UNITED STATES
SECURITIES AND EXCHANGE COMMISSION
Washington, D.C. 20549
|
|
|
FORM 8-K
|
|
|
CURRENT REPORT
Pursuant to Section 13 or 15(d)
of the Securities Exchange Act of 1934
Date of Report (Date of earliest event reported): February 7, 2019
|
|
|
BENCHMARK ELECTRONICS, INC.
(Exact name of registrant as specified in its charter)
|
|
|
Texas (State or other jurisdiction of incorporation) |
1-10560 (Commission File Number) |
74-2211011 (I.R.S. Employer Identification No.) |
56 South Rockford Drive, Tempe, Arizona 85251
(Address of Principal Executive Offices) (Zip Code)
Registrant’s telephone number, including area code: (623) 300-7000
|
|
|
Check the appropriate box below if the Form 8-K filing is intended to simultaneously satisfy the filing obligation of the registrant under any of the following provisions (see General Instruction A.2. below):
☐ Written communications pursuant to Rule 425 under the Securities Act (17 CFR 230.425)
☐ Soliciting material pursuant to Rule 14a-12 under the Exchange Act (17 CFR 240.14a-12)
☐ Pre-commencement communications pursuant to Rule 14d-2(b) under the Exchange Act (17 CFR 240.14d-2(b))
☐ Pre-commencement communications pursuant to Rule 13e-4(c) under the Exchange Act (17 CFR 240.13e-4(c))
Indicate by check mark whether the registrant is an emerging growth company as defined in Rule 405 of the Securities Act of 1933 (§230.405 of this chapter) or Rule 12b-2 of the Securities Exchange Act of 1934 (§240.12b-2 of this chapter).
Emerging growth company ☐
If an emerging growth company, indicate by check mark if the registrant has elected not to use the extended transition period for complying with any new or revised financial accounting standards provided pursuant to Section 13(a) of the Exchange Act. ☐
Item 2.02. Results of Operations and Financial Condition.
On February 7, 2019, Benchmark Electronics, Inc. (the “Company”) issued a press release announcing its results of operations for the quarter and year ended December 31, 2018. A copy of the press release and accompanying investor presentation are attached hereto as Exhibits 99.1 and 99.2, respectively, and incorporated by reference herein. The information disclosed under this Item 2.02, including Exhibits 99.1 and 99.2 hereto, shall not be deemed “filed” for purposes of Section 18 of the Securities Exchange Act of 1934, as amended (the “Exchange Act”), or deemed incorporated by reference in any filing under the Securities Act of 1933, as amended, or the Exchange Act, except as shall be expressly set forth by specific reference in such a filing.
Item 5.02. Departure of Directors or Certain Officers; Election of Directors; Appointment of Certain Officers; Compensatory Arrangements of Certain Officers.
On February 7, 2019, the Company issued a press release announcing that Paul J. Tufano, President and Chief Executive Officer, will retire after transitioning his responsibilities to a successor to be identified by the Board of Directors. He will also resign from the Board once his successor assumes the role of CEO. The Board of Directors has engaged a leading national executive search firm and is well underway to identify Mr. Tufano's successor. Mr. Tufano will remain with the company as an advisor through December 31, 2019. A copy of the press release is attached hereto as Exhibit 99.3 and incorporated by reference herein.
Item 9.01. Financial Statements and Exhibits.
(d) Exhibits
Exhibit No. |
Description |
99.1 |
Press release, dated February 7, 2019
|
|
|
99.2 |
Investor presentation, dated February 7, 2019
|
|
|
99.3 |
Press Release, dated February 7, 2019
|
|
SIGNATURE |
|
Pursuant to the requirements of the Securities Exchange Act of 1934, the registrant has duly caused this report to be signed on its behalf by the undersigned hereunto duly authorized.
|
BENCHMARK ELECTRONICS, INC. |
Dated: February 12, 2019 |
By: /s/ Stephen J. Beaver |
|
Stephen J. Beaver |
|
General Counsel |
|
|
-1-
· Quarterly revenue of $657 million
· Quarterly EPS of $0.64 ($0.41 non-GAAP)
TEMPE, AZ, February 7, 2019 – Benchmark Electronics, Inc. (NYSE: BHE) today announced financial results for the fourth quarter and year ended December 31, 2018.
|
|
Three Months Ended |
|||||
|
|
Dec 31, |
|
|
Sep 30, |
|
Dec 31, |
In millions, except EPS |
2018 |
|
|
2018 |
|
2017(1) |
|
Net sales |
$657 |
|
|
$641 |
|
$666 |
|
Net income (loss) |
$28 |
|
|
$8 |
|
(76) |
|
Net income – non-GAAP(2) |
$18 |
|
|
$15 |
|
$25 |
|
Diluted EPS |
$0.64 |
|
|
$0.17 |
|
($1.54) |
|
Diluted EPS – non-GAAP(2) |
$0.41 |
|
|
$0.33 |
|
$0.49 |
|
|
|
|
|
|
|
|
|
Operating margin |
2.3% |
|
|
1.7% |
|
3.3% |
|
Operating margin – non-GAAP(2) |
3.2% |
|
|
2.9% |
|
4.1% |
|
|
Twelve Months Ended |
|||
|
|
Dec 31, |
|
|
Dec 31, |
In millions, except EPS |
2018 |
|
|
2017(1) |
|
Net sales |
$2,566 |
|
|
$2,454 |
|
Net income (loss) |
$23 |
|
|
($32) |
|
Net income – non-GAAP(2) |
$68 |
|
|
$81 |
|
Diluted EPS |
$0.49 |
|
|
($0.64) |
|
Diluted EPS – non-GAAP(2) |
$1.45 |
|
|
$1.61 |
|
Operating margin |
2.3% |
|
|
3.1% |
|
Operating margin – non-GAAP(2) |
3.1% |
|
|
4.0% |
(1) On January 1, 2018, we adopted new accounting guidance, FASB ASC Topic 606 “Revenue from Contracts with Customers” (ASC 606), relating to revenue recognition. We adopted ASC 606 using the full retrospective transition method. Accordingly, we have adjusted prior period information to be consistent with ASC 606. The adoption of ASC 606 did not materially impact our overall financial position.
(2) A reconciliation of GAAP and non-GAAP results is included below.
“We capped 2018 with strong results in the fourth quarter, with revenue at $657 million and earnings at $0.41, both above the high end of our guidance”, said Paul Tufano, Benchmark’s President and CEO. “Bookings increased 23% for the full year and 13% sequentially to $198M; operating margins, on a non-GAAP basis, improved 30 bps quarter-over-quarter to 3.2%, but remain muted from continuing softness
1
in semi-cap; and cash cycle days were 62 for the quarter and 68 days for the full year within our target range. As a result, operating cash flow was $94 million in the quarter and $77 million for the full year. During 2018, we spent $212 million on share repurchases reducing our outstanding shares by 17% year-over-year and have $202 million remaining with our existing program.”
“As part of our ongoing process to review marginal and dilutive contracts, we have notified a long standing Computing customer that we will not renew a legacy contract that expires at the end of 2019 in its current form. The resulting reduction in annual revenue will be in the range of $280 million - $320 million, and annualized gross margins will improve by approximately 80 – 90 basis points, which more appropriately shows the strength of our underlying business. During this contractual transition year, we will discuss our actual results with and without the presence of this contract.”
“Over the past several years, we have made progress on a number of key initiatives including the implementation of our market‐sector sales organization to drive bookings and revenue growth; the expansion of our engineering and solutions capabilities to extend our value proposition to customers; and, the optimization of our global network and continued focus on operational execution,” added Tufano. “The progress on these initiatives will enable 3-5% revenue growth on our base business, excluding the legacy Computing contract. For 2019, we also expect gross and operating margin expansion from improved execution, effective cost and expense management, and the growth of additional service offerings including RF and high-speed design capabilities. We remain committed to the achievement of our long-term business model as we continue to pursue growth and create value for our shareholders,” said Tufano.
Cash Conversion Cycle
|
|
Dec 31, |
|
|
|
Sep 30, |
|
|
|
Dec 31, |
|
|
|
2018 |
|
|
|
2018 |
|
|
|
2017 |
|
|
|
|
|
|
|
|
|
(as adjusted) |
|||
Accounts receivable days |
|
64 |
|
|
|
64 |
|
|
|
59 |
|
Contract asset days |
|
19 |
|
|
|
22 |
|
|
|
20 |
|
Inventory days |
|
46 |
|
|
|
49 |
|
|
|
40 |
|
Accounts payable days |
|
(63) |
|
|
|
(57) |
|
|
|
(54) |
|
Customer deposits |
|
(4) |
|
|
|
(4) |
|
|
|
(3) |
|
|
|
62 |
|
|
|
74 |
|
|
|
62 |
|
Fourth Quarter 2018 Industry Sector Update
Revenue and percentage of sales by industry sector (in millions) was as follows.
|
|
|
Dec 31, |
|
|
|
Sep 30, |
|
|
|
Dec 31, |
|
||||||
|
Higher-Value Markets |
|
2018 |
|
|
|
2018 |
|
|
2017 (as adjusted) |
||||||||
Industrials |
$ |
121 |
|
18 |
% |
|
$ |
128 |
|
20 |
% |
|
$ |
129 |
|
19 |
% |
|
A&D |
|
105 |
|
16 |
|
|
|
105 |
|
16 |
|
|
|
95 |
|
15 |
|
|
Medical |
|
104 |
|
16 |
|
|
|
96 |
|
15 |
|
|
|
100 |
|
15 |
|
|
Test & Instrumentation |
|
70 |
|
11 |
|
|
|
77 |
|
12 |
|
|
|
93 |
|
14 |
|
|
|
|
$ |
400 |
|
61 |
% |
|
$ |
406 |
|
63 |
% |
|
$ |
417 |
|
63 |
% |
|
|
|
|
|
|
|
|
|
|
|
|
|
|
|
|
|
|
|
|
|
|
|
|
|
|
|
|
|
|
|
|
|
|
|
|
|
|
|
|
|
Dec 31, |
|
|
|
Sep 30, |
|
|
|
Dec 31, |
|
||||||
|
Traditional Markets |
|
2018 |
|
|
|
2018 |
|
|
2017 (as adjusted) |
||||||||
Computing |
$ |
171 |
|
26 |
% |
|
$ |
146 |
|
23 |
% |
|
$ |
172 |
|
26 |
% |
|
Telecommunications |
|
86 |
|
13 |
|
|
|
89 |
|
14 |
|
|
|
77 |
|
11 |
|
|
|
|
$ |
257 |
|
39 |
% |
|
$ |
235 |
|
37 |
% |
|
$ |
249 |
|
37 |
% |
|
Total |
$ |
657 |
|
100 |
% |
|
$ |
641 |
|
100 |
% |
|
$ |
666 |
|
100 |
% |
2
Higher‐value markets were down 4% year‐over‐year from softer demand in Test & Instrumentation (primarily semi-capital equipment). Traditional market revenues were up 3% year-over-year primarily from new program ramps in Telecommunications.
Fourth Quarter 2018 Bookings Update
· New program bookings of $198 million at the midpoint of projected annualized revenue.
· 17 engineering awards supporting early engagement opportunities.
· 34 manufacturing wins across all market sectors.
The Company projects that new program bookings for the fourth quarter will result in annualized revenue of $165 to $233 million when fully launched in the next 12-24 months, medical up to 36 months.
First Quarter 2019 Outlook
· Revenue between $570 - $610 million.
· Diluted GAAP earnings per share between $0.23 - $0.31.
· Diluted non-GAAP earnings per share between $0.29 - $0.37 (excluding any additional impact related to U.S. Tax Reform, restructuring charges and other costs and amortization of intangibles).
Fourth Quarter 2018 Results Conference Call Details
A conference call hosted by Benchmark management will be held today at 5:00 p.m. Eastern Time to discuss the Company’s financial results and outlook. This call will be broadcast via the internet and may be accessed by logging on to the Company’s website at www.bench.com.
About Benchmark Electronics, Inc.
Benchmark is a worldwide provider of innovative product design, engineering services, technology solutions and advanced manufacturing services. From initial product concept to volume production, including direct order fulfillment and aftermarket services, Benchmark has been providing integrated services and solutions to original equipment manufacturers since 1979. Today, Benchmark proudly serves the following industries: aerospace and defense, medical technologies, complex industrials, test and instrumentation, next-generation telecommunications and high-end computing. Benchmark’s global operations network includes facilities in eight countries and common shares trade on the New York Stock Exchange under the symbol BHE.
For More Information, Please Contact:
Lisa K. Weeks, VP of Strategy & Investor Relations
623-300-7052 or lisa.weeks@bench.com
3
Forward-Looking Statements
This document contains forward-looking statements within the meaning of Section 27A of the Securities Act of 1933 and Section 21E of the Securities Exchange Act of 1934. The words “expect,” “estimate,” “anticipate,” “predict” and similar expressions, and the negatives thereof, often identify forward-looking statements, which are not limited to historical facts. Forward-looking statements include, among other things: guidance for 2019 results; projected annual revenues resulting from new program bookings; statements, express or implied, concerning future operating results or margins, the ability to generate sales and income or cash flow; and Benchmark’s business and growth strategies and expected growth and performance. Although Benchmark believes these statements are based upon reasonable assumptions, they involve risks and uncertainties relating to operations, markets and the business environment generally. If one or more of these risks or uncertainties materializes, or underlying assumptions prove incorrect, actual outcomes may vary materially from those indicated. Readers are advised to consult further disclosures on these risks and uncertainties, particularly in Item 1A, “Risk Factors”, of the Company’s Annual Report on Form 10-K for the year ended December 31, 2017 and in its subsequent filings with the Securities and Exchange Commission. All forward-looking statements included in this document are based upon information available to the Company as of the date of this document, and it assumes no obligation to update them.
Non-GAAP Financial Measures
This document includes certain financial measures that exclude items and therefore are not in accordance with U.S. generally accepted accounting principles (“GAAP”). A detailed reconciliation between GAAP results and results excluding special items (“non-GAAP”) is included in the following tables attached to this document. Management discloses non‐GAAP information to provide investors with additional information to analyze the Company’s performance and underlying trends. Management uses non‐GAAP measures that exclude certain items in order to better assess operating performance and help investors compare results with our previous guidance. The Company’s non‐GAAP information is not necessarily comparable to the non‐GAAP information used by other companies. Non‐GAAP information should not be viewed as a substitute for, or superior to, net income or other data prepared in accordance with GAAP as a measure of the Company’s profitability or liquidity. Readers should consider the types of events and transactions for which adjustments have been made.
###
4
|
|
|
|
|
|
|
|
|
|
|
|
|
|
Benchmark Electronics, Inc. and Subsidiaries |
|
||||||||||||
|
|
|
|
|
|
|
|
|
|
|
|
|
|
Reconciliation of GAAP to Non-GAAP Financial Results |
|
||||||||||||
(Amounts in Thousands, Except Per Share Data) |
|
||||||||||||
(UNAUDITED) |
|
||||||||||||
|
|
|
|
|
|
|
|
|
|
|
|
|
|
|
|
|
Three Months Ended |
|
|
Year Ended |
|
||||||
|
|
|
Dec 31, |
|
Sep 30, |
|
Dec 31, |
|
|
Dec 31, |
|
||
|
|
|
2018 |
|
2018 |
|
2017 |
|
|
2018 |
|
2017 |
|
|
|
|
|
|
|
(as adjusted) |
|
|
(as adjusted) |
||||
Income from operations (GAAP) |
$ |
15,265 |
$ |
10,957 |
$ |
21,910 |
|
$ |
58,538 |
$ |
76,826 |
|
|
Restructuring charges and other costs |
|
3,527 |
|
1,845 |
|
3,062 |
|
|
9,365 |
|
8,628 |
|
|
Customer insolvency (recovery) |
|
(113) |
|
3,295 |
|
(239) |
|
|
2,511 |
|
2,657 |
|
|
Amortization of intangible assets |
|
2,384 |
|
2,368 |
|
2,367 |
|
|
9,485 |
|
10,065 |
|
|
Non-GAAP income from operations |
$ |
21,063 |
$ |
18,465 |
$ |
27,100 |
|
$ |
79,899 |
$ |
98,176 |
|
|
|
|
|
|
|
|
|
|
|
|
|
|
|
|
Gross Profit (GAAP) |
$ |
55,199 |
$ |
52,777 |
$ |
60,661 |
|
$ |
220,593 |
$ |
225,920 |
|
|
Customer insolvency (recovery) |
|
(113) |
|
1,581 |
|
(239) |
|
|
797 |
|
960 |
|
|
Non-GAAP gross profit |
$ |
55,086 |
$ |
54,358 |
$ |
60,422 |
|
$ |
221,390 |
$ |
226,880 |
|
|
|
|
|
|
|
|
|
|
|
|
|
|
|
|
Net income (loss) (GAAP) |
$ |
27,716 |
$ |
7,799 |
$ |
(76,361) |
|
$ |
22,817 |
$ |
(31,901) |
|
|
Restructuring charges and other costs |
|
3,527 |
|
1,845 |
|
3,062 |
|
|
9,365 |
|
8,628 |
|
|
Customer insolvency (recovery) |
|
(113) |
|
3,295 |
|
(239) |
|
|
2,511 |
|
2,657 |
|
|
Amortization of intangible assets |
|
2,384 |
|
2,368 |
|
2,367 |
|
|
9,485 |
|
10,065 |
|
|
Refinancing of credit facilities |
|
- |
|
1,982 |
|
- |
|
|
1,982 |
|
- |
|
|
Income tax adjustments(1) |
|
(1,050) |
|
(1,914) |
|
(1,793) |
|
|
(4,592) |
|
(6,312) |
|
|
Tax Cuts and Jobs Act(2) |
|
(14,529) |
|
- |
|
97,633 |
|
|
26,008 |
|
97,633 |
|
|
Non-GAAP net income |
$ |
17,935 |
$ |
15,375 |
$ |
24,669 |
|
$ |
67,576 |
$ |
80,770 |
|
|
|
|
|
|
|
|
|
|
|
|
|
|
|
|
Diluted Earnings (loss) per share: |
|
|
|
|
|
|
|
|
|
|
|
|
|
|
Diluted (GAAP) |
$ |
0.64 |
$ |
0.17 |
$ |
(1.54) |
|
$ |
0.49 |
$ |
(0.64) |
|
|
Diluted (Non-GAAP) |
$ |
0.41 |
$ |
0.33 |
$ |
0.49 |
|
$ |
1.45 |
$ |
1.61 |
|
|
|
|
|
|
|
|
|
|
|
|
|
|
|
Weighted-average number of shares used in |
|
|
|
|
|
|
|
|
|
|
|
||
calculating diluted earnings (loss) per share: |
|
|
|
|
|
|
|
|
|
|
|
||
|
Diluted (GAAP) |
|
43,229 |
|
46,455 |
|
49,576 |
|
|
46,655 |
|
49,680 |
|
|
Diluted (Non-GAAP) |
|
43,229 |
|
46,455 |
|
49,998 |
|
|
46,655 |
|
50,250 |
|
(1) This amount represents the tax impact of the non-GAAP adjustments using the applicable effective tax rates.
(2) This amount represents the impact of repatriating foreign earnings from our foreign jurisdictions to the U.S., offset by available U.S. foreign tax credits, and a non-recurring tax true-up benefit as a result of finalizing our federal and state income tax accounting for the U.S. transitions toll tax from the 2017 Tax Cuts and Jobs Act.
5
|
|
|
|
|
|
|
|
|
|
|
Benchmark Electronics, Inc. and Subsidiaries |
||||||||||
|
|
|
|
|
|
|
|
|
|
|
Condensed Consolidated Statements of Income |
||||||||||
(Amounts in Thousands, Except Per Share Data) |
||||||||||
(UNAUDITED) |
||||||||||
|
||||||||||
|
|
|
Three Months Ended |
|
|
Year Ended |
||||
|
|
|
December 31, |
|
|
December 31, |
||||
|
|
2018 |
|
2017 |
|
|
2018 |
|
2017 |
|
|
|
|
|
(as adjusted) |
|
|
|
(as adjusted) |
||
Sales |
$ |
657,050 |
$ |
666,036 |
|
$ |
2,566,465 |
$ |
2,454,479 |
|
Cost of sales |
|
601,851 |
|
605,375 |
|
|
2,345,872 |
|
2,228,559 |
|
|
Gross profit |
|
55,199 |
|
60,661 |
|
|
220,593 |
|
225,920 |
Selling, general and administrative expenses |
|
34,023 |
|
33,322 |
|
|
143,205 |
|
130,401 |
|
Amortization of intangible assets |
|
2,384 |
|
2,367 |
|
|
9,485 |
|
10,065 |
|
Restructuring charges and other costs |
|
3,527 |
|
3,062 |
|
|
9,365 |
|
8,628 |
|
|
Income from operations |
|
15,265 |
|
21,910 |
|
|
58,538 |
|
76,826 |
Interest expense |
|
(1,930) |
|
(2,544) |
|
|
(10,473) |
|
(9,405) |
|
Interest income |
|
1,651 |
|
1,749 |
|
|
6,848 |
|
5,370 |
|
Other income (expense), net |
|
(199) |
|
(481) |
|
|
628 |
|
(1,786) |
|
|
Income before income taxes |
|
14,787 |
|
20,634 |
|
|
55,541 |
|
71,005 |
Income tax expense (benefit) |
|
(12,929) |
|
96,995 |
|
|
32,724 |
|
102,906 |
|
|
Net income (loss) |
$ |
27,716 |
$ |
(76,361) |
|
$ |
22,817 |
$ |
(31,901) |
|
|
|
|
|
|
|
|
|
|
|
Earnings (loss) per share: |
|
|
|
|
|
|
|
|
|
|
|
Basic |
$ |
0.64 |
$ |
(1.54) |
|
$ |
0.49 |
$ |
(0.64) |
|
Diluted |
$ |
0.64 |
$ |
(1.54) |
|
$ |
0.49 |
$ |
(0.64) |
|
|
|
|
|
|
|
|
|
|
|
Weighted-average number of shares used in calculating |
|
|
|
|
|
|
|
|
||
earnings (loss) per share: |
|
|
|
|
|
|
|
|
||
|
Basic |
|
43,120 |
|
49,576 |
|
|
46,332 |
|
49,680 |
|
Diluted |
|
43,229 |
|
49,576 |
|
|
46,655 |
|
49,680 |
For the three months ended December 31, 2017, the adoption of ASC 606 decreased revenue by $13.8 million, operating income by $1.2 million and net income by $21 thousand. For the year ended December 31, 2017, the adoption of ASC 606 decreased revenue by $12.3 million, decreased operating income by $1.8 million and increased net income by $0.1 million.
6
|
|
|
|
|
|
|
|
|
|
Benchmark Electronics, Inc. and Subsidiaries |
|||||||||
|
|
|
|
|
|
|
|
|
|
Condensed Consolidated Balance Sheets |
|||||||||
(UNAUDITED) |
|||||||||
(in thousands) |
|||||||||
|
|
|
|
|
|
December 31, |
|
|
December 31, |
|
|
|
|
|
|
2018 |
|
|
2017 |
|
|
|
|
|
|
|
|
|
(as adjusted) |
Assets |
|
|
|
|
|
||||
|
Current assets: |
|
|
|
|
|
|||
|
|
Cash and cash equivalents |
$ |
458,102 |
|
$ |
742,546 |
||
|
|
Accounts receivable, net |
|
468,161 |
|
|
436,560 |
||
|
|
Contract assets |
|
140,082 |
|
|
146,496 |
||
|
|
Inventories |
|
309,975 |
|
|
268,917 |
||
|
|
Other current assets |
|
27,230 |
|
|
36,138 |
||
|
|
|
|
Total current assets |
|
1,403,550 |
|
|
1,630,657 |
|
Property, plant and equipment, net |
|
210,954 |
|
|
186,473 |
|||
|
Goodwill and other, net |
|
285,279 |
|
|
292,174 |
|||
|
|
|
|
Total assets |
$ |
1,899,783 |
|
$ |
2,109,304 |
|
|
|
|
|
|
|
|
|
|
Liabilities and Shareholders’ Equity |
|
|
|
|
|
||||
|
Current liabilities: |
|
|
|
|
|
|||
|
|
Current installments of long-term debt and capital lease obligations |
$ |
6,793 |
|
$ |
18,274 |
||
|
|
Accounts payable |
|
422,053 |
|
|
362,701 |
||
|
|
Accrued liabilities |
|
108,313 |
|
|
97,342 |
||
|
|
|
|
Total current liabilities |
|
537,159 |
|
|
478,317 |
|
Long-term debt and capital lease obligations, less current installments |
|
147,277 |
|
|
193,406 |
|||
|
Other long-term liabilities |
|
83,122 |
|
|
98,443 |
|||
|
Shareholders’ equity |
|
1,132,225 |
|
|
1,339,138 |
|||
|
|
|
|
Total liabilities and shareholders’ equity |
$ |
1,899,783 |
|
$ |
2,109,304 |
As of December 31, 2017, the adoption of ASC 606 increased current assets by $12.0 million, increased total liabilities by $1.7 million and increased shareholder’s equity by $10.3 million.
7
|
|
|
|
|
|
|
|
|
|
Benchmark Electronics, Inc. and Subsidiaries |
|||||||||
|
|
|
|
|
|
|
|
|
|
Condensed Consolidated Statement of Cash Flows |
|||||||||
(in thousands) |
|||||||||
(UNAUDITED) |
|||||||||
|
|
|
|
|
|
|
|
|
|
|
|
|
|
|
|
Year Ended |
|||
|
|
|
|
|
|
December 31, |
|||
|
|
|
|
|
|
2018 |
|
|
2017 |
|
|
|
|
|
|
|
|
|
(as adjusted) |
Cash flows from operating activities: |
|
|
|
|
|
||||
|
Net income (loss) |
$ |
22,817 |
|
$ |
(31,901) |
|||
|
Depreciation and amortization |
|
51,839 |
|
|
48,672 |
|||
|
Stock-based compensation expense |
|
10,089 |
|
|
7,815 |
|||
|
Accounts receivable, net |
|
(33,952) |
|
|
6,354 |
|||
|
Contract assets |
|
6,414 |
|
|
9,710 |
|||
|
Inventories |
|
(43,264) |
|
|
(24,570) |
|||
|
Accounts payable |
|
61,391 |
|
|
29,542 |
|||
|
Other changes in working capital and other, net |
|
1,353 |
|
|
100,220 |
|||
|
|
Net cash provided by operations |
|
76,687 |
|
|
145,842 |
||
|
|
|
|
|
|
|
|||
Cash flows from investing activities: |
|
|
|
|
|
||||
|
Additions to property, plant and equipment and software |
|
(66,732) |
|
|
(54,506) |
|||
|
Other investing activities, net |
|
(2,117) |
|
|
(1,615) |
|||
|
|
Net cash used in investing activities |
|
(68,849) |
|
|
(56,121) |
||
|
|
|
|
|
|
|
|
|
|
Cash flows from financing activities: |
|
|
|
|
|
||||
|
Share repurchases |
|
(211,858) |
|
|
(29,348) |
|||
|
Net debt activity |
|
(58,024) |
|
|
(12,396) |
|||
|
Other financing activities, net |
|
(21,085) |
|
|
10,392 |
|||
|
|
Net cash used in financing activities |
|
(290,967) |
|
|
(31,352) |
||
Effect of exchange rate changes |
|
(1,315) |
|
|
2,744 |
||||
Net increase (decrease) in cash and cash equivalents |
|
(284,444) |
|
|
61,113 |
||||
|
Cash and cash equivalents at beginning of year |
|
742,546 |
|
|
681,433 |
|||
|
Cash and cash equivalents at end of period |
$ |
458,102 |
|
$ |
742,546 |
|||
|
|
|
|
|
|
|
|
|
|
8
Exhibit 99.2
© 2018 Benchmark Electronics, Inc. Benchmark Electronics, Inc. Q4 and FY 2018 Earnings February 7, 2019
| 2 © 2018 Benchmark Electronics, Inc. Forward - Looking Statements This document contains forward - looking statements within the meaning of Section 27A of the Securities Act of 1933 and Section 21 E of the Securities Exchange Act of 1934. The words “expect,” “estimate,” “anticipate,” “predict” and similar expressions, and the n egatives thereof, often identify forward - looking statements, which are not limited to historical facts. Forward - looking statements inclu de, among other things: guidance for 2019 results; projected annual revenues resulting from new program bookings; statements , express or implied, concerning future operating results or margins, the ability to generate sales and income or cash flow; and Benchmark ’s business and growth strategies and expected growth and performance. Although Benchmark believes these statements are based upon reasonable assumptions, they involve risks and uncertainties relating to operations, markets and the business environmen t generally. If one or more of these risks or uncertainties materializes, or underlying assumptions prove incorrect , actual outcomes may vary materially from those indicated. Readers are advised to consult further disclosures on these risks and uncertainties, part icularly in Item 1A, “Risk Factors”, of the Company’s Annual Report on Form 10 - K for the year ended December 31, 2017 and in its subsequent filings with the Securities and Exchange Commission. All forward - looking statements included in this document are based upon information available to the Company as of the date of this document, and it assumes no obligation to update them. Non - GAAP Financial Information This document includes certain financial measures that exclude items and therefore are not in accordance with U.S. generally accepted accounting principles (“GAAP”). A detailed reconciliation between GAAP results and results excluding special items (“n on - GAAP”) is included in the Appendix of this document. Management discloses non - GAAP information to provide investors with additional information to analyze the Company’s performance and underlying trends. Management uses non - GAAP measures that exclude certain items in order to better assess operating performance and help investors compare results with our previous guidance. This document also references “free cash flow”, which the Company defines as cash flow from operations less additions to property, plant and equipment and purchased software. The Company’s non - GAAP information is not necessarily comparable to the non - GAAP information used by other companies. Non - GAAP information should not be viewed as a substitute for, or superior to, net income or other data prepared in accordance with GAAP as a measure of the Company’s profitability or liquidity. Readers should consider the types of events and transactions for which adjustments have been made.
| 3 © 2018 Benchmark Electronics, Inc. Implementation of ASC 606 – Revenue from Contracts with Customers Effective January 1, 2018, the Company implemented ASC 606 the accounting standard governing “Revenue from Contracts with Customers” using the full retrospective transition method. Under ASC 606, revenue is recognized as or when the customer obta ins control of the goods or services promised in a contract. Given the nature of the terms and conditions in substantially all o f t he Company’s customer contracts, the Company now recognizes revenue over time (beginning at work - in - process (“WIP”)) for the majori ty of its contracts. All historical financial information represented in this presentation has been adjusted to reflect the retrospective implementation of ASC 606. As part of ASC 606, we are also required to reclassify finished goods and WIP meeting “the over time criteria” from inventory to a new line item called contract assets on the face of the balance sheet. Contract assets are defined as the Company’s right to cons ide ration for work completed but not billed.
| 4 © 2018 Benchmark Electronics, Inc. CEO Update
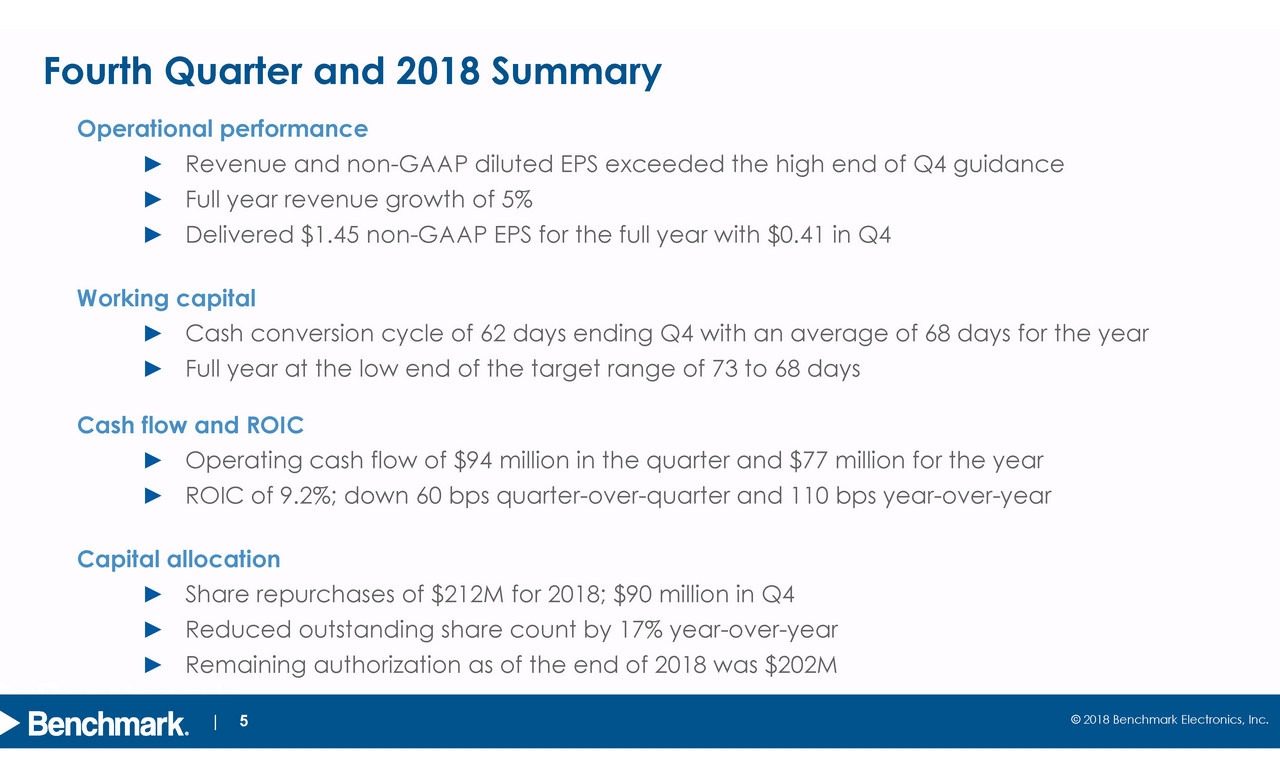
© 2018 Benchmark Electronics, Inc. | 5 Fourth Quarter and 2018 Summary O perational p erformance ► Revenue and non - GAAP diluted EPS exceeded the high end of Q4 guidance ► Full year revenue growth of 5% ► Delivered $ 1.45 non - GAAP EPS for the full year with $ 0.41 in Q4 Working capital ► Cash conversion cycle of 62 days ending Q4 with an average of 68 days for the year ► Full year at the low end of the target range of 73 to 68 days Cash flow and ROIC ► O perating cash flow of $94 million in the quarter and $77 million for the year ► ROIC of 9.2%; down 60 bps quarter - over - quarter and 110 bps year - over - year Capital allocation ► Share repurchases of $212M for 2018; $90 million in Q4 ► Reduced outstanding share count by 17% year - over - year ► Remaining authorization as of the end of 2018 was $202M
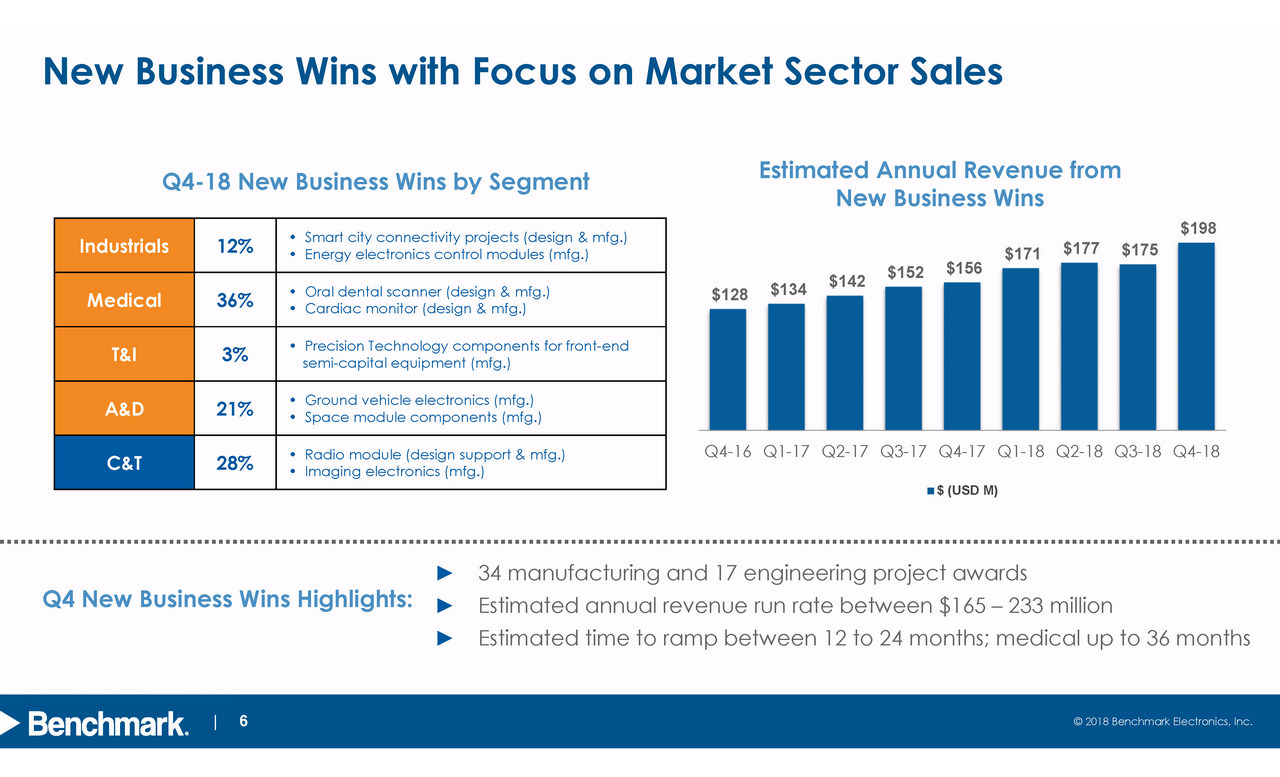
© 2018 Benchmark Electronics, Inc. | 6 New Business Wins with Focus on Market Sector Sales Q4 - 18 New Business Wins by Segment Estimated Annual Revenue from New Business Wins ► 34 manufacturing and 17 engineering project awards ► Estimated annual revenue run rate between $165 – 233 million ► Estimated time to ramp between 12 to 24 months; medical up to 36 months Q4 New Business Wins Highlights: Industrials 12% • Smart city connectivity projects (design & mfg.) • Energy electronics control modules (mfg .) Medical 36% • Oral dental scanner (design & mfg .) • Cardiac monitor (design & mfg.) T&I 3 % • Precision Technology components for front - end semi - capital equipment (mfg.) A&D 21% • Ground vehicle electronics (mfg .) • Space module components (mfg .) C&T 28% • Radio module (design support & mfg.) • Imaging electronics (mfg .) $128 $134 $142 $152 $156 $171 $177 $175 $198 $- $10 $20 $30 $40 $50 $60 $70 $80 $90 $100 $110 $120 $130 $140 $150 $160 $170 $180 $190 $200 Q4-16 Q1-17 Q2-17 Q3-17 Q4-17 Q1-18 Q2-18 Q3-18 Q4-18 $ (USD M)
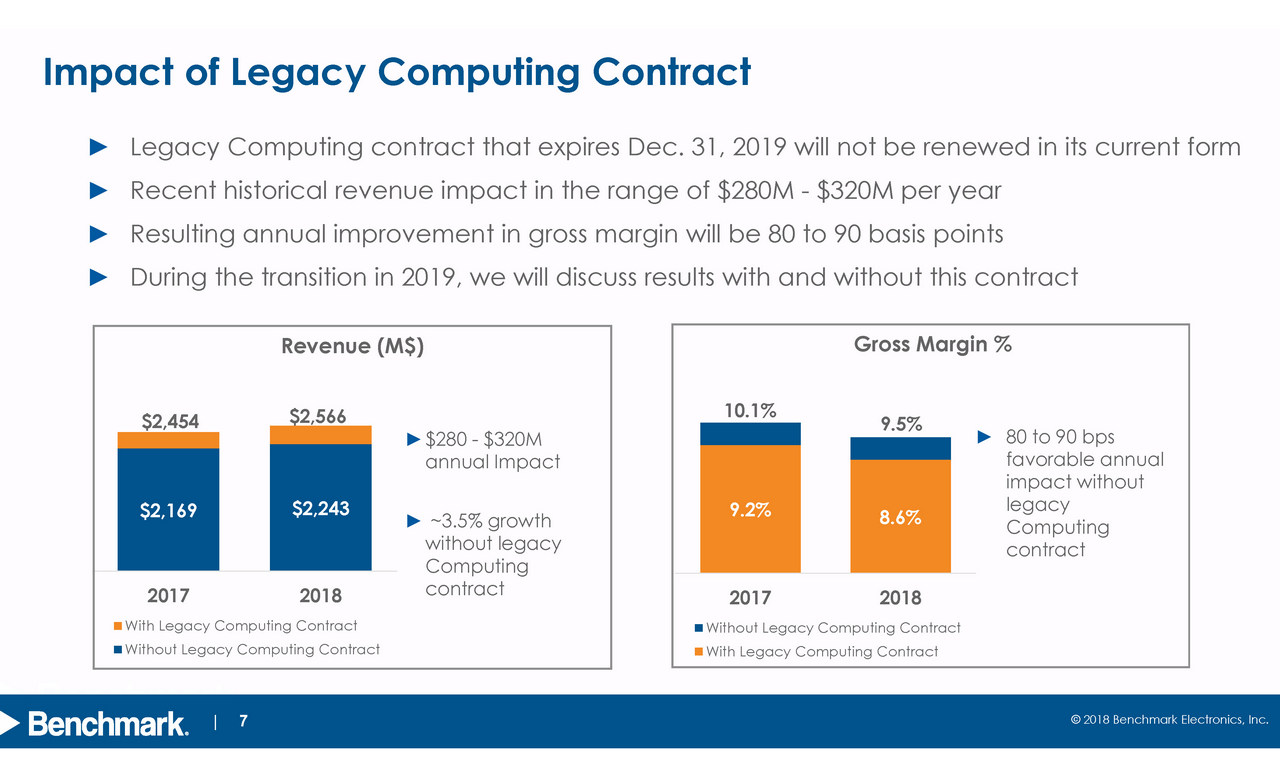
© 2018 Benchmark Electronics, Inc. | 7 $2,169 $2,243 2017 2018 With Legacy Computing Contract Without Legacy Computing Contract ► $280 - $320M annual Impact ► ~3.5% growth without legacy Computing contract Impact of Legacy Computing Contract $2,454 9.2% 8.6% 2017 2018 Without Legacy Computing Contract With Legacy Computing Contract 10.1% 9.5% ► 80 to 90 bps favorable annual impact without legacy Computing contract $2,566 Revenue (M$) Gross Margin % ► Legacy Computing contract that expires Dec. 31, 2019 will not be renewed in its current form ► Recent historical revenue impact in the range of $280M - $320M per year ► Resulting annual improvement in gross margin will be 80 to 90 basis points ► During the transition in 2019, we will discuss results with and without this contract
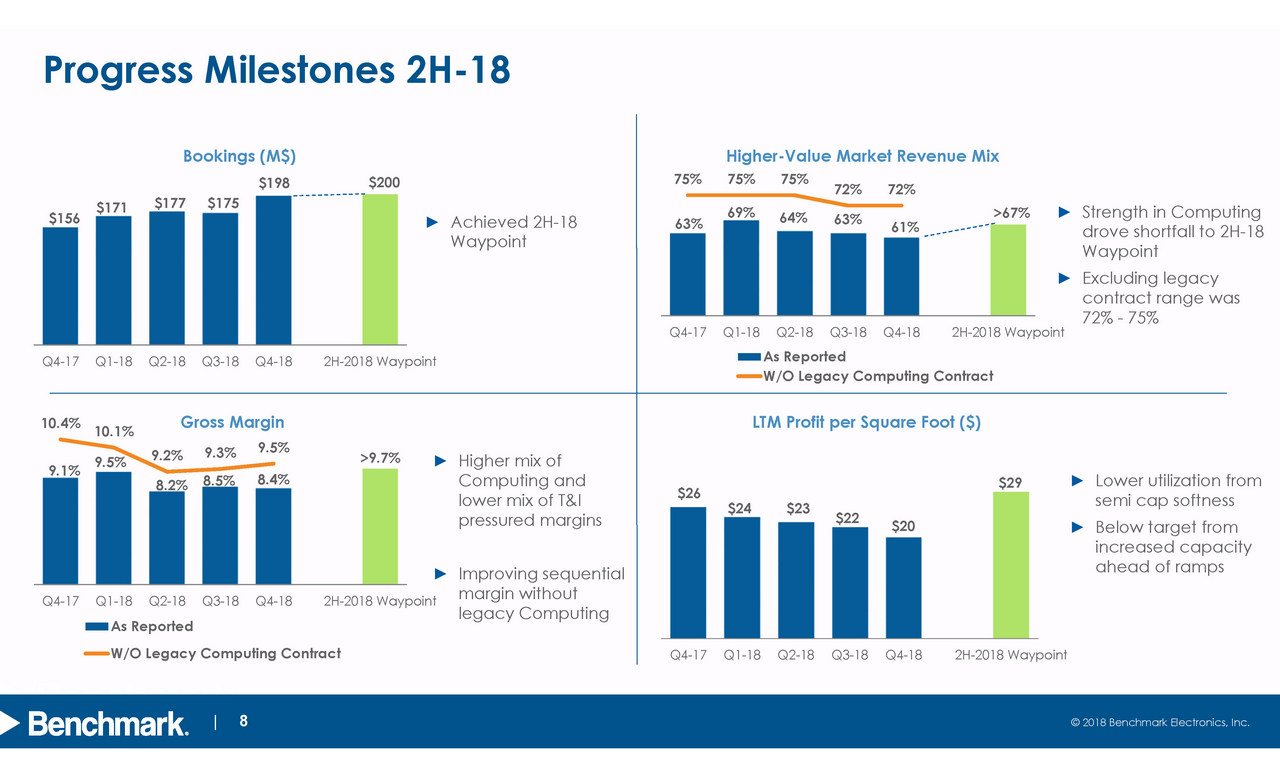
© 2018 Benchmark Electronics, Inc. | 8 Progress Milestones 2H - 18 ► Strength in Computing drove shortfall to 2H - 18 Waypoint ► Excluding legacy contract range was 72% - 75% ► Higher mix of Computing and lower mix of T&I pressured margins ► Improving sequential margin without legacy Computing ► Achieved 2H - 18 Waypoint ► Lower utilization from semi cap softness ► Below target from increased capacity ahead of ramps $156 $171 $177 $175 $198 $200 Q4-17 Q1-18 Q2-18 Q3-18 Q4-18 2H-2018 Waypoint Bookings (M$) 63% 69% 64% 63% 61% 75% 75% 75% 72% 72% Q4-17 Q1-18 Q2-18 Q3-18 Q4-18 2H-2018 Waypoint Higher - Value Market Revenue Mix As Reported W/O Legacy Computing Contract 9.1% 9.5% 8.2% 8.5% 8.4% 10.4% 10.1% 9.2% 9.3% 9.5% Q4-17 Q1-18 Q2-18 Q3-18 Q4-18 2H-2018 Waypoint Gross Margin As Reported W/O Legacy Computing Contract >9.7% $26 $24 $23 $22 $20 Q4-17 Q1-18 Q2-18 Q3-18 Q4-18 2H-2018 Waypoint LTM Profit per Square Foot ($) >67% $29
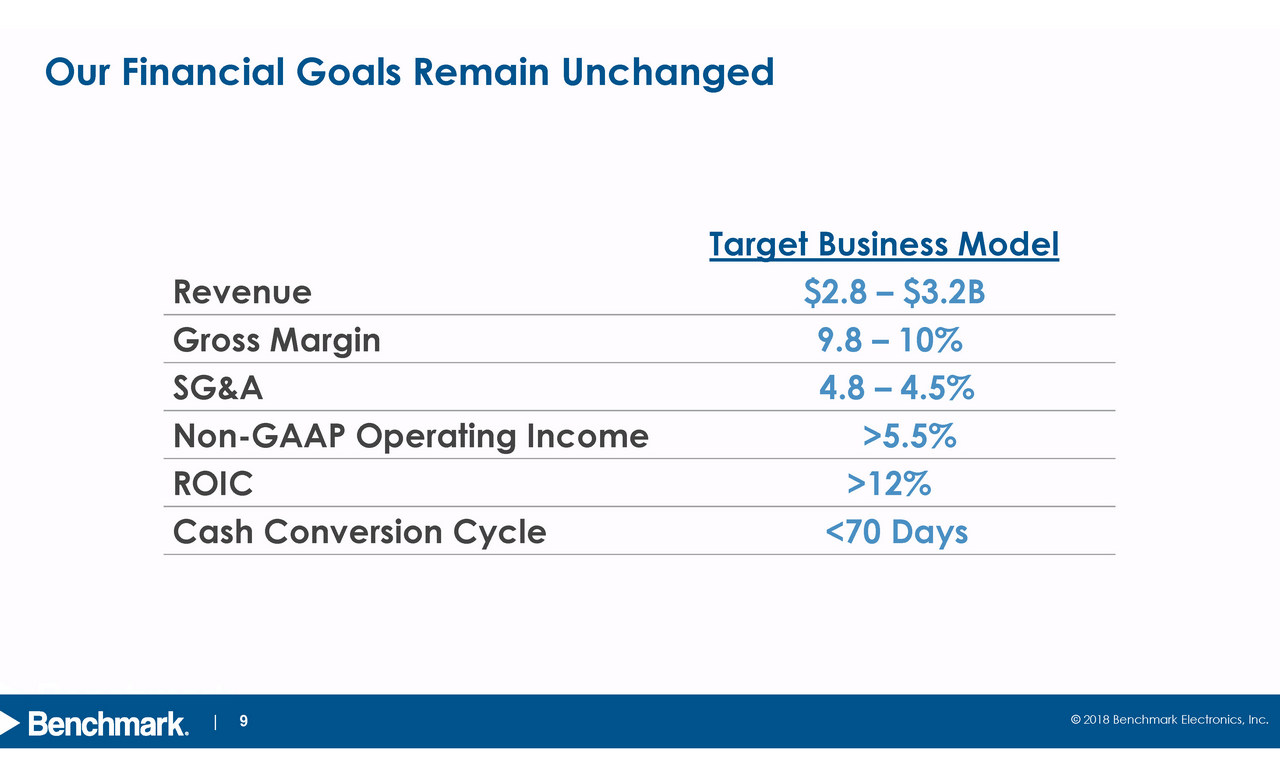
© 2018 Benchmark Electronics, Inc. | 9 Our Financial Goals Remain Unchanged Target Business Model Revenue $2.8 – $3.2B Gross Margin 9.8 – 10% SG&A 4.8 – 4.5% Non - GAAP Operating Income >5.5% ROIC >12% Cash Conversion Cycle <70 Days
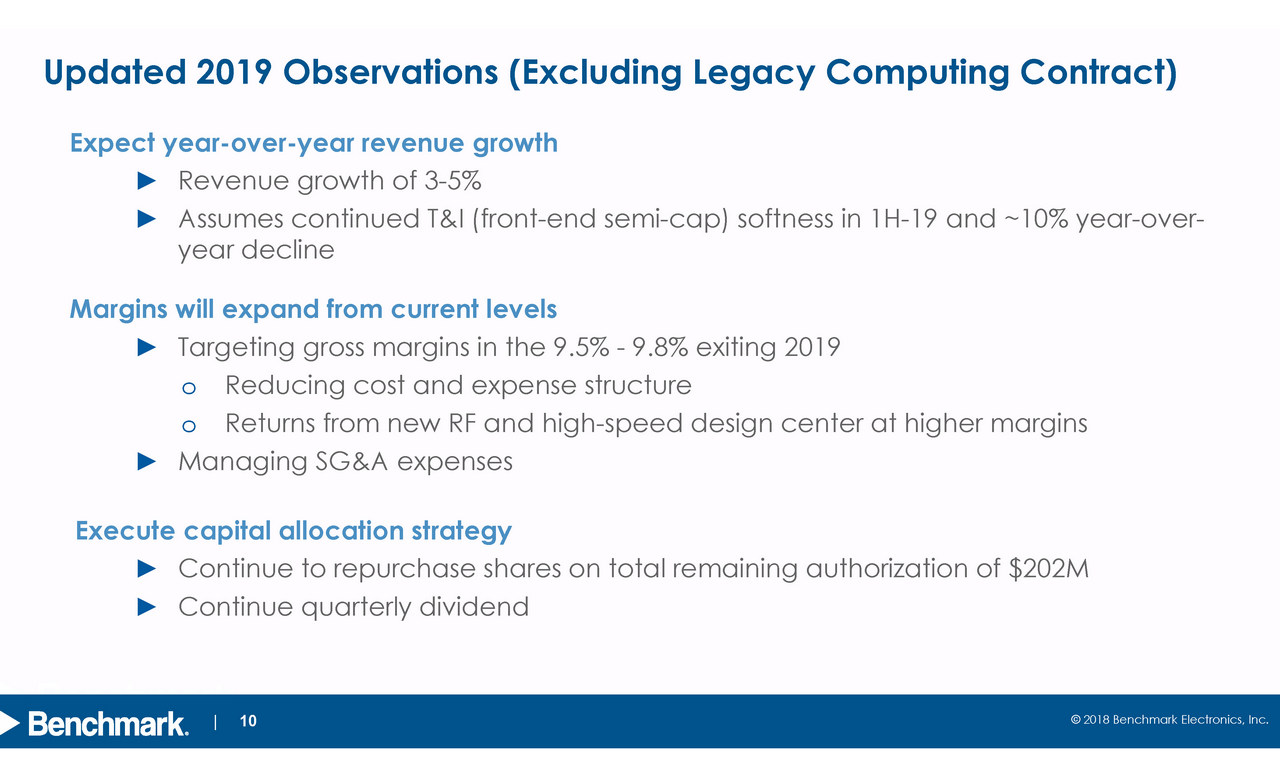
© 2018 Benchmark Electronics, Inc. | 10 Updated 2019 Observations (Excluding Legacy Computing Contract) Expect year - over - year revenue growth ► Revenue growth of 3 - 5% ► Assumes continued T&I (front - end semi - cap) softness in 1H - 19 and ~10% year - over - year decline Margins will expand from current levels ► Targeting gross margins in the 9.5% - 9.8% exiting 2019 o Reducing cost and expense structure o Returns from new RF and high - speed design center at higher margins ► Managing SG&A expenses Execute capital allocation strategy ► Continue to repurchase shares on total remaining authorization of $ 202M ► Continue quarterly dividend
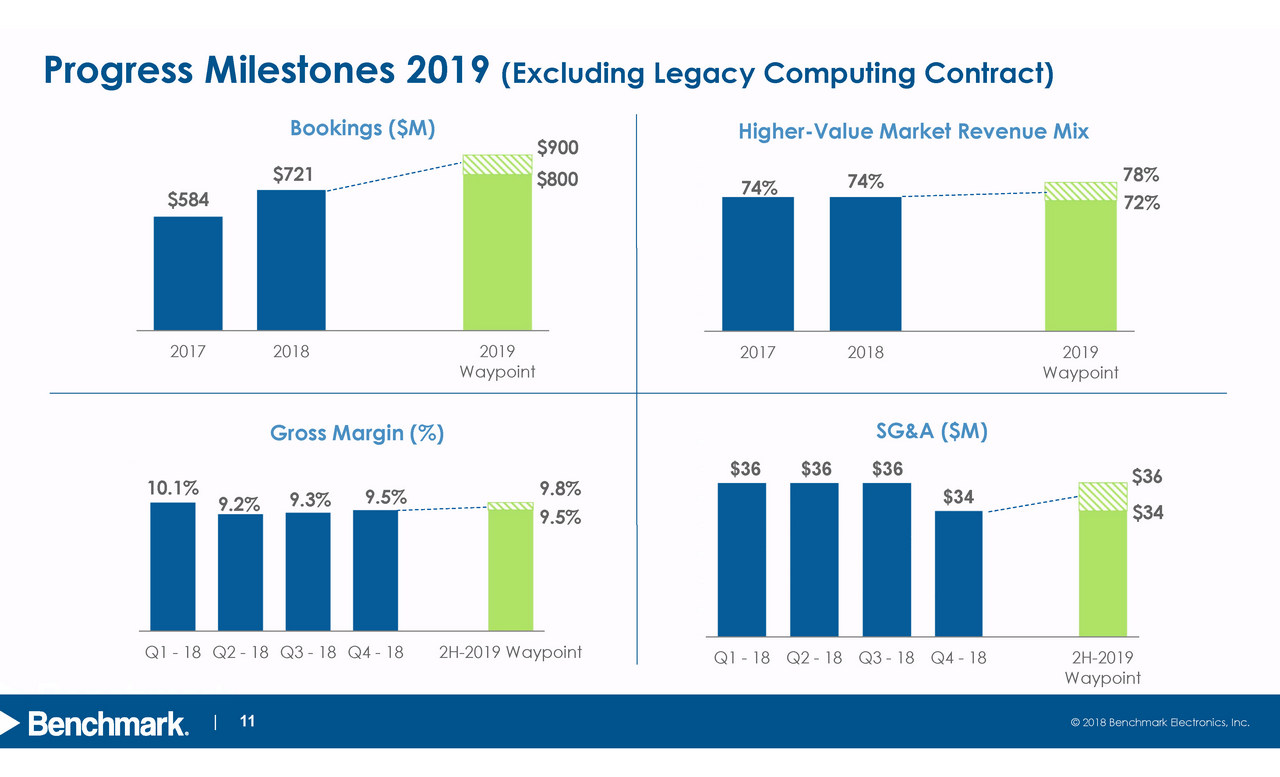
© 2018 Benchmark Electronics, Inc. | 11 $584 $721 2017 2018 2019 Waypoint 74% 74% 0% 10% 20% 30% 40% 50% 60% 70% 80% 90% 100% 2017 2018 2019 Waypoint $36 $36 $36 $34 $25 $27 $29 $31 $33 $35 $37 $39 Q1 - 18 Q2 - 18 Q3 - 18 Q4 - 18 2H-2019 Waypoint 10.1% 9.2% 9.3% 9.5% -1.0% 1.0% 3.0% 5.0% 7.0% 9.0% 11.0% 13.0% 15.0% Q1 - 18 Q2 - 18 Q3 - 18 Q4 - 18 2H-2019 Waypoint Progress Milestones 2019 (Excluding Legacy Computing Contract) SG&A ($M) Gross Margin (%) Higher - Value Market Revenue Mix Bookings ($ M ) $900 $34 72% 9.8% $800 78% $36 9.5%
© 2018 Benchmark Electronics, Inc. | 12 Evolution to Date and the Future Repositioning and Realignment of Benchmark ► Implementation of market - sector sales organization to drive growth ► Expansion of engineering and technology capabilities ► Optimization of our network for elevated operational execution Commitment to Achieving Our Long - Term Business Model ► Transforming business to increase exposure to higher - value markets ► Pursuing revenue growth and margin expansion as we extend capabilities to customers ► Strong focus on operational execution and expense management ► Returning value to shareholders through disciplined capital allocation
| 13 © 2018 Benchmark Electronics, Inc. Q4 & 2018 Financial Highlights
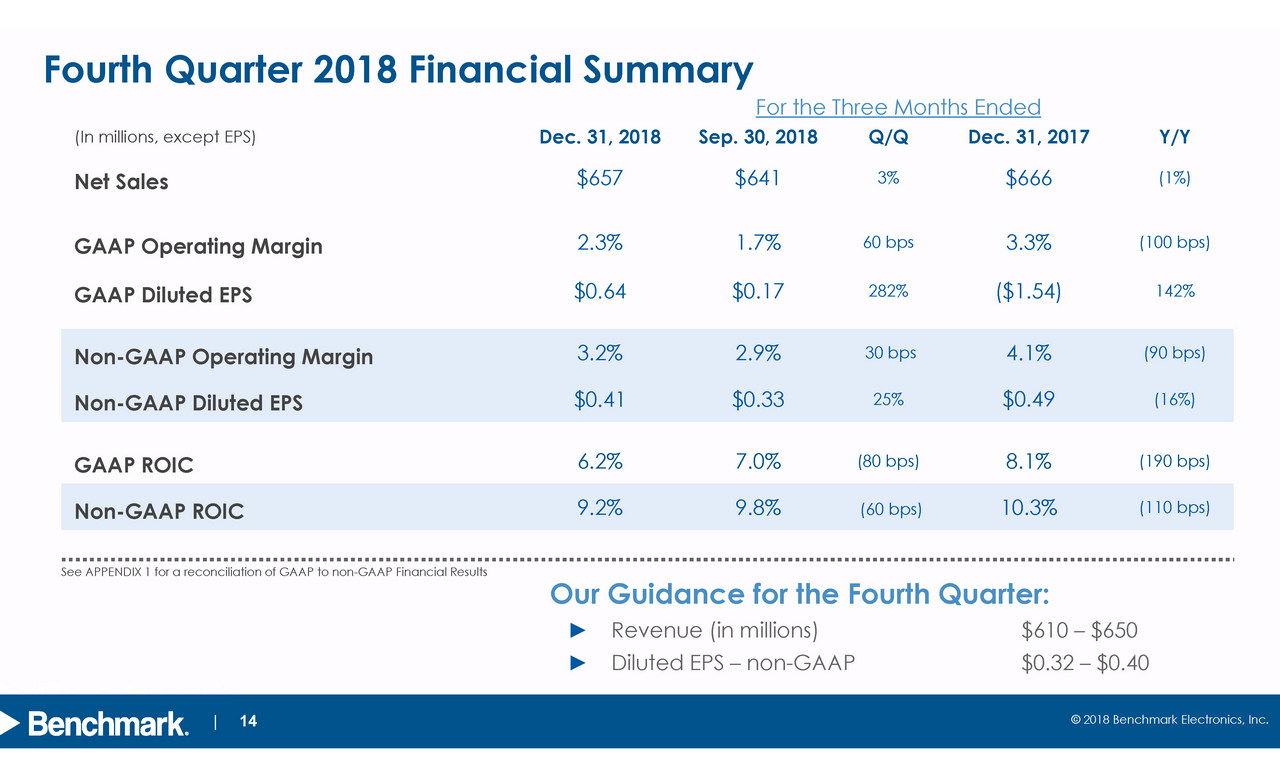
© 2018 Benchmark Electronics, Inc. | 14 Fourth Quarter 2018 Financial Summary For the Three Months Ended (In millions, except EPS) Dec. 31 , 2018 Sep. 30 , 2018 Q/Q Dec. 31 , 2017 Y/Y Net Sales $657 $641 3% $666 (1%) GAAP Operating Margin 2.3% 1.7% 60 bps 3.3% (100 bps) GAAP Diluted EPS $0.64 $0.17 282% ($1.54) 142% Non - GAAP Operating Margin 3.2% 2.9% 30 bps 4.1% (90 bps) Non - GAAP Diluted EPS $0.41 $0.33 25% $0.49 (16%) GAAP ROIC 6.2% 7.0% (80 bps) 8.1% (190 bps) Non - GAAP ROIC 9.2% 9.8% (60 bps) 10.3% (110 bps) See APPENDIX 1 for a reconciliation of GAAP to non - GAAP Financial Results Our Guidance for the Fourth Quarter: ► Revenue (in millions) $610 – $650 ► Diluted EPS – non - GAAP $0.32 – $0.40
© 2018 Benchmark Electronics, Inc. | 15 Higher - Value Markets Dec. 31 , 2018 Sep. 30 , 2018 Q/Q Industrials 18% $121 20% $128 (6%) Aerospace & Defense 16% $105 16% $105 -- Medical 16% $104 15% $96 8% Test & Instrument. 11% $70 12% $77 (9%) Total Revenue $400 $406 (2%) Revenue by Market Sector (1) In millions Traditional Markets Dec. 31 , 2018 Sep. 30 , 2018 Q/Q Computing 26% $171 23% $146 18% Telecommunication s 13% $86 14% $89 (3%) Total Revenue $257 $235 10% Dec. 31 , 2017 Y/Y 26% $172 (1%) 11% $77 12% $249 3% For the Three Months Ended Dec. 31 , 2017 Y/Y 19% $129 (6%) 15% $95 10% 15% $100 4% 14% $93 (25%) $417 (4%) (1) (1) (1) (1) (1) (1)
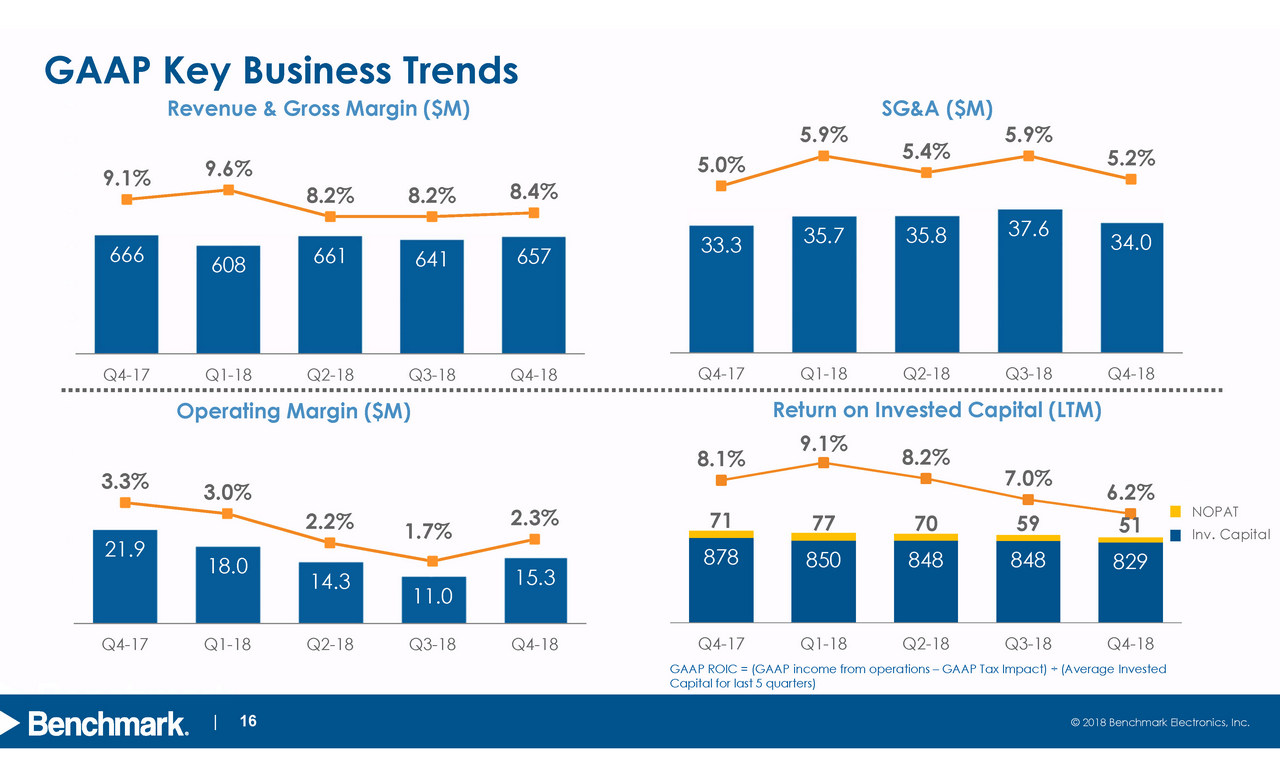
© 2018 Benchmark Electronics, Inc. | 16 GAAP Key Business Trends Return on Invested Capital (LTM) Operating Margin ($M) SG&A ($M) Revenue & Gross Margin ($ M ) NOPAT Inv. Capital 21.9 18.0 14.3 11.0 15.3 3.3% 3.0% 2.2% 1.7% 2.3% 0.0% 1.0% 2.0% 3.0% 4.0% 5.0% 6.0% 7.0% 0.0 10.0 20.0 30.0 40.0 50.0 60.0 Q4-17 Q1-18 Q2-18 Q3-18 Q4-18 33.3 35.7 35.8 37.6 34.0 5.0% 5.9% 5.4% 5.9% 5.2% 0.0% 1.0% 2.0% 3.0% 4.0% 5.0% 6.0% 7.0% 8.0% 0.0 10.0 20.0 30.0 40.0 50.0 60.0 70.0 Q4-17 Q1-18 Q2-18 Q3-18 Q4-18 666 608 661 641 657 9.1% 9.6% 8.2% 8.2% 8.4% 1.0% 3.0% 5.0% 7.0% 9.0% 11.0% 13.0% 15.0% 0 200 400 600 800 1,000 1,200 1,400 Q4-17 Q1-18 Q2-18 Q3-18 Q4-18 GAAP ROIC = ( GAAP income from operations – GAAP Tax Impact ) · (Average Invested Capital for last 5 quarters) 878 850 848 848 829 71 77 70 59 51 8.1% 9.1% 8.2% 7.0% 6.2% 0.0% 2.0% 4.0% 6.0% 8.0% 10.0% 0 200 400 600 800 1000 1200 1400 1600 1800 2000 Q4-17 Q1-18 Q2-18 Q3-18 Q4-18
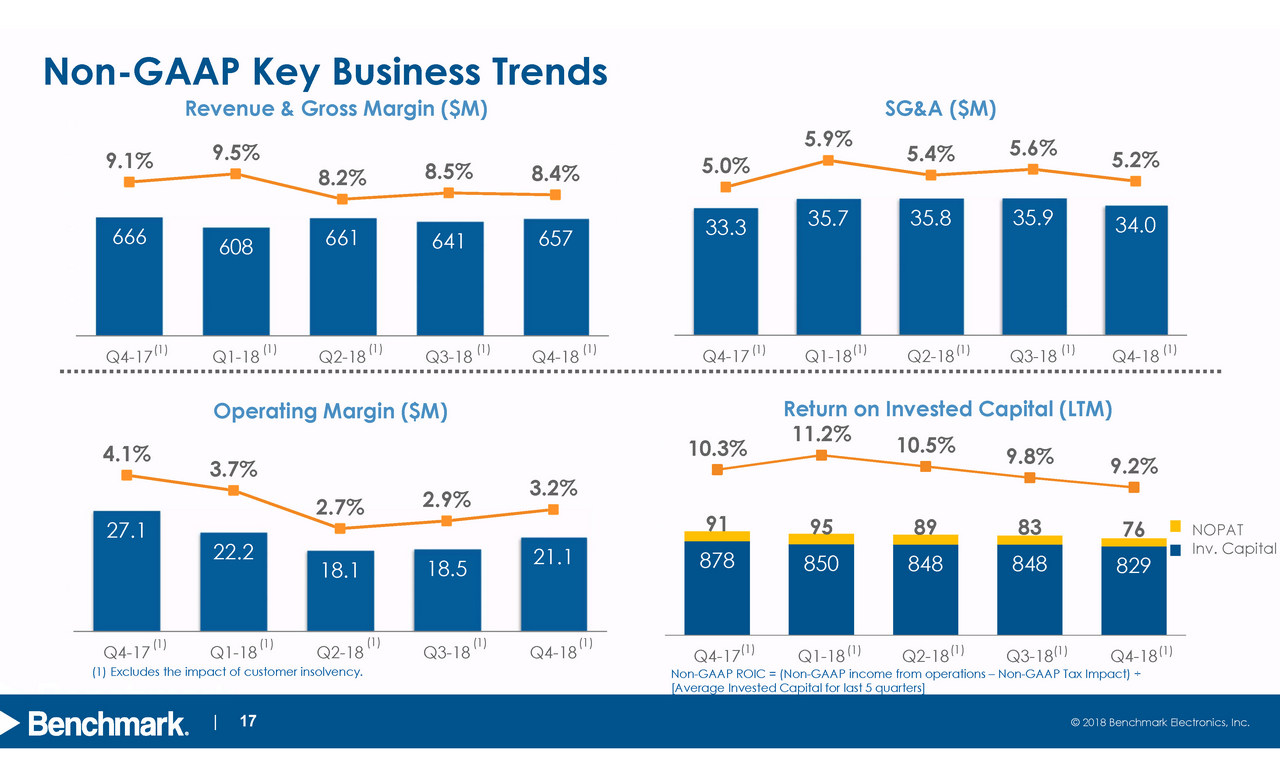
© 2018 Benchmark Electronics, Inc. | 17 Non - GAAP Key Business Trends Operating Margin ($M) SG&A ($M) Revenue & Gross Margin ($ M ) NOPAT Inv. Capital Non - GAAP ROIC = (Non - GAAP income from operations – Non - GAAP Tax Impact) · [Average Invested Capital for last 5 quarters] (1) Excludes the impact of customer insolvency. 33.3 35.7 35.8 35.9 34.0 5.0% 5.9% 5.4% 5.6% 5.2% 0.0% 1.0% 2.0% 3.0% 4.0% 5.0% 6.0% 7.0% 8.0% 9.0% 0.0 10.0 20.0 30.0 40.0 50.0 60.0 70.0 Q4-17 Q1-18 Q2-18 Q3-18 Q4-18 (1) (1) 666 608 661 641 657 9.1% 9.5% 8.2% 8.5% 8.4% 1.0% 3.0% 5.0% 7.0% 9.0% 11.0% 13.0% 15.0% 0 200 400 600 800 1,000 1,200 1,400 Q4-17 Q1-18 Q2-18 Q3-18 Q4-18 (1) (1) 27.1 22.2 18.1 18.5 21.1 4.1% 3.7% 2.7% 2.9% 3.2% 0.0% 1.0% 2.0% 3.0% 4.0% 5.0% 6.0% 7.0% 0.0 10.0 20.0 30.0 40.0 50.0 60.0 Q4-17 Q1-18 Q2-18 Q3-18 Q4-18 (1) (1) 878 850 848 848 829 91 95 89 83 76 10.3% 11.2% 10.5% 9.8% 9.2% 0.0% 2.0% 4.0% 6.0% 8.0% 10.0% 12.0% 0 200 400 600 800 1000 1200 1400 1600 1800 Q4-17 Q1-18 Q2-18 Q3-18 Q4-18 Return on Invested Capital (LTM) (1) (1) (1) (1) (1) (1) (1) (1) (1) (1) (1) (1) (1) (1)
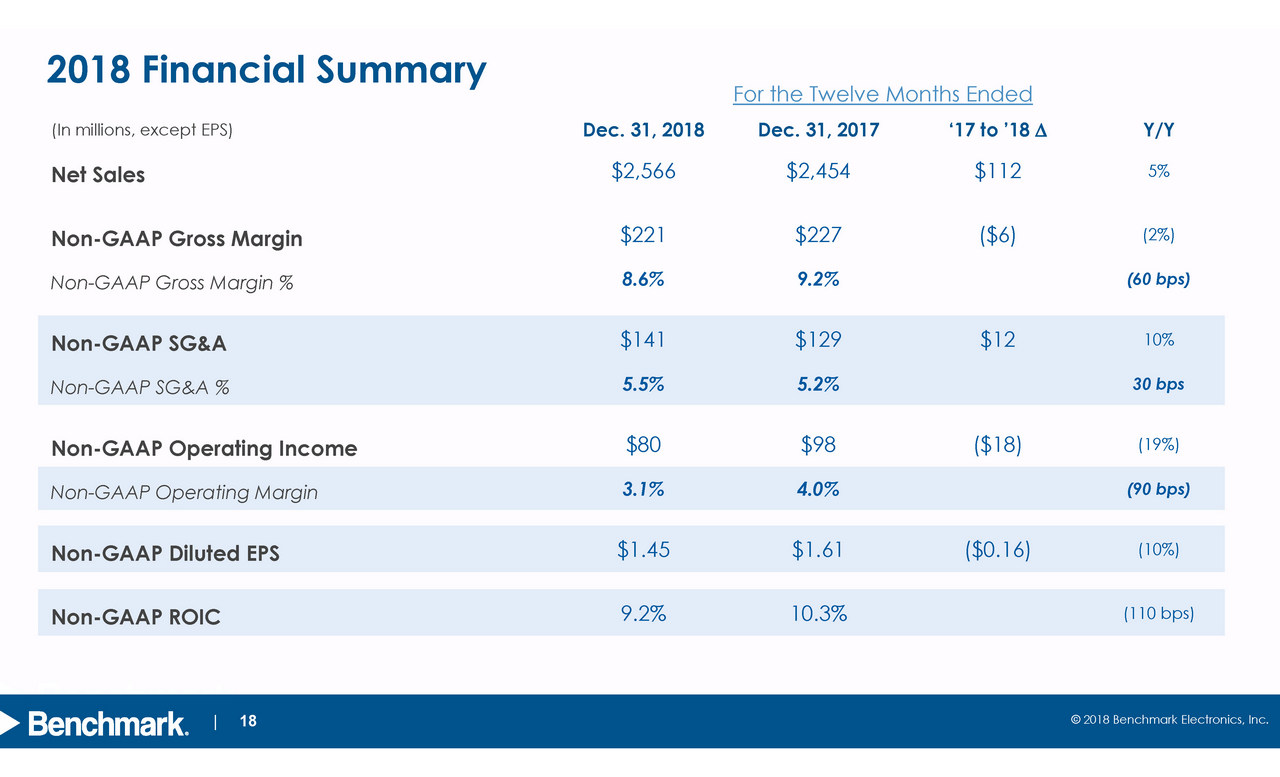
© 2018 Benchmark Electronics, Inc. | 18 2018 Financial Summary For the Twelve Months Ended (In millions, except EPS) Dec. 31 , 2018 Dec. 31 , 2017 ‘17 to ’18 Y/Y Net Sales $2,566 $2,454 $112 5% Non - GAAP Gross Margin $221 $227 ($6) (2%) Non - GAAP Gross Margin % 8.6% 9.2% (60 bps) Non - GAAP SG&A $141 $129 $12 10% Non - GAAP SG&A % 5.5% 5.2% 30 bps Non - GAAP Operating Income $80 $98 ($18) (19%) Non - GAAP Operating Margin 3.1% 4.0% (90 bps) Non - GAAP Diluted EPS $1.45 $1.61 ($0.16) (10%) Non - GAAP ROIC 9.2% 10.3% (110 bps)
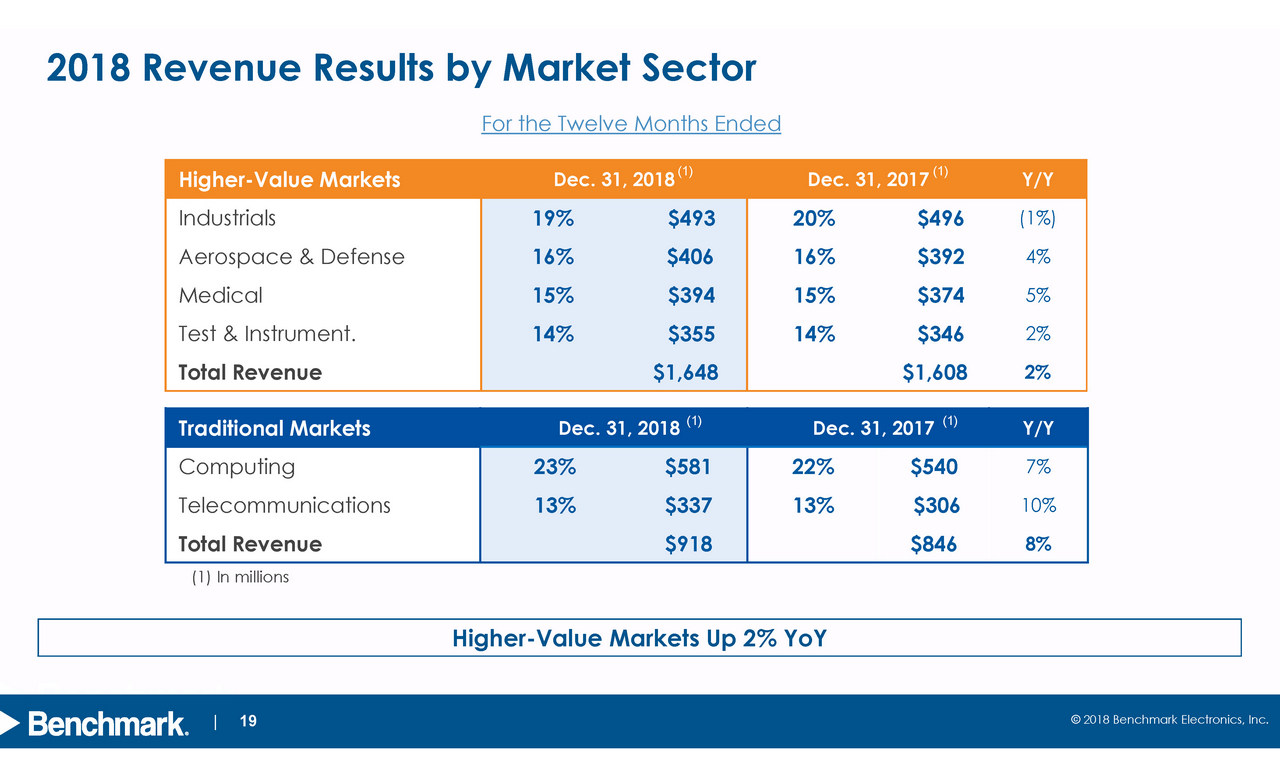
© 2018 Benchmark Electronics, Inc. | 19 2018 Revenue Results by Market Sector (1) In millions For the Twelve Months Ended Higher - Value Markets Up 2% YoY Higher - Value Markets Dec. 31 , 2018 Dec. 31 , 2017 Y/Y Industrials 19% $493 20% $496 (1%) Aerospace & Defense 16% $406 16% $392 4% Medical 15% $394 15% $374 5% Test & Instrument. 14% $355 14% $346 2% Total Revenue $1,648 $1,608 2% Traditional Markets Dec. 31 , 2018 Dec. 31 , 2017 Y/Y Computing 23% $581 22% $540 7% Telecommunication s 13% $337 13% $306 10% Total Revenue $918 $846 8% (1) (1) (1) (1)
© 2018 Benchmark Electronics, Inc. | 20 Cash Flow / Working Capital Highlights (1) Free cash flow (FCF) defined as net cash provided by operations (GAAP) less capex (In millions) Dec. 31, 2018 Dec. 31, 2017 Dec. 31 , 2018 Sep. 30 , 2018 Dec. 31 , 2017 Cash Flows from (used in) Operations $77 $146 $94 ($1) $56 FCF $10 $91 $80 ($16) $39 Cash $458 $743 $458 $476 $743 International $154 $674 $154 $170 $674 US $304 $69 $304 $306 $69 Inventory $310 $269 $310 $321 $269 Accounts Receivable $468 $437 $468 $456 $437 Contract Assets $140 $146 $140 $156 $146 Accounts Payable $422 $363 $422 $374 $363 For the Three Months Ended For the Twelve Months Ended 1
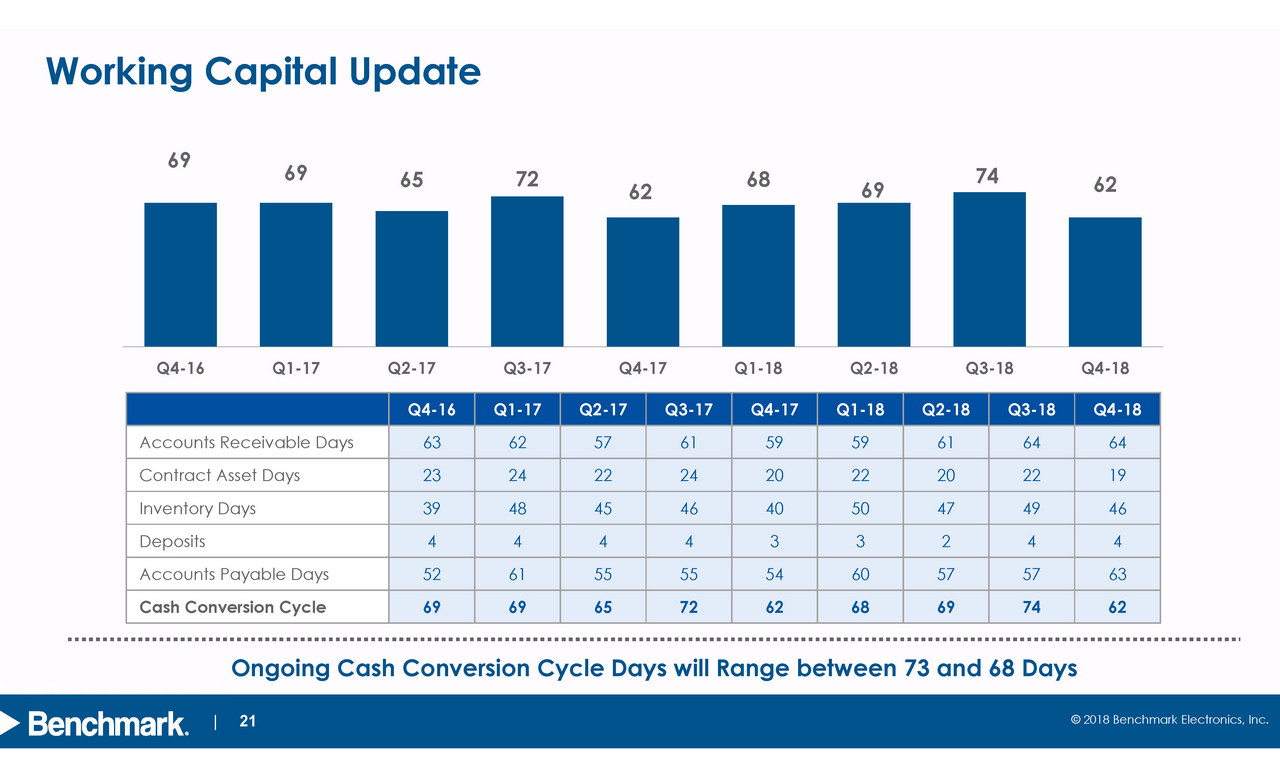
© 2018 Benchmark Electronics, Inc. | 21 Working Capital Update Ongoing Cash Conversion Cycle Days will Range between 73 and 68 Days Q4 - 16 Q1 - 17 Q2 - 17 Q3 - 17 Q4 - 17 Q1 - 18 Q2 - 18 Q3 - 18 Q4 - 18 Accounts Receivable Days 63 62 57 61 59 59 61 64 64 Contract Asset Days 23 24 22 24 20 22 20 22 19 Inventory Days 39 48 45 46 40 50 47 49 46 Deposits 4 4 4 4 3 3 2 4 4 Accounts Payable Days 52 61 55 55 54 60 57 57 63 Cash Conversion Cycle 69 69 65 72 62 68 69 74 62 69 69 65 72 62 68 69 74 62 0 20 40 60 80 100 120 Q4-16 Q1-17 Q2-17 Q3-17 Q4-17 Q1-18 Q2-18 Q3-18 Q4-18
© 2018 Benchmark Electronics, Inc. | 22 Capital Allocation Update Stock repurchase authorizations in 2018 ► Q1 - 18: Board approved stock repurchase of up to an additional $250 million of common stock ► Q4 - 18 : Board approved stock repurchase of up to an additional $100 million of common stock Recurring dividend initiated Q1 - 18 ► Announced first quarterly cash dividend of $0.15 per share to shareholders of record as of March 29, 2018; dividends were paid in April, July, and October 2018; and January 2019 Accelerated Stock Repurchase (ASR) Open Market Repurchase (OMR) $50 million ASR Completed Completed $212 million in 2018 $202 million remaining on existing authorizations $162 million OMR (Dec. 31)
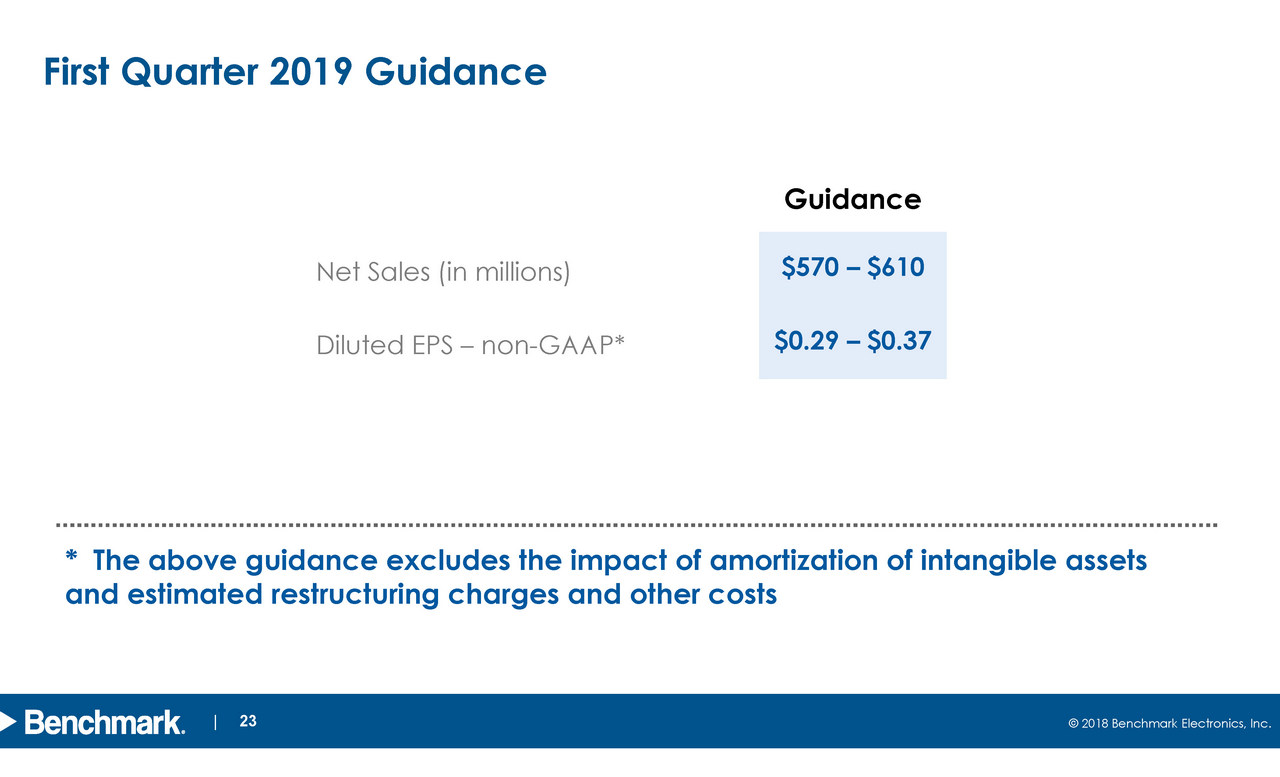
© 2018 Benchmark Electronics, Inc. | 23 First Quarter 2019 Guidance * The above guidance excludes the impact of amortization of intangible assets and estimated restructuring charges and other costs Guidance Net Sales (in millions) $570 – $610 Diluted EPS – non - GAAP* $0.29 – $0.37
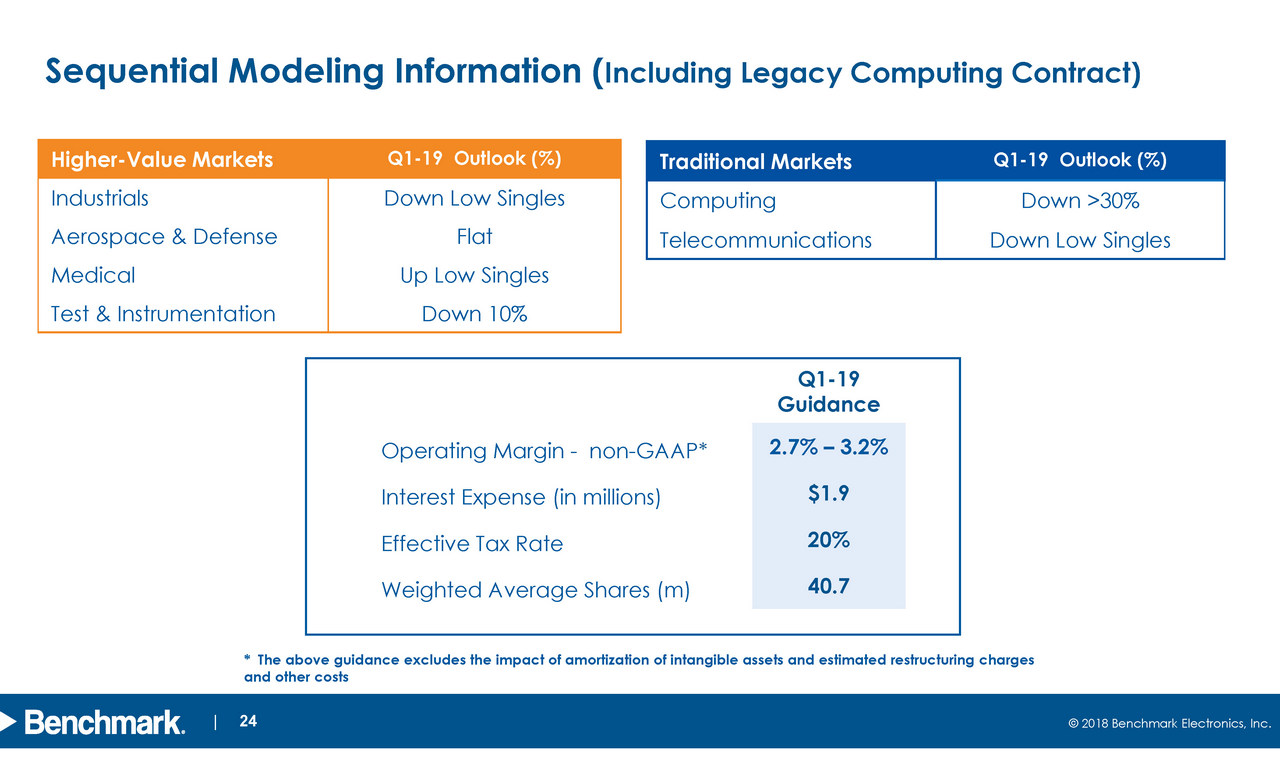
© 2018 Benchmark Electronics, Inc. | 24 Sequential Modeling Information ( Including Legacy Computing Contract) Higher - Value Markets Q1 - 19 Outlook (%) Industrials Down Low Singles Aerospace & Defense Flat Medical Up Low Singles Test & Instrumentation Down 10% Traditional Markets Q1 - 19 Outlook (%) Computing Down >30% Telecommunication s Down Low Singles Q1 - 19 Guidance Operating Margin - non - GAAP * 2.7% – 3.2% Interest Expense (in millions) $1.9 Effective Tax Rate 20% Weighted Average Shares (m) 40.7 * The above guidance excludes the impact of amortization of intangible assets and estimated restructuring charges and other costs
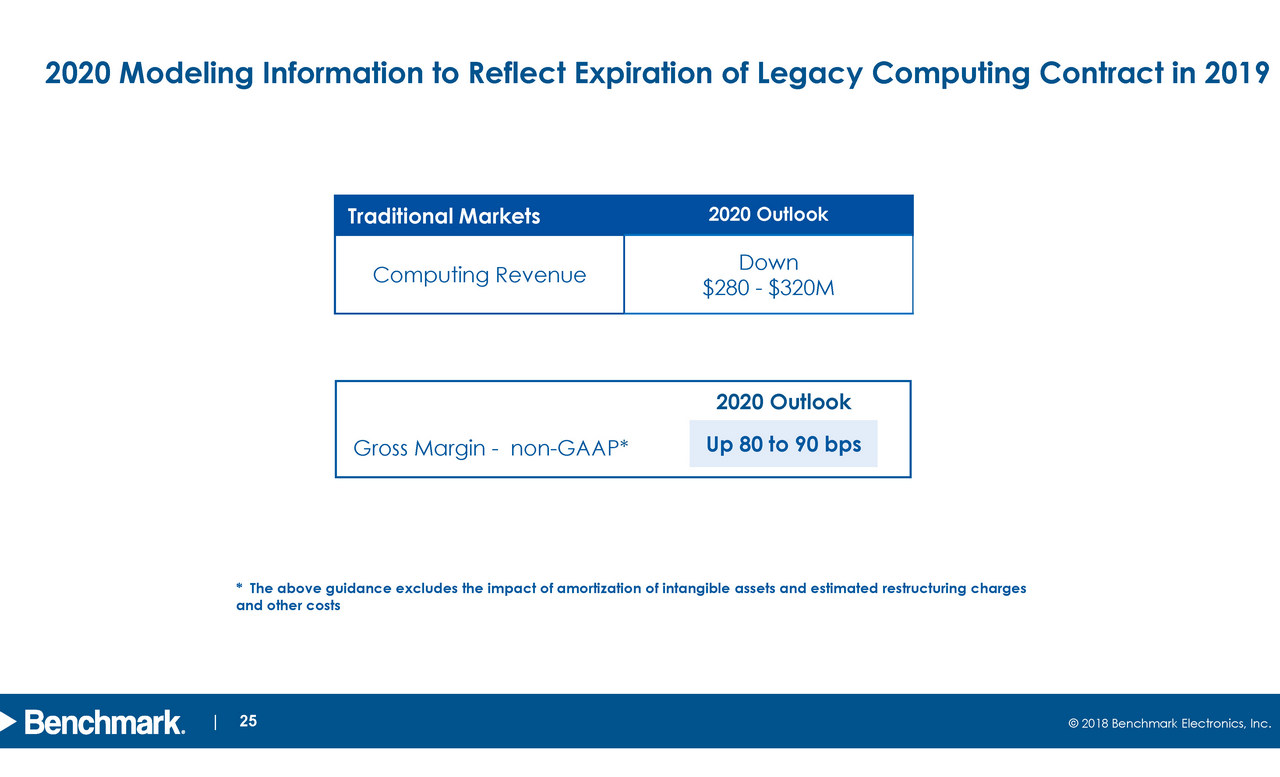
© 2018 Benchmark Electronics, Inc. | 25 2020 Modeling Information to Reflect Expiration of Legacy Computing Contract in 2019 Traditional Markets 2020 Outlook Computing Revenue Down $280 - $320M 2020 Outlook Gross Margin - non - GAAP * Up 80 to 90 bps * The above guidance excludes the impact of amortization of intangible assets and estimated restructuring charges and other costs
| 26 © 2018 Benchmark Electronics, Inc. Appendix
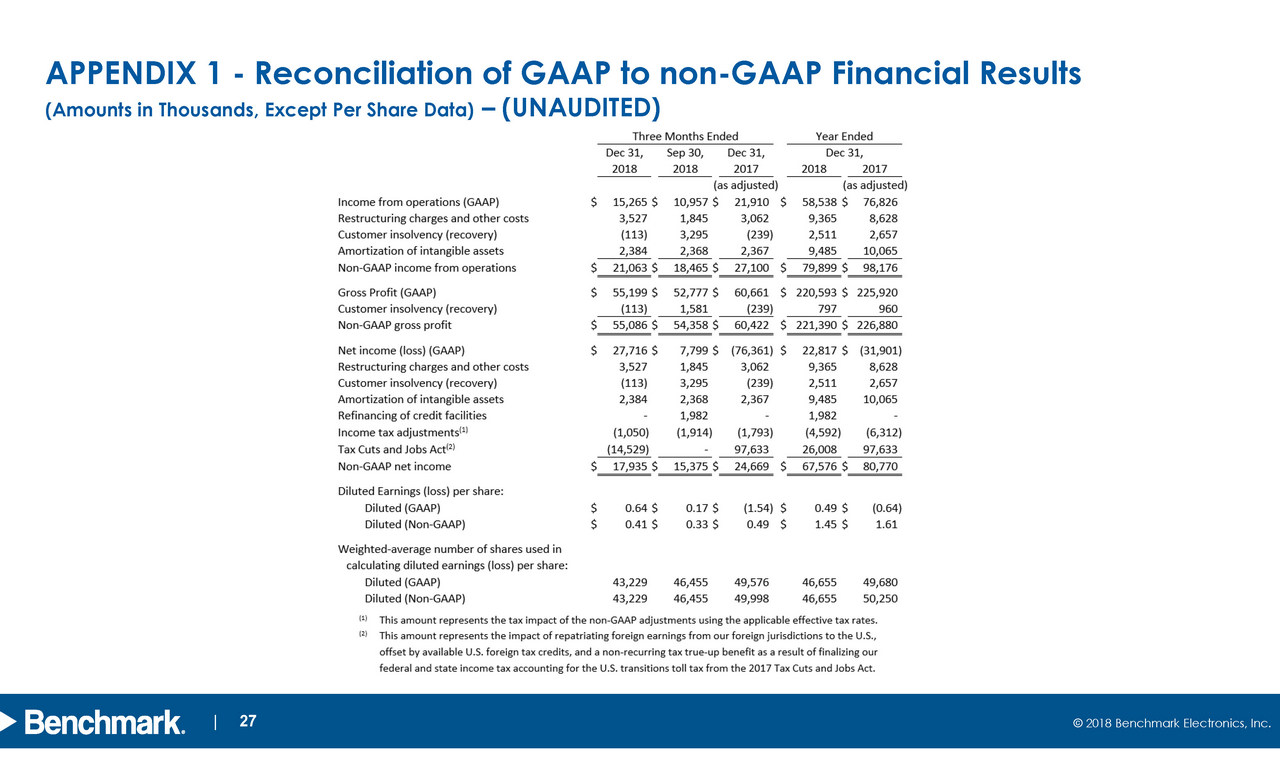
design develop deliver advanced technology 27 © 2018 Benchmark Electronics, Inc. | 27 APPENDIX 1 - Reconciliation of GAAP to non - GAAP Financial Results (Amounts in Thousands, Except Per Share Data) – (UNAUDITED)
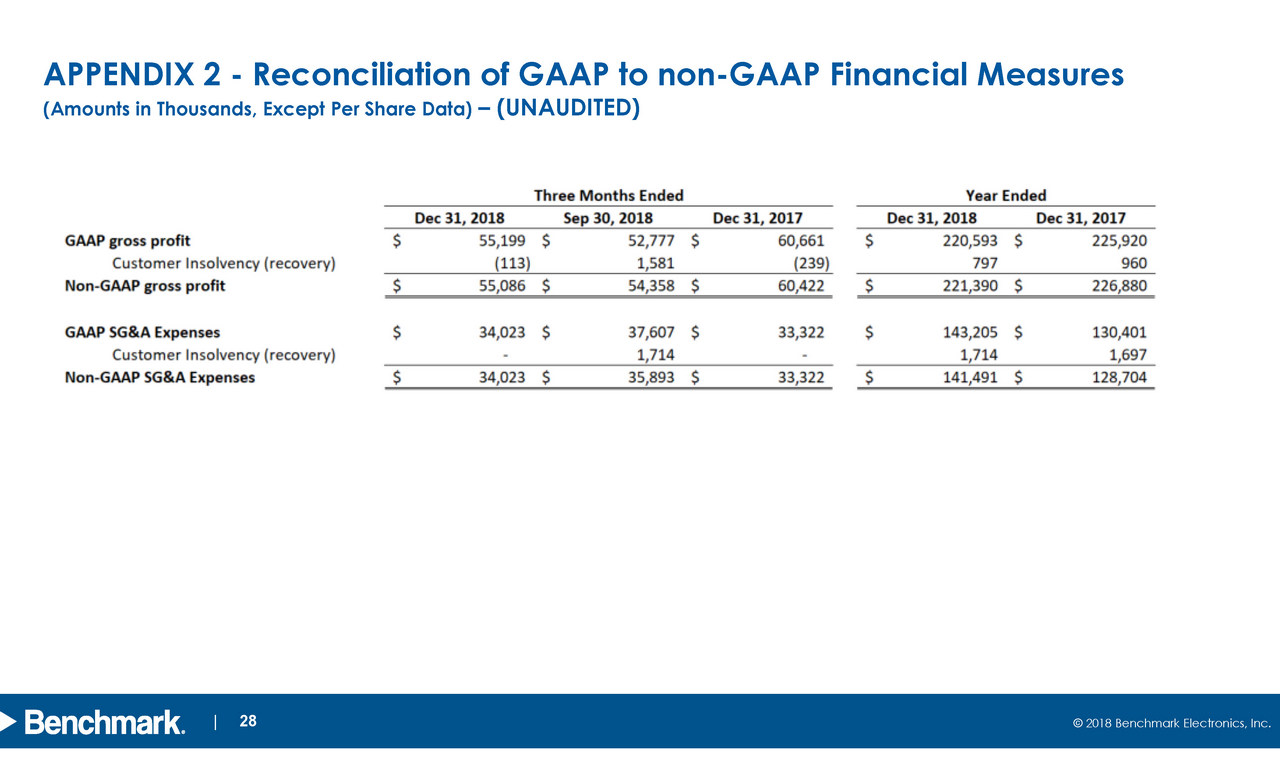
design develop deliver advanced technology 28 © 2018 Benchmark Electronics, Inc. | 28 APPENDIX 2 - Reconciliation of GAAP to non - GAAP Financial Measures (Amounts in Thousands, Except Per Share Data) – (UNAUDITED)
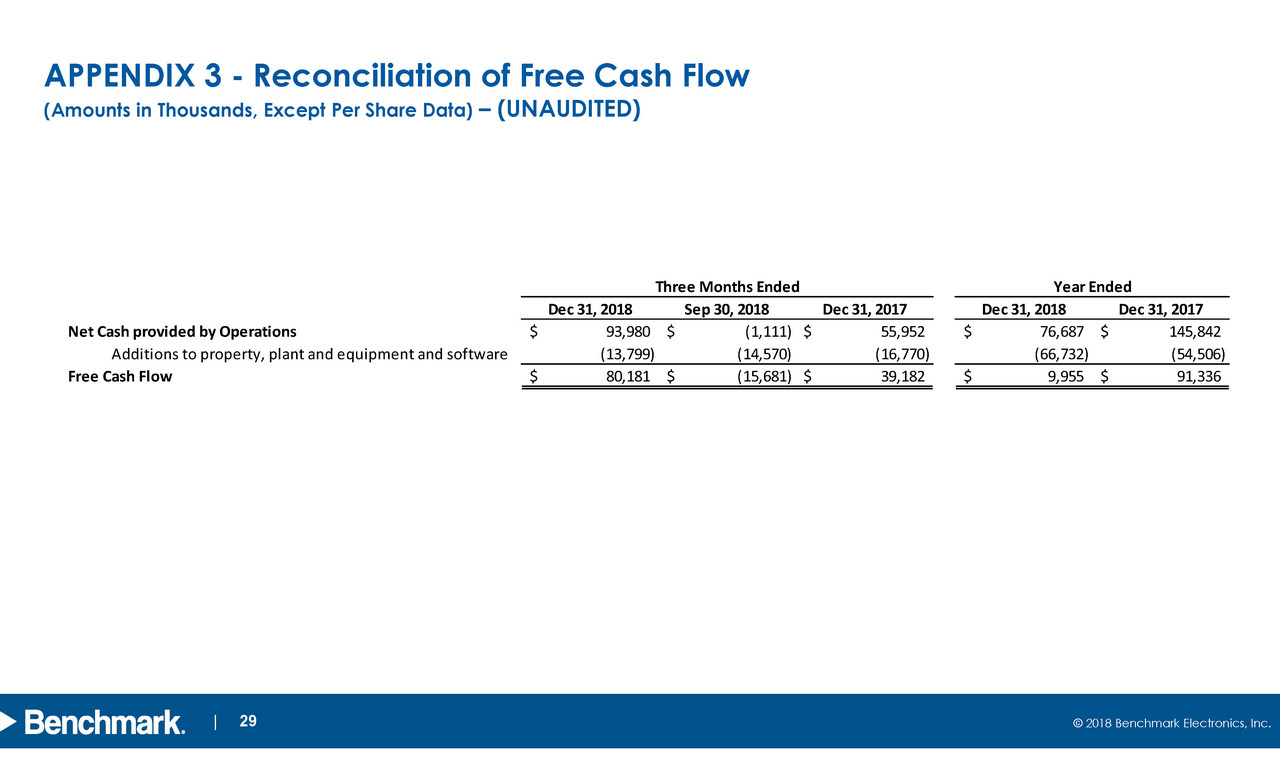
design develop deliver advanced technology 29 © 2018 Benchmark Electronics, Inc. | 29 APPENDIX 3 - Reconciliation of Free Cash Flow (Amounts in Thousands, Except Per Share Data) – (UNAUDITED) Dec 31, 2018 Sep 30, 2018 Dec 31, 2017 Dec 31, 2018 Dec 31, 2017 Net Cash provided by Operations 93,980$ (1,111)$ 55,952$ 76,687$ 145,842$ Additions to property, plant and equipment and software (13,799) (14,570) (16,770) (66,732) (54,506) Free Cash Flow 80,181$ (15,681)$ 39,182$ 9,955$ 91,336$ Three Months Ended Year Ended
BENCHMARK ANNOUNCES PLANNED CEO RETIREMENT
TEMPE, AZ, February 7, 2019– Benchmark Electronics, Inc. (NYSE: BHE) today announced that Paul J. Tufano, President and Chief Executive Officer, will retire after transitioning his responsibilities to a successor to be identified by the Board of Directors. He will also resign from the Board once his successor assumes the role of CEO. The Board of Directors has engaged a leading national executive search firm and is well underway to identify Mr. Tufano’s successor. Mr. Tufano will remain with the company as an advisor through December 31, 2019.
“On behalf of the Board of Directors, I would like to thank Paul for his contributions to Benchmark,” said David Scheible, Chairman of the Board of Directors. “Paul has been an invaluable part of Benchmark during his tenure as a Board Member and later stepping into the CEO role. Paul’s vision and drive have strengthened the foundations of Benchmark, and he leaves the company more resilient and well-positioned to achieve our strategy and long-term business targets.”
“It has been my privilege to lead Benchmark over the past few years,” said Tufano. “I am pleased with the progress we have made in the development of our go-to-market organization, the expansion of our engineering and solutions capabilities, and the unification and growth of our global network. Our leadership team is motivated and supported by a talented organization of professionals committed to solving the most complex problems for our customers. With these fundamentals in place, the timing is right to act on my planned retirement and transition to a new CEO who will continue guiding the organization towards the full achievement of our strategy. Benchmark has considerable opportunities in front of it and I look forward to working with my successor on a smooth transition.”
About Benchmark Electronics, Inc.
Benchmark is a worldwide provider of innovative product design, engineering services, technology solutions and advanced manufacturing services. From initial product concept to volume production, including direct order fulfillment and aftermarket services, Benchmark has been providing integrated services and solutions to original equipment manufacturers since 1979. Today, Benchmark proudly serves the following industries: aerospace and defense, medical technologies, complex industrials, test and instrumentation, next-generation telecommunications and high-end computing. Benchmark’s global operations network includes facilities in eight countries and common shares trade on the New York Stock Exchange under the symbol BHE.
For More Information, Please Contact:
Lisa K. Weeks, VP of Strategy & Investor Relations
623-300-7052 or lisa.weeks@bench.com
'--B""L;%BT L]KS;*
M# (L>BTA'HME7NC$]V9Y)X+)N^Y=*R*<'$
MZ>1YJI8@7!S6^5221SO]"(D@<+FU^G-0"#QUYJ+$W%\HO>QY64DV*FUM#J59
M$D/%C<\;*LM@0;@:\3PN%"=@1H&F][\NB9BQ0"POUX*%HR2XMD-Q?7JK$ ]H ;H.0&BBTI;;$Z(EAD:"!I?D59.<59#1EFLS:$#A?NE7
M2N5N9('Y#9XSLY@\5:,\KUV*2C?; T.8V%R;VZK66JNRD-# ''*0 +M%P>:RS
M(U$M@^X^-JK22S$+4LVS6'Q-@0>2T221!CD_:]1S-CTYK%ZJY>)B[H)N#?DJ
M=Y12F5_NLC&]H%G-%V]>.JR=F6*1ASGV%]3P2&K+/8N6ESM
M &^!*9;LJG8AY&8"U[Y#E9K0I$"]I:9 P<=3
MQ2*3YEF[Y&N:RV,; TFSWY0!?JJ63>K
M+.]KI%#>ZI=E[&2KCA86"&0OT[QMS\%K4A"-LK*PG*2>96,M+ T-<^5Q)' *
M\*:WD9SJ.]HAW=C,AMJ;#H$>BN$M;&"HD8 "QQ>?*P:5C.26QK"+V9@<1)(.
MU>0.9Z>Q9N[^(T6BT,9YA5OK8OWDAKA9;B5C0
MUI:_,2-1;AX*-$B5)ME&W)R@G7DH5V]"=$C+5V:UD8?F:TZ'JM*FUBD-VRC6
MNGJ PO \7'0*B