
Semiannual Report
April 30, 2023
MFS® Utilities Fund

MMU-SEM
MFS® Utilities Fund
CONTENTS
| 1 | |
| 2 | |
| 4 | |
| 7 | |
| 9 | |
| 10 | |
| 11 | |
| 20 | |
| 33 | |
| 34 | |
| 34 | |
| 34 | |
| 34 | |
| 34 |
| back cover |
The report is prepared for the
general information of shareholders. It is authorized for distribution to prospective investors only when preceded or accompanied by a current prospectus.
NOT FDIC INSURED
• MAY LOSE VALUE • NO BANK GUARANTEE
Portfolio Composition
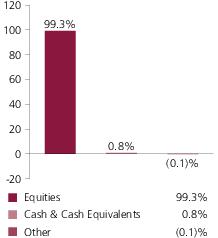
| (x) | Represents the portfolio’s exposure to issuer countries as a percentage of a portfolio’s net assets. For purposes of this presentation, United States includes Cash & Cash Equivalents and Other. |
Where the fund holds
convertible bonds, they are treated as part of the equity portion of the portfolio.
Cash & Cash
Equivalents includes any cash, investments in money market funds, short-term securities, and other assets less liabilities. Please see the Statement of Assets and Liabilities for additional information related to the
fund’s cash position and other assets and liabilities.
Other includes equivalent
exposure from currency derivatives and/or any offsets to derivative positions and may be negative.
Percentages are based on
net assets as of April 30, 2023.
The portfolio is actively
managed and current holdings may be different.
1
Expense Table
Fund expenses borne by the
shareholders during the period,
November 1, 2022 through April 30, 2023
November 1, 2022 through April 30, 2023
As a shareholder of the fund, you
incur two types of costs: (1) transaction costs, including sales charges (loads) on certain purchase or redemption payments, and (2) ongoing costs, including management fees; distribution and service (12b-1) fees; and
other fund expenses. This example is intended to help you understand your ongoing costs (in dollars) of investing in the fund and to compare these costs with the ongoing costs of investing in other mutual funds.
The example is based on an
investment of $1,000 invested at the beginning of the period and held for the entire period November 1, 2022 through April 30, 2023.
Actual Expenses
The first line for each share class
in the following table provides information about actual account values and actual expenses. You may use the information in this line, together with the amount you invested, to estimate the expenses that you paid over
the period. Simply divide your account value by $1,000 (for example, an $8,600 account value divided by $1,000 = 8.6), then multiply the result by the number in the first line under the heading entitled
“Expenses Paid During Period” to estimate the expenses you paid on your account during this period.
Hypothetical Example for
Comparison Purposes
The second line for each share class
in the following table provides information about hypothetical account values and hypothetical expenses based on the fund’s actual expense ratio and an assumed rate of return of 5% per year before expenses,
which is not the fund’s actual return. The hypothetical account values and expenses may not be used to estimate the actual ending account balance or expenses you paid for the period. You may use this information
to compare the ongoing costs of investing in the fund and other funds. To do so, compare this 5% hypothetical example with the 5% hypothetical examples that appear in the shareholder reports of the other funds.
Please note that the expenses shown
in the table are meant to highlight your ongoing costs only and do not reflect any transactional costs, such as sales charges (loads). Therefore, the second line for each share class in the table is useful in
comparing ongoing costs only, and will not help you determine the relative total costs of owning different funds. In addition, if these transactional costs were included, your costs would have been higher.
2
Expense Table - continued
| Share Class | Annualized Expense Ratio | Beginning Account Value 11/01/22 | Ending Account Value 4/30/23 | Expenses Paid During Period (p) 11/01/22-4/30/23 | |
| A | Actual | 1.03% | $1,000.00 | $1,082.92 | $5.32 |
| Hypothetical (h) | 1.03% | $1,000.00 | $1,019.69 | $5.16 | |
| B | Actual | 1.77% | $1,000.00 | $1,079.45 | $9.13 |
| Hypothetical (h) | 1.77% | $1,000.00 | $1,016.02 | $8.85 | |
| C | Actual | 1.77% | $1,000.00 | $1,079.14 | $9.12 |
| Hypothetical (h) | 1.77% | $1,000.00 | $1,016.02 | $8.85 | |
| I | Actual | 0.77% | $1,000.00 | $1,084.26 | $3.98 |
| Hypothetical (h) | 0.77% | $1,000.00 | $1,020.98 | $3.86 | |
| R1 | Actual | 1.78% | $1,000.00 | $1,079.33 | $9.18 |
| Hypothetical (h) | 1.78% | $1,000.00 | $1,015.97 | $8.90 | |
| R2 | Actual | 1.28% | $1,000.00 | $1,081.89 | $6.61 |
| Hypothetical (h) | 1.28% | $1,000.00 | $1,018.45 | $6.41 | |
| R3 | Actual | 1.03% | $1,000.00 | $1,082.97 | $5.32 |
| Hypothetical (h) | 1.03% | $1,000.00 | $1,019.69 | $5.16 | |
| R4 | Actual | 0.78% | $1,000.00 | $1,084.63 | $4.03 |
| Hypothetical (h) | 0.78% | $1,000.00 | $1,020.93 | $3.91 | |
| R6 | Actual | 0.68% | $1,000.00 | $1,084.75 | $3.51 |
| Hypothetical (h) | 0.68% | $1,000.00 | $1,021.42 | $3.41 |
| (h) | 5% class return per year before expenses. |
| (p) | “Expenses Paid During Period” are equal to each class’s annualized expense ratio, as shown above, multiplied by the average account value over the period, multiplied by 181/365 (to reflect the one-half year period). Expenses paid do not include any applicable sales charges (loads). If these transaction costs had been included, your costs would have been higher. |
Notes to Expense Table
Expense ratios include 0.03% of tax
reclaim recovery expenses.
3
Portfolio of Investments
4/30/23 (unaudited)
The Portfolio of Investments is a
complete list of all securities owned by your fund. It is categorized by broad-based asset classes.
| Issuer | Shares/Par | Value ($) | ||
| Common Stocks – 99.3% | ||||
| Energy - Renewables – 6.0% | ||||
| AES Corp. | 2,482,603 | $58,738,387 | ||
| EDP Renovaveis S.A. (a) | 4,804,326 | 106,949,628 | ||
| Orsted A/S | 243,930 | 21,923,207 | ||
| $187,611,222 | ||||
| Natural Gas - Distribution – 1.9% | ||||
| Atmos Energy Corp. | 396,597 | $45,267,581 | ||
| China Resources Gas Group Ltd. | 4,478,200 | 14,165,755 | ||
| $59,433,336 | ||||
| Telecommunications - Wireless – 6.4% | ||||
| Cellnex Telecom S.A. | 2,307,383 | $97,210,663 | ||
| Rogers Communications, Inc. | 640,399 | 31,640,631 | ||
| SBA Communications Corp., REIT | 241,163 | 62,917,015 | ||
| Vodafone Group PLC | 8,289,989 | 9,965,825 | ||
| $201,734,134 | ||||
| Telephone Services – 0.5% | ||||
| Hellenic Telecommunications Organization S.A. | 1,128,630 | $16,478,196 | ||
| Utilities - Electric Power – 83.2% | ||||
| Alliant Energy Corp. | 1,384,887 | $76,362,669 | ||
| Ameren Corp. | 1,131,698 | 100,687,171 | ||
| American Electric Power Co., Inc. | 923,328 | 85,333,974 | ||
| CenterPoint Energy, Inc. | 1,029,525 | 31,369,627 | ||
| CLP Holdings Ltd. | 3,491,000 | 26,018,832 | ||
| Constellation Energy | 900,043 | 69,663,328 | ||
| Dominion Energy, Inc. | 2,891,364 | 165,212,539 | ||
| DTE Energy Co. | 1,053,606 | 118,435,851 | ||
| E.ON SE | 5,620,582 | 74,350,799 | ||
| Edison International | 1,559,343 | 114,767,645 | ||
| Enel S.p.A. | 11,837,954 | 80,861,254 | ||
| Energias de Portugal S.A. | 8,226,319 | 45,385,133 | ||
| Energisa S.A., IEU | 2,012,500 | 16,865,652 | ||
| Entergy Corp. | 144,417 | 15,536,381 | ||
| Equatorial Energia S.A. | 3,330,800 | 18,257,362 | ||
| Evergy, Inc. | 1,054,093 | 65,469,716 | ||
| Exelon Corp. | 1,138,894 | 48,334,661 | ||
| Iberdrola S.A. | 4,982,884 | 64,645,977 | ||
| National Grid PLC | 4,144,893 | 59,455,206 | ||
| NextEra Energy, Inc. | 4,826,759 | 369,874,542 | ||
4
Portfolio of Investments (unaudited)
– continued
| Issuer | Shares/Par | Value ($) | ||
| Common Stocks – continued | ||||
| Utilities - Electric Power – continued | ||||
| PG&E Corp. (a) | 12,179,453 | $208,390,441 | ||
| Pinnacle West Capital Corp. | 564,756 | 44,310,756 | ||
| Portland General Electric Co. | 779,717 | 39,469,275 | ||
| PPL Corp. | 3,602,970 | 103,477,299 | ||
| Public Service Enterprise Group, Inc. | 746,785 | 47,196,812 | ||
| RWE AG | 2,398,544 | 112,457,763 | ||
| Sempra Energy | 961,829 | 149,554,791 | ||
| Southern Co. | 2,139,142 | 157,333,894 | ||
| SSE PLC | 3,088,582 | 71,259,685 | ||
| Xcel Energy, Inc. | 586,186 | 40,980,263 | ||
| $2,621,319,298 | ||||
| Utilities - Water – 1.3% | ||||
| Veolia Environnement S.A. | 1,265,304 | $40,117,625 | ||
| Total Common Stocks (Identified Cost, $2,248,211,938) | $3,126,693,811 | |||
| Investment Companies (h) – 0.6% | ||||
| Money Market Funds – 0.6% | ||||
| MFS Institutional Money Market Portfolio, 4.59% (v) (Identified Cost, $19,371,218) | 19,369,797 | $19,373,670 | ||
| Other Assets, Less Liabilities – 0.1% | 4,505,799 | |||
| Net Assets – 100.0% | $3,150,573,280 | |||
| (a) | Non-income producing security. | |||
| (h) | An affiliated issuer, which may be considered one in which the fund owns 5% or more of the outstanding voting securities, or a company which is under common control. At period end, the aggregate values of the fund's investments in affiliated issuers and in unaffiliated issuers were $19,373,670 and $3,126,693,811, respectively. | |||
| (v) | Affiliated issuer that is available only to investment companies managed by MFS. The rate quoted for the MFS Institutional Money Market Portfolio is the annualized seven-day yield of the fund at period end. |
| The following abbreviations are used in this report and are defined: | |
| IEU | International Equity Unit |
| REIT | Real Estate Investment Trust |
| Abbreviations indicate amounts shown in currencies other than the U.S. dollar. All amounts are stated in U.S. dollars unless otherwise indicated. A list of abbreviations is shown below: | |
| CAD | Canadian Dollar |
| EUR | Euro |
| GBP | British Pound |
5
Portfolio of Investments (unaudited)
– continued
Derivative Contracts at 4/30/23
| Forward Foreign Currency Exchange Contracts | ||||||
| Currency Purchased | Currency Sold | Counterparty | Settlement Date | Unrealized Appreciation (Depreciation) | ||
| Asset Derivatives | ||||||
| EUR | 3,919,601 | USD | 4,318,668 | JPMorgan Chase Bank N.A. | 7/21/2023 | $20,025 |
| USD | 20,109,375 | CAD | 26,958,709 | HSBC Bank | 7/21/2023 | 179,264 |
| $199,289 | ||||||
| Liability Derivatives | ||||||
| USD | 414,136,227 | EUR | 376,015,716 | Morgan Stanley Capital Services, Inc. | 7/21/2023 | $(2,083,844) |
| USD | 90,811,858 | GBP | 72,597,059 | HSBC Bank | 7/21/2023 | (568,022) |
| USD | 332,236 | GBP | 266,976 | State Street Bank Corp. | 7/21/2023 | (3,814) |
| $(2,655,680) | ||||||
At April 30, 2023, the fund had cash
collateral of $2,810,000 to cover any collateral or margin obligations for certain derivative contracts. Restricted cash and/or deposits with brokers in the Statement of Assets and Liabilities are comprised of cash
collateral.
See Notes to Financial Statements
6
Financial Statements
Statement of Assets and
Liabilities
At 4/30/23 (unaudited)
This statement represents your
fund’s balance sheet, which details the assets and liabilities comprising the total value of the fund.
| Assets | |
| Investments in unaffiliated issuers, at value (identified cost, $2,248,211,938) | $3,126,693,811 |
| Investments in affiliated issuers, at value (identified cost, $19,371,218) | 19,373,670 |
| Cash | 6,618 |
| Foreign currency, at value (identified cost, $7,501) | 7,539 |
| Restricted cash for | |
| Forward foreign currency exchange contracts | 2,810,000 |
| Receivables for | |
| Forward foreign currency exchange contracts | 199,289 |
| Fund shares sold | 995,067 |
| Dividends | 7,006,608 |
| Other assets | 44,262 |
| Total assets | $3,157,136,864 |
| Liabilities | |
| Payables for | |
| Forward foreign currency exchange contracts | $2,655,680 |
| Fund shares reacquired | 2,030,719 |
| Payable to affiliates | |
| Investment adviser | 201,514 |
| Administrative services fee | 5,042 |
| Shareholder servicing costs | 980,551 |
| Distribution and service fees | 74,567 |
| Payable for independent Trustees' compensation | 7,729 |
| Accrued expenses and other liabilities | 607,782 |
| Total liabilities | $6,563,584 |
| Net assets | $3,150,573,280 |
| Net assets consist of | |
| Paid-in capital | $2,274,692,062 |
| Total distributable earnings (loss) | 875,881,218 |
| Net assets | $3,150,573,280 |
| Shares of beneficial interest outstanding | 136,737,766 |
7
Statement of Assets and Liabilities (unaudited) – continued
| Net assets | Shares outstanding | Net asset value per share (a) | |
| Class A | $1,941,883,929 | 84,371,178 | $23.02 |
| Class B | 24,837,217 | 1,085,158 | 22.89 |
| Class C | 91,908,679 | 4,016,638 | 22.88 |
| Class I | 703,157,824 | 30,381,915 | 23.14 |
| Class R1 | 5,506,724 | 241,832 | 22.77 |
| Class R2 | 39,748,435 | 1,733,643 | 22.93 |
| Class R3 | 218,649,691 | 9,508,795 | 22.99 |
| Class R4 | 23,382,982 | 1,014,511 | 23.05 |
| Class R6 | 101,497,799 | 4,384,096 | 23.15 |
| (a) | Maximum offering price per share was equal to the net asset value per share for all share classes, except for Class A, for which the maximum offering price per share was $24.42 [100 / 94.25 x $23.02]. On sales of $50,000 or more, the maximum offering price of Class A shares is reduced. A contingent deferred sales charge may be imposed on redemptions of Class A, Class B, and Class C shares. Redemption price per share was equal to the net asset value per share for Classes I, R1, R2, R3, R4, and R6. |
See Notes to Financial Statements
8
Financial Statements
Statement of Operations
Six months ended 4/30/23
(unaudited)
This statement describes how much
your fund earned in investment income and accrued in expenses. It also describes any gains and/or losses generated by fund operations.
| Net investment income (loss) | |
| Income | |
| Dividends | $46,246,319 |
| Dividends from affiliated issuers | 476,081 |
| Other | 128,143 |
| Income on securities loaned | 5,898 |
| Total investment income | $46,856,441 |
| Expenses | |
| Management fee | $9,335,936 |
| Distribution and service fees | 3,410,633 |
| Shareholder servicing costs | 1,737,666 |
| Administrative services fee | 235,181 |
| Independent Trustees' compensation | 26,088 |
| Custodian fee | 153,173 |
| Shareholder communications | 75,591 |
| Audit and tax fees | 37,331 |
| Legal fees | 7,688 |
| Miscellaneous | 661,368 |
| Total expenses | $15,680,655 |
| Fees paid indirectly | (4,633) |
| Reduction of expenses by investment adviser and distributor | (204,263) |
| Net expenses | $15,471,759 |
| Net investment income (loss) | $31,384,682 |
| Realized and unrealized gain (loss) | |
| Realized gain (loss) (identified cost basis) | |
| Unaffiliated issuers | $47,100,014 |
| Affiliated issuers | 10,235 |
| Forward foreign currency exchange contracts | (42,369,964) |
| Foreign currency | (266,604) |
| Net realized gain (loss) | $4,473,681 |
| Change in unrealized appreciation or depreciation | |
| Unaffiliated issuers | $215,624,259 |
| Affiliated issuers | 871 |
| Forward foreign currency exchange contracts | (75,511) |
| Translation of assets and liabilities in foreign currencies | 192,225 |
| Net unrealized gain (loss) | $215,741,844 |
| Net realized and unrealized gain (loss) | $220,215,525 |
| Change in net assets from operations | $251,600,207 |
See Notes to Financial Statements
9
Financial Statements
Statements of Changes in Net
Assets
These statements describe the
increases and/or decreases in net assets resulting from operations, any distributions, and any shareholder transactions.
| Six months ended | Year ended | |
| 4/30/23 (unaudited) | 10/31/22 | |
| Change in net assets | ||
| From operations | ||
| Net investment income (loss) | $31,384,682 | $56,239,937 |
| Net realized gain (loss) | 4,473,681 | 224,894,811 |
| Net unrealized gain (loss) | 215,741,844 | (296,877,774) |
| Change in net assets from operations | $251,600,207 | $(15,743,026) |
| Total distributions to shareholders | $(233,132,531) | $(196,277,058) |
| Change in net assets from fund share transactions | $44,214,909 | $108,277,444 |
| Total change in net assets | $62,682,585 | $(103,742,640) |
| Net assets | ||
| At beginning of period | 3,087,890,695 | 3,191,633,335 |
| At end of period | $3,150,573,280 | $3,087,890,695 |
See Notes to Financial Statements
10
Financial Statements
Financial Highlights
The financial highlights table is
intended to help you understand the fund's financial performance for the semiannual period and the past 5 fiscal years. Certain information reflects financial results for a single fund share. The total returns in the
table represent the rate that an investor would have earned (or lost) on an investment in the fund share class (assuming reinvestment of all distributions) held for the entire period.
| Class A | Six months ended | Year ended | ||||
| 4/30/23 (unaudited) | 10/31/22 | 10/31/21 | 10/31/20 | 10/31/19 | 10/31/18 | |
| Net asset value, beginning of period | $22.88 | $24.45 | $21.65 | $23.54 | $20.08 | $20.46 |
| Income (loss) from investment operations | ||||||
| Net investment income (loss) (d) | $0.22 | $0.41 | $0.46 | $0.54 | $0.55 | $0.55 |
| Net realized and unrealized gain (loss) | 1.66 | (0.48) | 3.52 | (0.93) | 3.73 | (0.35) |
| Total from investment operations | $1.88 | $(0.07) | $3.98 | $(0.39) | $4.28 | $0.20 |
| Less distributions declared to shareholders | ||||||
| From net investment income | $(0.20) | $(0.44) | $(0.26) | $(0.31) | $(0.49) | $(0.50) |
| From net realized gain | (1.54) | (1.06) | (0.92) | (1.19) | (0.33) | (0.08) |
| Total distributions declared to shareholders | $(1.74) | $(1.50) | $(1.18) | $(1.50) | $(0.82) | $(0.58) |
| Net asset value, end of period (x) | $23.02 | $22.88 | $24.45 | $21.65 | $23.54 | $20.08 |
| Total return (%) (r)(s)(t)(x) | 8.34(n) | (0.50) | 18.90 | (1.70) | 21.94 | 0.98 |
| Ratios (%) (to average net assets) and Supplemental data: | ||||||
| Expenses before expense reductions (f) | 1.04(a) | 1.00 | 1.00 | 1.00 | 1.00 | 1.00 |
| Expenses after expense reductions (f) | 1.03(a) | 0.99 | 0.99 | 0.99 | 0.99 | 0.99 |
| Net investment income (loss) | 1.97(a) | 1.72 | 1.98 | 2.51 | 2.51 | 2.70 |
| Portfolio turnover | 10(n) | 23 | 12 | 30 | 30 | 23 |
| Net assets at end of period (000 omitted) | $1,941,884 | $1,861,665 | $1,951,571 | $1,744,515 | $1,956,524 | $1,706,956 |
See Notes to Financial Statements
11
Financial Highlights – continued
| Class B | Six months ended | Year ended | ||||
| 4/30/23 (unaudited) | 10/31/22 | 10/31/21 | 10/31/20 | 10/31/19 | 10/31/18 | |
| Net asset value, beginning of period | $22.75 | $24.30 | $21.53 | $23.42 | $19.98 | $20.36 |
| Income (loss) from investment operations | ||||||
| Net investment income (loss) (d) | $0.14 | $0.24 | $0.30 | $0.38 | $0.38 | $0.39 |
| Net realized and unrealized gain (loss) | 1.65 | (0.49) | 3.49 | (0.93) | 3.72 | (0.35) |
| Total from investment operations | $1.79 | $(0.25) | $3.79 | $(0.55) | $4.10 | $0.04 |
| Less distributions declared to shareholders | ||||||
| From net investment income | $(0.11) | $(0.24) | $(0.10) | $(0.15) | $(0.33) | $(0.34) |
| From net realized gain | (1.54) | (1.06) | (0.92) | (1.19) | (0.33) | (0.08) |
| Total distributions declared to shareholders | $(1.65) | $(1.30) | $(1.02) | $(1.34) | $(0.66) | $(0.42) |
| Net asset value, end of period (x) | $22.89 | $22.75 | $24.30 | $21.53 | $23.42 | $19.98 |
| Total return (%) (r)(s)(t)(x) | 7.94(n) | (1.24) | 18.02 | (2.45) | 21.02 | 0.22 |
| Ratios (%) (to average net assets) and Supplemental data: | ||||||
| Expenses before expense reductions (f) | 1.79(a) | 1.75 | 1.75 | 1.75 | 1.75 | 1.75 |
| Expenses after expense reductions (f) | 1.77(a) | 1.74 | 1.74 | 1.74 | 1.74 | 1.74 |
| Net investment income (loss) | 1.23(a) | 1.01 | 1.27 | 1.75 | 1.76 | 1.94 |
| Portfolio turnover | 10(n) | 23 | 12 | 30 | 30 | 23 |
| Net assets at end of period (000 omitted) | $24,837 | $31,760 | $49,750 | $63,594 | $99,924 | $113,779 |
See Notes to Financial Statements
12
Financial Highlights – continued
| Class C | Six months ended | Year ended | ||||
| 4/30/23 (unaudited) | 10/31/22 | 10/31/21 | 10/31/20 | 10/31/19 | 10/31/18 | |
| Net asset value, beginning of period | $22.75 | $24.30 | $21.53 | $23.42 | $19.98 | $20.36 |
| Income (loss) from investment operations | ||||||
| Net investment income (loss) (d) | $0.14 | $0.24 | $0.30 | $0.38 | $0.38 | $0.38 |
| Net realized and unrealized gain (loss) | 1.64 | (0.49) | 3.49 | (0.93) | 3.72 | (0.34) |
| Total from investment operations | $1.78 | $(0.25) | $3.79 | $(0.55) | $4.10 | $0.04 |
| Less distributions declared to shareholders | ||||||
| From net investment income | $(0.11) | $(0.24) | $(0.10) | $(0.15) | $(0.33) | $(0.34) |
| From net realized gain | (1.54) | (1.06) | (0.92) | (1.19) | (0.33) | (0.08) |
| Total distributions declared to shareholders | $(1.65) | $(1.30) | $(1.02) | $(1.34) | $(0.66) | $(0.42) |
| Net asset value, end of period (x) | $22.88 | $22.75 | $24.30 | $21.53 | $23.42 | $19.98 |
| Total return (%) (r)(s)(t)(x) | 7.91(n) | (1.23) | 18.00 | (2.45) | 21.02 | 0.21 |
| Ratios (%) (to average net assets) and Supplemental data: | ||||||
| Expenses before expense reductions (f) | 1.79(a) | 1.75 | 1.75 | 1.75 | 1.75 | 1.75 |
| Expenses after expense reductions (f) | 1.77(a) | 1.74 | 1.74 | 1.74 | 1.74 | 1.74 |
| Net investment income (loss) | 1.23(a) | 1.00 | 1.28 | 1.76 | 1.75 | 1.91 |
| Portfolio turnover | 10(n) | 23 | 12 | 30 | 30 | 23 |
| Net assets at end of period (000 omitted) | $91,909 | $104,022 | $149,761 | $230,614 | $370,036 | $424,769 |
See Notes to Financial Statements
13
Financial Highlights – continued
| Class I | Six months ended | Year ended | ||||
| 4/30/23 (unaudited) | 10/31/22 | 10/31/21 | 10/31/20 | 10/31/19 | 10/31/18 | |
| Net asset value, beginning of period | $23.00 | $24.57 | $21.74 | $23.64 | $20.16 | $20.54 |
| Income (loss) from investment operations | ||||||
| Net investment income (loss) (d) | $0.25 | $0.47 | $0.53 | $0.60 | $0.60 | $0.60 |
| Net realized and unrealized gain (loss) | 1.66 | (0.48) | 3.54 | (0.94) | 3.76 | (0.35) |
| Total from investment operations | $1.91 | $(0.01) | $4.07 | $(0.34) | $4.36 | $0.25 |
| Less distributions declared to shareholders | ||||||
| From net investment income | $(0.23) | $(0.50) | $(0.32) | $(0.37) | $(0.55) | $(0.55) |
| From net realized gain | (1.54) | (1.06) | (0.92) | (1.19) | (0.33) | (0.08) |
| Total distributions declared to shareholders | $(1.77) | $(1.56) | $(1.24) | $(1.56) | $(0.88) | $(0.63) |
| Net asset value, end of period (x) | $23.14 | $23.00 | $24.57 | $21.74 | $23.64 | $20.16 |
| Total return (%) (r)(s)(t)(x) | 8.43(n) | (0.24) | 19.23 | (1.49) | 22.26 | 1.22 |
| Ratios (%) (to average net assets) and Supplemental data: | ||||||
| Expenses before expense reductions (f) | 0.79(a) | 0.75 | 0.75 | 0.75 | 0.75 | 0.75 |
| Expenses after expense reductions (f) | 0.77(a) | 0.74 | 0.74 | 0.74 | 0.74 | 0.74 |
| Net investment income (loss) | 2.23(a) | 1.96 | 2.24 | 2.76 | 2.77 | 2.93 |
| Portfolio turnover | 10(n) | 23 | 12 | 30 | 30 | 23 |
| Net assets at end of period (000 omitted) | $703,158 | $714,999 | $687,188 | $626,500 | $698,558 | $587,221 |
See Notes to Financial Statements
14
Financial Highlights – continued
| Class R1 | Six months ended | Year ended | ||||
| 4/30/23 (unaudited) | 10/31/22 | 10/31/21 | 10/31/20 | 10/31/19 | 10/31/18 | |
| Net asset value, beginning of period | $22.65 | $24.23 | $21.47 | $23.37 | $19.94 | $20.32 |
| Income (loss) from investment operations | ||||||
| Net investment income (loss) (d) | $0.14 | $0.23 | $0.28 | $0.37 | $0.38 | $0.39 |
| Net realized and unrealized gain (loss) | 1.64 | (0.49) | 3.51 | (0.92) | 3.71 | (0.34) |
| Total from investment operations | $1.78 | $(0.26) | $3.79 | $(0.55) | $4.09 | $0.05 |
| Less distributions declared to shareholders | ||||||
| From net investment income | $(0.12) | $(0.26) | $(0.11) | $(0.16) | $(0.33) | $(0.35) |
| From net realized gain | (1.54) | (1.06) | (0.92) | (1.19) | (0.33) | (0.08) |
| Total distributions declared to shareholders | $(1.66) | $(1.32) | $(1.03) | $(1.35) | $(0.66) | $(0.43) |
| Net asset value, end of period (x) | $22.77 | $22.65 | $24.23 | $21.47 | $23.37 | $19.94 |
| Total return (%) (r)(s)(t)(x) | 7.93(n) | (1.27) | 18.06 | (2.48) | 21.03 | 0.23 |
| Ratios (%) (to average net assets) and Supplemental data: | ||||||
| Expenses before expense reductions (f) | 1.79(a) | 1.75 | 1.75 | 1.75 | 1.75 | 1.75 |
| Expenses after expense reductions (f) | 1.78(a) | 1.74 | 1.74 | 1.74 | 1.74 | 1.74 |
| Net investment income (loss) | 1.22(a) | 0.96 | 1.23 | 1.75 | 1.77 | 1.93 |
| Portfolio turnover | 10(n) | 23 | 12 | 30 | 30 | 23 |
| Net assets at end of period (000 omitted) | $5,507 | $5,243 | $5,126 | $5,171 | $6,561 | $6,453 |
See Notes to Financial Statements
15
Financial Highlights – continued
| Class R2 | Six months ended | Year ended | ||||
| 4/30/23 (unaudited) | 10/31/22 | 10/31/21 | 10/31/20 | 10/31/19 | 10/31/18 | |
| Net asset value, beginning of period | $22.80 | $24.36 | $21.58 | $23.47 | $20.03 | $20.40 |
| Income (loss) from investment operations | ||||||
| Net investment income (loss) (d) | $0.19 | $0.35 | $0.41 | $0.48 | $0.49 | $0.50 |
| Net realized and unrealized gain (loss) | 1.65 | (0.47) | 3.50 | (0.92) | 3.72 | (0.35) |
| Total from investment operations | $1.84 | $(0.12) | $3.91 | $(0.44) | $4.21 | $0.15 |
| Less distributions declared to shareholders | ||||||
| From net investment income | $(0.17) | $(0.38) | $(0.21) | $(0.26) | $(0.44) | $(0.44) |
| From net realized gain | (1.54) | (1.06) | (0.92) | (1.19) | (0.33) | (0.08) |
| Total distributions declared to shareholders | $(1.71) | $(1.44) | $(1.13) | $(1.45) | $(0.77) | $(0.52) |
| Net asset value, end of period (x) | $22.93 | $22.80 | $24.36 | $21.58 | $23.47 | $20.03 |
| Total return (%) (r)(s)(t)(x) | 8.19(n) | (0.72) | 18.60 | (1.96) | 21.59 | 0.77 |
| Ratios (%) (to average net assets) and Supplemental data: | ||||||
| Expenses before expense reductions (f) | 1.29(a) | 1.25 | 1.25 | 1.25 | 1.25 | 1.25 |
| Expenses after expense reductions (f) | 1.28(a) | 1.24 | 1.24 | 1.24 | 1.24 | 1.24 |
| Net investment income (loss) | 1.72(a) | 1.47 | 1.74 | 2.26 | 2.26 | 2.46 |
| Portfolio turnover | 10(n) | 23 | 12 | 30 | 30 | 23 |
| Net assets at end of period (000 omitted) | $39,748 | $38,534 | $41,968 | $41,020 | $59,224 | $57,733 |
See Notes to Financial Statements
16
Financial Highlights – continued
| Class R3 | Six months ended | Year ended | ||||
| 4/30/23 (unaudited) | 10/31/22 | 10/31/21 | 10/31/20 | 10/31/19 | 10/31/18 | |
| Net asset value, beginning of period | $22.86 | $24.43 | $21.63 | $23.52 | $20.07 | $20.45 |
| Income (loss) from investment operations | ||||||
| Net investment income (loss) (d) | $0.22 | $0.41 | $0.47 | $0.54 | $0.57 | $0.55 |
| Net realized and unrealized gain (loss) | 1.65 | (0.48) | 3.51 | (0.93) | 3.71 | (0.35) |
| Total from investment operations | $1.87 | $(0.07) | $3.98 | $(0.39) | $4.28 | $0.20 |
| Less distributions declared to shareholders | ||||||
| From net investment income | $(0.20) | $(0.44) | $(0.26) | $(0.31) | $(0.50) | $(0.50) |
| From net realized gain | (1.54) | (1.06) | (0.92) | (1.19) | (0.33) | (0.08) |
| Total distributions declared to shareholders | $(1.74) | $(1.50) | $(1.18) | $(1.50) | $(0.83) | $(0.58) |
| Net asset value, end of period (x) | $22.99 | $22.86 | $24.43 | $21.63 | $23.52 | $20.07 |
| Total return (%) (r)(s)(t)(x) | 8.30(n) | (0.49) | 18.91 | (1.71) | 21.92 | 0.97 |
| Ratios (%) (to average net assets) and Supplemental data: | ||||||
| Expenses before expense reductions (f) | 1.04(a) | 1.00 | 1.00 | 1.00 | 1.00 | 1.00 |
| Expenses after expense reductions (f) | 1.03(a) | 0.99 | 0.99 | 0.99 | 0.99 | 0.99 |
| Net investment income (loss) | 1.97(a) | 1.71 | 1.99 | 2.51 | 2.63 | 2.71 |
| Portfolio turnover | 10(n) | 23 | 12 | 30 | 30 | 23 |
| Net assets at end of period (000 omitted) | $218,650 | $217,043 | $201,006 | $201,509 | $279,639 | $72,490 |
See Notes to Financial Statements
17
Financial Highlights – continued
| Class R4 | Six months ended | Year ended | ||||
| 4/30/23 (unaudited) | 10/31/22 | 10/31/21 | 10/31/20 | 10/31/19 | 10/31/18 | |
| Net asset value, beginning of period | $22.91 | $24.48 | $21.67 | $23.56 | $20.10 | $20.48 |
| Income (loss) from investment operations | ||||||
| Net investment income (loss) (d) | $0.25 | $0.48 | $0.53 | $0.60 | $0.60 | $0.61 |
| Net realized and unrealized gain (loss) | 1.66 | (0.49) | 3.52 | (0.93) | 3.74 | (0.36) |
| Total from investment operations | $1.91 | $(0.01) | $4.05 | $(0.33) | $4.34 | $0.25 |
| Less distributions declared to shareholders | ||||||
| From net investment income | $(0.23) | $(0.50) | $(0.32) | $(0.37) | $(0.55) | $(0.55) |
| From net realized gain | (1.54) | (1.06) | (0.92) | (1.19) | (0.33) | (0.08) |
| Total distributions declared to shareholders | $(1.77) | $(1.56) | $(1.24) | $(1.56) | $(0.88) | $(0.63) |
| Net asset value, end of period (x) | $23.05 | $22.91 | $24.48 | $21.67 | $23.56 | $20.10 |
| Total return (%) (r)(s)(t)(x) | 8.46(n) | (0.24) | 19.19 | (1.46) | 22.22 | 1.22 |
| Ratios (%) (to average net assets) and Supplemental data: | ||||||
| Expenses before expense reductions (f) | 0.79(a) | 0.75 | 0.75 | 0.75 | 0.75 | 0.75 |
| Expenses after expense reductions (f) | 0.78(a) | 0.74 | 0.74 | 0.74 | 0.74 | 0.74 |
| Net investment income (loss) | 2.23(a) | 1.98 | 2.25 | 2.76 | 2.76 | 3.01 |
| Portfolio turnover | 10(n) | 23 | 12 | 30 | 30 | 23 |
| Net assets at end of period (000 omitted) | $23,383 | $23,369 | $25,766 | $24,920 | $49,530 | $48,109 |
See Notes to Financial Statements
18
Financial Highlights – continued
| Class R6 | Six months ended | Year ended | ||||
| 4/30/23 (unaudited) | 10/31/22 | 10/31/21 | 10/31/20 | 10/31/19 | 10/31/18 | |
| Net asset value, beginning of period | $23.01 | $24.58 | $21.75 | $23.64 | $20.17 | $20.54 |
| Income (loss) from investment operations | ||||||
| Net investment income (loss) (d) | $0.26 | $0.49 | $0.54 | $0.61 | $0.61 | $0.61 |
| Net realized and unrealized gain (loss) | 1.66 | (0.48) | 3.54 | (0.92) | 3.76 | (0.34) |
| Total from investment operations | $1.92 | $0.01 | $4.08 | $(0.31) | $4.37 | $0.27 |
| Less distributions declared to shareholders | ||||||
| From net investment income | $(0.24) | $(0.52) | $(0.33) | $(0.39) | $(0.57) | $(0.56) |
| From net realized gain | (1.54) | (1.06) | (0.92) | (1.19) | (0.33) | (0.08) |
| Total distributions declared to shareholders | $(1.78) | $(1.58) | $(1.25) | $(1.58) | $(0.90) | $(0.64) |
| Net asset value, end of period (x) | $23.15 | $23.01 | $24.58 | $21.75 | $23.64 | $20.17 |
| Total return (%) (r)(s)(t)(x) | 8.48(n) | (0.15) | 19.31 | (1.36) | 22.29 | 1.36 |
| Ratios (%) (to average net assets) and Supplemental data: | ||||||
| Expenses before expense reductions (f) | 0.70(a) | 0.66 | 0.66 | 0.66 | 0.66 | 0.66 |
| Expenses after expense reductions (f) | 0.68(a) | 0.65 | 0.65 | 0.65 | 0.65 | 0.65 |
| Net investment income (loss) | 2.31(a) | 2.04 | 2.29 | 2.84 | 2.84 | 3.02 |
| Portfolio turnover | 10(n) | 23 | 12 | 30 | 30 | 23 |
| Net assets at end of period (000 omitted) | $101,498 | $91,255 | $79,499 | $75,542 | $92,437 | $119,752 |
| (a) | Annualized. |
| (d) | Per share data is based on average shares outstanding. |
| (f) | Ratios do not reflect reductions from fees paid indirectly, if applicable. See Note 2 in the Notes to Financial Statements for additional information. |
| (n) | Not annualized. |
| (r) | Certain expenses have been reduced without which performance would have been lower. |
| (s) | From time to time the fund may receive proceeds from litigation settlements, without which performance would be lower. |
| (t) | Total returns do not include any applicable sales charges. |
| (x) | The net asset values and total returns have been calculated on net assets which include adjustments made in accordance with U.S. generally accepted accounting principles required at period end for financial reporting purposes. |
See Notes to Financial Statements
19
Notes to Financial Statements
(unaudited)
(1) Business and
Organization
MFS Utilities Fund (the fund) is a
diversified series of MFS Series Trust VI (the trust). The trust is organized as a Massachusetts business trust and is registered under the Investment Company Act of 1940, as amended, as an open-end management
investment company.
The fund is an investment company
and accordingly follows the investment company accounting and reporting guidance of the Financial Accounting Standards Board (FASB) Accounting Standards Codification Topic 946 Financial Services - Investment
Companies.
(2) Significant Accounting
Policies
General — The preparation of financial statements in conformity with U.S. generally accepted accounting principles requires management to make estimates and assumptions that affect the
reported amounts of assets and liabilities, and disclosure of contingent assets and liabilities at the date of the financial statements and the reported amounts of increases and decreases in net assets from operations
during the reporting period. Actual results could differ from those estimates. In the preparation of these financial statements, management has evaluated subsequent events occurring after the date of the fund’s
Statement of Assets and Liabilities through the date that the financial statements were issued. The fund invests primarily in securities of issuers in the utility industry. Issuers in a single industry can react similarly to market, currency, political, economic, regulatory,
geopolitical, environmental, public health, and other conditions. The value of stocks in the utilities sector can be very volatile due to supply and/or demand for services or fuel, financing costs, conservation
efforts, the negative impact of regulation, and other factors. The fund invests in foreign securities. Investments in foreign securities are vulnerable to the effects of changes in the relative values of the local currency and the U.S. dollar and to
the effects of changes in each country’s market, economic, industrial, political, regulatory, geopolitical, environmental, public health, and other conditions.
Balance Sheet Offsetting — The fund's accounting policy with respect to balance sheet offsetting is that, absent an event of default by the counterparty or a termination of the agreement, the International
Swaps and Derivatives Association (ISDA) Master Agreement, or similar agreement, does not result in an offset of reported amounts of financial assets and financial liabilities in the Statement of Assets and
Liabilities across transactions between the fund and the applicable counterparty. The fund's right to setoff may be restricted or prohibited by the bankruptcy or insolvency laws of the particular jurisdiction to which
a specific master netting agreement counterparty is subject. Balance sheet offsetting disclosures, to the extent applicable to the fund, have been included in the fund’s Significant Accounting Policies note
under the captions for each of the fund’s in-scope financial instruments and transactions.
Investment Valuations — Subject to its oversight, the fund's Board of Trustees has delegated primary responsibility for determining or causing to be determined the value of the fund’s investments to MFS as
the fund's adviser, pursuant to the fund’s valuation policy and procedures which have been adopted by the adviser and approved by the Board. In accordance with Rule 2a-5 under the Investment Company Act of
1940, the Board of Trustees designated the adviser as the “valuation designee” of the fund. If the
20
Notes to Financial
Statements (unaudited) - continued
adviser, as valuation designee, determines that
reliable market quotations are not readily available for an investment, the investment is valued at fair value as determined in good faith by the adviser in accordance with the adviser’s fair valuation policy
and procedures.
Under the fund's valuation policy
and procedures, equity securities, including restricted equity securities, are generally valued at the last sale or official closing price on their primary market or exchange as provided by a third-party pricing
service. Equity securities, for which there were no sales reported that day, are generally valued at the last quoted daily bid quotation on their primary market or exchange as provided by a third-party pricing
service. Short-term instruments with a maturity at issuance of 60 days or less may be valued at amortized cost, which approximates market value.
Forward foreign currency exchange contracts are
generally valued at the mean of bid and asked prices for the time period interpolated from rates provided by a third-party pricing service for proximate time periods. Open-end investment companies are generally valued
at net asset value per share. The values of foreign securities and other assets and liabilities expressed in foreign currencies are converted to U.S. dollars using the mean of bid and asked prices for rates provided
by a third-party pricing service.
Under the fund’s valuation
policy and procedures, market quotations are not considered to be readily available for debt instruments, floating rate loans, and many types of derivatives. These investments are generally valued at fair value based
on information from third-party pricing services or otherwise determined by the adviser in accordance with the adviser’s fair valuation policy and procedures. Securities and other assets generally valued on the
basis of information from a third-party pricing service may also be valued at a broker/dealer bid quotation. In determining values, third-party pricing services can utilize both transaction data and market information
such as yield, quality, coupon rate, maturity, type of issue, trading characteristics, spreads and other market data. An investment may also be valued at fair value if the adviser determines that the
investment’s value has been materially affected by events occurring after the close of the exchange or market on which the investment is principally traded (such as foreign exchange or market) and prior to the
determination of the fund’s net asset value, or after the halt of trading of a specific security where trading does not resume prior to the close of the exchange or market on which the security is principally
traded. Events that occur after foreign markets close (such as developments in foreign markets and significant movements in the U.S. markets) and prior to the determination of the fund’s net asset value may be
deemed to have a material effect on the value of securities traded in foreign markets. Accordingly, the fund’s foreign equity securities may often be valued at fair value. The adviser generally relies on
third-party pricing services or other information (such as the correlation with price movements of similar securities in the same or other markets; the type, cost and investment characteristics of the security; the
business and financial condition of the issuer; and trading and other market data) to assist in determining whether to fair value and at what value to fair value an investment. The value of an investment for purposes
of calculating the fund’s net asset value can differ depending on the source and method used to determine value. When fair valuation is used, the value of an investment used to determine the fund’s net
asset value may differ from quoted or published prices for the same investment. There can be no assurance that the fund could obtain the fair value assigned to an investment if it were to sell the investment at the
same time at which the fund determines its net asset value per share.
21
Notes to Financial
Statements (unaudited) - continued
Various inputs are used in
determining the value of the fund's assets or liabilities. These inputs are categorized into three broad levels. In certain cases, the inputs used to measure fair value may fall into different levels of the fair value
hierarchy. In such cases, an investment's level within the fair value hierarchy is based on the lowest level of input that is significant to the fair value measurement. The fund's assessment of the significance of a
particular input to the fair value measurement in its entirety requires judgment, and considers factors specific to the investment. Level 1 includes unadjusted quoted prices in active markets for identical assets or
liabilities. Level 2 includes other significant observable market-based inputs (including quoted prices for similar securities, interest rates, prepayment speed, and credit risk). Level 3 includes significant
unobservable inputs, which may include the adviser's own assumptions in determining the fair value of investments. Other financial instruments are derivative instruments, such as forward foreign currency exchange
contracts. The following is a summary of the levels used as of April 30, 2023 in valuing the fund's assets and liabilities:
| Financial Instruments | Level 1 | Level 2 | Level 3 | Total |
| Equity Securities: | ||||
| United States | $2,218,684,618 | $— | $— | $2,218,684,618 |
| Germany | 186,808,562 | — | — | 186,808,562 |
| Spain | — | 161,856,640 | — | 161,856,640 |
| Portugal | — | 152,334,761 | — | 152,334,761 |
| United Kingdom | — | 140,680,716 | — | 140,680,716 |
| Italy | 80,861,254 | — | — | 80,861,254 |
| France | — | 40,117,625 | — | 40,117,625 |
| Brazil | 35,123,014 | — | — | 35,123,014 |
| Canada | 31,640,631 | — | — | 31,640,631 |
| Other Countries | 16,478,196 | 62,107,794 | — | 78,585,990 |
| Mutual Funds | 19,373,670 | — | — | 19,373,670 |
| Total | $2,588,969,945 | $557,097,536 | $— | $3,146,067,481 |
| Other Financial Instruments | ||||
| Forward Foreign Currency Exchange Contracts – Assets | $— | $199,289 | $— | $199,289 |
| Forward Foreign Currency Exchange Contracts – Liabilities | — | (2,655,680) | — | (2,655,680) |
For further information regarding
security characteristics, see the Portfolio of Investments.
Foreign Currency Translation — Purchases and sales of foreign investments, income, and expenses are converted into U.S. dollars based upon currency exchange rates prevailing on the respective dates of such
transactions or on the reporting date for foreign denominated receivables and payables. Gains and losses attributable to foreign currency exchange rates on sales of securities are recorded for financial statement
purposes as net realized gains and losses on investments. Gains and losses attributable to foreign exchange rate movements on receivables, payables, income and expenses are recorded for financial statement purposes as
foreign currency transaction gains and losses. That portion of both realized and unrealized gains and losses on investments that results from fluctuations in foreign currency exchange rates is not separately
disclosed.
22
Notes to Financial
Statements (unaudited) - continued
Derivatives — The fund uses derivatives primarily to increase or decrease exposure to a particular market or segment of the market, or security, to increase or decrease interest rate or currency
exposure, or as alternatives to direct investments. Derivatives are used for hedging or non-hedging purposes. While hedging can reduce or eliminate losses, it can also reduce or eliminate gains. When the fund uses
derivatives as an investment to increase market exposure, or for hedging purposes, gains and losses from derivative instruments may be substantially greater than the derivative’s original cost.
The derivative instruments used by
the fund during the period were forward foreign currency exchange contracts. Depending on the type of derivative, a fund may exit a derivative position by entering into an offsetting transaction with a
counterparty or exchange, negotiating an agreement with the derivative counterparty, or novating the position to a third party. The fund's period end derivatives, as presented in the Portfolio of Investments and the
associated Derivative Contract tables, generally are indicative of the volume of its derivative activity during the period.
The following table presents, by
major type of derivative contract, the fair value, on a gross basis, of the asset and liability components of derivatives held by the fund at April 30, 2023 as reported in the Statement of Assets and Liabilities:
| Fair Value | |||
| Risk | Derivative Contracts | Asset Derivatives | Liability Derivatives |
| Foreign Exchange | Forward Foreign Currency Exchange Contracts | $199,289 | $(2,655,680) |
The following table presents, by
major type of derivative contract, the realized gain (loss) on derivatives held by the fund for the six months ended April 30, 2023 as reported in the Statement of Operations:
| Risk | Forward Foreign Currency Exchange Contracts |
| Foreign Exchange | $(42,369,964) |
The following table presents, by
major type of derivative contract, the change in unrealized appreciation or depreciation on derivatives held by the fund for the six months ended April 30, 2023 as reported in the Statement of Operations:
| Risk | Forward Foreign Currency Exchange Contracts |
| Foreign Exchange | $(75,511) |
Derivative counterparty credit risk
is managed through formal evaluation of the creditworthiness of all potential counterparties. On certain, but not all, uncleared derivatives, the fund attempts to reduce its exposure to counterparty credit risk
whenever possible by entering into an ISDA Master Agreement on a bilateral basis. The ISDA Master Agreement gives each party to the agreement the right to terminate all transactions traded under such agreement if
there is a specified deterioration in the credit quality of the other party. Upon an event of default or a termination of the ISDA Master Agreement, the non-defaulting party has the right to close out all
transactions
23
Notes to Financial
Statements (unaudited) - continued
traded under such agreement and to net amounts owed
under each agreement to one net amount payable by one party to the other. This right to close out and net payments across all transactions traded under the ISDA Master Agreement could result in a reduction of the
fund's credit risk to such counterparty equal to any amounts payable by the fund under the applicable transactions, if any.
Collateral and margin requirements
differ by type of derivative. For cleared derivatives (e.g., futures contracts, cleared swaps, and exchange-traded options), margin requirements are set by the clearing broker and the clearing house and collateral, in
the form of cash or securities, is posted by the fund directly with the clearing broker. Collateral terms are counterparty agreement specific for uncleared derivatives (e.g., forward foreign currency exchange
contracts, uncleared swap agreements, and uncleared options) and collateral, in the form of cash and securities, is held in segregated accounts with the fund's custodian in connection with these agreements. For
derivatives traded under an ISDA Master Agreement, which contains a credit support annex, the collateral requirements are netted across all transactions traded under such counterparty-specific agreement and an amount
is posted from one party to the other to collateralize such obligations. Cash that has been segregated or delivered to cover the fund's collateral or margin obligations under derivative contracts, if any, will be
reported separately in the Statement of Assets and Liabilities as restricted cash for uncleared derivatives and/or deposits with brokers for cleared derivatives. Securities pledged as collateral or margin for the same
purpose, if any, are noted in the Portfolio of Investments. The fund may be required to make payments of interest on uncovered collateral or margin obligations with the broker. Any such payments are included in
“Miscellaneous” expense in the Statement of Operations.
Forward Foreign Currency Exchange
Contracts — The fund entered into forward foreign currency exchange contracts for the purchase or sale of a specific foreign currency at a fixed price on a future date. These contracts may be
used to hedge the fund’s currency risk or for non-hedging purposes. For hedging purposes, the fund may enter into contracts to deliver or receive foreign currency that the fund will receive from or use in its
normal investment activities. The fund may also use contracts to hedge against declines in the value of foreign currency denominated securities due to unfavorable exchange rate movements. For non-hedging purposes, the
fund may enter into contracts with the intent of changing the relative exposure of the fund’s portfolio of securities to different currencies to take advantage of anticipated exchange rate changes.
Forward foreign currency exchange
contracts are adjusted by the daily exchange rate of the underlying currency and any unrealized gains or losses are recorded as a receivable or payable for forward foreign currency exchange contracts until the
contract settlement date. On contract settlement date, any gain or loss on the contract is recorded as realized gains or losses on forward foreign currency exchange contracts.
Risks may arise upon entering into
these contracts from unanticipated movements in the value of the contract and from the potential inability of counterparties to meet the terms of their contracts. Generally, the fund’s maximum risk due to
counterparty credit risk is the unrealized gain on the contract due to the use of Continuous Linked Settlement, a multicurrency cash settlement system for the centralized settlement of foreign transactions. This risk
is mitigated in cases where there is an ISDA Master
24
Notes to Financial
Statements (unaudited) - continued
Agreement between the fund and the counterparty
providing for netting as described above and, where applicable, by the posting of collateral by the counterparty to the fund to cover the fund’s exposure to the counterparty under such ISDA Master Agreement.
Security Loans — Under its Securities Lending Agency Agreement with the fund, JPMorgan Chase and Co., as lending agent, loans the securities of the fund to certain qualified institutions (the
“Borrowers”) approved by the fund. Security loans can be terminated at the discretion of either the lending agent or the fund and the related securities must be returned within the earlier of the standard
trade settlement period for such securities or within three business days. The loans are collateralized by cash and/or U.S. Treasury and federal agency obligations in an amount typically at least equal to the market
value of the securities loaned. On loans collateralized by cash, the cash collateral is invested in a money market fund. The market value of the loaned securities is determined at the close of business of the fund and
any additional required collateral is delivered to the fund on the next business day. The lending agent provides the fund with indemnification against Borrower default. In the event of Borrower default, the lending
agent will, for the benefit of the fund, either purchase securities identical to those loaned or, when such purchase is commercially impracticable, pay the fund the market value of the loaned securities. In return,
the lending agent assumes the fund's rights to the related collateral. If the collateral value is less than the cost to purchase identical securities, the lending agent is responsible for the shortfall, but only to
the extent that such shortfall is not due to a decline in collateral value resulting from collateral reinvestment for which the fund bears the risk of loss. A portion of the income generated upon investment of the
collateral is remitted to the Borrowers, and the remainder is allocated between the fund and the lending agent. On loans collateralized by U.S. Treasury and/or federal agency obligations, a fee is received from the
Borrower, and is allocated between the fund and the lending agent. Income from securities lending is separately reported in the Statement of Operations. The dividend and interest income earned on the securities loaned
is accounted for in the same manner as other dividend and interest income. At April 30, 2023, there were no securities on loan or collateral outstanding.
Indemnifications — Under the fund's organizational documents, its officers and Trustees may be indemnified against certain liabilities and expenses arising out of the performance of their duties to
the fund. Additionally, in the normal course of business, the fund enters into agreements with service providers that may contain indemnification clauses. The fund's maximum exposure under these agreements is unknown
as this would involve future claims that may be made against the fund that have not yet occurred.
Investment Transactions and
Income — Investment transactions are recorded on the trade date. Dividends received in cash are recorded on the ex-dividend date. Certain dividends from foreign securities will be recorded when the fund is informed of the dividend if such information is
obtained subsequent to the ex-dividend date. Dividend payments received in additional securities are recorded on the ex-dividend date in an amount equal to the value of the security on such date. In determining the net gain or loss on securities sold, the cost of securities is determined on the identified cost basis.
25
Notes to Financial
Statements (unaudited) - continued
The fund may receive proceeds from
litigation settlements. Any proceeds received from litigation involving portfolio holdings are reflected in the Statement of Operations in realized gain/loss if the security has been disposed of by the fund or in
unrealized gain/loss if the security is still held by the fund. Any other proceeds from litigation not related to portfolio holdings are reflected as other income in the Statement of Operations.
Fees Paid Indirectly — The fund's custody fee may be reduced by a credit earned under an arrangement that measures the value of U.S. dollars deposited with the custodian by the fund. The amount of the
credit, for the six months ended April 30, 2023, is shown as a reduction of total expenses in the Statement of Operations.
Tax Matters and Distributions — The fund intends to qualify as a regulated investment company, as defined under Subchapter M of the Internal Revenue Code, and to distribute all of its taxable income, including
realized capital gains. As a result, no provision for federal income tax is required. The fund’s federal tax returns, when filed, will remain subject to examination by the Internal Revenue Service for a three
year period. Management has analyzed the fund’s tax positions taken on federal and state tax returns for all open tax years and does not believe that there are any uncertain tax positions that require
recognition of a tax liability. Foreign taxes, if any, have been accrued by the fund in the accompanying financial statements in accordance with the applicable foreign tax law. Foreign income taxes may be withheld by
certain countries in which the fund invests. Additionally, capital gains realized by the fund on securities issued in or by certain foreign countries may be subject to capital gains tax imposed by those
countries.
Distributions to shareholders are
recorded on the ex-dividend date. Income and capital gain distributions are determined in accordance with income tax regulations, which may differ from U.S. generally accepted accounting principles. Certain capital
accounts in the financial statements are periodically adjusted for permanent differences in order to reflect their tax character. These adjustments have no impact on net assets or net asset value per share. Temporary
differences which arise from recognizing certain items of income, expense, gain or loss in different periods for financial statement and tax purposes will reverse at some time in the future.
Book/tax differences primarily
relate to wash sale loss deferrals, derivative transactions, and treating a portion of the proceeds from redemptions as a distribution for tax purposes.
The tax character of distributions
made during the current period will be determined at fiscal year end. The tax character of distributions declared to shareholders for the last year is as follows:
| Year ended 10/31/22 | |
| Ordinary income (including any short-term capital gains) | $82,777,891 |
| Long-term capital gains | 113,499,167 |
| Total distributions | $196,277,058 |
26
Notes to Financial
Statements (unaudited) - continued
The federal tax cost and the tax
basis components of distributable earnings were as follows:
| As of 4/30/23 | |
| Cost of investments | $2,281,939,836 |
| Gross appreciation | 907,291,751 |
| Gross depreciation | (43,164,106) |
| Net unrealized appreciation (depreciation) | $864,127,645 |
| As of 10/31/22 | |
| Undistributed ordinary income | 34,499,036 |
| Undistributed long-term capital gain | 171,382,478 |
| Other temporary differences | (210,688) |
| Net unrealized appreciation (depreciation) | 651,742,716 |
The aggregate cost above includes
prior fiscal year end tax adjustments, if applicable.
Multiple Classes of Shares of
Beneficial Interest — The fund offers multiple classes of shares, which differ in their respective distribution and service fees. The fund's income, realized and unrealized gain (loss), and common
expenses are allocated to shareholders based on the daily net assets of each class. Dividends are declared separately for each class. Differences in per share dividend rates are generally due to differences in
separate class expenses. Class B and Class C shares will convert to Class A shares approximately eight years after purchase. The fund’s distributions declared to shareholders as reported in the Statements of
Changes in Net Assets are presented by class as follows:
| Six months ended 4/30/23 | Year ended 10/31/22 | ||
| Class A | $140,905,352 | $118,840,841 | |
| Class B | 2,176,839 | 2,497,443 | |
| Class C | 7,225,233 | 7,663,422 | |
| Class I | 54,253,413 | 45,070,737 | |
| Class R1 | 387,176 | 280,651 | |
| Class R2 | 2,883,148 | 2,436,847 | |
| Class R3 | 16,157,084 | 12,473,140 | |
| Class R4 | 1,789,700 | 1,636,567 | |
| Class R6 | 7,354,586 | 5,377,410 | |
| Total | $233,132,531 | $196,277,058 |
(3) Transactions with
Affiliates
Investment Adviser — The fund has an investment advisory agreement with MFS to provide overall investment management and related administrative services and facilities to the fund. The management fee is computed daily and paid monthly at the following annual rates based on the fund's average daily net assets:
| Up to $3 billion | 0.60% |
| In excess of $3 billion and up to $10 billion | 0.55% |
| In excess of $10 billion | 0.50% |
27
Notes to Financial
Statements (unaudited) - continued
MFS has agreed in writing to reduce
its management fee by a specified amount if certain MFS mutual fund assets exceed thresholds agreed to by MFS and the fund's Board of Trustees. MFS has also agreed in writing to waive at least 0.01% of its management
fee as part of this agreement. The agreement to waive at least 0.01% of the management fee will continue until modified by the fund's Board of Trustees, but such agreement will continue at least until February 29,
2024. For the six months ended April 30, 2023, this management fee reduction amounted to $203,935, which is included in the reduction of total expenses in the Statement of Operations. The management fee incurred for
the six months ended April 30, 2023 was equivalent to an annual effective rate of 0.58% of the fund's average daily net assets.
Distributor — MFS Fund Distributors, Inc. (MFD), a wholly-owned subsidiary of MFS, as distributor, received $69,839 for the six months ended April 30, 2023, as its portion of the initial sales
charge on sales of Class A shares of the fund.
The Board of Trustees has adopted a
distribution plan for certain share classes pursuant to Rule 12b-1 of the Investment Company Act of 1940.
The fund's distribution plan
provides that the fund will pay MFD for services provided by MFD and financial intermediaries in connection with the distribution and servicing of certain share classes. One component of the plan is a distribution fee
paid to MFD and another component of the plan is a service fee paid to MFD. MFD may subsequently pay all, or a portion, of the distribution and/or service fees to financial intermediaries.
Distribution Plan Fee Table:
| Distribution Fee Rate (d) | Service Fee Rate (d) | Total Distribution Plan (d) | Annual Effective Rate (e) | Distribution and Service Fee | |
| Class A | — | 0.25% | 0.25% | 0.25% | $ 2,376,363 |
| Class B | 0.75% | 0.25% | 1.00% | 1.00% | 142,793 |
| Class C | 0.75% | 0.25% | 1.00% | 1.00% | 492,970 |
| Class R1 | 0.75% | 0.25% | 1.00% | 1.00% | 27,045 |
| Class R2 | 0.25% | 0.25% | 0.50% | 0.50% | 99,331 |
| Class R3 | — | 0.25% | 0.25% | 0.25% | 272,131 |
| Total Distribution and Service Fees | $3,410,633 |
| (d) | In accordance with the distribution plan for certain classes, the fund pays distribution and/or service fees equal to these annual percentage rates of each class’s average daily net assets. The distribution and service fee rates disclosed by class represent the current rates in effect at the end of the reporting period. Any rate changes, if applicable, are detailed below. |
| (e) | The annual effective rates represent actual fees incurred under the distribution plan for the six months ended April 30, 2023 based on each class's average daily net assets. MFD has voluntarily agreed to rebate a portion of each class's 0.25% service fee attributable to accounts for which there is no financial intermediary specified on the account except for accounts attributable to MFS or its affiliates' seed money. For the six months ended April 30, 2023, this rebate amounted to $289, $8, $4, and $27 for Class A, Class C, Class R2, and Class R3 shares, respectively, and is included in the reduction of total expenses in the Statement of Operations. |
Certain Class A shares are
subject to a contingent deferred sales charge (CDSC) in the event of a shareholder redemption within 18 months of purchase. Class B shares are subject to a CDSC in the event of a shareholder redemption within six
years of
28
Notes to Financial
Statements (unaudited) - continued
purchase. Class C shares are subject to a CDSC in
the event of a shareholder redemption within 12 months of purchase. All contingent deferred sales charges are paid to MFD and during the six months ended April 30, 2023, were as follows:
| Amount | |
| Class A | $11,008 |
| Class B | 3,620 |
| Class C | 1,947 |
Shareholder Servicing Agent — MFS Service Center, Inc. (MFSC), a wholly-owned subsidiary of MFS, receives a fee from the fund for its services as shareholder servicing agent calculated as a percentage of the
average daily net assets of the fund as determined periodically under the supervision of the fund's Board of Trustees. For the six months ended April 30, 2023, the fee was $237,966, which equated to 0.0152% annually
of the fund's average daily net assets. MFSC also receives reimbursement from the fund for out-of-pocket expenses, sub-accounting and other shareholder servicing costs which may be paid to affiliated and unaffiliated
service providers. Class R6 shares do not incur sub-accounting fees. For the six months ended April 30, 2023, these out-of-pocket expenses, sub-accounting and other shareholder servicing costs amounted to
$1,499,700.
Administrator — MFS provides certain financial, legal, shareholder communications, compliance, and other administrative services to the fund. Under an administrative services agreement, the fund
reimburses MFS the costs incurred to provide these services. The fund is charged an annual fixed amount of $17,500 plus a fee based on average daily net assets. The administrative services fee incurred for the six
months ended April 30, 2023 was equivalent to an annual effective rate of 0.0151% of the fund's average daily net assets.
Trustees’ and Officers’
Compensation — The fund pays compensation to independent Trustees in the form of a retainer, attendance fees, and additional compensation to Board and Committee chairpersons. The fund does not
pay compensation directly to Trustees or officers of the fund who are also officers of the investment adviser, all of whom receive remuneration from MFS for their services to the fund. Certain officers and Trustees of
the fund are officers or directors of MFS, MFD, and MFSC.
Other — The fund invests in the MFS Institutional Money Market Portfolio which is managed by MFS and seeks current income consistent with preservation of capital and liquidity. This money
market fund does not pay a management fee to MFS but does incur investment and operating costs.
The adviser has voluntarily
undertaken to reimburse the fund from its own resources on a quarterly basis for the cost of investment research embedded in the cost of the fund’s securities trades. This agreement may be rescinded at any time.
For the six months ended April 30, 2023, this reimbursement amounted to $126,827, which is included in “Other” income in the Statement of Operations.
(4) Portfolio Securities
For the six months ended April 30,
2023, purchases and sales of investments, other than short-term obligations, aggregated $304,974,879 and $503,807,198, respectively.
29
Notes to Financial
Statements (unaudited) - continued
(5) Shares of Beneficial
Interest
The fund's Declaration of Trust
permits the Trustees to issue an unlimited number of full and fractional shares of beneficial interest. Transactions in fund shares were as follows:
| Six months ended 4/30/23 | Year ended 10/31/22 | ||||
| Shares | Amount | Shares | Amount | ||
| Shares sold | |||||
| Class A | 2,990,495 | $68,096,064 | 7,478,168 | $179,884,785 | |
| Class B | 6,812 | 157,067 | 43,661 | 1,048,357 | |
| Class C | 214,747 | 4,869,562 | 597,097 | 14,271,307 | |
| Class I | 2,469,664 | 56,504,635 | 7,048,453 | 170,317,492 | |
| Class R1 | 18,400 | 413,753 | 82,864 | 1,964,491 | |
| Class R2 | 170,254 | 3,856,325 | 627,288 | 14,931,561 | |
| Class R3 | 673,733 | 15,248,797 | 2,424,571 | 58,848,253 | |
| Class R4 | 125,884 | 2,878,722 | 352,125 | 8,538,962 | |
| Class R6 | 912,252 | 20,788,893 | 1,488,939 | 36,258,768 | |
| 7,582,241 | $172,813,818 | 20,143,166 | $486,063,976 | ||
| Shares issued to shareholders in reinvestment of distributions | |||||
| Class A | 5,851,285 | $133,017,570 | 4,678,261 | $111,893,470 | |
| Class B | 92,039 | 2,087,598 | 97,379 | 2,320,230 | |
| Class C | 310,609 | 7,039,923 | 315,384 | 7,513,890 | |
| Class I | 2,155,364 | 49,244,551 | 1,678,213 | 40,313,039 | |
| Class R1 | 17,166 | 387,176 | 11,825 | 280,651 | |
| Class R2 | 126,956 | 2,877,179 | 101,968 | 2,431,781 | |
| Class R3 | 711,317 | 16,157,084 | 522,110 | 12,473,140 | |
| Class R4 | 73,242 | 1,665,987 | 61,134 | 1,463,038 | |
| Class R6 | 266,201 | 6,079,313 | 182,369 | 4,381,030 | |
| 9,604,179 | $218,556,381 | 7,648,643 | $183,070,269 | ||
| Shares reacquired | |||||
| Class A | (5,838,054) | $(132,761,013) | (10,611,604) | $(254,322,484) | |
| Class B | (409,526) | (9,251,613) | (792,305) | (18,917,727) | |
| Class C | (1,080,971) | (24,477,235) | (2,502,609) | (59,515,715) | |
| Class I | (5,333,066) | (121,162,336) | (5,606,583) | (134,488,508) | |
| Class R1 | (25,158) | (563,924) | (74,865) | (1,771,476) | |
| Class R2 | (253,784) | (5,733,111) | (761,616) | (18,145,589) | |
| Class R3 | (1,370,968) | (31,069,201) | (1,679,813) | (40,151,114) | |
| Class R4 | (204,634) | (4,637,765) | (445,731) | (10,785,473) | |
| Class R6 | (761,081) | (17,499,092) | (939,282) | (22,758,715) | |
| (15,277,242) | $(347,155,290) | (23,414,408) | $(560,856,801) | ||
30
Notes to Financial
Statements (unaudited) - continued
| Six months ended 4/30/23 | Year ended 10/31/22 | ||||
| Shares | Amount | Shares | Amount | ||
| Net change | |||||
| Class A | 3,003,726 | $68,352,621 | 1,544,825 | $37,455,771 | |
| Class B | (310,675) | (7,006,948) | (651,265) | (15,549,140) | |
| Class C | (555,615) | (12,567,750) | (1,590,128) | (37,730,518) | |
| Class I | (708,038) | (15,413,150) | 3,120,083 | 76,142,023 | |
| Class R1 | 10,408 | 237,005 | 19,824 | 473,666 | |
| Class R2 | 43,426 | 1,000,393 | (32,360) | (782,247) | |
| Class R3 | 14,082 | 336,680 | 1,266,868 | 31,170,279 | |
| Class R4 | (5,508) | (93,056) | (32,472) | (783,473) | |
| Class R6 | 417,372 | 9,369,114 | 732,026 | 17,881,083 | |
| 1,909,178 | $44,214,909 | 4,377,401 | $108,277,444 | ||
Effective June 1, 2019, purchases of
the fund’s Class B shares were closed to new and existing investors subject to certain exceptions. On March 30, 2023, the fund announced that effective after the close of business on September 29,
2023, purchases of Class R1 and Class R2 shares will be closed to new investors.
(6) Line of Credit
The fund and certain other funds
managed by MFS participate in a $1.45 billion unsecured committed line of credit of which $1.2 billion is reserved for use by the fund and certain other MFS U.S. funds. The line of credit is provided by a syndicate of
banks under a credit agreement. Borrowings may be made for temporary financing needs. Interest is charged to each fund, based on its borrowings, generally at a rate equal to the highest of 1) Daily Simple SOFR
(Secured Overnight Financing Rate) plus 0.10%, 2) the Federal Funds Effective Rate, or 3) the Overnight Bank Funding Rate, each plus an agreed upon spread. A commitment fee, based on the average daily unused portion
of the committed line of credit, is allocated among the participating funds. The line of credit expires on March 14, 2024 unless extended or renewed. In addition, the fund and other funds managed by MFS have
established unsecured uncommitted borrowing arrangements with certain banks for temporary financing needs. Interest is charged to each fund, based on its borrowings, at rates equal to customary reference rates plus an
agreed upon spread. For the six months ended April 30, 2023, the fund’s commitment fee and interest expense were $8,515 and $0, respectively, and are included in “Miscellaneous” expense in the
Statement of Operations.
31
Notes to Financial
Statements (unaudited) - continued
(7) Investments in Affiliated
Issuers
An affiliated issuer may be
considered one in which the fund owns 5% or more of the outstanding voting securities, or a company which is under common control. For the purposes of this report, the following were affiliated issuers:
| Affiliated Issuers | Beginning Value | Purchases | Sales Proceeds | Realized Gain (Loss) | Change in Unrealized Appreciation or Depreciation | Ending Value |
| MFS Institutional Money Market Portfolio | $25,673,112 | $209,155,470 | $215,466,018 | $10,235 | $871 | $19,373,670 |
| Affiliated Issuers | Dividend Income | Capital Gain Distributions |
| MFS Institutional Money Market Portfolio | $476,081 | $— |
32
Statement Regarding Liquidity Risk Management
Program
The fund has adopted and
implemented a liquidity risk management program (the “Program”) as required by Rule 22e-4 under the Investment Company Act of 1940, as amended. The fund’s Board of Trustees (the “Board”)
has designated MFS as the administrator of the Program. The Program is reasonably designed to assess and manage the liquidity risk of the fund. Liquidity risk is the risk that the fund could not meet requests to
redeem shares issued by the fund without significant dilution of remaining investors' interests.
MFS provided a written report to the
Board for consideration at its March 2023 meeting that addressed the operation of the Program and provided an assessment of the adequacy and effectiveness of the Program during the period from January 1, 2022 to
December 31, 2022 (the “Covered Period”). The report concluded that during the Covered Period the Program had operated effectively in all material respects and had adequately and effectively been
implemented to assess and manage the fund’s liquidity risk. MFS also reported that there were no liquidity events that impacted the fund or its ability to timely meet redemptions without dilution to existing
shareholders during the Covered Period.
There can be no assurance that the
Program will achieve its objectives in the future. Further information on liquidity risk, and other principal risks to which an investment in the fund may be subject, can be found in the prospectus.
33
Proxy Voting Policies and
Information
MFS votes proxies on behalf of the
fund pursuant to proxy voting policies and procedures that are available without charge, upon request, by calling 1-800-225-2606, by visiting mfs.com/proxyvoting, or by visiting the SEC’s Web site at http://www.sec.gov.
Information regarding how the fund
voted proxies relating to portfolio securities during the most recent twelve-month period ended June 30 is available by August 31 of each year without charge by visiting mfs.com/proxyvoting, or by visiting the SEC’s Web site at http://www.sec.gov.
Quarterly Portfolio
Disclosure
The fund files a complete schedule
of portfolio holdings with the SEC for the first and third quarters of each fiscal year as an exhibit to its reports on Form N-PORT. The fund's Form N-PORT reports are available on the SEC's Web site at http://www.sec.gov. A shareholder can obtain the portfolio holdings report for the first and third quarters of the fund's fiscal year at mfs.com/openendfunds by choosing the fund's name and then scrolling to the “Resources” section and clicking on the “Prospectus and Reports” tab.
Further Information
From time to time, MFS may post
important information about the fund or the MFS Funds on the MFS Web site (mfs.com). This information is available at https://www.mfs.com/announcements or at mfs.com/openendfunds by choosing the fund’s name and then scrolling to the “Resources” section and clicking on the “Announcements” tab, if any.
Information About Fund
Contracts and Legal Claims
The fund has entered into
contractual arrangements with an investment adviser, administrator, distributor, shareholder servicing agent, and custodian who each provide services to the fund. Unless expressly stated otherwise, shareholders are
not parties to, or intended beneficiaries of these contractual arrangements, and these contractual arrangements are not intended to create any shareholder right to enforce them against the service providers or to seek
any remedy under them against the service providers, either directly or on behalf of the fund.
Under the Trust’s By-Laws and
Declaration of Trust, any claims asserted against or on behalf of the MFS Funds, including claims against Trustees and Officers, must be brought in state and federal courts located within the Commonwealth of
Massachusetts.
Provision of Financial
Reports and Summary Prospectuses
The fund produces financial reports
every six months and updates its summary prospectus and prospectus annually. To avoid sending duplicate copies of materials to households, only one copy of the fund’s annual and semiannual report and summary
prospectus may be mailed to shareholders having the same last name and residential address on the fund’s records. However, any shareholder may contact MFSC (please see back cover for address and telephone
number) to request that copies of these reports and summary prospectuses be sent personally to that shareholder.
34


Semiannual Report
April 30, 2023
MFS® Global Equity Fund

LGE-SEM
MFS® Global Equity Fund
CONTENTS
| 1 | |
| 3 | |
| 5 | |
| 10 | |
| 12 | |
| 13 | |
| 14 | |
| 23 | |
| 34 | |
| 35 | |
| 35 | |
| 35 | |
| 35 | |
| 35 |
| back cover |
The report is prepared for the
general information of shareholders. It is authorized for distribution to prospective investors only when preceded or accompanied by a current prospectus.
NOT FDIC INSURED
• MAY LOSE VALUE • NO BANK GUARANTEE
Portfolio Composition
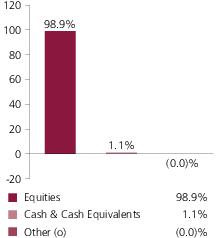
| (g) | The Global Industry Classification Standard (GICS®) was developed by and/or is the exclusive property of MSCI, Inc. and S&P Global Market Intelligence Inc. (“S&P Global Market Intelligence”). GICS is a service mark of MSCI and S&P Global Market Intelligence and has been licensed for use by MFS. MFS has applied its own internal sector/industry classification methodology for equity securities and non-equity securities that are unclassified by GICS. |
1
Portfolio Composition - continued
| (o) | Less than 0.1%. |
| (x) | Represents the portfolio’s exposure to issuer countries as a percentage of a portfolio’s net assets. For purposes of this presentation, United States includes Cash & Cash Equivalents and Other. |
| (y) | Represents the portfolio’s exposure to a particular currency as a percentage of a portfolio's net assets. For purposes of this presentation, United States Dollar includes Cash & Cash Equivalents. |
Cash & Cash Equivalents includes
any cash, investments in money market funds, short-term securities, and other assets less liabilities. Please see the Statement of Assets and Liabilities for additional information related to the fund’s cash
position and other assets and liabilities.
Other includes equivalent exposure
from currency derivatives and/or any offsets to derivative positions and may be negative.
Percentages are based on net assets
as of April 30, 2023.
The portfolio is actively managed
and current holdings may be different.
2
Expense Table
Fund expenses borne by the
shareholders during the period,
November 1, 2022 through April 30, 2023
November 1, 2022 through April 30, 2023
As a shareholder of the fund, you
incur two types of costs: (1) transaction costs, including sales charges (loads) on certain purchase or redemption payments, and (2) ongoing costs, including management fees; distribution and service (12b-1) fees; and
other fund expenses. This example is intended to help you understand your ongoing costs (in dollars) of investing in the fund and to compare these costs with the ongoing costs of investing in other mutual funds.
The example is based on an
investment of $1,000 invested at the beginning of the period and held for the entire period November 1, 2022 through April 30, 2023.
Actual Expenses
The first line for each share class
in the following table provides information about actual account values and actual expenses. You may use the information in this line, together with the amount you invested, to estimate the expenses that you paid over
the period. Simply divide your account value by $1,000 (for example, an $8,600 account value divided by $1,000 = 8.6), then multiply the result by the number in the first line under the heading entitled
“Expenses Paid During Period” to estimate the expenses you paid on your account during this period.
Hypothetical Example for
Comparison Purposes
The second line for each share class
in the following table provides information about hypothetical account values and hypothetical expenses based on the fund’s actual expense ratio and an assumed rate of return of 5% per year before expenses,
which is not the fund’s actual return. The hypothetical account values and expenses may not be used to estimate the actual ending account balance or expenses you paid for the period. You may use this information
to compare the ongoing costs of investing in the fund and other funds. To do so, compare this 5% hypothetical example with the 5% hypothetical examples that appear in the shareholder reports of the other funds.
Please note that the expenses shown
in the table are meant to highlight your ongoing costs only and do not reflect any transactional costs, such as sales charges (loads). Therefore, the second line for each share class in the table is useful in
comparing ongoing costs only, and will not help you determine the relative total costs of owning different funds. In addition, if these transactional costs were included, your costs would have been higher.
3
Expense Table - continued
| Share Class | Annualized Expense Ratio | Beginning Account Value 11/01/22 | Ending Account Value 4/30/23 | Expenses Paid During Period (p) 11/01/22-4/30/23 | |
| A | Actual | 1.16% | $1,000.00 | $1,160.16 | $6.21 |
| Hypothetical (h) | 1.16% | $1,000.00 | $1,019.04 | $5.81 | |
| B | Actual | 1.91% | $1,000.00 | $1,155.72 | $10.21 |
| Hypothetical (h) | 1.91% | $1,000.00 | $1,015.32 | $9.54 | |
| C | Actual | 1.91% | $1,000.00 | $1,155.76 | $10.21 |
| Hypothetical (h) | 1.91% | $1,000.00 | $1,015.32 | $9.54 | |
| I | Actual | 0.91% | $1,000.00 | $1,161.50 | $4.88 |
| Hypothetical (h) | 0.91% | $1,000.00 | $1,020.28 | $4.56 | |
| R1 | Actual | 1.91% | $1,000.00 | $1,155.64 | $10.21 |
| Hypothetical (h) | 1.91% | $1,000.00 | $1,015.32 | $9.54 | |
| R2 | Actual | 1.41% | $1,000.00 | $1,158.57 | $7.55 |
| Hypothetical (h) | 1.41% | $1,000.00 | $1,017.80 | $7.05 | |
| R3 | Actual | 1.16% | $1,000.00 | $1,160.01 | $6.21 |
| Hypothetical (h) | 1.16% | $1,000.00 | $1,019.04 | $5.81 | |
| R4 | Actual | 0.91% | $1,000.00 | $1,161.43 | $4.88 |
| Hypothetical (h) | 0.91% | $1,000.00 | $1,020.28 | $4.56 | |
| R6 | Actual | 0.82% | $1,000.00 | $1,161.86 | $4.40 |
| Hypothetical (h) | 0.82% | $1,000.00 | $1,020.73 | $4.11 |
| (h) | 5% class return per year before expenses. |
| (p) | “Expenses Paid During Period” are equal to each class’s annualized expense ratio, as shown above, multiplied by the average account value over the period, multiplied by 181/365 (to reflect the one-half year period). Expenses paid do not include any applicable sales charges (loads). If these transaction costs had been included, your costs would have been higher. |
4
Portfolio of Investments
4/30/23 (unaudited)
The Portfolio of Investments is a
complete list of all securities owned by your fund. It is categorized by broad-based asset classes.
| Issuer | Shares/Par | Value ($) | ||
| Common Stocks – 98.9% | ||||
| Aerospace & Defense – 3.3% | ||||
| Honeywell International, Inc. | 283,826 | $56,719,788 | ||
| MTU Aero Engines Holding AG | 55,265 | 14,475,099 | ||
| Rolls-Royce Holdings PLC (a) | 9,084,513 | 17,370,907 | ||
| $88,565,794 | ||||
| Airlines – 0.9% | ||||
| Aena S.A. (a) | 146,021 | $24,658,695 | ||
| Alcoholic Beverages – 6.0% | ||||
| Carlsberg Group | 97,975 | $16,185,537 | ||
| Diageo PLC | 1,294,508 | 59,136,231 | ||
| Heineken N.V. | 376,557 | 43,221,629 | ||
| Pernod Ricard S.A. | 189,393 | 43,749,867 | ||
| $162,293,264 | ||||
| Apparel Manufacturers – 5.2% | ||||
| Burberry Group PLC | 702,567 | $22,911,899 | ||
| Compagnie Financiere Richemont S.A. | 289,130 | 47,776,685 | ||
| LVMH Moet Hennessy Louis Vuitton SE | 72,932 | 69,996,845 | ||
| $140,685,429 | ||||
| Automotive – 0.4% | ||||
| Aptiv PLC (a) | 97,875 | $10,067,423 | ||
| Broadcasting – 2.2% | ||||
| Omnicom Group, Inc. | 88,597 | $8,024,230 | ||
| Walt Disney Co. (a) | 327,079 | 33,525,598 | ||
| WPP Group PLC | 1,566,798 | 18,185,643 | ||
| $59,735,471 | ||||
| Brokerage & Asset Managers – 2.6% | ||||
| Charles Schwab Corp. | 720,598 | $37,644,039 | ||
| Deutsche Boerse AG | 77,167 | 14,701,742 | ||
| London Stock Exchange Group PLC | 177,519 | 18,619,676 | ||
| $70,965,457 | ||||
| Business Services – 7.8% | ||||
| Accenture PLC, “A” | 211,083 | $59,164,454 | ||
| Adecco S.A. | 174,003 | 5,968,587 | ||
| Brenntag AG | 160,352 | 13,049,975 | ||
| Cognizant Technology Solutions Corp., “A” | 389,480 | 23,255,851 | ||
| Compass Group PLC | 601,907 | 15,862,686 | ||
5
Portfolio of Investments (unaudited)
– continued
| Issuer | Shares/Par | Value ($) | ||
| Common Stocks – continued | ||||
| Business Services – continued | ||||
| Equifax, Inc. | 135,300 | $28,193,814 | ||
| Fidelity National Information Services, Inc. | 364,118 | 21,381,009 | ||
| Fiserv, Inc. (a) | 283,697 | 34,645,078 | ||
| PayPal Holdings, Inc. (a) | 128,450 | 9,762,200 | ||
| $211,283,654 | ||||
| Cable TV – 2.4% | ||||
| Comcast Corp., “A” | 1,611,472 | $66,666,597 | ||
| Chemicals – 1.9% | ||||
| 3M Co. | 208,001 | $22,093,866 | ||
| PPG Industries, Inc. | 215,261 | 30,192,508 | ||
| $52,286,374 | ||||
| Computer Software – 2.9% | ||||
| Check Point Software Technologies Ltd. (a) | 224,589 | $28,603,655 | ||
| Oracle Corp. | 543,764 | 51,505,326 | ||
| $80,108,981 | ||||
| Computer Software - Systems – 1.0% | ||||
| Samsung Electronics Co. Ltd. | 551,050 | $27,149,347 | ||
| Construction – 0.6% | ||||
| Otis Worldwide Corp. | 183,599 | $15,660,995 | ||
| Consumer Products – 4.8% | ||||
| Colgate-Palmolive Co. | 175,500 | $14,004,900 | ||
| Essity AB | 1,334,125 | 40,420,343 | ||
| International Flavors & Fragrances, Inc. | 386,473 | 37,472,422 | ||
| Reckitt Benckiser Group PLC | 480,056 | 38,824,163 | ||
| $130,721,828 | ||||
| Electrical Equipment – 4.9% | ||||
| Amphenol Corp., “A” | 232,562 | $17,551,454 | ||
| Legrand S.A. | 360,599 | 34,116,028 | ||
| Schneider Electric SE | 462,958 | 80,882,981 | ||
| $132,550,463 | ||||
| Electronics – 1.0% | ||||
| Hoya Corp. | 115,800 | $12,198,186 | ||
| Microchip Technology, Inc. | 192,020 | 14,015,540 | ||
| $26,213,726 | ||||
6
Portfolio of Investments (unaudited)
– continued
| Issuer | Shares/Par | Value ($) | ||
| Common Stocks – continued | ||||
| Food & Beverages – 3.8% | ||||
| Danone S.A. | 620,078 | $41,031,346 | ||
| Nestle S.A. | 480,933 | 61,660,851 | ||
| $102,692,197 | ||||
| Gaming & Lodging – 1.0% | ||||
| Marriott International, Inc., “A” | 96,139 | $16,280,178 | ||
| Whitbread PLC | 300,806 | 12,298,718 | ||
| $28,578,896 | ||||
| Insurance – 3.2% | ||||
| Aon PLC | 119,680 | $38,917,542 | ||
| Willis Towers Watson PLC | 210,201 | 48,682,552 | ||
| $87,600,094 | ||||
| Internet – 2.4% | ||||
| Alphabet, Inc., “A” (a) | 420,414 | $45,127,239 | ||
| eBay, Inc. | 414,689 | 19,254,010 | ||
| $64,381,249 | ||||
| Machinery & Tools – 1.2% | ||||
| Carrier Global Corp. | 157,087 | $6,569,378 | ||
| Kubota Corp. | 1,804,500 | 27,266,591 | ||
| $33,835,969 | ||||
| Major Banks – 3.7% | ||||
| Erste Group Bank AG | 396,063 | $14,445,629 | ||
| Goldman Sachs Group, Inc. | 138,831 | 47,680,119 | ||
| UBS AG | 1,883,417 | 38,279,841 | ||
| $100,405,589 | ||||
| Medical Equipment – 13.6% | ||||
| Abbott Laboratories | 349,539 | $38,613,573 | ||
| Boston Scientific Corp. (a) | 933,253 | 48,641,146 | ||
| Cooper Cos., Inc. | 69,291 | 26,431,052 | ||
| EssilorLuxottica | 59,626 | 11,786,919 | ||
| Medtronic PLC | 801,406 | 72,887,876 | ||
| Olympus Corp. | 1,245,000 | 21,778,786 | ||
| Sonova Holding AG | 57,646 | 18,255,155 | ||
| Stryker Corp. | 121,571 | 36,428,750 | ||
| Thermo Fisher Scientific, Inc. | 128,426 | 71,263,587 | ||
| Waters Corp. (a) | 81,407 | 24,451,407 | ||
| $370,538,251 | ||||
7
Portfolio of Investments (unaudited)
– continued
| Issuer | Shares/Par | Value ($) | ||
| Common Stocks – continued | ||||
| Other Banks & Diversified Financials – 5.1% | ||||
| American Express Co. | 207,042 | $33,404,156 | ||
| Grupo Financiero Banorte S.A. de C.V. | 957,791 | 8,282,619 | ||
| Julius Baer Group Ltd. | 184,874 | 13,246,838 | ||
| Visa, Inc., “A” | 355,617 | 82,762,744 | ||
| $137,696,357 | ||||
| Pharmaceuticals – 5.0% | ||||
| Bayer AG | 508,290 | $33,470,665 | ||
| Merck KGaA | 198,983 | 35,640,611 | ||
| Roche Holding AG | 213,969 | 67,109,928 | ||
| $136,221,204 | ||||
| Railroad & Shipping – 4.6% | ||||
| Canadian National Railway Co. | 362,072 | $43,184,327 | ||
| Canadian Pacific Kansas City Ltd. | 673,450 | 53,094,798 | ||
| Union Pacific Corp. | 153,374 | 30,015,292 | ||
| $126,294,417 | ||||
| Specialty Chemicals – 4.8% | ||||
| Akzo Nobel N.V. | 315,552 | $26,252,694 | ||
| L'Air Liquide S.A. | 154,985 | 27,891,572 | ||
| Linde PLC | 206,193 | 76,178,004 | ||
| $130,322,270 | ||||
| Specialty Stores – 0.5% | ||||
| Hermes International | 5,903 | $12,809,150 | ||
| Telecommunications - Wireless – 1.1% | ||||
| Liberty Broadband Corp. (a) | 362,796 | $30,757,845 | ||
| Trucking – 1.0% | ||||
| United Parcel Service, Inc., “B” | 145,969 | $26,246,686 | ||
| Total Common Stocks (Identified Cost, $1,466,172,002) | $2,687,993,672 | |||
| Strike Price | First Exercise | |||
| Warrants – 0.0% | ||||
| Apparel Manufacturers – 0.0% | ||||
| Compagnie Financiere Richemont S.A. (1 share for 2 warrants, Expiration 12/04/23) (a) (Identified Cost, $0) | CHF 67 | 11/20/23 | 846,954 | $1,089,665 |
8
Portfolio of Investments (unaudited)
– continued
| Issuer | Shares/Par | Value ($) | ||
| Investment Companies (h) – 0.1% | ||||
| Money Market Funds – 0.1% | ||||
| MFS Institutional Money Market Portfolio, 4.59% (v) (Identified Cost, $1,933,789) | 1,933,783 | $1,934,170 | ||
| Other Assets, Less Liabilities – 1.0% | 26,420,247 | |||
| Net Assets – 100.0% | $2,717,437,754 | |||
| (a) | Non-income producing security. | |||
| (h) | An affiliated issuer, which may be considered one in which the fund owns 5% or more of the outstanding voting securities, or a company which is under common control. At period end, the aggregate values of the fund's investments in affiliated issuers and in unaffiliated issuers were $1,934,170 and $2,689,083,337, respectively. | |||
| (v) | Affiliated issuer that is available only to investment companies managed by MFS. The rate quoted for the MFS Institutional Money Market Portfolio is the annualized seven-day yield of the fund at period end. |
| Abbreviations indicate amounts shown in currencies other than the U.S. dollar. All amounts are stated in U.S. dollars unless otherwise indicated. A list of abbreviations is shown below: | |
| CHF | Swiss Franc |
See Notes to Financial Statements
9
Financial Statements
Statement of Assets and
Liabilities
At 4/30/23 (unaudited)
This statement represents your
fund’s balance sheet, which details the assets and liabilities comprising the total value of the fund.
| Assets | |
| Investments in unaffiliated issuers, at value (identified cost, $1,466,172,002) | $2,689,083,337 |
| Investments in affiliated issuers, at value (identified cost, $1,933,789) | 1,934,170 |
| Receivables for | |
| Investments sold | 23,035,582 |
| Fund shares sold | 2,863,614 |
| Interest and dividends | 9,421,281 |
| Other assets | 43,810 |
| Total assets | $2,726,381,794 |
| Liabilities | |
| Payable to custodian | $60 |
| Payables for | |
| Investments purchased | 4,707,565 |
| Fund shares reacquired | 3,196,924 |
| Payable to affiliates | |
| Investment adviser | 226,969 |
| Administrative services fee | 4,348 |
| Shareholder servicing costs | 565,634 |
| Distribution and service fees | 30,532 |
| Payable for independent Trustees' compensation | 9,104 |
| Accrued expenses and other liabilities | 202,904 |
| Total liabilities | $8,944,040 |
| Net assets | $2,717,437,754 |
| Net assets consist of | |
| Paid-in capital | $1,372,244,738 |
| Total distributable earnings (loss) | 1,345,193,016 |
| Net assets | $2,717,437,754 |
| Shares of beneficial interest outstanding | 54,748,624 |
10
Statement of Assets and Liabilities (unaudited) – continued
| Net assets | Shares outstanding | Net asset value per share (a) | |
| Class A | $718,912,426 | 14,723,881 | $48.83 |
| Class B | 6,993,657 | 160,159 | 43.67 |
| Class C | 64,457,957 | 1,564,243 | 41.21 |
| Class I | 958,886,981 | 18,999,028 | 50.47 |
| Class R1 | 1,061,153 | 24,971 | 42.50 |
| Class R2 | 26,546,971 | 563,144 | 47.14 |
| Class R3 | 59,903,807 | 1,237,002 | 48.43 |
| Class R4 | 64,922,981 | 1,323,152 | 49.07 |
| Class R6 | 815,751,821 | 16,153,044 | 50.50 |
| (a) | Maximum offering price per share was equal to the net asset value per share for all share classes, except for Class A, for which the maximum offering price per share was $51.81 [100 / 94.25 x $48.83]. On sales of $50,000 or more, the maximum offering price of Class A shares is reduced. A contingent deferred sales charge may be imposed on redemptions of Class A, Class B, and Class C shares. Redemption price per share was equal to the net asset value per share for Classes I, R1, R2, R3, R4, and R6. |
See Notes to Financial Statements
11
Financial Statements
Statement of Operations
Six months ended 4/30/23
(unaudited)
This statement describes how much
your fund earned in investment income and accrued in expenses. It also describes any gains and/or losses generated by fund operations.
| Net investment income (loss) | |
| Income | |
| Dividends | $24,537,543 |
| Dividends from affiliated issuers | 172,800 |
| Income on securities loaned | 14,092 |
| Other | 3 |
| Foreign taxes withheld | (1,623,970) |
| Total investment income | $23,100,468 |
| Expenses | |
| Management fee | $10,409,942 |
| Distribution and service fees | 1,374,172 |
| Shareholder servicing costs | 971,706 |
| Administrative services fee | 201,632 |
| Independent Trustees' compensation | 21,801 |
| Custodian fee | 129,527 |
| Shareholder communications | 83,255 |
| Audit and tax fees | 37,498 |
| Legal fees | 6,606 |
| Miscellaneous | 138,255 |
| Total expenses | $13,374,394 |
| Fees paid indirectly | (18) |
| Reduction of expenses by investment adviser and distributor | (174,287) |
| Net expenses | $13,200,089 |
| Net investment income (loss) | $9,900,379 |
| Realized and unrealized gain (loss) | |
| Realized gain (loss) (identified cost basis) | |
| Unaffiliated issuers | $126,877,108 |
| Affiliated issuers | 1,849 |
| Foreign currency | 162,001 |
| Net realized gain (loss) | $127,040,958 |
| Change in unrealized appreciation or depreciation | |
| Unaffiliated issuers | $262,453,372 |
| Affiliated issuers | 381 |
| Translation of assets and liabilities in foreign currencies | 697,354 |
| Net unrealized gain (loss) | $263,151,107 |
| Net realized and unrealized gain (loss) | $390,192,065 |
| Change in net assets from operations | $400,092,444 |
See Notes to Financial Statements
12
Financial Statements
Statements of Changes in Net
Assets
These statements describe the
increases and/or decreases in net assets resulting from operations, any distributions, and any shareholder transactions.
| Six months ended | Year ended | |
| 4/30/23 (unaudited) | 10/31/22 | |
| Change in net assets | ||
| From operations | ||
| Net investment income (loss) | $9,900,379 | $17,910,316 |
| Net realized gain (loss) | 127,040,958 | 245,538,621 |
| Net unrealized gain (loss) | 263,151,107 | (972,704,215) |
| Change in net assets from operations | $400,092,444 | $(709,255,278) |
| Total distributions to shareholders | $(226,391,945) | $(184,733,937) |
| Change in net assets from fund share transactions | $(55,179,871) | $(324,546,706) |
| Total change in net assets | $118,520,628 | $(1,218,535,921) |
| Net assets | ||
| At beginning of period | 2,598,917,126 | 3,817,453,047 |
| At end of period | $2,717,437,754 | $2,598,917,126 |
See Notes to Financial Statements
13
Financial Statements
Financial Highlights
The financial highlights table is
intended to help you understand the fund's financial performance for the semiannual period and the past 5 fiscal years. Certain information reflects financial results for a single fund share. The total returns in the
table represent the rate that an investor would have earned (or lost) on an investment in the fund share class (assuming reinvestment of all distributions) held for the entire period.
| Class A | Six months ended | Year ended | ||||
| 4/30/23 (unaudited) | 10/31/22 | 10/31/21 | 10/31/20 | 10/31/19 | 10/31/18 | |
| Net asset value, beginning of period | $45.88 | $60.75 | $45.22 | $45.79 | $41.44 | $43.43 |
| Income (loss) from investment operations | ||||||
| Net investment income (loss) (d) | $0.14 | $0.22 | $0.17 | $0.25 | $0.42 | $0.40 |
| Net realized and unrealized gain (loss) | 6.88 | (12.07) | 16.60 | 0.16(g) | 6.10 | (1.23) |
| Total from investment operations | $7.02 | $(11.85) | $16.77 | $0.41 | $6.52 | $(0.83) |
| Less distributions declared to shareholders | ||||||
| From net investment income | $(0.24) | $(0.18) | $(0.23) | $(0.45) | $(0.42) | $(0.29) |
| From net realized gain | (3.83) | (2.84) | (1.01) | (0.53) | (1.75) | (0.87) |
| Total distributions declared to shareholders | $(4.07) | $(3.02) | $(1.24) | $(0.98) | $(2.17) | $(1.16) |
| Net asset value, end of period (x) | $48.83 | $45.88 | $60.75 | $45.22 | $45.79 | $41.44 |
| Total return (%) (r)(s)(t)(x) | 16.02(n) | (20.50) | 37.58 | 0.83 | 16.67 | (1.99) |
| Ratios (%) (to average net assets) and Supplemental data: | ||||||
| Expenses before expense reductions (f) | 1.18(a) | 1.16 | 1.14 | 1.16 | 1.17 | 1.16 |
| Expenses after expense reductions (f) | 1.16(a) | 1.15 | 1.13 | 1.15 | 1.15 | 1.15 |
| Net investment income (loss) | 0.58(a) | 0.42 | 0.29 | 0.55 | 0.98 | 0.91 |
| Portfolio turnover | 4(n) | 8 | 10 | 9 | 7 | 12 |
| Net assets at end of period (000 omitted) | $718,912 | $649,695 | $857,804 | $667,074 | $721,141 | $671,000 |
See Notes to Financial Statements
14
Financial Highlights – continued
| Class B | Six months ended | Year ended | ||||
| 4/30/23 (unaudited) | 10/31/22 | 10/31/21 | 10/31/20 | 10/31/19 | 10/31/18 | |
| Net asset value, beginning of period | $41.36 | $55.28 | $41.35 | $41.93 | $38.09 | $40.03 |
| Income (loss) from investment operations | ||||||
| Net investment income (loss) (d) | $(0.04) | $(0.17) | $(0.23) | $(0.09) | $0.10 | $0.06 |
| Net realized and unrealized gain (loss) | 6.18 | (10.91) | 15.17 | 0.15(g) | 5.60 | (1.12) |
| Total from investment operations | $6.14 | $(11.08) | $14.94 | $0.06 | $5.70 | $(1.06) |
| Less distributions declared to shareholders | ||||||
| From net investment income | $— | $— | $— | $(0.11) | $(0.11) | $(0.01) |
| From net realized gain | (3.83) | (2.84) | (1.01) | (0.53) | (1.75) | (0.87) |
| Total distributions declared to shareholders | $(3.83) | $(2.84) | $(1.01) | $(0.64) | $(1.86) | $(0.88) |
| Net asset value, end of period (x) | $43.67 | $41.36 | $55.28 | $41.35 | $41.93 | $38.09 |
| Total return (%) (r)(s)(t)(x) | 15.57(n) | (21.09) | 36.56 | 0.08 | 15.79 | (2.73) |
| Ratios (%) (to average net assets) and Supplemental data: | ||||||
| Expenses before expense reductions (f) | 1.93(a) | 1.91 | 1.89 | 1.91 | 1.92 | 1.91 |
| Expenses after expense reductions (f) | 1.91(a) | 1.90 | 1.87 | 1.90 | 1.91 | 1.90 |
| Net investment income (loss) | (0.20)(a) | (0.36) | (0.45) | (0.21) | 0.24 | 0.15 |
| Portfolio turnover | 4(n) | 8 | 10 | 9 | 7 | 12 |
| Net assets at end of period (000 omitted) | $6,994 | $7,439 | $15,166 | $15,902 | $22,592 | $24,726 |
See Notes to Financial Statements
15
Financial Highlights – continued
| Class C | Six months ended | Year ended | ||||
| 4/30/23 (unaudited) | 10/31/22 | 10/31/21 | 10/31/20 | 10/31/19 | 10/31/18 | |
| Net asset value, beginning of period | $39.23 | $52.58 | $39.38 | $40.00 | $36.44 | $38.35 |
| Income (loss) from investment operations | ||||||
| Net investment income (loss) (d) | $(0.04) | $(0.15) | $(0.22) | $(0.08) | $0.09 | $0.06 |
| Net realized and unrealized gain (loss) | 5.85 | (10.36) | 14.43 | 0.14(g) | 5.34 | (1.07) |
| Total from investment operations | $5.81 | $(10.51) | $14.21 | $0.06 | $5.43 | $(1.01) |
| Less distributions declared to shareholders | ||||||
| From net investment income | $— | $— | $— | $(0.15) | $(0.12) | $(0.03) |
| From net realized gain | (3.83) | (2.84) | (1.01) | (0.53) | (1.75) | (0.87) |
| Total distributions declared to shareholders | $(3.83) | $(2.84) | $(1.01) | $(0.68) | $(1.87) | $(0.90) |
| Net asset value, end of period (x) | $41.21 | $39.23 | $52.58 | $39.38 | $40.00 | $36.44 |
| Total return (%) (r)(s)(t)(x) | 15.58(n) | (21.09) | 36.54 | 0.09 | 15.78 | (2.72) |
| Ratios (%) (to average net assets) and Supplemental data: | ||||||
| Expenses before expense reductions (f) | 1.93(a) | 1.91 | 1.89 | 1.91 | 1.92 | 1.91 |
| Expenses after expense reductions (f) | 1.91(a) | 1.90 | 1.87 | 1.90 | 1.91 | 1.90 |
| Net investment income (loss) | (0.20)(a) | (0.35) | (0.46) | (0.19) | 0.23 | 0.16 |
| Portfolio turnover | 4(n) | 8 | 10 | 9 | 7 | 12 |
| Net assets at end of period (000 omitted) | $64,458 | $66,875 | $112,939 | $110,351 | $143,769 | $149,669 |
See Notes to Financial Statements
16
Financial Highlights – continued
| Class I | Six months ended | Year ended | ||||
| 4/30/23 (unaudited) | 10/31/22 | 10/31/21 | 10/31/20 | 10/31/19 | 10/31/18 | |
| Net asset value, beginning of period | $47.36 | $62.59 | $46.55 | $47.09 | $42.57 | $44.58 |
| Income (loss) from investment operations | ||||||
| Net investment income (loss) (d) | $0.20 | $0.36 | $0.31 | $0.37 | $0.53 | $0.52 |
| Net realized and unrealized gain (loss) | 7.10 | (12.45) | 17.08 | 0.18(g) | 6.27 | (1.27) |
| Total from investment operations | $7.30 | $(12.09) | $17.39 | $0.55 | $6.80 | $(0.75) |
| Less distributions declared to shareholders | ||||||
| From net investment income | $(0.36) | $(0.30) | $(0.34) | $(0.56) | $(0.53) | $(0.39) |
| From net realized gain | (3.83) | (2.84) | (1.01) | (0.53) | (1.75) | (0.87) |
| Total distributions declared to shareholders | $(4.19) | $(3.14) | $(1.35) | $(1.09) | $(2.28) | $(1.26) |
| Net asset value, end of period (x) | $50.47 | $47.36 | $62.59 | $46.55 | $47.09 | $42.57 |
| Total return (%) (r)(s)(t)(x) | 16.15(n) | (20.30) | 37.91 | 1.10 | 16.94 | (1.76) |
| Ratios (%) (to average net assets) and Supplemental data: | ||||||
| Expenses before expense reductions (f) | 0.93(a) | 0.91 | 0.89 | 0.91 | 0.92 | 0.91 |
| Expenses after expense reductions (f) | 0.91(a) | 0.90 | 0.88 | 0.90 | 0.91 | 0.90 |
| Net investment income (loss) | 0.82(a) | 0.67 | 0.53 | 0.80 | 1.21 | 1.17 |
| Portfolio turnover | 4(n) | 8 | 10 | 9 | 7 | 12 |
| Net assets at end of period (000 omitted) | $958,887 | $946,778 | $1,245,750 | $908,819 | $947,284 | $935,292 |
See Notes to Financial Statements
17
Financial Highlights – continued
| Class R1 | Six months ended | Year ended | ||||
| 4/30/23 (unaudited) | 10/31/22 | 10/31/21 | 10/31/20 | 10/31/19 | 10/31/18 | |
| Net asset value, beginning of period | $40.35 | $54.00 | $40.41 | $40.97 | $37.25 | $39.18 |
| Income (loss) from investment operations | ||||||
| Net investment income (loss) (d) | $(0.04) | $(0.17) | $(0.23) | $(0.09) | $0.09 | $0.06 |
| Net realized and unrealized gain (loss) | 6.02 | (10.64) | 14.83 | 0.15(g) | 5.47 | (1.09) |
| Total from investment operations | $5.98 | $(10.81) | $14.60 | $0.06 | $5.56 | $(1.03) |
| Less distributions declared to shareholders | ||||||
| From net investment income | $— | $— | $— | $(0.09) | $(0.09) | $(0.03) |
| From net realized gain | (3.83) | (2.84) | (1.01) | (0.53) | (1.75) | (0.87) |
| Total distributions declared to shareholders | $(3.83) | $(2.84) | $(1.01) | $(0.62) | $(1.84) | $(0.90) |
| Net asset value, end of period (x) | $42.50 | $40.35 | $54.00 | $40.41 | $40.97 | $37.25 |
| Total return (%) (r)(s)(t)(x) | 15.56(n) | (21.09) | 36.57 | 0.08 | 15.77 | (2.73) |
| Ratios (%) (to average net assets) and Supplemental data: | ||||||
| Expenses before expense reductions (f) | 1.93(a) | 1.91 | 1.89 | 1.91 | 1.92 | 1.91 |
| Expenses after expense reductions (f) | 1.91(a) | 1.90 | 1.87 | 1.90 | 1.91 | 1.90 |
| Net investment income (loss) | (0.21)(a) | (0.36) | (0.46) | (0.23) | 0.22 | 0.16 |
| Portfolio turnover | 4(n) | 8 | 10 | 9 | 7 | 12 |
| Net assets at end of period (000 omitted) | $1,061 | $1,260 | $2,081 | $1,556 | $2,485 | $2,538 |
See Notes to Financial Statements
18
Financial Highlights – continued
| Class R2 | Six months ended | Year ended | ||||
| 4/30/23 (unaudited) | 10/31/22 | 10/31/21 | 10/31/20 | 10/31/19 | 10/31/18 | |
| Net asset value, beginning of period | $44.36 | $58.85 | $43.83 | $44.38 | $40.21 | $42.16 |
| Income (loss) from investment operations | ||||||
| Net investment income (loss) (d) | $0.07 | $0.08 | $0.02 | $0.13 | $0.31 | $0.28 |
| Net realized and unrealized gain (loss) | 6.65 | (11.68) | 16.09 | 0.16(g) | 5.91 | (1.19) |
| Total from investment operations | $6.72 | $(11.60) | $16.11 | $0.29 | $6.22 | $(0.91) |
| Less distributions declared to shareholders | ||||||
| From net investment income | $(0.11) | $(0.05) | $(0.08) | $(0.31) | $(0.30) | $(0.17) |
| From net realized gain | (3.83) | (2.84) | (1.01) | (0.53) | (1.75) | (0.87) |
| Total distributions declared to shareholders | $(3.94) | $(2.89) | $(1.09) | $(0.84) | $(2.05) | $(1.04) |
| Net asset value, end of period (x) | $47.14 | $44.36 | $58.85 | $43.83 | $44.38 | $40.21 |
| Total return (%) (r)(s)(t)(x) | 15.86(n) | (20.70) | 37.22 | 0.59 | 16.36 | (2.24) |
| Ratios (%) (to average net assets) and Supplemental data: | ||||||
| Expenses before expense reductions (f) | 1.43(a) | 1.41 | 1.39 | 1.41 | 1.42 | 1.41 |
| Expenses after expense reductions (f) | 1.41(a) | 1.40 | 1.38 | 1.40 | 1.41 | 1.40 |
| Net investment income (loss) | 0.32(a) | 0.16 | 0.04 | 0.30 | 0.76 | 0.66 |
| Portfolio turnover | 4(n) | 8 | 10 | 9 | 7 | 12 |
| Net assets at end of period (000 omitted) | $26,547 | $24,652 | $36,791 | $27,772 | $37,042 | $40,944 |
See Notes to Financial Statements
19
Financial Highlights – continued
| Class R3 | Six months ended | Year ended | ||||
| 4/30/23 (unaudited) | 10/31/22 | 10/31/21 | 10/31/20 | 10/31/19 | 10/31/18 | |
| Net asset value, beginning of period | $45.54 | $60.32 | $44.89 | $45.46 | $41.16 | $43.14 |
| Income (loss) from investment operations | ||||||
| Net investment income (loss) (d) | $0.12 | $0.21 | $0.16 | $0.24 | $0.41 | $0.39 |
| Net realized and unrealized gain (loss) | 6.84 | (11.97) | 16.49 | 0.17(g) | 6.06 | (1.21) |
| Total from investment operations | $6.96 | $(11.76) | $16.65 | $0.41 | $6.47 | $(0.82) |
| Less distributions declared to shareholders | ||||||
| From net investment income | $(0.24) | $(0.18) | $(0.21) | $(0.45) | $(0.42) | $(0.29) |
| From net realized gain | (3.83) | (2.84) | (1.01) | (0.53) | (1.75) | (0.87) |
| Total distributions declared to shareholders | $(4.07) | $(3.02) | $(1.22) | $(0.98) | $(2.17) | $(1.16) |
| Net asset value, end of period (x) | $48.43 | $45.54 | $60.32 | $44.89 | $45.46 | $41.16 |
| Total return (%) (r)(s)(t)(x) | 16.00(n) | (20.50) | 37.60 | 0.83 | 16.65 | (2.00) |
| Ratios (%) (to average net assets) and Supplemental data: | ||||||
| Expenses before expense reductions (f) | 1.18(a) | 1.16 | 1.14 | 1.16 | 1.17 | 1.16 |
| Expenses after expense reductions (f) | 1.16(a) | 1.15 | 1.13 | 1.15 | 1.16 | 1.15 |
| Net investment income (loss) | 0.51(a) | 0.41 | 0.29 | 0.54 | 0.97 | 0.90 |
| Portfolio turnover | 4(n) | 8 | 10 | 9 | 7 | 12 |
| Net assets at end of period (000 omitted) | $59,904 | $66,160 | $88,285 | $70,852 | $91,019 | $90,003 |
See Notes to Financial Statements
20
Financial Highlights – continued
| Class R4 | Six months ended | Year ended | ||||
| 4/30/23 (unaudited) | 10/31/22 | 10/31/21 | 10/31/20 | 10/31/19 | 10/31/18 | |
| Net asset value, beginning of period | $46.16 | $61.08 | $45.44 | $45.98 | $41.63 | $43.62 |
| Income (loss) from investment operations | ||||||
| Net investment income (loss) (d) | $0.18 | $0.35 | $0.30 | $0.36 | $0.54 | $0.51 |
| Net realized and unrealized gain (loss) | 6.92 | (12.13) | 16.69 | 0.17(g) | 6.09 | (1.23) |
| Total from investment operations | $7.10 | $(11.78) | $16.99 | $0.53 | $6.63 | $(0.72) |
| Less distributions declared to shareholders | ||||||
| From net investment income | $(0.36) | $(0.30) | $(0.34) | $(0.54) | $(0.53) | $(0.40) |
| From net realized gain | (3.83) | (2.84) | (1.01) | (0.53) | (1.75) | (0.87) |
| Total distributions declared to shareholders | $(4.19) | $(3.14) | $(1.35) | $(1.07) | $(2.28) | $(1.27) |
| Net asset value, end of period (x) | $49.07 | $46.16 | $61.08 | $45.44 | $45.98 | $41.63 |
| Total return (%) (r)(s)(t)(x) | 16.14(n) | (20.29) | 37.94 | 1.09 | 16.93 | (1.75) |
| Ratios (%) (to average net assets) and Supplemental data: | ||||||
| Expenses before expense reductions (f) | 0.93(a) | 0.91 | 0.89 | 0.91 | 0.92 | 0.91 |
| Expenses after expense reductions (f) | 0.91(a) | 0.90 | 0.88 | 0.90 | 0.91 | 0.90 |
| Net investment income (loss) | 0.78(a) | 0.67 | 0.53 | 0.80 | 1.25 | 1.16 |
| Portfolio turnover | 4(n) | 8 | 10 | 9 | 7 | 12 |
| Net assets at end of period (000 omitted) | $64,923 | $70,784 | $95,164 | $84,424 | $97,861 | $136,066 |
See Notes to Financial Statements
21
Financial Highlights – continued
| Class R6 | Six months ended | Year ended | ||||
| 4/30/23 (unaudited) | 10/31/22 | 10/31/21 | 10/31/20 | 10/31/19 | 10/31/18 | |
| Net asset value, beginning of period | $47.42 | $62.65 | $46.58 | $47.13 | $42.61 | $44.61 |
| Income (loss) from investment operations | ||||||
| Net investment income (loss) (d) | $0.22 | $0.39 | $0.36 | $0.41 | $0.59 | $0.54 |
| Net realized and unrealized gain (loss) | 7.10 | (12.43) | 17.11 | 0.17(g) | 6.26 | (1.24) |
| Total from investment operations | $7.32 | $(12.04) | $17.47 | $0.58 | $6.85 | $(0.70) |
| Less distributions declared to shareholders | ||||||
| From net investment income | $(0.41) | $(0.35) | $(0.39) | $(0.60) | $(0.58) | $(0.43) |
| From net realized gain | (3.83) | (2.84) | (1.01) | (0.53) | (1.75) | (0.87) |
| Total distributions declared to shareholders | $(4.24) | $(3.19) | $(1.40) | $(1.13) | $(2.33) | $(1.30) |
| Net asset value, end of period (x) | $50.50 | $47.42 | $62.65 | $46.58 | $47.13 | $42.61 |
| Total return (%) (r)(s)(t)(x) | 16.19(n) | (20.22) | 38.06 | 1.17 | 17.07 | (1.66) |
| Ratios (%) (to average net assets) and Supplemental data: | ||||||
| Expenses before expense reductions (f) | 0.84(a) | 0.82 | 0.80 | 0.82 | 0.83 | 0.81 |
| Expenses after expense reductions (f) | 0.82(a) | 0.80 | 0.78 | 0.81 | 0.82 | 0.80 |
| Net investment income (loss) | 0.90(a) | 0.73 | 0.63 | 0.89 | 1.35 | 1.20 |
| Portfolio turnover | 4(n) | 8 | 10 | 9 | 7 | 12 |
| Net assets at end of period (000 omitted) | $815,752 | $765,274 | $1,363,474 | $976,055 | $923,304 | $809,357 |
| (a) | Annualized. |
| (d) | Per share data is based on average shares outstanding. |
| (f) | Ratios do not reflect reductions from fees paid indirectly, if applicable. See Note 2 in the Notes to Financial Statements for additional information. |
| (g) | The per share amount varies from the net realized and unrealized gain/loss for the period because of the timing of sales of fund shares and the per share amount of realized and unrealized gains and losses at such time. |
| (n) | Not annualized. |
| (r) | Certain expenses have been reduced without which performance would have been lower. |
| (s) | From time to time the fund may receive proceeds from litigation settlements, without which performance would be lower. |
| (t) | Total returns do not include any applicable sales charges. |
| (x) | The net asset values and total returns have been calculated on net assets which include adjustments made in accordance with U.S. generally accepted accounting principles required at period end for financial reporting purposes. |
See Notes to Financial Statements
22
Notes to Financial Statements
(unaudited)
(1) Business and
Organization
MFS Global Equity Fund (the fund) is
a diversified series of MFS Series Trust VI (the trust). The trust is organized as a Massachusetts business trust and is registered under the Investment Company Act of 1940, as amended, as an open-end management
investment company.
The fund is an investment company
and accordingly follows the investment company accounting and reporting guidance of the Financial Accounting Standards Board (FASB) Accounting Standards Codification Topic 946 Financial Services - Investment
Companies.
(2) Significant Accounting
Policies
General — The preparation of financial statements in conformity with U.S. generally accepted accounting principles requires management to make estimates and assumptions that affect the
reported amounts of assets and liabilities, and disclosure of contingent assets and liabilities at the date of the financial statements and the reported amounts of increases and decreases in net assets from operations
during the reporting period. Actual results could differ from those estimates. In the preparation of these financial statements, management has evaluated subsequent events occurring after the date of the fund’s
Statement of Assets and Liabilities through the date that the financial statements were issued. The fund invests in foreign securities. Investments in foreign securities are vulnerable to the effects of changes in the relative values of the local currency and the U.S. dollar and to
the effects of changes in each country’s market, economic, industrial, political, regulatory, geopolitical, environmental, public health, and other conditions.
Balance Sheet Offsetting — The fund's accounting policy with respect to balance sheet offsetting is that, absent an event of default by the counterparty or a termination of the agreement, the International
Swaps and Derivatives Association (ISDA) Master Agreement, or similar agreement, does not result in an offset of reported amounts of financial assets and financial liabilities in the Statement of Assets and
Liabilities across transactions between the fund and the applicable counterparty. The fund's right to setoff may be restricted or prohibited by the bankruptcy or insolvency laws of the particular jurisdiction to which
a specific master netting agreement counterparty is subject. Balance sheet offsetting disclosures, to the extent applicable to the fund, have been included in the fund’s Significant Accounting Policies note
under the captions for each of the fund’s in-scope financial instruments and transactions.
Investment Valuations — Subject to its oversight, the fund's Board of Trustees has delegated primary responsibility for determining or causing to be determined the value of the fund’s investments to MFS as
the fund's adviser, pursuant to the fund’s valuation policy and procedures which have been adopted by the adviser and approved by the Board. In accordance with Rule 2a-5 under the Investment Company Act of
1940, the Board of Trustees designated the adviser as the “valuation designee” of the fund. If the adviser, as valuation designee, determines that reliable market quotations are not readily available for
an investment, the investment is valued at fair value as determined in good faith by the adviser in accordance with the adviser’s fair valuation policy and procedures.
23
Notes to Financial
Statements (unaudited) - continued
Under the fund's valuation policy
and procedures, equity securities, including restricted equity securities, are generally valued at the last sale or official closing price on their primary market or exchange as provided by a third-party pricing
service. Equity securities, for which there were no sales reported that day, are generally valued at the last quoted daily bid quotation on their primary market or exchange as provided by a third-party pricing
service. Short-term instruments with a maturity at issuance of 60 days or less may be valued at amortized cost, which approximates market value.
Open-end investment companies are generally valued
at net asset value per share. The values of foreign securities and other assets and liabilities expressed in foreign currencies are converted to U.S. dollars using the mean of bid and asked prices for rates provided
by a third-party pricing service.
Under the fund’s valuation
policy and procedures, market quotations are not considered to be readily available for debt instruments, floating rate loans, and many types of derivatives. These investments are generally valued at fair value based
on information from third-party pricing services or otherwise determined by the adviser in accordance with the adviser’s fair valuation policy and procedures. Securities and other assets generally valued on the
basis of information from a third-party pricing service may also be valued at a broker/dealer bid quotation. In determining values, third-party pricing services can utilize both transaction data and market information
such as yield, quality, coupon rate, maturity, type of issue, trading characteristics, spreads and other market data. An investment may also be valued at fair value if the adviser determines that the
investment’s value has been materially affected by events occurring after the close of the exchange or market on which the investment is principally traded (such as foreign exchange or market) and prior to the
determination of the fund’s net asset value, or after the halt of trading of a specific security where trading does not resume prior to the close of the exchange or market on which the security is principally
traded. Events that occur after foreign markets close (such as developments in foreign markets and significant movements in the U.S. markets) and prior to the determination of the fund’s net asset value may be
deemed to have a material effect on the value of securities traded in foreign markets. Accordingly, the fund’s foreign equity securities may often be valued at fair value. The adviser generally relies on
third-party pricing services or other information (such as the correlation with price movements of similar securities in the same or other markets; the type, cost and investment characteristics of the security; the
business and financial condition of the issuer; and trading and other market data) to assist in determining whether to fair value and at what value to fair value an investment. The value of an investment for purposes
of calculating the fund’s net asset value can differ depending on the source and method used to determine value. When fair valuation is used, the value of an investment used to determine the fund’s net
asset value may differ from quoted or published prices for the same investment. There can be no assurance that the fund could obtain the fair value assigned to an investment if it were to sell the investment at the
same time at which the fund determines its net asset value per share.
Various inputs are used in
determining the value of the fund's assets or liabilities. These inputs are categorized into three broad levels. In certain cases, the inputs used to measure fair value may fall into different levels of the fair value
hierarchy. In such cases, an investment's level within the fair value hierarchy is based on the lowest level of input that is significant to the fair value measurement. The fund's assessment of the significance of a
particular input to the fair value measurement in its entirety requires judgment, and considers factors specific to the investment. Level 1 includes unadjusted
24
Notes to Financial
Statements (unaudited) - continued
quoted prices in active markets for identical
assets or liabilities. Level 2 includes other significant observable market-based inputs (including quoted prices for similar securities, interest rates, prepayment speed, and credit risk). Level 3 includes
significant unobservable inputs, which may include the adviser's own assumptions in determining the fair value of investments. The following is a summary of the levels used as of April 30, 2023 in valuing the fund's
assets and liabilities:
| Financial Instruments | Level 1 | Level 2 | Level 3 | Total |
| Equity Securities: | ||||
| United States | $1,412,140,228 | $— | $— | $1,412,140,228 |
| France | 81,783,764 | 240,480,944 | — | 322,264,708 |
| Switzerland | 68,199,593 | 185,187,957 | — | 253,387,550 |
| United Kingdom | 51,853,269 | 151,356,654 | — | 203,209,923 |
| Germany | 98,288,117 | 13,049,975 | — | 111,338,092 |
| Canada | 96,279,125 | — | — | 96,279,125 |
| Netherlands | — | 69,474,323 | — | 69,474,323 |
| Japan | — | 61,243,563 | — | 61,243,563 |
| Sweden | 40,420,343 | — | — | 40,420,343 |
| Other Countries | 53,071,811 | 66,253,671 | — | 119,325,482 |
| Mutual Funds | 1,934,170 | — | — | 1,934,170 |
| Total | $1,903,970,420 | $787,047,087 | $— | $2,691,017,507 |
For further information regarding
security characteristics, see the Portfolio of Investments.
Foreign Currency Translation — Purchases and sales of foreign investments, income, and expenses are converted into U.S. dollars based upon currency exchange rates prevailing on the respective dates of such
transactions or on the reporting date for foreign denominated receivables and payables. Gains and losses attributable to foreign currency exchange rates on sales of securities are recorded for financial statement
purposes as net realized gains and losses on investments. Gains and losses attributable to foreign exchange rate movements on receivables, payables, income and expenses are recorded for financial statement purposes as
foreign currency transaction gains and losses. That portion of both realized and unrealized gains and losses on investments that results from fluctuations in foreign currency exchange rates is not separately
disclosed.
Security Loans — Under its Securities Lending Agency Agreement with the fund, JPMorgan Chase and Co., as lending agent, loans the securities of the fund to certain qualified institutions (the
“Borrowers”) approved by the fund. Security loans can be terminated at the discretion of either the lending agent or the fund and the related securities must be returned within the earlier of the standard
trade settlement period for such securities or within three business days. The loans are collateralized by cash and/or U.S. Treasury and federal agency obligations in an amount typically at least equal to the market
value of the securities loaned. On loans collateralized by cash, the cash collateral is invested in a money market fund. The market value of the loaned securities is determined at the close of business of the fund and
any additional required collateral is delivered to the fund on the next business day. The lending agent provides the fund with indemnification against Borrower default. In the event of Borrower default, the lending
agent will, for the benefit of the fund, either purchase securities identical to those loaned or, when such purchase is commercially impracticable, pay the
25
Notes to Financial
Statements (unaudited) - continued
fund the market value of the loaned securities. In
return, the lending agent assumes the fund's rights to the related collateral. If the collateral value is less than the cost to purchase identical securities, the lending agent is responsible for the shortfall, but
only to the extent that such shortfall is not due to a decline in collateral value resulting from collateral reinvestment for which the fund bears the risk of loss. A portion of the income generated upon investment of
the collateral is remitted to the Borrowers, and the remainder is allocated between the fund and the lending agent. On loans collateralized by U.S. Treasury and/or federal agency obligations, a fee is received from
the Borrower, and is allocated between the fund and the lending agent. Income from securities lending is separately reported in the Statement of Operations. The dividend and interest income earned on the securities
loaned is accounted for in the same manner as other dividend and interest income. At April 30, 2023, there were no securities on loan or collateral outstanding.
Indemnifications — Under the fund's organizational documents, its officers and Trustees may be indemnified against certain liabilities and expenses arising out of the performance of their duties to
the fund. Additionally, in the normal course of business, the fund enters into agreements with service providers that may contain indemnification clauses. The fund's maximum exposure under these agreements is unknown
as this would involve future claims that may be made against the fund that have not yet occurred.
Investment Transactions and
Income — Investment transactions are recorded on the trade date. Dividends received in cash are recorded on the ex-dividend date. Certain dividends from foreign securities will be recorded when the fund is informed of the dividend if such information is
obtained subsequent to the ex-dividend date. Dividend payments received in additional securities are recorded on the ex-dividend date in an amount equal to the value of the security on such date. In determining the net gain or loss on securities sold, the cost of securities is determined on the identified cost basis.
The fund may receive proceeds from
litigation settlements. Any proceeds received from litigation involving portfolio holdings are reflected in the Statement of Operations in realized gain/loss if the security has been disposed of by the fund or in
unrealized gain/loss if the security is still held by the fund. Any other proceeds from litigation not related to portfolio holdings are reflected as other income in the Statement of Operations.
Fees Paid Indirectly — The fund's custody fee may be reduced by a credit earned under an arrangement that measures the value of U.S. dollars deposited with the custodian by the fund. The amount of the
credit, for the six months ended April 30, 2023, is shown as a reduction of total expenses in the Statement of Operations.
Tax Matters and Distributions — The fund intends to qualify as a regulated investment company, as defined under Subchapter M of the Internal Revenue Code, and to distribute all of its taxable income, including
realized capital gains. As a result, no provision for federal income tax is required. The fund’s federal tax returns, when filed, will remain subject to examination by the Internal Revenue Service for a three
year period. Management has analyzed the fund’s tax positions taken on federal and state tax returns for all open tax years and does not believe that there are any uncertain tax positions that require
recognition of a tax liability. Foreign taxes, if any, have been accrued by the fund in the accompanying financial statements in accordance with the
26
Notes to Financial
Statements (unaudited) - continued
applicable foreign tax law. Foreign income taxes
may be withheld by certain countries in which the fund invests. Additionally, capital gains realized by the fund on securities issued in or by certain foreign countries may be subject to capital gains tax imposed by
those countries.
Distributions to shareholders are
recorded on the ex-dividend date. Income and capital gain distributions are determined in accordance with income tax regulations, which may differ from U.S. generally accepted accounting principles. Certain capital
accounts in the financial statements are periodically adjusted for permanent differences in order to reflect their tax character. These adjustments have no impact on net assets or net asset value per share. Temporary
differences which arise from recognizing certain items of income, expense, gain or loss in different periods for financial statement and tax purposes will reverse at some time in the future.
Book/tax differences primarily
relate to wash sale loss deferrals and treating a portion of the proceeds from redemptions as a distribution for tax purposes.
The tax character of distributions
made during the current period will be determined at fiscal year end. The tax character of distributions declared to shareholders for the last fiscal year is as follows:
| Year ended 10/31/22 | |
| Ordinary income (including any short-term capital gains) | $19,789,607 |
| Long-term capital gains | 164,944,330 |
| Total distributions | $184,733,937 |
The federal tax cost and the tax
basis components of distributable earnings were as follows:
| As of 4/30/23 | |
| Cost of investments | $1,468,105,791 |
| Gross appreciation | 1,296,562,771 |
| Gross depreciation | (73,651,055) |
| Net unrealized appreciation (depreciation) | $1,222,911,716 |
| As of 10/31/22 | |
| Undistributed ordinary income | 17,125,305 |
| Undistributed long-term capital gain | 208,537,055 |
| Other temporary differences | (648,742) |
| Net unrealized appreciation (depreciation) | 946,478,899 |
The aggregate cost above includes
prior fiscal year end tax adjustments, if applicable.
Multiple Classes of Shares of
Beneficial Interest — The fund offers multiple classes of shares, which differ in their respective distribution and service fees. The fund's income, realized and unrealized gain (loss), and common
expenses are allocated to shareholders based on the daily net assets of each class. Dividends are declared separately for each class. Differences in per share dividend rates are generally due to differences in
separate class expenses. Class B and Class C shares will convert to
27
Notes to Financial
Statements (unaudited) - continued
Class A shares approximately eight years after
purchase. The fund’s distributions declared to shareholders as reported in the Statements of Changes in Net Assets are presented by class as follows:
| Six months ended 4/30/23 | Year ended 10/31/22 | ||
| Class A | $56,773,747 | $42,467,364 | |
| Class B | 669,191 | 742,277 | |
| Class C | 6,363,794 | 5,994,793 | |
| Class I | 79,956,425 | 62,197,001 | |
| Class R1 | 120,143 | 109,269 | |
| Class R2 | 2,165,712 | 1,785,958 | |
| Class R3 | 5,734,624 | 4,368,531 | |
| Class R4 | 6,351,042 | 4,886,283 | |
| Class R6 | 68,257,267 | 62,182,461 | |
| Total | $226,391,945 | $184,733,937 |
(3) Transactions with
Affiliates
Investment Adviser — The fund has an investment advisory agreement with MFS to provide overall investment management and related administrative services and facilities to the fund. The management fee is computed daily and paid monthly at the following annual rates based on the fund's average daily net assets:
| Up to $1 billion | 0.90% |
| In excess of $1 billion and up to $2 billion | 0.75% |
| In excess of $2 billion and up to $5 billion | 0.65% |
| In excess of $5 billion | 0.60% |
MFS has agreed in writing to reduce
its management fee by a specified amount if certain MFS mutual fund assets exceed thresholds agreed to by MFS and the fund's Board of Trustees. MFS has also agreed in writing to waive at least 0.01% of its management
fee as part of this agreement. The agreement to waive at least 0.01% of the management fee will continue until modified by the fund's Board of Trustees, but such agreement will continue at least until February 29,
2024. For the six months ended April 30, 2023, this management fee reduction amounted to $174,165, which is included in the reduction of total expenses in the Statement of Operations. The management fee incurred for
the six months ended April 30, 2023 was equivalent to an annual effective rate of 0.77% of the fund's average daily net assets.
Distributor — MFS Fund Distributors, Inc. (MFD), a wholly-owned subsidiary of MFS, as distributor, received $25,096 for the six months ended April 30, 2023, as its portion of the initial sales
charge on sales of Class A shares of the fund.
The Board of Trustees has adopted a
distribution plan for certain share classes pursuant to Rule 12b-1 of the Investment Company Act of 1940.
The fund's distribution plan
provides that the fund will pay MFD for services provided by MFD and financial intermediaries in connection with the distribution and servicing of certain share classes. One component of the plan is a distribution fee
paid to MFD and another component of the plan is a service fee paid to MFD. MFD may subsequently pay all, or a portion, of the distribution and/or service fees to financial intermediaries.
28
Notes to Financial
Statements (unaudited) - continued
Distribution Plan Fee Table:
| Distribution Fee Rate (d) | Service Fee Rate (d) | Total Distribution Plan (d) | Annual Effective Rate (e) | Distribution and Service Fee | |
| Class A | — | 0.25% | 0.25% | 0.25% | $ 852,843 |
| Class B | 0.75% | 0.25% | 1.00% | 1.00% | 36,671 |
| Class C | 0.75% | 0.25% | 1.00% | 1.00% | 332,775 |
| Class R1 | 0.75% | 0.25% | 1.00% | 1.00% | 5,572 |
| Class R2 | 0.25% | 0.25% | 0.50% | 0.50% | 64,296 |
| Class R3 | — | 0.25% | 0.25% | 0.25% | 82,015 |
| Total Distribution and Service Fees | $1,374,172 |
| (d) | In accordance with the distribution plan for certain classes, the fund pays distribution and/or service fees equal to these annual percentage rates of each class’s average daily net assets. The distribution and service fee rates disclosed by class represent the current rates in effect at the end of the reporting period. Any rate changes, if applicable, are detailed below. |
| (e) | The annual effective rates represent actual fees incurred under the distribution plan for the six months ended April 30, 2023 based on each class's average daily net assets. MFD has voluntarily agreed to rebate a portion of each class's 0.25% service fee attributable to accounts for which there is no financial intermediary specified on the account except for accounts attributable to MFS or its affiliates' seed money. For the six months ended April 30, 2023, this rebate amounted to $115 and $7 for Class A and Class R2 shares, respectively, and is included in the reduction of total expenses in the Statement of Operations. |
Certain Class A shares are
subject to a contingent deferred sales charge (CDSC) in the event of a shareholder redemption within 18 months of purchase. Class B shares are subject to a CDSC in the event of a shareholder redemption within six
years of purchase. Class C shares are subject to a CDSC in the event of a shareholder redemption within 12 months of purchase. All contingent deferred sales charges are paid to MFD and during the six months
ended April 30, 2023, were as follows:
| Amount | |
| Class A | $6,075 |
| Class B | 1,050 |
| Class C | 1,296 |
Shareholder Servicing Agent — MFS Service Center, Inc. (MFSC), a wholly-owned subsidiary of MFS, receives a fee from the fund for its services as shareholder servicing agent calculated as a percentage of the
average daily net assets of the fund as determined periodically under the supervision of the fund's Board of Trustees. For the six months ended April 30, 2023, the fee was $90,909, which equated to 0.0068% annually of
the fund's average daily net assets. MFSC also receives reimbursement from the fund for out-of-pocket expenses, sub-accounting and other shareholder servicing costs which may be paid to affiliated and unaffiliated
service providers. Class R6 shares do not incur sub-accounting fees. For the six months ended April 30, 2023, these out-of-pocket expenses, sub-accounting and other shareholder servicing costs amounted to
$880,797.
Administrator — MFS provides certain financial, legal, shareholder communications, compliance, and other administrative services to the fund. Under an administrative services agreement, the fund
reimburses MFS the costs incurred to provide these
29
Notes to Financial
Statements (unaudited) - continued
services. The fund is charged an annual fixed
amount of $17,500 plus a fee based on average daily net assets. The administrative services fee incurred for the six months ended April 30, 2023 was equivalent to an annual effective rate of 0.0151% of the fund's
average daily net assets.
Trustees’ and Officers’
Compensation — The fund pays compensation to independent Trustees in the form of a retainer, attendance fees, and additional compensation to Board and Committee chairpersons. The fund does not
pay compensation directly to Trustees or officers of the fund who are also officers of the investment adviser, all of whom receive remuneration from MFS for their services to the fund. Certain officers and Trustees of
the fund are officers or directors of MFS, MFD, and MFSC.
Prior to December 31, 2001, the fund
had an unfunded defined benefit plan (“DB plan”) for independent Trustees. As of December 31, 2001, the Board took action to terminate the DB plan with respect to then-current and any future independent
Trustees, such that the DB plan covers only certain of those former independent Trustees who retired on or before December 31, 2001. The DB plan resulted in a pension expense of $144 and is included in
“Independent Trustees’ compensation” in the Statement of Operations for the six months ended April 30, 2023. The liability for deferred retirement benefits payable to those former independent
Trustees under the DB plan amounted to $3,116 at April 30, 2023, and is included in “Payable for independent Trustees’ compensation” in the Statement of Assets and Liabilities.
Other — The fund invests in the MFS Institutional Money Market Portfolio which is managed by MFS and seeks current income consistent with preservation of capital and liquidity. This money
market fund does not pay a management fee to MFS but does incur investment and operating costs.
The fund is permitted to engage in
purchase and sale transactions with funds and accounts for which MFS serves as investment adviser or sub-adviser (“cross-trades”) pursuant to a policy adopted by the Board of Trustees. This policy has been
designed to ensure that cross-trades conducted by the fund comply with Rule 17a-7 under the Investment Company Act of 1940. During the six months ended April 30, 2023, the fund engaged in purchase transactions
pursuant to this policy, which amounted to $2,566,606.
(4) Portfolio Securities
For the six months ended April 30,
2023, purchases and sales of investments, other than short-term obligations, aggregated $97,996,710 and $387,891,379, respectively.
30
Notes to Financial
Statements (unaudited) - continued
(5) Shares of Beneficial
Interest
The fund's Declaration of Trust
permits the Trustees to issue an unlimited number of full and fractional shares of beneficial interest. Transactions in fund shares were as follows:
| Six months ended 4/30/23 | Year ended 10/31/22 | ||||
| Shares | Amount | Shares | Amount | ||
| Shares sold | |||||
| Class A | 718,967 | $33,358,130 | 1,598,114 | $83,819,854 | |
| Class B | 4,192 | 165,588 | 723 | 36,283 | |
| Class C | 60,115 | 2,357,496 | 129,420 | 5,937,150 | |
| Class I | 1,704,384 | 81,952,055 | 4,668,176 | 247,307,932 | |
| Class R1 | 1,127 | 45,722 | 7,916 | 345,974 | |
| Class R2 | 37,282 | 1,678,670 | 121,943 | 6,225,015 | |
| Class R3 | 115,245 | 5,345,706 | 352,981 | 18,279,571 | |
| Class R4 | 97,907 | 4,609,646 | 204,357 | 10,632,175 | |
| Class R6 | 1,823,261 | 88,205,304 | 4,027,793 | 214,466,893 | |
| 4,562,480 | $217,718,317 | 11,111,423 | $587,050,847 | ||
| Shares issued to shareholders in reinvestment of distributions | |||||
| Class A | 1,160,093 | $52,401,412 | 684,451 | $39,129,987 | |
| Class B | 16,253 | 658,392 | 13,838 | 717,887 | |
| Class C | 158,815 | 6,071,575 | 114,666 | 5,642,648 | |
| Class I | 1,595,642 | 74,420,734 | 972,259 | 57,246,629 | |
| Class R1 | 3,047 | 120,143 | 2,159 | 109,269 | |
| Class R2 | 49,186 | 2,146,951 | 31,891 | 1,766,786 | |
| Class R3 | 128,005 | 5,734,624 | 76,992 | 4,368,531 | |
| Class R4 | 138,049 | 6,259,160 | 83,542 | 4,793,659 | |
| Class R6 | 1,401,301 | 65,370,701 | 1,012,072 | 59,611,019 | |
| 4,650,391 | $213,183,692 | 2,991,870 | $173,386,415 | ||
| Shares reacquired | |||||
| Class A | (1,314,785) | $(61,060,551) | (2,242,147) | $(115,135,541) | |
| Class B | (40,143) | (1,676,105) | (109,056) | (5,147,616) | |
| Class C | (359,378) | (14,178,098) | (687,244) | (30,353,116) | |
| Class I | (4,290,538) | (207,938,916) | (5,553,460) | (291,363,232) | |
| Class R1 | (10,439) | (402,888) | (17,376) | (780,110) | |
| Class R2 | (79,027) | (3,552,418) | (223,278) | (11,264,562) | |
| Class R3 | (459,079) | (21,133,329) | (440,771) | (22,596,576) | |
| Class R4 | (446,330) | (20,970,767) | (312,394) | (15,826,474) | |
| Class R6 | (3,210,142) | (155,168,808) | (10,664,146) | (592,516,741) | |
| (10,209,861) | $(486,081,880) | (20,249,872) | $(1,084,983,968) | ||
31
Notes to Financial
Statements (unaudited) - continued
| Six months ended 4/30/23 | Year ended 10/31/22 | ||||
| Shares | Amount | Shares | Amount | ||
| Net change | |||||
| Class A | 564,275 | $24,698,991 | 40,418 | $7,814,300 | |
| Class B | (19,698) | (852,125) | (94,495) | (4,393,446) | |
| Class C | (140,448) | (5,749,027) | (443,158) | (18,773,318) | |
| Class I | (990,512) | (51,566,127) | 86,975 | 13,191,329 | |
| Class R1 | (6,265) | (237,023) | (7,301) | (324,867) | |
| Class R2 | 7,441 | 273,203 | (69,444) | (3,272,761) | |
| Class R3 | (215,829) | (10,052,999) | (10,798) | 51,526 | |
| Class R4 | (210,374) | (10,101,961) | (24,495) | (400,640) | |
| Class R6 | 14,420 | (1,592,803) | (5,624,281) | (318,438,829) | |
| (996,990) | $(55,179,871) | (6,146,579) | $(324,546,706) | ||
Effective June 1, 2019, purchases of
the fund’s Class B shares were closed to new and existing investors subject to certain exceptions. On March 30, 2023, the fund announced that effective after the close of business on September 29, 2023,
purchases of Class R1 and Class R2 shares will be closed to new eligible investors.
(6) Line of Credit
The fund and certain other funds
managed by MFS participate in a $1.45 billion unsecured committed line of credit of which $1.2 billion is reserved for use by the fund and certain other MFS U.S. funds. The line of credit is provided by a syndicate of
banks under a credit agreement. Borrowings may be made for temporary financing needs. Interest is charged to each fund, based on its borrowings, generally at a rate equal to the highest of 1) Daily Simple SOFR
(Secured Overnight Financing Rate) plus 0.10%, 2) the Federal Funds Effective Rate, or 3) the Overnight Bank Funding Rate, each plus an agreed upon spread. A commitment fee, based on the average daily unused portion
of the committed line of credit, is allocated among the participating funds. The line of credit expires on March 14, 2024 unless extended or renewed. In addition, the fund and other funds managed by MFS have
established unsecured uncommitted borrowing arrangements with certain banks for temporary financing needs. Interest is charged to each fund, based on its borrowings, at rates equal to customary reference rates plus an
agreed upon spread. For the six months ended April 30, 2023, the fund’s commitment fee and interest expense were $6,959 and $0, respectively, and are included in “Miscellaneous” expense in the
Statement of Operations.
32
Notes to Financial
Statements (unaudited) - continued
(7) Investments in Affiliated
Issuers
An affiliated issuer may be
considered one in which the fund owns 5% or more of the outstanding voting securities, or a company which is under common control. For the purposes of this report, the following were affiliated issuers:
| Affiliated Issuers | Beginning Value | Purchases | Sales Proceeds | Realized Gain (Loss) | Change in Unrealized Appreciation or Depreciation | Ending Value |
| MFS Institutional Money Market Portfolio | $8,194,315 | $227,543,827 | $233,806,202 | $1,849 | $381 | $1,934,170 |
| Affiliated Issuers | Dividend Income | Capital Gain Distributions |
| MFS Institutional Money Market Portfolio | $172,800 | $— |
33
Statement Regarding Liquidity Risk Management
Program
The fund has adopted and
implemented a liquidity risk management program (the “Program”) as required by Rule 22e-4 under the Investment Company Act of 1940, as amended. The fund’s Board of Trustees (the “Board”)
has designated MFS as the administrator of the Program. The Program is reasonably designed to assess and manage the liquidity risk of the fund. Liquidity risk is the risk that the fund could not meet requests to
redeem shares issued by the fund without significant dilution of remaining investors' interests.
MFS provided a written report to the
Board for consideration at its March 2023 meeting that addressed the operation of the Program and provided an assessment of the adequacy and effectiveness of the Program during the period from January 1, 2022 to
December 31, 2022 (the “Covered Period”). The report concluded that during the Covered Period the Program had operated effectively in all material respects and had adequately and effectively been
implemented to assess and manage the fund’s liquidity risk. MFS also reported that there were no liquidity events that impacted the fund or its ability to timely meet redemptions without dilution to existing
shareholders during the Covered Period.
There can be no assurance that the
Program will achieve its objectives in the future. Further information on liquidity risk, and other principal risks to which an investment in the fund may be subject, can be found in the prospectus.
34
Proxy Voting Policies and
Information
MFS votes proxies on behalf of the
fund pursuant to proxy voting policies and procedures that are available without charge, upon request, by calling 1-800-225-2606, by visiting mfs.com/proxyvoting, or by visiting the SEC’s Web site at http://www.sec.gov.
Information regarding how the fund
voted proxies relating to portfolio securities during the most recent twelve-month period ended June 30 is available by August 31 of each year without charge by visiting mfs.com/proxyvoting, or by visiting the SEC’s Web site at http://www.sec.gov.
Quarterly Portfolio
Disclosure
The fund files a complete schedule
of portfolio holdings with the SEC for the first and third quarters of each fiscal year as an exhibit to its reports on Form N-PORT. The fund's Form N-PORT reports are available on the SEC's Web site at http://www.sec.gov. A shareholder can obtain the portfolio holdings report for the first and third quarters of the fund's fiscal year at mfs.com/openendfunds by choosing the fund's name and then scrolling to the “Resources” section and clicking on the “Prospectus and Reports” tab.
Further Information
From time to time, MFS may post
important information about the fund or the MFS Funds on the MFS Web site (mfs.com). This information is available at https://www.mfs.com/announcements or at mfs.com/openendfunds by choosing the fund’s name and then scrolling to the “Resources” section and clicking on the “Announcements” tab, if any.
Information About Fund
Contracts and Legal Claims
The fund has entered into
contractual arrangements with an investment adviser, administrator, distributor, shareholder servicing agent, and custodian who each provide services to the fund. Unless expressly stated otherwise, shareholders are
not parties to, or intended beneficiaries of these contractual arrangements, and these contractual arrangements are not intended to create any shareholder right to enforce them against the service providers or to seek
any remedy under them against the service providers, either directly or on behalf of the fund.
Under the Trust’s By-Laws and
Declaration of Trust, any claims asserted against or on behalf of the MFS Funds, including claims against Trustees and Officers, must be brought in state and federal courts located within the Commonwealth of
Massachusetts.
Provision of Financial
Reports and Summary Prospectuses
The fund produces financial reports
every six months and updates its summary prospectus and prospectus annually. To avoid sending duplicate copies of materials to households, only one copy of the fund’s annual and semiannual report and summary
prospectus may be mailed to shareholders having the same last name and residential address on the fund’s records. However, any shareholder may contact MFSC (please see back cover for address and telephone
number) to request that copies of these reports and summary prospectuses be sent personally to that shareholder.
35


Semiannual Report
April 30, 2023
MFS® Global Total
Return Fund
Return Fund

MWT-SEM
MFS® Global Total
Return Fund
Return Fund
CONTENTS
| 1 | |
| 4 | |
| 6 | |
| 38 | |
| 40 | |
| 42 | |
| 43 | |
| 52 | |
| 72 | |
| 73 | |
| 73 | |
| 73 | |
| 73 | |
| 73 |
| back cover |
The report is prepared for the
general information of shareholders. It is authorized for distribution to prospective investors only when preceded or accompanied by a current prospectus.
NOT FDIC INSURED
• MAY LOSE VALUE • NO BANK GUARANTEE
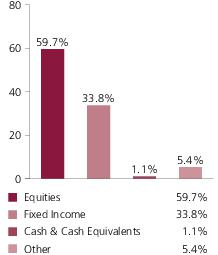
Portfolio Composition - continued
| (a) | For all securities other than those specifically described below, ratings are assigned to underlying securities utilizing ratings from Moody’s, Fitch, and Standard & Poor’s rating agencies and applying the following hierarchy: If all three agencies provide a rating, the middle rating (after dropping the highest and lowest ratings) is assigned; if two of the three agencies rate a security, the lower of the two is assigned. If none of the 3 rating agencies above assign a rating, but the security is rated by DBRS Morningstar, then the DBRS Morningstar rating is assigned. If none of the 4 rating agencies listed above rate the security, but the security is rated by the Kroll Bond Rating Agency (KBRA), then the KBRA rating is assigned. Ratings are shown in the S&P and Fitch scale (e.g., AAA). Securities rated BBB or higher are considered investment grade. All ratings are subject to change. U.S. Government includes securities issued by the U.S. Department of the Treasury. Federal Agencies includes rated and unrated U.S. Agency fixed-income securities, U.S. Agency mortgage-backed securities, and collateralized mortgage obligations of U.S. Agency mortgage-backed securities. |
Not Rated includes
fixed income securities and fixed income derivatives that have not been rated by any rating agency. Non-Fixed Income includes equity securities (including convertible bonds and equity derivatives), ETFs, and/or
commodity-linked derivatives. The fund may or may not have held all of these instruments on this date. The fund is not rated by these agencies.
2
Portfolio Composition - continued
| (g) | The Global Industry Classification Standard (GICS®) was developed by and/or is the exclusive property of MSCI, Inc. and S&P Global Market Intelligence Inc. (“S&P Global Market Intelligence”). GICS is a service mark of MSCI and S&P Global Market Intelligence and has been licensed for use by MFS. MFS has applied its own internal sector/industry classification methodology for equity securities and non-equity securities that are unclassified by GICS. |
| (i) | For purposes of this presentation, the components include the value of securities, and reflect the impact of the equivalent exposure of derivative positions, if any. These amounts may be negative from time to time. Equivalent exposure is a calculated amount that translates the derivative position into a reasonable approximation of the amount of the underlying asset that the portfolio would have to hold at a given point in time to have the same price sensitivity that results from the portfolio’s ownership of the derivative contract. When dealing with derivatives, equivalent exposure is a more representative measure of the potential impact of a position on portfolio performance than value. The bond component will include any accrued interest amounts. |
| (o) | Less than 0.1%. |
| (x) | Represents the portfolio’s exposure to issuer countries as a percentage of a portfolio’s net assets. For purposes of this presentation, United States includes Cash & Cash Equivalents and Other. |
| (y) | Represents the portfolio’s exposure to a particular currency as a percentage of a portfolio's net assets. For purposes of this presentation, United States Dollar includes Cash & Cash Equivalents. |
Where the fund holds convertible
bonds, they are treated as part of the equity portion of the portfolio.
Cash & Cash Equivalents includes
any cash, investments in money market funds, short-term securities, and other assets less liabilities. Please see the Statement of Assets and Liabilities for additional information related to the fund’s cash
position and other assets and liabilities.
Other includes equivalent exposure
from currency derivatives and/or any offsets to derivative positions and may be negative.
Percentages are based on net assets
as of April 30, 2023.
The portfolio is actively managed
and current holdings may be different.
3
Expense Table
Fund expenses borne by the
shareholders during the period,
November 1, 2022 through April 30, 2023
November 1, 2022 through April 30, 2023
As a shareholder of the fund, you
incur two types of costs: (1) transaction costs, including sales charges (loads) on certain purchase or redemption payments, and (2) ongoing costs, including management fees; distribution and service (12b-1) fees; and
other fund expenses. This example is intended to help you understand your ongoing costs (in dollars) of investing in the fund and to compare these costs with the ongoing costs of investing in other mutual funds.
The example is based on an
investment of $1,000 invested at the beginning of the period and held for the entire period November 1, 2022 through April 30, 2023.
Actual Expenses
The first line for each share class
in the following table provides information about actual account values and actual expenses. You may use the information in this line, together with the amount you invested, to estimate the expenses that you paid over
the period. Simply divide your account value by $1,000 (for example, an $8,600 account value divided by $1,000 = 8.6), then multiply the result by the number in the first line under the heading entitled
“Expenses Paid During Period” to estimate the expenses you paid on your account during this period.
Hypothetical Example for
Comparison Purposes
The second line for each share class
in the following table provides information about hypothetical account values and hypothetical expenses based on the fund’s actual expense ratio and an assumed rate of return of 5% per year before expenses,
which is not the fund’s actual return. The hypothetical account values and expenses may not be used to estimate the actual ending account balance or expenses you paid for the period. You may use this information
to compare the ongoing costs of investing in the fund and other funds. To do so, compare this 5% hypothetical example with the 5% hypothetical examples that appear in the shareholder reports of the other funds.
Please note that the expenses shown
in the table are meant to highlight your ongoing costs only and do not reflect any transactional costs, such as sales charges (loads). Therefore, the second line for each share class in the table is useful in
comparing ongoing costs only, and will not help you determine the relative total costs of owning different funds. In addition, if these transactional costs were included, your costs would have been higher.
4
Expense Table - continued
| Share Class | Annualized Expense Ratio | Beginning Account Value 11/01/22 | Ending Account Value 4/30/23 | Expenses Paid During Period (p) 11/01/22-4/30/23 | |
| A | Actual | 1.09% | $1,000.00 | $1,104.31 | $5.69 |
| Hypothetical (h) | 1.09% | $1,000.00 | $1,019.39 | $5.46 | |
| B | Actual | 1.84% | $1,000.00 | $1,100.64 | $9.58 |
| Hypothetical (h) | 1.84% | $1,000.00 | $1,015.67 | $9.20 | |
| C | Actual | 1.84% | $1,000.00 | $1,099.87 | $9.58 |
| Hypothetical (h) | 1.84% | $1,000.00 | $1,015.67 | $9.20 | |
| I | Actual | 0.84% | $1,000.00 | $1,105.80 | $4.39 |
| Hypothetical (h) | 0.84% | $1,000.00 | $1,020.63 | $4.21 | |
| R1 | Actual | 1.84% | $1,000.00 | $1,100.65 | $9.58 |
| Hypothetical (h) | 1.84% | $1,000.00 | $1,015.67 | $9.20 | |
| R2 | Actual | 1.34% | $1,000.00 | $1,103.26 | $6.99 |
| Hypothetical (h) | 1.34% | $1,000.00 | $1,018.15 | $6.71 | |
| R3 | Actual | 1.09% | $1,000.00 | $1,104.06 | $5.69 |
| Hypothetical (h) | 1.09% | $1,000.00 | $1,019.39 | $5.46 | |
| R4 | Actual | 0.84% | $1,000.00 | $1,106.17 | $4.39 |
| Hypothetical (h) | 0.84% | $1,000.00 | $1,020.63 | $4.21 | |
| R6 | Actual | 0.76% | $1,000.00 | $1,106.24 | $3.97 |
| Hypothetical (h) | 0.76% | $1,000.00 | $1,021.03 | $3.81 |
| (h) | 5% class return per year before expenses. |
| (p) | “Expenses Paid During Period” are equal to each class’s annualized expense ratio, as shown above, multiplied by the average account value over the period, multiplied by 181/365 (to reflect the one-half year period). Expenses paid do not include any applicable sales charges (loads). If these transaction costs had been included, your costs would have been higher. |
5
Portfolio of Investments
4/30/23 (unaudited)
The Portfolio of Investments is a
complete list of all securities owned by your fund. It is categorized by broad-based asset classes.
| Issuer | Shares/Par | Value ($) | ||
| Common Stocks – 58.8% | ||||
| Aerospace & Defense – 1.3% | ||||
| General Dynamics Corp. | 34,430 | $7,517,446 | ||
| Honeywell International, Inc. | 22,245 | 4,445,441 | ||
| L3Harris Technologies, Inc. | 18,409 | 3,592,516 | ||
| Northrop Grumman Corp. | 6,067 | 2,798,525 | ||
| $18,353,928 | ||||
| Alcoholic Beverages – 1.2% | ||||
| Diageo PLC | 137,214 | $6,268,264 | ||
| Heineken N.V. | 39,854 | 4,574,486 | ||
| Kirin Holdings Co. Ltd. | 150,500 | 2,446,882 | ||
| Pernod Ricard S.A. | 17,395 | 4,018,253 | ||
| $17,307,885 | ||||
| Apparel Manufacturers – 0.6% | ||||
| Compagnie Financiere Richemont S.A. | 49,076 | $8,109,462 | ||
| Automotive – 1.3% | ||||
| Aptiv PLC (a) | 52,059 | $5,354,789 | ||
| Bridgestone Corp. | 20,600 | 826,429 | ||
| Lear Corp. | 26,390 | 3,368,947 | ||
| LKQ Corp. | 113,219 | 6,536,133 | ||
| Stellantis N.V. | 98,582 | 1,629,412 | ||
| $17,715,710 | ||||
| Biotechnology – 0.2% | ||||
| Biogen, Inc. (a) | 2,696 | $820,204 | ||
| Gilead Sciences, Inc. | 24,486 | 2,012,994 | ||
| $2,833,198 | ||||
| Broadcasting – 0.7% | ||||
| Omnicom Group, Inc. | 114,049 | $10,329,418 | ||
| Brokerage & Asset Managers – 1.3% | ||||
| Cboe Global Markets, Inc. | 34,879 | $4,872,596 | ||
| Charles Schwab Corp. | 189,302 | 9,889,137 | ||
| NASDAQ, Inc. | 66,066 | 3,658,074 | ||
| $18,419,807 | ||||
| Business Services – 2.3% | ||||
| Accenture PLC, “A” | 15,840 | $4,439,794 | ||
| Amdocs Ltd. | 44,675 | 4,076,594 | ||
| CGI, Inc. (a) | 35,143 | 3,566,826 | ||
6
Portfolio of Investments (unaudited)
– continued
| Issuer | Shares/Par | Value ($) | ||
| Common Stocks – continued | ||||
| Business Services – continued | ||||
| Experian PLC | 102,063 | $3,604,322 | ||
| Fidelity National Information Services, Inc. | 48,214 | 2,831,126 | ||
| Fiserv, Inc. (a) | 41,842 | 5,109,745 | ||
| Nomura Research Institute Ltd. | 118,900 | 3,002,468 | ||
| Secom Co. Ltd. | 76,000 | 4,851,906 | ||
| $31,482,781 | ||||
| Cable TV – 1.3% | ||||
| Comcast Corp., “A” | 428,605 | $17,731,389 | ||
| Chemicals – 0.5% | ||||
| Nutrien Ltd. | 9,169 | $636,081 | ||
| PPG Industries, Inc. | 46,751 | 6,557,295 | ||
| $7,193,376 | ||||
| Computer Software – 0.7% | ||||
| Microsoft Corp. | 31,960 | $9,820,030 | ||
| Computer Software - Systems – 2.5% | ||||
| Amadeus IT Group S.A. (a) | 70,311 | $4,946,706 | ||
| Capgemini | 15,896 | 2,901,501 | ||
| Fujitsu Ltd. | 38,300 | 5,103,665 | ||
| Hitachi Ltd. | 145,700 | 8,084,497 | ||
| Hon Hai Precision Industry Co. Ltd. | 849,000 | 2,890,916 | ||
| Lenovo Group Ltd. | 1,670,000 | 1,713,254 | ||
| Samsung Electronics Co. Ltd. | 160,737 | 7,919,253 | ||
| Seagate Technology Holdings PLC | 24,104 | 1,416,592 | ||
| $34,976,384 | ||||
| Construction – 1.3% | ||||
| Anhui Conch Cement Co. Ltd. | 548,500 | $1,732,760 | ||
| Masco Corp. | 125,541 | 6,717,699 | ||
| Stanley Black & Decker, Inc. | 40,421 | 3,489,949 | ||
| Techtronic Industries Co. Ltd. | 214,000 | 2,323,010 | ||
| Vulcan Materials Co. | 19,853 | 3,476,657 | ||
| $17,740,075 | ||||
| Consumer Products – 1.3% | ||||
| Colgate-Palmolive Co. | 64,887 | $5,177,983 | ||
| Kimberly-Clark Corp. | 53,551 | 7,759,004 | ||
| Reckitt Benckiser Group PLC | 72,104 | 5,831,356 | ||
| $18,768,343 | ||||
7
Portfolio of Investments (unaudited)
– continued
| Issuer | Shares/Par | Value ($) | ||
| Common Stocks – continued | ||||
| Electrical Equipment – 1.5% | ||||
| Johnson Controls International PLC | 116,502 | $6,971,480 | ||
| Legrand S.A. | 37,447 | 3,542,835 | ||
| Schneider Electric SE | 57,243 | 10,000,874 | ||
| $20,515,189 | ||||
| Electronics – 2.4% | ||||
| Intel Corp. | 167,802 | $5,211,930 | ||
| Kyocera Corp. | 103,100 | 5,413,552 | ||
| Novatek Microelectronics Corp. | 102,000 | 1,397,244 | ||
| NXP Semiconductors N.V. | 39,100 | 6,402,234 | ||
| Taiwan Semiconductor Manufacturing Co. Ltd., ADR | 47,573 | 4,010,404 | ||
| Texas Instruments, Inc. | 61,489 | 10,280,961 | ||
| $32,716,325 | ||||
| Energy - Independent – 1.7% | ||||
| ConocoPhillips | 93,084 | $9,577,413 | ||
| Hess Corp. | 50,617 | 7,342,502 | ||
| Phillips 66 | 23,859 | 2,362,041 | ||
| Pioneer Natural Resources Co. | 16,490 | 3,587,399 | ||
| Valero Energy Corp. | 12,050 | 1,381,774 | ||
| $24,251,129 | ||||
| Energy - Integrated – 2.2% | ||||
| China Petroleum & Chemical Corp. | 9,072,000 | $5,953,699 | ||
| Eni S.p.A. | 623,538 | 9,444,554 | ||
| Exxon Mobil Corp. | 28,880 | 3,417,659 | ||
| LUKOIL PJSC (a)(u) | 8,038 | 0 | ||
| Petroleo Brasileiro S.A., ADR | 154,855 | 1,469,574 | ||
| Suncor Energy, Inc. | 176,756 | 5,534,184 | ||
| TotalEnergies SE | 66,214 | 4,221,057 | ||
| $30,040,727 | ||||
| Engineering - Construction – 0.1% | ||||
| ACS Actividades de Construcción y Servicios S.A. | 22,060 | $759,591 | ||
| Food & Beverages – 1.9% | ||||
| Archer Daniels Midland Co. | 32,500 | $2,537,600 | ||
| Coca-Cola FEMSA S.A.B. de C.V. | 15,782 | 1,332,317 | ||
| Danone S.A. | 88,974 | 5,887,522 | ||
| General Mills, Inc. | 104,173 | 9,232,853 | ||
| J.M. Smucker Co. | 26,523 | 4,095,416 | ||
| Nestle S.A. | 21,062 | 2,700,378 | ||
| $25,786,086 | ||||
8
Portfolio of Investments (unaudited)
– continued
| Issuer | Shares/Par | Value ($) | ||
| Common Stocks – continued | ||||
| Food & Drug Stores – 1.0% | ||||
| Albertsons Cos., Inc., “A” | 72,671 | $1,518,824 | ||
| BIM Birlesik Magazalar A.S. | 378,468 | 3,039,185 | ||
| Tesco PLC | 2,815,165 | 9,956,470 | ||
| $14,514,479 | ||||
| Health Maintenance Organizations – 0.7% | ||||
| Cigna Group | 36,962 | $9,362,105 | ||
| Insurance – 3.5% | ||||
| Aon PLC | 43,312 | $14,084,196 | ||
| Chubb Ltd. | 29,685 | 5,983,309 | ||
| Equitable Holdings, Inc. | 138,901 | 3,610,037 | ||
| Hartford Financial Services Group, Inc. | 23,826 | 1,691,408 | ||
| Manulife Financial Corp. | 348,533 | 6,881,395 | ||
| MetLife, Inc. | 48,868 | 2,997,075 | ||
| Samsung Fire & Marine Insurance Co. Ltd. | 15,418 | 2,598,094 | ||
| Travelers Cos., Inc. | 11,588 | 2,099,050 | ||
| Willis Towers Watson PLC | 28,514 | 6,603,842 | ||
| Zurich Insurance Group AG | 5,591 | 2,704,267 | ||
| $49,252,673 | ||||
| Internet – 0.6% | ||||
| Alphabet, Inc., “A” (a) | 71,963 | $7,724,508 | ||
| Leisure & Toys – 0.1% | ||||
| Nintendo Co. Ltd. | 25,900 | $1,092,353 | ||
| Machinery & Tools – 2.1% | ||||
| Eaton Corp. PLC | 50,143 | $8,379,898 | ||
| GEA Group AG | 22,952 | 1,075,871 | ||
| Ingersoll Rand, Inc. | 99,722 | 5,686,149 | ||
| Kubota Corp. | 235,300 | 3,555,461 | ||
| Regal Rexnord Corp. | 38,027 | 4,949,594 | ||
| Timken Co. | 8,781 | 674,820 | ||
| Volvo Group | 206,646 | 4,274,600 | ||
| $28,596,393 | ||||
| Major Banks – 6.4% | ||||
| ABN AMRO Group N.V., GDR (l) | 208,404 | $3,338,220 | ||
| Bank of America Corp. | 318,587 | 9,328,227 | ||
| BNP Paribas | 238,550 | 15,444,233 | ||
| DBS Group Holdings Ltd. | 335,000 | 8,308,544 | ||
| Erste Group Bank AG | 28,187 | 1,028,066 | ||
| Goldman Sachs Group, Inc. | 34,107 | 11,713,708 | ||
| JPMorgan Chase & Co. | 79,170 | 10,944,461 | ||
9
Portfolio of Investments (unaudited)
– continued
| Issuer | Shares/Par | Value ($) | ||
| Common Stocks – continued | ||||
| Major Banks – continued | ||||
| Mitsubishi UFJ Financial Group, Inc. | 938,100 | $5,917,645 | ||
| NatWest Group PLC | 2,507,739 | 8,304,790 | ||
| Regions Financial Corp. | 112,180 | 2,048,407 | ||
| State Street Corp. | 14,294 | 1,032,884 | ||
| UBS AG | 594,471 | 12,082,431 | ||
| $89,491,616 | ||||
| Medical & Health Technology & Services – 0.5% | ||||
| ICON PLC (a) | 14,014 | $2,700,358 | ||
| McKesson Corp. | 12,483 | 4,546,808 | ||
| $7,247,166 | ||||
| Medical Equipment – 1.3% | ||||
| Becton, Dickinson and Co. | 20,447 | $5,404,347 | ||
| Boston Scientific Corp. (a) | 98,950 | 5,157,274 | ||
| Medtronic PLC | 80,857 | 7,353,944 | ||
| $17,915,565 | ||||
| Metals & Mining – 1.5% | ||||
| Adaro Energy Indonesia TBK PT | 1,812,000 | $386,610 | ||
| Fortescue Metals Group Ltd. | 27,952 | 386,416 | ||
| Glencore PLC | 1,109,618 | 6,540,263 | ||
| Rio Tinto PLC | 156,864 | 9,953,540 | ||
| United States Steel Corp. | 77,140 | 1,764,963 | ||
| Vale S.A. | 166,900 | 2,422,623 | ||
| $21,454,415 | ||||
| Other Banks & Diversified Financials – 1.1% | ||||
| China Construction Bank Corp. | 2,277,000 | $1,527,634 | ||
| Julius Baer Group Ltd. | 68,045 | 4,875,651 | ||
| KB Financial Group, Inc. | 18,718 | 694,542 | ||
| Northern Trust Corp. | 41,901 | 3,274,982 | ||
| Sberbank of Russia PJSC (a)(u) | 780,516 | 0 | ||
| SLM Corp. | 118,445 | 1,779,044 | ||
| Truist Financial Corp. | 114,911 | 3,743,800 | ||
| $15,895,653 | ||||
| Pharmaceuticals – 6.0% | ||||
| Bayer AG | 155,685 | $10,251,786 | ||
| Johnson & Johnson | 118,794 | 19,446,578 | ||
| Merck & Co., Inc. | 149,266 | 17,235,745 | ||
| Novartis AG | 17,970 | 1,839,241 | ||
| Organon & Co. | 155,551 | 3,831,221 | ||
| Pfizer, Inc. | 159,378 | 6,198,210 | ||
10
Portfolio of Investments (unaudited)
– continued
| Issuer | Shares/Par | Value ($) | ||
| Common Stocks – continued | ||||
| Pharmaceuticals – continued | ||||
| Roche Holding AG | 62,977 | $19,752,310 | ||
| Sanofi | 37,345 | 4,115,046 | ||
| $82,670,137 | ||||
| Printing & Publishing – 0.6% | ||||
| RELX PLC | 94,490 | $3,142,178 | ||
| Wolters Kluwer N.V. | 37,257 | 4,937,386 | ||
| $8,079,564 | ||||
| Railroad & Shipping – 0.7% | ||||
| A.P. Moller-Maersk A/S | 255 | $459,712 | ||
| Canadian Pacific Kansas City Ltd. | 37,762 | 2,976,700 | ||
| Orient Overseas International Ltd. | 26,000 | 525,985 | ||
| Union Pacific Corp. | 26,255 | 5,138,104 | ||
| $9,100,501 | ||||
| Real Estate – 0.4% | ||||
| National Retail Properties, Inc., REIT | 29,402 | $1,278,987 | ||
| Simon Property Group, Inc., REIT | 24,480 | 2,774,073 | ||
| W.P. Carey, Inc., REIT | 18,269 | 1,355,560 | ||
| $5,408,620 | ||||
| Restaurants – 0.3% | ||||
| Darden Restaurants, Inc. | 6,619 | $1,005,625 | ||
| Sodexo | 12,243 | 1,311,283 | ||
| Texas Roadhouse, Inc. | 11,191 | 1,237,948 | ||
| $3,554,856 | ||||
| Specialty Chemicals – 0.5% | ||||
| Akzo Nobel N.V. | 42,641 | $3,547,565 | ||
| Axalta Coating Systems Ltd. (a) | 95,383 | 3,011,241 | ||
| Chemours Co. | 25,192 | 732,331 | ||
| $7,291,137 | ||||
| Telecommunications - Wireless – 1.4% | ||||
| KDDI Corp. | 352,900 | $11,020,278 | ||
| PT Telekom Indonesia | 4,019,600 | 1,164,506 | ||
| T-Mobile US, Inc. (a) | 47,099 | 6,777,546 | ||
| $18,962,330 | ||||
11
Portfolio of Investments (unaudited)
– continued
| Issuer | Shares/Par | Value ($) | ||
| Common Stocks – continued | ||||
| Telephone Services – 0.5% | ||||
| France Telecom | 153,174 | $1,994,333 | ||
| Hellenic Telecommunications Organization S.A. | 132,021 | 1,927,530 | ||
| Quebecor, Inc., “B” | 102,436 | 2,643,973 | ||
| $6,565,836 | ||||
| Tobacco – 1.0% | ||||
| British American Tobacco PLC | 120,231 | $4,441,710 | ||
| Japan Tobacco, Inc. | 119,900 | 2,579,803 | ||
| Philip Morris International, Inc. | 74,844 | 7,482,155 | ||
| $14,503,668 | ||||
| Utilities - Electric Power – 2.3% | ||||
| Duke Energy Corp. | 29,003 | $2,867,817 | ||
| E.ON SE | 669,242 | 8,852,940 | ||
| Edison International | 66,660 | 4,906,176 | ||
| Iberdrola S.A. | 435,682 | 5,652,367 | ||
| National Grid PLC | 298,880 | 4,287,197 | ||
| PG&E Corp. (a) | 250,693 | 4,289,357 | ||
| Vistra Corp. | 29,333 | 699,885 | ||
| $31,555,739 | ||||
| Total Common Stocks (Identified Cost, $576,422,073) | $815,090,147 | |||
| Bonds – 38.9% | ||||
| Aerospace & Defense – 0.1% | ||||
| Boeing Co., 5.805%, 5/01/2050 | $ | 582,000 | $578,884 | |
| Raytheon Technologies Corp., 2.82%, 9/01/2051 | 1,906,000 | 1,311,631 | ||
| $1,890,515 | ||||
| Alcoholic Beverages – 0.1% | ||||
| Pernod Ricard S.A., 3.75%, 11/02/2032 | EUR | 700,000 | $783,718 | |
| Apparel Manufacturers – 0.0% | ||||
| Tapestry, Inc., 3.05%, 3/15/2032 | $ | 703,000 | $582,173 | |
| Asset-Backed & Securitized – 3.2% | ||||
| 3650R Commercial Mortgage Trust, 2021-PF1, “XA”, 1.137%, 11/15/2054 (i) | $ | 7,225,269 | $392,361 | |
| AA Bond Co. Ltd., 3.25%, 7/31/2028 | GBP | 1,000,000 | 993,368 | |
| ACREC 2021-FL1 Ltd., “C”, FLR, 7.109% (LIBOR - 1mo. + 2.15%), 10/16/2036 (n) | $ | 1,125,500 | 1,038,383 | |
| ACRES 2021-FL2 Issuer Ltd., “AS”, FLR, 6.698% (LIBOR - 1mo. + 1.75%), 1/15/2037 (n) | 808,500 | 783,611 | ||
12
Portfolio of Investments (unaudited)
– continued
| Issuer | Shares/Par | Value ($) | ||
| Bonds – continued | ||||
| Asset-Backed & Securitized – continued | ||||
| ACRES 2021-FL2 Issuer Ltd., “B”, FLR, 7.197% (LIBOR - 1mo. + 2.25%), 1/15/2037 (n) | $ | 1,320,000 | $1,273,117 | |
| Arbor Realty Trust, Inc., CLO, 2019-FL2, “AS”, FLR, 6.454% (LIBOR - 1mo. + 1.45%), 9/15/2034 (n) | 501,908 | 498,173 | ||
| Arbor Realty Trust, Inc., CLO, 2021-FL1, “B”, FLR, 6.437% (LIBOR - 1mo. + 1.5%), 12/15/2035 (n) | 423,000 | 405,064 | ||
| Arbor Realty Trust, Inc., CLO, 2021-FL2, “B”, FLR, 6.548% (LIBOR - 1mo. + 1.6%), 5/15/2036 (n) | 289,000 | 272,500 | ||
| Arbor Realty Trust, Inc., CLO, 2021-FL2, “C”, FLR, 6.897% (LIBOR - 1mo. + 1.95%), 5/15/2036 (n) | 857,500 | 801,853 | ||
| Arbor Realty Trust, Inc., CLO, 2022-FL1, “B”, FLR, 6.85% (SOFR - 30 day + 2.1%), 1/15/2037 (n) | 1,712,000 | 1,636,574 | ||
| Arbor Realty Trust, Inc., CLO, 2022-FL1, “C”, FLR, 7.05% (SOFR - 30 day + 2.3%), 1/15/2037 (n) | 1,648,500 | 1,528,607 | ||
| AREIT 2022-CRE6 Trust, “B”, FLR, 6.608% (SOFR - 30 day + 1.85%), 1/16/2037 (n) | 620,000 | 587,679 | ||
| AREIT 2022-CRE6 Trust, “C”, FLR, 6.908% (SOFR - 30 day + 2.15%), 1/16/2037 (n) | 312,000 | 290,358 | ||
| BBCMS Mortgage Trust, 2020-C7, “XA”, 1.734%, 4/15/2053 (i) | 1,432,370 | 102,023 | ||
| BBCMS Mortgage Trust, 2021-C10, “XA”, 1.417%, 7/15/2054 (i) | 5,838,498 | 397,220 | ||
| BBCMS Mortgage Trust, 2021-C9, “XA”, 1.744%, 2/15/2054 (i) | 5,359,629 | 479,149 | ||
| BBCMS Mortgage Trust, 2022-C18, “AS”, 6.347%, 12/15/2055 | 584,994 | 621,934 | ||
| Benchmark 2021-B24 Mortgage Trust, “XA”, 1.268%, 3/15/2054 (i) | 4,606,565 | 280,747 | ||
| Benchmark 2021-B26 Mortgage Trust, “XA”, 0.997%, 6/15/2054 (i) | 10,651,990 | 520,543 | ||
| Benchmark 2021-B27 Mortgage Trust, “XA”, 1.381%, 7/15/2054 (i) | 13,960,193 | 1,000,386 | ||
| Benchmark 2021-B28 Mortgage Trust, “XA”, 1.392%, 8/15/2054 (i) | 13,176,788 | 954,278 | ||
| Benchmark 2022-B37 Mortgage Trust, “AS”, 5.943%, 11/15/2055 | 226,000 | 231,906 | ||
| Brazos Securitization LLC, 5.413%, 9/01/2052 (n) | 522,000 | 549,027 | ||
| BSPRT 2021-FL7 Issuer Ltd., “B”, FLR, 6.998% (LIBOR - 1mo. + 2.05%), 12/15/2038 (n) | 388,000 | 376,975 | ||
| BSPRT 2021-FL7 Issuer Ltd., “C”, FLR, 7.247% (LIBOR - 1mo. + 2.3%), 12/15/2038 (n) | 352,000 | 329,138 | ||
| Business Jet Securities LLC, 2020-1A, “A”, 2.981%, 11/15/2035 (n) | 193,581 | 183,061 | ||
13
Portfolio of Investments (unaudited)
– continued
| Issuer | Shares/Par | Value ($) | ||
| Bonds – continued | ||||
| Asset-Backed & Securitized – continued | ||||
| Business Jet Securities LLC, 2021-1A, “A”, 2.162%, 4/15/2036 (n) | $ | 308,729 | $288,674 | |
| BXMT 2021-FL4 Ltd., “AS”, FLR, 6.247% (LIBOR - 1mo. + 1.3%), 5/15/2038 (n) | 1,400,000 | 1,318,141 | ||
| BXMT 2021-FL4 Ltd., “B”, FLR, 6.498% (LIBOR - 1mo. + 1.55%), 5/15/2038 (n) | 1,996,500 | 1,863,570 | ||
| Capital Automotive, 2020-1A, “A4”, REIT, 3.19%, 2/15/2050 (n) | 519,188 | 488,680 | ||
| CarMax Auto Owner Trust, 2022-2, “A4”, 3.62%, 9/15/2027 | 795,000 | 774,106 | ||
| CF Hippolyta Issuer LLC, 2020-1, “A1”, 1.69%, 7/15/2060 (n) | 367,188 | 333,183 | ||
| Chesapeake Funding II LLC, 2023-1A, “A1”, 5.65%, 5/15/2035 (n) | 647,000 | 647,889 | ||
| CNH Equipment Trust 2023-A, “A2”, 5.34%, 9/15/2026 | 325,248 | 325,197 | ||
| Commercial Mortgage Pass-Through Certificates, 2021-BN32, “XA”, 0.887%, 4/15/2054 (i) | 6,780,027 | 289,378 | ||
| Commercial Mortgage Pass-Through Certificates, 2021-BN34, “XA”, 1.085%, 6/15/2063 (i) | 6,601,908 | 364,423 | ||
| Commercial Mortgage Pass-Through Certificates, 2021-BN35, “XA”, 1.15%, 6/15/2064 (i) | 6,182,548 | 363,714 | ||
| Commercial Mortgage Pass-Through Certificates, 2022-BNK41, “AS”, 3.916%, 4/15/2065 | 1,304,000 | 1,146,039 | ||
| Credit Acceptance Auto Loan Trust, 2021-3A, “A”, 1%, 5/15/2030 (n) | 1,579,000 | 1,530,611 | ||
| DT Auto Owner Trust, 2023-1A, “A”, 5.48%, 4/15/2027 (n) | 627,741 | 626,032 | ||
| Fortress CBO Investments Ltd., 2022-FL3, “AS”, FLR, 7.056% (SOFR - 30 day + 2.25%), 2/23/2039 (n) | 592,000 | 571,046 | ||
| FS Rialto 2021-FL2 Issuer Ltd., “AS”, FLR, 6.498% (LIBOR - 1mo. + 1.6%), 5/16/2038 (n) | 1,454,000 | 1,358,174 | ||
| LoanCore 2021-CRE5 Ltd., “AS”, FLR, 6.698% (LIBOR - 1mo. + 1.75%), 7/15/2036 (n) | 750,000 | 708,949 | ||
| LoanCore 2021-CRE5 Ltd., “B”, FLR, 6.948% (LIBOR - 1mo. + 2%), 7/15/2036 (n) | 782,000 | 733,286 | ||
| MF1 2021-FL5 Ltd., “AS”, FLR, 6.204% (LIBOR - 1mo. + 1.2%), 7/15/2036 (n) | 1,360,000 | 1,314,794 | ||
| MF1 2021-FL5 Ltd., “B”, FLR, 6.454% (LIBOR - 1mo. + 1.45%), 7/15/2036 (n) | 1,977,500 | 1,907,484 | ||
| MF1 2021-FL5 Ltd., “C”, FLR, 6.704% (LIBOR - 1mo. + 1.7%), 7/15/2036 (n) | 225,000 | 210,288 | ||
14
Portfolio of Investments (unaudited)
– continued
| Issuer | Shares/Par | Value ($) | ||
| Bonds – continued | ||||
| Asset-Backed & Securitized – continued | ||||
| MF1 2021-FL6 Ltd., “AS”, FLR, 6.409% (LIBOR - 1mo. + 1.45%), 7/16/2036 (n) | $ | 2,200,000 | $2,117,897 | |
| MF1 2021-FL6 Ltd., “B”, FLR, 6.609% (LIBOR - 1mo. + 1.65%), 7/16/2036 (n) | 1,400,000 | 1,329,449 | ||
| MF1 2022-FL8 Ltd., “A”, FLR, 6.132% (SOFR - 1mo. + 1.35%), 2/19/2037 (n) | 500,000 | 487,000 | ||
| MF1 2022-FL8 Ltd., “B”, FLR, 6.732% (SOFR - 30 day + 1.95%), 2/19/2037 (n) | 604,312 | 565,505 | ||
| Morgan Stanley Capital I Trust, 2021-L5, “XA”, 1.417%, 5/15/2054 (i) | 4,665,637 | 316,594 | ||
| Morgan Stanley Capital I Trust, 2021-L6, “XA”, 1.34%, 6/15/2054 (i) | 9,692,125 | 602,351 | ||
| Navistar Financial Dealer Note Master Owner Trust, 2022-1, “A”, FLR, 6.056% (SOFR - 30 day + 1.25%), 5/25/2027 (n) | 525,000 | 525,464 | ||
| RAC Bond Co. PLC, 4.87%, 5/06/2026 | GBP | 530,000 | 611,395 | |
| Starwood Commercial Mortgage, 2021-FL2, “A”, FLR, 6.159% (LIBOR - 1mo. + 1.2%), 4/18/2038 (n) | $ | 1,400,000 | 1,367,105 | |
| Starwood Commercial Mortgage, 2021-FL2, “AS”, FLR, 6.409% (LIBOR - 1mo. + 1.45%), 4/18/2038 (n) | 1,400,000 | 1,321,882 | ||
| TPG Real Estate Finance, 2021-FL4, “AS”, FLR, 6.347% (LIBOR - 1mo. + 1.4%), 3/15/2038 (n) | 700,000 | 681,623 | ||
| Wells Fargo Commercial Mortgage Trust, 2021-C60, “XA”, 1.658%, 8/15/2054 (i) | 6,883,314 | 569,554 | ||
| Westlake Automobile Receivables Trust, 2023-1A, “A2B”, FLR, 5.6% (SOFR - 1mo. + 0.85%), 6/15/2026 (n) | 269,000 | 268,810 | ||
| $44,456,322 | ||||
| Automotive – 0.0% | ||||
| Hyundai Capital America, 6.375%, 4/08/2030 (n) | $ | 366,000 | $385,020 | |
| Broadcasting – 0.3% | ||||
| Discovery, Inc., 4.125%, 5/15/2029 | $ | 718,000 | $664,308 | |
| Prosus N.V., 3.68%, 1/21/2030 (n) | 587,000 | 499,918 | ||
| Ubisoft Entertainment S.A., 0.878%, 11/24/2027 | EUR | 1,900,000 | 1,512,843 | |
| Walt Disney Co., 3.5%, 5/13/2040 | $ | 658,000 | 559,465 | |
| Warnermedia Holdings, Inc., 4.279%, 3/15/2032 | 1,343,000 | 1,192,799 | ||
| $4,429,333 | ||||
| Brokerage & Asset Managers – 0.1% | ||||
| Ameriprise Financial, Inc., 4.5%, 5/13/2032 | $ | 292,000 | $283,379 | |
| Low Income Investment Fund, 3.386%, 7/01/2026 | 285,000 | 271,599 | ||
| Low Income Investment Fund, 3.711%, 7/01/2029 | 760,000 | 674,680 | ||
15
Portfolio of Investments (unaudited)
– continued
| Issuer | Shares/Par | Value ($) | ||
| Bonds – continued | ||||
| Brokerage & Asset Managers – continued | ||||
| LPL Holdings, Inc., 4%, 3/15/2029 (n) | $ | 662,000 | $594,592 | |
| $1,824,250 | ||||
| Building – 0.1% | ||||
| Holcim Sterling Finance (Netherlands) B.V., 2.25%, 4/04/2034 | GBP | 850,000 | $776,271 | |
| Vulcan Materials Co., 3.5%, 6/01/2030 | $ | 908,000 | 833,359 | |
| $1,609,630 | ||||
| Business Services – 0.2% | ||||
| Euronet Worldwide, Inc., 1.375%, 5/22/2026 | EUR | 825,000 | $816,821 | |
| Fiserv, Inc., 4.4%, 7/01/2049 | $ | 281,000 | 239,154 | |
| Mastercard, Inc., 3.85%, 3/26/2050 | 542,000 | 480,120 | ||
| Verisk Analytics, Inc., 4%, 6/15/2025 | 747,000 | 731,572 | ||
| $2,267,667 | ||||
| Cable TV – 0.2% | ||||
| Charter Communications Operating LLC/Charter Communications Operating Capital Corp., 6.384%, 10/23/2035 | $ | 482,000 | $476,467 | |
| Charter Communications Operating LLC/Charter Communications Operating Capital Corp., 4.8%, 3/01/2050 | 895,000 | 677,773 | ||
| Comcast Corp., 3.75%, 4/01/2040 | 675,000 | 582,564 | ||
| SES S.A., 3.5%, 1/14/2029 | EUR | 580,000 | 587,625 | |
| $2,324,429 | ||||
| Chemicals – 0.1% | ||||
| Alpek SAB de C.V., 3.25%, 2/25/2031 (n) | $ | 501,000 | $408,299 | |
| LYB International Finance III, LLC, 4.2%, 5/01/2050 | 306,000 | 237,273 | ||
| Nutrien Ltd., 4.9%, 3/27/2028 | 349,000 | 350,431 | ||
| Sherwin-Williams Co., 3.8%, 8/15/2049 | 305,000 | 237,213 | ||
| $1,233,216 | ||||
| Computer Software – 0.0% | ||||
| Microsoft Corp., 2.921%, 3/17/2052 | $ | 753,000 | $577,038 | |
| Computer Software - Systems – 0.1% | ||||
| Apple, Inc., 2.9%, 9/12/2027 | $ | 608,000 | $584,110 | |
| Apple, Inc., 4.5%, 2/23/2036 | 204,000 | 211,787 | ||
| $795,897 | ||||
16
Portfolio of Investments (unaudited)
– continued
| Issuer | Shares/Par | Value ($) | ||
| Bonds – continued | ||||
| Conglomerates – 0.3% | ||||
| ABB Finance B.V., 3.375%, 1/16/2031 | EUR | 320,000 | $347,852 | |
| nVent Finance S.à r.l., 5.65%, 5/15/2033 (w) | $ | 452,000 | 456,439 | |
| Regal Rexnord Corp., 6.05%, 4/15/2028 (n) | 1,007,000 | 1,016,562 | ||
| Siemens Financieringsmaatschappij N.V., 3.625%, 2/24/2043 | EUR | 600,000 | 650,479 | |
| Westinghouse Air Brake Technologies Corp., 4.95%, 9/15/2028 | $ | 1,743,000 | 1,730,232 | |
| $4,201,564 | ||||
| Consumer Products – 0.1% | ||||
| JAB Holdings B.V., 2.25%, 12/19/2039 | EUR | 1,200,000 | $936,267 | |
| Kenvue, Inc., 5.05%, 3/22/2053 (n) | $ | 931,000 | 966,491 | |
| $1,902,758 | ||||
| Consumer Services – 0.0% | ||||
| Booking Holdings, Inc., 4.75%, 11/15/2034 | EUR | 445,000 | $520,857 | |
| Electrical Equipment – 0.2% | ||||
| Arrow Electronics, Inc., 3.25%, 9/08/2024 | $ | 647,000 | $629,052 | |
| Telefonaktiebolaget LM Ericsson, 1.125%, 2/08/2027 | EUR | 840,000 | 815,522 | |
| Telefonaktiebolaget LM Ericsson, 1%, 5/26/2029 | 1,160,000 | 1,012,118 | ||
| $2,456,692 | ||||
| Electronics – 0.1% | ||||
| Broadcom, Inc., 3.137%, 11/15/2035 (n) | $ | 859,000 | $665,004 | |
| Emerging Market Quasi-Sovereign – 0.5% | ||||
| Airport Authority Hong Kong, 3.25%, 1/12/2052 (n) | $ | 817,000 | $635,668 | |
| CEZ A.S. (Czech Republic), 2.375%, 4/06/2027 | EUR | 807,000 | 826,923 | |
| Korea Hydro & Nuclear Power Co. Ltd., 4.25%, 7/27/2027 (n) | $ | 437,000 | 432,451 | |
| Magyar Export-Import Bank PLC (Republic of Hungary), 6.125%, 12/04/2027 (n)(w) | 314,000 | 315,570 | ||
| MDGH - GMTN RSC Ltd. (United Arab Emirates), 2.5%, 6/03/2031 | 675,000 | 590,069 | ||
| Ooredoo International Finance Ltd. (State of Qatar), 2.625%, 4/08/2031 | 820,000 | 716,475 | ||
| PT Freeport Indonesia, 6.2%, 4/14/2052 (n) | 609,000 | 560,687 | ||
| Qatar Petroleum, 3.125%, 7/12/2041 | 776,000 | 610,130 | ||
| REC Ltd. (Republic of India), 5.625%, 4/11/2028 (n) | 612,000 | 614,706 | ||
| SPP-Distribucia A.S. (Republic of Slovakia), 1%, 6/09/2031 | EUR | 2,200,000 | 1,684,815 | |
| $6,987,494 | ||||
17
Portfolio of Investments (unaudited)
– continued
| Issuer | Shares/Par | Value ($) | ||
| Bonds – continued | ||||
| Emerging Market Sovereign – 5.6% | ||||
| Oriental Republic of Uruguay, 4.375%, 1/23/2031 | $ | 2,450,000 | $2,470,094 | |
| Oriental Republic of Uruguay, 8.25%, 5/21/2031 | UYU | 131,835,000 | 3,051,878 | |
| People's Republic of China, 3.03%, 3/11/2026 | CNY | 125,550,000 | 18,416,972 | |
| People's Republic of China, 3.13%, 11/21/2029 | 24,230,000 | 3,587,410 | ||
| Republic of Hungary, 5.5%, 6/16/2034 (n) | $ | 640,000 | 625,956 | |
| Republic of Indonesia, 3.55%, 3/31/2032 | 990,000 | 919,374 | ||
| Republic of Korea, 2.125%, 6/10/2027 | KRW | 9,100,000,000 | 6,487,973 | |
| Republic of Korea, 2.375%, 12/10/2027 | 1,900,000,000 | 1,362,242 | ||
| Republic of Korea, 1.875%, 6/10/2029 | 25,986,970,000 | 17,845,773 | ||
| Republic of Korea, 1.375%, 6/10/2030 | 14,311,200,000 | 9,355,979 | ||
| State of Qatar, 4.4%, 4/16/2050 | $ | 299,000 | 279,939 | |
| United Mexican States, 7.5%, 6/03/2027 | MXN | 154,900,000 | 8,146,347 | |
| United Mexican States, 2.659%, 5/24/2031 | $ | 943,000 | 796,049 | |
| United Mexican States, 7.75%, 5/29/2031 | MXN | 66,000,000 | 3,443,769 | |
| United Mexican States, 6.338%, 5/04/2053 | $ | 433,000 | 446,448 | |
| United Mexican States, 3.771%, 5/24/2061 | 1,036,000 | 713,419 | ||
| $77,949,622 | ||||
| Energy - Independent – 0.2% | ||||
| Tengizchevroil Finance Co. International Ltd., 4%, 8/15/2026 (n) | $ | 3,609,000 | $3,216,521 | |
| Energy - Integrated – 0.2% | ||||
| BP Capital Markets America, Inc., 4.812%, 2/13/2033 | $ | 489,000 | $497,473 | |
| BP Capital Markets PLC, 3.625%, 6/22/2170 | EUR | 860,000 | 818,470 | |
| Eni S.p.A., 4.25%, 5/09/2029 (n) | $ | 607,000 | 584,705 | |
| Galp Energia SGPS S.A., 2%, 1/15/2026 | EUR | 600,000 | 623,406 | |
| $2,524,054 | ||||
| Engineering - Construction – 0.0% | ||||
| Arcadis N.V., 4.875%, 2/28/2028 | EUR | 477,000 | $532,426 | |
| Financial Institutions – 0.5% | ||||
| AerCap Ireland Capital DAC/AerCap Global Aviation Trust, 3.85%, 10/29/2041 | $ | 293,000 | $220,060 | |
| Avolon Holdings Funding Ltd., 4.375%, 5/01/2026 (n) | 537,000 | 507,162 | ||
| Corporacion Inmobiliaria Vesta S.A.B. de C.V., 3.625%, 5/13/2031 | 285,000 | 236,167 | ||
| CTP N.V., 0.875%, 1/20/2026 | EUR | 850,000 | 785,736 | |
| EXOR N.V., 0.875%, 1/19/2031 | 720,000 | 620,485 | ||
| Grand City Properties S.A., 1.5%, 12/09/2069 | 900,000 | 348,959 | ||
| Logicor Financing S.à r.l., 1.625%, 1/17/2030 | 890,000 | 718,650 | ||
18
Portfolio of Investments (unaudited)
– continued
| Issuer | Shares/Par | Value ($) | ||
| Bonds – continued | ||||
| Financial Institutions – continued | ||||
| Logicor Financing S.à r.l., 0.875%, 1/14/2031 | EUR | 275,000 | $199,119 | |
| P3 Group S.à r.l., 1.625%, 1/26/2029 | 680,000 | 574,515 | ||
| Samhallsbyggnadsbolaget i Norden AB, 1.75%, 1/14/2025 | 610,000 | 589,959 | ||
| SBB Treasury Oyj, 0.75%, 12/14/2028 | 590,000 | 392,490 | ||
| SBB Treasury Oyj, 1.125%, 11/26/2029 | 450,000 | 288,305 | ||
| VGP N.V., 1.5%, 4/08/2029 | 1,000,000 | 749,354 | ||
| $6,230,961 | ||||
| Food & Beverages – 0.5% | ||||
| Anheuser-Busch InBev Worldwide, Inc., 4%, 4/13/2028 | $ | 974,000 | $965,063 | |
| Anheuser-Busch InBev Worldwide, Inc., 4.375%, 4/15/2038 | 446,000 | 430,589 | ||
| Anheuser-Busch InBev Worldwide, Inc., 5.55%, 1/23/2049 | 512,000 | 553,158 | ||
| Bacardi Ltd., 5.15%, 5/15/2038 (n) | 658,000 | 635,351 | ||
| Constellation Brands, Inc., 3.15%, 8/01/2029 | 1,006,000 | 924,634 | ||
| Constellation Brands, Inc., 2.25%, 8/01/2031 | 400,000 | 332,050 | ||
| JBS USA Lux S.A./JBS USA Food Co./JBS USA Finance, Inc., 3%, 2/02/2029 (n) | 621,000 | 530,905 | ||
| Kraft Heinz Foods Co., 3.875%, 5/15/2027 | 1,121,000 | 1,094,425 | ||
| PT Indofood CBP Sukses Makmur Tbk, 3.398%, 6/09/2031 | 1,680,000 | 1,428,126 | ||
| $6,894,301 | ||||
| Gaming & Lodging – 0.1% | ||||
| Marriott International, Inc., 2.85%, 4/15/2031 | $ | 796,000 | $678,705 | |
| VICI Properties LP, REIT, 4.95%, 2/15/2030 | 1,065,000 | 1,018,023 | ||
| $1,696,728 | ||||
| Industrial – 0.0% | ||||
| Investor AB, 2.75%, 6/10/2032 | EUR | 240,000 | $249,153 | |
| Insurance – 0.4% | ||||
| Aflac, Inc., 3.6%, 4/01/2030 | $ | 213,000 | $200,803 | |
| AIA Group Ltd., 0.88%, 9/09/2033 | EUR | 843,000 | 731,190 | |
| ASR Nederland N.V., 7% to 12/07/2033, FLR (EUR Swap Rate - 5yr. + 5.3%) to 12/07/2043 | 900,000 | 1,037,860 | ||
| Assicurazioni Generali S.p.A., 5.399%, 4/20/2033 | 870,000 | 962,008 | ||
| Axa S.A., 5.5% to 7/11/2033, FLR (EURIBOR - 3mo. + 3.6%) to 7/11/2043 | 580,000 | 638,655 | ||
| Corebridge Financial, Inc., 4.35%, 4/05/2042 (n) | $ | 1,179,000 | 973,858 | |
| Equitable Holdings, Inc., 5.594%, 1/11/2033 | 882,000 | 876,786 | ||
19
Portfolio of Investments (unaudited)
– continued
| Issuer | Shares/Par | Value ($) | ||
| Bonds – continued | ||||
| Insurance – continued | ||||
| NN Group N.V., 6.367% to 11/03/2033, FLR (EURIBOR - 3mo. + 4%) to 11/03/2043 | EUR | 550,000 | $606,072 | |
| $6,027,232 | ||||
| Insurance - Health – 0.0% | ||||
| Humana, Inc., 5.5%, 3/15/2053 | $ | 193,000 | $196,852 | |
| UnitedHealth Group, Inc., 4.625%, 7/15/2035 | 184,000 | 185,715 | ||
| $382,567 | ||||
| Insurance - Property & Casualty – 0.2% | ||||
| American International Group, Inc., 5.125%, 3/27/2033 | $ | 586,000 | $588,756 | |
| Aon Corp./Aon Global Holdings PLC, 2.6%, 12/02/2031 | 244,000 | 206,234 | ||
| Aon Corp./Aon Global Holdings PLC, 3.9%, 2/28/2052 | 718,000 | 578,129 | ||
| Marsh & McLennan Cos., Inc., 2.25%, 11/15/2030 | 241,000 | 205,764 | ||
| QBE Insurance Group Ltd., 2.5% to 9/13/2028, FLR (GBP Government Yield - 5yr. + 2.061%) to 9/13/2038 | GBP | 738,000 | 732,898 | |
| $2,311,781 | ||||
| International Market Quasi-Sovereign – 0.8% | ||||
| Caixa Geral de Depositos S.A. (Republic of Portugal), 5.75% to 10/31/2027, FLR (EUR Swap Rate - 1yr. + 2.75%) to 10/31/2028 | EUR | 800,000 | $908,664 | |
| Deutsche Bahn Finance GmbH (Federal Republic of Germany), 1.375%, 4/16/2040 | 195,000 | 153,588 | ||
| Electricite de France S.A., 2.625% to 6/01/2028, FLR (EUR Swap Rate - 5yr. + 2.86%) to 6/01/2033, FLR (EUR Swap Rate - 5yr. + 3.11%) to 6/01/2048, FLR (EUR Swap Rate - 5yr. + 3.86%) to 12/29/2049 | 800,000 | 693,030 | ||
| Electricite de France S.A., 2.875% to 3/15/2027, FLR (EUR Swap Rate - 5yr. + 3.373%) to 3/15/2031, FLR (EUR Swap Rate - 5yr. + 3.623%) to 3/15/2047, FLR (EUR Swap Rate - 5yr. + 4.373%) to 3/15/2070 | 1,000,000 | 913,519 | ||
| Electricite de France S.A., 5.875% to 1/22/2029, FLR (GBP Swap Rate - 15yr. + 3.323%) to 1/22/2049, FLR (GBP Swap Rate - 15yr. + 4.073%) to 12/31/2165 | GBP | 800,000 | 828,349 | |
| EnBW International Finance B.V., 3.5%, 7/24/2028 | EUR | 570,000 | 623,832 | |
| EnBW International Finance B.V., 4.049%, 11/22/2029 | 200,000 | 224,999 | ||
| ESB Finance DAC, 1%, 7/19/2034 | 930,000 | 781,922 | ||
20
Portfolio of Investments (unaudited)
– continued
| Issuer | Shares/Par | Value ($) | ||
| Bonds – continued | ||||
| International Market Quasi-Sovereign – continued | ||||
| Kreditanstalt Fuer Wiederaufbau, 1.125%, 3/31/2037 | EUR | 1,938,000 | $1,652,107 | |
| La Banque Postale S.A., 4%, 5/03/2028 | 1,300,000 | 1,431,378 | ||
| La Banque Postale S.A., 4.375%, 1/17/2030 | 900,000 | 980,254 | ||
| Landsbankinn Bank (Republic of Iceland), 0.375%, 5/23/2025 | 623,000 | 598,647 | ||
| NBN Co. Ltd., 4.375%, 3/15/2033 | 353,000 | 397,942 | ||
| Ontario Teachers' Cadillac Fairview Properties, 2.5%, 10/15/2031 (n) | $ | 927,000 | 753,152 | |
| RTE Reseau de Transport d'Electricite, 0.75%, 1/12/2034 | EUR | 300,000 | 249,448 | |
| $11,190,831 | ||||
| International Market Sovereign – 9.4% | ||||
| Commonwealth of Australia, 2.75%, 11/21/2028 | AUD | 8,065,000 | $5,237,840 | |
| Commonwealth of Australia, 1%, 11/21/2031 | 6,124,000 | 3,357,426 | ||
| Commonwealth of Australia, 3.25%, 6/21/2039 | 2,408,000 | 1,505,039 | ||
| Federal Republic of Germany, 1.7%, 8/15/2032 | EUR | 1,220,000 | 1,279,371 | |
| Government of Bermuda, 2.375%, 8/20/2030 (n) | $ | 418,000 | 359,062 | |
| Government of Bermuda, 5%, 7/15/2032 (n) | 1,331,000 | 1,334,154 | ||
| Government of Canada, 1.25%, 3/01/2027 | CAD | 4,316,000 | 2,972,508 | |
| Government of Canada, 2%, 6/01/2032 | 2,769,000 | 1,907,449 | ||
| Government of Canada, 2%, 12/01/2051 | 1,792,000 | 1,079,022 | ||
| Government of Japan, 0.1%, 12/20/2026 | JPY | 1,912,350,000 | 14,087,203 | |
| Government of Japan, 2.1%, 12/20/2027 | 1,621,250,000 | 13,002,486 | ||
| Government of Japan, 1.7%, 6/20/2033 | 308,850,000 | 2,546,287 | ||
| Government of Japan, 2.3%, 3/20/2040 | 206,150,000 | 1,842,285 | ||
| Government of Japan, 1.7%, 6/20/2044 | 852,450,000 | 6,987,406 | ||
| Government of Japan, 0.3%, 6/20/2046 | 398,650,000 | 2,427,480 | ||
| Government of Japan, 1.6%, 12/20/2052 | 710,250,000 | 5,598,644 | ||
| Kingdom of Belgium, 3%, 6/22/2033 (n) | EUR | 3,400,000 | 3,744,415 | |
| Kingdom of Belgium, 0.4%, 6/22/2040 | 3,016,000 | 2,063,589 | ||
| Kingdom of Spain, 1.25%, 10/31/2030 | 2,908,000 | 2,803,310 | ||
| Kingdom of Spain, 2.55%, 10/31/2032 | 9,419,000 | 9,742,576 | ||
| Kingdom of Spain, 3.15%, 4/30/2033 | 6,290,000 | 6,802,354 | ||
| Kingdom of Spain, 3.9%, 7/30/2039 (n) | 3,037,000 | 3,401,848 | ||
| Kingdom of Spain, 1%, 10/31/2050 | 4,760,000 | 2,760,603 | ||
| Kingdom of Sweden, 1.75%, 11/11/2033 | SEK | 79,675,000 | 7,372,873 | |
| Republic of Finland, 3%, 9/15/2033 | EUR | 1,493,000 | 1,647,078 | |
| Republic of Italy, 0.5%, 7/15/2028 | 14,259,000 | 13,402,518 | ||
| United Kingdom Treasury, 1.25%, 7/22/2027 | GBP | 5,898,000 | 6,717,986 | |
| United Kingdom Treasury, 1.25%, 10/22/2041 | 3,359,000 | 2,693,483 | ||
21
Portfolio of Investments (unaudited)
– continued
| Issuer | Shares/Par | Value ($) | ||
| Bonds – continued | ||||
| International Market Sovereign – continued | ||||
| United Kingdom Treasury, 1.25%, 7/31/2051 | GBP | 2,927,991 | $1,957,187 | |
| $130,633,482 | ||||
| Local Authorities – 0.2% | ||||
| City of Oslo, 2.17%, 5/18/2029 | NOK | 15,000,000 | $1,273,917 | |
| Province of Alberta, 4.5%, 12/01/2040 | CAD | 710,000 | 554,165 | |
| Province of British Columbia, 2.95%, 6/18/2050 | 600,000 | 368,556 | ||
| $2,196,638 | ||||
| Machinery & Tools – 0.0% | ||||
| CNH Industrial Capital LLC, 1.875%, 1/15/2026 | $ | 621,000 | $575,966 | |
| Major Banks – 2.3% | ||||
| Australia and New Zealand Banking Group Ltd., 2.57% to 11/25/2030, FLR (CMT - 5yr. + 1.7%) to 11/25/2035 (n) | $ | 1,034,000 | $807,728 | |
| Bank of America Corp., 5.202% to 4/25/2033, FLR (SOFR - 1 day + 1.63%) to 4/25/2029 | 922,000 | 928,129 | ||
| Bank of America Corp., 0.694%, 3/22/2031 | EUR | 950,000 | 828,056 | |
| Bank of America Corp., 2.687% to 4/22/2031, FLR (SOFR - 1 day + 1.32%) to 4/22/2032 | $ | 1,617,000 | 1,351,210 | |
| Barclays Bank PLC, 8.407% to 11/14/2027, FLR (GBP Swap Rate - 5yr. + 4.75%) to 11/14/2032 | GBP | 300,000 | 391,152 | |
| Barclays Bank PLC, 5.235%, 8/14/2171 | $ | 910,000 | 809,900 | |
| BNP Paribas S.A., 4.25% to 4/13/2030, FLR (EURIBOR - 3mo. + 1.37%) to 4/13/2031 | EUR | 700,000 | 766,992 | |
| BNP Paribas S.A., FLR, 5.284% (LIBOR - 6mo. + 0.075%), 3/23/2172 | $ | 720,000 | 604,843 | |
| Commonwealth Bank of Australia, 2.688%, 3/11/2031 (n) | 1,471,000 | 1,170,641 | ||
| Credit Agricole S.A., 4.75%, 3/23/2171 (n) | 268,000 | 206,092 | ||
| Credit Suisse AG (London), 2.125%, 5/31/2024 | EUR | 730,000 | 778,555 | |
| Credit Suisse AG (London), 5.5%, 8/20/2026 | 460,000 | 516,576 | ||
| Credit Suisse Group AG, 7.75% to 3/01/2028, FLR (EUR ICE Swap Rate - 1yr. + 4.95%) to 3/01/2029 | 790,000 | 948,846 | ||
| Goldman Sachs Group, Inc., 2.383% to 7/21/2031, FLR (SOFR - 1 day + 1.248%) to 7/21/2032 | $ | 940,000 | 767,893 | |
| Goldman Sachs Group, Inc., 3.436% to 2/24/2042, FLR (SOFR - 1 day + 1.632%) to 2/24/2043 | 362,000 | 279,398 | ||
| HSBC Bank PLC, 5.46%, 3/18/2171 | 310,000 | 306,023 | ||
| HSBC Bank PLC, 5.251%, 6/11/2171 | 150,000 | 148,125 | ||
| HSBC Bank PLC, 5.401%, 12/19/2171 | 410,000 | 404,741 | ||
| HSBC Holdings PLC, 2.099% to 6/04/2025, FLR (SOFR - 1 day + 1.929%) to 6/04/2026 | 1,029,000 | 958,142 | ||
22
Portfolio of Investments (unaudited)
– continued
| Issuer | Shares/Par | Value ($) | ||
| Bonds – continued | ||||
| Major Banks – continued | ||||
| HSBC Holdings PLC, 4.375%, 11/23/2026 | $ | 510,000 | $493,855 | |
| HSBC Holdings PLC, 4% to 9/09/2026, FLR (CMT - 1yr. + 3.222%) to 9/09/2170 | 702,000 | 589,680 | ||
| ING Groep N.V., 1%, 11/16/2032 | EUR | 800,000 | 728,902 | |
| ING Groep N.V., 6.25%, 5/20/2033 | GBP | 800,000 | 982,310 | |
| JPMorgan Chase & Co., 1.47% to 9/22/2026, FLR (SOFR - 1 day + 0.765%) to 9/22/2027 | $ | 581,000 | 517,354 | |
| JPMorgan Chase & Co., 1.953% to 2/04/2031, FLR (SOFR - 1 day + 1.065%) to 2/04/2032 | 732,000 | 590,033 | ||
| JPMorgan Chase & Co., 3.109% to 4/22/2050, FLR (SOFR + 2.44%) to 4/22/2051 | 677,000 | 481,325 | ||
| mBank S.A., 0.966% to 9/21/2026, FLR (EURIBOR - 3mo. + 1.25%) to 9/21/2027 | EUR | 1,000,000 | 851,284 | |
| Mitsubishi UFJ Financial Group, Inc., 1.412%, 7/17/2025 | $ | 2,681,000 | 2,465,890 | |
| Mitsubishi UFJ Financial Group, Inc., 2.494% to 10/13/2031, FLR (CMT - 1yr. + 0.97%) to 10/13/2032 | 484,000 | 394,720 | ||
| Morgan Stanley, 3.125%, 7/27/2026 | 534,000 | 507,699 | ||
| Morgan Stanley, 1.593% to 5/04/2026, FLR (SOFR - 1 day + 0.879%) to 5/04/2027 | 1,063,000 | 956,067 | ||
| Morgan Stanley, 3.622% to 4/01/2030, FLR (SOFR - 1 day + 3.12%) to 4/01/2031 | 423,000 | 386,904 | ||
| Nationwide Building Society, 6.178% to 12/07/2026, FLR (SONIA + 2.213%) to 12/07/2027 | GBP | 210,000 | 267,731 | |
| NatWest Group PLC, 5.763% to 2/28/2029, FLR (EUR Swap Rate - 5yr. + 2.6%) to 2/28/2034 | EUR | 490,000 | 543,419 | |
| NatWest Group PLC, 4.5%, 3/31/2171 | GBP | 572,000 | 535,401 | |
| Société Générale S.A., 4.25%, 12/06/2030 | EUR | 600,000 | 644,076 | |
| Standard Chartered PLC, 0.8% to 11/17/2028, FLR (EUR Swap Rate - 1yr. + 0.85%) to 11/17/2029 | 940,000 | 850,554 | ||
| Toronto-Dominion Bank, 4.108%, 6/08/2027 | $ | 884,000 | 860,271 | |
| UBS Group AG, 2.746% to 2/11/2032, FLR (CMT - 1yr. + 1.1%) to 2/11/2033 (n) | 1,622,000 | 1,289,300 | ||
| Unicaja Banco S.A., 1%, 12/01/2026 | EUR | 700,000 | 690,882 | |
| Unicaja Banco S.A., 5.13% to 2/21/2028, FLR (EUR Swap Rate - 1yr. + 2.15%) to 2/21/2029 | 700,000 | 749,887 | ||
| UniCredit S.p.A., 2.569% to 9/22/2025, FLR (CMT - 1yr. + 2.3%) to 9/22/2026 (n) | $ | 1,030,000 | 937,226 | |
| Wells Fargo & Co., 3.35% to 3/02/2032, FLR (SOFR - 1 day + 1.5%) to 3/02/2033 | 775,000 | 676,466 | ||
| Wells Fargo & Co., 3.9%, 5/01/2045 | 316,000 | 257,432 | ||
| $31,221,710 | ||||
23
Portfolio of Investments (unaudited)
– continued
| Issuer | Shares/Par | Value ($) | ||
| Bonds – continued | ||||
| Medical & Health Technology & Services – 0.5% | ||||
| Alcon Finance B.V., 2.375%, 5/31/2028 | EUR | 460,000 | $474,954 | |
| Alcon Finance Corp., 3.8%, 9/23/2049 (n) | $ | 231,000 | 183,372 | |
| Becton, Dickinson and Co., 4.298%, 8/22/2032 | 326,000 | 316,451 | ||
| CVS Health Corp., 5.625%, 2/21/2053 | 672,000 | 675,200 | ||
| HCA, Inc., 5.125%, 6/15/2039 | 399,000 | 375,174 | ||
| Laboratory Corp. of America Holdings, 3.6%, 2/01/2025 | 589,000 | 574,902 | ||
| Laboratory Corp. of America Holdings, 4.7%, 2/01/2045 | 567,000 | 514,793 | ||
| Memorial Sloan-Kettering Cancer Center, 2.955%, 1/01/2050 | 670,000 | 479,744 | ||
| New York Society for the Relief of the Ruptured & Crippled, 2.667%, 10/01/2050 | 1,300,000 | 836,741 | ||
| ProMedica Toledo Hospital, “B”, AGM, 6.015%, 11/15/2048 | 590,000 | 575,701 | ||
| Thermo Fisher Scientific Finance I B.V., 2%, 10/18/2051 | EUR | 630,000 | 440,510 | |
| Thermo Fisher Scientific, Inc., 1.75%, 10/15/2028 | $ | 1,119,000 | 994,244 | |
| $6,441,786 | ||||
| Medical Equipment – 0.1% | ||||
| Boston Scientific Corp., 0.625%, 12/01/2027 | EUR | 630,000 | $609,595 | |
| Boston Scientific Corp., 2.65%, 6/01/2030 | $ | 564,000 | 498,881 | |
| DH Europe Finance II S.à r.l., 0.45%, 3/18/2028 | EUR | 640,000 | 614,363 | |
| $1,722,839 | ||||
| Metals & Mining – 0.2% | ||||
| Anglo American Capital PLC, 4.5%, 9/15/2028 | EUR | 160,000 | $179,274 | |
| Anglo American Capital PLC, 5.625%, 4/01/2030 (n) | $ | 572,000 | 580,298 | |
| Anglo American Capital PLC, 4.75%, 9/21/2032 | EUR | 730,000 | 804,146 | |
| Glencore Funding LLC, 2.85%, 4/27/2031 (n) | $ | 808,000 | 682,438 | |
| $2,246,156 | ||||
| Midstream – 0.3% | ||||
| Enbridge, Inc., 5.7%, 3/08/2033 | $ | 537,000 | $557,669 | |
| Energy Transfer LP, 5.55%, 2/15/2028 | 478,000 | 487,361 | ||
| Galaxy Pipeline Assets Bidco Ltd., 2.16%, 3/31/2034 (n) | 971,374 | 841,468 | ||
| Sabine Pass Liquefaction LLC, 4.2%, 3/15/2028 | 1,216,000 | 1,177,846 | ||
| Targa Resources Corp., 4.2%, 2/01/2033 | 107,000 | 97,211 | ||
| Targa Resources Corp., 4.95%, 4/15/2052 | 649,000 | 537,844 | ||
| $3,699,399 | ||||
24
Portfolio of Investments (unaudited)
– continued
| Issuer | Shares/Par | Value ($) | ||
| Bonds – continued | ||||
| Mortgage-Backed – 3.9% | ||||
| Fannie Mae, 4.5%, 3/01/2025 - 2/01/2046 | $ | 3,083,578 | $3,074,155 | |
| Fannie Mae, 5.5%, 1/01/2037 | 11,409 | 11,822 | ||
| Fannie Mae, 6%, 9/01/2037 - 6/01/2038 | 122,515 | 126,826 | ||
| Fannie Mae, 5%, 4/01/2040 - 8/01/2040 | 827,123 | 840,650 | ||
| Fannie Mae, 4%, 11/01/2040 - 2/01/2041 | 938,962 | 912,336 | ||
| Fannie Mae, 3.5%, 5/01/2043 - 12/01/2046 | 1,452,526 | 1,371,548 | ||
| Fannie Mae, UMBS, 2.5%, 4/01/2037 - 5/01/2052 | 8,956,562 | 7,773,452 | ||
| Fannie Mae, UMBS, 3%, 5/01/2037 - 6/01/2052 | 3,155,728 | 2,841,427 | ||
| Fannie Mae, UMBS, 2%, 3/01/2042 - 7/01/2052 | 2,645,229 | 2,227,631 | ||
| Fannie Mae, UMBS, 1.5%, 4/01/2052 | 1,059,707 | 836,575 | ||
| Fannie Mae, UMBS, 3.5%, 5/01/2052 - 7/01/2052 | 45,502 | 42,350 | ||
| Fannie Mae, UMBS, 5.5%, 11/01/2052 - 12/01/2052 | 2,637,463 | 2,659,338 | ||
| Fannie Mae, UMBS, 6%, 12/01/2052 | 174,983 | 178,362 | ||
| Freddie Mac, 1.481%, 3/25/2027 (i) | 1,523,000 | 71,890 | ||
| Freddie Mac, 3.224%, 3/25/2027 | 1,500,000 | 1,449,120 | ||
| Freddie Mac, 3.194%, 7/25/2027 | 3,914,000 | 3,769,676 | ||
| Freddie Mac, 3.286%, 11/25/2027 | 2,576,000 | 2,486,184 | ||
| Freddie Mac, 1.916%, 4/25/2030 (i) | 3,170,226 | 332,156 | ||
| Freddie Mac, 1.985%, 4/25/2030 (i) | 2,614,093 | 276,993 | ||
| Freddie Mac, 1.768%, 5/25/2030 (i) | 3,298,344 | 321,381 | ||
| Freddie Mac, 1.907%, 5/25/2030 (i) | 7,375,798 | 773,194 | ||
| Freddie Mac, 1.436%, 6/25/2030 (i) | 3,056,884 | 244,997 | ||
| Freddie Mac, 1.704%, 8/25/2030 (i) | 2,713,457 | 259,833 | ||
| Freddie Mac, 1.263%, 9/25/2030 (i) | 1,752,322 | 125,392 | ||
| Freddie Mac, 1.172%, 11/25/2030 (i) | 3,594,105 | 241,439 | ||
| Freddie Mac, 0.42%, 1/25/2031 (i) | 13,664,169 | 267,592 | ||
| Freddie Mac, 0.612%, 3/25/2031 (i) | 16,745,293 | 534,418 | ||
| Freddie Mac, 1.039%, 7/25/2031 (i) | 3,177,082 | 200,955 | ||
| Freddie Mac, 0.632%, 9/25/2031 (i) | 13,281,588 | 466,125 | ||
| Freddie Mac, 0.955%, 9/25/2031 (i) | 4,021,884 | 233,005 | ||
| Freddie Mac, 0.665%, 12/25/2031 (i) | 3,294,996 | 129,602 | ||
| Freddie Mac, 4.35%, 1/25/2033 | 202,666 | 205,362 | ||
| Freddie Mac, 5.5%, 7/01/2037 | 21,787 | 22,600 | ||
| Freddie Mac, 4.5%, 12/01/2039 - 5/01/2042 | 945,389 | 949,772 | ||
| Freddie Mac, 5%, 7/01/2041 | 341,212 | 348,391 | ||
| Freddie Mac, UMBS, 3.5%, 1/01/2047 | 640,018 | 605,645 | ||
| Freddie Mac, UMBS, 3%, 6/01/2050 - 6/01/2052 | 1,091,206 | 982,486 | ||
| Freddie Mac, UMBS, 2%, 1/01/2051 - 12/01/2051 | 97,815 | 81,439 | ||
| Freddie Mac, UMBS, 2.5%, 10/01/2051 - 4/01/2052 | 915,522 | 794,987 | ||
| Freddie Mac, UMBS, 4%, 5/01/2052 | 142,328 | 137,160 | ||
| Freddie Mac, UMBS, 6%, 11/01/2052 | 506,082 | 516,324 | ||
| Ginnie Mae, 5%, 5/15/2040 - 1/20/2053 | 340,986 | 343,598 | ||
| Ginnie Mae, 3.5%, 6/20/2043 - 11/20/2052 | 497,610 | 476,697 | ||
25
Portfolio of Investments (unaudited)
– continued
| Issuer | Shares/Par | Value ($) | ||
| Bonds – continued | ||||
| Mortgage-Backed – continued | ||||
| Ginnie Mae, 2.5%, 8/20/2051 - 5/20/2052 | $ | 1,397,844 | $1,235,761 | |
| Ginnie Mae, 3%, 10/20/2051 - 11/20/2052 | 2,479,714 | 2,264,193 | ||
| Ginnie Mae, 2%, 1/20/2052 | 875,928 | 749,918 | ||
| Ginnie Mae, 4%, 9/20/2052 - 10/20/2052 | 1,460,583 | 1,404,105 | ||
| Ginnie Mae, 4.5%, 9/20/2052 - 11/20/2052 | 1,457,896 | 1,430,319 | ||
| Ginnie Mae, TBA, 2.5%, 5/15/2053 | 525,000 | 463,835 | ||
| Ginnie Mae, TBA, 3.5%, 5/15/2053 | 1,400,000 | 1,314,141 | ||
| Ginnie Mae, TBA, 5%, 5/15/2053 | 475,000 | 472,866 | ||
| Ginnie Mae, TBA, 5.5%, 5/15/2053 | 825,000 | 830,543 | ||
| UMBS, TBA, 2%, 5/25/2053 | 3,450,000 | 2,870,036 | ||
| $53,580,602 | ||||
| Municipals – 0.7% | ||||
| Colorado Housing & Finance Authority Rev., Single Family Mortgage Class I, Taxable, “D-1”, GNMA, 5%, 11/01/2047 | $ | 735,000 | $736,256 | |
| Connecticut Higher Education Supplemental Loan Authority Rev. Taxable (Chesla Loan Program), “C”, 4.668%, 11/15/2034 | 1,200,000 | 1,145,665 | ||
| Iowa Student Loan Liquidity Corp. Rev., Taxable, “A”, 5.08%, 12/01/2039 | 1,045,000 | 987,448 | ||
| Massachusetts Educational Financing Authority, Education Loan Rev., Taxable, “M-A”, 2.641%, 7/01/2037 | 1,235,000 | 1,137,505 | ||
| Massachusetts Educational Financing Authority, Education Loan Rev., Taxable, “M-A”, 4.949%, 7/01/2038 | 1,815,000 | 1,784,046 | ||
| Massachusetts Housing Finance Agency, Single Family Housing Rev., Taxable, “226”, 5.562%, 12/01/2052 | 1,080,000 | 1,100,994 | ||
| Michigan Finance Authority Hospital Rev., Taxable (Trinity Health Credit Group), 3.384%, 12/01/2040 | 585,000 | 489,090 | ||
| Minnesota Housing Finance Agency, Residential Housing, Taxable, “G”, 4.337%, 1/01/2047 | 1,005,000 | 980,941 | ||
| New Jersey Economic Development Authority State Pension Funding Rev., Taxable, “A”, NPFG, 7.425%, 2/15/2029 | 445,000 | 487,790 | ||
| Oklahoma Development Finance Authority, Health System Rev., Taxable (OU Medicine Project), “C”, AGM, 4.65%, 8/15/2030 | 992,000 | 925,471 | ||
| $9,775,206 | ||||
26
Portfolio of Investments (unaudited)
– continued
| Issuer | Shares/Par | Value ($) | ||
| Bonds – continued | ||||
| Natural Gas - Distribution – 0.1% | ||||
| Boston Gas Co., 3.15%, 8/01/2027 (n) | $ | 857,000 | $791,415 | |
| Engie S.A., 4.25%, 1/11/2043 | EUR | 100,000 | 109,134 | |
| Infraestructura Energética Nova S.A.B. de C.V., 4.875%, 1/14/2048 | $ | 710,000 | 542,092 | |
| NiSource, Inc., 5.25%, 3/30/2028 | 142,000 | 145,038 | ||
| $1,587,679 | ||||
| Natural Gas - Pipeline – 0.1% | ||||
| APA Infrastructure Ltd., 0.75%, 3/15/2029 | EUR | 970,000 | $875,464 | |
| APA Infrastructure Ltd., 2.5%, 3/15/2036 | GBP | 1,140,000 | 985,522 | |
| $1,860,986 | ||||
| Network & Telecom – 0.1% | ||||
| AT&T, Inc., 3.5%, 9/15/2053 | $ | 246,000 | $176,437 | |
| Orange S.A., 3.625%, 11/16/2031 | EUR | 900,000 | 1,005,253 | |
| Verizon Communications, Inc., 3.55%, 3/22/2051 | $ | 388,000 | 294,312 | |
| $1,476,002 | ||||
| Oils – 0.1% | ||||
| Neste Oyj, 0.75%, 3/25/2028 | EUR | 1,000,000 | $962,417 | |
| Neste Oyj, 3.875%, 3/16/2029 | 220,000 | 245,192 | ||
| Phillips 66, 4.875%, 11/15/2044 | $ | 300,000 | 282,584 | |
| $1,490,193 | ||||
| Other Banks & Diversified Financials – 1.0% | ||||
| AIB Group PLC, 5.75% to 2/16/2028, FLR (EUR Swap Rate - 1yr. + 2.85%) to 2/16/2029 | EUR | 730,000 | $836,205 | |
| Arion Banki HF, 4.875%, 12/21/2024 | 1,080,000 | 1,161,872 | ||
| Banque Federative du Credit Mutuel S.A., 4.375%, 5/02/2030 | 700,000 | 774,749 | ||
| BPCE S.A., 4.625% to 3/02/2029, FLR (EURIBOR - 3mo. + 1.6%) to 3/02/2030 | 500,000 | 557,252 | ||
| BPCE S.A., 2.277% to 1/20/2031, FLR (SOFR - 1 day + 1.312%) to 1/20/2032 (n) | $ | 960,000 | 750,355 | |
| CaixaBank S.A., 6.875% to 10/25/2028, FLR (GBP Swap Rate - 5yr. + 3.7%) to 10/25/2033 | GBP | 400,000 | 490,682 | |
| Cooperatieve Rabobank U.A., 4.233% to 4/25/2028, FLR (EURIBOR - 3mo. + 1.15%) to 4/25/2029 | EUR | 700,000 | 773,311 | |
| Deutsche Bank AG, 1.875% to 2/23/2027, FLR (EURIBOR - 3mo. + 1.38%) to 2/23/2028 | 400,000 | 387,421 | ||
| Deutsche Bank AG, 3.25% to 5/24/2027, FLR (EURIBOR - 3mo. + 1.93%) to 5/24/2028 | 200,000 | 201,680 | ||
| Deutsche Bank AG, 6.125% to 12/12/2029, FLR (SONIA + 2.621%) to 12/12/2030 | GBP | 600,000 | 725,485 | |
27
Portfolio of Investments (unaudited)
– continued
| Issuer | Shares/Par | Value ($) | ||
| Bonds – continued | ||||
| Other Banks & Diversified Financials – continued | ||||
| Deutsche Bank AG, 1.375% to 2/17/2031, FLR (EURIBOR - 3mo. + 1.5%) to 2/17/2032 | EUR | 400,000 | $325,520 | |
| Deutsche Bank AG, 4%, 6/24/2032 | 700,000 | 665,653 | ||
| Groupe BPCE S.A., 4.5%, 3/15/2025 (n) | $ | 950,000 | 918,474 | |
| Groupe BPCE S.A., 1.75%, 2/02/2034 | EUR | 900,000 | 803,017 | |
| Groupe des Assurances du Credit Mutuel, 1.85% to 4/21/2032, FLR (EURIBOR - 3mo. + 2.65%) to 4/21/2042 | 1,000,000 | 806,693 | ||
| KBC Group N.V., 4.375% to 4/19/2029, FLR (EURIBOR - 3mo. + 1.38%) to 4/19/2030 | 300,000 | 332,579 | ||
| Macquarie Group Ltd., 4.08%, 5/31/2029 | GBP | 640,000 | 732,360 | |
| Manufacturers and Traders Trust Co., 4.7%, 1/27/2028 | $ | 301,000 | 285,525 | |
| Skipton Building Society, 6.25%, 4/25/2029 | GBP | 740,000 | 922,118 | |
| Virgin Money UK PLC, 5.125% to 12/11/2025, FLR (GBP Government Yield - 5yr. + 5.25%) to 12/11/2030 | 650,000 | 758,019 | ||
| $13,208,970 | ||||
| Pharmaceuticals – 0.1% | ||||
| Amgen, Inc., 5.25%, 3/02/2030 | $ | 418,000 | $429,305 | |
| Amgen, Inc., 5.6%, 3/02/2043 | 579,000 | 595,793 | ||
| $1,025,098 | ||||
| Pollution Control – 0.1% | ||||
| Waste Connections, Inc., 4.2%, 1/15/2033 | $ | 698,000 | $670,572 | |
| Waste Management, Inc., 4.625%, 2/15/2033 | 815,000 | 825,177 | ||
| $1,495,749 | ||||
| Precious Metals & Minerals – 0.1% | ||||
| Northern Star Resources Ltd. Co., 6.125%, 4/11/2033 (n) | $ | 881,000 | $878,144 | |
| Printing & Publishing – 0.1% | ||||
| Wolters Kluwer N.V., 3.75%, 4/03/2031 | EUR | 690,000 | $768,808 | |
| Real Estate - Office – 0.1% | ||||
| Corporate Office Property LP, REIT, 2.25%, 3/15/2026 | $ | 675,000 | $602,717 | |
| Corporate Office Property LP, REIT, 2%, 1/15/2029 | 425,000 | 328,361 | ||
| Corporate Office Property LP, REIT, 2.75%, 4/15/2031 | 868,000 | 659,485 | ||
| $1,590,563 | ||||
28
Portfolio of Investments (unaudited)
– continued
| Issuer | Shares/Par | Value ($) | ||
| Bonds – continued | ||||
| Real Estate - Other – 0.1% | ||||
| EPR Properties, REIT, 3.6%, 11/15/2031 | $ | 725,000 | $563,938 | |
| Lexington Realty Trust Co., 2.7%, 9/15/2030 | 881,000 | 713,879 | ||
| W.P. Carey, Inc., REIT, 2.4%, 2/01/2031 | 699,000 | 571,663 | ||
| $1,849,480 | ||||
| Real Estate - Retail – 0.2% | ||||
| Regency Centers Corp., 3.7%, 6/15/2030 | $ | 286,000 | $262,016 | |
| Spirit Realty, LP, REIT, 3.2%, 1/15/2027 | 531,000 | 485,669 | ||
| STORE Capital Corp., REIT, 2.7%, 12/01/2031 | 949,000 | 682,885 | ||
| WEA Finance LLC, 2.875%, 1/15/2027 (n) | 800,000 | 699,219 | ||
| $2,129,789 | ||||
| Restaurants – 0.0% | ||||
| McDonald's Corp., 4.25%, 3/07/2035 | EUR | 560,000 | $632,705 | |
| Retailers – 0.1% | ||||
| AutoZone, Inc., 4.75%, 8/01/2032 | $ | 326,000 | $324,358 | |
| Home Depot, Inc., 4.875%, 2/15/2044 | 496,000 | 493,679 | ||
| Home Depot, Inc., 3.625%, 4/15/2052 | 723,000 | 589,230 | ||
| $1,407,267 | ||||
| Specialty Chemicals – 0.0% | ||||
| International Flavors & Fragrances, Inc., 1.832%, 10/15/2027 (n) | $ | 699,000 | $595,461 | |
| Specialty Stores – 0.0% | ||||
| DICK'S Sporting Goods, 3.15%, 1/15/2032 | $ | 696,000 | $577,077 | |
| Supranational – 0.7% | ||||
| Corporacion Andina de Fomento, 4.5%, 3/07/2028 | EUR | 790,000 | $886,952 | |
| European Financial Stability Facility, 3.375%, 4/03/2037 | 978,000 | 1,094,664 | ||
| European Stability Mechanism, 1%, 6/23/2027 | 1,510,000 | 1,537,918 | ||
| European Stability Mechanism, 0.5%, 3/05/2029 | 1,620,000 | 1,554,517 | ||
| European Stability Mechanism, 0.01%, 10/15/2031 | 4,489,000 | 3,865,298 | ||
| International Bank for Reconstruction and Development, 4.25%, 6/24/2025 | AUD | 440,000 | 294,660 | |
| $9,234,009 | ||||
| Telecommunications - Wireless – 0.3% | ||||
| Crown Castle, Inc., REIT, 1.35%, 7/15/2025 | $ | 501,000 | $463,621 | |
| Crown Castle, Inc., REIT, 4.45%, 2/15/2026 | 483,000 | 478,157 | ||
| Rogers Communications, Inc., 3.8%, 3/15/2032 (n) | 765,000 | 688,834 | ||
| T-Mobile USA, Inc., 3.875%, 4/15/2030 | 1,004,000 | 945,318 | ||
| Vodafone Group PLC, 3.375%, 8/08/2049 | GBP | 650,000 | 561,890 | |
29
Portfolio of Investments (unaudited)
– continued
| Issuer | Shares/Par | Value ($) | ||
| Bonds – continued | ||||
| Telecommunications - Wireless – continued | ||||
| Vodafone Group PLC, 5.625%, 2/10/2053 | $ | 581,000 | $573,562 | |
| $3,711,382 | ||||
| Telephone Services – 0.2% | ||||
| Telstra Group Ltd., 3.75%, 5/04/2031 | EUR | 873,000 | $970,097 | |
| TELUS Corp., 2.85%, 11/13/2031 | CAD | 1,775,000 | 1,139,257 | |
| $2,109,354 | ||||
| Tobacco – 0.1% | ||||
| B.A.T. International Finance PLC, 2.25%, 1/16/2030 | EUR | 650,000 | $596,413 | |
| Philip Morris International, Inc., 5.125%, 11/17/2027 | $ | 945,000 | 967,677 | |
| $1,564,090 | ||||
| Transportation - Services – 0.4% | ||||
| Autostrade per L'Italia S.p.A., 4.75%, 1/24/2031 | EUR | 730,000 | $793,542 | |
| Holding d'Infrastructures de Transport, 1.475%, 1/18/2031 | 800,000 | 711,727 | ||
| Sydney Airport Finance Co. Pty Ltd., 4.375%, 5/03/2033 | 882,000 | 975,833 | ||
| Transurban Finance Co. Pty Ltd., 4.225%, 4/26/2033 | 870,000 | 971,931 | ||
| Triton International Ltd., 3.15%, 6/15/2031 (n) | $ | 769,000 | 609,802 | |
| United Parcel Service, 5.05%, 3/03/2053 | 1,219,000 | 1,255,986 | ||
| $5,318,821 | ||||
| U.S. Government Agencies and Equivalents – 0.0% | ||||
| Small Business Administration, 5.31%, 5/01/2027 | $ | 25,470 | $25,237 | |
| U.S. Treasury Obligations – 1.9% | ||||
| U.S. Treasury Bonds, 1.125%, 8/15/2040 (f) | $ | 22,415,000 | $14,897,219 | |
| U.S. Treasury Bonds, 2.375%, 11/15/2049 | 3,144,000 | 2,431,810 | ||
| U.S. Treasury Notes, 2.75%, 8/15/2032 | 9,887,000 | 9,357,119 | ||
| $26,686,148 | ||||
| Utilities - Electric Power – 1.2% | ||||
| American Electric Power Co., Inc., 2.3%, 3/01/2030 | $ | 684,000 | $580,629 | |
| American Electric Power Co., Inc., 5.625%, 3/01/2033 | 367,000 | 384,460 | ||
| Bruce Power LP, 2.68%, 12/21/2028 | CAD | 1,600,000 | 1,077,882 | |
| Duke Energy Corp., 3.75%, 9/01/2046 | $ | 515,000 | 404,434 | |
| E.ON International Finance B.V., 5.875%, 10/30/2037 | GBP | 1,050,000 | 1,331,902 | |
| Enel Americas S.A., 4%, 10/25/2026 | $ | 3,133,000 | 3,056,147 | |
| Enel Finance International N.V., 2.25%, 7/12/2031 (n) | 580,000 | 460,544 | ||
| Enel Finance International N.V., 4.5%, 2/20/2043 | EUR | 420,000 | 448,901 | |
30
Portfolio of Investments (unaudited)
– continued
| Issuer | Shares/Par | Value ($) | ||
| Bonds – continued | ||||
| Utilities - Electric Power – continued | ||||
| Enel Finance International N.V., 4.75%, 5/25/2047 (n) | $ | 456,000 | $395,188 | |
| Enel S.p.A., 2.25% to 3/10/2027, FLR (EUR Swap Rate - 5yr. + 2.679%) to 3/10/2032, FLR (EUR Swap Rate - 5yr. + 2.929%) to 3/10/2047, FLR (EUR Swap Rate - 5yr. + 3.679%) to 3/10/2070 | EUR | 645,000 | 611,788 | |
| Enel S.p.A., 1.875%, 3/08/2170 | 1,025,000 | 816,026 | ||
| Evergy, Inc., 2.9%, 9/15/2029 | $ | 881,000 | 792,820 | |
| Florida Power & Light Co., 2.875%, 12/04/2051 | 549,000 | 391,571 | ||
| Jersey Central Power & Light Co., 2.75%, 3/01/2032 (n) | 758,000 | 643,009 | ||
| National Grid Electricity Transmission PLC, 2%, 4/17/2040 | GBP | 820,000 | 641,212 | |
| National Grid PLC, 3.875%, 1/16/2029 | EUR | 410,000 | 453,063 | |
| National Grid PLC, 4.275%, 1/16/2035 | 390,000 | 427,360 | ||
| NextEra Energy Capital Holdings, Inc., 6.051%, 3/01/2025 | $ | 398,000 | 404,617 | |
| PPL Electric Utilities Corp, 1st Mortgage, 5.25%, 5/15/2053 | 948,000 | 987,412 | ||
| Southern California Edison Co., 3.65%, 2/01/2050 | 478,000 | 371,893 | ||
| Southern Co., 1.875%, 9/15/2081 | EUR | 100,000 | 86,630 | |
| Virginia Electric & Power Co., 3.5%, 3/15/2027 | $ | 1,001,000 | 968,258 | |
| Xcel Energy, Inc., 4.6%, 6/01/2032 | 351,000 | 344,807 | ||
| $16,080,553 | ||||
| Total Bonds (Identified Cost, $568,125,244) | $538,497,103 | |||
| Preferred Stocks – 0.8% | ||||
| Computer Software - Systems – 0.0% | ||||
| Samsung Electronics Co. Ltd. | 21,626 | $905,697 | ||
| Consumer Products – 0.6% | ||||
| Henkel AG & Co. KGaA | 100,370 | $8,104,600 | ||
| Metals & Mining – 0.2% | ||||
| Gerdau S.A. | 499,285 | $2,520,549 | ||
| Total Preferred Stocks (Identified Cost, $8,595,486) | $11,530,846 | |||
| Convertible Preferred Stocks – 0.1% | ||||
| Medical Equipment – 0.1% | ||||
| Boston Scientific Corp., 5.5% (Identified Cost, $1,472,916) | 13,573 | $1,706,533 | ||
31
Portfolio of Investments (unaudited)
– continued
| Issuer | Shares/Par | Value ($) | ||
| Investment Companies (h) – 1.7% | ||||
| Money Market Funds – 1.7% | ||||
| MFS Institutional Money Market Portfolio, 4.59% (v) (Identified Cost, $23,293,023) | 23,292,326 | $23,296,984 | ||
| Underlying/Expiration Date/Exercise Price | Put/Call | Counterparty | Notional Amount | Par Amount/ Number of Contracts | |
| Purchased Options – 0.0% | |||||
| Market Index Securities – 0.0% | |||||
| iTraxx Europe Crossover Series 39 Index Credit Default Swap-Fund pays 5%, Fund receives notional amount upon a defined credit event of an index constituent – May 2023 @ 5.5% | Put | BNP Paribas S.A. | $ 4,139,469 | EUR 3,640,000 | $2,307 |
| iTraxx Europe Crossover Series 39 Index Credit Default Swap-Fund pays 5%, Fund receives notional amount upon a defined credit event of an index constituent – May 2023 @ 5.5% | Put | Goldman Sachs International | 4,139,469 | 3,640,000 | 2,306 |
| Total Purchased Options (Premiums Paid, $52,492) | $4,613 | ||||
| Other Assets, Less Liabilities – (0.3)% | (3,585,551) | |||
| Net Assets – 100.0% | $1,386,540,675 | |||
| (a) | Non-income producing security. | |||
| (f) | All or a portion of the security has been segregated as collateral for open futures contracts. | |||
| (h) | An affiliated issuer, which may be considered one in which the fund owns 5% or more of the outstanding voting securities, or a company which is under common control. At period end, the aggregate values of the fund's investments in affiliated issuers and in unaffiliated issuers were $23,296,984 and $1,366,829,242, respectively. | |||
| (i) | Interest only security for which the fund receives interest on notional principal (Par amount). Par amount shown is the notional principal and does not reflect the cost of the security. | |||
| (l) | A portion of this security is on loan. See Note 2 for additional information. | |||
| (n) | Securities exempt from registration under Rule 144A of the Securities Act of 1933. These securities may be sold in the ordinary course of business in transactions exempt from registration, normally to qualified institutional buyers. At period end, the aggregate value of these securities was $71,010,721, representing 5.1% of net assets. | |||
| (u) | The security was valued using significant unobservable inputs and is considered level 3 under the fair value hierarchy. For further information about the fund’s level 3 holdings, please see Note 2 in the Notes to Financial Statements. |
32
Portfolio of Investments (unaudited)
– continued
| (v) | Affiliated issuer that is available only to investment companies managed by MFS. The rate quoted for the MFS Institutional Money Market Portfolio is the annualized seven-day yield of the fund at period end. | |||
| (w) | When-issued security. |
| The following abbreviations are used in this report and are defined: | |
| ADR | American Depositary Receipt |
| AGM | Assured Guaranty Municipal |
| CLO | Collateralized Loan Obligation |
| CMT | Constant Maturity Treasury |
| EURIBOR | Euro Interbank Offered Rate |
| FLR | Floating Rate. Interest rate resets periodically based on the parenthetically disclosed reference rate plus a spread (if any). The period-end rate reported may not be the current rate. All reference rates are USD unless otherwise noted. |
| GDR | Global Depositary Receipt |
| GNMA | Government National Mortgage Assn. |
| ICE | Intercontinental Exchange |
| LIBOR | London Interbank Offered Rate |
| NPFG | National Public Finance Guarantee Corp. |
| REIT | Real Estate Investment Trust |
| SOFR | Secured Overnight Financing Rate |
| SONIA | Sterling Overnight Index Average |
| TBA | To Be Announced |
| UMBS | Uniform Mortgage-Backed Security |
| Abbreviations indicate amounts shown in currencies other than the U.S. dollar. All amounts are stated in U.S. dollars unless otherwise indicated. A list of abbreviations is shown below: | |
| AUD | Australian Dollar |
| CAD | Canadian Dollar |
| CHF | Swiss Franc |
| CLP | Chilean Peso |
| CNH | Chinese Yuan Renminbi (Offshore) |
| CNY | China Yuan Renminbi |
| COP | Colombian Peso |
| CZK | Czech Koruna |
| DKK | Danish Krone |
| EUR | Euro |
| GBP | British Pound |
| HUF | Hungarian Forint |
| IDR | Indonesian Rupiah |
| ILS | Israeli Shekel |
| JPY | Japanese Yen |
| KRW | South Korean Won |
| MXN | Mexican Peso |
| NOK | Norwegian Krone |
| NZD | New Zealand Dollar |
| PLN | Polish Zloty |
| SEK | Swedish Krona |
| SGD | Singapore Dollar |
| THB | Thai Baht |
| TWD | Taiwan Dollar |
| UYU | Uruguayan Peso |
33
Portfolio of Investments (unaudited)
– continued
Derivative Contracts at 4/30/23
| Forward Foreign Currency Exchange Contracts | ||||||
| Currency Purchased | Currency Sold | Counterparty | Settlement Date | Unrealized Appreciation (Depreciation) | ||
| Asset Derivatives | ||||||
| CHF | 2,610,060 | USD | 2,938,955 | Merrill Lynch International | 7/21/2023 | $7,924 |
| CLP | 230,670,610 | USD | 275,773 | Goldman Sachs International | 6/02/2023 | 8,669 |
| DKK | 8,708,598 | USD | 1,288,611 | State Street Bank Corp. | 7/21/2023 | 5,762 |
| EUR | 2,138,763 | USD | 2,357,911 | HSBC Bank | 7/21/2023 | 9,533 |
| EUR | 1,077,030 | USD | 1,187,091 | Merrill Lynch International | 7/21/2023 | 5,097 |
| EUR | 836,161 | USD | 922,457 | State Street Bank Corp. | 7/21/2023 | 3,109 |
| EUR | 29,235,063 | USD | 32,204,209 | UBS AG | 7/21/2023 | 156,725 |
| GBP | 2,368,427 | USD | 2,967,707 | Brown Brothers Harriman | 7/21/2023 | 13,496 |
| GBP | 6,621,283 | USD | 8,253,260 | HSBC Bank | 7/21/2023 | 81,127 |
| GBP | 496,210 | USD | 619,612 | JPMorgan Chase Bank N.A. | 7/21/2023 | 4,982 |
| GBP | 402,053 | USD | 504,296 | State Street Bank Corp. | 7/21/2023 | 1,779 |
| HUF | 162,983,000 | USD | 467,440 | Goldman Sachs International | 7/21/2023 | 2,550 |
| IDR | 36,992,338,010 | USD | 2,459,924 | Citibank N.A. | 5/10/2023 | 61,067 |
| IDR | 20,222,470,150 | USD | 1,349,766 | Morgan Stanley Capital Services, Inc. | 5/10/2023 | 28,375 |
| ILS | 3,400,000 | USD | 931,935 | Morgan Stanley Capital Services, Inc. | 7/20/2023 | 7,735 |
| PLN | 4,899,803 | USD | 1,152,223 | Barclays Bank PLC | 7/21/2023 | 19,624 |
| SEK | 1,977,000 | USD | 192,094 | State Street Bank Corp. | 7/21/2023 | 1,482 |
| THB | 33,982,252 | USD | 997,425 | Barclays Bank PLC | 7/19/2023 | 6,293 |
| THB | 117,563,348 | USD | 3,439,939 | JPMorgan Chase Bank N.A. | 6/13/2023 | 20,815 |
| USD | 9,977,029 | AUD | 14,776,558 | State Street Bank Corp. | 7/21/2023 | 165,568 |
| USD | 1,358,843 | CAD | 1,824,654 | Goldman Sachs International | 7/21/2023 | 9,907 |
| USD | 2,441,948 | CAD | 3,273,685 | HSBC Bank | 7/21/2023 | 21,769 |
| USD | 51,004 | EUR | 45,905 | Barclays Bank PLC | 7/21/2023 | 190 |
| USD | 555,525 | EUR | 500,054 | Deutsche Bank AG | 7/21/2023 | 2,004 |
| USD | 1,421,058 | EUR | 1,280,034 | HSBC Bank | 7/21/2023 | 4,160 |
| USD | 1,777,947 | EUR | 1,601,808 | JPMorgan Chase Bank N.A. | 7/21/2023 | 4,870 |
| USD | 869,368 | EUR | 784,669 | Morgan Stanley Capital Services, Inc. | 7/21/2023 | 800 |
| USD | 221,641 | EUR | 200,000 | State Street Bank Corp. | 7/21/2023 | 257 |
| USD | 1,647,978 | JPY | 219,170,981 | Barclays Bank PLC | 7/21/2023 | 19,176 |
| USD | 245,138 | JPY | 32,417,310 | UBS AG | 7/21/2023 | 4,224 |
| USD | 2,743,376 | KRW | 3,513,167,366 | Barclays Bank PLC | 5/10/2023 | 117,414 |
| USD | 16,064,143 | KRW | 21,342,429,518 | Barclays Bank PLC | 7/10/2023 | 51,025 |
| USD | 10,804,064 | KRW | 14,189,873,707 | Citibank N.A. | 7/10/2023 | 157,473 |
| USD | 8,004,424 | KRW | 10,389,415,410 | Merrill Lynch International | 6/15/2023 | 221,058 |
| USD | 665,861 | KRW | 865,619,403 | Morgan Stanley Capital Services, Inc. | 6/15/2023 | 17,371 |
| USD | 1,354,387 | NOK | 14,266,207 | UBS AG | 7/21/2023 | 10,470 |
| USD | 2,785,031 | SGD | 3,704,370 | Merrill Lynch International | 7/21/2023 | 306 |
| USD | 4,401,530 | TWD | 130,773,337 | Barclays Bank PLC | 5/05/2023 | 146,265 |
| USD | 3,968,960 | TWD | 119,837,996 | Citibank N.A. | 5/23/2023 | 60,884 |
| $1,461,335 | ||||||
34
Portfolio of Investments (unaudited)
– continued
| Forward Foreign Currency Exchange Contracts - continued | ||||||
| Currency Purchased | Currency Sold | Counterparty | Settlement Date | Unrealized Appreciation (Depreciation) | ||
| Liability Derivatives | ||||||
| AUD | 2,001,472 | USD | 1,351,420 | Merrill Lynch International | 7/21/2023 | $(22,466) |
| AUD | 1,310,354 | USD | 882,845 | UBS AG | 7/21/2023 | (12,785) |
| CAD | 3,761,492 | USD | 2,811,828 | Merrill Lynch International | 7/21/2023 | (31,022) |
| CAD | 1,688,358 | USD | 1,267,867 | Morgan Stanley Capital Services, Inc. | 7/21/2023 | (19,692) |
| CNH | 137,791,076 | USD | 20,189,068 | Barclays Bank PLC | 7/21/2023 | (164,561) |
| COP | 2,054,532,379 | USD | 450,849 | Barclays Bank PLC | 7/21/2023 | (21,452) |
| CZK | 19,003,547 | USD | 887,770 | Merrill Lynch International | 7/21/2023 | (1,115) |
| EUR | 820,180 | USD | 911,082 | Brown Brothers Harriman | 7/21/2023 | (3,207) |
| EUR | 1,637,828 | USD | 1,816,566 | State Street Bank Corp. | 7/21/2023 | (3,618) |
| JPY | 3,350,759,854 | USD | 25,500,960 | UBS AG | 7/21/2023 | (599,286) |
| NOK | 61,596,842 | USD | 5,868,613 | HSBC Bank | 7/21/2023 | (66,018) |
| NZD | 1,537,956 | USD | 954,365 | UBS AG | 7/21/2023 | (3,678) |
| SGD | 5,242,672 | USD | 3,941,968 | BNP Paribas S.A. | 7/21/2023 | (839) |
| USD | 1,175,538 | AUD | 1,774,255 | HSBC Bank | 7/21/2023 | (2,547) |
| USD | 1,768,552 | AUD | 2,666,291 | JPMorgan Chase Bank N.A. | 7/21/2023 | (1,834) |
| USD | 450,640 | AUD | 680,911 | Merrill Lynch International | 7/21/2023 | (1,477) |
| USD | 548,245 | EUR | 497,321 | Brown Brothers Harriman | 7/21/2023 | (2,251) |
| USD | 4,972,515 | EUR | 4,508,359 | HSBC Bank | 7/21/2023 | (17,887) |
| USD | 670,322 | EUR | 608,695 | JPMorgan Chase Bank N.A. | 7/21/2023 | (3,456) |
| USD | 4,210,113 | EUR | 3,823,921 | Merrill Lynch International | 7/21/2023 | (22,668) |
| USD | 14,084,522 | EUR | 12,788,066 | Morgan Stanley Capital Services, Inc. | 7/21/2023 | (70,870) |
| USD | 772,882 | EUR | 699,746 | State Street Bank Corp. | 7/21/2023 | (1,681) |
| USD | 2,035,666 | EUR | 1,846,946 | UBS AG | 7/21/2023 | (8,758) |
| USD | 585,554 | GBP | 471,527 | HSBC Bank | 7/21/2023 | (7,970) |
| USD | 917,366 | GBP | 737,092 | JPMorgan Chase Bank N.A. | 7/21/2023 | (10,432) |
| USD | 14,376,129 | GBP | 11,489,004 | State Street Bank Corp. | 7/21/2023 | (85,392) |
| USD | 922,570 | MXN | 16,986,426 | HSBC Bank | 7/21/2023 | (6,710) |
| USD | 1,011,840 | SEK | 10,344,284 | HSBC Bank | 7/21/2023 | (1,008) |
| USD | 4,691,291 | SEK | 48,288,960 | State Street Bank Corp. | 7/21/2023 | (36,861) |
| $(1,231,541) | ||||||
| Futures Contracts | ||||||
| Description | Long/ Short | Currency | Contracts | Notional Amount | Expiration Date | Value/Unrealized Appreciation (Depreciation) |
| Asset Derivatives | ||||||
| Interest Rate Futures | ||||||
| Australian Bond 10 yr | Long | AUD | 42 | $3,403,229 | June – 2023 | $35,457 |
| Canadian Treasury Bond 10 yr | Long | CAD | 97 | 9,026,652 | June – 2023 | 243,801 |
| Canadian Treasury Bond 5 yr | Long | CAD | 197 | 16,558,556 | June – 2023 | 190,313 |
| Euro-Buxl 30 yr | Long | EUR | 60 | 9,222,903 | June – 2023 | 516,875 |
| U.S. Treasury Note 10 yr | Long | USD | 203 | 23,386,234 | June – 2023 | 339,235 |
35
Portfolio of Investments (unaudited)
– continued
| Futures Contracts - continued | ||||||
| Description | Long/ Short | Currency | Contracts | Notional Amount | Expiration Date | Value/Unrealized Appreciation (Depreciation) |
| Asset Derivatives - continued | ||||||
| Interest Rate Futures - continued | ||||||
| U.S. Treasury Note 2 yr | Short | USD | 150 | $30,924,609 | June – 2023 | $45,964 |
| U.S. Treasury Ultra Bond | Long | USD | 32 | 4,525,000 | June – 2023 | 162,040 |
| $1,533,685 | ||||||
| Liability Derivatives | ||||||
| Interest Rate Futures | ||||||
| Euro-Bobl 5 yr | Short | EUR | 392 | $50,956,528 | June – 2023 | $(1,158,913) |
| Euro-BTP 10 yr | Short | EUR | 100 | 12,655,322 | June – 2023 | (399,116) |
| Euro-Bund 10 yr | Short | EUR | 4 | 597,494 | June – 2023 | (4,681) |
| Euro-Schatz 2 yr | Short | EUR | 182 | 21,192,678 | June – 2023 | (144,070) |
| Long Gilt 10 yr | Long | GBP | 56 | 7,140,552 | June – 2023 | (102,136) |
| U.S. Treasury Bond | Short | USD | 15 | 1,974,844 | June – 2023 | (92,695) |
| U.S. Treasury Note 5 yr | Short | USD | 226 | 24,801,734 | June – 2023 | (278,260) |
| U.S. Treasury Ultra Note 10 yr | Short | USD | 41 | 4,979,578 | June – 2023 | (156,635) |
| $(2,336,506) | ||||||
36
Portfolio of Investments (unaudited)
– continued
| Uncleared Swap Agreements | ||||||||||
| Maturity Date | Notional Amount | Counterparty | Cash Flows to Receive/ Frequency | Cash Flows to Pay/ Frequency | Unrealized Appreciation (Depreciation) | Net Unamortized Upfront Payments (Receipts) | Value | |||
| Asset Derivatives | ||||||||||
| Credit Default Swaps | ||||||||||
| 6/20/28 | EUR | 1,020,000 | Barclays Bank PLC | 5.00%/Quarterly | (1) | $5,697 | $153,528 | $159,225 | ||
(1) Fund, as protection seller, to
pay notional amount upon a defined credit event by Glencore Funding LLC, 1.875%, 9/13/23, a BBB+ rated bond. The fund entered into the contract to gain issuer exposure.
The credit ratings presented here
are an indicator of the current payment/performance risk of the related swap agreement, the reference obligation for which may be either a single security or, in the case of a credit default swap index, a basket of
securities issued by corporate or sovereign issuers. Ratings are assigned to each reference security, including each individual security within a reference basket of securities, utilizing ratings from Moody’s,
Fitch, and Standard & Poor’s rating agencies and applying the following hierarchy: If all three agencies provide a rating, the middle rating (after dropping the highest and lowest ratings) is assigned; if
two of the three agencies rate a security, the lower of the two is assigned. If none of the 3 rating agencies above assign a rating, but the security is rated by DBRS Morningstar, than the DBRS Morningstar rating is
assigned. If none of the 4 rating agencies listed above rate the security, but the security is rated by the Kroll Bond Rating Agency (KBRA), then the KBRA rating is assigned. Ratings are shown in the S&P and Fitch
scale (e.g., AAA). The ratings for a credit default swap index are calculated by MFS as a weighted average of the external credit ratings of the individual securities that compose the index’s reference basket of
securities.
At April 30, 2023, the fund had cash
collateral of $29,000 and other liquid securities with an aggregate value of $3,525,756 to cover any collateral or margin obligations for certain derivative contracts. Restricted cash and/or deposits with brokers in
the Statement of Assets and Liabilities are comprised of cash collateral.
See Notes to Financial Statements
37
Financial Statements
Statement of Assets and
Liabilities
At 4/30/23 (unaudited)
This statement represents your
fund’s balance sheet, which details the assets and liabilities comprising the total value of the fund.
| Assets | |
| Investments in unaffiliated issuers, at value, including $1,669,786 of securities on loan (identified cost, $1,154,668,211) | $1,366,829,242 |
| Investments in affiliated issuers, at value (identified cost, $23,293,023) | 23,296,984 |
| Cash | 362,617 |
| Foreign currency, at value (identified cost, $28,835) | 28,839 |
| Restricted cash for | |
| Forward foreign currency exchange contracts | 29,000 |
| Receivables for | |
| Forward foreign currency exchange contracts | 1,461,335 |
| Investments sold | 10,147,767 |
| TBA sale commitments | 2,856,590 |
| Fund shares sold | 906,938 |
| Interest and dividends | 7,959,084 |
| Uncleared swaps, at value | 159,225 |
| Other assets | 42,628 |
| Total assets | $1,414,080,249 |
| Liabilities | |
| Payables for | |
| Forward foreign currency exchange contracts | $1,231,541 |
| Net daily variation margin on open futures contracts | 151,098 |
| Investments purchased | 15,001,385 |
| When-issued investments purchased | 762,338 |
| TBA purchase commitments | 8,757,276 |
| Fund shares reacquired | 1,024,748 |
| Payable to affiliates | |
| Investment adviser | 4,868 |
| Administrative services fee | 2,281 |
| Shareholder servicing costs | 352,556 |
| Distribution and service fees | 26,450 |
| Payable for independent Trustees' compensation | 3,580 |
| Accrued expenses and other liabilities | 221,453 |
| Total liabilities | $27,539,574 |
| Net assets | $1,386,540,675 |
38
Statement of Assets and Liabilities (unaudited) – continued
| Net assets consist of | |
| Paid-in capital | $1,163,334,547 |
| Total distributable earnings (loss) | 223,206,128 |
| Net assets | $1,386,540,675 |
| Shares of beneficial interest outstanding | 83,368,916 |
| Net assets | Shares outstanding | Net asset value per share (a) | |
| Class A | $655,770,725 | 39,183,443 | $16.74 |
| Class B | 8,589,468 | 503,803 | 17.05 |
| Class C | 61,957,276 | 3,702,443 | 16.73 |
| Class I | 407,468,392 | 24,682,539 | 16.51 |
| Class R1 | 2,437,637 | 146,788 | 16.61 |
| Class R2 | 3,941,141 | 239,017 | 16.49 |
| Class R3 | 12,953,592 | 777,128 | 16.67 |
| Class R4 | 5,396,816 | 321,896 | 16.77 |
| Class R6 | 228,025,628 | 13,811,859 | 16.51 |
| (a) | Maximum offering price per share was equal to the net asset value per share for all share classes, except for Class A, for which the maximum offering price per share was $17.76 [100 / 94.25 x $16.74]. On sales of $50,000 or more, the maximum offering price of Class A shares is reduced. A contingent deferred sales charge may be imposed on redemptions of Class A, Class B, and Class C shares. Redemption price per share was equal to the net asset value per share for Classes I, R1, R2, R3, R4, and R6. |
See Notes to Financial Statements
39
Financial Statements
Statement of Operations
Six months ended 4/30/23
(unaudited)
This statement describes how much
your fund earned in investment income and accrued in expenses. It also describes any gains and/or losses generated by fund operations.
| Net investment income (loss) | |
| Income | |
| Dividends | $12,052,222 |
| Interest | 9,536,030 |
| Dividends from affiliated issuers | 546,115 |
| Other | 19,381 |
| Income on securities loaned | 14,427 |
| Foreign taxes withheld | (560,461) |
| Total investment income | $21,607,714 |
| Expenses | |
| Management fee | $5,331,610 |
| Distribution and service fees | 1,229,301 |
| Shareholder servicing costs | 613,064 |
| Administrative services fee | 107,319 |
| Independent Trustees' compensation | 12,161 |
| Custodian fee | 127,205 |
| Shareholder communications | 53,553 |
| Audit and tax fees | 46,158 |
| Legal fees | 3,304 |
| Miscellaneous | 137,649 |
| Total expenses | $7,661,324 |
| Fees paid indirectly | (12,619) |
| Reduction of expenses by investment adviser and distributor | (681,688) |
| Net expenses | $6,967,017 |
| Net investment income (loss) | $14,640,697 |
40
Statement of Operations (unaudited)
– continued
| Realized and unrealized gain (loss) | |
| Realized gain (loss) (identified cost basis) | |
| Unaffiliated issuers (net of $20,567 country tax) | $17,647,456 |
| Affiliated issuers | 1,389 |
| Written options | 41,818 |
| Futures contracts | 2,200,877 |
| Swap agreements | 319,667 |
| Forward foreign currency exchange contracts | 2,203,423 |
| Foreign currency | 160,592 |
| Net realized gain (loss) | $22,575,222 |
| Change in unrealized appreciation or depreciation | |
| Unaffiliated issuers (net of $9,064 decrease in deferred country tax) | $106,230,298 |
| Affiliated issuers | 2,456 |
| Written options | (40,158) |
| Futures contracts | (4,014,196) |
| Swap agreements | 30,362 |
| Forward foreign currency exchange contracts | (713,790) |
| Translation of assets and liabilities in foreign currencies | 344,336 |
| Net unrealized gain (loss) | $101,839,308 |
| Net realized and unrealized gain (loss) | $124,414,530 |
| Change in net assets from operations | $139,055,227 |
See Notes to Financial Statements
41
Financial Statements
Statements of Changes in Net
Assets
These statements describe the
increases and/or decreases in net assets resulting from operations, any distributions, and any shareholder transactions.
| Six months ended | Year ended | |
| 4/30/23 (unaudited) | 10/31/22 | |
| Change in net assets | ||
| From operations | ||
| Net investment income (loss) | $14,640,697 | $26,808,907 |
| Net realized gain (loss) | 22,575,222 | 8,752,132 |
| Net unrealized gain (loss) | 101,839,308 | (289,313,380) |
| Change in net assets from operations | $139,055,227 | $(253,752,341) |
| Total distributions to shareholders | $(38,986,562) | $(158,295,050) |
| Change in net assets from fund share transactions | $(79,442,733) | $(58,826,426) |
| Total change in net assets | $20,625,932 | $(470,873,817) |
| Net assets | ||
| At beginning of period | 1,365,914,743 | 1,836,788,560 |
| At end of period | $1,386,540,675 | $1,365,914,743 |
See Notes to Financial Statements
42
Financial Statements
Financial Highlights
The financial highlights table is
intended to help you understand the fund's financial performance for the semiannual period and the past 5 fiscal years. Certain information reflects financial results for a single fund share. The total returns in the
table represent the rate that an investor would have earned (or lost) on an investment in the fund share class (assuming reinvestment of all distributions) held for the entire period.
| Class A | Six months ended | Year ended | ||||
| 4/30/23 (unaudited) | 10/31/22 | 10/31/21 | 10/31/20 | 10/31/19 | 10/31/18 | |
| Net asset value, beginning of period | $15.57 | $19.98 | $17.90 | $18.51 | $17.02 | $18.08 |
| Income (loss) from investment operations | ||||||
| Net investment income (loss) (d) | $0.16 | $0.27 | $0.24 | $0.22 | $0.30 | $0.27 |
| Net realized and unrealized gain (loss) | 1.45 | (2.96) | 3.22 | (0.03) | 1.70 | (0.81) |
| Total from investment operations | $1.61 | $(2.69) | $3.46 | $0.19 | $2.00 | $(0.54) |
| Less distributions declared to shareholders | ||||||
| From net investment income | $(0.02) | $(0.09) | $(0.35) | $(0.29) | $(0.23) | $(0.28) |
| From net realized gain | (0.42) | (1.63) | (1.03) | (0.51) | (0.28) | (0.24) |
| Total distributions declared to shareholders | $(0.44) | $(1.72) | $(1.38) | $(0.80) | $(0.51) | $(0.52) |
| Net asset value, end of period (x) | $16.74 | $15.57 | $19.98 | $17.90 | $18.51 | $17.02 |
| Total return (%) (r)(s)(t)(x) | 10.50(n) | (14.80) | 19.88 | 1.00 | 12.03 | (3.12) |
| Ratios (%) (to average net assets) and Supplemental data: | ||||||
| Expenses before expense reductions (f) | 1.19(a) | 1.18 | 1.16 | 1.17 | 1.16 | 1.15 |
| Expenses after expense reductions (f) | 1.09(a) | 1.09 | 1.09 | 1.09 | 1.09 | 1.09 |
| Net investment income (loss) | 2.02(a) | 1.59 | 1.24 | 1.26 | 1.70 | 1.48 |
| Portfolio turnover | 36(n) | 70 | 94 | 89 | 65 | 52 |
| Net assets at end of period (000 omitted) | $655,771 | $626,577 | $810,477 | $698,352 | $754,092 | $731,699 |
See Notes to Financial Statements
43
Financial Highlights – continued
| Class B | Six months ended | Year ended | ||||
| 4/30/23 (unaudited) | 10/31/22 | 10/31/21 | 10/31/20 | 10/31/19 | 10/31/18 | |
| Net asset value, beginning of period | $15.89 | $20.45 | $18.29 | $18.88 | $17.34 | $18.41 |
| Income (loss) from investment operations | ||||||
| Net investment income (loss) (d) | $0.10 | $0.14 | $0.10 | $0.09 | $0.17 | $0.13 |
| Net realized and unrealized gain (loss) | 1.48 | (3.03) | 3.29 | (0.03) | 1.73 | (0.83) |
| Total from investment operations | $1.58 | $(2.89) | $3.39 | $0.06 | $1.90 | $(0.70) |
| Less distributions declared to shareholders | ||||||
| From net investment income | $— | $(0.04) | $(0.20) | $(0.14) | $(0.08) | $(0.13) |
| From net realized gain | (0.42) | (1.63) | (1.03) | (0.51) | (0.28) | (0.24) |
| Total distributions declared to shareholders | $(0.42) | $(1.67) | $(1.23) | $(0.65) | $(0.36) | $(0.37) |
| Net asset value, end of period (x) | $17.05 | $15.89 | $20.45 | $18.29 | $18.88 | $17.34 |
| Total return (%) (r)(s)(t)(x) | 10.06(n) | (15.43) | 18.96 | 0.26 | 11.21 | (3.90) |
| Ratios (%) (to average net assets) and Supplemental data: | ||||||
| Expenses before expense reductions (f) | 1.94(a) | 1.93 | 1.91 | 1.92 | 1.91 | 1.90 |
| Expenses after expense reductions (f) | 1.84(a) | 1.84 | 1.84 | 1.84 | 1.84 | 1.84 |
| Net investment income (loss) | 1.24(a) | 0.80 | 0.49 | 0.51 | 0.96 | 0.72 |
| Portfolio turnover | 36(n) | 70 | 94 | 89 | 65 | 52 |
| Net assets at end of period (000 omitted) | $8,589 | $9,966 | $17,638 | $19,630 | $28,393 | $36,088 |
See Notes to Financial Statements
44
Financial Highlights – continued
| Class C | Six months ended | Year ended | ||||
| 4/30/23 (unaudited) | 10/31/22 | 10/31/21 | 10/31/20 | 10/31/19 | 10/31/18 | |
| Net asset value, beginning of period | $15.61 | $20.12 | $18.01 | $18.60 | $17.10 | $18.15 |
| Income (loss) from investment operations | ||||||
| Net investment income (loss) (d) | $0.10 | $0.14 | $0.10 | $0.09 | $0.17 | $0.13 |
| Net realized and unrealized gain (loss) | 1.44 | (2.98) | 3.24 | (0.03) | 1.70 | (0.80) |
| Total from investment operations | $1.54 | $(2.84) | $3.34 | $0.06 | $1.87 | $(0.67) |
| Less distributions declared to shareholders | ||||||
| From net investment income | $— | $(0.04) | $(0.20) | $(0.14) | $(0.09) | $(0.14) |
| From net realized gain | (0.42) | (1.63) | (1.03) | (0.51) | (0.28) | (0.24) |
| Total distributions declared to shareholders | $(0.42) | $(1.67) | $(1.23) | $(0.65) | $(0.37) | $(0.38) |
| Net asset value, end of period (x) | $16.73 | $15.61 | $20.12 | $18.01 | $18.60 | $17.10 |
| Total return (%) (r)(s)(t)(x) | 9.99(n) | (15.43) | 19.00 | 0.28 | 11.14 | (3.81) |
| Ratios (%) (to average net assets) and Supplemental data: | ||||||
| Expenses before expense reductions (f) | 1.94(a) | 1.93 | 1.91 | 1.92 | 1.91 | 1.90 |
| Expenses after expense reductions (f) | 1.84(a) | 1.84 | 1.84 | 1.84 | 1.84 | 1.84 |
| Net investment income (loss) | 1.26(a) | 0.81 | 0.49 | 0.52 | 0.96 | 0.72 |
| Portfolio turnover | 36(n) | 70 | 94 | 89 | 65 | 52 |
| Net assets at end of period (000 omitted) | $61,957 | $67,989 | $116,520 | $144,961 | $211,090 | $255,464 |
See Notes to Financial Statements
45
Financial Highlights – continued
| Class I | Six months ended | Year ended | ||||
| 4/30/23 (unaudited) | 10/31/22 | 10/31/21 | 10/31/20 | 10/31/19 | 10/31/18 | |
| Net asset value, beginning of period | $15.37 | $19.75 | $17.70 | $18.31 | $16.85 | $17.91 |
| Income (loss) from investment operations | ||||||
| Net investment income (loss) (d) | $0.18 | $0.31 | $0.29 | $0.27 | $0.34 | $0.31 |
| Net realized and unrealized gain (loss) | 1.42 | (2.93) | 3.19 | (0.04) | 1.67 | (0.81) |
| Total from investment operations | $1.60 | $(2.62) | $3.48 | $0.23 | $2.01 | $(0.50) |
| Less distributions declared to shareholders | ||||||
| From net investment income | $(0.04) | $(0.13) | $(0.40) | $(0.33) | $(0.27) | $(0.32) |
| From net realized gain | (0.42) | (1.63) | (1.03) | (0.51) | (0.28) | (0.24) |
| Total distributions declared to shareholders | $(0.46) | $(1.76) | $(1.43) | $(0.84) | $(0.55) | $(0.56) |
| Net asset value, end of period (x) | $16.51 | $15.37 | $19.75 | $17.70 | $18.31 | $16.85 |
| Total return (%) (r)(s)(t)(x) | 10.58(n) | (14.59) | 20.23 | 1.27 | 12.26 | (2.90) |
| Ratios (%) (to average net assets) and Supplemental data: | ||||||
| Expenses before expense reductions (f) | 0.94(a) | 0.93 | 0.91 | 0.92 | 0.91 | 0.90 |
| Expenses after expense reductions (f) | 0.84(a) | 0.84 | 0.84 | 0.84 | 0.84 | 0.84 |
| Net investment income (loss) | 2.27(a) | 1.83 | 1.49 | 1.50 | 1.94 | 1.75 |
| Portfolio turnover | 36(n) | 70 | 94 | 89 | 65 | 52 |
| Net assets at end of period (000 omitted) | $407,468 | $420,715 | $597,469 | $524,907 | $569,767 | $667,895 |
See Notes to Financial Statements
46
Financial Highlights – continued
| Class R1 | Six months ended | Year ended | ||||
| 4/30/23 (unaudited) | 10/31/22 | 10/31/21 | 10/31/20 | 10/31/19 | 10/31/18 | |
| Net asset value, beginning of period | $15.49 | $19.98 | $17.90 | $18.51 | $17.02 | $18.08 |
| Income (loss) from investment operations | ||||||
| Net investment income (loss) (d) | $0.10 | $0.15 | $0.10 | $0.09 | $0.17 | $0.12 |
| Net realized and unrealized gain (loss) | 1.44 | (2.97) | 3.22 | (0.03) | 1.69 | (0.80) |
| Total from investment operations | $1.54 | $(2.82) | $3.32 | $0.06 | $1.86 | $(0.68) |
| Less distributions declared to shareholders | ||||||
| From net investment income | $— | $(0.04) | $(0.21) | $(0.16) | $(0.09) | $(0.14) |
| From net realized gain | (0.42) | (1.63) | (1.03) | (0.51) | (0.28) | (0.24) |
| Total distributions declared to shareholders | $(0.42) | $(1.67) | $(1.24) | $(0.67) | $(0.37) | $(0.38) |
| Net asset value, end of period (x) | $16.61 | $15.49 | $19.98 | $17.90 | $18.51 | $17.02 |
| Total return (%) (r)(s)(t)(x) | 10.06(n) | (15.43) | 18.99 | 0.23 | 11.18 | (3.84) |
| Ratios (%) (to average net assets) and Supplemental data: | ||||||
| Expenses before expense reductions (f) | 1.94(a) | 1.93 | 1.91 | 1.92 | 1.91 | 1.90 |
| Expenses after expense reductions (f) | 1.84(a) | 1.84 | 1.84 | 1.84 | 1.84 | 1.84 |
| Net investment income (loss) | 1.28(a) | 0.87 | 0.49 | 0.51 | 0.96 | 0.65 |
| Portfolio turnover | 36(n) | 70 | 94 | 89 | 65 | 52 |
| Net assets at end of period (000 omitted) | $2,438 | $2,218 | $2,432 | $2,396 | $2,483 | $2,352 |
See Notes to Financial Statements
47
Financial Highlights – continued
| Class R2 | Six months ended | Year ended | ||||
| 4/30/23 (unaudited) | 10/31/22 | 10/31/21 | 10/31/20 | 10/31/19 | 10/31/18 | |
| Net asset value, beginning of period | $15.36 | $19.76 | $17.71 | $18.31 | $16.84 | $17.89 |
| Income (loss) from investment operations | ||||||
| Net investment income (loss) (d) | $0.14 | $0.23 | $0.19 | $0.18 | $0.25 | $0.22 |
| Net realized and unrealized gain (loss) | 1.43 | (2.93) | 3.19 | (0.04) | 1.68 | (0.80) |
| Total from investment operations | $1.57 | $(2.70) | $3.38 | $0.14 | $1.93 | $(0.58) |
| Less distributions declared to shareholders | ||||||
| From net investment income | $(0.02) | $(0.07) | $(0.30) | $(0.23) | $(0.18) | $(0.23) |
| From net realized gain | (0.42) | (1.63) | (1.03) | (0.51) | (0.28) | (0.24) |
| Total distributions declared to shareholders | $(0.44) | $(1.70) | $(1.33) | $(0.74) | $(0.46) | $(0.47) |
| Net asset value, end of period (x) | $16.49 | $15.36 | $19.76 | $17.71 | $18.31 | $16.84 |
| Total return (%) (r)(s)(t)(x) | 10.33(n) | (14.98) | 19.61 | 0.75 | 11.74 | (3.37) |
| Ratios (%) (to average net assets) and Supplemental data: | ||||||
| Expenses before expense reductions (f) | 1.44(a) | 1.43 | 1.41 | 1.42 | 1.41 | 1.40 |
| Expenses after expense reductions (f) | 1.34(a) | 1.34 | 1.34 | 1.34 | 1.34 | 1.34 |
| Net investment income (loss) | 1.76(a) | 1.35 | 0.99 | 1.00 | 1.44 | 1.21 |
| Portfolio turnover | 36(n) | 70 | 94 | 89 | 65 | 52 |
| Net assets at end of period (000 omitted) | $3,941 | $4,022 | $5,047 | $4,997 | $11,286 | $13,788 |
See Notes to Financial Statements
48
Financial Highlights – continued
| Class R3 | Six months ended | Year ended | ||||
| 4/30/23 (unaudited) | 10/31/22 | 10/31/21 | 10/31/20 | 10/31/19 | 10/31/18 | |
| Net asset value, beginning of period | $15.52 | $19.92 | $17.85 | $18.45 | $16.97 | $18.03 |
| Income (loss) from investment operations | ||||||
| Net investment income (loss) (d) | $0.16 | $0.27 | $0.24 | $0.22 | $0.30 | $0.26 |
| Net realized and unrealized gain (loss) | 1.43 | (2.95) | 3.21 | (0.02) | 1.69 | (0.80) |
| Total from investment operations | $1.59 | $(2.68) | $3.45 | $0.20 | $1.99 | $(0.54) |
| Less distributions declared to shareholders | ||||||
| From net investment income | $(0.02) | $(0.09) | $(0.35) | $(0.29) | $(0.23) | $(0.28) |
| From net realized gain | (0.42) | (1.63) | (1.03) | (0.51) | (0.28) | (0.24) |
| Total distributions declared to shareholders | $(0.44) | $(1.72) | $(1.38) | $(0.80) | $(0.51) | $(0.52) |
| Net asset value, end of period (x) | $16.67 | $15.52 | $19.92 | $17.85 | $18.45 | $16.97 |
| Total return (%) (r)(s)(t)(x) | 10.41(n) | (14.78) | 19.88 | 1.05 | 12.01 | (3.14) |
| Ratios (%) (to average net assets) and Supplemental data: | ||||||
| Expenses before expense reductions (f) | 1.19(a) | 1.18 | 1.16 | 1.17 | 1.16 | 1.15 |
| Expenses after expense reductions (f) | 1.09(a) | 1.09 | 1.09 | 1.09 | 1.09 | 1.09 |
| Net investment income (loss) | 2.01(a) | 1.59 | 1.24 | 1.25 | 1.69 | 1.47 |
| Portfolio turnover | 36(n) | 70 | 94 | 89 | 65 | 52 |
| Net assets at end of period (000 omitted) | $12,954 | $16,923 | $19,529 | $19,799 | $20,300 | $18,795 |
See Notes to Financial Statements
49
Financial Highlights – continued
| Class R4 | Six months ended | Year ended | ||||
| 4/30/23 (unaudited) | 10/31/22 | 10/31/21 | 10/31/20 | 10/31/19 | 10/31/18 | |
| Net asset value, beginning of period | $15.60 | $20.02 | $17.93 | $18.54 | $17.05 | $18.11 |
| Income (loss) from investment operations | ||||||
| Net investment income (loss) (d) | $0.19 | $0.32 | $0.29 | $0.27 | $0.34 | $0.31 |
| Net realized and unrealized gain (loss) | 1.44 | (2.98) | 3.23 | (0.04) | 1.70 | (0.81) |
| Total from investment operations | $1.63 | $(2.66) | $3.52 | $0.23 | $2.04 | $(0.50) |
| Less distributions declared to shareholders | ||||||
| From net investment income | $(0.04) | $(0.13) | $(0.40) | $(0.33) | $(0.27) | $(0.32) |
| From net realized gain | (0.42) | (1.63) | (1.03) | (0.51) | (0.28) | (0.24) |
| Total distributions declared to shareholders | $(0.46) | $(1.76) | $(1.43) | $(0.84) | $(0.55) | $(0.56) |
| Net asset value, end of period (x) | $16.77 | $15.60 | $20.02 | $17.93 | $18.54 | $17.05 |
| Total return (%) (r)(s)(t)(x) | 10.62(n) | (14.59) | 20.19 | 1.25 | 12.30 | (2.87) |
| Ratios (%) (to average net assets) and Supplemental data: | ||||||
| Expenses before expense reductions (f) | 0.94(a) | 0.93 | 0.91 | 0.92 | 0.91 | 0.90 |
| Expenses after expense reductions (f) | 0.84(a) | 0.84 | 0.84 | 0.84 | 0.84 | 0.84 |
| Net investment income (loss) | 2.28(a) | 1.88 | 1.50 | 1.51 | 1.95 | 1.71 |
| Portfolio turnover | 36(n) | 70 | 94 | 89 | 65 | 52 |
| Net assets at end of period (000 omitted) | $5,397 | $5,018 | $6,058 | $6,461 | $7,570 | $7,514 |
See Notes to Financial Statements
50
Financial Highlights – continued
| Class R6 | Six months ended | Year ended | ||||
| 4/30/23 (unaudited) | 10/31/22 | 10/31/21 | 10/31/20 | 10/31/19 | 10/31/18 | |
| Net asset value, beginning of period | $15.37 | $19.75 | $17.71 | $18.32 | $16.85 | $17.91 |
| Income (loss) from investment operations | ||||||
| Net investment income (loss) (d) | $0.19 | $0.33 | $0.31 | $0.28 | $0.35 | $0.33 |
| Net realized and unrealized gain (loss) | 1.42 | (2.93) | 3.18 | (0.03) | 1.69 | (0.81) |
| Total from investment operations | $1.61 | $(2.60) | $3.49 | $0.25 | $2.04 | $(0.48) |
| Less distributions declared to shareholders | ||||||
| From net investment income | $(0.05) | $(0.15) | $(0.42) | $(0.35) | $(0.29) | $(0.34) |
| From net realized gain | (0.42) | (1.63) | (1.03) | (0.51) | (0.28) | (0.24) |
| Total distributions declared to shareholders | $(0.47) | $(1.78) | $(1.45) | $(0.86) | $(0.57) | $(0.58) |
| Net asset value, end of period (x) | $16.51 | $15.37 | $19.75 | $17.71 | $18.32 | $16.85 |
| Total return (%) (r)(s)(t)(x) | 10.62(n) | (14.50) | 20.26 | 1.36 | 12.44 | (2.82) |
| Ratios (%) (to average net assets) and Supplemental data: | ||||||
| Expenses before expense reductions (f) | 0.85(a) | 0.84 | 0.82 | 0.83 | 0.82 | 0.81 |
| Expenses after expense reductions (f) | 0.76(a) | 0.75 | 0.75 | 0.75 | 0.75 | 0.75 |
| Net investment income (loss) | 2.36(a) | 1.94 | 1.58 | 1.60 | 2.03 | 1.83 |
| Portfolio turnover | 36(n) | 70 | 94 | 89 | 65 | 52 |
| Net assets at end of period (000 omitted) | $228,026 | $212,487 | $261,619 | $229,244 | $230,324 | $363,364 |
| (a) | Annualized. |
| (d) | Per share data is based on average shares outstanding. |
| (f) | Ratios do not reflect reductions from fees paid indirectly, if applicable. See Note 2 in the Notes to Financial Statements for additional information. |
| (n) | Not annualized. |
| (r) | Certain expenses have been reduced without which performance would have been lower. |
| (s) | From time to time the fund may receive proceeds from litigation settlements, without which performance would be lower. |
| (t) | Total returns do not include any applicable sales charges. |
| (x) | The net asset values and total returns have been calculated on net assets which include adjustments made in accordance with U.S. generally accepted accounting principles required at period end for financial reporting purposes. |
See Notes to Financial Statements
51
Notes to Financial Statements
(unaudited)
(1) Business and
Organization
MFS Global Total Return Fund (the
fund) is a diversified series of MFS Series Trust VI (the trust). The trust is organized as a Massachusetts business trust and is registered under the Investment Company Act of 1940, as amended, as an open-end
management investment company.
The fund is an investment company
and accordingly follows the investment company accounting and reporting guidance of the Financial Accounting Standards Board (FASB) Accounting Standards Codification Topic 946 Financial Services - Investment
Companies.
(2) Significant Accounting
Policies
General — The preparation of financial statements in conformity with U.S. generally accepted accounting principles requires management to make estimates and assumptions that affect the
reported amounts of assets and liabilities, and disclosure of contingent assets and liabilities at the date of the financial statements and the reported amounts of increases and decreases in net assets from operations
during the reporting period. Actual results could differ from those estimates. In the preparation of these financial statements, management has evaluated subsequent events occurring after the date of the fund’s
Statement of Assets and Liabilities through the date that the financial statements were issued. The fund invests in foreign securities. Investments in foreign securities are vulnerable to the effects of changes in the relative values of the local currency and the U.S. dollar and to
the effects of changes in each country’s market, economic, industrial, political, regulatory, geopolitical, environmental, public health, and other conditions.
Balance Sheet Offsetting — The fund's accounting policy with respect to balance sheet offsetting is that, absent an event of default by the counterparty or a termination of the agreement, the International
Swaps and Derivatives Association (ISDA) Master Agreement, or similar agreement, does not result in an offset of reported amounts of financial assets and financial liabilities in the Statement of Assets and
Liabilities across transactions between the fund and the applicable counterparty. The fund's right to setoff may be restricted or prohibited by the bankruptcy or insolvency laws of the particular jurisdiction to which
a specific master netting agreement counterparty is subject. Balance sheet offsetting disclosures, to the extent applicable to the fund, have been included in the fund’s Significant Accounting Policies note
under the captions for each of the fund’s in-scope financial instruments and transactions.
Investment Valuations — Subject to its oversight, the fund's Board of Trustees has delegated primary responsibility for determining or causing to be determined the value of the fund’s investments to MFS as
the fund's adviser, pursuant to the fund’s valuation policy and procedures which have been adopted by the adviser and approved by the Board. In accordance with Rule 2a-5 under the Investment Company Act of
1940, the Board of Trustees designated the adviser as the “valuation designee” of the fund. If the adviser, as valuation designee, determines that reliable market quotations are not readily available for
an investment, the investment is valued at fair value as determined in good faith by the adviser in accordance with the adviser’s fair valuation policy and procedures.
52
Notes to Financial
Statements (unaudited) - continued
Under the fund's valuation policy
and procedures, equity securities, including restricted equity securities, are generally valued at the last sale or official closing price on their primary market or exchange as provided by a third-party pricing
service. Equity securities, for which there were no sales reported that day, are generally valued at the last quoted daily bid quotation on their primary market or exchange as provided by a third-party pricing
service. Debt instruments and floating rate loans, including restricted debt instruments, are generally valued at an evaluated or composite bid as provided by a third-party pricing service. Short-term instruments with
a maturity at issuance of 60 days or less may be valued at amortized cost, which approximates market value.
Exchange-traded options are generally valued at the
last sale or official closing price on their primary exchange as provided by a third-party pricing service. Exchange-traded options for which there were no sales reported that day are generally valued at the last
daily bid quotation on their primary exchange as provided by a third-party pricing service. For put options, the position may be valued at the last daily ask quotation if there are no trades reported during the day.
Options not traded on an exchange are generally valued at a broker/dealer bid quotation. Foreign currency options are generally valued at valuations provided by a third-party pricing service. Futures contracts are
generally valued at last posted settlement price on their primary exchange as provided by a third-party pricing service. Futures contracts for which there were no trades that day for a particular position are
generally valued at the closing bid quotation on their primary exchange as provided by a third-party pricing service.
Forward foreign currency exchange contracts are
generally valued at the mean of bid and asked prices for the time period interpolated from rates provided by a third-party pricing service for proximate time periods. Swap agreements are generally valued using
valuations provided by a third-party pricing service, which for cleared swaps includes an evaluation of any trading activity at the clearinghouses. Open-end investment companies are generally valued at net asset value
per share. The values of foreign securities and other assets and liabilities expressed in foreign currencies are converted to U.S. dollars using the mean of bid and asked prices for rates provided by a third-party
pricing service.
Under the fund’s valuation
policy and procedures, market quotations are not considered to be readily available for debt instruments, floating rate loans, and many types of derivatives. These investments are generally valued at fair value based
on information from third-party pricing services or otherwise determined by the adviser in accordance with the adviser’s fair valuation policy and procedures. Securities and other assets generally valued on the
basis of information from a third-party pricing service may also be valued at a broker/dealer bid quotation. In determining values, third-party pricing services can utilize both transaction data and market information
such as yield, quality, coupon rate, maturity, type of issue, trading characteristics, spreads and other market data. An investment may also be valued at fair value if the adviser determines that the
investment’s value has been materially affected by events occurring after the close of the exchange or market on which the investment is principally traded (such as foreign exchange or market) and prior to the
determination of the fund’s net asset value, or after the halt of trading of a specific security where trading does not resume prior to the close of the exchange or market on which the security is principally
traded. Events that occur after foreign markets close (such as developments in foreign markets and significant movements in the U.S. markets) and prior to the determination of the fund’s net asset value may be
deemed to have a material effect on the value of securities traded in foreign markets. Accordingly, the fund’s foreign equity securities
53
Notes to Financial
Statements (unaudited) - continued
may often be valued at fair value. The adviser
generally relies on third-party pricing services or other information (such as the correlation with price movements of similar securities in the same or other markets; the type, cost and investment characteristics of
the security; the business and financial condition of the issuer; and trading and other market data) to assist in determining whether to fair value and at what value to fair value an investment. The value of an
investment for purposes of calculating the fund’s net asset value can differ depending on the source and method used to determine value. When fair valuation is used, the value of an investment used to determine
the fund’s net asset value may differ from quoted or published prices for the same investment. There can be no assurance that the fund could obtain the fair value assigned to an investment if it were to sell the
investment at the same time at which the fund determines its net asset value per share.
Various inputs are used in
determining the value of the fund's assets or liabilities. These inputs are categorized into three broad levels. In certain cases, the inputs used to measure fair value may fall into different levels of the fair value
hierarchy. In such cases, an investment's level within the fair value hierarchy is based on the lowest level of input that is significant to the fair value measurement. The fund's assessment of the significance of a
particular input to the fair value measurement in its entirety requires judgment, and considers factors specific to the investment. Level 1 includes unadjusted quoted prices in active markets for identical assets or
liabilities. Level 2 includes other significant observable market-based inputs (including quoted prices for similar securities, interest rates, prepayment speed, and credit risk). Level 3 includes significant
unobservable inputs, which may include the adviser's own assumptions in determining the fair value of investments. Other financial instruments are derivative instruments, such as futures contracts, forward foreign
currency exchange contracts, and swap agreements. The following is a summary of the levels used as of April 30, 2023 in valuing the fund's assets and liabilities:
54
Notes to Financial
Statements (unaudited) - continued
| Financial Instruments | Level 1 | Level 2 | Level 3 | Total |
| Equity Securities: | ||||
| United States | $454,334,453 | $— | $— | $454,334,453 |
| United Kingdom | 20,098,125 | 42,231,965 | — | 62,330,090 |
| Japan | 4,851,906 | 49,043,033 | — | 53,894,939 |
| France | 7,420,662 | 46,016,275 | — | 53,436,937 |
| Switzerland | 19,752,310 | 32,311,430 | — | 52,063,740 |
| Germany | 28,285,197 | — | — | 28,285,197 |
| Canada | 22,239,159 | — | — | 22,239,159 |
| Netherlands | — | 16,397,657 | — | 16,397,657 |
| South Korea | — | 12,117,586 | — | 12,117,586 |
| Other Countries | 30,332,961 | 42,894,807 | 0 | 73,227,768 |
| U.S. Treasury Bonds & U.S. Government Agencies & Equivalents | — | 26,711,385 | — | 26,711,385 |
| Non - U.S. Sovereign Debt | — | 235,995,438 | — | 235,995,438 |
| Municipal Bonds | — | 9,775,206 | — | 9,775,206 |
| U.S. Corporate Bonds | — | 70,362,164 | — | 70,362,164 |
| Residential Mortgage-Backed Securities | — | 53,580,602 | — | 53,580,602 |
| Commercial Mortgage-Backed Securities | — | 15,172,966 | — | 15,172,966 |
| Asset-Backed Securities (including CDOs) | — | 29,283,356 | — | 29,283,356 |
| Foreign Bonds | — | 97,620,599 | — | 97,620,599 |
| Mutual Funds | 23,296,984 | — | — | 23,296,984 |
| Total | $610,611,757 | $779,514,469 | $0 | $1,390,126,226 |
| Other Financial Instruments | ||||
| Futures Contracts – Assets | $1,533,685 | $— | $— | $1,533,685 |
| Futures Contracts – Liabilities | (2,336,506) | — | — | (2,336,506) |
| Forward Foreign Currency Exchange Contracts – Assets | — | 1,461,335 | — | 1,461,335 |
| Forward Foreign Currency Exchange Contracts – Liabilities | — | (1,231,541) | — | (1,231,541) |
| Swap Agreements – Assets | — | 159,225 | — | 159,225 |
For further information regarding
security characteristics, see the Portfolio of Investments. At April 30, 2023, the fund held two level 3 securities valued at $0, which were also held and valued at $0 at October 31, 2022.
Foreign Currency Translation — Purchases and sales of foreign investments, income, and expenses are converted into U.S. dollars based upon currency exchange rates prevailing on the respective dates of such
transactions or on the reporting date for foreign denominated receivables and payables. Gains and losses attributable to foreign currency exchange rates on sales of securities are recorded for financial statement
purposes as net realized gains and losses on investments. Gains and losses attributable to foreign exchange rate movements on receivables, payables, income and expenses
55
Notes to Financial
Statements (unaudited) - continued
are recorded for financial statement purposes as
foreign currency transaction gains and losses. That portion of both realized and unrealized gains and losses on investments that results from fluctuations in foreign currency exchange rates is not separately
disclosed.
Derivatives — The fund uses derivatives primarily to increase or decrease exposure to a particular market or segment of the market, or security, to increase or decrease interest rate or currency
exposure, or as alternatives to direct investments. Derivatives are used for hedging or non-hedging purposes. While hedging can reduce or eliminate losses, it can also reduce or eliminate gains. When the fund uses
derivatives as an investment to increase market exposure, or for hedging purposes, gains and losses from derivative instruments may be substantially greater than the derivative’s original cost.
The derivative instruments used by
the fund during the period were written options, purchased options, futures contracts, forward foreign currency exchange contracts, and swap agreements. Depending on the type of derivative, a fund may exit a
derivative position by entering into an offsetting transaction with a counterparty or exchange, negotiating an agreement with the derivative counterparty, or novating the position to a third party. The fund may be
unable to promptly close out a futures position in instances where the daily fluctuation in the price for that type of future exceeds the daily limit set by the exchange. The fund's period end derivatives, as
presented in the Portfolio of Investments and the associated Derivative Contract tables, generally are indicative of the volume of its derivative activity during the period.
The following table presents, by
major type of derivative contract, the fair value, on a gross basis, of the asset and liability components of derivatives held by the fund at April 30, 2023 as reported in the Statement of Assets and Liabilities:
| Fair Value (a) | |||
| Risk | Derivative Contracts | Asset Derivatives | Liability Derivatives |
| Credit | Purchased Option Contracts | $4,613 | $— |
| Interest Rate | Futures Contracts | 1,533,685 | (2,336,506) |
| Foreign Exchange | Forward Foreign Currency Exchange Contracts | 1,461,335 | (1,231,541) |
| Credit | Uncleared Swap Agreements | 159,225 | — |
| Total | $3,158,858 | $(3,568,047) | |
| (a) | The value of purchased options outstanding is included in investments in unaffiliated issuers, at value, within the Statement of Assets and Liabilities. Values presented in this table for futures contracts correspond to the values reported in the Portfolio of Investments. Only the current day net variation margin for futures contracts is reported separately within the Statement of Assets and Liabilities. |
56
Notes to Financial
Statements (unaudited) - continued
The following table presents, by
major type of derivative contract, the realized gain (loss) on derivatives held by the fund for the six months ended April 30, 2023 as reported in the Statement of Operations:
| Risk | Futures Contracts | Swap Agreements | Forward Foreign Currency Exchange Contracts | Unaffiliated Issuers (Purchased Options) | Written Options |
| Interest Rate | $2,200,877 | $— | $— | $— | $— |
| Foreign Exchange | — | — | 2,203,423 | — | — |
| Credit | — | 319,667 | — | 129,575 | 41,818 |
| Total | $2,200,877 | $319,667 | $2,203,423 | $129,575 | $41,818 |
The following table presents, by
major type of derivative contract, the change in unrealized appreciation or depreciation on derivatives held by the fund for the six months ended April 30, 2023 as reported in the Statement of Operations:
| Risk | Futures Contracts | Swap Agreements | Forward Foreign Currency Exchange Contracts | Unaffiliated Issuers (Purchased Options) | Written Options |
| Interest Rate | $(4,014,196) | $— | $— | $— | $— |
| Foreign Exchange | — | — | (713,790) | — | — |
| Credit | — | 30,362 | — | (102,095) | (40,158) |
| Total | $(4,014,196) | $30,362 | $(713,790) | $(102,095) | $(40,158) |
Derivative counterparty credit risk
is managed through formal evaluation of the creditworthiness of all potential counterparties. On certain, but not all, uncleared derivatives, the fund attempts to reduce its exposure to counterparty credit risk
whenever possible by entering into an ISDA Master Agreement on a bilateral basis. The ISDA Master Agreement gives each party to the agreement the right to terminate all transactions traded under such agreement if
there is a specified deterioration in the credit quality of the other party. Upon an event of default or a termination of the ISDA Master Agreement, the non-defaulting party has the right to close out all transactions
traded under such agreement and to net amounts owed under each agreement to one net amount payable by one party to the other. This right to close out and net payments across all transactions traded under the ISDA
Master Agreement could result in a reduction of the fund's credit risk to such counterparty equal to any amounts payable by the fund under the applicable transactions, if any.
Collateral and margin requirements
differ by type of derivative. For cleared derivatives (e.g., futures contracts, cleared swaps, and exchange-traded options), margin requirements are set by the clearing broker and the clearing house and collateral, in
the form of cash or securities, is posted by the fund directly with the clearing broker. Collateral terms are counterparty agreement specific for uncleared derivatives (e.g., forward foreign currency exchange
contracts, uncleared swap agreements, and uncleared options) and collateral, in the form of cash and securities, is held in segregated accounts with the fund's custodian in connection with these agreements. For
derivatives traded under an ISDA Master Agreement, which contains a credit support annex, the collateral requirements are netted across all transactions traded under such counterparty-specific agreement and an amount
is posted from one party to the other to collateralize such obligations. Cash that has been segregated or
57
Notes to Financial
Statements (unaudited) - continued
delivered to cover the fund's collateral or margin
obligations under derivative contracts, if any, will be reported separately in the Statement of Assets and Liabilities as restricted cash for uncleared derivatives and/or deposits with brokers for cleared derivatives.
Securities pledged as collateral or margin for the same purpose, if any, are noted in the Portfolio of Investments. The fund may be required to make payments of interest on uncovered collateral or margin obligations
with the broker. Any such payments are included in “Miscellaneous” expense in the Statement of Operations.
Written Options — In exchange for a premium, the fund wrote put options on securities for which it anticipated the price would increase. At the time the option was written, the fund believed the
premium received exceeded the potential loss that could result from adverse price changes in the options’ underlying securities. In a written option, the fund as the option writer grants the buyer the right to
purchase from, or sell to, the fund a specified number of shares or units of a particular security, currency or index at a specified price within a specified period of time.
The premium received is initially
recorded as a liability in the Statement of Assets and Liabilities. The option is subsequently marked-to-market daily with the difference between the premium received and the market value of the written option being
recorded as unrealized appreciation or depreciation. When a written option expires, the fund realizes a gain equal to the amount of the premium received. The difference between the premium received and the amount paid
on effecting a closing transaction is considered a realized gain or loss. When a written put option is exercised, the premium reduces the cost basis of the security purchased by the fund.
At the initiation of the written
option contract, for exchange traded options, the fund is required to deposit securities or cash as collateral with the custodian for the benefit of the broker or directly with the clearing broker, based on the type
of option. For uncleared options, the fund may post collateral subject to the terms of an ISDA Master Agreement as generally described above if the market value of the options contract moves against it. The fund, as
writer of an option, may have no control over whether the underlying securities may be sold (call) or purchased (put) and, as a result, bears the market risk of an unfavorable change in the price of the securities
underlying the written option. Losses from writing options can exceed the premium received and can exceed the potential loss from an ordinary buy and sell transaction. Although the fund’s market risk may be
significant, the maximum counterparty credit risk to the fund is equal to the market value of any collateral posted to the broker. For uncleared options, this risk is mitigated in cases where there is an ISDA Master
Agreement between the fund and the counterparty providing for netting as described above.
Purchased Options — The fund purchased call and put options for a premium. Purchased call and put options entitle the holder to buy and sell a specified number of shares or units of a particular
security, currency or index at a specified price at a specified date or within a specified period of time. Purchasing call options may hedge against an anticipated increase in the dollar cost of securities or currency
to be acquired or increase the fund’s exposure to an underlying instrument. Purchasing put options may hedge against an anticipated decline in the value of portfolio securities or currency or decrease the fund's
exposure to an underlying instrument.
The premium paid is initially
recorded as an investment in the Statement of Assets and Liabilities. That investment is subsequently marked-to-market daily with the difference between the premium paid and the market value of the purchased option
being recorded as unrealized appreciation or depreciation. Premiums paid for purchased call
58
Notes to Financial
Statements (unaudited) - continued
and put options which have expired are treated as
realized losses on investments in the Statement of Operations. Upon the exercise or closing of a purchased call option, the premium paid is added to the cost of the security or financial instrument purchased. Upon the
exercise or closing of a purchased put option, the premium paid is offset against the proceeds on the sale of the underlying security or financial instrument in order to determine the realized gain or loss on
investments.
Whether or not the option is
exercised, the fund's maximum risk of loss from purchasing an option is the amount of premium paid. All option contracts involve credit risk if the counterparty to the option contract fails to perform. For uncleared
options, this risk is mitigated in cases where there is an ISDA Master Agreement between the fund and the counterparty providing for netting as described above and, where applicable, by the posting of collateral by
the counterparty to the fund to cover the fund’s exposure to the counterparty under such ISDA Master Agreement.
Futures Contracts — The fund entered into futures contracts which may be used to hedge against or obtain broad market exposure, interest rate exposure, currency exposure, or to manage duration. A
futures contract represents a commitment for the future purchase or sale of an asset at a specified price on a specified date.
Upon entering into a futures
contract, the fund is required to deposit with the broker, either in cash or securities, an initial margin in an amount equal to a specified percentage of the notional amount of the contract. Subsequent payments
(variation margin) are made or received by the fund each day, depending on the daily fluctuations in the value of the contract, and are recorded for financial statement purposes as unrealized gain or loss by the fund
until the contract is closed or expires at which point the gain or loss on futures contracts is realized.
The fund bears the risk of interest
rates, exchange rates or securities prices moving unexpectedly, in which case, the fund may not achieve the anticipated benefits of the futures contracts and may realize a loss. While futures contracts may present
less counterparty risk to the fund since the contracts are exchange traded and the exchange’s clearinghouse guarantees payments to the broker, there is still counterparty credit risk due to the insolvency of the
broker. The fund’s maximum risk of loss due to counterparty credit risk is equal to the margin posted by the fund to the broker plus any gains or minus any losses on the outstanding futures contracts.
Forward Foreign Currency Exchange
Contracts — The fund entered into forward foreign currency exchange contracts for the purchase or sale of a specific foreign currency at a fixed price on a future date. These contracts may be
used to hedge the fund’s currency risk or for non-hedging purposes. For hedging purposes, the fund may enter into contracts to deliver or receive foreign currency that the fund will receive from or use in its
normal investment activities. The fund may also use contracts to hedge against declines in the value of foreign currency denominated securities due to unfavorable exchange rate movements. For non-hedging purposes, the
fund may enter into contracts with the intent of changing the relative exposure of the fund’s portfolio of securities to different currencies to take advantage of anticipated exchange rate changes.
59
Notes to Financial
Statements (unaudited) - continued
Forward foreign currency exchange
contracts are adjusted by the daily exchange rate of the underlying currency and any unrealized gains or losses are recorded as a receivable or payable for forward foreign currency exchange contracts until the
contract settlement date. On contract settlement date, any gain or loss on the contract is recorded as realized gains or losses on forward foreign currency exchange contracts.
Risks may arise upon entering into
these contracts from unanticipated movements in the value of the contract and from the potential inability of counterparties to meet the terms of their contracts. Generally, the fund’s maximum risk due to
counterparty credit risk is the unrealized gain on the contract due to the use of Continuous Linked Settlement, a multicurrency cash settlement system for the centralized settlement of foreign transactions. This risk
is mitigated in cases where there is an ISDA Master Agreement between the fund and the counterparty providing for netting as described above and, where applicable, by the posting of collateral by the counterparty to
the fund to cover the fund’s exposure to the counterparty under such ISDA Master Agreement.
Swap Agreements — The fund entered into swap agreements which generally involve a periodic exchange of cash payments on a net basis, at specified intervals or upon the occurrence of specified
events, between the fund and a counterparty. Certain swap agreements may be entered into as a bilateral contract (“uncleared swaps”) while others are required to be centrally cleared (“cleared
swaps”).
Both cleared and uncleared swap
agreements are marked to market daily. The value of uncleared swap agreements is reported in the Statement of Assets and Liabilities as “Uncleared swaps, at value” which includes any related interest
accruals to be paid or received by the fund. For cleared swaps, payments (variation margin) are made or received by the fund each day, depending on the daily fluctuations in the value of the cleared swap, such that
only the current day net receivable or payable for variation margin is reported in the Statement of Assets and Liabilities.
For both cleared and uncleared
swaps, premiums paid or received at the inception of the agreements are amortized over the term of the agreement as realized gain or loss on swap agreements in the Statement of Operations. The periodic exchange of net
cash payments, as well as any liquidation payment received or made upon early termination, are recorded as a realized gain or loss on swap agreements in the Statement of Operations. The change in unrealized
appreciation or depreciation on swap agreements in the Statement of Operations reflects the aggregate change over the reporting period in the value of swaps net of any unamortized premiums paid or received.
Risks related to swap agreements
include the possible lack of a liquid market, unfavorable market and interest rate movements of the underlying instrument and the failure of the counterparty to perform under the terms of the agreements. The fund's
maximum risk of loss from counterparty credit risk is the discounted net value of the cash flows to be received from/paid to the counterparty over the contract's remaining life, to the extent that the amount is
positive. To address counterparty risk, uncleared swap agreements are limited to only highly-rated counterparties. Risk is further reduced by having an ISDA Master Agreement (“ISDA”) between the fund and
the counterparty and, where applicable, by the posting of collateral by the counterparty to the fund to
60
Notes to Financial
Statements (unaudited) - continued
cover the fund’s exposure to the counterparty
under such ISDA. The fund's counterparty risk due to cleared swaps is mitigated by the fact that the clearinghouse is the true counterparty to the transaction and the regulatory requirement safeguards in the event of
a clearing broker bankruptcy.
The fund entered into credit default
swap agreements in order to manage its exposure to the market or certain sectors of the market, to reduce its credit risk exposure to defaults of corporate and sovereign issuers or to create exposure to corporate or
sovereign issuers to which it is not otherwise exposed. A credit default swap’s reference obligation may be either a single security or a basket of securities issued by corporate or sovereign issuers. At the
inception of the agreement, the protection buyer may make an upfront payment to or receive an upfront payment from the protection seller. Over the term of the agreement, the protection buyer will make a series of
periodic payments to the protection seller based on a fixed percentage applied to the agreement’s notional amount in exchange for a promise from the protection seller to make a specific payment should a defined
credit event occur with respect to the reference obligation. Although agreement-specific, credit events generally consist of a combination of the following: bankruptcy, failure to pay, restructuring, obligation
acceleration, obligation default, or repudiation/moratorium. If a defined credit event occurs, the protection buyer will either (i) receive from the protection seller an amount equal to the agreement’s notional
amount and deliver the reference obligation (i.e., physical settlement) or (ii) receive from the protection seller a net settlement of cash equal to the agreement’s notional amount less the recovery value of the
reference obligation. Upon determination of the final price for the reference obligation (or upon delivery of the reference obligation in the case of physical settlement), the difference between the recovery value of
the reference obligation and the agreement’s notional amount is recorded as realized gain or loss on swap agreements in the Statement of Operations.
Credit default swap agreements are
considered to have credit-risk-related contingent features since they trigger payment by the protection seller to the protection buyer upon the occurrence of a defined credit event. The maximum amount of future,
undiscounted payments that the fund, as protection seller, could be required to make is equal to the swap agreement’s notional amount. The protection seller’s payment obligation would be offset to the
extent of the value of the agreement’s deliverable obligation. At April 30, 2023, the fund did not hold any credit default swap agreements at an unrealized loss where it is the protection seller. The
fund’s maximum risk of loss from counterparty risk, either as the protection seller or as the protection buyer, is the fair value of the agreement.
Security Loans — Under its Securities Lending Agency Agreement with the fund, JPMorgan Chase and Co., as lending agent, loans the securities of the fund to certain qualified institutions (the
“Borrowers”) approved by the fund. Security loans can be terminated at the discretion of either the lending agent or the fund and the related securities must be returned within the earlier of the standard
trade settlement period for such securities or within three business days. The loans are collateralized by cash and/or U.S. Treasury and federal agency obligations in an amount typically at least equal to the market
value of the securities loaned. On loans collateralized by cash, the cash collateral is invested in a money market fund. The market value of the loaned securities is determined at the close of business of the fund and
any additional required collateral is delivered to the fund on the next business day. The lending agent provides the fund with indemnification against Borrower default. In the event of Borrower
61
Notes to Financial
Statements (unaudited) - continued
default, the lending agent will, for the benefit of
the fund, either purchase securities identical to those loaned or, when such purchase is commercially impracticable, pay the fund the market value of the loaned securities. In return, the lending agent assumes the
fund's rights to the related collateral. If the collateral value is less than the cost to purchase identical securities, the lending agent is responsible for the shortfall, but only to the extent that such shortfall
is not due to a decline in collateral value resulting from collateral reinvestment for which the fund bears the risk of loss. At period end, the fund had investment securities on loan, all of which were classified as
equity securities in the fund’s Portfolio of Investments, with a fair value of $1,669,786. The fair value of the fund’s investment securities on loan is presented gross in the Statement of Assets and
Liabilities. These loans were collateralized by U.S. Treasury Obligations of $1,759,978 held by the lending agent. The collateral on securities loaned exceeded the value of securities on loan at period end. A portion
of the income generated upon investment of the collateral is remitted to the Borrowers, and the remainder is allocated between the fund and the lending agent. On loans collateralized by U.S. Treasury and/or federal
agency obligations, a fee is received from the Borrower, and is allocated between the fund and the lending agent. Income from securities lending is separately reported in the Statement of Operations. The dividend and
interest income earned on the securities loaned is accounted for in the same manner as other dividend and interest income.
Indemnifications — Under the fund's organizational documents, its officers and Trustees may be indemnified against certain liabilities and expenses arising out of the performance of their duties to
the fund. Additionally, in the normal course of business, the fund enters into agreements with service providers that may contain indemnification clauses. The fund's maximum exposure under these agreements is unknown
as this would involve future claims that may be made against the fund that have not yet occurred.
Investment Transactions and
Income — Investment transactions are recorded on the trade date. Some securities may be purchased or sold on an extended settlement basis, which means that the receipt or delivery of the securities by the fund and related payments occur at a future
date, usually beyond the customary settlement period.
Interest income is recorded on the accrual basis.
All premium and discount is amortized or accreted for financial statement purposes in accordance with U.S. generally accepted accounting principles. Dividends received in cash are recorded on the ex-dividend date.
Certain dividends from foreign securities will be recorded when the fund is informed of the dividend if such information is obtained subsequent to the ex-dividend date. Dividend and interest payments received in
additional securities are recorded on the ex-dividend or ex-interest date in an amount equal to the value of the security on such date. In determining the net gain or loss on securities sold, the cost of securities is
determined on the identified cost basis.
The fund may receive proceeds from
litigation settlements. Any proceeds received from litigation involving portfolio holdings are reflected in the Statement of Operations in realized gain/loss if the security has been disposed of by the fund or in
unrealized gain/loss if the security is still held by the fund. Any other proceeds from litigation not related to portfolio holdings are reflected as other income in the Statement of Operations.
62
Notes to Financial
Statements (unaudited) - continued
The fund invests a significant
portion of its assets in asset-backed and/or mortgage-backed securities. For these securities, the value of the debt instrument also depends on the credit quality and adequacy of the underlying assets or collateral as
well as whether there is a security interest in the underlying assets or collateral. Enforcing rights, if any, against the underlying assets or collateral may be difficult. U.S. Government securities not supported as
to the payment of principal or interest by the U.S. Treasury, such as those issued by Fannie Mae, Freddie Mac, and the Federal Home Loan Banks, are subject to greater credit risk than are U.S. Government securities
supported by the U.S. Treasury, such as those issued by Ginnie Mae.
The fund may purchase or sell
mortgage-backed securities on a “To Be Announced” (TBA) basis. A TBA transaction is subject to extended settlement and typically does not designate the actual security to be delivered, but instead includes
an approximate principal amount. The price of the TBA security and the date that it will be settled are fixed at the time the transaction is negotiated. The value of the security varies with market fluctuations and no
interest accrues to the fund until settlement takes place. TBA purchase and sale commitments are held at carrying amount, which approximates fair value and are categorized as level 2 within the fair value hierarchy
and included in TBA purchase and TBA sale commitments in the Statement of Assets and Liabilities. Losses may arise as a result of changes in the value of the TBA investment prior to settlement date or due to
counterparty non-performance.
The fund may also enter into
mortgage dollar rolls, typically TBA dollar rolls, in which the fund sells TBA mortgage-backed securities to financial institutions and simultaneously agrees to repurchase similar (same issuer, type and coupon)
securities at a later date at an agreed-upon price. During the period between the sale and repurchase, the fund will not be entitled to receive interest and principal payments on the securities sold. The fund accounts
for dollar roll transactions as purchases and sales and realizes gains and losses on these transactions. Dollar roll transactions involve the risk that the market value of the securities that the fund is required to
purchase may decline below the agreed upon repurchase price of those securities.
The fund may purchase or sell
securities on a when-issued or delayed delivery basis. In these extended settlement transactions, the receipt or delivery of the securities by the fund and related payments occur at a future date, usually beyond the
normal settlement period. The price of such security and the date that the security will be settled are generally fixed at the time the transaction is negotiated. The value of the security varies with market
fluctuations and for debt securities no interest accrues to the fund until settlement takes place. When the fund sells securities on a when-issued or delayed delivery basis, the fund typically owns or has the right to
acquire securities equivalent in kind and amount to the securities sold. Purchase and sale commitments for when-issued or delayed delivery securities are held at carrying amount, which approximates fair value and are
categorized as level 2 within the fair value hierarchy, and included in When-issued investments purchased in the Statement of Assets and Liabilities. Losses may arise due to changes in the value of the underlying
securities prior to settlement date or if the counterparty does not perform under the contract’s terms, or if the issuer does not issue the securities due to political, economic or other factors.
To mitigate the counterparty credit
risk on TBA transactions, mortgage dollar rolls, and other types of forward settling mortgage-backed and asset-backed security transactions, the fund whenever possible enters into a Master Securities Forward
63
Notes to Financial
Statements (unaudited) - continued
Transaction Agreement (“MSFTA”) on a
bilateral basis with each of the counterparties with whom it undertakes a significant volume of transactions. The MSFTA gives each party to the agreement the right to terminate all transactions traded under such
agreement if there is a specified deterioration in the credit quality of the other party. Upon an event of default or a termination of the MSFTA, the non-defaulting party has the right to close out all transactions
traded under such agreement and to net amounts owed under each transaction to one net amount payable by one party to the other. This right to close out and net payments across all transactions traded under the MSFTA
could result in a reduction of the fund's credit risk to such counterparty equal to any amounts payable by the fund under the applicable transactions, if any.
For mortgage-backed and asset-backed
securities traded under a MSFTA, the collateral and margining requirements are contract specific. Collateral amounts across all transactions traded under such agreement are netted and an amount is posted from one
party to the other to collateralize such obligations. Cash that has been pledged to cover the fund's collateral or margin obligations under a MSFTA, if any, will be reported separately on the Statement of Assets and
Liabilities as restricted cash. Securities pledged as collateral or margin for the same purpose, if any, are noted in the Portfolio of Investments.
Fees Paid Indirectly — The fund's custody fee may be reduced by a credit earned under an arrangement that measures the value of U.S. dollars deposited with the custodian by the fund. The amount of the
credit, for the six months ended April 30, 2023, is shown as a reduction of total expenses in the Statement of Operations.
Tax Matters and Distributions — The fund intends to qualify as a regulated investment company, as defined under Subchapter M of the Internal Revenue Code, and to distribute all of its taxable income, including
realized capital gains. As a result, no provision for federal income tax is required. The fund’s federal tax returns, when filed, will remain subject to examination by the Internal Revenue Service for a three
year period. Management has analyzed the fund’s tax positions taken on federal and state tax returns for all open tax years and does not believe that there are any uncertain tax positions that require
recognition of a tax liability. Foreign taxes, if any, have been accrued by the fund in the accompanying financial statements in accordance with the applicable foreign tax law. Foreign income taxes may be withheld by
certain countries in which the fund invests. Additionally, capital gains realized by the fund on securities issued in or by certain foreign countries may be subject to capital gains tax imposed by those
countries.
Distributions to shareholders are
recorded on the ex-dividend date. Income and capital gain distributions are determined in accordance with income tax regulations, which may differ from U.S. generally accepted accounting principles. Certain capital
accounts in the financial statements are periodically adjusted for permanent differences in order to reflect their tax character. These adjustments have no impact on net assets or net asset value per share. Temporary
differences which arise from recognizing certain items of income, expense, gain or loss in different periods for financial statement and tax purposes will reverse at some time in the future.
Book/tax differences primarily
relate to net operating losses, amortization and accretion of debt securities, treating a portion of the proceeds from redemptions as a distribution for tax purposes, wash sale loss deferrals and derivative
transactions.
64
Notes to Financial
Statements (unaudited) - continued
The tax character of distributions
made during the current period will be determined at fiscal year end. The tax character of distributions declared to shareholders for the last fiscal year is as follows:
| Year ended 10/31/22 | |
| Ordinary income (including any short-term capital gains) | $17,459,790 |
| Long-term capital gains | 140,835,260 |
| Total distributions | $158,295,050 |
The federal tax cost and the tax
basis components of distributable earnings were as follows:
| As of 4/30/23 | |
| Cost of investments | $1,192,372,300 |
| Gross appreciation | 251,824,975 |
| Gross depreciation | (54,071,049) |
| Net unrealized appreciation (depreciation) | $197,753,926 |
| As of 10/31/22 | |
| Undistributed long-term capital gain | 32,028,636 |
| Other temporary differences | (292,460) |
| Net unrealized appreciation (depreciation) | 91,401,287 |
The aggregate cost above includes
prior fiscal year end tax adjustments, if applicable.
Multiple Classes of Shares of
Beneficial Interest — The fund offers multiple classes of shares, which differ in their respective distribution and service fees. The fund's income, realized and unrealized gain (loss), and common
expenses are allocated to shareholders based on the daily net assets of each class. Dividends are declared separately for each class. Differences in per share dividend rates are generally due to differences in
separate class expenses. Class B and Class C shares will convert to Class A shares approximately eight years after purchase. The fund’s distributions declared to shareholders as reported in the Statements of
Changes in Net Assets are presented by class as follows:
| Six months ended 4/30/23 | Year ended 10/31/22 | ||
| Class A | $17,710,810 | $68,656,802 | |
| Class B | 255,759 | 1,395,204 | |
| Class C | 1,744,465 | 9,401,182 | |
| Class I | 11,999,295 | 52,489,854 | |
| Class R1 | 61,173 | 202,464 | |
| Class R2 | 107,653 | 431,823 | |
| Class R3 | 472,425 | 1,760,140 | |
| Class R4 | 147,433 | 513,036 | |
| Class R6 | 6,487,549 | 23,444,545 | |
| Total | $38,986,562 | $158,295,050 |
65
Notes to Financial
Statements (unaudited) - continued
(3) Transactions with
Affiliates
Investment Adviser — The fund has an investment advisory agreement with MFS to provide overall investment management and related administrative services and facilities to the fund. The management fee is computed daily and paid monthly at the following annual rates based on the fund's average daily net assets:
| Up to $500 million | 0.84% |
| In excess of $500 million and up to $1 billion | 0.75% |
| In excess of $1 billion and up to $2.5 billion | 0.70% |
| In excess of $2.5 billion | 0.65% |
MFS has agreed in writing to reduce
its management fee by a specified amount if certain MFS mutual fund assets exceed thresholds agreed to by MFS and the fund's Board of Trustees. MFS has also agreed in writing to waive at least 0.01% of its management
fee as part of this agreement. The agreement to waive at least 0.01% of the management fee will continue until modified by the fund's Board of Trustees, but such agreement will continue at least until February 29,
2024. For the six months ended April 30, 2023, this management fee reduction amounted to $90,628, which is included in the reduction of total expenses in the Statement of Operations. The management fee incurred for
the six months ended April 30, 2023 was equivalent to an annual effective rate of 0.75% of the fund's average daily net assets.
The investment adviser has agreed in
writing to pay a portion of the fund’s total annual operating expenses, excluding interest, taxes, extraordinary expenses, brokerage and transaction costs, certain tax reclaim recovery expenses (including
contingency fees and closing agreement expenses), and investment-related expenses, such that total fund operating expenses do not exceed the following rates annually of each class’s average daily net assets:
| Classes | ||||||||
| A | B | C | I | R1 | R2 | R3 | R4 | R6 |
| 1.09% | 1.84% | 1.84% | 0.84% | 1.84% | 1.34% | 1.09% | 0.84% | 0.77% |
This written agreement will continue
until modified by the fund’s Board of Trustees, but such agreement will continue at least until February 29, 2024. For the six months ended April 30, 2023, this reduction amounted to $590,973, which is included
in the reduction of total expenses in the Statement of Operations.
Distributor — MFS Fund Distributors, Inc. (MFD), a wholly-owned subsidiary of MFS, as distributor, received $14,164 for the six months ended April 30, 2023, as its portion of the initial sales
charge on sales of Class A shares of the fund.
The Board of Trustees has adopted a
distribution plan for certain share classes pursuant to Rule 12b-1 of the Investment Company Act of 1940.
The fund's distribution plan
provides that the fund will pay MFD for services provided by MFD and financial intermediaries in connection with the distribution and servicing of certain share classes. One component of the plan is a distribution fee
paid to MFD and another component of the plan is a service fee paid to MFD. MFD may subsequently pay all, or a portion, of the distribution and/or service fees to financial intermediaries.
66
Notes to Financial
Statements (unaudited) - continued
Distribution Plan Fee Table:
| Distribution Fee Rate (d) | Service Fee Rate (d) | Total Distribution Plan (d) | Annual Effective Rate (e) | Distribution and Service Fee | |
| Class A | — | 0.25% | 0.25% | 0.25% | $ 809,116 |
| Class B | 0.75% | 0.25% | 1.00% | 1.00% | 48,069 |
| Class C | 0.75% | 0.25% | 1.00% | 1.00% | 328,635 |
| Class R1 | 0.75% | 0.25% | 1.00% | 1.00% | 11,902 |
| Class R2 | 0.25% | 0.25% | 0.50% | 0.50% | 9,768 |
| Class R3 | — | 0.25% | 0.25% | 0.25% | 21,811 |
| Total Distribution and Service Fees | $1,229,301 |
| (d) | In accordance with the distribution plan for certain classes, the fund pays distribution and/or service fees equal to these annual percentage rates of each class’s average daily net assets. The distribution and service fee rates disclosed by class represent the current rates in effect at the end of the reporting period. Any rate changes, if applicable, are detailed below. |
| (e) | The annual effective rates represent actual fees incurred under the distribution plan for the six months ended April 30, 2023 based on each class's average daily net assets. MFD has voluntarily agreed to rebate a portion of each class's 0.25% service fee attributable to accounts for which there is no financial intermediary specified on the account except for accounts attributable to MFS or its affiliates' seed money. For the six months ended April 30, 2023, this rebate amounted to $82, $2, and $3 for Class A, Class B, and Class C shares, respectively, and is included in the reduction of total expenses in the Statement of Operations. |
Certain Class A shares are
subject to a contingent deferred sales charge (CDSC) in the event of a shareholder redemption within 18 months of purchase. Class B shares are subject to a CDSC in the event of a shareholder redemption within six
years of purchase. Class C shares are subject to a CDSC in the event of a shareholder redemption within 12 months of purchase. All contingent deferred sales charges are paid to MFD and during the six months
ended April 30, 2023, were as follows:
| Amount | |
| Class A | $1,618 |
| Class B | 3,260 |
| Class C | 794 |
Shareholder Servicing Agent — MFS Service Center, Inc. (MFSC), a wholly-owned subsidiary of MFS, receives a fee from the fund for its services as shareholder servicing agent calculated as a percentage of the
average daily net assets of the fund as determined periodically under the supervision of the fund's Board of Trustees. For the six months ended April 30, 2023, the fee was $70,127, which equated to 0.0101% annually of
the fund's average daily net assets. MFSC also receives reimbursement from the fund for out-of-pocket expenses, sub-accounting and other shareholder servicing costs which may be paid to affiliated and unaffiliated
service providers. Class R6 shares do not incur sub-accounting fees. For the six months ended April 30, 2023, these out-of-pocket expenses, sub-accounting and other shareholder servicing costs amounted to
$542,937.
Administrator — MFS provides certain financial, legal, shareholder communications, compliance, and other administrative services to the fund. Under an administrative services agreement, the fund
reimburses MFS the costs incurred to provide these
67
Notes to Financial
Statements (unaudited) - continued
services. The fund is charged an annual fixed
amount of $17,500 plus a fee based on average daily net assets. The administrative services fee incurred for the six months ended April 30, 2023 was equivalent to an annual effective rate of 0.0155% of the fund's
average daily net assets.
Trustees’ and Officers’
Compensation — The fund pays compensation to independent Trustees in the form of a retainer, attendance fees, and additional compensation to Board and Committee chairpersons. The fund does not
pay compensation directly to Trustees or officers of the fund who are also officers of the investment adviser, all of whom receive remuneration from MFS for their services to the fund. Certain officers and Trustees of
the fund are officers or directors of MFS, MFD, and MFSC.
Other — The fund invests in the MFS Institutional Money Market Portfolio which is managed by MFS and seeks current income consistent with preservation of capital and liquidity. This money
market fund does not pay a management fee to MFS but does incur investment and operating costs.
The fund is permitted to engage in
purchase and sale transactions with funds and accounts for which MFS serves as investment adviser or sub-adviser (“cross-trades”) pursuant to a policy adopted by the Board of Trustees. This policy has been
designed to ensure that cross-trades conducted by the fund comply with Rule 17a-7 under the Investment Company Act of 1940. During the six months ended April 30, 2023, the fund engaged in purchase transactions
pursuant to this policy, which amounted to $2,120,856.
(4) Portfolio Securities
For the period ended April 30, 2023,
purchases and sales of investments, other than purchased options and short-term obligations, were as follows:
| Purchases | Sales | |
| U.S. Government securities | $100,087,044 | $107,888,582 |
| Non-U.S. Government securities | 389,349,486 | 463,628,205 |
68
Notes to Financial
Statements (unaudited) - continued
(5) Shares of Beneficial
Interest
The fund's Declaration of Trust
permits the Trustees to issue an unlimited number of full and fractional shares of beneficial interest. Transactions in fund shares were as follows:
| Six months ended 4/30/23 | Year ended 10/31/22 | ||||
| Shares | Amount | Shares | Amount | ||
| Shares sold | |||||
| Class A | 2,424,550 | $39,769,900 | 3,771,994 | $64,677,221 | |
| Class B | 318 | 5,244 | 5,507 | 102,053 | |
| Class C | 170,849 | 2,808,101 | 255,357 | 4,527,459 | |
| Class I | 3,991,679 | 64,478,116 | 5,139,242 | 86,292,529 | |
| Class R1 | 8,707 | 141,862 | 21,398 | 367,881 | |
| Class R2 | 18,428 | 297,597 | 63,108 | 1,068,831 | |
| Class R3 | 137,885 | 2,246,631 | 444,377 | 7,751,250 | |
| Class R4 | 43,776 | 715,791 | 83,054 | 1,432,904 | |
| Class R6 | 1,192,139 | 19,275,567 | 2,700,201 | 46,303,733 | |
| 7,988,331 | $129,738,809 | 12,484,238 | $212,523,861 | ||
| Shares issued to shareholders in reinvestment of distributions | |||||
| Class A | 1,003,898 | $16,173,858 | 3,412,193 | $62,646,092 | |
| Class B | 15,180 | 249,402 | 69,343 | 1,307,804 | |
| Class C | 103,620 | 1,671,391 | 481,998 | 8,926,539 | |
| Class I | 656,483 | 10,432,432 | 2,495,468 | 45,091,003 | |
| Class R1 | 3,821 | 61,173 | 11,016 | 202,464 | |
| Class R2 | 6,113 | 97,087 | 21,167 | 383,969 | |
| Class R3 | 29,433 | 472,425 | 96,252 | 1,760,140 | |
| Class R4 | 9,138 | 147,410 | 27,897 | 511,648 | |
| Class R6 | 339,229 | 5,387,717 | 1,113,319 | 20,094,105 | |
| 2,166,915 | $34,692,895 | 7,728,653 | $140,923,764 | ||
| Shares reacquired | |||||
| Class A | (4,474,752) | $(73,274,815) | (7,510,529) | $(128,190,321) | |
| Class B | (138,725) | (2,324,537) | (310,164) | (5,425,742) | |
| Class C | (928,146) | (15,206,207) | (2,173,693) | (37,247,487) | |
| Class I | (7,340,281) | (118,410,823) | (10,519,208) | (175,966,814) | |
| Class R1 | (8,909) | (143,734) | (10,966) | (192,539) | |
| Class R2 | (47,352) | (764,925) | (77,871) | (1,314,763) | |
| Class R3 | (480,952) | (7,927,404) | (430,455) | (7,576,772) | |
| Class R4 | (52,627) | (861,679) | (91,965) | (1,563,826) | |
| Class R6 | (1,544,752) | (24,960,313) | (3,235,658) | (54,795,787) | |
| (15,016,496) | $(243,874,437) | (24,360,509) | $(412,274,051) | ||
69
Notes to Financial
Statements (unaudited) - continued
| Six months ended 4/30/23 | Year ended 10/31/22 | ||||
| Shares | Amount | Shares | Amount | ||
| Net change | |||||
| Class A | (1,046,304) | $(17,331,057) | (326,342) | $(867,008) | |
| Class B | (123,227) | (2,069,891) | (235,314) | (4,015,885) | |
| Class C | (653,677) | (10,726,715) | (1,436,338) | (23,793,489) | |
| Class I | (2,692,119) | (43,500,275) | (2,884,498) | (44,583,282) | |
| Class R1 | 3,619 | 59,301 | 21,448 | 377,806 | |
| Class R2 | (22,811) | (370,241) | 6,404 | 138,037 | |
| Class R3 | (313,634) | (5,208,348) | 110,174 | 1,934,618 | |
| Class R4 | 287 | 1,522 | 18,986 | 380,726 | |
| Class R6 | (13,384) | (297,029) | 577,862 | 11,602,051 | |
| (4,861,250) | $(79,442,733) | (4,147,618) | $(58,826,426) | ||
Effective June 1, 2019, purchases of
the fund’s Class B shares were closed to new and existing investors subject to certain exceptions. On March 30, 2023, the fund announced that effective after the close of business on September 29, 2023,
purchases of Class R1 and Class R2 shares will be closed to new eligible investors.
(6) Line of Credit
The fund and certain other funds
managed by MFS participate in a $1.45 billion unsecured committed line of credit of which $1.2 billion is reserved for use by the fund and certain other MFS U.S. funds. The line of credit is provided by a syndicate of
banks under a credit agreement. Borrowings may be made for temporary financing needs. Interest is charged to each fund, based on its borrowings, generally at a rate equal to the highest of 1) Daily Simple SOFR
(Secured Overnight Financing Rate) plus 0.10%, 2) the Federal Funds Effective Rate, or 3) the Overnight Bank Funding Rate, each plus an agreed upon spread. A commitment fee, based on the average daily unused portion
of the committed line of credit, is allocated among the participating funds. The line of credit expires on March 14, 2024 unless extended or renewed. In addition, the fund and other funds managed by MFS have
established unsecured uncommitted borrowing arrangements with certain banks for temporary financing needs. Interest is charged to each fund, based on its borrowings, at rates equal to customary reference rates plus an
agreed upon spread. For the six months ended April 30, 2023, the fund’s commitment fee and interest expense were $3,662 and $0, respectively, and are included in “Miscellaneous” expense in the
Statement of Operations.
70
Notes to Financial
Statements (unaudited) - continued
(7) Investments in Affiliated
Issuers
An affiliated issuer may be
considered one in which the fund owns 5% or more of the outstanding voting securities, or a company which is under common control. For the purposes of this report, the following were affiliated issuers:
| Affiliated Issuers | Beginning Value | Purchases | Sales Proceeds | Realized Gain (Loss) | Change in Unrealized Appreciation or Depreciation | Ending Value |
| MFS Institutional Money Market Portfolio | $35,384,108 | $260,807,892 | $272,898,861 | $1,389 | $2,456 | $23,296,984 |
| Affiliated Issuers | Dividend Income | Capital Gain Distributions |
| MFS Institutional Money Market Portfolio | $546,115 | $— |
(8) LIBOR Transition
Certain of the fund's investments,
including investments in certain debt instruments and derivatives (if any), as well as borrowings by the fund and certain other contractual arrangements of the fund, may be based on the London Interbank Offered Rate
(“LIBOR”). In 2017, the regulatory authority that oversees financial services firms in the United Kingdom announced plans to transition away from LIBOR by the end of 2021. In March 2021, the administrator
of LIBOR announced the extension of the publication of the more commonly used U.S. dollar LIBOR settings to the end of June 2023. Although the full impacts of the transition away from LIBOR are not fully known, the
transition may result in, among other things, an increase in volatility or illiquidity of the markets for instruments that currently rely on LIBOR to determine interest rates and this could have an adverse impact on
the fund's performance. With respect to the fund's accounting for investments, including investments in certain debt instruments and derivatives, as well as borrowings by the fund and any other contractual
arrangements of the fund that undergo reference rate-related modifications as a result of the transition, management will rely upon the relief provided by FASB Codification Topic 848 – Reference Rate Reform
(Topic 848). The guidance in Topic 848 permits the fund to account for those modified contracts as a continuation of the existing contracts. The situation remains fluid, and management believes, based on best
available information, that the impact of the transition will not be material to the fund.
(9) Russia and Ukraine
Conflict
The fund invests in securities
and/or derivative instruments that are economically tied to Russia and/or Ukraine. Escalation of the conflict between Russia and Ukraine in late February 2022 caused market volatility and disruption in the tradability
of Russian securities, including closure of the local securities market, temporary restriction on securities sales by non-residents, and disruptions to clearance and payment systems. To the extent that the fund is
unable to sell securities, whether due to market constraints or to the sanctions imposed on Russia by the United States and other countries, those securities are considered illiquid and the value of those securities
reflects their illiquid classification. Management continues to monitor these events and to evaluate the related impacts on fund performance.
71
Statement Regarding Liquidity Risk Management
Program
The fund has adopted and
implemented a liquidity risk management program (the “Program”) as required by Rule 22e-4 under the Investment Company Act of 1940, as amended. The fund’s Board of Trustees (the “Board”)
has designated MFS as the administrator of the Program. The Program is reasonably designed to assess and manage the liquidity risk of the fund. Liquidity risk is the risk that the fund could not meet requests to
redeem shares issued by the fund without significant dilution of remaining investors' interests.
MFS provided a written report to the
Board for consideration at its March 2023 meeting that addressed the operation of the Program and provided an assessment of the adequacy and effectiveness of the Program during the period from January 1, 2022 to
December 31, 2022 (the “Covered Period”). The report concluded that during the Covered Period the Program had operated effectively in all material respects and had adequately and effectively been
implemented to assess and manage the fund’s liquidity risk. MFS also reported that there were no liquidity events that impacted the fund or its ability to timely meet redemptions without dilution to existing
shareholders during the Covered Period.
There can be no assurance that the
Program will achieve its objectives in the future. Further information on liquidity risk, and other principal risks to which an investment in the fund may be subject, can be found in the prospectus.
72
Proxy Voting Policies and
Information
MFS votes proxies on behalf of the
fund pursuant to proxy voting policies and procedures that are available without charge, upon request, by calling 1-800-225-2606, by visiting mfs.com/proxyvoting, or by visiting the SEC’s Web site at http://www.sec.gov.
Information regarding how the fund
voted proxies relating to portfolio securities during the most recent twelve-month period ended June 30 is available by August 31 of each year without charge by visiting mfs.com/proxyvoting, or by visiting the SEC’s Web site at http://www.sec.gov.
Quarterly Portfolio
Disclosure
The fund files a complete schedule
of portfolio holdings with the SEC for the first and third quarters of each fiscal year as an exhibit to its reports on Form N-PORT. The fund's Form N-PORT reports are available on the SEC's Web site at http://www.sec.gov. A shareholder can obtain the portfolio holdings report for the first and third quarters of the fund's fiscal year at mfs.com/openendfunds by choosing the fund's name and then scrolling to the “Resources” section and clicking on the “Prospectus and Reports” tab.
Further Information
From time to time, MFS may post
important information about the fund or the MFS Funds on the MFS Web site (mfs.com). This information is available at https://www.mfs.com/announcements or at mfs.com/openendfunds by choosing the fund’s name and then scrolling to the “Resources” section and clicking on the “Announcements” tab, if any.
Information About Fund
Contracts and Legal Claims
The fund has entered into
contractual arrangements with an investment adviser, administrator, distributor, shareholder servicing agent, and custodian who each provide services to the fund. Unless expressly stated otherwise, shareholders are
not parties to, or intended beneficiaries of these contractual arrangements, and these contractual arrangements are not intended to create any shareholder right to enforce them against the service providers or to seek
any remedy under them against the service providers, either directly or on behalf of the fund.
Under the Trust’s By-Laws and
Declaration of Trust, any claims asserted against or on behalf of the MFS Funds, including claims against Trustees and Officers, must be brought in state and federal courts located within the Commonwealth of
Massachusetts.
Provision of Financial
Reports and Summary Prospectuses
The fund produces financial reports
every six months and updates its summary prospectus and prospectus annually. To avoid sending duplicate copies of materials to households, only one copy of the fund’s annual and semiannual report and summary
prospectus may be mailed to shareholders having the same last name and residential address on the fund’s records. However, any shareholder may contact MFSC (please see back cover for address and telephone
number) to request that copies of these reports and summary prospectuses be sent personally to that shareholder.
73
