UNITED STATES
SECURITIES AND EXCHANGE COMMISSION
WASHINGTON, D. C. 20549
FORM 10-K
ANNUAL REPORT PURSUANT TO SECTION 13 OR 15(d)
OF THE SECURITIES EXCHANGE ACT OF 1934
For the fiscal year ended December 31, 2019
Commission file number 1-10447
(Exact name of registrant as specified in its charter)
(State or other jurisdiction of incorporation or organization) | (I.R.S. Employer Identification Number) | |
(Address of principal executive offices including ZIP code)
(281 ) 589-4600
(Registrant's telephone number, including area code)
Securities registered pursuant to Section 12(b) of the Act:
Title of each class | Trading Symbol(s) | Name of each exchange on which registered |
Securities registered pursuant to Section 12(g) of the Act: None
Indicate by check mark if the registrant is a well-known seasoned issuer, as defined in Rule 405 of the Securities Act. Yes ☒ No ☐
Indicate by check mark if the registrant is not required to file reports pursuant to Section 13 or Section 15(d) of the Act. Yes ☐ No ☒
Indicate by check mark whether the registrant (1) has filed all reports required to be filed by Section 13 or 15(d) of the Securities Exchange Act of 1934 during the preceding 12 months (or for such shorter period that the registrant was required to file such reports), and (2) has been subject to such filing requirements for the past 90 days. Yes ☒ No ☐
Indicate by check mark whether the registrant has submitted electronically every Interactive Data File required to be submitted pursuant to Rule 405 of Regulation S-T during the preceding 12 months (or for such shorter period that the registrant was required to submit such files). Yes ☒ No ☐
Indicate by check mark whether the registrant is a large accelerated filer, an accelerated filer, a non-accelerated filer, smaller reporting company, or an emerging growth company. See the definitions of "large accelerated filer," "accelerated filer," "smaller reporting company," and "emerging growth company" in Rule 12b-2 of the Exchange Act. (Check one):
☒ | Accelerated filer | ☐ | Non-accelerated filer | ☐ | Smaller reporting company | Emerging growth company | ||||
If an emerging growth company, indicate by check mark if the registrant has elected not to use the extended transition period for complying with any new or revised financial accounting standards provided pursuant to Section 13(a) of the Exchange Act. ☐
Indicate by check mark whether the registrant is a shell company (as defined in Rule 12b-2 of the Exchange Act). Yes ☐ No ☒
The aggregate market value of Common Stock, par value $.10 per share ("Common Stock"), held by non-affiliates as of the last business day of registrant's most recently completed second fiscal quarter (based upon the closing sales price on the New York Stock Exchange on June 28, 2019) was approximately $9.4 billion.
As of February 19, 2020, there were 398,575,510 shares of Common Stock outstanding.
DOCUMENTS INCORPORATED BY REFERENCE
Portions of the Proxy Statement for the Annual Meeting of Stockholders to be held April 30, 2020 are incorporated by reference into Part III of this report.
TABLE OF CONTENTS
PAGE | ||
2
FORWARD-LOOKING INFORMATION
The statements regarding future financial and operating performance and results, strategic pursuits and goals, market prices, future hedging and risk management activities, and other statements that are not historical facts contained in this report are forward-looking statements. The words "expect," "project," "estimate," "believe," "anticipate," "intend," "budget," "plan," "forecast," "target," "predict," "may," "should," "could," "will" and similar expressions are also intended to identify forward-looking statements. Such statements involve risks and uncertainties, including, but not limited to, market factors, market prices (including geographic basis differentials) of natural gas, results of future drilling and marketing activity, future production and costs, legislative and regulatory initiatives, electronic, cyber or physical security breaches and other factors detailed herein and in our other Securities and Exchange Commission filings. Refer to "Risk Factors" in Item 1A for additional information about these risks and uncertainties. Should one or more of these risks or uncertainties materialize, or should underlying assumptions prove incorrect, actual outcomes may vary materially from those indicated.
GLOSSARY OF CERTAIN OIL AND GAS TERMS
The following are abbreviations and definitions of certain terms commonly used in the oil and gas industry and included within this Annual Report on Form 10-K:
Abbreviations
Bbl. One stock tank barrel, or 42 U.S. gallons liquid volume, used in reference to oil or other liquid hydrocarbons.
Bcf. One billion cubic feet of natural gas.
Bcfe. One billion cubic feet of natural gas equivalent.
Btu. One British thermal unit.
Dth. One million British thermal units.
Mbbl. One thousand barrels of oil or other liquid hydrocarbons.
Mcf. One thousand cubic feet of natural gas.
Mcfe. One thousand cubic feet of natural gas equivalent.
Mmbbl. One million barrels of oil or other liquid hydrocarbons.
Mmbtu. One million British thermal units.
Mmcf. One million cubic feet of natural gas.
Mmcfe. One million cubic feet of natural gas equivalent.
NGL. Natural gas liquids.
NYMEX. New York Mercantile Exchange.
Definitions
Condensate. A mixture of hydrocarbons that exists in the gaseous phase at original reservoir temperature and pressure, but that, when produced, is in the liquid phase at surface pressure and temperature.
Conventional play. A term used in the oil and gas industry to refer to an area believed to be capable of producing crude oil and natural gas occurring in discrete accumulations in structural and stratigraphic traps utilizing conventional recovery methods.
Developed reserves. Developed reserves are reserves that can be expected to be recovered: (i) through existing wells with existing equipment and operating methods or in which the cost of the required equipment is relatively minor compared to the cost of a new well; and (ii) through installed extraction equipment and infrastructure operational at the time of the reserves estimate if the extraction is by means not involving a well.
Development costs. Costs incurred to obtain access to proved reserves and to provide facilities for extracting, treating, gathering and storing the oil and gas. More specifically, development costs, including depreciation and applicable operating
3
costs of support equipment and facilities and other costs of development activities, are costs incurred to: (i) gain access to and prepare well locations for drilling, including surveying well locations for the purpose of determining specific development drilling sites, clearing ground, draining, road building, and relocating public roads, gas lines, and power lines, to the extent necessary in developing the proved reserves, (ii) drill and equip development wells, development-type stratigraphic test wells, and service wells, including the costs of platforms and of well equipment such as casing, tubing, pumping equipment, and the wellhead assembly, (iii) acquire, construct, and install production facilities such as lease flow lines, separators, treaters, heaters, manifolds, measuring devices, and production storage tanks, natural gas cycling and processing plants, and central utility and waste disposal systems, and (iv) provide improved recovery systems.
Development well. A well drilled within the proved area of an oil or gas reservoir to the depth of a stratigraphic horizon known to be productive.
Differential. An adjustment to the price of oil or gas from an established spot market price to reflect differences in the quality and/or location of oil or gas.
Dry hole. Exploratory or development well that does not produce oil or gas in commercial quantities.
Exploitation activities. The process of the recovery of fluids from reservoirs and drilling and development of oil and gas reserves.
Exploration costs. Costs incurred in identifying areas that may warrant examination and in examining specific areas that are considered to have prospects of containing oil and gas reserves, including costs of drilling exploratory wells and exploratory-type stratigraphic test wells. Exploration costs may be incurred both before acquiring the related property (sometimes referred to in part as prospecting costs) and after acquiring the property. Principal types of exploration costs, which include depreciation and applicable operating costs of support equipment and facilities and other costs of exploration activities, are: (i) costs of topographical, geographical and geophysical studies, rights of access to properties to conduct those studies, and salaries and other expenses of geologists, geophysical crews, and others conducting those studies. Collectively, these are sometimes referred to as geological and geophysical or "G&G" costs, (ii) costs of carrying and retaining undeveloped properties, such as delay rentals, ad valorem taxes on properties, legal costs for title defense, and the maintenance of land and lease records, (iii) dry hole contributions and bottom hole contributions, (iv) costs of drilling and equipping exploratory wells, and (v) costs of drilling exploratory-type stratigraphic test wells.
Exploratory well. A well drilled to find a new field or to find a new reservoir in a field previously found to be productive of oil or gas in another reservoir. Generally, an exploratory well is any well that is not a development well, an extension well, or a service well.
Extension well. An extension well is a well drilled to extend the limits of a known reservoir.
Field. An area consisting of a single reservoir or multiple reservoirs all grouped on or related to the same individual geological structural feature and/or stratigraphic condition. There may be two or more reservoirs in a field that are separated vertically by intervening impervious, strata, or laterally by local geological barriers, or by both. Reservoirs that are associated by being in overlapping or adjacent fields may be treated as a single or common operational field. The geological terms structural feature and stratigraphic condition are intended to identify localized geological features as opposed to the broader terms of basins, trends, provinces, plays, areas-of-interest, etc.
Gross acres. The total acres in which a working interest is owned.
Gross wells. The total wells in which a working interest is owned.
Net acres. The number of acres an owner has out of a particular number of gross acres. An owner who has a 30 percent working interest in 100 acres owns 30 net acres.
Net wells. The percentage ownership interest in a well that an owner has based on the working interest. An owner who has a 30 percent working interest in a well owns a 0.30 net well.
Oil. Crude oil and condensate.
Operator. The individual or company responsible for the exploration, development and/or production of an oil or gas well or lease.
Play. A geographic area with potential oil and gas reserves.
4
Possible reserves. Possible reserves are those additional reserves that are less certain to be recovered than probable reserves.
Probable reserves. Probable reserves are those additional reserves that are less certain to be recovered than proved reserves but which, together with proved reserves, are as likely not to be recovered.
Production costs. Costs incurred to operate and maintain wells and related equipment and facilities, including depreciation and applicable operating costs of support equipment and facilities, which become part of the cost of oil and gas produced.
Proved properties. Properties with proved reserves.
Proved reserves. Proved reserves are those quantities, which, by analysis of geoscience and engineering data, can be estimated with reasonable certainty to be economically producible from a given date forward, from known reservoirs, and under existing economic conditions and operating methods prior to the time at which contracts providing the right to operate expire, unless evidence indicates that renewal is reasonably certain, regardless of whether deterministic or probabilistic methods are used for the estimation. The project to extract hydrocarbons must have commenced or the operator must be reasonably certain that it will commence the project within a reasonable time.
Existing economic conditions include prices and costs at which economic producibility from a reservoir is to be determined. The price shall be the average price during the twelve-month period prior to the ending date of the period covered by the report, determined as an unweighted arithmetic average of the first-day-of-the-month price for each month within such period, unless prices are defined by contractual arrangements, excluding escalations based upon future conditions.
Reasonable certainty. If deterministic methods are used, reasonable certainty means a high degree of confidence that the quantities will be recovered. If probabilistic methods are used, there should be at least a 90 percent probability that the quantities actually recovered will equal or exceed the estimate. A high degree of confidence exists if the quantity is much more likely to be achieved than not, and, as changes due to increased availability of geoscience (geological, geophysical, and geochemical), engineering, and economic data are made to estimated ultimate recovery (EUR) with time, reasonably certain EUR is much more likely to increase or remain constant than to decrease.
Reliable technology. A grouping of one or more technologies (including computational methods) that has been field tested and has been demonstrated to provide reasonable certain results with consistency and repeatability in the formation being evaluated or in an analogous formation.
Reserves. Reserves are estimated remaining quantities of oil and gas and related substances anticipated to be economically producible, as of a given date, by application of development projects to known accumulations. In addition, there must exist, or there must be a reasonable expectation that there will exist, the legal right to produce or a revenue interest in the production, installed means of delivering oil and gas or related substances to market, and all permits and financing required to implement the project.
Reservoir. A porous and permeable underground formation containing a natural accumulation of producible oil and/or gas that is confined by impermeable rock or water barriers and is individual and separate from other reservoirs.
Resources. Resources are quantities of oil and gas estimated to exist in naturally occurring accumulations. A portion of the resources may be estimated to be recoverable, and another portion may be considered to be unrecoverable. Resources include both discovered and undiscovered accumulations.
Royalty interest. An interest in an oil and gas lease that gives the owner of the interest the right to receive a portion of the production from the leased acreage (or of the proceeds of the sale thereof), but generally does not require the owner to pay any portion of the costs of drilling or operating the wells on the leased acreage. Royalties may be either landowners' royalties, which are reserved by the owner of the leased acreage at the time the lease is granted, or overriding royalties, which are usually reserved by an owner of the leasehold in connection with a transfer to a subsequent owner.
Shale. Fine-grained sedimentary rock composed mostly of consolidated clay or mud.
Standardized measure. The present value, discounted at 10 percent per year, of estimated future net revenues from the production of proved reserves, computed by applying sales prices used in estimating proved oil and gas reserves to the year-end quantities of those reserves in effect as of the dates of such estimates and held constant throughout the productive life of the reserves (except for consideration of future price changes to the extent provided by contractual arrangements in existence at year-end), and deducting the estimated future costs to be incurred in developing, producing and abandoning the proved reserves (computed based on year-end costs and assuming continuation of existing economic conditions). Future income taxes are
5
calculated by applying the appropriate year-end statutory federal and state income tax rate with consideration of future tax rates already legislated, to pre-tax future net cash flows, net of the tax basis of the properties involved and utilization of available tax carryforwards related to proved oil and gas reserves.
Unconventional play. A term used in the oil and gas industry to refer to a play in which the targeted reservoirs generally fall into one of three categories: (1) tight sands, (2) coal beds or (3) shales. The reservoirs tend to cover large areas and lack the readily apparent traps, seals and discrete hydrocarbon-water boundaries that typically define conventional reservoirs. These reservoirs generally require fracture stimulation treatments or other special recovery processes in order to achieve economic flow rates.
Undeveloped reserves. Undeveloped reserves are reserves that are expected to be recovered from new wells on undrilled acreage, or from existing wells where a relatively major expenditure is required. Reserves on undrilled acreage are limited to those directly offsetting development spacing areas that are reasonably certain of production when drilled, unless evidence exists that establishes reasonable certainty of economic producibility at greater distances. Undrilled locations can be classified as having undeveloped reserves only if a development plan has been adopted indicating that they are scheduled to be drilled within five years, unless the specific circumstances justify a longer time. Under no circumstances shall estimates for undeveloped reserves be attributable to any acreage for which an application of fluid injection or other improved recovery technique is contemplated, unless such techniques have been proved effective by actual projects in the same reservoir or an analogous reservoir, or by other evidence using reliable technology establishing reasonable certainty.
Unproved properties. Properties with no proved reserves.
Working interest. An interest in an oil and gas lease that gives the owner of the interest the right to drill for and produce oil and gas on the leased acreage and requires the owner to pay a share of the costs of drilling and production operations.
6
PART I
ITEMS 1 and 2. BUSINESS AND PROPERTIES
Cabot Oil & Gas Corporation is an independent oil and gas company engaged in the development, exploitation, exploration and production of oil and gas properties. Our assets are concentrated in areas with known hydrocarbon resources, which are conducive to multi-well, repeatable drilling programs. We operate in one segment, natural gas development, exploitation, exploration and production, in the continental United States. We have offices located in Houston, Texas and Pittsburgh, Pennsylvania.
STRATEGY
Our objective is to enhance shareholder value through the commodity price cycles by maintaining our disciplined approach to returns-focused capital allocation. While we operate in a cyclical industry, driven by the volatility of commodity prices, we believe that focusing on the following key components of our business strategy positions us to succeed on creating shareholder value through the commodity price cycles.
Focus on financial returns. Our goal is to generate financial returns that exceed our cost of capital by focusing on disciplined capital investment and maintaining a low cost structure. In 2019, our return on capital employed (non-GAAP) was 22.2 percent, an increase from 15.9 percent in 2018. Commodity prices play a critical role in our capital allocation decisions and have a significant impact on our financial returns.
Demonstrate continued cost control. Underpinning our financial returns is our continued focus on cost control, which resulted in an 18 percent reduction in operating expenses per unit in 2019 relative to 2018. We believe maintaining a low cost structure provides us with a competitive advantage, especially in a low natural gas price environment. We continue to assess additional opportunities to reduce our operating expenses per unit over time.
Maintain financial strength. We believe that maintaining a strong balance sheet with significant financial flexibility is imperative in a cyclical industry that is exposed to commodity price volatility. In recent years, we have reduced our absolute debt levels, and we anticipate retiring the current portion of our debt at maturity in 2020. We improved our total debt to total capitalization ratio from 37.0 percent at year-end 2018 to 36.2 percent at year-end 2019. Additionally, we ended 2019 with strong liquidity resulting from $200.2 million of cash and cash equivalents and $1.5 billion of unused commitments on our revolving credit facility.
Generate positive free cash flow. We believe generating positive free cash flow is paramount to creating shareholder value. Our disciplined approach to capital allocation allows us to adjust our capital spending and activity levels in response to commodity prices in order to maximize positive free cash flow through the price cycles. Our free cash flow is used for returning capital to shareholders, reducing debt levels and enhancing liquidity. In 2019, we generated $1.4 billion in cash flow from operations (GAAP) and $563.1 million of free cash flow (non-GAAP), representing our fourth consecutive year of positive free cash flow generation.
Return capital to shareholders. We currently target returning at least 50 percent of our free cash flow to shareholders annually through dividends and share repurchases. In 2019, we returned $665.4 million of capital to shareholders, representing 118 percent of our free cash flow for the year. We increased our dividend twice during 2019 and have increased our dividend five times since 2017. Since reinstating our share repurchase program in 2017, we have reduced our shares outstanding by over 14 percent. We plan to continue to prioritize returning capital to shareholders through all commodity price cycles.
Increase our proved reserve base. In 2019, we increased our year-end proved reserves by 11 percent at an all-sources finding and development cost (non-GAAP) of $0.36 per Mcfe. We also replaced 250 percent of our production for the year. We intend to continue to increase our proved reserves through our disciplined investment in the development of our Marcellus Shale asset assuming the commodity price environment provides for economic returns for our shareholders.
Refer to "Management's Discussion and Analysis of Financial Condition and Results of Operations - Non-GAAP Financial Measures" for a discussion and calculation of return on capital employed, free cash flow and finding and development cost, which are non-GAAP financial measures.
2020 OUTLOOK
Our 2020 capital program is expected to be approximately $575.0 million, a 27 percent reduction from our 2019 capital program of $783.3 million. We reduced our planned capital program as a result of the lower natural gas price environment. We expect to fund these expenditures with our operating cash flow and, if required, cash on hand.
7
In 2020, our capital program will focus on the Marcellus Shale, where we expect to drill, complete and place on production 60 to 70 net wells. We allocate our planned program for capital expenditures based on market conditions, return on capital and free cash flow expectations and availability of services and human resources. We will continue to assess the natural gas price environment and may adjust our capital expenditures accordingly.
DESCRIPTION OF PROPERTIES
Our operations are primarily concentrated in one unconventional play—the Marcellus Shale in northeast Pennsylvania. Our Marcellus Shale properties represent our primary operating and growth area in terms of reserves, production and capital investment. Our properties are principally located in Susquehanna County, Pennsylvania, where we currently hold approximately 173,000 net acres in the dry gas window of the play. Our 2019 net production in the Marcellus Shale was 865 Bcfe, representing substantially all of our total equivalent production for the year. As of December 31, 2019, we had a total of 788.0 net wells in the Marcellus Shale, of which approximately 99.5 percent are operated by us.
During 2019, we invested $773.4 million in the Marcellus Shale and drilled or participated in drilling 94.0 net wells, completed 97.0 net wells and turned in line 97.0 net wells. As of December 31, 2019, we had 26.0 net wells that were either in the completion stage or waiting on completion or connection to a pipeline. We exited 2019 with three drilling rigs operating in the play and plan to exit 2020 with two rigs operating.
DIVESTITURES
In July 2018, we sold certain proved and unproved oil and gas properties in the Haynesville Shale to a third party for $30.0 million and recognized a gain on sale of oil and gas properties of $29.7 million.
In February 2018, we sold certain proved and unproved oil and gas properties in the Eagle Ford Shale to an affiliate of Venado Oil & Gas LLC for $765.0 million. During the fourth quarter of 2017, we recorded an impairment charge of $414.3 million associated with the proposed sale of these properties and upon closing recognized a loss on sale of oil and gas properties of $45.4 million.
In September 2017, we sold certain proved and unproved oil and gas properties and related pipeline assets located in West Virginia, Virginia and Ohio to an affiliate of Carbon Natural Gas Company for $41.3 million. During the second quarter of 2017, we recorded an impairment charge of $68.6 million associated with the proposed sale of these properties and upon closing the sale in the third quarter of 2017, we recognized a loss on sale of oil and gas properties of $11.9 million.
In February 2016, we sold certain proved and unproved oil and gas properties in east Texas to a third party for $56.4 million and recognized a $0.5 million gain on sale of assets.
MARKETING
Substantially all of our natural gas is sold at market sensitive prices under both long-term and short-term sales contracts and is subject to seasonal price swings. The principal markets for our natural gas are in the northeastern United States where we sell natural gas to industrial customers, local distribution companies, gas marketers and power generation facilities.
We also incur transportation and gathering expenses to move our natural gas production from the wellhead to our principal markets in the United States. The majority of our natural gas production is transported on third-party gathering systems and interstate pipelines where we have long-term contractual capacity arrangements or use purchaser-owned capacity under both long-term and short-term sales contracts.
To date, we have not experienced significant difficulty in transporting or marketing our natural gas production as it becomes available; however, there is no assurance that we will always be able to transport and market all of our production.
Delivery Commitments
We have entered into various firm sales contracts to deliver and sell natural gas. We believe we will have sufficient production quantities to meet substantially all of our commitments, but may be required to purchase natural gas from third parties to satisfy shortfalls should they occur.
8
A summary of our firm sales commitments as of December 31, 2019 are set forth in the table below:
Natural Gas (Bcf) | |||
2020 | 624.0 | ||
2021 | 608.4 | ||
2022 | 567.6 | ||
2023 | 539.6 | ||
2024 | 521.6 | ||
We utilize a part of our firm transportation capacity to deliver natural gas under the majority of these firm sales contracts and have entered into numerous agreements for transportation of our production. Some of these contracts have volumetric requirements which could require monetary shortfall penalties if our production is inadequate to meet the terms. However, we do not believe we have a financial commitment due based on our current proved reserves and production levels from which we can fulfill these obligations.
RISK MANAGEMENT
From time to time, we use derivative financial instruments to manage price risk associated with our natural gas production. While there are many different types of derivatives available, we generally utilize collar, swap and basis swap agreements designed to manage price risk more effectively. The collar arrangements are a combination of put and call options used to establish floor and ceiling prices for a fixed volume of natural gas production during a certain time period. They provide for payments to counterparties if the index price exceeds the ceiling and payments from the counterparties if the index price falls below the floor. The swap agreements call for payments to, or receipts from, counterparties based on whether the index price for the period is greater or less than the fixed price established for the particular period under the swap agreement.
During 2019, natural gas basis swaps covered 63.8 Bcf, or seven percent, of natural gas production at an average price of $2.32 per Mcf. Natural gas swaps covered 226.1 Bcf, or 26 percent, of natural gas production at a weighted-average price of $3.30 per Mcf.
As of December 31, 2019, we had the following outstanding financial commodity derivatives:
Collars | |||||||||||||||||||||||
Floor | Ceiling | Swaps | |||||||||||||||||||||
Type of Contract | Volume (Mmbtu) | Contract Period | Range | Weighted- Average | Range | Weighted- Average | Weighted- Average ($/Mmbtu) | ||||||||||||||||
Natural gas (NYMEX) | 10,700,000 | Apr. 2020 - Oct. 2020 | $ | 2.27 | |||||||||||||||||||
Natural gas (NYMEX) | 10,700,000 | Apr. 2020 - Oct. 2020 | $ | — | $ | 2.15 | $2.36 - $2.38 | $ | 2.37 | ||||||||||||||
In early 2020, we entered into the following financial commodity derivatives:
Collars | |||||||||||||||||||||||||
Floor | Ceiling | Swaps | |||||||||||||||||||||||
Type of Contract | Volume (Mmbtu) | Contract Period | Range | Weighted- Average | Range | Weighted- Average | Weighted- Average ($/Mmbtu) | ||||||||||||||||||
Natural gas (NYMEX) | 10,700,000 | Apr. 2020 - Oct. 2020 | $ | 2.28 | |||||||||||||||||||||
Natural gas (NYMEX) | 10,700,000 | Apr. 2020 - Oct. 2020 | $ | — | $ | 2.15 | $ | — | $ | 2.38 | |||||||||||||||
A significant portion of our expected natural gas production for 2020 and beyond is currently unhedged and directly exposed to the volatility in natural gas market prices, whether favorable or unfavorable. We will continue to evaluate the benefit of using derivatives in the future. Please read "Management's Discussion and Analysis of Financial Condition and Results of Operations" and "Quantitative and Qualitative Disclosures about Market Risk" for further discussion related to our use of derivatives.
9
RESERVES
The following table presents our estimated proved reserves for the periods indicated:
_______________________________________________________________________________
December 31, | ||||||||
2019 | 2018 | 2017 | ||||||
Natural Gas (Bcf) | ||||||||
Proved developed reserves | 8,056 | 7,402 | 6,001 | |||||
Proved undeveloped reserves(1) | 4,847 | 4,202 | 3,352 | |||||
12,903 | 11,604 | 9,353 | ||||||
Crude Oil & NGLs (Mbbl)(2) | ||||||||
Proved developed reserves | 22 | 107 | 31,066 | |||||
Proved undeveloped reserves(1) | — | 13 | 31,186 | |||||
22 | 120 | 62,252 | ||||||
Natural gas equivalent (Bcfe)(3) | 12,903 | 11,605 | 9,726 | |||||
Reserve life index (in years)(4) | 14.9 | 15.8 | 14.2 | |||||
(1) | Proved undeveloped reserves for 2019, 2018 and 2017 include reserves drilled but uncompleted of 783.2 Bcfe, 631.6 Bcfe and 807.4 Bcfe, respectively. |
(2) | There were no significant NGL reserves for 2019 and 2018, respectively. For 2017, NGL reserves were less than one percent of our total proved equivalent reserves and 13.7 percent of our proved crude oil and NGL reserves. |
(3) | Natural gas equivalents are determined using a ratio of 6 Mcf of natural gas to 1 Bbl of crude oil, condensate or NGLs. |
(4) | Reserve life index is equal to year-end proved reserves divided by annual production for the years ended December 31, 2019, 2018 and 2017, respectively. |
Our proved reserves at December 31, 2019 increased 1,298 Bcfe or 11 percent from 11,605 Bcfe at December 31, 2018. In 2019, we added 2,116 Bcfe of proved reserves through extensions, discoveries and other additions, primarily due to the results from our drilling and completion program in the Dimock field in northeast Pennsylvania. We also had a net upward revision of 47 Bcfe, which was primarily due to a net upward performance revision of 67 Bcfe, partially offset by a downward revision of 18 Bcfe associated with proved undeveloped (PUD) reserves reclassifications as a result of the five year limitation. The net upward performance revision of 67 Bcfe was primarily due to an upward revision of 417 Bcfe associated with our PUD reserves due to performance revisions and the drilling of longer lateral length wells, offset by a downward performance revision of 350 Bcfe related to certain proved developed producing properties. During 2019, we produced 865 Bcfe.
Since substantially all of our reserves are natural gas, our reserves are significantly more sensitive to natural gas prices and their effect on the economic productive life of producing properties. Our reserves are based on the 12-month average index price for the respective commodity, calculated as the unweighted arithmetic average for the first day of the month price for each month during the year. Increases in commodity prices may result in a longer economic productive life of a property or result in more economically viable proved undeveloped reserves to be recognized. Decreases in prices may result in negative impacts of this nature.
For additional information regarding estimates of proved reserves, the audit of such estimates by Miller and Lents, Ltd. (Miller and Lents) and other information about our reserves, including the risks inherent in our estimates of proved reserves, refer to the Supplemental Oil and Gas Information to the Consolidated Financial Statements included in Item 8 and “Risk Factors-Our proved reserves are estimates. Any material inaccuracies in our reserve estimates or underlying assumptions could cause the quantities and net present value of our reserves to be overstated or understated” in Item 1A.
Technologies Used In Reserves Estimates
We utilize various traditional methods to estimate our reserves, including decline curve extrapolations, volumetric calculations and analogies, and in some cases a combination of these methods. In addition, at times we may use seismic interpretations to confirm continuity of a formation in combination with traditional technologies; however, seismic interpretations are not used in the volumetric computation.
10
Internal Control
Our Senior Vice President, EHS and Engineering is the technical person responsible for our internal reserves estimation process and provides oversight of our corporate reservoir engineering department, which consists of two engineers, and the annual audit of our year-end reserves by Miller and Lents. He has a Bachelor of Science degree in Chemical Engineering, specializing in petroleum engineering, and over 37 years of industry experience with positions of increasing responsibility in operations, engineering and evaluations. He has worked in the area of reserves and reservoir engineering for 28 years and is a member of the Society of Petroleum Engineers.
Our reserves estimation process is coordinated by our corporate reservoir engineering department. Reserve information, including models and other technical data, are stored on secured databases on our network. Certain non-technical inputs used in the reserves estimation process, including commodity prices, production and development costs and ownership percentages, are obtained by other departments and are subject to testing as part of our annual internal control process. We also engage Miller and Lents, independent petroleum engineers, to perform an independent audit of our estimated proved reserves. Upon completion of the process, the estimated reserves are presented to senior management.
Miller and Lents has audited 100 percent of our proved reserves estimates and concluded, in their judgment, we have an effective system for gathering data and documenting information required to estimate our proved reserves and project our future revenues. Further, Miller and Lents has concluded (1) the reserves estimation methods employed by us were appropriate, and our classification of such reserves was appropriate to the relevant SEC reserve definitions, (2) our reserves estimation processes were comprehensive and of sufficient depth, (3) the data upon which we relied were adequate and of sufficient quality, and (4) the results of our estimates and projections are, in the aggregate, reasonable. A copy of the audit letter by Miller and Lents dated January 30, 2020, has been filed as an exhibit to this Annual Report on Form 10-K.
Qualifications of Third Party Engineers
The technical person primarily responsible for the audit of our reserves estimates at Miller and Lents meets the requirements regarding qualifications, independence, objectivity, and confidentiality set forth in the Standards Pertaining to the Estimating and Auditing of Oil and Gas Reserves Information promulgated by the Society of Petroleum Engineers. Miller and Lents is an independent firm of petroleum engineers, geologists, geophysicists, and petro physicists; they do not own an interest in our properties and are not retained on a contingent fee basis.
Proved Undeveloped Reserves
At December 31, 2019, we had 4,847 Bcfe of PUD reserves associated with future development costs of $1.8 billion, which represents an increase of 645 Bcfe compared to December 31, 2018. All of our PUD reserves are located in Susquehanna County, Pennsylvania. We expect to complete substantially all of our PUD reserves associated with drilled but uncompleted wells by the end of 2020. Future development plans are reflective of the lower commodity price environment and have been established based on expected available cash flows from operations and availability under our revolving credit facility. As of December 31, 2019, all PUD reserves are expected to be drilled and completed within five years of initial disclosure of these reserves, with the exception of two drilled but uncompleted wells. These wells are scheduled to be completed in early 2020, just beyond the five-year period since initial disclosure, and together represent 1.6 percent of our total PUD reserves and less than 1.0 percent of our total proved reserves.
The following table is a reconciliation of the change in our PUD reserves (Bcfe):
Year Ended December 31, 2019 | ||
Balance at beginning of period | 4,202 | |
Transfers to proved developed | (1,542 | ) |
Additions | 1,788 | |
Revision of prior estimates | 399 | |
Balance at end of period | 4,847 | |
Changes in PUD reserves that occurred during the year were due to:
• | transfer of 1,542 Bcfe from PUD to proved developed reserves based on total capital expenditures of $473.1 million during 2019; |
• | new PUD reserve additions of 1,788 Bcfe in the Dimock field in northeast Pennsylvania; and |
11
• | upward PUD reserve revisions of 399 Bcfe resulting from upward performance revisions of 417 Bcfe associated with performance revisions along with the drilling of longer lateral wells, partially offset by downward revisions of 18 Bcfe associated with PUD reclassifications as a result of the five year limitation. |
PRODUCTION, SALES PRICE AND PRODUCTION COSTS
The following table presents historical information about our production volumes for natural gas and oil (including NGLs), average natural gas and crude oil sales prices, and average production costs per equivalent, including our Dimock field located in northeast Pennsylvania, which represents more than 15 percent of our total proved reserves:
_______________________________________________________________________________
Year Ended December 31, | |||||||||||
2019 | 2018 | 2017 | |||||||||
Production Volumes | |||||||||||
Natural gas (Bcf) | |||||||||||
Dimock field | 865.0 | 729.1 | 641.7 | ||||||||
Total | 865.3 | 729.9 | 655.6 | ||||||||
Oil (Mbbl)(1) | |||||||||||
Total | — | 829 | 4,953 | ||||||||
Equivalents (Bcfe) | |||||||||||
Dimock field | 865.0 | 729.1 | 641.7 | ||||||||
Total | 865.3 | 735.0 | 685.3 | ||||||||
Natural Gas Average Sales Price ($/Mcf) | |||||||||||
Dimock field | $ | 2.29 | $ | 2.58 | $ | 2.33 | |||||
Total (excluding realized impact of derivative settlements) | $ | 2.29 | $ | 2.58 | $ | 2.30 | |||||
Total (including realized impact of derivative settlements) | $ | 2.45 | $ | 2.54 | $ | 2.31 | |||||
Oil Average Sales Price ($/Bbl) | |||||||||||
Total (excluding realized impact of derivative settlements) | $ | — | $ | 64.51 | $ | 47.81 | |||||
Total (including realized impact of derivative settlements) | $ | — | $ | 63.53 | $ | 48.16 | |||||
Average Production Costs ($/Mcfe) | |||||||||||
Dimock field | $ | 0.06 | $ | 0.05 | $ | 0.04 | |||||
Total | $ | 0.06 | $ | 0.05 | $ | 0.11 | |||||
(1) | There was no significant NGL production for the year ended December 31, 2019. NGL production represented less than one percent of our equivalent production for the years ended December 31, 2018 and 2017, and 8.5 percent, and 10.3 percent of our crude oil production for the years ended December 31, 2018 and 2017, respectively. |
ACREAGE
Our interest in both developed and undeveloped properties is primarily in the form of leasehold interests held under customary mineral leases. These leases provide us the right to develop oil and/or natural gas on the properties. Their primary terms range in length from approximately three to 10 years. These properties are held for longer periods if production is established.
12
The following table summarizes our gross and net developed and undeveloped leasehold and mineral fee acreage at December 31, 2019:
_______________________________________________________________________________
Developed | Undeveloped (1) | Total | |||||||||||||||
Gross | Net | Gross | Net | Gross | Net | ||||||||||||
Leasehold acreage | 155,997 | 153,799 | 894,123 | 777,600 | 1,050,120 | 931,399 | |||||||||||
Mineral fee acreage | 877 | 877 | 177,481 | 149,301 | 178,358 | 150,178 | |||||||||||
Total | 156,874 | 154,676 | 1,071,604 | 926,901 | 1,228,478 | 1,081,577 | |||||||||||
Includes leasehold and mineral fee net acreage of 585,686 and 147,371, respectively, associated with deep formations located in West Virginia and Virginia. Substantially all of this leasehold is held by production from shallower formations that are operated by others.
Total Net Undeveloped Acreage Expiration
In the event that production is not established or we take no action to extend or renew the terms of our leases, our net undeveloped acreage that will expire over the next three years as of December 31, 2019 is 78,534, 13,747 and 3,998 for the years ending December 31, 2020, 2021 and 2022, respectively.
As of December 31, 2019, less than one percent of our expiring acreage disclosed above is located in our primary operating areas where we currently expect to continue exploration and development activities and/or extend the lease terms. There were no PUD reserves recorded on any of our expiring acreage disclosed above.
WELL SUMMARY
The following table presents our ownership in productive natural gas and crude oil wells at December 31, 2019. This summary includes natural gas and crude oil wells in which we have a working interest:
_______________________________________________________________________________
Gross | Net | ||||
Natural gas | 850 | 789.0 | |||
Crude oil | 17 | 1.8 | |||
Total(1) | 867 | 790.8 | |||
(1) | Total percentage of gross operated wells is 90.7 percent. |
DRILLING ACTIVITY
We drilled and completed wells or participated in the drilling and completion of wells as indicated in the table below. The information below should not be considered indicative of future performance, nor should a correlation be assumed between the number of productive wells drilled, quantities of reserves found or economic value.
Year Ended December 31, | |||||||||||||||||
2019 | 2018 | 2017 | |||||||||||||||
Gross | Net | Gross | Net | Gross | Net | ||||||||||||
Development Wells | |||||||||||||||||
Productive | 96 | 94.0 | 85 | 84.0 | 104 | 93.2 | |||||||||||
Dry | — | — | — | — | — | — | |||||||||||
Exploratory Wells | |||||||||||||||||
Productive | — | — | — | — | — | — | |||||||||||
Dry | — | — | 9 | 9.0 | 1 | 1.0 | |||||||||||
Total | 96 | 94.0 | 94 | 93.0 | 105 | 94.2 | |||||||||||
Acquired Wells | — | — | — | — | — | — | |||||||||||
During the year ended December 31, 2019, we completed 29 gross wells (29.0 net) that were drilled in prior years.
13
The following table sets forth information about wells for which drilling was in progress or which were drilled but uncompleted at December 31, 2019, which are not included in the above table:
Drilling In Progress | Drilled But Uncompleted | |||||||||||
Gross | Net | Gross | Net | |||||||||
Development wells | 11 | 11.0 | 26 | 26.0 | ||||||||
Exploratory wells | — | — | — | — | ||||||||
Total | 11 | 11.0 | 26 | 26.0 | ||||||||
OTHER BUSINESS MATTERS
Title to Properties
We believe that we have satisfactory title to all of our producing properties in accordance with generally accepted industry standards. Individual properties may be subject to burdens such as royalty, overriding royalty, carried, net profits, working and other outstanding interests customary in the industry. In addition, interests may be subject to obligations or duties under applicable laws or burdens such as production payments, ordinary course liens incidental to operating agreements and for current taxes or development obligations under oil and gas leases. As is customary in the industry in the case of undeveloped properties, preliminary investigations of record title are made at the time of lease acquisition. Complete investigations are made prior to the consummation of an acquisition of producing properties and before commencement of drilling operations on undeveloped properties.
Competition
The oil and gas industry is highly competitive and we experience strong competition in our primary producing areas. We primarily compete with integrated, independent and other energy companies for the sale and transportation of our natural gas production to marketing companies and end users. Furthermore, the oil and gas industry competes with other energy industries that supply fuel and power to industrial, commercial and residential consumers. Many of these competitors have greater financial, technical and personnel resources. The effect of these competitive factors cannot be predicted.
Price, contract terms, availability of rigs and related equipment and quality of service, including pipeline connection times and distribution efficiencies affect competition. We believe that our extensive acreage position and our access to gathering and pipeline infrastructure in Pennsylvania, along with our expected activity level and the related services and equipment that we have secured for the upcoming years, enhance our competitive position over other producers who do not have similar systems or services in place.
Major Customers
During the year ended December 31, 2019, three customers accounted for approximately 17 percent, 16 percent and 16 percent of our total sales. During the year ended December 31, 2018, two customers accounted for approximately 20 percent and 11 percent of our total sales. During the year ended December 31, 2017, two customers accounted for approximately 18 percent and 11 percent of our total sales. We do not believe that the loss of any of these customers would have a material adverse effect on us because alternative customers are readily available.
Seasonality
Demand for natural gas has historically been seasonal, with peak demand and typically higher prices occurring during the winter months.
Regulation of Oil and Natural Gas Exploration and Production
Exploration and production operations are subject to various types of regulation at the federal, state and local levels. This regulation includes requiring permits to drill wells, maintaining bonding requirements to drill or operate wells, and regulating the location of wells, the method of drilling and casing wells, the surface use and restoration of properties on which wells are drilled, and the plugging and abandoning of wells. Our operations are also subject to various conservation laws and regulations. These include the regulation of the size of drilling and spacing units or proration units, the density of wells that may be drilled in a given field and the unitization or pooling of oil and natural gas properties. Some states allow the forced pooling or integration of tracts to facilitate exploration while other states rely on voluntary pooling of lands and leases. In addition, state conservation laws establish maximum rates of production from oil and natural gas wells, generally prohibiting the venting or flaring of natural gas and imposing certain requirements regarding the ratability of production. The effect of these regulations is to limit the amounts of oil and natural gas we can produce from our wells, and to limit the number of wells or the locations
14
where we can drill. Because these statutes, rules and regulations undergo constant review and often are amended, expanded and reinterpreted, we are unable to predict the future cost or impact of regulatory compliance. The regulatory burden on the oil and gas industry increases our cost of doing business and, consequently, affects our profitability. We do not believe, however, we are affected differently by these regulations than others in the industry.
Natural Gas Marketing, Gathering and Transportation
Federal legislation and regulatory controls have historically affected the price of the natural gas we produce and the manner in which our production is transported and marketed. Under the Natural Gas Act of 1938 (NGA), the Natural Gas Policy Act of 1978 (NGPA), and the regulations promulgated under those statutes, the Federal Energy Regulatory Commission (FERC) regulates the interstate sale for resale of natural gas and the transportation of natural gas in interstate commerce, although facilities used in the production or gathering of natural gas in interstate commerce are generally exempted from FERC jurisdiction. Effective beginning in January 1993, the Natural Gas Wellhead Decontrol Act deregulated natural gas prices for all “first sales” of natural gas, which definition covers all sales of our own production. In addition, as part of the broad industry restructuring initiatives described below, the FERC granted to all producers such as us a “blanket certificate of public convenience and necessity” authorizing the sale of natural gas for resale without further FERC approvals. As a result of this policy, all of our produced natural gas is sold at market prices, subject to the terms of any private contracts that may be in effect. In addition, under the provisions of the Energy Policy Act of 2005 (2005 Act), the NGA was amended to prohibit any forms of market manipulation in connection with the purchase or sale of natural gas. Pursuant to the 2005 Act, the FERC established regulations intended to increase natural gas pricing transparency by, among other things, requiring market participants to report their gas sales transactions annually to the FERC. The 2005 Act also significantly increased the penalties for violations of the NGA and NGPA and the FERC’s regulations thereunder up to $1,000,000 per day per violation. This maximum penalty authority established by statute has been and will continue to be adjusted periodically for inflation. As of December 31, 2019, the maximum penalty amount was $1,269,500 per day per violation. In 2010, the FERC issued Penalty Guidelines for the determination of civil penalties and procedure under its enforcement program.
Our production and gathering facilities are not subject to FERC jurisdiction; however, our natural gas sales prices nevertheless continue to be affected by intrastate and interstate gas transportation regulation because the cost of transporting the natural gas once sold to the consuming market is a factor in the prices we receive. Beginning with Order No. 436 in 1985 and continuing through Order No. 636 in 1992 and Order No. 637 in 2000, the FERC has adopted a series of rulemakings that have significantly altered the transportation and marketing of natural gas. These changes were intended by the FERC to foster competition by, among other things, requiring interstate pipeline companies to separate their wholesale gas marketing business from their gas transportation business, and by increasing the transparency of pricing for pipeline services. The FERC has also established regulations governing the relationship of pipelines with their marketing affiliates, which essentially require that designated employees function independently of each other, and that certain information not be shared. The FERC has also implemented standards relating to the use of electronic data exchange by the pipelines to make transportation information available on a timely basis and to enable transactions to occur on a purely electronic basis.
In light of these statutory and regulatory changes, most pipelines have divested their natural gas sales functions to marketing affiliates, which operate separately from the transporter and in direct competition with all other merchants. Most pipelines have also implemented the large‑scale divestiture of their natural gas gathering facilities to affiliated or non-affiliated companies. Interstate pipelines are required to provide unbundled, open and nondiscriminatory transportation and transportation‑related services to producers, gas marketing companies, local distribution companies, industrial end users and other customers seeking such services. As a result of the FERC requiring natural gas pipeline companies to separate marketing and transportation services, sellers and buyers of natural gas have gained direct access to pipeline transportation services, and are better able to conduct business with a larger number of counterparties. We believe these changes generally have improved our access to markets while, at the same time, substantially increasing competition in the natural gas marketplace. We cannot predict what new or different regulations the FERC and other regulatory agencies may adopt, or what effect subsequent regulations may have on our activities. Similarly, we cannot predict what proposals, if any, that affect the oil and natural gas industry might actually be enacted by Congress or the various state legislatures and what effect, if any, such proposals might have on us. Further, we cannot predict whether the recent trend toward federal deregulation of the natural gas industry will continue or what effect future policies will have on our sale of gas.
Federal Regulation of Swap Transactions
We use derivative financial instruments such as collar, swap and basis swap agreements to attempt to more effectively manage price risk due to the impact of changes in commodity prices on our operating results and cash flows. Following enactment of the Dodd‑Frank Wall Street Reform and Consumer Protection Act (Dodd‑Frank Act) in July 2010, the Commodity Futures Trading Commission (CFTC) has promulgated regulations to implement statutory requirements for swap transactions, including certain options. The CFTC regulations are intended to implement a regulated market in which most swaps are
15
executed on registered exchanges or swap execution facilities and cleared through central counterparties. In addition, all swap market participants are subject to new reporting and recordkeeping requirements related to their swap transactions. We believe that our use of swaps to hedge against commodity exposure qualifies us as an end‑user, exempting us from the requirement to centrally clear our swaps. Nevertheless, changes to the swap market as a result of Dodd‑Frank implementation could significantly increase the cost of entering into new swaps or maintaining existing swaps, materially alter the terms of new or existing swap transactions and/or reduce the availability of new or existing swaps. If we reduce our use of swaps as a result of the Dodd‑Frank Act and regulations, our results of operations may become more volatile and our cash flows may be less predictable.
Federal Regulation of Petroleum
Sales of crude oil and NGLs are not regulated and are made at market prices. However, the price received from the sale of these products is affected by the cost of transporting the products to market. Much of that transportation is through interstate common carrier pipelines, which are regulated by the FERC under the Interstate Commerce Act (ICA). FERC requires that pipelines regulated under the ICA file tariffs setting forth the rates and terms and conditions of service and that such service not be unduly discriminatory or preferential.
Effective January 1, 1995, the FERC implemented regulations generally grandfathering all previously approved interstate transportation rates and establishing an indexing system for those rates by which adjustments are made annually based on the rate of inflation, subject to certain conditions and limitations. These regulations may increase or decrease the cost of transporting crude oil and NGLs by interstate pipeline, although the annual adjustments may result in decreased rates in a given year. Every five years, the FERC must examine the relationship between the annual change in the applicable index and the actual cost changes experienced in the oil pipeline industry. In December 2015, to implement this required five‑year re‑determination, the FERC established an upward adjustment in the index to track oil pipeline cost changes and determined that the Producer Price Index for Finished Goods plus 1.23 percent should be the oil pricing index for the five‑year period beginning July 1, 2016. The result of indexing is a “ceiling rate” for each rate, which is the maximum at which the pipeline may set its interstate transportation rates. A pipeline may also file cost‑of‑service based rates if rate indexing will be insufficient to allow the pipeline to recover its costs. Rates are subject to challenge by protest when they are filed or changed. For indexed rates, complaints alleging that the rates are unjust and unreasonable may only be pursued if the complainant can show that a substantial change has occurred since the enactment of Energy Policy Act of 1992 in either the economic circumstances of the pipeline or in the nature of the services provided that were a basis for the rate. There is no such limitation on complaints alleging that the pipeline’s rates or terms and conditions of service are unduly discriminatory or preferential. We are unable to predict with certainty the effect upon us of these periodic reviews by the FERC of the pipeline index, or any potential future challenges to pipelines' rates.
Environmental and Safety Regulations
General. Our operations are subject to extensive federal, state and local laws and regulations relating to the generation, storage, handling, emission, transportation and discharge of materials into the environment. Permits are required for the operation of our various facilities. These permits can be revoked, modified or renewed by issuing authorities. Governmental authorities enforce compliance with their regulations through fines, injunctions or both. Government regulations can increase the cost of planning, designing, installing and operating, and can affect the timing of installing and operating, oil and natural gas facilities. Although we believe that compliance with environmental regulations will not have a material adverse effect on us, risks of substantial costs and liabilities related to environmental compliance issues are part of oil and natural gas production operations. No assurance can be given that significant costs and liabilities will not be incurred. Also, it is possible that other developments, such as stricter environmental laws and regulations, and claims for damages to property or persons resulting from oil and natural gas production could result in substantial costs and liabilities to us.
U.S. laws and regulations applicable to our operations include those controlling the discharge of materials into the environment, requiring removal and cleanup of materials that may harm the environment or otherwise relating to the protection of the environment.
Solid and Hazardous Waste. We currently own or lease, and have in the past owned or leased, numerous properties that were used for the production of oil and natural gas for many years. Although operating and disposal practices that were standard in the industry at the time may have been utilized, it is possible that hydrocarbons or other wastes may have been disposed of or released on or under the properties currently owned or leased by us. State and federal laws applicable to oil and gas wastes and properties have become stricter over time. Under these increasingly stringent requirements, we could be required to remove or remediate previously disposed wastes (including wastes disposed or released by prior owners and operators) or clean up property contamination (including groundwater contamination by prior owners or operators) or to perform plugging operations to prevent future contamination.
16
We generate some hazardous wastes that are subject to the Federal Resource Conservation and Recovery Act (RCRA) and comparable state statutes, as well as wastes that are exempt from such regulation. The Environmental Protection Agency (EPA) has limited the disposal options for certain hazardous wastes. It is possible that certain wastes currently exempt from treatment as hazardous wastes may in the future be designated as hazardous wastes under RCRA or other applicable statutes. For example, in December 2016, the EPA and environmental groups entered into a consent decree to address the EPA’s alleged failure to timely assess the need to regulate exploration and production related oil and gas wastes exempt from regulation as hazardous wastes under RCRA under Subtitle D applicable to non-hazardous solid waste. The consent decree required the EPA to propose a rulemaking by March 2019 for revision of certain Subtitle D criteria regulations pertaining to oil and gas wastes or to sign a determination that revision of the regulations is not necessary. In April 2019, the EPA issued its determination that based on its review, including consideration of state regulatory programs, it was not necessary at the time to revise Subtitle D regulations to address the management of oil and gas wastes. In the future, we could be subject to more rigorous and costly disposal requirements than we encounter today.
Superfund. The Comprehensive Environmental Response, Compensation, and Liability Act (CERCLA), also known as the “Superfund” law, and comparable state laws and regulations impose liability, without regard to fault or the legality of the original conduct, on certain persons with respect to the release of hazardous substances into the environment. These persons include the current and past owners and operators of a site where the release occurred and any party that treated or disposed of or arranged for the treatment or disposal of hazardous substances found at a site. Under CERCLA, such persons may be subject to joint and several strict liability for the costs of cleaning up the hazardous substances that have been released into the environment, for damages to natural resources and for the costs of certain health studies. CERCLA also authorizes the EPA, and in some cases, private parties, to undertake actions to clean up such hazardous substances, or to recover the costs of such actions from the responsible parties. In addition, it is not uncommon for neighboring landowners and other third parties to file claims for personal injury and property damage allegedly caused by the hazardous substances released into the environment. In the course of business, we have used materials and generated wastes and will continue to use materials and generate wastes that may fall within CERCLA’s definition of hazardous substances. We may also be an owner or operator of sites on which hazardous substances have been released. As a result, we may be responsible under CERCLA for all or part of the costs to clean up sites where such substances have been released.
Oil Pollution Act. The Federal Oil Pollution Act of 1990 (OPA) and resulting regulations impose a variety of obligations on responsible parties related to the prevention of oil spills and liability for damages resulting from such spills in waters of the United States. The term “waters of the United States” has been broadly defined to include inland water bodies, including wetlands and intermittent streams. The OPA assigns joint and several strict liability to each responsible party for oil removal costs and a variety of public and private damages. The OPA also imposes ongoing requirements on operators, including the preparation of oil spill response plans and proof of financial responsibility to cover environmental cleanup and restoration costs that could be incurred in connection with an oil spill. We believe that we substantially comply with the Oil Pollution Act and related federal regulations.
Endangered Species Act. The Endangered Species Act (ESA) restricts activities that may affect endangered or threatened species or their habitats. While some of our operations may be located in areas that are designated as habitats for endangered or threatened species, we believe that we are in substantial compliance with the ESA, nor are we aware of any proposed listings that will affect our operations. However, the designation of previously unidentified endangered or threatened species could cause us to incur additional costs or become subject to operating restrictions or bans in the affected areas.
Clean Water Act. The Federal Water Pollution Control Act (Clean Water Act) and implementing regulations, which are primarily executed through a system of permits, also govern the discharge of certain contaminants into waters of the United States. Sanctions for failure to comply strictly with the Clean Water Act are generally resolved by payment of fines and correction of any identified deficiencies. However, regulatory agencies could require us to cease construction or operation of certain facilities or to cease hauling wastewaters to facilities owned by others that are the source of water discharges. We believe that we substantially comply with the Clean Water Act and related federal and state regulations.
Clean Air Act. Our operations are subject to the Federal Clean Air Act and comparable local and state laws and regulations to control emissions from sources of air pollution. Federal and state laws require new and modified sources of air pollutants to obtain permits prior to commencing construction. Major sources of air pollutants are subject to more stringent, federally imposed requirements including additional permits. Federal and state laws designed to control toxic air pollutants and greenhouse gases might require installation of additional controls. Payment of fines and correction of any identified deficiencies generally resolve penalties for failure to comply strictly with air regulations or permits. Regulatory agencies could also require us to cease construction or operation of certain facilities or to install additional controls on certain facilities that are air emission sources. We believe that we substantially comply with applicable emission standards under local, state, and federal laws and regulations.
17
Some of our producing wells and associated facilities are subject to restrictive air emission limitations and permitting requirements. In 2012, the EPA published final New Source Performance Standards (NSPS) and National Emission Standards for Hazardous Air Pollutants (NESHAP) that amended the existing NSPS and NESHAP standards for oil and gas facilities and created new NSPS standards for oil and natural gas production, transmission and distribution facilities. In June 2016, the EPA published a final rule that updates and expands the NSPS by setting additional emissions limits for volatile organic compounds and regulating methane emissions for new and modified sources in the oil and gas industry. In addition, in June 2017, the EPA proposed a two year stay of certain requirements contained in June 2016 rule and in November 2017 issued a notice of data availability in support of the stay proposal and provided a 30-day comment period on the information provided. In March 2018, the EPA published a final rule that amended two narrow provisions of the NSPS including removing the requirement for completion of delayed repair during emergency or unscheduled vent blowdowns. The EPA also published a final rule in June 2016 concerning aggregation of sources that affects source determinations for air permitting in the oil and gas industry. In September 2019, the EPA published a proposal to rescind the 2012 and 2016 NSPS rules applicable to sources in the transmission and storage segment of the oil and gas industry and to rescind the methane requirements applicable to sources in the production and processing segments. In its September 2019 proposal, as an alternative, the EPA proposed the rescission of all of the new source performance standards applicable to all oil and natural gas sources in the source category without otherwise undoing the 2012 and 2016 NSPS rules. In October 2015, the EPA adopted a lower national ambient air quality standard for ozone. The revised standard could result in additional areas being designated as ozone non-attainment, which could lead to requirements for additional emissions control equipment and the imposition of more stringent permit requirements on facilities in those areas. The EPA completed its final area designations under the new ozone standard in July 2018. If we are unable to comply with air pollution regulations or to obtain permits for emissions associated with our operations, we could be required to forego construction, modification or certain operations. These regulations may also increase compliance costs for some facilities we own or operate, and result in administrative, civil and/or criminal penalties for non-compliance. Obtaining permits may delay the development of our oil and natural gas projects, including the construction and operation of facilities.
Safe Drinking Water Act. The Safe Drinking Water Act (SDWA) and comparable local and state provisions restrict the disposal, treatment or release of water produced or used during oil and gas development. Subsurface emplacement of fluids (including disposal wells or enhanced oil recovery) is governed by federal or state regulatory authorities that, in some cases, includes the state oil and gas regulatory authority or the state’s environmental authority. These regulations may increase the costs of compliance for some facilities.
Hydraulic Fracturing. Many of our exploration and production operations depend on the use of hydraulic fracturing to enhance production from oil and natural gas wells. This technology involves the injection of fluids, usually consisting mostly of water but typically including small amounts of several chemical additives, as well as sand into a well under high pressure in order to create fractures in the formation that allow oil or natural gas to flow more freely to the wellbore. Most of our wells would not be economical without the use of hydraulic fracturing to stimulate production from the well. Due to concerns raised relating to potential impacts of hydraulic fracturing on groundwater quality, legislative and regulatory efforts at the federal, state and local levels have been initiated to render permitting and compliance requirements more stringent for hydraulic fracturing or prohibit the activity altogether. Increased regulation and attention given to the hydraulic fracturing process could lead to greater opposition to oil and natural gas production activities using hydraulic fracturing techniques which could have an adverse effect on oil and natural gas production activities, including operational delays or increased operating costs in the production of oil and natural gas from the developing shale plays, or could make it more difficult to perform hydraulic fracturing. The adoption of federal, state or local laws or the implementation of regulations regarding hydraulic fracturing could potentially cause a decrease in the completion of new oil and natural gas wells and increased compliance costs, which could increase costs of our operations and cause considerable delays in acquiring regulatory approvals to drill and complete wells. In addition, if existing laws and regulations with regard to hydraulic fracturing are revised or reinterpreted or if new laws and regulations become applicable to our operations through judicial or administrative actions, our business, financial condition, results of operations and cash flows could be adversely affected. For additional information about hydraulic fracturing and related environmental matters, please read “Risk Factors-Federal and state legislation, judicial actions and regulatory initiatives related to oil and gas development, including hydraulic fracturing, could result in increased costs and operating restrictions or delays and adversely affect our business, financial condition, results of operations and cash flows” in Item 1A.
Greenhouse Gas. In response to studies suggesting that emissions of carbon dioxide and certain other gases may be contributing to global climate change, the United States Congress has considered, but not enacted, legislation to reduce emissions of greenhouse gases from sources within the United States between 2012 and 2050. In addition, many states have already taken legal measures to reduce emissions of greenhouse gases, primarily through the planned development of greenhouse gas emission inventories and/or regional greenhouse gas cap and trade programs. The EPA has also begun to regulate carbon dioxide and other greenhouse gas emissions under existing provisions of the Clean Air Act. This includes potential regulation of methane emissions from new and modified sources in the oil and gas sector. If we are unable to recover
18
or pass through a significant portion of our costs related to complying with current and future regulations relating to climate change and GHGs, it could materially affect our operations and financial condition. To the extent financial markets view climate change and GHG emissions as a financial risk, this could negatively impact our cost of, and access to, capital. Future legislation or regulations adopted to address climate change could also make our products more or less desirable than competing sources of energy. Please read “Risk Factors-Climate change and climate change legislative and regulatory initiatives could result in increased operating costs and decreased demand for the oil and natural gas that we produce” in Item 1A.
OSHA and Other Laws and Regulations. We are subject to the requirements of the federal Occupational Safety and Health Act (OSHA), and comparable state laws. The OSHA hazard communication standard, the EPA community right‑ to‑know regulations under the Title III of CERCLA and similar state laws require that we organize and/or disclose information about hazardous materials used or produced in our operations. Also, pursuant to OSHA, the Occupational Safety and Health Administration has established a variety of standards related to workplace exposure to hazardous substances and employee health and safety.
Employees
As of December 31, 2019, we had 274 employees associated with our upstream operations. In addition, we had 273 employees that are employed by our wholly-owned subsidiary, GasSearch Drilling Services Corporation. We recognize that our success is significantly influenced by the relationship we maintain with our employees. Overall, we believe that our relations with our employees are satisfactory. Our employees are not represented by a collective bargaining agreement.
Website Access to Company Reports
We make available free of charge through our website, www.cabotog.com, our annual reports on Form 10‑K, quarterly reports on Form 10‑Q, current reports on Form 8‑K, and all amendments to those reports as soon as reasonably practicable after such material is electronically filed with or furnished to the Securities and Exchange Commission (SEC). Information on our website is not a part of this report. In addition, the SEC maintains an Internet site at www.sec.gov that contains reports, proxy and information statements and other information filed by us.
Corporate Governance Matters
Our Corporate Governance Guidelines, Corporate Bylaws, Audit Committee Charter, Compensation Committee Charter, Corporate Governance and Nominations Committee Charter, Code of Business Conduct and Safety and Environmental Affairs Committee Charter are available on our website at www.cabotog.com, under the “Governance” section of “About Cabot.” Requests can also be made in writing to Investor Relations at our corporate headquarters at Three Memorial City Plaza, 840 Gessner Road, Suite 1400, Houston, Texas 77024.
19
ITEM 1A. RISK FACTORS
Commodity prices fluctuate widely, and low prices for an extended period would likely have a material adverse impact on our business.
Our revenues, operating results, financial condition and ability to borrow funds or obtain additional capital depend substantially on prices we receive for the natural gas that we sell. Lower commodity prices may reduce the amount of natural gas that we can produce economically. Historically, commodity prices have been volatile, with prices fluctuating widely, and they are likely to continue to be volatile. Because substantially all of our reserves are natural gas, changes in natural gas prices have a more significant impact on our financial results. Natural gas prices, based on the NYMEX Henry Hub Natural Gas Futures Final Settlement prices, were $3.642 per Mmbtu in January 2019 and $2.470 per Mmbtu in December 2019. Prices have continued to decline to $1.877 per Mmbtu in February 2020. Any substantial or extended decline in future commodity prices would have, a material adverse effect on our future business, financial condition, results of operations, cash flows, liquidity or ability to finance planned capital expenditures and commitments. Furthermore, substantial, extended decreases in commodity prices may cause us to delay or postpone a significant portion of our exploration, development and exploitation projects or may render such projects uneconomic, which may result in significant downward adjustments to our estimated proved reserves and could negatively impact our ability to borrow and cost of capital and our ability to access capital markets, increase our costs under our revolving credit facility, and limit our ability to execute aspects of our business plans. Refer to "Risk Factors-Future commodity price declines may result in write-downs of the carrying amount of our oil and gas properties, which could materially and adversely affect our results of operations."
Wide fluctuations in commodity prices may result from relatively minor changes in the supply of and demand for natural gas and oil, market uncertainty and a variety of additional factors that are beyond our control. These factors include but are not limited to the following:
• | the levels and location of natural gas and oil supply and demand and expectations regarding supply and demand, including the potential long-term impact of an abundance of natural gas from shale (such as that produced from our Marcellus Shale properties) on the global natural gas supply; |
• | the level of consumer demand for natural gas and oil; |
• | weather conditions; |
• | political conditions or hostilities in natural gas and oil producing regions, including the Middle East, Africa, South America and the United States; |
• | the ability and willingness of the members of the Organization of Petroleum Exporting Countries and other exporting nations to agree to and maintain oil price and production controls; |
• | the price level and quantities of foreign imports; |
• | actions of governmental authorities; |
• | the availability, proximity and capacity of gathering, transportation, processing and/or refining facilities in regional or localized areas that may affect the realized price for natural gas and oil; |
• | inventory storage levels; |
• | the nature and extent of domestic and foreign governmental regulations and taxation, including environmental and climate change regulation; |
• | the price, availability and acceptance of alternative fuels; |
• | technological advances affecting energy consumption; |
• | speculation by investors in oil and natural gas; |
• | variations between product prices at sales points and applicable index prices; and |
• | overall economic conditions, including the value of the U.S. dollar relative to other major currencies. |
These factors and the volatile nature of the energy markets make it impossible to predict the future commodity prices. If commodity prices remain low or continue to decline significantly for a sustained period of time, the lower prices may cause us
20
to reduce our planned drilling program or adversely affect our ability to make planned expenditures, raise additional capital or meet our financial obligations.
Drilling natural gas and oil wells is a high-risk activity.
Our growth is materially dependent upon the success of our drilling program. Drilling for natural gas and oil involves numerous risks, including the risk that no commercially productive reservoirs will be encountered. The cost of drilling, completing and operating wells is substantial and uncertain, and drilling operations may be curtailed, delayed or canceled as a result of a variety of factors beyond our control, including:
• | decreases in commodity prices; |
• | unexpected drilling conditions, pressure or irregularities in formations; |
• | equipment failures or accidents; |
• | adverse weather conditions; |
• | surface access restrictions; |
• | loss of title or other title related issues; |
• | lack of available gathering or processing facilities or delays in the construction thereof; |
• | compliance with, or changes in, governmental requirements and regulation, including with respect to wastewater disposal, discharge of greenhouse gases and fracturing; and |
• | costs of shortages or delays in the availability of drilling rigs or crews and the delivery of equipment and materials. |
Our future drilling activities may not be successful and, if unsuccessful, such failure will have an adverse effect on our future results of operations and financial condition. Our overall drilling success rate or our drilling success rate within a particular geographic area may decline. We may be unable to lease or drill identified or budgeted prospects within our expected time frame, or at all. We may be unable to lease or drill a particular prospect because, in some cases, we identify a prospect or drilling location before seeking an option or lease rights in the prospect or location. Similarly, our drilling schedule may vary from our capital budget. The final determination with respect to the drilling of any scheduled or budgeted wells will be dependent on a number of factors, including:
• | the results of exploration efforts and the acquisition, review and analysis of seismic data; |
• | the availability of sufficient capital resources to us and the other participants for the drilling of the prospects; |
• | the approval of the prospects by other participants after additional data has been compiled; |
• | economic and industry conditions at the time of drilling, including prevailing and anticipated prices for natural gas and oil and the availability of drilling rigs and crews; |
• | our financial resources and results; and |
• | the availability of leases and permits on reasonable terms for the prospects and any delays in obtaining such permits. |
These projects may not be successfully developed and the wells, if drilled, may not encounter reservoirs of commercially productive natural gas or oil.
Our proved reserves are estimates. Any material inaccuracies in our reserve estimates or underlying assumptions could cause the quantities and net present value of our reserves to be overstated or understated
Reserve engineering is a subjective process of estimating underground accumulations of natural gas and oil that cannot be measured in an exact manner. The process of estimating quantities of proved reserves is complex and inherently imprecise, and the reserve data included in this document are only estimates. The process relies on interpretations of available geologic, geophysical, engineering and production data. The extent, quality and reliability of this technical data can vary. The process also requires certain economic assumptions, some of which are mandated by the SEC, such as commodity prices. Additional assumptions include drilling and operating expenses, capital expenditures, taxes and availability of funds. Furthermore, different reserve engineers may make different estimates of reserves and cash flows based on the same data.
21
Results of drilling, testing and production subsequent to the date of an estimate may justify revising the original estimate. Accordingly, initial reserve estimates often vary from the quantities of natural gas and oil that are ultimately recovered, and such variances may be material. Any significant variance could reduce the estimated quantities and present value of our reserves.
As of December 31, 2019, approximately 38 percent of our estimated proved reserves (by volume) were undeveloped. These reserve estimates reflect our plans to make capital expenditures for estimated future development costs of $1.8 billion to convert our PUD reserves into proved developed reserves. The estimated future development costs associated with our PUD reserves may not equal our actual costs, development may not occur as scheduled and results may not be as estimated. If we choose not to develop our PUD reserves, or if we are not otherwise able to successfully develop them, we will be required to remove them from our reported proved reserves. In addition, under the SEC’s reserve reporting rules, because PUD reserves generally may be booked only if they relate to wells scheduled to be drilled within five years of the date of booking, we may be required to remove any PUD reserves that are not developed within this five-year time frame.
You should not assume that the present value of future net cash flows from our proved reserves is the current market value of our estimated reserves. In accordance with SEC requirements, we base the estimated discounted future net cash flows from our proved reserves on the 12-month average index price for the respective commodity, calculated as the unweighted arithmetic average for the first day of the month price for each month and costs in effect on the date of the estimate, holding the prices and costs constant throughout the life of the properties. Actual future prices and costs may differ materially from those used in the net present value estimate, and future net present value estimates using then current prices and costs may be significantly less than the current estimate. In addition, the 10 percent discount factor we use when calculating discounted future net cash flows for reporting requirements in compliance with the applicable accounting standards may not be the most appropriate discount factor based on interest rates in effect from time to time and risks associated with us or the oil and gas industry in general.
Future commodity price declines may result in write-downs of the carrying amount of our oil and gas properties, which could materially and adversely affect our results of operations.
The value of our oil and gas properties depends on commodity prices. Declines in these prices as well as increases in development costs, changes in well performance, delays in asset development or deterioration of drilling results may result in our having to make material downward adjustments to our estimated proved reserves, and could result in an impairment charge and a corresponding write-down of the carrying amount of our oil and natural gas properties. Because substantially all of our reserves are natural gas, changes in natural gas prices have a more significant impact on our financial results.
We evaluate our oil and gas properties for impairment on a field-by-field basis whenever events or changes in circumstances indicate a property's carrying amount may not be recoverable. We compare expected undiscounted future cash flows to the net book value of the asset. If the future undiscounted expected cash flows, based on our estimate of future commodity prices, operating costs and anticipated production from proved reserves and risk-adjusted probable and possible reserves, are lower than the net book value of the asset, the capitalized cost is reduced to fair value. Commodity pricing is estimated by using a combination of assumptions management uses in its budgeting and forecasting process as well as historical and current prices adjusted for geographical location and quality differentials, as well as other factors that management believes will impact realizable prices. In the event that commodity prices decline, there could be a significant revision in the future.
Our producing properties are geographically concentrated in the Marcellus Shale in northeast Pennsylvania, making us vulnerable to risks associated with operating in one major geographic area.
Our producing properties are geographically concentrated in the Marcellus Shale in northeast Pennsylvania. At December 31, 2019 substantially all of our proved developed reserves and equivalent production were attributable to our properties located in the Marcellus Shale. As a result of this concentration, we may be disproportionately exposed to the impact of regional supply and demand factors, state and local political forces and governmental regulation, processing or transportation capacity constraints, market limitations, severe weather events, water shortages or other conditions or interruption of the processing or transportation of oil, natural gas or NGLs in the region.
Our future performance depends on our ability to find or acquire additional natural gas and oil reserves that are economically recoverable.
In general, the production rate of oil and gas properties declines as reserves are depleted, with the rate of decline depending on reservoir characteristics. Unless we successfully replace the reserves that we produce, our reserves will decline, eventually resulting in a decrease in natural gas production and lower revenues and cash flow from operations. Our future production is, therefore, highly dependent on our level of success in finding or acquiring additional reserves. We may not be
22
able to replace reserves through our exploration, development and exploitation activities or by acquiring properties at acceptable costs. Low commodity prices may further limit the kinds of reserves that we can develop and produce economically.
Our reserve report estimates that production from our proved developed reserves as of December 31, 2019 will decrease at a rate of 13 percent, 26 percent, 18 percent and 14 percent during 2020, 2021, 2022 and 2023, respectively. Future development of proved undeveloped and other reserves currently not classified as proved developed producing will impact these rates of decline. Because of higher initial decline rates from newly developed reserves, we consider this pattern to be fairly typical.
Exploration, development and exploitation activities involve numerous risks that may result in, among other things, dry holes, the failure to produce natural gas and oil in commercial quantities and the inability to fully produce discovered reserves.
We have substantial capital requirements, and we may not be able to obtain needed financing on satisfactory terms, if at all.
We make and expect to make substantial capital expenditures in connection with our development and production projects. We rely upon access to both our revolving credit facility and longer-term capital markets as sources of liquidity for any capital requirements not satisfied by cash flow from operations or other sources. Future challenges in the global financial system, including the capital markets, may adversely affect our business and our financial condition. Our ability to access the capital markets may be restricted at a time when we desire, or need, to raise capital, which could have an impact on our flexibility to react to changing economic and business conditions. Adverse economic and market conditions could adversely affect the collectability of our trade receivables and cause our commodity hedging counterparties to be unable to perform their obligations or to seek bankruptcy protection. Future challenges in the economy could also lead to reduced demand for natural gas which could have a negative impact on our revenues.
Risks associated with our debt and the provisions of our debt agreements could adversely affect our business, financial position and results of operations.
As of December 31, 2019, we had approximately $1.2 billion of debt outstanding and we may incur additional indebtedness in the future. Increases in our level of indebtedness may:
• | require us to use a substantial portion of our cash flow to make debt service payments, which will reduce the funds that would otherwise be available for operations, returning free cash flow to shareholders and future business opportunities; |
• | limit our operating flexibility due to financial and other restrictive covenants, including restrictions on incurring additional debt, making certain investments, and paying dividends; |
• | place us at a competitive disadvantage compared to our competitors with lower debt service obligations; |
• | depending on the levels of our outstanding debt, limit our ability to obtain additional financing for working capital, capital expenditures, general corporate and other purposes; and |
• | increase our vulnerability to downturns in our business or the economy, including declines in commodity prices. |
In addition, the margins we pay under our revolving credit facility depend on our leverage ratio. Accordingly, increases in the amount of our indebtedness without corresponding increases in our consolidated EBITDAX, or decreases in our EBITDAX without a corresponding decrease in our indebtedness, may result in an increase in our interest expense.
Our debt agreements also require compliance with covenants to maintain specified financial ratios. If commodity prices deteriorate from current levels or continue for an extended period, it could lead to reduced revenues, cash flow and earnings, which in turn could lead to a default due to lack of covenant compliance. Because the calculations of the financial ratios are made as of certain dates, the financial ratios can fluctuate significantly from period to period. A prolonged period of lower commodity prices could further increase the risk of our inability to comply with covenants to maintain specified financial ratios. In order to provide a margin of comfort with regard to these financial covenants, we may seek to reduce our capital expenditures, sell non-strategic assets or opportunistically modify or increase our derivative instruments to the extent permitted under our debt agreements. In addition, we may seek to refinance or restructure all or a portion of our indebtedness. We cannot provide assurance that we will be able to successfully execute any of these strategies, and such strategies may be unavailable on favorable terms or at all. For more information about our debt agreements, please read “Management’s Discussion and Analysis of Financial Condition and Results of Operations - Financial Condition - Capital Resources and Liquidity.”
23
The borrowing base under our revolving credit facility may be reduced, which could limit us in the future.
The borrowing base under our revolving credit facility is currently $3.2 billion, and lender commitments under our revolving credit facility are $1.5 billion. The borrowing base is redetermined annually under the terms of our revolving credit facility on April 1. In addition, either we or the banks may request an interim redetermination twice a year or in conjunction with certain acquisitions or sales of oil and gas properties. Our borrowing base may decrease as a result of lower commodity prices, operating difficulties, declines in reserves, lending requirements or regulations, the issuance of new indebtedness or for any other reason. In the event of a decrease in our borrowing base due to declines in commodity prices or otherwise, our ability to borrow under our revolving credit facility may be limited and we could be required to repay any indebtedness in excess of the redetermined borrowing base. In addition, we may be unable to access the equity or debt capital markets, including the market for senior unsecured notes, to meet our obligations, including any such debt repayment obligations.
Strategic determinations, including the allocation of capital and other resources to strategic opportunities, are challenging, and our failure to appropriately allocate capital and resources among our strategic opportunities may adversely affect our financial condition and reduce our growth rate.
Our future growth prospects are dependent upon our ability to identify optimal strategies for our business. In developing our business plan, we considered allocating capital and other resources to various aspects of our businesses including well-development (primarily drilling), reserve acquisitions, exploratory activity, corporate items and other alternatives. We also considered our likely sources of capital. Notwithstanding the determinations made in the development of our 2020 plan, business opportunities not previously identified periodically come to our attention, including possible acquisitions and dispositions. If we fail to identify optimal business strategies, or fail to optimize our capital investment and capital raising opportunities and the use of our other resources in furtherance of our business strategies, our financial condition and growth rate may be adversely affected. Moreover, economic or other circumstances may change from those contemplated by our 2020 plan, and our failure to recognize or respond to those changes may limit our ability to achieve our objectives.
Negative public perception regarding us and/or our industry could have an adverse effect on our operations.
Negative public perception regarding us and/or our industry resulting from, among other things, concerns raised by advocacy groups about hydraulic fracturing, oil spills, greenhouse gas or methane emissions and explosions of natural gas transmission lines, may lead to increased regulatory scrutiny, which may, in turn, lead to new state and federal safety and environmental laws, regulations, guidelines and enforcement interpretations. These actions may cause operational delays or restrictions, increased operating costs, additional regulatory burdens and increased risk of litigation. Moreover, governmental authorities exercise considerable discretion in the timing and scope of permit issuance and the public may engage in the permitting process, including through intervention in the courts. Negative public perception could cause the permits we need to conduct our operations to be withheld, delayed, or burdened by requirements that restrict our ability to profitably conduct our business.
Our ability to sell our natural gas production and/or the prices we receive for our production could be materially harmed if we fail to obtain adequate services such as transportation and processing.
The sale of our natural gas production depends on a number of factors beyond our control, including the availability and capacity of transportation and processing facilities. We deliver our natural gas production primarily through gathering systems and pipelines that we do not own. The lack of available capacity on these systems and facilities could reduce the price offered for our production or result in the shut-in of producing wells or the delay or discontinuance of development plans for properties. Third-party systems and facilities may be unavailable due to market conditions or mechanical or other reasons. In addition, at current commodity prices, construction of new pipelines and building of such infrastructure may be slower to build out. To the extent these services are unavailable, we would be unable to realize revenue from wells served by such facilities until suitable arrangements are made to market our production. Our failure to obtain these services on acceptable terms could materially harm our business.
For example, the Marcellus Shale wells we have drilled to date have generally reported very high initial production rates. The amount of natural gas being produced in the area from these new wells, as well as natural gas produced from other existing wells, may exceed the capacity of the various gathering and intrastate or interstate transportation pipelines currently available. In such an event, this could result in wells being shut in or awaiting a pipeline connection or capacity and/or natural gas being sold at much lower prices than those quoted on NYMEX or than we currently project, which would adversely affect our results of operations and cash flows.
24
We are subject to complex laws and regulations, including environmental and safety regulations, which can adversely affect the cost, manner or feasibility of doing business.
Our operations are subject to extensive federal, state and local laws and regulations, including drilling, permitting and safety laws and regulations and those relating to the generation, storage, handling, emission, transportation and discharge of materials into the environment. These laws and regulations can adversely affect the cost, manner or feasibility of doing business. Many laws and regulations require permits for the operation of various facilities, and these permits are subject to revocation, modification and renewal. Governmental authorities have the power to enforce compliance with their regulations, and violations could subject us to fines, injunctions or both. These laws and regulations have increased the costs of planning, designing, drilling, installing and operating natural gas and oil facilities, and new laws and regulations or revisions or reinterpretations of existing laws and regulations could further increase these costs. In addition, we may be liable for environmental damages caused by previous owners or operators of property we purchase or lease. Risks of substantial costs and liabilities related to environmental compliance issues are inherent in natural gas and oil operations. For example, we could be required to install expensive pollution control measures or limit or cease activities on lands located within wilderness, wetlands or other environmentally or politically sensitive areas. Failure to comply with these laws also may result in the suspension or termination of our operations and subject us to administrative, civil and criminal penalties as well as the imposition of corrective action orders. It is possible that other developments, such as stricter environmental laws and regulations, and claims for damages to property or persons resulting from natural gas and oil production, would result in substantial costs and liabilities.
Acquired properties may not be worth what we pay due to uncertainties in evaluating recoverable reserves and other expected benefits, as well as potential liabilities.
Successful property acquisitions require an assessment of a number of factors beyond our control. These factors include estimates of recoverable reserves, exploration potential, future commodity prices, operating costs, production taxes and potential environmental and other liabilities. These assessments are complex and inherently imprecise. Our review of the properties we acquire may not reveal all existing or potential problems. In addition, our review may not allow us to fully assess the potential deficiencies of the properties. We do not inspect every well, and even when we inspect a well we may not discover structural, subsurface, or environmental problems that may exist or arise.
There may be threatened or contemplated claims against the assets or businesses we acquire related to environmental, title, regulatory, tax, contract, litigation or other matters of which we are unaware, which could materially and adversely affect our production, revenues and results of operations. We often assume certain liabilities, and we may not be entitled to contractual indemnification for pre-closing liabilities, including environmental liabilities, and our contractual indemnification may not be effective. At times, we acquire interests in properties on an "as is" basis with limited representations and warranties and limited remedies for breaches of such representations and warranties. In addition, significant acquisitions can change the nature of our operations and business if the acquired properties have substantially different operating and geological characteristics or are in different geographic locations than our existing properties.
The integration of the businesses and properties we may acquire could be difficult, and may divert management's attention away from our existing operations.
The integration of the businesses and properties we may acquire could be difficult, and may divert management's attention and financial resources away from our existing operations. These difficulties include:
• | the challenge of integrating the acquired businesses and properties while carrying on the ongoing operations of our business; |
• | the inability to retain key employees of the acquired business; |
• | potential lack of operating experience in a geographic market of the acquired properties; and |
• | the possibility of faulty assumptions underlying our expectations. |
The process of integrating our operations could cause an interruption of, or loss of momentum in, the activities of our business. Members of our management may be required to devote considerable amounts of time to this integration process, which will decrease the time they will have to manage our existing business. If management is not able to effectively manage the integration process, or if any significant business activities are interrupted as a result of the integration process, our business could suffer.
25
We face a variety of hazards and risks that could cause substantial financial losses.
Our business involves a variety of operating risks, including:
• | well site blowouts, cratering and explosions; |
• | equipment failures; |
• | pipe or cement failures and casing collapses, which can release natural gas, oil, drilling fluids or hydraulic fracturing fluids; |
• | uncontrolled flows of natural gas, oil or well fluids; |
• | pipeline ruptures; |
• | fires; |
• | formations with abnormal pressures; |
• | handling and disposal of materials, including drilling fluids and hydraulic fracturing fluids; |
• | release of toxic gas; |
• | buildup of naturally occurring radioactive materials; |
• | pollution and other environmental risks, including conditions caused by previous owners or operators of our properties; and |
• | natural disasters. |
Any of these events could result in injury or loss of human life, loss of hydrocarbons, significant damage to or destruction of property, environmental pollution, regulatory investigations and penalties, suspension or impairment of our operations and substantial losses to us.
Our utilization of natural gas gathering and pipeline systems also involves various risks, including the risk of explosions and environmental hazards caused by pipeline leaks and ruptures. The location of pipelines near populated areas, including residential areas, commercial business centers and industrial sites, could increase these risks.
We may not be insured against all of the operating risks to which we are exposed.
We maintain insurance against some, but not all, operating risks and losses. We do not carry business interruption insurance. In addition, pollution and environmental risks generally are not fully insurable. The occurrence of an event not fully covered by insurance could have a material adverse effect on our financial position, results of operations and cash flows.
We have limited control over the activities on properties we do not operate.
Other companies operate some of the properties in which we have an interest. As of December 31, 2019, non-operated wells represented approximately nine percent of our total owned gross wells, or approximately one percent of our owned net wells. We have limited ability to influence or control the operation or future development of these non-operated properties, including compliance with environmental, safety and other regulations, or the amount of capital expenditures that we are required to fund with respect to them. The failure of an operator of our wells to adequately perform operations, an operator's breach of the applicable agreements or an operator's failure to act in ways that are in our best interest could reduce our production and revenues. Our dependence on the operator and other working interest owners for these projects and our limited ability to influence or control the operation and future development of these properties could materially adversely affect the realization of our targeted returns on capital in drilling or acquisition activities and lead to unexpected future costs.
Competition in our industry is intense, and many of our competitors have substantially greater financial and technological resources than we do, which could adversely affect our competitive position.
Competition in the natural gas and oil industry is intense. Major and independent natural gas and oil companies actively bid for desirable natural gas and oil properties, as well as for the capital, equipment and labor required to operate and develop these properties. Our competitive position is affected by price, contract terms and quality of service, including pipeline connection times, distribution efficiencies and reliable delivery record. Many of our competitors have financial and technological resources and exploration and development budgets that are substantially greater than ours. These companies
26
may be able to pay more for exploratory projects and productive natural gas and oil properties and may be able to define, evaluate, bid for and purchase a greater number of properties and prospects than our financial or human resources permit. In addition, these companies may be able to expend greater resources on the existing and changing technologies that we believe will be increasingly important to attaining success in the industry. These companies may also have a greater ability to continue drilling activities during periods of low natural gas and oil prices and to absorb the burden of current and future governmental regulations and taxation.
We may have hedging arrangements that expose us to risk of financial loss and limit the benefit to us of increases in prices for natural gas.
From time to time, when we believe that market conditions are favorable, we use financial derivative instruments to manage price risk associated with our natural gas production. While there are many different types of derivatives available, we generally utilize collar, swap and basis swap agreements to manage price risk more effectively.
The collar arrangements are put and call options used to establish floor and ceiling prices for a fixed volume of production during a certain time period. They provide for payments to counterparties if the index price exceeds the ceiling and payments from the counterparties if the index price falls below the floor. The swap agreements call for payments to, or receipts from, counterparties based on whether the index price for the period is greater or less than the fixed price established for that period when the swap is put in place. These arrangements limit the benefit to us of increases in prices. In addition, these arrangements expose us to risks of financial loss in a variety of circumstances, including when:
• | there is an adverse change in the expected differential between the underlying price in the derivative instrument and actual prices received for our production; |
• | production is less than expected; or |
• | a counterparty is unable to satisfy its obligations. |
The CFTC has promulgated regulations to implement statutory requirements for swap transactions. These regulations are intended to implement a regulated market in which most swaps are executed on registered exchanges or swap execution facilities and cleared through central counterparties. While we believe that our use of swap transactions exempt us from certain regulatory requirements, the changes to the swap market due to increased regulation could significantly increase the cost of entering into new swaps or maintaining existing swaps, materially alter the terms of new or existing swap transactions and/or reduce the availability of new or existing swaps. If we reduce our use of swaps as a result of the Dodd-Frank Act and regulations, our results of operations may become more volatile and our cash flows may be less predictable.
We will continue to evaluate the benefit of utilizing derivatives in the future. Please read "Management's Discussion and Analysis of Financial Condition and Results of Operations" in Item 7 and "Quantitative and Qualitative Disclosures about Market Risk" in Item 7A for further discussion concerning our use of derivatives.
The loss of key personnel could adversely affect our ability to operate.
Our operations are dependent upon a relatively small group of key management and technical personnel, and one or more of these individuals could leave our employment. The unexpected loss of the services of one or more of these individuals could have a detrimental effect on us. In addition, our drilling success and the success of other activities integral to our operations will depend, in part, on our ability to attract and retain experienced geologists, engineers and other professionals. Competition for experienced geologists, engineers and some other professionals is extremely intense. If we cannot retain our technical personnel or attract additional experienced technical personnel, our ability to compete could be harmed.
Oil and natural gas production operations, especially those using hydraulic fracturing, are substantially dependent on the availability of water. Our ability to produce natural gas economically and in commercial quantities could be impaired if we are unable to acquire adequate supplies of water for our operations or are unable to dispose of or recycle the water we use economically and in an environmentally safe manner.
Water is an essential component of oil and natural gas production during the drilling, and in particular, hydraulic fracturing, process. Our inability to locate sufficient amounts of water, or dispose of or recycle water used in our exploration and production operations, could adversely impact our operations. For water sourcing, we first seek to use non-potable water supplies for our operational needs. In certain areas, there may be insufficient local aquifer capacity to provide a source of water for drilling activities. Water must then be obtained from other sources and transported to the drilling site. An inability to secure sufficient amounts of water or to dispose of or recycle the water used in our operations could adversely impact our operations in certain areas. The imposition of new environmental regulations could further restrict our ability to conduct operations such as hydraulic fracturing by restricting the disposal of things such as produced water and drilling fluids.
27
Federal and state legislation, judicial actions and regulatory initiatives related to oil and gas development, including hydraulic fracturing, could result in increased costs and operating restrictions or delays and adversely affect our business, financial condition, results of operations and cash flows.
Most of our exploration and production operations depend on the use of hydraulic fracturing to enhance production from oil and gas wells. This technology involves the injection of fluids—usually consisting mostly of water but typically including small amounts of several chemical additives—as well as sand or other proppants into a well under high pressure in order to create fractures in the rock that allow oil or gas to flow more freely to the wellbore. Most of our wells would not be economical without the use of hydraulic fracturing to stimulate production from the well. Hydraulic fracturing operations have historically been overseen by state regulators as part of their oil and gas regulatory programs; however, the EPA has asserted federal regulatory authority over certain hydraulic fracturing activities involving diesel under the Safe Drinking Water Act and has released permitting guidance for hydraulic fracturing activities that use diesel in fracturing fluids in those states where the EPA is the permitting authority, including Pennsylvania. As a result, we may be subject to additional permitting requirements for hydraulic fracturing operations as well as various restrictions on those operations. These permitting requirements and restrictions could result in delays in operations at well sites as well as increased costs to make wells productive. Several candidates in the 2020 United States presidential campaign have indicated that they would support federal government efforts to limit or prohibit hydraulic fracturing. In addition, from time to time, legislation has been introduced, but not enacted, in Congress that would provide for federal regulation of hydraulic fracturing under the Safe Drinking Water Act and require the public disclosure of certain information regarding the chemical makeup of hydraulic fracturing fluids. If enacted, this legislation could establish an additional level of regulation and permitting at the federal, state or local levels, and could make it easier for third parties opposed to the hydraulic fracturing process to initiate legal proceedings based on allegations that specific chemicals used in the fracturing process could adversely affect the environment, including groundwater, soil or surface water. In March 2015, the Department of the Interior's Bureau of Land Management issued a final rule to regulate hydraulic fracturing on public and Indian land; however, these rules were rescinded by rule in December 2017. We voluntarily disclose on a well-by-well basis the chemicals we use in the hydraulic fracturing process at www.fracfocus.org.
In addition, state and federal regulatory agencies recently have focused on a possible connection between the operation of injection wells used for oil and gas waste disposal and seismic activity. Similar concerns have been raised that hydraulic fracturing may also contribute to seismic activity. When caused by human activity, such events are called induced seismicity. In March 2016, the United States Geological Survey identified six states with the most significant hazards from induced seismicity, including Oklahoma, Kansas, Texas, Colorado, New Mexico, and Arkansas. In light of these concerns, some state regulatory agencies have modified their regulations or issued orders to address induced seismicity. Certain environmental and other groups have also suggested that additional federal, state and local laws and regulations may be needed to more closely regulate the hydraulic fracturing process. We cannot predict whether additional federal, state or local laws or regulations applicable to hydraulic fracturing will be enacted in the future and, if so, what actions any such laws or regulations would require or prohibit. Increased regulation and attention given to induced seismicity could lead to greater opposition to, and litigation concerning, oil and gas activities utilizing hydraulic fracturing or injection wells for waste disposal, which could have an adverse effect on oil and natural gas production activities, including operational delays or increased operating costs in the production of oil and natural gas from developing shale plays, or could make it more difficult to perform hydraulic fracturing.
On August 16, 2012, the EPA published final rules that establish new air emission control requirements for natural gas and NGL production, processing and transportation activities, including NSPS to address emissions of sulfur dioxide and volatile organic compounds, and NESHAPS to address hazardous air pollutants frequently associated with gas production and processing activities. In June 2016, the EPA published a final rule that updates and expands the NSPS by setting additional emissions limits for volatile organic compounds and regulating methane emissions for new and modified sources in the oil and gas industry. In June 2017, the EPA proposed a two year stay of certain requirements contained in the June 2016 rule and in November 2017 issued a notice of data availability in support of the stay proposal and provided a 30-day comment period on the information provided. In March 2018, the EPA published a final rule that amended two narrow provisions of the NSPS, removing the requirement for completion of delayed repair during emergency or unscheduled vent blowdowns. A 2016 information collection request made to oil and natural gas facilities by the EPA in connection with its intention at the time to regulate methane emissions from existing sources were withdrawn in March 2017. The EPA also published a final rule in June 2016 concerning aggregation of sources that affects source determinations for air permitting in the oil and gas industry.
Compliance with these requirements, especially the new methane regulation, may require modifications to certain of our operations or increase the cost of new or modified facilities, including the installation of new equipment to control emissions at the well site that could result in significant costs, including increased capital expenditures and operating costs, and could adversely impact our business. Similarly, aggregating our oil and gas facilities for permitting could result in more complex, costly, and time consuming air permitting. Particularly in regard to obtaining pre-construction permits, the final aggregation rule could add costs and cause delays in our operations.
28
In addition to these federal legislative and regulatory proposals, some states in which we operate, such as Pennsylvania, and certain local governments have adopted, and others are considering adopting, regulations that could restrict hydraulic fracturing in certain circumstances, including requirements regarding chemical disclosure, casing and cementing of wells, withdrawal of water for use in high-volume hydraulic fracturing of horizontal wells, baseline testing of nearby water wells, and restrictions on the type of additives that may be used in hydraulic fracturing operations. For example, New York issued a statewide ban on hydraulic fracturing in June 2015. In addition, Pennsylvania's Act 13 of 2012 became law on February 14, 2012 and amended the state's Oil and Gas Act to, among other things, increase civil penalties and strengthen the Pennsylvania Department of Environmental Protection's (PaDEP) authority over the issuance of drilling permits. Although the Pennsylvania Supreme Court struck down portions of Act 13 that made statewide rules on oil and gas preempt local zoning rules, this could lead to additional local restrictions on oil and gas activity in the state. In addition, if existing laws and regulations with regard to hydraulic fracturing are revised or reinterpreted or if new laws and regulations become applicable to our operations through judicial or administrative actions, our business, financial condition, results of operations and cash flows could be adversely affected. For example, a Pennsylvania state trial court in 2018 refused to apply the established common law rule of capture in a case concerning claims of trespass by hydraulic fracturing. The Pennsylvania Supreme Court heard the appeal of this ruling and on January 22, 2020 affirmed the rule of capture and remanded the case to the Pennsylvania state trial court for further proceedings. Depending on the ultimate outcome at the Pennsylvania state trial court, this case could still have a material impact on our operations.
We use a significant amount of water in our hydraulic fracturing operations. Our inability to locate sufficient amounts of water, or dispose of or recycle water used in our operations, could adversely impact our operations. Moreover, new environmental initiatives and regulations could include restrictions on our ability to conduct certain operations such as hydraulic fracturing or disposal of waste, including, but not limited to, produced water, drilling fluids and other wastes associated with the exploration, development or production of natural gas. Compliance with environmental regulations and permit requirements governing the withdrawal, storage and use of surface water or groundwater necessary for hydraulic fracturing of wells may increase our operating costs and cause delays, interruptions or termination of our operations, the extent of which cannot be predicted, all of which could have an adverse effect on our operations and financial condition. For example, in April 2011, PaDEP called on all Marcellus Shale natural gas drilling operators to voluntarily cease by May 19, 2011 delivering wastewater to those centralized treatment facilities that were grandfathered from the application of PaDEP's Total Dissolved Solids regulations. In June 2016, the EPA published final pretreatment standards for disposal of wastewater produced from shale gas operations to publicly owned treatment works. The regulations were developed under the EPA's Effluent Guidelines Program under the authority of the Clean Water Act. In response to these actions, operators including us have begun to rely more on recycling of flowback and produced water from well sites as a preferred alternative to disposal.
A number of federal agencies are analyzing, or have been requested to review, a variety of environmental issues associated with hydraulic fracturing practices. For example, the EPA conducted a study of the potential environmental effects of hydraulic fracturing on drinking water and groundwater. The EPA released its final report in December 2016. It concluded that hydraulic fracturing activities can impact drinking water resources under some circumstances, including large volume spills and inadequate mechanical integrity of wells. This study and other studies that may be undertaken by the EPA or other federal agencies could spur initiatives to further regulate hydraulic fracturing under the Safe Drinking Water Act, the Toxic Substances Control Act, or other statutory and/or regulatory mechanisms.
Climate change and climate change legislation and regulatory initiatives could result in increased operating costs and decreased demand for the oil and natural gas that we produce.
Scientific studies have suggested that emissions of certain gases, commonly referred to as “greenhouse gases” (GHGs), including carbon dioxide and methane, may be contributing to warming of the earth’s atmosphere and other climatic changes. In response to such studies, the issue of climate change and the effect of GHG emissions, in particular emissions from fossil fuels, has and continues to attract political and social attention. The regulatory response to and physical effects of climate change have the potential to negatively affect our business in many ways, including increasing the costs to provide our products and services, reducing the demand for and consumption of our products and services (due to change in both costs and weather patterns), and the economic health of the regions in which we operate, all of which can create financial risks.
Legislation to regulate GHG emissions has periodically been introduced in the U.S. Congress and such legislation may be proposed or adopted in the future. In addition, the EPA has adopted regulations addressing GHG emissions. In 2009 and 2010, the EPA adopted rules requiring the monitoring, reporting and recordkeeping of GHG emissions from specified sources in the United States, including onshore and offshore oil and natural gas production facilities that emit 25,000 metric tons or more of CO2e per year. Since 2012, we have been required to report our GHG emissions to the EPA each year in March under these rules and have submitted our annual reports in compliance with the deadline. In 2015, the EPA finalized rules adding additional sources to the scope of the GHG monitoring and reporting requirements, including gathering and boosting facilities as well as completions and workovers from hydraulically fractured oil wells, and adding well identification reporting requirements for
29
certain facilities. The EPA published a final rule in 2016 adding monitoring methods for detecting leaks from oil and gas equipment and emission factors for leaking equipment to be used to calculate and report GHG emissions resulting from equipment leaks. In addition to the GHG monitoring and reporting rules, the EPA adopted rules requiring permits for GHGs for certain large stationary sources beginning in 2011. However, in 2014, the U.S. Supreme Court, in Utility Air Regulatory Group v. EPA, limited the application of the GHG permitting requirements under the Prevention of Significant Deterioration and Title V permitting programs to sources that would otherwise need permits based on the emission of conventional pollutants. A discussion of federal methane regulations is provided in the preceding risk factor.
There have also been international efforts seeking legally binding reductions in GHG emissions. The United States was actively involved in the negotiations at the 21st Conference of the Parties of the United Nations Framework Convention on Climate Change in Paris (the “UNFCCC”), which led to the creation of the Paris Agreement. The Paris Agreement requires countries to review and "represent a progression" in their nationally determined contributions, which set emissions reduction goals, every five years. The United States was a signatory to the Paris Agreement, which entered into full force in November 2016. On June 1, 2017, the President of the United States announced that the United States planned to withdraw from the Paris Agreement and to seek negotiations to either reenter the Paris Agreement on different terms or establish a new framework agreement. The earliest possible effective date for the United States withdrawal is November 4, 2020, which is four years from the date the agreement took effect. The United States’ adherence to the exit process is uncertain, and the terms on which the United States may reenter the Paris Agreement, or a separately negotiated agreement are unclear at this time.
It is not possible at this time to predict the timing and effect of climate change or to predict the effect of the Paris Agreement or whether additional GHG legislation, regulations or other measures will be adopted at the federal, state or local levels. However, more aggressive efforts by governments and non-governmental organizations to reduce GHG emissions appear likely and any such future laws and regulations could result in increased compliance costs or additional operating restrictions. For example, several U.S. states and cities have committed to advance the objectives of the Paris Agreement at the state or local level despite the pending federal withdrawal.
The passage of any federal or state climate change laws or regulations in the future could result in increased costs to (i) operate and maintain our facilities, (ii) install new emission controls on our facilities and (iii) administer and manage any GHG emissions program. If we are unable to recover or pass through a significant level of our costs related to complying with climate change regulatory requirements imposed on us, it could have a material adverse effect on our results of operations and financial condition. To the extent financial markets view climate change and GHG emissions as a financial risk, this could negatively impact our cost of and access to capital. Legislation or regulations that may be adopted to address climate change could also affect the markets for our products by making our products more or less desirable than competing sources of energy.
Beyond financial and regulatory impacts, climate change poses potential physical risks. Scientific studies forecast that these risks include an increase in sea level, stresses on water supply and changes in weather conditions, such as an increase in changes in precipitation and extreme weather events. The projected physical effects of climate change have the potential to directly affect, delay and result in increased costs related to our operations. In addition, warmer winters as a result of global warming could also decrease demand for natural gas. However, because the nature and timing of changes in extreme weather events (such as increased frequency, duration, and severity) are uncertain, any estimations of future financial risk to our operations caused by these potential physical risks of climate change would be unreliable.
Terrorist activities and the potential for military and other actions could adversely affect our business.
The threat of terrorism and the impact of military and other action have caused instability in world financial markets and could lead to increased volatility in prices for natural gas and oil, all of which could adversely affect the markets for our operations. Acts of terrorism, including cybersecurity threats to gain unauthorized access to sensitive information or to render data or systems unusable, could be directed against companies operating in the United States. The U.S. government has issued public warnings that indicate energy assets might be specific targets of terrorist organizations. These developments have subjected our operations to increased risk and, depending on their ultimate magnitude, could have a material adverse effect on our business.
Cyber-attacks targeting our systems, the oil and gas industry systems and infrastructure, or the systems of our third-party service providers could adversely affect our business.
Our business and the oil and gas industry in general have become increasingly dependent on digital data, computer networks and connected infrastructure, including technologies that are managed by third-party providers on whom we rely to help us collect, host or process information. We depend on this technology to record and store financial data, estimate quantities of natural gas and crude oil reserves, analyze and share operating data and communicate internally and externally. Computers
30
control nearly all of the oil and gas distribution systems in the United States, which are necessary to transport our products to market, to enable communications and to provide a host of other support services for our business.
Cyber-attacks are becoming more sophisticated and include, but are not limited to, malicious software, phishing, ransomware, attempts to gain unauthorized access to data, and other electronic security breaches that could lead to disruptions in critical systems, unauthorized release of confidential or otherwise protected information and corruption of data. Unauthorized access to our seismic data, reserves information, customer or employee data or other proprietary or commercially sensitive information could lead to data corruption, communication interruption, or other disruptions in our exploration or production operations or planned business transactions, any of which could have a material adverse impact on our results of operations. If our information technology systems cease to function properly or our cybersecurity is breached, we could suffer disruptions to our normal operations, which may include drilling, completion, production and corporate functions. A cyber-attack involving our information systems and related infrastructure, or that of our business associates, could result in supply chain disruptions that delay or prevent the transportation and marketing of our production, non-compliance leading to regulatory fines or penalties, loss or disclosure of, or damage to, our or any of our customer’s or supplier’s data or confidential information that could harm our business by damaging our reputation, subjecting us to potential financial or legal liability, and requiring us to incur significant costs, including costs to repair or restore our systems and data or to take other remedial steps.
In addition, certain cyber incidents, such as surveillance, may remain undetected for an extended period, and our systems and insurance coverage for protecting against such cybersecurity risks may not be sufficient. As cyber-attackers become more sophisticated, we may be required to expend significant additional resources to continue to protect our business or remediate the damage from cyber-attacks. Furthermore, the continuing and evolving threat of cyber-attacks has resulted in increased regulatory focus on prevention, and we may be required to expend significant additional resources to continue to modify or enhance our protective measures or to investigate and remediate any information security vulnerabilities. To the extent we face increased regulatory requirements, we may be required to expend significant additional resources to meet such requirements.
We are subject to a number of privacy and data protection laws, rules and directives (collectively, “data protection laws”) relating to the processing of personal data.
The regulatory environment surrounding data protection laws is uncertain. Complying with varying jurisdictional requirements could increase the costs and complexity of compliance, and violations of applicable data protection laws can result in significant penalties. A determination that there have been violations of applicable data protection laws could expose us to significant damage awards, fines and other penalties that could materially harm our business and reputation.
Any failure, or perceived failure, by us to comply with applicable data protection laws could result in proceedings or actions against us by governmental entities or others, subject us to significant fines, penalties, judgments and negative publicity, require us to change our business practices, increase the costs and complexity of compliance, and adversely affect our business. As noted above, we are also subject to the possibility of security and privacy breaches, which themselves may result in a violation of these laws. Additionally, the acquisition of a company that is not in compliance with applicable data protection laws may result in a violation of these laws.
Tax law changes could have an adverse effect on our financial position, results of operations, and cash flows.
On December 22, 2017, the U.S. enacted legislation referred to as the Tax Cuts and Jobs Act (the Tax Act). The Tax Act significantly changed U.S. corporate income tax laws beginning, generally, in 2018. Refer to Note 11 of the Notes to the Consolidated Financial Statements, Income Taxes, for a discussion on the impact of the Tax Act on us. There exist various uncertainties and ambiguities in the application of certain provisions of the Tax Act. In the absence of guidance, we have used what we believe are reasonable interpretations and assumptions in applying the Tax Act. It is possible that the Internal Revenue Service could issue subsequent regulations or other guidance or take positions on audit that differ from our prior interpretations and assumptions, which could adversely impact our financial position, results of operations, and cash flows.
While the Tax Act maintained many of the tax incentives and deductions that are used by U.S. oil and gas companies, including the percentage depletion allowance for oil and natural gas companies, the ability to fully deduct intangible drilling costs in the year incurred, and the current amortization period of geological and geophysical expenditures for independent producers, the U.S. tax law is always subject to change. Periodically, legislation is proposed to repeal these industry tax incentives and deductions, and/or to impose new industry taxes. In addition, various states are still determining if and to what extent they will conform to the Tax Act. Further, many states are currently in deficits, and have been enacting laws eliminating or limiting certain deductions, carryforwards, and credits in order to increase tax revenue.
Should the U.S. or the states publish guidance or pass tax legislation limiting any currently allowed tax incentives and deductions, our taxes would increase, potentially significantly, which would have a negative impact on our net income and cash
31
flows. This could also reduce our drilling activities in the U.S. Since future changes to federal and state tax legislation and regulations are unknown, we cannot know the ultimate impact such changes may have on our business.
Provisions of Delaware law and our bylaws and charter could discourage change in control transactions and prevent stockholders from receiving a premium on their investment.
Our charter authorizes our Board of Directors to set the terms of preferred stock. In addition, Delaware law contains provisions that impose restrictions on business combinations with interested parties. Our bylaws prohibit the calling of a special meeting by our stockholders and place procedural requirements and limitations on stockholder proposals at meetings of stockholders. Because of these provisions of our charter, bylaws and Delaware law, persons considering unsolicited tender offers or other unilateral takeover proposals may be more likely to negotiate with our Board of Directors rather than pursue non-negotiated takeover attempts. As a result, these provisions may make it more difficult for our stockholders to benefit from transactions that are opposed by an incumbent Board of Directors.
The personal liability of our directors for monetary damages for breach of their fiduciary duty of care is limited by the Delaware General Corporation Law and by our charter.
The Delaware General Corporation Law allows corporations to limit available relief for the breach of directors' duty of care to equitable remedies such as injunction or rescission. Our charter limits the liability of our directors to the fullest extent permitted by Delaware law. Specifically, our directors will not be personally liable for monetary damages for any breach of their fiduciary duty as a director, except for liability:
• | for any breach of their duty of loyalty to the Company or our stockholders; |
• | for acts or omissions not in good faith or that involve intentional misconduct or a knowing violation of law; |
• | under provisions relating to unlawful payments of dividends or unlawful stock repurchases or redemptions; and |
• | for any transaction from which the director derived an improper personal benefit. |
This limitation may have the effect of reducing the likelihood of derivative litigation against directors, and may discourage or deter stockholders or management from bringing a lawsuit against directors for breach of their duty of care, even though such an action, if successful, might otherwise have benefited our stockholders.
ITEM 1B. UNRESOLVED STAFF COMMENTS
None.
ITEM 3. LEGAL PROCEEDINGS
Legal Matters
The information set forth under the heading "Legal Matters" in Note 9 of the Notes to Consolidated Financial Statements included in Item 8 of this Annual Report on Form 10-K is incorporated by reference in response to this item.
Environmental Matters
On June 17, 2019, we received two proposed Consent Order and Agreements (CO&A) from the Pennsylvania Department of Environmental Protection (PaDEP) relating to gas migration allegations in areas surrounding several wells owned and operated by us in Susquehanna County, Pennsylvania. The allegations relating to these wells were initially raised by residents in the area in March and June 2017, respectively, in the form of complaints about their drinking water supply. Since then, we have been engaged with the PaDEP in investigating the incidents and have performed appropriate remediation efforts, including the provision of alternative sources of drinking water to the affected residents. We received Notices of Violation (NOV) from the PaDEP in June and November, 2017, respectively, for failure to prevent the migration of gas into fresh groundwater sources in the area surrounding these wells. With regard to the June 2017 NOV, we believe these water quality complaints have been resolved, and we are working with the PaDEP to reach agreement on the disposition of this matter. The proposed CO&A is the culmination of this effort and, if finalized, would result in the payment of a civil monetary penalty in an amount likely to exceed $100,000, up to approximately $215,000. We will continue to work with the PaDEP to finalize the CO&A, and to bring this matter to a close. With regard to the November 2017 NOV, the proposed CO&A, if finalized as drafted, would require Cabot to submit a detailed written remediation plan, continue water sampling and other investigative measures and restore or replace affected water supplies and would result in the payment of a civil monetary penalty in an amount likely to exceed $100,000, up to approximately $355,000. We will continue to work with the PaDEP to finalize the CO&A, and to complete the ongoing investigation and remediation.
32
From time to time we receive notices of violation from governmental and regulatory authorities in areas in which we operate relating to alleged violations of environmental statutes or the rules and regulations promulgated thereunder. While we cannot predict with certainty whether these notices of violation will result in fines and/or penalties, if fines and/or penalties are imposed, they may result in monetary sanctions, individually or in the aggregate, in excess of $100,000.
ITEM 4. MINE SAFETY DISCLOSURES
Not applicable.
EXECUTIVE OFFICERS OF THE REGISTRANT
The following table shows certain information as of February 19, 2020 about our executive officers, as such term is defined in Rule 3b-7 of the Securities Exchange Act of 1934, and certain of our other officers.
Name | Age | Position | Officer Since | ||||
Dan O. Dinges | 66 | Chairman, President and Chief Executive Officer | 2001 | ||||
Scott C. Schroeder | 57 | Executive Vice President and Chief Financial Officer | 1997 | ||||
Jeffrey W. Hutton | 64 | Senior Vice President, Marketing | 1995 | ||||
Todd L. Liebl | 62 | Senior Vice President, Land and Business Development | 2012 | ||||
Steven W. Lindeman | 59 | Senior Vice President, EHS and Engineering | 2011 | ||||
Phillip L. Stalnaker | 60 | Senior Vice President, Operations | 2009 | ||||
G. Kevin Cunningham | 66 | Vice President and General Counsel | 2010 | ||||
Charles E. Dyson II | 48 | Vice President, Information Services | 2018 | ||||
Matthew P. Kerin | 39 | Vice President, Finance and Treasurer | 2014 | ||||
Julius Leitner | 57 | Vice President, Marketing | 2017 | ||||
Todd M. Roemer | 49 | Vice President and Chief Accounting Officer | 2010 | ||||
Deidre L. Shearer | 52 | Vice President, Administration and Corporate Secretary | 2012 | ||||
All officers are elected annually by our Board of Directors. All of the executive officers have been employed by Cabot Oil & Gas Corporation for at least the last five years, except for Mr. Charles E. Dyson II and Mr. Julius Leitner.
Mr. Dyson joined the Company as the Director of Information Services in October 2015 and was promoted to Vice President of Information Services in February 2018. Prior to joining the Company, he served as the Director of Infrastructure and Support Services at Transocean Offshore Deepwater Drilling, Inc. Mr. Dyson holds a Bachelor of Business Administration degree in Finance from Texas A&M University.
Mr. Leitner joined the Company as Vice President, Marketing in July 2017. Prior to joining the Company, Mr. Leitner held various positions with Shell Energy North America (US) L.P., including Director of Northeast Trading, Director of Producer Services, and Senior Originator, from July 1996 through July 2017. Mr. Leitner holds a Bachelor of Science degree in Biology from Boston College and a Masters of Business Administration from the Mays Business School of Texas A&M University.
33
PART II
ITEM 5. MARKET FOR REGISTRANT'S COMMON EQUITY, RELATED STOCKHOLDER MATTERS AND ISSUER PURCHASES OF EQUITY SECURITIES
Our common stock is listed and principally traded on the New York Stock Exchange under the ticker symbol "COG."
As of February 1, 2020, there were 345 registered holders of our common stock.
In April 2019, the Board of Directors approved an increase in the quarterly dividend on our common stock from $0.07 per share to $0.09 per share. In October 2019, the Board of Directors approved an additional increase in the quarterly dividend on our common stock from $0.09 per share to $0.10 per share.
EQUITY COMPENSATION PLAN INFORMATION
The following table provides information as of December 31, 2019 regarding the number of shares of common stock that may be issued under our incentive plans.
(a) | (b) | (c) | ||||||
Plan Category | Number of securities to be issued upon exercise of outstanding options, warrants and rights | Weighted-average exercise price of outstanding options, warrants and rights | Number of securities remaining available for future issuance under equity compensation plans (excluding securities reflected in column (a)) | |||||
Equity compensation plans approved by security holders | 3,954,928 | (1) | n/a | 12,842,600 | (2) | |||
Equity compensation plans not approved by security holders | n/a | n/a | n/a | |||||
Total | 3,954,928 | n/a | 12,842,600 | |||||
_______________________________________________________________________________
(1) | Includes 1,259,287 employee performance shares, the performance periods of which end on December 31, 2019, 2020 and 2021; 1,428,634 TSR performance shares, the performance periods of which end on December 31, 2019, 2020 and 2021; 692,788 hybrid performance shares, which vest, if at all, in 2020, 2021 and 2022; and 574,219 restricted stock units awarded to the non-employee directors, the restrictions on which lapse upon a non-employee director's departure from the Board of Directors. |
(2) | Includes 58,834 shares of restricted stock, the restrictions on which lapse on various dates in 2020, 2021 and 2022; and 12,783,766 shares that are available for future grants under the 2014 Incentive Plan. |
ISSUER PURCHASES OF EQUITY SECURITIES
Our Board of Directors has authorized a share repurchase program under which we may purchase shares of common stock in the open market or in negotiated transactions. In July 2019, the Board of Directors authorized an increase of 25.0 million shares to our share repurchase program. There is no expiration date associated with the authorization. The shares included in the table below were repurchased on the open market and were held as treasury stock as of December 31, 2019.
Period | Total Number of Shares Purchased | Average Price Paid per Share | Total Number of Shares Purchased as Part of Publicly Announced Plans or Programs | Maximum Number of Shares That May Yet Be Purchased Under the Plans or Programs | |||||||||
October 2019 | — | $ | — | — | 21,032,682 | ||||||||
November 2019 | 5,250,000 | $ | 17.76 | 5,250,000 | 15,782,682 | ||||||||
December 2019 | 4,750,000 | $ | 16.62 | 4,750,000 | 11,032,682 | ||||||||
Total | 10,000,000 | 10,000,000 | |||||||||||
34
PERFORMANCE GRAPH
The following graph compares our common stock performance (COG) with the performance of the Standard & Poor's 500 Stock Index and the Dow Jones U.S. Exploration & Production Index for the period December 2014 through December 2019. The graph assumes that the value of the investment in our common stock and in each index was $100 on December 31, 2014 and that all dividends were reinvested.
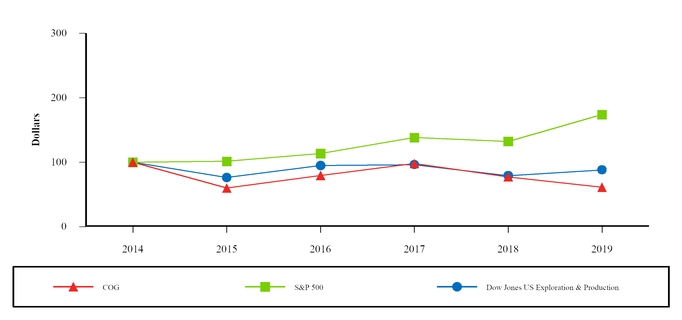
December 31, | |||||||||||||||||||||||
Calculated Values | 2014 | 2015 | 2016 | 2017 | 2018 | 2019 | |||||||||||||||||
COG | $ | 100.00 | $ | 59.92 | $ | 79.42 | $ | 97.89 | $ | 77.26 | $ | 61.21 | |||||||||||
S&P 500 | $ | 100.00 | $ | 101.38 | $ | 113.51 | $ | 138.29 | $ | 132.23 | $ | 173.86 | |||||||||||
Dow Jones U.S. Exploration & Production | $ | 100.00 | $ | 76.27 | $ | 94.94 | $ | 96.18 | $ | 79.09 | $ | 88.10 | |||||||||||
The performance graph above is furnished and not filed for purposes of Section 18 of the Securities Exchange Act of 1934 (the Exchange Act) and will not be incorporated by reference into any registration statement filed under the Securities Act of 1933 unless specifically identified therein as being incorporated therein by reference. The performance graph is not soliciting material subject to Regulation 14A of the Exchange Act.
35
ITEM 6. SELECTED FINANCIAL DATA
The following table summarizes our selected consolidated financial data for the periods indicated. This information should be read in conjunction with Management's Discussion and Analysis of Financial Condition and Results of Operations in Item 7, and the Consolidated Financial Statements and related Notes in Item 8.
Year Ended December 31, | |||||||||||||||||||
(In thousands, except per share amounts) | 2019 | 2018 | 2017 | 2016 | 2015 | ||||||||||||||
Statement of Operations Data | |||||||||||||||||||
Operating revenues | $ | 2,066,277 | $ | 2,188,148 | $ | 1,764,219 | $ | 1,155,677 | $ | 1,357,150 | |||||||||
Impairment of oil and gas properties(1) | — | — | 482,811 | 435,619 | 114,875 | ||||||||||||||
Earnings (loss) on equity method investments(2) | 80,496 | 1,137 | (100,486 | ) | (2,477 | ) | 6,415 | ||||||||||||
Gain (loss) on sale of assets(3) | (1,462 | ) | (16,327 | ) | (11,565 | ) | (1,857 | ) | 3,866 | ||||||||||
Income (loss) from operations | 955,750 | 771,801 | (151,260 | ) | (564,945 | ) | (88,914 | ) | |||||||||||
Net income (loss)(4) | 681,070 | 557,043 | 100,393 | (417,124 | ) | (113,891 | ) | ||||||||||||
Basic earnings (loss) per share | $ | 1.64 | $ | 1.25 | $ | 0.22 | $ | (0.91 | ) | $ | (0.28 | ) | |||||||
Diluted earnings (loss) per share | $ | 1.63 | $ | 1.24 | $ | 0.22 | $ | (0.91 | ) | $ | (0.28 | ) | |||||||
Dividends per common share | $ | 0.35 | $ | 0.25 | $ | 0.17 | $ | 0.08 | $ | 0.08 | |||||||||
December 31, | |||||||||||||||||||
(In thousands) | 2019 | 2018 | 2017 | 2016 | 2015 | ||||||||||||||
Balance Sheet Data | |||||||||||||||||||
Properties and equipment, net | $ | 3,855,706 | $ | 3,463,606 | $ | 3,072,204 | $ | 4,250,125 | $ | 4,976,879 | |||||||||
Total assets(5) | 4,487,245 | 4,198,829 | 4,727,344 | 5,122,569 | 5,253,038 | ||||||||||||||
Current portion of long-term debt | 87,000 | — | 304,000 | — | 20,000 | ||||||||||||||
Long-term debt | 1,133,025 | 1,226,104 | 1,217,891 | 1,520,530 | 1,996,139 | ||||||||||||||
Stockholders' equity | 2,151,487 | 2,088,159 | 2,523,905 | 2,567,667 | 2,009,188 | ||||||||||||||
(1) | Impairment of oil and gas properties in 2017 includes an impairment charge of $414.3 million associated with our oil and gas properties located in the Eagle Ford Shale in south Texas and $68.6 million associated with our oil and gas properties located in West Virginia and Ohio. Impairment of oil and gas properties in 2016 includes an impairment charge of $435.6 million associated with the proposed sale our oil and gas properties located in West Virginia and Ohio. Impairment of oil and gas properties in 2015 includes an impairment charge of $114.9 million associated with our oil and gas properties located in south Texas, east Texas and Louisiana. For additional discussion of impairment of oil and gas properties, refer to Note 1 and Note 3 of the Notes to the Consolidated Financial Statements. |
(2) | Earnings (loss) on equity method investments in 2019 includes a gain on sale of investment of $75.8 million associated with our equity investment in Meade Pipeline Co LLC (Meade). Earnings (loss) on equity method investments in 2017 includes an other than temporary impairment of $95.9 million associated with our investment in Constitution Pipeline Company, LLC (Constitution). Refer to Note 4 of the Notes to the Consolidated Financial Statements. |
(3) | Gain (loss) on sale of assets in 2018 includes a $45.4 million loss from the sale of certain proved and unproved oil and gas properties located in the Eagle Ford Shale partially offset by a $29.7 million gain from the sale of certain proved and unproved oil and gas properties located in the Haynesville Shale. Gain (loss) on sale of assets in 2017 includes an $11.9 million loss from the sale of certain proved and unproved oil and gas properties located in West Virginia, Virginia and Ohio. Refer to Note 2 of the Notes to the Consolidated Financial Statements. |
(4) | Net income (loss) in 2017 includes an income tax benefit of $242.9 million as a result of the remeasurement of our net deferred income tax liabilities based on the new lower corporate income tax rate associated with the Tax Act that was enacted in December 2017. Refer to Note 11 of the Notes to the Consolidated Financial Statements. |
(5) | Total assets as of December 31, 2019 include a right of use asset of $35.9 million as a result of the adoption of Accounting Standards Update No. 2016-02, Leases effective January 1, 2019. Comparative periods were not restated. Refer to Note 1 of the Notes to the Consolidated Financial Statements. |
36
ITEM 7. MANAGEMENT'S DISCUSSION AND ANALYSIS OF FINANCIAL CONDITION AND RESULTS OF OPERATIONS
The following discussion is intended to assist you in understanding our results of operations and our present financial condition. Our Consolidated Financial Statements and the accompanying Notes to the Consolidated Financial Statements included elsewhere in this Annul Report on Form 10-K contain additional information that should be referred to when reviewing this material.
OVERVIEW
Financial and Operating Overview
Financial and operating results for the year ended December 31, 2019 compared to the year ended December 31, 2018 are as follows:
• | Natural gas production increased 135.4 Bcf, or 19 percent, from 729.9 Bcf in 2018 to 865.3 Bcf in 2019, as a result of drilling and completion activities in the Marcellus Shale. |
• | Equivalent production increased 130.3 Bcfe, or 18 percent, from 735.0 Bcfe, or 2,013.7 Mmcfe per day, in 2018 to 865.3 Bcfe, or 2,370.9 Mmcfe per day, in 2019. The increase is primarily due to drilling and completion activities in the Marcellus Shale, partially offset by the sale of our Eagle Ford Shale assets in south Texas in February 2018. |
• | Average realized natural gas price for 2019 was $2.45 per Mcf, 4 percent lower than the $2.54 per Mcf price realized in 2018. |
• | Total capital expenditures were $783.3 million in 2019 compared to $816.1 million in 2018. |
• | Drilled 96 gross wells (94.0 net) with a success rate of 100.0 percent in 2019 compared to 97 gross wells (95.1 net) with a success rate of 90.7 percent in 2018. |
• | Completed 99 gross wells (97.0 net) in 2019 compared to 94 gross wells (93.0 net) in 2018. |
• | Average rig count during 2019 was approximately 3.1 rigs in the Marcellus Shale, compared to an average rig count in the Marcellus Shale of approximately 3.5 rigs and approximately 0.5 rigs in other areas during 2018. |
• | Repurchased 25.5 million shares of our common stock for a total cost of $488.5 million in 2019 compared to 38.5 million shares of common stock for a total cost of $904.1 million in 2018. |
• | Received proceeds of $249.5 million, including restricted cash of $13.6 million, related to the sale of our equity investment in Meade in November 2019. |
Market Conditions and Commodity Prices
Our financial results depend on many factors, particularly the commodity prices and our ability to market our production on economically attractive terms. Commodity prices are affected by many factors outside of our control, including changes in market supply and demand, which are impacted by pipeline capacity constraints, inventory storage levels, basis differentials, weather conditions and other factors. In addition, our realized prices are further impacted by our hedging activities. As a result, we cannot accurately predict future commodity prices and, therefore, cannot determine with any degree of certainty what effect increases or decreases in these prices will have on our capital program, production volumes or revenues. We expect commodity prices to remain volatile. In addition to production volumes and commodity prices, finding and developing sufficient amounts of natural gas and crude oil reserves at economical costs are critical to our long-term success. For information about the impact of realized commodity prices on our revenues, refer to "Results of Operations" below. Refer to "Risk Factors—Commodity prices fluctuate widely, and low prices for an extended period would likely have a material adverse impact on our business" and "Risk Factors—Our future performance depends on our ability to find or acquire additional natural gas and oil reserves that are economically recoverable" in Item 1A.
We account for our derivative instruments on a mark-to-market basis with changes in fair value recognized in operating revenues in the Consolidated Statement of Operations. As a result of these mark-to-market adjustments associated with our derivative instruments, we will experience volatility in our earnings due to commodity price volatility. Refer to “Impact of Derivative Instruments on Operating Revenues” below and Note 6 of the Notes to the Consolidated Financial Statements for more information.
37
Commodity prices have been and are expected to remain volatile. We believe that we are well-positioned to manage the challenges presented in a volatile commodity pricing environment by:
• | Continuing to exercise discipline in our capital program with the expectation of funding our capital expenditures with cash on hand, operating cash flows, and if required, borrowings under our revolving credit facility. |
• | Continuing to optimize our drilling, completion and operational efficiencies, resulting in lower operating costs per unit of production. |
• | Continuing to manage our balance sheet, which we believe provides sufficient availability under our revolving credit facility and existing cash balances to meet our capital requirements and maintain compliance with our debt covenants. |
• | Continuing to manage price risk by strategically hedging our production. |
While we are unable to predict future commodity prices, in the event that commodity prices significantly decline, management would test the recoverability of the carrying value of its oil and gas properties and, if necessary, record an impairment charge.
FINANCIAL CONDITION
Capital Resources and Liquidity
Our primary sources of cash in 2019 were from the sale of natural gas production and proceeds from the sale of our equity investment in Meade. These cash flows were primarily used to fund our capital expenditures, interest payments on debt, repurchases of shares of our common stock, payment of dividends and contributions to our equity method investments. See below for additional discussion and analysis of cash flow.
On April 22, 2019, we entered into a second amended and restated credit agreement (revolving credit facility). The borrowing base under the terms of our revolving credit facility is redetermined annually in April. In addition, either we or the banks may request an interim redetermination twice a year or in connection with certain acquisitions or divestitures of oil and gas properties. The borrowing base and available commitments were reaffirmed at $3.2 billion and $1.5 billion, respectively. As of December 31, 2019, there were no borrowings outstanding under our revolving credit facility and our unused commitments remained at $1.5 billion.
A decline in commodity prices could result in the future reduction of our borrowing base and related commitments under our revolving credit facility. Unless commodity prices decline significantly from current levels, we do not believe that any such reductions would have a significant impact on our ability to service our debt and fund our drilling program and related operations.
We strive to manage our debt at a level below the available credit line in order to maintain borrowing capacity. Our revolving credit facility includes a covenant limiting our total debt. We believe that, with internally generated operating cash flow, cash on hand and availability under our revolving credit facility, we have the capacity to finance our spending plans.
At December 31, 2019, we were in compliance with all restrictive financial covenants for both our revolving credit facility and senior notes. Refer to Note 5 of the Notes to the Consolidated Financial Statements for further details regarding restrictive covenants.
Cash Flows
Our cash flows from operating activities, investing activities and financing activities are as follows:
Year Ended December 31, | |||||||||||
(In thousands) | 2019 | 2018 | 2017 | ||||||||
Cash flows provided by operating activities | $ | 1,445,791 | $ | 1,104,903 | $ | 898,160 | |||||
Cash flows used in investing activities | (543,915 | ) | (293,383 | ) | (706,153 | ) | |||||
Cash flows used in financing activities | (690,380 | ) | (1,289,280 | ) | (210,502 | ) | |||||
Net increase (decrease) in cash, cash equivalents and restricted cash | $ | 211,496 | $ | (477,760 | ) | $ | (18,495 | ) | |||
Operating Activities. Operating cash flow fluctuations are substantially driven by commodity prices, changes in our production volumes and operating expenses. Commodity prices have historically been volatile, primarily as a result of supply
38
and demand for natural gas and crude oil, pipeline infrastructure constraints, basis differentials, inventory storage levels and seasonal influences. In addition, fluctuations in cash flow may result in an increase or decrease in our capital expenditures.
Our working capital is substantially influenced by the variables discussed above and fluctuates based on the timing and amount of borrowings and repayments under our revolving credit facility, repayments of debt, the timing of cash collections and payments on our trade accounts receivable and payable, respectively, payment of dividends, repurchases of our securities and changes in the fair value of our commodity derivative activity. From time to time, our working capital will reflect a deficit, while at other times it will reflect a surplus. This fluctuation is not unusual. At December 31, 2019 and 2018, we had a working capital surplus of $240.2 million and $257.3 million, respectively. We believe we have adequate liquidity and availability under our revolving credit facility to meet our working capital requirements over the next twelve months.
Net cash provided by operating activities in 2019 increased by $340.9 million compared to 2018. This increase was primarily due to an increase in cash received in settlement of derivatives, higher natural gas revenue, lower operating expenses and favorable changes in working capital and other assets and liabilities. These increases were partially offset by a decrease in brokered natural gas revenue. The increase in natural gas revenue was due to higher equivalent production, partially offset by a decrease in realized natural gas prices. Average realized natural gas prices decreased by 4 percent in 2019 compared to 2018. Equivalent production increased by 18 percent for 2019 compared to 2018 as a result of higher natural gas production in the Marcellus Shale.
Refer to "Results of Operations" for additional information relative to commodity price, production and operating expense fluctuations. We are unable to predict future commodity prices and, as a result, cannot provide any assurance about future levels of net cash provided by operating activities.
Investing Activities. Cash flows used in investing activities increased by $250.5 million from 2018 compared to 2019. The increase was due to $675.8 million lower proceeds from the sale of assets primarily due to the divestiture of our Eagle Ford Shale assets in February 2018 and our Haynesville Shale assets in July 2018. This change was partially offset by $249.5 million of proceeds from the sale of our equity investment in Meade in November 2019, $106.1 million of lower capital expenditures and $67.9 million of lower capital contributions associated with our equity method investments.
Financing Activities. Cash flows used in financing activities decreased by $598.9 million from 2018 compared to 2019. The decrease was due to $352.9 million of lower repurchases of our common stock in 2019 and $290.0 million of lower net repayments of debt primarily related to maturities of certain of our senior notes in 2018. This decrease was partially offset by $34.1 million of higher dividend payments related to an increase in our dividend rate in 2019, $7.4 million higher debt issuance costs related to amending our revolving credit facility in early 2019 and $2.4 million higher tax withholdings on vesting of stock awards. Share repurchases in 2019 include $31.4 million of share repurchases that were accrued in 2018 and paid in 2019.
2018 and 2017 Compared. For additional information on the comparison of operating, investing and financing cash flows for the year ended December 31, 2017 compared to the year ended December 31, 2018, refer to Financial Condition (Cash Flows) included in the Cabot Oil & Gas Corporation Annual Report on Form 10-K for the year ended December 31, 2018.
Capitalization
Information about our capitalization is as follows:
December 31, | |||||||
(Dollars in thousands) | 2019 | 2018 | |||||
Debt(1) | $ | 1,220,025 | $ | 1,226,104 | |||
Stockholders' equity | 2,151,487 | 2,088,159 | |||||
Total capitalization | $ | 3,371,512 | $ | 3,314,263 | |||
Debt to total capitalization | 36 | % | 37 | % | |||
Cash and cash equivalents | $ | 200,227 | $ | 2,287 | |||
(1) | Includes $87.0 million of current portion of long-term debt at December 31, 2019. There were no borrowings outstanding under our revolving credit facility as of December 31, 2019. Includes $7.0 million borrowings outstanding under our revolving credit facility as of December 31, 2018. |
During 2019 and 2018, we repurchased 25.5 million shares of our common stock for $488.5 million and 38.5 million shares of our common stock for $904.1 million, respectively. During 2019 and 2018, we paid dividends of $145.5 million ($0.35 per share) and $111.4 million ($0.25 per share) on our common stock, respectively.
39
In April 2019, the Board of Directors approved an increase in the quarterly dividend on our common stock from $0.07 per share to $0.09 per share. In October 2019, the Board of Directors approved an additional increase in the quarterly dividend on our common stock from $0.09 per share to $0.10 per share.
Capital and Exploration Expenditures
On an annual basis, we generally fund most of our capital expenditures, excluding any significant property acquisitions, with cash generated from operations and, if required, borrowings under our revolving credit facility. We budget these expenditures based on our projected cash flows for the year.
The following table presents major components of our capital and exploration expenditures:
_______________________________________________________________________________
Year Ended December 31, | |||||||||||
(In thousands) | 2019 | 2018 | 2017 | ||||||||
Capital expenditures | |||||||||||
Drilling and facilities | $ | 761,478 | $ | 758,909 | $ | 637,207 | |||||
Leasehold acquisitions | 6,072 | 29,851 | 102,265 | ||||||||
Other | 15,712 | 27,315 | 17,750 | ||||||||
783,262 | 816,075 | 757,222 | |||||||||
Exploration expenditures(1) | 20,270 | 113,820 | 21,526 | ||||||||
Total | $ | 803,532 | $ | 929,895 | $ | 778,748 | |||||
(1) | Exploration expenditures include $2.2 million, $97.7 million and $3.8 million of exploratory dry hole expenditures in 2019, 2018 and 2017, respectively. |
In 2019, we drilled 96 gross wells (94.0 net) and completed 99 gross wells (97.0 net), of which 29 gross wells (29.0 net) were drilled but uncompleted in prior years. In 2020, we plan to allocate substantially all of our capital to the Marcellus Shale, where we expect to drill, complete and place on production 60 to 70 net wells. Our 2020 capital program is expected to be approximately $575.0 million. We will continue to assess the natural gas price environment and may increase or decrease our capital expenditures accordingly.
Contractual Obligations
We have various contractual obligations in the normal course of our operations. A summary of our contractual obligations as of December 31, 2019 are set forth in the following table:
_______________________________________________________________________________
Payments Due by Year | |||||||||||||||||||
(In thousands) | Total | 2020 | 2021 to 2022 | 2023 to 2024 | 2025 & Beyond | ||||||||||||||
Debt | $ | 1,224,000 | $ | 87,000 | $ | 188,000 | $ | 637,000 | $ | 312,000 | |||||||||
Interest on debt(1) | 211,141 | 49,084 | 78,505 | 63,644 | 19,908 | ||||||||||||||
Transportation and gathering agreements(2) | 1,518,148 | 100,165 | 314,520 | 280,253 | 823,210 | ||||||||||||||
Operating leases(2) | 48,899 | 4,831 | 9,356 | 9,290 | 25,422 | ||||||||||||||
Equity investment contribution commitments(3) | 9,400 | 9,400 | — | — | — | ||||||||||||||
Total contractual obligations | $ | 3,011,588 | $ | 250,480 | $ | 590,381 | $ | 990,187 | $ | 1,180,540 | |||||||||
(1) | Interest payments have been calculated utilizing the rates associated with our revolving credit facility and senior notes outstanding at December 31, 2019, assuming that our revolving credit facility and senior notes will remain outstanding through their respective maturity dates. |
(2) | For further information on our obligations under transportation and gathering agreements and operating leases, refer to Note 9 of the Notes to the Consolidated Financial Statements. |
(3) | For further information on our equity investment contribution commitments, refer to Note 4 of the Notes to the Consolidated Financial Statements. |
40
Amounts related to our asset retirement obligations are not included in the above table due to the uncertainty regarding the actual timing of such expenditures. The total amount of our asset retirement obligations at December 31, 2019 was $72.1 million. Refer to Note 8 of the Notes to the Consolidated Financial Statements for further details.
We have no off-balance sheet debt or other similar unrecorded obligations.
Potential Impact of Our Critical Accounting Policies
Our significant accounting policies are described in Note 1 of the Notes to the Consolidated Financial Statements. The preparation of the Consolidated Financial Statements, which is in accordance with accounting principles generally accepted in the United States, requires management to make certain estimates and judgments that affect the amounts reported in our financial statements and the related disclosures of assets and liabilities. The following accounting policies are our most critical policies requiring more significant judgments and estimates. We evaluate our estimates and assumptions on a regular basis. Actual results could differ from those estimates.
Successful Efforts Method of Accounting
We follow the successful efforts method of accounting for our oil and gas producing activities. Acquisition costs for proved and unproved properties are capitalized when incurred. Judgment is required to determine the proper classification of wells designated as developmental or exploratory, which will ultimately determine the proper accounting treatment of costs incurred. Exploration costs, including geological and geophysical costs, the costs of carrying and retaining unproved properties and exploratory dry hole costs are expensed. Development costs, including costs to drill and equip development wells and successful exploratory drilling costs to locate proved reserves, are capitalized.
Oil and Gas Reserves
The process of estimating quantities of proved reserves is inherently imprecise, and the reserves data included in this document is only an estimate. The process relies on interpretations and judgment of available geological, geophysical, engineering and production data. The extent, quality and reliability of this technical data can vary. The process also requires certain economic assumptions, some of which are mandated by the SEC, such as commodity prices. Additional assumptions include drilling and operating expenses, capital expenditures, taxes and availability of funds. Any significant variance in the interpretations or assumptions could materially affect the estimated quantity and value of our reserves and can change substantially over time. Periodic revisions to the estimated reserves and future cash flows may be necessary as a result of reservoir performance, drilling activity, commodity prices, fluctuations in operating expenses, technological advances, new geological or geophysical data or other economic factors. Accordingly, reserve estimates are generally different from the quantities ultimately recovered. We cannot predict the amounts or timing of such future revisions.
Our reserves estimate has been prepared by our petroleum engineering staff and audited by Miller and Lents, independent petroleum engineers, who in their opinion determined the estimates presented to be reasonable in the aggregate. For more information regarding reserve estimation, including historical reserve revisions, refer to the Supplemental Oil and Gas Information to the Consolidated Financial Statements included in Item 8.
Our rate of recording depreciation, depletion and amortization (DD&A) expense is dependent upon our estimate of proved and proved developed reserves, which are utilized in our unit-of-production calculation. If the estimates of proved reserves were to be reduced, the rate at which we record DD&A expense would increase, reducing net income. Such a reduction in reserves may result from lower market prices, which may make it uneconomic to drill and produce higher cost fields. A five percent positive or negative revision to proved reserves would result in a decrease of $0.02 per Mcfe and an increase of $0.02 per Mcfe, respectively, on our DD&A rate. This estimated impact is based on current data, and actual events could require different adjustments to our DD&A rate.
In addition, a decline in proved reserve estimates may impact the outcome of our impairment test under applicable accounting standards. Due to the inherent imprecision of the reserve estimation process, risks associated with the operations of proved producing properties and market sensitive commodity prices utilized in our impairment analysis, management cannot determine if an impairment is reasonably likely to occur in the future.
Oil and Gas Properties
We evaluate our proved oil and gas properties for impairment on a field-by-field basis whenever events or changes in circumstances indicate an asset's carrying amount may not be recoverable. We compare expected undiscounted future cash flows to the net book value of the asset. If the future undiscounted expected cash flows, based on our estimate of future commodity prices, operating costs and anticipated production from proved reserves and risk-adjusted probable and possible reserves, are lower than the net book value of the asset, the capitalized cost is reduced to fair value. Commodity pricing is
41
estimated by using a combination of assumptions management uses in its budgeting and forecasting process, historical and current prices adjusted for geographical location and quality differentials, as well as other factors that management believes will impact realizable prices. In the event that commodity prices significantly decline, management would test the recoverability of the carrying value of our oil and gas properties and, if necessary, record an impairment charge. Fair value is calculated by discounting the future cash flows. The discount factor used is based on rates utilized by market participants that are commensurate with the risks inherent in the development and production of the underlying natural gas and oil.
Unproved oil and gas properties are assessed periodically for impairment on an aggregate basis through periodic updates to our undeveloped acreage amortization based on past drilling and exploration experience, our expectation of converting leases to held by production and average property lives. Average property lives are determined on a geographical basis and based on the estimated life of unproved property leasehold rights. Historically, the average property life in each of the geographical areas has not significantly changed and generally range from three to five years. The commodity price environment may impact the capital available for exploration projects as well as development drilling.
As these properties are developed and reserves are proved, the remaining capitalized costs are subject to depreciation and depletion. If the development of these properties is deemed unsuccessful and the properties are abandoned or surrendered, the capitalized costs related to the unsuccessful activity are expensed in the year the determination is made. The rate at which the unproved properties are written off depends on the timing and success of our future exploration and development program.
Asset Retirement Obligations
The majority of our asset retirement obligations (ARO) relate to the plugging and abandonment of oil and gas wells. We record the fair value of a liability for an asset retirement obligation in the period in which it is incurred, with the associated asset retirement cost capitalized as part of the carrying amount of the related long-lived asset. The recognition of an asset retirement obligation requires management to make assumptions that include estimated plugging and abandonment costs, timing of settlements, inflation rates and discount rate. In periods subsequent to initial measurement, the asset retirement cost is depreciated using the units-of-production method, while increases in the discounted ARO liability resulting from the passage of time (accretion expense) are reflected as depreciation, depletion and amortization expense.
Derivative Instruments
Under applicable accounting standards, the fair value of each derivative instrument is recorded as either an asset or liability on the balance sheet. At the end of each quarterly period, these instruments are marked-to-market. The change in fair value of derivatives not designated as hedges are recorded as a component of operating revenues in gain (loss) on derivative instruments in the Consolidated Statement of Operations.
Our derivative contracts are measured based on quotes from our counterparties or internal models. Such quotes and models have been derived using an income approach that considers various inputs including current market and contractual prices for the underlying instruments, quoted forward commodity prices, basis differentials, volatility factors and interest rates for a similar length of time as the derivative contract term, as applicable. These estimates are derived from or verified using relevant NYMEX futures contracts or are compared to multiple quotes obtained from counterparties for reasonableness. The determination of fair value also incorporates a credit adjustment for non-performance risk. We measure the non-performance risk of our counterparties by reviewing credit default swap spreads for the various financial institutions with which we have derivative transactions, while our non-performance risk is evaluated using a market credit spread provided by one of our banks.
Our financial condition, results of operations and liquidity can be significantly impacted by changes in the market value of our derivative instruments due to volatility of commodity prices, both NYMEX and basis differentials.
Income Taxes
We make certain estimates and judgments in determining our income tax expense for financial reporting purposes. These estimates and judgments include the calculation of certain deferred tax assets and liabilities that arise from differences in the timing and recognition of revenue and expenses for tax and financial reporting purposes and estimating reserves for potential adverse outcomes regarding tax positions that we have taken. We account for the uncertainty in income taxes using a recognition and measurement threshold for tax positions taken or expected to be taken in a tax return. The tax benefit from an uncertain tax position is recognized when it is more likely than not that the position will be sustained upon examination by taxing authorities based on technical merits of the position. The amount of the tax benefit recognized is the largest amount of the benefit that has a greater than 50 percent likelihood of being realized upon ultimate settlement. The effective tax rate and the tax basis of assets and liabilities reflect management's estimates of the ultimate outcome of various tax uncertainties.
42
We believe all of our deferred tax assets, net of any valuation allowances, will ultimately be realized, taking into consideration our forecasted future taxable income, which includes consideration of future operating conditions specifically related to commodity prices. If our estimates and judgments change regarding our ability to realize our deferred tax assets, our tax provision could increase in the period it is determined that it is more likely than not it will not be realized.
Our effective tax rate is subject to variability as a result of factors other than changes in federal and state tax rates and/or changes in tax laws which could affect us. Our effective tax rate is affected by changes in the allocation of property, payroll and revenues among states in which we operate. A small change in our estimated future tax rate could have a material effect on current period earnings.
Contingency Reserves
A provision for contingencies is charged to expense when the loss is probable and the cost is estimable. The establishment of a reserve is based on an estimation process that includes the advice of legal counsel and subjective judgment of management. In certain cases, management's judgment is based on the advice and opinions of legal counsel and other advisors, the interpretation of laws and regulations, which can be interpreted differently by regulators and courts of laws, our experience and the experiences of other companies dealing with similar matters, and our decision on how we intend to respond to a particular matter. Actual losses can differ from estimates for various reasons, including those noted above. We monitor known and potential legal, environmental and other contingencies and make our best estimate based on the information we have. Future changes in facts and circumstances not currently foreseeable could result in the actual liability exceeding the estimated ranges of loss and amounts accrued.
Stock-Based Compensation
We account for stock-based compensation under the fair value method of accounting in accordance with applicable accounting standards. Under the fair value method, compensation cost is measured at the grant date for equity-classified awards and remeasured each reporting period for liability-classified awards based on the fair value of an award and is recognized over the service period, which is generally the vesting period. To calculate fair value, we use either a Monte Carlo or Black-Scholes valuation model, as determined by the specific provisions of the award. The use of these models requires significant judgment with respect to expected life, volatility and other factors. Stock-based compensation cost for all types of awards is included in general and administrative expense in the Consolidated Statement of Operations. Refer to Note 14 of the Notes to the Consolidated Financial Statements for a full discussion of our stock-based compensation.
Recently Adopted Accounting Pronouncements
Refer to Note 1 of the Notes to the Consolidated Financial Statements, "Summary of Significant Accounting Policies," for a discussion of recently adopted accounting pronouncements.
Recently Issued Accounting Pronouncements
Refer to Note 1 of the Notes to the Consolidated Financial Statements, "Summary of Significant Accounting Policies," for a discussion of new accounting pronouncements that affect us.
OTHER ISSUES AND CONTINGENCIES
Regulations
Our operations are subject to various types of regulation by federal, state and local authorities. Refer to the "Other Business Matters" section of Item 1 for a discussion of these regulations.
Restrictive Covenants
Our ability to incur debt and to make certain types of investments is subject to certain restrictive covenants in our various debt instruments. Among other requirements, our senior note agreements and our revolving credit agreement specify a minimum annual coverage ratio of consolidated cash flow to interest expense for the trailing four quarters of 2.8 to 1.0 and a minimum asset coverage ratio of the present value of proved reserves before income taxes plus adjusted cash to indebtedness and other liabilities of 1.75 to 1.0. Our revolving credit agreement also requires us to maintain a minimum current ratio of 1.0 to 1.0. At December 31, 2019, we were in compliance with all restrictive financial covenants in both our senior note agreements and our revolving credit agreement.
43
Operating Risks and Insurance Coverage
Our business involves a variety of operating risks. Refer to "Risk Factors—We face a variety of hazards and risks that could cause substantial financial losses" in Item 1A. In accordance with customary industry practice, we maintain insurance against some, but not all, of these risks and losses. The occurrence of any of these events not fully covered by insurance could have a material adverse effect on our financial position, results of operations and cash flows. The costs of these insurance policies are somewhat dependent on our historical claims experience, the areas in which we operate and market conditions.
Commodity Pricing and Risk Management Activities
Our revenues, operating results, financial condition and ability to borrow funds or obtain additional capital depend substantially on prevailing commodity prices. Further declines in commodity prices may have a material adverse effect on our financial condition, liquidity, ability to obtain financing and operating results. Lower commodity prices also may reduce the amount of natural gas that we can produce economically. Historically, commodity prices have been volatile, with prices fluctuating widely, and they are likely to continue to be volatile. Depressed prices in the future would have a negative impact on our future financial results. In particular, substantially lower prices would significantly reduce revenue and could potentially trigger an impairment of our oil and gas properties or a violation of certain financial debt covenants. Because substantially all of our reserves are natural gas, changes in natural gas prices have a more significant impact on our financial results.
The majority of our production is sold at market prices. Generally, if the related commodity index declines, the price that we receive for our production will also decline. Therefore, the amount of revenue that we realize is determined by certain factors that are beyond our control. However, management may mitigate this price risk on a portion of our anticipated production with the use of financial commodity derivatives, including collars and swaps to reduce the impact of sustained lower pricing on our revenue. Under both arrangements, there is also a risk that the movement of index prices may result in our inability to realize the full benefit of an improvement in market conditions.
RESULTS OF OPERATIONS
2019 and 2018 Compared
We reported net income for 2019 of $681.1 million, or $1.64 per share, compared to net income for 2018 of $557.0 million, or $1.25 per share. The increase in net income was primarily due to lower operating expenses and interest expense and higher earnings on equity method investments. These increases were partially offset by lower operating revenues and higher income tax expense.
44
Revenue, Price and Volume Variance
Our revenues vary from year to year as a result of changes in commodity prices and production volumes. Below is a discussion of revenue, price and volume variances.
Year Ended December 31, | Variance | |||||||||||||
Revenue Variances (In thousands) | 2019 | 2018 | Amount | Percent | ||||||||||
Natural gas | $ | 1,985,240 | $ | 1,881,150 | $ | 104,090 | 6 | % | ||||||
Crude oil and condensate | — | 48,722 | (48,722 | ) | (100 | )% | ||||||||
Gain on derivative instruments | 80,808 | 44,432 | 36,376 | 82 | % | |||||||||
Brokered natural gas | — | 209,530 | (209,530 | ) | (100 | )% | ||||||||
Other | 229 | 4,314 | (4,085 | ) | (95 | )% | ||||||||
$ | 2,066,277 | $ | 2,188,148 | $ | (121,871 | ) | (6 | )% | ||||||
Year Ended December 31, | Variance | Increase (Decrease) (In thousands) | ||||||||||||||||
2019 | 2018 | Amount | Percent | |||||||||||||||
Price Variances | ||||||||||||||||||
Natural gas | $ | 2.29 | $ | 2.58 | $ | (0.29 | ) | (11 | )% | $ | (245,242 | ) | ||||||
Crude oil and condensate | $ | — | $ | 64.68 | $ | (64.68 | ) | (100 | )% | — | ||||||||
Total | $ | (245,242 | ) | |||||||||||||||
Volume Variances | ||||||||||||||||||
Natural gas (Bcf) | 865.3 | 729.9 | 135.4 | 19 | % | $ | 349,332 | |||||||||||
Crude oil and condensate (Mbbl) | — | 754 | (754 | ) | (100 | )% | (48,722 | ) | ||||||||||
Total | $ | 300,610 | ||||||||||||||||
Natural Gas Revenues
The increase in natural gas revenues of $104.1 million was due to higher production partially offset by lower natural gas prices. The increase in production was a result of an increase in our drilling and completion activities in the Marcellus Shale.
Crude Oil and Condensate Revenues
The decrease in crude oil and condensate revenues of $48.7 million was primarily due to the sale of our Eagle Ford Shale assets in February 2018.
Impact of Derivative Instruments on Operating Revenues
Year Ended December 31, | |||||||
(In thousands) | 2019 | 2018 | |||||
Cash received (paid) on settlement of derivative instruments | |||||||
Gain (loss) on derivative instruments | $ | 138,450 | $ | (41,631 | ) | ||
Non-cash gain (loss) on derivative instruments | |||||||
Gain (loss) on derivative instruments | (57,642 | ) | 86,063 | ||||
$ | 80,808 | $ | 44,432 | ||||
Brokered Natural Gas
Brokered natural gas revenues decreased $209.5 million. There was no brokered natural gas activity in the current period.
45
Operating and Other Expenses
Year Ended December 31, | Variance | |||||||||||||
(In thousands) | 2019 | 2018 | Amount | Percent | ||||||||||
Operating and Other Expenses | ||||||||||||||
Direct operations | $ | 76,958 | $ | 69,646 | $ | 7,312 | 10 | % | ||||||
Transportation and gathering | 574,677 | 496,731 | 77,946 | 16 | % | |||||||||
Brokered natural gas | — | 184,198 | (184,198 | ) | (100 | )% | ||||||||
Taxes other than income | 17,053 | 22,642 | (5,589 | ) | (25 | )% | ||||||||
Exploration | 20,270 | 113,820 | (93,550 | ) | (82 | )% | ||||||||
Depreciation, depletion and amortization | 405,733 | 417,479 | (11,746 | ) | (3 | )% | ||||||||
General and administrative | 94,870 | 96,641 | (1,771 | ) | (2 | )% | ||||||||
$ | 1,189,561 | $ | 1,401,157 | $ | (211,596 | ) | (15 | )% | ||||||
Earnings on equity method investments | $ | 80,496 | $ | 1,137 | $ | 79,359 | 6,980 | % | ||||||
Loss on sale of assets | 1,462 | 16,327 | (14,865 | ) | (91 | )% | ||||||||
Interest expense, net | 54,952 | 73,201 | (18,249 | ) | (25 | )% | ||||||||
Other expense | 574 | 463 | 111 | 24 | % | |||||||||
Income tax expense | 219,154 | 141,094 | 78,060 | 55 | % | |||||||||
Total costs and expenses from operations decreased by $211.6 million from 2018 to 2019. The primary reasons for this fluctuation are as follows:
• | Direct operations increased $7.3 million primarily driven by $18.7 million of higher operating costs due to higher production, which included a $10.1 million increase in workover expense. This increase was partially offset by an $11.4 million decrease in operating costs as a result of the sale of our Eagle Ford Shale assets in February 2018. |
• | Transportation and gathering increased $77.9 million due to higher throughput as a result of higher Marcellus Shale production, partially offset by a decrease in demand charges related to a change in commitments. |
• | Brokered natural gas decreased $184.2 million. There was no brokered natural gas activity in the current period. |
• | Taxes other than income decreased $5.6 million due to $3.6 million lower production taxes resulting from the sale of the Eagle Ford Shale assets in February of 2018 and $2.7 million lower drilling impact fees driven by a decrease in rates associated with lower natural gas prices. |
• | Exploration decreased $93.6 million as a result of a decrease in exploratory dry hole costs of $95.5 million compared to 2018. The exploratory dry hole costs in 2018 related to our exploration activities in West Texas and Ohio. This decrease was partially offset by an increase of $4.3 million in geological and geophysical costs. |
• | Depreciation, depletion and amortization decreased $11.7 million primarily due to lower amortization of unproved properties of $49.7 million, partially offset by higher DD&A of $37.1 million. Amortization of unproved properties decreased due to lower amortization rates as a result of a decrease in exploration activities. The increase in DD&A was primarily due to an increase of $58.0 million due to higher equivalent production volumes in the Marcellus Shale, partially offset by a decrease of $21.0 million related to a lower DD&A rate of $0.42 per Mcfe for 2019 compared to $0.45 per Mcfe for 2018. The lower DD&A rate was primarily due to positive reserve revisions to our 2018 year-end reserve estimates and lower cost reserve additions. |
• | General and administrative decreased $1.8 million primarily due to a $6.1 million decrease in professional services and a $2.4 million decrease in stock-based compensation expense associated with certain of our market-based performance awards. These decreases were partially offset by $2.1 million in severance cost incurred in the second quarter 2019 and $3.0 million in higher employee costs. The remaining changes in other general and administrative expenses were not individually significant. |
46
Earnings on Equity Method Investments
Earnings on equity method investments increased $79.4 million primarily due to the sale of our investment in Meade for a gain of $75.8 million and the recognition of our proportionate share of net income from our equity method investments in 2019 compared to 2018 primarily from our investment in Meade, which commenced operations in late 2018.
Loss on Sale of Assets
During 2019, we recognized a net aggregate loss of $1.5 million primarily due to the conveyance of certain remaining properties related to the sale of our Eagle Ford Shale assets. During 2018, we recognized a net aggregate loss of $16.3 million primarily due to the sale of our Eagle Ford Shale assets, partially offset by a gain on the sale of oil and gas properties in the Haynesville Shale.
Interest Expense, net
Interest expense decreased $18.2 million primarily due to $14.1 million lower interest expense resulting from the repayment of $237.0 million of our 6.51% weighted-average senior notes, which matured in July 2018 and $67.0 million of our 9.78% senior notes that matured in December 2018 and a $6.2 million decrease related to income tax reserves. These decreases were partially offset by $3.6 million of lower interest income.
Income Tax Expense
Income tax expense increased $78.1 million due to higher pretax income and a higher effective tax rate. The effective tax rates for 2019 and 2018 were 24.3 percent and 20.2 percent, respectively. The increase in the effective tax rate is primarily due to the impact of non-recurring discrete items recorded during 2019 compared to 2018.
Excluding the impact of any discrete items, we expect our 2020 effective income tax rate to be approximately 23.0 percent. However, this rate may fluctuate based on a number of factors, including but not limited to changes in enacted federal and/or state rates that occur during the year, changes in our executive compensation and the amount of excess tax benefits on stock-based compensation, as well as changes in the composition and location of our asset base, our employees and our customers.
2018 and 2017 Compared
We reported net income for 2018 of $557.0 million, or $1.25 per share, compared to net income for 2017 of $100.4 million, or $0.22 per share. The increase in net income was primarily due to higher operating revenues, lower operating expenses and higher earnings on equity method investments, partially offset by higher income tax expense.
For additional information on the comparison of the results of operations for the year ended December 31, 2018 compared to the year ended December 31, 2017, refer to Management's Discussion and Analysis included in the Cabot Oil & Gas Corporation Annual Report on Form 10-K for the year ended December 31, 2018.
NON-GAAP FINANCIAL MEASURES
Explanation and Reconciliation of Non-GAAP Financial Measures
We report our financial results in accordance with accounting principles generally accepted in the United States (GAAP). However, we believe certain non-GAAP performance measures may provide financial statement users with additional meaningful comparisons between current results and results of prior periods. In addition, we believe these measures are used by analysts and others in the valuation, rating and investment recommendations of companies within the oil and natural gas exploration and production industry. The reconciliations of GAAP financial measures to non-GAAP financial measures presented in this Annual Report on Form 10-K are shown below.
47
Reconciliation of Net Income to Adjusted Net Income
Adjusted net income is presented based on our belief that this non-GAAP measure enables a user of the financial information to understand the impact of these items on reported results. Adjusted net income is defined as net income plus gain and loss on sale of assets, gain and loss on derivative instruments, gain on sale of equity method investments, stock-based compensation expense, severance expense, interest expense related to income tax reserves and tax effect on selected items. Additionally, this presentation provides a beneficial comparison to similarly adjusted measurements of prior periods. Adjusted net income is not a measure of financial performance under GAAP and should not be considered as an alternative to net income, as defined by GAAP.
Year Ended December 31, | ||||||||
(In thousands) | 2019 | 2018 | ||||||
As reported - net income | $ | 681,070 | $ | 557,043 | ||||
Reversal of selected items: | ||||||||
(Gain) loss on sale of assets | 1,462 | 16,327 | ||||||
(Gain) loss on derivative instruments(1) | 57,642 | (86,063 | ) | |||||
Gain on sale of equity method investment | (66,412 | ) | — | |||||
Stock-based compensation expense | 30,780 | 33,147 | ||||||
Severance expense | 2,521 | 28 | ||||||
Interest expense related to income tax reserves | (3,052 | ) | 3,116 | |||||
Tax effect on selected items | (5,233 | ) | 7,637 | |||||
Adjusted net income | $ | 698,778 | $ | 531,235 | ||||
_______________________________________________________________________________
(1) | This amount represents the non-cash mark-to-market changes of our commodity derivative instruments recorded in gain (loss) on derivative instruments in the Consolidated Statement of Operations. |
48
Return on Capital Employed
Return on capital employed (ROCE) is defined as adjusted net income (defined above) plus after-tax net interest expense divided by average capital employed, which is defined as total debt plus stockholders’ equity. ROCE is presented based on our belief that this non-GAAP measure is useful information to investors when evaluating our profitability and the efficiency with which we have employed capital over time. ROCE is not a measure of financial performance under GAAP and should not be considered an alternative to net income, as defined by GAAP.
Year Ended December 31, | ||||||||
(In thousands) | 2019 | 2018 | ||||||
Interest expense, net | $ | 54,952 | $ | 73,201 | ||||
Interest expense related to income tax reserves (1) | 3,052 | (3,116 | ) | |||||
Tax benefit | (13,241 | ) | (16,004 | ) | ||||
After-tax interest expense, net (A) | 44,763 | 54,081 | ||||||
As reported - net income | 681,070 | 557,043 | ||||||
Adjustments to as reported - net income, net of tax | 17,708 | (25,808 | ) | |||||
Adjusted net income (B) | 698,778 | 531,235 | ||||||
Adjusted net income before interest expense, net (A + B) | $ | 743,541 | $ | 585,316 | ||||
Total debt - beginning | $ | 1,226,104 | $ | 1,521,891 | ||||
Stockholders’ equity - beginning | 2,088,159 | 2,523,905 | ||||||
Capital employed - beginning | 3,314,263 | 4,045,796 | ||||||
Total debt - ending | 1,220,025 | 1,226,104 | ||||||
Stockholders’ equity - ending | 2,151,487 | 2,088,159 | ||||||
Capital employed - ending | 3,371,512 | 3,314,263 | ||||||
Average capital employed (C) | $ | 3,342,888 | $ | 3,680,030 | ||||
Return on average capital employed (ROCE) (A + B) / C | 22.2 | % | 15.9 | % | ||||
(1) | Interest expense related to income tax reserves is included in the adjustments to as reported - net income, net of tax. |
49
Discretionary Cash Flow and Free Cash Flow Calculation and Reconciliation
Discretionary cash flow is defined as net cash provided by operating activities excluding changes in assets and liabilities. Discretionary cash flow is widely accepted as a financial indicator of an oil and gas company’s ability to generate cash which is used to internally fund exploration and development activities, pay dividends and service debt. Discretionary cash flow is presented based on our belief that this non-GAAP measure is useful information to investors when comparing our cash flows with the cash flows of other companies that use the full cost method of accounting for oil and gas producing activities or have different financing and capital structures or tax rates. Discretionary cash flow is not a measure of financial performance under GAAP and should not be considered as an alternative to cash flows from operating activities or net income, as defined by GAAP, or as a measure of liquidity.
Free cash flow is defined as discretionary cash flow (defined above) less capital expenditures and investment in equity method investments. Free cash flow is an indicator of a company's ability to generate cash flow after spending the money required to maintain or expand its asset base. Free cash flow is presented based on our belief that this non-GAAP measure is useful information to investors when comparing our cash flows with the cash flows of other companies. Free cash flow is not a measure of financial performance under GAAP and should not be considered as an alternative to cash flows from operating activities or net income, as defined by GAAP, or as a measure of liquidity.
Year Ended December 31, | ||||||||
(In thousands) | 2019 | 2018 | ||||||
Net cash provided by operating activities | $ | 1,445,791 | $ | 1,104,903 | ||||
Changes in assets and liabilities | (85,026 | ) | 163,460 | |||||
Discretionary cash flow | 1,360,765 | 1,268,363 | ||||||
Capital expenditures | (788,368 | ) | (894,470 | ) | ||||
Investment in equity method investments | (9,338 | ) | (77,263 | ) | ||||
Free cash flow | $ | 563,059 | $ | 296,630 | ||||
Finding and Development Costs
Drill-bit finding and development cost is defined as costs incurred in exploration and development activities as defined by GAAP divided by reserve extensions, discoveries and other additions. All-sources finding and development cost is defined as costs incurred in property acquisition, exploration and development activities as defined by GAAP divided by the total of reserve extensions, discoveries and other additions and revision of prior estimates. Drill-bit finding and development cost and all-sources finding and development cost are presented based on management's belief that these non-GAAP measures are useful information to investors to evaluate how much it costs to add proved reserves. These calculations do not include the future development costs required for the development of proved undeveloped reserves and may not be comparable to similarly titled measurements used by other companies.
Year Ended December 31, | ||||||||
2019 | 2018 | |||||||
Costs incurred in oil and gas property acquisition, exploration and development activities (In thousands) | ||||||||
Exploration costs | $ | 20,270 | $ | 94,309 | ||||
Development costs | 761,326 | 778,574 | ||||||
Exploration and development costs (A) | 781,596 | 872,883 | ||||||
Property acquisition costs, unproved | 6,072 | 29,851 | ||||||
Total costs incurred (B) | 787,668 | 902,734 | ||||||
Extensions, discoveries and other additions (Bcfe) (C) | 2,116 | 2,244 | ||||||
Revision of prior estimates (Bcfe) (D) | 47 | 780 | ||||||
Drill-bit finding and development costs ($ per Mcfe) (A) / (C) | $ | 0.37 | $ | 0.39 | ||||
All-sources finding and development costs ($ per Mcfe) (B) / (C + D) | $ | 0.36 | $ | 0.30 | ||||
50
ITEM 7A. QUANTITATIVE AND QUALITATIVE DISCLOSURES ABOUT MARKET RISK
Market Risk
Our primary market risk is exposure to natural gas prices. Realized prices are mainly driven by spot market prices for North American natural gas production, which can be volatile and unpredictable.
Derivative Instruments and Risk Management Activities
Our risk management strategy is designed to reduce the risk of commodity price volatility for our production in the natural gas markets through the use of financial commodity derivatives. A committee that consists of members of senior management oversees our risk management activities. Our financial commodity derivatives generally cover a portion of our production and provide only partial price protection by limiting the benefit to us of increases in prices, while protecting us in the event of price declines. Further, if any of our counterparties defaulted, this protection might be limited as we might not receive the full benefit of our financial commodity derivatives. Please read the discussion below as well as Note 6 of the Notes to the Consolidated Financial Statements for a more detailed discussion of our derivative instruments.
Periodically, we enter into financial commodity derivatives, including collar, swap and basis swap agreements, to protect against exposure to commodity price declines related to our natural gas production. Our credit agreement restricts our ability to enter into financial commodity derivatives other than to hedge or mitigate risks to which we have actual or projected exposure or as permitted under our risk management policies and not subjecting us to material speculative risks. All of our financial derivatives are used for risk management purposes and are not held for trading purposes. Under the collar agreements, if the index price rises above the ceiling price, we pay the counterparty. If the index price falls below the floor price, the counterparty pays us. Under the swap agreements, we receive a fixed price on a notional quantity of natural gas in exchange for paying a variable price based on a market-based index.
As of December 31, 2019, we had the following outstanding financial commodity derivatives:
Collars | |||||||||||||||||||||||||||
Floor | Ceiling | Swaps | Estimated Fair Value | ||||||||||||||||||||||||
Type of Contract | Volume (Mmbtu) | Contract Period | Range | Weighted- Average | Range | Weighted- Average | Weighted- Average | (Liability) (In thousands) | |||||||||||||||||||
Natural gas (NYMEX) | 10,700,000 | Apr. 2020 - Oct. 2020 | $ | 2.27 | $ | 44 | |||||||||||||||||||||
Natural gas (NYMEX) | 10,700,000 | Apr. 2020 - Oct. 2020 | $ | — | $ | 2.15 | $2.36 - $2.38 | $ | 2.37 | (22 | ) | ||||||||||||||||
$ | 22 | ||||||||||||||||||||||||||
The amounts set forth in the table above represent our total unrealized derivative position at December 31, 2019 and exclude the impact of non-performance risk. Non-performance risk is considered in the fair value of our derivative instruments that are recorded in our Consolidated Financial Statements and is primarily evaluated by reviewing credit default swap spreads for the various financial institutions with which we have derivative contracts, while our non-performance risk is evaluated using a market credit spread provided by one of our banks.
In early 2020, we entered into the following financial commodity derivatives:
Collars | |||||||||||||||||||||||||
Floor | Ceiling | Swaps | |||||||||||||||||||||||
Type of Contract | Volume (Mmbtu) | Contract Period | Range | Weighted- Average | Range | Weighted- Average | Weighted- Average | ||||||||||||||||||
Natural gas (NYMEX) | 10,700,000 | Apr. 2020 - Oct. 2020 | $ | 2.28 | |||||||||||||||||||||
Natural gas (NYMEX) | 10,700,000 | Apr. 2020 - Oct. 2020 | $ | — | $ | 2.15 | $ | — | $ | 2.38 | |||||||||||||||
A significant portion of our expected natural gas production for 2020 and beyond is currently unhedged and directly exposed to the volatility in natural gas market prices, whether favorable or unfavorable.
During 2019, natural gas basis swaps covered 63.8 Bcf, or seven percent of natural gas production at an average price of $2.32 per Mcf. Natural gas swaps covered 226.1 Bcf, or 26 percent, of natural gas production at a weighted-average price of $3.30 per Mcf.
51
We are exposed to market risk on financial commodity derivative instruments to the extent of changes in market prices of natural gas. However, the market risk exposure on these derivative contracts is generally offset by the gain or loss recognized upon the ultimate sale of the commodity. Although notional contract amounts are used to express the volume of natural gas agreements, the amounts that can be subject to credit risk in the event of non-performance by third parties are substantially smaller. Our counterparties are primarily commercial banks and financial service institutions that management believes present minimal credit risk and our derivative contracts are with multiple counterparties to minimize our exposure to any individual counterparty. We perform both quantitative and qualitative assessments of these counterparties based on their credit ratings and credit default swap rates where applicable. We have not incurred any losses related to non-performance risk of our counterparties and we do not anticipate any material impact on our financial results due to non-performance by third parties. However, we cannot be certain that we will not experience such losses in the future.
The preceding paragraphs contain forward-looking information concerning future production and projected gains and losses, which may be impacted both by production and by changes in the future commodity prices. Refer to “Forward-Looking Information” for further details.
Fair Value of Other Financial Instruments
The estimated fair value of other financial instruments is the amount at which the instrument could be exchanged currently between willing parties. The carrying amounts reported in the Consolidated Balance Sheet for cash and cash equivalents and restricted cash approximate fair value due to the short-term maturities of these instruments.
We use available market data and valuation methodologies to estimate the fair value of debt. The fair value of debt is the estimated amount we would have to pay a third party to assume the debt, including a credit spread for the difference between the issue rate and the period end market rate. The credit spread is our default or repayment risk. The credit spread (premium or discount) is determined by comparing our senior notes and revolving credit facility to new issuances (secured and unsecured) and secondary trades of similar size and credit statistics for both public and private debt. The fair value of all senior notes and the revolving credit facility is based on interest rates currently available to us.
The carrying amount and fair value of debt is as follows:
December 31, 2019 | December 31, 2018 | ||||||||||||||
(In thousands) | Carrying Amount | Estimated Fair Value | Carrying Amount | Estimated Fair Value | |||||||||||
Long-term debt | $ | 1,220,025 | $ | 1,260,259 | $ | 1,226,104 | $ | 1,202,994 | |||||||
Current maturities | (87,000 | ) | (88,704 | ) | — | — | |||||||||
Long-term debt, excluding current maturities | $ | 1,133,025 | $ | 1,171,555 | $ | 1,226,104 | $ | 1,202,994 | |||||||
52
ITEM 8. FINANCIAL STATEMENTS AND SUPPLEMENTARY DATA
INDEX TO CONSOLIDATED FINANCIAL STATEMENTS
Page | |
53
Report of Independent Registered Public Accounting Firm
To the Board of Directors and Stockholders of Cabot Oil & Gas Corporation
Opinions on the Financial Statements and Internal Control over Financial Reporting
We have audited the accompanying consolidated balance sheets of Cabot Oil & Gas Corporation and its subsidiaries (the “Company”) as of December 31, 2019 and 2018, and the related consolidated statements of operations, comprehensive income, stockholders’ equity and of cash flows for each of the three years in the period ended December 31, 2019, including the related notes (collectively referred to as the “consolidated financial statements”). We also have audited the Company's internal control over financial reporting as of December 31, 2019, based on criteria established in Internal Control - Integrated Framework (2013) issued by the Committee of Sponsoring Organizations of the Treadway Commission (COSO).
In our opinion, the consolidated financial statements referred to above present fairly, in all material respects, the financial position of the Company as of December 31, 2019 and 2018, and the results of its operations and its cash flows for each of the three years in the period ended December 31, 2019 in conformity with accounting principles generally accepted in the United States of America. Also in our opinion, the Company maintained, in all material respects, effective internal control over financial reporting as of December 31, 2019, based on criteria established in Internal Control - Integrated Framework (2013) issued by the COSO.
Basis for Opinions
The Company's management is responsible for these consolidated financial statements, for maintaining effective internal control over financial reporting, and for its assessment of the effectiveness of internal control over financial reporting, included in Management’s Report on Internal Control over Financial Reporting appearing under Item 9A. Our responsibility is to express opinions on the Company’s consolidated financial statements and on the Company's internal control over financial reporting based on our audits. We are a public accounting firm registered with the Public Company Accounting Oversight Board (United States) (PCAOB) and are required to be independent with respect to the Company in accordance with the U.S. federal securities laws and the applicable rules and regulations of the Securities and Exchange Commission and the PCAOB.
We conducted our audits in accordance with the standards of the PCAOB. Those standards require that we plan and perform the audits to obtain reasonable assurance about whether the consolidated financial statements are free of material misstatement, whether due to error or fraud, and whether effective internal control over financial reporting was maintained in all material respects.
Our audits of the consolidated financial statements included performing procedures to assess the risks of material misstatement of the consolidated financial statements, whether due to error or fraud, and performing procedures that respond to those risks. Such procedures included examining, on a test basis, evidence regarding the amounts and disclosures in the consolidated financial statements. Our audits also included evaluating the accounting principles used and significant estimates made by management, as well as evaluating the overall presentation of the consolidated financial statements. Our audit of internal control over financial reporting included obtaining an understanding of internal control over financial reporting, assessing the risk that a material weakness exists, and testing and evaluating the design and operating effectiveness of internal control based on the assessed risk. Our audits also included performing such other procedures as we considered necessary in the circumstances. We believe that our audits provide a reasonable basis for our opinions.
Definition and Limitations of Internal Control over Financial Reporting
A company’s internal control over financial reporting is a process designed to provide reasonable assurance regarding the reliability of financial reporting and the preparation of financial statements for external purposes in accordance with generally accepted accounting principles. A company’s internal control over financial reporting includes those policies and procedures that (i) pertain to the maintenance of records that, in reasonable detail, accurately and fairly reflect the transactions and dispositions of the assets of the company; (ii) provide reasonable assurance that transactions are recorded as necessary to permit preparation of financial statements in accordance with generally accepted accounting principles, and that receipts and expenditures of the company are being made only in accordance with authorizations of management and directors of the company; and (iii) provide reasonable assurance regarding prevention or timely detection of unauthorized acquisition, use, or disposition of the company’s assets that could have a material effect on the financial statements.
54
Because of its inherent limitations, internal control over financial reporting may not prevent or detect misstatements. Also, projections of any evaluation of effectiveness to future periods are subject to the risk that controls may become inadequate because of changes in conditions, or that the degree of compliance with the policies or procedures may deteriorate.
Critical Audit Matters
The critical audit matter communicated below is a matter arising from the current period audit of the consolidated financial statements that was communicated or required to be communicated to the audit committee and that (i) relates to accounts or disclosures that are material to the consolidated financial statements and (ii) involved our especially challenging, subjective, or complex judgments. The communication of critical audit matters does not alter in any way our opinion on the consolidated financial statements, taken as a whole, and we are not, by communicating the critical audit matter below, providing a separate opinion on the critical audit matter or on the accounts or disclosures to which it relates.
The Impact of Proved Oil and Gas Reserves on Proved Oil and Gas Properties, Net
As described in Notes 1 and 3 to the consolidated financial statements, the Company’s consolidated proved oil and gas properties, net balance was $3.9 billion as of December 31, 2019, and depreciation, depletion and amortization (DD&A) expense for the year ended December 31, 2019 was $405.7 million. As described by management, the Company follows the successful efforts method of accounting for its oil and gas producing activities. The Company’s rate of recording DD&A expense is dependent upon the estimate of proved and proved developed reserves, which are utilized in the unit-of-production calculation. In estimating oil and gas reserves, management relies on interpretations and judgment of available geological, geophysical, engineering and production data, as well as the use of certain economic assumptions such as natural gas prices. Additional assumptions include drilling and operating expenses, capital expenditures, taxes and availability of funds. The estimates of oil and gas reserves have been developed by specialists, specifically petroleum engineers.
The principal considerations for our determination that performing procedures relating to the impact of oil and gas reserves on proved oil and gas properties, net is a critical audit matter are there was significant judgment by management, including the use of specialists, when developing the estimates of oil and gas reserves, which in turn led to a high degree of auditor judgment and effort in performing procedures to evaluate the significant assumptions used in developing the estimates of oil and gas reserves, including future production decline curves, price differentials, lease operating expenses, transportation expense and future development costs.
Addressing the matter involved performing procedures and evaluating audit evidence in connection with forming our overall opinion on the consolidated financial statements. These procedures included testing the effectiveness of controls relating to management’s estimates of oil and gas reserves and the calculation of DD&A expense. These procedures also included, among others, evaluating the significant assumptions used by management in developing the estimates of oil and gas reserves, including future production decline curves, price differentials, lease operating expenses, transportation expense and future development costs, and testing the unit-of-production rate used to calculate DD&A expense. The work of management’s specialists was used in performing the procedures to evaluate the reasonableness of the estimates of proved oil and gas reserves. As a basis for using this work, the specialists’ qualifications and objectivity were understood, as well as the methods and assumptions used by the specialists. The procedures performed also included tests of the data used by the specialists and an evaluation of the specialists’ findings. Evaluating the significant assumptions relating to the estimates of proved oil and gas reserves also involved obtaining evidence to support the reasonableness of the assumptions, including whether the assumptions used were reasonable considering the past performance of the Company, and whether they were consistent with evidence obtained in other areas of the audit.
/s/ PricewaterhouseCoopers LLP
Houston, Texas
February 25, 2020
We have served as the Company’s auditor since 1989.
55
CABOT OIL & GAS CORPORATION
CONSOLIDATED BALANCE SHEET
December 31, | ||||||||
(In thousands, except share amounts) | 2019 | 2018 | ||||||
ASSETS | ||||||||
Current assets | ||||||||
Cash and cash equivalents | $ | $ | ||||||
Restricted cash | ||||||||
Accounts receivable, net | ||||||||
Income taxes receivable | ||||||||
Inventories | ||||||||
Derivative instruments | ||||||||
Other current assets | ||||||||
Total current assets | ||||||||
Properties and equipment, net (Successful efforts method) | ||||||||
Equity method investments | ||||||||
Other assets | ||||||||
$ | $ | |||||||
LIABILITIES AND STOCKHOLDERS' EQUITY | ||||||||
Current liabilities | ||||||||
Accounts payable | $ | $ | ||||||
Current portion of long-term debt | ||||||||
Accrued liabilities | ||||||||
Interest payable | ||||||||
Total current liabilities | ||||||||
Long-term debt, net | ||||||||
Deferred income taxes | ||||||||
Asset retirement obligations | ||||||||
Postretirement benefits | ||||||||
Other liabilities | ||||||||
Total liabilities | ||||||||
Commitments and contingencies | ||||||||
Stockholders' equity | ||||||||
Common stock: | ||||||||
Authorized — 960,000,000 shares of $0.10 par value in 2019 and 2018, respectively | ||||||||
Issued — 476,881,991 shares and 476,094,551 shares in 2019 and 2018, respectively | ||||||||
Additional paid-in capital | ||||||||
Retained earnings | ||||||||
Accumulated other comprehensive income | ||||||||
Less treasury stock, at cost: | ||||||||
78,957,318 shares and 53,409,705 shares in 2019 and 2018, respectively | ( | ) | ( | ) | ||||
Total stockholders' equity | ||||||||
$ | $ | |||||||
The accompanying notes are an integral part of these consolidated financial statements.
56
CABOT OIL & GAS CORPORATION
CONSOLIDATED STATEMENT OF OPERATIONS
Year Ended December 31, | |||||||||||
(In thousands, except per share amounts) | 2019 | 2018 | 2017 | ||||||||
OPERATING REVENUES | |||||||||||
Natural gas | $ | $ | $ | ||||||||
Crude oil and condensate | |||||||||||
Gain on derivative instruments | |||||||||||
Brokered natural gas | |||||||||||
Other | |||||||||||
OPERATING EXPENSES | |||||||||||
Direct operations | |||||||||||
Transportation and gathering | |||||||||||
Brokered natural gas | |||||||||||
Taxes other than income | |||||||||||
Exploration | |||||||||||
Depreciation, depletion and amortization | |||||||||||
Impairment of oil and gas properties | |||||||||||
General and administrative | |||||||||||
Earnings (loss) on equity method investments | ( | ) | |||||||||
Loss on sale of assets | ( | ) | ( | ) | ( | ) | |||||
INCOME (LOSS) FROM OPERATIONS | ( | ) | |||||||||
Interest expense, net | |||||||||||
Other expense (income) | ( | ) | |||||||||
Income (loss) before income taxes | ( | ) | |||||||||
Income tax expense (benefit) | ( | ) | |||||||||
NET INCOME | $ | $ | $ | ||||||||
Earnings per share | |||||||||||
Basic | $ | $ | $ | ||||||||
Diluted | $ | $ | $ | ||||||||
Weighted-average common shares outstanding | |||||||||||
Basic | |||||||||||
Diluted | |||||||||||
The accompanying notes are an integral part of these consolidated financial statements.
57
CABOT OIL & GAS CORPORATION
CONSOLIDATED STATEMENT OF COMPREHENSIVE INCOME
Year Ended December 31, | |||||||||||
(In thousands) | 2019 | 2018 | 2017 | ||||||||
Net income | $ | $ | $ | ||||||||
Postretirement benefits: | |||||||||||
Net actuarial gain (loss)(1) | ( | ) | ( | ) | |||||||
Prior service credit (2) | |||||||||||
Amortization of prior service cost(3) | ( | ) | ( | ) | ( | ) | |||||
Cumulative effect of adoption of ASU 2018-02 reclassified to retained earnings | |||||||||||
Total other comprehensive income | ( | ) | |||||||||
Comprehensive income | $ | $ | $ | ||||||||
(1) | Net of income taxes of $ |
(2) | Net of income taxes of $ |
(3) |
The accompanying notes are an integral part of these consolidated financial statements.
58
CABOT OIL & GAS CORPORATION
CONSOLIDATED STATEMENT OF CASH FLOWS
Year Ended December 31, | |||||||||||
(In thousands) | 2019 | 2018 | 2017 | ||||||||
CASH FLOWS FROM OPERATING ACTIVITIES | |||||||||||
Net income | $ | $ | $ | ||||||||
Adjustments to reconcile net income to cash provided by operating activities: | |||||||||||
Depreciation, depletion and amortization | |||||||||||
Impairment of oil and gas properties | |||||||||||
Deferred income tax expense (benefit) | ( | ) | |||||||||
Loss on sale of assets | |||||||||||
Exploratory dry hole cost | |||||||||||
Gain on derivative instruments | ( | ) | ( | ) | ( | ) | |||||
Net cash received (paid) in settlement of derivative instruments | ( | ) | |||||||||
(Earnings) loss on equity method investments | ( | ) | ( | ) | |||||||
Distribution of earnings from equity method investments | |||||||||||
Amortization of debt issuance costs | |||||||||||
Stock-based compensation and other | |||||||||||
Changes in assets and liabilities: | |||||||||||
Accounts receivable, net | ( | ) | ( | ) | |||||||
Income taxes | ( | ) | ( | ) | ( | ) | |||||
Inventories | ( | ) | ( | ) | |||||||
Other current assets | ( | ) | |||||||||
Accounts payable and accrued liabilities | ( | ) | ( | ) | |||||||
Interest payable | ( | ) | ( | ) | ( | ) | |||||
Other assets and liabilities | ( | ) | ( | ) | |||||||
Net cash provided by operating activities | |||||||||||
CASH FLOWS FROM INVESTING ACTIVITIES | |||||||||||
Capital expenditures | ( | ) | ( | ) | ( | ) | |||||
Proceeds from sale of assets | |||||||||||
Investment in equity method investments | ( | ) | ( | ) | ( | ) | |||||
Distribution of investment from equity method investments | |||||||||||
Proceeds from sale of equity method investments | |||||||||||
Net cash used in investing activities | ( | ) | ( | ) | ( | ) | |||||
CASH FLOWS FROM FINANCING ACTIVITIES | |||||||||||
Borrowings from debt | |||||||||||
Repayments of debt | ( | ) | ( | ) | |||||||
Treasury stock repurchases | ( | ) | ( | ) | ( | ) | |||||
Dividends paid | ( | ) | ( | ) | ( | ) | |||||
Tax withholding on vesting of stock awards | ( | ) | ( | ) | ( | ) | |||||
Capitalized debt issuance costs | ( | ) | |||||||||
Other | |||||||||||
Net cash used in financing activities | ( | ) | ( | ) | ( | ) | |||||
Net increase (decrease) in cash, cash equivalents and restricted cash | ( | ) | ( | ) | |||||||
Cash, cash equivalents and restricted cash, beginning of period | |||||||||||
Cash, cash equivalents and restricted cash, end of period | $ | $ | $ | ||||||||
The accompanying notes are an integral part of these consolidated financial statements.
59
CABOT OIL & GAS CORPORATION
CONSOLIDATED STATEMENT OF STOCKHOLDERS' EQUITY
(In thousands, except per share amounts) | Common Shares | Common Stock Par | Treasury Shares | Treasury Stock | Paid-In Capital | Accumulated Other Comprehensive Income (Loss) | Retained Earnings | Total | ||||||||||||||||||||||
Balance at December 31, 2016 | $ | $ | ( | ) | $ | $ | $ | $ | ||||||||||||||||||||||
Net income | — | — | — | — | — | — | ||||||||||||||||||||||||
Exercise of stock appreciation rights | — | — | ( | ) | — | — | ||||||||||||||||||||||||
Stock amortization and vesting | — | — | — | — | ||||||||||||||||||||||||||
Purchase of treasury stock | — | — | ( | ) | — | — | — | ( | ) | |||||||||||||||||||||
Cash dividends at $0.17 per share | — | — | — | — | — | — | ( | ) | ( | ) | ||||||||||||||||||||
Other comprehensive income | — | — | — | — | — | — | ||||||||||||||||||||||||
Cumulative impact from accounting change | — | — | — | — | — | — | ||||||||||||||||||||||||
Balance at December 31, 2017 | $ | $ | ( | ) | $ | $ | $ | $ | ||||||||||||||||||||||
Net income | — | — | — | — | — | — | ||||||||||||||||||||||||
Exercise of stock appreciation rights | — | — | ( | ) | — | — | ||||||||||||||||||||||||
Stock amortization and vesting | — | — | — | — | ||||||||||||||||||||||||||
Purchase of treasury stock | — | — | ( | ) | — | — | — | ( | ) | |||||||||||||||||||||
Cash dividends at $0.25 per share | — | — | — | — | — | — | ( | ) | ( | ) | ||||||||||||||||||||
Other comprehensive income | — | — | — | — | — | — | ||||||||||||||||||||||||
Cumulative impact from accounting change | — | — | — | — | — | — | ( | ) | ( | ) | ||||||||||||||||||||
Balance at December 31, 2018 | $ | $ | ( | ) | $ | $ | $ | $ | ||||||||||||||||||||||
Net income | — | — | — | — | — | — | ||||||||||||||||||||||||
Stock amortization and vesting | — | — | — | — | ||||||||||||||||||||||||||
Purchase of treasury stock | — | — | ( | ) | — | — | — | ( | ) | |||||||||||||||||||||
Cash dividends at $0.35 per share | — | — | — | — | — | — | ( | ) | ( | ) | ||||||||||||||||||||
Other comprehensive income | — | — | — | — | — | ( | ) | — | ( | ) | ||||||||||||||||||||
Balance at December 31, 2019 | $ | $ | ( | ) | $ | $ | $ | $ | ||||||||||||||||||||||
The accompanying notes are an integral part of these consolidated financial statements.
60
NOTES TO THE CONSOLIDATED FINANCIAL STATEMENTS
1. Summary of Significant Accounting Policies
Basis of Presentation and Nature of Operations
Cabot Oil & Gas Corporation and its subsidiaries (the Company) are engaged in the development, exploitation, exploration, production and marketing of natural gas exclusively within the continental United States. The Company's exploration and development activities are concentrated in areas with known hydrocarbon resources, which are conducive to multi-well, repeatable drilling programs.
The Company operates in one segment, natural gas development, exploitation, exploration and production. The Company's oil and gas properties are managed as a whole rather than through discrete operating segments or business units. Operational information is tracked by geographic area; however, financial performance is assessed as a single enterprise and not on a geographic basis. Allocation of resources is made on a project basis across the Company's entire portfolio without regard to geographic areas.
The consolidated financial statements include the accounts of the Company and its subsidiaries after eliminating all significant intercompany balances and transactions. Certain reclassifications have been made to prior year statements to conform with the current year presentation. These reclassifications have no impact on previously reported stockholders' equity, net income (loss) or cash flows.
Recently Adopted Accounting Pronouncements
Leases. In February 2016, the Financial Accounting Standards Board (FASB) issued Accounting Standards Update (ASU) No. 2016-02, Leases (Topic 842). The new lease guidance supersedes Topic 840. The core principle of the guidance is that entities should recognize the assets and liabilities that arise from leases. This ASU does not apply to leases to explore for or use minerals, oil, natural gas and similar nonregenerative resources, including the intangible right to explore for those natural resources and rights to use the land in which those natural resources are contained. In July 2018, the FASB issued ASU No. 2018-11, Leases (Topic 842): Targeted Improvements, which provides entities with an optional transition method that permits an entity to initially apply the new lease standard at the adoption date and recognize a cumulative-effect adjustment to the opening balance of retained earnings in the period of adoption. The guidance is effective for interim and annual periods beginning after December 15, 2018. This ASU was adopted using a modified retrospective approach. The Company adopted this guidance effective January 1, 2019 by applying the optional transition approach as of the beginning of the period of adoption. Comparative periods, including the disclosures related to those periods, were not restated.
On the adoption date, the Company elected the following practical expedients which are provided in the lease standard:
• | an election not to apply the recognition requirements in the lease standard to short-term leases (a lease that at commencement date has a lease term of 12 months or less and does not contain a purchase option that the Company is reasonably certain to exercise); |
• | a package of practical expedients to not reassess whether a contract is or contains a lease, lease classification and initial direct costs; |
• | a practical expedient to use hindsight when determining the lease term; |
• | a practical expedient that permits combining lease and non-lease components in a contract and accounting for the combination as a lease (elected by asset class); and |
• | a practical expedient to not reassess certain land easements in existence prior to January 1, 2019. |
On January 1, 2019, the Company recognized a right of use asset for operating leases and an operating lease liability of $44.6 million, representing the present value of the future minimum lease payment obligations associated with office leases, drilling rig commitments, surface use agreements and other leases. The adoption of this guidance did not have an impact on the Company’s results of operations or cash flows.
Refer to Note 9 for more details regarding leases.
Recently Issued Accounting Pronouncements
Financial Instruments: Credit Losses. In June 2016, the FASB issued ASU No. 2016-13, Financial Instruments: Credit Losses, which replaces the incurred loss impairment methodology used for certain financial instruments with a methodology
61
that reflects current expected credit losses (CECL). ASU No. 2016-13, along with subsequently issued codification improvements, will be effective for the Company on January 1, 2020, and will be applied using a modified retrospective approach through a cumulative-effect adjustment to retained earnings as of the beginning of the adoption period. The Company's historical credit losses have not been material, and future expected credit losses under the CECL model are not expected to be material. The adoption of ASU No. 2016-13 is not expected to have a material effect on the Company's financial position or results of operations; however, it will modify certain disclosure requirements.
Significant Accounting Policies
Cash and Cash Equivalents
Restricted Cash.
Allowance for Doubtful Accounts
The Company records an allowance for doubtful accounts for receivables that the Company determines to be uncollectible based on the specific identification method.
Inventories
Inventories are comprised of tubular goods and well equipment and are carried at average cost.
Equity Method Investments
The Company accounts for its investments in entities over which the Company has significant influence, but not control, using the equity method of accounting. Under the equity method of accounting, the Company increases its investment for contributions made and records its proportionate share of net earnings, declared dividends and partnership distributions based on the most recently available financial statements of the investee. The Company records the activity for its equity method investments on a one month lag. In addition, the Company evaluates its equity method investments for potential impairment whenever events or changes in circumstances indicate that there is a decline in the value of the investment.
Properties and Equipment
The Company uses the successful efforts method of accounting for oil and gas producing activities. Under this method, acquisition costs for proved and unproved properties are capitalized when incurred. Exploration costs, including geological and geophysical costs, the costs of carrying and retaining unproved properties and exploratory dry hole drilling costs, are expensed. Development costs, including the costs to drill and equip development wells and successful exploratory drilling costs to locate proved reserves are capitalized.
Exploratory drilling costs are capitalized when incurred pending the determination of whether a well has found proved reserves. The determination is based on a process which relies on interpretations of available geologic, geophysical, and engineering data. If a well is determined to be successful, the capitalized drilling costs will be reclassified as part of the cost of the well. If a well is determined to be unsuccessful, the capitalized drilling costs will be charged to exploration expense in the Consolidated Statement of Operations in the period the determination is made. If an exploratory well requires a major capital expenditure before production can begin, the cost of drilling the exploratory well will continue to be carried as an asset pending determination of whether reserves have been found only as long as: (i) the well has found a sufficient quantity of reserves to
62
justify its completion as a producing well if the required capital expenditure is made and (ii) drilling of an additional exploratory well is under way or firmly planned for the near future. If drilling in the area is not under way or firmly planned, or if the well has not found a commercially producible quantity of reserves, the exploratory well is assumed to be impaired and its costs are charged to exploration expense.
Development costs of proved oil and gas properties, including estimated dismantlement, restoration and abandonment costs and acquisition costs, are depreciated and depleted on a field basis by the units-of-production method using proved developed and proved reserves, respectively. Buildings are depreciated on a straight-line basis over 25 to 40 years. Certain other assets are depreciated on a straight-line basis over 3 to 25 years.
Costs of sold or abandoned properties that make up a part of an amortization base (partial field) remain in the amortization base if the units-of-production rate is not significantly affected. If significant, a gain or loss, if any, is recognized and the sold or abandoned properties are retired. A gain or loss, if any, is also recognized when a group of proved properties (entire field) that make up the amortization base has been retired, abandoned or sold.
The Company evaluates its proved oil and gas properties for impairment whenever events or changes in circumstances indicate an asset's carrying amount may not be recoverable. The Company compares expected undiscounted future cash flows to the net book value of the asset. If the future undiscounted expected cash flows, based on estimates of future commodity prices, operating costs and anticipated production from proved reserves and risk-adjusted probable and possible reserves, are lower than the net book value of the asset, the capitalized cost is reduced to fair value. Commodity pricing is estimated by using a combination of assumptions management uses in its budgeting and forecasting process as well as historical and current prices adjusted for geographical location and quality differentials, as well as other factors that management believes will impact realizable prices. Fair value is calculated by discounting the future cash flows. The discount factor used is based on rates utilized by market participants that are commensurate with the risks inherent in the development and production of the underlying natural gas and oil.
Unproved oil and gas properties are assessed periodically for impairment on an aggregate basis through periodic updates to the Company's undeveloped acreage amortization based on past drilling and exploration experience, the Company's expectation of converting leases to held by production and average property lives. Average property lives are determined on a geographical basis and based on the estimated life of unproved property leasehold rights. During 2019, 2018 and 2017, amortization associated with the Company's unproved properties was $32.6 million, $82.3 million and $52.8 million, respectively, and is included in depreciation, depletion, and amortization in the Consolidated Statement of Operations.
Asset Retirement Obligations
The Company records the fair value of a liability for an asset retirement obligation in the period in which it is incurred if a reasonable estimate of fair value can be made. The associated asset retirement cost is capitalized as part of the carrying amount of the long-lived asset. The asset retirement costs are depreciated using the units-of-production method. At December 31, 2019, there were no assets legally restricted for purposes of settling asset retirement obligations.
Additional retirement obligations increase the liability associated with new oil and gas wells and other facilities as these obligations are incurred. Accretion expense is included in depreciation, depletion and amortization expense in the Consolidated Statement of Operations.
Derivative Instruments
The Company enters into financial derivative contracts, primarily swaps, collars and basis swaps, to manage its exposure to price fluctuations on a portion of its anticipated future production volumes. The Company’s credit agreement restricts the ability of the Company to enter into commodity derivatives other than to hedge or mitigate risks to which the Company has actual or projected exposure or as permitted under the Company’s risk management policies and where such derivatives do not subject the Company to material speculative risks. All of the Company’s derivatives are used for risk management purposes and are not held for trading purposes. The Company has elected not to designate its financial derivative instruments as accounting hedges under the accounting guidance.
The Company evaluates all of its physical purchase and sale contracts to determine if they meet the definition of a derivative. For contracts that meet the definition of a derivative, the Company may elect the normal purchase normal sale (NPNS) exception provided under the accounting guidance and account for the contract using the accrual method of accounting. Contracts that do not qualify for or for which the Company elects not to apply the NPNS exception are accounted for at fair value.
63
All derivatives, except for derivatives that qualify for the NPNS exception, are recognized on the balance sheet and are measured at fair value. At the end of each quarterly period, these derivatives are marked to market. As a result, changes in the fair value of derivatives are recognized in operating revenues in gain (loss) on derivative instruments. The resulting cash flows are reported as cash flows from operating activities.
The Company follows the authoritative accounting guidance for measuring fair value of assets and liabilities in its financial statements. Fair value is the price that would be received to sell an asset or paid to transfer a liability in an orderly transaction between market participants at the measurement date (exit price). The Company utilizes market data or assumptions that market participants who are independent, knowledgeable and willing and able to transact would use in pricing the asset or liability, including assumptions about risk and the risks inherent in the inputs to the valuation technique. The Company is able to classify fair value balances based on the observability of these inputs. The authoritative guidance for fair value measurements establishes three levels of the fair value hierarchy, defined as follows:
• | Level 1: Unadjusted, quoted prices for identical assets or liabilities in active markets. |
• | Level 2: Quoted prices in markets that are not considered to be active or financial instruments for which all significant inputs are observable, either directly or indirectly for substantially the full term of the asset or liability. |
• | Level 3: Significant, unobservable inputs for use when little or no market data exists, requiring a significant degree of judgment. |
The hierarchy gives the highest priority to Level 1 measurements and the lowest priority to Level 3 measurements. Depending on the particular asset or liability, input availability can vary depending on factors such as product type, longevity of a product in the market and other particular transaction conditions. In some cases, certain inputs used to measure fair value may be categorized into different levels of the fair value hierarchy. For disclosure purposes under the accounting guidance, the lowest level that contains significant inputs used in the valuation should be chosen.
Revenue Recognition
On January 1, 2018, the Company adopted ASC 606, Revenue from Contracts with Customers, and the related guidance in ASC 340-40 (the new revenue standard), and related guidance on gains and losses on derecognition of nonfinancial assets ASC 610-20, using the modified retrospective method applied to those contracts which were not completed as of January 1, 2018. Under the modified retrospective method, the Company recognizes the cumulative effect of initially applying the new revenue standard as an adjustment to the opening balance of retained earnings; however, no significant adjustment was required as a result of adopting the new revenue standard. Results for reporting periods beginning after January 1, 2018 are presented under the new revenue standard. The comparative information has not been restated and continues to be reported under the historic accounting standards in effect for those periods.
The Company’s revenue is typically generated from contracts to sell natural gas produced from interests in oil and gas properties owned by the Company. These contracts generally require the Company to deliver a specific amount of a commodity per day for a specified number of days at a price that is either fixed or variable. The contracts specify a delivery point which represents the point at which control of the product is transferred to the customer. These contracts frequently meet the definition of a derivative under ASC 815, and are accounted for as derivatives unless the Company elects to treat them as normal sales as permitted under that guidance. The Company typically elects to treat contracts to sell oil and gas production as normal sales, which are then accounted for as contracts with customers. The Company has determined that these contracts represent multiple performance obligations which are satisfied when control of the commodity transfers to the customer, typically through the delivery of the specified commodity to a designated delivery point.
Revenue is measured based on consideration specified in the contract with the customer, and excludes any amounts collected on behalf of third parties. The Company recognizes revenue in the amount that reflects the consideration it expects to be entitled to in exchange for transferring control of those goods to the customer. The contract consideration in the Company’s variable price contracts are typically allocated to specific performance obligations in the contract according to the price stated in the contract. Amounts allocated in the Company’s fixed price contracts are based on the standalone selling price of those products in the context of long-term, fixed price contracts, which generally approximates the contract price. Payment is generally received one or two months after the sale has occurred.
Gain or loss on derivative instruments is outside the scope of ASC 606 and is not considered revenue from contracts with customers subject to ASC 606. The Company may use financial or physical contracts accounted for as derivatives as economic
64
hedges to manage price risk associated with normal sales, or in limited cases may use them for contracts the Company intends to physically settle but do not meet all of the criteria to be treated as normal sales.
Taxes assessed by a governmental authority that are both imposed on and concurrent with a specific revenue-producing transaction, and that are collected by the Company from a customer, are excluded from revenue.
Producer Gas Imbalances. The Company applies the sales method of accounting for natural gas revenue. Under this method, revenues are recognized based on the actual volume of natural gas sold to purchasers. Natural gas production operations may include joint owners who take more or less than the production volumes entitled to them on certain properties. Production volume is monitored to minimize these natural gas imbalances. Under this method, a natural gas imbalance liability is recorded if the Company's excess takes of natural gas exceed its estimated remaining proved developed reserves for these properties at the actual price realized upon the gas sale. A receivable is recognized only to the extent an imbalance cannot be recouped from the reserves in the underlying properties. The Company’s aggregate imbalance positions at December 31, 2019 and 2018 were not material.
Brokered Natural Gas. Revenues and expenses related to brokered natural gas are reported gross as part of operating revenues and operating expenses in accordance with applicable accounting standards. The Company buys and sells natural gas utilizing separate purchase and sale transactions whereby the Company or the counterparty obtains control of the natural gas purchased or sold.
Practical Expedients. The Company has made use of certain practical expedients in adopting the new revenue standard, including the value of unsatisfied performance obligations are not disclosed for (i) contracts with an original expected length of one year or less, (ii) contracts for which the Company recognizes revenue at the amount to which the Company has the right to invoice, (iii) contracts with variable consideration which is allocated entirely to a wholly unsatisfied performance obligation and meets the variable allocation criteria in the standard and (iv) only contracts that are not completed at transition.
The Company has not adjusted the promised amount of consideration for the effects of a significant financing component if the Company expects, at contract inception, that the period between when the Company transfers a promised good or service to the customer and when the customer pays for that good or service will be one year or less.
Income Taxes
The Company follows the asset and liability method of accounting for income taxes. Under this method, deferred tax assets and liabilities are recorded for the estimated future tax consequences attributable to the differences between the financial carrying amounts of existing assets and liabilities and their respective tax basis. Deferred tax assets and liabilities are measured using the tax rate in effect for the year in which those temporary differences are expected to reverse. The effect of a change in tax rates on deferred tax assets and liabilities is recognized in the year of the enacted rate change. A valuation allowance is established to reduce deferred tax assets if it is more likely than not that the related tax benefits will not be realized.
The Company follows the “equity first” approach when applying the limitation for certain executive compensation in excess of $1 million to future compensation. The limitation is first applied to stock-based compensation that vests in future tax years before considering cash compensation paid in a future period. Accordingly, the Company records a deferred tax asset for stock-based compensation expense recorded in the current period, and reverses the temporary difference in the future period, during which the stock-based compensation becomes deductible for tax purposes.
The Company is required to make judgments, including estimating reserves for potential adverse outcomes regarding tax positions that the Company has taken. The Company accounts for uncertainty in income taxes using a recognition and measurement threshold for tax positions taken or expected to be taken in a tax return. The tax benefit from an uncertain tax position is recognized when it is more likely than not that the position will be sustained upon examination by taxing authorities based on technical merits of the position. The amount of the tax benefit recognized is the largest amount of the benefit that has a greater than 50 percent likelihood of being realized upon ultimate settlement. The effective tax rate and the tax basis of assets and liabilities reflect management's estimates of the ultimate outcome of various tax uncertainties.
The Company recognizes accrued interest related to uncertain tax positions in interest expense and accrued penalties related to such positions in general and administrative expense in the Consolidated Statement of Operations.
Stock-Based Compensation
The Company accounts for stock-based compensation under the fair value method of accounting. Under this method, compensation cost is measured at the grant date for equity-classified awards and remeasured each reporting period for liability-classified awards based on the fair value of an award and is recognized over the service period, which is generally the vesting period. To calculate fair value, the Company uses either a Monte Carlo or Black-Scholes valuation model depending on the
65
specific provisions of the award. Stock-based compensation cost for all types of awards is included in general and administrative expense in the Consolidated Statement of Operations.
The Company records excess tax benefits and tax deficiencies on stock-based compensation in the income statement upon vesting of the respective awards. Excess tax benefits and tax deficiencies are included in cash flows from operating activities in the Consolidated Statement of Cash Flow.
Cash paid by the Company when directly withholding shares from employee stock-based compensation awards for tax-withholding purposes are classified as financing activities in the Consolidated Statement of Cash Flow.
Environmental expenditures are expensed or capitalized, as appropriate, depending on their future economic benefit. Expenditures that relate to an existing condition caused by past operations, and that do not have future economic benefit are expensed. Liabilities related to future costs are recorded on an undiscounted basis when environmental assessments and/or remediation activities are probable and the costs can be reasonably estimated. Any insurance recoveries are recorded as assets when received.
Credit and Concentration Risk
Substantially all of the Company's accounts receivable result from the sale of natural gas to third parties in the oil and gas industry. This concentration of purchasers may impact the Company's overall credit risk, either positively or negatively, in that these entities may be similarly affected by changes in economic or other conditions. The Company does not anticipate any material impact on its financial results due to non-performance by the third parties.
During the year ended December 31, 2019, three customers accounted for approximately 17 percent, 16 percent and 16 percent of the Company's total sales. During the year ended December 31, 2018, two customers accounted for approximately 20 percent and 11 percent of the Company's total sales. During the year ended December 31, 2017, two customers accounted for approximately 18 percent and 11 percent of the Company's total sales. The Company does not believe that the loss of any of these customers would have a material adverse effect on it because alternative customers are readily available.
Use of Estimates
In preparing financial statements, the Company follows accounting principles generally accepted in the United States. These principles require management to make estimates and assumptions that affect the reported amounts of assets and liabilities, the disclosure of contingent assets and liabilities at the date of the financial statements, and the reported amounts of revenues and expenses during the reporting period. The most significant estimates pertain to proved natural gas reserves and related cash flow estimates which are used to compute depreciation, depletion and amortization and impairments of proved oil and gas properties. Other significant estimates include natural gas revenues and expenses, fair value of derivative instruments, estimates of expenses related to legal, environmental and other contingencies, asset retirement obligations, postretirement obligations, stock-based compensation and deferred income taxes. Actual results could differ from those estimates.
2. Divestitures
The Company recognized an aggregate net loss on sale of assets of $1.5 million, $16.3 million and $11.6 million for the years ended December 31, 2019, 2018 and 2017, respectively.
In July 2018, the Company sold certain proved and unproved oil and gas properties in the Haynesville Shale to a third party for $30.0 million. The sales price included a $5.0 million deposit that was received in the fourth quarter of 2017. The Company recognized a gain on sale of oil and gas properties of $29.7 million.
In February 2018, the Company sold certain proved and unproved oil and gas properties in the Eagle Ford Shale to an affiliate of Venado Oil & Gas LLC for $765.0 million. The sales price included a $76.5 million deposit that was received in the fourth quarter of 2017. During the fourth quarter of 2017, the Company recorded an impairment charge of $414.3 million associated with the proposed sale of these properties and upon closing recognized a loss on sale of oil and gas properties of $45.4 million.
In September 2017, the Company sold certain proved and unproved oil and gas properties and related pipeline assets located in West Virginia, Virginia and Ohio to an affiliate of Carbon Natural Gas Company for $41.3 million, and recognized an $11.9 million loss on sale of assets. During the second quarter of 2017, the Company recorded an impairment charge of $68.6 million associated with the proposed sale of these properties.
66
3. Properties and Equipment, Net
Properties and equipment, net are comprised of the following:
December 31, | |||||||
(In thousands) | 2019 | 2018 | |||||
Proved oil and gas properties | $ | $ | |||||
Unproved oil and gas properties | |||||||
Land, buildings and other equipment | |||||||
Accumulated depreciation, depletion and amortization | ( | ) | ( | ) | |||
$ | $ | ||||||
Impairment of Oil and Gas Properties
In December 2017, the Company recorded an impairment of $414.3 million associated with its Eagle Ford Shale oil and gas properties located in south Texas. The impairment of these properties was due to the anticipated sale of these assets, as demonstrated by the execution of a purchase and sale agreement with a third party on December 19, 2017. These assets were reduced to fair value of approximately $765.6 million.
In June 2017, the Company recorded an impairment of $68.6 million associated with its proposed sale of oil and gas properties and related pipeline assets located in West Virginia, Virginia and Ohio. These assets were reduced to fair value of approximately $37.9 million.
The fair value of the impaired assets in 2017 was determined using a market approach that took into consideration the expected sales price included in the respective purchase and sale agreements the Company executed in June and December 2017. Accordingly, the inputs associated with the fair value of these assets were considered Level 3 in the fair value hierarchy. Refer to Note 1 for a description of fair value hierarchy.
Capitalized Exploratory Well Costs
The following table reflects the net changes in capitalized exploratory well costs:
Year Ended December 31, | |||||||||||
(In thousands) | 2019 | 2018 | 2017 | ||||||||
Balance at beginning of period | $ | $ | $ | ||||||||
Additions to capitalized exploratory well costs pending the determination of proved reserves | |||||||||||
Reclassifications to wells, facilities, and equipment based on the determination of proved reserves | |||||||||||
Capitalized exploratory well costs charged to expense | ( | ) | |||||||||
Balance at end of period | $ | $ | $ | ||||||||
The following table provides an aging of capitalized exploratory well costs based on the date the drilling was completed:
December 31, | |||||||||||
(In thousands) | 2019 | 2018 | 2017 | ||||||||
Capitalized exploratory well costs that have been capitalized for a period of one year or less | $ | $ | $ | ||||||||
Capitalized exploratory well costs that have been capitalized for a period greater than one year | |||||||||||
$ | $ | $ | |||||||||
67
4. Equity Method Investments
Activity related to the Company's equity method investments is as follows:
_______________________________________________________________________________
Constitution | Meade | Total | ||||||||||||||||||||||||||||||||||
Year Ended December 31, | Year Ended December 31, | Year Ended December 31, | ||||||||||||||||||||||||||||||||||
(In thousands) | 2019 | 2018 | 2017 | 2019 | 2018 | 2017 | 2019 | 2018 | 2017 | |||||||||||||||||||||||||||
Balance at beginning of period | $ | $ | $ | $ | $ | $ | $ | $ | $ | |||||||||||||||||||||||||||
Contributions | ||||||||||||||||||||||||||||||||||||
Distributions | ( | ) | ( | ) | ( | ) | ( | ) | ||||||||||||||||||||||||||||
Earnings (loss) on equity method investments | ( | ) | ( | ) | ( | ) | ( | ) | ( | ) | ||||||||||||||||||||||||||
Reclassification of accumulated losses(1) | ||||||||||||||||||||||||||||||||||||
Sale of investment | ( | ) | ( | ) | ||||||||||||||||||||||||||||||||
Balance at end of period | $ | $ | $ | $ | $ | $ | $ | $ | $ | |||||||||||||||||||||||||||
(1) Amount is included in accounts payable in the Consolidated Balance Sheet as of December 31, 2019.
Constitution Pipeline Company, LLC
In April 2012, the Company acquired a 25 percent equity interest in Constitution Pipeline Company, LLC (Constitution), which was formed to develop, construct and operate a 124-mile large diameter pipeline to transport natural gas from northeast Pennsylvania to both the New England and New York markets.
As of December 31, 2017, as a result of the ongoing legal and regulatory challenges associated with the project, the Company evaluated its investment in Constitution for other than temporary impairment (OTTI). At that time, the Company recorded an OTTI of $95.9 million, reducing its investment in Constitution to its estimated fair value. Fair value was determined using a market approach.
Although Constitution received a certificate of public convenience and necessity from the Federal Energy and Regulatory Commission (FERC) to construct the proposed pipeline and obtained, among other approvals, a waiver of the water quality certification under Section 401 of the Clean Water Act for the New York portion of the project, the members of Constitution, following extensive evaluation and discussions regarding the diminished underlying economics for this project, have elected to not proceed with the project. As a result of this decision, as of December 31, 2019, the Company recorded a liability of $9.4 million which represents its estimated remaining obligations associated with the project.
On February 10, 2020, the Company sold its 25 percent equity interest in Constitution to Williams Partners Operating LLC (Williams). The Company did not receive any proceeds and paid Williams $9.4 million that was previously accrued. Upon closing of the sale, the Company has no further obligations with respect to the project.
Meade Pipeline Co LLC
In February 2014, the Company acquired a 20 percent equity interest in Meade, which was formed to participate in the development and construction of the Central Penn Line, a 177-mile pipeline operated by Transcontinental Gas Pipe Line Company, LLC (Transco) that transports natural gas from Susquehanna County, Pennsylvania to an interconnect with Transco’s mainline in Lancaster County, Pennsylvania. The Central Penn Line is owned by Transco and Meade in proportion to their respective ownership percentages of approximately 61 percent and 39 percent, respectively. The Central Penn Line was placed into service on October 6, 2018.
68
5. Debt and Credit Agreements
The Company's debt and credit agreements consisted of the following:
_______________________________________________________________________________
December 31, | |||||||
(In thousands) | 2019 | 2018 | |||||
Total debt | |||||||
6.51% weighted-average senior notes (1) | $ | $ | |||||
5.58% weighted-average senior notes | |||||||
3.65% weighted-average senior notes | |||||||
Revolving credit facility | |||||||
Unamortized debt issuance costs | ( | ) | ( | ) | |||
$ | $ | ||||||
(1) | Includes $ |
The Company has debt maturities of $87.0 million due in 2020, $188.0 million due in 2021, $62.0 million due in 2023 and $575.0 million due in 2024 associated with its senior notes. In addition, the revolving credit facility matures in April 2024. No other tranches of debt are due within the next five years.
At December 31, 2019, the Company was in compliance with all restrictive financial covenants for both its revolving credit facility and senior notes.
Senior Notes
The Company has various issuances of senior notes. Interest on each of the senior notes is payable semi-annually. Under the terms of the various senior note agreements, the Company may prepay all or any portion of the notes of each series on any date at a price equal to the principal amount thereof plus accrued and unpaid interest plus a make-whole premium.
The Company's agreements provide that the Company maintain a minimum asset coverage ratio of 1.75 to 1.0 and a minimum annual coverage ratio of consolidated cash flow to interest expense for the trailing four quarters of 2.8 to 1.0. There are also various other covenants and events of default customarily found in such debt instruments.
In July 2008, the Company issued $425.0 million of senior unsecured notes to a group of 41 institutional investors in a private placement. The notes have bullet maturities and were issued in three separate tranches as follows:
Principal | Term | Maturity Date | Coupon | |||||||
Tranche 1 | $ | July 2018 | % | |||||||
Tranche 2 | $ | July 2020 | % | |||||||
Tranche 3 | $ | July 2023 | % | |||||||
In May 2016, the Company repurchased $8.0 million of Tranche 1, $13.0 million of Tranche 2 and $43.0 million of Tranche 3 for a total of $64.0 million for $68.3 million.
As of December 31, 2019, the Company has repaid $301.0 million of aggregate principal amount associated with the 6.51 % weighted-average senior notes.
69
In December 2010, the Company issued $175.0 million of senior unsecured notes to a group of eight institutional investors in a private placement. The notes have bullet maturities and were issued in three separate tranches as follows:
Principal | Term | Maturity Date | Coupon | |||||||
Tranche 1 | $ | January 2021 | % | |||||||
Tranche 2 | $ | January 2023 | % | |||||||
Tranche 3 | $ | January 2026 | % | |||||||
In September 2014, the Company issued $925.0 million of senior unsecured notes to a group of 24 institutional investors in a private placement. The notes have bullet maturities and were issued in three separate tranches as follows:
Principal | Term | Maturity Date | Coupon | |||||||
Tranche 1 | $ | September 2021 | % | |||||||
Tranche 2 | $ | September 2024 | % | |||||||
Tranche 3 | $ | September 2026 | % | |||||||
Revolving Credit Agreement
On April 22, 2019, the Company entered into a second amended and restated credit agreement (the revolving credit facility). The Company's revolving credit facility is unsecured and the borrowing base is redetermined annually on April 1. In addition, either the Company or the banks may request an interim redetermination twice a year or in connection with certain acquisitions or divestitures of oil and gas properties. The Company’s borrowing base and available commitments under the revolving credit facility were $3.2 billion and $1.5 billion, respectively. The maximum revolving credit available to the Company is the lesser of the available commitments or the difference of the borrowing base less outstanding senior notes. The Company's revolving credit facility matures in April 2024 and can be extended by one year upon the agreement of the Company and lenders holding at least 50 percent of the commitments under the revolving credit facility.
Interest rates under the revolving credit facility are based on LIBOR or ABR indications, plus a margin which ranges from 150 to 225 basis points for LIBOR loans and from 50 to 125 basis points for ABR loans when not in an Investment Grade Period (as defined in the amended and restated credit agreement) and from 112.5 to 175 basis points for LIBOR loans and from 12.5 to 75 basis points for ABR loans during an Investment Grade Period. The revolving credit facility also provides for a commitment fee on the unused available balance and is calculated at annual rates ranging from 30 to 42.5 basis points when not in an Investment Grade Period and from 12.5 to 27.5 basis points during an Investment Grade Period. The Company is currently not in an Investment Grade Period.
The revolving credit facility contains various customary covenants, which include the following (with all calculations based on definitions contained in the amended and restated credit agreement):
(a) | Maintenance of a minimum asset coverage ratio of |
(b) | Maintenance of a minimum annual coverage ratio of consolidated cash flow to interest expense for the trailing |
(c) | Maintenance of a minimum current ratio of |
At December 31, 2019, there were no borrowings outstanding under the Company's revolving credit facility and unused commitments were $1.5 billion. The Company's weighted-average effective interest rate for the revolving credit facility during the year ended December 31, 2019 and 2018 was approximately 6.3 percent. At December 31, 2018, the Company had $7.0 million of borrowings outstanding under its revolving credit facility.
The Company incurred $7.4 million of debt issuance costs in connection with the amended and restated credit agreement, which were capitalized and will be amortized over the term of the amended and restated agreement. The remaining unamortized costs of $3.4 million will also be amortized over the term of the amended and restated agreement in accordance with ASC 470-50, Debt Modifications and Extinguishments.
70
6. Derivative Instruments
As of December 31, 2019, the Company had the following outstanding financial commodity derivatives:
Collars | |||||||||||||||||||||
Floor | Ceiling | Swaps | |||||||||||||||||||
Type of Contract | Volume (Mmbtu) | Contract Period | Range | Weighted-Average | Range | Weighted- Average | Weighted- Average | ||||||||||||||
Natural gas (NYMEX) | Apr. 2020 - Oct. 2020 | $ | |||||||||||||||||||
Natural gas (NYMEX) | Apr. 2020 - Oct. 2020 | $ | $ | $2.36 - $2.38 | $ | ||||||||||||||||
In early 2020, the Company entered into the following financial commodity derivatives:
Collars | |||||||||||||||||||||
Floor | Ceiling | Swaps | |||||||||||||||||||
Type of Contract | Volume (Mmbtu) | Contract Period | Range | Weighted-Average | Range | Weighted- Average | Weighted- Average | ||||||||||||||
Natural gas (NYMEX) | Apr. 2020 - Oct. 2020 | $ | |||||||||||||||||||
Natural gas (NYMEX) | Apr. 2020 - Oct. 2020 | $ | $ | $ | $ | ||||||||||||||||
Effect of Derivative Instruments on the Consolidated Balance Sheet
Fair Values of Derivative Instruments | |||||||||||||||||
Derivative Assets | Derivative Liabilities | ||||||||||||||||
December 31, | December 31, | ||||||||||||||||
(In thousands) | Balance Sheet Location | 2019 | 2018 | 2019 | 2018 | ||||||||||||
Commodity contracts | Derivative instruments (current) | $ | $ | $ | |||||||||||||
December 31, | ||||||||
(In thousands) | 2019 | 2018 | ||||||
Derivative assets | ||||||||
Gross amounts of recognized assets | $ | $ | ||||||
Gross amounts offset in the consolidated balance sheet | ( | ) | ( | ) | ||||
Net amounts of assets presented in the consolidated balance sheet | ||||||||
Gross amounts of financial instruments not offset in the consolidated balance sheet | ||||||||
Net amount | $ | $ | ||||||
Derivative liabilities | ||||||||
Gross amounts of recognized liabilities | $ | $ | ||||||
Gross amounts offset in the consolidated balance sheet | ( | ) | ( | ) | ||||
Net amounts of liabilities presented in the consolidated balance sheet | ||||||||
Gross amounts of financial instruments not offset in the consolidated balance sheet | ||||||||
Net amount | $ | $ | ||||||
71
Effect of Derivative Instruments on the Consolidated Statement of Operations
Year Ended December 31, | ||||||||||||
(In thousands) | 2019 | 2018 | 2017 | |||||||||
Cash received (paid) on settlement of derivative instruments | ||||||||||||
Gain (loss) on derivative instruments | $ | $ | ( | ) | $ | |||||||
Non-cash gain (loss) on derivative instruments | ||||||||||||
Gain (loss) on derivative instruments | ( | ) | ||||||||||
$ | $ | $ | ||||||||||
Additional Disclosures about Derivative Instruments
The use of derivative instruments involves the risk that the counterparties will be unable to meet their obligations under the agreements. The Company's counterparties are primarily commercial banks and financial service institutions that management believes present minimal credit risk and its derivative contracts are with multiple counterparties to minimize its exposure to any individual counterparty. The Company performs both quantitative and qualitative assessments of these counterparties based on their credit ratings and credit default swap rates where applicable.
Certain counterparties to the Company's derivative instruments are also lenders under its revolving credit facility. The Company's revolving credit facility and derivative instruments contain certain cross default and acceleration provisions that may require immediate payment of its derivative liabilities in certain situations. The Company also has netting arrangements with each of its counterparties that allow it to offset assets and liabilities from separate derivative contracts with that counterparty.
72
7. Fair Value Measurements
Financial Assets and Liabilities
The following fair value hierarchy table presents information about the Company's financial assets and liabilities measured at fair value on a recurring basis:
(In thousands) | Quoted Prices in Active Markets for Identical Assets (Level 1) | Significant Other Observable Inputs (Level 2) | Significant Unobservable Inputs (Level 3) | Balance at December 31, 2019 | |||||||||||
Assets | |||||||||||||||
Deferred compensation plan | $ | $ | $ | $ | |||||||||||
Derivative instruments | |||||||||||||||
Total assets | $ | $ | $ | $ | |||||||||||
Liabilities | |||||||||||||||
Deferred compensation plan | $ | $ | $ | $ | |||||||||||
Derivative instruments | |||||||||||||||
Total liabilities | $ | $ | $ | $ | |||||||||||
(In thousands) | Quoted Prices in Active Markets for Identical Assets (Level 1) | Significant Other Observable Inputs (Level 2) | Significant Unobservable Inputs (Level 3) | Balance at December 31, 2018 | |||||||||||
Assets | |||||||||||||||
Deferred compensation plan | $ | $ | $ | $ | |||||||||||
Derivative instruments | |||||||||||||||
Total assets | $ | $ | $ | $ | |||||||||||
Liabilities | |||||||||||||||
Deferred compensation plan | $ | $ | $ | $ | |||||||||||
Derivative instruments | |||||||||||||||
Total liabilities | $ | $ | $ | $ | |||||||||||
The Company's investments associated with its deferred compensation plan consist of mutual funds and deferred shares of the Company's common stock that are publicly traded and for which market prices are readily available.
The derivative instruments were measured based on quotes from the Company's counterparties or internal models. Such quotes and models have been derived using an income approach that considers various inputs including current market and contractual prices for the underlying instruments, quoted forward commodity prices, basis differentials, volatility factors and interest rates for a similar length of time as the derivative contract term as applicable. Estimates are derived from or verified using relevant NYMEX futures contracts and/or are compared to multiple quotes obtained from counterparties for reasonableness. The determination of the fair values presented above also incorporates a credit adjustment for non-performance risk. The Company measured the non-performance risk of its counterparties by reviewing credit default swap spreads for the various financial institutions with which it has derivative contracts while non-performance risk of the Company is evaluated using a market credit spread provided by the Company's bank. The Company has not incurred any losses related to non-performance risk of its counterparties and does not anticipate any material impact on its financial results due to non-performance by third parties.
The most significant unobservable inputs relative to the Company's Level 3 derivative contracts are basis differentials and volatility factors. An increase (decrease) in these unobservable inputs would result in an increase (decrease) in fair value, respectively. The Company does not have access to the specific assumptions used in its counterparties' valuation models. Consequently, additional disclosures regarding significant Level 3 unobservable inputs were not provided.
73
The following table sets forth a reconciliation of changes in the fair value of financial assets and liabilities classified as Level 3 in the fair value hierarchy:
Year Ended December 31, | |||||||||||
(In thousands) | 2019 | 2018 | 2017 | ||||||||
Balance at beginning of period | $ | $ | ( | ) | $ | ( | ) | ||||
Total gain (loss) included in earnings | ( | ) | |||||||||
Settlement (gain) loss | ( | ) | ( | ) | |||||||
Transfers in and/or out of Level 3 | |||||||||||
Balance at end of period | $ | ( | ) | $ | $ | ( | ) | ||||
Change in unrealized gains (losses) relating to assets and liabilities still held at the end of the period | $ | ( | ) | $ | $ | ( | ) | ||||
Non-Financial Assets and Liabilities
The Company discloses or recognizes its non-financial assets and liabilities, such as impairments of oil and gas properties or impairments of equity method investments, at fair value on a nonrecurring basis. The Company recorded an impairment charge related to certain oil and gas properties during the year ended December 31, 2017. The Company also recorded an other than temporary impairment of its equity method investment in Constitution during the year ended December 31, 2017. Refer to Notes 3 and 4 for additional disclosures related to fair value associated with the impaired assets. As none of the Company’s other non-financial assets and liabilities were measured at fair value as of December 31, 2019, 2018 and 2017, additional disclosures were not required.
The estimated fair value of the Company's asset retirement obligations at inception is determined by utilizing the income approach by applying a credit-adjusted risk-free rate, which takes into account the Company's credit risk, the time value of money, and the current economic state to the undiscounted expected abandonment cash flows. Given the unobservable nature of the inputs, the measurement of the asset retirement obligations was classified as Level 3 in the fair value hierarchy.
Fair Value of Other Financial Instruments
The estimated fair value of other financial instruments is the amount at which the instrument could be exchanged currently between willing parties. The carrying amounts reported in the Consolidated Balance Sheet for cash and cash equivalents and restricted cash approximate fair value due to the short-term maturities of these instruments. Cash and cash equivalents and restricted cash are classified as Level 1 in the fair value hierarchy and the remaining financial instruments are classified as Level 2.
The Company uses available market data and valuation methodologies to estimate the fair value of debt. The fair value of debt is the estimated amount the Company would have to pay a third party to assume the debt, including a credit spread for the difference between the issue rate and the period end market rate. The credit spread is the Company's default or repayment risk. The credit spread (premium or discount) is determined by comparing the Company's senior notes and revolving credit facility to new issuances (secured and unsecured) and secondary trades of similar size and credit statistics for both public and private debt. The fair value of all senior notes and the revolving credit facility is based on interest rates currently available to the Company. The Company's debt is valued using an income approach and classified as Level 3 in the fair value hierarchy.
The carrying amount and fair value of debt is as follows:
December 31, 2019 | December 31, 2018 | ||||||||||||||
(In thousands) | Carrying Amount | Estimated Fair Value | Carrying Amount | Estimated Fair Value | |||||||||||
Long-term debt | $ | $ | $ | $ | |||||||||||
Current maturities | ( | ) | ( | ) | |||||||||||
Long-term debt, excluding current maturities | $ | $ | $ | $ | |||||||||||
74
8. Asset Retirement Obligations
Activity related to the Company's asset retirement obligations is as follows:
Year Ended December 31, | ||||||||
(In thousands) | 2019 | 2018 | ||||||
Balance at beginning of period | $ | $ | ||||||
Liabilities incurred | ||||||||
Liabilities settled | ( | ) | ( | ) | ||||
Liabilities divested | ( | ) | ( | ) | ||||
Accretion expense | ||||||||
Change in estimate | ||||||||
Balance at end of period | ||||||||
Less: current asset retirement obligation | ( | ) | ( | ) | ||||
Noncurrent asset retirement obligation | $ | $ | ||||||
9. Commitments and Contingencies
Transportation and Gathering Agreements
The Company has entered into certain transportation and gathering agreements with various pipeline carriers. Under certain of these agreements, the Company is obligated to ship minimum daily quantities, or pay for any deficiencies at a specified rate. The Company's forecasted production to be shipped on these pipelines is expected to exceed minimum daily quantities provided in the agreements. The Company is also obligated under certain of these arrangements to pay a demand charge for firm capacity rights on pipeline systems regardless of the amount of pipeline capacity utilized by the Company. If the Company does not utilize the capacity, it can release it to others, thus reducing its potential liability.
As of December 31, 2019, the Company's future minimum obligations under transportation and gathering agreements are as follows:
(In thousands) | |||
2020 | $ | ||
2021 | |||
2022 | |||
2023 | |||
2024 | |||
Thereafter | |||
$ | |||
Lease Commitments
The Company determines if an arrangement is, or contains, a lease at inception based on whether that contract conveys the right to control the use of an identified asset in exchange for consideration for a period of time. Operating leases are included in operating lease right-of-use assets (ROU assets) and operating lease liabilities (current and non-current) in the Consolidated Balance Sheet. The Company does no t have any finance leases at December 31, 2019.
ROU assets represent the Company’s right to use an underlying asset for the lease term and lease liabilities represent the Company’s obligation to make lease payments arising from the leases. ROU assets and lease liabilities are recognized at the lease commencement date based on the present value of minimum lease payments over the lease term. Most leases do not provide an implicit interest rate; therefore, the Company used its incremental borrowing rate based on the information available at the inception date to determine the present value of the lease payments. Lease terms include options to extend the lease when it is reasonably certain that the Company will exercise that option. Lease cost for lease payments is recognized on a straight-line basis over the lease term. Certain leases have payment terms that vary based on the usage of the underlying assets. Variable lease payments are not included in ROU assets and lease liabilities.
For all operating leases, lease and non-lease components are accounted for as a single lease component.
75
The Company has operating leases for office space, drilling rig commitments, surface use agreements, compressor services and other leases. The leases have remaining terms ranging from three months to 26 years, including options to extend leases that the Company is reasonably certain to exercise. During the year ended December 31, 2019, the Company recognized operating lease cost and variable lease cost of $11.5 million and $6.6 million, respectively.
Short-term leases. The Company leases drilling rigs, fracturing and other equipment under lease terms ranging from 30 days to one year . Lease cost of $267.9 million was recognized on short-term leases during the year ended December 31, 2019. Certain lease costs are capitalized and included in Properties and equipment, net in the Consolidated Balance Sheet because they relate to drilling and completion activities, while other costs are expensed because they relate to production and administrative activities.
As of December 31, 2019, the Company’s future undiscounted minimum cash payment obligations for its operating lease liabilities are as follows:
(In thousands) | Year Ending December 31, | |||
2020 | $ | |||
2021 | ||||
2022 | ||||
2023 | ||||
2024 | ||||
Thereafter | ||||
Total undiscounted future lease payments | ||||
Present value adjustment | ( | ) | ||
Net operating lease liabilities | $ | |||
Supplemental cash flow information related to leases was as follows:
(In thousands) | Year Ended December 31, 2019 | |||
Cash paid for amounts included in the measurement of lease liabilities: | ||||
Operating cash flows from operating leases | $ | |||
Investing cash flows from operating leases | $ | |||
Information regarding the weighted-average remaining lease term and the weighted-average discount rate for operating leases is summarized below:
December 31, 2019 | |||
Weighted-average remaining lease term (in years) | |||
Operating leases | |||
Weighted-average discount rate | |||
Operating leases | % | ||
Lease Commitments (Topic 840)
Future minimum rental commitments under non-cancelable leases in effect at December 31, 2018 are as follows:
(In thousands) | ||||
2019 | $ | |||
2020 | ||||
2021 | ||||
2022 | ||||
2023 | ||||
Thereafter | ||||
$ | ||||
The table above was prepared under the guidance of Topic 840. As discussed in Note 1 above, the Company adopted the guidance of Topic 842 effective January 1, 2019.
76
Rent expense under cancelable and non-cancelable leases totaled $9.3 million and $9.7 million for the years ended December 31, 2018 and 2017, respectively.
Legal Matters
The Company is a defendant in various legal proceedings arising in the normal course of business. All known liabilities are accrued when management determines they are probable based on its best estimate of the potential loss. While the outcome and impact of these legal proceedings on the Company cannot be predicted with certainty, management believes that the resolution of these proceedings will not have a material effect on the Company's financial position, results of operations or cash flows.
Contingency Reserves. When deemed necessary, the Company establishes reserves for certain legal proceedings. The establishment of a reserve is based on an estimation process that includes the advice of legal counsel and subjective judgment of management. While management believes these reserves to be adequate, it is reasonably possible that the Company could incur additional losses with respect to those matters for which reserves have been established. The Company believes that any such amount above the amounts accrued would not be material to the Consolidated Financial Statements. Future changes in facts and circumstances not currently foreseeable could result in the actual liability exceeding the estimated ranges of loss and amounts accrued.
10. Revenue Recognition
Disaggregation of Revenue
The following table presents revenues from contracts with customers disaggregated by product:
_______________________________________________________________________________
Year Ended December 31, | |||||||||||
(In thousands) | 2019 | 2018 | 2017(1) | ||||||||
OPERATING REVENUES | |||||||||||
Natural gas | $ | $ | $ | ||||||||
Crude oil and condensate | |||||||||||
Brokered natural gas | |||||||||||
Other | |||||||||||
Total revenues from contracts with customers | $ | $ | $ | ||||||||
(1) | Prior period amounts have not been adjusted under the modified retrospective method. |
All of the Company’s revenues from contracts with customers represent products transferred at a point in time as control is transferred to the customer and generated in the United States.
Transaction Price Allocated to Remaining Performance Obligations
A significant number of the Company’s product sales contracts are short-term in nature with a contract term of one year or less. For those contracts, the Company has utilized the practical expedient exempting the Company from disclosure of the transaction price allocated to remaining performance obligations if the performance obligation is part of a contract that has an original expected duration of one year or less.
As of December 31, 2019, the Company has $9.5 billion of unsatisfied performance obligations related to natural gas sales that have a fixed pricing component and a contract term greater than one year. The Company expects to recognize these obligations over periods ranging from four to 19 years.
Contract Balances
77
11. Income Taxes
On December 22, 2017, the U.S. enacted the Tax Cuts and Jobs Act (the Tax Act) which significantly changed U.S. corporate income tax laws beginning, generally, in 2018. These changes included, among others, (i) a permanent reduction of the U.S. corporate income tax rate from a top marginal rate of 35 percent to a flat rate of 21 percent, (ii) elimination of the corporate alternative minimum tax, (iii) immediate deductions for certain new investments instead of deductions for depreciation expense over time, (iv) limitation on the tax deduction for interest expense to 30 percent of adjusted taxable income, (v) limitation of the deduction for net operating losses to 80 percent of current year taxable income and elimination of net operating loss carrybacks, and (vi) elimination of many business deductions and credits, including the domestic production activities deduction, the deduction for entertainment expenditures, and the deduction for certain executive compensation in excess of $1 million. The 2019 and 2018 tax provisions reflect the legislative changes noted above, including the new corporate tax rate of 21 percent.
Income tax expense (benefit) is summarized as follows:
Year Ended December 31, | |||||||||||
(In thousands) | 2019 | 2018 | 2017 | ||||||||
Current | |||||||||||
Federal | $ | ( | ) | $ | ( | ) | $ | ( | ) | ||
State | |||||||||||
( | ) | ( | ) | ( | ) | ||||||
Deferred | |||||||||||
Federal | ( | ) | |||||||||
State | ( | ) | ( | ) | |||||||
( | ) | ||||||||||
Income tax expense (benefit) | $ | $ | $ | ( | ) | ||||||
Income tax expense (benefit) was different than the amounts computed by applying the statutory federal income tax rate as follows:
Year Ended December 31, | ||||||||||||||||||||
2019 | 2018 | 2017 | ||||||||||||||||||
(In thousands, except rates) | Amount | Rate | Amount | Rate | Amount | Rate | ||||||||||||||
Computed "expected" federal income tax | $ | % | $ | % | $ | ( | ) | % | ||||||||||||
State income tax, net of federal income tax benefit | % | % | ( | ) | % | |||||||||||||||
Deferred tax adjustment related to change in overall state tax rate | ( | ) | ( | )% | ( | ) | ( | )% | ( | ) | % | |||||||||
Valuation allowance | % | % | ( | ) | % | |||||||||||||||
Provision to return adjustments | ( | ) | ( | )% | ( | ) | ( | )% | ( | ) | % | |||||||||
Excess stock compensation | ( | ) | ( | )% | % | ( | )% | |||||||||||||
Tax Act | % | ( | ) | ( | )% | ( | ) | % | ||||||||||||
Other, net | % | % | ( | ) | % | |||||||||||||||
Income tax expense (benefit) | $ | % | $ | % | $ | ( | ) | % | ||||||||||||
In 2019, the Company's overall effective tax rate increased compared to 2018, primarily due to larger tax benefits recorded in 2018 compared to 2019 related to the Tax Act and changes in the overall state tax rate. The overall effective tax rate was significantly higher in 2017 due to the Tax Act, where the Company recorded an income tax benefit of $242.9 million resulting from the remeasurement of its net deferred tax liabilities based on the new lower corporate income tax rate.
Excluding the discrete impact of the Tax Act, the adjusted effective tax rates were 24.3 percent for 2019, 21.8 percent for 2018 and 37.6 percent for 2017. The effective tax rate was lower in 2019 and 2018 than in 2017 primarily due to the reduction of the U.S. corporate income tax rate from 35 percent to 21 percent.
78
The composition of net deferred tax liabilities is as follows:
December 31, | |||||||
(In thousands) | 2019 | 2018 | |||||
Deferred Tax Assets | |||||||
Net operating losses | $ | $ | |||||
Alternative minimum tax credits | |||||||
Foreign tax credits | |||||||
Other business credits | |||||||
Incentive compensation | |||||||
Deferred compensation | |||||||
Post-retirement benefits | |||||||
Equity method investments | |||||||
Capital loss carryforward | |||||||
Other | |||||||
Less: valuation allowance | ( | ) | ( | ) | |||
Total | |||||||
Deferred Tax Liabilities | |||||||
Properties and equipment | |||||||
Derivative instruments | |||||||
Total | |||||||
Net deferred tax liabilities | $ | $ | |||||
As of December 31, 2019, the Company had fully utilized its federal net operating loss (NOL) carryforward, foreign tax credits, and other business credit carryforwards. The Company did have a remaining AMT credit carryforward balance of $22.1 million, which is expected to be fully utilized to offset regular income taxes in 2020. The Company also had gross state NOL carryforwards of $390.1 million, the majority of which will not expire until 2025 through 2039.
At December 31, 2019, the Company had $13.6 million of valuation allowances on the deferred tax benefits related to state NOLs, and recorded a valuation allowance of $18.1 million on the deferred tax benefits related to its equity method investments. The Company believes it is more likely than not that the remainder of its deferred tax benefits will be utilized prior to their expiration.
Unrecognized Tax Benefits
A reconciliation of unrecognized tax benefits is as follows:
Year Ended December 31, | ||||||||||||
(In thousands) | 2019 | 2018 | 2017 | |||||||||
Balance at beginning of year | $ | $ | $ | |||||||||
Additions for tax positions of prior years | ||||||||||||
Reductions for tax positions of prior years | ( | ) | ||||||||||
Balance at end of year | $ | $ | $ | |||||||||
During 2019, the Company released a $16.3 million net reserve for unrecognized tax benefits related to alternative minimum tax associated with uncertain tax positions and a $3.1 million liability for accrued interest associated with the uncertain tax positions. The release of the net reserve did not have a material impact on the Company's effective tax rate. As of December 31, 2019, the Company had a $0.5 million reserve for unrecognized tax benefits related to the allocation of certain gains associated with its divestitures for purposes of computing state income taxes. If recognized, the net tax benefit of $0.5 million would not have a material effect on the Company's effective tax rate.
The Company files income tax returns in the U.S. federal, various states and other jurisdictions. The Company is no longer subject to examinations by state authorities before 2012 or by federal authorities before 2013. The Company is currently under examination by the Internal Revenue Service for its 2014 through 2017 tax years. The Company believes that appropriate
79
provisions have been made for all jurisdictions and all open years, and that any assessment on these filings will not have a material impact on the Company's financial position, results of operations or cash flows.
12. Employee Benefit Plans
Postretirement Benefits
The Company provides certain health care benefits for retired employees, including their spouses, eligible dependents and surviving spouses (retirees). These benefits are commonly called postretirement benefits. The health care plans are contributory, with participants' contributions adjusted annually. Most employees become eligible for these benefits if they meet certain age and service requirements at retirement. During the year ended December 31, 2017, the Company amended the plan to reflect a change from a Medicare Supplemental program to a Medicare Advantage program for participants age 65 and older. The coverage continues to be provided under a fully-insured arrangement.
The Company provided postretirement benefits to 310 retirees and their dependents at the end of 2019 and 337 retirees and their dependents at the end of 2018.
Obligations and Funded Status
The funded status represents the difference between the accumulated benefit obligation of the Company's postretirement plan and the fair value of plan assets at December 31. The postretirement plan does not have any plan assets; therefore, the unfunded status is equal to the amount of the December 31 accumulated benefit obligation.
The change in the Company's postretirement benefit obligation is as follows:
_______________________________________________________________________________
Year Ended December 31, | |||||||||||
(In thousands) | 2019 | 2018 | 2017 | ||||||||
Change in Benefit Obligation | |||||||||||
Benefit obligation at beginning of year | $ | $ | $ | ||||||||
Service cost | |||||||||||
Interest cost | |||||||||||
Actuarial (gain) loss | ( | ) | |||||||||
Benefits paid | ( | ) | ( | ) | ( | ) | |||||
Curtailments(1) | ( | ) | |||||||||
Plan amendments | ( | ) | |||||||||
Benefit obligation at end of year | $ | $ | $ | ||||||||
Change in Plan Assets | |||||||||||
Fair value of plan assets at end of year | |||||||||||
Funded status at end of year | $ | ( | ) | $ | ( | ) | $ | ( | ) | ||
(1) | During 2017, the Company terminated approximately |
Amounts Recognized in the Balance Sheet
Amounts recognized in the balance sheet consist of the following:
December 31, | |||||||||||
(In thousands) | 2019 | 2018 | 2017 | ||||||||
Current liabilities | $ | $ | $ | ||||||||
Non-current liabilities | |||||||||||
$ | $ | $ | |||||||||
80
Amounts Recognized in Accumulated Other Comprehensive Income (Loss)
Amounts recognized in accumulated other comprehensive income (loss) consist of the following:
December 31, | |||||||||||
(In thousands) | 2019 | 2018 | 2017 | ||||||||
Net actuarial (gain) loss | $ | ( | ) | $ | ( | ) | $ | ||||
Prior service cost | ( | ) | ( | ) | |||||||
$ | ( | ) | $ | ( | ) | $ | ( | ) | |||
Components of Net Periodic Benefit Cost and Other Amounts Recognized in Other Comprehensive Income (Loss)
Year Ended December 31, | |||||||||||
(In thousands) | 2019 | 2018 | 2017 | ||||||||
Components of Net Periodic Postretirement Benefit Cost | |||||||||||
Service cost | $ | $ | $ | ||||||||
Interest cost | |||||||||||
Amortization of prior service cost | ( | ) | ( | ) | ( | ) | |||||
Net periodic postretirement cost | |||||||||||
Recognized curtailment gain | ( | ) | |||||||||
Total post retirement cost (income) | $ | $ | $ | ( | ) | ||||||
Other Changes in Benefit Obligations Recognized in Other Comprehensive Income (Loss) | |||||||||||
Net (gain) loss | $ | $ | ( | ) | $ | ||||||
Prior service cost | ( | ) | |||||||||
Amortization of prior service cost | |||||||||||
Total recognized in other comprehensive income | ( | ) | ( | ) | |||||||
Total recognized in net periodic benefit cost (income) and other comprehensive income | $ | $ | ( | ) | $ | ( | ) | ||||
Assumptions
Assumptions used to determine projected postretirement benefit obligations and postretirement costs are as follows:
_______________________________________________________________________________
December 31, | ||||||||
2019 | 2018 | 2017 | ||||||
Discount rate(1) | % | % | % | |||||
Health care cost trend rate for medical benefits assumed for next year (pre-65) | % | % | % | |||||
Health care cost trend rate for medical benefits assumed for next year (post-65) | % | % | % | |||||
Ultimate trend rate (pre-65) | % | % | % | |||||
Ultimate trend rate (post-65) | % | % | % | |||||
Year that the rate reaches the ultimate trend rate (pre-65) | 2030 | 2030 | 2030 | |||||
Year that the rate reaches the ultimate trend rate (post-65) | 2023 | 2023 | 2023 | |||||
(1) | Represents the year end rates used to determine the projected benefit obligation. To compute postretirement cost in 2019, 2018 and 2017, respectively, the beginning of year discount rates of |
Coverage provided to participants age 65 and older is under a fully-insured arrangement. The Company subsidy is limited to 60 percent of the expected annual fully-insured premium for participants age 65 and older. For all participants under age 65, the Company subsidy for all retiree medical and prescription drug benefits, beginning January 1, 2006, was limited to an aggregate annual amount not to exceed $648,000 . This limit increases by 3.5 percent annually thereafter.
81
Assumed health care cost trend rates may have a significant effect on the amounts reported for the health care plans. A one-percentage-point change in assumed health care cost trend rates would have the following effects:
(In thousands) | 1-Percentage-Point Increase | 1-Percentage-Point Decrease | |||||
Effect on total of service and interest cost | $ | $ | ( | ) | |||
Effect on postretirement benefit obligation | ( | ) | |||||
Cash Flows
Contributions. The Company expects to contribute approximately $1.8 million to the postretirement benefit plan in 2020.
Estimated Future Benefit Payments. The following estimated benefit payments under the Company's postretirement plans, which reflect expected future service, are expected to be paid as follows:
(In thousands) | |||
2020 | $ | ||
2021 | |||
2022 | |||
2023 | |||
2024 | |||
Years 2025 - 2029 | |||
Savings Investment Plan
The Company has a Savings Investment Plan (SIP), which is a defined contribution plan. The Company matches a portion of employees' contributions in cash. Participation in the SIP is voluntary and all regular employees of the Company are eligible to participate. The Company matches employee contributions dollar-for-dollar, up to the maximum IRS limit, on the first six percent of an employee's pretax earnings. The SIP also provides for discretionary profit sharing contributions in an amount equal to 10 percent of an eligible plan participant's salary and bonus. During the years ended December 31, 2019, 2018 and 2017, the Company made contributions of $5.8 million, $5.9 million and $6.5 million, respectively, which are included in general and administrative expense in the Consolidated Statement of Operations. The Company's common stock is an investment option within the SIP.
Deferred Compensation Plan
The Company has a deferred compensation plan which is available to officers and certain members of the Company's management group and acts as a supplement to the SIP. The Internal Revenue Code does not cap the amount of compensation that may be taken into account for purposes of determining contributions to the deferred compensation plan and does not impose limitations on the amount of contributions to the deferred compensation plan. At the present time, the Company anticipates making a contribution to the deferred compensation plan on behalf of a participant in the event that Internal Revenue Code limitations cause a participant to receive less than the Company matching contribution under the SIP.
The assets of the deferred compensation plan are held in a rabbi trust and are subject to additional risk of loss in the event of bankruptcy or insolvency of the Company.
Under the deferred compensation plan, the participants direct the deemed investment of amounts credited to their accounts. The trust assets are invested in either mutual funds that cover the investment spectrum from equity to money market, or may include holdings of the Company's common stock, which is funded by the issuance of shares to the trust. The mutual funds are publicly traded and have market prices that are readily available. The Company's common stock is not currently an investment option in the deferred compensation plan. Shares of the Company's stock currently held in the deferred compensation plan represent vested performance share awards that were previously deferred into the rabbi trust. Settlement payments are made to participants in cash, either in a lump sum or in periodic installments. The market value of the trust assets, excluding the Company's common stock, was $18.4 million and $14.7 million at December 31, 2019 and 2018, respectively, and is included in other assets in the Consolidated Balance Sheet. Related liabilities, including the Company's common stock, totaled $27.0 million and $25.8 million at December 31, 2019 and 2018, respectively, and are included in other liabilities in the Consolidated Balance Sheet. With the exception of the Company's common stock, there is no impact on earnings or earnings per share from the changes in market value of the deferred compensation plan assets because the changes in market value of the
82
trust assets are offset completely by changes in the value of the liability, which represents trust assets belonging to plan participants.
As of December 31, 2019 and 2018, 495,774 shares and 495,774 shares of the Company's common stock were held in the rabbi trust, respectively. These shares were recorded at the market value on the date of deferral, which totaled $5.1 million and $5.1 million at December 31, 2019 and 2018, respectively, and is included in additional paid-in capital in stockholders' equity in the Consolidated Balance Sheet. The Company recognized compensation (benefit) expense of ($2.4 million), ($3.1 million) and $2.6 million in 2019, 2018 and 2017, respectively, which is included in general and administrative expense in the Consolidated Statement of Operations representing the increase (decrease) in the closing price of the Company's shares held in the trust. The Company's common stock issued to the trust is not considered outstanding for purposes of calculating basic earnings per share, but is considered a common stock equivalent in the calculation of diluted earnings per share.
The Company made contributions to the deferred compensation plan of $1.0 million, $1.1 million and $1.0 million in 2019, 2018 and 2017, respectively, which are included in general and administrative expense in the Consolidated Statement of Operations.
13. Capital Stock
Incentive Plans
On May 1, 2014, the Company’s shareholders approved the 2014 Incentive Plan. Under the 2014 Incentive Plan, incentive and non-statutory stock options, stock appreciation rights (SARs), stock awards, cash awards and performance share awards may be granted to key employees, consultants and officers of the Company. Non-employee directors of the Company may be granted discretionary awards under the 2014 Incentive Plan consisting of stock options or stock awards. A total of 18.0 million shares of common stock may be issued under the 2014 Incentive Plan. Under the 2014 Incentive Plan, no more than 10.0 million shares may be issued pursuant to incentive stock options. No additional awards may be granted under the 2014 Incentive Plan on or after May 1, 2024. At December 31, 2019, approximately 12.8 million shares are available for issuance under the 2014 Incentive Plan.
Treasury Stock
In August 1998, the Board of Directors authorized a share repurchase program under which the Company may purchase shares of common stock in the open market or in negotiated transactions. The timing and amount of these stock purchases are determined at the discretion of management. The Company may use the repurchased shares to fund stock compensation programs presently in existence, or for other corporate purposes. All purchases executed to date have been through open market transactions. There is no expiration date associated with the authorization to repurchase shares of the Company.
During the years ended December 31, 2019, 2018 and 2017, the Company repurchased 25.5 million shares for a total cost of $488.5 million, 38.5 million shares for a total cost of $904.1 million and 5.0 million shares for a total cost of $123.7 million, respectively. Since the authorization date and subsequent authorizations, the Company has repurchased 99.0 million shares, of which 20.0 million shares have been retired, for a total cost of approximately $1.9 billion. No treasury shares have been delivered or sold by the Company subsequent to the repurchase.
In July 2019, the Board of Directors authorized an increase of 25.0 million shares to the Company’s share repurchase program. As of December 31, 2019, 79.0 million shares were held as treasury stock and 11.0 million shares were available for repurchase under the share repurchase plan.
Dividend Restrictions
The Board of Directors of the Company determines the amount of future cash dividends, if any, to be declared and paid on the common stock depending on, among other things, the Company's financial condition, funds from operations, the level of its capital and exploration expenditures, and its future business prospects. None of the senior note or credit agreements in place have restricted payment provisions or other provisions limiting dividends
In April 2019, the Board of Directors approved an increase in the quarterly dividend on the Company's common stock from $0.07 per share to $0.09 per share. In October 2019, the Board of Directors approved an additional increase in the quarterly dividend on the Company's common stock from $0.09 per share to $0.10 per share.
83
14. Stock-Based Compensation
General
Stock-based compensation expense for the years ended December 31, 2019, 2018 and 2017 was $30.8 million, $33.1 million and $34.0 million, respectively, and is included in general and administrative expense in the Consolidated Statement of Operations.
Restricted Stock Awards
Restricted stock awards are granted from time to time to employees of the Company. The fair value of restricted stock grants is based on the closing stock price on the grant date. Restricted stock awards generally vest either at the end of a three year service period or on a graded or graduated vesting basis at each anniversary date over a three or four year service period.
For awards that vest at the end of the service period, expense is recognized ratably using a straight-line approach over the service period. Under the graded or graduated approach, the Company recognizes compensation cost ratably over the requisite service period, as applicable, for each separately vesting tranche as though the awards are, in substance, multiple awards. For most restricted stock awards, vesting is dependent upon the employees' continued service with the Company, with the exception of employment termination due to death, disability or retirement. If included in the grant award, the Company accelerates the vesting period for retirement-eligible employees for purposes of recognizing compensation expense in accordance with the vesting provisions of the Company's stock-based compensation programs.
The Company used an annual forfeiture rate assumption of five percent for purposes of recognizing stock-based compensation expense for restricted stock awards. The annual forfeiture rates were based on the Company's actual forfeiture history for this type of award to various employee groups.
The following table is a summary of restricted stock award activity:
__________________________________________________________________
Year Ended December 31, | ||||||||||||||||||||
2019 | 2018 | 2017 | ||||||||||||||||||
Shares | Weighted- Average Grant Date Fair Value per Share | Shares | Weighted- Average Grant Date Fair Value per Share | Shares | Weighted- Average Grant Date Fair Value per Share | |||||||||||||||
Outstanding at beginning of period | $ | $ | $ | |||||||||||||||||
Granted | ||||||||||||||||||||
Vested | ( | ) | ( | ) | ( | ) | ||||||||||||||
Forfeited | ( | ) | ( | ) | ||||||||||||||||
Outstanding at end of period(1)(2) | $ | $ | $ | |||||||||||||||||
(1) | As of December 31, 2019, the aggregate intrinsic value was $ |
(2) | As of December 31, 2019, the weighted average remaining contractual term of non-vested restricted stock awards outstanding was |
Compensation expense recorded for all restricted stock awards for the years ended December 31, 2019, 2018 and 2017 was $1.3 million, $2.8 million and $0.5 million, respectively. Unamortized expense as of December 31, 2019 for all outstanding restricted stock awards was $1.1 million and will be recognized over the next 2.5 years.
The total fair value of restricted stock awards that vested during 2019, 2018 and 2017 was $4.1 million, $0.2 million and $0.9 million, respectively.
Restricted Stock Units
Restricted stock units are granted from time to time to non-employee directors of the Company. The fair value of the restricted stock units is based on the closing stock price on the grant date. These units vest immediately and compensation expense is recorded immediately. Restricted stock units are issued when the director ceases to be a director of the Company.
84
The following table is a summary of restricted stock unit activity:
_______________________________________________________________________________
Year Ended December 31, | ||||||||||||||||||||
2019 | 2018 | 2017 | ||||||||||||||||||
Shares | Weighted- Average Grant Date Fair Value per Share | Shares | Weighted- Average Grant Date Fair Value per Share | Shares | Weighted- Average Grant Date Fair Value per Share | |||||||||||||||
Outstanding at beginning of period | $ | $ | $ | |||||||||||||||||
Granted and fully vested | ||||||||||||||||||||
Issued | ||||||||||||||||||||
Forfeited | ||||||||||||||||||||
Outstanding at end of period(1)(2) | $ | $ | $ | |||||||||||||||||
(1) | As of December 31, 2019, the aggregate intrinsic value was $ |
(2) | Due to the immediate vesting of the units and the unknown term of each director, the weighted-average remaining contractual term in years has not been provided. |
Compensation expense recorded for all restricted stock units for the year ended December 31, 2019, 2018 and 2017 was $2.1 million, $1.9 million and $1.4 million, respectively, which reflects the total fair value of these units.
Performance Share Awards
The Company grants three types of performance share awards: two based on performance conditions measured against the Company's internal performance metrics (Employee Performance Share Awards and Hybrid Performance Share Awards) and one based on market conditions measured based on the Company's performance relative to a predetermined peer group (TSR Performance Share Awards). The performance period for these awards commences on January 1 of the respective year in which the award was granted and extends over a three-year performance period. For all performance share awards, the Company used an annual forfeiture rate assumption ranging from zero percent to seven percent for purposes of recognizing stock-based compensation expense for its performance share awards.
Performance Share Awards Based on Internal Performance Metrics
The fair value of performance share award grants based on internal performance metrics is based on the closing stock price on the grant date. Each performance share award represents the right to receive up to 100 percent of the award in shares of common stock.
Employee Performance Share Awards. The Employee Performance Share Awards vest at the end of the three-year performance period. An employee will earn one-third of the award for each of the three performance metrics that the Company meets. These performance metrics are set by the Company's Compensation Committee and are based on the Company's average production, average finding costs and average reserve replacement over a three-year performance period. Based on the Company's probability assessment at December 31, 2019, it is considered probable that all of the criteria for these awards will be met.
85
The following table is a summary of activity for Employee Performance Share Awards:
Year Ended December 31, | ||||||||||||||||||||
2019 | 2018 | 2017 | ||||||||||||||||||
Shares | Weighted- Average Grant Date Fair Value per Share | Shares | Weighted- Average Grant Date Fair Value per Share | Shares | Weighted- Average Grant Date Fair Value per Share | |||||||||||||||
Outstanding at beginning of period | $ | $ | $ | |||||||||||||||||
Granted | ||||||||||||||||||||
Issued and fully vested | ( | ) | ( | ) | ( | ) | ||||||||||||||
Forfeited | ( | ) | ( | ) | ( | ) | ||||||||||||||
Outstanding at end of period | $ | $ | $ | |||||||||||||||||
Hybrid Performance Share Awards. The Hybrid Performance Share Awards have a three-year graded performance period. The awards vest 25 percent on each of the first and second anniversary dates and 50 percent on the third anniversary provided that the Company has $100 million or more of operating cash flow for the year preceding the vesting date, as set by the Company's Compensation Committee. If the Company does not meet the performance metric for the applicable period, then the portion of the performance shares that would have been issued on that anniversary date will be forfeited. Based on the Company's probability assessment at December 31, 2019, it is considered probable that the criteria for these awards will be met.
The following table is a summary of activity for the Hybrid Performance Share Awards:
Year Ended December 31, | ||||||||||||||||||||
2019 | 2018 | 2017 | ||||||||||||||||||
Shares | Weighted- Average Grant Date Fair Value per Share | Shares | Weighted- Average Grant Date Fair Value per Share | Shares | Weighted- Average Grant Date Fair Value per Share | |||||||||||||||
Outstanding at beginning of period | $ | $ | $ | |||||||||||||||||
Granted | ||||||||||||||||||||
Issued and fully vested | ( | ) | ( | ) | ( | ) | ||||||||||||||
Forfeited | ||||||||||||||||||||
Outstanding at end of period | $ | $ | $ | |||||||||||||||||
Performance Share Awards Based on Market Conditions
These awards have both an equity and liability component, with the right to receive up to the first 100 percent of the award in shares of common stock and the right to receive up to an additional 100 percent of the value of the award in excess of the equity component in cash. The equity portion of these awards is valued on the grant date and is not marked to market, while the liability portion of the awards is valued as of the end of each reporting period on a mark-to-market basis. The Company calculates the fair value of the equity and liability portions of the awards using a Monte Carlo simulation model.
TSR Performance Share Awards. The TSR Performance Share Awards granted are earned, or not earned, based on the comparative performance of the Company's common stock measured against a predetermined group of companies in the Company's peer group over a three-year performance period.
86
The following table is a summary of activity for the TSR Performance Share Awards:
_______________________________________________________________________________
Year Ended December 31, | ||||||||||||||||||||
2019 | 2018 | 2017 | ||||||||||||||||||
Shares | Weighted- Average Grant Date Fair Value per Share(1) | Shares | Weighted- Average Grant Date Fair Value per Share(1) | Shares | Weighted- Average Grant Date Fair Value per Share(1) | |||||||||||||||
Outstanding at beginning of period | $ | $ | $ | |||||||||||||||||
Granted | ||||||||||||||||||||
Issued and fully vested | ( | ) | ( | ) | ( | ) | ||||||||||||||
Forfeited | ( | ) | ||||||||||||||||||
Outstanding at end of period | $ | $ | $ | |||||||||||||||||
(1) | The grant date fair value figures in this table represent the fair value of the equity component of the performance share awards. |
The current portion of the liability, included in accrued liabilities in the Consolidated Balance Sheet at December 31, 2019 and 2018 was $6.1 million and $5.0 million, respectively. The non-current portion of the liability for the TSR Performance Share Awards, included in other liabilities in the Consolidated Balance Sheet at December 31, 2019 and 2018, was $4.1 million and $7.9 million, respectively. The Company made cash payments during the years ended December 31, 2019 and 2018 of $5.0 million and $3.3 million, respectively. There were no cash payments made during the year ended December 31, 2017.
Year Ended December 31, | |||||||||||
2019 | 2018 | 2017 | |||||||||
Fair value per performance share award granted during the period | $ | $ | $ | ||||||||
Assumptions | |||||||||||
Stock price volatility | % | % | % | ||||||||
Risk free rate of return | % | % | % | ||||||||
The following assumptions were used to determine the fair value of the liability component of the TSR Performance Share Awards for the respective periods:
December 31, | |||||
2019 | 2018 | 2017 | |||
Fair value per performance share award at the end of the period | $6.18 - $14.80 | $15.15 - $20.12 | $13.23 - $21.64 | ||
Assumptions | |||||
Stock price volatility | 29.8% - 30.4% | 29.9% - 31.1% | 29.1% - 36.7% | ||
Risk free rate of return | 1.6% | 2.5% - 2.6% | 1.8% - 1.9% | ||
The stock price volatility was calculated using historical closing stock price data for the Company for the period associated with the expected term through the grant date of each award. The risk free rate of return percentages are based on the continuously compounded equivalent of the U.S. Treasury within the expected term as measured on the grant date.
Other Information
Compensation expense recorded for both the equity and liability components of all performance share awards for the years ended December 31, 2019, 2018 and 2017 was $28.8 million, $30.6 million and $29.1 million, respectively. Total unamortized compensation expense related to the equity component of performance shares at December 31, 2019 was $27.2 million and will be recognized over the next 2.5 years.
As of December 31, 2019, the aggregate intrinsic value for all performance share awards was $58.9 million and was calculated by multiplying the closing market price of the Company's stock on December 31, 2019 by the number of unvested
87
performance share awards outstanding. As of December 31, 2019, the weighted average remaining contractual term of unvested performance share awards outstanding was approximately 1.1 years.
On December 31, 2019, the performance period ended for two types of performance share awards that were granted in 2017. For the Employee Performance Share Awards, the calculation of the three-year average of the three internal performance metrics was completed in the first quarter of 2020 and was certified by the Compensation Committee in February 2020. As the Company achieved the three performance metrics, 347,070 shares with a grant date fair value of $7.8 million were issued in February 2020. For the TSR Performance Share Awards, 409,380 shares with a grant date fair value of $8.1 million were issued in January 2020 based on the Company's ranking relative to a predetermined peer group. Cash payments associated with these awards in the amount of $6.1 million were also made in January 2020 due to the Company's ranking relative to the peer group. The calculation of the award payout was certified by the Compensation Committee on January 3, 2020.
Deferred Performance Shares
As of December 31, 2019, 495,774 shares of the Company's common stock representing vested performance share awards were deferred into the deferred compensation plan. During 2019, no shares were sold out of the plan. During 2019, a decrease to the deferred compensation liability of $2.4 million was recognized, which represents the decrease in the closing price of the Company's shares held in the trust during the period. The decrease in compensation expense was included in general and administrative expense in the Consolidated Statement of Operations.
15. Earnings per Common Share
Basic earnings per share (EPS) is computed by dividing net income by the weighted-average number of common shares outstanding for the period. Diluted EPS is similarly calculated except that the common shares outstanding for the period is increased using the treasury stock method to reflect the potential dilution that could occur if outstanding stock awards were vested or exercised at the end of the applicable period. Anti-dilutive shares represent potentially dilutive securities that are excluded from the computation of diluted income or loss per share as their impact would be anti-dilutive.
The following is a calculation of basic and diluted weighted-average shares outstanding:
Year Ended December 31, | |||||||||
(In thousands) | 2019 | 2018 | 2017 | ||||||
Weighted-average shares - basic | |||||||||
Dilution effect of stock awards at end of period | |||||||||
Weighted-average shares - diluted | |||||||||
The following is a calculation of weighted-average shares excluded from diluted EPS due to the anti-dilutive effect:
Year Ended December 31, | |||||||||
(In thousands) | 2019 | 2018 | 2017 | ||||||
Weighted-average stock awards excluded from diluted EPS due to the anti-dilutive effect calculated using the treasury stock method | |||||||||
88
16. Accumulated Other Comprehensive Income
(In thousands) | Postretirement Benefits | ||
Balance at December 31, 2016 | $ | ||
Other comprehensive income before reclassifications | |||
Amounts reclassified from accumulated other comprehensive loss | ( | ) | |
Net current-period other comprehensive income | |||
Balance at December 31, 2017 | $ | ||
Other comprehensive income before reclassifications | |||
Amounts reclassified from accumulated other comprehensive loss | ( | ) | |
Net current-period other comprehensive income | |||
Balance at December 31, 2018 | $ | ||
Other comprehensive income before reclassifications | ( | ) | |
Amounts reclassified from accumulated other comprehensive loss | ( | ) | |
Net current-period other comprehensive income | ( | ) | |
Balance at December 31, 2019 | $ | ||
Year Ended December 31, | Affected Line Item in the Consolidated Statement of Operations | ||||||||||||
(In thousands) | 2019 | 2018 | 2017 | ||||||||||
Postretirement benefits | |||||||||||||
Amortization of prior service cost | $ | $ | $ | General and administrative expense | |||||||||
Total before tax | Income before income taxes | ||||||||||||
Income tax expense | ( | ) | ( | ) | ( | ) | Income tax expense | ||||||
Cumulative effect of adoption of ASU 2018-02 reclassified to retained earnings | ( | ) | Retained earnings | ||||||||||
Total reclassifications for the period | $ | $ | $ | Net income | |||||||||
89
17. Additional Balance Sheet Information
December 31, | |||||||
(In thousands) | 2019 | 2018 | |||||
Accounts receivable, net | |||||||
Trade accounts | $ | $ | |||||
Other accounts | |||||||
Allowance for doubtful accounts | ( | ) | ( | ) | |||
$ | $ | ||||||
Other assets | |||||||
Deferred compensation plan | $ | $ | |||||
Debt issuance cost | |||||||
Income taxes receivable | |||||||
Operating lease right-of-use assets | — | ||||||
Other accounts | |||||||
$ | $ | ||||||
Accounts payable | |||||||
Trade accounts | $ | $ | |||||
Royalty and other owners | |||||||
Accrued transportation | |||||||
Accrued capital costs | |||||||
Taxes other than income | |||||||
Income taxes payable | |||||||
Other accounts | |||||||
$ | $ | ||||||
Accrued liabilities | |||||||
Employee benefits | $ | $ | |||||
Taxes other than income | |||||||
Operating lease liabilities | — | ||||||
Other accounts | |||||||
$ | $ | ||||||
Other liabilities | |||||||
Deferred compensation plan | $ | $ | |||||
Operating lease liabilities | — | ||||||
Other accounts | |||||||
$ | $ | ||||||
90
18. Supplemental Cash Flow Information
Year Ended December 31, | |||||||||||
(In thousands) | 2019 | 2018 | 2017 | ||||||||
Cash paid for interest and income taxes | |||||||||||
Interest | $ | $ | $ | ||||||||
Income taxes | |||||||||||
As of December 31, 2019, cash, cash equivalents and restricted cash included in the Consolidated Statement of Cash Flows includes cash and cash equivalents of $200.2 million and restricted cash of $13.6 million.
91
CABOT OIL & GAS CORPORATION
SUPPLEMENTAL OIL AND GAS INFORMATION (UNAUDITED)
Oil and Gas Reserves
Users of this information should be aware that the process of estimating quantities of "proved" and "proved developed" natural gas and crude oil reserves is very complex, requiring significant subjective decisions in the evaluation of all available geological, engineering and economic data for each reservoir. The data for a given reservoir may also change substantially over time as a result of numerous factors including, but not limited to, additional development activity, evolving production history and continual reassessment of the viability of production under varying economic conditions. As a result, revisions to existing reserve estimates may occur from time to time. Although every reasonable effort is made to ensure that reserve estimates reported represent the most accurate assessments possible, the subjective decisions and variances in available data for various reservoirs make these estimates generally less precise than other estimates included in the financial statement disclosures.
Estimates of total proved reserves at December 31, 2019, 2018 and 2017 were based on studies performed by the Company's petroleum engineering staff. The estimates were computed using the 12-month average index price for the respective commodity, calculated as the unweighted arithmetic average for the first day of the month price for each month during the respective year. The estimates were audited by Miller and Lents, Ltd. (Miller and Lents), who indicated that based on their investigation and subject to the limitations described in their audit letter, they believe the results of those estimates and projections were reasonable in the aggregate.
No major discovery or other favorable or unfavorable event after December 31, 2019, is believed to have caused a material change in the estimates of proved or proved developed reserves as of that date.
92
The following tables illustrate the Company's net proved reserves, including changes, and proved developed and proved undeveloped reserves for the periods indicated, as estimated by the Company's engineering staff. All reserves are located within the continental United States.
_______________________________________________________________________________
Natural Gas (Bcf) | Crude Oil & NGLs (Mbbl)(1) | Total (Bcfe)(2) | ||||||
December 31, 2016 | 8,281 | 49,172 | 8,576 | |||||
Revision of prior estimates(3) | 917 | 1,892 | 928 | |||||
Extensions, discoveries and other additions(4) | 1,138 | 16,329 | 1,236 | |||||
Production | (655 | ) | (4,953 | ) | (685 | ) | ||
Sales of reserves in place(5) | (328 | ) | (188 | ) | (329 | ) | ||
December 31, 2017 | 9,353 | 62,252 | 9,726 | |||||
Revision of prior estimates(6) | 776 | 677 | 780 | |||||
Extensions, discoveries and other additions(4) | 2,243 | — | 2,244 | |||||
Production | (730 | ) | (829 | ) | (735 | ) | ||
Sales of reserves in place(7) | (38 | ) | (61,980 | ) | (410 | ) | ||
December 31, 2018 | 11,604 | 120 | 11,605 | |||||
Revision of prior estimates(8) | 48 | (48 | ) | 47 | ||||
Extensions, discoveries and other additions(4) | 2,116 | — | 2,116 | |||||
Production | (865 | ) | — | (865 | ) | |||
Sales of reserves in place | — | (50 | ) | — | ||||
December 31, 2019 | 12,903 | 22 | 12,903 | |||||
Proved Developed Reserves | ||||||||
December 31, 2016 | 5,500 | 20,442 | 5,623 | |||||
December 31, 2017 | 6,001 | 31,066 | 6,187 | |||||
December 31, 2018 | 7,402 | 107 | 7,403 | |||||
December 31, 2019 | 8,056 | 22 | 8,056 | |||||
Proved Undeveloped Reserves | ||||||||
December 31, 2016 | 2,781 | 28,730 | 2,953 | |||||
December 31, 2017 | 3,352 | 31,186 | 3,539 | |||||
December 31, 2018 | 4,202 | 13 | 4,202 | |||||
December 31, 2019 | 4,847 | — | 4,847 | |||||
(1) | There were no significant NGL reserves for 2019 and 2018. For 2017, NGL reserves were less than one percent of the Company's total proved equivalent reserves 13.7 percent of the Company's proved crude oil and NGL reserves. |
(2) | Includes natural gas and natural gas equivalents determined by using the ratio of 6 Mcf of natural gas to 1 Bbl of crude oil, condensate or NGLs. |
(3) | The net upward revision of 928 Bcfe was primarily due to an upward revision of 863 Bcfe associated with positive drilling results in the Dimock field in northeast Pennsylvania and 103 Bcfe associated with higher commodity prices, partially offset by a downward revision of 38 Bcfe associated with PUD reclassifications. |
(4) | Extensions, discoveries and other additions were primarily related to drilling activity in the Dimock field located in northeast Pennsylvania. The Company added 2,116 Bcfe, 2,243 Bcfe and 1,129 Bcfe of proved reserves in this field in 2019, 2018 and 2017, respectively. |
(5) | Sales of reserves in place were primarily related to the divestiture of certain oil and gas properties in West Virginia, Virginia and Ohio in September 2017 which represented 322 Bcfe. |
(6) | The net upward revision of 780 Bcfe was primarily due to an upward revision of 1,123 Bcfe associated with positive drilling results in the Dimock field in northeast Pennsylvania, partially offset by a downward revision of 345 Bcfe associated with PUD reclassifications. |
93
(7) | Sales of reserves in place were primarily related to the divestiture of certain oil and gas properties in Eagle Ford Shale in February 2018 and the Haynesville Shale in July 2018 which represented 404 Bcfe and 6 Bcfe, respectively. |
(8) | The net upward revision of 47 Bcfe was primarily due to a net upward performance revision of 67 Bcfe, partially offset by a downward revision of 18 Bcfe associated with PUD reclassifications as a result of the five year limitation. The net upward performance revision of 67 Bcfe was primarily due to an upward revision of 417 Bcfe associated with our PUD reserves due to performance revisions and the drilling of longer lateral length wells, partially offset by a downward performance revision of 350 Bcfe related to certain proved developed producing properties. |
Capitalized Costs Relating to Oil and Gas Producing Activities
Capitalized costs relating to oil and gas producing activities and related accumulated depreciation, depletion and amortization were as follows:
December 31, | |||||||||||
(In thousands) | 2019 | 2018 | 2017 | ||||||||
Aggregate capitalized costs relating to oil and gas producing activities | $ | 6,676,122 | $ | 5,995,194 | $ | 7,472,653 | |||||
Aggregate accumulated depreciation, depletion and amortization | (2,861,014 | ) | (2,540,068 | ) | (3,630,855 | ) | |||||
Net capitalized costs | $ | 3,815,108 | $ | 3,455,126 | $ | 3,841,798 | |||||
Costs Incurred in Oil and Gas Property Acquisition, Exploration and Development Activities
Costs incurred in property acquisition, exploration and development activities were as follows:
Year Ended December 31, | |||||||||||
(In thousands) | 2019 | 2018 | 2017 | ||||||||
Property acquisition costs, proved | $ | — | $ | — | $ | — | |||||
Property acquisition costs, unproved | 6,072 | 29,851 | 102,265 | ||||||||
Exploration costs | 20,270 | 94,309 | 41,232 | ||||||||
Development costs | 761,326 | 778,574 | 617,500 | ||||||||
Total costs | $ | 787,668 | $ | 902,734 | $ | 760,997 | |||||
Standardized Measure of Discounted Future Net Cash Flows Relating to Proved Oil and Gas Reserves
The following information has been developed based on natural gas and crude oil reserve and production volumes estimated by the Company's engineering staff. It can be used for some comparisons, but should not be the only method used to evaluate the Company or its performance. Further, the information in the following table may not represent realistic assessments of future cash flows, nor should the Standardized Measure of Discounted Future Net Cash Flows (Standardized Measure) be viewed as representative of the current value of the Company.
The Company believes that the following factors should be taken into account when reviewing the following information:
• | Future costs and selling prices will differ from those required to be used in these calculations. |
• | Due to future market conditions and governmental regulations, actual rates of production in future years may vary significantly from the rate of production assumed in the calculations. |
• | Selection of a 10 percent discount rate is arbitrary and may not be a reasonable measure of the relative risk that is part of realizing future net oil and gas revenues. |
• | Future net revenues may be subject to different rates of income taxation. |
Under the Standardized Measure, future cash inflows were estimated by using the 12-month average index price for the respective commodity, calculated as the unweighted arithmetic average for the first day of the month price for each month during the year.
94
The average prices (adjusted for basis and quality differentials) related to proved reserves are as follows:
Year Ended December 31, | |||||||||||
2019 | 2018 | 2017 | |||||||||
Natural gas | $ | 2.35 | $ | 2.58 | $ | 2.33 | |||||
Crude oil | $ | 55.80 | $ | 65.21 | $ | 49.26 | |||||
NGLs | $ | — | $ | 21.64 | $ | 20.64 | |||||
In the above table, natural gas prices are stated per Mcf and crude oil and NGL prices are stated per barrel.
Future cash inflows were reduced by estimated future development and production costs based on year end costs to arrive at net cash flow before tax. Future income tax expense was computed by applying year end statutory tax rates to future pretax net cash flows, less the tax basis of the properties involved and utilization of available tax carryforwards related to oil and gas operations. The applicable accounting standards require the use of a 10 percent discount rate.
Management does not solely use the following information when making investment and operating decisions. These decisions are based on a number of factors, including estimates of proved reserves, and varying price and cost assumptions considered more representative of a range of anticipated economic conditions.
Standardized Measure is as follows:
_______________________________________________________________________________
Year Ended December 31, | |||||||||||
(In thousands) | 2019 | 2018 | 2017 | ||||||||
Future cash inflows | $ | 30,302,480 | $ | 29,904,474 | $ | 24,602,423 | |||||
Future production costs | (10,039,294 | ) | (8,702,734 | ) | (9,080,268 | ) | |||||
Future development costs(1) | (2,006,167 | ) | (1,766,796 | ) | (1,901,647 | ) | |||||
Future income tax expenses | (4,042,787 | ) | (4,166,089 | ) | (2,585,022 | ) | |||||
Future net cash flows | 14,214,232 | 15,268,855 | 11,035,486 | ||||||||
10% annual discount for estimated timing of cash flows | (8,353,115 | ) | (8,785,547 | ) | (6,025,040 | ) | |||||
Standardized measure of discounted future net cash flows | $ | 5,861,117 | $ | 6,483,308 | $ | 5,010,446 | |||||
(1) | Includes $212.9 million, $193.5 million and $396.7 million in plugging and abandonment costs for the years ended December 31, 2019, 2018 and 2017, respectively. |
Changes in Standardized Measure of Discounted Future Net Cash Flows Relating to Proved Oil and Gas Reserves
The following is an analysis of the changes in the Standardized Measure:
Year Ended December 31, | |||||||||||
(In thousands) | 2019 | 2018 | 2017 | ||||||||
Beginning of year | $ | 6,483,308 | $ | 5,010,446 | $ | 2,234,767 | |||||
Discoveries and extensions, net of related future costs | 1,075,839 | 1,280,499 | 729,429 | ||||||||
Net changes in prices and production costs | (1,510,104 | ) | 2,078,479 | 2,709,183 | |||||||
Accretion of discount | 813,480 | 596,569 | 261,504 | ||||||||
Revisions of previous quantity estimates | 28,310 | 586,494 | 538,318 | ||||||||
Timing and other | (192,563 | ) | (76,761 | ) | (71,407 | ) | |||||
Development costs incurred | 468,748 | 338,297 | 405,264 | ||||||||
Sales and transfers, net of production costs | (1,316,752 | ) | (1,343,872 | ) | (1,126,520 | ) | |||||
Sales of reserves in place | (1,350 | ) | (1,290,594 | ) | (95,128 | ) | |||||
Net change in income taxes | 12,201 | (696,249 | ) | (574,964 | ) | ||||||
End of year | $ | 5,861,117 | $ | 6,483,308 | $ | 5,010,446 | |||||
95
CABOT OIL & GAS CORPORATION
SELECTED DATA
QUARTERLY FINANCIAL INFORMATION (UNAUDITED)
(In thousands, except per share amounts) | First | Second | Third | Fourth | Total | ||||||||||||||
2019 | |||||||||||||||||||
Operating revenues | $ | 641,681 | $ | 534,117 | $ | 429,111 | $ | 461,368 | $ | 2,066,277 | |||||||||
Earnings on equity method investments (1) | 3,684 | 3,650 | 3,860 | 69,302 | 80,496 | ||||||||||||||
Operating income | 352,959 | 250,805 | 129,777 | 222,209 | 955,750 | ||||||||||||||
Net income | 262,763 | 181,009 | 90,358 | 146,940 | 681,070 | ||||||||||||||
Basic earnings per share | 0.62 | 0.43 | 0.22 | 0.36 | 1.64 | ||||||||||||||
Diluted earnings per share | 0.62 | 0.43 | 0.22 | 0.36 | 1.63 | ||||||||||||||
2018 | |||||||||||||||||||
Operating revenues | $ | 473,227 | $ | 453,447 | $ | 545,173 | $ | 716,301 | $ | 2,188,148 | |||||||||
Operating income | 177,044 | 78,029 | 176,051 | 340,677 | 771,801 | ||||||||||||||
Net income | 117,231 | 42,431 | 122,337 | 275,044 | 557,043 | ||||||||||||||
Basic earnings per share | 0.26 | 0.09 | 0.28 | 0.64 | 1.25 | ||||||||||||||
Diluted earnings per share | 0.25 | 0.09 | 0.28 | 0.63 | 1.24 | ||||||||||||||
(1) Earnings on equity method investments in the fourth quarter of 2019 includes a gain on sale of $75.8 million associated with the Company's sale of its equity investment in Meade.
ITEM 9. CHANGES IN AND DISAGREEMENTS WITH ACCOUNTANTS ON ACCOUNTING AND FINANCIAL DISCLOSURE
None.
ITEM 9A. CONTROLS AND PROCEDURES
Conclusion Regarding the Effectiveness of Disclosure Controls and Procedures and Changes in Internal Control over Financial Reporting
As of December 31, 2019, the Company carried out an evaluation, under the supervision and with the participation of the Company's management, including the Company's Chief Executive Officer and Chief Financial Officer, of the effectiveness of the design and operation of the Company's disclosure controls and procedures pursuant to Rules 13a-15 and 15d-15 of the Securities Exchange Act of 1934 (the Exchange Act). Based upon that evaluation, the Chief Executive Officer and Chief Financial Officer concluded that the Company's disclosure controls and procedures are effective, in all material respects, with respect to the recording, processing, summarizing and reporting, within the time periods specified in the SEC’s rules and forms, of information required to be disclosed by the Company in the reports that it files or submits under the Exchange Act.
There were no changes in internal control over financial reporting that occurred during the fourth quarter of 2019 that have materially affected, or are reasonably likely to have a material effect on, the Company's internal control over financial reporting.
Management's Report on Internal Control over Financial Reporting
The management of Cabot Oil & Gas Corporation is responsible for establishing and maintaining adequate internal control over financial reporting. Cabot Oil & Gas Corporation's internal control over financial reporting is a process designed to provide reasonable assurance regarding the reliability of financial reporting and the preparation of financial statements for external purposes in accordance with generally accepted accounting principles. Because of its inherent limitations, internal control over financial reporting may not prevent or detect misstatements. Also, projections of any evaluation of effectiveness to future periods are subject to the risk that controls may become inadequate because of changes in conditions, or that the degree of compliance with the policies or procedures may deteriorate.
Cabot Oil & Gas Corporation's management assessed the effectiveness of the Company's internal control over financial reporting as of December 31, 2019. In making this assessment, it used the criteria set forth by the Committee of Sponsoring
96
Organizations of the Treadway Commission (COSO) in Internal Control—Integrated Framework (2013). Based on this assessment management has concluded that, as of December 31, 2019, the Company's internal control over financial reporting is effective at a reasonable assurance level based on those criteria.
The effectiveness of Cabot Oil & Gas Corporation's internal control over financial reporting as of December 31, 2019, has been audited by PricewaterhouseCoopers LLP, an independent registered public accounting firm, as stated in their report which appears herein.
ITEM 9B. OTHER INFORMATION
None.
97
PART III
ITEM 10. DIRECTORS, EXECUTIVE OFFICERS AND CORPORATE GOVERNANCE
The information required by this Item is incorporated by reference to the Company's definitive Proxy Statement in connection with the 2020 annual stockholders' meeting. In addition, the information set forth under the caption "Business—Other Business Matters—Corporate Governance Matters" in Item 1 regarding our Code of Business Conduct is incorporated by reference in response to this Item.
ITEM 11. EXECUTIVE COMPENSATION
The information required by this Item is incorporated by reference to the Company's definitive Proxy Statement in connection with the 2020 annual stockholders' meeting.
ITEM 12. SECURITY OWNERSHIP OF CERTAIN BENEFICIAL OWNERS AND MANAGEMENT AND RELATED STOCKHOLDER MATTERS
The information required by this Item is incorporated by reference to the Company's definitive Proxy Statement in connection with the 2020 annual stockholders' meeting.
ITEM 13. CERTAIN RELATIONSHIPS AND RELATED TRANSACTIONS, AND DIRECTOR INDEPENDENCE
The information required by this Item is incorporated by reference to the Company's definitive Proxy Statement in connection with the 2020 annual stockholders' meeting.
ITEM 14. PRINCIPAL ACCOUNTANT FEES AND SERVICES
The information required by this Item is incorporated by reference to the Company's definitive Proxy Statement in connection with the 2020 annual stockholders' meeting.
98
PART IV
ITEM 15. EXHIBITS AND FINANCIAL STATEMENT SCHEDULES
A. INDEX
1. Consolidated Financial Statements
See Index on page 53.
2. Financial Statement Schedules
Financial statement schedules listed under SEC rules but not included in this report are omitted because they are not applicable or the required information is provided in the notes to our consolidated financial statements.
3. Exhibits
The following instruments are included as exhibits to this report. Those exhibits below incorporated by reference herein are indicated as such by the information supplied in the parenthetical thereafter. If no parenthetical appears after an exhibit, copies of the instrument have been included herewith. The Company's file number with the SEC is 1-10447.
Exhibit Number | Description |
99
10.11 | |
101.INS | XBRL Instance Document. The instance document does not appear in the Interactive Data File because its XBRL tags are embedded within the Inline XBRL document. |
101.SCH | XBRL Taxonomy Extension Schema Document. |
101.CAL | XBRL Taxonomy Extension Calculation Linkbase Document. |
101.LAB | XBRL Taxonomy Extension Label Linkbase Document. |
101.PRE | XBRL Taxonomy Extension Presentation Linkbase Document. |
101.DEF | XBRL Taxonomy Extension Definition Linkbase Document. |
104 | Cover Page Interactive Data File (formatted as Inline XBRL and contained in Exhibit 101). |
* | Compensatory plan, contract or arrangement. |
100
ITEM 16. FORM 10-K SUMMARY
The Company has elected not to include summary information.
101
SIGNATURES
Pursuant to the requirements of Section 13 and 15(d) of the Securities Exchange Act of 1934, the registrant has duly caused this report to be signed on its behalf by the undersigned, thereunto duly authorized, in the City of Houston, State of Texas, on the 25th of February 2020.
CABOT OIL & GAS CORPORATION | |||
By: | /s/ DAN O. DINGES | ||
Dan O. Dinges Chairman, President and Chief Executive Officer | |||
________________________________________________________________________________________________________________________
102
Pursuant to the requirements of the Securities Exchange Act of 1934, this report has been signed below by the following persons on behalf of the registrant and in the capacities and on the dates indicated.
Signature | Title | Date | ||
/s/ DAN O. DINGES | Chairman, President and Chief Executive Officer (Principal Executive Officer) | February 25, 2020 | ||
Dan O. Dinges | ||||
/s/ SCOTT C. SCHROEDER | Executive Vice President and Chief Financial Officer (Principal Financial Officer) | February 25, 2020 | ||
Scott C. Schroeder | ||||
/s/ TODD M. ROEMER | Vice President and Chief Accounting Officer (Principal Accounting Officer) | February 25, 2020 | ||
Todd M. Roemer | ||||
/s/ DOROTHY M. ABLES | Director | February 25, 2020 | ||
Dorothy M. Ables | ||||
/s/ RHYS J. BEST | Director | February 25, 2020 | ||
Rhys J. Best | ||||
/s/ ROBERT S. BOSWELL | Director | February 25, 2020 | ||
Robert S. Boswell | ||||
/s/ AMANDA M. BROCK | Director | February 25, 2020 | ||
Amanda M. Brock | ||||
/s/ PETER B. DELANEY | Director | February 25, 2020 | ||
Peter B. Delaney | ||||
/s/ ROBERT KELLEY | Director | February 25, 2020 | ||
Robert Kelley | ||||
/s/ W. MATT RALLS | Director | February 25, 2020 | ||
W. Matt Ralls | ||||
/s/ MARCUS A. WATTS | Director | February 25, 2020 | ||
Marcus A. Watts | ||||
103