UNITED STATES
SECURITIES AND EXCHANGE COMMISSION
Washington, D.C. 20549
FORM 10-K
(Mark One)
Commission File Number 001-34218
(Exact name of registrant as specified in its charter)
(State or other jurisdiction of incorporation or organization) | (I.R.S. Employer Identification No.) | |||
(508 ) 650-3000
(Address, including zip code, and telephone number, including area code, of principal executive offices) | ||||
Securities registered pursuant to Section 12(b) of the Act:
Title of Each Class | Trading Symbol(s) | Name of Exchange on Which Registered |
Securities registered pursuant to Section 12(g) of the Act: None
Indicate by check mark if the registrant is a well-known seasoned issuer, as defined in Rule 405 of the Securities Act.
☒ | No | ☐ | ||||||||||
Indicate by check mark if the registrant is not required to file reports pursuant to Section 13 or Section 15(d) of the Act.
Yes | ☐ | ☒ | ||||||||||
Indicate by check mark whether the registrant (1) has filed all reports required to be filed by Section 13 or 15(d) of the Securities Exchange Act of 1934 during the preceding 12 months (or for such shorter period that the registrant was required to file such reports), and (2) has been subject to such filing requirements for the past 90 days.
☒ | No | ☐ | ||||||||||
Indicate by check mark whether the registrant has submitted electronically every Interactive Data File required to be submitted pursuant to Rule 405 of Regulation S-T during the preceding 12 months (or for such shorter period that the registrant was required to submit such files).
☒ | No | ☐ | ||||||||||
Indicate by check mark whether the registrant is a large accelerated filer, an accelerated filer, a non-accelerated filer, a smaller reporting company, or emerging growth company. See the definitions of “large accelerated filer,” “accelerated filer,” “smaller reporting company” and "emerging growth company" in Rule 12b-2 of the Exchange Act. (Check one):
☒ | ☐ | Accelerated filer | ||
☐ | Non-accelerated filer | Smaller reporting company | ||
Emerging growth company | ||||
If an emerging growth company, indicate by check mark if the registrant has elected not to use the extended transition period for complying with any new or revised financial accounting standards provided pursuant to Section 13(a) of the Exchange Act. o
Indicate by check mark whether the registrant is a shell company (as defined in Rule 12b-2 of the Exchange Act).
Yes | No | ☒ | ||||||||||
Aggregate market value of voting stock held by non-affiliates of the registrant as of June 30, 2019: $7,800,874,313
Common stock, par value $.002 per share, outstanding as of January 26, 2020: 172,611,232 shares
DOCUMENTS INCORPORATED BY REFERENCE:
The registrant intends to file a Definitive Proxy Statement pursuant to Regulation 14A within 120 days of the end of the fiscal year ended December 31, 2019. Portions of such Proxy Statement are incorporated by reference in Part III of this report.
COGNEX CORPORATION
ANNUAL REPORT ON FORM 10-K
FOR THE YEAR ENDED DECEMBER 31, 2019
INDEX
ITEM 1. | ||
ITEM 1A. | ||
ITEM 1B. | ||
ITEM 2. | ||
ITEM 3. | ||
ITEM 4. | ||
ITEM 4A. | INFORMATION ABOUT OUR EXECUTIVE OFFICERS | |
ITEM 5. | ||
ITEM 6. | ||
ITEM 7. | ||
ITEM 7A. | ||
ITEM 8. | ||
ITEM 9. | ||
ITEM 9A. | ||
ITEM 9B. | ||
ITEM 10. | ||
ITEM 11. | ||
ITEM 12. | ||
ITEM 13. | ||
ITEM 14. | ||
ITEM 15. | ||
ITEM 16. | ||
PART I
This Annual Report on Form 10-K contains forward-looking statements within the meaning of the federal securities laws. Readers can identify these forward-looking statements by our use of the words “expects,” “anticipates,” “estimates,” “believes,” “projects,” “intends,” “plans,” “will,” “may,” “shall,” “could,” “should,” and similar words and other statements of a similar sense. Our future results may differ materially from current results and from those projected in the forward-looking statements as a result of known and unknown risks and uncertainties. Readers should pay particular attention to considerations described in the section captioned “Risk Factors,” appearing in Part I - Item 1A of this Annual Report on Form 10-K. We caution readers not to place undue reliance upon any such forward-looking statements, which speak only as of the date made. We disclaim any obligation to subsequently revise forward-looking statements to reflect the occurrence of anticipated or unanticipated events or circumstances after the date such statements are made.
Unless the context otherwise requires, the words “Cognex®,” the “Company,” “we,” “our,” “us,” and “our company” refer to Cognex Corporation and its consolidated subsidiaries.
ITEM 1: BUSINESS
Corporate Profile
Cognex Corporation was incorporated in Massachusetts in 1981. Our corporate headquarters are located at One Vision Drive, Natick, Massachusetts 01760 and our telephone number is (508) 650-3000.
Cognex is a leading worldwide provider of machine vision products that capture and analyze visual information in order to automate manufacturing and distribution tasks where vision is required. Machine vision is the technology that gives computers and automation equipment the ability to see. Machine vision products are used to automate the manufacture and tracking of discrete items, such as mobile phones, aspirin bottles, and automobile tires, by locating, identifying, inspecting, and measuring them during the manufacturing or distribution process. Machine vision is important for applications in which human vision is inadequate to meet requirements for size, accuracy, or speed, or in instances where substantial cost savings are obtained through the reduction of labor or improved product quality. Today, many types of manufacturing equipment require machine vision because of the increasing demands for speed and accuracy in manufacturing processes, as well as the decreasing size of items being manufactured.
What is Machine Vision?
Since the beginning of the Industrial Revolution, human vision has played an indispensable role in the process of manufacturing products. Human eyes did what no machines could do themselves: locating and positioning work, tracking the flow of parts, and inspecting output for quality and consistency. Today, however, the requirements of many manufacturing processes have surpassed the limits of human eyesight. Manufactured items often are produced too quickly or with tolerances too small to be analyzed by the human eye. In response to manufacturers’ needs, “machine vision” technology emerged, providing manufacturing equipment with the gift of sight. Machine vision systems were first widely embraced by manufacturers of electronic components who needed this technology to produce computer chips with decreasing geometries. However, advances in technology and ease-of-use, combined with the decreasing cost of implementing vision applications, have made machine vision available to a broader range of users.
1
Machine vision products combine cameras with innovative software to collect images and then answer questions about these images, such as:
Question | Description | Example | ||
GUIDANCE | ||||
Where is it? | Determining the exact physical location and orientation of an object. | Aligning a screen on a smartphone or guiding a robot to put a windshield on a car. | ||
IDENTIFICATION | ||||
What is it? | Identifying an object by analyzing its physical appearance or by reading a serial number or symbol. | Reading a two-dimensional barcode directly marked on an automotive airbag so that it can be tracked and processed correctly through manufacturing. | ||
INSPECTION | ||||
How good is it? | Inspecting an object for flaws or defects. | Checking for debris to ensure that foreign objects are not present in a product before shipping to consumers. | ||
GAUGING | ||||
What size is it? | Determining the dimensions of an object. | Using 3D vision to ensure the cap is secure on a bottle of detergent prior to packaging. | ||
Machine Vision Market
Cognex machine vision is primarily used to automate manufacturing and distribution processes in a variety of industries, where the technology is widely recognized as an important component of automated production and quality assurance. Virtually every manufacturer can achieve better quality and manufacturing efficiency by using machine vision, and therefore, Cognex products are used by a broad base of customers across a variety of industries, including consumer electronics, automotive, consumer products, food and beverage, pharmaceuticals, and medical devices. Cognex products are also used to automate distribution processes in the logistics industry for applications in retail distribution and ecommerce to scan, track, and sort goods through distribution centers.
The Company operates in one segment, machine vision technology. We offer a variety of machine vision products that have similar economic characteristics, have the same production processes, and are distributed by the same sales channels to the same types of customers. Information about segments may be found in Note 20 to the Consolidated Financial Statements, appearing in Part II - Item 8 of this Annual Report on Form 10-K.
In 2018 and 2017, direct and indirect revenue from Apple Inc. accounted for 15% and 20% of total revenue, respectively. In 2019, no customer accounted for greater than 10% of total revenue.
Business Strategy
Our goal is to expand our position as a leading worldwide provider of machine vision products for industrial customers. We are selective in choosing growth opportunities that we believe will maintain our historically high gross margin percentages, which have ranged in the mid 70s for the past several years and reflect the value our customers place on our innovative products. Our high gross margins have the potential to provide us with strong operating leverage in our financial model, as any incremental revenue at such margins is able to fall through to operating income at a high ratio. Our strong and unique corporate culture reinforces our values of customer first and innovation, and enables us to attract and retain smart, highly-educated, experienced talent who are motivated to solve the most challenging vision tasks.
We invest heavily in research and development in order to maintain our position as a technology leader in machine vision. We invest in technology that makes vision easier to use and more affordable, and therefore, available to a broader base of customers, such as our vision sensor products that enable customers with a lower budget to use machine vision without the help of sophisticated engineers. We also invest in technology that addresses the most challenging vision applications, such as our 3D vision products that solve applications where a height or volume measurement is required and our deep learning vision software that solves complex applications with unpredictable defects and deviations. We invest through internal development, as well as the acquisition of businesses and technologies. We believe that our acquisition of Sualab Co., Ltd. in the fourth quarter of 2019 will expand our deep learning technology to visual inspection tasks that replace human inspectors and make automated inspection tasks fast, easy, and cost-effective.
We continue to invest in our core markets, such as consumer electronics and automotive, where we are a leading provider of vision and ID products for factory automation, while making significant investments in the logistics market,
2
where we see opportunity to move beyond barcode reading into vision for applications in retail distribution and ecommerce.
We reach a broad base of customers through our worldwide direct sales force that sells to large, strategic customers, as well as through our network of distributors and integrators that sell primarily to smaller customers who may be more geographically remote and may require supplemental technical support or integration assistance. We invest in emerging, high-growth regions where many manufacturers can benefit from incorporating machine vision into their production processes. This includes investment in China, where rising wages for assembly workers and a greater focus on product quality are driving assembly automation, particularly in the consumer electronics industry.
Acquisitions
Our business strategy includes selective expansion into new machine vision applications and markets through the acquisition of businesses and technologies. In 2017 and 2016, we completed six small business acquisitions, which were not significant individually or in the aggregate. The purchase price for each business ranged from $2.5 million to $23 million. In addition to completed technology and customer relationships, these acquisitions included engineering talent expected to help accelerate the development of future products.
On October 16, 2019, Cognex acquired Sualab Co., Ltd. (Sualab), a provider of deep learning-based vision software for industrial image analysis based in Korea. The total consideration of $195 million included cash payments of $171 million upon closing and deferred payments of $24 million that may become payable on the fourth anniversary date of the closing, contingent upon continued employment of key talent. Sualab's intellectual property, engineering expertise, and market coverage are expected to increase the Company's existing deep learning capabilities. Combined with intellectual property acquired from ViDI Systems S.A. in 2017, we believe that Cognex is now a leading provider of deep learning-based industrial vision software.
Management considers business acquisitions to be an important part of our growth strategy, and although we continue to actively seek out acquisition opportunities, we are selective in choosing businesses that we believe will enhance our long-term growth rate and profitability, as well as fit within our corporate culture. We plan to continue to seek opportunities to expand our product lines, customer base, distribution network, and technical talent through acquisitions in the machine vision industry.
Products
Cognex offers a full range of machine vision systems and sensors, vision software, and industrial image-based barcode readers designed to meet customer needs at different performance and price points. Our products range from low-cost vision sensors that conduct simple presence/absence inspections, to deep learning vision software that solves complex applications with unpredictable defects and deviations. Our products also have a variety of physical forms, depending upon the user's needs. For example, customers can purchase vision software to use with their own camera and processor, or they can purchase a standalone unit that combines camera, processor, and software into a single package.
Vision Systems and Sensors
Vision systems combine camera, processor, and vision software into a single, rugged package with a simple and flexible user interface for configuring applications. General-purpose vision systems are designed to be easily programmed to perform a wide range of vision tasks including part location, identification, measurement, assembly verification, and robotic guidance. Unlike general-purpose vision systems, vision sensors deliver an easy-to-use, low-cost, reliable solution for simple pass/fail vision applications, such as checking the presence and size of parts. Cognex offers the In-Sight® product line of vision systems and sensors in a wide range of models to meet various price and performance requirements. Cognex also offers a series of 3D vision systems for use in highly demanding applications that require surface feature measurements that go beyond the capabilities of 2D vision technology.
Vision Software
Vision software provides users with the most flexibility by combining the full general-purpose library of Cognex vision tools with the cameras, frame grabbers, and peripheral equipment of their choice. Applications based upon Cognex vision software perform a wide range of vision tasks, including part location, identification, measurement, assembly verification, and robotic guidance. Cognex VisionPro® software offers an extensive suite of patented vision tools for advanced programming, while Cognex Designer allows customers to build complete vision applications with the simplicity of a graphical, flowchart-based programming environment. Cognex deep learning vision software solves difficult applications that are too complicated and time-consuming to program and maintain with traditional machine vision rule-based algorithms.
3
Industrial Image-Based Barcode Readers
Cognex barcode readers quickly and reliably read codes (e.g., one-dimensional barcodes or two-dimensional data matrix codes) that have been applied to, or directly marked on, discrete items during the manufacturing process. Manufacturers of goods ranging from automotive parts, pharmaceutical items, aircraft components, and medical devices are increasingly using direct part mark (DPM) identification to ensure that the appropriate manufacturing processes are performed in the correct sequence and on the right parts. In addition, DPM is used to track parts throughout the product lifecycle, and is also used in supply chain management and repair.
Cognex bardcode readers are also used outside of the manufacturing sector to automate distribution processes in the logistics industry for applications in retail distribution and ecommerce to scan, track, and sort goods through distribution centers, and in airports to read baggage tags. Cognex offers the DataMan® product line of image-based barcode readers, which includes both hand-held and fixed-mount models, and barcode verifiers, as well as the MX Series of vision-enabled mobile terminals that allow customers to leverage the latest mobile device technology for industrial barcode reading applications.
Research, Development, and Engineering
Cognex engages in research, development, and engineering (RD&E) to enhance our existing products and to develop new products and functionality to address market opportunities. In addition to internal research and development efforts, we intend to continue our strategy of gaining access to new technology through strategic relationships and acquisitions where appropriate.
As of December 31, 2019, Cognex employed 563 professionals in RD&E, many of whom are software developers. Cognex’s RD&E expenses totaled $119,427,000 in 2019, $116,445,000 in 2018, and $99,205,000 in 2017, or approximately 16%, 14%, and 13% of revenue, respectively. We believe that a continued commitment to RD&E activities is essential in order to maintain or achieve product leadership with our existing products and to provide innovative new product offerings, as well as to provide engineering support for large customers. In addition, we consider our ability to accelerate time to market for new products to be critical to our revenue growth. Therefore, we expect to continue to make significant RD&E investments in the future. At any point in time, we have numerous research and development projects underway.
Manufacturing and Order Fulfillment
Cognex’s products are manufactured utilizing a turnkey operation whereby the majority of component procurement, system assembly, and initial testing are performed by third-party contract manufacturers. Cognex’s primary contract manufacturer is located in Indonesia. The contract manufacturers use specified components sourced from a vendor list approved by Cognex and assembly/test documentation created and controlled by Cognex. Certain components are presently sourced from a single vendor that is selected based upon price and performance considerations. In the event of a supply disruption from a single-source vendor, these components may be purchased from alternative vendors.
After the completion of initial testing, a fully assembled product from the contract manufacturers is routed to our facility in Cork, Ireland or Natick, Massachusetts, USA, where trained Cognex personnel load Cognex software onto the product and perform quality control procedures. Finished product for customers in the Americas is then shipped from our Natick, Massachusetts facility, while finished product for customers outside of the Americas is shipped from our Cork, Ireland facility.
Sales Channels and Support Services
Cognex sells its products through a worldwide direct sales force that focuses on the development of strategic accounts that generate or are expected to generate significant sales volume, as well as through a global network of distribution and integration partners. Our distribution partners provide sales and local support to help Cognex reach the many prospects for our products in factories around the world, and our integration partners are experts in vision and complementary technologies that can provide turnkey solutions for complex automation projects using vision.
As of December 31, 2019, Cognex’s sales force consisted of 980 professionals, and our partner network consisted of 425 authorized distributors and active integrators. Sales engineers call directly on targeted accounts, with the assistance of application engineers, and manage the activities of our distribution and integration partners within their territories in order to provide an advantageous sales model for our products. Cognex has sales and support personnel located throughout the Americas, Europe, and Asia. The majority of our sales engineers are degreed engineers.
Sales to customers based outside of the United States represented approximately 66% of total revenue in 2019 compared to approximately 71% of total revenue in 2018. In 2019, approximately 31% of our total revenue came from customers based in Europe, 16% from customers based in Greater China, 5% from customers based in Japan, and 14% from customers based in other regions outside the United States. Sales to customers based in Europe are
4
denominated in Euros and U.S. Dollars, sales to customers based in Greater China are denominated in Yuan for sales within Mainland China and U.S. Dollars in other territories, sales to customers based in Japan are denominated in Yen, and sales to customers based in other regions are denominated in U.S. Dollars. Financial information about geographic areas may be found in Note 20 to the Consolidated Financial Statements, appearing in Part II - Item 8 of this Annual Report on Form 10-K.
Cognex’s service offerings represent less than 10% of our total revenue and include maintenance and support, consulting, and training services. Maintenance and support programs include hardware support programs that entitle customers to have failed products repaired, as well as software support programs that provide customers with application support and software updates to the latest software releases. Application support is provided by technical support personnel located at Cognex regional offices, as well as by field service engineers that provide support at the customer’s production site. We provide consulting services that range from a specific area of functionality to a completely integrated vision application or installed ID application. Training services include a variety of product courses that are available at our offices worldwide, at customer facilities, and online at www.cognex.com.
Intellectual Property
We rely on the technical expertise, creativity, and knowledge of our personnel, and therefore, we utilize patent, trademark, copyright, and trade secret protection to maintain our competitive position and protect our proprietary rights in our products and technology. While our intellectual property rights are important to our success, we believe that our business as a whole is not materially dependent on any particular patent, trademark, copyright, or other intellectual property right.
As of December 31, 2019, Cognex owned 686 patents issued worldwide and had another 514 patent applications pending worldwide. Cognex has used, registered, or applied to register a number of trademark registrations in the United States and in other countries. Cognex’s trademark and servicemark portfolio includes various registered marks, including, among others, Cognex®, In-Sight®, VisionPro®, and DataMan®, as well as many common-law marks.
Compliance with Environmental Provisions
Cognex’s capital expenditures, earnings, and competitive position are not materially affected by compliance with federal, state, and local environmental provisions which have been enacted or adopted to regulate the distribution of materials into the environment.
Competition
The machine vision market is highly fragmented and competitive. Our competitors include other vendors of machine vision systems, controllers, and components; manufacturers of image processing systems, sensors, and components; and system integrators. In addition, in the semiconductor and electronics capital equipment market, and with machine builders in the factory automation market, we compete with the internal engineering departments of current or prospective customers. In the identification and logistics markets, we compete with manufacturers of automatic identification systems. In the deep learning market, we compete with other industrially-focused machine vision companies, deep learning software companies, and engineering teams that use open source tools to solve applications. Key competitors in geographies worldwide include Keyence Corporation, Sick AG, Datalogic, and Omron Corporation. Any of these competitors may have greater financial and other resources than Cognex. Although we consider Cognex to be one of the leading machine vision companies in the world, reliable estimates of the machine vision market and the number and relative size of competitors are not readily available.
Cognex’s ability to compete depends upon our ability to design, manufacture, and sell high-quality products, as well as our ability to develop new products and functionality that meet evolving customer requirements. The primary competitive factors affecting the choice of a machine vision or identification system include vendor reputation, product functionality and performance, ease of use, price, and post-sales support. The importance of each of these factors varies depending upon the specific customer’s needs.
Backlog
As of December 31, 2019, backlog, which includes deferred revenue, totaled $74,857,000, compared to $65,408,000 as of December 31, 2018. Backlog reflects customer purchase orders for products scheduled for shipment primarily within 120 days for customers in the logistics industry and primarily within 60 days for customers in all other industries. The level of backlog at any particular date is not necessarily indicative of future revenue. Delivery schedules may be extended and orders may be canceled at any time subject to certain cancellation penalties.
5
Employees
As of December 31, 2019, Cognex employed 2,267 persons, including 1,295 in sales, marketing, and service activities; 563 in research, development, and engineering; 193 in manufacturing and quality assurance; and 216 in information technology, finance, and administration. Of our 2,267 employees, 1,349 are based outside of the United States. We have not experienced any work stoppages due to labor disputes. We believe that our employee relations are good.
Available Information
Cognex maintains a website on the World Wide Web at www.cognex.com. We make available, free of charge, on our website in the “Company” section under the caption “Investor Information” followed by “Financial Information” and then “SEC FiIings,” our Annual Report on Form 10-K, Quarterly Reports on Form 10-Q, and Current Reports on Form 8-K, including exhibits, and amendments to those reports filed or furnished pursuant to Section 13(a) or 15(d) of the Securities Exchange Act of 1934, as amended, as soon as reasonably practicable after such reports are electronically filed with, or furnished to, the SEC. Cognex’s reports filed with, or furnished to, the SEC are also available at the SEC’s website at www.sec.gov. Information contained on our website is not a part of, or incorporated by reference into, this Annual Report on Form 10-K.
ITEM 1A: RISK FACTORS
The risks and uncertainties described below are not the only ones that we face. Additional risks and uncertainties that we are unaware of, or that we currently deem immaterial, also may become important factors that affect our company in the future. If any of these risks were to occur, our business, financial condition, or results of operations could be materially and adversely affected. This section includes or refers to certain forward-looking statements. We refer you to the explanation of the qualifications and limitations on such forward-looking statements, appearing under the heading "Forward-Looking Statements" in Part II - Item 7 of this Annual Report on Form 10-K.
Global economic conditions may continue to deteriorate and further negatively impact our operating results.
Our revenue levels are impacted by global economic conditions, as we have a significant business presence in many countries throughout the world. Our revenue declined 10% in 2019 from the prior year, as industrial companies delayed and reduced spending for automation projects, including those with machine vision, amid weaker general manufacturing confidence and heightened uncertainty around global trade. As of the date of this report, these conditions persist and we have limited visibility beyond the current quarter as to the impact on our 2020 operating results. If global economic conditions were to continue to deteriorate, our revenue and our ability to generate operating profits could be further materially adversely affected.
As a result of global economic conditions, our business is subject to the following risks, among others:
• | our customers may not have sufficient cash flow or access to financing to purchase our products, |
• | our customers may not pay us within agreed upon terms or may default on their payments altogether, |
• | our vendors may be unable to fulfill their delivery obligations to us in a timely manner, |
• | lower demand for our products may result in charges for excess and obsolete inventory if we are unable to sell inventory that is either already on hand or committed to purchase, |
• | lower cash flows may result in impairment charges for acquired intangible assets or goodwill, |
• | a decline in our stock price may make stock-based awards a less attractive form of compensation and a less effective form of retention for our employees, and |
• | the trading price of our common stock may be volatile. |
As of December 31, 2019, the Company had $845 million in cash and investments. In addition, Cognex has no long-term debt and we do not anticipate needing debt financing in the near future. We believe that our strong cash position puts us in a relatively good position to weather economic downturns. Nevertheless, our operating results have been materially adversely affected in 2019, and could continue to be materially adversely affected in the future, as a result of unfavorable economic conditions and reduced capital spending by manufacturers worldwide.
The loss of, or significant curtailment of purchases by, a large customer could continue to have an adverse effect on our business.
Revenue from a single customer accounted for 15% and 20% of total revenue in 2018 and 2017, respectively, but less than 10% of total revenue in 2019. The curtailment of purchases by this customer represented a significant portion of our total revenue decrease in 2019 from the prior year. Although no customer accounted for greater than 10% of
6
our total revenue in 2019, we continue to have relatively larger customers, particularly in the consumer electronics and logistics industries. In some cases, end customers of our resellers may be large consumers of our products. Large customers may divert management’s attention from other operational matters and pull resources from other areas of the business, resulting in potential loss of revenue from other customers. In addition, large customers may receive preferred pricing and a higher level of support, which may lower our gross margin percentage. Furthermore, we typically extend credit terms to large customers, resulting in significant accounts receivable balances, and in certain instances due to long supplier lead times, we may purchase inventory in advance of receipt of a customer purchase order, which exposes us to an increased risk of excess or obsolete inventory and resulting charges. The loss of, or further curtailment of purchases by, any one or more of our larger customers could have a material adverse effect on our operating results.
A continued downturn in the consumer electronics or automotive industries may further adversely affect our business.
In 2019, consumer electronics and automotive, our two largest markets that combined represented approximately half of our total revenue, both contracted simultaneously. Our business is impacted by the level of capital spending in these industries, as well as the product design cycles of our major customers in these industries. The market leaders in these industries are able to exert purchasing power over their vendors' supply chains, and our large customers in these industries may decide to purchase fewer products from Cognex or stop purchasing from Cognex altogether. As a result, our operating results could continue to be materially and adversely affected by further declining sales in these industries.
Our inability to achieve growth in revenue and profits from our logistics business may negatively impact our operating results.
We are pursuing applications to automate distribution processes in the logistics industry for applications including retail distribution and ecommerce to scan, track, and sort goods through distribution centers. Our future growth plans are dependent upon growth in this industry. Our gross margin percentage in this industry is currently lower than our average gross margin percentage, as certain sales in this industry are for application-specific customer solutions that include deployment services. Our strategy is to shift our focus as the logistics market matures from Cognex providing deployment services to utilizing partner integrators to provide these services for end users, which we believe will result in improved gross margins that will be more in line with our overall average over time. In addition, we are making significant investments in engineering and sales to further develop our logistics sales. Failure to generate revenue in this industry in the amounts anticipated may have a material adverse impact on our revenue growth and operating results.
Economic, political, and other risks associated with international sales and operations could continue to adversely affect our business and operating results.
In 2019, approximately 66% of our revenue was derived from customers located outside of the United States. We anticipate that international sales will continue to account for a significant portion of our revenue. In addition, we source components from suppliers located outside of the United States, including China, and utilize third-party contract manufacturers, primarily located in Indonesia, to assemble certain of our products. We intend to continue to expand our sales and operations outside of the United States and expand our presence in international emerging markets. As a result, our business is subject to the risks inherent in international sales and operations, including, among other things:
• | various regulatory and statutory requirements, |
• | difficulties in injecting and repatriating cash, |
• | export and import restrictions, |
• | trade tariffs, |
• | transportation delays, |
• | employment regulations and local labor conditions, |
• | difficulties in staffing and managing foreign sales operations, |
• | instability in economic or political conditions, including potential adverse effects from Brexit, |
• | public health epidemics, such as the coronavirus currently impacting China and elsewhere, |
• | difficulties protecting intellectual property, |
• | business systems connectivity issues, and |
7
• | potentially adverse tax consequences. |
Any of these factors could have a material adverse effect on our operating results. In 2019, trade tariffs imposed by the United States on certain components imported from Chinese suppliers resulted in higher costs for our products. To date, these cost increases have been immaterial to our total cost of goods sold and primarily relate to components sourced in China for new products that we build in the United States in their infancy before they are moved to our contract manufacturer in Indonesia; however, cost increases as a result of trade tariffs could become material in the future.
Trade tariffs have also had an indirect impact on the economic climate in China, which in turn, has had a negative impact on the Company's revenue from customers based in China. Further escalations of trade conflicts between the United States and China, or other countries where Cognex has operations, such as countries in Europe, may have a further adverse effect on our revenue. In addition to trade tariffs, United States export controls that place restrictions on the exportation of our products or a subset of our products, including, without limitation, any applicable regulations promulgated by the U.S. Commerce Department’s Bureau of Industry and Security, have had a negative impact on our revenue from customers based in China. To date, the impact of these restrictions has been immaterial to our total revenue; however, further or continued restrictions could have a material adverse effect on our operating results in the future.
In addition, the coronavirus outbreak originating from China at the beginning of 2020 has resulted in extended shutdown of certain businesses in the region and disruptions to the supply chain. Health concerns in China or other countries in which we or our customers operate could result in social, economic, and labor instability. These uncertainties could have a material adverse effect on the continuity of our business and our results of operation and financial condition.
Finally, we are subject to applicable anti-corruption laws, such as the U.S. Foreign Corrupt Practices Act and the U.K. Bribery Act, and similar anti-corruption and anti-kickback laws in the jurisdictions in which we operate. These laws generally prohibit offering, promising, giving, or authorizing others to provide anything of value, either directly or indirectly, to a government official or private party in order to influence official action or otherwise gain an unfair business advantage, such as to obtain or retain business. Particularly as a result of our global operations, including in developing countries, and our growing international sales force, our relationships with our customers and resellers could expose us to liability under these laws. Violations of anti-corruption laws may result in severe civil and criminal penalties for noncompliance. Even an unsuccessful challenge or investigation into our practices is costly to defend, and could cause adverse publicity, and thus could have a material adverse effect on our business, financial condition, or operating results.
Fluctuations in foreign currency exchange rates and the use of derivative instruments to hedge these exposures could adversely affect our reported results, liquidity, and competitive position.
We face exposure to foreign currency exchange rate fluctuations, as a significant portion of our revenues, expenses, assets, and liabilities are denominated in currencies other than the functional currencies of our subsidiaries or the reporting currency of our company, which is the U.S. Dollar. In certain instances, we utilize forward contracts to hedge against foreign currency fluctuations. These contracts are used to minimize foreign currency gains or losses, as the gains or losses on the derivative are intended to offset the losses or gains on the underlying exposure. We do not engage in foreign currency speculation. If the counterparty to any of our hedging arrangements experiences financial difficulties, or is otherwise unable to honor the terms of the contract, we may experience material losses.
Our foreign currency hedging program may include foreign currency cash flow hedges that protect our budgeted revenues and expenses against foreign currency exchange rate changes compared to our budgeted rates. These derivatives are designated for hedge accounting, and therefore, the effective portion of the forward contract's gain or loss is reported in shareholders' equity as other comprehensive income (loss) and is reclassified into current operations as the hedged transaction impacts current operations. Should these hedges fail to qualify for hedge accounting or be ineffective, the gain or loss on the forward contract would be reported in current operations immediately as opposed to when the hedged transaction impacts current operations, which may result in material foreign currency gains or losses.
The success of our foreign currency risk management program depends upon forecasts of transaction activity denominated in various currencies. To the extent that these forecasts are overstated or understated during periods of currency volatility, we could experience unanticipated foreign currency gains or losses that could have a material impact on our results of operations. In addition, our failure to identify new exposures and hedge them in an effective manner may result in material foreign currency gains or losses. Furthermore, our ability to hedge the Chinese Yuan is limited, which has resulted in unhedged exposures. To date, foreign currency gains and losses related to the Chinese Yuan have been immaterial to our total results; however, further fluctuations in this currency may result in material foreign currency gains or losses in the future.
8
A significant portion of our revenues and expenses are denominated in the Euro, the Chinese Yuan, and the Japanese Yen. Our predominant currency of sale is the U.S. Dollar in the Americas, the Euro and U.S. Dollar in Europe, the Yuan in Mainland China, the Yen in Japan, and the U.S. Dollar in other regions. We estimate that approximately 44% of our sales in 2019 were invoiced in currencies other than the U.S. Dollar, and we expect sales denominated in foreign currencies to continue to represent a significant portion of our total revenue. While we also have expenses denominated in these same foreign currencies, the impact on revenues has historically been, and is expected to continue to be, greater than the offsetting impact on expenses. Therefore, in times when the U.S. Dollar strengthens in relation to these foreign currencies, we would expect to report a net decrease in operating income. Conversely, in times when the U.S. Dollar weakens in relation to these foreign currencies, we would expect to report a net increase in operating income. Thus, changes in the relative strength of the U.S. Dollar may have a material impact on our operating results.
Information security breaches or business system disruptions may adversely affect our business.
We rely on our information technology infrastructure and management information systems to effectively run our business. We may be subject to information security breaches caused by hacking, malicious software, or acts of vandalism or terrorism. Our security measures or those of our third-party service providers may not detect or prevent such breaches. Any such compromise to our information security could result in theft of our intellectual property, including software source code, a misappropriation of our cash or other assets, an interruption in our operations, the unauthorized publication of our confidential business or proprietary information, the unauthorized release of customer, vendor, or employee data, the violation of privacy or other laws, and the exposure to litigation or regulatory penalties, any of which could harm our business and operating results. We have experienced cybersecurity incidents in the past that have included malware, viruses, phishing attacks, and intrusion attempts to Cognex’s internet-facing systems. To date, these incidents have not had a material impact on our operations or financial results; however, future cybersecurity incidents could have a material adverse effect on our business, financial condition, or operating results.
In 2018, we placed into service a new Enterprise Resource Planning (ERP) system, which is the management information system that integrates our manufacturing, order fulfillment, and financial activities. Disruptions with our management information systems may cause significant business disruption, including our ability to process orders, ship products, invoice customers, process payments, and otherwise run our business. Any disruption occurring with our ERP system, or any of our other management information systems, may have a material adverse effect on our operating results.
Our business could suffer if we lose the services of, or fail to attract, key personnel.
We are highly dependent upon the management and leadership of Robert J. Shillman, our Chairman of the Board of Directors and Chief Culture Officer, and Robert J. Willett, our President and Chief Executive Officer, as well as other members of our senior management team. Although we have many experienced and qualified senior managers, the loss of key personnel could have a material adverse effect on our company.
We have historically used stock options as a key component of our employee compensation program in order to align employee interests with the interests of our shareholders, provide competitive compensation packages, and encourage employee retention. While we currently intend to continue to grant stock options as a key component of our compensation program for our senior management team, we are shifting away from granting stock options to granting restricted stock units (RSUs) as a retention tool for key employees below the senior management level. Our stock price volatility may cause periods of time during which option exercise prices might be less than the sale price of our common stock, which may lessen such options' retentive attributes, and therefore, we believe that RSUs may be a more effective retention tool for employees below the senior management level. We are limited as to the number of stock options and RSUs that we may grant under our stock plans, and we are unsure how effective different stock-based awards with different vesting schedules will be to retain key talent. Accordingly, we may find it difficult to attract, retain, and motivate employees, and any such difficulties could materially adversely affect our business.
If we fail to effectively manage our growth, our business and operating results could suffer.
To help support our growth plans, our headcount increased from 2,114 employees as of December 31, 2018 to 2,267 employees as of December 31, 2019, with 90 employees added as a result of the acquisition of Sualab Co., Ltd. in the fourth quarter of 2019. Although the remaining additions represent a net headcount increase of 63 persons, the number of new employees that we hired and trained was higher due to workforce attrition. In addition, we currently utilize a large number of third-party contractors to provide on-site technical support and installation services.
To support our growth and execute on our operating plans and strategic initiatives, we must effectively attract, train, develop, motivate, and retain skilled employees, while maintaining our unique corporate culture. We believe our strong corporate culture is critical to our ability to collaborate, innovate, execute, and adapt in a high-growth, fast-changing business environment. We may not be able to hire and train new employees and contractors quickly enough to meet
9
our business needs. If we fail to quickly adapt our hiring and training plans to our business levels or effectively execute on our hiring plans, our efficiency and ability to meet our operating goals could suffer. Furthermore, employee productivity, morale, and retention could suffer, which may have a material adverse effect on our business and operating results.
Additionally, the growth and expansion of our business and product offerings place significant demand on our employees and, in particular, our management team. The growth of our business may require significant additional resources to meet these daily requirements, which may not scale in a cost-effective manner or may negatively impact our customers’ experience. Effective management information systems, including our Enterprise Resource Planning (ERP) system placed into service in 2018, and strong internal controls are also necessary to support our growth. If we are unable to manage the growth of our organization and business effectively, our operating results may be materially and adversely affected.
The failure of a key supplier to deliver quality product in a timely manner or our inability to obtain components for our products could adversely affect our operating results.
A significant portion of our product is manufactured by a third-party contractor located in Indonesia. This contractor has agreed to provide Cognex with termination notification periods and last-time-buy rights, if and when that may be applicable. We rely upon this contractor to provide quality product and meet delivery schedules. We engage in extensive product quality programs and processes, including actively monitoring the performance of our third-party manufacturers; however, we may not detect all product quality issues through these programs and processes.
Certain components are presently sourced from a single vendor that is selected based upon price and performance considerations. In the event of a supply disruption from a single-source vendor, these components may be purchased from alternative vendors, which may result in manufacturing delays based on the lead time of the new vendor. Certain key electronic and mechanical components that are purchased from strategic suppliers, such as processors or imagers, are fundamental to the design of Cognex products. A disruption in the supply of these key components, such as a last-time-buy announcement, natural disaster, financial bankruptcy, or other event, may require us to purchase a significant amount of inventory at unfavorable prices resulting in lower gross margins and higher risk of carrying excess inventory.
We are subject to the requirements of the Dodd-Frank Wall Street Reform and Consumer Protection Act that obligates companies to inquire into the origin of conflict minerals in their supply chains. We work with our supply chain partners to take reasonable steps to assure conflict minerals are not sourced by Cognex or our supply chain partners. These steps may include purchasing supply from alternative vendors. If we are unable to secure adequate supply from alternative vendors, we may have to redesign our products, which may lead to a delay in manufacturing and a possible loss of sales. Although we are taking certain actions to mitigate supply risk, an interruption in, termination of, or material change in the purchase terms of any key components could have a material adverse effect on our operating results.
Our failure to effectively manage product transitions or accurately forecast customer demand could result in excess or obsolete inventory and resulting charges.
Because the market for our products is characterized by rapid technological changes, we frequently introduce new products with improved ease-of-use, improved hardware performance, additional software features and functionality, or lower cost that may replace existing products. Among the risks associated with the introduction of new products are difficulty predicting customer demand and effectively managing inventory levels to ensure adequate supply of the new product and avoid excess supply of the legacy product.
We may strategically enter into non-cancelable commitments with vendors to purchase materials for our products in advance of demand to take advantage of favorable pricing, address concerns about the availability of future supplies, or build safety stock to help ensure customer shipments are not delayed should we experience higher than anticipated demand for materials with long lead times. These measures to purchase inventory may expose us to an increased risk of excess or obsolete inventory and resulting charges if actual demand is lower than anticipated. Our failure to effectively manage product transitions or accurately forecast customer demand, in terms of both volume and configuration, has led to, and may again in the future lead to, an increased risk of excess or obsolete inventory and resulting charges.
10
Our products may contain design or manufacturing defects, which could result in reduced demand, significant delays, or substantial costs.
If flaws in either the design or manufacture of our products were to occur, we could experience a rate of failure in our products that could result in significant delays in shipment and material repair or replacement costs. Our release-to-market process may not be robust enough to detect significant design flaws or software bugs. While we engage in product quality programs and processes, including actively monitoring and evaluating the quality of our component suppliers and contract manufacturers, these actions may not be sufficient to avoid a product failure rate that results in:
• | substantial delays in shipment, |
• | significant repair or replacement costs, |
• | product liability claims or lawsuits, particularly in connection with life sciences customers or other high-risk end-user industries, or |
• | potential damage to our reputation. |
Any of these results could have a material adverse effect on our operating results.
Our failure to introduce new products in a successful and timely manner could result in the loss of our market share and a decrease in our revenues and profits.
The market for our products is characterized by rapidly changing technology. Accordingly, we believe that our future success will depend upon our ability to accelerate time-to-market for new products with improved functionality, ease-of-use, performance, or price. There can be no assurance that we will be able to introduce new products in accordance with scheduled release dates or that new products will achieve market acceptance. Our inability to keep pace with the rapid rate of technological change in the high-technology marketplace could have a material adverse effect on our operating results.
Product development is often a complex, time-consuming, and costly process involving significant investment in research and development with no assurance of return on investment. Our strong balance sheet allows us to continue to make significant investments in research, development, and marketing for new products and technologies. Research is by its nature speculative and the ultimate commercial success of a product depends upon various factors, many of which are not under our control. We may not achieve significant revenue from new product investments for a number of years, if at all. Moreover, new products, if introduced, may not generate the gross margins that we have experienced historically.
Our failure to properly manage the distribution of our products and services could result in the loss of revenues and profits.
We utilize a direct sales force, as well as a network of distribution and integration partners, to sell our products and services. Successfully managing the interaction of our direct and indirect sales channels to reach various potential customers for our products and services is a complex process. In addition, our reliance upon indirect selling methods may reduce visibility to demand and pricing issues. Each sales channel has distinct risks and costs, and therefore, our failure to implement the most advantageous balance in the sales model for our products and services could adversely affect our revenue and profitability.
If we fail to successfully protect our intellectual property, our competitive position and operating results could suffer.
We rely on our proprietary software technology and hardware designs, as well as the technical expertise, creativity, and knowledge of our personnel to maintain our position as a leading provider of machine vision products. Software piracy and reverse engineering, specifically from companies in Russia and China, may result in counterfeit products that are misrepresented in the market as Cognex products. Although we use a variety of methods to protect our intellectual property, we rely most heavily on patent, trademark, copyright, and trade secret protection, as well as non-disclosure agreements with customers, suppliers, employees, and consultants. We also attempt to protect our intellectual property by restricting access to our proprietary information by a combination of technical and internal security measures. These measures, however, may not be adequate to:
• | protect our proprietary technology, |
• | protect our patents from challenge, invalidation, or circumvention, or |
• | ensure that our intellectual property will provide us with competitive advantages. |
11
Our pending and future patent applications may not issue as patents or, if issued, may not issue in a form that will provide us with any meaningful protection or any competitive advantage. Even if issued, existing or future patents may be challenged, narrowed, invalidated, or circumvented, which could limit our ability to stop competitors from developing and marketing similar products or limit the length of patent protection we may have for our products. Furthermore, other companies may design around technologies we have patented, licensed, or developed. Moreover, changes in patent laws or their interpretation in the United States and other countries could also diminish the value of our intellectual property or narrow the scope of our patent protection. In addition, the legal systems of certain countries do not favor the aggressive enforcement of patents, and the laws of foreign countries may not protect our rights to the same extent as the laws of the United States. As a result, our patent portfolio may not provide us with sufficient rights to exclude others from commercializing products similar to ours. Any of these adverse circumstances could have a material adverse effect on our operating results.
Our Company may be subject to time-consuming and costly litigation.
From time to time, we may be subject to various claims and lawsuits by competitors, shareholders, customers, distributors, or other parties arising in the ordinary course of business, including lawsuits charging patent infringement, or claims and lawsuits instituted by us to protect our intellectual property and confidential information or for other reasons. We may be a party to actions that are described in the section captioned “Legal Proceedings,” appearing in Part I - Item 3 of this Annual Report on Form 10-K. These matters can be time consuming, divert management’s attention and resources, and cause us to incur significant expenses. Furthermore, the results of any of these actions may have a material adverse effect on our operating results.
Increased competition may result in decreased demand or prices for our products and services.
The machine vision market is highly fragmented and competitive. Our competitors include other vendors of machine vision systems, controllers, and components; manufacturers of image processing systems, sensors, and components; and system integrators. We may also compete with internal engineering departments of current or prospective customers, as well as open source tools available for free by various companies. Any of these competitors may have greater financial and other resources than we do. We may not be able to compete successfully in the future and our investments in research and development, sales and marketing, and support activities may be insufficient to enable us to maintain our competitive advantage. In addition, competitive pressures could lead to price erosion that could have a material adverse effect on our gross margins and operating results. We refer you to the section captioned “Competition,” appearing in Part I - Item 1 of this Annual Report on Form 10-K for further information regarding the competition that we face.
Implementation of our acquisition strategy may not be successful, which could affect our ability to increase our revenue or profitability and result in the impairment of acquired intangible assets.
On October 16, 2019, we completed our largest acquisition to date when we acquired Sualab Co., Ltd., a provider of deep learning-based vision software based in Korea. The total consideration of approximately $195 million included cash payments of approximately $171 million paid at closing and deferred payments of approximately $24 million payable on the fourth anniversary date of the closing, contingent upon the continued employment of key talent.
Our business may be negatively impacted by risks related to this acquisition, as well as other smaller acquisitions we have completed in the past few years, and future acquisitions that we may make. These risks include, among others:
• | the diversion of management's attention from other operational matters, |
• | difficulties or delays integrating personnel, operations, technologies, products, and systems of the acquired business, particularly in remote locations, |
• | the inability to realize expected synergies or other benefits resulting from the acquisition, |
• | the failure to retain key talent, |
• | the impairment of acquired intangible assets resulting from lower-than-expected cash flows from the acquired assets, |
• | the inability to protect and secure acquired intellectual property or confidential information, |
• | difficulties or delays completing the development of acquired in-process technology, |
• | the failure to retain key customers, and |
• | the failure to achieve projected sales of acquired products. |
Acquisitions are inherently risky and the inability to effectively manage these risks could have a material adverse effect on our operating results.
12
We are at risk for impairment charges with respect to our investments or for acquired intangible assets or goodwill, which could have a material adverse effect on our results of operations.
As of December 31, 2019, our investment portfolio of debt securities totaled $669,594,000. These debt securities are reported at fair value, with unrealized gains and losses, net of tax, recorded in shareholders’ equity as other comprehensive income (loss) since these securities are designated as available-for-sale securities. As of December 31, 2019, our portfolio of debt securities had a net unrealized gain of $2,351,000. Included in this net gain were gross unrealized losses totaling $65,000, of which $39,000 were in a loss position for less than twelve months and $26,000 were in a loss position for greater than twelve months. As of December 31, 2019, these unrealized losses were determined to be temporary. However, if conditions change and future unrealized losses were determined to be other-than-temporary, we would be required to record an impairment charge.
Management monitors the carrying value of its debt securities compared to their fair value to determine whether an other-than-temporary impairment has occurred. In considering whether a decline in fair value is other-than-temporary, we consider many factors, both qualitative and quantitative. Management considers the type of security, the credit rating of the security, the length of time the security has been in a loss position, the size of the loss position, our ability and intent to hold the security to expected recovery of value, and other meaningful information. If a decline in fair value is determined to be other-than-temporary, an impairment charge would be recorded in current operations to reduce the carrying value of the investment to its fair value. Should the fair value of investments decline in future periods below their carrying value, management will need to determine whether this decline is other-than-temporary and future impairment charges may be required.
As of December 31, 2019, we had $243 million in acquired goodwill. The fair value of goodwill is susceptible to changes in the fair value of the reporting segment in which the goodwill resides, and therefore, a decline in our market capitalization or cash flows relative to our net book value may result in future impairment charges.
As of December 31, 2019, we had $39 million in acquired intangible assets, consisting primarily of acquired technologies and customer relationships. These assets are susceptible to changes in fair value due to a decrease in the historical or projected cash flows from the use of these assets, which may be negatively impacted by economic trends. A decline in the cash flows generated by these assets may result in future impairment charges.
If we determine that any of these investments, goodwill, or intangible assets is impaired, we would be required to take a related charge to earnings that could have a material adverse effect on our results of operations.
We may have additional tax liabilities, which could adversely affect our operating results and financial condition.
We are subject to taxes in the United States, as well as in numerous foreign jurisdictions, including income taxes, indirect taxes such as value-added taxes (VAT), and payroll-related taxes and withholding obligations. Significant judgment is required in determining our worldwide provision for income and other taxes. In the ordinary course of business, there are many transactions and calculations where the ultimate tax determination is uncertain. We are regularly under audit by tax authorities and may be assessed additional taxes, penalties, fees or interest, which could have an adverse effect on our financial position, liquidity, or results of operation.
In the fourth quarter of 2019, we made changes to our international tax structure as a result of tax reform legislation enacted by the European Union. In addition, in connection with the acquisition of Sualab Co., Ltd., we migrated acquired intellectual property to certain subsidiaries in order to align with our corporate tax structure. The Company has made certain judgments and estimates in connection with these transactions, which have impacted the amount and timing of current and deferred tax expense in 2019 and in future years.
Although we believe our tax positions are reasonable, the final determination of tax audits and any related litigation could be materially different than that which is reflected in our financial statements and could have a material adverse effect on our income tax provision, net income, or cash flows in the period in which the determination is made.
ITEM 1B: UNRESOLVED STAFF COMMENTS
None
ITEM 2: PROPERTIES
In 1994, Cognex purchased and renovated a 100,000 square-foot building located in Natick, Massachusetts that serves as our corporate headquarters and is occupied by employees primarily in research, development, and engineering, manufacturing and quality assurance, and administration functions. In 1997, Cognex completed construction of a 50,000 square-foot addition to this building.
13
In 1995, Cognex purchased an 83,000 square-foot office building adjacent to our corporate headquarters that is occupied by employees primarily in sales, marketing, service, logistics, finance, and information technology functions.
In 1997, Cognex purchased a three and one-half acre parcel of land adjacent to our corporate headquarters. This land is being held for future expansion.
In 2007, Cognex purchased a 19,000 square-foot building adjacent to our corporate headquarters. A portion of this facility serves as the distribution center for customers in the Americas. The remainder of this building is occupied by a tenant who has a lease agreement that expires in 2022.
In 2014, Cognex purchased a 50,000 square foot building in Cork, Ireland where we had previously leased space for several years. This facility serves as the distribution center for customers outside of the Americas.
Cognex conducts certain of its operations in leased facilities. These lease agreements expire at various dates through 2025. Certain of these leases contain renewal options, retirement obligations, escalation clauses, rent holidays, and leasehold improvement incentives.
ITEM 3: LEGAL PROCEEDINGS
Various claims and legal proceedings generally incidental to the normal course of business are pending or threatened on behalf of or against the Company. While we cannot predict the outcome of these matters, we believe that any liability arising from them will not have a material adverse effect on our financial position, liquidity, or results of operations.
ITEM 4: MINE SAFETY DISCLOSURES
Not applicable.
ITEM 4A: INFORMATION ABOUT OUR EXECUTIVE OFFICERS
The following table sets forth the names, ages, and titles of Cognex’s executive officers as of December 31, 2019:
Name | Age | Title | ||
Robert J. Shillman | 73 | Chairman of the Board of Directors and Chief Culture Officer | ||
Robert J. Willett | 52 | President and Chief Executive Officer | ||
Laura A. MacDonald | 51 | Vice President and Corporate Controller | ||
Sheila M. DiPalma | 53 | Senior Vice President of Employee Services | ||
Executive officers are elected annually by the Board of Directors. There are no family relationships among the directors and executive officers of the Company.
Dr. Shillman and Mr. Willett have been employed by Cognex in their current positions for no less than the past five years.
Ms. MacDonald joined Cognex in 1994. She has served for more than 25 years in a series of increasingly responsible roles in the finance function, and has served as the Company's Vice President and Corporate Controller since 2007. Prior to joining Cognex, Ms. MacDonald was a member of the audit firm PricewaterhouseCoopers, where she practiced as a Certified Public Accountant. She holds a Bachelor of Science degree in Accounting from Providence College and a Master of Business Administration from Babson College.
Ms. DiPalma joined Cognex in 1992. She has served for more than 25 years in a series of increasingly responsible roles in the finance function, including six years as Cognex Treasurer, before transitioning to Employee Services in 2016. Prior to joining Cognex, Ms. DiPalma was a member of the audit firm PricewaterhouseCoopers. She holds a Bachelor of Science degree in Accounting from Boston College, a Master of Science degree in Taxation from Bentley College, and is a Certified Public Accountant.
14
PART II
ITEM 5: MARKET FOR REGISTRANT’S COMMON EQUITY, RELATED STOCKHOLDER MATTERS, AND ISSUER PURCHASES OF EQUITY SECURITIES
The Company’s common stock is traded on The NASDAQ Stock Market LLC, under the symbol CGNX. As of January 26, 2020, there were approximately 650 shareholders of record of the Company’s common stock. The Company believes the number of beneficial owners of the Company’s common stock on that date was substantially greater.
In October 2018, the Company's Board of Directors authorized the repurchase of $200,000,000 of the Company's common stock. As of December 31, 2019, the Company repurchased 1,601,000 shares at a cost of $70,312,000 under this program, including 1,398,000 shares at a cost of $61,690,000 during 2019, leaving a remaining balance of $129,688,000. The Company may repurchase shares under this program in future periods depending upon a variety of factors, including, among other things, the impact of dilution from employee stock awards, stock price, share availability, and cash requirements.
The following table sets forth information with respect to purchases by the Company of shares of its common stock during each fiscal month of the fourth quarter of 2019:
Total Number of Shares Purchased | Average Price Paid per Share | Total Number of Shares Purchased as Part of Publicly Announced Plans or Programs | Approximate Dollar Value of Shares that May Yet Be Purchased Under the Plans or Programs | ||||||||||
September 30 - October 27, 2019 | — | $ | — | — | $ | 129,688,000 | |||||||
October 28 - November 24, 2019 | — | — | — | 129,688,000 | |||||||||
November 25 - December 31, 2019 | — | — | — | 129,688,000 | |||||||||
Total | — | $ | — | — | $ | 129,688,000 | |||||||
15
Set forth below is a line graph comparing the annual percentage change in the cumulative total shareholder return on the Company’s common stock, based upon the market price of the Company’s common stock, with the total return on companies within the Nasdaq Composite Index and the Research Data Group, Inc. Nasdaq Lab Apparatus & Analytical, Optical, Measuring & Controlling Instrument (SIC 3820-3829 US Companies) Index (the “Nasdaq Lab Apparatus Index”). The performance graph assumes an investment of $100 in each of the Company and the two indices, and the reinvestment of any dividends. The historical information set forth below is not necessarily indicative of future performance. Data for the Nasdaq Composite Index and the Nasdaq Lab Apparatus Index was provided to the Company by Research Data Group, Inc.
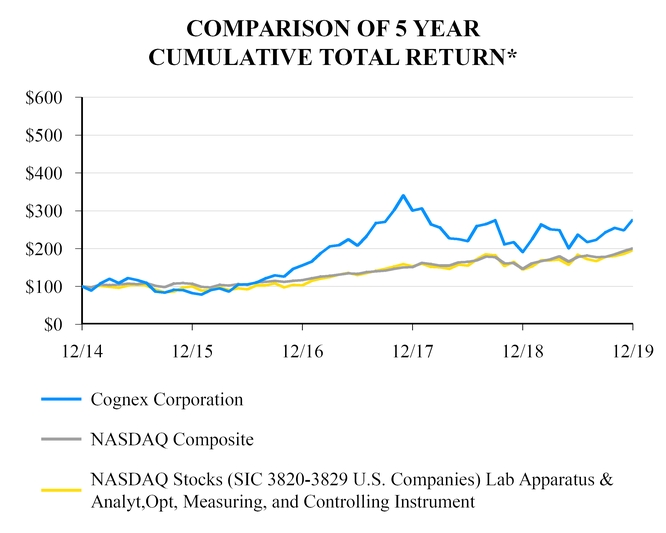
*$100 invested on 12/31/2014 in stock or index, including reinvestment of dividends. Fiscal year ended December 31. | |||||||||||||||||
12/14 | 12/15 | 12/16 | 12/17 | 12/18 | 12/19 | ||||||||||||
Cognex Corporation | 100.00 | 82.15 | 155.73 | 300.42 | 190.68 | 277.52 | |||||||||||
NASDAQ Composite | 100.00 | 106.96 | 116.45 | 150.96 | 146.67 | 200.49 | |||||||||||
NASDAQ Stocks | 100.00 | 100.11 | 103.09 | 153.38 | 144.64 | 195.94 | |||||||||||
(SIC 3820-3829 U.S. Companies) Lab Apparatus & Analyt,Opt, Measuring, and Controlling Instrument | |||||||||||||||||
16
ITEM 6: SELECTED FINANCIAL DATA
Year Ended December 31, | |||||||||||||||||||
2019 | 2018 | 2017 | 2016 | 2015 | |||||||||||||||
(In thousands, except per share amounts) | |||||||||||||||||||
Statement of Operations Data: | |||||||||||||||||||
Revenue | $ | 725,625 | $ | 806,338 | $ | 766,083 | $ | 529,515 | $ | 470,991 | |||||||||
Cost of revenue (1) | 189,754 | 206,052 | 187,289 | 131,070 | 123,085 | ||||||||||||||
Gross margin | 535,871 | 600,286 | 578,794 | 398,445 | 347,906 | ||||||||||||||
Research, development, and engineering expenses (1) | 119,427 | 116,445 | 99,205 | 78,269 | 69,791 | ||||||||||||||
Selling, general, and administrative expenses (1) | 273,842 | 262,699 | 220,728 | 166,110 | 156,674 | ||||||||||||||
Operating income | 142,602 | 221,142 | 258,861 | 154,066 | 121,441 | ||||||||||||||
Non-operating income | 20,392 | 13,432 | 7,603 | 8,011 | 5,441 | ||||||||||||||
Income from continuing operations before income tax expense | 162,994 | 234,574 | 266,464 | 162,077 | 126,882 | ||||||||||||||
Income tax expense (benefit) on continuing operations | (40,871 | ) | 15,307 | 89,752 | 18,128 | 19,288 | |||||||||||||
Net income from continuing operations | 203,865 | 219,267 | 176,712 | 143,949 | 107,594 | ||||||||||||||
Net income (loss) from discontinued operations (1) | — | — | — | (255 | ) | 79,410 | |||||||||||||
Net income | $ | 203,865 | $ | 219,267 | $ | 176,712 | $ | 143,694 | $ | 187,004 | |||||||||
Basic earnings per weighted-average common and common-equivalent share (2): | |||||||||||||||||||
Net income from continuing operations | $ | 1.19 | $ | 1.27 | $ | 1.02 | $ | 0.84 | $ | 0.62 | |||||||||
Net income (loss) from discontinued operations | $ | — | $ | — | $ | — | $ | — | $ | 0.46 | |||||||||
Net income | $ | 1.19 | $ | 1.27 | $ | 1.02 | $ | 0.84 | $ | 1.08 | |||||||||
Diluted earnings per weighted-average common and common-equivalent share (2): | |||||||||||||||||||
Net income from continuing operations | $ | 1.16 | $ | 1.24 | $ | 0.98 | $ | 0.83 | $ | 0.61 | |||||||||
Net income (loss) from discontinued operations | $ | — | $ | — | $ | — | $ | — | $ | 0.45 | |||||||||
Net income | $ | 1.16 | $ | 1.24 | $ | 0.98 | $ | 0.83 | $ | 1.06 | |||||||||
Weighted-average common and common-equivalent shares outstanding (2): | |||||||||||||||||||
Basic | 171,194 | 172,333 | 173,287 | 170,676 | 172,592 | ||||||||||||||
Diluted | 175,269 | 177,406 | 179,551 | 174,144 | 175,982 | ||||||||||||||
Cash dividends per common share (2) | $ | 0.2050 | $ | 0.1850 | $ | 0.1675 | $ | 0.1475 | $ | 0.1050 | |||||||||
(1) Amounts include stock-based compensation expense, as follows: | |||||||||||||||||||
Cost of revenue | $ | 1,504 | $ | 2,447 | $ | 1,881 | $ | 1,052 | $ | 1,515 | |||||||||
Research, development, and engineering | 15,748 | 14,578 | 11,022 | 6,271 | 5,194 | ||||||||||||||
Selling, general, and administrative | 28,337 | 24,065 | 19,039 | 13,235 | 13,032 | ||||||||||||||
Discontinued operations | — | — | — | — | 1,533 | ||||||||||||||
Total stock-based compensation expense | $ | 45,589 | $ | 41,090 | $ | 31,942 | $ | 20,558 | $ | 21,274 | |||||||||
(2) Prior period results have been adjusted to reflect the two-for-one stock split effected in the form of a stock dividend which occurred in 2017. | |||||||||||||||||||
December 31, | |||||||||||||||||||
2019 | 2018 | 2017 | 2016 | 2015 | |||||||||||||||
(In thousands) | |||||||||||||||||||
Balance Sheet Data: | |||||||||||||||||||
Working capital | $ | 486,754 | $ | 688,969 | $ | 517,356 | $ | 461,357 | $ | 397,470 | |||||||||
Total assets | 1,885,935 | 1,289,667 | 1,287,753 | 1,038,361 | 877,421 | ||||||||||||||
Shareholders’ equity | 1,355,710 | 1,135,263 | 1,095,673 | 963,385 | 832,331 | ||||||||||||||
17
ITEM 7: MANAGEMENT’S DISCUSSION AND ANALYSIS OF FINANCIAL CONDITION AND RESULTS OF OPERATIONS
FORWARD-LOOKING STATEMENTS
Certain statements made in this report, as well as oral statements made by the Company from time to time, constitute forward-looking statements within the meaning of Section 27A of the Securities Act of 1933, as amended, and Section 21E of the Securities Exchange Act of 1934, as amended. Readers can identify these forward-looking statements by our use of the words “expects,” “anticipates,” “estimates,” “believes,” “projects,” “intends,” “plans,” “will,” “may,” “shall,” “could,” “should,” and similar words and other statements of a similar sense. These statements are based upon our current estimates and expectations as to prospective events and circumstances, which may or may not be in our control and as to which there can be no firm assurances given. These forward-looking statements, which include statements regarding business and market trends, future financial performance, customer order rates and timing of related revenue, expected areas of growth, emerging markets, future product mix, research and development activities, investments, strategic plans, expected benefits from acquisitions, dividends, stock repurchases, and tax matters, involve known and unknown risks and uncertainties that could cause actual results to differ materially from those projected. Such risks and uncertainties include: (1) current and future conditions in the global economy, including the imposition of tariffs or export controls and the impact of the coronavirus outbreak; (2) the loss of, or curtailment of purchases by, a large customer; (3) the reliance on revenue from the consumer electronics or automotive industries; (4) the inability to penetrate the logistics industry and other new markets; (5) the inability to achieve significant international revenue; (6) fluctuations in foreign currency exchange rates and the use of derivative instruments; (7) information security breaches or business system disruptions; (8) the inability to attract and retain skilled employees; (9) the failure to effectively manage our growth; (10) the reliance upon key suppliers to manufacture and deliver critical components for our products; (11) the failure to effectively manage product transitions or accurately forecast customer demand; (12) the inability to design and manufacture high-quality products; (13) the technological obsolescence of current products and the inability to develop new products; (14) the failure to properly manage the distribution of products and services; (15) the inability to protect our proprietary technology and intellectual property; (16) our involvement in time-consuming and costly litigation; (17) the impact of competitive pressures; (18) the challenges in integrating and achieving expected results from acquired businesses, including the recent acquisition of Sualab; (19) potential impairment charges with respect to our investments or for acquired intangible assets or goodwill; and (20) exposure to additional tax liabilities. The foregoing list should not be construed as exhaustive and we encourage readers to refer to the detailed discussion of risk factors included in Part I - Item 1A of this Annual Report on Form 10-K. The Company cautions readers not to place undue reliance upon any such forward-looking statements, which speak only as of the date made. The Company disclaims any obligation to subsequently revise forward-looking statements to reflect the occurrence of anticipated or unanticipated events or circumstances after the date such statements are made.
EXECUTIVE OVERVIEW
Cognex Corporation is a leading worldwide provider of machine vision products that capture and analyze visual information in order to automate manufacturing and distribution tasks where vision is required. In addition to product revenue derived from the sale of machine vision products, the Company also generates revenue by providing maintenance and support, consulting, and training services to its customers; however, service revenue accounted for less than 10% of total revenue for all periods presented.
Cognex machine vision is used to automate manufacturing and distribution processes in a variety of industries, where the technology is widely recognized as an important component of automated production and quality assurance. Virtually every manufacturer can achieve better quality and manufacturing efficiency by using machine vision, and therefore, Cognex products are used by a broad base of customers across a variety of industries, including consumer electronics, automotive, consumer products, food and beverage, pharmaceuticals, and medical devices. Cognex products are also used to automate distribution processes in the logistics industry, including for applications in retail distribution and ecommerce to scan, track, and sort goods through distribution centers.
Revenue for the year ended December 31, 2019 totaled $725,625,000, representing a decrease of 10% from 2018 driven by significantly lower revenue in the consumer electronics industry related to smartphone manufacturing. Gross margin as a percentage of revenue was 74% for both years. Operating expenses increased by 4% over 2018, as the impact of additional headcount to support our future growth plans was offset by lower expenses related to incentive compensation plans. As a result of the lower revenue level and continued investments, operating income was 20% of revenue in 2019 compared to 27% of revenue in 2018. A higher level of discrete tax benefits in 2019 related to tax structure changes resulted in net income of 28% of revenue in 2019 compared to 27% of revenue in 2018. Net income per diluted share was $1.16 in 2019 compared to $1.24 in 2018.
18
The following table sets forth certain consolidated financial data as a percentage of revenue:
Year Ended December 31, | ||||||||
2019 | 2018 | 2017 | ||||||
Revenue | 100 | % | 100 | % | 100 | % | ||
Cost of revenue | 26 | 26 | 24 | |||||
Gross margin | 74 | 74 | 76 | |||||
Research, development, and engineering expenses | 16 | 14 | 13 | |||||
Selling, general, and administrative expenses | 38 | 33 | 29 | |||||
Operating income | 20 | 27 | 34 | |||||
Non-operating income | 3 | 2 | 1 | |||||
Income before income tax expense | 23 | 29 | 35 | |||||
Income tax expense (benefit) | (5 | ) | 2 | 12 | ||||
Net income | 28 | % | 27 | % | 23 | % | ||
RESULTS OF OPERATIONS
As foreign currency exchange rates are a factor in understanding period-to-period comparisons, we believe the presentation of results on a constant-currency basis in addition to reported results helps improve investors’ ability to understand our operating results and evaluate our performance in comparison to prior periods. We also use results on a constant-currency basis as one measure to evaluate our performance. Constant-currency information compares results between periods as if exchange rates had remained constant period-over-period. We generally refer to such amounts calculated on a constant-currency basis as excluding the impact of foreign currency exchange rate changes. Results on a constant-currency basis are not in accordance with accounting principles generally accepted in the United States of America (U.S. GAAP) and should be considered in addition to, and not as a substitute for, results prepared in accordance with U.S. GAAP.
Year Ended December 31, 2019 Compared to Year Ended December 31, 2018
Revenue
Revenue for the year ended December 31, 2019 was $725,625,000 compared to $806,338,000 for the prior year, representing a decrease of $80,713,000, or 10%. Changes in foreign currency exchange rates accounted for approximately 2% of the revenue decrease from 2018 to 2019, primarily related to the translation of Euro-denominated and Chinese Yuan-denominated revenue to U.S. Dollars.
In 2019, industrial companies delayed and reduced spending for automation projects, including those with machine vision, amid weaker general manufacturing confidence and heightened uncertainty around global trade. This decrease in capital spending, along with the decision by certain of our larger customers to retrofit existing equipment rather than invest in new production lines or facilities, contributed to the decrease in revenue from the prior year.
The impact to our business was most significant in our two largest markets, consumer electronics and automotive, which together represent approximately half of our total revenue. Consumer electronics revenue was approximately 30% lower than the prior year, with the majority of this decrease related to smartphone manufacturing, while automotive revenue was approximately 10% lower than the prior year.
These decreases were only partially offset by higher revenue in the logistics industry, which increased by approximately 15% from the prior year. This growth rate was slower than 2018 due to a major customer delaying deliveries for new facilities until mid-2020 after building adequate capacity for 2019 by upgrading existing facilities. Excluding revenue from this major customer, logistics revenue increased by approximately 50% from the prior year. We expect this customer to grow at a lower rate than our total logistics business in 2020.
From a geographic perspective, revenue from customers based in the Americas increased by 5% driven by higher sales in the logistics industry, partially offset by lower sales in the automotive industry. Revenue from customers based in Europe decreased by 27% driven by lower sales in the consumer electronics industry, and to a lesser extent, the automotive industry. Revenue from customers based in Greater China decreased by 7% across a variety of industries. The decline would have been larger in Greater China, and less extreme in Europe, if not for procurement changes made by certain consumer electronics customers, shifting their purchases to China from Europe. Revenue from customers based in other regions in Asia were relatively flat.
19
As of the date of this report, we expect revenue for the first quarter of 2020 to be lower than the fourth quarter of 2019 due to continued weakness in the automotive industry and the estimated impact of the recent coronavirus outbreak on our business. This decrease is expected to be partially offset by higher sales to customers in the logistics industry from the prior quarter.
Gross Margin
Gross margin as a percentage of revenue was 74% for both years. The unfavorable absorption of manufacturing overhead costs over the lower level of revenue was offset by favorable product mix.
As of the date of this report, we expect gross margin as a percentage of revenue for the first quarter of 2020 to be relatively consistent with the gross margin reported in the fourth quarter of 2019.
Operating Expenses
Research, Development, and Engineering Expenses
Research, development, and engineering (RD&E) expenses in 2019 increased by $2,982,000, or 3%, from the prior year as detailed in the table below (in thousands).
RD&E expenses in 2018 | $ | 116,445 | |
Personnel-related costs | 5,782 | ||
Incentive compensation plans | (3,852 | ) | |
Other | 1,052 | ||
RD&E expenses in 2019 | $ | 119,427 | |
RD&E expenses increased due to higher personnel-related costs resulting primarily from headcount additions to support new product initiatives, of which $1,013,000 related to a new team of deep learning engineers from the Company's acquisition of Sualab Co., Ltd. on October 16, 2019. The consideration from this acquisition included deferred payments that are being recorded as compensation expense over four years from the closing date, which accounted for an additional $1,092,000 of the increase in personnel-related costs. These increases were partially offset by lower expenses related to incentive compensation plans resulting from lower levels of achievement on performance plans that were set at the beginning of the year. These annual incentive compensation plans will be reset with relevant performance goals for 2020, which would result in higher expense if the targeted achievements are met.
RD&E expenses as a percentage of revenue were 16% in 2019 compared to 14% in 2018. We believe that a continued commitment to RD&E activities is essential in order to maintain or achieve product leadership with our existing products and to provide innovative new product offerings, as well as to provide engineering support for large customers. In addition, we consider our ability to accelerate time to market for new products to be critical to our revenue growth. Therefore, we expect to continue to make significant RD&E investments in the future, and currently intend to continue our product development plans during periods of lower revenue levels, which would result in a higher level of RD&E expenses as a percentage of revenue in the first quarter of 2020 than the 16% in 2019.
Selling, General, and Administrative Expenses
Selling, general, and administrative (SG&A) expenses in 2019 increased by $11,143,000, or 4%, from the prior year as detailed in the table below (in thousands).
SG&A expenses in 2018 | $ | 262,699 | |
Personnel-related costs | 23,811 | ||
Incentive compensation plans | (8,742 | ) | |
Foreign currency exchange rate changes | (5,085 | ) | |
ERP project costs | (4,967 | ) | |
Other | 6,126 | ||
SG&A expenses in 2019 | $ | 273,842 | |
SG&A expenses increased due to higher personnel-related costs resulting primarily from headcount additions, principally sales personnel. In addition to salaries and fringe benefits, these personnel-related costs included sales commissions and travel expenses related to the additional headcount. These increases were partially offset by lower expenses related to incentive compensation plans resulting from lower levels of achievement on performance plans that were set at the beginning of the year. These annual incentive compensation plans will be reset with relevant performance goals for 2020, which would result in higher expense if the targeted achievements are met. Changes in foreign currency exchange rates also resulted in a lower level of expenses, as costs denominated in foreign currencies
20
were translated to U.S. Dollars at a lower rate. Expenses were also lower due to project costs incurred in 2018 related to the Company's new Enterprise Resource Planning (ERP) system. This system was placed into service during the third quarter of 2018, and therefore, similar costs were not incurred in 2019.
Non-operating Income (Expense)
The Company recorded foreign currency losses of $509,000 in 2019 and $1,064,000 in 2018. Foreign currency gains and losses result primarily from the revaluation and settlement of accounts receivable, accounts payable, and intercompany balances that are reported in one currency and collected in another.
Investment income increased by $4,974,000 or 34%, from the prior year. The increase was due to higher yields on the Company's portfolio of debt securities, and to a lesser extent, higher average investment balances.
The Company recorded other income of $1,212,000 in 2019 and other expense of $219,000 in 2018. Other income (expense) includes fair value adjustments of contingent consideration liabilities arising from business acquisitions. A higher level of fair value adjustments to income was recorded in 2019 related to the Company's acquisition of GVi Ventures, Inc., resulting from a lower level of revenue in the Americas' automotive industry.
Income Tax Expense
The Company’s effective tax rate was a benefit of 25% of pre-tax income in 2019 compared to an expense of 7% in 2018.
The European Union has enacted a series of tax reform legislation over the past few years regarding low tax structures. The Company made changes to its international tax structure in the fourth quarter of 2019 as a result of this legislation, and as a result, recorded a net discrete tax benefit of $87,500,000. Management expects its current effective tax rate excluding discrete events to increase slightly in future years as a result of this change.
On October 16, 2019, the Company acquired Sualab Co., Ltd., a provider of deep learning-based vision software based in Korea. The Company migrated acquired intellectual property to certain subsidiaries in the fourth quarter of 2019, and as a result, recorded a discrete tax expense of $28,528,000.
In addition, the effective tax rate included a decrease in tax expense of $6,472,000 in 2019 and $8,488,000 in 2018 related to stock options, primarily from the excess tax benefit arising from the difference between the deduction for tax purposes and the compensation cost recognized for financial reporting purposes from stock option exercises. The Company cannot predict the level of stock option exercises by employees in future periods.
Other discrete tax events included a net decrease in tax expense of $1,932,000 in 2019 and $1,847,000 in 2018, consisting primarily of the expiration of the statutes of limitations for certain reserves for income tax uncertainties and the final true-up of the prior year's tax accrual upon filing the related tax returns.
Excluding the impact of these discrete events, the Company’s effective tax rate was an expense of 16% of pre-tax income in 2019. This represents an increase in the effective tax rate excluding discrete events from 14% in 2018 due to more of the Company's profits being earned and taxed in higher tax jurisdictions.
Year Ended December 31, 2018 Compared to Year Ended December 31, 2017
Revenue
Revenue for the year ended December 31, 2018 was $806,338,000 compared to $766,083,000 for the prior year, representing an increase of $40,255,000, or 5%. Revenue in 2018 was impacted by lower sales in the consumer electronics industry primarily due to significantly lower revenue from a few large customers in OLED (organic light-emitting diode) display and smartphone manufacturing following a high level of investment from these customers in 2017. Excluding sales to customers in the consumer electronics industry, revenue increased by approximately 18% from the prior year, driven by growth in the logistics industry of over 50%. Changes in foreign currency exchange rates accounted for approximately 2% of the revenue increase from 2017 to 2018, primarily related to the translation of Euro-denominated and Chinese Yuan-denominated revenue to U.S. Dollars.
Revenue from customers based in the Americas increased by 24% in 2018 from the prior year driven by strong sales in the logistics industry. Revenue from customers based in Greater China increased by 14% in 2018 from 2017, although this business was relatively flat in the fourth quarter of 2018 over the fourth quarter of 2017. Revenue from customers based in Europe decreased by 5% and revenue from customers based in other Asia regions decreased by 8% in 2018 from the prior year. Revenue for both the Europe and Asia regions outside of Greater China was impacted by the lower sales in the consumer electronics industry noted above.
21
Gross Margin
Gross margin as a percentage of revenue was 74.4% in 2018 compared to 75.6% in 2017. The decrease in gross margin was due primarily to a higher percentage of total revenue from the logistics industry. Certain sales in this industry are for application-specific customer solutions, which typically have lower gross margins due to deployment services. Unfavorable product mix for sales in the logistics industry also contributed to the lower gross margin percentage.
Operating Expenses
Research, Development, and Engineering Expenses
Research, development, and engineering (RD&E) expenses in 2018 increased by $17,240,000, or 17%, from the prior year as detailed in the table below (in thousands).
RD&E expenses in 2017 | $ | 99,205 | |
Personnel-related costs | 10,173 | ||
Stock-based compensation expense | 3,493 | ||
Other | 3,574 | ||
RD&E expenses in 2018 | $ | 116,445 | |
RD&E expenses increased due to higher personnel-related costs resulting primarily from headcount additions to support new product initiatives. Stock-based compensation expense was higher than the prior year due to a higher valuation of stock options granted, as well as a decrease in the estimated forfeiture rate in 2018.
Selling, General, and Administrative Expenses
Selling, general, and administrative (SG&A) expenses in 2018 increased by $41,971,000, or 19%, from the prior year as detailed in the table below (in thousands).
SG&A expenses in 2017 | $ | 220,728 | |
Personnel-related costs | 36,569 | ||
Stock-based compensation expense | 4,912 | ||
Depreciation expense | 3,744 | ||
Incentive compensation plans | (7,967 | ) | |
Other | 4,713 | ||
SG&A expenses in 2018 | $ | 262,699 | |
SG&A expenses increased due to higher personnel-related costs resulting primarily from headcount additions, principally sales personnel. In addition to salaries and fringe benefits, these personnel-related costs included sales commissions and travel expenses related to the additional headcount. Stock-based compensation expense was higher than the prior year due to a higher valuation of stock options granted, as well as a decrease in the estimated forfeiture rate in 2018. Depreciation expense increased from the prior year due primarily to information technology investments in infrastructure, security, and business applications, including a new Enterprise Resource Planning (ERP) system that was placed into service in the middle of 2018. Offsetting these increases were lower expenses related to incentive compensation plans, including company bonuses and sales commissions, resulting from lower levels of achievement on performance plans that were set at the beginning of the year.
Non-operating Income (Expense)
The Company recorded foreign currency losses of $1,064,000 in 2018 and $1,601,000 in 2017. The foreign currency gains and losses result primarily from the revaluation and settlement of accounts receivable, accounts payable, and intercompany balances that are reported in one currency and collected or paid in another.
Investment income increased by $5,173,000, or 54%, from the prior year. The increase was primarily due to higher yields on the Company's portfolio of debt securities.
The Company recorded other expense of $219,000 in 2018 and $338,000 in 2017. Other income (expense) includes fair value adjustments of contingent consideration liabilities arising from business acquisitions, as well as rental income, net of associated expenses, from leasing space in buildings adjacent to the Company’s corporate headquarters.
Income Tax Expense
The Company’s effective tax rate was 7% of the Company’s pre-tax income in 2018 compared to 34% in 2017.
22
The Tax Act
On December 22, 2017, the Tax Cuts and Jobs Act of 2017 (Tax Act) was signed into law. The Tax Act resulted in a decrease in the U.S. federal statutory corporate tax rate from 35% to 21%. As a result of the reduction in anticipated tax rate, the Company remeasured its deferred tax positions as of December 31, 2017 at the new enacted tax rate, and accordingly, recorded tax expense of $12,523,000 in 2017 from the associated write-down of its deferred tax assets. In 2018, the Company recorded an increase in tax expense of $3,240,000 from the write-down of its deferred tax assets primarily relating to guidance under the Tax Act regarding stock-based compensation.
The Tax Act subjects unrepatriated foreign earnings to a one-time transition tax, regardless of the Company's financial statement assertion related to indefinite reinvestment or whether the Company ultimately repatriates any of the foreign earnings, for which the Company recorded estimated tax expense of $101,379,000 in 2017. In 2018, the Company revised its estimate of the one-time transition tax and recorded a decrease in tax expense of $11,028,000, which resulted in a revised estimate for the one-time transition tax of $90,351,000.
The Tax Act replaces the current system of taxing U.S. corporations on repatriated foreign earnings with a partial territorial system that provides a 100% dividends-received deduction to domestic corporations for foreign-source dividends received from 10% or more owned foreign corporations. The Company recorded a decrease in tax expense of $3,843,000 in 2017 from the reversal of the tax effect of a 2016 dividend paid in 2017 from a wholly-owned foreign subsidiary to its domestic entity.
Other Discrete Tax Events
The effective tax rate also included a decrease in tax expense of $8,488,000 in 2018 and $38,569,000 in 2017 from the excess tax benefit arising from the difference between the deduction for tax purposes and the compensation cost recognized for financial reporting purposes from stock option exercises.
In 2018, tax expense included a provision for state income taxes of $620,000 from a change in management's financial statement assertion related to the indefinite reinvestment of foreign earnings. Management has determined that earnings from its legal entity in China will remain indefinitely reinvested to provide local funding for growth, and that earnings from all other jurisdictions will not be indefinitely reinvested, resulting in the additional state income tax provision.
Other discrete tax events resulted in a net decrease in tax expense of $2,467,000 in 2018 and $2,502,000 in 2017, consisting primarily of the final true-up of the prior year's tax accrual upon filing the related tax returns and the expiration of the statutes of limitations for certain reserves for income tax uncertainties.
Excluding the impact of these discrete tax events, the Company's effective tax rate was 14% in 2018.
LIQUIDITY AND CAPITAL RESOURCES
The Company has historically been able to generate positive cash flow from operations, which has funded its operating activities and other cash requirements and has resulted in an accumulated cash and investment balance of $845,353,000 as of December 31, 2019. The Company has established guidelines relative to credit ratings, diversification, and maturities of its investments that maintain liquidity.
The Company’s cash requirements in 2019 were primarily met with positive cash flows from operations and the proceeds from stock option exercises. Cash requirements consisted of operating activities, the repurchase of common stock, the payment of dividends, the acquisition of Sualab Co., Ltd., and capital expenditures. Capital expenditures in 2019 totaled $21,745,000 and consisted primarily of computer hardware and software, manufacturing test equipment related to new product introductions, and improvements made to the Company's headquarters building in Natick, Massachusetts and various leased facilities.
23
The following table summarizes the Company’s material contractual obligations, both fixed and contingent (in thousands):
Year Ended December 31, | Inventory Purchase Commitments | Leases | Total | ||||||||
2020 | $ | 7,707 | $ | 6,565 | $ | 14,272 | |||||
2021 | — | 5,558 | 5,558 | ||||||||
2022 | — | 3,822 | 3,822 | ||||||||
2023 | — | 3,000 | 3,000 | ||||||||
2024 | — | 927 | 927 | ||||||||
Thereafter | — | 310 | 310 | ||||||||
$ | 7,707 | $ | 20,182 | $ | 27,889 | ||||||
In addition to the obligations described above, the following items may also result in future material uses of cash:
Stock Repurchases
In October 2018, the Company's Board of Directors authorized the repurchase of $200,000,000 of the Company's common stock. As of December 31, 2019, the Company repurchased 1,601,000 shares at a cost of $70,312,000 under this program, including 1,398,000 shares at a cost of $61,690,000 in 2019. The Company may repurchase shares under this program in future periods, up to the remaining balance of $129,688,000, depending on a variety of factors, including, among other things, the impact of dilution from employee stock options, stock price, share availability, and cash requirements.
Dividends
The Company’s Board of Directors declared and paid cash dividends of $0.050 per share in the first, second, and third quarters of 2019. The dividend was increased to $0.055 per share in the fourth quarter of 2019. Total dividends amounted to $35,124,000 in 2019. Future dividends will be declared at the discretion of the Company’s Board of Directors and will depend upon such factors as the Board deems relevant including, among other things, the Company’s ability to generate positive cash flows from operations.
Business Acquisitions
On October 16, 2019, the Company acquired Sualab Co., Ltd. for cash payments of $170,602,000 upon closing and deferred payments of $24,040,000 that may become payable on the fourth anniversary date of the closing, contingent upon the continued employment of key talent.
Certain of the Company's business acquisitions that closed in 2017 and 2016 have contractual obligations for deferred cash payments, contingent cash payments tied to performance, and special incentive cash payments tied to employment, none of which are material individually or in the aggregate to the Company's cash flows.
Income Taxes
In conjunction with the acquisition of Sualab, the Company migrated acquired intellectual property to certain subsidiaries in the fourth quarter of 2019, which is expected to result in a foreign tax payment of approximately $30,000,000 in early 2020.
The Tax Act subjected unrepatriated foreign earnings to a one-time transition tax, which is expected to result in tax payments of $51,113,000 starting in 2021 through 2025.
The Company believes that its existing cash and investment balances, together with cash flow from operations, will be sufficient to meet its operating, investing, and financing activities for the next twelve months. As of December 31, 2019, the Company had $845,353,000 in cash and investments. In addition, the Company has no long-term debt and does not anticipate needing debt financing in the near future. We believe that our strong cash position has put us in a relatively good position with respect to anticipated longer-term liquidity needs.
OFF-BALANCE SHEET ARRANGEMENTS
As of December 31, 2019, the Company has no off-balance sheet arrangements as defined in Item 303(a)(4)(ii) of Regulation S-K.
24
CRITICAL ACCOUNTING POLICIES AND ESTIMATES
Our discussion and analysis of the Company’s financial condition and results of operations are based upon the consolidated financial statements included in this Annual Report on Form 10-K, which have been prepared in accordance with accounting principles generally accepted in the United States. The preparation of these financial statements requires management to make estimates and judgments that affect the reported amounts of assets, liabilities, revenue, and expenses, and related disclosure of contingent assets and liabilities. We base our estimates on historical experience and various other assumptions believed to be reasonable under the circumstances, the results of which form the basis for making judgments about the carrying values of assets and liabilities that are not readily apparent from other sources. Actual results could differ from these estimates under different assumptions or circumstances resulting in charges that could be material in future reporting periods. We believe the following critical accounting policies require the use of significant estimates and judgments in the preparation of our consolidated financial statements.
Revenue Recognition
The Company recognizes revenue in accordance with Accounting Standards Codification (ASC) 606, “Revenue from Contracts with Customers.” The core principle of ASC 606 is to recognize revenue in a manner that depicts the transfer of promised goods or services to customers in an amount that reflects the consideration to which the Company expects to be entitled in exchange for those goods or services. The framework in support of this core principle includes: (1) identifying the contract with the customer; (2) identifying the performance obligations in the contract; (3) determining the transaction price; (4) allocating the transaction price to the performance obligations; and (5) recognizing revenue when (or as) the performance obligations are satisfied.
Identifying the Contract with the Customer
The Company identifies contracts with customers as agreements that create enforceable rights and obligations, which typically take the form of customer contracts or purchase orders.
Identifying the Performance Obligations in the Contract
The Company identifies performance obligations as promises in contracts to transfer distinct goods or services. Standard products and services that the Company regularly sells separately are accounted for as distinct performance obligations. Application-specific customer solutions that are comprised of a combination of products and services are accounted for as one performance obligation to deliver a total solution to the customer. On-site support services that are provided to the customer after the solution is deployed are accounted for as a separate performance obligation. These solutions are provided to customers in a variety of industries, including the consumer electronics, logistics, and automotive industries.
Shipping and handling activities for which the Company is responsible under the terms and conditions of the sale are not accounted for as performance obligations but as fulfillment costs. These activities are required to fulfill the Company’s promise to transfer the goods and are expensed when revenue is recognized.
The Company does not assess whether promised goods or services are performance obligations if they are immaterial in the context of the contract. If revenue is recognized before immaterial promises have been completed, then the costs related to such immaterial promises are accrued at the time of sale.
Determining the Transaction Price
The Company determines the transaction price as the amount of consideration it expects to receive in exchange for transferring promised goods or services to the customer. Amounts collected from customers for sales taxes are excluded from the transaction price.
If a contract includes a variable amount, such as a rebate, then the Company estimates the transaction price using either the expected value or the most likely amount of consideration to be received, depending upon the specific facts and circumstances. The Company includes estimated variable consideration in the transaction price only to the extent it is probable that a significant reversal of revenue will not occur when the uncertainty is resolved. The Company updates its estimate of variable consideration at the end of each reporting period to reflect changes in facts and circumstances.
Allocating the Transaction Price to the Performance Obligations
The Company allocates the transaction price to each performance obligation at contract inception based on a relative stand-alone selling price basis, or the price at which the Company would sell the good or service separately to similar customers in similar circumstances.
25
Recognizing Revenue When (or As) the Performance Obligations are Satisfied
The Company recognizes revenue when it transfers the promised goods or services to the customer. Revenue for standard products is recognized at the point in time when the customer obtains control of the goods, which is typically upon delivery when the customer has legal title, physical possession, the risks and rewards of ownership, and an enforceable obligation to pay for the products. Revenue for services, which are not material, is typically recognized over the time the service is provided.
Revenue for application-specific customer solutions is recognized at the point in time when the solution is validated, which is the point in time when the Company can objectively determine that the agreed-upon specifications in the contract have been met and the customer will accept the performance obligations in the arrangement. Although the customer may have taken legal title and physical possession of the goods when they arrived at the customer’s designated site, the significant risks and rewards of ownership transfer to the customer only upon validation. Revenue for on-site support services related to these solutions is recognized over the time the service is provided.
In certain instances, an arrangement may include customer-specified acceptance provisions or performance guarantees that allow the customer to accept or reject delivered products that do not meet the customer’s specifications. If the Company can objectively determine that control of a good or service has been transferred to the customer in accordance with the agreed-upon specifications in the contract, then customer acceptance is a formality. If acceptance provisions are presumed to be substantive, then revenue is deferred until customer acceptance.
For the Company’s standard products and services, revenue recognition and billing typically occur at the same time. For application-specific customer solutions, however, the agreement with the customer may provide for billing terms which differ from revenue recognition criteria, resulting in either deferred revenue or unbilled revenue. Credit assessments are performed to determine payment terms, which vary by region, industry, and customer. Prepayment terms result in contract liabilities for customer deposits. When credit is granted to customers, payment is typically due 30 to 90 days from billing. The Company's contracts have an original expected duration of less than one year, and therefore as a practical expedient, the Company has elected to ignore the impact of the time value of money on a contract and to expense sales commissions. The Company recognizes an asset for costs to fulfill a contract if the costs relate directly to the contract and to future performance, and the costs are expected to be recovered.
Management exercises judgment when determining the amount of revenue to be recognized each period. Such judgments include, but are not limited to, assessing the customer’s ability and intention to pay substantially all of the contract consideration when due, determining when two or more contracts should be combined and accounted for as a single contract, determining whether a contract modification has occurred, assessing whether promises are immaterial in the context of the contract, determining whether material promises in a contract represent distinct performance obligations, estimating the transaction price for a contract that contains variable consideration, determining the stand-alone selling price of each performance obligation, determining whether control is transferred over time or at a point in time for performance obligations, and assessing whether formal customer acceptance provisions are substantive.
Investments
As of December 31, 2019, the Company’s investment portfolio of debt securities totaled $669,594,000. The debt securities are reported at fair value, with unrealized gains and losses, net of tax, recorded in shareholders’ equity as other comprehensive income (loss) since these securities are designated as available-for-sale securities. As of December 31, 2019, the Company’s portfolio of debt securities had a net unrealized gain of $2,351,000. Included in this net gain were gross unrealized losses totaling $65,000 of which $39,000 were in a loss position for less than twelve months and $26,000 were in a loss position for greater than twelve months.
The Company applies a three-level valuation hierarchy for fair value measurements. The categorization of assets and liabilities within the valuation hierarchy is based upon the lowest level of input that is significant to the measurement of fair value. Level 1 inputs to the valuation methodology utilize unadjusted quoted market prices in active markets for identical assets and liabilities. Level 2 inputs to the valuation methodology are other observable inputs, including quoted market prices for similar assets and liabilities, quoted prices for identical and similar assets and liabilities in markets that are not active, or other inputs that are observable or can be corroborated by observable market data. Level 3 inputs to the valuation methodology are unobservable inputs based upon management’s best estimate of the inputs that market participants would use in pricing the asset or liability at the measurement date, including assumptions about risk. Changes in the valuation methodology, interest rates, credit rates, or the market for these investments could result in changes to their fair values. Changes to the Level of an investment within the fair value hierarchy are determined at the end of the reporting period.
The Company’s debt securities are reported at fair value based upon model-driven valuations in which all significant inputs are observable or can be derived from or corroborated by observable market data for substantially the full term
26
of the asset, and are therefore classified as Level 2. Management is responsible for estimating the fair value of these financial assets and liabilities, and in doing so, considers valuations provided by a large, third-party pricing service. This service maintains regular contact with market makers, brokers, dealers, and analysts to gather information on market movement, direction, trends, and other specific data. They use this information to structure yield curves for various types of debt securities and arrive at the daily valuations.
Management monitors the carrying value of its debt securities compared to their fair value to determine whether an other-than-temporary impairment has occurred. In considering whether a decline in fair value is other-than-temporary, we consider many factors, both qualitative and quantitative in nature, including the type of security, the credit rating of the security, the length of time the security has been in a loss position, the size of the loss position, our ability and intent to hold the security to expected recovery of value, and other meaningful information. If a decline in fair value is determined to be other-than-temporary, an impairment charge would be recorded in current operations to reduce the carrying value of the investment to its fair value. There were no other-than-temporary impairments of investments in 2019, 2018, or 2017.
Accounts Receivable
The Company maintains reserves against its accounts receivable for potential credit losses. Ongoing credit evaluations of customers are performed and the Company has historically not experienced significant losses related to the collection of its accounts receivable. Allowances for specific accounts determined to be at risk for collection are estimated by management taking into account the length of time the receivable has been outstanding, the customer’s current ability to pay its obligations to the Company, general economic and industry conditions, as well as various other factors. Global economic uncertainty may result in longer payment cycles and challenges in collecting accounts receivable balances, which make these estimates more judgmental. An adverse change in any of these factors could result in higher than expected customer defaults and may result in the need for additional bad debt provisions. As of December 31, 2019, the Company’s reserve against accounts receivable was $1,821,000, or 2% of the gross accounts receivable balance. A 10% difference in the reserve against accounts receivable as of December 31, 2019 would have affected net income by approximately $153,000.
Inventories
Inventories are stated at the lower of cost and net realizable value. Net realizable value is the estimated selling price in the ordinary course of business, less readily predictable costs of completion, disposal, and transportation. Management estimates excess and obsolescence exposures based upon assumptions about future demand, product transitions, and market conditions, and records reserves to reduce the carrying value of inventories to their net realizable value. Volatility in the global economy makes these assumptions about future demand more judgmental. Among the risks associated with the introduction of new products are difficulty predicting customer demand and effectively managing inventory levels to ensure adequate supply of the new product and avoid excess supply of the legacy product. In addition, we may strategically enter into non-cancelable commitments with vendors to purchase materials for products in advance of demand to take advantage of favorable pricing or address concerns about the availability of future supplies and long lead times. As of December 31, 2019, the Company’s reserve for excess and obsolete inventory totaled $7,066,000, or 10% of the gross inventory balance. A 10% difference in inventory reserves as of December 31, 2019 would have affected net income by approximately $595,000.
Leases
The Company accounts for leases in accordance with Accounting Standard Codification (ASC) 842, "Leases." The core principle of ASC 842 is that a lessee should recognize on the balance sheet the assets and liabilities that arise from leases. The application of this rule requires the Company to determine whether a contract is or contains a lease by assessing whether there is an identified asset and whether the contract conveys the right to control the use of the identified asset for a period of time in exchange for consideration. In the determination of the lease term, the Company considers the existence of extension or termination options and the probability of those options being exercised.
The Company must also determine whether the lease meets the criteria for classification as a finance lease by assessing whether the lease transfers ownership of the underlying asset to the Company by the end of the lease term, the lease grants the Company an option to purchase the underlying asset that the Company is reasonably certain to exercise, the lease term is for the major part of the remaining economic life of the underlying asset, the present value of the sum of the lease payments and any residual value guaranteed by the Company equals or exceeds substantially all of the fair value of the underlying asset, and the underlying asset is of such a specialized nature that it is expected to have no alternative use to the lessor at the end of the lease term.
27
Long-lived Assets
The Company has long-lived assets, including property, plant, and equipment and acquired intangible assets. These assets are susceptible to shortened estimated useful lives and changes in fair value due to changes in their use, market or economic changes, or other events or circumstances. The Company evaluates the potential impairment of these long-lived assets whenever events or circumstances indicate their carrying value may not be recoverable. Factors that could trigger an impairment review include historical or projected results that are less than the assumptions used in the original valuation of an acquired asset, a change in the Company’s business strategy or its use of an acquired asset, or negative economic or industry trends.
If an event or circumstance indicates the carrying value of long-lived assets may not be recoverable, the Company assesses the recoverability of the assets by comparing the carrying value of the assets to the sum of the undiscounted future cash flows that the assets are expected to generate over their remaining economic lives. If the carrying value exceeds the sum of the undiscounted future cash flows, the Company compares the fair value of the long-lived assets to the carrying value and records an impairment loss for the difference. The Company generally estimates the fair value of its long-lived assets using the income approach based upon a discounted cash flow model. The income approach requires the use of many assumptions and estimates including future revenues and expenses, discount factors, income tax rates, the identification of groups of assets with highly independent cash flows, and assets’ economic lives. Volatility in the global economy makes these assumptions and estimates more judgmental. In 2017, the Company determined that the carrying value of the customer relationships arising from the acquisition of AQSense S.L. was impaired and reduced this value to zero, resulting in an impairment charge of $469,000. The Company did not record an impairment charge related to long-lived assets in 2019 or 2018. Actual future operating results and the remaining economic lives of our long-lived assets could differ from those used in assessing the recoverability of these assets and could result in an impairment of long-lived assets in future periods.
Internal-use Software
The accounting treatment for computer software developed for internal use depends upon the nature of activities performed at each stage of development. The preliminary project stage includes conceptual formulation of design alternatives, determination of system requirements, vendor demonstrations, and final selection of vendors, and during this stage costs are expensed as incurred. The application development stage includes software configuration, coding, hardware installation, and testing. During this stage, certain costs are capitalized, including external direct costs of materials and services, as well as payroll and payroll-related costs for employees who are directly associated with the project, while certain costs are expensed as incurred, including training and data conversion costs. The post-implementation stage includes support and maintenance, and during this stage costs are expensed as incurred. Capitalization begins when both the preliminary project stage is completed and management commits to funding the project. Capitalization ceases at the point the project is substantially complete and ready for its intended use, that is, after all substantial testing is completed. The application of these rules requires the use of judgment to determine when the project has reached the next stage of development, which costs are directly associated with the project, and when the asset is ready for its intended use.
Goodwill
Management evaluates the potential impairment of goodwill annually each fourth quarter and whenever events or circumstances indicate the carrying value may not be recoverable. Impairment of goodwill is the condition that exists when the carrying amount of a reporting unit exceeds its fair value. The Company currently operates under one reporting unit which is the level at which the goodwill impairment analysis is performed. Determining the Company’s reporting units requires judgments regarding what constitutes a business and at what level discrete financial information is available and reviewed by management.
The Company performs a qualitative assessment of goodwill to determine whether further impairment testing is necessary. If this qualitative assessment indicates that it is more likely than not that the fair value of a reporting unit is less than its carrying amount, the entity would proceed to perform a quantitative impairment test. Under this quantitative analysis, the Company compares the fair value of the reporting unit with its carrying value, including goodwill. If the carrying amount exceeds the fair value of the reporting unit, the Company recognizes an impairment charge. The Company estimates the fair value of its reporting unit using the income approach based upon a discounted cash flow model. In addition, the Company uses the market approach, which compares the reporting unit to publicly-traded companies and transactions involving similar businesses, to support the conclusions based upon the income approach. The income approach requires the use of many assumptions and estimates including future revenues, expenses, capital expenditures, and working capital, as well as discount factors and income tax rates.
Factors that management considered in the qualitative assessment include macroeconomic conditions, industry and market considerations, overall financial performance (both current and projected), changes in management or strategy,
28
changes in the composition or carrying amount of net assets, and market capitalization. Based on the qualitative assessment, management does not believe that it is more likely than not that the carrying value of its reporting unit exceeds its fair value. No impairment losses were recorded in 2019, 2018, or 2017.
Warranty Obligations
The Company records the estimated cost of fulfilling product warranties at the time of sale based upon historical costs to fulfill claims. Obligations may also be recorded subsequent to the time of sale whenever specific events or circumstances impacting product quality become known that would not have been taken into account using historical data. While we engage in extensive product quality programs and processes, including actively monitoring and evaluating the quality of our component suppliers and third-party contract manufacturers, the Company’s warranty obligation is affected by product failure rates, material usage, and service delivery costs incurred in correcting a product failure. An adverse change in any of these factors may result in the need for additional warranty provisions. As of December 31, 2019, the Company’s accrued warranty obligations amounted to $4,713,000. A 10% difference in accrued warranty obligations as of December 31, 2019 would have affected net income by approximately $397,000.
Contingencies
Estimated losses from contingencies are accrued by management based upon whether a loss is probable and whether management has the ability to reasonably estimate the amount of the loss. Estimating potential losses, or even a range of losses, is difficult and involves a great deal of judgment. Management relies primarily on assessments made by its internal and external legal counsel to make the determination as to whether a loss contingency arising from litigation should be recorded or disclosed. This analysis is performed each reporting period or when facts and circumstances dictate. Should the resolution of a contingency result in a loss that we did not accrue because management did not believe that the loss was probable or capable of being reasonably estimated, then this loss would result in a charge to income in the period the contingency was resolved. The Company did not have any significant accrued contingencies as of December 31, 2019.
Derivative Instruments
In certain instances, the Company enters into forward contracts to hedge against foreign currency fluctuations. The Company's forward contracts are reported at fair value based upon model-driven valuations in which all significant inputs are observable or can be derived from or corroborated by observable market data for substantially the full term of the asset or liability, and are therefore classified as Level 2. The Company's forward contracts are typically traded or executed in over-the-counter markets with a relatively high degree of pricing transparency. The market participants are generally large commercial banks.
The Company may enter into two types of hedges to manage foreign currency exchange rate risk. The first are economic hedges which utilize foreign currency forward contracts to manage the exposure to fluctuations in foreign currency exchange rates arising primarily from foreign-denominated receivables and payables. The gains and losses on these derivatives are intended to be offset by the changes in the fair value of the assets and liabilities being hedged. These economic hedges are not designated as effective hedges, and therefore, do not qualify for effective hedge accounting. The second are cash flow hedges which utilize foreign currency forward contracts to protect our budgeted revenues and expenses against foreign currency exchange rate changes compared to our budgeted rates. These cash flow hedges are designated for hedge accounting, and therefore, the effective portion of the forward contract's gain or loss is reported in shareholders' equity as other comprehensive income (loss) and is reclassified into current operations as the hedged transaction impacts current operations. Should these hedges fail to qualify for hedge accounting or be ineffective, the gain or loss on the forward contract would be reported in current operations immediately as opposed to when the hedged transaction impacts current operations. This may result in material foreign currency gains or losses.
Stock-Based Compensation
Compensation expense is recognized for all grants of stock options and restricted stock units. Determining the appropriate valuation model and estimating the fair values of these grants requires the input of subjective assumptions, including expected stock price volatility, dividend yields, expected term, and forfeiture rates. The expected volatility assumption is based partially upon the historical volatility of the Company’s common stock, which may or may not be a true indicator of future volatility. The assumptions used in calculating the fair values of stock option grants represent management’s best estimates, but these estimates involve inherent uncertainties and the application of judgment. As a result, if factors change and different assumptions are used, stock-based compensation expense could be significantly different from what the Company recorded in the current period.
29
Income Taxes
Significant judgment is required in determining worldwide income tax expense based upon tax laws in the various jurisdictions in which the Company operates. The Company has established reserves for income taxes by applying the “more likely than not” criteria, under which the recognition threshold is met when an entity concludes that a tax position, based solely on its technical merits, is more likely than not to be sustained upon examination by the relevant tax authority. All tax positions are analyzed periodically and adjustments are made as events occur that warrant modification, such as the completion of audits or the expiration of statutes of limitations, which may result in future charges or credits to income tax expense.
As part of the process of preparing consolidated financial statements, management is required to estimate income taxes in each of the jurisdictions in which the Company operates. This process involves estimating the current tax liability, as well as assessing temporary differences arising from the different treatment of items for financial statement and tax purposes. These differences result in deferred tax assets and liabilities, which are recorded on the Consolidated Balance Sheets.
The Tax Act imposed a minimum tax on foreign earnings related to intangible assets, known as the Global Intangible Low-Taxed Income (GILTI) tax. In the fourth quarter of 2019, the Company elected to account for the impact of the GILTI minimum tax in deferred taxes, a change from the Company’s initial election made in the third quarter of 2018 whereby the GILTI minimum tax was included in income tax expense as incurred on an annual basis. Management has determined that this change is considered preferable, based upon the conclusion that it appropriately matches the Company’s current and deferred income tax implications related to the change in tax structure noted below.
In the fourth quarter of 2019, the Company made changes to its international tax structure as a result of tax reform legislation enacted by the European Union that resulted in an intercompany sale of intellectual property based upon the fair value of this intellectual property. Also in the fourth quarter of 2019, in connection with the acquisition of Sualab Co. Ltd., the Company migrated acquired intellectual property to certain subsidiaries to align with its corporate tax structure. Significant judgment was required to estimate the fair value of the migrated intellectual property, including management estimates related to forecasted future cash flows and discount rates.
Business Acquisitions
Business combinations are accounted for under the acquisition method of accounting. Determining what constitutes a business to qualify as a business combination requires some judgment. Allocating the purchase price requires the Company to identify and estimate the fair values of various assets acquired and liabilities assumed. Management is responsible for determining the appropriate valuation model and estimated fair values, and in doing so, considers a number of factors, including information provided by an outside valuation advisor. Management primarily establishes fair value using the income approach based upon a discounted cash flow model. The income approach requires the use of many assumptions and estimates including future revenues and expenses, as well as discount factors. Contingent consideration liabilities are reported at their estimated fair values based upon probability-adjusted present values of the consideration expected to be paid, using significant inputs and estimates. Key assumptions used in these estimates include probability assessments with respect to the likelihood of achieving certain milestones and discount rates consistent with the level of risk of achievement. The fair value of these contingent consideration liabilities are remeasured each reporting period, with changes in the fair value recorded in "Other income (expense)" on the Consolidated Statement of Operations. The remeasured liability amount could be significantly different from the amount at the acquisition date, resulting in material charges or credits in future reporting periods.
NEW PRONOUNCEMENTS
Refer to Part II, Item 8 - Note 2 within this Form 10-K, for a full description of recently issued accounting pronouncements including the expected dates of adoption and expected impact on the financial position and results of operations of the Company.
ITEM 7A: QUANTITATIVE AND QUALITATIVE DISCLOSURES ABOUT MARKET RISK
The Company is exposed to certain risks relating to its ongoing business operations, including foreign currency exchange rate risk and interest rate risk. The Company currently mitigates certain foreign currency exchange rate risks with derivative instruments. The Company does not currently manage its interest rate risk with derivative instruments.
30
Foreign Currency Risk
The Company faces exposure to foreign currency exchange rate fluctuations, as a significant portion of its revenues, expenses, assets, and liabilities are denominated in currencies other than the functional currencies of the Company’s subsidiaries or the reporting currency of the Company, which is the U.S. Dollar. In certain instances, we utilize forward contracts to hedge against foreign currency fluctuations. These contracts are used to minimize foreign gains or losses, as the gains or losses on the derivative are intended to offset the losses or gains on the underlying exposure. We do not engage in foreign currency speculation.
The Company’s foreign currency risk management strategy is principally designed to mitigate the potential financial impact of changes in the value of transactions and balances denominated in foreign currencies resulting from changes in foreign currency exchange rates. The Company may enter into two types of hedges to manage this risk. The first are economic hedges which utilize foreign currency forward contracts with maturities of up to 45 days to manage the exposure to fluctuations in foreign currency exchange rates arising primarily from foreign-denominated receivables and payables. The gains and losses on these derivatives are intended to be offset by the changes in the fair value of the assets and liabilities being hedged. The second are cash flow hedges which utilize foreign currency forward contracts with maturities of up to 18 months to hedge specific forecasted transactions of the Company's foreign subsidiaries with the goal of protecting our budgeted revenues and expenses against foreign currency exchange rate changes compared to our budgeted rates. The Company did not have any cash flow hedges as of December 31, 2019 and 2018.
The Company had the following outstanding forward contracts (in thousands):
December 31, 2019 | December 31, 2018 | ||||||||||||||||||
Currency | Notional Value | USD Equivalent | High Rate | Low Rate | Notional Value | USD Equivalent | High Rate | Low Rate | |||||||||||
Derivatives Not Designated as Hedging Instruments: | |||||||||||||||||||
Korean Won | 161,951,500 | $ | 139,688 | 1,155 | 1,155 | 3,125,000 | $ | 2,808 | 1,113 | 1,113 | |||||||||
Euro | 18,000 | 20,249 | 0.8917 | 0.8917 | 23,000 | 26,330 | 0.8735 | 0.8735 | |||||||||||
Japanese Yen | 575,000 | 5,291 | 108.70 | 108.70 | 380,000 | 3,459 | 109.86 | 109.86 | |||||||||||
Mexican Peso | 80,000 | 4,223 | 18.94 | 18.94 | — | — | — | — | |||||||||||
British Pound | 2,700 | 3,569 | 0.7541 | 0.7541 | 2,500 | 3,204 | 0.7803 | 0.7803 | |||||||||||
Hungarian Forint | 870,000 | 2,962 | 295.3 | 295.3 | 750,000 | 2,685 | 279.3 | 279.3 | |||||||||||
Taiwanese Dollar | 37,450 | 1,256 | 29.91 | 29.91 | 55,000 | 1,807 | 30.43 | 30.43 | |||||||||||
Canadian Dollar | 1,300 | 1,000 | 1.2989 | 1.2989 | 990 | 726 | 1.3639 | 1.3639 | |||||||||||
Singapore Dollar | 845 | 628 | 1.3461 | 1.3461 | 700 | 514 | 1.3628 | 1.3628 | |||||||||||
A change in foreign currency exchange rates could materially impact the fair value of these contracts; however, if this occurred, the fair value of the underlying exposures hedged by the contracts would change by a similar amount. Accordingly, management does not believe that a material change in foreign currency exchange rates used in the fair value of our derivative instruments would materially impact operations or cash flows.
The success of our foreign currency risk management program depends upon forecasts of transaction activity denominated in various currencies. To the extent that these forecasts are overstated or understated during periods of currency volatility, we could experience unanticipated foreign currency gains or losses that could have a material impact on our results of operations. Furthermore, our failure to identify new exposures and hedge them in an effective manner may result in material foreign currency gains or losses.
The Company’s functional currency/reporting currency exchange rate exposures result from revenues and expenses that are denominated in currencies other than the U.S. Dollar. A significant portion of our revenues and expenses are denominated in the Euro, the Chinese Yuan, and the Japanese Yen. Our predominant currency of sale is the U.S. Dollar in the Americas, the Euro and U.S. Dollar in Europe, the Yuan in Mainland China, the Yen in Japan, and the U.S. Dollar in other regions. We estimate that approximately 44% of our sales in 2019 were invoiced in currencies other than the U.S. Dollar, and we expect sales denominated in foreign currencies to continue to represent a significant portion of our total revenue. While we also have expenses denominated in these same foreign currencies, the impact on revenues has historically been, and is expected to continue to be, greater than the offsetting impact on expenses. Therefore, in times when the U.S. Dollar strengthens in relation to these foreign currencies, we would expect to report a net decrease in operating income. Conversely, in times when the U.S. Dollar weakens in relation to these foreign currencies,
31
we would expect to report a net increase in operating income. Thus, changes in the relative strength of the U.S. Dollar may have a material impact on our operating results.
Interest Rate Risk
The Company’s investment portfolio of debt securities includes corporate bonds, treasury bills, asset-backed securities, sovereign bonds, agency bonds, and municipal bonds. Debt securities with original maturities greater than three months are designated as available-for-sale and are reported at fair value. As of December 31, 2019, the fair value of the Company’s portfolio of debt securities amounted to $669,594,000 with amortized cost amounts totaling $667,243,000, maturities that do not exceed five years, and a yield to maturity of 2.2%. Differences between the fair value and principal amounts of the Company’s portfolio of debt securities are primarily attributable to discounts and premiums arising at the acquisition date, as well as unrealized gains and losses as of the balance sheet date.
The Company’s investment policy allows investment in debt securities with effective maturities up to ten years, however as of December 31, 2019, 99% of the investment portfolio has effective maturity dates of less than three years. Given the relatively short maturities and investment-grade quality of the Company’s portfolio of debt securities as of December 31, 2019, a sharp rise in interest rates should not have a material adverse effect on the fair value of these instruments. As a result, the Company does not currently hedge these interest rate exposures.
The following table presents the hypothetical change in the fair value of the Company’s portfolio of debt securities arising from selected potential changes in interest rates (in thousands). This modeling technique measures the change in fair value that would result from a parallel shift in the yield curve plus or minus 50 and 100 basis points (BP) over a twelve-month time horizon.
Type of security | Valuation of securities given an interest rate decrease | No change in interest rates | Valuation of securities given an interest rate increase | |||||||||||||||||
(100 BP) | (50 BP) | 50 BP | 100 BP | |||||||||||||||||
Treasury bills | $ | 312,063 | $ | 310,656 | $ | 309,248 | $ | 307,841 | $ | 306,434 | ||||||||||
Corporate bonds | 214,029 | 213,064 | 212,098 | 211,134 | 210,169 | |||||||||||||||
Asset-backed securities | 114,111 | 113,596 | 113,083 | 112,567 | 112,053 | |||||||||||||||
Sovereign bonds | 22,502 | 22,400 | 22,299 | 22,197 | 22,096 | |||||||||||||||
Municipal bonds | 7,015 | 6,984 | 6,952 | 6,921 | 6,889 | |||||||||||||||
Agency bonds | 5,967 | 5,941 | 5,914 | 5,887 | 5,860 | |||||||||||||||
$ | 675,687 | $ | 672,641 | $ | 669,594 | $ | 666,547 | $ | 663,501 | |||||||||||
32
ITEM 8: FINANCIAL STATEMENTS AND SUPPLEMENTARY DATA
INDEX TO FINANCIAL STATEMENTS AND SUPPLEMENTARY DATA
Consolidated Financial Statements: | |
Financial Statement Schedule: | |
33
REPORT OF INDEPENDENT REGISTERED PUBLIC ACCOUNTING FIRM
Board of Directors and Shareholders
Cognex Corporation
Opinion on the financial statements
We have audited the accompanying consolidated balance sheets of Cognex Corporation (a Massachusetts corporation) and subsidiaries (the “Company”) as of December 31, 2019 and 2018, the related consolidated statements of operations, comprehensive income, shareholders’ equity, and cash flows for each of the three years in the period ended December 31, 2019, and the related notes and financial statement schedule included under Item 15(2) (collectively referred to as the “financial statements”). In our opinion, the financial statements present fairly, in all material respects, the financial position of the Company as of December 31, 2019 and 2018, and the results of its operations and its cash flows for each of the three years in the period ended December 31, 2019, in conformity with accounting principles generally accepted in the United States of America.
We also have audited, in accordance with the standards of the Public Company Accounting Oversight Board (United States) (“PCAOB”), the Company’s internal control over financial reporting as of December 31, 2019, based on criteria established in the 2013 Internal Control-Integrated Framework issued by the Committee of Sponsoring Organizations of the Treadway Commission (“COSO”), and our report dated February 13, 2020 expressed an unqualified opinion.
Basis for opinion
These financial statements are the responsibility of the Company’s management. Our responsibility is to express an opinion on the Company’s financial statements based on our audits. We are a public accounting firm registered with the PCAOB and are required to be independent with respect to the Company in accordance with the U.S. federal securities laws and the applicable rules and regulations of the Securities and Exchange Commission and the PCAOB.
We conducted our audits in accordance with the standards of the PCAOB. Those standards require that we plan and perform the audit to obtain reasonable assurance about whether the financial statements are free of material misstatement, whether due to error or fraud. Our audits included performing procedures to assess the risks of material misstatement of the financial statements, whether due to error or fraud, and performing procedures that respond to those risks. Such procedures included examining, on a test basis, evidence supporting the amounts and disclosures in the financial statements. Our audits also included evaluating the accounting principles used and significant estimates made by management, as well as evaluating the overall presentation of the financial statements. We believe that our audits provide a reasonable basis for our opinion.
Critical audit matters
The critical audit matters communicated below are matters arising from the current period audit of the financial statements that were communicated or required to be communicated to the audit committee and that: (1) relate to accounts or disclosures that are material to the financial statements and (2) involved our especially challenging, subjective, or complex judgments. The communication of critical audit matters does not alter in any way our opinion on the financial statements, taken as a whole, and we are not, by communicating the critical audit matters below, providing separate opinions on the critical audit matters or on the accounts or disclosures to which they relate.
Revenue recognition - Application-Specific Customer Solutions
As described further in Notes 1 and 14 to the consolidated financial statements, the Company recognizes revenue from application-specific customer solutions. For these transactions, revenue is recognized at the point in time control is transferred to the customer, which is when the solution is validated, and the Company can objectively determine that the agreed-upon specifications in the contract have been met and the customer will accept the performance obligation in the contract. We identified revenue recognition related to application-specific customer solutions as a critical audit matter.
The principal considerations for our determination that application-specific customer solutions revenue is a critical audit matter are that determining the timing of validation and that the agreed-upon specifications in the contract have been met relies on the use of management estimates and requires a higher degree of auditor subjectivity and judgment in designing and executing audit procedures. Accounting for application-specific customer solutions requires the Company to monitor and evaluate customer contracts on an ongoing basis to determine the point in time at which the agreed-upon specifications in the contract have been met.
34
Our audit procedures related to the revenue recognition of application-specific customer solutions included the following, among others.
• | We tested the design and operating effectiveness of internal controls related to the monitoring of application-specific customer solutions and the determination of the timing of revenue recognition. |
• | We evaluated management’s significant accounting policies related to these customer contracts for appropriate revenue recognition based on key terms and provisions. |
• | For a sample of transactions, we inspected source documents, including the customer contract or purchase order, third-party shipping information, invoice, and relevant communications. |
Income Taxes - Fair Value of Intellectual Property and Change in Accounting Policy for Global Intangible Low-Taxed Income (GILTI)
As described further in Notes 1 and 18 to the consolidated financial statements, effective December 31, 2019, the Company executed an intercompany sale of intellectual property that resulted in the establishment of a deferred tax asset and an income tax benefit in Ireland based on the fair value of the intellectual property. From a United States tax perspective the sale is disregarded and any future tax deduction in Ireland will not be regarded when determining Global Intangible Low-Taxed Income (GILTI). The Company determined that changing their accounting policy to recognize deferred tax assets and liabilities for basis differences that are expected to affect the amount of GILTI inclusion upon reversal is preferable. As a result of this change in accounting policy, the Company recorded a deferred tax liability and corresponding deferred income tax expense representing the future GILTI tax implications related to the fair value of intellectual property transferred to Ireland. We identified the Company’s determination of the fair value of the intellectual property sold and related change in accounting policy as a critical audit matter.
The principal considerations for our determination that the sale of intellectual property and change in accounting policy is a critical audit matter are that the determination of the fair value of the intellectual property relies on the use of management estimates related to forecasted future cash flows and discount rates. This requires management to evaluate historical results and expectations of future operating performance based on relevant information available to them regarding expectations of industry performance, as well as, expectations for company-specific performance. Determining the discount rate requires management to evaluate the appropriate risk premium based on their judgment of industry and company-specific risks. Significant management judgments and estimates utilized to determine the fair value are subject to estimation uncertainty and require significant auditor subjectivity in evaluating the reasonableness of those judgments and estimates. In addition, changing the Company’s accounting policy requires management to make a judgment as to the preferability of the accounting policy in relation to the financial statements taken as a whole.
Our audit procedures related to this critical audit matter included the following, among others.
• | We tested the design and operating effectiveness of internal controls related to management’s determination of the fair value of the Company’s intellectual property, including controls over the determination of key inputs related to forecasting of future cash flows and determination of the discount rate. |
• | We evaluated management’s historical ability to achieve forecasted revenue and operating results. |
• | We compared management’s forecasts of future revenue and operating results to third-party industry projections and historical operating results. |
• | We performed sensitivity analysis on the Company’s future cash flows and discount rate to evaluate the reasonableness of management’s forecasts. |
• | We utilized a valuation specialist to assist in testing the Company’s discounted cash flow model and in evaluating the reasonableness of significant assumptions to the model, including the discount rate. |
• | We consulted with our national office and utilized individuals with specialized skill and knowledge in income tax accounting in evaluating the preferability of the change in accounting policy. |
Business Combinations - Acquisition of Sualab Co., Ltd.
As described further in notes 1 and 21 to the consolidated financial statements, on October 16, 2019, the Company acquired Sualab Co., Ltd. In accordance with ASC 805, Business Combinations, the Company allocated the purchase price to the identifiable assets acquired based on their fair values. We identified the Company’s determination of the fair value of the identifiable intangible assets acquired as a critical audit matter.
35
The principal considerations for our determination that the fair value of identifiable intangible assets acquired is a critical audit matter are that the determination of the fair value of the intangible assets relies on the use of management estimates related to forecasted future cash flows and discount rates. This requires management to evaluate historical results and expectations of future operating performance based on relevant information available to them regarding expectations of industry performance, as well as, expectations for company-specific performance. Determining the discount rate requires management to evaluate the appropriate risk premium based on their judgment of industry and company-specific risks. Significant management judgments and estimates utilized to determine the fair value are subject to estimation uncertainty and require significant auditor subjectivity in evaluating the reasonableness of those judgments and estimates.
Our audit procedures related to the determination of the fair value of acquired intangible assets included the following, among others.
• | We tested the design and operating effectiveness of internal controls relating to management’s determination of the fair value of the acquired identifiable intangible assets, including controls over the determination of key inputs related to forecasting of future cash flows and determination of the discount rate. |
• | We evaluated management’s historical ability to achieve forecasted revenue and operating results. |
• | We compared management’s forecasts of future revenue and operating margin to third-party industry projections and historical operating results. |
• | We performed sensitivity analysis on the Company’s future cash flows and discount rate to evaluate the reasonableness of management’s forecasts. |
• | We utilized a valuation specialist to assist in testing the Company’s discounted cash flow model and in evaluating the reasonableness of significant assumptions to the model, including the discount rate. |
/s/ GRANT THORNTON LLP
We have served as the Company’s auditor since 2007.
Boston, Massachusetts
February 13, 2020
36
COGNEX CORPORATION – CONSOLIDATED STATEMENTS OF OPERATIONS
Year Ended December 31, | |||||||||||
2019 | 2018 | 2017 | |||||||||
(In thousands, except per share amounts) | |||||||||||
Revenue | $ | $ | $ | ||||||||
Cost of revenue | |||||||||||
Gross margin | |||||||||||
Research, development, and engineering expenses | |||||||||||
Selling, general, and administrative expenses | |||||||||||
Operating income | |||||||||||
Foreign currency gain (loss) | ( | ) | ( | ) | ( | ) | |||||
Investment income | |||||||||||
Other income (expense) | ( | ) | ( | ) | |||||||
Income before income tax expense | |||||||||||
Income tax expense (benefit) | ( | ) | |||||||||
Net income | $ | $ | $ | ||||||||
Net Income per weighted-average common and common-equivalent share (1): | |||||||||||
Basic | $ | $ | $ | ||||||||
Diluted | $ | $ | $ | ||||||||
Weighted-average common and common-equivalent shares outstanding (1): | |||||||||||
Basic | |||||||||||
Diluted | |||||||||||
Cash dividends per common share (1) | $ | $ | $ | ||||||||
(1) Prior period results have been adjusted to reflect the two-for-one stock split effected in the form of a stock dividend which occurred in the fourth quarter of 2017. | |||||||||||
The accompanying notes are an integral part of these consolidated financial statements.
37
COGNEX CORPORATION – CONSOLIDATED STATEMENTS OF COMPREHENSIVE INCOME
Year Ended December 31, | |||||||||||
2019 | 2018 | 2017 | |||||||||
(In thousands) | |||||||||||
Net income | $ | $ | $ | ||||||||
Other comprehensive income (loss), net of tax: | |||||||||||
Cash flow hedges: | |||||||||||
Net unrealized gain (loss), net of tax of $0, $0, and ($5) in 2019, 2018, and 2017, respectively | |||||||||||
Reclassification of net realized (gain) loss into current operations | ( | ) | |||||||||
Net change related to cash flow hedges | ( | ) | |||||||||
Available-for-sale investments: | |||||||||||
Net unrealized gain (loss), net of tax of $515, ($188), and $2 in 2019, 2018, and 2017, respectively | ( | ) | |||||||||
Reclassification of net realized (gain) loss into current operations | ( | ) | ( | ) | ( | ) | |||||
Net change related to available-for-sale investments | ( | ) | ( | ) | |||||||
Foreign currency translation adjustments: | |||||||||||
Foreign currency translation adjustments | ( | ) | ( | ) | |||||||
Net change related to foreign currency translation adjustments | ( | ) | ( | ) | |||||||
Other comprehensive income (loss), net of tax | ( | ) | |||||||||
Total comprehensive income | $ | $ | $ | ||||||||
The accompanying notes are an integral part of these consolidated financial statements.
38
COGNEX CORPORATION – CONSOLIDATED BALANCE SHEETS
December 31, | |||||||
2019 | 2018 | ||||||
(In thousands) | |||||||
ASSETS | |||||||
Current assets: | |||||||
Cash and cash equivalents | $ | $ | |||||
Current investments | |||||||
Accounts receivable, less reserves of $1,821 and $1,646 in 2019 and 2018, respectively | |||||||
Unbilled revenue | |||||||
Inventories | |||||||
Prepaid expenses and other current assets | |||||||
Total current assets | |||||||
Non-current investments | |||||||
Property, plant, and equipment, net | |||||||
Operating lease assets | |||||||
Goodwill | |||||||
Intangible assets, net | |||||||
Deferred income taxes | |||||||
Other assets | |||||||
Total assets | $ | $ | |||||
LIABILITIES AND SHAREHOLDERS’ EQUITY | |||||||
Current liabilities: | |||||||
Accounts payable | $ | $ | |||||
Accrued expenses | |||||||
Accrued income taxes | |||||||
Deferred revenue and customer deposits | |||||||
Operating lease liabilities | |||||||
Total current liabilities | |||||||
Non-current operating lease liabilities | |||||||
Deferred income taxes | |||||||
Reserve for income taxes | |||||||
Non-current accrued income taxes | |||||||
Other liabilities | |||||||
Total liabilities | |||||||
Commitments and contingencies (Note 11) | |||||||
Shareholders’ equity: | |||||||
Preferred stock,$.01 par value - Authorized: 400 shares in 2019 and 2018, respectively, no shares issued and outstanding | |||||||
Common stock, $.002 par value – Authorized: 300,000 shares in 2019 and 2018, respectively, issued and outstanding: 172,440 and 170,820 shares in 2019 and 2018, respectively | |||||||
Additional paid-in capital | |||||||
Retained earnings | |||||||
Accumulated other comprehensive loss, net of tax | ( | ) | ( | ) | |||
Total shareholders’ equity | |||||||
$ | $ | ||||||
The accompanying notes are an integral part of these consolidated financial statements.
39
COGNEX CORPORATION – CONSOLIDATED STATEMENTS OF CASH FLOWS
Year Ended December 31, | |||||||||||
2019 | 2018 | 2017 | |||||||||
(In thousands) | |||||||||||
Cash flows from operating activities: | |||||||||||
Net income | $ | $ | $ | ||||||||
Adjustments to reconcile net income to net cash provided by operating activities: | |||||||||||
Stock-based compensation expense | |||||||||||
Depreciation of property, plant, and equipment | |||||||||||
Amortization of intangible assets | |||||||||||
Impairment of intangible assets | |||||||||||
Amortization of discounts or premiums on investments | ( | ) | |||||||||
Realized (gain) loss on sale of investments | ( | ) | ( | ) | ( | ) | |||||
Revaluation of contingent consideration | ( | ) | ( | ) | ( | ) | |||||
Change in deferred income taxes | ( | ) | ( | ) | |||||||
Changes in operating assets and liabilities: | |||||||||||
Accounts receivable | ( | ) | ( | ) | |||||||
Unbilled revenue | ( | ) | ( | ) | |||||||
Inventories | ( | ) | ( | ) | |||||||
Prepaid expenses and other current assets | ( | ) | ( | ) | |||||||
Accounts payable | ( | ) | |||||||||
Accrued expenses | ( | ) | |||||||||
Accrued income taxes | ( | ) | |||||||||
Deferred revenue and customer deposits | |||||||||||
Other | ( | ) | |||||||||
Net cash provided by operating activities | |||||||||||
Cash flows from investing activities: | |||||||||||
Purchases of investments | ( | ) | ( | ) | ( | ) | |||||
Maturities and sales of investments | |||||||||||
Purchases of property, plant, and equipment | ( | ) | ( | ) | ( | ) | |||||
Cash paid for acquisition of business, net of cash acquired | ( | ) | ( | ) | ( | ) | |||||
Net cash paid from sale of discontinued business | ( | ) | |||||||||
Net cash used in investing activities | ( | ) | ( | ) | ( | ) | |||||
Cash flows from financing activities: | |||||||||||
Issuance of common stock under stock plans | |||||||||||
Repurchase of common stock | ( | ) | ( | ) | ( | ) | |||||
Payment of dividends | ( | ) | ( | ) | ( | ) | |||||
Payment of contingent consideration | ( | ) | ( | ) | |||||||
Net cash used in financing activities | ( | ) | ( | ) | ( | ) | |||||
Effect of foreign exchange rate changes on cash and cash equivalents | ( | ) | ( | ) | |||||||
Net change in cash and cash equivalents | |||||||||||
Cash and cash equivalents at beginning of year | |||||||||||
Cash and cash equivalents at end of year | $ | $ | $ | ||||||||
The accompanying notes are an integral part of these consolidated financial statements.
40
COGNEX CORPORATION – CONSOLIDATED STATEMENTS OF SHAREHOLDERS’ EQUITY
Common Stock (1) | Additional Paid-in Capital (1) | Retained Earnings (1) | Accumulated Other Comprehensive Loss | Total Shareholders’ Equity | |||||||||||||||||||
(In thousands) | Shares | Par Value | |||||||||||||||||||||
Balance as of December 31, 2016 | $ | $ | $ | $ | ( | ) | $ | ||||||||||||||||
Issuance of common stock under stock plans | — | — | |||||||||||||||||||||
Repurchase of common stock | ( | ) | ( | ) | — | ( | ) | — | ( | ) | |||||||||||||
Stock-based compensation expense | — | — | — | — | |||||||||||||||||||
Payment of dividends | — | — | — | ( | ) | — | ( | ) | |||||||||||||||
Net income | — | — | — | — | |||||||||||||||||||
Net unrealized gain (loss) on cash flow hedges, net of tax of ($5) | — | — | — | — | |||||||||||||||||||
Reclassification of net realized (gain) loss on cash flow hedges | — | — | — | — | ( | ) | ( | ) | |||||||||||||||
Net unrealized gain (loss) on available-for-sale investments, net of tax of $2 | — | — | — | — | |||||||||||||||||||
Reclassification of net realized (gain) loss on the sale of available-for-sale investments | — | — | — | — | ( | ) | ( | ) | |||||||||||||||
Foreign currency translation adjustment, net of tax of $0 | — | — | — | — | |||||||||||||||||||
Balance as of December 31, 2017 | $ | $ | $ | $ | ( | ) | $ | ||||||||||||||||
Issuance of common stock under stock plans | — | — | |||||||||||||||||||||
Repurchase of common stock | ( | ) | ( | ) | — | ( | ) | — | ( | ) | |||||||||||||
Stock-based compensation expense | — | — | — | — | |||||||||||||||||||
Payment of dividends | — | — | — | ( | ) | — | ( | ) | |||||||||||||||
Adjustment as a result of the adoption of ASU 2016-06 "Income Taxes - Intra-Entity Transfers Other than Inventory" (Note 18) | — | — | — | ( | ) | — | ( | ) | |||||||||||||||
Net income | — | — | — | — | |||||||||||||||||||
Net unrealized gain (loss) on available-for-sale investments, net of tax of ($188) | — | — | — | — | ( | ) | ( | ) | |||||||||||||||
Reclassification of net realized (gain) loss on the sale of available-for-sale investments | — | — | — | — | ( | ) | ( | ) | |||||||||||||||
Foreign currency translation adjustment, net of tax of $0 | — | — | — | — | ( | ) | ( | ) | |||||||||||||||
Balance as of December 31, 2018 | $ | $ | $ | $ | ( | ) | $ | ||||||||||||||||
Issuance of common stock under stock plans | — | — | |||||||||||||||||||||
Repurchase of common stock | ( | ) | ( | ) | — | ( | ) | — | ( | ) | |||||||||||||
Stock-based compensation expense | — | — | — | — | |||||||||||||||||||
Payment of dividends | — | — | — | ( | ) | — | ( | ) | |||||||||||||||
Net income | — | — | — | — | |||||||||||||||||||
Net unrealized gain (loss) on available-for-sale investments, net of tax of $515 | — | — | — | — | |||||||||||||||||||
Reclassification of net realized (gain) loss on the sale of available-for-sale investments | — | — | — | — | ( | ) | ( | ) | |||||||||||||||
Foreign currency translation adjustment, net of tax of $0 | — | — | — | — | ( | ) | ( | ) | |||||||||||||||
Balance as of December 31, 2019 | $ | $ | $ | $ | ( | ) | $ | ||||||||||||||||
(1) Prior period amounts have been adjusted to reflect the two-for-one stock split effected in the form of a stock dividend which occurred in the fourth quarter of 2017. | |||||||||||||||||||||||
The accompanying notes are an integral part of these consolidated financial statements.
41
NOTE 1: Summary of Significant Accounting Policies
The accompanying consolidated financial statements reflect the application of the significant accounting policies described below.
Nature of Operations
Cognex Corporation is a leading provider of machine vision products that capture and analyze visual information in order to automate manufacturing and distribution tasks where vision is required.
Use of Estimates in the Preparation of Financial Statements
The preparation of financial statements in conformity with accounting principles generally accepted in the United States of America (U.S. GAAP) requires management to make estimates and judgments that affect the reported amounts of assets and liabilities and the disclosure of contingent liabilities as of the balance sheet date, and the reported amounts of revenues and expenses during the year. Actual results could differ from those estimates. Significant estimates and judgments include those related to revenue recognition, investments, accounts receivable, inventories, leases, long-lived assets, internal-use software, goodwill, warranty obligations, contingencies, derivative instruments, stock-based compensation, income taxes, and business combinations.
Basis of Consolidation
The consolidated financial statements include the accounts of Cognex Corporation and its subsidiaries, all of which are wholly-owned. All intercompany accounts and transactions have been eliminated.
Foreign Currency Translation
The financial statements of the Company’s foreign subsidiaries, where the local currency is the functional currency, are translated using exchange rates in effect at the end of the year for assets and liabilities and average exchange rates during the year for results of operations. The resulting foreign currency translation adjustment, net of tax, is recorded in shareholders’ equity as other comprehensive income (loss).
Fair Value Measurements
The Company applies a three-level valuation hierarchy for fair value measurements. The categorization of assets and liabilities within the valuation hierarchy is based upon the lowest level of input that is significant to the measurement of fair value. Level 1 inputs to the valuation methodology utilize unadjusted quoted market prices in active markets for identical assets and liabilities. Level 2 inputs to the valuation methodology are other observable inputs, including quoted market prices for similar assets and liabilities, quoted prices for identical and similar assets and liabilities in markets that are not active, or other inputs that are observable or can be corroborated by observable market data. Level 3 inputs to the valuation methodology are unobservable inputs based upon management’s best estimate of the inputs that market participants would use in pricing the asset or liability at the measurement date, including assumptions about risk. A change to the level of an asset or liability within the fair value hierarchy is determined at the end of a reporting period.
Cash, Cash Equivalents, and Investments
Money market instruments, as well as certificates of deposits and debt securities with original maturities of three months or less, are classified as cash equivalents and are stated at amortized cost. Certificates of deposit and debt securities with original maturities greater than three months and remaining maturities of one year or less are classified as short-term investments. Debt securities with remaining maturities greater than one year are classified as long-term investments. It is the Company’s policy to invest in debt securities with effective maturities that do not exceed ten years .
Debt securities with original maturities greater than three months are designated as available-for-sale and are reported at fair value, with unrealized gains and losses, net of tax, recorded in shareholders’ equity as other comprehensive income (loss). Realized gains and losses are included in current operations, along with the amortization of the discount or premium on debt securities arising at acquisition, and are calculated using the specific identification method. The Company’s limited partnership interest is accounted for using the cost method because the Company’s investment is less than 5 % of the partnership and the Company has no influence over the partnership’s operating and financial policies. The carrying value of this investment has been reduced to zero, and therefore, distributions are recorded as investment income as they occur.
42
Management monitors the carrying value of its investments in debt securities compared to their fair value to determine whether an other-than-temporary impairment has occurred. If the fair value of a debt security is less than its amortized cost, the Company assesses whether the impairment is other-than-temporary. In considering whether a decline in fair value is other-than-temporary, we consider many factors. In its evaluation of its debt securities, management considers the type of security, the credit rating of the security, the length of time the security has been in a loss position, the size of the loss position, our intent and ability to hold the security to expected recovery of value, and other meaningful information. An impairment is considered other-than-temporary if (i) the Company has the intent to sell the security, (ii) it is more likely than not that the Company will be required to sell the security before recovery of the entire amortized cost basis, or (iii) the Company does not expect to recover the entire amortized cost basis of the security. If impairment is considered other-than-temporary based upon condition (i) or (ii) described above, the entire difference between the amortized cost and the fair value of the security is recognized in current operations. If an impairment is considered other-than-temporary based upon condition (iii), the amount representing credit losses (defined as the difference between the present value of the cash flows expected to be collected and the amortized cost basis of the security) is recognized in current operations and the amount relating to all other factors is recognized in shareholders' equity as other comprehensive income (loss).
Accounts Receivable
The Company extends credit with various payment terms to customers based upon an evaluation of their financial condition. Accounts that are outstanding longer than the payment terms are considered to be past due. The Company establishes reserves against accounts receivable for potential credit losses and records bad debt expense in current operations when it determines receivables are at risk for collection based upon the length of time the receivable has been outstanding, the customer’s current ability to pay its obligations to the Company, general economic and industry conditions, as well as various other factors. Receivables are written off against these reserves in the period they are determined to be uncollectible and payments subsequently received on previously written-off receivables are recorded as a reversal of the bad debt expense.
Inventories
Inventories are stated at the lower of cost and net realizable value. Cost is determined using standard costs, which approximates actual costs under the first-in, first-out (FIFO) method. Net realizable value is the estimated selling prices in the ordinary course of business, less reasonably predictable costs of completion, disposal, and transportation.
The Company’s inventory is subject to technological change or obsolescence. The Company reviews inventory quantities on hand and estimates excess and obsolescence exposures based upon assumptions about future demand, product transitions, and market conditions, and records reserves to reduce the carrying value of inventories to their net realizable value. If actual future demand is less than estimated, additional inventory write-downs would be required.
The Company generally disposes of obsolete inventory upon determination of obsolescence. The Company does not dispose of excess inventory immediately, due to the possibility that some of this inventory could be sold to customers as a result of differences between actual and forecasted demand. When inventory has been written down below cost, such reduced amount is considered the new cost basis for subsequent accounting purposes. As a result, the Company would recognize a higher than normal gross margin if the reserved inventory were subsequently sold.
Property, Plant, and Equipment
Property, plant, and equipment are stated at cost and depreciated using the straight-line method over the assets’ estimated useful lives. Buildings’ useful lives are 39 years, building improvements’ useful lives are ten years , and the useful lives of computer hardware and software, manufacturing test equipment, and furniture and fixtures range from two to ten years . Leasehold improvements are depreciated over the shorter of the estimated useful lives or the remaining terms of the leases. Maintenance and repairs are expensed when incurred; additions and improvements are capitalized. Upon retirement or disposition, the cost and related accumulated depreciation of the disposed assets are removed from the accounts, with any resulting gain or loss included in current operations.
Leases
The Company accounts for leases in accordance with Accounting Standard Codification (ASC) 842, "Leases." The core principle of ASC 842 is that a lessee should recognize on the balance sheet the assets and liabilities that arise from leases.
43
At inception of a contract, the Company determines whether that contract is or contains a lease. The Company determines whether a contract contains a lease by assessing whether there is an identified asset and whether the contract conveys the right to control the use of the identified asset for a period of time in exchange for consideration. The Company has control of the asset if it has the right to direct the use of the asset and obtains substantially all of the economic benefits from the use of the asset throughout the period of use.
As a practical expedient, the Company does not recognize a lease asset or lease liability for leases with a lease term of 12 months or less. In the determination of the lease term, the Company considers the existence of extension or termination options and the probability of those options being exercised.
Lease contracts may include lease components and non-lease components, such as common area maintenance and utilities for property leases. As a practical expedient, the Company accounts for the non-lease components together with the lease components as a single lease component for all of its leases.
The Company classifies a lease as a finance lease when it meets any of the following criteria at the lease commencement date: a) the lease transfers ownership of the underlying asset to the Company by the end of the lease term; b) the lease grants the Company an option to purchase the underlying asset that the Company is reasonably certain to exercise; c) the lease term is for the major part of the remaining economic life of the underlying asset (the Company considers a major part to be 75% or more of the remaining economic life of the underlying asset); d) the present value of the sum of the lease payments and any residual value guaranteed by the Company equals or exceeds substantially all of the fair value of the underlying asset (the Company considers substantially all the fair value to be 90% or more of the fair value of the underlying asset amount); or e) the underlying asset is of such a specialized nature that it is expected to have no alternative use to the lessor at the end of the lease term. When none of the criteria above are met, the Company classifies the lease as an operating lease.
On the lease commencement date, the Company records a lease asset and lease liability on the balance sheet. The lease asset consists of: 1) the amount of the initial lease liability; 2) any lease payments made to the lessor at or before the lease commencement date, minus any lease incentives received; and 3) any initial direct cost incurred by the Company. Initial direct costs are incremental costs of a lease that would not have been incurred if the lease had not been obtained and are capitalized as part of the lease asset. The lease liability equals the present value of the future cash payments discounted using the Company's incremental borrowing rate. The Company’s incremental borrowing rate is the rate of interest that the Company would have to pay to borrow an amount equal to the lease payments over a similar term, which is the three-month London Interbank Offered Rate (LIBOR) plus a 2.5% credit risk spread.
Operating lease expense equals the total cash payments recognized on a straight-line basis over the lease term. The amortization of the lease asset is calculated as the straight-line lease expense less the accretion of the interest on the lease liability each period. The lease liability is reduced by the cash payment less the interest each period.
Internal-use Software
Internal-use software is software acquired, internally developed, or modified solely to meet the entity's internal needs, and during the software's development, no substantive plan exists to sell the software. The accounting treatment for computer software developed for internal use depends upon the nature of activities performed at each stage of development. The preliminary project stage includes conceptual formulation of design alternatives, determination of system requirements, vendor demonstrations, and final selection of vendors, and during this stage costs are expensed as incurred. The application development stage includes software configuration, coding, hardware installation, and testing. During this stage, certain costs are capitalized, including external direct costs of materials and services, as well as payroll and payroll-related costs for employees who are directly associated with the project, while certain costs are expensed as incurred, including training and data conversion costs. The post-implementation stage includes support and maintenance, and during this stage costs are expensed as incurred.
Capitalization begins when both the preliminary project stage is completed and management commits to funding the project. Capitalization ceases at the point the project is substantially complete and ready for its intended use, that is, after all substantial testing is completed. Costs of specified upgrades and enhancements to internal-use software are capitalized if it is probable that those expenditures result in additional functionality. Capitalized costs are amortized on a straight line basis over the estimated useful life.
44
Goodwill
Goodwill is stated at cost. The Company evaluates the possible impairment of goodwill annually each fourth quarter and whenever events or circumstances indicate the carrying value of the goodwill may not be recoverable. The Company performs a qualitative assessment of goodwill to determine whether further impairment testing is necessary. Factors that management considers in this assessment include macroeconomic conditions, industry and market considerations, overall financial performance (both current and projected), changes in management or strategy, changes in the composition or carrying amount of net assets, and market capitalization. If this qualitative assessment indicates that it is more likely than not that the fair value of a reporting unit is less than its carrying amount, the entity would proceed to perform a quantitative impairment test. Under this quantitative analysis, the fair value of the reporting unit is compared with its carrying value, including goodwill. If the carrying amount exceeds the fair value of the reporting unit, the Company recognizes an impairment charge. The Company estimates the fair value of its reporting unit using the income approach based upon a discounted cash flow model. In addition, the Company uses the market approach, which compares the reporting unit to publicly-traded companies and transactions involving similar businesses, to support the conclusions based upon the income approach.
Intangible assets are stated at cost and amortized over the assets’ estimated useful lives. Intangible assets are either amortized in relation to the relative cash flows anticipated from the intangible asset or using the straight-line method, depending upon facts and circumstances. The useful lives of distribution networks range from eleven to twelve years , of completed technologies from five to eight years , of customer relationships from five to eight years , of non-compete agreements from three to seven years , and trademarks two years . In-process technology is an indefinite-lived intangible asset until the technology is finalized, at which point it is amortized over its estimated useful life. The Company evaluates the possible impairment of long-lived assets, including intangible assets, whenever events or circumstances indicate the carrying value of the assets may not be recoverable. At the occurrence of a certain event or change in circumstances, the Company evaluates the potential impairment of an asset by estimating the future undiscounted cash flows expected to result from the use and eventual disposition of the asset. If the sum of the estimated future cash flows is less than the carrying value, the Company determines the amount of such impairment by comparing the fair value of the asset to its carrying value. The fair value is based upon the present value of the estimated future cash flows using a discount rate commensurate with the risks involved.
Warranty Obligations
The Company warrants its products to be free from defects in material and workmanship for periods primarily ranging from one to three years from the time of sale based upon the product being purchased and the terms of the customer arrangement. Warranty obligations are evaluated and recorded at the time of sale since it is probable that customers will make claims under warranties related to products that have been sold and the amount of these claims can be reasonably estimated based upon historical costs to fulfill claims. Obligations may also be recorded subsequent to the time of sale whenever specific events or circumstances impacting product quality become known that would not have been taken into account using historical data.
Contingencies
Loss contingencies are accrued if the loss is probable and the amount of the loss can be reasonably estimated. Legal costs associated with potential loss contingencies, such as patent infringement matters, are expensed as incurred.
Revenue Recognition
The Company recognizes revenue in accordance with Accounting Standards Codification (ASC) 606, “Revenue from Contracts with Customers.” The core principle of ASC 606 is to recognize revenue in a manner that depicts the transfer of promised goods or services to customers in an amount that reflects the consideration to which the Company expects to be entitled in exchange for those goods or services. The framework in support of this core principle includes: (1) identifying the contract with the customer; (2) identifying the performance obligations in the contract; (3) determining the transaction price; (4) allocating the transaction price to the performance obligations; and (5) recognizing revenue when (or as) the performance obligations are satisfied.
Identifying the Contract with the Customer
The Company identifies contracts with customers as agreements that create enforceable rights and obligations, which typically take the form of customer contracts or purchase orders.
45
Identifying the Performance Obligations in the Contract
The Company identifies performance obligations as promises in contracts to transfer distinct goods or services. Standard products and services that the Company regularly sells separately are accounted for as distinct performance obligations. Application-specific customer solutions that are comprised of a combination of products and services are accounted for as one performance obligation to deliver a total solution to the customer. On-site support services that are provided to the customer after the solution is deployed are accounted for as a separate performance obligation. These solutions are provided to customers in a variety of industries, including the consumer electronics, logistics, and automotive industries.
Shipping and handling activities for which the Company is responsible under the terms and conditions of the sale are not accounted for as performance obligations but as fulfillment costs. These activities are required to fulfill the Company’s promise to transfer the goods and are expensed when revenue is recognized.
The Company does not assess whether promised goods or services are performance obligations if they are immaterial in the context of the contract. If revenue is recognized before immaterial promises have been completed, then the costs related to such immaterial promises are accrued at the time of sale.
Determining the Transaction Price
The Company determines the transaction price as the amount of consideration it expects to receive in exchange for transferring promised goods or services to the customer. Amounts collected from customers for sales taxes are excluded from the transaction price.
If a contract includes a variable amount, such as a rebate, then the Company estimates the transaction price using either the expected value or the most likely amount of consideration to be received, depending upon the specific facts and circumstances. The Company includes estimated variable consideration in the transaction price only to the extent it is probable that a significant reversal of revenue will not occur when the uncertainty is resolved. The Company updates its estimate of variable consideration at the end of each reporting period to reflect changes in facts and circumstances.
Allocating the Transaction Price to the Performance Obligations
The Company allocates the transaction price to each performance obligation at contract inception based on a relative stand-alone selling price basis, or the price at which the Company would sell the good or service separately to similar customers in similar circumstances.
Recognizing Revenue When (or As) the Performance Obligations are Satisfied
The Company recognizes revenue when it transfers the promised goods or services to the customer. Revenue for standard products is recognized at the point in time when the customer obtains control of the goods, which is typically upon delivery when the customer has legal title, physical possession, the risks and rewards of ownership, and an enforceable obligation to pay for the products. Revenue for services, which are not material, is typically recognized over the time the service is provided.
Revenue for application-specific customer solutions is recognized at the point in time when the solution is validated, which is the point in time when the Company can objectively determine that the agreed-upon specifications in the contract have been met and the customer will accept the performance obligations in the arrangement. Although the customer may have taken legal title and physical possession of the goods when they arrived at the customer’s designated site, the significant risks and rewards of ownership transfer to the customer only upon validation. Revenue for on-site support services related to these solutions is recognized over the time the service is provided.
In certain instances, an arrangement may include customer-specified acceptance provisions or performance guarantees that allow the customer to accept or reject delivered products that do not meet the customer’s specifications. If the Company can objectively determine that control of a good or service has been transferred to the customer in accordance with the agreed-upon specifications in the contract, then customer acceptance is a formality. If acceptance provisions are presumed to be substantive, then revenue is deferred until customer acceptance.
For the Company’s standard products and services, revenue recognition and billing typically occur at the same time. For application-specific customer solutions, however, the agreement with the customer may provide for billing terms which differ from revenue recognition criteria, resulting in either deferred revenue or unbilled revenue. Credit assessments are performed to determine payment terms, which vary by region, industry, and customer. Prepayment terms result in contract liabilities for customer deposits. When credit is granted to customers, payment is typically due 30 to 90 days from billing. The Company's contracts have an original expected duration of less than one year, and therefore as a practical expedient, the Company has elected to ignore the impact of the time value of money on a
46
contract and to expense sales commissions. The Company recognizes an asset for costs to fulfill a contract if the costs relate directly to the contract and to future performance, and the costs are expected to be recovered.
Management exercises judgment when determining the amount of revenue to be recognized each period. Such judgments include, but are not limited to, assessing the customer’s ability and intention to pay substantially all of the contract consideration when due, determining when two or more contracts should be combined and accounted for as a single contract, determining whether a contract modification has occurred, assessing whether promises are immaterial in the context of the contract, determining whether material promises in a contract represent distinct performance obligations, estimating the transaction price for a contract that contains variable consideration, determining the stand-alone selling price of each performance obligation, determining whether control is transferred over time or at a point in time for performance obligations, and assessing whether formal customer acceptance provisions are substantive.
Research and Development
Research and development costs for internally-developed or acquired products are expensed when incurred until technological feasibility has been established for the product. Thereafter, all software costs may be capitalized until the product is available for general release to customers. The Company determines technological feasibility at the time the product reaches beta in its stage of development. Historically, the time incurred between beta and general release to customers has been short, and therefore, the costs have been insignificant.
Advertising Costs
Advertising costs are expensed as incurred and totaled $1,385,000 in 2019, $1,662,000 in 2018, and $1,679,000 in 2017.
Stock-Based Compensation
The Company’s stock-based awards that result in compensation expense consist of stock options and restricted stock units (RSUs). The Company has reserved a specific number of shares of its authorized but unissued shares for issuance upon the exercise of stock options or the settlement of restricted stock units. When a stock option is exercised or a restricted stock unit is settled, the Company issues new shares from this pool. The fair values of stock options are estimated on the grant date using a binomial lattice model. Management is responsible for determining the appropriate valuation model and estimating these fair values, and in doing so, considers a number of factors, including information provided by an outside valuation advisor. The fair value of RSUs are determined based upon the market value of the Company's common stock on the grant date.
Taxes
The Company recognizes a tax position in its financial statements when that tax position, based solely upon its technical merits, is more likely than not to be sustained upon examination by the relevant taxing authority. Those tax positions failing to qualify for initial recognition are recognized in the first interim period in which they meet the more likely than not standard, or are resolved through negotiation or litigation with the taxing authority, or upon expiration of the statutes of limitations. Derecognition of a tax position that was previously recognized occurs when an entity subsequently determines that a tax position no longer meets the more likely than not threshold of being sustained.
Only the portion of the liability that is expected to be paid within one year is classified as a current liability. As a result, liabilities expected to be resolved without the payment of cash (e.g., resolution due to the expiration of the statutes of limitations) or are not expected to be paid within one year are not classified as current. It is the Company’s policy to record estimated interest and penalties as income tax expense and tax credits as a reduction in income tax expense.
47
Deferred tax assets and liabilities are determined based upon the differences between the financial statement and tax bases of assets and liabilities as measured by the enacted tax rates that will be in effect when these differences reverse. Valuation allowances are provided if, based upon the weight of available evidence, it is more likely than not that some or all of the deferred tax assets will not be realized.
In December 2017, the Tax Cuts and Jobs Act (“Tax Act”) was signed into law. The Tax Act imposed a minimum tax on foreign earnings related to intangible assets, known as the Global Intangible Low-Taxed Income (GILTI) tax In the fourth quarter of 2019, the Company elected to account for the impact of the GILTI minimum tax in deferred taxes, a change from the Company’s initial election made in the third quarter of 2018 whereby the GILTI minimum tax was included in income tax expense as incurred on an annual basis. The change is considered preferable, as it appropriately matches the Company’s current and deferred income tax implications.
Sales tax in the United States and similar taxes in other jurisdictions that are collected from customers and remitted to government authorities are presented on a gross basis (i.e., a receivable from the customer with a corresponding payable to the government). Amounts collected from customers and retained by the Company during tax holidays are recognized as non-operating income when earned.
Net Income Per Share
Basic net income per share is computed by dividing net income available to common shareholders by the weighted-average number of common shares outstanding for the period. Diluted net income per share is computed by dividing net income available to common shareholders by the weighted-average number of common shares outstanding for the period plus potential dilutive common shares. Dilutive common equivalent shares consist of stock options and restricted stock units and are calculated using the treasury stock method. Common equivalent shares do not qualify as participating securities. In periods where the Company records a net loss, potential common stock equivalents are not included in the calculation of diluted net loss per share as their effect would be anti-dilutive.
Comprehensive Income
Comprehensive income is defined as the change in equity of a company during a period from transactions and other events and circumstances, excluding transactions resulting from investments by owners and distributions to owners. Accumulated other comprehensive loss, net of tax, consists of foreign currency translation adjustment losses of $38,027,000 and $37,486,000 , as of December 31, 2019 and December 31, 2018, respectively; net unrealized gains on available-for-sale investments of $2,023,000 as of December 31, 2019 and net unrealized losses on available-for-sale investments of $1,744,000 as of December 31, 2018; and losses on currency swaps, net of gains on long-term intercompany loans of $1,271,000 at each year end.
Amounts reclassified from accumulated other comprehensive income (loss) to investment income on the Consolidated Statements of Operations were net realized gains of $1,452,000 , $501,000 , and $829,000 for 2019, 2018, and 2017, respectively.
Concentrations of Risk
Financial instruments that potentially subject the Company to concentrations of credit risk consist primarily of cash, cash equivalents, investments, and trade receivables. The Company has certain domestic and foreign cash balances that exceed the insured limits set by the Federal Deposit Insurance Corporation (FDIC) in the United States and equivalent regulatory agencies in foreign countries. The Company primarily invests in investment-grade debt securities and has established guidelines relative to credit ratings, diversification, and maturities of its debt securities that maintain safety and liquidity. The Company has not experienced any significant realized losses on its debt securities.
The Company performs ongoing credit evaluations of its customers and maintains allowances for potential credit losses. The Company has not experienced any significant losses related to the collection of its accounts receivable.
A significant portion of the Company's product is manufactured by a third-party contractor located in Indonesia. This contractor has agreed to provide Cognex with termination notification periods and last-time-buy rights, if and when that may be applicable. We rely upon this contractor to provide quality product and meet delivery schedules. We engage in extensive product quality programs and processes, including actively monitoring the performance of our third-party manufacturers; however, we may not detect all product quality issues through these programs and processes.
Certain components are presently sourced from a single vendor that is selected based on price and performance considerations. In the event of a supply disruption from a single-source vendor, these components may be purchased from alternative vendors, which may result in manufacturing delays based on the lead time of the new vendor. Certain
48
key electronic and mechanical components that are purchased from strategic suppliers, such as processors or imagers, are fundamental to the design of Cognex products. A disruption in the supply of these key components, such as a last-time-buy announcement, natural disaster, financial bankruptcy, or other event, may require us to purchase a significant amount of inventory at unfavorable prices resulting in lower gross margins and higher risk of carrying excess inventory. If we are unable to secure adequate supply from alternative sources, we may have to redesign our products, which may lead to a delay in manufacturing and a possible loss of sales.
Derivative instruments are recorded on the Consolidated Balance Sheets at fair value. Changes in the fair value of derivatives are recorded each period in current operations or in shareholders' equity as other comprehensive income (loss), depending upon whether the derivative is designated as a hedge transaction and, if it is, the effectiveness of the hedge. At the inception of the contract, the Company designates foreign currency forward exchange contracts as either a cash flow hedge of certain forecasted foreign currency denominated sales and purchase transactions or as an economic hedge. Changes in the fair value of a derivative that is highly effective and that is designated and qualifies as a cash flow hedge are recorded in shareholders' equity as other comprehensive income (loss), and reclassified into current operations in the same period during which the hedged transaction affects current operations and in the same financial statement line item as that of the forecasted transaction. Cash flow hedges are evaluated for effectiveness quarterly. Any hedge ineffectiveness (which represents the amount by which the changes in the fair value of the derivative exceed the variability in the cash flows of the forecasted transaction) is recorded in current operations in the period in which ineffectiveness is determined. Changes in the fair value of the Company’s economic hedges (not designated as a cash flow hedge) are reported in current operations. The cash flows from derivative instruments are presented in the same category on the Consolidated Statements of Cash Flows as the category for the cash flows from the hedged item. Generally, this accounting policy election results in cash flows related to derivative instruments being classified as an operating activity on the Consolidated Statements of Cash Flows.
The Company formally documents all relationships between hedging instruments and hedged items, as well as its risk-management objective and strategy for undertaking various hedge transactions. This process includes linking all derivatives that are designated as cash flow hedges to specific forecasted transactions. The Company also formally assesses (both at the hedge’s inception and on an ongoing basis) whether the derivatives that are used in hedging transactions have been highly effective in offsetting changes in the fair value or cash flows of hedged items and whether those derivatives may be expected to remain highly effective in future periods. When it is determined that a derivative is not (or has ceased to be) highly effective as a hedge, the Company discontinues hedge accounting prospectively, as discussed below.
The Company discontinues hedge accounting prospectively when (1) it determines that the derivative is no longer effective in offsetting changes in the cash flows of a hedged item; (2) the derivative expires or is sold, terminated, or exercised; (3) it is no longer probable that the forecasted transaction will occur; or (4) management determines that designating the derivative as a hedging instrument is no longer appropriate or desired. When the Company discontinues hedge accounting because it is no longer probable that the forecasted transaction will occur in the originally expected period, the gain or loss on the derivative remains in accumulated other comprehensive income (loss) and is reclassified into current operations when the forecasted transaction affects current operations. However, if it is probable that a forecasted transaction will not occur by the end of the originally specified time period or within an additional two-month period of time thereafter, the gain or loss that was accumulated in other comprehensive income (loss) is recognized immediately in current operations. In all situations in which hedge accounting is discontinued and the derivative remains outstanding, the Company carries the derivative at fair value on the Consolidated Balance Sheets, recognizing changes in the fair value in current operations, unless it is designated in a new hedging relationship.
Business Acquisitions
The Company determines whether a transaction qualifies as a business combination by applying the definition of a business, which requires the assets acquired and liabilities assumed to be inputs and processes that have the ability to contriubte to the creation of outputs. The Company accounts for business combinations under the acquisition method of accounting, which requires the following steps: (1) identifying the acquirer, (2) determining the acquisition date, (3) recognizing and measuring the identifiable assets acquired and the liabilities assumed, and (4) recognizing and
49
NOTE 2: New Pronouncements
Accounting Standards Update (ASU) 2016-13, "Financial Instruments - Measurement of Credit Losses"
ASU 2016-13 applies to all reporting entities holding financial assets that are not accounted for at fair value through net income. The amendments in this ASU eliminate the probable initial recognition threshold to recognize a credit loss under current GAAP and, instead, reflect an entity’s current estimate of all expected credit losses. In addition, this ASU broadens the information an entity must consider in developing the credit loss estimate, including the use of reasonable and supportable forecasted information. The amendments in this ASU require that credit losses be presented as an allowance rather than as a write-down, and an entity will be able to record reversals of credit losses in current period net income. The guidance in this ASU is effective for annual periods, and interim periods within those annual periods, beginning after December 15, 2019. This ASU should be applied through a cumulative-effect adjustment to retained earnings as of the beginning of the first reporting period in which the guidance is effective. Available-for-sale debt securities and accounts receivable are the account balances primarily impacted by the guidance in this ASU. Management adopted this ASU on January 1, 2020, and we do not expect this ASU to have a material impact on the Company's consolidated financial statements and disclosures.
Accounting Standards Update (ASU) 2018-15, "Intangibles - Goodwill and Other - Internal-Use Software"
ASU 2018-15 applies to entities that are a customer in a hosting arrangement that is a service contract. The amendments in this ASU align the requirements for capitalizing implementation costs incurred in a hosting arrangement that is a service contract with the requirements for capitalizing implementation costs incurred to develop or obtain internal-use software. Accordingly, the amendments in this ASU require an entity in a hosting arrangement that is a service contract to follow the guidance in Subtopic 350-40 to determine which implementation costs to capitalize as an asset related to the service contract and which costs to expense. Further, it requires the entity to expense the capitalized implementation costs over the term of the hosting arrangement. In addition, it requires the presentation of the expenses related to the capitalized implementation costs in the same line item in the statement of income as the fees associated with the hosting element of the arrangement and the classification of the payments for the capitalized implementation costs in the statement of cash flows in the same manner as the payments made for the fees associated with the hosting element. The amendments in this ASU are effective for public entities for annual periods, and for interim periods within those annual periods, beginning after December 15, 2019. Management adopted this ASU on January 1, 2020, and we do not expect this ASU to have a material impact on the Company's consolidated financial statements and disclosures.
50
Accounting Standards Update (ASU) 2019-12, "Simplifying the Accounting for Income Taxes"
ASU 2019-12 applies to all entities within the scope of Topic 740, Income Taxes. The amendments in this ASU simplify the accounting for income taxes by removing the following exceptions: 1) exception to the incremental approach for intraperiod tax allocation when there is a loss from continuing operations and income or a gain from other items; 2) exception to the requirement to recognize a deferred tax liability for equity method investments when a foreign subsidiary becomes an equity method investment; 3) exception to the ability not to recognize a deferred tax liability for a foreign subsidiary when a foreign equity method investment becomes a subsidiary; and 4) exception to the general methodology for calculating income taxes in an interim period when a year-to-date loss exceeds the anticipated loss for the year. The amendments in this ASU also simplify the accounting for income taxes by doing the following: 1) requiring that an entity recognize a franchise tax that is partially based on income as an income-based tax and account for any incremental amount incurred as a non-income-based tax; 2) requiring that an entity evaluate when a step up in the tax basis of goodwill should be considered part of the business combination in which the book goodwill was originally recognized and when it should be considered a separate transaction; 3) specifying that an entity is not required to allocate the consolidated amount of current and deferred tax expense to a legal entity that is not subject to tax in its separate financial statements; and 4) requiring that an entity reflect the effect of an enacted change in tax laws or rates in the annual effective tax rate computation in the interim period that included the enacted date. The amendments in this ASU are effective for public companies for annual periods, and interim periods within those annual periods, beginning after December 15, 2020. Early adoption is permitted; however, an entity that elects to early adopt the amendments must adopt all the amendments in the same period. The amendments in this ASU related to separate financial statements of legal entities that are not subject to tax should be applied on a retrospective basis for all periods presented. The amendments related to changes in ownership of foreign equity method investments or foreign subsidiaries should be applied on a modified retrospective basis through a cumulative-effect adjustment to retained earnings as of the beginning of the fiscal year of adoption. The amendments related to franchise taxes that are partially based on income should be applied on either a retrospective basis for all periods presented or a modified retrospective basis through a cumulative-effect adjustment to retained earnings as of the beginning of the fiscal year of adoption. All other amendments should be applied on a prospective basis. Management does not expect ASU 2019-12 to have a material impact on the Company's consolidated financial statements and disclosures.
NOTE 3: Fair Value Measurements
Financial Assets and Liabilities that are Measured at Fair Value on a Recurring Basis
The following table summarizes the financial assets and liabilities measured at fair value on a recurring basis as of December 31, 2019 (in thousands):
Quoted Prices in Active Markets for Identical Assets (Level 1) | Significant Other Observable Inputs (Level 2) | Unobservable Inputs (Level 3) | |||||||||
Assets: | |||||||||||
Money market instruments | $ | $ | $ | — | |||||||
Treasury bills | |||||||||||
Corporate bonds | — | ||||||||||
Asset-backed securities | — | ||||||||||
Sovereign bonds | — | ||||||||||
Municipal bonds | |||||||||||
Agency bonds | — | ||||||||||
Certificate of deposit | — | ||||||||||
Economic hedge forward contracts | — | ||||||||||
Liabilities: | |||||||||||
Economic hedge forward contracts | — | ||||||||||
Contingent consideration liabilities | |||||||||||
The Company’s money market instruments are reported at fair value based upon the daily market price for identical assets in active markets, and are therefore classified as Level 1.
51
The Company’s debt securities and forward contracts are reported at fair value based upon model-driven valuations in which all significant inputs are observable or can be derived from or corroborated by observable market data for substantially the full term of the asset or liability, and are therefore classified as Level 2. Management is responsible for estimating the fair value of these financial assets and liabilities, and in doing so, considers valuations provided by a large, third-party pricing service. For debt securities, this service maintains regular contact with market makers, brokers, dealers, and analysts to gather information on market movement, direction, trends, and other specific data. They use this information to structure yield curves for various types of debt securities and arrive at the daily valuations. The Company's forward contracts are typically traded or executed in over-the-counter markets with a high degree of pricing transparency. The market participants are generally large commercial banks. The Company's certificate of deposit is valued at cost, which approximates fair value given its short term to maturity.
The Company did not record an other-than-temporary impairment of these financial assets in 2019, 2018, or 2017.
The Company's contingent consideration liabilities are reported at fair value based upon probability-adjusted present values of the consideration expected to be paid, using significant inputs that are not observable in the market, and are therefore classified as Level 3. Key assumptions used in these estimates include probability assessments with respect to the likelihood of achieving certain revenue milestones. The fair values of these contingent consideration liabilities were calculated using discount rates consistent with the level of risk of achievement, and are remeasured each reporting period with changes in fair value recorded in "Other income (expense)" on the Consolidated Statements of Operations.
The following table summarizes the activity for the Company's liabilities measured at fair value using Level 3 inputs (in thousands):
Balance as of December 31, 2017 | $ | ||
Payment of GVi contingent consideration | ( | ) | |
Fair value adjustment to GVi contingent consideration | |||
Fair value adjustment to Manatee contingent consideration | ( | ) | |
Fair value adjustment to Chiaro contingent consideration | |||
Balance as of December 31, 2018 | |||
Fair value adjustment to GVi contingent consideration | ( | ) | |
Fair value adjustment to Chiaro contingent consideration | |||
Balance as of December 31, 2019 | $ | ||
The contingent consideration liability as of December 31, 2019 in the amount of $1,153,000 relates to the Company's acquisition of Chiaro Techologies, LLC in 2016. The undiscounted potential outcomes related to the contingent consideration range from $0 to $1,250,000 based upon certain milestone revenue levels to be paid in 2020 if earned.
Non-financial Assets that are Measured at Fair Value on a Non-recurring Basis
Non-financial assets such as property, plant, and equipment, goodwill, and intangible assets are required to be measured at fair value only when an impairment loss is recognized. In 2017, the Company determined that the carrying value of the customer relationships arising from the acquisition of AQSense, S.L. was impaired and reduced this value to zero, resulting in an impairment charge of $469,000 . The Company did not record an impairment charge related to non-financial assets in 2019 or 2018.
Refer to Note 21 to the Consolidated Financial Statements for further information regarding acquisitions.
52
NOTE 4: Cash, Cash Equivalents, and Investments
Cash, cash equivalents, and investments consisted of the following (in thousands):
December 31, | |||||||
2019 | 2018 | ||||||
Cash | $ | $ | |||||
Money market instruments | |||||||
Cash and cash equivalents | |||||||
Treasury bills | |||||||
Asset-backed securities | |||||||
Corporate bonds | |||||||
Sovereign bonds | |||||||
Municipal bonds | |||||||
Certificate of deposit | |||||||
Current investments | |||||||
Treasury bills | |||||||
Corporate bonds | |||||||
Asset-backed securities | |||||||
Sovereign bonds | |||||||
Agency bonds | |||||||
Municipal bonds | |||||||
Non-current investments | |||||||
$ | $ | ||||||
The Company’s cash balance included foreign bank balances totaling $123,499,000 and $67,502,000 as of December 31, 2019 and 2018, respectively.
Treasury bills consist of debt securities issued by the U.S. government; asset-backed securities consist of debt securities collateralized by pools of receivables or loans with credit enhancement; corporate bonds consist of debt securities issued by both domestic and foreign companies; sovereign bonds consist of direct debt issued by foreign governments; municipal bonds consist of debt securities issued by state and local government entities; agency bonds consist of domestic or foreign obligations of government agencies and government-sponsored enterprises that have government backing; and certificates of deposit are time deposits held by financial institutions with a fixed interest rate.
53
The following table summarizes the Company’s available-for-sale investments as of December 31, 2019 (in thousands):
Amortized Cost | Gross Unrealized Gains | Gross Unrealized Losses | Fair Value | ||||||||||||
Current: | |||||||||||||||
Treasury bills | $ | $ | $ | ( | ) | $ | |||||||||
Asset-backed securities | ( | ) | |||||||||||||
Corporate bonds | ( | ) | |||||||||||||
Sovereign bonds | |||||||||||||||
Municipal bonds | ( | ) | |||||||||||||
Non-current: | |||||||||||||||
Treasury bills | ( | ) | |||||||||||||
Corporate bonds | ( | ) | |||||||||||||
Asset-backed securities | ( | ) | |||||||||||||
Sovereign bonds | ( | ) | |||||||||||||
Agency bonds | ( | ) | |||||||||||||
Municipal bonds | |||||||||||||||
$ | $ | $ | ( | ) | $ | ||||||||||
The following table summarizes the Company’s gross unrealized losses and fair values for available-for-sale investments in an unrealized loss position as of December 31, 2019 (in thousands):
Unrealized Loss Position For Less than 12 Months | Unrealized Loss Position For Greater than 12 Months | Total | |||||||||||||||||||||
Fair Value | Unrealized Losses | Fair Value | Unrealized Losses | Fair Value | Unrealized Losses | ||||||||||||||||||
Treasury bills | $ | $ | ( | ) | $ | $ | ( | ) | $ | $ | ( | ) | |||||||||||
Asset-backed securities | ( | ) | ( | ) | ( | ) | |||||||||||||||||
Sovereign bonds | ( | ) | ( | ) | |||||||||||||||||||
Corporate bonds | ( | ) | ( | ) | ( | ) | |||||||||||||||||
Agency Bonds | ( | ) | ( | ) | |||||||||||||||||||
Municipal bonds | ( | ) | ( | ) | |||||||||||||||||||
$ | $ | ( | ) | $ | $ | ( | ) | $ | $ | ( | ) | ||||||||||||
As of December 31, 2019, the Company did not recognize any other-than-temporary impairment of these investments. In its evaluation, management considered the type of security, the credit rating of the security, the length of time the security has been in a loss position, the size of the loss position, our intent and ability to hold the security to expected recovery of value, and other meaningful information. The Company does not intend to sell, and is unlikely to be required to sell, any of these available-for-sale investments before its effective maturity or market price recovery.
The Company recorded gross realized gains on the sale of debt securities totaling $1,581,000 in 2019, $669,000 in 2018, and $929,000 in 2017, and gross realized losses on the sale of debt securities totaling $129,000 in 2019, $168,000 in 2018, and $100,000 in 2017. These gains and losses are included in "Investment income" on the Consolidated Statement of Operations. Prior to the sale of these securities, unrealized gains and losses for these debt securities, net of tax, are recorded in shareholders’ equity as other comprehensive income (loss).
54
The following table summarizes the effective maturity dates of the Company’s available-for-sale investments as of December 31, 2019 (in thousands):
<1 Year | 1-2 Years | 2-3 Years | 3-4 Years | 4-5 Years | Total | ||||||||||||||||||
Treasury bills | $ | $ | $ | $ | $ | $ | |||||||||||||||||
Corporate bonds | |||||||||||||||||||||||
Asset-backed securities | |||||||||||||||||||||||
Sovereign bonds | |||||||||||||||||||||||
Municipal bonds | |||||||||||||||||||||||
Agency bonds | |||||||||||||||||||||||
$ | $ | $ | $ | $ | $ | ||||||||||||||||||
NOTE 5: Inventories
Inventories consisted of the following (in thousands):
December 31, | |||||||
2019 | 2018 | ||||||
Raw materials | $ | $ | |||||
Work-in-process | |||||||
Finished goods | |||||||
$ | $ | ||||||
NOTE 6: Property, Plant, and Equipment
Property, plant, and equipment consisted of the following (in thousands):
December 31, | |||||||
2019 | 2018 | ||||||
Land | $ | $ | |||||
Buildings | |||||||
Building improvements | |||||||
Leasehold improvements | |||||||
Computer hardware and software | |||||||
Manufacturing test equipment | |||||||
Furniture and fixtures | |||||||
Less: accumulated depreciation | ( | ) | ( | ) | |||
$ | $ | ||||||
The cost of disposed property, plant, and equipment totaling $8,883,000 and $6,367,000 was removed from the asset balance in 2019 and 2018, respectively. The cost of disposed property, plant, and equipment totaling $8,559,000 and $6,367,000 was removed from the accumulated depreciation balance in 2019 and 2018, respectively. Gains and losses on these disposals were immaterial in both years.
Buildings include rental property with a cost basis of $800,000 as of December 31, 2019 and 2018, and accumulated depreciation of $255,000 and $234,000 as of December 31, 2019 and 2018, respectively.
NOTE 7: Leases
On January 1, 2019, the Company adopted Accounting Standards Codification (ASC) 842, “Leases,” using the transition method of adoption, which allowed the Company to apply the standard on a prospective basis with a cumulative-effect adjustment to the opening balance sheet as of the adoption date. Accordingly, the Company recorded lease assets of $17,522,000 , current lease liabilities of $4,736,000 , and non-current lease liabilities of $12,669,000 on its Consolidated Balance Sheet as of January 1, 2019.
As part of the adoption, the Company elected a practical expedient package to be applied to all of its leases upon transition, and as a result, the Company did not reassess: 1) whether any expired or existing contracts contain leases;
55
2) the lease classification for any expired or existing leases; and 3) the accounting for initial direct costs for any existing leases.
The Company's leases are primarily leased properties across different worldwide locations where the Company conducts its operations. All of these leases are classified as operating leases. Certain leases may contain options to extend or terminate the lease at the Company's sole discretion. There were no options to extend or terminate that were included in the determination of the lease term for the leases outstanding as of December 31, 2019. Certain leases contain leasehold improvement incentives, retirement obligations, escalating clauses, rent holidays, and variable payments tied to a consumer price index. There were no restrictions or covenants for the leases outstanding as of December 31, 2019.
The total operating lease expense and operating lease cash payments in 2019 were $6,893,000 and $6,530,000 , respectively. The total lease expense for leases with a term of twelve months or less for which the Company elected
not to recognize a lease asset or lease liability was $275,000 in 2019. Annual rental expense prior to the adoption of ASC 842 was $8,186,000 in 2018 and $6,738,000 in 2017.
Future operating lease cash payments are as follows (in thousands):
Year Ended December 31, | Amount | |||
2020 | ||||
2021 | ||||
2022 | ||||
2023 | ||||
2024 | ||||
Thereafter | ||||
$ | ||||
The discounted present value of the future lease cash payments resulted in a lease liability of $17,973,000 as of December 31, 2019.
The weighted-average discount rate was 4.6 % for the leases outstanding as of December 31, 2019. The weighted-average remaining lease term was 3.7 years for the leases outstanding as of December 31, 2019. The Company did not have any leases that have not yet commenced but that create significant rights and obligations as of December 31, 2019.
The Company owns a building adjacent to its corporate headquarters that is partially occupied with a tenant who has a lease agreement that will expire in 2022. Annual rental income totaled $311,000 in 2019, $1,116,000 in 2018, and $1,474,000 in 2017. Rental income and related expenses are included in "Other income (expense)" on the Consolidated Statements of Operations.
Future minimum rental receipts under non-cancelable lease agreements are as follows (in thousands):
Year Ended December 31, | Amount | |||
2020 | ||||
2021 | ||||
2022 | ||||
$ | ||||
56
NOTE 8: Goodwill
The changes in the carrying value of goodwill were as follows (in thousands):
Amount | ||||
Balance as of December 31, 2017 | $ | |||
Balance as of December 31, 2018 | ||||
Acquisition of Sualab Co., Ltd. | ||||
Foreign exchange rate changes | ||||
Balance as of December 31, 2019 | $ | |||
Refer to Note 21 to the Consolidated Financial Statements for further information regarding acquisitions.
For its 2019 analysis of goodwill, management elected to perform a qualitative assessment. Based upon this assessment, management believes that it is more likely than not that the fair value of the reporting unit exceeds its carrying amount. Factors that management considered in the qualitative assessment include macroeconomic conditions, industry and market considerations, overall financial performance (both current and projected), changes in management or strategy, changes in the composition or carrying amount of net assets, and market capitalization.
NOTE 9: Intangible Assets
Intangible assets consisted of the following (in thousands):
Gross Carrying Value | Accumulated Amortization | Net Carrying Value | |||||||||
Distribution networks | $ | $ | $ | ||||||||
Completed technologies | |||||||||||
Customer relationships | |||||||||||
In-process technologies | |||||||||||
Non-compete agreements | |||||||||||
Trademarks | |||||||||||
Balance as of December 31, 2019 | $ | $ | $ | ||||||||
Gross Carrying Value | Accumulated Amortization | Net Carrying Value | |||||||||
Distribution networks | $ | $ | $ | ||||||||
Completed technologies | |||||||||||
Customer relationships | |||||||||||
Non-compete agreements | |||||||||||
Balance as of December 31, 2018 | $ | $ | $ | ||||||||
In connection with the acquisition of Sualab Co., Ltd. in the fourth quarter of 2019, the Company acquired in-process technologies valued at $8,200,000 . In-process technology is an indefinite-lived intangible asset until the technology is finalized, at which point it is amortized over its estimated useful life.
Estimated amortization expense for each of the five succeeding fiscal years and thereafter is as follows (in thousands):
Year Ended December 31, | Amount | |||
2020 | $ | |||
2021 | ||||
2022 | ||||
2023 | ||||
2024 | ||||
Thereafter | ||||
$ | ||||
57
NOTE 10: Accrued Expenses
Accrued expenses consisted of the following (in thousands):
December 31, | |||||||
2019 | 2018 | ||||||
Salaries, commissions, and payroll taxes | $ | $ | |||||
Foreign retirement obligations | |||||||
Warranty obligations | |||||||
Vacation | |||||||
Acquisition deferred and contingent liabilities | |||||||
Company bonuses | |||||||
Other | |||||||
$ | $ | ||||||
The changes in the warranty obligation were as follows (in thousands):
Balance as of December 31, 2017 | $ | ||
Provisions for warranties issued during the period | |||
Fulfillment of warranty obligations | ( | ) | |
Foreign exchange rate changes | ( | ) | |
Balance as of December 31, 2018 | |||
Provisions for warranties issued during the period | |||
Fulfillment of warranty obligations | ( | ) | |
Balance as of December 31, 2019 | $ | ||
NOTE 11: Commitments and Contingencies
As of December 31, 2019, the Company had outstanding purchase orders totaling $7,707,000 to purchase inventory from various vendors. Certain of these purchase orders may be canceled by the Company, subject to cancellation penalties. These purchase commitments relate to expected sales in 2020.
Various claims and legal proceedings generally incidental to the normal course of business are pending or threatened on behalf of or against the Company. While we cannot predict the outcome of these matters, we believe that any liability arising from them will not have a material adverse effect on our financial position, liquidity, or results of operations.
NOTE 12: Indemnification Provisions
Except as limited by Massachusetts law, the by-laws of the Company require it to indemnify certain current or former directors, officers, and employees of the Company against expenses incurred by them in connection with each proceeding in which he or she is involved as a result of serving or having served in certain capacities. Indemnification is not available with respect to a proceeding as to which it has been adjudicated that the person did not act in good faith in the reasonable belief that the action was in the best interests of the Company. The maximum potential amount of future payments the Company could be required to make under these provisions is unlimited. The Company has never incurred significant costs related to these indemnification provisions. As a result, the Company believes the estimated fair value of these provisions is not material.
In the ordinary course of business, the Company may accept standard limited indemnification provisions in connection with the sale of its products, whereby it indemnifies its customers for certain direct damages incurred in connection with third-party patent or other intellectual property infringement claims with respect to the use of the Company’s products. The maximum potential amount of future payments the Company could be required to make under these provisions is generally subject to fixed monetary limits. The Company has never incurred significant costs to defend lawsuits or settle claims related to these indemnification provisions. As a result, the Company believes the estimated fair value of these provisions is not material.
In the ordinary course of business, the Company also accepts limited indemnification provisions from time to time, whereby it indemnifies customers for certain direct damages incurred in connection with bodily injury and property damage arising from the use of the Company’s products. The maximum potential amount of future payments the Company could be required to make under these provisions is generally limited and is likely recoverable under the
58
Company’s insurance policies. As a result of this coverage, and the fact that the Company has never incurred significant costs to defend lawsuits or settle claims related to these indemnification provisions, the Company believes the estimated fair value of these provisions is not material.
NOTE 13: Derivative Instruments
The Company’s foreign currency risk management strategy is principally designed to mitigate the potential financial impact of changes in the value of transactions and balances denominated in foreign currencies resulting from changes in foreign currency exchange rates. The Company may enter into two types of hedges to manage this risk. The first are economic hedges which utilize foreign currency forward contracts with maturities of up to 45 days to manage the exposure to fluctuations in foreign currency exchange rates arising primarily from foreign-denominated receivables and payables. The gains and losses on these derivatives are intended to be offset by the changes in the fair value of the assets and liabilities being hedged. These economic hedges are not designated as hedging instruments for hedge accounting treatment. The second are cash flow hedges which utilize foreign currency forward contracts with maturities of up to 18 months to hedge specific forecasted transactions of the Company's foreign subsidiaries with the goal of protecting our budgeted revenues and expenses against foreign currency exchange rate changes compared to our budgeted rates. These cash flow hedges are designated as hedging instruments for hedge accounting treatment. The Company did not have any cash flow hedges as of December 31, 2019 and 2018.
The Company had the following outstanding forward contracts (in thousands):
December 31, 2019 | December 31, 2018 | ||||||||||
Currency | Notional Value | USD Equivalent | Notional Value | USD Equivalent | |||||||
Derivatives Not Designated as Hedging Instruments: | |||||||||||
Korean Won | $ | $ | |||||||||
Euro | |||||||||||
Japanese Yen | |||||||||||
Mexican Peso | |||||||||||
British Pound | |||||||||||
Hungarian Forint | |||||||||||
Taiwanese Dollar | |||||||||||
Canadian Dollar | |||||||||||
Singapore Dollar | |||||||||||
Information regarding the fair value of the outstanding forward contracts was as follows (in thousands):
Asset Derivatives | Liability Derivatives | ||||||||||||||||||
Balance Sheet Location | Fair Value | Balance Sheet Location | Fair Value | ||||||||||||||||
December 31, 2019 | December 31, 2018 | December 31, 2019 | December 31, 2018 | ||||||||||||||||
Derivatives Not Designated as Hedging Instruments: | |||||||||||||||||||
Economic hedge forward contracts | Prepaid expenses and other current assets | $ | $ | Accrued expenses | $ | $ | |||||||||||||
59
The following table summarizes the gross activity for all derivative assets and liabilities which were presented on a net basis on the Consolidated Balance Sheets due to the right of offset with each counterparty (in thousands):
Asset Derivatives | Liability Derivatives | |||||||||||||||||
December 31, 2019 | December 31, 2018 | December 31, 2019 | December 31, 2018 | |||||||||||||||
Gross amounts of recognized assets | $ | $ | Gross amounts of recognized liabilities | $ | $ | |||||||||||||
Gross amounts offset | Gross amounts offset | |||||||||||||||||
Net amount of assets presented | $ | $ | Net amount of liabilities presented | $ | $ | |||||||||||||
Information regarding the effect of derivative instruments, net of the underlying exposure, on the consolidated financial statements was as follows (in thousands):
Location in Financial Statements | Year Ended December 31, | ||||||||||||
2019 | 2018 | 2017 | |||||||||||
Derivatives Designated as Hedging Instruments: | |||||||||||||
Gains (losses) reclassified from accumulated other comprehensive income (loss) into current operations (effective portion) | Revenue | $ | $ | $ | |||||||||
Research, development, and engineering expenses | |||||||||||||
Selling, general, and administrative expenses | |||||||||||||
Total gains (losses) reclassified from accumulated other comprehensive income (loss) into current operations | $ | $ | $ | ||||||||||
Derivatives Not Designated as Hedging Instruments: | |||||||||||||
Gains (losses) recognized in current operations | Foreign currency gain (loss) | $ | $ | ( | ) | $ | |||||||
60
NOTE 14: Revenue Recognition
Year Ended December 31, | ||||||||||||
2019 | 2018 | 2017 | ||||||||||
Americas | $ | $ | ||||||||||
Europe | ||||||||||||
Greater China | ||||||||||||
Other Asia | ||||||||||||
$ | $ | $ | ||||||||||
The following table summarizes disaggregated revenue information by revenue type (in thousands):
Year Ended December 31, | ||||||||||||
2019 | 2018 | 2017 | ||||||||||
Standard products and services | $ | $ | $ | |||||||||
Application-specific customer solutions | ||||||||||||
$ | $ | $ | ||||||||||
Costs to Fulfill a Contract
Costs to fulfill a contract are included in "Prepaid expenses and other current assets" on the Consolidated Balance Sheet and amounted to $3,963,000 and $3,514,000 as of December 31, 2019 and 2018, respectively.
Accounts Receivable, Contract Assets, and Contract Liabilities
Accounts receivable represent amounts billed and currently due from customers which are reported at their net estimated realizable value. The Company maintains reserves against its accounts receivable for potential credit losses. Credit losses recognized on accounts receivable were immaterial for the year ended December 31, 2019 and 2018. Contract assets consist of unbilled revenue which arises when revenue is recognized in advance of billing for certain application-specific customer solutions contracts. Contract liabilities consist of deferred revenue and customer deposits which arise when amounts are billed to or collected from customers in advance of revenue recognition.
The following table summarizes the deferred revenue and customer deposits activity (in thousands):
Amount | |||
Balance as of December 31, 2017 | $ | ||
Increases to deferred revenue and customer deposits | |||
Recognition of revenue | ( | ) | |
Foreign exchange rate changes | ( | ) | |
Balance as of December 31, 2018 | |||
Increases to deferred revenue and customer deposits | |||
Recognition of revenue | ( | ) | |
Foreign exchange rate changes | ( | ) | |
Balance as of December 31, 2019 | $ | ||
As a practical expedient, the Company has elected not to disclose the aggregate amount of the transaction price allocated to unsatisfied performance obligations, as our contracts have an original expected duration of less than one year.
61
NOTE 15: Shareholders’ Equity
Preferred Stock
The Company has 400,000 shares of authorized but unissued $.01 par value preferred stock.
Common Stock
On April 25, 2018, the Company's shareholders approved an amendment to the Company's Articles of Organization to increase the authorized number of shares of common stock from 200,000,000 to 300,000,000 . In addition, on April 25, 2018, the Company's shareholders approved an amendment and restatement of the Company's 2001 General Stock Option Plan which provides for an increase in the number of available shares by 10,000,000 .
In October 2017, the Company’s Board of Directors declared a two -for-one stock split, effected in the form of a stock dividend, on the shares of the Company’s common stock. Each shareholder of record on November 17, 2017 received an additional share of common stock for each share of common stock then held. The stock was distributed on December 1, 2017. The Company retained the current par value of $.002 per share for all shares of common stock. All references in the financial statements to the number of shares outstanding, number of shares repurchased, per-share amounts, and stock option data related to the Company’s common stock have been adjusted to reflect the effect of the stock split for all periods presented. Shareholders’ equity reflects the stock split by reclassifying from “Additional paid in capital” and "Retained earnings" to “Common stock” an amount equal to the par value of the additional shares arising from the split.
Each outstanding share of common stock entitles the record holder to one vote on all matters submitted to a vote of the Company’s shareholders. Common shareholders are also entitled to dividends when and if declared by the Company’s Board of Directors.
Shareholder Rights Agreement
On December 5, 2018, the Company’s Board of Directors allowed the Company’s Shareholder Rights Agreement and associated rights to expire in accordance with their terms without renewal. In connection with the adoption of the Shareholder Rights Agreement, the Company had filed Articles of Amendment to its Restated Articles of Organization establishing Series E Junior Participating Cumulative Preferred Stock with the Secretary of State of The Commonwealth of Massachusetts, setting forth the rights, powers, and preferences of the Series E Junior Participating Cumulative Preferred Stock issuable upon exercise of the rights (the “Preferred Shares”). Effective on April 26, 2019, the Company filed Articles of Amendment to the Company’s Restated Articles of Organization with the Secretary of State of The Commonwealth of Massachusetts eliminating the Preferred Shares and returning them to authorized but undesignated shares of the Company’s preferred stock.
Stock Repurchases
In April 2017, the Company's Board of Directors authorized the repurchase of $100,000,000 of the Company's common stock. The Company repurchased 1,744,000 shares at a cost of $100,000,000 under this April 2017 program, including 803,000 shares at a cost of $45,200,000 in 2018. In February 2018, the Company's Board of Directors authorized the repurchase of $150,000,000 of the Company's common stock. The Company repurchased 3,174,000 shares at a cost of $150,000,000 in 2018 under this February 2018 program. In October 2018, the Company's Board of Directors authorized the repurchase of $200,000,000 of the Company's common stock. The Company repurchased 203,000 shares at a cost of $8,622,000 in 2018 under this October 2018 program. Total stock repurchases amounted to $203,822,000 in 2018. The Company repurchased 1,398,000 shares at a cost of $61,690,000 in 2019 under this October 2018 program. As of December 31, 2019, the Company repurchased 1,601,000 shares at a cost of $70,312,000 under this October 2018 program, leaving a remaining balance of $129,688,000 . The Company may repurchase shares under this program in future periods depending on a variety of factors, including, among other things, the impact of dilution from employee stock awards, stock price, share availability, and cash requirements.
Dividends
The Company’s Board of Directors declared and paid cash dividends of $0.045 per share in the first, second, and third quarters of 2018, and $0.050 in the fourth quarter of 2018, as well as in the first, second, and third quarters of 2019. The dividend was increased to $0.055 per share in the fourth quarter of 2019. Total dividends amounted to $35,124,000 and $31,865,000 in 2019 and 2018, respectively. Future dividends will be declared at the discretion of the Company's Board of Directors and will depend upon such factors as the Board deems relevant, including, among other things, the Company's ability to generate positive cash flow from operations.
62
NOTE 16: Stock-Based Compensation
Stock Plans
The Company’s stock-based awards that result in compensation expense consist of stock options and restricted stock units (RSUs). As of December 31, 2019, the Company had 17,300,802 shares available for grant. Stock options are granted with an exercise price equal to the market value of the Company’s common stock at the grant date and generally vest over four or five years based upon continuous employment and expire ten years from the grant date. RSUs generally vest upon three years of continuous employment or incrementally over such three-year period. Participants are not entitled to dividends on RSUs.
Stock Options
The following table summarizes the Company’s stock option activity:
Shares (in thousands) | Weighted- Average Exercise Price | Weighted- Average Remaining Contractual Term (in years) | Aggregate Intrinsic Value (in thousands) | |||||||||
Outstanding as of December 31, 2018 | $ | |||||||||||
Granted | ||||||||||||
Exercised | ( | ) | ||||||||||
Forfeited or expired | ( | ) | ||||||||||
Outstanding as of December 31, 2019 | $ | $ | ||||||||||
Exercisable as of December 31, 2019 | $ | $ | ||||||||||
Options vested or expected to vest as of December 31, 2019 (1) | $ | $ | ||||||||||
(1) In addition to the vested options, the Company expects a portion of the unvested options to vest at some point in the future. Options expected to vest are calculated by applying an estimated forfeiture rate to the unvested options.
The fair values of stock options granted in each period presented were estimated using the following weighted-average assumptions:
Year Ended December 31, | ||||||||
2019 | 2018 | 2017 | ||||||
Risk-free rate | % | % | % | |||||
Expected dividend yield | % | % | % | |||||
Expected volatility | % | % | % | |||||
Expected term (in years) | ||||||||
Risk-free rate
The risk-free rate was based upon a treasury instrument whose term was consistent with the contractual term of the option.
Expected dividend yield
Generally, the current dividend yield is calculated by annualizing the cash dividend declared by the Company’s Board of Directors and dividing that result by the closing stock price on the grant date.
Expected volatility
The expected volatility was based upon a combination of historical volatility of the Company’s common stock over the contractual term of the option and implied volatility for traded options of the Company’s stock.
Expected term
The expected term was derived from the binomial lattice model from the impact of events that trigger exercises over time.
63
The weighted-average grant-date fair value of stock options granted was $18.62 in 2019, $20.84 in 2018, and $15.59 in 2017.
The total intrinsic value of stock options exercised was $90,762,000 in 2019, $52,629,000 in 2018, and $136,672,000 in 2017. The total fair value of stock options vested was $38,974,000 in 2019, $31,106,000 in 2018, and $21,519,000 in 2017.
Restricted Stock Units (RSUs)
The following tables summarizes the Company's RSU activity:
Shares (in thousands) | Weighted- Average Grant Date Fair Value | |||||
Nonvested as of December 31, 2018 | $ | |||||
Granted | ||||||
Vested | ||||||
Forfeited or expired | ( | ) | ||||
Nonvested as of December 31, 2019 | $ | |||||
Stock-Based Compensation Expense
The Company stratifies its employee population into two groups: one consisting of senior management and another consisting of all other employees. The Company currently applies an estimated forfeiture rate of 9 % to all unvested options for senior management and a rate of 12 % for all other employees. Each year during the first quarter, the Company revises its forfeiture rate. This resulted in a decrease to compensation expense of $499,000 in 2019, an increase to compensation expense of $1,283,000 in 2018, and a decrease to compensation expense of $673,000 in 2017.
As of December 31, 2019, total unrecognized compensation expense related to non-vested stock-based awards, including stock options and RSUs, was $53,491,000 , which is expected to be recognized over a weighted-average period of 1.66 years.
The total stock-based compensation expense and the related income tax benefit recognized was $45,589,000 and $7,756,000 , respectively, in 2019, $41,090,000 and $7,317,000 , respectively, in 2018, and $31,942,000 and $10,473,000 , respectively, in 2017. No compensation expense was capitalized in 2019, 2018, or 2017.
The following table presents the stock-based compensation expense by caption for each period presented on the Consolidated Statements of Operations (in thousands):
Year Ended December 31, | |||||||||||
2019 | 2018 | 2017 | |||||||||
Cost of revenue | $ | $ | $ | ||||||||
Research, development, and engineering | |||||||||||
Selling, general, and administrative | |||||||||||
$ | $ | $ | |||||||||
NOTE 17: Employee Savings Plan
Under the Company's Employee Savings Plan, a defined contribution plan, all U.S. employees who have attained age 21 may contribute up to 100 % of their pay on a pre-tax basis under the Company's Employee Savings Plan, subject to the annual dollar limitations established by the Internal Revenue Service (IRS). The Company matches 50 % of the first 6 % of pay an employee contributes. Company contributions vest 25 %, 50 %, 75 %, and 100 % after one, two, three, and four years of continuous employment with the Company, respectively. Company contributions totaled $2,729,000 in 2019, $2,540,000 in 2018, and $2,030,000 in 2017. Cognex stock is not an investment alternative and Company contributions are not made in the form of Cognex stock.
NOTE 18: Income Taxes
Domestic income before taxes was $31,396,000 in 2019, $39,042,000 in 2018, and $30,345,000 in 2017. Foreign income before taxes was $131,598,000 in 2019, $195,532,000 in 2018, and $236,119,000 in 2017.
64
Income tax expense consisted of the following (in thousands):
Year Ended December 31, | |||||||||||
2019 | 2018 | 2017 | |||||||||
Current: | |||||||||||
Federal | $ | $ | $ | ||||||||
State | ( | ) | |||||||||
Foreign | |||||||||||
Deferred: | |||||||||||
Federal | ( | ) | |||||||||
State | ( | ) | |||||||||
Foreign | ( | ) | ( | ) | |||||||
( | ) | ( | ) | ||||||||
$ | ( | ) | $ | $ | |||||||
A reconciliation of the U.S. federal statutory corporate tax rate to the Company’s income tax expense, or effective tax rate, was as follows:
Year Ended December 31, | ||||||||
2019 | 2018 | 2017 | ||||||
Income tax expense at U.S. federal statutory corporate tax rate | % | % | % | |||||
State income taxes, net of federal benefit | ||||||||
Foreign tax rate differential | ( | ) | ( | ) | ( | ) | ||
Tax credit | ( | ) | ( | ) | ||||
Discrete tax benefit related to employee stock options | ( | ) | ( | ) | ( | ) | ||
Discrete tax expense (benefit) related to Tax Act | ( | ) | ||||||
Discrete tax expense related to write-down of deferred tax assets | ||||||||
Discrete tax expense related to migration of acquired IP | ||||||||
Discrete tax (benefit) related to change in tax structure | ( | ) | ||||||
Discrete tax expense related to GILTI impact of change in tax structure | ||||||||
Other discrete tax events | ( | ) | ( | ) | ||||
Other | ||||||||
Income tax expense | ( | )% | % | % | ||||
Change in Accounting Policy
In 2019, the Company elected to change its method of accounting for the United States Global Intangible Low-Taxed Income (GILTI) tax from recording the tax impact in the period it is incurred to recognizing deferred taxes for temporary tax basis differences expected to reverse as GILTI tax in future years. The change is considered preferable, as it appropriately matches the Company's current and deferred income tax implications related to the change in tax structure noted under the heading "Discrete Tax Events 2019" below.
65
The change in this accounting policy impacted the Company's 2019 reported results as follows (in thousands):
Statement of Operations | |||||||||||
Year Ended December 31, 2019 | |||||||||||
As reported under the new accounting policy | As computed under the previous accounting policy | Effect of change | |||||||||
Income before income tax expense | $ | $ | $ | ||||||||
Income tax expense (benefit) | ( | ) | ( | ) | |||||||
Net income | $ | $ | $ | ( | ) | ||||||
Net income per weighted-average common and common-equivalent share: | |||||||||||
Basic | $ | $ | $ | ( | ) | ||||||
Diluted | $ | $ | $ | ( | ) | ||||||
Balance Sheet | |||||||||||
December 31, 2019 | |||||||||||
As reported under the new accounting policy | As computed under the previous accounting policy | Effect of change | |||||||||
Deferred tax assets | $ | $ | $ | ( | ) | ||||||
Deferred tax liabilities | $ | $ | $ | ||||||||
Statement of Shareholders' Equity | |||||||||||
Year Ended December 31, 2019 | |||||||||||
As reported under the new accounting policy | As computed under the previous accounting policy | Effect of change | |||||||||
Retained earnings | $ | $ | $ | ( | ) | ||||||
There were no material differences to the Company's reported results in prior years.
Discrete Tax Events 2019
The European Union has enacted a series of tax reform legislation over the past few years regarding low tax structures. The Company made changes to its international tax structure in the fourth quarter of 2019 as a result of this legislation that resulted in an intercompany sale of intellectual property. The Company recorded an associated deferred tax asset and income tax benefit of $437,500,000 in Ireland based upon the fair value of the intellectual property, that will be realized over 15 years as future tax deductions. From a United States perspective, the sale is disregarded, and any future deductions claimed in Ireland will be added back to taxable income as part of GILTI minimum tax. The Company recorded an associated deferred tax liability and income tax expense of $350,000,000 , representing the GILTI minimum tax related to the fair value of the intellectual property. The result of these transactions was a net discrete tax benefit of $87,500,000 . Management expects its current effective tax rate excluding discrete items to increase slightly in future years as a result of this change.
In connection with the acquisition of Sualab, Co. Ltd., the Company migrated acquired intellectual property to certain subsidiaries in the fourth quarter of 2019 in order to align with its corporate tax structure. As a result of this transaction, the Company recorded a discrete tax expense of $28,528,000 , which included a reserve of $3,700,000 for certain related tax uncertainties.
66
The Tax Act
In December 2017, the Tax Cuts and Jobs Act of 2017 (Tax Act) was signed into law. The Tax Act resulted in a decrease in the U.S. federal statutory corporate tax rate from 35% to 21%. As a result of the reduction in anticipated tax rate, the Company remeasured its deferred tax positions as of December 31, 2017 at the new enacted tax rate, and accordingly, recorded tax expense of $12,523,000 in 2017 from the associated write-down of its deferred tax assets. In 2018, the Company recorded an increase in tax expense of $3,240,000 from the write-down of its deferred tax assets primarily relating to guidance under the Tax Act regarding stock-based compensation.
The Tax Act subjects unrepatriated foreign earnings to a one-time transition tax, regardless of the Company's financial statement assertion related to indefinite reinvestment or whether the Company ultimately repatriates any of the foreign earnings, for which the Company recorded estimated tax expense of $101,379,000 in 2017. In 2018, the Company revised its estimate of the one-time transition tax and recorded a decrease in tax expense of $11,028,000 , which resulted in a revised estimate for the one-time transition tax of $90,351,000 .
The Tax Act replaces the current system of taxing U.S. corporations on repatriated foreign earnings with a partial territorial system that provides a 100% dividends-received deduction to domestic corporations for foreign-source dividends received from 10% or more owned foreign corporations. The Company recorded a decrease in tax expense of $3,843,000 in 2017 from the reversal of the tax effect of a 2016 dividend paid in 2017 from a wholly-owned foreign subsidiary to its domestic entity.
Other Discrete Tax Events
The effective tax rate also included a decrease in tax expense of $6,472,000 in 2019, $8,488,000 in 2018, and $38,569,000 in 2017 related to stock options, primarily from the excess tax benefit arising from the difference between the deduction for tax purposes and the compensation cost recognized for financial reporting purposes from stock option exercises. The Company cannot predict the level of stock option exercises by employees in future periods.
Other discrete tax events included a net decrease in tax expense of $1,932,000 in 2019, $1,847,000 in 2018, and $2,502,000 in 2017, consisting primarily of the expiration of the statutes of limitations for certain reserves for income tax uncertainties and the final true-up of the prior year's tax accrual upon filing the related tax returns.
The Company is tax resident in numerous jurisdictions around the world and has identified its major tax jurisdictions as the United States, Ireland, and China. Management has determined that earnings from its legal entity in China will remain indefinitely reinvested to provide local funding for growth, and that earnings from all other jurisdictions will not be indefinitely reinvested. As of December 31, 2019 and 2018, $370,953,000 and $446,346,000 , respectively, of the Company’s cash, cash equivalents, and investments were held by foreign subsidiaries and were primarily denominated in U.S. Dollars.
Interest and penalties included in income tax expense were $116,000 , $91,000 , and $71,000 in 2019, 2018, and 2017, respectively.
On January 1, 2018, the Company adopted Accounting Standard Update (ASU) 2016-16, "Income Taxes - Intra-Entity Transfers of Assets Other than Inventory." This ASU requires the recognition of deferred income taxes for an intra-entity transfer of an asset other than inventory. As a result of this ASU, the Company recorded $5,961,000 through a cumulative-effect adjustment directly to retained earnings at the beginning of fiscal year 2018.
67
Tax Reserves
The changes in the reserve for income taxes, excluding gross interest and penalties, were as follows (in thousands):
Balance of reserve for income taxes as of December 31, 2017 | $ | ||
Gross amounts of increases in unrecognized tax benefits as a result of tax positions taken in prior periods | |||
Gross amounts of increases in unrecognized tax benefits as a result of tax positions taken in the current period | |||
Gross amounts of decreases in unrecognized tax benefits as a result of the expiration of the applicable statutes of limitations | ( | ) | |
Balance of reserve for income taxes as of December 31, 2018 | |||
Gross amounts of increases in unrecognized tax benefits as a result of tax positions taken in prior periods | |||
Gross amounts of increases in unrecognized tax benefits as a result of tax positions taken in the current period | |||
Gross amounts of decreases in unrecognized tax benefits as a result of the expiration of the applicable statutes of limitations | ( | ) | |
Balance of reserve for income taxes as of December 31, 2019 | $ | ||
The Company’s reserve for income taxes, including gross interest and penalties, was $12,591,000 as of December 31, 2019, which included $11,563,000 classified as a non-current liability and $1,028,000 recorded as a reduction to non-current deferred tax assets. The Company's reserve for income taxes, including gross interest and penalties, was $8,134,000 as of December 31, 2018, which included $7,106,000 classified as a non-current liability and $1,028,000 recorded as a reduction to non-current deferred tax assets. The amount of gross interest and penalties included in these balances was $1,000,000 and $840,000 as of December 31, 2019 and December 31, 2018, respectively. If the Company’s tax positions were sustained or the statutes of limitations related to certain positions expired, these reserves would be released and income tax expense would be reduced in a future period. As a result of the expiration of certain statutes of limitations, there is a potential that a portion of these reserves could be released, which would decrease income tax expense by approximately $1,300,000 to $1,400,000 over the next twelve months.
The Company has defined its major tax jurisdictions as the United States, Ireland, and China, and within the United States, Massachusetts. Within the United States, the tax years 2016 through 2019 remain open to examination by the Internal Revenue Service and various state taxing authorities. The tax years 2015 through 2019 remain open to examination by various taxing authorities in other jurisdictions in which the Company operates.
68
Deferred Tax Assets and Liabilities
Deferred tax assets and liabilities, presented on a gross basis by jurisdiction, consisted of the following (in thousands):
December 31, | |||||||
2019 | 2018 | ||||||
Non-current gross deferred tax assets: | |||||||
Intangible asset in connection with change in tax structure | $ | $ | |||||
Stock-based compensation expense | |||||||
Federal and state tax credit carryforwards | |||||||
Foreign net operating losses | |||||||
Depreciation | |||||||
Inventory and revenue related | |||||||
Bonuses, commissions, and other compensation | |||||||
Other | |||||||
Gross non-current deferred tax assets | |||||||
Valuation allowance | ( | ) | ( | ) | |||
$ | $ | ||||||
Non-current gross deferred tax liabilities: | |||||||
GILTI tax basis differences in connection with change in tax structure | $ | ( | ) | $ | |||
Other GILTI tax basis differences | ( | ) | |||||
Nondeductible intangible assets | ( | ) | |||||
Other | ( | ) | |||||
$ | ( | ) | $ | ( | ) | ||
In 2019, the Company recorded a valuation allowance of $1,200,000 for state research and development tax credits that were not considered to be realizable. Should these credits be utilized in a future period, the reserve associated with these credits would be reversed in the period when it is determined that the credits can be utilized to offset future state income tax liabilities. In addition, the Company had $9,519,000 of state research and development tax credit carryforwards, net of federal tax, as of December 31, 2019, which will begin to expire in 2020.
While the deferred tax assets, net of valuation allowance, are not assured of realization, management has evaluated the realizability of these deferred tax assets and has determined that it is more likely than not that these assets will be realized. In reaching this conclusion, we have evaluated certain relevant criteria including the Company’s historical profitability, current projections of future profitability, and the lives of tax credits, net operating losses, and other carryforwards. Should the Company fail to generate sufficient pre-tax profits in future periods, we may be required to establish valuation allowances against these deferred tax assets, resulting in a charge to current operations in the period of determination.
NOTE 19: Weighted Average Shares
Weighted-average shares were calculated as follows (in thousands):
Year Ended December 31, | ||||||||
2019 | 2018 | 2017 | ||||||
Basic weighted-average common shares outstanding | ||||||||
Effect of dilutive stock awards | ||||||||
Diluted weighted-average common and common-equivalent shares outstanding | ||||||||
Stock options to purchase 5,735,608 , 2,650,164 , and 3,363,141 shares of common stock, on a weighted-average basis, were outstanding in 2019, 2018, and 2017, respectively, but were not included in the calculation of dilutive net income per share because they were anti-dilutive. Restricted stock units totaling 13,092 shares of common stock, on
69
a weighted-average basis, were outstanding in 2019, but were not included in the calculation of dilutive net income per share because they were anti-dilutive. There were no restricted stock units outstanding that were anti-dilutive in 2018 or 2017.
NOTE 20: Segment and Geographic Information
The Company operates in one segment, machine vision technology. The Company’s chief operating decision maker is the chief executive officer, who makes decisions to allocate resources and assesses performance at the corporate level. The Company offers a variety of machine vision products that have similar economic characteristics, have the same production processes, and are distributed by the same sales channels to the same types of customers.
The following table summarizes information about geographic areas (in thousands):
United States | Europe | Greater China | Other | Total | |||||||||||||||
Year Ended December 31, 2019 | |||||||||||||||||||
Revenue | $ | $ | $ | $ | $ | ||||||||||||||
Long-lived assets | $ | ||||||||||||||||||
Year Ended December 31, 2018 | |||||||||||||||||||
Revenue | $ | $ | $ | $ | $ | ||||||||||||||
Long-lived assets | $ | ||||||||||||||||||
Year Ended December 31, 2017 | |||||||||||||||||||
Revenue | $ | $ | $ | $ | $ | ||||||||||||||
Long-lived assets | $ | ||||||||||||||||||
Revenue is presented geographically based upon the customer’s country of domicile. Revenue from a single customer accounted for 15 % and 20 % of total revenue in 2018 and 2017, respectively. Accounts receivable from the same customer accounted for 24 %, 30 %, and 40 % of total accounts receivable as of December 31, 2019, 2018, and 2017, respectively. In 2019, no customer accounted for greater than 10% of total revenue.
NOTE 21: Business Acquisitions
The Company completed one business acquisition in 2019 and two business acquisitions in 2017. All of these transactions were accounted for as business combinations. Pro-forma information for these acquisitions is not presented because they are not significant, either individually or in the aggregate. Revenue and earnings since the dates of the acquisitions included in the Company's Consolidated Statements of Operations are also not presented because they are not material. Transaction costs were immaterial and were expensed as incurred.
Assets acquired and liabilities assumed have been recorded at their estimated fair values as of the acquisition date. Contingent consideration is remeasured each reporting period with changes in fair value recorded in "Other income (expense)" on the Consolidated Statements of Operations.
Sualab Co., Ltd.
On October 16, 2019, the Company acquired all the outstanding shares of Sualab Co., Ltd. (Sualab), a provider of deep learning-based vision software for industrial image analysis based in Korea. The total consideration of $194,642,000 included cash payments of $170,602,000 upon closing. The remaining consideration consists of deferred payments of $24,040,000 that may become payable on the fourth anniversary date of the closing, contingent upon continued employment of key talent, and will be recorded as compensation expense over this four year period.
Sualab's intellectual property, engineering expertise, and market coverage are expected to increase the Company's existing deep learning capabilities. Combined with intellectual property acquired from ViDi Systems S.A. in 2017, the Company is now a leading provider of deep learning-based industrial vision software.
70
The purchase price that was not related to employment was allocated as follows (in thousands):
Cash and cash equivalents | $ | ||
Current investments | |||
Accounts receivable | |||
Inventories | |||
Prepaid expenses and other current assets | |||
Property, plant, and equipment | |||
Operating lease assets | |||
Deferred income tax asset | |||
Other assets | |||
Accounts payable | ( | ) | |
Accrued expenses | ( | ) | |
Deferred revenue and customer deposits | ( | ) | |
Operating lease liabilities | ( | ) | |
Non-current operating lease liabilities | ( | ) | |
Deferred income tax liabilities | ( | ) | |
Other liabilities | ( | ) | |
Completed technologies | |||
In-process technologies | |||
Customer relationships | |||
Non-compete agreements | |||
Trademarks | |||
Goodwill | |||
Purchase price | $ | ||
The completed technologies, in-process technologies, customer relationships, trademarks, and non-compete agreements are included in "Intangible assets" on the Consolidated Balance Sheet. The completed technologies are being amortized to cost of revenue over eight years , the customer relationships are being amortized to SG&A expenses over seven years , the trademarks are being amortized to SG&A expenses over two years , and the non-compete agreements are being amortized to RD&E expenses over six to seven years . The in-process technology will be amortized to cost of revenue over its estimated useful life once the technology is finalized. The portion of the acquired goodwill deductible for tax purposes is $104,609,000 .
GVi Ventures, Inc.
On April 12, 2017, the Company acquired selected assets and assumed selected liabilities of GVi Ventures, Inc., a privately-held maker of pre-configured vision solutions for common automotive applications based in the United States. The total purchase price of $5,368,000 included cash payment of $4,069,000 and contingent consideration valued at $1,299,000 as of the acquisition date. In addition, the Company entered into special incentive payments tied to employment, none of which are material, that are being recorded as compensation expense.
The Company recorded fair value adjustments in non-operating expense totaling $282,000 in 2017 and $1,065,000 in 2018, and paid out $1,000,000 in 2018 of the contingent consideration. In 2019, the remaining contingent consideration liability was reduced to zero as a result of a lower level of revenue in the America's automotive industry. The undiscounted potential outcomes related to future contingent consideration range from $0 to $2,500,000 based upon certain revenue levels over the next three years.
Under this transaction, in addition to customer relationships and completed technologies, the Company acquired a team of software engineers that are expected to develop new products and increase the Company's ability to serve large customers in the automotive industry.
71
The purchase price was allocated as follows (in thousands):
Accounts receivable | $ | ||
Inventories | |||
Prepaid expenses and other current assets | |||
Accounts payable | ( | ) | |
Accrued expenses | ( | ) | |
Completed technologies | |||
Customer relationships | |||
Goodwill | |||
Purchase price | $ | ||
The customer relationships and completed technologies are included in "Intangible assets" on the Consolidated Balance Sheet. The customer relationships are being amortized to selling, general, and administrative expenses over eight years , and the completed technologies are being amortized to cost of revenue over five years , both on a straight-line basis. The portion of the acquired goodwill deductible for tax purposes is $443,000 .
ViDi Systems S.A.
On April 4, 2017, the Company acquired all of the outstanding shares of ViDi Systems, S.A. (ViDi), a privately-held vision software company based in Switzerland. The total purchase price of $23,015,000 included cash payment of $20,019,000 , with the remaining $2,996,000 recorded as a holdback to secure potential claims under the agreement that was paid in 2018. In addition, the Company entered into a special incentive payment tied to employment, which is not material, that is being recorded as compensation expense.
Under this transaction, in addition to completed technologies, the Company acquired a team of software engineers that are expected to help the Company broaden the scope of applications that can be addressed with Cognex vision. ViDi's deep learning software solves complex applications that are too complicated and time-consuming to program and maintain with traditional machine vision rules-based algorithms. Using feedback, ViDi's software trains the system to distinguish between acceptable variations and defects.
The purchase price was allocated as follows (in thousands):
Cash | $ | ||
Accounts receivable | |||
Prepaid expenses and other current assets | |||
Property, plant, and equipment | |||
Deferred income tax asset | |||
Accounts payable | ( | ) | |
Accrued expenses | ( | ) | |
Deferred income tax liability | ( | ) | |
Non-compete agreement | |||
Completed technologies | |||
Goodwill | |||
Purchase price | $ | ||
NOTE 22: Subsequent Events
On February 13, 2020, the Company's Board of Directors declared a cash dividend of $0.055 per share. The dividend is payable March 13, 2020 to all shareholders of record as of the close of business on February 28, 2020 .
72
COGNEX CORPORATION - SELECTED QUARTERLY FINANCIAL DATA (UNAUDITED)
Quarter Ended | |||||||||||||||
March 31, 2019 | June 30, 2019 | September 29, 2019 | December 31, 2019 | ||||||||||||
(In thousands, except per share amounts) | |||||||||||||||
Revenue | $ | $ | $ | $ | |||||||||||
Gross margin | |||||||||||||||
Operating income | |||||||||||||||
Net income | $ | $ | $ | $ | |||||||||||
Basic net income per share | $ | $ | $ | $ | |||||||||||
Diluted net income per share | $ | $ | $ | $ | |||||||||||
Quarter Ended | |||||||||||||||
April 1, 2018 | July 1, 2018 | September 30, 2018 | December 31, 2018 | ||||||||||||
(In thousands, except per share amounts) | |||||||||||||||
Revenue | $ | $ | $ | $ | |||||||||||
Gross margin | |||||||||||||||
Operating income | |||||||||||||||
Net income | $ | $ | $ | $ | |||||||||||
Basic net income per share | $ | $ | $ | $ | |||||||||||
Diluted net income per share | $ | $ | $ | $ | |||||||||||
73
COGNEX CORPORATION – SCHEDULE II – VALUATION AND QUALIFYING ACCOUNTS
Additions | ||||||||||||||||||||||||
Description | Balance at Beginning of Period | Charged to Costs and Expenses | Charged to Other Accounts | Deductions | Other | Balance at End of Period | ||||||||||||||||||
(In thousands) | ||||||||||||||||||||||||
Reserve for Uncollectible Accounts Receivable and Sales Returns: | ||||||||||||||||||||||||
2019 | $ | $ | $ | — | $ | ( | ) | (a) | $ | (b) | $ | |||||||||||||
2018 | $ | $ | $ | — | $ | ( | ) | (a) | $ | ( | ) | (b) | $ | |||||||||||
2017 | $ | $ | $ | — | $ | ( | ) | (a) | $ | (b) | $ | |||||||||||||
Deferred Tax Valuation Allowance: | ||||||||||||||||||||||||
2019 | $ | $ | $ | — | $ | $ | $ | |||||||||||||||||
2018 | $ | $ | $ | — | $ | $ | $ | |||||||||||||||||
2017 | $ | $ | $ | — | $ | $ | $ | |||||||||||||||||
(a) | Specific write-offs |
(b) | Foreign currency exchange rate changes |
74
ITEM 9: CHANGES IN AND DISAGREEMENTS WITH ACCOUNTANTS ON ACCOUNTING AND FINANCIAL DISCLOSURE
There were no disagreements with accountants on accounting or financial disclosure during 2019 or 2018.
ITEM 9A: CONTROLS AND PROCEDURES
Disclosure Controls and Procedures
As required by Rules 13a-15 and 15d-15 of the Securities Exchange Act of 1934, the Company has evaluated, with the participation of management, including the Chief Executive Officer and the Principal Financial & Accounting Officer, the effectiveness of its disclosure controls and procedures (as defined in such rules) as of the end of the period covered by this report. Based on such evaluation, the Chief Executive Officer and Principal Financial & Accounting Officer concluded that such disclosure controls and procedures were effective as of that date.
Management’s Report on Internal Control over Financial Reporting
Management is responsible for establishing and maintaining adequate internal control over financial reporting. Management has evaluated the effectiveness of the Company’s internal control over financial reporting based upon the framework in Internal Control – Integrated Framework issued in 2013 by the Committee of Sponsoring Organizations of the Treadway Commission (COSO).
Based upon our evaluation, management has concluded that the Company’s internal control over financial reporting was effective as of December 31, 2019.
Attestation Report of the Registered Public Accounting Firm on Internal Control over Financial Reporting
The Company’s internal control over financial reporting as of December 31, 2019 has been audited by Grant Thornton LLP, an independent registered public accounting firm, as stated in their report which is included herein.
Changes in Internal Control over Financial Reporting
There have been no changes in the Company's internal control over financial reporting that occurred during the fourth quarter of the year ended December 31, 2019 that have materially affected, or are reasonably likely to materially affect, the Company’s internal control over financial reporting. The Company continues to review its disclosure controls and procedures, including its internal control over financial reporting, and may from time to time make changes aimed at enhancing their effectiveness and to ensure that the Company’s systems evolve with its business.
75
REPORT OF INDEPENDENT REGISTERED PUBLIC ACCOUNTING FIRM
Board of Directors and Shareholders Cognex Corporation
Opinion on internal control over financial reporting
We have audited the internal control over financial reporting of Cognex Corporation (a Massachusetts corporation) and subsidiaries (the “Company”) as of December 31, 2019, based on criteria established in the 2013 Internal Control-Integrated Framework issued by the Committee of Sponsoring Organizations of the Treadway Commission ("COSO"). In our opinion, the Company maintained, in all material respects, effective internal control over financial reporting as of December 31, 2019, based on criteria established in the 2013 Internal Control-Integrated Framework issued by COSO.
We also have audited, in accordance with the standards of the Public Company Accounting Oversight Board (United States) (“PCAOB”), the consolidated financial statements of the Company as of and for the year ended December 31, 2019, and our report dated February 13, 2020 expressed an unqualified opinion on those financial statements.
Basis for opinion
The Company’s management is responsible for maintaining effective internal control over financial reporting and for its assessment of the effectiveness of internal control over financial reporting, included in the accompanying Management’s Report on Internal Control over Financial Reporting. Our responsibility is to express an opinion on the Company’s internal control over financial reporting based on our audit. We are a public accounting firm registered with the PCAOB and are required to be independent with respect to the Company in accordance with the U.S. federal securities laws and the applicable rules and regulations of the Securities and Exchange Commission and the PCAOB.
We conducted our audit in accordance with the standards of the PCAOB. Those standards require that we plan and perform the audit to obtain reasonable assurance about whether effective internal control over financial reporting was maintained in all material respects. Our audit included obtaining an understanding of internal control over financial reporting, assessing the risk that a material weakness exists, testing and evaluating the design and operating effectiveness of internal control based on the assessed risk, and performing such other procedures as we considered necessary in the circumstances. We believe that our audit provides a reasonable basis for our opinion.
Definition and limitations of internal control over financial reporting
A company’s internal control over financial reporting is a process designed to provide reasonable assurance regarding the reliability of financial reporting and the preparation of financial statements for external purposes in accordance with generally accepted accounting principles. A company’s internal control over financial reporting includes those policies and procedures that (1) pertain to the maintenance of records that, in reasonable detail, accurately and fairly reflect the transactions and dispositions of the assets of the company; (2) provide reasonable assurance that transactions are recorded as necessary to permit preparation of financial statements in accordance with generally accepted accounting principles, and that receipts and expenditures of the company are being made only in accordance with authorizations of management and directors of the company; and (3) provide reasonable assurance regarding prevention or timely detection of unauthorized acquisition, use, or disposition of the company’s assets that could have a material effect on the financial statements.
Because of its inherent limitations, internal control over financial reporting may not prevent or detect misstatements. Also, projections of any evaluation of effectiveness to future periods are subject to the risk that controls may become inadequate because of changes in conditions, or that the degree of compliance with the policies or procedures may deteriorate.
/s/ GRANT THORNTON LLP
Boston, Massachusetts
February 13, 2020
76
ITEM 9B: OTHER INFORMATION
None
PART III
ITEM 10: DIRECTORS, EXECUTIVE OFFICERS, AND CORPORATE GOVERNANCE
Information with respect to Directors and Executive Officers of the Company and the other matters required by Item 10 shall be included in the Company’s definitive Proxy Statement for the Annual Meeting of Shareholders to be held on April 23, 2020 and is incorporated herein by reference. In addition, certain information with respect to Executive Officers of the Company may be found in the section captioned “Executive Officers of the Registrant,” appearing in Part I – Item 4A of this Annual Report on Form 10-K.
The Company has adopted a Code of Business Conduct and Ethics covering all employees, which is available, free of charge, on the Company’s website, www.cognex.com under "Company-Investor Information-Governance". The Company intends to disclose on its website any amendments to or waivers of the Code of Business Conduct and Ethics on behalf of the Company’s directors and executive officers that would otherwise be required to be disclosed under the rules of the SEC or The NASDAQ Stock Market LLC.
ITEM 11: EXECUTIVE COMPENSATION
Information with respect to executive compensation and the other matters required by Item 11 shall be included in the Company’s definitive Proxy Statement for the Annual Meeting of Shareholders to be held on April 23, 2020 and is incorporated herein by reference.
ITEM 12: SECURITY OWNERSHIP OF CERTAIN BENEFICIAL OWNERS AND MANAGEMENT AND RELATED STOCKHOLDER MATTERS
Information with respect to security ownership and the other matters required by Item 12 shall be included in the Company’s definitive Proxy Statement for the Annual Meeting of Shareholders to be held on April 23, 2020 and is incorporated herein by reference.
The following table provides information as of December 31, 2019 regarding shares of common stock that may be issued under the Company’s existing equity compensation plans:
Plan Category | Number of securities to be issued upon exercise of outstanding options, warrants and rights, and vesting of restricted stock units | Weighted-average exercise price of outstanding options, restricted stock units, warrants, and rights | Number of securities remaining available for future issuance under equity compensation plans (excluding securities reflected in column (a)) | |||||||
(a) | ||||||||||
Equity compensation plans approved by shareholders (4) | 12,798,120 | (1) | $ | 38.4639 | (2) | |||||
Equity compensation plans not approved by shareholders (4) | 250,168 | (3) | 7.2401 | - | ||||||
13,048,288 | $ | 37.8652 | 17,300,802 | |||||||
(1) | Includes shares to be issued upon exercise of outstanding options under the Company’s 1998 Stock Incentive Plan, 2007 Stock Option and Incentive Plan, and subsequent to shareholder approval, the 2001 General Stock Option Plan, as amended and restated. |
(2) | Includes shares remaining available for future issuance under the Company’s 2007 Stock Option and Incentive Plan and 2001 General Stock Option Plan, as amended and restated. |
(3) | Includes shares to be issued upon the exercise of outstanding options granted prior to shareholder approval under the 2001 General Stock Option Plan, as amended and restated. |
(4) | All references made to share or per share amounts have been adjusted to reflect the two-for-one stock split which occurred in the fourth quarter of 2017. |
The 2001 General Stock Option Plan was originally adopted by the Board of Directors in December 2001 without shareholder approval. In December 2011, this plan received shareholder approval for an amendment and restatement of the plan. This plan provides for the granting of nonqualified stock options and incentive stock options to any employee who is actively employed by the Company and is not an officer or director of the Company. The maximum number of shares of common stock available for grant under this plan is 38,440,000 shares. All option grants must have an exercise price per share that is no less than the fair market value per share of the Company’s common stock on the grant date and must have a term that is no longer than ten years from the grant date. 29,991,140 stock options have been granted under the 2001 General Stock Option Plan.
77
ITEM 13: CERTAIN RELATIONSHIPS AND RELATED TRANSACTIONS, AND DIRECTOR INDEPENDENCE
Information with respect to certain relationships and related transactions and the other matters required by Item 13 shall be included in the Company’s definitive Proxy Statement for the Annual Meeting of Shareholders to be held on April 23, 2020 and is incorporated herein by reference.
ITEM 14: PRINCIPAL ACCOUNTING FEES AND SERVICES
Information with respect to principal accounting fees and services and the other matters required by Item 14 shall be included in the Company’s definitive Proxy Statement for the Annual Meeting of Shareholders to be held on April 23, 2020 and is incorporated herein by reference.
PART IV
ITEM 15: EXHIBITS AND FINANCIAL STATEMENT SCHEDULES
(1) | Financial Statements |
The financial statements are included in Part II – Item 8 of this Annual Report on Form 10-K.
(2) | Financial Statement Schedule |
Financial Statement Schedule II is included in Part II – Item 8 of this Annual Report on Form 10-K.
Other schedules are omitted because of the absence of conditions under which they are required or because the required information is provided in the consolidated financial statements or notes thereto.
(3) | Exhibits |
The Exhibits filed as part of this Annual Report on Form 10-K are listed in the Exhibit Index, immediately preceding the signature page hereto.
ITEM 16: FORM 10-K SUMMARY
Not applicable
78
EXHIBIT INDEX
EXHIBIT NUMBER | ||
3A | ||
3B | ||
3C | ||
3D | ||
3E | ||
3F | ||
4A | Specimen Certificate for Shares of Common Stock (incorporated by reference to Exhibit 4 to Cognex's Registration Statement on Form S-1 [Registration No. 33-29020]) | |
4B | ||
10A * | ||
10B * | ||
10C * | ||
10D * | ||
10E * | ||
10F * | ||
10G * | ||
10H * | ||
10I * | ||
10J * | ||
10K * | ||
10L * | ||
79
10M * | ||
10N * | ||
10O * | ||
10P * | ||
10Q * | ||
10R * | ||
10S* | ||
10T* | ||
10U* | ||
18.1 | ||
21 | ||
23.1 | ||
31.1 | ||
31.2 | ||
32.1 | ||
32.2 | ||
101.SCH | Inline XBRL Taxonomy Extension Schema Document (filed herewith) | |
101.CAL | Inline XBRL Taxonomy Extension Calculation Linkbase Document (filed herewith) | |
101.LAB | Inline XBRL Taxonomy Extension Label Linkbase Document (filed herewith) | |
101.PRE | Inline XBRL Taxonomy Extension Presentation Linkbase Document (filed herewith) | |
101.DEF | Inline XBRL Taxonomy Extension Schema Document (filed herewith) | |
104 | Cover Page Interactive Data File (formatted as Inline XBRL with applicable taxonomy extension information contained in Exhibits 101*.) (filed herewith) | |
* Indicated management contract or compensatory plan or arrangement | ||
80
SIGNATURES
Pursuant to the requirements of Section 13 or 15(d) of the Securities Exchange Act of 1934, the registrant has duly caused this report to be signed on its behalf by the undersigned, thereunto duly authorized.
COGNEX CORPORATION | ||
By: | /s/ Robert J. Willett | |
Robert J. Willett | ||
President and Chief Executive Officer | ||
Pursuant to the requirements of the Securities Exchange Act of 1934, this report has been signed below by the following persons on behalf of the registrant and in the capacities and on the dates indicated.
Signature | Title | Date | ||
/s/ Robert J. Shillman | Chairman of the Board of Directors and Chief Culture Officer | February 13, 2020 | ||
Robert J. Shillman | ||||
/s/ Robert J. Willett | President, Chief Executive Officer, and Director (principal executive officer) | February 13, 2020 | ||
Robert J. Willett | ||||
/s/ Laura A. MacDonald | Vice President and Corporate Controller (principal financial and accounting officer) | February 13, 2020 | ||
Laura A. MacDonald | ||||
/s/ Patrick Alias | Director | February 13, 2020 | ||
Patrick Alias | ||||
/s/ Eugene Banucci | Director | February 13, 2020 | ||
Eugene Banucci | ||||
/s/ Theodor Krantz | Director | February 13, 2020 | ||
Theodor Krantz | ||||
/s/ Dianne Parrotte | Director | February 13, 2020 | ||
Dianne Parrotte | ||||
/s/ Jerry Schneider | Director | February 13, 2020 | ||
Jerry Schneider | ||||
/s/ Anthony Sun | Director | February 13, 2020 | ||
Anthony Sun | ||||
81