FALSE00008493952022FYL2CRH PUBLIC LTD COP5YP10Y0.330.20P2YP1YP1YP1YP1Y00008493952022-01-012022-12-310000849395dei:BusinessContactMember2022-01-012022-12-310000849395dei:AdrMember2022-01-012022-12-3100008493952022-12-31xbrli:sharesiso4217:USD00008493952021-01-012021-12-3100008493952020-01-012020-12-31iso4217:USDxbrli:shares00008493952021-12-310000849395ifrs-full:IssuedCapitalMember2021-12-310000849395ifrs-full:SharePremiumMember2021-12-310000849395ifrs-full:TreasurySharesMember2021-12-310000849395ifrs-full:OtherReservesMember2021-12-310000849395ifrs-full:ReserveOfCashFlowHedgesMember2021-12-310000849395ifrs-full:ReserveOfExchangeDifferencesOnTranslationMember2021-12-310000849395ifrs-full:RetainedEarningsMember2021-12-310000849395crh:TotalEquityAttributableToOwnersOfParentMember2021-12-310000849395ifrs-full:NoncontrollingInterestsMember2021-12-310000849395ifrs-full:RetainedEarningsMember2022-01-012022-12-310000849395crh:TotalEquityAttributableToOwnersOfParentMember2022-01-012022-12-310000849395ifrs-full:NoncontrollingInterestsMember2022-01-012022-12-310000849395ifrs-full:ReserveOfCashFlowHedgesMember2022-01-012022-12-310000849395ifrs-full:ReserveOfExchangeDifferencesOnTranslationMember2022-01-012022-12-310000849395ifrs-full:OtherReservesMember2022-01-012022-12-310000849395ifrs-full:TreasurySharesMember2022-01-012022-12-310000849395ifrs-full:IssuedCapitalMember2022-01-012022-12-310000849395ifrs-full:IssuedCapitalMember2022-12-310000849395ifrs-full:SharePremiumMember2022-12-310000849395ifrs-full:TreasurySharesMember2022-12-310000849395ifrs-full:OtherReservesMember2022-12-310000849395ifrs-full:ReserveOfCashFlowHedgesMember2022-12-310000849395ifrs-full:ReserveOfExchangeDifferencesOnTranslationMember2022-12-310000849395ifrs-full:RetainedEarningsMember2022-12-310000849395crh:TotalEquityAttributableToOwnersOfParentMember2022-12-310000849395ifrs-full:NoncontrollingInterestsMember2022-12-310000849395ifrs-full:IssuedCapitalMember2020-12-310000849395ifrs-full:SharePremiumMember2020-12-310000849395ifrs-full:TreasurySharesMember2020-12-310000849395ifrs-full:OtherReservesMember2020-12-310000849395ifrs-full:ReserveOfCashFlowHedgesMember2020-12-310000849395ifrs-full:ReserveOfExchangeDifferencesOnTranslationMember2020-12-310000849395ifrs-full:RetainedEarningsMember2020-12-310000849395crh:TotalEquityAttributableToOwnersOfParentMember2020-12-310000849395ifrs-full:NoncontrollingInterestsMember2020-12-3100008493952020-12-310000849395ifrs-full:RetainedEarningsMember2021-01-012021-12-310000849395crh:TotalEquityAttributableToOwnersOfParentMember2021-01-012021-12-310000849395ifrs-full:NoncontrollingInterestsMember2021-01-012021-12-310000849395ifrs-full:ReserveOfExchangeDifferencesOnTranslationMember2021-01-012021-12-310000849395ifrs-full:OtherReservesMember2021-01-012021-12-310000849395ifrs-full:TreasurySharesMember2021-01-012021-12-310000849395ifrs-full:SharePremiumMember2021-01-012021-12-310000849395ifrs-full:IssuedCapitalMember2021-01-012021-12-310000849395ifrs-full:IssuedCapitalMember2019-12-310000849395ifrs-full:SharePremiumMember2019-12-310000849395ifrs-full:TreasurySharesMember2019-12-310000849395ifrs-full:OtherReservesMember2019-12-310000849395ifrs-full:ReserveOfCashFlowHedgesMember2019-12-310000849395ifrs-full:ReserveOfExchangeDifferencesOnTranslationMember2019-12-310000849395ifrs-full:RetainedEarningsMember2019-12-310000849395crh:TotalEquityAttributableToOwnersOfParentMember2019-12-310000849395ifrs-full:NoncontrollingInterestsMember2019-12-3100008493952019-12-310000849395ifrs-full:RetainedEarningsMember2020-01-012020-12-310000849395crh:TotalEquityAttributableToOwnersOfParentMember2020-01-012020-12-310000849395ifrs-full:NoncontrollingInterestsMember2020-01-012020-12-310000849395ifrs-full:ReserveOfExchangeDifferencesOnTranslationMember2020-01-012020-12-310000849395ifrs-full:OtherReservesMember2020-01-012020-12-310000849395ifrs-full:TreasurySharesMember2020-01-012020-12-310000849395ifrs-full:IssuedCapitalMember2020-01-012020-12-310000849395crh:TSRMeasureMember2022-01-012022-12-31xbrli:pure0000849395crh:TSRMeasureMember2021-01-012021-12-310000849395crh:TSRMeasureMember2020-01-012020-12-310000849395crh:CumulativeCashFlowTargetMember2022-01-012022-12-310000849395crh:CumulativeCashFlowTargetMember2021-01-012021-12-310000849395crh:CumulativeCashFlowTargetMember2020-01-012020-12-310000849395crh:TSRMeasureMembercrh:TailoredSectorPeerGroupMember2022-01-012022-12-310000849395crh:TSRMeasureMembercrh:TailoredSectorPeerGroupMember2021-01-012021-12-310000849395crh:TSRMeasureMembercrh:TailoredSectorPeerGroupMember2020-01-012020-12-310000849395crh:SustainabilityAndDiversityScorecardMetricMember2022-01-012022-12-310000849395ifrs-full:TopOfRangeMember2022-01-012022-12-310000849395ifrs-full:BuildingsMember2022-01-012022-12-310000849395crh:PlantAndMachineryMemberifrs-full:BottomOfRangeMember2022-01-012022-12-310000849395crh:PlantAndMachineryMemberifrs-full:TopOfRangeMember2022-01-012022-12-310000849395ifrs-full:VehiclesMembersrt:WeightedAverageMember2022-01-012022-12-310000849395srt:MinimumMemberifrs-full:CustomerrelatedIntangibleAssetsMember2022-01-012022-12-310000849395srt:MaximumMemberifrs-full:CustomerrelatedIntangibleAssetsMember2022-01-012022-12-310000849395crh:MarketRelatedIntangibleAssetsMembersrt:MinimumMember2022-01-012022-12-310000849395crh:MarketRelatedIntangibleAssetsMembersrt:MaximumMember2022-01-012022-12-310000849395currency:BRL2022-01-012022-12-31utr:Rate0000849395currency:BRL2021-01-012021-12-310000849395currency:BRL2020-01-012020-12-310000849395currency:BRL2022-12-310000849395currency:BRL2021-12-310000849395currency:CAD2022-01-012022-12-310000849395currency:CAD2021-01-012021-12-310000849395currency:CAD2020-01-012020-12-310000849395currency:CAD2022-12-310000849395currency:CAD2021-12-310000849395currency:CNY2022-01-012022-12-310000849395currency:CNY2021-01-012021-12-310000849395currency:CNY2020-01-012020-12-310000849395currency:CNY2022-12-310000849395currency:CNY2021-12-310000849395currency:DKK2022-01-012022-12-310000849395currency:DKK2021-01-012021-12-310000849395currency:DKK2020-01-012020-12-310000849395currency:DKK2022-12-310000849395currency:DKK2021-12-310000849395srt:EuropeMember2022-01-012022-12-310000849395srt:EuropeMember2021-01-012021-12-310000849395srt:EuropeMember2020-01-012020-12-310000849395srt:EuropeMember2022-12-310000849395srt:EuropeMember2021-12-310000849395currency:HUF2022-01-012022-12-310000849395currency:HUF2021-01-012021-12-310000849395currency:HUF2020-01-012020-12-310000849395currency:HUF2022-12-310000849395currency:HUF2021-12-310000849395currency:INR2022-01-012022-12-310000849395currency:INR2021-01-012021-12-310000849395currency:INR2020-01-012020-12-310000849395currency:INR2022-12-310000849395currency:INR2021-12-310000849395currency:PHP2022-01-012022-12-310000849395currency:PHP2021-01-012021-12-310000849395currency:PHP2020-01-012020-12-310000849395currency:PHP2022-12-310000849395currency:PHP2021-12-310000849395currency:PLN2022-01-012022-12-310000849395currency:PLN2021-01-012021-12-310000849395currency:PLN2020-01-012020-12-310000849395currency:PLN2022-12-310000849395currency:PLN2021-12-310000849395currency:GBP2022-01-012022-12-310000849395currency:GBP2021-01-012021-12-310000849395currency:GBP2020-01-012020-12-310000849395currency:GBP2022-12-310000849395currency:GBP2021-12-310000849395currency:RON2022-01-012022-12-310000849395currency:RON2021-01-012021-12-310000849395currency:RON2020-01-012020-12-310000849395currency:RON2022-12-310000849395currency:RON2021-12-310000849395currency:RSD2022-01-012022-12-310000849395currency:RSD2021-01-012021-12-310000849395currency:RSD2020-01-012020-12-310000849395currency:RSD2022-12-310000849395currency:RSD2021-12-310000849395currency:CHF2022-01-012022-12-310000849395currency:CHF2021-01-012021-12-310000849395currency:CHF2020-01-012020-12-310000849395currency:CHF2022-12-310000849395currency:CHF2021-12-310000849395currency:UAH2022-01-012022-12-310000849395currency:UAH2021-01-012021-12-310000849395currency:UAH2020-01-012020-12-310000849395currency:UAH2022-12-310000849395currency:UAH2021-12-31crh:Segments0000849395ifrs-full:ForeignCountriesMemberifrs-full:BottomOfRangeMember2022-01-012022-12-310000849395crh:AmericasMaterialsMembercountry:IE2022-01-012022-12-310000849395crh:BuildingProductsMembercountry:IE2022-01-012022-12-310000849395crh:EuropeMaterialsMembercountry:IE2022-01-012022-12-310000849395country:IE2022-01-012022-12-310000849395crh:AmericasMaterialsMembercountry:IE2021-01-012021-12-310000849395crh:BuildingProductsMembercountry:IE2021-01-012021-12-310000849395crh:EuropeMaterialsMembercountry:IE2021-01-012021-12-310000849395country:IE2021-01-012021-12-310000849395crh:AmericasMaterialsMembercountry:IE2020-01-012020-12-310000849395crh:BuildingProductsMembercountry:IE2020-01-012020-12-310000849395crh:EuropeMaterialsMembercountry:IE2020-01-012020-12-310000849395country:IE2020-01-012020-12-310000849395country:GBcrh:AmericasMaterialsMember2022-01-012022-12-310000849395crh:BuildingProductsMembercountry:GB2022-01-012022-12-310000849395crh:EuropeMaterialsMembercountry:GB2022-01-012022-12-310000849395country:GB2022-01-012022-12-310000849395country:GBcrh:AmericasMaterialsMember2021-01-012021-12-310000849395crh:BuildingProductsMembercountry:GB2021-01-012021-12-310000849395crh:EuropeMaterialsMembercountry:GB2021-01-012021-12-310000849395country:GB2021-01-012021-12-310000849395country:GBcrh:AmericasMaterialsMember2020-01-012020-12-310000849395crh:BuildingProductsMembercountry:GB2020-01-012020-12-310000849395crh:EuropeMaterialsMembercountry:GB2020-01-012020-12-310000849395country:GB2020-01-012020-12-310000849395crh:RestOfEuropeMembercrh:AmericasMaterialsMember2022-01-012022-12-310000849395crh:RestOfEuropeMembercrh:BuildingProductsMember2022-01-012022-12-310000849395crh:RestOfEuropeMembercrh:EuropeMaterialsMember2022-01-012022-12-310000849395crh:RestOfEuropeMember2022-01-012022-12-310000849395crh:RestOfEuropeMembercrh:AmericasMaterialsMember2021-01-012021-12-310000849395crh:RestOfEuropeMembercrh:BuildingProductsMember2021-01-012021-12-310000849395crh:RestOfEuropeMembercrh:EuropeMaterialsMember2021-01-012021-12-310000849395crh:RestOfEuropeMember2021-01-012021-12-310000849395crh:RestOfEuropeMembercrh:AmericasMaterialsMember2020-01-012020-12-310000849395crh:RestOfEuropeMembercrh:BuildingProductsMember2020-01-012020-12-310000849395crh:RestOfEuropeMembercrh:EuropeMaterialsMember2020-01-012020-12-310000849395crh:RestOfEuropeMember2020-01-012020-12-310000849395country:UScrh:AmericasMaterialsMember2022-01-012022-12-310000849395country:UScrh:BuildingProductsMember2022-01-012022-12-310000849395crh:EuropeMaterialsMembercountry:US2022-01-012022-12-310000849395country:US2022-01-012022-12-310000849395country:UScrh:AmericasMaterialsMember2021-01-012021-12-310000849395country:UScrh:BuildingProductsMember2021-01-012021-12-310000849395crh:EuropeMaterialsMembercountry:US2021-01-012021-12-310000849395country:US2021-01-012021-12-310000849395country:UScrh:AmericasMaterialsMember2020-01-012020-12-310000849395country:UScrh:BuildingProductsMember2020-01-012020-12-310000849395crh:EuropeMaterialsMembercountry:US2020-01-012020-12-310000849395country:US2020-01-012020-12-310000849395crh:RestOfWorldMembercrh:AmericasMaterialsMember2022-01-012022-12-310000849395crh:RestOfWorldMembercrh:BuildingProductsMember2022-01-012022-12-310000849395crh:EuropeMaterialsMembercrh:RestOfWorldMember2022-01-012022-12-310000849395crh:RestOfWorldMember2022-01-012022-12-310000849395crh:RestOfWorldMembercrh:AmericasMaterialsMember2021-01-012021-12-310000849395crh:RestOfWorldMembercrh:BuildingProductsMember2021-01-012021-12-310000849395crh:EuropeMaterialsMembercrh:RestOfWorldMember2021-01-012021-12-310000849395crh:RestOfWorldMember2021-01-012021-12-310000849395crh:RestOfWorldMembercrh:AmericasMaterialsMember2020-01-012020-12-310000849395crh:RestOfWorldMembercrh:BuildingProductsMember2020-01-012020-12-310000849395crh:EuropeMaterialsMembercrh:RestOfWorldMember2020-01-012020-12-310000849395crh:RestOfWorldMember2020-01-012020-12-310000849395crh:AmericasMaterialsMember2022-01-012022-12-310000849395crh:BuildingProductsMember2022-01-012022-12-310000849395crh:EuropeMaterialsMember2022-01-012022-12-310000849395crh:AmericasMaterialsMember2021-01-012021-12-310000849395crh:BuildingProductsMember2021-01-012021-12-310000849395crh:EuropeMaterialsMember2021-01-012021-12-310000849395crh:AmericasMaterialsMember2020-01-012020-12-310000849395crh:BuildingProductsMember2020-01-012020-12-310000849395crh:EuropeMaterialsMember2020-01-012020-12-310000849395country:GBifrs-full:DiscontinuedOperationsMembercrh:AmericasMaterialsMember2022-01-012022-12-310000849395crh:BuildingProductsMembercountry:GBifrs-full:DiscontinuedOperationsMember2022-01-012022-12-310000849395crh:EuropeMaterialsMembercountry:GBifrs-full:DiscontinuedOperationsMember2022-01-012022-12-310000849395country:GBifrs-full:DiscontinuedOperationsMember2022-01-012022-12-310000849395country:GBifrs-full:DiscontinuedOperationsMembercrh:AmericasMaterialsMember2021-01-012021-12-310000849395crh:BuildingProductsMembercountry:GBifrs-full:DiscontinuedOperationsMember2021-01-012021-12-310000849395crh:EuropeMaterialsMembercountry:GBifrs-full:DiscontinuedOperationsMember2021-01-012021-12-310000849395country:GBifrs-full:DiscontinuedOperationsMember2021-01-012021-12-310000849395country:GBifrs-full:DiscontinuedOperationsMembercrh:AmericasMaterialsMember2020-01-012020-12-310000849395crh:BuildingProductsMembercountry:GBifrs-full:DiscontinuedOperationsMember2020-01-012020-12-310000849395crh:EuropeMaterialsMembercountry:GBifrs-full:DiscontinuedOperationsMember2020-01-012020-12-310000849395country:GBifrs-full:DiscontinuedOperationsMember2020-01-012020-12-310000849395crh:RestOfEuropeMemberifrs-full:DiscontinuedOperationsMembercrh:AmericasMaterialsMember2022-01-012022-12-310000849395crh:RestOfEuropeMembercrh:BuildingProductsMemberifrs-full:DiscontinuedOperationsMember2022-01-012022-12-310000849395crh:RestOfEuropeMembercrh:EuropeMaterialsMemberifrs-full:DiscontinuedOperationsMember2022-01-012022-12-310000849395crh:RestOfEuropeMemberifrs-full:DiscontinuedOperationsMember2022-01-012022-12-310000849395crh:RestOfEuropeMemberifrs-full:DiscontinuedOperationsMembercrh:AmericasMaterialsMember2021-01-012021-12-310000849395crh:RestOfEuropeMembercrh:BuildingProductsMemberifrs-full:DiscontinuedOperationsMember2021-01-012021-12-310000849395crh:RestOfEuropeMembercrh:EuropeMaterialsMemberifrs-full:DiscontinuedOperationsMember2021-01-012021-12-310000849395crh:RestOfEuropeMemberifrs-full:DiscontinuedOperationsMember2021-01-012021-12-310000849395crh:RestOfEuropeMemberifrs-full:DiscontinuedOperationsMembercrh:AmericasMaterialsMember2020-01-012020-12-310000849395crh:RestOfEuropeMembercrh:BuildingProductsMemberifrs-full:DiscontinuedOperationsMember2020-01-012020-12-310000849395crh:RestOfEuropeMembercrh:EuropeMaterialsMemberifrs-full:DiscontinuedOperationsMember2020-01-012020-12-310000849395crh:RestOfEuropeMemberifrs-full:DiscontinuedOperationsMember2020-01-012020-12-310000849395country:USifrs-full:DiscontinuedOperationsMembercrh:AmericasMaterialsMember2022-01-012022-12-310000849395country:UScrh:BuildingProductsMemberifrs-full:DiscontinuedOperationsMember2022-01-012022-12-310000849395crh:EuropeMaterialsMembercountry:USifrs-full:DiscontinuedOperationsMember2022-01-012022-12-310000849395country:USifrs-full:DiscontinuedOperationsMember2022-01-012022-12-310000849395country:USifrs-full:DiscontinuedOperationsMembercrh:AmericasMaterialsMember2021-01-012021-12-310000849395country:UScrh:BuildingProductsMemberifrs-full:DiscontinuedOperationsMember2021-01-012021-12-310000849395crh:EuropeMaterialsMembercountry:USifrs-full:DiscontinuedOperationsMember2021-01-012021-12-310000849395country:USifrs-full:DiscontinuedOperationsMember2021-01-012021-12-310000849395country:USifrs-full:DiscontinuedOperationsMembercrh:AmericasMaterialsMember2020-01-012020-12-310000849395country:UScrh:BuildingProductsMemberifrs-full:DiscontinuedOperationsMember2020-01-012020-12-310000849395crh:EuropeMaterialsMembercountry:USifrs-full:DiscontinuedOperationsMember2020-01-012020-12-310000849395country:USifrs-full:DiscontinuedOperationsMember2020-01-012020-12-310000849395crh:RestOfWorldMemberifrs-full:DiscontinuedOperationsMembercrh:AmericasMaterialsMember2022-01-012022-12-310000849395crh:RestOfWorldMembercrh:BuildingProductsMemberifrs-full:DiscontinuedOperationsMember2022-01-012022-12-310000849395crh:EuropeMaterialsMembercrh:RestOfWorldMemberifrs-full:DiscontinuedOperationsMember2022-01-012022-12-310000849395crh:RestOfWorldMemberifrs-full:DiscontinuedOperationsMember2022-01-012022-12-310000849395crh:RestOfWorldMemberifrs-full:DiscontinuedOperationsMembercrh:AmericasMaterialsMember2021-01-012021-12-310000849395crh:RestOfWorldMembercrh:BuildingProductsMemberifrs-full:DiscontinuedOperationsMember2021-01-012021-12-310000849395crh:EuropeMaterialsMembercrh:RestOfWorldMemberifrs-full:DiscontinuedOperationsMember2021-01-012021-12-310000849395crh:RestOfWorldMemberifrs-full:DiscontinuedOperationsMember2021-01-012021-12-310000849395crh:RestOfWorldMemberifrs-full:DiscontinuedOperationsMembercrh:AmericasMaterialsMember2020-01-012020-12-310000849395crh:RestOfWorldMembercrh:BuildingProductsMemberifrs-full:DiscontinuedOperationsMember2020-01-012020-12-310000849395crh:EuropeMaterialsMembercrh:RestOfWorldMemberifrs-full:DiscontinuedOperationsMember2020-01-012020-12-310000849395crh:RestOfWorldMemberifrs-full:DiscontinuedOperationsMember2020-01-012020-12-310000849395ifrs-full:DiscontinuedOperationsMembercrh:AmericasMaterialsMember2022-01-012022-12-310000849395crh:BuildingProductsMemberifrs-full:DiscontinuedOperationsMember2022-01-012022-12-310000849395crh:EuropeMaterialsMemberifrs-full:DiscontinuedOperationsMember2022-01-012022-12-310000849395ifrs-full:DiscontinuedOperationsMember2022-01-012022-12-310000849395ifrs-full:DiscontinuedOperationsMembercrh:AmericasMaterialsMember2021-01-012021-12-310000849395crh:BuildingProductsMemberifrs-full:DiscontinuedOperationsMember2021-01-012021-12-310000849395crh:EuropeMaterialsMemberifrs-full:DiscontinuedOperationsMember2021-01-012021-12-310000849395ifrs-full:DiscontinuedOperationsMember2021-01-012021-12-310000849395ifrs-full:DiscontinuedOperationsMembercrh:AmericasMaterialsMember2020-01-012020-12-310000849395crh:BuildingProductsMemberifrs-full:DiscontinuedOperationsMember2020-01-012020-12-310000849395crh:EuropeMaterialsMemberifrs-full:DiscontinuedOperationsMember2020-01-012020-12-310000849395ifrs-full:DiscontinuedOperationsMember2020-01-012020-12-310000849395crh:CementLimeAndCementProductsMembercrh:AmericasMaterialsMember2022-01-012022-12-310000849395crh:BuildingProductsMembercrh:CementLimeAndCementProductsMember2022-01-012022-12-310000849395crh:EuropeMaterialsMembercrh:CementLimeAndCementProductsMember2022-01-012022-12-310000849395crh:CementLimeAndCementProductsMember2022-01-012022-12-310000849395crh:CementLimeAndCementProductsMembercrh:AmericasMaterialsMember2021-01-012021-12-310000849395crh:BuildingProductsMembercrh:CementLimeAndCementProductsMember2021-01-012021-12-310000849395crh:EuropeMaterialsMembercrh:CementLimeAndCementProductsMember2021-01-012021-12-310000849395crh:CementLimeAndCementProductsMember2021-01-012021-12-310000849395crh:CementLimeAndCementProductsMembercrh:AmericasMaterialsMember2020-01-012020-12-310000849395crh:BuildingProductsMembercrh:CementLimeAndCementProductsMember2020-01-012020-12-310000849395crh:EuropeMaterialsMembercrh:CementLimeAndCementProductsMember2020-01-012020-12-310000849395crh:CementLimeAndCementProductsMember2020-01-012020-12-310000849395crh:AggregatesAsphaltAndReadymixedProductsMembercrh:AmericasMaterialsMember2022-01-012022-12-310000849395crh:BuildingProductsMembercrh:AggregatesAsphaltAndReadymixedProductsMember2022-01-012022-12-310000849395crh:EuropeMaterialsMembercrh:AggregatesAsphaltAndReadymixedProductsMember2022-01-012022-12-310000849395crh:AggregatesAsphaltAndReadymixedProductsMember2022-01-012022-12-310000849395crh:AggregatesAsphaltAndReadymixedProductsMembercrh:AmericasMaterialsMember2021-01-012021-12-310000849395crh:BuildingProductsMembercrh:AggregatesAsphaltAndReadymixedProductsMember2021-01-012021-12-310000849395crh:EuropeMaterialsMembercrh:AggregatesAsphaltAndReadymixedProductsMember2021-01-012021-12-310000849395crh:AggregatesAsphaltAndReadymixedProductsMember2021-01-012021-12-310000849395crh:AggregatesAsphaltAndReadymixedProductsMembercrh:AmericasMaterialsMember2020-01-012020-12-310000849395crh:BuildingProductsMembercrh:AggregatesAsphaltAndReadymixedProductsMember2020-01-012020-12-310000849395crh:EuropeMaterialsMembercrh:AggregatesAsphaltAndReadymixedProductsMember2020-01-012020-12-310000849395crh:AggregatesAsphaltAndReadymixedProductsMember2020-01-012020-12-310000849395crh:ConstructionContractActivitiesMembercrh:AmericasMaterialsMember2022-01-012022-12-310000849395crh:ConstructionContractActivitiesMembercrh:BuildingProductsMember2022-01-012022-12-310000849395crh:EuropeMaterialsMembercrh:ConstructionContractActivitiesMember2022-01-012022-12-310000849395crh:ConstructionContractActivitiesMember2022-01-012022-12-310000849395crh:ConstructionContractActivitiesMembercrh:AmericasMaterialsMember2021-01-012021-12-310000849395crh:ConstructionContractActivitiesMembercrh:BuildingProductsMember2021-01-012021-12-310000849395crh:EuropeMaterialsMembercrh:ConstructionContractActivitiesMember2021-01-012021-12-310000849395crh:ConstructionContractActivitiesMember2021-01-012021-12-310000849395crh:ConstructionContractActivitiesMembercrh:AmericasMaterialsMember2020-01-012020-12-310000849395crh:ConstructionContractActivitiesMembercrh:BuildingProductsMember2020-01-012020-12-310000849395crh:EuropeMaterialsMembercrh:ConstructionContractActivitiesMember2020-01-012020-12-310000849395crh:ConstructionContractActivitiesMember2020-01-012020-12-310000849395crh:ArchitecturalProductsMembercrh:AmericasMaterialsMember2022-01-012022-12-310000849395crh:BuildingProductsMembercrh:ArchitecturalProductsMember2022-01-012022-12-310000849395crh:EuropeMaterialsMembercrh:ArchitecturalProductsMember2022-01-012022-12-310000849395crh:ArchitecturalProductsMember2022-01-012022-12-310000849395crh:ArchitecturalProductsMembercrh:AmericasMaterialsMember2021-01-012021-12-310000849395crh:BuildingProductsMembercrh:ArchitecturalProductsMember2021-01-012021-12-310000849395crh:EuropeMaterialsMembercrh:ArchitecturalProductsMember2021-01-012021-12-310000849395crh:ArchitecturalProductsMember2021-01-012021-12-310000849395crh:ArchitecturalProductsMembercrh:AmericasMaterialsMember2020-01-012020-12-310000849395crh:BuildingProductsMembercrh:ArchitecturalProductsMember2020-01-012020-12-310000849395crh:EuropeMaterialsMembercrh:ArchitecturalProductsMember2020-01-012020-12-310000849395crh:ArchitecturalProductsMember2020-01-012020-12-310000849395crh:AmericasMaterialsMembercrh:InfrastructureProductsMember2022-01-012022-12-310000849395crh:BuildingProductsMembercrh:InfrastructureProductsMember2022-01-012022-12-310000849395crh:EuropeMaterialsMembercrh:InfrastructureProductsMember2022-01-012022-12-310000849395crh:InfrastructureProductsMember2022-01-012022-12-310000849395crh:AmericasMaterialsMembercrh:InfrastructureProductsMember2021-01-012021-12-310000849395crh:BuildingProductsMembercrh:InfrastructureProductsMember2021-01-012021-12-310000849395crh:EuropeMaterialsMembercrh:InfrastructureProductsMember2021-01-012021-12-310000849395crh:InfrastructureProductsMember2021-01-012021-12-310000849395crh:AmericasMaterialsMembercrh:InfrastructureProductsMember2020-01-012020-12-310000849395crh:BuildingProductsMembercrh:InfrastructureProductsMember2020-01-012020-12-310000849395crh:EuropeMaterialsMembercrh:InfrastructureProductsMember2020-01-012020-12-310000849395crh:InfrastructureProductsMember2020-01-012020-12-310000849395crh:ConstructionAccessoriesMembercrh:AmericasMaterialsMember2022-01-012022-12-310000849395crh:ConstructionAccessoriesMembercrh:BuildingProductsMember2022-01-012022-12-310000849395crh:ConstructionAccessoriesMembercrh:EuropeMaterialsMember2022-01-012022-12-310000849395crh:ConstructionAccessoriesMember2022-01-012022-12-310000849395crh:ConstructionAccessoriesMembercrh:AmericasMaterialsMember2021-01-012021-12-310000849395crh:ConstructionAccessoriesMembercrh:BuildingProductsMember2021-01-012021-12-310000849395crh:ConstructionAccessoriesMembercrh:EuropeMaterialsMember2021-01-012021-12-310000849395crh:ConstructionAccessoriesMember2021-01-012021-12-310000849395crh:ConstructionAccessoriesMembercrh:AmericasMaterialsMember2020-01-012020-12-310000849395crh:ConstructionAccessoriesMembercrh:BuildingProductsMember2020-01-012020-12-310000849395crh:ConstructionAccessoriesMembercrh:EuropeMaterialsMember2020-01-012020-12-310000849395crh:ConstructionAccessoriesMember2020-01-012020-12-310000849395crh:ConstructionContractActivitiesMemberifrs-full:DiscontinuedOperationsMembercrh:AmericasMaterialsMember2022-01-012022-12-310000849395crh:ConstructionContractActivitiesMembercrh:BuildingProductsMemberifrs-full:DiscontinuedOperationsMember2022-01-012022-12-310000849395crh:EuropeMaterialsMembercrh:ConstructionContractActivitiesMemberifrs-full:DiscontinuedOperationsMember2022-01-012022-12-310000849395crh:ConstructionContractActivitiesMemberifrs-full:DiscontinuedOperationsMember2022-01-012022-12-310000849395crh:ConstructionContractActivitiesMemberifrs-full:DiscontinuedOperationsMembercrh:AmericasMaterialsMember2021-01-012021-12-310000849395crh:ConstructionContractActivitiesMembercrh:BuildingProductsMemberifrs-full:DiscontinuedOperationsMember2021-01-012021-12-310000849395crh:EuropeMaterialsMembercrh:ConstructionContractActivitiesMemberifrs-full:DiscontinuedOperationsMember2021-01-012021-12-310000849395crh:ConstructionContractActivitiesMemberifrs-full:DiscontinuedOperationsMember2021-01-012021-12-310000849395crh:ConstructionContractActivitiesMemberifrs-full:DiscontinuedOperationsMembercrh:AmericasMaterialsMember2020-01-012020-12-310000849395crh:ConstructionContractActivitiesMembercrh:BuildingProductsMemberifrs-full:DiscontinuedOperationsMember2020-01-012020-12-310000849395crh:EuropeMaterialsMembercrh:ConstructionContractActivitiesMemberifrs-full:DiscontinuedOperationsMember2020-01-012020-12-310000849395crh:ConstructionContractActivitiesMemberifrs-full:DiscontinuedOperationsMember2020-01-012020-12-310000849395crh:ArchitecturalGlassAndGlazingSystemsAndRelatedHardwareMemberifrs-full:DiscontinuedOperationsMembercrh:AmericasMaterialsMember2022-01-012022-12-310000849395crh:BuildingProductsMembercrh:ArchitecturalGlassAndGlazingSystemsAndRelatedHardwareMemberifrs-full:DiscontinuedOperationsMember2022-01-012022-12-310000849395crh:EuropeMaterialsMembercrh:ArchitecturalGlassAndGlazingSystemsAndRelatedHardwareMemberifrs-full:DiscontinuedOperationsMember2022-01-012022-12-310000849395crh:ArchitecturalGlassAndGlazingSystemsAndRelatedHardwareMemberifrs-full:DiscontinuedOperationsMember2022-01-012022-12-310000849395crh:ArchitecturalGlassAndGlazingSystemsAndRelatedHardwareMemberifrs-full:DiscontinuedOperationsMembercrh:AmericasMaterialsMember2021-01-012021-12-310000849395crh:BuildingProductsMembercrh:ArchitecturalGlassAndGlazingSystemsAndRelatedHardwareMemberifrs-full:DiscontinuedOperationsMember2021-01-012021-12-310000849395crh:EuropeMaterialsMembercrh:ArchitecturalGlassAndGlazingSystemsAndRelatedHardwareMemberifrs-full:DiscontinuedOperationsMember2021-01-012021-12-310000849395crh:ArchitecturalGlassAndGlazingSystemsAndRelatedHardwareMemberifrs-full:DiscontinuedOperationsMember2021-01-012021-12-310000849395crh:ArchitecturalGlassAndGlazingSystemsAndRelatedHardwareMemberifrs-full:DiscontinuedOperationsMembercrh:AmericasMaterialsMember2020-01-012020-12-310000849395crh:BuildingProductsMembercrh:ArchitecturalGlassAndGlazingSystemsAndRelatedHardwareMemberifrs-full:DiscontinuedOperationsMember2020-01-012020-12-310000849395crh:EuropeMaterialsMembercrh:ArchitecturalGlassAndGlazingSystemsAndRelatedHardwareMemberifrs-full:DiscontinuedOperationsMember2020-01-012020-12-310000849395crh:ArchitecturalGlassAndGlazingSystemsAndRelatedHardwareMemberifrs-full:DiscontinuedOperationsMember2020-01-012020-12-310000849395crh:AmericasMaterialsAndEuropeMaterialsMember2022-01-012022-12-310000849395crh:AmericasMaterialsAndEuropeMaterialsMember2021-01-012021-12-310000849395crh:AmericasMaterialsAndEuropeMaterialsMember2020-01-012020-12-310000849395crh:RestructuringOfDivisionsAndSegmentsMember2023-01-01crh:division0000849395crh:RestructuringOfDivisionsAndSegmentsMember2023-01-012023-03-100000849395ifrs-full:OperatingSegmentsMembercrh:AmericasMaterialsMember2022-12-310000849395ifrs-full:OperatingSegmentsMembercrh:AmericasMaterialsMember2021-12-310000849395ifrs-full:OperatingSegmentsMembercrh:BuildingProductsMember2022-12-310000849395ifrs-full:OperatingSegmentsMembercrh:BuildingProductsMember2021-12-310000849395ifrs-full:OperatingSegmentsMembercrh:EuropeMaterialsMember2022-12-310000849395ifrs-full:OperatingSegmentsMembercrh:EuropeMaterialsMember2021-12-310000849395ifrs-full:OperatingSegmentsMember2022-12-310000849395ifrs-full:OperatingSegmentsMember2021-12-310000849395ifrs-full:MaterialReconcilingItemsMember2022-12-310000849395ifrs-full:MaterialReconcilingItemsMember2021-12-310000849395ifrs-full:AggregateContinuingAndDiscontinuedOperationsMember2022-01-012022-12-310000849395ifrs-full:AggregateContinuingAndDiscontinuedOperationsMember2021-01-012021-12-310000849395ifrs-full:AggregateContinuingAndDiscontinuedOperationsMember2020-01-012020-12-310000849395ifrs-full:CountryOfDomicileMember2022-12-310000849395ifrs-full:CountryOfDomicileMember2021-12-310000849395country:GB2022-12-310000849395country:GB2021-12-310000849395country:US2022-12-310000849395country:US2021-12-310000849395crh:OtherCountriesMember2022-12-310000849395crh:OtherCountriesMember2021-12-310000849395crh:CostSalesmemberMember2022-01-012022-12-310000849395crh:CostSalesmemberMember2021-01-012021-12-310000849395crh:CostSalesmemberMember2020-01-012020-12-310000849395crh:OperatingCostsMember2022-01-012022-12-310000849395crh:OperatingCostsMember2021-01-012021-12-310000849395crh:OperatingCostsMember2020-01-012020-12-310000849395ifrs-full:InvestmentsAccountedForUsingEquityMethodMember2020-01-012020-12-310000849395crh:DeloitteIrelandStatutoryAuditorMember2022-01-012022-12-310000849395crh:DeloitteIrelandStatutoryAuditorMember2021-01-012021-12-310000849395crh:DeloitteIrelandStatutoryAuditorMember2020-01-012020-12-310000849395crh:DeloitteIrelandNetworkFirmsMember2022-01-012022-12-310000849395crh:DeloitteIrelandNetworkFirmsMember2021-01-012021-12-310000849395crh:DeloitteIrelandNetworkFirmsMember2020-01-012020-12-310000849395crh:AuditorsRemunerationFromContinuingOperationsMember2022-01-012022-12-310000849395crh:AuditorsRemunerationFromContinuingOperationsMember2021-01-012021-12-310000849395crh:AuditorsRemunerationFromContinuingOperationsMember2020-01-012020-12-310000849395crh:OtherThanDeloitteMember2022-01-012022-12-310000849395crh:OtherThanDeloitteMember2021-01-012021-12-310000849395crh:OtherThanDeloitteMember2020-01-012020-12-310000849395crh:DeloitteMember2022-01-012022-12-310000849395crh:DeloitteMember2021-01-012021-12-310000849395crh:DeloitteMember2020-01-012020-12-310000849395crh:BusinessDisposalMember2022-01-012022-12-310000849395crh:BusinessDisposalMember2021-01-012021-12-310000849395crh:BusinessDisposalMember2020-01-012020-12-310000849395crh:DisposalOfOtherNonCurrentAssetsMember2022-01-012022-12-310000849395crh:DisposalOfOtherNonCurrentAssetsMember2021-01-012021-12-310000849395crh:DisposalOfOtherNonCurrentAssetsMember2020-01-012020-12-310000849395ifrs-full:DiscontinuedOperationsMembercrh:BusinessDisposalMember2022-01-012022-12-310000849395ifrs-full:DiscontinuedOperationsMembercrh:BusinessDisposalMember2021-01-012021-12-310000849395ifrs-full:DiscontinuedOperationsMembercrh:BusinessDisposalMember2020-01-012020-12-310000849395crh:DisposalOfOtherNonCurrentAssetsMemberifrs-full:DiscontinuedOperationsMember2022-01-012022-12-310000849395crh:DisposalOfOtherNonCurrentAssetsMemberifrs-full:DiscontinuedOperationsMember2021-01-012021-12-310000849395crh:DisposalOfOtherNonCurrentAssetsMemberifrs-full:DiscontinuedOperationsMember2020-01-012020-12-31crh:Employees0000849395crh:PerformanceSharePlansAndRestrictedSharePlansMember2022-01-012022-12-310000849395crh:PerformanceSharePlansAndRestrictedSharePlansMember2021-01-012021-12-310000849395crh:PerformanceSharePlansAndRestrictedSharePlansMember2020-01-012020-12-310000849395crh:ShareOptionPlanMember2022-01-012022-12-310000849395crh:ShareOptionPlanMember2021-01-012021-12-310000849395crh:ShareOptionPlanMember2020-01-012020-12-310000849395crh:TwoThousandFourteenPerformanceSharePlanMember2022-01-012022-12-310000849395crh:TwoThousandFourteenPerformanceSharePlanMember2021-01-012021-12-310000849395crh:TwoThousandFourteenPerformanceSharePlanMember2020-01-012020-12-31iso4217:EURutr:Y0000849395crh:TwoThousandFourteenPerformanceSharePlanMember2022-12-310000849395crh:TwoThousandFourteenPerformanceSharePlanMember2021-12-310000849395crh:TwoThousandFourteenPerformanceSharePlanMember2020-12-310000849395crh:PerformanceSharePlansMember2022-01-012022-12-310000849395crh:PerformanceSharePlansMember2021-01-012021-12-310000849395crh:PerformanceSharePlansMember2020-01-012020-12-310000849395crh:ShareOptionSchemesExcludingSavingsRelatedShareOptionSchemesMember2021-12-31iso4217:EURxbrli:shares0000849395crh:ShareOptionSchemesExcludingSavingsRelatedShareOptionSchemesMember2020-12-310000849395crh:ShareOptionSchemesExcludingSavingsRelatedShareOptionSchemesMember2019-12-310000849395crh:ShareOptionSchemesExcludingSavingsRelatedShareOptionSchemesMember2022-01-012022-12-310000849395crh:ShareOptionSchemesExcludingSavingsRelatedShareOptionSchemesMember2021-01-012021-12-310000849395crh:ShareOptionSchemesExcludingSavingsRelatedShareOptionSchemesMember2020-01-012020-12-310000849395crh:ShareOptionSchemesExcludingSavingsRelatedShareOptionSchemesMember2022-12-310000849395crh:ShareOptionSchemesMember2022-01-012022-12-310000849395crh:ShareOptionSchemesMember2021-01-012021-12-310000849395crh:ShareOptionSchemesMember2020-01-012020-12-310000849395crh:TwoThousandTenAndTwoThousandTwentyOneSavingsRelatedShareOptionSchemesMemberifrs-full:TopOfRangeMember2022-01-012022-12-31iso4217:GBP0000849395crh:TwoThousandTenAndTwoThousandTwentyOneSavingsRelatedShareOptionSchemesMemberifrs-full:BottomOfRangeMember2022-01-012022-12-310000849395crh:TwoThousandTenAndTwoThousandTwentyOneSavingsRelatedShareOptionSchemesMemberifrs-full:TopOfRangeMember2022-12-310000849395crh:TwoThousandTenSavingsRelatedShareOptionSchemesMember2022-01-012022-12-310000849395crh:TwoThousandTenAndTwoThousandTwentyOneSavingsRelatedShareOptionSchemesMember2021-12-31iso4217:GBPxbrli:shares0000849395crh:TwoThousandTenAndTwoThousandTwentyOneSavingsRelatedShareOptionSchemesMember2020-12-310000849395crh:TwoThousandTenAndTwoThousandTwentyOneSavingsRelatedShareOptionSchemesMember2019-12-310000849395crh:TwoThousandTenAndTwoThousandTwentyOneSavingsRelatedShareOptionSchemesMember2022-01-012022-12-310000849395crh:TwoThousandTenAndTwoThousandTwentyOneSavingsRelatedShareOptionSchemesMember2021-01-012021-12-310000849395crh:TwoThousandTenAndTwoThousandTwentyOneSavingsRelatedShareOptionSchemesMember2020-01-012020-12-310000849395crh:TwoThousandTenAndTwoThousandTwentyOneSavingsRelatedShareOptionSchemesMember2022-12-310000849395crh:TwoThousandTenSavingsRelatedShareOptionExercisableWithinSixMonthsAfterThirdAnniversaryOfContractMember2022-01-012022-12-310000849395crh:TwoThousandTenSavingsRelatedShareOptionExercisableWithinSixMonthsAfterThirdAnniversaryOfContractMember2021-01-012021-12-310000849395crh:TwoThousandTenSavingsRelatedShareOptionExercisableWithinSixMonthsAfterThirdAnniversaryOfContractMember2020-01-012020-12-310000849395crh:TwoThousandTenSavingsRelatedShareOptionExercisableWithinSixMonthsAfterFifthAnniversaryOfContractMember2022-01-012022-12-310000849395crh:TwoThousandTenSavingsRelatedShareOptionExercisableWithinSixMonthsAfterFifthAnniversaryOfContractMember2021-01-012021-12-310000849395crh:TwoThousandTenSavingsRelatedShareOptionExercisableWithinSixMonthsAfterFifthAnniversaryOfContractMember2020-01-012020-12-310000849395crh:TwoThousandTenAndTwoThousandTwentyOneSavingsRelatedShareOptionSchemesMembercurrency:EUR2022-12-310000849395crh:TwoThousandTenAndTwoThousandTwentyOneSavingsRelatedShareOptionSchemesMembercurrency:EUR2021-12-310000849395crh:TwoThousandTenAndTwoThousandTwentyOneSavingsRelatedShareOptionSchemesMembercurrency:EUR2020-12-310000849395crh:TwoThousandTenAndTwoThousandTwentyOneSavingsRelatedShareOptionSchemesMemberifrs-full:BottomOfRangeMembercurrency:EUR2022-12-310000849395crh:TwoThousandTenAndTwoThousandTwentyOneSavingsRelatedShareOptionSchemesMemberifrs-full:TopOfRangeMembercurrency:EUR2022-12-310000849395crh:TwoThousandTenAndTwoThousandTwentyOneSavingsRelatedShareOptionSchemesMemberifrs-full:BottomOfRangeMembercurrency:EUR2021-12-310000849395crh:TwoThousandTenAndTwoThousandTwentyOneSavingsRelatedShareOptionSchemesMemberifrs-full:TopOfRangeMembercurrency:EUR2021-12-310000849395crh:TwoThousandTenAndTwoThousandTwentyOneSavingsRelatedShareOptionSchemesMemberifrs-full:BottomOfRangeMembercurrency:EUR2020-12-310000849395crh:TwoThousandTenAndTwoThousandTwentyOneSavingsRelatedShareOptionSchemesMemberifrs-full:TopOfRangeMembercurrency:EUR2020-12-310000849395crh:TwoThousandTenAndTwoThousandTwentyOneSavingsRelatedShareOptionSchemesMembercurrency:GBP2022-12-310000849395crh:TwoThousandTenAndTwoThousandTwentyOneSavingsRelatedShareOptionSchemesMembercurrency:GBP2021-12-310000849395crh:TwoThousandTenAndTwoThousandTwentyOneSavingsRelatedShareOptionSchemesMembercurrency:GBP2020-12-310000849395crh:TwoThousandTenAndTwoThousandTwentyOneSavingsRelatedShareOptionSchemesMemberifrs-full:BottomOfRangeMembercurrency:GBP2022-12-310000849395crh:TwoThousandTenAndTwoThousandTwentyOneSavingsRelatedShareOptionSchemesMemberifrs-full:TopOfRangeMembercurrency:GBP2022-12-310000849395crh:TwoThousandTenAndTwoThousandTwentyOneSavingsRelatedShareOptionSchemesMemberifrs-full:BottomOfRangeMembercurrency:GBP2021-12-310000849395crh:TwoThousandTenAndTwoThousandTwentyOneSavingsRelatedShareOptionSchemesMemberifrs-full:TopOfRangeMembercurrency:GBP2021-12-310000849395crh:TwoThousandTenAndTwoThousandTwentyOneSavingsRelatedShareOptionSchemesMemberifrs-full:BottomOfRangeMembercurrency:GBP2020-12-310000849395crh:TwoThousandTenAndTwoThousandTwentyOneSavingsRelatedShareOptionSchemesMemberifrs-full:TopOfRangeMembercurrency:GBP2020-12-310000849395crh:TwoThousandTenAndTwoThousandTwentyOneSavingsRelatedShareOptionExercisableWithinSixMonthsAfterThirdAnniversaryOfContractMembercrh:TrinomialValuationMethodologyMember2022-01-012022-12-310000849395crh:TrinomialValuationMethodologyMembercrh:TwoThousandTenAndTwoThousandTwentyOneSavingsRelatedShareOptionExercisableWithinSixMonthsAfterFifthAnniversaryOfContractMember2022-01-012022-12-310000849395crh:TwoThousandTenAndTwoThousandTwentyOneSavingsRelatedShareOptionExercisableWithinSixMonthsAfterThirdAnniversaryOfContractMembercrh:TrinomialValuationMethodologyMember2021-01-012021-12-310000849395crh:TrinomialValuationMethodologyMembercrh:TwoThousandTenAndTwoThousandTwentyOneSavingsRelatedShareOptionExercisableWithinSixMonthsAfterFifthAnniversaryOfContractMember2021-01-012021-12-31utr:M0000849395ifrs-full:CountryOfDomicileMember2022-01-012022-12-310000849395ifrs-full:CountryOfDomicileMember2021-01-012021-12-310000849395ifrs-full:CountryOfDomicileMember2020-01-012020-12-310000849395ifrs-full:ForeignCountriesMember2022-01-012022-12-310000849395ifrs-full:ForeignCountriesMember2021-01-012021-12-310000849395ifrs-full:ForeignCountriesMember2020-01-012020-12-310000849395crh:RetirementBenefitObligationsMember2022-01-012022-12-310000849395crh:RetirementBenefitObligationsMember2021-01-012021-12-310000849395crh:RetirementBenefitObligationsMember2020-01-012020-12-310000849395crh:SharebasedPaymentExpenseMember2022-01-012022-12-310000849395crh:SharebasedPaymentExpenseMember2021-01-012021-12-310000849395crh:SharebasedPaymentExpenseMember2020-01-012020-12-310000849395ifrs-full:DerivativesMember2022-01-012022-12-310000849395ifrs-full:DerivativesMember2021-01-012021-12-310000849395ifrs-full:DerivativesMember2020-01-012020-12-310000849395crh:OtherItemsMember2022-01-012022-12-310000849395crh:OtherItemsMember2021-01-012021-12-310000849395crh:OtherItemsMember2020-01-012020-12-310000849395ifrs-full:CashFlowHedgesMember2022-01-012022-12-310000849395ifrs-full:CashFlowHedgesMember2021-01-012021-12-310000849395ifrs-full:CashFlowHedgesMember2020-01-012020-12-310000849395crh:ShareOptionExerciseMember2022-01-012022-12-310000849395crh:ShareOptionExerciseMember2021-01-012021-12-310000849395crh:ShareOptionExerciseMember2020-01-012020-12-310000849395crh:FinalDividendsMember2022-01-012022-12-310000849395crh:FinalDividendsMember2021-01-012021-12-310000849395crh:FinalDividendsMember2020-01-012020-12-310000849395crh:InterimDividendsMember2022-01-012022-12-310000849395crh:InterimDividendsMember2021-01-012021-12-310000849395crh:InterimDividendsMember2020-01-012020-12-310000849395crh:FivePercentageCumulativePreferenceSharesMember2022-01-012022-12-310000849395crh:FivePercentageCumulativePreferenceSharesMember2021-01-012021-12-310000849395crh:FivePercentageCumulativePreferenceSharesMember2020-01-012020-12-310000849395crh:SevenPercentageACumulativePreferenceSharesMember2022-01-012022-12-310000849395crh:SevenPercentageACumulativePreferenceSharesMember2021-01-012021-12-310000849395crh:SevenPercentageACumulativePreferenceSharesMember2020-01-012020-12-310000849395ifrs-full:MiningPropertyMembercrh:CarryingAmountsMemberifrs-full:GrossCarryingAmountMember2022-12-310000849395crh:CarryingAmountsMemberifrs-full:GrossCarryingAmountMemberifrs-full:LandAndBuildingsMember2022-12-310000849395crh:PlantAndMachineryMembercrh:CarryingAmountsMemberifrs-full:GrossCarryingAmountMember2022-12-310000849395ifrs-full:ConstructionInProgressMembercrh:CarryingAmountsMemberifrs-full:GrossCarryingAmountMember2022-12-310000849395crh:CarryingAmountsMemberifrs-full:GrossCarryingAmountMember2022-12-310000849395ifrs-full:MiningPropertyMemberifrs-full:AccumulatedDepreciationAmortisationAndImpairmentMembercrh:CarryingAmountsMember2022-12-310000849395ifrs-full:AccumulatedDepreciationAmortisationAndImpairmentMembercrh:CarryingAmountsMemberifrs-full:LandAndBuildingsMember2022-12-310000849395crh:PlantAndMachineryMemberifrs-full:AccumulatedDepreciationAmortisationAndImpairmentMembercrh:CarryingAmountsMember2022-12-310000849395ifrs-full:AccumulatedDepreciationAmortisationAndImpairmentMemberifrs-full:ConstructionInProgressMembercrh:CarryingAmountsMember2022-12-310000849395ifrs-full:AccumulatedDepreciationAmortisationAndImpairmentMembercrh:CarryingAmountsMember2022-12-310000849395ifrs-full:MiningPropertyMembercrh:CarryingAmountsMember2022-12-310000849395crh:CarryingAmountsMemberifrs-full:LandAndBuildingsMember2022-12-310000849395crh:PlantAndMachineryMembercrh:CarryingAmountsMember2022-12-310000849395ifrs-full:ConstructionInProgressMembercrh:CarryingAmountsMember2022-12-310000849395crh:CarryingAmountsMember2022-12-310000849395ifrs-full:MiningPropertyMembercrh:CarryingAmountsMember2021-12-310000849395crh:CarryingAmountsMemberifrs-full:LandAndBuildingsMember2021-12-310000849395crh:PlantAndMachineryMembercrh:CarryingAmountsMember2021-12-310000849395ifrs-full:ConstructionInProgressMembercrh:CarryingAmountsMember2021-12-310000849395crh:CarryingAmountsMember2021-12-310000849395ifrs-full:MiningPropertyMembercrh:CarryingAmountsMember2022-01-012022-12-310000849395crh:CarryingAmountsMemberifrs-full:LandAndBuildingsMember2022-01-012022-12-310000849395crh:PlantAndMachineryMembercrh:CarryingAmountsMember2022-01-012022-12-310000849395ifrs-full:ConstructionInProgressMembercrh:CarryingAmountsMember2022-01-012022-12-310000849395crh:CarryingAmountsMember2022-01-012022-12-310000849395crh:PropertyPlantAndEquipmentByLeasedRightOfUseAssetsMemberifrs-full:LandAndBuildingsMember2022-12-310000849395crh:PropertyPlantAndEquipmentByLeasedRightOfUseAssetsMembercrh:PlantAndMachineryMember2022-12-310000849395crh:PropertyPlantAndEquipmentByLeasedRightOfUseAssetsMemberifrs-full:ConstructionInProgressMember2022-12-310000849395crh:PropertyPlantAndEquipmentByLeasedRightOfUseAssetsMember2022-12-310000849395ifrs-full:MiningPropertyMembercrh:CarryingAmountsMemberifrs-full:GrossCarryingAmountMember2021-12-310000849395crh:CarryingAmountsMemberifrs-full:GrossCarryingAmountMemberifrs-full:LandAndBuildingsMember2021-12-310000849395crh:PlantAndMachineryMembercrh:CarryingAmountsMemberifrs-full:GrossCarryingAmountMember2021-12-310000849395ifrs-full:ConstructionInProgressMembercrh:CarryingAmountsMemberifrs-full:GrossCarryingAmountMember2021-12-310000849395crh:CarryingAmountsMemberifrs-full:GrossCarryingAmountMember2021-12-310000849395ifrs-full:MiningPropertyMemberifrs-full:AccumulatedDepreciationAmortisationAndImpairmentMembercrh:CarryingAmountsMember2021-12-310000849395ifrs-full:AccumulatedDepreciationAmortisationAndImpairmentMembercrh:CarryingAmountsMemberifrs-full:LandAndBuildingsMember2021-12-310000849395crh:PlantAndMachineryMemberifrs-full:AccumulatedDepreciationAmortisationAndImpairmentMembercrh:CarryingAmountsMember2021-12-310000849395ifrs-full:AccumulatedDepreciationAmortisationAndImpairmentMemberifrs-full:ConstructionInProgressMembercrh:CarryingAmountsMember2021-12-310000849395ifrs-full:AccumulatedDepreciationAmortisationAndImpairmentMembercrh:CarryingAmountsMember2021-12-310000849395ifrs-full:MiningPropertyMembercrh:CarryingAmountsMember2020-12-310000849395crh:CarryingAmountsMemberifrs-full:LandAndBuildingsMember2020-12-310000849395crh:PlantAndMachineryMembercrh:CarryingAmountsMember2020-12-310000849395ifrs-full:ConstructionInProgressMembercrh:CarryingAmountsMember2020-12-310000849395crh:CarryingAmountsMember2020-12-310000849395ifrs-full:MiningPropertyMembercrh:CarryingAmountsMember2021-01-012021-12-310000849395crh:CarryingAmountsMemberifrs-full:LandAndBuildingsMember2021-01-012021-12-310000849395crh:PlantAndMachineryMembercrh:CarryingAmountsMember2021-01-012021-12-310000849395ifrs-full:ConstructionInProgressMembercrh:CarryingAmountsMember2021-01-012021-12-310000849395crh:CarryingAmountsMember2021-01-012021-12-310000849395crh:PropertyPlantAndEquipmentByLeasedRightOfUseAssetsMemberifrs-full:LandAndBuildingsMember2021-12-310000849395crh:PropertyPlantAndEquipmentByLeasedRightOfUseAssetsMembercrh:PlantAndMachineryMember2021-12-310000849395crh:PropertyPlantAndEquipmentByLeasedRightOfUseAssetsMemberifrs-full:ConstructionInProgressMember2021-12-310000849395crh:PropertyPlantAndEquipmentByLeasedRightOfUseAssetsMember2021-12-310000849395ifrs-full:MiningPropertyMembercrh:CarryingAmountsMemberifrs-full:GrossCarryingAmountMember2020-12-310000849395crh:CarryingAmountsMemberifrs-full:GrossCarryingAmountMemberifrs-full:LandAndBuildingsMember2020-12-310000849395crh:PlantAndMachineryMembercrh:CarryingAmountsMemberifrs-full:GrossCarryingAmountMember2020-12-310000849395ifrs-full:ConstructionInProgressMembercrh:CarryingAmountsMemberifrs-full:GrossCarryingAmountMember2020-12-310000849395crh:CarryingAmountsMemberifrs-full:GrossCarryingAmountMember2020-12-310000849395ifrs-full:MiningPropertyMemberifrs-full:AccumulatedDepreciationAmortisationAndImpairmentMembercrh:CarryingAmountsMember2020-12-310000849395ifrs-full:AccumulatedDepreciationAmortisationAndImpairmentMembercrh:CarryingAmountsMemberifrs-full:LandAndBuildingsMember2020-12-310000849395crh:PlantAndMachineryMemberifrs-full:AccumulatedDepreciationAmortisationAndImpairmentMembercrh:CarryingAmountsMember2020-12-310000849395ifrs-full:AccumulatedDepreciationAmortisationAndImpairmentMemberifrs-full:ConstructionInProgressMembercrh:CarryingAmountsMember2020-12-310000849395ifrs-full:AccumulatedDepreciationAmortisationAndImpairmentMembercrh:CarryingAmountsMember2020-12-310000849395ifrs-full:DiscontinuedOperationsMembercrh:CarryingAmountsMember2022-01-012022-12-310000849395ifrs-full:DiscontinuedOperationsMembercrh:CarryingAmountsMember2021-01-012021-12-310000849395ifrs-full:DiscontinuedOperationsMembercrh:CarryingAmountsMember2020-01-012020-12-310000849395ifrs-full:DiscontinuedOperationsMember2021-12-310000849395ifrs-full:GoodwillMemberifrs-full:GrossCarryingAmountMember2022-12-310000849395crh:MarketingRelatedIntangiblesMemberifrs-full:GrossCarryingAmountMember2022-12-310000849395ifrs-full:CustomerrelatedIntangibleAssetsMemberifrs-full:GrossCarryingAmountMember2022-12-310000849395crh:ContractBasedIntangibleAssets1Memberifrs-full:GrossCarryingAmountMember2022-12-310000849395ifrs-full:GrossCarryingAmountMember2022-12-310000849395ifrs-full:AccumulatedDepreciationAmortisationAndImpairmentMemberifrs-full:GoodwillMember2022-12-310000849395crh:MarketingRelatedIntangiblesMemberifrs-full:AccumulatedDepreciationAmortisationAndImpairmentMember2022-12-310000849395ifrs-full:CustomerrelatedIntangibleAssetsMemberifrs-full:AccumulatedDepreciationAmortisationAndImpairmentMember2022-12-310000849395crh:ContractBasedIntangibleAssets1Memberifrs-full:AccumulatedDepreciationAmortisationAndImpairmentMember2022-12-310000849395ifrs-full:AccumulatedDepreciationAmortisationAndImpairmentMember2022-12-310000849395ifrs-full:GoodwillMember2022-12-310000849395crh:MarketingRelatedIntangiblesMember2022-12-310000849395ifrs-full:CustomerrelatedIntangibleAssetsMember2022-12-310000849395crh:ContractBasedIntangibleAssets1Member2022-12-310000849395ifrs-full:GoodwillMember2021-12-310000849395crh:MarketingRelatedIntangiblesMember2021-12-310000849395ifrs-full:CustomerrelatedIntangibleAssetsMember2021-12-310000849395crh:ContractBasedIntangibleAssets1Member2021-12-310000849395ifrs-full:GoodwillMember2022-01-012022-12-310000849395crh:MarketingRelatedIntangiblesMember2022-01-012022-12-310000849395ifrs-full:CustomerrelatedIntangibleAssetsMember2022-01-012022-12-310000849395crh:ContractBasedIntangibleAssets1Member2022-01-012022-12-310000849395ifrs-full:GoodwillMemberifrs-full:GrossCarryingAmountMember2021-12-310000849395crh:MarketingRelatedIntangiblesMemberifrs-full:GrossCarryingAmountMember2021-12-310000849395ifrs-full:CustomerrelatedIntangibleAssetsMemberifrs-full:GrossCarryingAmountMember2021-12-310000849395crh:ContractBasedIntangibleAssets1Memberifrs-full:GrossCarryingAmountMember2021-12-310000849395ifrs-full:GrossCarryingAmountMember2021-12-310000849395ifrs-full:AccumulatedDepreciationAmortisationAndImpairmentMemberifrs-full:GoodwillMember2021-12-310000849395crh:MarketingRelatedIntangiblesMemberifrs-full:AccumulatedDepreciationAmortisationAndImpairmentMember2021-12-310000849395ifrs-full:CustomerrelatedIntangibleAssetsMemberifrs-full:AccumulatedDepreciationAmortisationAndImpairmentMember2021-12-310000849395crh:ContractBasedIntangibleAssets1Memberifrs-full:AccumulatedDepreciationAmortisationAndImpairmentMember2021-12-310000849395ifrs-full:AccumulatedDepreciationAmortisationAndImpairmentMember2021-12-310000849395ifrs-full:GoodwillMember2020-12-310000849395crh:MarketingRelatedIntangiblesMember2020-12-310000849395ifrs-full:CustomerrelatedIntangibleAssetsMember2020-12-310000849395crh:ContractBasedIntangibleAssets1Member2020-12-310000849395ifrs-full:GoodwillMember2021-01-012021-12-310000849395crh:MarketingRelatedIntangiblesMember2021-01-012021-12-310000849395ifrs-full:CustomerrelatedIntangibleAssetsMember2021-01-012021-12-310000849395crh:ContractBasedIntangibleAssets1Member2021-01-012021-12-310000849395ifrs-full:GoodwillMemberifrs-full:GrossCarryingAmountMember2020-12-310000849395crh:MarketingRelatedIntangiblesMemberifrs-full:GrossCarryingAmountMember2020-12-310000849395ifrs-full:CustomerrelatedIntangibleAssetsMemberifrs-full:GrossCarryingAmountMember2020-12-310000849395crh:ContractBasedIntangibleAssets1Memberifrs-full:GrossCarryingAmountMember2020-12-310000849395ifrs-full:GrossCarryingAmountMember2020-12-310000849395ifrs-full:AccumulatedDepreciationAmortisationAndImpairmentMemberifrs-full:GoodwillMember2020-12-310000849395crh:MarketingRelatedIntangiblesMemberifrs-full:AccumulatedDepreciationAmortisationAndImpairmentMember2020-12-310000849395ifrs-full:CustomerrelatedIntangibleAssetsMemberifrs-full:AccumulatedDepreciationAmortisationAndImpairmentMember2020-12-310000849395crh:ContractBasedIntangibleAssets1Memberifrs-full:AccumulatedDepreciationAmortisationAndImpairmentMember2020-12-310000849395ifrs-full:AccumulatedDepreciationAmortisationAndImpairmentMember2020-12-310000849395crh:MarketingRelatedIntangiblesMembercrh:BarretteOutdoorLivingMember2022-12-310000849395ifrs-full:CustomerrelatedIntangibleAssetsMembercrh:BarretteOutdoorLivingMember2022-12-310000849395crh:ContractBasedIntangibleAssets1Membercrh:BarretteOutdoorLivingMember2022-12-310000849395ifrs-full:IndividualAssetsOrCashgeneratingUnitsMember2022-01-012022-12-31crh:Cash_Generating_Units0000849395ifrs-full:IndividualAssetsOrCashgeneratingUnitsMember2021-01-012021-12-310000849395crh:CashGeneratingUnitMembercrh:AmericasMaterialsMember2022-01-012022-12-310000849395crh:CashGeneratingUnitMembercrh:AmericasMaterialsMember2021-01-012021-12-310000849395crh:AmericasMaterialsMember2022-12-310000849395crh:AmericasMaterialsMember2021-12-310000849395crh:BuildingProductsMembercrh:CashGeneratingUnitMember2022-01-012022-12-310000849395crh:BuildingProductsMembercrh:CashGeneratingUnitMember2021-01-012021-12-310000849395crh:BuildingProductsMember2022-12-310000849395crh:BuildingProductsMember2021-12-310000849395crh:CashGeneratingUnitMembercrh:EuropeMaterialsMember2022-01-012022-12-310000849395crh:CashGeneratingUnitMembercrh:EuropeMaterialsMember2021-01-012021-12-310000849395crh:EuropeMaterialsMember2022-12-310000849395crh:EuropeMaterialsMember2021-12-310000849395srt:AmericasMember2022-12-310000849395ifrs-full:BottomOfRangeMembersrt:EuropeMember2022-12-310000849395srt:EuropeMemberifrs-full:TopOfRangeMember2022-12-310000849395srt:AsiaMember2022-12-310000849395country:UA2022-12-310000849395ifrs-full:BottomOfRangeMember2022-12-310000849395ifrs-full:TopOfRangeMember2022-12-310000849395ifrs-full:BottomOfRangeMember2021-12-310000849395ifrs-full:TopOfRangeMember2021-12-310000849395srt:ScenarioForecastMember2030-01-012030-12-31crh:uSDollarPerTonne0000849395srt:ScenarioForecastMember2050-01-012050-12-310000849395ifrs-full:BottomOfRangeMembercrh:AmericasCementAMATSouthAndBuildingProductsMember2022-01-012022-12-310000849395crh:AmericasCementAMATSouthAndBuildingProductsMemberifrs-full:TopOfRangeMember2022-01-012022-12-310000849395crh:EachOfRemainingCashGeneratingUnitsMemberifrs-full:TopOfRangeMember2022-01-012022-12-310000849395crh:AmericasCementMember2022-12-310000849395crh:AmericasCementMember2021-12-310000849395crh:AMATSouthMember2022-12-310000849395crh:AMATSouthMember2021-12-310000849395crh:AmericasCementMember2022-01-012022-12-310000849395crh:AmericasCementMember2021-01-012021-12-310000849395crh:AMATSouthMember2022-01-012022-12-310000849395crh:AMATSouthMember2021-01-012021-12-310000849395crh:BuildingProductsMember2022-01-012022-12-310000849395crh:BuildingProductsMember2021-01-012021-12-310000849395crh:TwoCashGeneratingUnitsMembersrt:MinimumMember2022-01-012022-12-310000849395crh:TwoCashGeneratingUnitsMembersrt:MaximumMember2022-01-012022-12-310000849395ifrs-full:IndividualAssetsOrCashgeneratingUnitsMember2022-12-310000849395crh:ShareOfNetAssetMember2021-12-310000849395crh:Loans1Member2021-12-310000849395ifrs-full:OtherAssetsMember2021-12-310000849395crh:ShareOfNetAssetMember2022-01-012022-12-310000849395crh:Loans1Member2022-01-012022-12-310000849395ifrs-full:OtherAssetsMember2022-01-012022-12-310000849395crh:ShareOfNetAssetMemberifrs-full:InvestmentsAccountedForUsingEquityMethodMember2022-01-012022-12-310000849395crh:Loans1Memberifrs-full:InvestmentsAccountedForUsingEquityMethodMember2022-01-012022-12-310000849395ifrs-full:InvestmentsAccountedForUsingEquityMethodMember2022-01-012022-12-310000849395crh:ShareOfNetAssetMember2022-12-310000849395crh:Loans1Member2022-12-310000849395ifrs-full:OtherAssetsMember2022-12-310000849395crh:ShareOfNetAssetMember2020-12-310000849395crh:Loans1Member2020-12-310000849395ifrs-full:OtherAssetsMember2020-12-310000849395crh:ShareOfNetAssetMember2021-01-012021-12-310000849395crh:Loans1Member2021-01-012021-12-310000849395ifrs-full:OtherAssetsMember2021-01-012021-12-310000849395crh:ShareOfNetAssetMemberifrs-full:InvestmentsAccountedForUsingEquityMethodMember2021-01-012021-12-310000849395crh:Loans1Memberifrs-full:InvestmentsAccountedForUsingEquityMethodMember2021-01-012021-12-310000849395ifrs-full:InvestmentsAccountedForUsingEquityMethodMember2021-01-012021-12-310000849395ifrs-full:JointVenturesMember2022-01-012022-12-310000849395ifrs-full:JointVenturesMember2021-01-012021-12-310000849395ifrs-full:JointVenturesMember2020-01-012020-12-310000849395ifrs-full:AssociatesMember2022-01-012022-12-310000849395ifrs-full:AssociatesMember2021-01-012021-12-310000849395ifrs-full:AssociatesMember2020-01-012020-12-310000849395crh:ConstructionContracts1Member2022-12-310000849395crh:ConstructionContracts1Member2021-12-310000849395crh:AmericasMaterialsMember2022-12-310000849395crh:AmericasMaterialsMember2021-12-310000849395crh:AmericasMaterialsMember2020-12-310000849395crh:BuildingProductsMember2022-12-310000849395crh:BuildingProductsMember2021-12-310000849395crh:BuildingProductsMember2020-12-310000849395crh:EuropeMaterialsMember2022-12-310000849395crh:EuropeMaterialsMember2021-12-310000849395crh:EuropeMaterialsMember2020-12-310000849395srt:AmericasMembercrh:BuildingProductsMember2022-12-310000849395srt:AmericasMembercrh:BuildingProductsMember2021-12-310000849395srt:AmericasMembercrh:BuildingProductsMember2020-12-310000849395crh:BuildingProductsMembersrt:EuropeMember2022-12-310000849395crh:BuildingProductsMembersrt:EuropeMember2021-12-310000849395crh:BuildingProductsMembersrt:EuropeMember2020-12-310000849395ifrs-full:CurrentMembercrh:AmericasMaterialsMember2022-12-310000849395crh:BuildingProductsMemberifrs-full:CurrentMember2022-12-310000849395crh:EuropeMaterialsMemberifrs-full:CurrentMember2022-12-310000849395ifrs-full:CurrentMember2022-12-310000849395ifrs-full:CurrentMembercrh:AmericasMaterialsMember2021-12-310000849395crh:BuildingProductsMemberifrs-full:CurrentMember2021-12-310000849395crh:EuropeMaterialsMemberifrs-full:CurrentMember2021-12-310000849395ifrs-full:CurrentMember2021-12-310000849395ifrs-full:LaterThanOneMonthAndNotLaterThanTwoMonthsMembercrh:AmericasMaterialsMember2022-12-310000849395ifrs-full:LaterThanOneMonthAndNotLaterThanTwoMonthsMembercrh:BuildingProductsMember2022-12-310000849395crh:EuropeMaterialsMemberifrs-full:LaterThanOneMonthAndNotLaterThanTwoMonthsMember2022-12-310000849395ifrs-full:LaterThanOneMonthAndNotLaterThanTwoMonthsMember2022-12-310000849395ifrs-full:LaterThanOneMonthAndNotLaterThanTwoMonthsMembercrh:AmericasMaterialsMember2021-12-310000849395ifrs-full:LaterThanOneMonthAndNotLaterThanTwoMonthsMembercrh:BuildingProductsMember2021-12-310000849395crh:EuropeMaterialsMemberifrs-full:LaterThanOneMonthAndNotLaterThanTwoMonthsMember2021-12-310000849395ifrs-full:LaterThanOneMonthAndNotLaterThanTwoMonthsMember2021-12-310000849395ifrs-full:LaterThanTwoMonthsAndNotLaterThanThreeMonthsMembercrh:AmericasMaterialsMember2022-12-310000849395ifrs-full:LaterThanTwoMonthsAndNotLaterThanThreeMonthsMembercrh:BuildingProductsMember2022-12-310000849395crh:EuropeMaterialsMemberifrs-full:LaterThanTwoMonthsAndNotLaterThanThreeMonthsMember2022-12-310000849395ifrs-full:LaterThanTwoMonthsAndNotLaterThanThreeMonthsMember2022-12-310000849395ifrs-full:LaterThanTwoMonthsAndNotLaterThanThreeMonthsMembercrh:AmericasMaterialsMember2021-12-310000849395ifrs-full:LaterThanTwoMonthsAndNotLaterThanThreeMonthsMembercrh:BuildingProductsMember2021-12-310000849395crh:EuropeMaterialsMemberifrs-full:LaterThanTwoMonthsAndNotLaterThanThreeMonthsMember2021-12-310000849395ifrs-full:LaterThanTwoMonthsAndNotLaterThanThreeMonthsMember2021-12-310000849395ifrs-full:LaterThanThreeMonthsMembercrh:AmericasMaterialsMember2022-12-310000849395ifrs-full:LaterThanThreeMonthsMembercrh:BuildingProductsMember2022-12-310000849395ifrs-full:LaterThanThreeMonthsMembercrh:EuropeMaterialsMember2022-12-310000849395ifrs-full:LaterThanThreeMonthsMember2022-12-310000849395ifrs-full:LaterThanThreeMonthsMembercrh:AmericasMaterialsMember2021-12-310000849395ifrs-full:LaterThanThreeMonthsMembercrh:BuildingProductsMember2021-12-310000849395ifrs-full:LaterThanThreeMonthsMembercrh:EuropeMaterialsMember2021-12-310000849395ifrs-full:LaterThanThreeMonthsMember2021-12-310000849395ifrs-full:Level3OfFairValueHierarchyMember2022-12-310000849395ifrs-full:Level3OfFairValueHierarchyMember2021-12-310000849395crh:InventoryMember2021-12-310000849395crh:TradeAndOtherReceivableMember2021-12-310000849395crh:TradeAndOtherPayableMember2021-12-310000849395crh:ProvisionsForLiabilitiesMember2021-12-310000849395crh:InventoryMember2022-01-012022-12-310000849395crh:TradeAndOtherReceivableMember2022-01-012022-12-310000849395crh:TradeAndOtherPayableMember2022-01-012022-12-310000849395crh:ProvisionsForLiabilitiesMember2022-01-012022-12-310000849395crh:InventoryMember2022-12-310000849395crh:TradeAndOtherReceivableMember2022-12-310000849395crh:TradeAndOtherPayableMember2022-12-310000849395crh:ProvisionsForLiabilitiesMember2022-12-310000849395crh:InventoryMember2020-12-310000849395crh:TradeAndOtherReceivableMember2020-12-310000849395crh:TradeAndOtherPayableMember2020-12-310000849395crh:ProvisionsForLiabilitiesMember2020-12-310000849395crh:InventoryMember2021-01-012021-12-310000849395crh:TradeAndOtherReceivableMember2021-01-012021-12-310000849395crh:TradeAndOtherPayableMember2021-01-012021-12-310000849395crh:ProvisionsForLiabilitiesMember2021-01-012021-12-310000849395crh:InventoryMember2019-12-310000849395crh:TradeAndOtherReceivableMember2019-12-310000849395crh:TradeAndOtherPayableMember2019-12-310000849395crh:ProvisionsForLiabilitiesMember2019-12-310000849395crh:InventoryMember2020-01-012020-12-310000849395crh:TradeAndOtherReceivableMember2020-01-012020-12-310000849395crh:TradeAndOtherPayableMember2020-01-012020-12-310000849395crh:ProvisionsForLiabilitiesMember2020-01-012020-12-310000849395ifrs-full:LandAndBuildingsMemberifrs-full:RightofuseAssetsMemberifrs-full:GrossCarryingAmountMember2022-12-310000849395ifrs-full:RightofuseAssetsMemberifrs-full:GrossCarryingAmountMemberifrs-full:PropertyPlantAndEquipmentMember2022-12-310000849395ifrs-full:OtherAssetsMemberifrs-full:RightofuseAssetsMemberifrs-full:GrossCarryingAmountMember2022-12-310000849395ifrs-full:RightofuseAssetsMemberifrs-full:GrossCarryingAmountMember2022-12-310000849395ifrs-full:LandAndBuildingsMemberifrs-full:AccumulatedDepreciationAmortisationAndImpairmentMemberifrs-full:RightofuseAssetsMember2022-12-310000849395ifrs-full:AccumulatedDepreciationAmortisationAndImpairmentMemberifrs-full:RightofuseAssetsMemberifrs-full:PropertyPlantAndEquipmentMember2022-12-310000849395ifrs-full:OtherAssetsMemberifrs-full:AccumulatedDepreciationAmortisationAndImpairmentMemberifrs-full:RightofuseAssetsMember2022-12-310000849395ifrs-full:AccumulatedDepreciationAmortisationAndImpairmentMemberifrs-full:RightofuseAssetsMember2022-12-310000849395ifrs-full:LandAndBuildingsMemberifrs-full:RightofuseAssetsMember2022-12-310000849395ifrs-full:RightofuseAssetsMemberifrs-full:PropertyPlantAndEquipmentMember2022-12-310000849395ifrs-full:OtherAssetsMemberifrs-full:RightofuseAssetsMember2022-12-310000849395ifrs-full:RightofuseAssetsMember2022-12-310000849395ifrs-full:LandAndBuildingsMemberifrs-full:RightofuseAssetsMember2021-12-310000849395ifrs-full:RightofuseAssetsMemberifrs-full:PropertyPlantAndEquipmentMember2021-12-310000849395ifrs-full:OtherAssetsMemberifrs-full:RightofuseAssetsMember2021-12-310000849395ifrs-full:RightofuseAssetsMember2021-12-310000849395ifrs-full:LandAndBuildingsMemberifrs-full:RightofuseAssetsMember2022-01-012022-12-310000849395ifrs-full:RightofuseAssetsMemberifrs-full:PropertyPlantAndEquipmentMember2022-01-012022-12-310000849395ifrs-full:OtherAssetsMemberifrs-full:RightofuseAssetsMember2022-01-012022-12-310000849395ifrs-full:RightofuseAssetsMember2022-01-012022-12-310000849395ifrs-full:LandAndBuildingsMemberifrs-full:RightofuseAssetsMemberifrs-full:GrossCarryingAmountMember2021-12-310000849395ifrs-full:RightofuseAssetsMemberifrs-full:GrossCarryingAmountMemberifrs-full:PropertyPlantAndEquipmentMember2021-12-310000849395ifrs-full:OtherAssetsMemberifrs-full:RightofuseAssetsMemberifrs-full:GrossCarryingAmountMember2021-12-310000849395ifrs-full:RightofuseAssetsMemberifrs-full:GrossCarryingAmountMember2021-12-310000849395ifrs-full:LandAndBuildingsMemberifrs-full:AccumulatedDepreciationAmortisationAndImpairmentMemberifrs-full:RightofuseAssetsMember2021-12-310000849395ifrs-full:AccumulatedDepreciationAmortisationAndImpairmentMemberifrs-full:RightofuseAssetsMemberifrs-full:PropertyPlantAndEquipmentMember2021-12-310000849395ifrs-full:OtherAssetsMemberifrs-full:AccumulatedDepreciationAmortisationAndImpairmentMemberifrs-full:RightofuseAssetsMember2021-12-310000849395ifrs-full:AccumulatedDepreciationAmortisationAndImpairmentMemberifrs-full:RightofuseAssetsMember2021-12-310000849395ifrs-full:LandAndBuildingsMemberifrs-full:RightofuseAssetsMember2020-12-310000849395ifrs-full:RightofuseAssetsMemberifrs-full:PropertyPlantAndEquipmentMember2020-12-310000849395ifrs-full:OtherAssetsMemberifrs-full:RightofuseAssetsMember2020-12-310000849395ifrs-full:RightofuseAssetsMember2020-12-310000849395ifrs-full:LandAndBuildingsMemberifrs-full:RightofuseAssetsMember2021-01-012021-12-310000849395ifrs-full:RightofuseAssetsMemberifrs-full:PropertyPlantAndEquipmentMember2021-01-012021-12-310000849395ifrs-full:OtherAssetsMemberifrs-full:RightofuseAssetsMember2021-01-012021-12-310000849395ifrs-full:RightofuseAssetsMember2021-01-012021-12-310000849395ifrs-full:LandAndBuildingsMemberifrs-full:RightofuseAssetsMemberifrs-full:GrossCarryingAmountMember2020-12-310000849395ifrs-full:RightofuseAssetsMemberifrs-full:GrossCarryingAmountMemberifrs-full:PropertyPlantAndEquipmentMember2020-12-310000849395ifrs-full:OtherAssetsMemberifrs-full:RightofuseAssetsMemberifrs-full:GrossCarryingAmountMember2020-12-310000849395ifrs-full:RightofuseAssetsMemberifrs-full:GrossCarryingAmountMember2020-12-310000849395ifrs-full:LandAndBuildingsMemberifrs-full:RightofuseAssetsMemberifrs-full:AccumulatedDepreciationAndAmortisationMember2020-12-310000849395ifrs-full:RightofuseAssetsMemberifrs-full:AccumulatedDepreciationAndAmortisationMemberifrs-full:PropertyPlantAndEquipmentMember2020-12-310000849395ifrs-full:OtherAssetsMemberifrs-full:RightofuseAssetsMemberifrs-full:AccumulatedDepreciationAndAmortisationMember2020-12-310000849395ifrs-full:RightofuseAssetsMemberifrs-full:AccumulatedDepreciationAndAmortisationMember2020-12-310000849395ifrs-full:LandAndBuildingsMemberifrs-full:LeaseLiabilitiesMember2021-12-310000849395ifrs-full:LeaseLiabilitiesMemberifrs-full:PropertyPlantAndEquipmentMember2021-12-310000849395ifrs-full:OtherAssetsMemberifrs-full:LeaseLiabilitiesMember2021-12-310000849395ifrs-full:LeaseLiabilitiesMember2021-12-310000849395ifrs-full:LandAndBuildingsMemberifrs-full:LeaseLiabilitiesMember2022-01-012022-12-310000849395ifrs-full:LeaseLiabilitiesMemberifrs-full:PropertyPlantAndEquipmentMember2022-01-012022-12-310000849395ifrs-full:OtherAssetsMemberifrs-full:LeaseLiabilitiesMember2022-01-012022-12-310000849395ifrs-full:LeaseLiabilitiesMember2022-01-012022-12-310000849395ifrs-full:LandAndBuildingsMemberifrs-full:LeaseLiabilitiesMember2022-12-310000849395ifrs-full:LeaseLiabilitiesMemberifrs-full:PropertyPlantAndEquipmentMember2022-12-310000849395ifrs-full:OtherAssetsMemberifrs-full:LeaseLiabilitiesMember2022-12-310000849395ifrs-full:LeaseLiabilitiesMember2022-12-310000849395ifrs-full:LandAndBuildingsMemberifrs-full:LeaseLiabilitiesMember2020-12-310000849395ifrs-full:LeaseLiabilitiesMemberifrs-full:PropertyPlantAndEquipmentMember2020-12-310000849395ifrs-full:OtherAssetsMemberifrs-full:LeaseLiabilitiesMember2020-12-310000849395ifrs-full:LeaseLiabilitiesMember2020-12-310000849395ifrs-full:LandAndBuildingsMemberifrs-full:LeaseLiabilitiesMember2021-01-012021-12-310000849395ifrs-full:LeaseLiabilitiesMemberifrs-full:PropertyPlantAndEquipmentMember2021-01-012021-12-310000849395ifrs-full:OtherAssetsMemberifrs-full:LeaseLiabilitiesMember2021-01-012021-12-310000849395ifrs-full:LeaseLiabilitiesMember2021-01-012021-12-310000849395ifrs-full:LeaseLiabilitiesMemberifrs-full:DiscontinuedOperationsMember2022-01-012022-12-310000849395ifrs-full:LeaseLiabilitiesMemberifrs-full:DiscontinuedOperationsMember2021-01-012021-12-310000849395ifrs-full:LeaseLiabilitiesMemberifrs-full:DiscontinuedOperationsMember2020-01-012020-12-310000849395ifrs-full:NotLaterThanOneYearMembercrh:DiscountedLeaseLiabilityMember2022-12-310000849395ifrs-full:NotLaterThanOneYearMembercrh:UndiscountedLeaseLiabilityMember2022-12-310000849395ifrs-full:NotLaterThanOneYearMembercrh:DiscountedLeaseLiabilityMember2021-12-310000849395ifrs-full:NotLaterThanOneYearMembercrh:UndiscountedLeaseLiabilityMember2021-12-310000849395ifrs-full:LaterThanOneYearAndNotLaterThanTwoYearsMembercrh:DiscountedLeaseLiabilityMember2022-12-310000849395ifrs-full:LaterThanOneYearAndNotLaterThanTwoYearsMembercrh:UndiscountedLeaseLiabilityMember2022-12-310000849395ifrs-full:LaterThanOneYearAndNotLaterThanTwoYearsMembercrh:DiscountedLeaseLiabilityMember2021-12-310000849395ifrs-full:LaterThanOneYearAndNotLaterThanTwoYearsMembercrh:UndiscountedLeaseLiabilityMember2021-12-310000849395ifrs-full:LaterThanTwoYearsAndNotLaterThanThreeYearsMembercrh:DiscountedLeaseLiabilityMember2022-12-310000849395ifrs-full:LaterThanTwoYearsAndNotLaterThanThreeYearsMembercrh:UndiscountedLeaseLiabilityMember2022-12-310000849395ifrs-full:LaterThanTwoYearsAndNotLaterThanThreeYearsMembercrh:DiscountedLeaseLiabilityMember2021-12-310000849395ifrs-full:LaterThanTwoYearsAndNotLaterThanThreeYearsMembercrh:UndiscountedLeaseLiabilityMember2021-12-310000849395crh:DiscountedLeaseLiabilityMemberifrs-full:LaterThanThreeYearsAndNotLaterThanFourYearsMember2022-12-310000849395crh:UndiscountedLeaseLiabilityMemberifrs-full:LaterThanThreeYearsAndNotLaterThanFourYearsMember2022-12-310000849395crh:DiscountedLeaseLiabilityMemberifrs-full:LaterThanThreeYearsAndNotLaterThanFourYearsMember2021-12-310000849395crh:UndiscountedLeaseLiabilityMemberifrs-full:LaterThanThreeYearsAndNotLaterThanFourYearsMember2021-12-310000849395ifrs-full:LaterThanFourYearsAndNotLaterThanFiveYearsMembercrh:DiscountedLeaseLiabilityMember2022-12-310000849395ifrs-full:LaterThanFourYearsAndNotLaterThanFiveYearsMembercrh:UndiscountedLeaseLiabilityMember2022-12-310000849395ifrs-full:LaterThanFourYearsAndNotLaterThanFiveYearsMembercrh:DiscountedLeaseLiabilityMember2021-12-310000849395ifrs-full:LaterThanFourYearsAndNotLaterThanFiveYearsMembercrh:UndiscountedLeaseLiabilityMember2021-12-310000849395ifrs-full:LaterThanFiveYearsMembercrh:DiscountedLeaseLiabilityMember2022-12-310000849395ifrs-full:LaterThanFiveYearsMembercrh:UndiscountedLeaseLiabilityMember2022-12-310000849395ifrs-full:LaterThanFiveYearsMembercrh:DiscountedLeaseLiabilityMember2021-12-310000849395ifrs-full:LaterThanFiveYearsMembercrh:UndiscountedLeaseLiabilityMember2021-12-310000849395crh:DiscountedLeaseLiabilityMember2022-12-310000849395crh:UndiscountedLeaseLiabilityMember2022-12-310000849395crh:DiscountedLeaseLiabilityMember2021-12-310000849395crh:UndiscountedLeaseLiabilityMember2021-12-310000849395ifrs-full:NotLaterThanOneYearMembercrh:Ifrs16Member2022-12-310000849395ifrs-full:NotLaterThanOneYearMembercrh:Ifrs16Member2021-12-310000849395ifrs-full:LaterThanOneYearAndNotLaterThanTwoYearsMembercrh:Ifrs16Member2022-12-310000849395ifrs-full:LaterThanOneYearAndNotLaterThanTwoYearsMembercrh:Ifrs16Member2021-12-310000849395ifrs-full:LaterThanTwoYearsAndNotLaterThanThreeYearsMembercrh:Ifrs16Member2022-12-310000849395ifrs-full:LaterThanTwoYearsAndNotLaterThanThreeYearsMembercrh:Ifrs16Member2021-12-310000849395crh:Ifrs16Memberifrs-full:LaterThanThreeYearsAndNotLaterThanFourYearsMember2022-12-310000849395crh:Ifrs16Memberifrs-full:LaterThanThreeYearsAndNotLaterThanFourYearsMember2021-12-310000849395ifrs-full:LaterThanFourYearsAndNotLaterThanFiveYearsMembercrh:Ifrs16Member2022-12-310000849395ifrs-full:LaterThanFourYearsAndNotLaterThanFiveYearsMembercrh:Ifrs16Member2021-12-310000849395ifrs-full:LaterThanFiveYearsMembercrh:Ifrs16Member2022-12-310000849395ifrs-full:LaterThanFiveYearsMembercrh:Ifrs16Member2021-12-310000849395crh:Ifrs16Member2022-12-310000849395crh:Ifrs16Member2021-12-310000849395crh:NetCarryingAmountMember2022-12-310000849395ifrs-full:AtFairValueMember2022-12-310000849395crh:NetCarryingAmountMember2021-12-310000849395ifrs-full:AtFairValueMember2021-12-310000849395crh:CashFlowItemsMember2022-01-012022-12-310000849395crh:NetDebtInAcquiredCompaniesMember2022-01-012022-12-310000849395crh:NetDebtInDisposedCompaniesMember2022-01-012022-12-310000849395crh:MarkToMarketAndOtherNonCashAdjustmentsMember2022-01-012022-12-310000849395crh:TranslationAdjustmentMember2022-01-012022-12-310000849395crh:InterestBearingLoansAndBorrowingsMember2021-12-310000849395crh:InterestBearingLoansAndBorrowingsMembercrh:CashFlowItemsMember2022-01-012022-12-310000849395crh:InterestBearingLoansAndBorrowingsMembercrh:NetDebtInAcquiredCompaniesMember2022-01-012022-12-310000849395crh:NetDebtInDisposedCompaniesMembercrh:InterestBearingLoansAndBorrowingsMember2022-01-012022-12-310000849395crh:MarkToMarketAndOtherNonCashAdjustmentsMembercrh:InterestBearingLoansAndBorrowingsMember2022-01-012022-12-310000849395crh:InterestBearingLoansAndBorrowingsMembercrh:TranslationAdjustmentMember2022-01-012022-12-310000849395crh:InterestBearingLoansAndBorrowingsMember2022-12-310000849395ifrs-full:LeaseLiabilitiesMembercrh:CashFlowItemsMember2022-01-012022-12-310000849395ifrs-full:LeaseLiabilitiesMembercrh:NetDebtInAcquiredCompaniesMember2022-01-012022-12-310000849395crh:NetDebtInDisposedCompaniesMemberifrs-full:LeaseLiabilitiesMember2022-01-012022-12-310000849395crh:MarkToMarketAndOtherNonCashAdjustmentsMemberifrs-full:LeaseLiabilitiesMember2022-01-012022-12-310000849395ifrs-full:LeaseLiabilitiesMembercrh:TranslationAdjustmentMember2022-01-012022-12-310000849395crh:DerivativeFinancialInstrumentsFinancingMember2021-12-310000849395crh:CashFlowItemsMembercrh:DerivativeFinancialInstrumentsFinancingMember2022-01-012022-12-310000849395crh:NetDebtInAcquiredCompaniesMembercrh:DerivativeFinancialInstrumentsFinancingMember2022-01-012022-12-310000849395crh:NetDebtInDisposedCompaniesMembercrh:DerivativeFinancialInstrumentsFinancingMember2022-01-012022-12-310000849395crh:MarkToMarketAndOtherNonCashAdjustmentsMembercrh:DerivativeFinancialInstrumentsFinancingMember2022-01-012022-12-310000849395crh:TranslationAdjustmentMembercrh:DerivativeFinancialInstrumentsFinancingMember2022-01-012022-12-310000849395crh:DerivativeFinancialInstrumentsFinancingMember2022-12-310000849395crh:DerivativeFinancialInstrumentsNonFinancingMember2021-12-310000849395crh:CashFlowItemsMembercrh:DerivativeFinancialInstrumentsNonFinancingMember2022-01-012022-12-310000849395crh:NetDebtInAcquiredCompaniesMembercrh:DerivativeFinancialInstrumentsNonFinancingMember2022-01-012022-12-310000849395crh:NetDebtInDisposedCompaniesMembercrh:DerivativeFinancialInstrumentsNonFinancingMember2022-01-012022-12-310000849395crh:MarkToMarketAndOtherNonCashAdjustmentsMembercrh:DerivativeFinancialInstrumentsNonFinancingMember2022-01-012022-12-310000849395crh:TranslationAdjustmentMembercrh:DerivativeFinancialInstrumentsNonFinancingMember2022-01-012022-12-310000849395crh:DerivativeFinancialInstrumentsNonFinancingMember2022-12-310000849395crh:CashFlowItemsMember2021-01-012021-12-310000849395crh:NetDebtInAcquiredCompaniesMember2021-01-012021-12-310000849395crh:NetDebtInDisposedCompaniesMember2021-01-012021-12-310000849395crh:MarkToMarketAndOtherNonCashAdjustmentsMember2021-01-012021-12-310000849395crh:TranslationAdjustmentMember2021-01-012021-12-310000849395crh:InterestBearingLoansAndBorrowingsMember2020-12-310000849395crh:InterestBearingLoansAndBorrowingsMembercrh:CashFlowItemsMember2021-01-012021-12-310000849395crh:InterestBearingLoansAndBorrowingsMembercrh:NetDebtInAcquiredCompaniesMember2021-01-012021-12-310000849395crh:NetDebtInDisposedCompaniesMembercrh:InterestBearingLoansAndBorrowingsMember2021-01-012021-12-310000849395crh:MarkToMarketAndOtherNonCashAdjustmentsMembercrh:InterestBearingLoansAndBorrowingsMember2021-01-012021-12-310000849395crh:InterestBearingLoansAndBorrowingsMembercrh:TranslationAdjustmentMember2021-01-012021-12-310000849395ifrs-full:LeaseLiabilitiesMembercrh:CashFlowItemsMember2021-01-012021-12-310000849395ifrs-full:LeaseLiabilitiesMembercrh:NetDebtInAcquiredCompaniesMember2021-01-012021-12-310000849395crh:NetDebtInDisposedCompaniesMemberifrs-full:LeaseLiabilitiesMember2021-01-012021-12-310000849395crh:MarkToMarketAndOtherNonCashAdjustmentsMemberifrs-full:LeaseLiabilitiesMember2021-01-012021-12-310000849395ifrs-full:LeaseLiabilitiesMembercrh:TranslationAdjustmentMember2021-01-012021-12-310000849395crh:DerivativeFinancialInstrumentsMember2020-12-310000849395crh:DerivativeFinancialInstrumentsMembercrh:CashFlowItemsMember2021-01-012021-12-310000849395crh:DerivativeFinancialInstrumentsMembercrh:NetDebtInAcquiredCompaniesMember2021-01-012021-12-310000849395crh:NetDebtInDisposedCompaniesMembercrh:DerivativeFinancialInstrumentsMember2021-01-012021-12-310000849395crh:MarkToMarketAndOtherNonCashAdjustmentsMembercrh:DerivativeFinancialInstrumentsMember2021-01-012021-12-310000849395crh:DerivativeFinancialInstrumentsMembercrh:TranslationAdjustmentMember2021-01-012021-12-310000849395crh:DerivativeFinancialInstrumentsMember2021-12-310000849395crh:CashFlowItemsMember2020-01-012020-12-310000849395crh:NetDebtInAcquiredCompaniesMember2020-01-012020-12-310000849395crh:NetDebtInDisposedCompaniesMember2020-01-012020-12-310000849395crh:MarkToMarketAndOtherNonCashAdjustmentsMember2020-01-012020-12-310000849395crh:TranslationAdjustmentMember2020-01-012020-12-310000849395crh:InterestBearingLoansAndBorrowingsMember2019-12-310000849395crh:InterestBearingLoansAndBorrowingsMembercrh:CashFlowItemsMember2020-01-012020-12-310000849395crh:InterestBearingLoansAndBorrowingsMembercrh:NetDebtInAcquiredCompaniesMember2020-01-012020-12-310000849395crh:NetDebtInDisposedCompaniesMembercrh:InterestBearingLoansAndBorrowingsMember2020-01-012020-12-310000849395crh:MarkToMarketAndOtherNonCashAdjustmentsMembercrh:InterestBearingLoansAndBorrowingsMember2020-01-012020-12-310000849395crh:InterestBearingLoansAndBorrowingsMembercrh:TranslationAdjustmentMember2020-01-012020-12-310000849395ifrs-full:LeaseLiabilitiesMember2019-12-310000849395ifrs-full:LeaseLiabilitiesMembercrh:CashFlowItemsMember2020-01-012020-12-310000849395ifrs-full:LeaseLiabilitiesMembercrh:NetDebtInAcquiredCompaniesMember2020-01-012020-12-310000849395crh:NetDebtInDisposedCompaniesMemberifrs-full:LeaseLiabilitiesMember2020-01-012020-12-310000849395crh:MarkToMarketAndOtherNonCashAdjustmentsMemberifrs-full:LeaseLiabilitiesMember2020-01-012020-12-310000849395ifrs-full:LeaseLiabilitiesMembercrh:TranslationAdjustmentMember2020-01-012020-12-310000849395crh:DerivativeFinancialInstrumentsMember2019-12-310000849395crh:DerivativeFinancialInstrumentsMembercrh:CashFlowItemsMember2020-01-012020-12-310000849395crh:DerivativeFinancialInstrumentsMembercrh:NetDebtInAcquiredCompaniesMember2020-01-012020-12-310000849395crh:NetDebtInDisposedCompaniesMembercrh:DerivativeFinancialInstrumentsMember2020-01-012020-12-310000849395crh:MarkToMarketAndOtherNonCashAdjustmentsMembercrh:DerivativeFinancialInstrumentsMember2020-01-012020-12-310000849395crh:DerivativeFinancialInstrumentsMembercrh:TranslationAdjustmentMember2020-01-012020-12-310000849395currency:USDcrh:CurrencyProfileMember2022-12-310000849395crh:CurrencyProfileMembercurrency:EUR2022-12-310000849395crh:CurrencyProfileMembercurrency:GBP2022-12-310000849395crh:CurrencyProfileMembercurrency:CAD2022-12-310000849395crh:CurrencyProfileMembercurrency:PHP2022-12-310000849395crh:CurrencyProfileMembercurrency:PLN2022-12-310000849395crh:CurrencyProfileMembercurrency:CHF2022-12-310000849395crh:CurrencyProfileMembercrh:OtherCurrencyMember2022-12-310000849395crh:CurrencyProfileMember2022-12-310000849395currency:USDcrh:CurrencyProfileMember2021-12-310000849395crh:CurrencyProfileMembercurrency:EUR2021-12-310000849395crh:CurrencyProfileMembercurrency:GBP2021-12-310000849395crh:CurrencyProfileMembercurrency:CAD2021-12-310000849395crh:CurrencyProfileMembercurrency:PHP2021-12-310000849395crh:CurrencyProfileMembercurrency:PLN2021-12-310000849395crh:CurrencyProfileMembercurrency:CHF2021-12-310000849395crh:CurrencyProfileMembercrh:OtherCurrencyMember2021-12-310000849395crh:CurrencyProfileMember2021-12-310000849395currency:USD2022-01-012022-12-310000849395currency:USD2021-01-012021-12-310000849395currency:EUR2022-01-012022-12-310000849395currency:EUR2021-01-012021-12-310000849395crh:EurobondsMembercrh:MaturityYearTwoThousandTwentyThreeMember2022-01-012022-12-310000849395crh:EurobondsMembercrh:MaturityYearTwoThousandTwentyThreeMember2022-12-310000849395crh:MaturityYearTwoThousandTwentyThreeNewMembercrh:EurobondsMember2022-01-012022-12-310000849395crh:MaturityYearTwoThousandTwentyThreeNewMembercrh:EurobondsMember2022-12-310000849395crh:MaturityYearTwoThousandTwentyFourMembercrh:EurobondsMember2022-01-012022-12-310000849395crh:MaturityYearTwoThousandTwentyFourMembercrh:EurobondsMember2022-12-310000849395crh:USDollarBondsMembercrh:MaturityYearTwoThousandTwentyFiveMember2022-01-012022-12-310000849395crh:USDollarBondsMembercrh:MaturityYearTwoThousandTwentyFiveMember2022-12-310000849395crh:MaturityYearTwoThousandAndTwentySixMembercrh:EurobondsMember2022-01-012022-12-310000849395crh:MaturityYearTwoThousandAndTwentySixMembercrh:EurobondsMember2022-12-310000849395crh:MaturityYearTwoThousandTwentySevenMembercrh:USDollarBondsMember2022-01-012022-12-310000849395crh:MaturityYearTwoThousandTwentySevenMembercrh:USDollarBondsMember2022-12-310000849395crh:MaturityYearTwoThousandTwentyEightMembercrh:USDollarBondsMember2022-01-012022-12-310000849395crh:MaturityYearTwoThousandTwentyEightMembercrh:USDollarBondsMember2022-12-310000849395crh:MaturityYearTwoThousandTwentyEightNewMembercrh:EurobondsMember2022-01-012022-12-310000849395crh:MaturityYearTwoThousandTwentyEightNewMembercrh:EurobondsMember2022-12-310000849395crh:PoundSterlingBondsMembercrh:MaturityYearTwoThousandTwentyNineMember2022-01-012022-12-310000849395crh:PoundSterlingBondsMembercrh:MaturityYearTwoThousandTwentyNineMember2022-12-310000849395crh:MaturityYearTwoThousandAndThirtyMembercrh:EurobondsMember2022-01-012022-12-310000849395crh:MaturityYearTwoThousandAndThirtyMembercrh:EurobondsMember2022-12-310000849395crh:MaturityYearTwoThousandThirtyThreeMembercrh:USDollarBondsMember2022-01-012022-12-310000849395crh:MaturityYearTwoThousandThirtyThreeMembercrh:USDollarBondsMember2022-12-310000849395crh:MaturityYearTwoThousandFortyFiveMembercrh:USDollarBondsMember2022-01-012022-12-310000849395crh:MaturityYearTwoThousandFortyFiveMembercrh:USDollarBondsMember2022-12-310000849395crh:MaturityYearTwoThousandFourtySevenMembercrh:USDollarBondsMember2022-01-012022-12-310000849395crh:MaturityYearTwoThousandFourtySevenMembercrh:USDollarBondsMember2022-12-310000849395crh:USDollarBondsMembercrh:MaturityYearTwoThousandFortyEightMember2022-01-012022-12-310000849395crh:USDollarBondsMembercrh:MaturityYearTwoThousandFortyEightMember2022-12-3100008493952003-09-3000008493952009-08-3100008493952010-12-310000849395crh:HedgingInstrumentsThatReference3MonthUSLIBORMember2022-12-310000849395srt:MinimumMember2022-01-012022-12-310000849395srt:MaximumMember2022-01-012022-12-310000849395ifrs-full:InterestRateRiskMember2022-01-012022-12-310000849395ifrs-full:InterestRateRiskMember2021-01-012021-12-310000849395ifrs-full:InterestRateRiskMember2020-01-012020-12-310000849395ifrs-full:CommodityPriceRiskMember2022-01-012022-12-310000849395ifrs-full:HedgesOfNetInvestmentInForeignOperationsMember2022-12-310000849395ifrs-full:HedgesOfNetInvestmentInForeignOperationsMember2021-12-310000849395crh:ForeignCurrencyRiskMember2022-01-012022-12-310000849395crh:ForeignCurrencyRiskMember2021-01-012021-12-310000849395crh:ForeignCurrencyRiskMember2020-01-012020-12-310000849395ifrs-full:CreditRiskMembercrh:AaaAaaAaaMembercrh:CreditRatingOfCounterpartyMember2022-12-310000849395ifrs-full:CreditRiskMembercrh:AaaAaaAaaMembercrh:CreditRatingOfCounterpartyMember2021-12-310000849395ifrs-full:CreditRiskMembercrh:AaAaAaMembercrh:CreditRatingOfCounterpartyMember2022-12-310000849395ifrs-full:CreditRiskMembercrh:AaAaAaMembercrh:CreditRatingOfCounterpartyMember2021-12-310000849395ifrs-full:CreditRiskMembercrh:AAAMembercrh:CreditRatingOfCounterpartyMember2022-12-310000849395ifrs-full:CreditRiskMembercrh:AAAMembercrh:CreditRatingOfCounterpartyMember2021-12-310000849395ifrs-full:CreditRiskMembercrh:BaaBbbBbbOrLowerMembercrh:CreditRatingOfCounterpartyMember2022-12-310000849395ifrs-full:CreditRiskMembercrh:BaaBbbBbbOrLowerMembercrh:CreditRatingOfCounterpartyMember2021-12-310000849395ifrs-full:CreditRiskMembercrh:CreditRatingOfCounterpartyMember2022-12-310000849395ifrs-full:CreditRiskMembercrh:CreditRatingOfCounterpartyMember2021-12-310000849395ifrs-full:CreditRiskMemberifrs-full:TradeReceivablesMember2022-12-310000849395ifrs-full:CreditRiskMemberifrs-full:TradeReceivablesMember2021-12-310000849395crh:EuroAndUSDCommercialPaperProgrammeMemberifrs-full:LiquidityRiskMember2022-12-310000849395crh:CommoditySwapsMember2022-12-310000849395crh:CommoditySwapsMember2021-12-310000849395crh:ElectricityMember2022-12-310000849395crh:ElectricityMember2021-12-310000849395crh:FuelOilAndRelatedProductsMember2022-12-310000849395crh:FuelOilAndRelatedProductsMember2021-12-310000849395ifrs-full:NotLaterThanOneYearMember2022-12-310000849395ifrs-full:LaterThanOneYearAndNotLaterThanTwoYearsMember2022-12-310000849395ifrs-full:LaterThanTwoYearsAndNotLaterThanThreeYearsMember2022-12-310000849395ifrs-full:LaterThanThreeYearsAndNotLaterThanFourYearsMember2022-12-310000849395ifrs-full:LaterThanFourYearsAndNotLaterThanFiveYearsMember2022-12-310000849395ifrs-full:LaterThanFiveYearsMember2022-12-310000849395ifrs-full:NotLaterThanOneYearMember2021-12-310000849395ifrs-full:LaterThanOneYearAndNotLaterThanTwoYearsMember2021-12-310000849395ifrs-full:LaterThanTwoYearsAndNotLaterThanThreeYearsMember2021-12-310000849395ifrs-full:LaterThanThreeYearsAndNotLaterThanFourYearsMember2021-12-310000849395ifrs-full:LaterThanFourYearsAndNotLaterThanFiveYearsMember2021-12-310000849395ifrs-full:LaterThanFiveYearsMember2021-12-310000849395crh:InterestBearingLoansAndBorrowingsMemberifrs-full:PropertyPlantAndEquipmentMember2022-12-310000849395crh:InterestBearingLoansAndBorrowingsMemberifrs-full:PropertyPlantAndEquipmentMember2021-12-3100008493952022-09-012022-09-30iso4217:CHF0000849395crh:LoansBankAdvancesDerivativeObligationsAndFutureLeaseObligationsMembercrh:LettersOfGuaranteeMember2022-12-310000849395crh:LoansBankAdvancesDerivativeObligationsAndFutureLeaseObligationsMembercrh:LettersOfGuaranteeMember2021-12-310000849395ifrs-full:NotLaterThanOneYearMembercrh:LettersOfGuaranteeMembercrh:LettersOfCreditMember2022-12-310000849395ifrs-full:NotLaterThanOneYearMembercrh:LettersOfGuaranteeMembercrh:LettersOfCreditMember2021-12-310000849395ifrs-full:NotLaterThanOneYearMemberifrs-full:FairValueHedgesMember2022-12-310000849395ifrs-full:NotLaterThanOneYearMemberifrs-full:CashFlowHedgesMember2022-12-310000849395ifrs-full:HedgesOfNetInvestmentInForeignOperationsMemberifrs-full:NotLaterThanOneYearMember2022-12-310000849395ifrs-full:NotLaterThanOneYearMembercrh:DerivativesNotDesignatedAsHedgesMember2022-12-310000849395ifrs-full:FairValueHedgesMemberifrs-full:LaterThanOneYearAndNotLaterThanTwoYearsMember2022-12-310000849395ifrs-full:LaterThanOneYearAndNotLaterThanTwoYearsMemberifrs-full:CashFlowHedgesMember2022-12-310000849395ifrs-full:HedgesOfNetInvestmentInForeignOperationsMemberifrs-full:LaterThanOneYearAndNotLaterThanTwoYearsMember2022-12-310000849395crh:DerivativesNotDesignatedAsHedgesMemberifrs-full:LaterThanOneYearAndNotLaterThanTwoYearsMember2022-12-310000849395ifrs-full:FairValueHedgesMember2022-12-310000849395ifrs-full:CashFlowHedgesMember2022-12-310000849395crh:DerivativesNotDesignatedAsHedgesMember2022-12-310000849395ifrs-full:LaterThanTwoYearsAndNotLaterThanThreeYearsMemberifrs-full:FairValueHedgesMember2022-12-310000849395ifrs-full:LaterThanTwoYearsAndNotLaterThanThreeYearsMemberifrs-full:CashFlowHedgesMember2022-12-310000849395ifrs-full:LaterThanTwoYearsAndNotLaterThanThreeYearsMemberifrs-full:HedgesOfNetInvestmentInForeignOperationsMember2022-12-310000849395ifrs-full:LaterThanTwoYearsAndNotLaterThanThreeYearsMembercrh:DerivativesNotDesignatedAsHedgesMember2022-12-310000849395ifrs-full:FairValueHedgesMemberifrs-full:LaterThanFiveYearsMember2022-12-310000849395ifrs-full:LaterThanFiveYearsMemberifrs-full:CashFlowHedgesMember2022-12-310000849395ifrs-full:HedgesOfNetInvestmentInForeignOperationsMemberifrs-full:LaterThanFiveYearsMember2022-12-310000849395crh:DerivativesNotDesignatedAsHedgesMemberifrs-full:LaterThanFiveYearsMember2022-12-310000849395ifrs-full:NotLaterThanOneYearMemberifrs-full:FairValueHedgesMember2021-12-310000849395ifrs-full:NotLaterThanOneYearMemberifrs-full:CashFlowHedgesMember2021-12-310000849395ifrs-full:HedgesOfNetInvestmentInForeignOperationsMemberifrs-full:NotLaterThanOneYearMember2021-12-310000849395ifrs-full:NotLaterThanOneYearMembercrh:DerivativesNotDesignatedAsHedgesMember2021-12-310000849395ifrs-full:FairValueHedgesMemberifrs-full:LaterThanOneYearAndNotLaterThanTwoYearsMember2021-12-310000849395ifrs-full:LaterThanOneYearAndNotLaterThanTwoYearsMemberifrs-full:CashFlowHedgesMember2021-12-310000849395ifrs-full:HedgesOfNetInvestmentInForeignOperationsMemberifrs-full:LaterThanOneYearAndNotLaterThanTwoYearsMember2021-12-310000849395crh:DerivativesNotDesignatedAsHedgesMemberifrs-full:LaterThanOneYearAndNotLaterThanTwoYearsMember2021-12-310000849395ifrs-full:FairValueHedgesMemberifrs-full:LaterThanThreeYearsAndNotLaterThanFourYearsMember2021-12-310000849395ifrs-full:LaterThanThreeYearsAndNotLaterThanFourYearsMemberifrs-full:CashFlowHedgesMember2021-12-310000849395ifrs-full:HedgesOfNetInvestmentInForeignOperationsMemberifrs-full:LaterThanThreeYearsAndNotLaterThanFourYearsMember2021-12-310000849395crh:DerivativesNotDesignatedAsHedgesMemberifrs-full:LaterThanThreeYearsAndNotLaterThanFourYearsMember2021-12-310000849395ifrs-full:FairValueHedgesMemberifrs-full:LaterThanFiveYearsMember2021-12-310000849395ifrs-full:LaterThanFiveYearsMemberifrs-full:CashFlowHedgesMember2021-12-310000849395ifrs-full:HedgesOfNetInvestmentInForeignOperationsMemberifrs-full:LaterThanFiveYearsMember2021-12-310000849395crh:DerivativesNotDesignatedAsHedgesMemberifrs-full:LaterThanFiveYearsMember2021-12-310000849395ifrs-full:FairValueHedgesMember2021-12-310000849395ifrs-full:CashFlowHedgesMember2021-12-310000849395crh:DerivativesNotDesignatedAsHedgesMember2021-12-310000849395ifrs-full:Level1OfFairValueHierarchyMember2022-12-310000849395ifrs-full:Level1OfFairValueHierarchyMember2021-12-310000849395crh:CommodityForwardContractsMember2022-01-012022-12-310000849395crh:CommodityForwardContractsMember2021-01-012021-12-310000849395crh:CommodityForwardContractsMember2020-01-012020-12-310000849395crh:CurrencyForwardContractsMember2022-01-012022-12-310000849395crh:CurrencyForwardContractsMember2021-01-012021-12-310000849395crh:CurrencyForwardContractsMember2020-01-012020-12-310000849395ifrs-full:Level2OfFairValueHierarchyMemberifrs-full:InterestRateSwapContractMemberifrs-full:FairValueHedgesMember2022-12-310000849395ifrs-full:Level2OfFairValueHierarchyMemberifrs-full:InterestRateSwapContractMemberifrs-full:FairValueHedgesMember2021-12-310000849395ifrs-full:Level2OfFairValueHierarchyMemberifrs-full:CashFlowHedgesMembercrh:CurrencyAndCommoditySwapsMember2022-12-310000849395ifrs-full:Level2OfFairValueHierarchyMemberifrs-full:CashFlowHedgesMembercrh:CurrencyAndCommoditySwapsMember2021-12-310000849395ifrs-full:HedgesOfNetInvestmentInForeignOperationsMemberifrs-full:Level2OfFairValueHierarchyMemberifrs-full:CurrencySwapContractMember2022-12-310000849395ifrs-full:HedgesOfNetInvestmentInForeignOperationsMemberifrs-full:Level2OfFairValueHierarchyMemberifrs-full:CurrencySwapContractMember2021-12-310000849395ifrs-full:Level2OfFairValueHierarchyMembercrh:DerivativesNotDesignatedAsHedgesMemberifrs-full:CurrencySwapContractMember2022-12-310000849395ifrs-full:Level2OfFairValueHierarchyMembercrh:DerivativesNotDesignatedAsHedgesMemberifrs-full:CurrencySwapContractMember2021-12-310000849395ifrs-full:Level2OfFairValueHierarchyMember2022-12-310000849395ifrs-full:Level2OfFairValueHierarchyMember2021-12-310000849395crh:InsuranceProvisionMember2021-12-310000849395crh:InsuranceProvisionMember2022-01-012022-12-310000849395crh:InsuranceProvisionMember2022-12-310000849395crh:EnvironmentAndRemediationProvisionMember2021-12-310000849395crh:EnvironmentAndRemediationProvisionMember2022-01-012022-12-310000849395crh:EnvironmentAndRemediationProvisionMember2022-12-310000849395crh:RationalisationAndRedundancyProvisionMember2021-12-310000849395crh:RationalisationAndRedundancyProvisionMember2022-01-012022-12-310000849395crh:RationalisationAndRedundancyProvisionMember2022-12-310000849395crh:OtherProvisionMember2021-12-310000849395crh:OtherProvisionMember2022-01-012022-12-310000849395crh:OtherProvisionMember2022-12-310000849395crh:InsuranceProvisionMember2020-12-310000849395crh:InsuranceProvisionMember2021-01-012021-12-310000849395crh:EnvironmentAndRemediationProvisionMember2020-12-310000849395crh:EnvironmentAndRemediationProvisionMember2021-01-012021-12-310000849395crh:RationalisationAndRedundancyProvisionMember2020-12-310000849395crh:RationalisationAndRedundancyProvisionMember2021-01-012021-12-310000849395crh:OtherProvisionMember2020-12-310000849395crh:OtherProvisionMember2021-01-012021-12-310000849395crh:EnvironmentAndRemediationProvisionMembercrh:ConstructiveObligationsMember2022-01-012022-12-310000849395crh:EnvironmentAndRemediationProvisionMembercrh:ConstructiveObligationsMember2021-01-012021-12-310000849395ifrs-full:BottomOfRangeMembercrh:EnvironmentAndRemediationProvisionMember2022-01-012022-12-310000849395crh:EnvironmentAndRemediationProvisionMemberifrs-full:TopOfRangeMember2022-01-012022-12-310000849395crh:RationalisationAndRedundancyProvisionMember2020-01-012020-12-310000849395ifrs-full:BottomOfRangeMembercrh:RationalisationAndRedundancyProvisionMember2022-01-012022-12-310000849395crh:RationalisationAndRedundancyProvisionMemberifrs-full:TopOfRangeMember2022-01-012022-12-310000849395ifrs-full:BottomOfRangeMembercrh:RationalisationAndRedundancyProvisionMember2021-01-012021-12-310000849395crh:RationalisationAndRedundancyProvisionMemberifrs-full:TopOfRangeMember2021-01-012021-12-310000849395crh:LegalRelatedProvisionMemberifrs-full:BottomOfRangeMember2022-01-012022-12-310000849395crh:LegalRelatedProvisionMemberifrs-full:TopOfRangeMember2022-01-012022-12-310000849395crh:LegalRelatedProvisionMemberifrs-full:BottomOfRangeMember2021-01-012021-12-310000849395crh:LegalRelatedProvisionMemberifrs-full:TopOfRangeMember2021-01-012021-12-310000849395ifrs-full:LaterThanOneYearAndNotLaterThanFiveYearsMember2022-12-310000849395ifrs-full:LaterThanOneYearAndNotLaterThanFiveYearsMember2021-12-310000849395ifrs-full:LaterThanFiveYearsMember2022-12-310000849395ifrs-full:LaterThanFiveYearsMember2021-12-310000849395crh:UnfundedDefinedBenefitObligationMember2022-12-310000849395crh:UnfundedDefinedBenefitObligationMember2021-12-310000849395crh:EuroZoneMember2022-12-310000849395crh:EuroZoneMember2021-12-310000849395crh:EuroZoneMember2020-12-310000849395crh:UnitedStatesAndCanadaMember2022-12-310000849395crh:UnitedStatesAndCanadaMember2021-12-310000849395crh:UnitedStatesAndCanadaMember2020-12-310000849395country:CH2022-12-310000849395country:CH2021-12-310000849395country:CH2020-12-310000849395country:IEcrh:CurrentRetireesMaleMember2022-12-310000849395country:IEcrh:CurrentRetireesMaleMember2021-12-310000849395country:IEcrh:CurrentRetireesMaleMember2020-12-310000849395crh:UnitedStatesAndCanadaMembercrh:CurrentRetireesMaleMember2022-12-310000849395crh:UnitedStatesAndCanadaMembercrh:CurrentRetireesMaleMember2021-12-310000849395crh:UnitedStatesAndCanadaMembercrh:CurrentRetireesMaleMember2020-12-310000849395country:CHcrh:CurrentRetireesMaleMember2022-12-310000849395country:CHcrh:CurrentRetireesMaleMember2021-12-310000849395country:CHcrh:CurrentRetireesMaleMember2020-12-310000849395crh:CurrentRetireesFemaleMembercountry:IE2022-12-310000849395crh:CurrentRetireesFemaleMembercountry:IE2021-12-310000849395crh:CurrentRetireesFemaleMembercountry:IE2020-12-310000849395crh:CurrentRetireesFemaleMembercrh:UnitedStatesAndCanadaMember2022-12-310000849395crh:CurrentRetireesFemaleMembercrh:UnitedStatesAndCanadaMember2021-12-310000849395crh:CurrentRetireesFemaleMembercrh:UnitedStatesAndCanadaMember2020-12-310000849395country:CHcrh:CurrentRetireesFemaleMember2022-12-310000849395country:CHcrh:CurrentRetireesFemaleMember2021-12-310000849395country:CHcrh:CurrentRetireesFemaleMember2020-12-310000849395crh:FutureRetireesMaleMembercountry:IE2022-12-310000849395crh:FutureRetireesMaleMembercountry:IE2021-12-310000849395crh:FutureRetireesMaleMembercountry:IE2020-12-310000849395crh:FutureRetireesMaleMembercrh:UnitedStatesAndCanadaMember2022-12-310000849395crh:FutureRetireesMaleMembercrh:UnitedStatesAndCanadaMember2021-12-310000849395crh:FutureRetireesMaleMembercrh:UnitedStatesAndCanadaMember2020-12-310000849395crh:FutureRetireesMaleMembercountry:CH2022-12-310000849395crh:FutureRetireesMaleMembercountry:CH2021-12-310000849395crh:FutureRetireesMaleMembercountry:CH2020-12-310000849395crh:FutureRetireesFemaleMembercountry:IE2022-12-310000849395crh:FutureRetireesFemaleMembercountry:IE2021-12-310000849395crh:FutureRetireesFemaleMembercountry:IE2020-12-310000849395crh:FutureRetireesFemaleMembercrh:UnitedStatesAndCanadaMember2022-12-310000849395crh:FutureRetireesFemaleMembercrh:UnitedStatesAndCanadaMember2021-12-310000849395crh:FutureRetireesFemaleMembercrh:UnitedStatesAndCanadaMember2020-12-310000849395crh:FutureRetireesFemaleMembercountry:CH2022-12-310000849395crh:FutureRetireesFemaleMembercountry:CH2021-12-310000849395crh:FutureRetireesFemaleMembercountry:CH2020-12-310000849395crh:DefinedContributionPensionLiabilitiesMember2022-12-310000849395crh:DefinedContributionPensionLiabilitiesMember2021-12-310000849395crh:EuroZoneMember2022-01-012022-12-310000849395crh:EuroZoneMember2021-01-012021-12-310000849395crh:EuroZoneMember2020-01-012020-12-310000849395crh:UnitedStatesAndCanadaMember2022-01-012022-12-310000849395crh:UnitedStatesAndCanadaMember2021-01-012021-12-310000849395crh:UnitedStatesAndCanadaMember2020-01-012020-12-310000849395country:CH2022-01-012022-12-310000849395country:CH2021-01-012021-12-310000849395country:CH2020-01-012020-12-310000849395crh:OtherCountriesMember2022-01-012022-12-310000849395crh:OtherCountriesMember2021-01-012021-12-310000849395crh:OtherCountriesMember2020-01-012020-12-310000849395ifrs-full:PlanAssetsMember2021-12-310000849395ifrs-full:PlanAssetsMember2020-12-310000849395ifrs-full:PlanAssetsMember2022-01-012022-12-310000849395ifrs-full:PlanAssetsMember2021-01-012021-12-310000849395ifrs-full:PlanAssetsMember2022-12-310000849395ifrs-full:PlanAssetsMembercrh:EuroZoneMember2022-12-310000849395ifrs-full:PlanAssetsMembercrh:EuroZoneMember2021-12-310000849395ifrs-full:PlanAssetsMembercrh:UnitedStatesAndCanadaMember2022-12-310000849395ifrs-full:PlanAssetsMembercrh:UnitedStatesAndCanadaMember2021-12-310000849395ifrs-full:PlanAssetsMembercountry:CH2022-12-310000849395ifrs-full:PlanAssetsMembercountry:CH2021-12-310000849395ifrs-full:PlanAssetsMembercrh:OtherCountriesMember2022-12-310000849395ifrs-full:PlanAssetsMembercrh:OtherCountriesMember2021-12-310000849395ifrs-full:PresentValueOfDefinedBenefitObligationMember2021-12-310000849395ifrs-full:PresentValueOfDefinedBenefitObligationMember2020-12-310000849395ifrs-full:PresentValueOfDefinedBenefitObligationMember2022-01-012022-12-310000849395ifrs-full:PresentValueOfDefinedBenefitObligationMember2021-01-012021-12-310000849395ifrs-full:PresentValueOfDefinedBenefitObligationMember2022-12-310000849395crh:EuroZoneMemberifrs-full:PresentValueOfDefinedBenefitObligationMember2022-12-310000849395crh:EuroZoneMemberifrs-full:PresentValueOfDefinedBenefitObligationMember2021-12-310000849395crh:UnitedStatesAndCanadaMemberifrs-full:PresentValueOfDefinedBenefitObligationMember2022-12-310000849395crh:UnitedStatesAndCanadaMemberifrs-full:PresentValueOfDefinedBenefitObligationMember2021-12-310000849395country:CHifrs-full:PresentValueOfDefinedBenefitObligationMember2022-12-310000849395country:CHifrs-full:PresentValueOfDefinedBenefitObligationMember2021-12-310000849395crh:OtherCountriesMemberifrs-full:PresentValueOfDefinedBenefitObligationMember2022-12-310000849395crh:OtherCountriesMemberifrs-full:PresentValueOfDefinedBenefitObligationMember2021-12-310000849395crh:EuroZoneMembercrh:RetirementBenefitObligationsMember2022-12-310000849395crh:UnitedStatesAndCanadaMembercrh:RetirementBenefitObligationsMember2022-12-310000849395country:CHcrh:RetirementBenefitObligationsMember2022-12-310000849395crh:OtherCountriesMembercrh:RetirementBenefitObligationsMember2022-12-310000849395crh:RetirementBenefitObligationsMember2022-12-310000849395crh:ActuarialAssumptionOfDiscountRatesIncreaseByZeroPointTwoFivePercentageMembercrh:RetirementBenefitObligationsMember2022-12-310000849395crh:EuroZoneMembercrh:ActuarialAssumptionOfDiscountRatesIncreaseByZeroPointTwoFivePercentageMembercrh:RetirementBenefitObligationsMember2022-12-310000849395crh:UnitedStatesAndCanadaMembercrh:ActuarialAssumptionOfDiscountRatesIncreaseByZeroPointTwoFivePercentageMembercrh:RetirementBenefitObligationsMember2022-12-310000849395country:CHcrh:ActuarialAssumptionOfDiscountRatesIncreaseByZeroPointTwoFivePercentageMembercrh:RetirementBenefitObligationsMember2022-12-310000849395crh:OtherCountriesMembercrh:ActuarialAssumptionOfDiscountRatesIncreaseByZeroPointTwoFivePercentageMembercrh:RetirementBenefitObligationsMember2022-12-310000849395crh:ActuarialAssumptionOfDiscountRatesDecreaseByZeroPointTwoFivePercentageMembercrh:RetirementBenefitObligationsMember2022-12-310000849395crh:ActuarialAssumptionOfDiscountRatesDecreaseByZeroPointTwoFivePercentageMembercrh:EuroZoneMembercrh:RetirementBenefitObligationsMember2022-12-310000849395crh:ActuarialAssumptionOfDiscountRatesDecreaseByZeroPointTwoFivePercentageMembercrh:UnitedStatesAndCanadaMembercrh:RetirementBenefitObligationsMember2022-12-310000849395crh:ActuarialAssumptionOfDiscountRatesDecreaseByZeroPointTwoFivePercentageMembercountry:CHcrh:RetirementBenefitObligationsMember2022-12-310000849395crh:ActuarialAssumptionOfDiscountRatesDecreaseByZeroPointTwoFivePercentageMembercrh:OtherCountriesMembercrh:RetirementBenefitObligationsMember2022-12-310000849395crh:ActuarialAssumptionOfExpectedRatesOfInflationIncreaseByZeroPointTwoFivePercentageMembercrh:RetirementBenefitObligationsMember2022-12-310000849395crh:EuroZoneMembercrh:ActuarialAssumptionOfExpectedRatesOfInflationIncreaseByZeroPointTwoFivePercentageMembercrh:RetirementBenefitObligationsMember2022-12-310000849395crh:UnitedStatesAndCanadaMembercrh:ActuarialAssumptionOfExpectedRatesOfInflationIncreaseByZeroPointTwoFivePercentageMembercrh:RetirementBenefitObligationsMember2022-12-310000849395country:CHcrh:ActuarialAssumptionOfExpectedRatesOfInflationIncreaseByZeroPointTwoFivePercentageMembercrh:RetirementBenefitObligationsMember2022-12-310000849395crh:OtherCountriesMembercrh:ActuarialAssumptionOfExpectedRatesOfInflationIncreaseByZeroPointTwoFivePercentageMembercrh:RetirementBenefitObligationsMember2022-12-310000849395crh:ActuarialAssumptionOfExpectedRatesOfInflationDecreaseByZeroPointTwoFivePercentageMembercrh:RetirementBenefitObligationsMember2022-12-310000849395crh:EuroZoneMembercrh:ActuarialAssumptionOfExpectedRatesOfInflationDecreaseByZeroPointTwoFivePercentageMembercrh:RetirementBenefitObligationsMember2022-12-310000849395crh:UnitedStatesAndCanadaMembercrh:ActuarialAssumptionOfExpectedRatesOfInflationDecreaseByZeroPointTwoFivePercentageMembercrh:RetirementBenefitObligationsMember2022-12-310000849395country:CHcrh:ActuarialAssumptionOfExpectedRatesOfInflationDecreaseByZeroPointTwoFivePercentageMembercrh:RetirementBenefitObligationsMember2022-12-310000849395crh:OtherCountriesMembercrh:ActuarialAssumptionOfExpectedRatesOfInflationDecreaseByZeroPointTwoFivePercentageMembercrh:RetirementBenefitObligationsMember2022-12-310000849395crh:ActurialAssumptionOfMortalityRateIncreaseByOneYearMembercrh:RetirementBenefitObligationsMember2022-01-012022-12-310000849395crh:EuroZoneMembercrh:ActurialAssumptionOfMortalityRateIncreaseByOneYearMembercrh:RetirementBenefitObligationsMember2022-12-310000849395crh:UnitedStatesAndCanadaMembercrh:ActurialAssumptionOfMortalityRateIncreaseByOneYearMembercrh:RetirementBenefitObligationsMember2022-12-310000849395country:CHcrh:ActurialAssumptionOfMortalityRateIncreaseByOneYearMembercrh:RetirementBenefitObligationsMember2022-12-310000849395crh:OtherCountriesMembercrh:ActurialAssumptionOfMortalityRateIncreaseByOneYearMembercrh:RetirementBenefitObligationsMember2022-12-310000849395crh:ActurialAssumptionOfMortalityRateIncreaseByOneYearMembercrh:RetirementBenefitObligationsMember2022-12-310000849395crh:ActurialAssumptionOfMortalityRateDecreaseByOneYearMembercrh:RetirementBenefitObligationsMember2022-01-012022-12-310000849395crh:EuroZoneMembercrh:ActurialAssumptionOfMortalityRateDecreaseByOneYearMembercrh:RetirementBenefitObligationsMember2022-12-310000849395crh:UnitedStatesAndCanadaMembercrh:ActurialAssumptionOfMortalityRateDecreaseByOneYearMembercrh:RetirementBenefitObligationsMember2022-12-310000849395country:CHcrh:ActurialAssumptionOfMortalityRateDecreaseByOneYearMembercrh:RetirementBenefitObligationsMember2022-12-310000849395crh:OtherCountriesMembercrh:ActurialAssumptionOfMortalityRateDecreaseByOneYearMembercrh:RetirementBenefitObligationsMember2022-12-310000849395crh:ActurialAssumptionOfMortalityRateDecreaseByOneYearMembercrh:RetirementBenefitObligationsMember2022-12-310000849395ifrs-full:PlanAssetsMembercrh:EquityInstrumentsMembercrh:InvestmentsQuotedInActiveMarketsMember2022-12-310000849395ifrs-full:PlanAssetsMembercrh:EquityInstrumentsMembercrh:InvestmentsQuotedInActiveMarketsMember2021-12-310000849395ifrs-full:PlanAssetsMembercrh:DebtInstrumentsMembercrh:InvestmentsQuotedInActiveMarketsMember2022-12-310000849395ifrs-full:PlanAssetsMembercrh:DebtInstrumentsMembercrh:InvestmentsQuotedInActiveMarketsMember2021-12-310000849395ifrs-full:PlanAssetsMembercrh:PropertyMembercrh:InvestmentsQuotedInActiveMarketsMember2022-12-310000849395ifrs-full:PlanAssetsMembercrh:PropertyMembercrh:InvestmentsQuotedInActiveMarketsMember2021-12-310000849395ifrs-full:PlanAssetsMembercrh:CashAndCashEquivalents1Membercrh:InvestmentsQuotedInActiveMarketsMember2022-12-310000849395ifrs-full:PlanAssetsMembercrh:CashAndCashEquivalents1Membercrh:InvestmentsQuotedInActiveMarketsMember2021-12-310000849395ifrs-full:PlanAssetsMembercrh:InvestmentFundMembercrh:InvestmentsQuotedInActiveMarketsMember2022-12-310000849395ifrs-full:PlanAssetsMembercrh:InvestmentFundMembercrh:InvestmentsQuotedInActiveMarketsMember2021-12-310000849395crh:UnquotedInvestmentsMemberifrs-full:PlanAssetsMembercrh:EquityInstrumentsMember2022-12-310000849395crh:UnquotedInvestmentsMemberifrs-full:PlanAssetsMembercrh:EquityInstrumentsMember2021-12-310000849395crh:UnquotedInvestmentsMemberifrs-full:PlanAssetsMembercrh:DebtInstrumentsMember2022-12-310000849395crh:UnquotedInvestmentsMemberifrs-full:PlanAssetsMembercrh:DebtInstrumentsMember2021-12-310000849395crh:UnquotedInvestmentsMemberifrs-full:PlanAssetsMembercrh:PropertyMember2022-12-310000849395crh:UnquotedInvestmentsMemberifrs-full:PlanAssetsMembercrh:PropertyMember2021-12-310000849395crh:UnquotedInvestmentsMemberifrs-full:PlanAssetsMembercrh:CashAndCashEquivalents1Member2022-12-310000849395crh:UnquotedInvestmentsMemberifrs-full:PlanAssetsMembercrh:CashAndCashEquivalents1Member2021-12-310000849395crh:UnquotedInvestmentsMemberifrs-full:PlanAssetsMembercrh:AssetsHeldByInsuranceCompanyMember2022-12-310000849395crh:UnquotedInvestmentsMemberifrs-full:PlanAssetsMembercrh:AssetsHeldByInsuranceCompanyMember2021-12-310000849395crh:UnquotedInvestmentsMemberifrs-full:PlanAssetsMember2022-12-310000849395crh:UnquotedInvestmentsMemberifrs-full:PlanAssetsMember2021-12-310000849395crh:GovernmentDebtInstrumentsMembercrh:InvestmentsQuotedInActiveMarketsMember2022-12-310000849395crh:GovernmentDebtInstrumentsMembercrh:InvestmentsQuotedInActiveMarketsMember2021-12-310000849395crh:InvestmentsQuotedInActiveMarketsMembercrh:NonGovernmentDebtInstrumentsMember2022-12-310000849395crh:InvestmentsQuotedInActiveMarketsMembercrh:NonGovernmentDebtInstrumentsMember2021-12-310000849395ifrs-full:NotLaterThanOneYearMembercrh:ContractualPaymentsOnDiscountedBasisMember2022-12-310000849395ifrs-full:NotLaterThanOneYearMembercrh:ContractualPaymentsOnDiscountedBasisMember2021-12-310000849395ifrs-full:NotLaterThanOneYearMembercrh:ContractualPaymentsOnDiscountedBasisMember2020-12-310000849395crh:ContractualPaymentsOnDiscountedBasisMemberifrs-full:LaterThanOneYearAndNotLaterThanTwoYearsMember2022-12-310000849395crh:ContractualPaymentsOnDiscountedBasisMemberifrs-full:LaterThanOneYearAndNotLaterThanTwoYearsMember2021-12-310000849395crh:ContractualPaymentsOnDiscountedBasisMemberifrs-full:LaterThanOneYearAndNotLaterThanTwoYearsMember2020-12-310000849395ifrs-full:LaterThanTwoYearsAndNotLaterThanThreeYearsMembercrh:ContractualPaymentsOnDiscountedBasisMember2022-12-310000849395ifrs-full:LaterThanTwoYearsAndNotLaterThanThreeYearsMembercrh:ContractualPaymentsOnDiscountedBasisMember2021-12-310000849395ifrs-full:LaterThanTwoYearsAndNotLaterThanThreeYearsMembercrh:ContractualPaymentsOnDiscountedBasisMember2020-12-310000849395crh:ContractualPaymentsOnDiscountedBasisMemberifrs-full:LaterThanThreeYearsAndNotLaterThanFourYearsMember2022-12-310000849395crh:ContractualPaymentsOnDiscountedBasisMemberifrs-full:LaterThanThreeYearsAndNotLaterThanFourYearsMember2021-12-310000849395crh:ContractualPaymentsOnDiscountedBasisMemberifrs-full:LaterThanThreeYearsAndNotLaterThanFourYearsMember2020-12-310000849395ifrs-full:LaterThanFourYearsAndNotLaterThanFiveYearsMembercrh:ContractualPaymentsOnDiscountedBasisMember2022-12-310000849395ifrs-full:LaterThanFourYearsAndNotLaterThanFiveYearsMembercrh:ContractualPaymentsOnDiscountedBasisMember2021-12-310000849395ifrs-full:LaterThanFourYearsAndNotLaterThanFiveYearsMembercrh:ContractualPaymentsOnDiscountedBasisMember2020-12-310000849395crh:ContractualPaymentsOnDiscountedBasisMemberifrs-full:LaterThanFiveYearsMember2022-12-310000849395crh:ContractualPaymentsOnDiscountedBasisMemberifrs-full:LaterThanFiveYearsMember2021-12-310000849395crh:ContractualPaymentsOnDiscountedBasisMemberifrs-full:LaterThanFiveYearsMember2020-12-310000849395crh:ContractualPaymentsOnDiscountedBasisMember2022-12-310000849395crh:ContractualPaymentsOnDiscountedBasisMember2021-12-310000849395crh:ContractualPaymentsOnDiscountedBasisMember2020-12-310000849395ifrs-full:OrdinarySharesMember2022-12-310000849395ifrs-full:OrdinarySharesMember2021-12-310000849395crh:IncomeSharesMember2021-12-310000849395ifrs-full:OrdinarySharesMember2020-12-310000849395crh:IncomeSharesMember2020-12-310000849395crh:IncomeSharesMember2021-01-012021-12-310000849395ifrs-full:OrdinarySharesMember2022-01-012022-12-310000849395ifrs-full:OrdinarySharesMember2021-01-012021-12-310000849395ifrs-full:OrdinarySharesMembercrh:CancellationOfIncomeSharesMember2022-01-012022-12-310000849395ifrs-full:OrdinarySharesMembercrh:CancellationOfIncomeSharesMember2021-01-012021-12-310000849395ifrs-full:OrdinarySharesMemberifrs-full:TopOfRangeMember2022-01-012022-12-31crh:Options0000849395crh:FivePercentageCumulativePreferenceSharesMember2022-12-310000849395crh:SevenPercentageACumulativePreferenceSharesMember2022-12-310000849395crh:FivePercentageCumulativePreferenceSharesMember2021-12-310000849395crh:SevenPercentageACumulativePreferenceSharesMember2021-12-310000849395crh:ShareRepurchaseProgrammeMember2022-01-012022-12-310000849395crh:ShareRepurchaseProgrammeMemberifrs-full:TreasurySharesMember2022-01-012022-12-310000849395crh:ShareRepurchaseProgrammeMemberifrs-full:TreasurySharesMember2021-01-012021-12-310000849395exch:BANAcrh:ShareRepurchaseProgrammeMemberifrs-full:TreasurySharesMember2022-12-310000849395exch:BANAcrh:ShareRepurchaseProgrammeMemberifrs-full:TreasurySharesMember2021-12-310000849395crh:ShareRepurchaseProgrammeMemberifrs-full:TreasurySharesMember2022-12-310000849395crh:ShareRepurchaseProgrammeMemberifrs-full:TreasurySharesMember2021-12-310000849395crh:ShareBuybackProgrammeMembercrh:ShareRepurchaseProgrammeMember2023-01-012023-03-100000849395crh:ShareBuybackProgrammeMember2023-01-012023-03-100000849395crh:CertainAssetsOfUSSteelKosiceSroMember2022-12-310000849395crh:GranbySandGravelMember2022-12-310000849395crh:CertainAssetsOfKudzue3TruckingIncMember2022-12-310000849395crh:CertainAssetsOfLibetCompanyMember2022-12-310000849395crh:CertainAssetsOfCOLASSlovakiaAsMember2022-12-310000849395crh:RSSocketsLtdMember2022-12-310000849395crh:ChapmanConstructionMember2022-12-310000849395crh:CertainAssetsOfRinkerMaterialsMember2022-12-310000849395crh:CalstoneCompanyMember2022-12-310000849395crh:SoilMenderProductsMember2022-12-310000849395crh:JeffersonAsphaltProductsCompanyMember2022-12-310000849395crh:GunderupMember2022-12-310000849395crh:HinkleContractingLLCMember2022-12-310000849395crh:InwescoIncMember2022-12-310000849395crh:BarretteOutdoorLivingIncMember2022-12-310000849395crh:KrystalGravelIncMember2022-12-310000849395crh:SimbetonSRLMember2022-12-310000849395crh:CertainAssetsOfSUTICIMAndIrcaSRLMember2022-12-310000849395crh:TerrawiseOyStoneAggregatesMember2022-12-310000849395crh:ThermostoneMember2022-12-310000849395crh:NorthAlabamaPavingIncMember2022-12-310000849395crh:MooreBrothersConstructionCompanyMember2022-12-310000849395crh:NormandyIndustriesIncMember2022-12-310000849395crh:LDConstructionCompanyAndPTSSInvestmentsLLCMember2022-12-310000849395crh:SterlingSandLLCMember2022-12-310000849395crh:ConfacHoldingsASMember2022-12-310000849395crh:GrantCountyMulchIncMember2022-12-310000849395crh:MarionCountyPavingMember2022-12-310000849395crh:MabauGroupMember2022-12-310000849395crh:BarretteMember2022-12-310000849395ifrs-full:AggregatedIndividuallyImmaterialBusinessCombinationsMember2022-12-310000849395ifrs-full:BusinessCombinationsMember2022-12-310000849395ifrs-full:BusinessCombinationsMember2021-12-310000849395ifrs-full:BusinessCombinationsMember2020-12-310000849395crh:BarretteMember2022-01-012022-12-310000849395ifrs-full:AggregatedIndividuallyImmaterialBusinessCombinationsMember2022-01-012022-12-310000849395ifrs-full:BusinessCombinationsMember2022-01-012022-12-310000849395ifrs-full:BusinessCombinationsMember2021-01-012021-12-310000849395ifrs-full:BusinessCombinationsMember2020-01-012020-12-310000849395crh:BarretteMember2021-12-310000849395crh:BarretteMember2020-12-310000849395ifrs-full:AggregatedIndividuallyImmaterialBusinessCombinationsMember2021-12-310000849395ifrs-full:AggregatedIndividuallyImmaterialBusinessCombinationsMember2020-12-310000849395crh:OperatingCostMembercrh:BarretteMember2022-01-012022-12-310000849395crh:OperatingCostMembercrh:BarretteMember2021-01-012021-12-310000849395crh:OperatingCostMembercrh:BarretteMember2020-01-012020-12-310000849395ifrs-full:AggregatedIndividuallyImmaterialBusinessCombinationsMembercrh:OperatingCostMember2022-01-012022-12-310000849395ifrs-full:AggregatedIndividuallyImmaterialBusinessCombinationsMembercrh:OperatingCostMember2021-01-012021-12-310000849395ifrs-full:AggregatedIndividuallyImmaterialBusinessCombinationsMembercrh:OperatingCostMember2020-01-012020-12-310000849395crh:OperatingCostMember2022-01-012022-12-310000849395crh:OperatingCostMember2021-01-012021-12-310000849395crh:OperatingCostMember2020-01-012020-12-31crh:Acquisition0000849395crh:BeforeAdjustmentsToProvisionalFairValuesOfPriorYearAcquisitionsMemberifrs-full:BusinessCombinationsMembercrh:AmericasMaterialsMember2022-01-012022-12-310000849395crh:BeforeAdjustmentsToProvisionalFairValuesOfPriorYearAcquisitionsMemberifrs-full:BusinessCombinationsMembercrh:AmericasMaterialsMember2021-01-012021-12-310000849395crh:BeforeAdjustmentsToProvisionalFairValuesOfPriorYearAcquisitionsMemberifrs-full:BusinessCombinationsMembercrh:AmericasMaterialsMember2020-01-012020-12-310000849395crh:BeforeAdjustmentsToProvisionalFairValuesOfPriorYearAcquisitionsMemberifrs-full:BusinessCombinationsMembercrh:AmericasMaterialsMember2022-12-310000849395crh:BeforeAdjustmentsToProvisionalFairValuesOfPriorYearAcquisitionsMemberifrs-full:BusinessCombinationsMembercrh:AmericasMaterialsMember2021-12-310000849395crh:BeforeAdjustmentsToProvisionalFairValuesOfPriorYearAcquisitionsMemberifrs-full:BusinessCombinationsMembercrh:AmericasMaterialsMember2020-12-310000849395crh:BeforeAdjustmentsToProvisionalFairValuesOfPriorYearAcquisitionsMembercrh:BuildingProductsMemberifrs-full:BusinessCombinationsMember2022-01-012022-12-310000849395crh:BeforeAdjustmentsToProvisionalFairValuesOfPriorYearAcquisitionsMembercrh:BuildingProductsMemberifrs-full:BusinessCombinationsMember2021-01-012021-12-310000849395crh:BeforeAdjustmentsToProvisionalFairValuesOfPriorYearAcquisitionsMembercrh:BuildingProductsMemberifrs-full:BusinessCombinationsMember2020-01-012020-12-310000849395crh:BeforeAdjustmentsToProvisionalFairValuesOfPriorYearAcquisitionsMembercrh:BuildingProductsMemberifrs-full:BusinessCombinationsMember2022-12-310000849395crh:BeforeAdjustmentsToProvisionalFairValuesOfPriorYearAcquisitionsMembercrh:BuildingProductsMemberifrs-full:BusinessCombinationsMember2021-12-310000849395crh:BeforeAdjustmentsToProvisionalFairValuesOfPriorYearAcquisitionsMembercrh:BuildingProductsMemberifrs-full:BusinessCombinationsMember2020-12-310000849395crh:EuropeMaterialsMembercrh:BeforeAdjustmentsToProvisionalFairValuesOfPriorYearAcquisitionsMemberifrs-full:BusinessCombinationsMember2022-01-012022-12-310000849395crh:EuropeMaterialsMembercrh:BeforeAdjustmentsToProvisionalFairValuesOfPriorYearAcquisitionsMemberifrs-full:BusinessCombinationsMember2021-01-012021-12-310000849395crh:EuropeMaterialsMembercrh:BeforeAdjustmentsToProvisionalFairValuesOfPriorYearAcquisitionsMemberifrs-full:BusinessCombinationsMember2020-01-012020-12-310000849395crh:EuropeMaterialsMembercrh:BeforeAdjustmentsToProvisionalFairValuesOfPriorYearAcquisitionsMemberifrs-full:BusinessCombinationsMember2022-12-310000849395crh:EuropeMaterialsMembercrh:BeforeAdjustmentsToProvisionalFairValuesOfPriorYearAcquisitionsMemberifrs-full:BusinessCombinationsMember2021-12-310000849395crh:EuropeMaterialsMembercrh:BeforeAdjustmentsToProvisionalFairValuesOfPriorYearAcquisitionsMemberifrs-full:BusinessCombinationsMember2020-12-310000849395crh:BeforeAdjustmentsToProvisionalFairValuesOfPriorYearAcquisitionsMemberifrs-full:BusinessCombinationsMember2022-01-012022-12-310000849395crh:BeforeAdjustmentsToProvisionalFairValuesOfPriorYearAcquisitionsMemberifrs-full:BusinessCombinationsMember2021-01-012021-12-310000849395crh:BeforeAdjustmentsToProvisionalFairValuesOfPriorYearAcquisitionsMemberifrs-full:BusinessCombinationsMember2020-01-012020-12-310000849395crh:BeforeAdjustmentsToProvisionalFairValuesOfPriorYearAcquisitionsMemberifrs-full:BusinessCombinationsMember2022-12-310000849395crh:BeforeAdjustmentsToProvisionalFairValuesOfPriorYearAcquisitionsMemberifrs-full:BusinessCombinationsMember2021-12-310000849395crh:BeforeAdjustmentsToProvisionalFairValuesOfPriorYearAcquisitionsMemberifrs-full:BusinessCombinationsMember2020-12-310000849395crh:BeforeAdjustmentsToProvisionalFairValuesOfPriorYearAcquisitionsMembercrh:BuildingProductsMemberifrs-full:BusinessCombinationsMemberifrs-full:DiscontinuedOperationsMember2022-01-012022-12-310000849395crh:BeforeAdjustmentsToProvisionalFairValuesOfPriorYearAcquisitionsMembercrh:BuildingProductsMemberifrs-full:BusinessCombinationsMemberifrs-full:DiscontinuedOperationsMember2021-01-012021-12-310000849395crh:BeforeAdjustmentsToProvisionalFairValuesOfPriorYearAcquisitionsMembercrh:BuildingProductsMemberifrs-full:BusinessCombinationsMemberifrs-full:DiscontinuedOperationsMember2020-01-012020-12-310000849395crh:BeforeAdjustmentsToProvisionalFairValuesOfPriorYearAcquisitionsMembercrh:BuildingProductsMemberifrs-full:BusinessCombinationsMemberifrs-full:DiscontinuedOperationsMember2022-12-310000849395crh:BeforeAdjustmentsToProvisionalFairValuesOfPriorYearAcquisitionsMembercrh:BuildingProductsMemberifrs-full:BusinessCombinationsMemberifrs-full:DiscontinuedOperationsMember2021-12-310000849395crh:BeforeAdjustmentsToProvisionalFairValuesOfPriorYearAcquisitionsMembercrh:BuildingProductsMemberifrs-full:BusinessCombinationsMemberifrs-full:DiscontinuedOperationsMember2020-12-310000849395crh:BeforeAdjustmentsToProvisionalFairValuesOfPriorYearAcquisitionsMemberifrs-full:AggregateContinuingAndDiscontinuedOperationsMemberifrs-full:BusinessCombinationsMember2022-12-310000849395crh:BeforeAdjustmentsToProvisionalFairValuesOfPriorYearAcquisitionsMemberifrs-full:AggregateContinuingAndDiscontinuedOperationsMemberifrs-full:BusinessCombinationsMember2021-12-310000849395crh:BeforeAdjustmentsToProvisionalFairValuesOfPriorYearAcquisitionsMemberifrs-full:AggregateContinuingAndDiscontinuedOperationsMemberifrs-full:BusinessCombinationsMember2020-12-310000849395crh:AdjustmentsToProvisionalPriorYearAcquisitionsMemberifrs-full:BusinessCombinationsMember2022-12-310000849395crh:AdjustmentsToProvisionalPriorYearAcquisitionsMemberifrs-full:BusinessCombinationsMember2021-12-310000849395crh:AdjustmentsToProvisionalPriorYearAcquisitionsMemberifrs-full:BusinessCombinationsMember2020-12-310000849395crh:PostAcquisitionImpactMembercrh:BarretteMember2022-01-012022-12-310000849395ifrs-full:AggregatedIndividuallyImmaterialBusinessCombinationsMembercrh:PostAcquisitionImpactMember2022-01-012022-12-310000849395crh:PostAcquisitionImpactMember2022-01-012022-12-310000849395crh:PostAcquisitionImpactMember2021-01-012021-12-310000849395crh:PostAcquisitionImpactMember2020-01-012020-12-310000849395crh:AcquisitionsMember2022-01-012022-12-310000849395crh:CrhGroupExcludingAcquisitionsMember2022-01-012022-12-310000849395crh:ConsolidatedGroupIncludingAcquisitionsMember2022-01-012022-12-310000849395crh:RepublicCementAndBuildingMaterialsIncAndRepublicCementLandAndResourcesFormerlyLuzonContinentalLandCorporationMember2022-12-310000849395crh:RepublicCementAndBuildingMaterialsIncAndRepublicCementLandAndResourcesFormerlyLuzonContinentalLandCorporationMember2021-12-310000849395crh:RepublicCementAndBuildingMaterialsIncAndRepublicCementLandAndResourcesFormerlyLuzonContinentalLandCorporationMember2022-01-012022-12-310000849395crh:RepublicCementAndBuildingMaterialsIncAndLuzonContinentalLandCorporationMember2022-01-012022-12-310000849395crh:RepublicCementAndBuildingMaterialsIncAndLuzonContinentalLandCorporationMember2021-01-012021-12-310000849395crh:RepublicCementAndBuildingMaterialsIncAndLuzonContinentalLandCorporationMember2022-12-310000849395crh:RepublicCementAndBuildingMaterialsIncAndLuzonContinentalLandCorporationMember2021-12-310000849395crh:CombinedPhilippinesBusinessMember2022-01-012022-12-310000849395crh:CombinedPhilippinesBusinessMember2021-01-012021-12-310000849395ifrs-full:JointVenturesWhereEntityIsVenturerMember2022-01-012022-12-310000849395ifrs-full:JointVenturesWhereEntityIsVenturerMember2021-01-012021-12-310000849395ifrs-full:JointVenturesWhereEntityIsVenturerMember2020-01-012020-12-310000849395ifrs-full:AssociatesMember2022-01-012022-12-310000849395ifrs-full:AssociatesMember2021-01-012021-12-310000849395ifrs-full:AssociatesMember2020-01-012020-12-31
UNITED STATES
SECURITIES AND EXCHANGE COMMISSION
(Mark One) WASHINGTON, D.C. 20549
FORM 20-F
☐ REGISTRATION STATEMENT PURSUANT TO SECTION 12(b) OR (g) OF THE SECURITIES EXCHANGE ACT OF 1934
OR
X ANNUAL REPORT PURSUANT TO SECTION 13 OR 15(d) OF THE SECURITIES EXCHANGE ACT OF 1934
For the fiscal year ended: December 31, 2022
OR
☐ TRANSITION REPORT PURSUANT TO SECTION 13 OR 15(d) OF THE SECURITIES EXCHANGE ACT OF 1934
For the transition period from to
OR
☐ SHELL COMPANY REPORT PURSUANT TO SECTION 13 OR 15(d) OF THE SECURITIES EXCHANGE ACT OF 1934
Date of event requiring this shell company report
Commission file number: 001-32846
CRH public limited company
(Exact name of Registrant as specified in its charter)
Republic of Ireland
(Jurisdiction of incorporation or organisation)
Stonemason’s Way, Rathfarnham, Dublin 16, Ireland
(Address of principal executive offices)
Jim Mintern
Tel: +353 1 404 1000
mail@crh.com
Stonemason’s Way, Rathfarnham, Dublin 16, Ireland
(Name, Telephone, Email and/or Facsimile number and Address of Company Contact Person)
Securities registered or to be registered pursuant to Section 12(b) of the Act.
| | |
| Title of each class |
| CRH plc |
Ordinary Shares of €0.32 each |
| American Depositary Shares, each representing the right to receive one Ordinary Share |
| | |
| Name of each exchange on which registered |
|
New York Stock Exchange* |
New York Stock Exchange* |
*Not for trading but only in connection with the registration of American Depositary Shares, pursuant to the requirements of the Securities and Exchange Commission.
Securities registered or to be registered pursuant to Section 12(g) of the Act. None
Securities for which there is a reporting obligation pursuant to Section 15(d) of the Act. None
Indicate the number of outstanding shares of each of the issuer’s classes of capital or common stock as of the close of the period covered by the annual report.
| | | | | |
| Ordinary Shares of €0.32 each | 752,140,338 |
| 5% Cumulative Preference Shares of €1.27 each | 50,000 |
| 7% ‘A’ Cumulative Preference Shares of €1.27 each | 872,000 |
–
Indicate by check mark if the registrant is a well-known seasoned issuer, as defined in Rule 405 of the Securities Act. Yes X No ☐
If this report is an annual or transition report, indicate by check mark if the registrant is not required to file reports pursuant to Section 13 or 15(d) of the Securities Exchange Act of 1934.
Yes ☐ No X
Note – Checking the box above will not relieve any registrant required to file reports pursuant to Section 13 or 15(d) of the Securities Exchange Act of 1934 from their obligations under those Sections.
Indicate by check mark whether the registrant (1) has filed all reports required to be filed by Section 13 or 15(d) of the Securities Exchange Act of 1934 during the preceding 12 months (or for such shorter period that the registrant was required to file such reports), and (2) has been subject to such filing requirements for the past 90 days. Yes X No ☐
Indicate by check mark whether the registrant has submitted electronically every Interactive Data File required to be submitted pursuant to Rule 405 of Regulation S-T (§232.405 of this chapter) during the preceding 12 months (or for such shorter period that the registrant was required to submit such files). Yes X No ☐
Indicate by check mark whether the registrant is a large accelerated filer, an accelerated filer, a non-accelerated filer, or an emerging growth company. See definition of “large accelerated filer”, “accelerated filer”, and “emerging growth company” in Rule 12b-2 of the Exchange Act.
Large accelerated filer X Accelerated filer ☐ Non-accelerated filer ☐ Emerging Growth Company ☐
If an emerging growth company that prepares its financial statements in accordance with U.S. GAAP, indicate by check mark if the registrant has elected not to use the extended transition period for complying with any new or revised financial accounting standards† provided pursuant to Section 13(a) of the Exchange Act ☐
†The term “new or revised financial accounting standard” refers to any update issued by the Financial Accounting Standards Board to its Accounting Standards Codification after April 5, 2012.
Indicate by check mark whether the registrant has filed a report on and attestation to its management’s assessment of the effectiveness of its internal control over financial reporting under Section 404(b) of the Sarbanes-Oxley Act (15 U.S.C. 7262(b)) by the registered public accounting firm that prepared or issued its audit report. X
If securities are registered pursuant to Section 12(b) of the Act, indicate by check mark whether the financial statements of the registrant included in the filing reflect the correction of an error to previously issued financial statements. ☐
Indicate by check mark whether any of those error corrections are restatements that required a recovery analysis of incentive-based compensation received by any of the registrant’s executive officers during the relevant recovery period pursuant to §240.10D-1(b). ☐
Indicate by check mark which basis of accounting the registrant has used to prepare the financial statements included in this filing:
U.S. GAAP ☐ International Financial Reporting Standards as issued by the Other ☐
International Accounting Standards Board X
If “Other” has been checked in response to the previous question, indicate by check mark which financial statement item the registrant has elected to follow. Item 17 ☐ Item 18 ☐
If this is an annual report, indicate by check mark whether the registrant is a shell company (as defined in Rule 12b-2 of the Exchange Act). Yes ☐ No X
[THIS PAGE INTENTIONALLY LEFT BLANK]
2022 Annual Report and Form 20-F

We stand together to reinvent the way our world is built www.crh.com/investors/annual-reports/ Overview CRH at a Glance 2 Why Invest in CRH 4 Our Purpose 6 Chairman's Introduction 8 Strategy Report Our Strategic Framework 12 Chief Executive's Review 14 Market Backdrop 16 Business Model 20 Strategy in Action 22 Solutions for a Sustainable Future 24 - Decarbonisation 26 - Waste 32 - Water 34 - Natural World 36 - People & Communities 38 - Responsible Business 46 Risk Management 50 TCFD Executive Summary 56 Business Performance and Segmental Reviews Chief Financial Officer's Review 62 Americas Materials 68 Building Products 72 Europe Materials 76 Governance Board of Directors 82 Global Leadership Team 86 Governance Framework 87 Corporate Governance Report 88 Audit Committee Report 92 Nomination & Corporate Governance Committee Report 98 Safety, Environment & Social Responsibility Committee Report 104 Directors' Remuneration Report 108 Directors' Report 134 Principal Risks and Uncertainties (Risk Factors) 139 150 172 176 181 191 255 277 289 297 Focus on Climate Risks and Opportunities Financial Statements Independent Auditors' Reports Consolidated Financial Statements Accounting Policies Notes on Consolidated Financial Statements Supplemental 20-F and Other Disclosures Shareholder Information Other Information Cross Reference to Form 20-F Index 298 This document constitutes the Annual Report and Financial Statements in accordance with Irish and UK requirements and the Annual Report on Form 20-F in accordance with the US Securities Exchange Act of 1934, for CRH plc for the year ended 31 December 2022. A cross reference to Form 20-F requirements is included on page 297. The Directors’ Statements (comprising the Statement of Directors’ Responsibilities, the Viability Statement and the Directors’ Compliance Statement on pages 136 to 138), certain sections of the Principal Risks and Uncertainties (on pages 139 to 148), certain sections of the Climate Risks and Opportunities (on pages 151 to 153), the Independent Auditors’ Reports (on pages 160 to 171), the Parent Company financial statements of CRH plc (on pages 248 to 252) and EU Taxonomy (on pages 270 to 273) do not form part of CRH’s Annual Report disclosures on Form 20-F as filed with the Securities and Exchange Commission (SEC). Forward-Looking Statements This document contains forward-looking statements, which by their nature involve risk and uncertainty. Please see Disclaimer/Forward-Looking Statements on page 135 for more information about these statements and certain factors that may cause them to prove inaccurate.
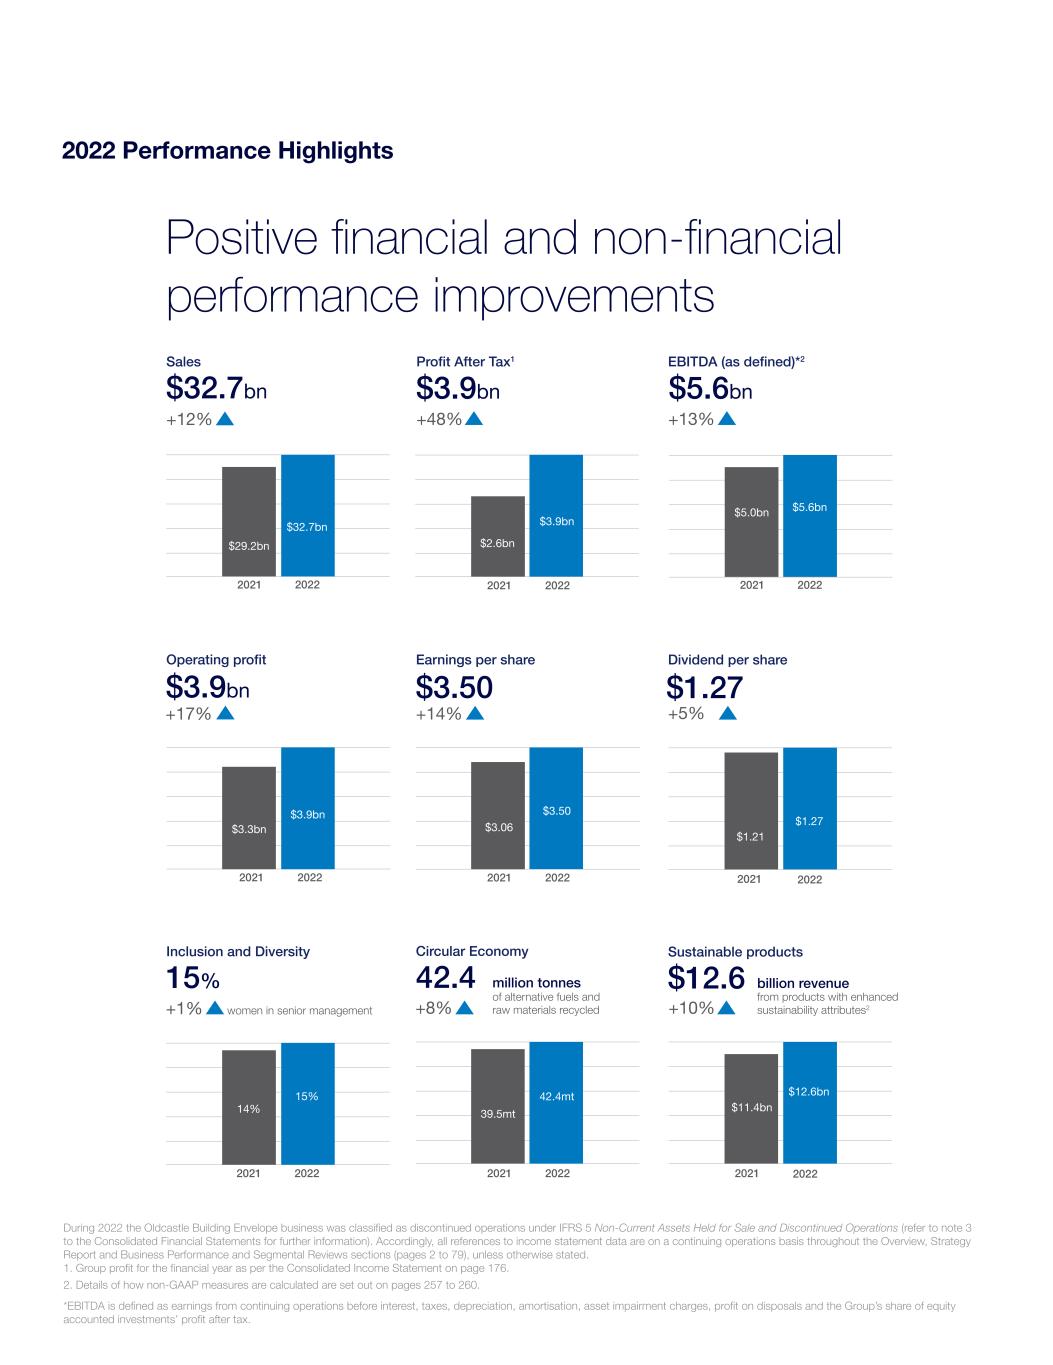
During 2022 the Oldcastle Building Envelope business was classified as discontinued operations under IFRS 5 Non-Current Assets Held for Sale and Discontinued Operations (refer to note 3 to the Consolidated Financial Statements for further information). Accordingly, all references to income statement data are on a continuing operations basis throughout the Overview, Strategy Report and Business Performance and Segmental Reviews sections (pages 2 to 79), unless otherwise stated. 1. Group profit for the financial year as per the Consolidated Income Statement on page 176. 2. Details of how non-GAAP measures are calculated are set out on pages 257 to 260. *EBITDA is defined as earnings from continuing operations before interest, taxes, depreciation, amortisation, asset impairment charges, profit on disposals and the Group’s share of equity accounted investments’ profit after tax. 2022 2022 Performance Highlights Positive financial and non-financial performance improvements Sales $32.7bn +12% $29.2bn 2021 2022 $32.7bn EBITDA (as defined)*2 $5.6bn +13% $5.0bn 2021 $5.6bn 2022 Operating profit $3.9bn +17% $3.3bn 2021 $3.9bn 2022 Profit After Tax1 $3.9bn +48% $2.6bn 2021 $3.9bn 2022 Earnings per share $3.50 $3.06 2021 $3.50 2022 +14% Dividend per share $1.27 +5% $1.21 2021 $1.27 2022 Inclusion and Diversity 15% +1% women in senior management 14% 15% 2021 2022 Circular Economy 42.4 +8% million tonnes of alternative fuels and raw materials recycled 39.5mt 42.4mt 2021 2022 Sustainable products $12.6 billion revenue from products with enhanced sustainability attributes2+10% 2021 $11.4bn $12.6bn

2022 Annual Report and Form 20-F2 CRH at a Glance The leading building materials business in the world CRH is the leading provider of building materials solutions that build, connect and improve our world. We help to make constructing the built environment easier, safer and more sustainable. We are the essential partner for transport and critical utility infrastructure projects, commercial real estate development and home construction. By combining our materials, products and services, including recycled end-of-life materials, into integrated solutions which can be delivered more efficiently and sustainably, CRH is uniquely positioned to meet the changing needs of its customers, address the evolving trends in global construction markets and contribute to a more sustainable built environment. What we do Build Sustainable and resilient communities through structures that provide protection, shelter, warmth and safety as well as enabling transport and commerce. Materials, products and services We manufacture and supply a range of materials, products and services that are used extensively in a wide range of construction applications. Integrated building solutions We combine and connect materials, products and services to provide customers with complete end-to-end building solutions. Connect People and locations through infrastructure that moves people, property, information, energy and water. Improve A built environment that is stronger, more durable, more efficient, more economical and more effective. • Aggregates • Cement & Lime • Asphalt • Paving & Construction • Architectural Products • Infrastructure Products • Construction Accessories • Road and Transport Infrastructure Solutions • Water Infrastructure Solutions • Urban Construction Solutions • Renewable Energy Infrastructure • Utilities and Communications Infrastructure
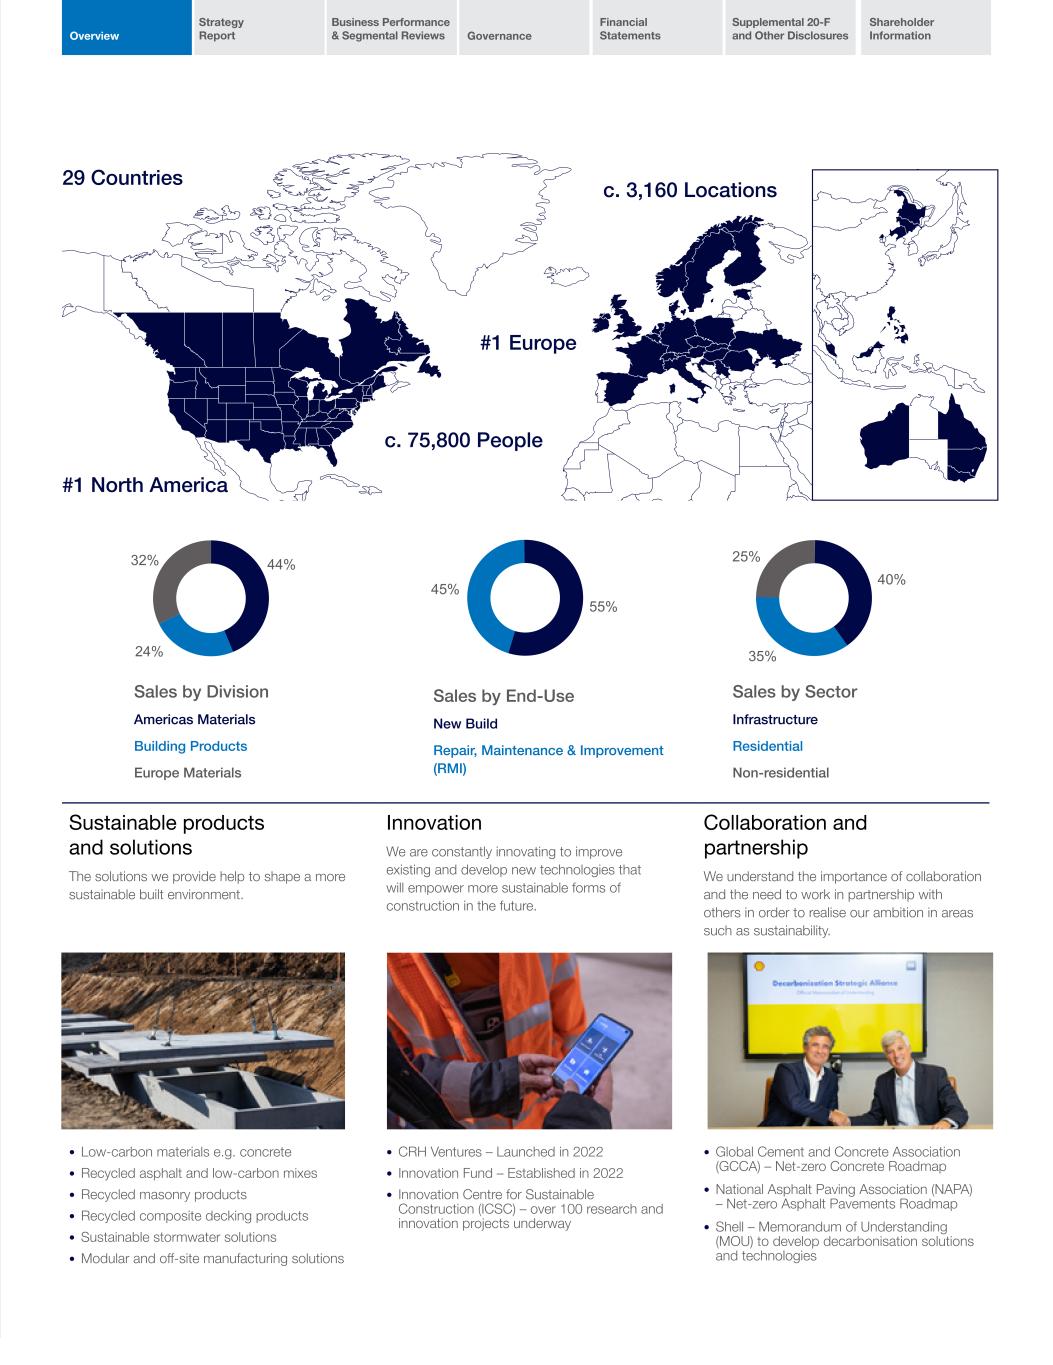
Overview Strategy Report Business Performance & Segmental Reviews Governance Financial Statements Supplemental 20-F and Other Disclosures Shareholder Information 44% 24% 32% 45% 55% 35% 25% 40% What we do Build Sustainable and resilient communities through structures that provide protection, shelter, warmth and safety as well as enabling transport and commerce. Materials, products and services We manufacture and supply a range of materials, products and services that are used extensively in a wide range of construction applications. Integrated building solutions We combine and connect materials, products and services to provide customers with complete end-to-end building solutions. Improve A built environment that is stronger, more durable, more efficient, more economical and more effective. • Aggregates • Cement & Lime • Asphalt • Paving & Construction • Architectural Products • Infrastructure Products • Construction Accessories • Road and Transport Infrastructure Solutions • Water Infrastructure Solutions • Urban Construction Solutions • Renewable Energy Infrastructure • Utilities and Communications Infrastructure 29 Countries c. 3,160 Locations c. 75,800 People #1 North America #1 Europe Sales by Division Americas Materials Building Products Europe Materials Sales by End-Use New Build Repair, Maintenance & Improvement (RMI) Sales by Sector Infrastructure Residential Non-residential Sustainable products and solutions The solutions we provide help to shape a more sustainable built environment. Innovation We are constantly innovating to improve existing and develop new technologies that will empower more sustainable forms of construction in the future. Collaboration and partnership We understand the importance of collaboration and the need to work in partnership with others in order to realise our ambition in areas such as sustainability. • Low-carbon materials e.g. concrete • Recycled asphalt and low-carbon mixes • Recycled masonry products • Recycled composite decking products • Sustainable stormwater solutions • Modular and off-site manufacturing solutions • CRH Ventures – Launched in 2022 • Innovation Fund – Established in 2022 • Innovation Centre for Sustainable Construction (ICSC) – over 100 research and innovation projects underway • Global Cement and Concrete Association (GCCA) – Net-zero Concrete Roadmap • National Asphalt Paving Association (NAPA) – Net-zero Asphalt Pavements Roadmap • Shell – Memorandum of Understanding (MOU) to develop decarbonisation solutions and technologies
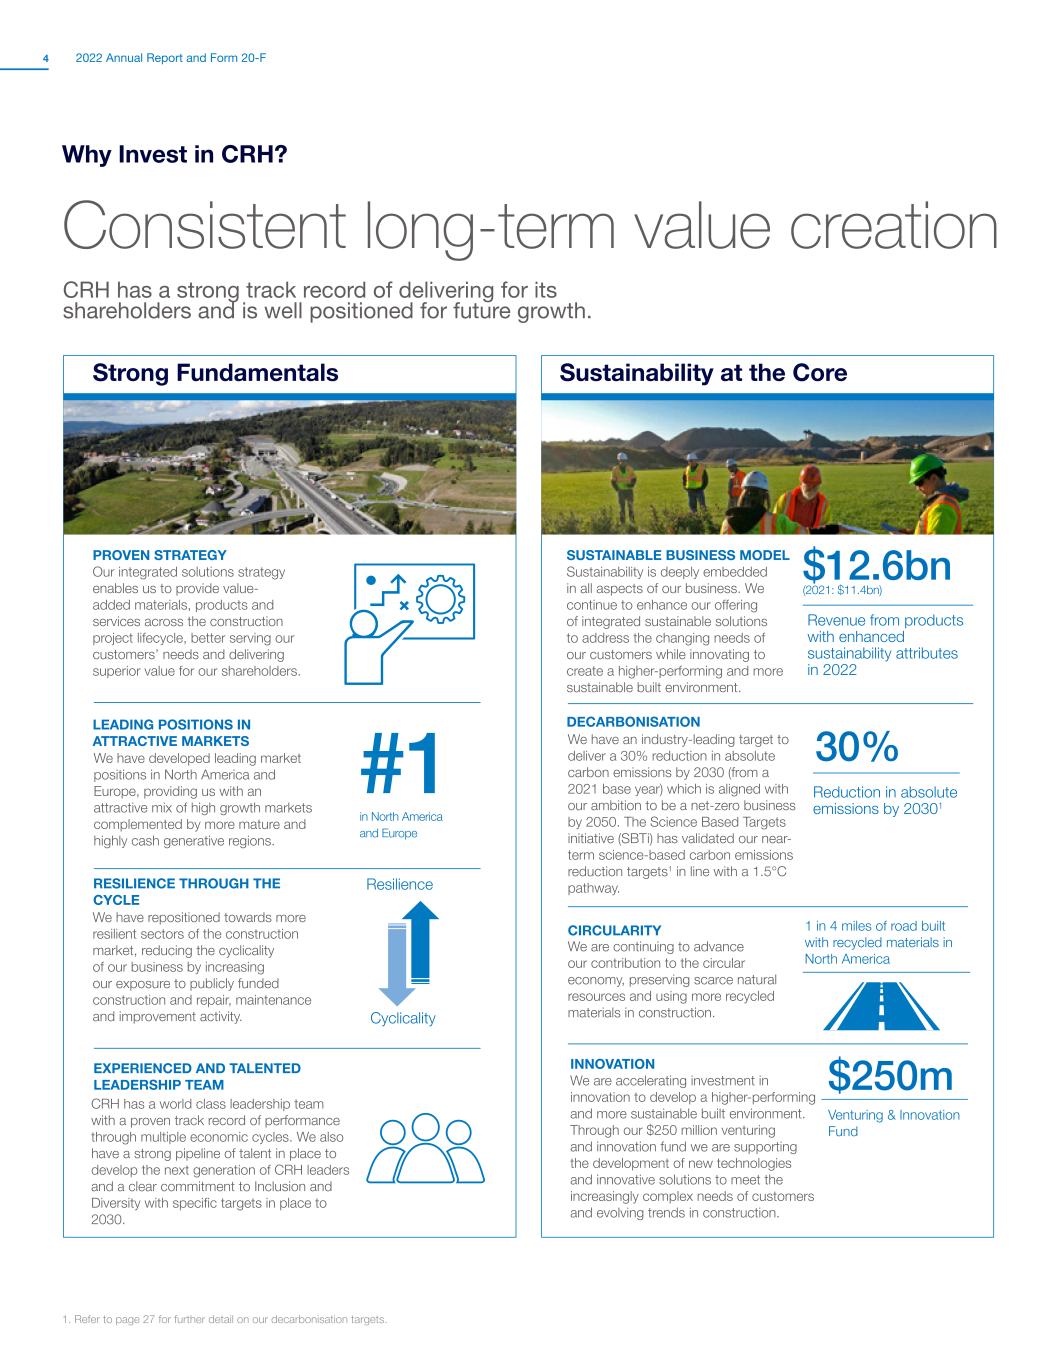
2022 Annual Report and Form 20-F4 #1 Why Invest in CRH? Consistent long-term value creation CRH has a strong track record of delivering for its shareholders and is well positioned for future growth. Strong Fundamentals PROVEN STRATEGY Our integrated solutions strategy enables us to provide value- added materials, products and services across the construction project lifecycle, better serving our customers’ needs and delivering superior value for our shareholders. LEADING POSITIONS IN ATTRACTIVE MARKETS We have developed leading market positions in North America and Europe, providing us with an attractive mix of high growth markets complemented by more mature and highly cash generative regions. in North America and Europe RESILIENCE THROUGH THE CYCLE We have repositioned towards more resilient sectors of the construction market, reducing the cyclicality of our business by increasing our exposure to publicly funded construction and repair, maintenance and improvement activity. Resilience Cyclicality EXPERIENCED AND TALENTED LEADERSHIP TEAM CRH has a world class leadership team with a proven track record of performance through multiple economic cycles. We also have a strong pipeline of talent in place to develop the next generation of CRH leaders and a clear commitment to Inclusion and Diversity with specific targets in place to 2030. Sustainability at the Core SUSTAINABLE BUSINESS MODEL Sustainability is deeply embedded in all aspects of our business. We continue to enhance our offering of integrated sustainable solutions to address the changing needs of our customers while innovating to create a higher-performing and more sustainable built environment. Revenue from products with enhanced sustainability attributes in 2022 $12.6bn (2021: $11.4bn) DECARBONISATION We have an industry-leading target to deliver a 30% reduction in absolute carbon emissions by 2030 (from a 2021 base year) which is aligned with our ambition to be a net-zero business by 2050. The Science Based Targets initiative (SBTi) has validated our near- term science-based carbon emissions reduction targets1 in line with a 1.5°C pathway. Reduction in absolute emissions by 20301 30% CIRCULARITY We are continuing to advance our contribution to the circular economy, preserving scarce natural resources and using more recycled materials in construction. 1 in 4 miles of road built with recycled materials in North America INNOVATION We are accelerating investment in innovation to develop a higher-performing and more sustainable built environment. Through our $250 million venturing and innovation fund we are supporting the development of new technologies and innovative solutions to meet the increasingly complex needs of customers and evolving trends in construction. $250m Venturing & Innovation Fund 1. Refer to page 27 for further detail on our decarbonisation targets.
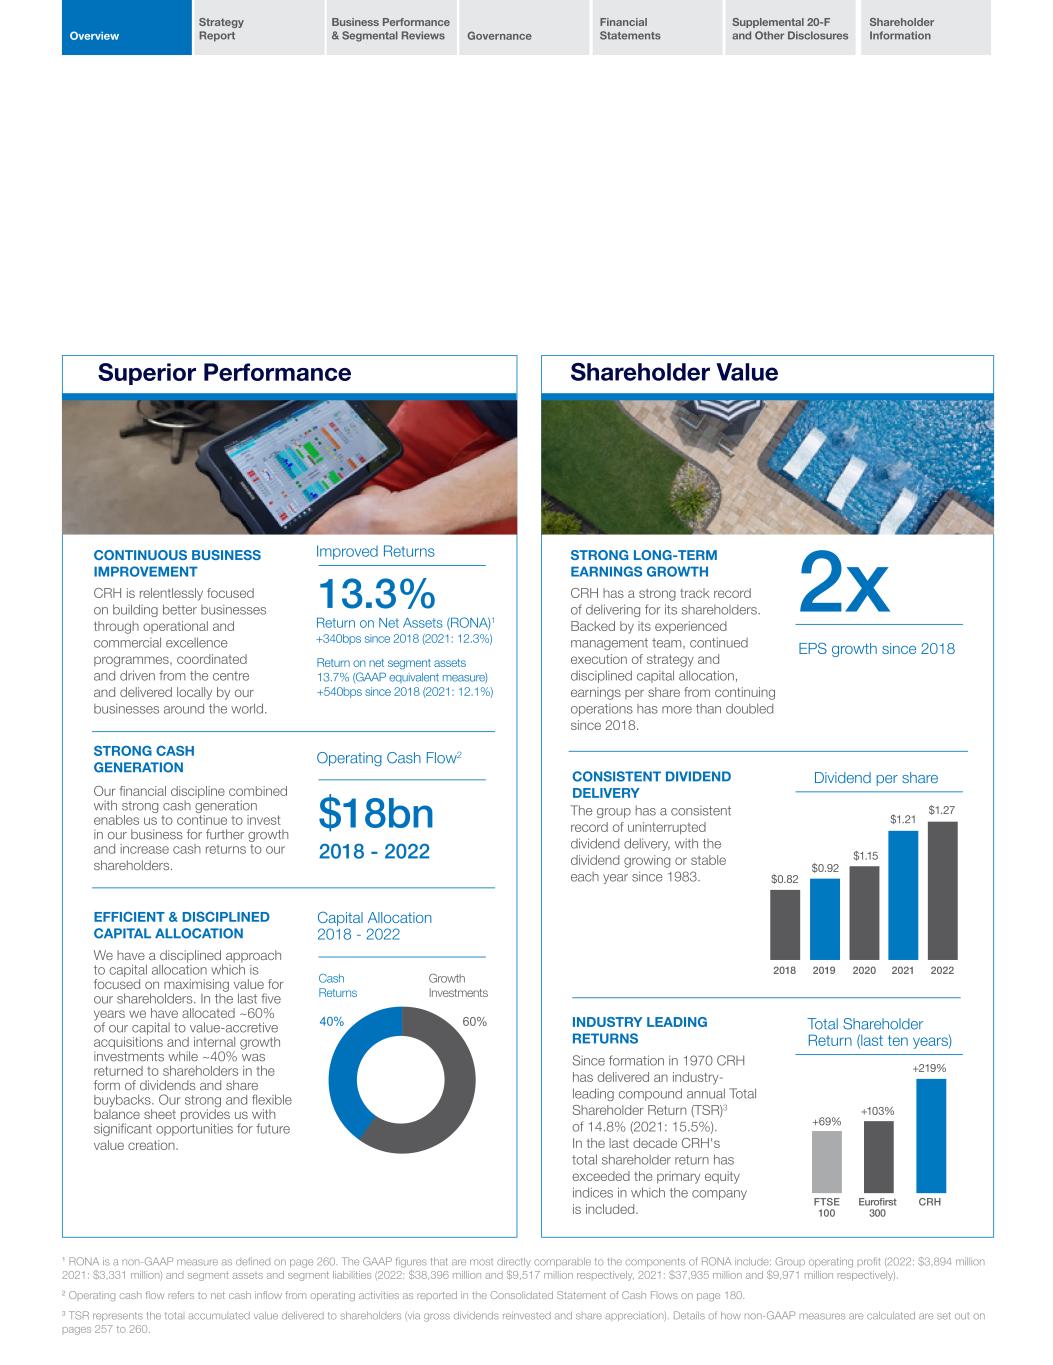
Overview Strategy Report Business Performance & Segmental Reviews Governance Financial Statements Supplemental 20-F and Other Disclosures Shareholder Information Superior Performance CONTINUOUS BUSINESS IMPROVEMENT CRH is relentlessly focused on building better businesses through operational and commercial excellence programmes, coordinated and driven from the centre and delivered locally by our businesses around the world. Improved Returns 13.3% Return on Net Assets (RONA)1 +340bps since 2018 (2021: 12.3%) Return on net segment assets 13.7% (GAAP equivalent measure) +540bps since 2018 (2021: 12.1%) STRONG CASH GENERATION Our financial discipline combined with strong cash generation enables us to continue to invest in our business for further growth and increase cash returns to our shareholders. Operating Cash Flow2 $18bn 2018 - 2022 EFFICIENT & DISCIPLINED CAPITAL ALLOCATION We have a disciplined approach to capital allocation which is focused on maximising value for our shareholders. In the last five years we have allocated ~60% of our capital to value-accretive acquisitions and internal growth investments while ~40% was returned to shareholders in the form of dividends and share buybacks. Our strong and flexible balance sheet provides us with significant opportunities for future value creation. Capital Allocation 2018 - 2022 Shareholder Value STRONG LONG-TERM EARNINGS GROWTH CRH has a strong track record of delivering for its shareholders. Backed by its experienced management team, continued execution of strategy and disciplined capital allocation, earnings per share from continuing operations has more than doubled since 2018. EPS growth since 2018 2x CONSISTENT DIVIDEND DELIVERY The group has a consistent record of uninterrupted dividend delivery, with the dividend growing or stable each year since 1983. Dividend per share INDUSTRY LEADING RETURNS Since formation in 1970 CRH has delivered an industry- leading compound annual Total Shareholder Return (TSR)3 of 14.8% (2021: 15.5%). In the last decade CRH's total shareholder return has exceeded the primary equity indices in which the company is included. Total Shareholder Return (last ten years) 40% 60%40% 60% Cash Returns Growth Investments FTSE 100 Eurofirst 300 +69% +103% 2018 2020 20222019 2021 $0.82 $1.15 $0.92 $1.21 $1.27 CRH +219% 1 RONA is a non-GAAP measure as defined on page 260. The GAAP figures that are most directly comparable to the components of RONA include: Group operating profit (2022: $3,894 million 2021: $3,331 million) and segment assets and segment liabilities (2022: $38,396 million and $9,517 million respectively, 2021: $37,935 million and $9,971 million respectively). 2 Operating cash flow refers to net cash inflow from operating activities as reported in the Consolidated Statement of Cash Flows on page 180. 3 TSR represents the total accumulated value delivered to shareholders (via gross dividends reinvested and share appreciation). Details of how non-GAAP measures are calculated are set out on pages 257 to 260. 40% 60%
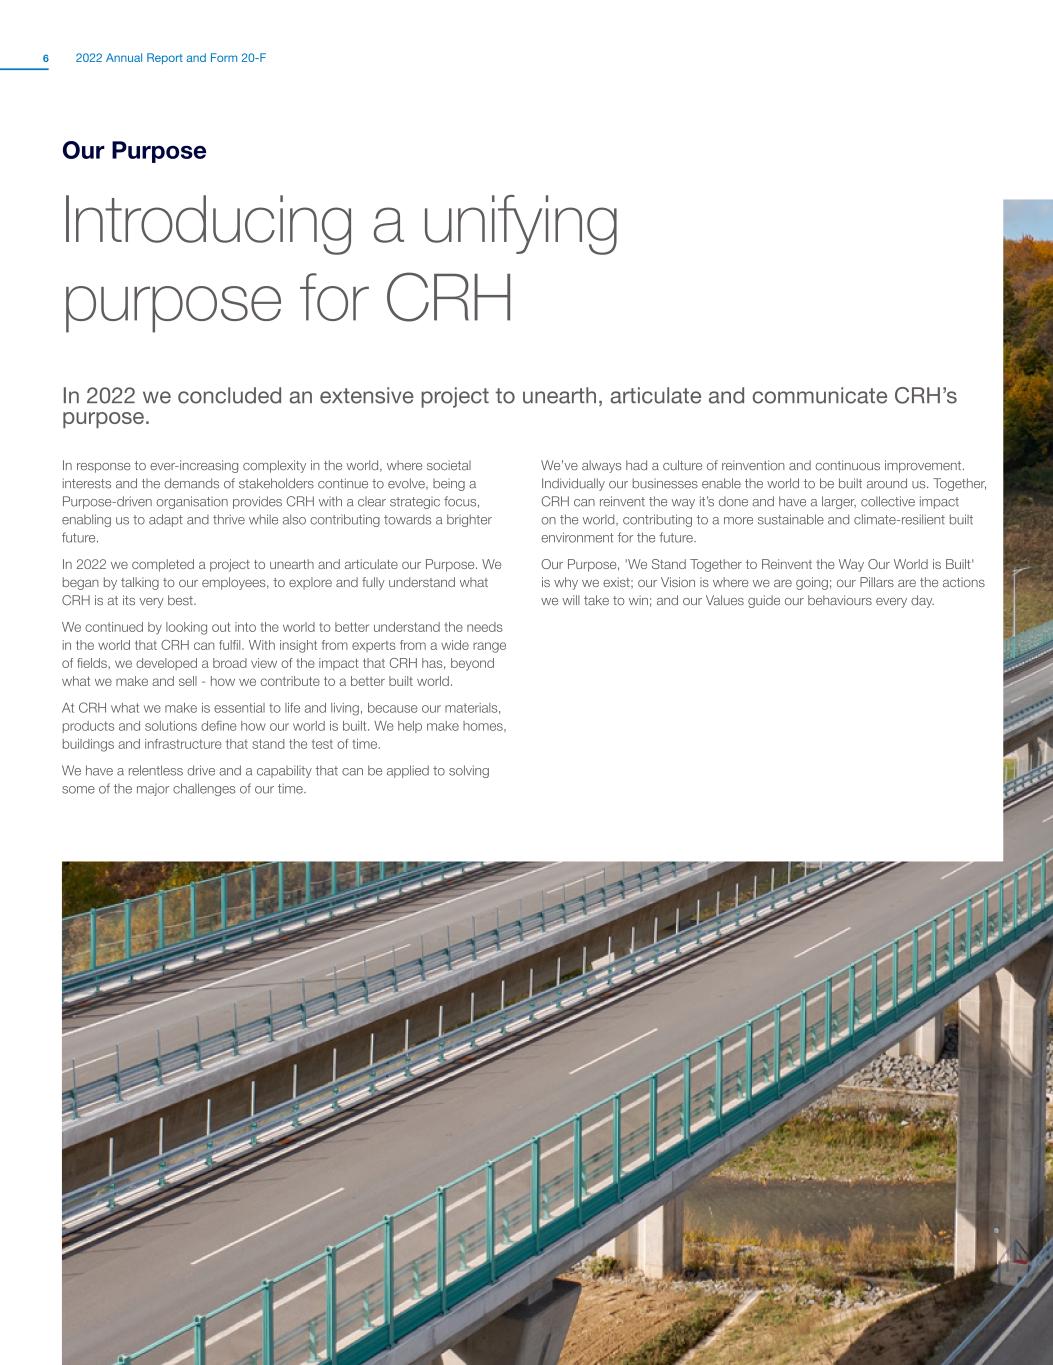
2022 Annual Report and Form 20-F6 We’ve always had a culture of reinvention and continuous improvement. Individually our businesses enable the world to be built around us. Together, CRH can reinvent the way it’s done and have a larger, collective impact on the world, contributing to a more sustainable and climate-resilient built environment for the future. Our Purpose, 'We Stand Together to Reinvent the Way Our World is Built' is why we exist; our Vision is where we are going; our Pillars are the actions we will take to win; and our Values guide our behaviours every day. VISION GRAPHIC Our Purpose In 2022 we concluded an extensive project to unearth, articulate and communicate CRH’s purpose. In response to ever-increasing complexity in the world, where societal interests and the demands of stakeholders continue to evolve, being a Purpose-driven organisation provides CRH with a clear strategic focus, enabling us to adapt and thrive while also contributing towards a brighter future. In 2022 we completed a project to unearth and articulate our Purpose. We began by talking to our employees, to explore and fully understand what CRH is at its very best. We continued by looking out into the world to better understand the needs in the world that CRH can fulfil. With insight from experts from a wide range of fields, we developed a broad view of the impact that CRH has, beyond what we make and sell - how we contribute to a better built world. At CRH what we make is essential to life and living, because our materials, products and solutions define how our world is built. We help make homes, buildings and infrastructure that stand the test of time. We have a relentless drive and a capability that can be applied to solving some of the major challenges of our time. Introducing a unifying purpose for CRH
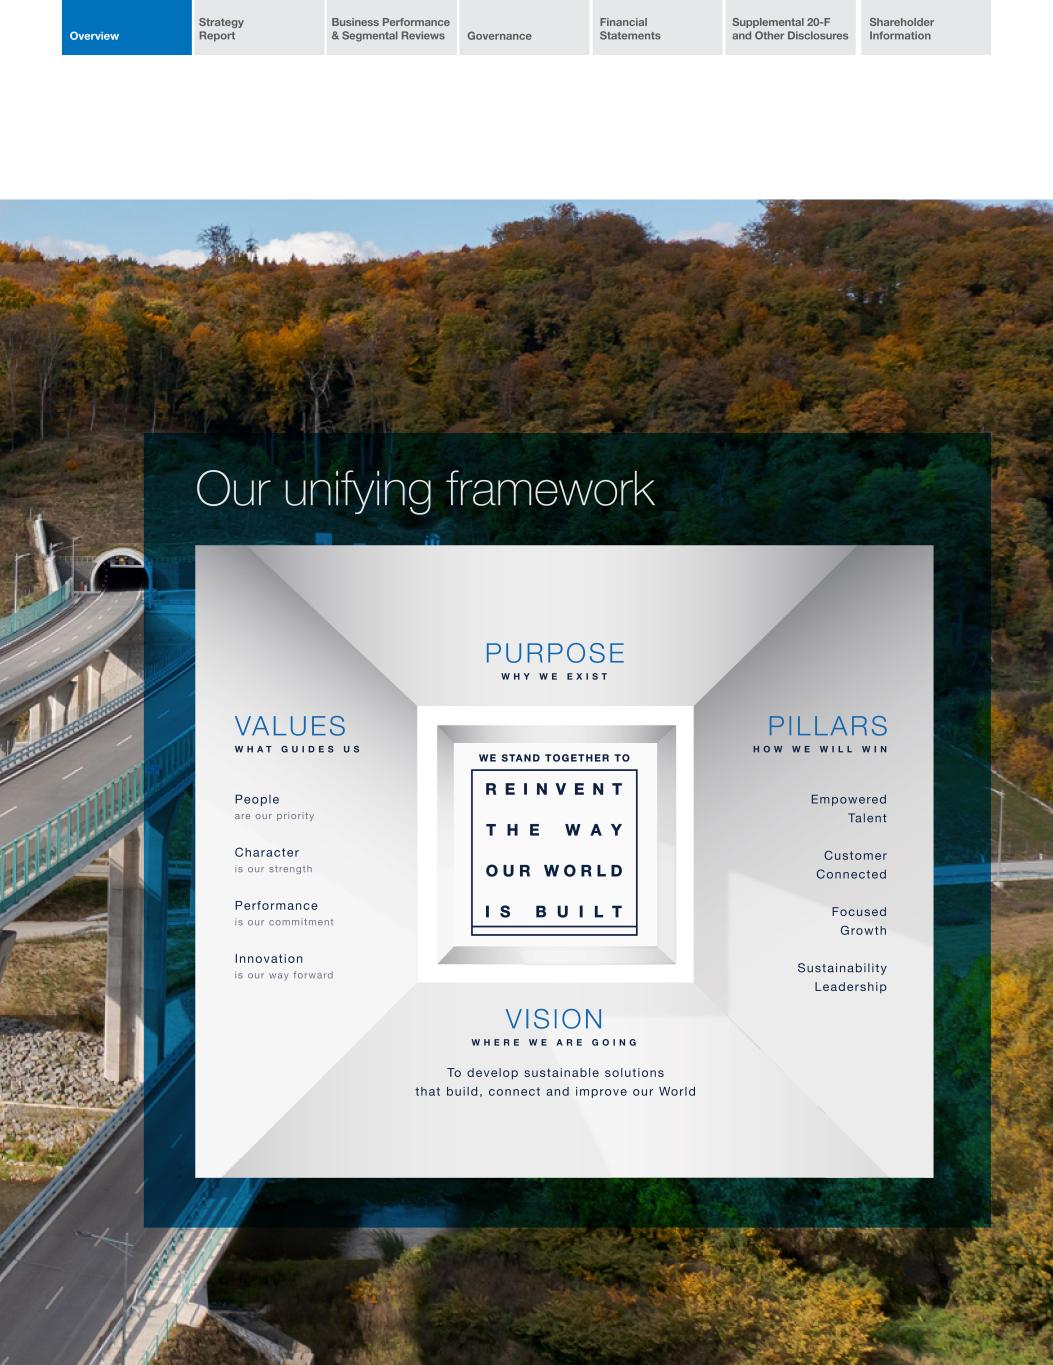
Overview Strategy Report Business Performance & Segmental Reviews Governance Financial Statements Supplemental 20-F and Other Disclosures Shareholder Information Our unifying framework
2022 Annual Report and Form 20-F8 Chairman's Introduction Introduction I am pleased to introduce CRH’s Annual Report for 2022. The last 12 months have represented another challenging year for the world and for the building materials sector. The Chief Executive and Chief Financial Officer reviews on page 14 and 62 respectively outline the key operational highlights and drivers of CRH’s performance in what has been another record year for the Group despite these challenges. Purpose During 2022, we launched our Purpose. We also took the opportunity to review and revise the wording of our values to strengthen and align with our Purpose. The Purpose statement and the revised values are set out on page 6. The process to articulate our Purpose included input from our employees through focus groups and test panels across all geographies, divisions and organisational levels. We also took on board valuable insights from global experts in a range of fields. I was present at the launch of our Purpose last year and was struck by the extent to which the newly articulated Purpose resonated with those present, by encapsulating what has driven the success of CRH to date and underpinning how we will build the CRH of the future. The feedback we received on our Purpose during our engagement with employees during the year, details of which are included in the Corporate Governance Report on page 88, was similarly positive. Our Purpose is currently being shared with our whole organisation and is being embedded in our operational and strategic processes, demonstrating our commitment to guiding and nurturing the culture of the organisation. Purpose sets the path for future evolution and success "Our Purpose is currently being shared with all of our employees and is being embedded in our operational and strategic processes, demonstrating our commitment to guiding and nurturing the culture of the organisation."
Overview Strategy Report Business Performance & Segmental Reviews Governance Financial Statements Supplemental 20-F and Other Disclosures Shareholder Information Chairman's Introduction Sustainability The Group is working towards delivery of its ambition to become a net-zero business by 2050, with an industry-leading target of a 30% reduction in absolute carbon emissions by 2030 and continued investment in ground- breaking technologies. Further information on these and other initiatives in areas such as circularity, climate resilience, our $250 million venturing and innovation fund to support the development of pioneering sustainable building solutions and our strategic alliances are set out in the Solutions for a Sustainable Future section on page 24. Conclusion On behalf of the Board, I would like to express our appreciation to all of our employees for their commitment and efforts during this challenging year and to the management team led by our Chief Executive, Albert Manifold. I am confident that our clearly defined Purpose, which is directly aligned with our clear strategy, focus on operational performance and development of our employees whilst providing commercial solutions for our customers’ needs, provides a valuable underpin for the Company’s evolution and future success of the Group. Richie Boucher Chairman 1 March 2023 Ukraine Amidst the turbulence impacting global economies, your Board’s primary focus has been on the safety and well-being of our colleagues in Ukraine. I am pleased to report that our employees and their families are physically safe and have received our help and support, including evacuation from risk areas, accommodation and financial assistance. I am also immensely proud of the response of our people across the Group in their support for the humanitarian effort in Ukraine, as is further outlined in the Chief Executive’s review on page 14. Safety Very regrettably, there were five reportable fatalities in 2022 involving one employee and four contractors. As outlined in the Safety, Environment and Social Responsibility (SESR) Committee report on page 104, following detailed reports to the Board on the background circumstances of these incidents, the SESR Committee received follow-up reports on the investigations into the root causes in each case. Your Board remains steadfast in its determination to work towards zero harm and CRH continues to invest in safety initiatives and technologies to support this. Further information on our work in the area of safety is set out in the People & Communities section on page 38.

2022 Annual Report and Form 20-F10 Chief Executive’s Review In 2022 CRH delivered a resilient performance supported by our solutions strategy. Read our Chief Executive’s Review on page 14 Market Backdrop The factors driving demand in the marketplace for our materials, products and value-added solutions. Read our market backdrop on page 16

Overview Strategy Report Business Performance & Segmental Reviews Governance Financial Statements Supplemental 20-F and Other Disclosures Shareholder Information Strategy Report Our Strategic Framework 12 Chief Executive’s Review 14 Market Backdrop 16 Business Model 20 Strategy in Action 22 Solutions for a Sustainable Future 24 – Decarbonisation 26 – Waste 32 – Water 34 – Natural World 36 – People and Communities 38 – Responsible Business 46 Risk Management 50 TCFD Executive Summary 56 Lorem Ipsum Lorem Lorem Ipsum Lorem Lorem Ipsum Lorem Ipsum Lorem Ipsum Lorem Ipsum Lorem Ipsum Lorem Ipsum Solutions for a sustainable future Creating value by reinventing the way the world is built Read more on page 24 Our Strategic Framework 12 Chief Executive’s Review 14 Market Backdrop 16 Business Model 20 Strategy in Action 22 Solutions for a Sustainable Future 24 – Decarbonisation 26 – Waste 32 – Water 34 – Natural World 36 – People & Communities 38 – Responsible Business 46 Risk Management 50 TCFD Executive Summary 56 Strategy Report Risk management driving bett r decision making Effective management of risks and opportunities is funda ental to the realisation of our strategic objectives Read about our approach to risk management on page 50
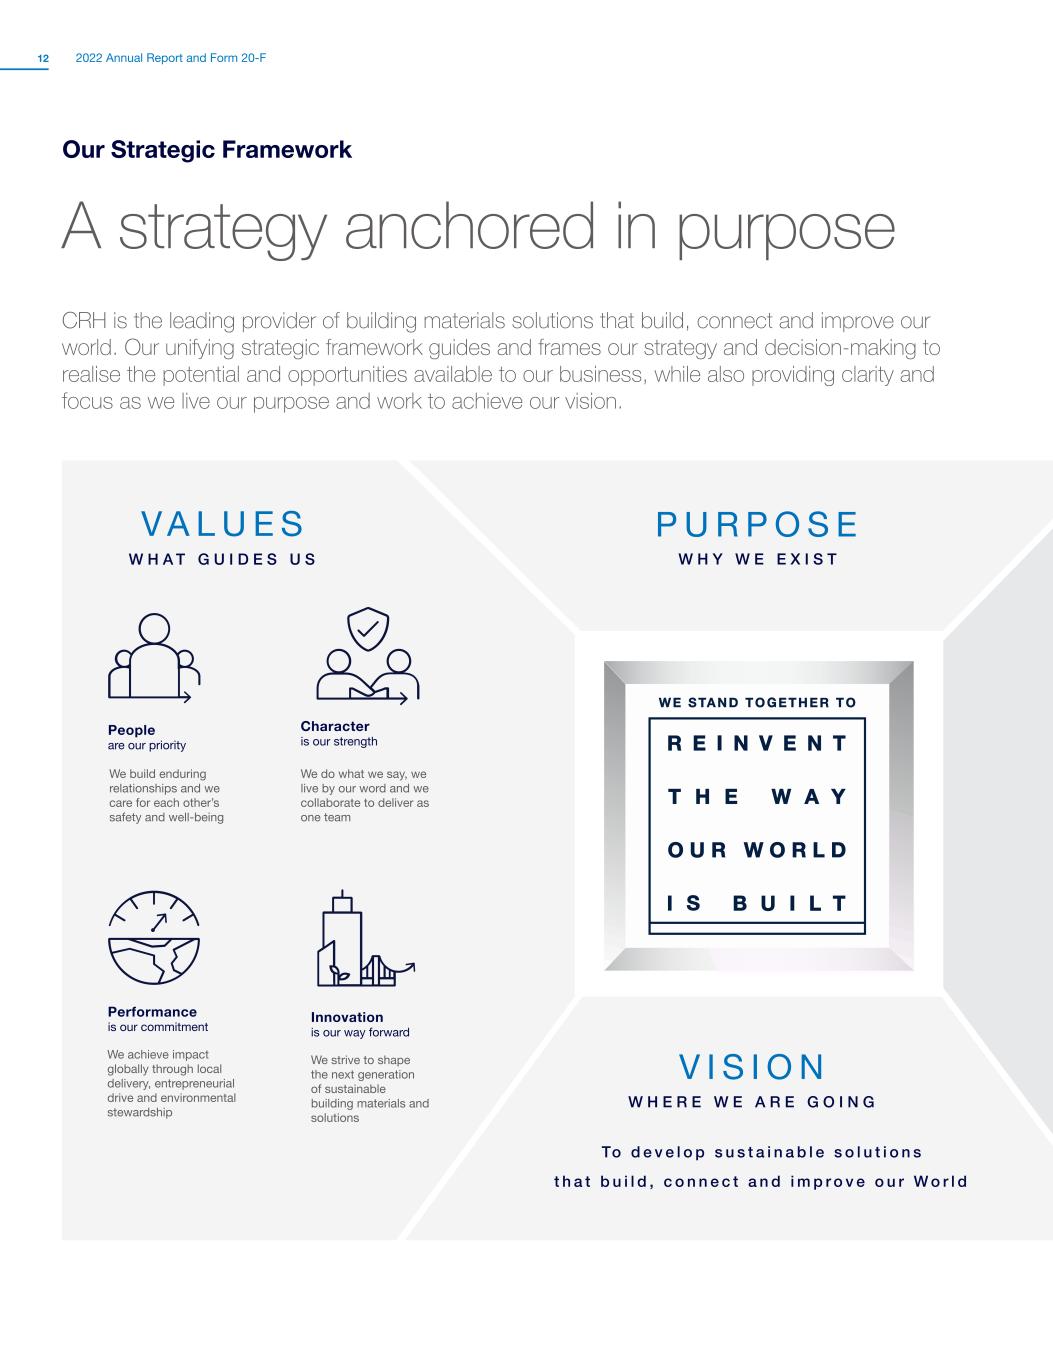
2022 Annual Report and Form 20-F12 Our Strategic Framework A strategy anchored in purpose CRH is the leading provider of building materials solutions that build, connect and improve our world. Our unifying strategic framework guides and frames our strategy and decision-making to realise the potential and opportunities available to our business, while also providing clarity and focus as we live our purpose and work to achieve our vision. V A L U E S W H A T G U I D E S U S People are our priority We build enduring relationships and we care for each other’s safety and well-being Character is our strength We do what we say, we live by our word and we collaborate to deliver as one team Performance is our commitment We achieve impact globally through local delivery, entrepreneurial drive and environmental stewardship Innovation is our way forward We strive to shape the next generation of sustainable building materials and solutions P U R P O S E W H Y W E E X I S T V I S I O N W H E R E W E A R E G O I N G To d e v e l o p s u s t a i n a b l e s o l u t i o n s t h a t b u i l d , c o n n e c t a n d i m p r o v e o u r W o r l d
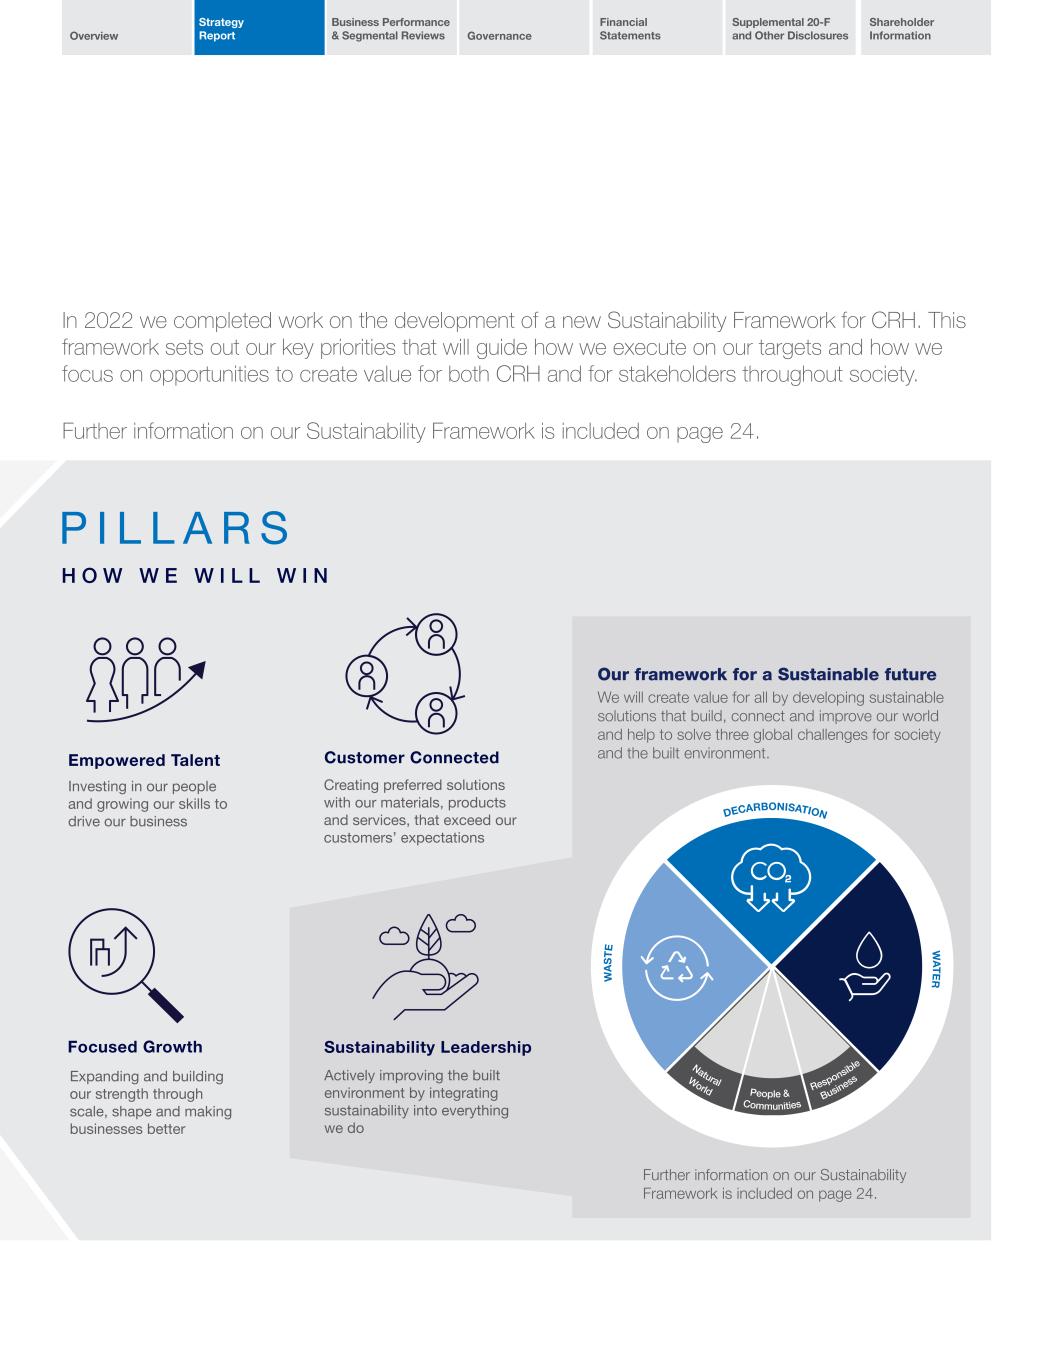
Overview Strategy Report Business Performance & Segmental Reviews Governance Financial Statements Supplemental 20-F and Other Disclosures Shareholder Information In 2022 we completed work on the development of a new Sustainability Framework for CRH. This framework sets out our key priorities that will guide how we execute on our targets and how we focus on opportunities to create value for both CRH and for stakeholders throughout society. Further information on our Sustainability Framework is included on page 24. P I L L A R S H O W W E W I L L W I N Empowered Talent Investing in our people and growing our skills to drive our business Customer Connected Creating preferred solutions with our materials, products and services, that exceed our customers’ expectations Focused Growth Expanding and building our strength through scale, shape and making businesses better Sustainability Leadership Actively improving the built environment by integrating sustainability into everything we do Our framework for a Sustainable future We will create value for all by developing sustainable solutions that build, connect and improve our world and help to solve three global challenges for society and the built environment. Further information on our Sustainability Framework is included on page 24. DECARBONISATION W AS TE W ATER Innovating for a low-carbon future World Communities Business Natural People & Responsible

2022 Annual Report and Form 20-F14 Chief Executive’s Review1 Resilient performance supported by our solutions strategy CRH reported further growth in sales, EBITDA (as defined)* and margin amid a challenging and volatile cost environment, reflecting the resilience of our business and the benefits of our integrated and sustainable solutions strategy. 4 Introduction At CRH our vision is to develop sustainable solutions that build, connect and improve our world. In recent years we have reshaped and repositioned our business to help realise that vision and to deliver superior growth and performance. We have a clear strategy in place which has sharpened our competitive advantage, strengthened our resilience and enabled CRH to deliver a strong performance during 2022, despite an increasingly challenging and volatile cost environment globally. Solutions Strategy Integrating our materials and products with value-added services that can be delivered as solutions in multiple markets uniquely positions CRH to capture additional value across the entire construction value chain. By deepening our relationships with customers, removing reasons to switch and improving our pricing power we can capture more business from each individual customer, deliver greater production and logistical efficiencies and achieve higher utilisation rates on our asset base. In 2022 we continued to develop our solutions proposition with a strong focus on enhancing the ability of our businesses to solve problems and address new and emerging challenges that customers are facing. This included the acquisition of businesses that complement and enhance our existing offerings and enable us to deliver more complete solutions for customers. CRH spent a total of $3.3 billion on acquisitions and investments in 2022 (2021: $1.5 billion). The most significant of which was our $1.9 billion acquisition of Barrette Outdoor Living (Barrette), North America’s leading provider of fencing and railing systems for the outdoor living space. Integrating Barrette with our existing outdoor living businesses enables us to provide a complete suite of sustainable outdoor living solutions for our customers. We are also seeing increasing demand for integrated solutions in major infrastructure and commercial projects in key markets across each of our Divisions. In 2022 this included areas such as drainage and waste- water systems, energy and telecoms infrastructure, manufacturing facilities and data centres. CRH is uniquely positioned to meet this demand through our extensive operational footprint and ability to combine multiple materials, products and services at a level of scale required to deliver these projects on-time and on-budget. This helped CRH to deliver a strong financial performance during 2022 which saw sales 12% and EBITDA (as defined)* 13% ahead of the prior year, while EBITDA (as defined)* margin increased despite the significant inflationary cost environment. Sustainability Leadership We continued to make progress in decarbonising our business and, in 2022 announced an industry-leading absolute carbon emissions reduction target. In early 2023, the SBTi validated our revised targets2 in line with the updated 1.5°C science-based framework which now 4 *EBITDA is defined as earnings from continuing operations before interest, taxes, depreciation, amortisation, asset impairment charges, profit on disposals and the Group’s share of equity accounted investments’ profit after tax. 1. See cautionary statement regarding forward-looking statements on page 135. 2. Refer to page 27 for further detail on our decarbonisation targets.

Overview Strategy Report Business Performance & Segmental Reviews Governance Financial Statements Supplemental 20-F and Other Disclosures Shareholder Information equate to a 30% reduction in absolute carbon emissions by 2030 (from a 2021 base year). This is aligned with our ambition to be a net-zero business by 2050. We are innovating to improve circularity and climate resilience in the built environment. This includes the development of new low-impact products and solutions that are less carbon intensive and help to mitigate and adapt to climate change while reducing its environmental and social effects. This is an area where we see increasing opportunities as public policy changes begin to drive an increase in demand for products such as low- carbon concretes and asphalt. In 2022 assisted by our Innovation Centre for Sustainable Construction (ICSC), our businesses continued to introduce new low-carbon concretes. Customer Connected There are currently over 100 projects being undertaken by the ICSC as part of our innovation agenda. In 2022 we further increased our investment in innovation, launching a new venture capital unit, CRH Ventures, and establishing a $250 million venturing and innovation fund. CRH Ventures will partner with construction technology and climate technology companies, across the construction value chain, investing in the development of new technologies and innovative solutions to meet the increasingly complex needs of customers and evolving trends in construction. CRH is particularly well positioned with the technical capabilities, knowledge and expertise of a global industry leader, to pilot and scale new technologies and innovations that will enable safer, smarter and more sustainable construction. We also have the benefit of deep market insights and strong customer relationships which provide CRH with a unique understanding of the evolving needs of the industry and the changing nature of construction. Maintaining our ability to solve our customers’ complex construction challenges is critical to our continued commercial and operational success and we are investing to strengthen our market leadership. Empowered Talent At CRH people are our priority. We pride ourselves on the enduring relationships that we build and the care we take for each other’s safety and wellbeing. We took early and decisive action to protect our colleagues in Ukraine and their families in February 2022 and I remain deeply moved by the efforts of our people. We also stood together as a company to support the humanitarian effort in Ukraine including raising and donating over $1.7 million to UNICEF. We continue to put safety first and to drive our culture of safety and wellness towards ensuring zero harm. Regrettably, despite our best efforts, we fell short in delivering on our safety target in 2022 with five fatalities recorded during the year. This is unacceptable and has further strengthened our resolve to achieve our ambition of zero harm and target of zero fatalities. Our thoughts are with the families of the deceased. In 2022 we continued to deliver our Inclusion & Diversity (I&D) strategy by appointing a new executive committee sponsor for I&D strategy setting and a new Chief Culture and People Officer (CCPO) at executive committee level, to elevate the strategic focus on culture and people at CRH. Our people are essential to unlocking the full potential of CRH’s solutions- focused business model. Through our global talent strategy and development programmes we are investing in our people to grow their skills and drive our business forward. This helps us to identify and attract talent and empower the next generation of leaders to reinvent the way our world is built. Focused Growth Our integrated solutions strategy is the engine which will drive future growth in CRH and will allow our business to reach its full potential, fuelling our innovation, creativity and entrepreneurship, while delivering significantly higher margins, returns and industry-leading cash generation. To deliver this strategy and fully capitalise on the opportunities in the market requires an enhanced organisational structure capable of better serving our customers through increased cross-company collaboration and innovation. This will also help to unlock additional improvements in productivity, growth and financial performance. For this reason, effective 1 January 2023 we have reorganised CRH into two distinct Divisions, CRH Americas and CRH Europe. CRH Americas will bring together our existing Americas Materials businesses with our Architectural Products and Infrastructure Products businesses in North America. CRH Europe will bring together our existing Europe Materials businesses with our Architectural Products and Infrastructure Products businesses in Europe, as well as our global Leviat business. Bringing these businesses together in the Americas and Europe will establish two strong growth platforms that position CRH to lead the way in integrated, sustainable construction solutions that are scalable and replicable across multiple markets. This is another important step in achieving our vision to build, connect and improve our world. Outlook Overall, we expect resilient demand and increased pricing in 2023 despite macroeconomic uncertainties and ongoing cost inflation. Our operations in North America will benefit from strong pricing and robust infrastructure demand being underpinned by significant increases in funding at both federal and state level. The non-residential sector is supported by government funding initiatives in clean energy and the onshoring of critical manufacturing, while the residential new-build sector will experience short-term weakness as a result of rising interest rates. In Europe we expect positive pricing momentum to offset lower volumes. Construction activity in Central and Eastern Europe will continue to be supported by EU infrastructure funds, while our businesses in Western Europe remain underpinned by resilient repair, maintenance and improvement (RMI) activity and stable infrastructure demand. Notwithstanding a number of macroeconomic risks and uncertainties, CRH remains well positioned for another year of progress in 2023 due to our uniquely integrated, value- added solutions strategy together with a strong and flexible balance sheet. Albert Manifold Chief Executive 1 March 2023

2022 Annual Report and Form 20-F16 Market Backdrop Positioned to meet the changing needs of construction There are a number of factors which are driving demand in the marketplace for our materials, products and value-added solutions. Over several decades CRH has developed a strong core business focused on building materials, value-added products and services. This business is underpinned by a portfolio of well-located assets in attractive construction markets in North America, Europe and Asia-Pacific. Our business addresses the needs of customers with both new build and RMI requirements in infrastructure, residential, non-residential and construction markets. Demand for our materials, products and services is driven by a number of important market fundamentals, while sector specific trends are creating challenges and opportunities that will shape the way in which we meet that demand now and in the future. Through its broad base of high-quality businesses and leadership positions in local construction markets, CRH is well positioned to capitalise on future growth potential, both organic and inorganic. Our business is also positioned to align with the major demand fundamentals in key global markets which enables CRH to take advantage of the opportunities presented by the changing nature of construction. This has involved moving our business away from being solely a supplier of base materials and has helped CRH deliver superior performance. Demand Fundamentals Construction demand continues to be driven by a number of factors including significant infrastructure needs, long-term residential under-build and a resurgence in non-residential demand. In the US we have orientated our operating footprint to benefit from resilient RMI activity in the North East and Midwest along with new-build expansion driven by migration and population growth in the South and West. In Europe we have seen resilient RMI demand and advancements in sustainable construction in the more stable and developed markets of Western Europe. This is in addition to significant new-build infrastructure and residential needs coupled with a supportive regulatory environment for sustainable solutions in the higher growth markets in the East. In both geographies we have seen significant government support for infrastructure, through state and federal funding in the US and EU funding in Eastern Europe.
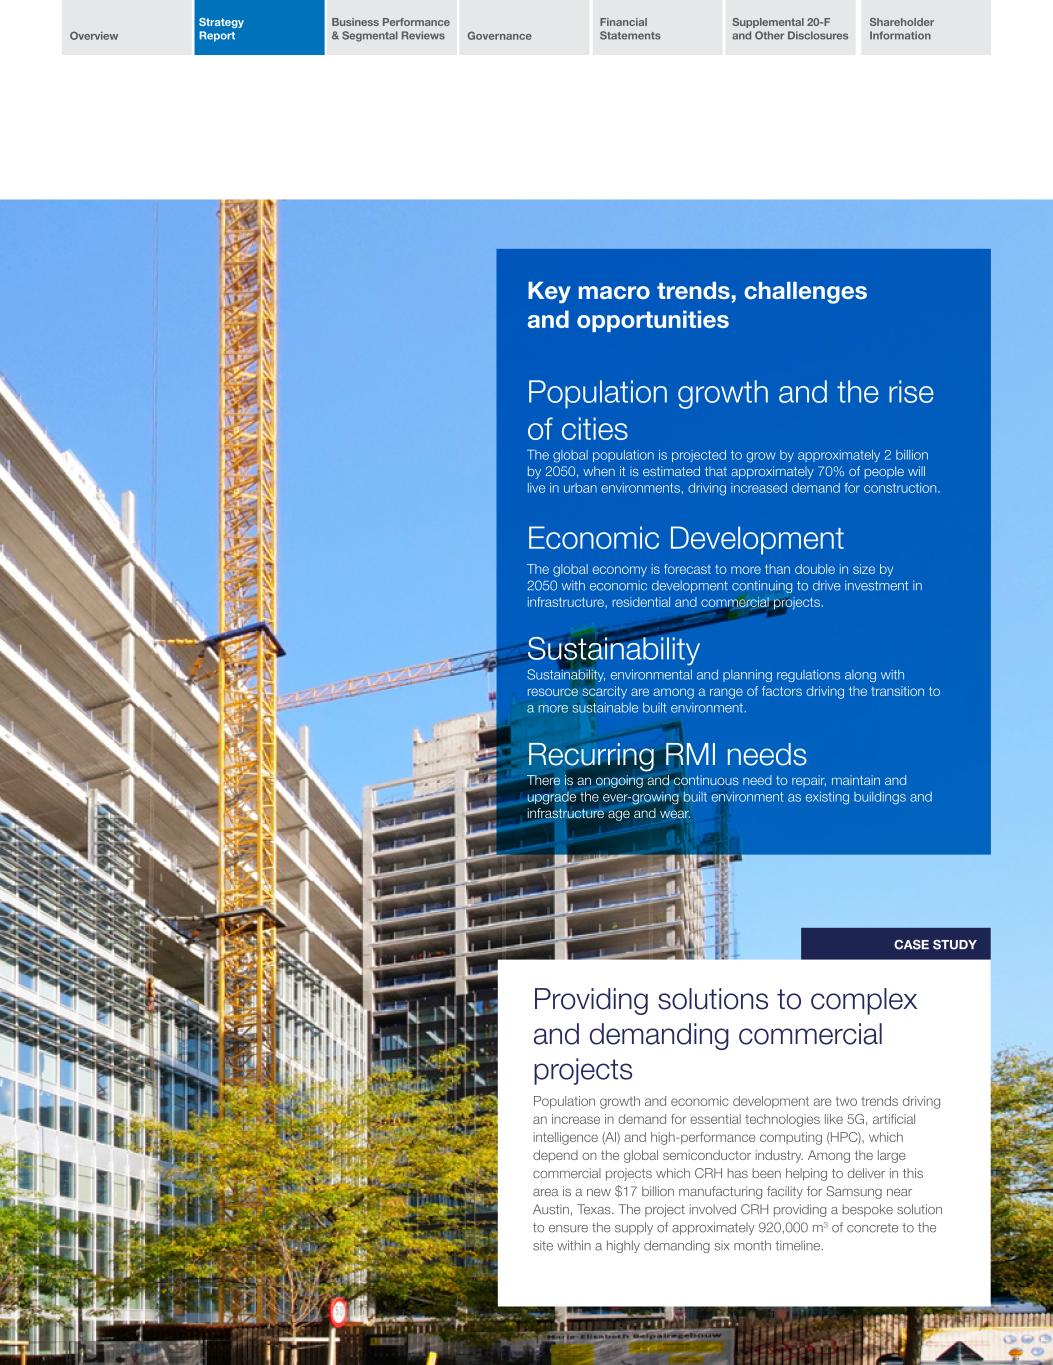
Overview Strategy Report Business Performance & Segmental Reviews Governance Financial Statements Supplemental 20-F and Other Disclosures Shareholder Information Key macro trends, challenges and opportunities Population growth and the rise of cities The global population is projected to grow by approximately 2 billion by 2050, when it is estimated that approximately 70% of people will live in urban environments, driving increased demand for construction. Economic Development The global economy is forecast to more than double in size by 2050 with economic development continuing to drive investment in infrastructure, residential and commercial projects. Sustainability Sustainability, environmental and planning regulations along with resource scarcity are among a range of factors driving the transition to a more sustainable built environment. Recurring RMI needs There is an ongoing and continuous need to repair, maintain and upgrade the ever-growing built environment as existing buildings and infrastructure age and wear. Providing solutions to complex and demanding commercial projects Population growth and economic development are two trends driving an increase in demand for essential technologies like 5G, artificial intelligence (AI) and high-performance computing (HPC), which depend on the global semiconductor industry. Among the large commercial projects which CRH has been helping to deliver in this area is a new $17 billion manufacturing facility for Samsung near Austin, Texas. The project involved CRH providing a bespoke solution to ensure the supply of approximately 920,000 m3 of concrete to the site within a highly demanding six month timeline. CASE STUDY
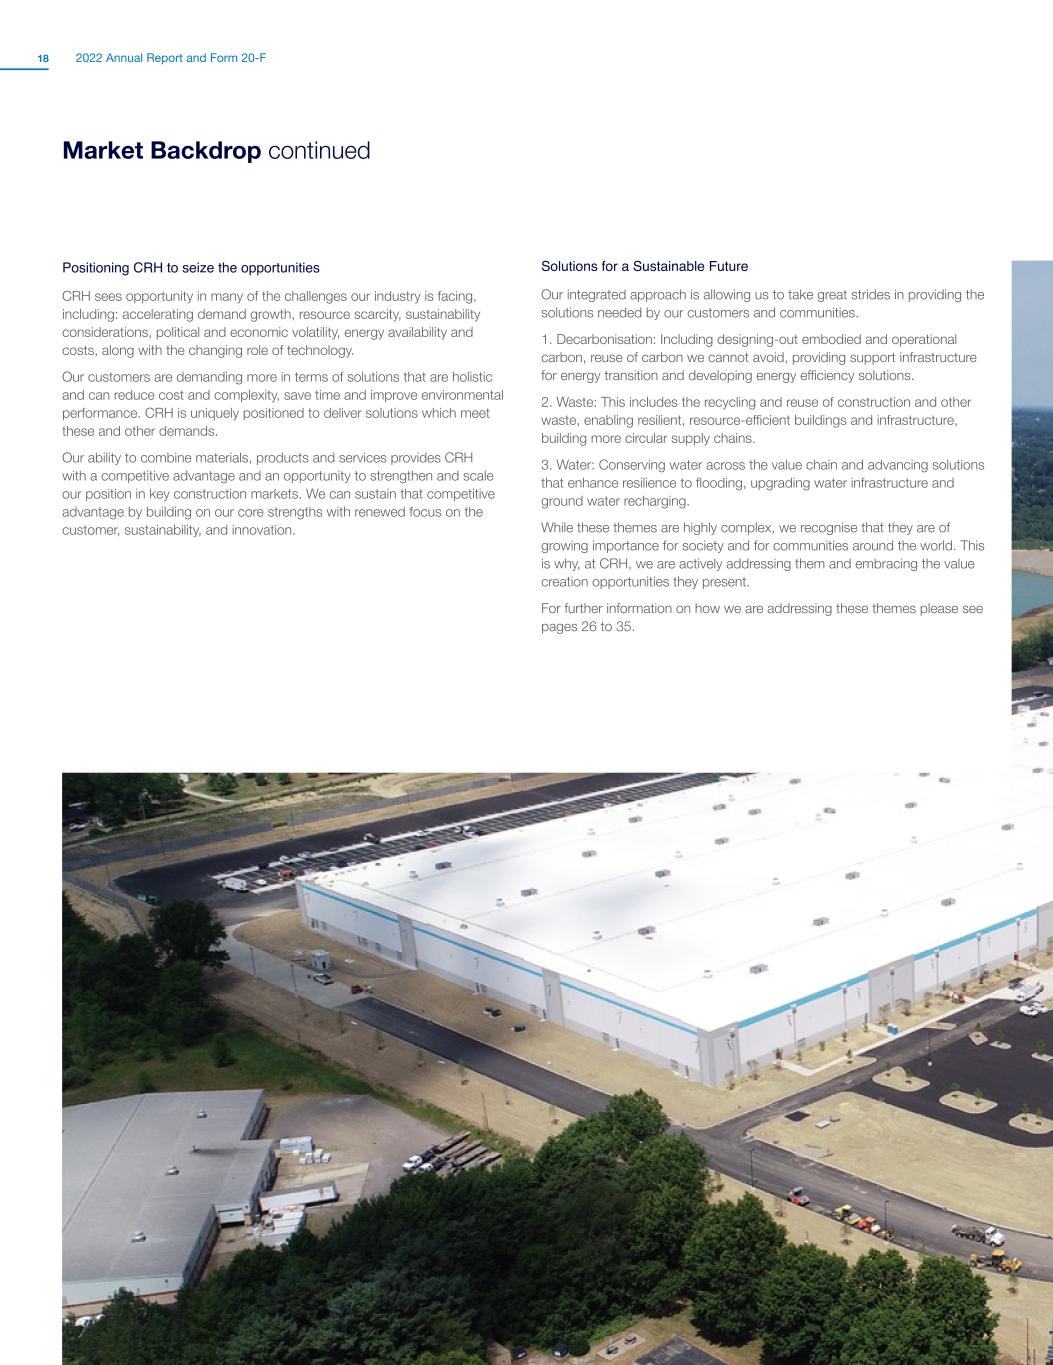
2022 Annual Report and Form 20-F18 Market Backdrop continued Positioning CRH to seize the opportunities CRH sees opportunity in many of the challenges our industry is facing, including: accelerating demand growth, resource scarcity, sustainability considerations, political and economic volatility, energy availability and costs, along with the changing role of technology. Our customers are demanding more in terms of solutions that are holistic and can reduce cost and complexity, save time and improve environmental performance. CRH is uniquely positioned to deliver solutions which meet these and other demands. Our ability to combine materials, products and services provides CRH with a competitive advantage and an opportunity to strengthen and scale our position in key construction markets. We can sustain that competitive advantage by building on our core strengths with renewed focus on the customer, sustainability, and innovation. Solutions for a Sustainable Future Our integrated approach is allowing us to take great strides in providing the solutions needed by our customers and communities. 1. Decarbonisation: Including designing-out embodied and operational carbon, reuse of carbon we cannot avoid, providing support infrastructure for energy transition and developing energy efficiency solutions. 2. Waste: This includes the recycling and reuse of construction and other waste, enabling resilient, resource-efficient buildings and infrastructure, building more circular supply chains. 3. Water: Conserving water across the value chain and advancing solutions that enhance resilience to flooding, upgrading water infrastructure and ground water recharging. While these themes are highly complex, we recognise that they are of growing importance for society and for communities around the world. This is why, at CRH, we are actively addressing them and embracing the value creation opportunities they present. For further information on how we are addressing these themes please see pages 26 to 35.
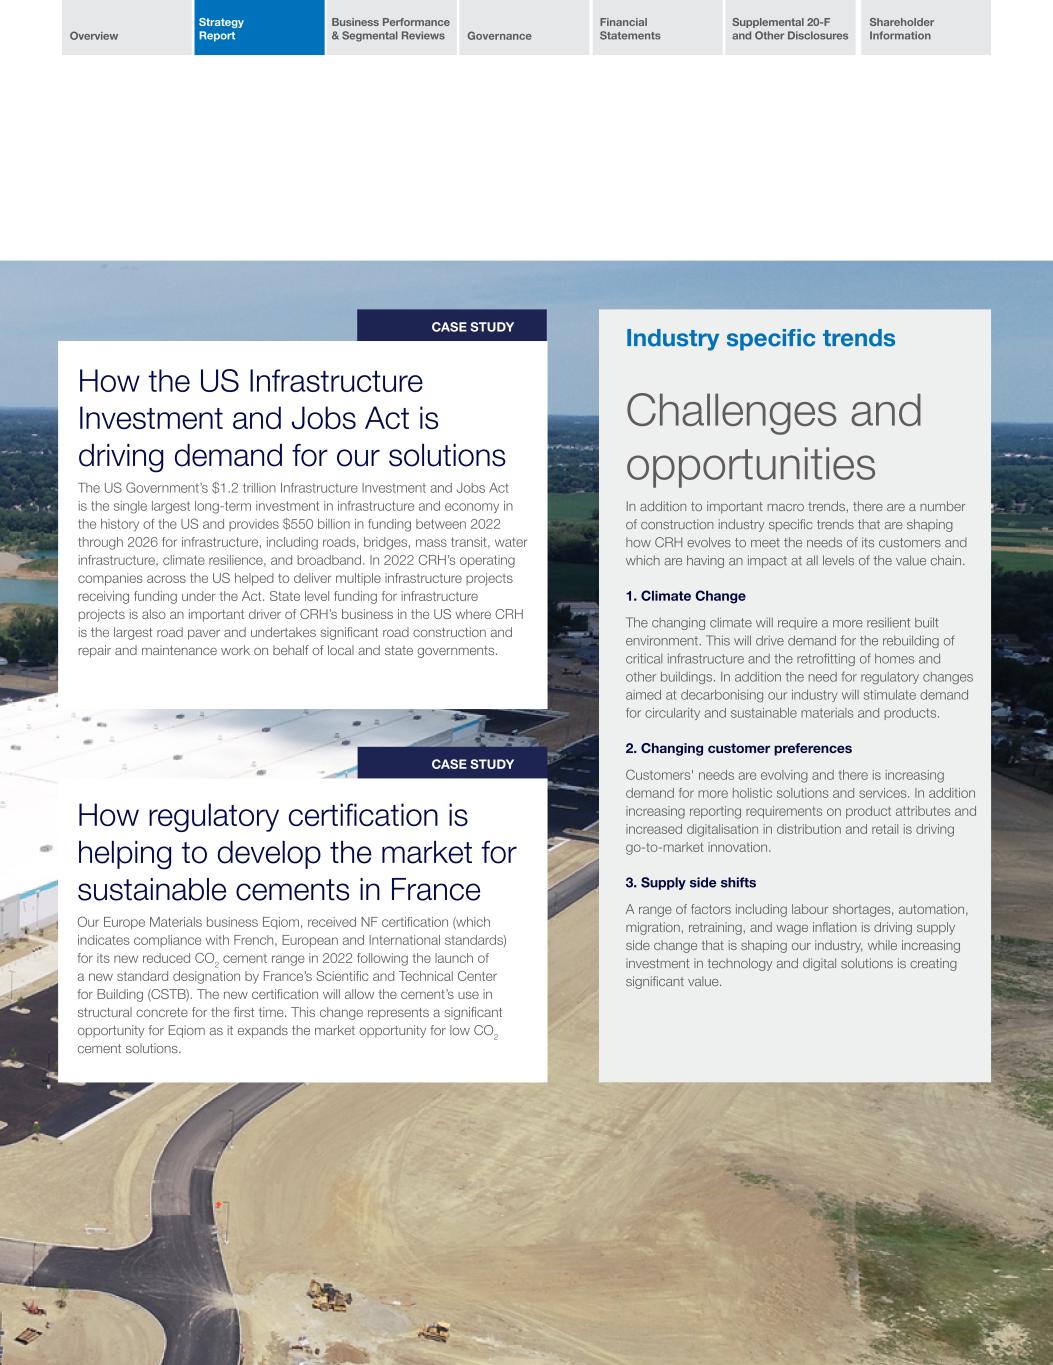
Overview Strategy Report Business Performance & Segmental Reviews Governance Financial Statements Supplemental 20-F and Other Disclosures Shareholder Information CASE STUDY How regulatory certification is helping to develop the market for sustainable cements in France Our Europe Materials business Eqiom, received NF certification (which indicates compliance with French, European and International standards) for its new reduced CO2 cement range in 2022 following the launch of a new standard designation by France’s Scientific and Technical Center for Building (CSTB). The new certification will allow the cement’s use in structural concrete for the first time. This change represents a significant opportunity for Eqiom as it expands the market opportunity for low CO2 cement solutions. CASE STUDY How the US Infrastructure Investment and Jobs Act is driving demand for our solutions The US Government’s $1.2 trillion Infrastructure Investment and Jobs Act is the single largest long-term investment in infrastructure and economy in the history of the US and provides $550 billion in funding between 2022 through 2026 for infrastructure, including roads, bridges, mass transit, water infrastructure, climate resilience, and broadband. In 2022 CRH’s operating companies across the US helped to deliver multiple infrastructure projects receiving funding under the Act. State level funding for infrastructure projects is also an important driver of CRH’s business in the US where CRH is the largest road paver and undertakes significant road construction and repair and maintenance work on behalf of local and state governments. Industry specific trends Challenges and opportunities In addition to important macro trends, there are a number of construction industry specific trends that are shaping how CRH evolves to meet the needs of its customers and which are having an impact at all levels of the value chain. 1. Climate Change The changing climate will require a more resilient built environment. This will drive demand for the rebuilding of critical infrastructure and the retrofitting of homes and other buildings. In addition the need for regulatory changes aimed at decarbonising our industry will stimulate demand for circularity and sustainable materials and products. 2. Changing customer preferences Customers' needs are evolving and there is increasing demand for more holistic solutions and services. In addition increasing reporting requirements on product attributes and increased digitalisation in distribution and retail is driving go-to-market innovation. 3. Supply side shifts A range of factors including labour shortages, automation, migration, retraining, and wage inflation is driving supply side change that is shaping our industry, while increasing investment in technology and digital solutions is creating significant value.
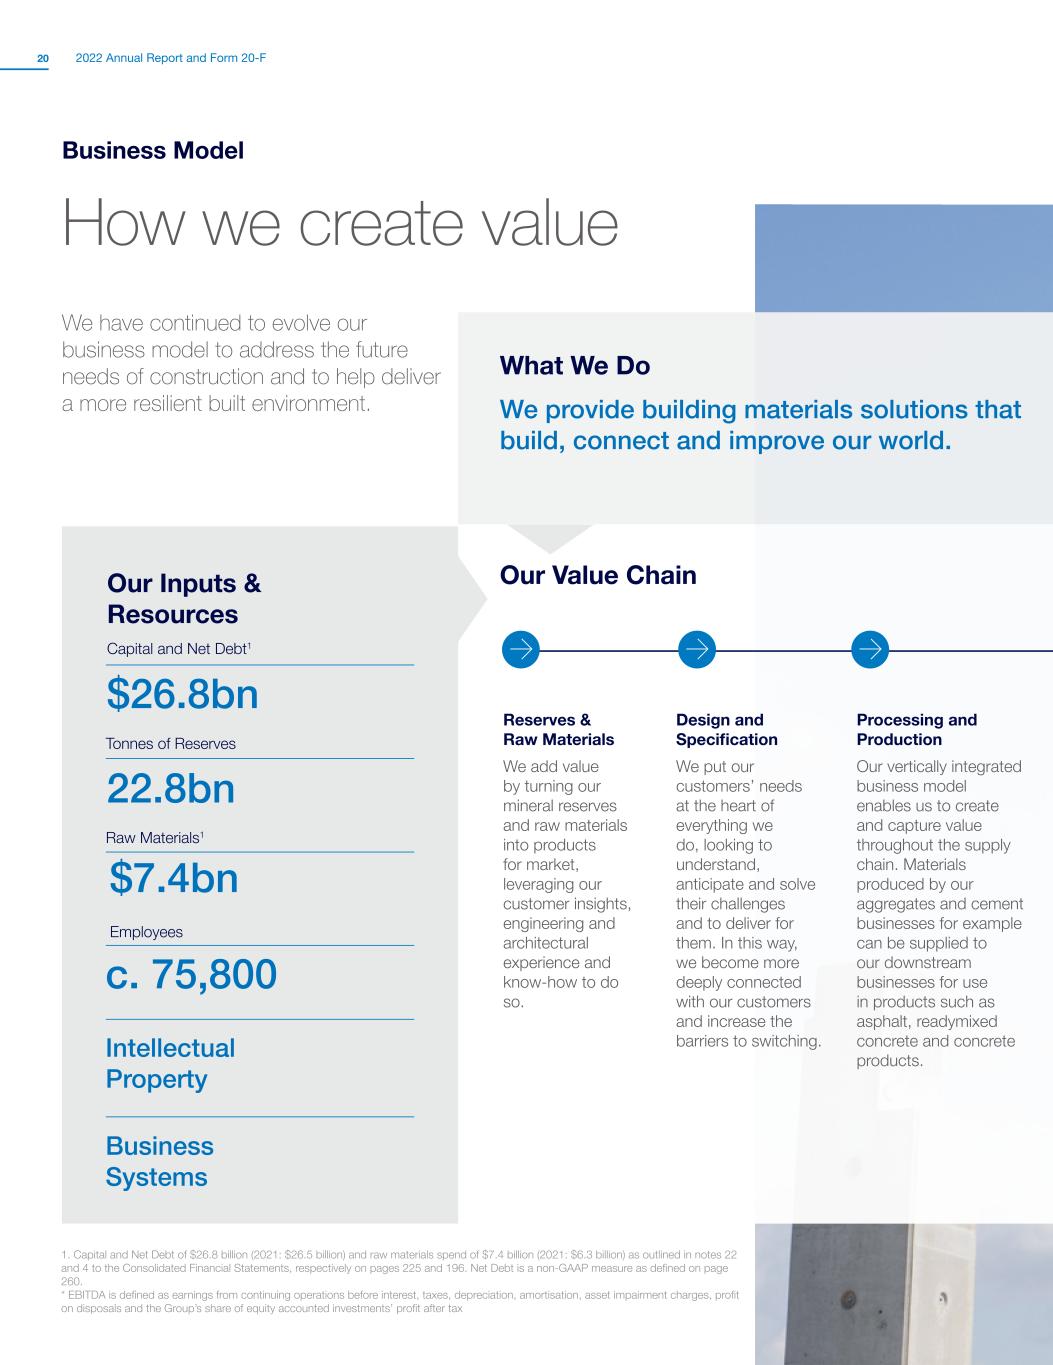
2022 Annual Report and Form 20-F20 Business Model How we create value We have continued to evolve our business model to address the future needs of construction and to help deliver a more resilient built environment. What We Do We provide building materials solutions that build, connect and improve our world. Our Value Chain Reserves & Raw Materials We add value by turning our mineral reserves and raw materials into products for market, leveraging our customer insights, engineering and architectural experience and know-how to do so. Design and Specification We put our customers’ needs at the heart of everything we do, looking to understand, anticipate and solve their challenges and to deliver for them. In this way, we become more deeply connected with our customers and increase the barriers to switching. Processing and Production Our vertically integrated business model enables us to create and capture value throughout the supply chain. Materials produced by our aggregates and cement businesses for example can be supplied to our downstream businesses for use in products such as asphalt, readymixed concrete and concrete products. Our Inputs & Resources Capital and Net Debt1 $26.8bn Tonnes of Reserves 22.8bn Raw Materials1 $7.4bn Employees c. 75,800 Intellectual Property Business Systems 1. Capital and Net Debt of $26.8 billion (2021: $26.5 billion) and raw materials spend of $7.4 billion (2021: $6.3 billion) as outlined in notes 22 and 4 to the Consolidated Financial Statements, respectively on pages 225 and 196. Net Debt is a non-GAAP measure as defined on page 260. * EBITDA is defined as earnings from continuing operations before interest, taxes, depreciation, amortisation, asset impairment charges, profit on disposals and the Group’s share of equity accounted investments’ profit after tax
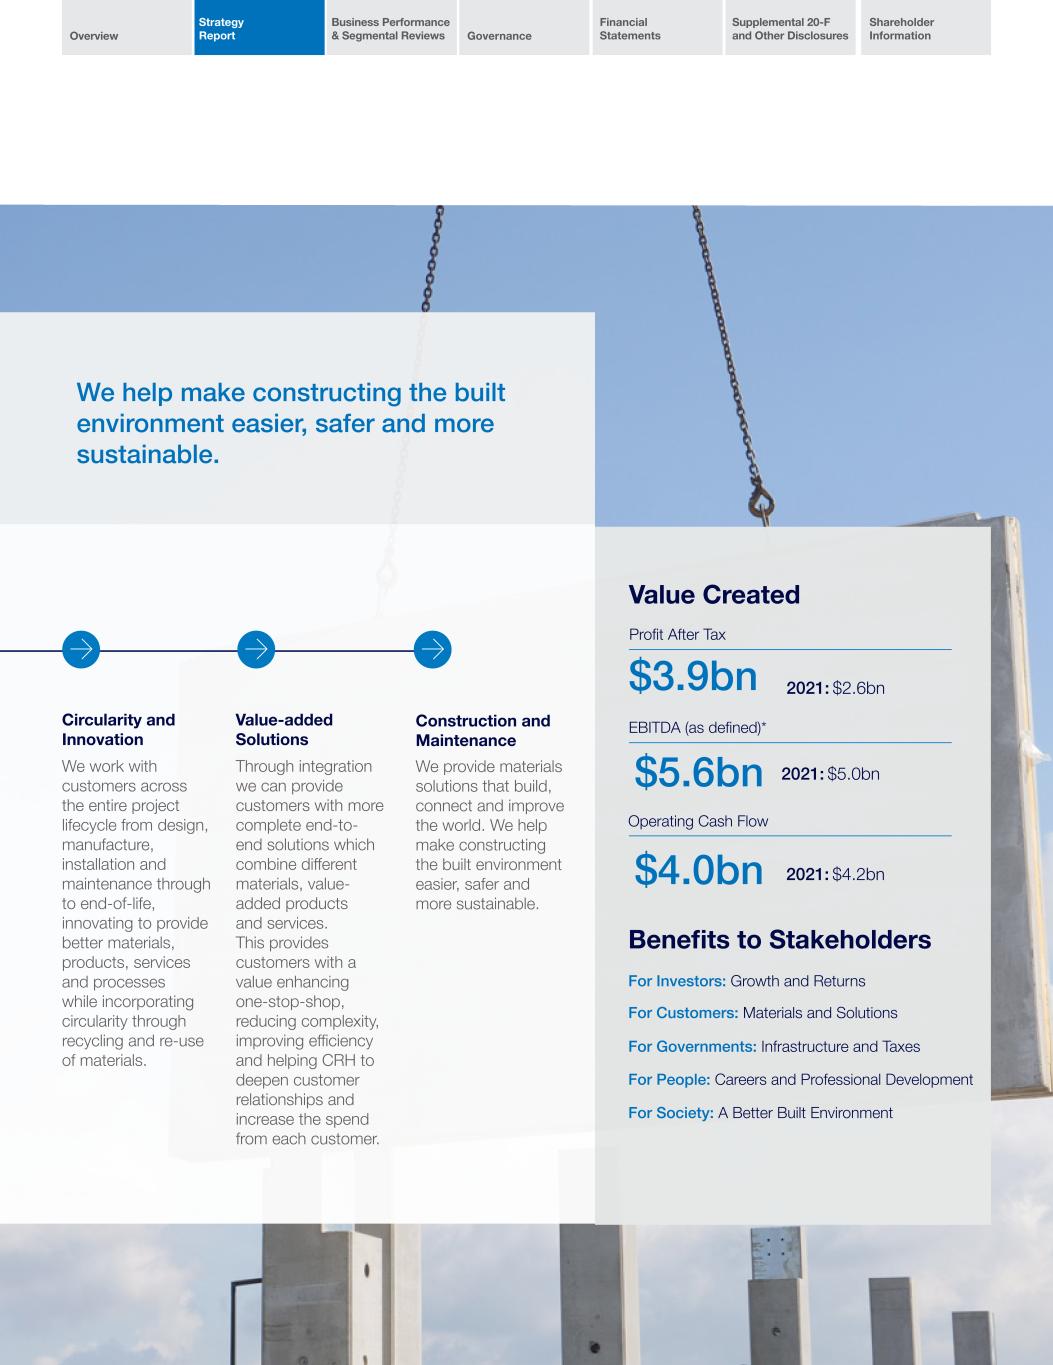
Overview Strategy Report Business Performance & Segmental Reviews Governance Financial Statements Supplemental 20-F and Other Disclosures Shareholder Information We help make constructing the built environment easier, safer and more sustainable. Circularity and Innovation We work with customers across the entire project lifecycle from design, manufacture, installation and maintenance through to end-of-life, innovating to provide better materials, products, services and processes while incorporating circularity through recycling and re-use of materials. Value-added Solutions Through integration we can provide customers with more complete end-to- end solutions which combine different materials, value- added products and services. This provides customers with a value enhancing one-stop-shop, reducing complexity, improving efficiency and helping CRH to deepen customer relationships and increase the spend from each customer. Construction and Maintenance We provide materials solutions that build, connect and improve the world. We help make constructing the built environment easier, safer and more sustainable. Value Created Profit After Tax $3.9bn 2021: $2.6bn EBITDA (as defined)* $5.6bn 2021: $5.0bn Operating Cash Flow $4.0bn 2021: $4.2bn Benefits to Stakeholders For Investors: Growth and Returns For Customers: Materials and Solutions For Governments: Infrastructure and Taxes For People: Careers and Professional Development For Society: A Better Built Environment

2022 Annual Report and Form 20-F22 Strategy in Action Delivering on our vision OUR STRATEGIC PILLARS WHY IS IT IMPORTANT TO US? WHAT ARE WE DOING? Strategic pillar #1 Empowered talent Investing in our people and growing our skills Our people are what drives our business. We are therefore committed to nurturing and empowering talent at all levels of the organisation, to ensure our continued success into the future. CRH provides a range of training and development supports and resources across our business which help us to identify and develop talent at various levels. Strategic pillar #2 Customer connected Creating preferred solutions using our materials, products and services, that exceed our customers’ expectations The construction industry is evolving and customers' needs are changing rapidly. Our integrated business model enables us to partner with our customers to create and deliver preferred solutions. We are constantly listening to our customers and gaining new insights while adapting our business to improve our ability to deliver sustainable products and solutions that address the real underlying needs of customers. Strategic pillar #3 Focused growth Expanding and building our strength through scale, shape and making our businesses better Our customers have an increasing need for more holistic solutions, CRH can maximise its overall growth potential by focusing on its ability to deliver solutions that meet this growing need. We are focused on delivering our integrated solutions strategy and to do so we are working to better connect our people, capabilities, assets and customers across businesses, markets and geographies. Strategic pillar #4 Sustainability leadership Actively improving the built environment by integrating sustainability into everything we do We recognise the impact of construction on our world and CRH's unique ability to create value through action on sustainability and integrating our materials, products and services into solutions that contribute to a more sustainable built environment. In 2022 we developed a new sustainability framework which prioritises three rapidly emerging and hard to solve global challenges for the built environment and society - decarbonisation, waste and water. CRH is well placed to help address these challenges. Through our sustainability framework we will drive actions to continuously improve our sustainability performance, further develop our integrated portfolio of products, services and solutions and invest in innovation to create significant value for our business and for society.
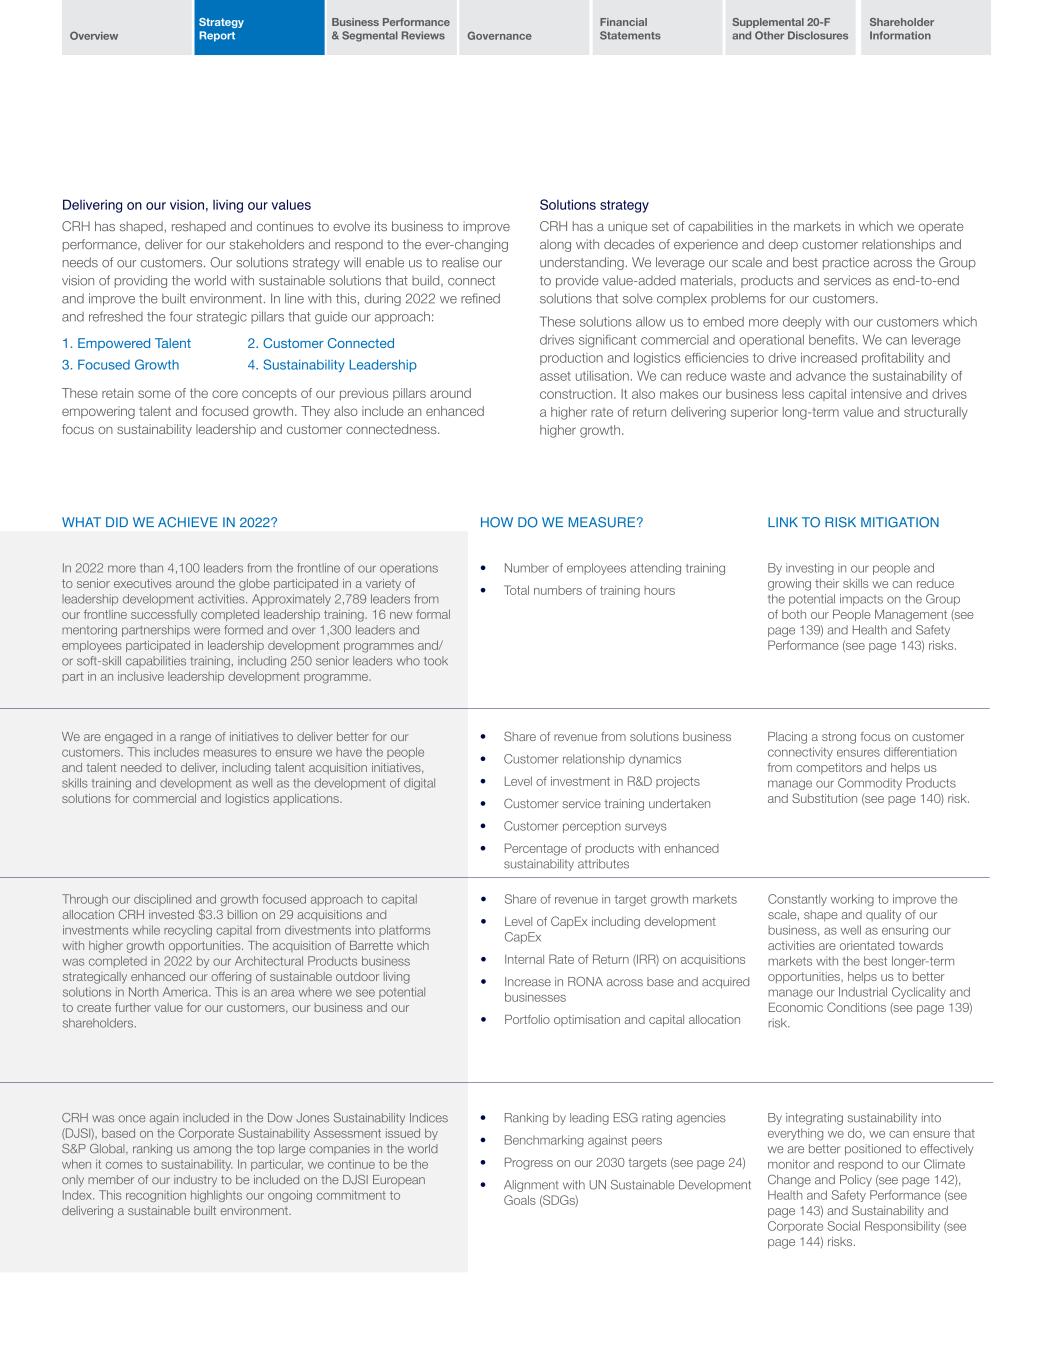
Overview Strategy Report Business Performance & Segmental Reviews Governance Financial Statements Supplemental 20-F and Other Disclosures Shareholder Information Strategic pillar #1 Empowered talent Investing in our people and growing our skills Our people are what drives our business. We are therefore committed to nurturing and empowering talent at all levels of the organisation, to ensure our continued success into the future. CRH provides a range of training and development supports and resources across our business which help us to identify and develop talent at various levels. Delivering on our vision, living our values CRH has shaped, reshaped and continues to evolve its business to improve performance, deliver for our stakeholders and respond to the ever-changing needs of our customers. Our solutions strategy will enable us to realise our vision of providing the world with sustainable solutions that build, connect and improve the built environment. In line with this, during 2022 we refined and refreshed the four strategic pillars that guide our approach: 1. Empowered Talent 2. Customer Connected 3. Focused Growth 4. Sustainability Leadership These retain some of the core concepts of our previous pillars around empowering talent and focused growth. They also include an enhanced focus on sustainability leadership and customer connectedness. Solutions strategy CRH has a unique set of capabilities in the markets in which we operate along with decades of experience and deep customer relationships and understanding. We leverage our scale and best practice across the Group to provide value-added materials, products and services as end-to-end solutions that solve complex problems for our customers. These solutions allow us to embed more deeply with our customers which drives significant commercial and operational benefits. We can leverage production and logistics efficiencies to drive increased profitability and asset utilisation. We can reduce waste and advance the sustainability of construction. It also makes our business less capital intensive and drives a higher rate of return delivering superior long-term value and structurally higher growth. WHAT DID WE ACHIEVE IN 2022? HOW DO WE MEASURE? LINK TO RISK MITIGATION In 2022 more than 4,100 leaders from the frontline of our operations to senior executives around the globe participated in a variety of leadership development activities. Approximately 2,789 leaders from our frontline successfully completed leadership training. 16 new formal mentoring partnerships were formed and over 1,300 leaders and employees participated in leadership development programmes and/ or soft-skill capabilities training, including 250 senior leaders who took part in an inclusive leadership development programme. • Number of employees attending training • Total numbers of training hours By investing in our people and growing their skills we can reduce the potential impacts on the Group of both our People Management (see page 139) and Health and Safety Performance (see page 143) risks. We are engaged in a range of initiatives to deliver better for our customers. This includes measures to ensure we have the people and talent needed to deliver, including talent acquisition initiatives, skills training and development as well as the development of digital solutions for commercial and logistics applications. • Share of revenue from solutions business • Customer relationship dynamics • Level of investment in R&D projects • Customer service training undertaken • Customer perception surveys • Percentage of products with enhanced sustainability attributes Placing a strong focus on customer connectivity ensures differentiation from competitors and helps us manage our Commodity Products and Substitution (see page 140) risk. Through our disciplined and growth focused approach to capital allocation CRH invested $3.3 billion on 29 acquisitions and investments while recycling capital from divestments into platforms with higher growth opportunities. The acquisition of Barrette which was completed in 2022 by our Architectural Products business strategically enhanced our offering of sustainable outdoor living solutions in North America. This is an area where we see potential to create further value for our customers, our business and our shareholders. • Share of revenue in target growth markets • Level of CapEx including development CapEx • Internal Rate of Return (IRR) on acquisitions • Increase in RONA across base and acquired businesses • Portfolio optimisation and capital allocation Constantly working to improve the scale, shape and quality of our business, as well as ensuring our activities are orientated towards markets with the best longer-term opportunities, helps us to better manage our Industrial Cyclicality and Economic Conditions (see page 139) risk. CRH was once again included in the Dow Jones Sustainability Indices (DJSI), based on the Corporate Sustainability Assessment issued by S&P Global, ranking us among the top large companies in the world when it comes to sustainability. In particular, we continue to be the only member of our industry to be included on the DJSI European Index. This recognition highlights our ongoing commitment to delivering a sustainable built environment. • Ranking by leading ESG rating agencies • Benchmarking against peers • Progress on our 2030 targets (see page 24) • Alignment with UN Sustainable Development Goals (SDGs) By integrating sustainability into everything we do, we can ensure that we are better positioned to effectively monitor and respond to our Climate Change and Policy (see page 142), Health and Safety Performance (see page 143) and Sustainability and Corporate Social Responsibility (see page 144) risks.

2022 Annual Report and Form 20-F24 Solutions for a Sustainable Future Creating value by reinventing the way our world is built For over 50 years, CRH has continually transformed, adapted and reinvented, while delivering sustainable value and creating integrated solutions that contribute to a better built environment. The products we make and the services we provide are essential to life and living, contributing to safer, cleaner and more sustainable homes, cities and critical infrastructure. However, the world that we see emerging today is more complex than ever. The global population is currently 8 billion and is expected to increase by 2 billion people in the next 30 years, with much of this growth predicted in urban areas. With cities already at capacity, there are significant demands on the built environment and the infrastructure needed to support these expanding populations. To meet these demands, society must move quickly to plan for growth and provide the efficient and resilient buildings, infrastructure and utilities, such as clean water, affordable energy, transport and telecommunications, that are essential for modern life. In addition to developing this essential infrastructure, we must also address the increasing demands being put on our world’s resources. To ensure that we protect vital global resources, both public and private sector leaders need to take bold action to support and invest in sustainable and resilient urban infrastructure. At CRH, we recognise the need to change what is built and how we build it, as well as addressing the challenges facing our own business and industry. We are continuously focused on advancing the performance of our business, which positions sustainability matters front and centre, as we accelerate the delivery of integrated solutions that our customers need now, and in the future. As the provider of the materials, products and services that are constructing the world of tomorrow, we see significant opportunities for our business to lead the way in construction solutions to help tackle the sustainability challenges faced by the built environment and position CRH for future growth and improved performance. We are embracing our responsibility to society and evolving as a business to successfully address the macro trends that are redefining our industry. Our new sustainability framework identifies three rapidly emerging and hard to address global challenges for the built environment and society - decarbonisation, waste and water. CRH is well placed to help solve these challenges by taking action within our own operations and beyond, and thereby helping to improve the quality of the world we live in. We are creating value-added solutions for each of these global challenges to ensure that we can continue to drive growth and value for our business and design our products and solutions based on the needs of our customers and society. By positioning sustainability at the core of modern construction, CRH is helping to create and maintain healthy, low-carbon and more circular buildings, infrastructure and communities, while also supporting the United Nations Sustainable Development Goals (SDGs).
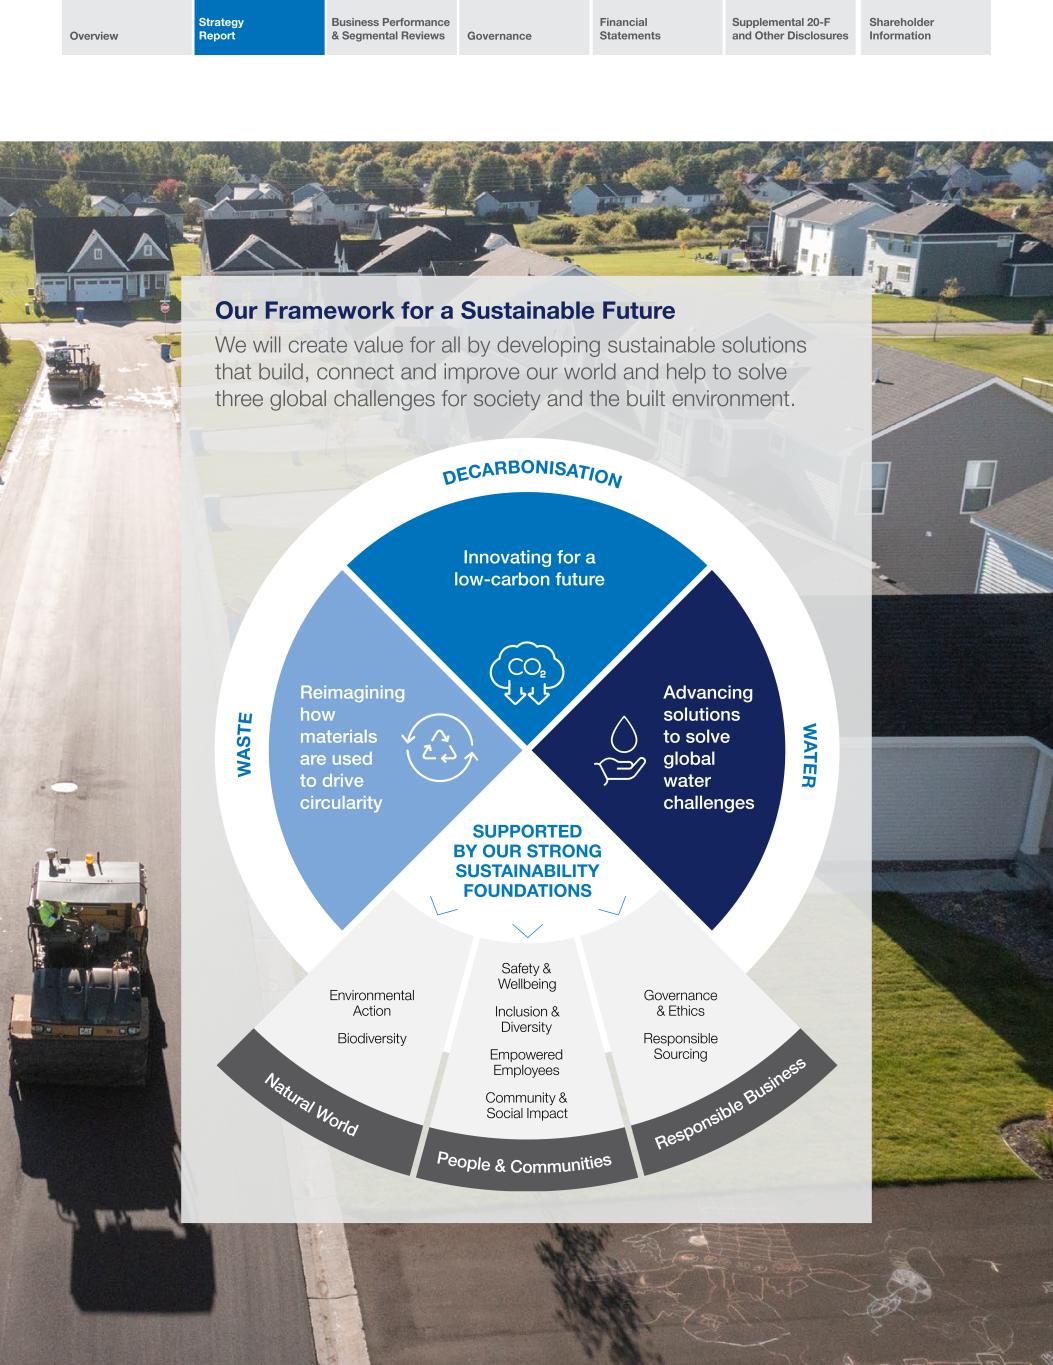
Overview Strategy Report Business Performance & Segmental Reviews Governance Financial Statements Supplemental 20-F and Other Disclosures Shareholder Information Our Framework for a Sustainable Future We will create value for all by developing sustainable solutions that build, connect and improve our world and help to solve three global challenges for society and the built environment. DECARBONISATION W AS TE W ATER Innovating for a low-carbon future SUPPORTED BY OUR STRONG SUSTAINABILITY FOUNDATIONS Reimagining how materials are used to drive circularity Environmental Action Biodiversity Governance & Ethics Responsible Sourcing Safety & Wellbeing Inclusion & Diversity Empowered Employees Community & Social Impact Advancing solutions to solve global water challenges Natural World People & Communities Responsible Business
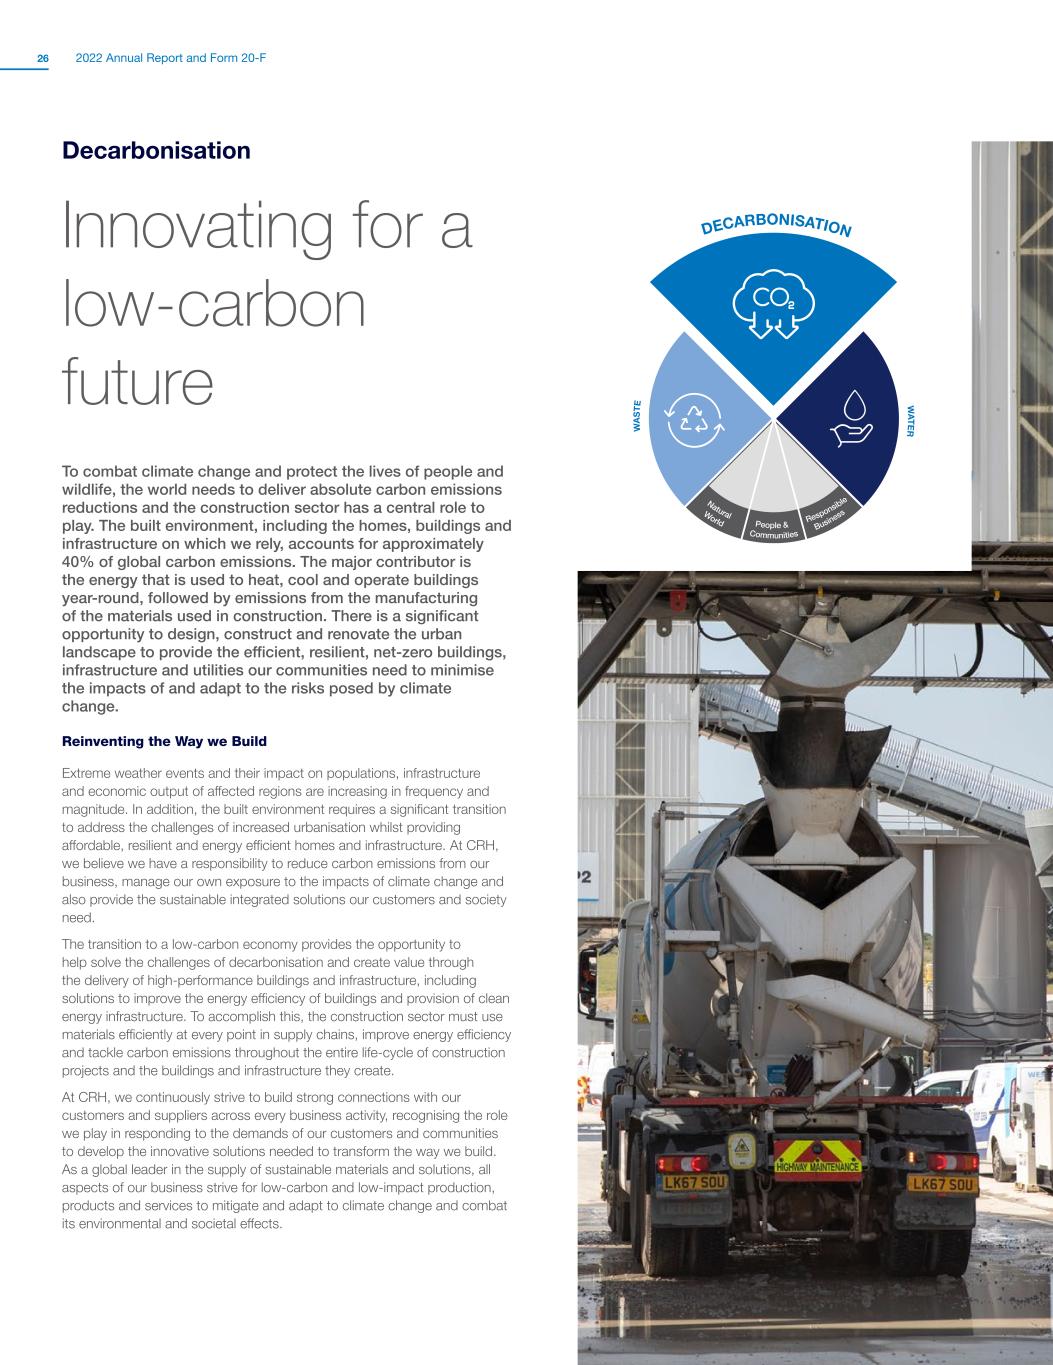
2022 Annual Report and Form 20-F26 DECARBONISATION W AS TE W ATER Innovating for a low-carbon future World Communities Business Natural People & Responsible DECARBONISATION Decarbonisation Innovating for a low-carbon future To combat climate change and protect the lives of people and wildlife, the world needs to deliver absolute carbon emissions reductions and the construction sector has a central role to play. The built environment, including the homes, buildings and infrastructure on which we rely, accounts for approximately 40% of global carbon emissions. The major contributor is the energy that is used to heat, cool and operate buildings year-round, followed by emissions from the manufacturing of the materials used in construction. There is a significant opportunity to design, construct and renovate the urban landscape to provide the efficient, resilient, net-zero buildings, infrastructure and utilities our communities need to minimise the impacts of and adapt to the risks posed by climate change. Reinventing the Way we Build Extreme weather events and their impact on populations, infrastructure and economic output of affected regions are increasing in frequency and magnitude. In addition, the built environment requires a significant transition to address the challenges of increased urbanisation whilst providing affordable, resilient and energy efficient homes and infrastructure. At CRH, we believe we have a responsibility to reduce carbon emissions from our business, manage our own exposure to the impacts of climate change and also provide the sustainable integrated solutions our customers and society need. The transition to a low-carbon economy provides the opportunity to help solve the challenges of decarbonisation and create value through the delivery of high-performance buildings and infrastructure, including solutions to improve the energy efficiency of buildings and provision of clean energy infrastructure. To accomplish this, the construction sector must use materials efficiently at every point in supply chains, improve energy efficiency and tackle carbon emissions throughout the entire life-cycle of construction projects and the buildings and infrastructure they create. At CRH, we continuously strive to build strong connections with our customers and suppliers across every business activity, recognising the role we play in responding to the demands of our customers and communities to develop the innovative solutions needed to transform the way we build. As a global leader in the supply of sustainable materials and solutions, all aspects of our business strive for low-carbon and low-impact production, products and services to mitigate and adapt to climate change and combat its environmental and societal effects.
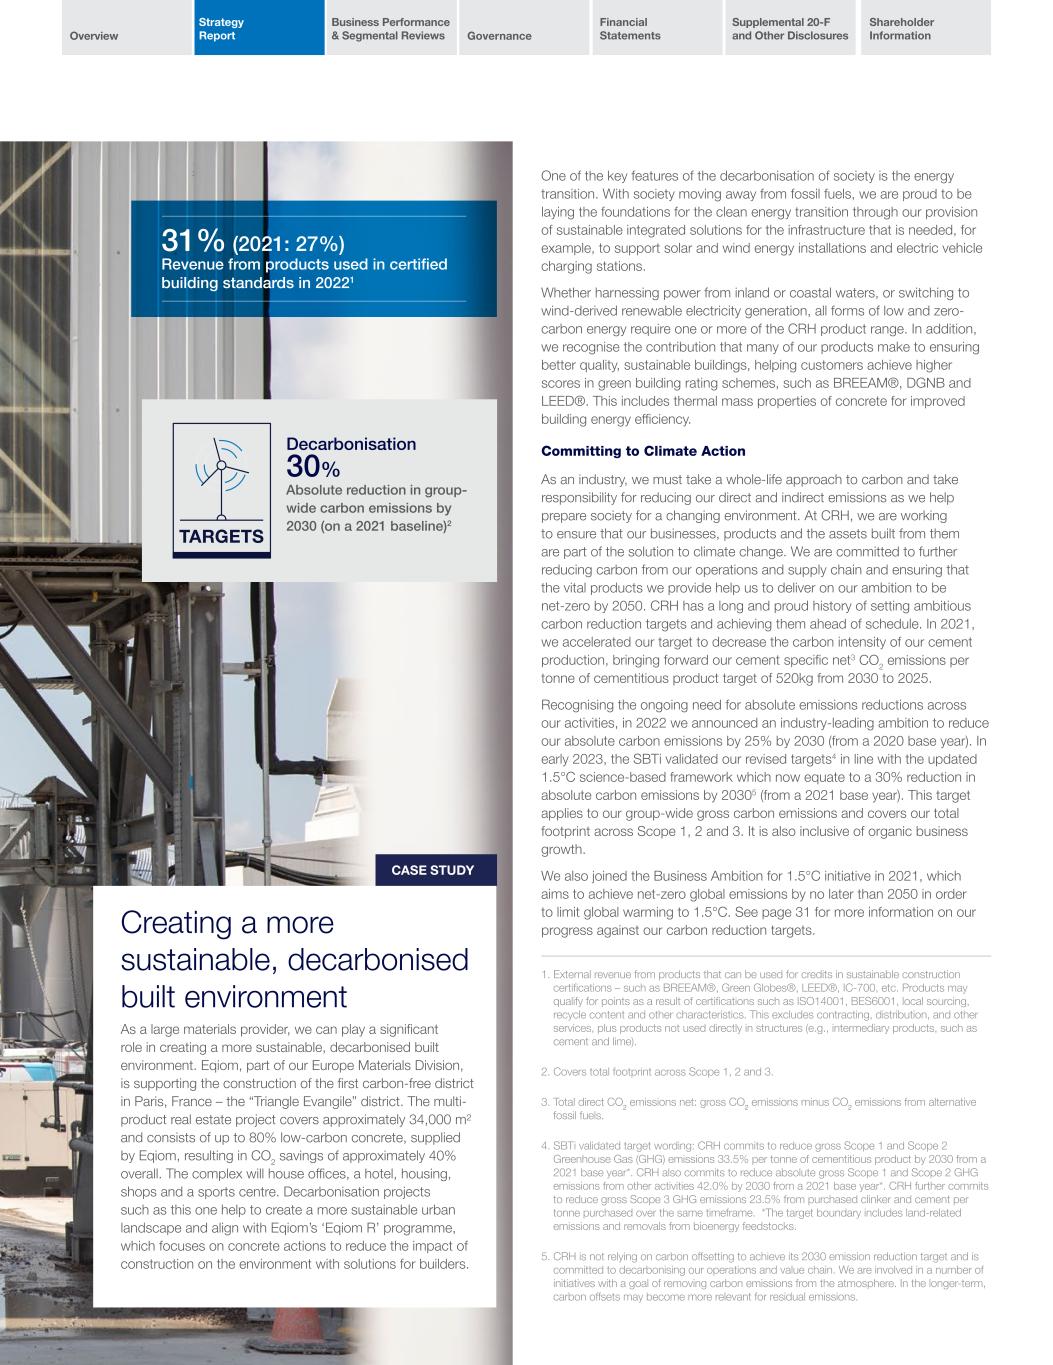
Overview Strategy Report Business Performance & Segmental Reviews Governance Financial Statements Supplemental 20-F and Other Disclosures Shareholder Information One of the key features of the decarbonisation of society is the energy transition. With society moving away from fossil fuels, we are proud to be laying the foundations for the clean energy transition through our provision of sustainable integrated solutions for the infrastructure that is needed, for example, to support solar and wind energy installations and electric vehicle charging stations. Whether harnessing power from inland or coastal waters, or switching to wind-derived renewable electricity generation, all forms of low and zero- carbon energy require one or more of the CRH product range. In addition, we recognise the contribution that many of our products make to ensuring better quality, sustainable buildings, helping customers achieve higher scores in green building rating schemes, such as BREEAM®, DGNB and LEED®. This includes thermal mass properties of concrete for improved building energy efficiency. Committing to Climate Action As an industry, we must take a whole-life approach to carbon and take responsibility for reducing our direct and indirect emissions as we help prepare society for a changing environment. At CRH, we are working to ensure that our businesses, products and the assets built from them are part of the solution to climate change. We are committed to further reducing carbon from our operations and supply chain and ensuring that the vital products we provide help us to deliver on our ambition to be net-zero by 2050. CRH has a long and proud history of setting ambitious carbon reduction targets and achieving them ahead of schedule. In 2021, we accelerated our target to decrease the carbon intensity of our cement production, bringing forward our cement specific net3 CO2 emissions per tonne of cementitious product target of 520kg from 2030 to 2025. Recognising the ongoing need for absolute emissions reductions across our activities, in 2022 we announced an industry-leading ambition to reduce our absolute carbon emissions by 25% by 2030 (from a 2020 base year). In early 2023, the SBTi validated our revised targets4 in line with the updated 1.5°C science-based framework which now equate to a 30% reduction in absolute carbon emissions by 20305 (from a 2021 base year). This target applies to our group-wide gross carbon emissions and covers our total footprint across Scope 1, 2 and 3. It is also inclusive of organic business growth. We also joined the Business Ambition for 1.5°C initiative in 2021, which aims to achieve net-zero global emissions by no later than 2050 in order to limit global warming to 1.5°C. See page 31 for more information on our progress against our carbon reduction targets. 1. External revenue from products that can be used for credits in sustainable construction certifications – such as BREEAM®, Green Globes®, LEED®, IC-700, etc. Products may qualify for points as a result of certifications such as ISO14001, BES6001, local sourcing, recycle content and other characteristics. This excludes contracting, distribution, and other services, plus products not used directly in structures (e.g., intermediary products, such as cement and lime). 2. Covers total footprint across Scope 1, 2 and 3. 3. Total direct CO2 emissions net: gross CO2 emissions minus CO2 emissions from alternative fossil fuels. 4. SBTi validated target wording: CRH commits to reduce gross Scope 1 and Scope 2 Greenhouse Gas (GHG) emissions 33.5% per tonne of cementitious product by 2030 from a 2021 base year*. CRH also commits to reduce absolute gross Scope 1 and Scope 2 GHG emissions from other activities 42.0% by 2030 from a 2021 base year*. CRH further commits to reduce gross Scope 3 GHG emissions 23.5% from purchased clinker and cement per tonne purchased over the same timeframe. *The target boundary includes land-related emissions and removals from bioenergy feedstocks. 5. CRH is not relying on carbon offsetting to achieve its 2030 emission reduction target and is committed to decarbonising our operations and value chain. We are involved in a number of initiatives with a goal of removing carbon emissions from the atmosphere. In the longer-term, carbon offsets may become more relevant for residual emissions. 31% (2021: 27%) Revenue from products used in certified building standards in 20221 CASE STUDY Creating a more sustainable, decarbonised built environment As a large materials provider, we can play a significant role in creating a more sustainable, decarbonised built environment. Eqiom, part of our Europe Materials Division, is supporting the construction of the first carbon-free district in Paris, France – the “Triangle Evangile” district. The multi- product real estate project covers approximately 34,000 m² and consists of up to 80% low-carbon concrete, supplied by Eqiom, resulting in CO2 savings of approximately 40% overall. The complex will house offices, a hotel, housing, shops and a sports centre. Decarbonisation projects such as this one help to create a more sustainable urban landscape and align with Eqiom’s ‘Eqiom R’ programme, which focuses on concrete actions to reduce the impact of construction on the environment with solutions for builders. Decarbonisation 30% Absolute reduction in group- wide carbon emissions by 2030 (on a 2021 baseline)2
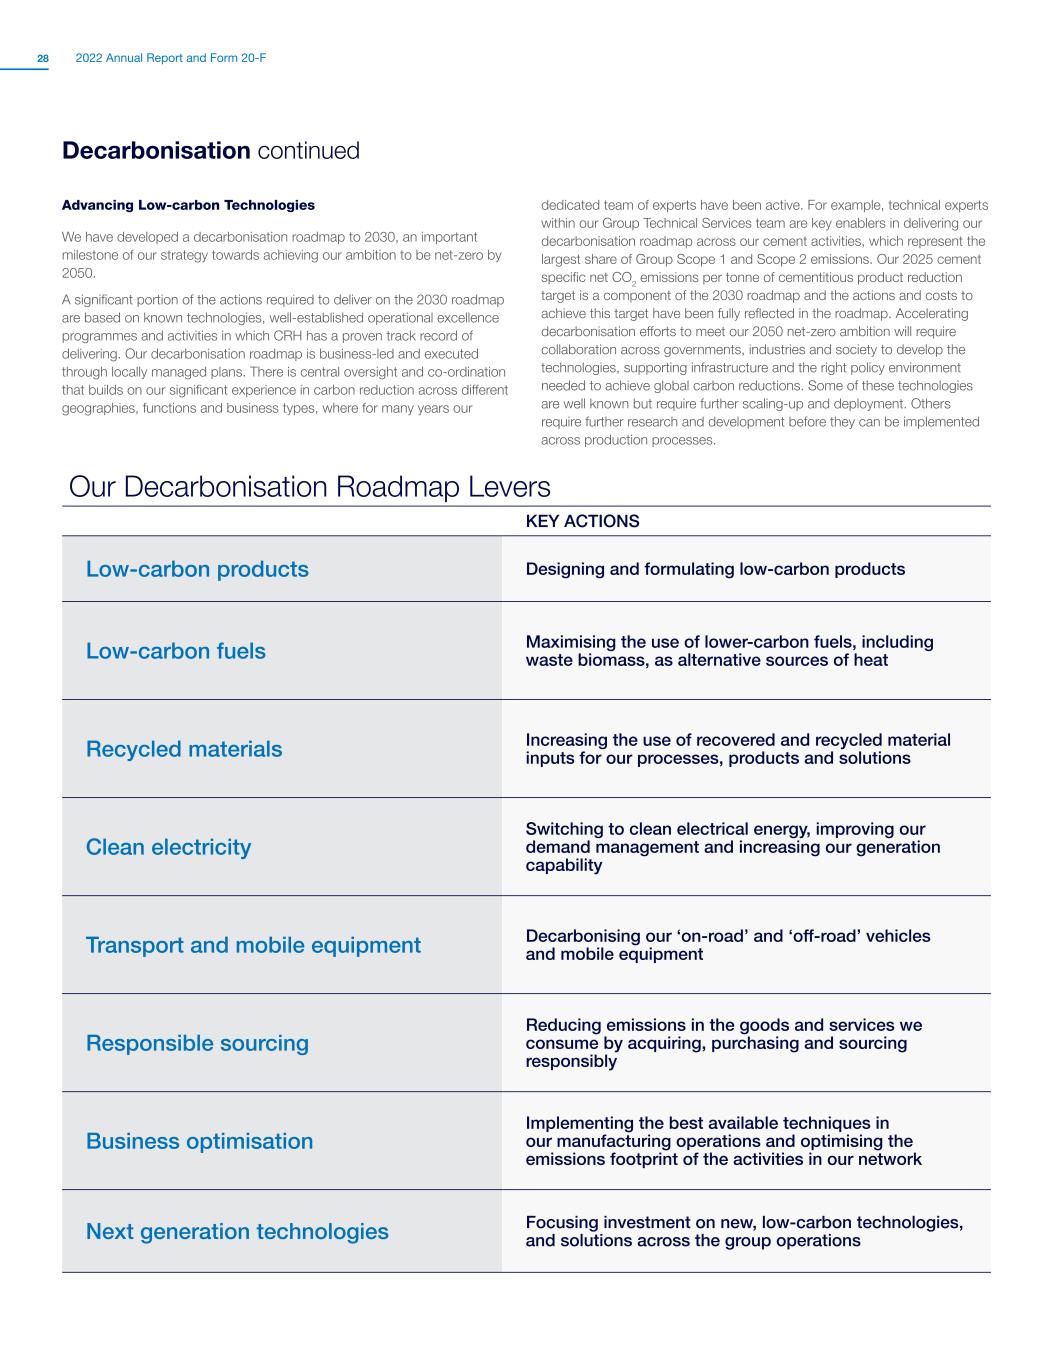
2022 Annual Report and Form 20-F28 Decarbonisation continued Advancing Low-carbon Technologies We have developed a decarbonisation roadmap to 2030, an important milestone of our strategy towards achieving our ambition to be net-zero by 2050. A significant portion of the actions required to deliver on the 2030 roadmap are based on known technologies, well-established operational excellence programmes and activities in which CRH has a proven track record of delivering. Our decarbonisation roadmap is business-led and executed through locally managed plans. There is central oversight and co-ordination that builds on our significant experience in carbon reduction across different geographies, functions and business types, where for many years our dedicated team of experts have been active. For example, technical experts within our Group Technical Services team are key enablers in delivering our decarbonisation roadmap across our cement activities, which represent the largest share of Group Scope 1 and Scope 2 emissions. Our 2025 cement specific net CO2 emissions per tonne of cementitious product reduction target is a component of the 2030 roadmap and the actions and costs to achieve this target have been fully reflected in the roadmap. Accelerating decarbonisation efforts to meet our 2050 net-zero ambition will require collaboration across governments, industries and society to develop the technologies, supporting infrastructure and the right policy environment needed to achieve global carbon reductions. Some of these technologies are well known but require further scaling-up and deployment. Others require further research and development before they can be implemented across production processes. Our Decarbonisation Roadmap Levers KEY ACTIONS Low-carbon products Designing and formulating low-carbon products Low-carbon fuels Maximising the use of lower-carbon fuels, including waste biomass, as alternative sources of heat Recycled materials Increasing the use of recovered and recycled material inputs for our processes, products and solutions Clean electricity Switching to clean electrical energy, improving our demand management and increasing our generation capability Transport and mobile equipment Decarbonising our ‘on-road’ and ‘off-road’ vehicles and mobile equipment Responsible sourcing Reducing emissions in the goods and services we consume by acquiring, purchasing and sourcing responsibly Business optimisation Implementing the best available techniques in our manufacturing operations and optimising the emissions footprint of the activities in our network Next generation technologies Focusing investment on new, low-carbon technologies, and solutions across the group operations

Overview Strategy Report Business Performance & Segmental Reviews Governance Financial Statements Supplemental 20-F and Other Disclosures Shareholder Information EXAMPLES OF PROGRESS DURING 2022 We continue to drive carbon emission reduction in our cement and concrete products through the replacement of high CO2 clinker with traditional supplementary materials such as limestone, slag and fly ash. In addition, new materials such as natural pozzolans and calcined clay were introduced into our wider product mix, a result of our Group-led research over previous years. We are an industry leader in the use of low-carbon and alternative fuels. Our in-house technical experts continue to develop knowledge and guide our businesses in using alternative and waste biomass fuels to reduce carbon emissions. For example, Jura Cement, part of our Europe Materials Division, is using 80% waste-derived alternative fuels. In addition, in 2022 numerous trials were undertaken with external partners in North America and Europe to replace fossil fuels, such as diesel, with Hydrotreated Vegetable Oil (HVO) in our operations and on-site mobile equipment and develop new innovative solutions to reduce CO2 emissions. We are an industry-leading recycler of asphalt and the largest recycler of building materials in North America. Approximately 25% of every mile of road we build is from recycled materials. In addition, our MoistureShield decking product from Oldcastle APG, part of our Building Products Division, is made with 95% recycled content. In Finland, Rudus, part of our Europe Materials Division, offers recycled alternatives to virgin concretes and aggregates. Up to 30% of natural aggregates in our Uuma-concrete products can be replaced with recycled aggregates, hence substantially contributing to CO2 reduction and saving of scarce natural resources. We actively continue to target an increase of renewable energy across our operations. We are increasingly focused on procuring power from renewable sources, such as on-site solar installations at Leviat’s production site in Melbourne, Australia, part of our Building Products Division, which will cut energy costs on-site by 35%. We are also supporting the global transition to clean electricity. For example, Staker Parson, part of our Americas Materials Division, collaborated to install a wind farm at its Gomex Pit location in Utah, reducing pressures on the national power infrastructure. Delivering an increasingly sustainable transport model across road, rail and water is a key part of our transition to a low-carbon economy. This includes the electrification of vehicles and mobile equipment. For example, Tarmac, part of our Europe Materials Division, has committed to transitioning its fleet of corporate cars and vans to electric vehicles by 2030. In 2022 Tarmac acquired the first electric battery concrete mixer truck in the United Kingdom (UK) at its Washwood Heath site in Birmingham, marking a significant milestone for both the business and wider UK construction industry as part of a continued drive towards net-zero. We are increasing our efforts to reduce the CO2 emissions throughout our entire value chain, with specific focus on emissions from purchased goods and materials, transportation, and fuels and energy. We actively participate in cross-industrial cooperation to drive decarbonisation across all levers. In 2022 CRH and Shell created a strategic alliance to explore decarbonisation opportunities across transport, operations, and materials. The solutions include, but are not limited to, vehicle electrification and charging infrastructure to reduce transport emissions; deploying low-carbon fuels for off-road equipment and renewable electricity to power facilities. We continue to invest in and guide our plants in achieving best-in-class production efficiency and operational excellence and pride ourselves on continuously measuring and improving our operations. For example, within our cement businesses, we work to improve kiln energy efficiency and specific power consumption across our locations. Further efficiency is achieved through the internal integration of our operations and resources. For example, at Tarmac’s Tunstead site, part of our Europe Materials Division, there is one established quarry servicing co-located aggregates, cement and lime production, resulting in optimised materials efficiency. CRH continues to place itself at the forefront of innovative solutions. In 2022 we introduced a Group-wide $250 million venturing and innovation fund to support our decarbonisation journey. With the support of this fund we have expanded both the number and range of research initiatives across our entire Group, including hydrogen use, CO2 mineralisation projects, novel cements, AI technology and Carbon Capture Utilisation and Storage (CCUS). CRH has been actively involved in the development of the GCCA 'Roadmap for Net Zero Concrete', CEMBUREAU, the European Cement Association, '2050 Carbon Neutrality Roadmap', the National Asphalt Pavement Association (NAPA) roadmap 'Towards Net Zero Carbon Emissions', as well as the Portland Cement Association (PCA) 'Roadmap for Carbon Neutrality'. We are also involved in the GCCA's innovation programme, 'Innovandi', which supports research and development on emerging technologies to help the industry decarbonise and produce net-zero concrete by 2050. Our decarbonisation roadmap levers, highlighted below, focus on the key technological and operational areas to drive net-zero aligned decarbonisation.
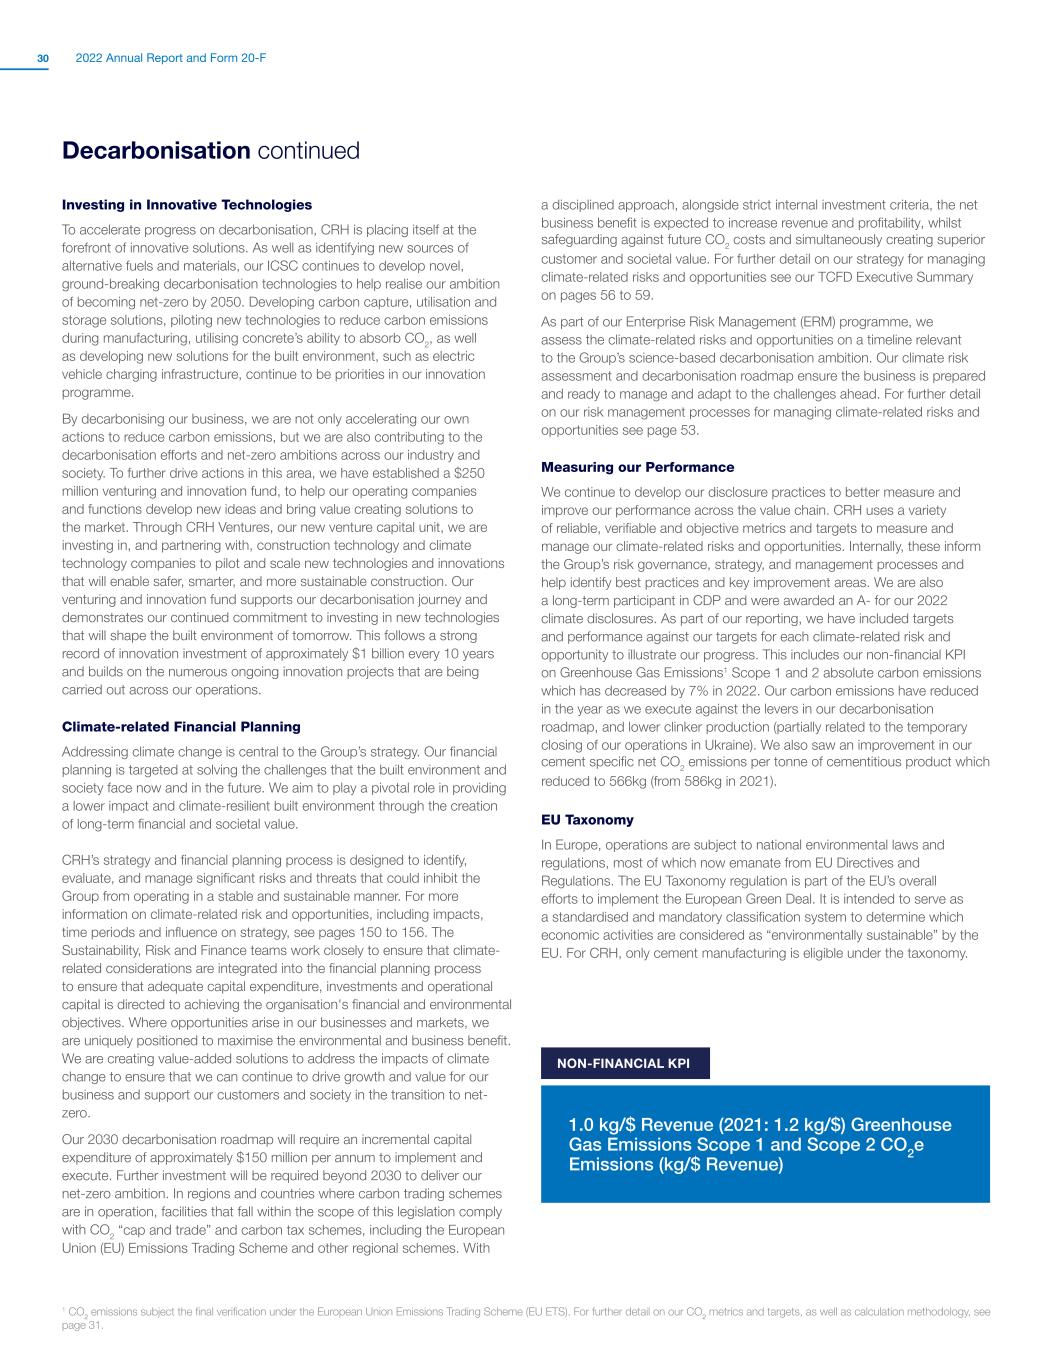
2022 Annual Report and Form 20-F30 Decarbonisation continued Investing in Innovative Technologies To accelerate progress on decarbonisation, CRH is placing itself at the forefront of innovative solutions. As well as identifying new sources of alternative fuels and materials, our ICSC continues to develop novel, ground-breaking decarbonisation technologies to help realise our ambition of becoming net-zero by 2050. Developing carbon capture, utilisation and storage solutions, piloting new technologies to reduce carbon emissions during manufacturing, utilising concrete’s ability to absorb CO2, as well as developing new solutions for the built environment, such as electric vehicle charging infrastructure, continue to be priorities in our innovation programme. By decarbonising our business, we are not only accelerating our own actions to reduce carbon emissions, but we are also contributing to the decarbonisation efforts and net-zero ambitions across our industry and society. To further drive actions in this area, we have established a $250 million venturing and innovation fund, to help our operating companies and functions develop new ideas and bring value creating solutions to the market. Through CRH Ventures, our new venture capital unit, we are investing in, and partnering with, construction technology and climate technology companies to pilot and scale new technologies and innovations that will enable safer, smarter, and more sustainable construction. Our venturing and innovation fund supports our decarbonisation journey and demonstrates our continued commitment to investing in new technologies that will shape the built environment of tomorrow. This follows a strong record of innovation investment of approximately $1 billion every 10 years and builds on the numerous ongoing innovation projects that are being carried out across our operations. Climate-related Financial Planning Addressing climate change is central to the Group’s strategy. Our financial planning is targeted at solving the challenges that the built environment and society face now and in the future. We aim to play a pivotal role in providing a lower impact and climate-resilient built environment through the creation of long-term financial and societal value. CRH’s strategy and financial planning process is designed to identify, evaluate, and manage significant risks and threats that could inhibit the Group from operating in a stable and sustainable manner. For more information on climate-related risk and opportunities, including impacts, time periods and influence on strategy, see pages 150 to 156. The Sustainability, Risk and Finance teams work closely to ensure that climate- related considerations are integrated into the financial planning process to ensure that adequate capital expenditure, investments and operational capital is directed to achieving the organisation's financial and environmental objectives. Where opportunities arise in our businesses and markets, we are uniquely positioned to maximise the environmental and business benefit. We are creating value-added solutions to address the impacts of climate change to ensure that we can continue to drive growth and value for our business and support our customers and society in the transition to net- zero. Our 2030 decarbonisation roadmap will require an incremental capital expenditure of approximately $150 million per annum to implement and execute. Further investment will be required beyond 2030 to deliver our net-zero ambition. In regions and countries where carbon trading schemes are in operation, facilities that fall within the scope of this legislation comply with CO 2 “cap and trade” and carbon tax schemes, including the European Union (EU) Emissions Trading Scheme and other regional schemes. With a disciplined approach, alongside strict internal investment criteria, the net business benefit is expected to increase revenue and profitability, whilst safeguarding against future CO2 costs and simultaneously creating superior customer and societal value. For further detail on our strategy for managing climate-related risks and opportunities see our TCFD Executive Summary on pages 56 to 59. As part of our Enterprise Risk Management (ERM) programme, we assess the climate-related risks and opportunities on a timeline relevant to the Group’s science-based decarbonisation ambition. Our climate risk assessment and decarbonisation roadmap ensure the business is prepared and ready to manage and adapt to the challenges ahead. For further detail on our risk management processes for managing climate-related risks and opportunities see page 53. Measuring our Performance We continue to develop our disclosure practices to better measure and improve our performance across the value chain. CRH uses a variety of reliable, verifiable and objective metrics and targets to measure and manage our climate-related risks and opportunities. Internally, these inform the Group’s risk governance, strategy, and management processes and help identify best practices and key improvement areas. We are also a long-term participant in CDP and were awarded an A- for our 2022 climate disclosures. As part of our reporting, we have included targets and performance against our targets for each climate-related risk and opportunity to illustrate our progress. This includes our non-financial KPI on Greenhouse Gas Emissions1 Scope 1 and 2 absolute carbon emissions which has decreased by 7% in 2022. Our carbon emissions have reduced in the year as we execute against the levers in our decarbonisation roadmap, and lower clinker production (partially related to the temporary closing of our operations in Ukraine). We also saw an improvement in our cement specific net CO2 emissions per tonne of cementitious product which reduced to 566kg (from 586kg in 2021). EU Taxonomy In Europe, operations are subject to national environmental laws and regulations, most of which now emanate from EU Directives and Regulations. The EU Taxonomy regulation is part of the EU’s overall efforts to implement the European Green Deal. It is intended to serve as a standardised and mandatory classification system to determine which economic activities are considered as “environmentally sustainable” by the EU. For CRH, only cement manufacturing is eligible under the taxonomy. NON-FINANCIAL KPI 1.0 kg/$ Revenue (2021: 1.2 kg/$) Greenhouse Gas Emissions Scope 1 and Scope 2 CO2e Emissions (kg/$ Revenue) NON-FINANCIAL KPI 1 CO2 emissions subject the final verification under the European Union Emissions Trading Scheme (EU ETS). For further detail on our CO2 metrics and targets, as well as calculation methodology, see page 31.
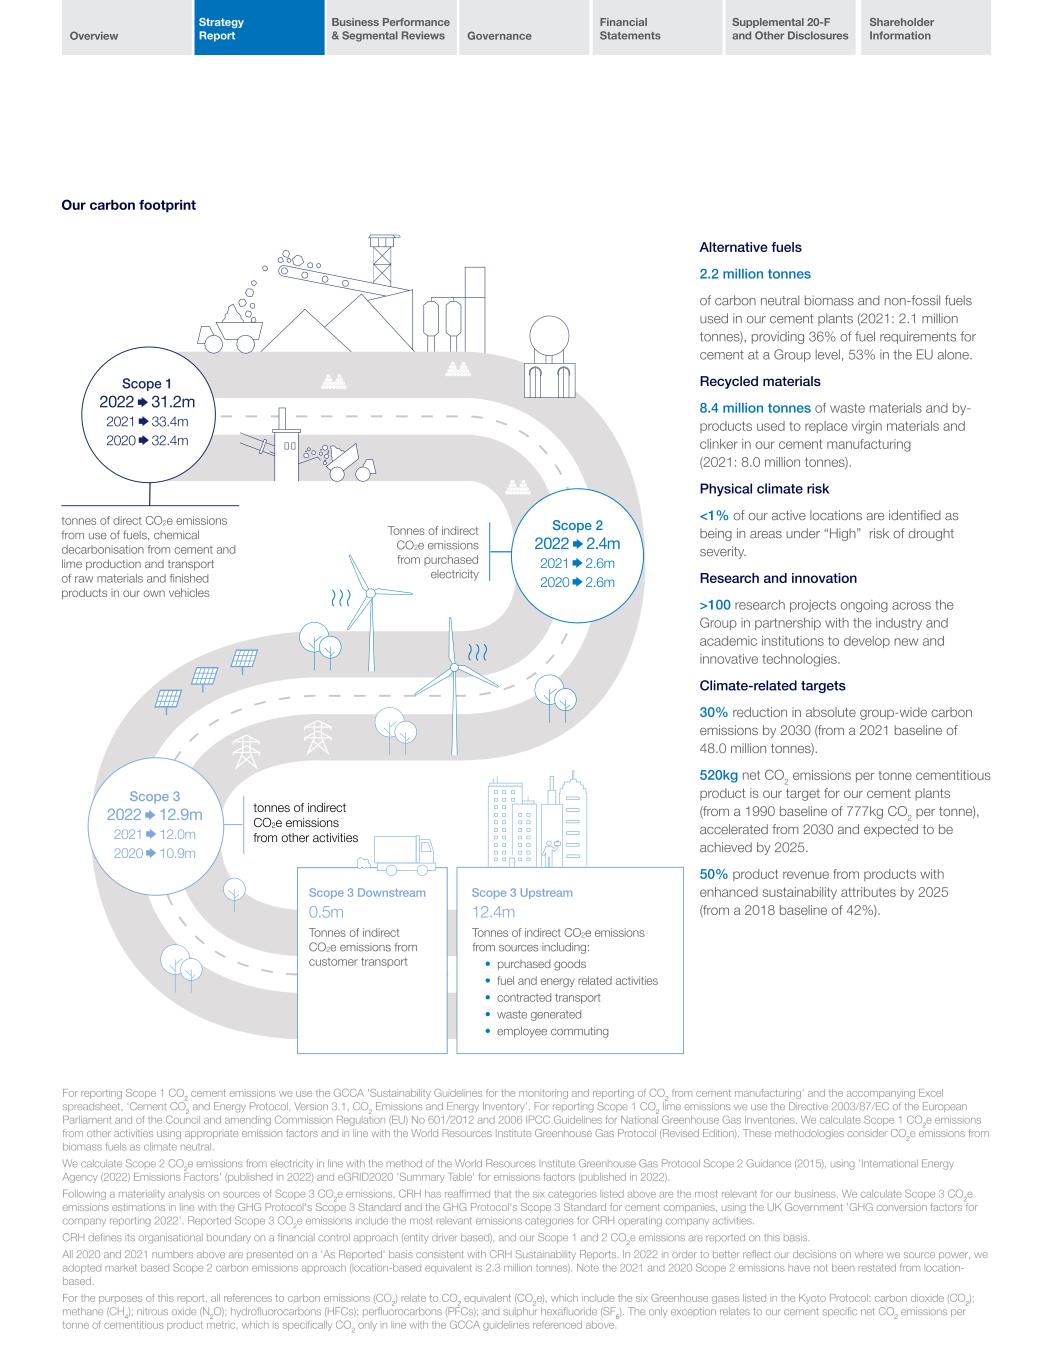
Overview Strategy Report Business Performance & Segmental Reviews Governance Financial Statements Supplemental 20-F and Other Disclosures Shareholder Information tonnes of indirect CO2e emissions from other activities Tonnes of indirect CO2e emissions from purchased electricity tonnes of direct CO2e emissions from use of fuels, chemical decarbonisation from cement and lime production and transport of raw materials and finished products in our own vehicles 0.5m Tonnes of indirect CO2e emissions from customer transport Scope 3 Downstream 12.4m Tonnes of indirect CO2e emissions from sources including: • purchased goods • fuel and energy related activities • contracted transport • waste generated • employee commuting Scope 3 Upstream Scope 1 2022 31.2m 2021 33.4m 2020 32.4m Scope 2 2022 2.4m 2021 2.6m 2020 2.6m Scope 3 2022 12.9m 2021 12.0m 2020 10.9m Our carbon footprint Alternative fuels 2.2 million tonnes of carbon neutral biomass and non-fossil fuels used in our cement plants (2021: 2.1 million tonnes), providing 36% of fuel requirements for cement at a Group level, 53% in the EU alone. Recycled materials 8.4 million tonnes of waste materials and by- products used to replace virgin materials and clinker in our cement manufacturing (2021: 8.0 million tonnes). Physical climate risk <1% of our active locations are identified as being in areas under “High” risk of drought severity. Research and innovation >100 research projects ongoing across the Group in partnership with the industry and academic institutions to develop new and innovative technologies. Climate-related targets 30% reduction in absolute group-wide carbon emissions by 2030 (from a 2021 baseline of 48.0 million tonnes). 520kg net CO 2 emissions per tonne cementitious product is our target for our cement plants (from a 1990 baseline of 777kg CO2 per tonne), accelerated from 2030 and expected to be achieved by 2025. 50% product revenue from products with enhanced sustainability attributes by 2025 (from a 2018 baseline of 42%). For reporting Scope 1 CO2 cement emissions we use the GCCA 'Sustainability Guidelines for the monitoring and reporting of CO2 from cement manufacturing' and the accompanying Excel spreadsheet, ‘Cement CO2 and Energy Protocol, Version 3.1, CO2 Emissions and Energy Inventory’. For reporting Scope 1 CO2 lime emissions we use the Directive 2003/87/EC of the European Parliament and of the Council and amending Commission Regulation (EU) No 601/2012 and 2006 IPCC Guidelines for National Greenhouse Gas Inventories. We calculate Scope 1 CO2e emissions from other activities using appropriate emission factors and in line with the World Resources Institute Greenhouse Gas Protocol (Revised Edition). These methodologies consider CO2e emissions from biomass fuels as climate neutral. We calculate Scope 2 CO2e emissions from electricity in line with the method of the World Resources Institute Greenhouse Gas Protocol Scope 2 Guidance (2015), using 'International Energy Agency (2022) Emissions Factors' (published in 2022) and eGRID2020 'Summary Table' for emissions factors (published in 2022). Following a materiality analysis on sources of Scope 3 CO2e emissions, CRH has reaffirmed that the six categories listed above are the most relevant for our business. We calculate Scope 3 CO2e emissions estimations in line with the GHG Protocol's Scope 3 Standard and the GHG Protocol's Scope 3 Standard for cement companies, using the UK Government 'GHG conversion factors for company reporting 2022'. Reported Scope 3 CO2e emissions include the most relevant emissions categories for CRH operating company activities. CRH defines its organisational boundary on a financial control approach (entity driver based), and our Scope 1 and 2 CO2e emissions are reported on this basis. All 2020 and 2021 numbers above are presented on a 'As Reported' basis consistent with CRH Sustainability Reports. In 2022 in order to better reflect our decisions on where we source power, we adopted market based Scope 2 carbon emissions approach (location-based equivalent is 2.3 million tonnes). Note the 2021 and 2020 Scope 2 emissions have not been restated from location- based. For the purposes of this report, all references to carbon emissions (CO2) relate to CO2 equivalent (CO2e), which include the six Greenhouse gases listed in the Kyoto Protocol: carbon dioxide (CO2); methane (CH4); nitrous oxide (N2O); hydrofluorocarbons (HFCs); perfluorocarbons (PFCs); and sulphur hexafluoride (SF6). The only exception relates to our cement specific net CO2 emissions per tonne of cementitious product metric, which is specifically CO2 only in line with the GCCA guidelines referenced above.
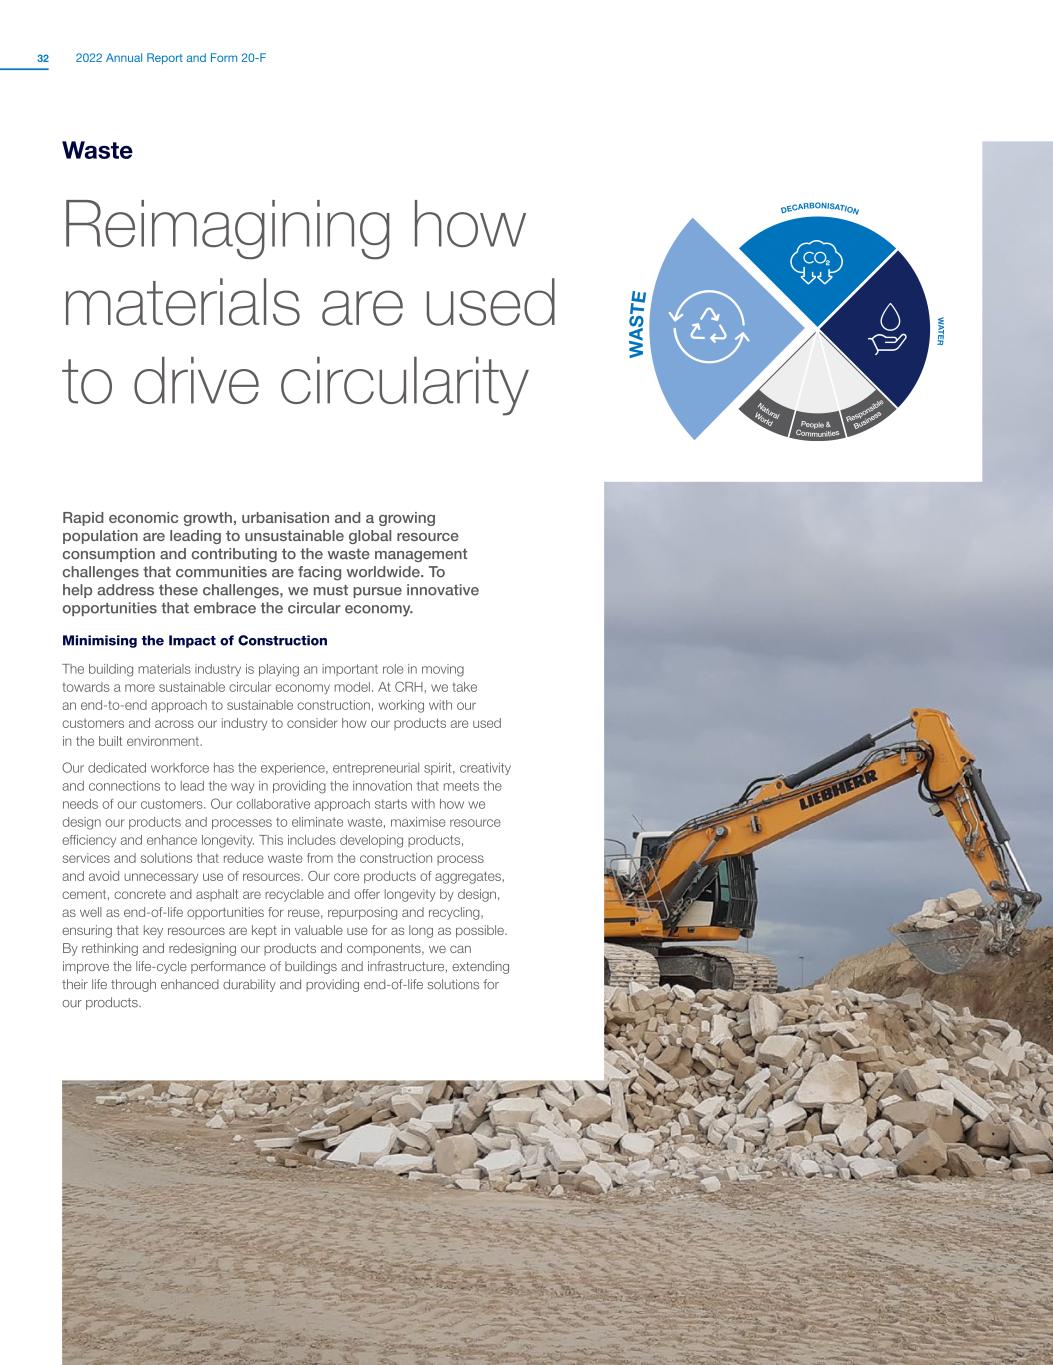
2022 Annual Report and Form 20-F32 Waste Reimagining how materials are used to drive circularity Rapid economic growth, urbanisation and a growing population are leading to unsustainable global resource consumption and contributing to the waste management challenges that communities are facing worldwide. To help address these challenges, we must pursue innovative opportunities that embrace the circular economy. Minimising the Impact of Construction The building materials industry is playing an important role in moving towards a more sustainable circular economy model. At CRH, we take an end-to-end approach to sustainable construction, working with our customers and across our industry to consider how our products are used in the built environment. Our dedicated workforce has the experience, entrepreneurial spirit, creativity and connections to lead the way in providing the innovation that meets the needs of our customers. Our collaborative approach starts with how we design our products and processes to eliminate waste, maximise resource efficiency and enhance longevity. This includes developing products, services and solutions that reduce waste from the construction process and avoid unnecessary use of resources. Our core products of aggregates, cement, concrete and asphalt are recyclable and offer longevity by design, as well as end-of-life opportunities for reuse, repurposing and recycling, ensuring that key resources are kept in valuable use for as long as possible. By rethinking and redesigning our products and components, we can improve the life-cycle performance of buildings and infrastructure, extending their life through enhanced durability and providing end-of-life solutions for our products. DECARBONISATION W AS TE W ATER World Communities Business Natural People & Responsible W AS TE
Overview Strategy Report Business Performance & Segmental Reviews Governance Financial Statements Supplemental 20-F and Other Disclosures Shareholder Information We also see an opportunity to lead by example and promote a circular approach in the wider industry and society. This includes developing more circular designs through our modular and off-site manufacturing solutions, allowing for less complex product replacement and enhancement due to the design of the modular structures. In addition, off-site solutions also offer many other benefits, including improved time and cost predictability, reduced noise and traffic disruption during construction, and improved health and safety rates. Enhancing Value Through Increased Circularity Minimising waste, using materials efficiently and using recycled waste, by-products and renewable resources are key components of CRH's sustainability framework and contribute to improving circularity in the built environment. We are a leader in the recycling and use of waste and by- products from other industries as raw materials and fuels in our processes and products. We have an opportunity to increase further the use of renewable and recyclable materials to enable the resilient, resource efficient infrastructure and buildings needed to enhance modern living. Our operations use waste and by-products from both our own and other construction and industrial processes, such as recycled asphalt pavement (RAP) and recycled asphalt shingles (RAS), construction and demolition (C&D) waste, fly ash, ground granulated blast-furnace slag (GGBS), as well as using various wastes as fuel. For example, approximately 25% of every mile of road we build in North America is made from recycled materials. In addition, we work closely with partners, such as the World Building Council for Sustainable Development (WBCSD) and the GCCA, to help develop the innovative technologies and processes needed for the efficient reuse of by- products in the most cost-effective way. 1. Alternative raw materials and fuels are selected wastes and by-products which can be used to replace natural substances and fossil fuels. This metric demonstrates to investors our focus on the circular economy. We monitor this KPI in order to evaluate our performance in contributing to the circular economy which, as noted above, represents a growth opportunity for CRH. CASE STUDY Contributing to a more circular economy At CRH, our ambition is to deliver innovative products and solutions to drive progress towards a circular, net-zero built environment. Michigan Paving & Materials, part of our CRH Americas Materials Division, is leading the Interstate 69 Design Build project, consisting of 23 miles of divided interstate reconstruction in Southern Michigan. This involves the removal of approximately 1.5 million tonnes of concrete and converting it into recycled road base aggregates. The recycled aggregates are then reincorporated into the construction of the interstate. In addition, approximately 141,000 tonnes of Hot Mix Asphalt (HMA) will be removed from the existing interstate and recycled to produce the new HMA pavement required for the reconstruction. By taking a circular approach, we can reduce the use of primary resources in construction projects, leading to less intensive and more cost-effective development practices. 42.4 million tonnes (2021: 39.5 million tonnes) alternative fuels and raw materials recycled in 20221 c. 25% (2021: c. 25%) Raw materials requirements for our US asphalt business are met by recycled asphalt pavement (RAP) and shingles
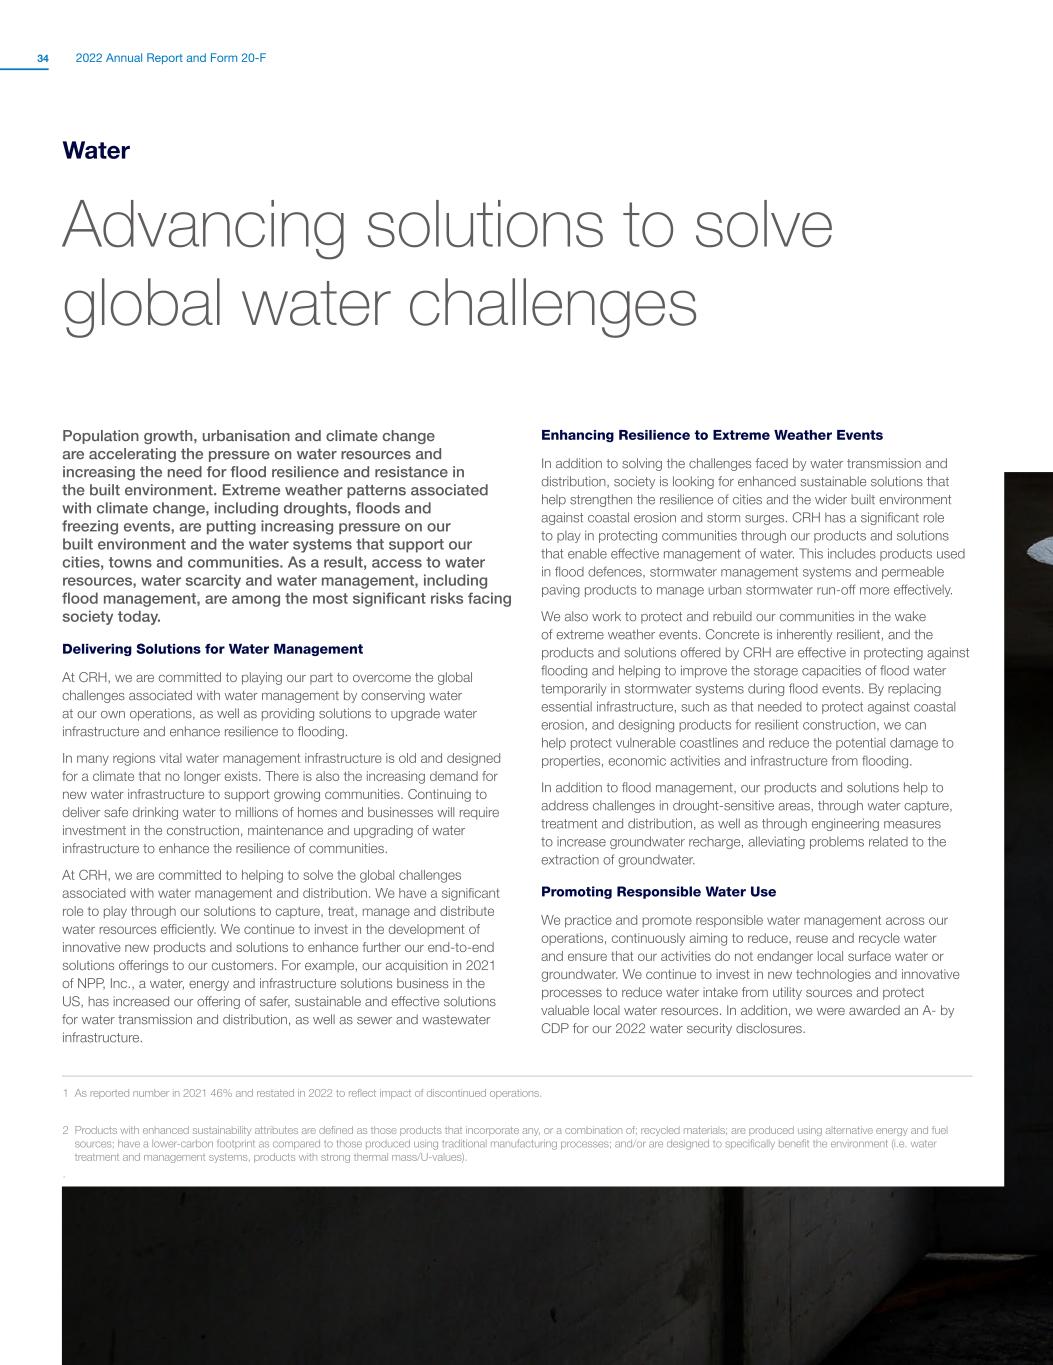
2022 Annual Report and Form 20-F34 Water Advancing solutions to solve global water challenges Population growth, urbanisation and climate change are accelerating the pressure on water resources and increasing the need for flood resilience and resistance in the built environment. Extreme weather patterns associated with climate change, including droughts, floods and freezing events, are putting increasing pressure on our built environment and the water systems that support our cities, towns and communities. As a result, access to water resources, water scarcity and water management, including flood management, are among the most significant risks facing society today. Delivering Solutions for Water Management At CRH, we are committed to playing our part to overcome the global challenges associated with water management by conserving water at our own operations, as well as providing solutions to upgrade water infrastructure and enhance resilience to flooding. In many regions vital water management infrastructure is old and designed for a climate that no longer exists. There is also the increasing demand for new water infrastructure to support growing communities. Continuing to deliver safe drinking water to millions of homes and businesses will require investment in the construction, maintenance and upgrading of water infrastructure to enhance the resilience of communities. At CRH, we are committed to helping to solve the global challenges associated with water management and distribution. We have a significant role to play through our solutions to capture, treat, manage and distribute water resources efficiently. We continue to invest in the development of innovative new products and solutions to enhance further our end-to-end solutions offerings to our customers. For example, our acquisition in 2021 of NPP, Inc., a water, energy and infrastructure solutions business in the US, has increased our offering of safer, sustainable and effective solutions for water transmission and distribution, as well as sewer and wastewater infrastructure. Enhancing Resilience to Extreme Weather Events In addition to solving the challenges faced by water transmission and distribution, society is looking for enhanced sustainable solutions that help strengthen the resilience of cities and the wider built environment against coastal erosion and storm surges. CRH has a significant role to play in protecting communities through our products and solutions that enable effective management of water. This includes products used in flood defences, stormwater management systems and permeable paving products to manage urban stormwater run-off more effectively. We also work to protect and rebuild our communities in the wake of extreme weather events. Concrete is inherently resilient, and the products and solutions offered by CRH are effective in protecting against flooding and helping to improve the storage capacities of flood water temporarily in stormwater systems during flood events. By replacing essential infrastructure, such as that needed to protect against coastal erosion, and designing products for resilient construction, we can help protect vulnerable coastlines and reduce the potential damage to properties, economic activities and infrastructure from flooding. In addition to flood management, our products and solutions help to address challenges in drought-sensitive areas, through water capture, treatment and distribution, as well as through engineering measures to increase groundwater recharge, alleviating problems related to the extraction of groundwater. Promoting Responsible Water Use We practice and promote responsible water management across our operations, continuously aiming to reduce, reuse and recycle water and ensure that our activities do not endanger local surface water or groundwater. We continue to invest in new technologies and innovative processes to reduce water intake from utility sources and protect valuable local water resources. In addition, we were awarded an A- by CDP for our 2022 water security disclosures. 1 As reported number in 2021 46% and restated in 2022 to reflect impact of discontinued operations. 2 Products with enhanced sustainability attributes are defined as those products that incorporate any, or a combination of; recycled materials; are produced using alternative energy and fuel sources; have a lower-carbon footprint as compared to those produced using traditional manufacturing processes; and/or are designed to specifically benefit the environment (i.e. water treatment and management systems, products with strong thermal mass/U-values). .
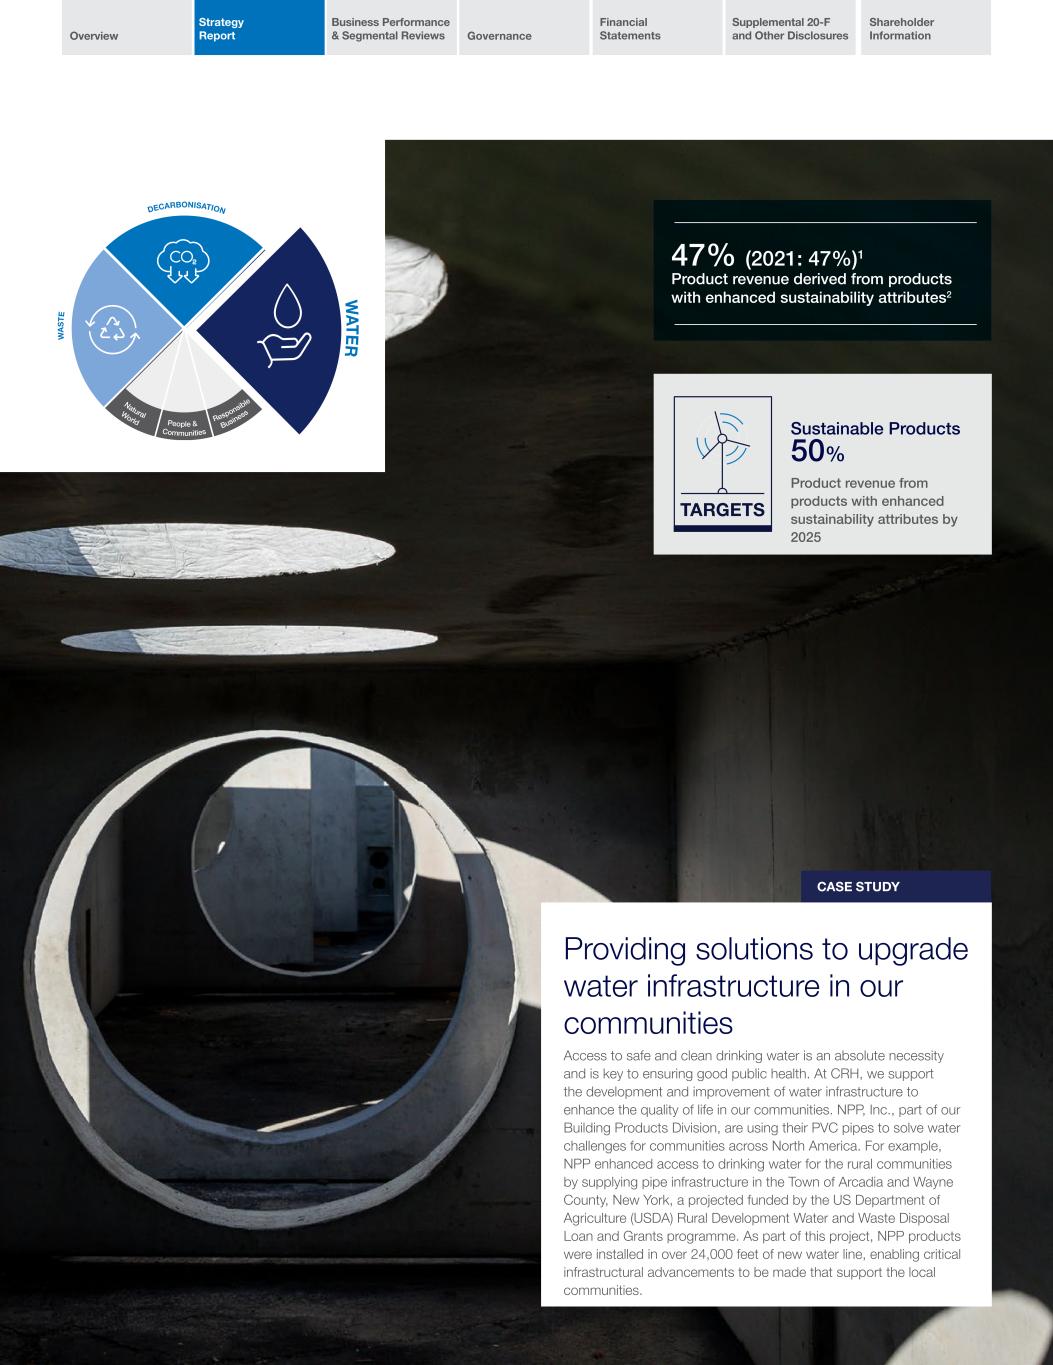
Overview Strategy Report Business Performance & Segmental Reviews Governance Financial Statements Supplemental 20-F and Other Disclosures Shareholder Information DECARBONISATION W AS TE W ATER World Communities Business Natural People & Responsible W ATER CASE STUDY 47% (2021: 47%)1 Product revenue derived from products with enhanced sustainability attributes2 Sustainable Products 50% Product revenue from products with enhanced sustainability attributes by 2025 Providing solutions to upgrade water infrastructure in our communities Access to safe and clean drinking water is an absolute necessity and is key to ensuring good public health. At CRH, we support the development and improvement of water infrastructure to enhance the quality of life in our communities. NPP, Inc., part of our Building Products Division, are using their PVC pipes to solve water challenges for communities across North America. For example, NPP enhanced access to drinking water for the rural communities by supplying pipe infrastructure in the Town of Arcadia and Wayne County, New York, a projected funded by the US Department of Agriculture (USDA) Rural Development Water and Waste Disposal Loan and Grants programme. As part of this project, NPP products were installed in over 24,000 feet of new water line, enabling critical infrastructural advancements to be made that support the local communities.
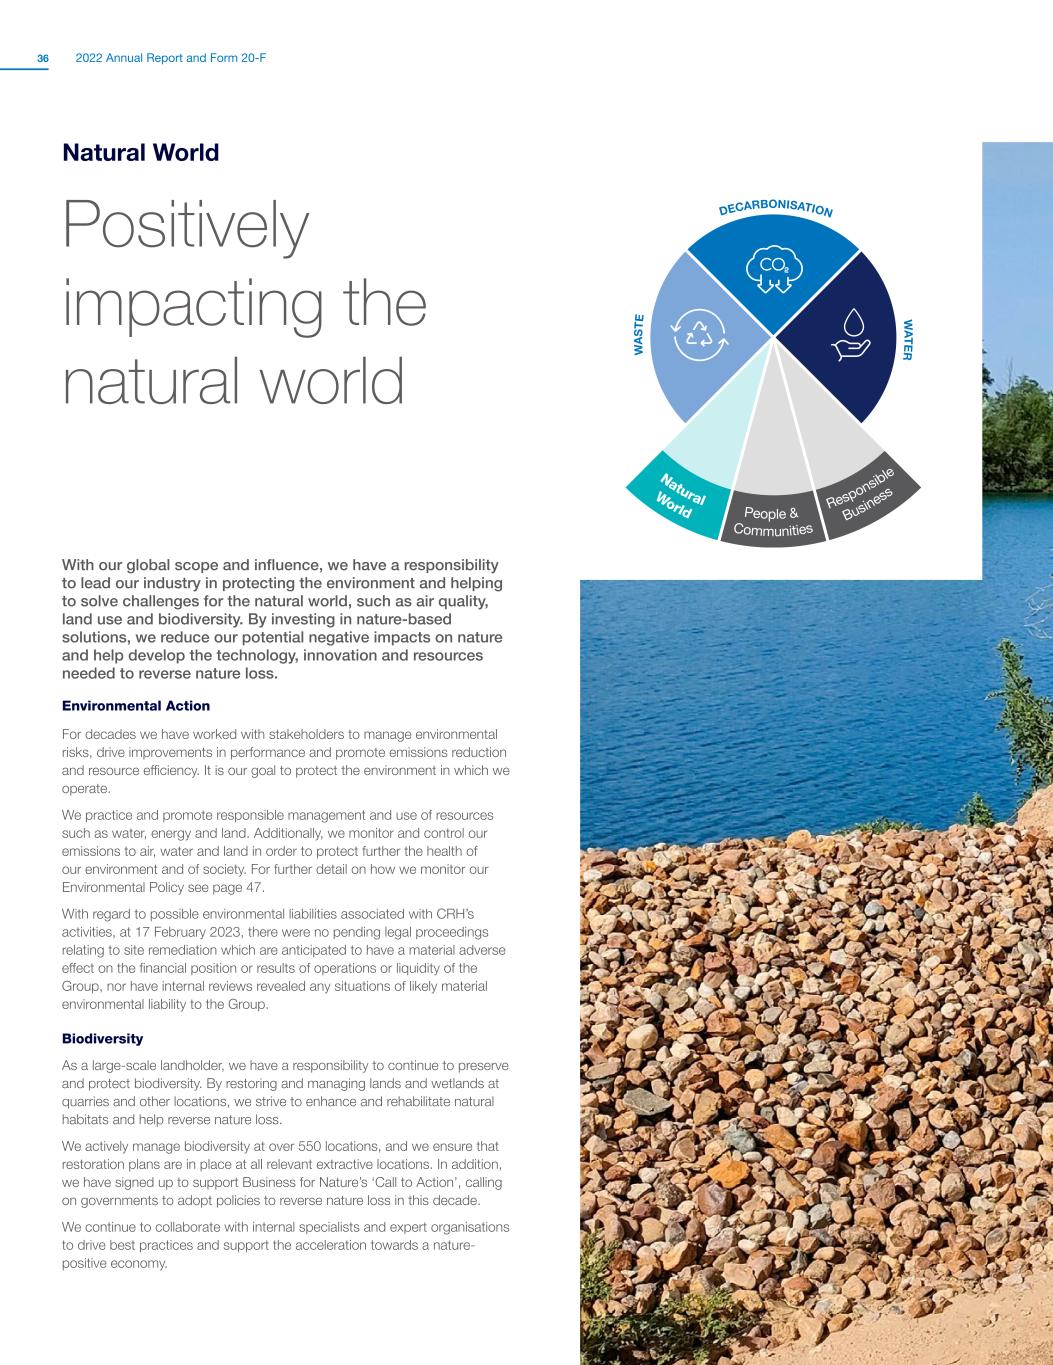
2022 Annual Report and Form 20-F36 Natural World Positively impacting the natural world DECARBONISATION W AS TE W ATER World Communities Business Natural People & Responsible With our global scope and influence, we have a responsibility to lead our industry in protecting the environment and helping to solve challenges for the natural world, such as air quality, land use and biodiversity. By investing in nature-based solutions, we reduce our potential negative impacts on nature and help develop the technology, innovation and resources needed to reverse nature loss. Environmental Action For decades we have worked with stakeholders to manage environmental risks, drive improvements in performance and promote emissions reduction and resource efficiency. It is our goal to protect the environment in which we operate. We practice and promote responsible management and use of resources such as water, energy and land. Additionally, we monitor and control our emissions to air, water and land in order to protect further the health of our environment and of society. For further detail on how we monitor our Environmental Policy see page 47. With regard to possible environmental liabilities associated with CRH’s activities, at 17 February 2023, there were no pending legal proceedings relating to site remediation which are anticipated to have a material adverse effect on the financial position or results of operations or liquidity of the Group, nor have internal reviews revealed any situations of likely material environmental liability to the Group. Biodiversity As a large-scale landholder, we have a responsibility to continue to preserve and protect biodiversity. By restoring and managing lands and wetlands at quarries and other locations, we strive to enhance and rehabilitate natural habitats and help reverse nature loss. We actively manage biodiversity at over 550 locations, and we ensure that restoration plans are in place at all relevant extractive locations. In addition, we have signed up to support Business for Nature’s ‘Call to Action’, calling on governments to adopt policies to reverse nature loss in this decade. We continue to collaborate with internal specialists and expert organisations to drive best practices and support the acceleration towards a nature- positive economy.

Overview Strategy Report Business Performance & Segmental Reviews Governance Financial Statements Supplemental 20-F and Other Disclosures Shareholder Information c. 100% (2021: c. 100%) of our relevant locations have restoration plans in place CASE STUDY Protecting and enhancing biodiversity At CRH, we are committed to protecting and enhancing biodiversity across our locations. Since 2004, our Americas Materials Division has partnered with the Wildlife Habitat Council (WHC), a non-profit group that collaborates with corporations to advance biodiversity and sustainability. In 2022 two of our businesses in North America were recognised by the WHC for their excellence in corporate conservation. Dufferin Aggregates’ Acton Quarry in Halton Hills, Ontario received the Reptiles & Amphibians Project Award for creating the first known man-made wetland in Ontario, Canada, in which the endangered Jefferson salamander has successfully bred. In addition, APAC Central’s Gravette Quarry in Arkansas received the Invasive Species Project Award for efforts to remove invasive plant species from the site to facilitate natural regeneration of native trees. These are two of the many projects demonstrating our ongoing commitment to preserve and protect biodiversity across our locations.
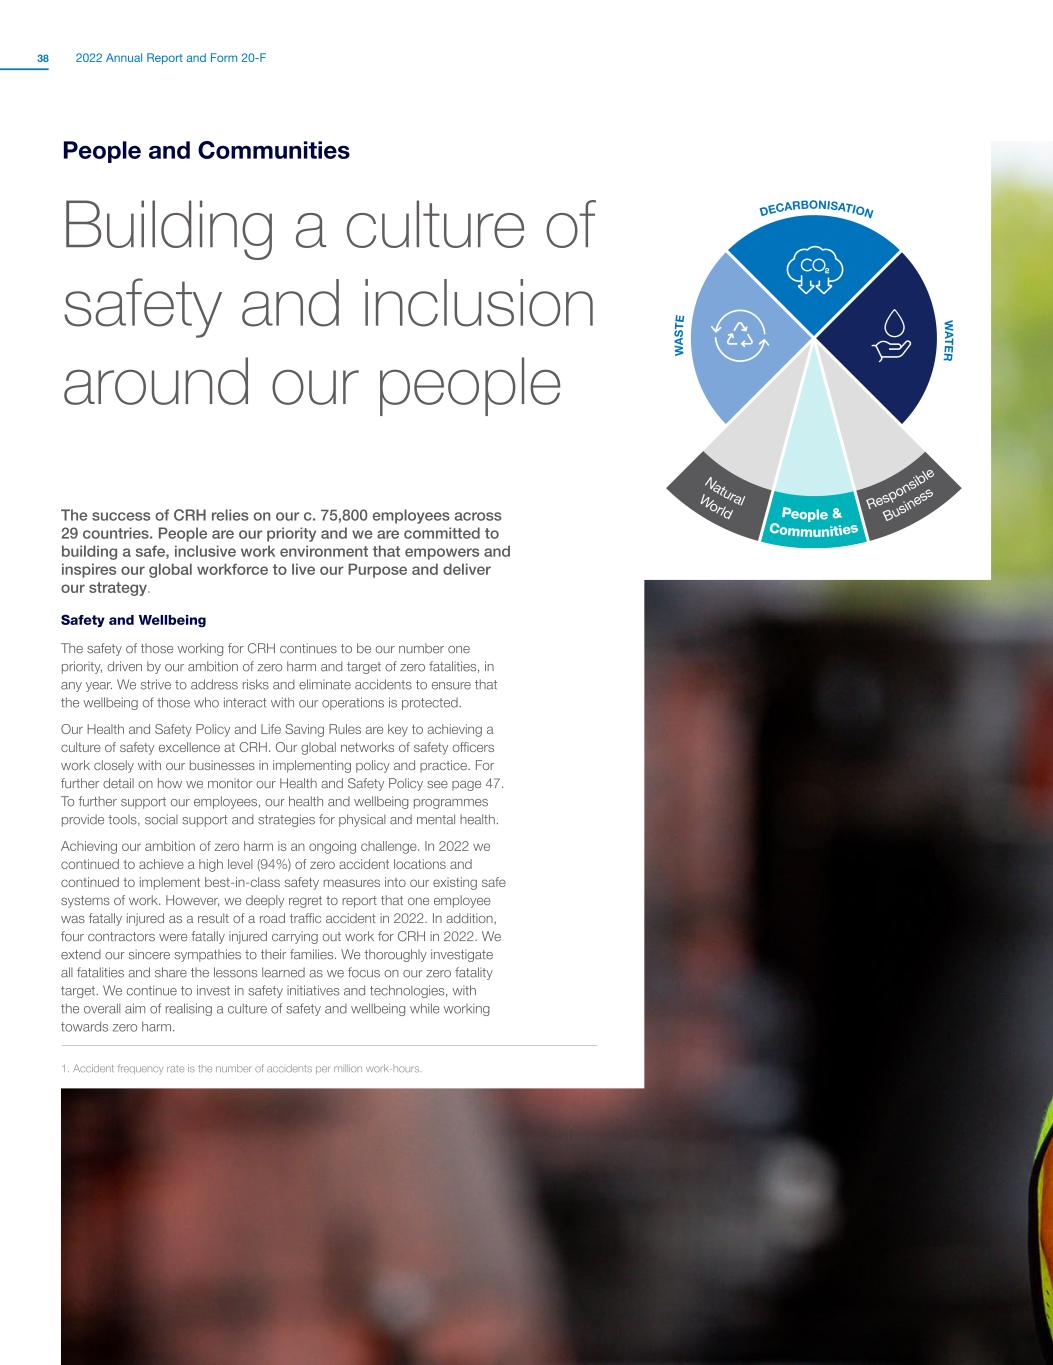
2022 Annual Report and Form 20-F38 People and Communities The success of CRH relies on our c. 75,800 employees across 29 countries. People are our priority and we are committed to building a safe, inclusive work environment that empowers and inspires our global workforce to live our Purpose and deliver our strategy. Safety and Wellbeing The safety of those working for CRH continues to be our number one priority, driven by our ambition of zero harm and target of zero fatalities, in any year. We strive to address risks and eliminate accidents to ensure that the wellbeing of those who interact with our operations is protected. Our Health and Safety Policy and Life Saving Rules are key to achieving a culture of safety excellence at CRH. Our global networks of safety officers work closely with our businesses in implementing policy and practice. For further detail on how we monitor our Health and Safety Policy see page 47. To further support our employees, our health and wellbeing programmes provide tools, social support and strategies for physical and mental health. Achieving our ambition of zero harm is an ongoing challenge. In 2022 we continued to achieve a high level (94%) of zero accident locations and continued to implement best-in-class safety measures into our existing safe systems of work. However, we deeply regret to report that one employee was fatally injured as a result of a road traffic accident in 2022. In addition, four contractors were fatally injured carrying out work for CRH in 2022. We extend our sincere sympathies to their families. We thoroughly investigate all fatalities and share the lessons learned as we focus on our zero fatality target. We continue to invest in safety initiatives and technologies, with the overall aim of realising a culture of safety and wellbeing while working towards zero harm. DECARBONISATION W AS TE W ATER World Communities Business Natural People & Responsible Building a culture of safety and inclusion around our people 1. Accident frequency rate is the number of accidents per million work-hours.
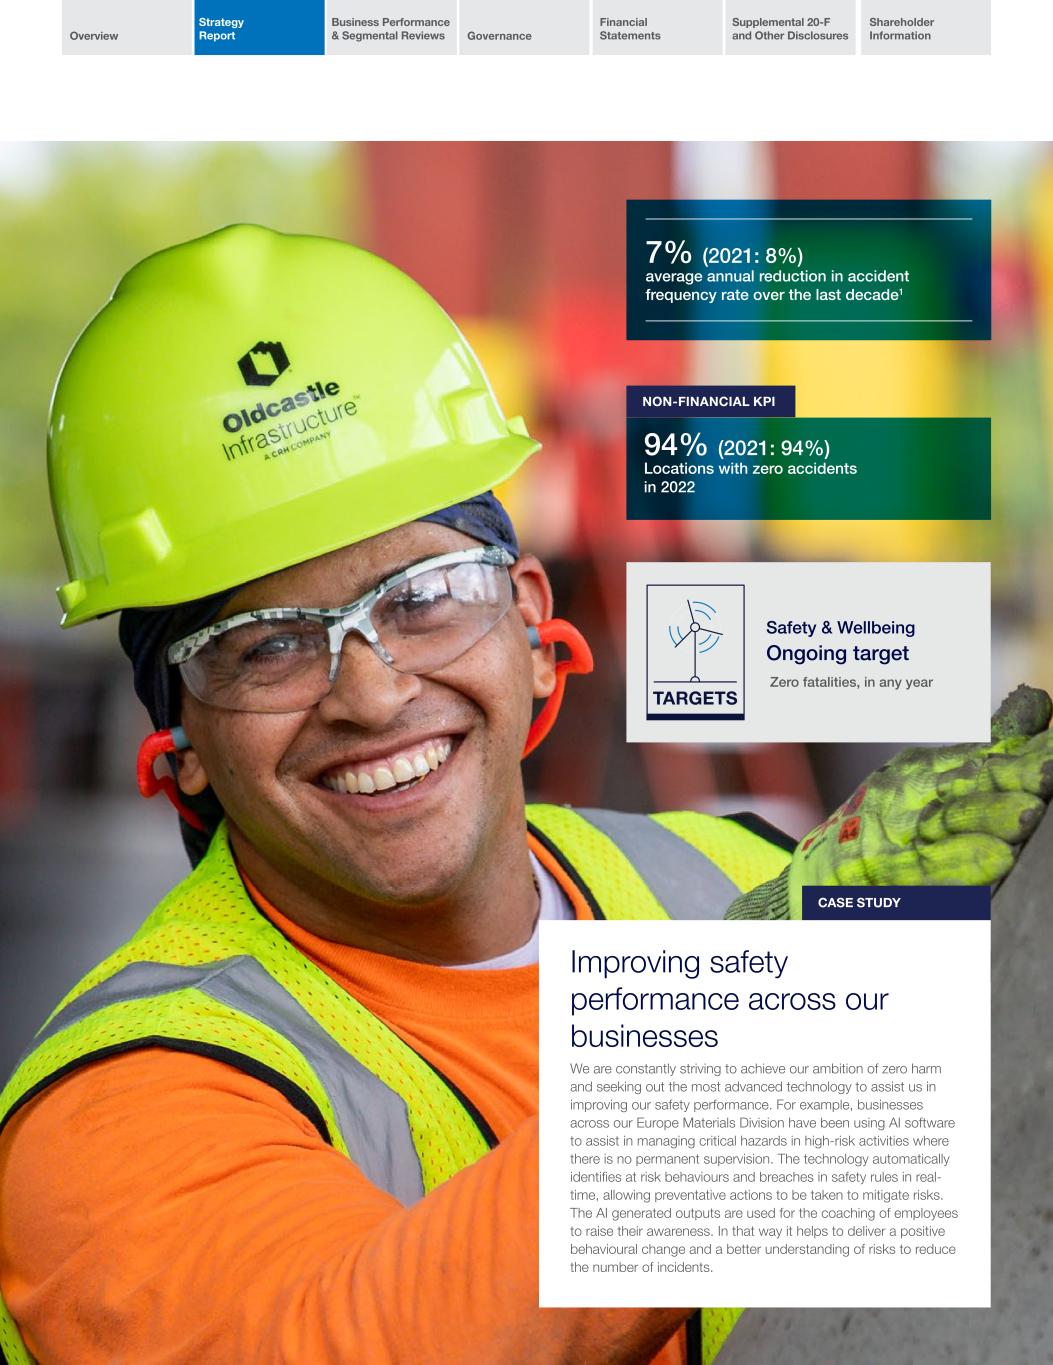
Overview Strategy Report Business Performance & Segmental Reviews Governance Financial Statements Supplemental 20-F and Other Disclosures Shareholder Information CASE STUDY NON-FINANCIAL KPI 94% (2021: 94%) Locations with zero accidents in 2022 CASE STUDY Improving safety performance across our businesses We are constantly striving to achieve our ambition of zero harm and seeking out the most advanced technology to assist us in improving our safety performance. For example, businesses across our Europe Materials Division have been using AI software to assist in managing critical hazards in high-risk activities where there is no permanent supervision. The technology automatically identifies at risk behaviours and breaches in safety rules in real- time, allowing preventative actions to be taken to mitigate risks. The AI generated outputs are used for the coaching of employees to raise their awareness. In that way it helps to deliver a positive behavioural change and a better understanding of risks to reduce the number of incidents. Safety & Wellbeing Ongoing target Zero fatalities, in any year 7% (2021: 8%) average annual reduction in accident frequency rate over the last decade1
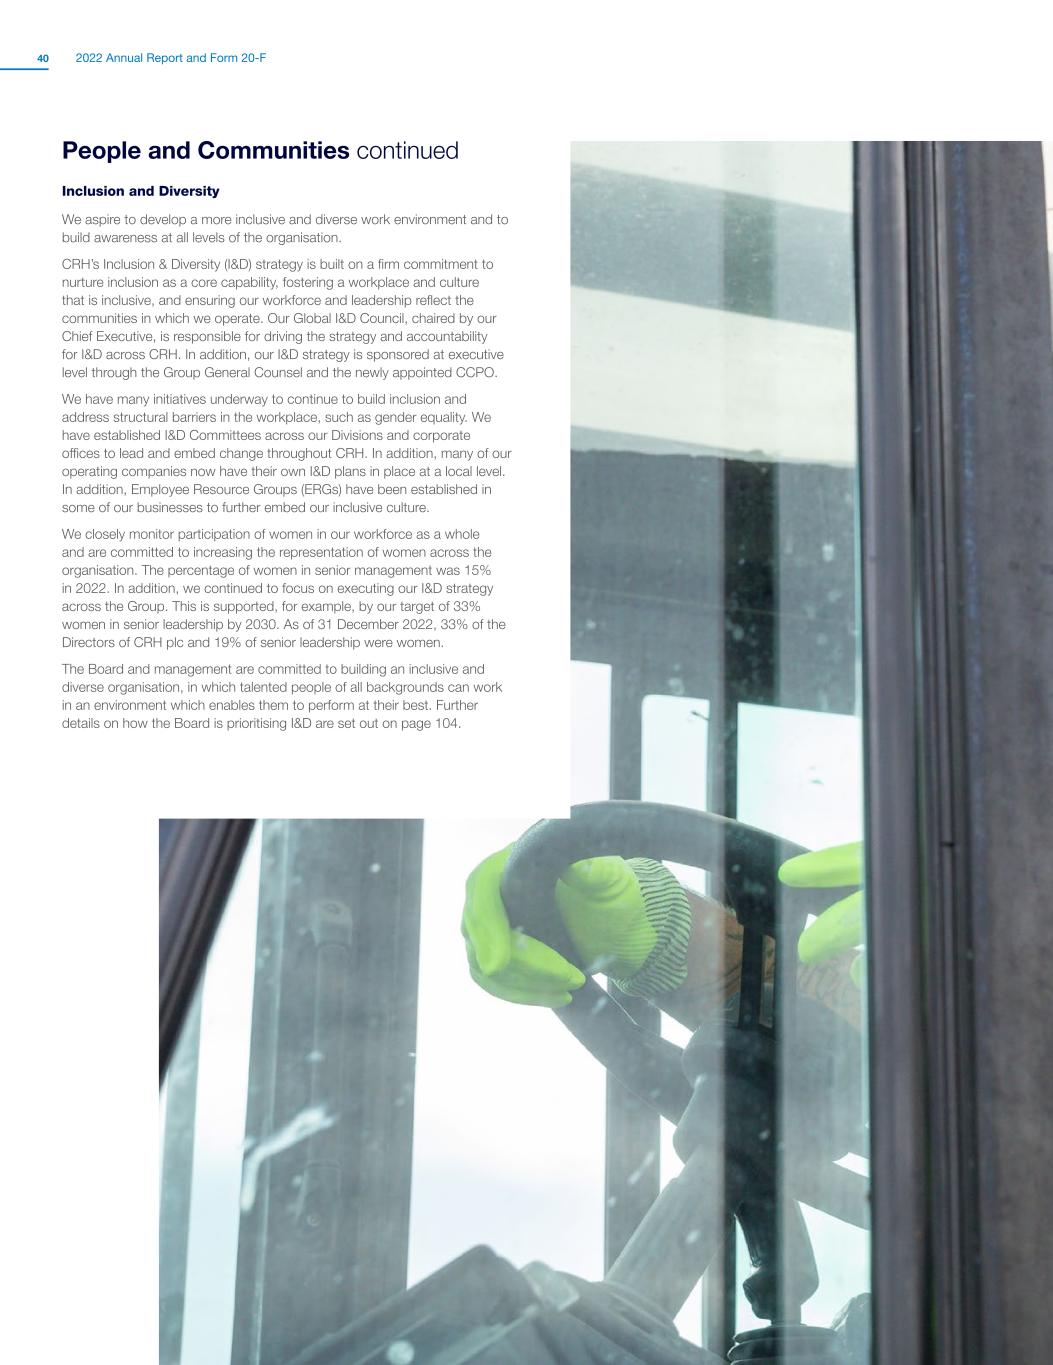
2022 Annual Report and Form 20-F40 People and Communities continued Inclusion and Diversity We aspire to develop a more inclusive and diverse work environment and to build awareness at all levels of the organisation. CRH’s Inclusion & Diversity (I&D) strategy is built on a firm commitment to nurture inclusion as a core capability, fostering a workplace and culture that is inclusive, and ensuring our workforce and leadership reflect the communities in which we operate. Our Global I&D Council, chaired by our Chief Executive, is responsible for driving the strategy and accountability for I&D across CRH. In addition, our I&D strategy is sponsored at executive level through the Group General Counsel and the newly appointed CCPO. We have many initiatives underway to continue to build inclusion and address structural barriers in the workplace, such as gender equality. We have established I&D Committees across our Divisions and corporate offices to lead and embed change throughout CRH. In addition, many of our operating companies now have their own I&D plans in place at a local level. In addition, Employee Resource Groups (ERGs) have been established in some of our businesses to further embed our inclusive culture. We closely monitor participation of women in our workforce as a whole and are committed to increasing the representation of women across the organisation. The percentage of women in senior management was 15% in 2022. In addition, we continued to focus on executing our I&D strategy across the Group. This is supported, for example, by our target of 33% women in senior leadership by 2030. As of 31 December 2022, 33% of the Directors of CRH plc and 19% of senior leadership were women. The Board and management are committed to building an inclusive and diverse organisation, in which talented people of all backgrounds can work in an environment which enables them to perform at their best. Further details on how the Board is prioritising I&D are set out on page 104.
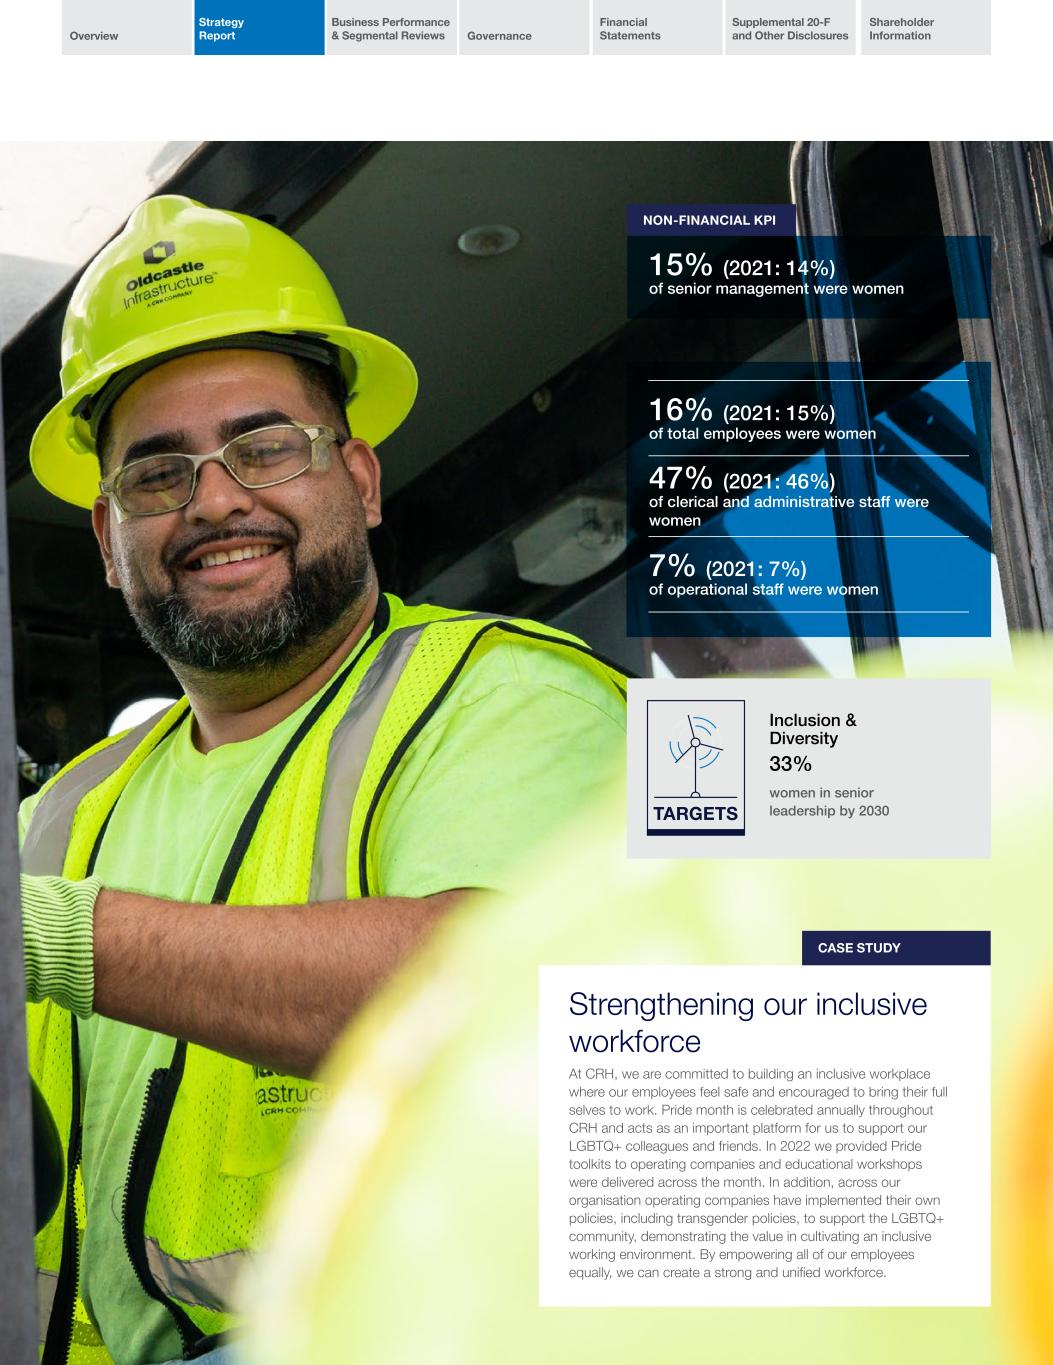
Overview Strategy Report Business Performance & Segmental Reviews Governance Financial Statements Supplemental 20-F and Other Disclosures Shareholder Information NON-FINANCIAL KPI CASE STUDY 15% (2021: 14%) of senior management were women 16% (2021: 15%) of total employees were women 47% (2021: 46%) of clerical and administrative staff were women 7% (2021: 7%) of operational staff were women Inclusion & Diversity 33% women in senior leadership by 2030 Strengthening our inclusive workforce At CRH, we are committed to building an inclusive workplace where our employees feel safe and encouraged to bring their full selves to work. Pride month is celebrated annually throughout CRH and acts as an important platform for us to support our LGBTQ+ colleagues and friends. In 2022 we provided Pride toolkits to operating companies and educational workshops were delivered across the month. In addition, across our organisation operating companies have implemented their own policies, including transgender policies, to support the LGBTQ+ community, demonstrating the value in cultivating an inclusive working environment. By empowering all of our employees equally, we can create a strong and unified workforce.
2022 Annual Report and Form 20-F42 People & Communitiesand Co munities continued Empowered Employees We understand that people are at the heart of what we do at CRH. The skills and expertise of our employees drive performance and growth and help us deliver on the key agendas of decarbonisation, building a circular economy and providing sustainable solutions for society. We invest in talent development across our businesses, supporting our employees across all levels of education and employment to grow their careers through personal and professional development opportunities. We have an ongoing focus on training to enable employees to acquire the attributes and skills needed in our dynamic industry to support performance and growth and help us deliver our decarbonisation roadmap while continuing to provide sustainable solutions for society. We respect the rights of our employees to form and join trade unions and take part in collective bargaining. We also take care that employee representatives do not suffer discrimination. The SESR Committee has been delegated responsibility for management of stakeholder engagement, including with employees, to ensure that the views of all stakeholders are understood and taken into consideration in its decision-making process. Further details on the Board's engagement with employees are set out on pages 88 to 89. Focused engagement with employees helps us to understand our employees' needs. We regularly monitor employee engagement, to continually advance progress and understand what matters most to our employees. During 2022 we conducted an organisational health pulse survey across our business, which highlighted our overall good performance and identified priority areas for improvement. We are continuing to progress action plans in line with priority areas, which are being implemented across the business. In addition to supporting our employees, we believe that to unlock the potential of societal change, we need to empower our young people with the skills and education they require to work in our industry. Our goal, through harnessing the knowledge and skills of our employees, is to develop a diverse talent pipeline, encouraging young people to participate in STEM (science, technology, engineering and maths) subjects from an early age and ensuring they have the skills needed for our industry. Community and Social Impact We aim to develop and strengthen positive relationships with our stakeholders and want to further enhance this with open and meaningful communications. Our stakeholders include investors, customers, employees, suppliers, Non-Governmental Organisations (NGOs), communities, assessment organisations, advocacy groups, media and other interested parties. Further details on our engagement with our stakeholders are set out on pages 44 to 45. We contribute to local communities through employment, educational development and supporting local businesses, as well as through our donations and other support in areas such as environment and conservation, health and wellness, arts and culture, and provision of shelter. We are committed to respecting internationally recognised human rights – as set out in the International Bill of Human Rights and the International Labour Organisation’s Core Labour Principles – across our operations and extended supply chain. In addition, we are a signatory of the UN Global Compact and apply the UN Guiding Principles on Business and Human Rights. We develop our approach to human rights through the identification of salient human rights related to CRH operations, including the health and safety of those working on our sites, the health of neighbouring communities and the labour rights of workers in our extended supply chain. Risk assessment and management processes play a critical role in improving our human rights performance. In the shift to a low-carbon economy the Paris Agreement on Climate Change calls for “a just transition of the workforce and the creation of decent work and quality jobs”. At CRH, we recognise that decarbonisation of our business must be fair and equitable. Many of the existing just transition principles, such as those in the Paris Agreement and International Labour Organisation’s Guidelines, are already embedded in our business, and we take a holistic and collaborative approach to managing the social impacts of our decarbonisation strategy on our people and communities. Actions we have taken to protect human rights include improved training and awareness through our Modern Slavery e-module, the updating of our Code of Business Conduct (CoBC) and of our Supplier Code of Conduct (SCoC). In response to supply chain risks, we increase our assurance and due diligence processes as required. By engaging with industry partnership schemes, we aim to help improve standards across industry sectors. We monitor our progress regarding human rights using KPIs, which include zero-harm measures and increased training and awareness. Our ‘Commitment to human rights’ Modern Slavery Statement is published annually on the CRH website, www.crh.com1 and discloses our risks, progress and targets related to preventing modern slavery within our operations and supply chain. For further detail on how we monitor our Social Policy see page 47. 1. Our most recent Modern Slavery Statement is available at www.crh.com/media/4207/ modern-slavery-act-statement-for-the-year-ending-31-december-2021.pdf.

Overview Strategy Report Business Performance & Segmental Reviews Governance Financial Statements Supplemental 20-F and Other Disclosures Shareholder Information c. 1,500 (2021: c. 1,100) stakeholder engagement events were hosted by Group companies in 2022 $7.2 million (2021: $7.1 million) donated to local organisations and initiatives in 2022 CASE STUDY CASE STUDY Partnering for positive change We are constantly striving to create a more inclusive and diverse workforce. By providing opportunities for a broader group of young people to access college learning, we help create pathways for them to gain the skills needed in our industry and to advance a more equitable future for their communities. One such example is that our Building Products Division established an internship and mentoring program targeting students from Historically Black Colleges and Universities (HBCUs). They also participated in the Thurgood Marshall College Fund’s Annual Leadership Institute, offering development sessions to the 400 participants. TMCF is the largest organization in the US exclusively representing the Black College Community, it provides assistance to students and member-schools from HBCUs and PBIs. We value these partnerships and recognise that attracting people with different perspectives and life experiences will help us to be more innovative and creative. Creating value for our communities Our goal is to have a positive impact on our communities by creating opportunities and pathways for local people. For example, in 2022 Tarmac, part of our Europe Materials Division, was awarded the Purpose Business Coalition Levelling Up Award in the ‘Infrastructure for Opportunity’ category, recognising its achievements in helping to improve social mobility across the UK. The award recognises companies that help communities overcome barriers to opportunity, such as digital connectivity, good health and wellbeing. The accolade demonstrates our ongoing commitment to creating a lasting, positive influence through employment and training opportunities.
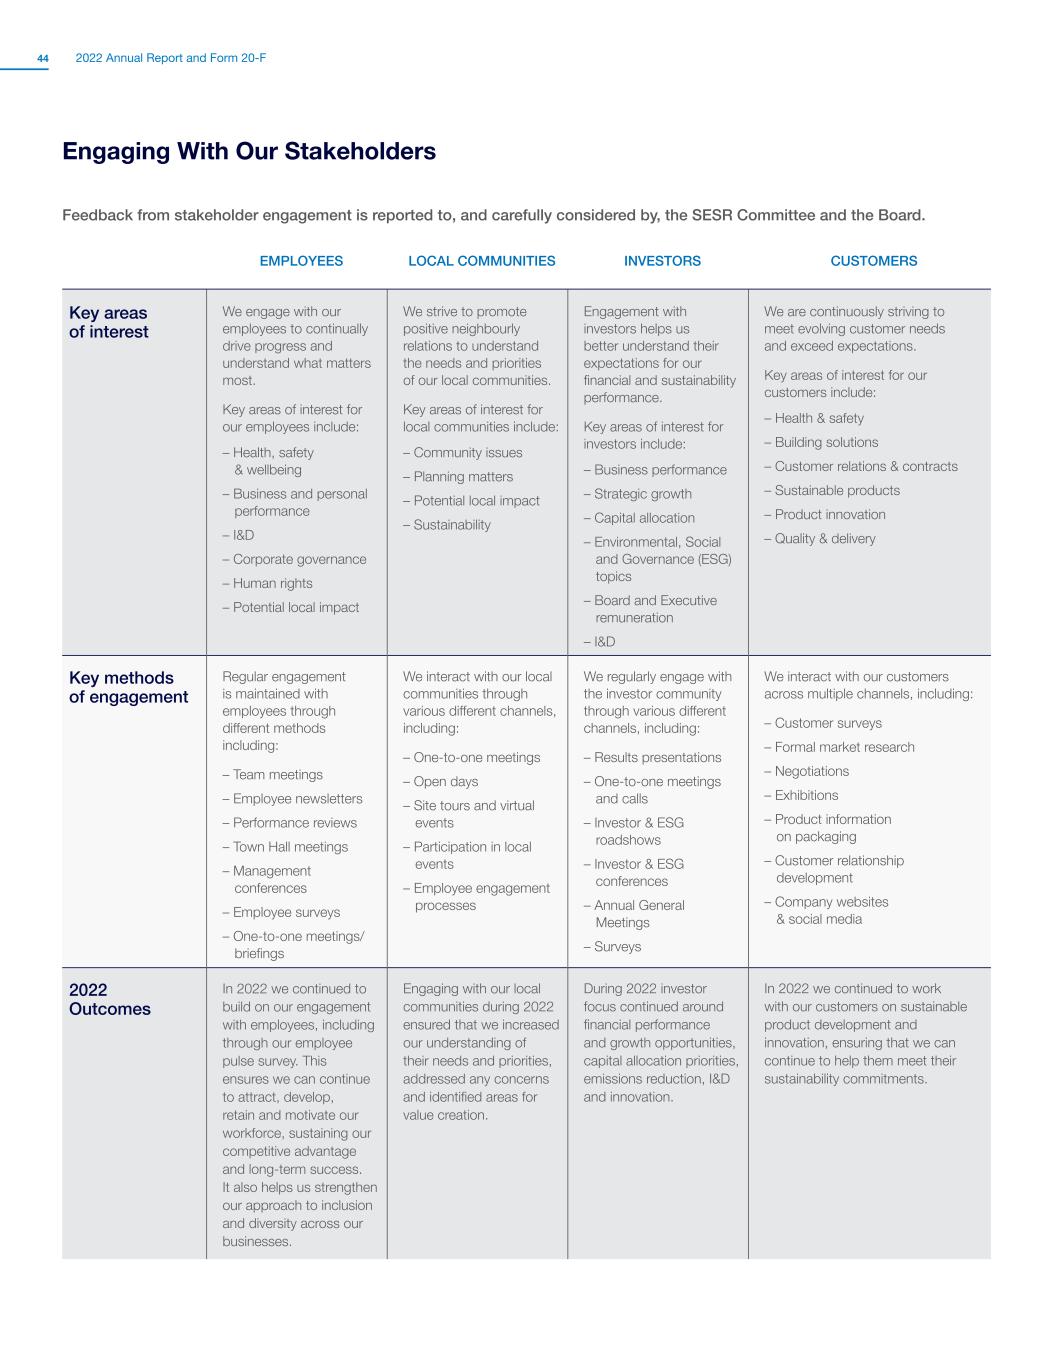
2022 Annual Report and Form 20-F44 Engaging With Our Stakeholders Feedback from stakeholder engagement is reported to, and carefully considered by, the SESR Committee and the Board. EMPLOYEES LOCAL COMMUNITIES INVESTORS CUSTOMERS Key areas of interest We engage with our employees to continually drive progress and understand what matters most. Key areas of interest for our employees include: – Health, safety & wellbeing – Business and personal performance – I&D – Corporate governance – Human rights – Potential local impact We strive to promote positive neighbourly relations to understand the needs and priorities of our local communities. Key areas of interest for local communities include: – Community issues – Planning matters – Potential local impact – Sustainability Engagement with investors helps us better understand their expectations for our financial and sustainability performance. Key areas of interest for investors include: – Business performance – Strategic growth – Capital allocation – Environmental, Social and Governance (ESG) topics – Board and Executive remuneration – I&D We are continuously striving to meet evolving customer needs and exceed expectations. Key areas of interest for our customers include: – Health & safety – Building solutions – Customer relations & contracts – Sustainable products – Product innovation – Quality & delivery Key methods of engagement Regular engagement is maintained with employees through different methods including: – Team meetings – Employee newsletters – Performance reviews – Town Hall meetings – Management conferences – Employee surveys – One-to-one meetings/ briefings We interact with our local communities through various different channels, including: – One-to-one meetings – Open days – Site tours and virtual events – Participation in local events – Employee engagement processes We regularly engage with the investor community through various different channels, including: – Results presentations – One-to-one meetings and calls – Investor & ESG roadshows – Investor & ESG conferences – Annual General Meetings – Surveys We interact with our customers across multiple channels, including: – Customer surveys – Formal market research – Negotiations – Exhibitions – Product information on packaging – Customer relationship development – Company websites & social media 2022 Outcomes In 2022 we continued to build on our engagement with employees, including through our employee pulse survey. This ensures we can continue to attract, develop, retain and motivate our workforce, sustaining our competitive advantage and long-term success. It also helps us strengthen our approach to inclusion and diversity across our businesses. Engaging with our local communities during 2022 ensured that we increased our understanding of their needs and priorities, addressed any concerns and identified areas for value creation. During 2022 investor focus continued around financial performance and growth opportunities, capital allocation priorities, emissions reduction, I&D and innovation. In 2022 we continued to work with our customers on sustainable product development and innovation, ensuring that we can continue to help them meet their sustainability commitments.
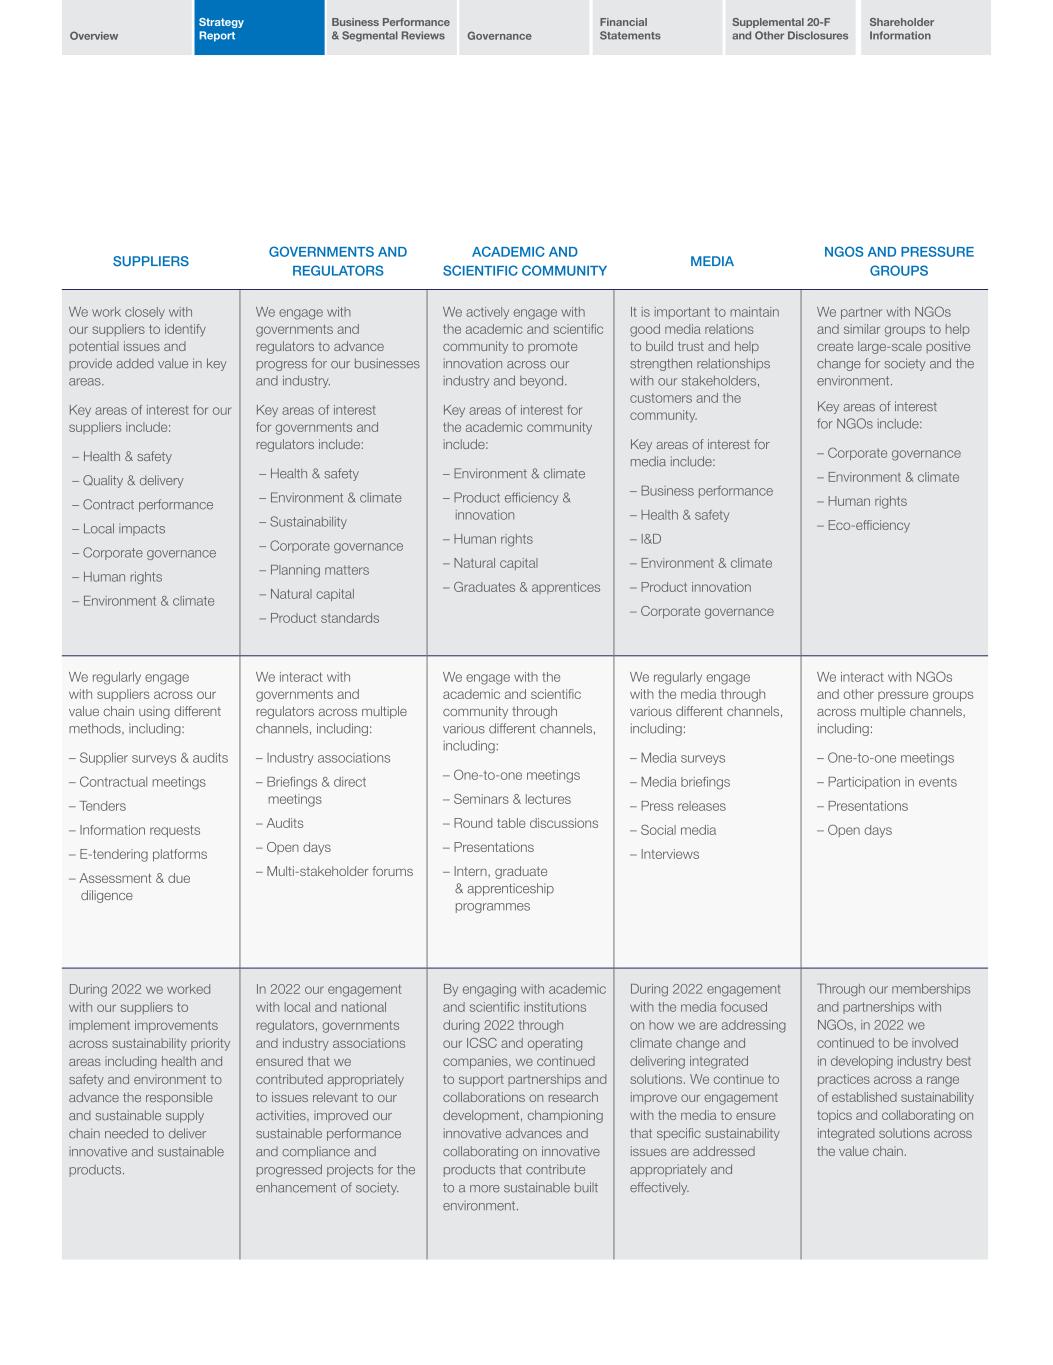
Overview Strategy Report Business Performance & Segmental Reviews Governance Financial Statements Supplemental 20-F and Other Disclosures Shareholder Information SUPPLIERS GOVERNMENTS AND REGULATORS ACADEMIC AND SCIENTIFIC COMMUNITY MEDIA NGOS AND PRESSURE GROUPS We work closely with our suppliers to identify potential issues and provide added value in key areas. Key areas of interest for our suppliers include: – Health & safety – Quality & delivery – Contract performance – Local impacts – Corporate governance – Human rights – Environment & climate We engage with governments and regulators to advance progress for our businesses and industry. Key areas of interest for governments and regulators include: – Health & safety – Environment & climate – Sustainability – Corporate governance – Planning matters – Natural capital – Product standards We actively engage with the academic and scientific community to promote innovation across our industry and beyond. Key areas of interest for the academic community include: – Environment & climate – Product efficiency & innovation – Human rights – Natural capital – Graduates & apprentices It is important to maintain good media relations to build trust and help strengthen relationships with our stakeholders, customers and the community. Key areas of interest for media include: – Business performance – Health & safety – I&D – Environment & climate – Product innovation – Corporate governance We partner with NGOs and similar groups to help create large-scale positive change for society and the environment. Key areas of interest for NGOs include: – Corporate governance – Environment & climate – Human rights – Eco-efficiency We regularly engage with suppliers across our value chain using different methods, including: – Supplier surveys & audits – Contractual meetings – Tenders – Information requests – E-tendering platforms – Assessment & due diligence We interact with governments and regulators across multiple channels, including: – Industry associations – Briefings & direct meetings – Audits – Open days – Multi-stakeholder forums We engage with the academic and scientific community through various different channels, including: – One-to-one meetings – Seminars & lectures – Round table discussions – Presentations – Intern, graduate & apprenticeship programmes We regularly engage with the media through various different channels, including: – Media surveys – Media briefings – Press releases – Social media – Interviews We interact with NGOs and other pressure groups across multiple channels, including: – One-to-one meetings – Participation in events – Presentations – Open days During 2022 we worked with our suppliers to implement improvements across sustainability priority areas including health and safety and environment to advance the responsible and sustainable supply chain needed to deliver innovative and sustainable products. In 2022 our engagement with local and national regulators, governments and industry associations ensured that we contributed appropriately to issues relevant to our activities, improved our sustainable performance and compliance and progressed projects for the enhancement of society. By engaging with academic and scientific institutions during 2022 through our ICSC and operating companies, we continued to support partnerships and collaborations on research development, championing innovative advances and collaborating on innovative products that contribute to a more sustainable built environment. During 2022 engagement with the media focused on how we are addressing climate change and delivering integrated solutions. We continue to improve our engagement with the media to ensure that specific sustainability issues are addressed appropriately and effectively. Through our memberships and partnerships with NGOs, in 2022 we continued to be involved in developing industry best practices across a range of established sustainability topics and collaborating on integrated solutions across the value chain.
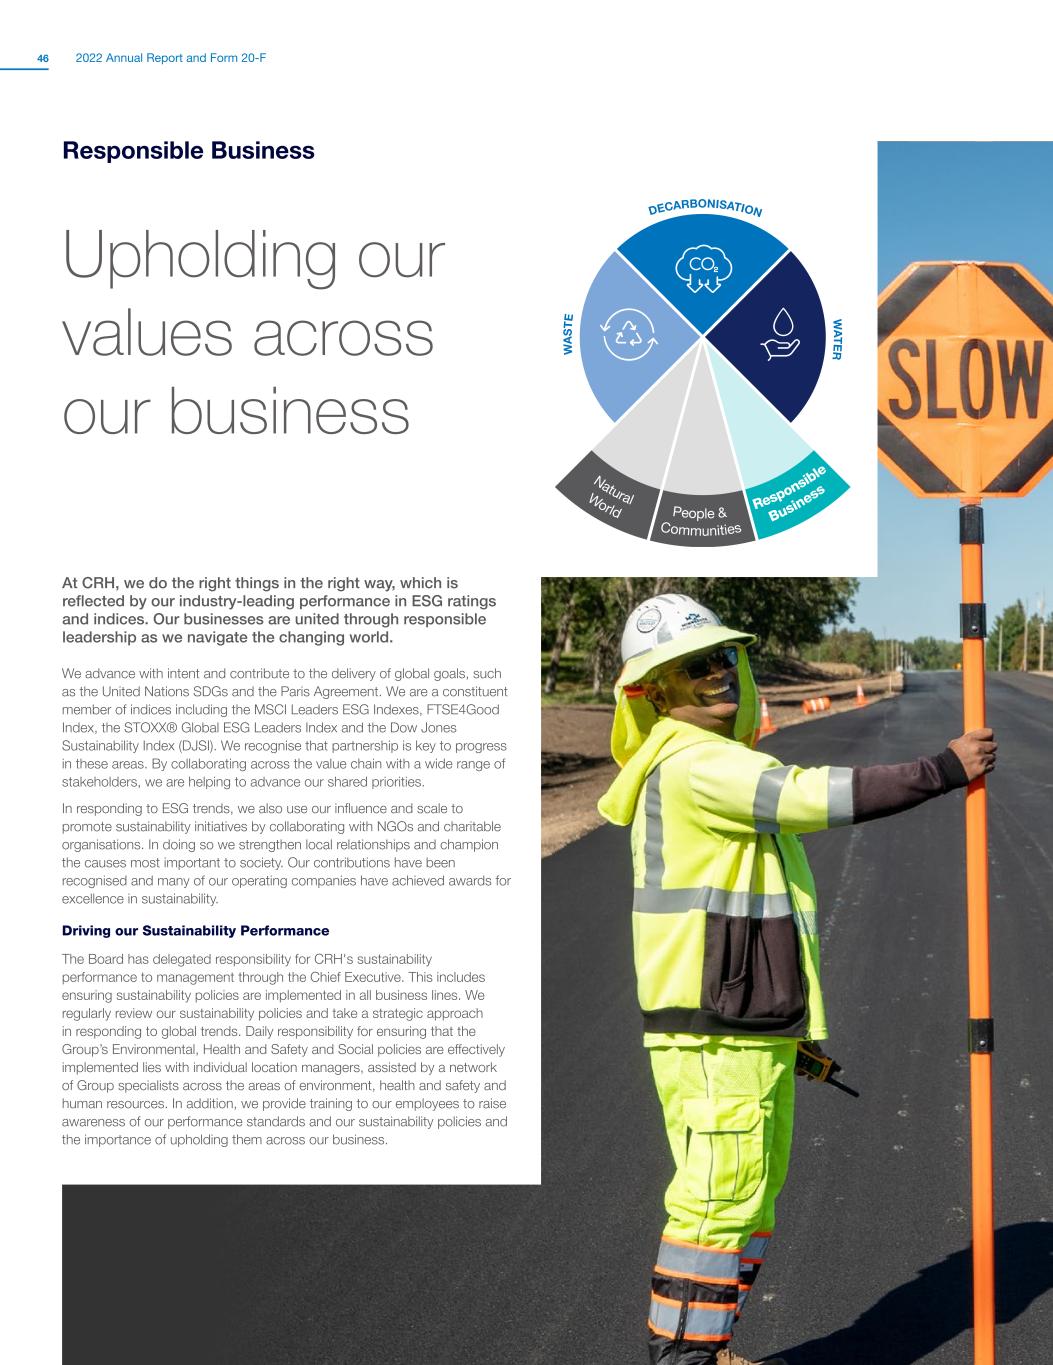
2022 Annual Report and Form 20-F46 DECARBONISATION W AS TE W ATER World Communities Business Natural People & Responsib le Responsible Business Upholding our values across our business At CRH, we do the right things in the right way, which is reflected by our industry-leading performance in ESG ratings and indices. Our businesses are united through responsible leadership as we navigate the changing world. We advance with intent and contribute to the delivery of global goals, such as the United Nations SDGs and the Paris Agreement. We are a constituent member of indices including the MSCI Leaders ESG Indexes, FTSE4Good Index, the STOXX® Global ESG Leaders Index and the Dow Jones Sustainability Index (DJSI). We recognise that partnership is key to progress in these areas. By collaborating across the value chain with a wide range of stakeholders, we are helping to advance our shared priorities. In responding to ESG trends, we also use our influence and scale to promote sustainability initiatives by collaborating with NGOs and charitable organisations. In doing so we strengthen local relationships and champion the causes most important to society. Our contributions have been recognised and many of our operating companies have achieved awards for excellence in sustainability. Driving our Sustainability Performance The Board has delegated responsibility for CRH's sustainability performance to management through the Chief Executive. This includes ensuring sustainability policies are implemented in all business lines. We regularly review our sustainability policies and take a strategic approach in responding to global trends. Daily responsibility for ensuring that the Group’s Environmental, Health and Safety and Social policies are effectively implemented lies with individual location managers, assisted by a network of Group specialists across the areas of environment, health and safety and human resources. In addition, we provide training to our employees to raise awareness of our performance standards and our sustainability policies and the importance of upholding them across our business.
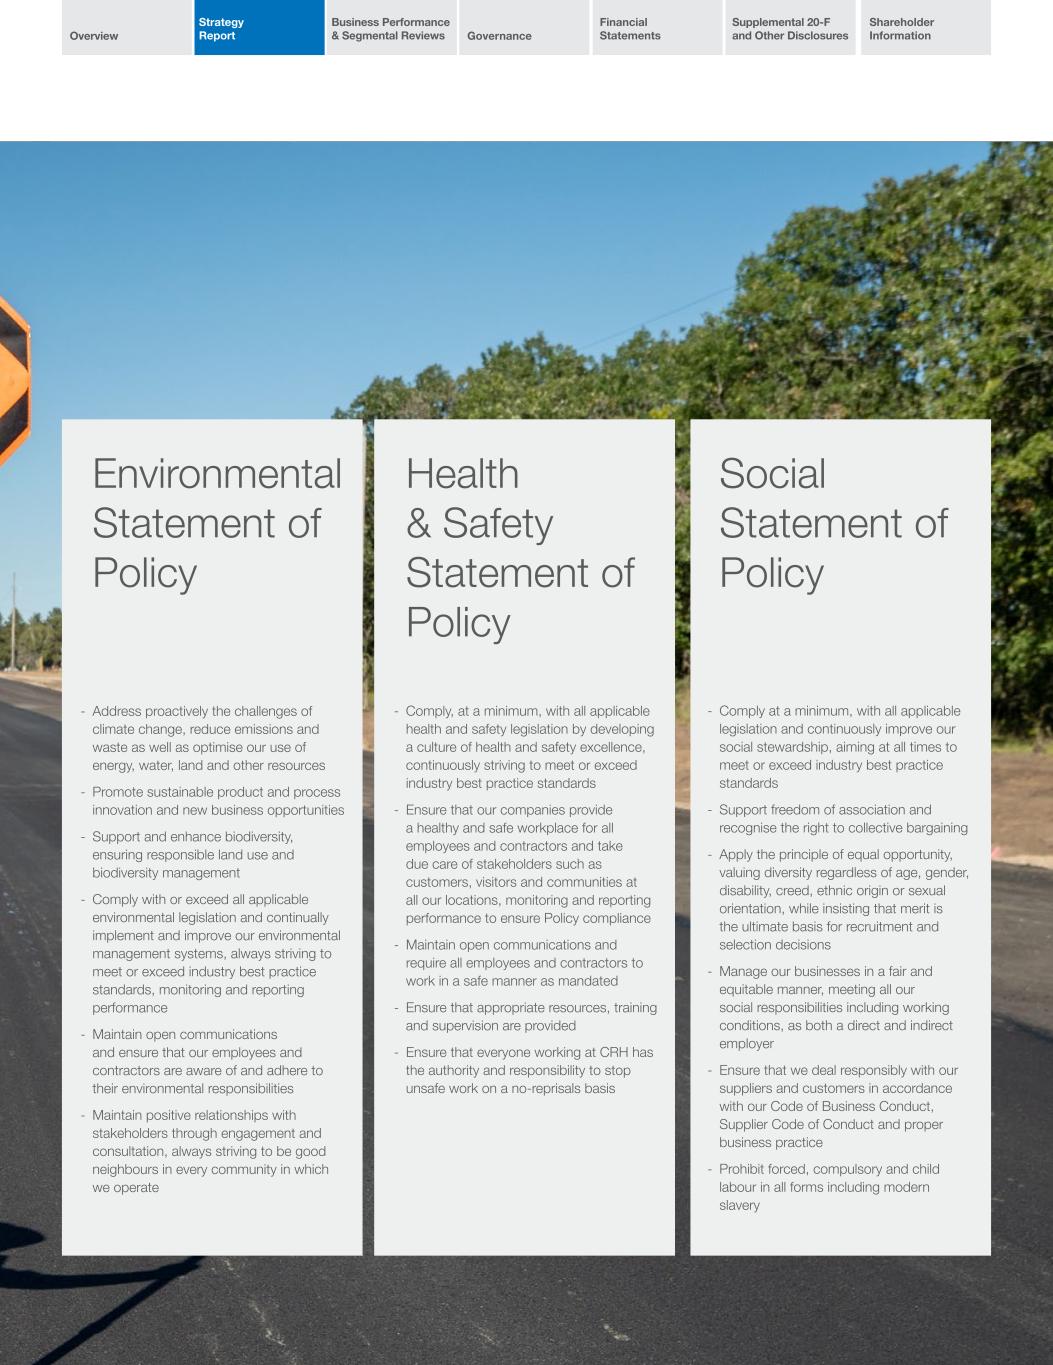
Overview Strategy Report Business Performance & Segmental Reviews Governance Financial Statements Supplemental 20-F and Other Disclosures Shareholder Information Environmental Statement of Policy Health & Safety Statement of Policy Social Statement of Policy - Address proactively the challenges of climate change, reduce emissions and waste as well as optimise our use of energy, water, land and other resources - Promote sustainable product and process innovation and new business opportunities - Support and enhance biodiversity, ensuring responsible land use and biodiversity management - Comply with or exceed all applicable environmental legislation and continually implement and improve our environmental management systems, always striving to meet or exceed industry best practice standards, monitoring and reporting performance - Maintain open communications and ensure that our employees and contractors are aware of and adhere to their environmental responsibilities - Maintain positive relationships with stakeholders through engagement and consultation, always striving to be good neighbours in every community in which we operate - Comply, at a minimum, with all applicable health and safety legislation by developing a culture of health and safety excellence, continuously striving to meet or exceed industry best practice standards - Ensure that our companies provide a healthy and safe workplace for all employees and contractors and take due care of stakeholders such as customers, visitors and communities at all our locations, monitoring and reporting performance to ensure Policy compliance - Maintain open communications and require all employees and contractors to work in a safe manner as mandated - Ensure that appropriate resources, training and supervision are provided - Ensure that everyone working at CRH has the authority and responsibility to stop unsafe work on a no-reprisals basis - Comply at a minimum, with all applicable legislation and continuously improve our social stewardship, aiming at all times to meet or exceed industry best practice standards - Support freedom of association and recognise the right to collective bargaining - Apply the principle of equal opportunity, valuing diversity regardless of age, gender, disability, creed, ethnic origin or sexual orientation, while insisting that merit is the ultimate basis for recruitment and selection decisions - Manage our businesses in a fair and equitable manner, meeting all our social responsibilities including working conditions, as both a direct and indirect employer - Ensure that we deal responsibly with our suppliers and customers in accordance with our Code of Business Conduct, Supplier Code of Conduct and proper business practice - Prohibit forced, compulsory and child labour in all forms including modern slavery
2022 Annual Report and Form 20-F48 Responsible Business continued Our sustainability performance is monitored using KPIs across the areas of environment, safety and wellbeing, and social and employee matters. We have identified the most important ESG topics and KPIs for CRH through a range of internal and external processes. These include annual sustainability reporting by our businesses to the Group, review of issues raised through ERM processes and regular formal materiality assessment reviews, the outcomes of which guide our strategy and reporting. An overview of our materiality assessment process and outcomes will be included in our 2022 Sustainability Performance Report, which will be published in March 2023 on the CRH website, www.crh.com. These internal and external processes allow us to monitor opportunities and risks and articulate what matters most to society. Our non-financial due diligence processes are well established in our business and supply chains, and we made no material changes to these in 2022. Our most relevant sustainability KPIs are provided on pages 24 to 49. We provide training to our employees to raise awareness of our performance standards and the importance of upholding them across our business. Our training and awareness tools include our non-financial policies and our CoBC. We comply with the EU Non-Financial Reporting Directive (see page 134 for more information) and the EU Taxonomy Regulation and we make disclosures consistent with TCFD (see pages 56 to 59 for more information). In addition, our annual independently assured Sustainability Performance Report is prepared in line with the Global Reporting Initiative (GRI) standards and in accordance with the Sustainability Accounting Standards Board (SASB) reporting standards. This includes additional information on environmental performance and social and employee matters. Governance and Ethics CRH is committed to the highest level of legal, ethical and moral standards, complying with the law and working responsibly. We do not tolerate any illegal behaviour and all CRH companies respect and comply with the laws and obligations in the countries and regions in which they operate. A “Speak-up” culture encourages employees, customers, suppliers and other stakeholders to raise good faith reportable concerns through a number of secure channels, including the CRH Hotline, where, if needed, the reporters can remain anonymous. Employees can speak to members of their management team, Legal and Compliance team or, in the case of fraud and theft, also to a dedicated Fraud Point of Contact in their business. We are strongly focused on protecting "Speak-up" reporters from retaliation, in accordance with the CRH "Speak-up" Policy and requirements of local laws. Our CoBC, available on crh.com/sustainability/codes-of-conduct, outlines clear expectations for employees related to business conduct. We take a zero-tolerance approach to bribery, corruption and fraud. Regular training on our CoBC is provided to all employees. Certain employees, based on risk profile, undertake annual Advanced Compliance Training (ACT), covering Anti-Bribery, Competition/Antitrust, Anti-Fraud and Anti- Theft. Globally our senior management complete an Annual Compliance Certification, confirming their business’s compliance with our CoBC and accompanying policies. Further detail on the CRH Hotline and CoBC awareness and training is set out on page 101. In the US, CRH supports the rights of employees to participate in the political process through employee-funded Political Action Committees (PACs) and CRH’s US operations provide administrative support (consistent with applicable laws) to their affiliated federal and state PACs.

Overview Strategy Report Business Performance & Segmental Reviews Governance Financial Statements Supplemental 20-F and Other Disclosures Shareholder Information Responsible Sourcing We expect our suppliers, both direct and indirect, to share our commitment to ethical business practices and meet the standards set out in our SCoC, including respect for human rights, health and safety and environmental stewardship. We engage with suppliers to develop a responsible and sustainable supply chain needed to deliver innovative, sustainable products and solutions. Through our SCoC, we continue to operate our core supplier due diligence processes to increase visibility and insights into our suppliers. These actions are taken with the goal of ensuring that good business practices are upheld throughout our supply chain. We continue to review our supply chain risks through our ERM Framework (see page 50 for more information). c. 10,700 (2021: c. 8,500) employees completed ACT training in 2022 c. 31,500 (2021: c. 32,600) employees completed CoBC training in 2022 CASE STUDY Supporting the transition to more sustainable supply chains We are passionate about sustainable and resilient supply chains. For example, in 2022 Tarmac, part of our Europe Materials Division, launched its second Supplier Sustainability Week to drive the net-zero and wider sustainability agenda in partnership with its supply chain. This event consists of digital events and meetings covering everything from strategic industry insights to specialist presentations on areas such as I&D, renewable energy and sustainable packaging. The event also provided a platform to announce the winner of the Tarmac 2022 Innovation Challenge, which has been running since 2019. The focus of this year’s challenge was ‘energy efficiency or innovation resulting in improvements for the industry’. The winning entry was submitted by Prior Power Solutions for a hydrogen introduction system that can be fitted onto new or existing diesel engines that offers CO2 reductions of up to 8%, which will be brought to life in partnership with Tarmac.

2022 Annual Report and Form 20-F50 Risk Management Driving Better Decision-making Our Risk Framework ERM is a process embedded across the Group that provides a structured and consistent global approach to identifying, assessing and managing our most material threats and opportunities. Ultimately, the purpose of ERM is to assist our people in making better decisions by focusing decision-makers on taking the right risk for the right reward, encouraging effective and informed interaction with risk to protect and grow our business. Our ERM framework, aligned with Committee of Sponsoring Organizations of the Treadway Commission (COSO) principles, provides a clear approach for our people to comprehensively identify and effectively manage the uncertainty our businesses face as they strive to create value for the Group. The Board, supported by its sub-committees, is ultimately accountable for ensuring the Group takes the right risks aligned to our objectives, owning and approving the Group’s risk management and internal control systems, and defining the Group’s risk appetite. Risk workshops, facilitated by Group Risk, bring together leaders from across the Group to identify risks and opportunities, and define mitigation. Uncertainties that present themselves as downside risks are assessed in line with the Group's risk appetite and those which present themselves as opportunities are sufficiently explored and captured, where possible. To maximise value, ERM is integrated into our formal strategic planning and budgeting processes, and also at key day-to-day decision points. Doing so drives a risk-intelligent culture and underpins more informed and confident decision-making closer to the customer. Performance is our commitment and encouraging all employees to proactively manage risk creates a more agile and resilient organisation, which is reflected in this year’s strong financial performance. The Group Risk team supports the business by continuing to enhance our risk framework, processes and practices. In line with our pillar of empowered talent, the Group Risk team is supported by a network of risk champions, comprising senior leaders from every business, to provide continuous process advocacy and support formal activity, such as risk reporting and analysis. Strong tone at the top and robust governance structures ensure that risks and opportunities are reported in a timely manner and processes are implemented to minimise risks and maximise opportunities. Our framework enables us to be customer connected, allowing us to add depth to our understanding of our customers and markets and generate new ways to meet their needs. This is evident in how our integrated solutions strategy works with customers to find solutions to their challenges, minimising risks associated with large scale development, and allowing the Group to capture opportunities. For a full overview of risk governance structures and key steps in our risk process, please see page 94 of the Audit Committee Report.

Overview Strategy Report Business Performance & Segmental Reviews Governance Financial Statements Supplemental 20-F and Other Disclosures Shareholder Information ERM 2022 Highlights and Plans for 2023 Framework and Process: 2022: 14 risk workshops, with engagement of over 140 senior leaders from across the Group, focusing on topics such as climate, resilience and business performance 2023: Further embed tracking of Key Risk Indicators to enhance early warning capabilities, facilitated by developed risk analytics and reporting Appetite and Tolerance: 2022: Definition and articulation of updated risk appetite across perceived key risk areas 2023: Cascade of updated risk appetite across Group operations Culture and Governance: 2022: 600+ people trained on enterprise risk management fundamentals and requirements across all geographies and business levels 2023: Facilitate risk champion forums, bringing our risk champions together to foster relationships and promote knowledge sharing Risk and Strategy: 2022: Integration of outputs from our risk reporting processes into business strategic and financial planning processes 2023: Further enhancement of our emerging risk framework and integration of outputs into operating company and Group strategic planning Ownership and Reporting: 2022: Group-wide deployment of our new Risk Management Information System (RMIS), which is driving transparency and actionable business insights 2023: Formal assignment of all risks, mitigations and actions to specified owners that are subsequently held accountable for their management/delivery Principal Risk Focus Areas for 2022 Reporting The conflict in Ukraine resulted in the closing of our operations in the country in February 2022. With our primary focus being the safety of our colleagues and their families, we worked to support the evacuation of those wishing to leave the country. Since then, operations have resumed and we continue to monitor the situation closely. With global supply chain issues already impacting most industries, the conflict in Ukraine has exacerbated these challenges with supply chain continuity being added as a principal risk for 2022. Whilst the Group has been relatively successful in managing continuity-related issues, we may face increasing challenges sourcing required raw materials (e.g. flyash, petcoke and energy) at economic rates. Highly volatile exchange rates also continue as a principal risk, given the significant volatility in 2022 in the performance of many of the Group’s currencies relative to USD, the Group’s reporting currency. Whilst Group capacity and financial performance remained strong in 2022 in the face of a challenging and volatile cost environment, and while we expect resilient demand and increased pricing in 2023, industry cyclicality and economic conditions may continue to present risks to the Group in 2023. Our people are our priority and ensuring we have diverse and empowered talent at all levels of the organisation is core to the successful delivery of the Group’s strategy. The Group has continued to focus on our people management programmes in 2022, implementing new programmes to mitigate challenges with attracting and retaining talent which could impact the Group’s ability to successfully deliver on that strategy. Whilst we did not experience any material cyber-related incidents during the year, it remains a principal risk in light of the continually growing threat and an area in which the Group is directing additional resource (see case study on page 53). More detailed information on our principal risks, their potential impact on the Group can be found on pages 139 to 148 of the Directors' Report.

2022 Annual Report and Form 20-F52 Principal Risks Our principal risks and uncertainties, presented below and defined in more detail on pages 139 to 148, are reviewed regularly and represent the key risks faced by the Group at the time of publication. The Risk Committee helps ensure the risks highlighted in this report reflect those risks which could have the most material impact on the Group achieving its strategic objectives. These risks form the basis of Board and Audit Committee communications and discussions. Risks linkages to Strategic Pillars Empowered Talent Customer Connected Focused Growth Sustainability Leadership Strategic Industry Cyclicality and Economic Conditions a a a a People Management a a a a Commodity Products and Substitution a a a a Portfolio Management a a a a Public Policy and Geopolitics a a a a Strategic Mineral Reserves a a a a Operational Climate Change and Policy a a a a Information Technology and Cyber Security a a a a Health and Safety Performance a a a a Sustainability and Corporate Social Responsibility a a a a Supply Chain Continuity a a a a Compliance Laws, Regulations and Business Conduct a a a Financial & Reporting Taxation Charge and Balance Sheet Provisioning a Financial Instruments a Goodwill Impairment a Foreign Currency Translation a
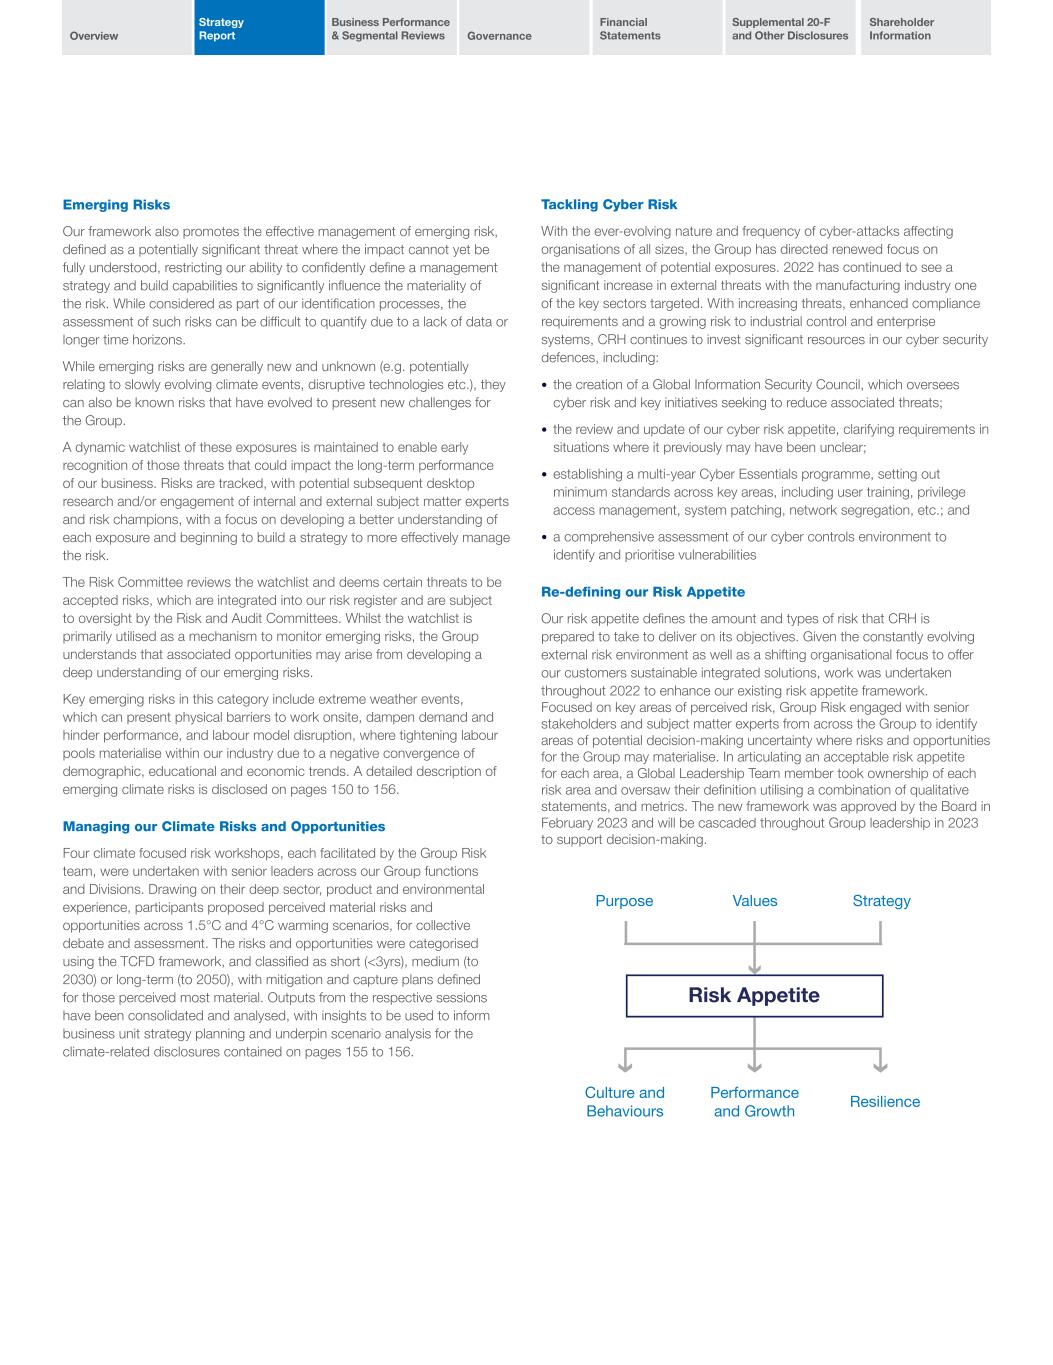
Overview Strategy Report Business Performance & Segmental Reviews Governance Financial Statements Supplemental 20-F and Other Disclosures Shareholder Information Emerging Risks Our framework also promotes the effective management of emerging risk, defined as a potentially significant threat where the impact cannot yet be fully understood, restricting our ability to confidently define a management strategy and build capabilities to significantly influence the materiality of the risk. While considered as part of our identification processes, the assessment of such risks can be difficult to quantify due to a lack of data or longer time horizons. While emerging risks are generally new and unknown (e.g. potentially relating to slowly evolving climate events, disruptive technologies etc.), they can also be known risks that have evolved to present new challenges for the Group. A dynamic watchlist of these exposures is maintained to enable early recognition of those threats that could impact the long-term performance of our business. Risks are tracked, with potential subsequent desktop research and/or engagement of internal and external subject matter experts and risk champions, with a focus on developing a better understanding of each exposure and beginning to build a strategy to more effectively manage the risk. The Risk Committee reviews the watchlist and deems certain threats to be accepted risks, which are integrated into our risk register and are subject to oversight by the Risk and Audit Committees. Whilst the watchlist is primarily utilised as a mechanism to monitor emerging risks, the Group understands that associated opportunities may arise from developing a deep understanding of our emerging risks. Key emerging risks in this category include extreme weather events, which can present physical barriers to work onsite, dampen demand and hinder performance, and labour model disruption, where tightening labour pools materialise within our industry due to a negative convergence of demographic, educational and economic trends. A detailed description of emerging climate risks is disclosed on pages 150 to 156. Managing our Climate Risks and Opportunities Four climate focused risk workshops, each facilitated by the Group Risk team, were undertaken with senior leaders across our Group functions and Divisions. Drawing on their deep sector, product and environmental experience, participants proposed perceived material risks and opportunities across 1.5°C and 4°C warming scenarios, for collective debate and assessment. The risks and opportunities were categorised using the TCFD framework, and classified as short (<3yrs), medium (to 2030) or long-term (to 2050), with mitigation and capture plans defined for those perceived most material. Outputs from the respective sessions have been consolidated and analysed, with insights to be used to inform business unit strategy planning and underpin scenario analysis for the climate-related disclosures contained on pages 155 to 156. Tackling Cyber Risk With the ever-evolving nature and frequency of cyber-attacks affecting organisations of all sizes, the Group has directed renewed focus on the management of potential exposures. 2022 has continued to see a significant increase in external threats with the manufacturing industry one of the key sectors targeted. With increasing threats, enhanced compliance requirements and a growing risk to industrial control and enterprise systems, CRH continues to invest significant resources in our cyber security defences, including: • the creation of a Global Information Security Council, which oversees cyber risk and key initiatives seeking to reduce associated threats; • the review and update of our cyber risk appetite, clarifying requirements in situations where it previously may have been unclear; • establishing a multi-year Cyber Essentials programme, setting out minimum standards across key areas, including user training, privilege access management, system patching, network segregation, etc.; and • a comprehensive assessment of our cyber controls environment to identify and prioritise vulnerabilities Re-defining our Risk Appetite Our risk appetite defines the amount and types of risk that CRH is prepared to take to deliver on its objectives. Given the constantly evolving external risk environment as well as a shifting organisational focus to offer our customers sustainable integrated solutions, work was undertaken throughout 2022 to enhance our existing risk appetite framework. Focused on key areas of perceived risk, Group Risk engaged with senior stakeholders and subject matter experts from across the Group to identify areas of potential decision-making uncertainty where risks and opportunities for the Group may materialise. In articulating an acceptable risk appetite for each area, a Global Leadership Team member took ownership of each risk area and oversaw their definition utilising a combination of qualitative statements, and metrics. The new framework was approved by the Board in February 2023 and will be cascaded throughout Group leadership in 2023 to support decision-making. Values StrategyPurpose Culture and Behaviours Performance and Growth Resilience Risk Appetite
2022 Annual Report and Form 20-F54 Enhancing Decision-Making with Risk Data Over the course of 2022, the Group deployed a new RMIS, which has been integrated into businesses and functions across our global operations. Developed in conjunction with our businesses, the system enables real-time capture and visibility of risk data, promoting transparency, accountability, and awareness of exposures that could have material implications for our business. We continued to invest in our people and to grow the skills required to drive our business, training over 600 employees to use this risk technology during 2022. Algorithms built into dashboards automatically filter risks to help leaders effectively prioritise those for review, and provide risk owners with a ‘point in time’ view of exposures and the effectiveness of mitigation activity, supporting the management of risks to within our defined risk appetite levels. The system underpins our bottom-up risk reporting, easily consolidating risks at all levels throughout the Group and has helped provide a more time-sensitive analysis of risk, expanding and building our strength through scale, and shaping and making our businesses better. Turning Risk into Reward Rapidly changing political, social, economic and environmental factors inherently present material uncertainty for our business and major stakeholders. Our ERM framework provides a structured approach for our people to consistently manage risk, whilst positioning us to capitalise on identified opportunities. Deep Stakeholder Collaboration CRH recognises that climate change presents significant risks and opportunities that may materially affect the Group’s operational and financial performance, and that collaboration across internal and external stakeholders is integral to our ability to move at speed to deliver our sustainability targets and ambitions. The agreement CRH signed with Shell in 2022 exemplifies this commitment, and will see the businesses collaborate and share learnings across Europe, North America and Asia-Pacific to explore, develop and deploy decarbonisation solutions and technologies at scale, including vehicle electrification and charging infrastructure, low-carbon fuels and asphalt solutions, and renewable electricity generation. Driving Continuous Innovation Rapidly evolving construction trends present material opportunity for those able to anticipate and quickly move to meet customers’ increasingly complex needs. In seeking to capitalise this opportunity, CRH Ventures was established in 2022 with access to a $250 million venturing and innovation fund to innovate, pilot and scale cutting-edge technologies and solutions with the potential to reinvent the built environment. One of its early investments was in AICrete, which combines data and artificial intelligence to create a unique ‘recipe-as-a-service’ platform to optimise local materials and minimise the amount of cement used, reducing CO2 emissions and the cost of concrete production. Recognising that there can be no opportunity without risk, the Group continues to cultivate a ‘safe to innovate’ culture, creating space for teams to be courageous and creative in their pursuit of transformative market solutions.

Overview Strategy Report Business Performance & Segmental Reviews Governance Financial Statements Supplemental 20-F and Other Disclosures Shareholder Information
2022 Annual Report and Form 20-F56 TCFD Executive Summary Task Force on Climate- related Financial Disclosures statement Our climate-related disclosures and details of the risks, opportunities and actions that we are taking are consistent with all of the Task Force on Climate-related Financial Disclosures (TCFD) recommendations and recommended disclosures*. We comply with the four TCFD recommendations and the 11 recommended disclosures as set out in Figure 4 of Section C of the report entitled 'Recommendations of the Task Force on Climate-related Financial Disclosures' published in June 2017 by the TCFD. These are detailed throughout this Annual Report and a cross- referencing map can be seen on page 59. Governance The Board is responsible for promoting the long-term success of the Group, generating value for shareholders and ensuring we make a positive contribution to society. Its role includes providing leadership; establishing and monitoring the Group’s purpose, values, and strategy; setting the Group’s risk appetite; and ensuring there is a robust framework of effective controls to enable risks and opportunities, including those related to climate change, to be successfully assessed and managed. Sustainability, including the impacts of climate change, is embedded in the Group’s strategy and business model. The Board recognises the importance of decarbonisation to address the challenges of climate change and believes the Group’s integrated strategy of value-added products and innovative solutions have a key role to play in delivering a more resilient and sustainable built environment. Our Governance Report beginning on page 80, provides our framework for addressing climate-related issues. Our Safety, Environment & Social Responsibility Committee report on pages 104 to 105 and Audit Committee report on pages 92 to 97 provides further information on the Board’s oversight of climate-related risks and opportunities. The Chief Executive is responsible for the operational and profit performance of the Group and is accountable to the Board for all authority delegated to executive management. The Chief Executive executes strategy agreed with the Board and regularly reports to the Board on the progress and performance of the Group, including in relation to climate- related matters. The Chief Executive is supported by the Global Leadership Team, which is responsible for implementing strategy, performance delivery and progressing the Group’s sustainability and climate-related agenda. Responsibility for formulating and * As required by the FCA Listing Rule 9.8.6(R) which applies to issuers with a premium listing on the London Stock Exchange.

Overview Strategy Report Business Performance & Segmental Reviews Governance Financial Statements Supplemental 20-F and Other Disclosures Shareholder Information CASE STUDY executing our climate strategy sits with the Chief Operating Officer (COO), while the Global Leadership Team receives support from various executive-level committees and other working groups and functions on sustainability and climate-related issues. For more information on the management of climate change see pages 150 to 154. Strategy The Group’s strategy and financial planning is designed to identify, evaluate, and manage significant risks that could inhibit the group from successfully operating. Our financial planning takes into consideration the multidimensional impacts of climate change on the Group’s activities. For more information on how climate considerations are incorporated into the Group’s strategy, see pages 150 to 154. The Group has identified climate-related risks and opportunities that could impact us in the short (<3 years), medium (to 2030) and long- term (to 2050) using the TCFD’s framework. We assessed these factors qualitatively, informed by warming scenario key assumptions and supported where possible with top-down quantitative assessments. We have provided an overview of the material climate-related risks and opportunities and how they impact our businesses, strategy and financial planning in our risks and opportunities disclosure on pages 150 to 154. Building on our climate-related risk and opportunity analysis, CRH also conducted in 2022 a detailed quantitative assessment on two of these risks; carbon pricing and adverse weather, as a first step in undertaking detailed quantification of all risks and opportunities. For more information on the processes, assumptions, and outputs of the Group’s climate scenario analysis, see pages 155 and 156. The overall assessment identified a number of transitional and physical risks and opportunities, which may adversely or positively impact the operational and financial performance of the Group. The impacts were considered both with and without any mitigation or adaptation actions CRH may take. CRH continually assesses its strategy, business model and ongoing business performance to make sure that they are driving sustainable growth and value creation for its stakeholders. Based on this assessment, the Group believes it has sufficient flexibility and resilience to successfully manage its climate-related risks and opportunities. Advancing innovative solutions for carbon reduction We use innovative processes to reinvent our products and to support our ambition to decarbonise our operations and the built environment. For example, Tarmac, part of our Europe Materials Division, has become a sector leader through the use of its ULTILOW products, a range of high performing, durable, warm- mix asphalts which use lower temperatures in the manufacturing process to reduce carbon by up to 15%. In 2022 Tarmac have led the way in the UK market by making ULTILOW the default asphalt for virtually all road surfacing applications instead of the traditional hot-mix option.
2022 Annual Report and Form 20-F58 TCFD Executive Summary continued Risk Management CRH operates a bottom-up and top-down risk assessment process, where information from our operating companies informs our Group-wide risk assessments, and Group-level risk analysis informs local risk identification and assessment. A robust risk catalogue is used to inform our bottom-up risk identification processes and ensure our businesses consider the full breadth of climate- related risks and opportunities. Common criteria and topic hierarchies are used to assess and consistently categorise risks and opportunities, which helps CRH to identify and manage aggregate exposures that may be more effectively managed centrally. More broadly, climate-related risks and opportunities are managed using our ERM framework. To understand more about our processes for identifying, assessing, and managing risk, please see our Risk Governance section on pages 50 to 54. Risks are identified through a number of different forums, such as champion forums, engagement with senior leaders and other stakeholders and through other channels. During 2022, CRH undertook a number of workshops across our three Divisions to identify how climate-related risks could adversely impact the Group and how potential opportunities could create value and contribute to a more resilient built environment. The size and significance of each risk is determined according to assessed impact on the organisation and its likelihood of occurrence. A list of the climate- related risks and opportunities identified can be seen on pages 150 to 154. Metrics and Targets CRH uses a variety of metrics and targets to measure and manage our climate-related risks and opportunities. Internally, these inform the Group’s risk governance, strategy, and management processes. Externally, they allow investors and other stakeholders to assess the Group’s performance over time and provide a sound basis for comparison with industry peers. Our climate-related targets are set by the Global Leadership Team and approved by our SESR Committee, which evaluates these targets annually. In 2022, CRH adopted its industry-leading SBTi validated target 25% reduction in absolute carbon emissions by 2030 (from a 2020 base year). In early 2023, the SBTi validated our revised targets1 in line with the updated 1.5°C science-based framework which now equate to a 30% reduction in absolute carbon emissions by 2030 (from a 2021 base year). For more information see page 31. Our climate-related targets are linked to our remuneration policy. For our 2022 Performance Share Plan (PSP), 15% relates to ESG metrics, of which 10% are specific to climate. Our PSP is an effective mechanism for incentivising progress towards a more sustainable built environment, recognising the long-term nature of our targets. To monitor performance and the implementation of our sustainability strategy, where appropriate key performance indicators and related targets are defined for each climate-related risk and opportunity. To facilitate comparative and trend analysis, our climate-related metrics are disclosed consistently from year to year and our targets have a defined time horizon. See more on pages 150 to 154. The Corporate Sustainability Reporting team is responsible for monitoring the Group’s climate-related metrics and progress being made towards targets through our Annual Sustainability Review process. 1: Refer to page 27 for further detail on our decarbonisation targets.
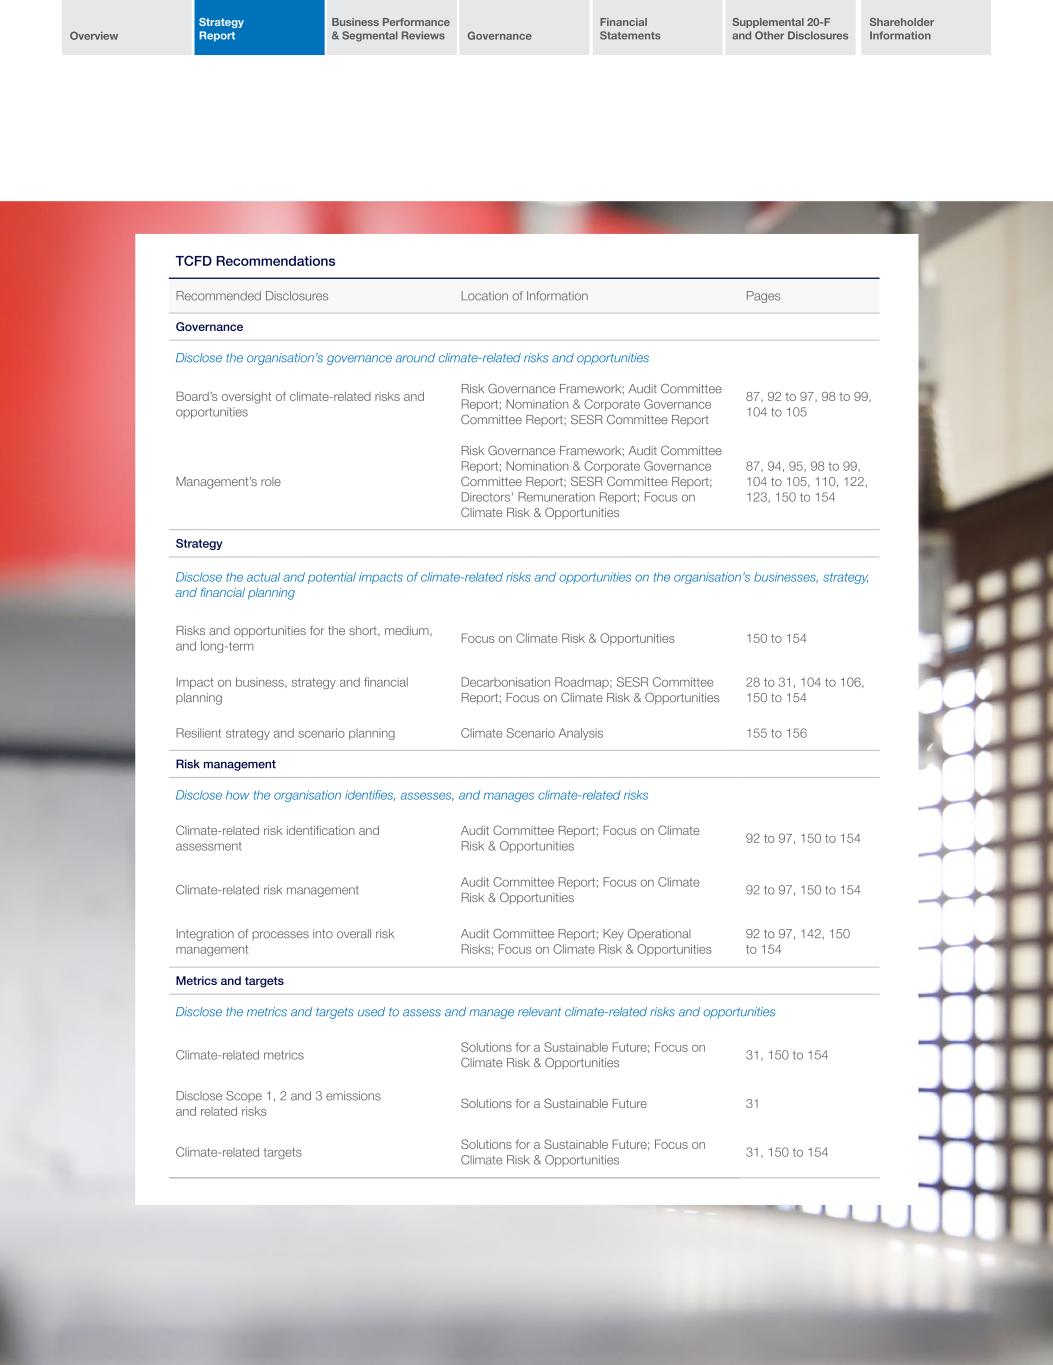
Overview Strategy Report Business Performance & Segmental Reviews Governance Financial Statements Supplemental 20-F and Other Disclosures Shareholder Information TCFD Recommendations Recommended Disclosures Location of Information Pages Governance Disclose the organisation’s governance around climate-related risks and opportunities Board’s oversight of climate-related risks and opportunities Risk Governance Framework; Audit Committee Report; Nomination & Corporate Governance Committee Report; SESR Committee Report 87, 92 to 97, 98 to 99, 104 to 105 Management’s role Risk Governance Framework; Audit Committee Report; Nomination & Corporate Governance Committee Report; SESR Committee Report; Directors' Remuneration Report; Focus on Climate Risk & Opportunities 87, 94, 95, 98 to 99, 104 to 105, 110, 122, 123, 150 to 154 Strategy Disclose the actual and potential impacts of climate-related risks and opportunities on the organisation’s businesses, strategy, and financial planning Risks and opportunities for the short, medium, and long-term Focus on Climate Risk & Opportunities 150 to 154 Impact on business, strategy and financial planning Decarbonisation Roadmap; SESR Committee Report; Focus on Climate Risk & Opportunities 28 to 31, 104 to 106, 150 to 154 Resilient strategy and scenario planning Climate Scenario Analysis 155 to 156 Risk management Disclose how the organisation identifies, assesses, and manages climate-related risks Climate-related risk identification and assessment Audit Committee Report; Focus on Climate Risk & Opportunities 92 to 97, 150 to 154 Climate-related risk management Audit Committee Report; Focus on Climate Risk & Opportunities 92 to 97, 150 to 154 Integration of processes into overall risk management Audit Committee Report; Key Operational Risks; Focus on Climate Risk & Opportunities 92 to 97, 142, 150 to 154 Metrics and targets Disclose the metrics and targets used to assess and manage relevant climate-related risks and opportunities Climate-related metrics Solutions for a Sustainable Future; Focus on Climate Risk & Opportunities 31, 150 to 154 Disclose Scope 1, 2 and 3 emissions and related risks Solutions for a Sustainable Future 31 Climate-related targets Solutions for a Sustainable Future; Focus on Climate Risk & Opportunities 31, 150 to 154

Chief Financial Officer's Review Americas Materials In 2022 CRH recorded a strong financial performance reflecting the strength and resilience of our integrated solutions strategy. Our Americas Materials Division provides solutions for the construction and RMI of public infrastructure, homes and commercial buildings in North America. Read our Chief Financial Officer's Review on page 62 Read more about its 2022 Performance on page 68

Business Performance and Segmental Reviews Chief Financial Officer's Review 62 Americas Materials 68 Building Products 72 Europe Materials 76 Building Products Europe Materials Our Building Products Division manufactures, supplies and delivers high quality, value-added, innovative solutions to shape and enhance the built environment for modern communities in major economies in North America, Europe and Asia. Our Europe Materials Division provides solutions for the construction of public infrastructure, homes and commercial buildings to customers in construction markets across 19 countries in Europe and 2 countries in Asia. Read more about its 2022 Performance on page 72 Read more about its 2022 Performance on page 76

2022 Annual Report and Form 20-F62 Chief Financial Officer's Review 20221 Strong result reflecting the strength & resilience of our integrated solutions strategy In 2022 CRH delivered another strong result despite a challenging and volatile cost environment in both North America and Europe. Our performance reflects the continued execution of our integrated and sustainable solutions strategy. Group sales of $32.7 billion (2021: $29.2 billion) were 12% ahead of 2021 reflecting solid commercial progress, resilient underlying demand and the strength of our business model. Year-end net debt of $5.1 billion (2021: $6.3 billion) was reflective of our continued strong cash generation, and efficient allocation and reallocation of capital. Net acquisition spend totalled $3.3 billion (2021: $1.5 billion) in the year and total distributions to shareholders were $2.1 billion (2021: $1.8 billion). Net Debt/EBITDA (as defined)*2 was 0.9x (2021: 1.3x). Segmental Reviews The sections on pages 68 to 79 outline the scale of CRH's operations in 2022 and provide a more detailed review of performance in each of CRH's reporting segments. A review of the Building Envelope business, which was divested in April 2022 and has been classified within discontinued operations, is also included on page 75. Key Components of 2022 Performance Americas Materials delivered a strong performance with total sales 15% above 2021 levels and like-for-like sales3 12% ahead driven primarily by solid price progression across all lines of business. Building Products maintained good activity levels as demand for critical utility infrastructure and outdoor living solutions remained resilient. This, together with strong performances from recent acquisitions, delivered total sales growth of 26%. Like-for-like sales were 11% ahead of 2021. Europe Materials like-for-like sales were also 11% ahead reflecting continued strong pricing progress which offset the impact of lower activity levels. Total sales were in line with 2021 due to the impact of adverse currency translation effects. Group EBITDA (as defined)* of $5.6 billion (2021: $5.0 billion) was 13% ahead despite the backdrop of significant cost inflation, reflecting the benefits of our integrated solutions strategy together with resilient demand and continued commercial progress. This improved profitability, coupled with our ongoing focus on balance sheet optimisation, resulted in a further increase in returns with RONA increasing by 100 basis points (bps) to 13.3% (2021: 12.3%). Reported profit after tax was ahead of 2021 at $3.9 billion (2021: $2.6 billion) driven by the strong trading performance and with this year’s profit augmented by the profit on disposal of the Building Envelope business. 1 See cautionary statement regarding Forward-Looking Statements on page 135. 2 Net Debt/EBITDA (as defined)* is a non-GAAP measure as defined on page 260. The GAAP figures that are most directly comparable to the components of Net Debt/EBITDA (as defined)* include: interest-bearing loans and borrowings: (2022: $9,636 million, 2021: $10,487 million) and profit after tax (2022: $3,874 million, 2021: $2,621 million). 3 Details of how non-GAAP measures are calculated are set out on pages 257 to 260. *EBITDA is defined as earnings from continuing operations before interest, taxes, depreciation, amortisation, asset impairment charges, profit on disposals and the Group’s share of equity accounted investments’ profit after tax. 2022 2021 Net Debt/EBITDA (as defined)* 0.9x 1.3x Interest-bearing loans and borrowings/Profit after tax 2.5x 4.0x Return on net assets (RONA) 13.3% 12.3% Return on net segment assets 13.7% 12.1%
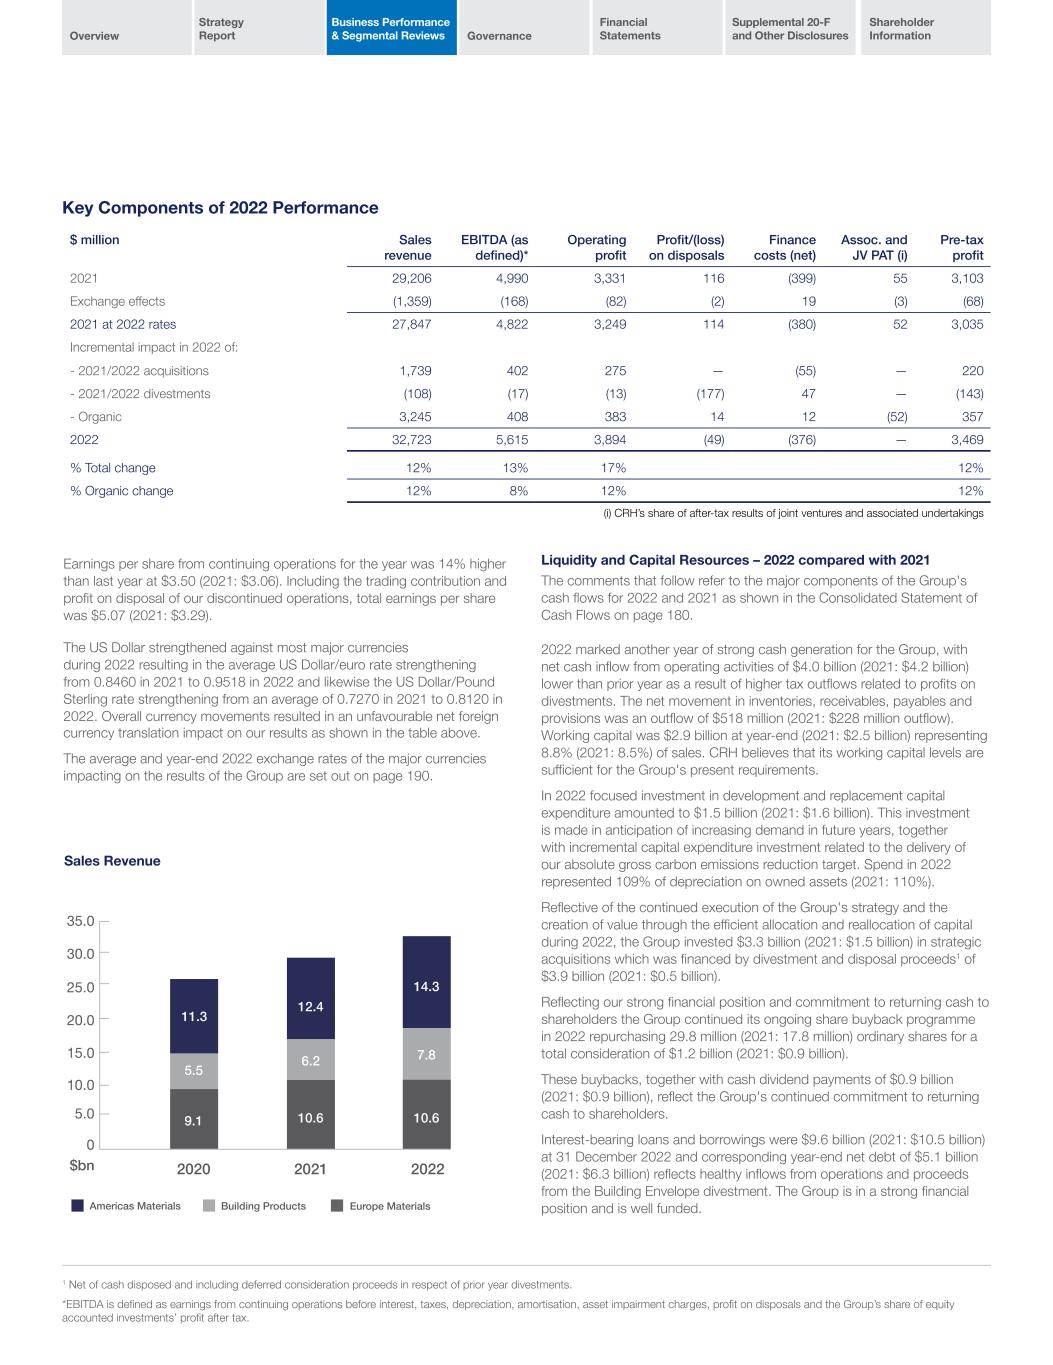
Overview Strategy Report Business Performance & Segmental Reviews Governance Financial Statements Supplemental 20-F and Other Disclosures Shareholder Information Key Components of 2022 Performance $ million Sales revenue EBITDA (as defined)* Operating profit Profit/(loss) on disposals Finance costs (net) Assoc. and JV PAT (i) Pre-tax profit 2021 29,206 4,990 3,331 116 (399) 55 3,103 Exchange effects (1,359) (168) (82) (2) 19 (3) (68) 2021 at 2022 rates 27,847 4,822 3,249 114 (380) 52 3,035 Incremental impact in 2022 of: - 2021/2022 acquisitions 1,739 402 275 — (55) — 220 - 2021/2022 divestments (108) (17) (13) (177) 47 — (143) - Organic 3,245 408 383 14 12 (52) 357 2022 32,723 5,615 3,894 (49) (376) — 3,469 % Total change 12% 13% 17% 12% % Organic change 12% 8% 12% 12% (i) CRH’s share of after-tax results of joint ventures and associated undertakings Americas Materials Building Products Europe Materials $bn 0 5.0 10.0 15.0 20.0 25.0 30.0 35.0 2020 2021 2022 11.3 5.5 9.1 12.4 14.3 6.2 7.8 10.6 10.6 The US Dollar strengthened against most major currencies during 2022 resulting in the average US Dollar/euro rate strengthening from 0.8460 in 2021 to 0.9518 in 2022 and likewise the US Dollar/Pound Sterling rate strengthening from an average of 0.7270 in 2021 to 0.8120 in 2022. Overall currency movements resulted in an unfavourable net foreign currency translation impact on our results as shown in the table above. The average and year-end 2022 exchange rates of the major currencies impacting on the results of the Group are set out on page 190. 1 Net of cash disposed and including deferred consideration proceeds in respect of prior year divestments. *EBITDA is defined as earnings from continuing operations before interest, taxes, depreciation, amortisation, asset impairment charges, profit on disposals and the Group’s share of equity accounted investments’ profit after tax. Earnings per share from continuing operations for the year was 14% higher than last year at $3.50 (2021: $3.06). Including the trading contribution and profit on disposal of our discontinued operations, total earnings per share was $5.07 (2021: $3.29). Sales Revenue Liquidity and Capital Resources – 2022 compared with 2021 The comments that follow refer to the major components of the Group's cash flows for 2022 and 2021 as shown in the Consolidated Statement of Cash Flows on page 180. 2022 marked another year of strong cash generation for the Group, with net cash inflow from operating activities of $4.0 billion (2021: $4.2 billion) lower than prior year as a result of higher tax outflows related to profits on divestments. The net movement in inventories, receivables, payables and provisions was an outflow of $518 million (2021: $228 million outflow). Working capital was $2.9 billion at year-end (2021: $2.5 billion) representing 8.8% (2021: 8.5%) of sales. CRH believes that its working capital levels are sufficient for the Group's present requirements. In 2022 focused investment in development and replacement capital expenditure amounted to $1.5 billion (2021: $1.6 billion). This investment is made in anticipation of increasing demand in future years, together with incremental capital expenditure investment related to the delivery of our absolute gross carbon emissions reduction target. Spend in 2022 represented 109% of depreciation on owned assets (2021: 110%). Reflective of the continued execution of the Group's strategy and the creation of value through the efficient allocation and reallocation of capital during 2022, the Group invested $3.3 billion (2021: $1.5 billion) in strategic acquisitions which was financed by divestment and disposal proceeds1 of $3.9 billion (2021: $0.5 billion). Reflecting our strong financial position and commitment to returning cash to shareholders the Group continued its ongoing share buyback programme in 2022 repurchasing 29.8 million (2021: 17.8 million) ordinary shares for a total consideration of $1.2 billion (2021: $0.9 billion). These buybacks, together with cash dividend payments of $0.9 billion (2021: $0.9 billion), reflect the Group's continued commitment to returning cash to shareholders. Interest-bearing loans and borrowings were $9.6 billion (2021: $10.5 billion) at 31 December 2022 and corresponding year-end net debt of $5.1 billion (2021: $6.3 billion) reflects healthy inflows from operations and proceeds from the Building Envelope divestment. The Group is in a strong financial position and is well funded.

2022 Annual Report and Form 20-F64 Chief Financial Officer's Review 2022 continued Development Review 2022 The Group invested $3.3 billion on 29 acquisitions in 2022 (including deferred and contingent consideration in respect of prior year acquisitions) and a further $1.5 billion on development and replacement capital expenditure projects. On the divestment front, the Group completed nine transactions and realised total business and asset disposal proceeds of $3.9 billion, primarily relating to the proceeds from the Building Envelope divestment. The largest acquisition in 2022 was in our Building Products Division where the Group completed its acquisition of Barrette, North America’s leading provider of residential fencing and railing solutions, for $1.9 billion. This acquisition complements and enhances our offering of sustainable outdoor living solutions in North America. In addition, Building Products completed a further seven acquisitions in the US and two in Europe amounting to a total spend of $2.7 billion. The Americas Materials Division completed ten solutions-focused acquisitions in the US for a total spend of $0.5 billion, and the Europe Materials Division completed nine bolt-on acquisitions for $0.1 billion, the largest of which was the acquisition of a precast business in Denmark. The largest divestment in 2022 was the Building Envelope business for cash proceeds of $3.5 billion (enterprise value of $3.8 billion including lease liabilities transferred of $0.3 billion). A further eight divestments were completed across the Group realising total proceeds of $0.2 billion. In addition to these business divestments, the Group realised proceeds of $0.1 billion from the disposal of surplus property, plant and equipment and other non-current assets. Furthermore, $52 million cash proceeds were received during the year relating to divestments in prior years, of which $49 million related to deferred consideration received for the divestment of the Group’s equity interest in My Home Industries (MHIL) in India. The Group ended 2022 with $5.9 billion of cash and cash equivalents on hand and $3.7 billion of undrawn committed facilities which are available until 2026. At year-end, the Group had sufficient cash balances to meet all maturing debt obligations (including leases) for the next five years and the weighted average maturity of the remaining term debt was 12.2 years. A CHF330 million Swiss Franc denominated bond was repaid on maturity in September 2022. The Group also has a $2.0 billion US Dollar Commercial Paper Programme and a €1.5 billion Euro Commercial Paper Programme of which there were no outstanding issued notes at year-end. The purpose of these programmes is to provide short-term liquidity at attractive terms as required. Contractual obligations and off-Balance Sheet arrangements are disclosed on page 274 of this Annual Report and Form 20-F. Jim Mintern Chief Financial Officer

Overview Strategy Report Business Performance & Segmental Reviews Governance Financial Statements Supplemental 20-F and Other Disclosures Shareholder Information N O N - F I N A N C I A L K P I s F I N A N C I A L K P I s Key Performance Indicators SAFETY % ZERO ACCIDENTS IN OUR LOCATIONS 2022 94% 2021 94% 2020 94% In 2022 we continued to achieve a high level 94% of zero-accident locations. For detail on our safety performance see page 38. ENVIRONMENT KG/$ REVENUE GREENHOUSE GAS EMISSIONS SCOPE 1 AND SCOPE 2 CO2e EMISSIONS1 2022 1.0 kg/$ 2021 1.2 kg/$ 2020 1.3 kg/$ In 2022 our Scope 1 and Scope 2 CO2e emissions decreased as we maintained our progress towards our cement emissions reduction target. For detail on our CO2 emissions reductions see page 26. INCLUSION & DIVERSITY % WOMEN IN SENIOR MANAGEMENT 2022 15% 2021 14% 2020 13% The percentage of women in senior management was 15% in 2022 and we continued to focus on executing our I&D strategy across the Group. For detail on our I&D performance see page 40. CASH GENERATION OPERATING CASH FLOW (OCF) 2022 $4.0bn 2021 $4.2bn 2020 $3.9bn We measure cash flows generated to fund organic and acquisitive growth, dividends to shareholders, share buybacks and debt repayment. OCF was behind in 2022 due to higher tax outflows related to profits on divestments. PROFITABILITY EARNINGS PER SHARE (EPS) 2022 $3.50 2021 $3.06 2020 $1.23 EPS serves as an indicator of profitability on a per-share basis. In 2022, basic EPS increased by 14% to $3.50, reflecting a strong trading performance despite a challenging and volatile cost environment. SHAREHOLDER RETURNS CASH PAID TO SHAREHOLDERS Dividends Shares Repurchased 2022 $0.9bn $1.2bn $2.1bn Dividends Shares Repurchased 2021 $0.9bn $0.9bn $1.8bn 2020 $0.7bn $0.2bn $0.9bn Cash returned to shareholders each year through dividends and our share buyback programme are among a range of shareholder returns we measure. In 2022, we returned $2.1 billion to our shareholders with $1.2 billion being returned through share buybacks and $0.9 billion through dividends. FINANCIAL DISCIPLINE INTEREST-BEARING LOANS AND BORROWINGS/PROFIT AFTER TAX 2022 2.5x 2021 4.0x 2020 10.5x^ Interest-bearing Loans and Borrowings/Profit After Tax is a GAAP equivalent measure of Net Debt/EBITDA (as defined)* ^ 2020 metric includes the impact of non-cash impairment charges of $0.8 billion. FINANCIAL DISCIPLINE NET DEBT/EBITDA (AS DEFINED)* 2022 0.9x 2021 1.3x 2020 1.4x Net Debt/EBITDA (as defined)* is a measure of financial leverage and ability to service debt. It underpins investment-grade credit ratings and the ability to access finance. Net Debt/EBITDA (as defined)* improved to 0.9x (2021: 1.3x) as a result of lower net debt levels. CREATING VALUE RETURN ON NET ASSETS RONA Return on Net Segment Assets 2022 13.3% 13.7% RONA Return on Net Segment Assets 2021 12.3% 12.1% 2020 10.1% 7.4% RONA is a measure of pre-tax and pre-impairment returns through excellence in operational performance. The Group achieved a RONA of 13.3% (2021: 12.3%) which reflected continued enhancement of operating efficiencies and improved profit margins. 1.CO2 emissions subject to final verification under the European Union Emissions Trading Scheme (EU ETS). For further detail on our CO2 metrics and targets, as well as calculation methodology, see page 31. *EBITDA is defined as earnings from continuing operations before interest, taxes, depreciation, amortisation, asset impairment charges, profit on disposals and the Group’s share of equity accounted investments’ profit after tax. We track and measure progress through the use of specific financial and non-financial Key Performance Indicators (KPIs). We regularly review these KPIs to ensure they remain appropriate for our business. In 2022 we measured our progress across the following KPIs:

2022 Annual Report and Form 20-F66 Chief Financial Officer's Review 2021 2021 was another year of growth for CRH underpinned by our integrated solutions strategy and reflected positive underlying momentum in North America and Europe. Group sales of $29.2 billion (2020: $25.9 billion) were 13% ahead of 2020 reflecting improved pricing and volume growth. Year-end net debt of $6.3 billion (2020: $5.9 billion) was reflective of our continued strong cash generation, disciplined capital expenditure and value-focused investments. Net acquisition spend totalled $1.5 billion (2020: $0.4 billion) and total distributions to shareholders were $1.8 billion (2020: $0.9 billion). Net Debt/ EBITDA (as defined)* was 1.3x (2020: 1.4x). Key Components of 2021 Performance Americas Materials benefited from increased construction activity in 2021 due to strong residential demand in North America. Underlying good operating performance offset the impacts of higher input costs and inclement weather. Like-for-like sales in 2021 increased by 6% against 2020, due to positive volume growth and pricing progression. Building Products delivered like-for-like sales 7% ahead of 2020, driven by strong demand for residential construction and a moderate recovery in the non-residential sector. Building Envelope, which is classified within discontinued operations for reporting purposes, saw sales increase by 4% in 2021 driven by strong pricing and good demand due to early signs of recovery in the non-residential market. Europe Materials saw like-for-like sales 11% ahead of 2021 reflecting good volume growth, and pricing progress against a 2020 comparative which was heavily impacted by pandemic restrictions. Positive pricing actions and strong fixed cost control offset cost inflation headwinds. EBITDA (as defined)* of $5.0 billion (2020: $4.3 billion) was 16% ahead reflecting the benefits of our integrated solutions strategy together with strong demand growth and continued commercial discipline. Reported profit after tax was significantly ahead of 2020 at $2.6 billion (2020: $1.2 billion) driven by a strong trading performance and the non- recurrence of non-cash impairment charges and one-off restructuring costs in 2020. The US Dollar strengthened against most major currencies by the end of 2021. However, during 2021 the US Dollar weakened against most major currencies resulting in the average US Dollar/euro rate weakening from 0.8771 in 2020 to 0.8460 in 2021 and likewise the US Dollar/Pound Sterling weakening from an average 0.7798 in 2020 to 0.7270 in 2021. Overall currency movements resulted in a favourable net foreign currency translation impact on our results as shown in the table above. The average and year-end 2021 exchange rates of the major currencies impacting on the Group are set out on page 190. Liquidity and Capital Resources – 2021 compared with 2020 The comments that follow refer to the major components of the Group's cash flows for 2021 and 2020 as shown in the Consolidated Statement of Cash Flows on page 180. Despite significantly increased trading activity compared to 2020, the Group remained focused on cash management. Management delivered a net working capital outflow of $228 million (2020: $196 million inflow) and the Group's operating cash flow increased to $4.2 billion (2020: $3.9 billion). Working capital was $2.5 billion at year-end (2020: $2.4 billion) representing 8.5% of sales (2020: 9.3%). Focused investment in property, plant and equipment in markets and businesses with increased demand and efficiency requirements, resulted in higher cash outflows of $1.6 billion (2020: $1.0 billion), with spend in 2021 representing 110% of depreciation on owned assets (2020: 74%). Reflective of the ongoing strategy of active portfolio management, the Group invested $1.5 billion in bolt-on acquisitions (2020: $0.4 billion) which was partly financed by divestment and disposal proceeds1 of $0.5 billion (2020: $0.3 billion). Reflecting our strong financial position and commitment to returning cash to shareholders, the Group continued its share buyback programme in 2021 repurchasing 17.8 million (2020: 6.0 million) ordinary shares for a total consideration of $0.9 billion (2020: $0.2 billion). These buybacks, together with cash dividend payments of $0.9 billion (2020: $0.7 billion), reflect the Group's continued commitment to returning cash to shareholders. Year-end interest-bearing loans and borrowings were $10.5 billion (2020: $12.2 billion) and year-end net debt of $6.3 billion (2020: $5.9 billion) reflects strong inflows from operations and an increase in disciplined capital expenditure and value-focused investments. Key Components of 2021 Performance $ million Sales revenue EBITDA (as defined)* Operating profit Profit on disposals Finance costs (net) Assoc. and JV PAT (i) Pre-tax profit 2020 25,888 4,293 2,026 17 (471) (118) 1,454 Exchange effects 551 49 10 1 (9) — 2 2020 at 2021 rates 26,439 4,342 2,036 18 (480) (118) 1,456 Incremental impact in 2021 of: - 2020/2021 acquisitions 813 101 56 — (3) — 53 - 2020/2021 divestments (182) (58) (51) 97 — — 46 - One-offs (ii) — 118 118 — — — 118 - Impairments — — 673 — — 154 827 - Organic 2,136 487 499 1 84 19 603 2021 29,206 4,990 3,331 116 (399) 55 3,103 % Total change 13% 16% 64% 113% % Organic change 8% 11% 25% 41% (i) CRH’s share of after-tax results of joint ventures and associated undertakings (ii) One-offs primarily due to 2020 COVID-19 related restructuring costs

Overview Strategy Report Business Performance & Segmental Reviews Governance Financial Statements Supplemental 20-F and Other Disclosures Shareholder Information 1 Net of cash disposed and including deferred consideration proceeds in respect of prior year divestments. *EBITDA is defined as earnings from continuing operations before interest, taxes, depreciation, amortisation, asset impairment charges, profit on disposals and the Group’s share of equity accounted investments’ profit after tax. Development Review 2021 The Group invested $1.5 billion in 19 bolt-on acquisitions in 2021 (including deferred and contingent consideration in respect of prior acquisitions). The largest of these in 2021 was the acquisition of Angel Brother Enterprises, an asphalt paving and infrastructure solutions business in Texas. In addition, the Americas Materials Division completed a further seven bolt-on acquisitions across the US and Canada for a total spend of $0.7 billion. The Building Products Division completed seven acquisitions amounting to a total spend of c. $0.7 billion including NPP, a water and energy infrastructure solutions business in the eastern region of the US. The Europe Materials Division completed four acquisitions, with a total spend of c. $17 million. The Group also paid $33 million of deferred and contingent consideration related to prior acquisitions. On the divestment front, the Group completed 11 transactions and realised total business and asset disposal cash proceeds of $0.5 billion, inclusive of $0.1 billion relating to the receipt of deferred proceeds from prior divestments, the majority of which related to the divestment of the Group's equity interest in MHIL in India. The sale of the Brazil cement operations by the Americas Materials Division represented the largest divestment during 2021, with a further 10 other divestments completed across the Group. In addition to these business divestments, the Group realised proceeds of $0.1 billion from the disposal of surplus property, plant and equipment and other non-current assets. 2020 The Americas Materials Division completed seven bolt-on acquisitions across the US and Canada for a total spend of $163 million. The Building Products Division completed six bolt-on acquisitions amounting to a total spend of $182 million including the acquisition of Martin Enterprises. Europe Materials completed four acquisitions, with a total spend of $7 million for the Division. The Group also paid $54 million of deferred and contingent consideration related to prior acquisitions. On the divestment front, the Group completed 12 transactions and realised total business and asset disposal cash proceeds of $307 million, inclusive of $123 million relating to the receipt of deferred proceeds from previous divestments of which $95 million related to the divestment of the Group's equity interest in MHIL. The sale of precast concrete production assets located in Spokane, Washington, represented the largest divestment in 2020 and was completed by our Building Products Division. The divestment of the building materials business in La Reunion was the second largest divestment, completed by our Europe Materials Division, with 10 other divestments completed across the Divisions. In addition to these business divestments, the Group realised proceeds of $128 million from the disposal of surplus property, plant and equipment and other non-current assets.

2022 Annual Report and Form 20-F68 Americas Materials Strong growth delivered by a uniquely integrated and value-added solutions strategy1 CRH is the largest building materials business in North America where our Americas Materials business provides solutions for the construction and RMI of public infrastructure, homes and commercial buildings. The Markets We Serve Our Americas Materials Division serves the needs of the construction industry across North America where positive market fundamentals, including strong population growth, drive demand for our materials, products and services. Our operating footprint includes attractive locations in the Northeast and Midwest where RMI activity is most resilient and the South and West where migration is driving new-build growth. In recent years we have expanded our presence in the higher-growth US southern states to increase our exposure to the favourable demand fundamentals of higher population growth and positive migration trends. Approximately 50% of the Division's sales relates to the infrastructure sector, a significant proportion of which is awarded by public tender. These construction projects include federal, provincial, state, and local government authority road and infrastructure projects. Demand momentum in 2022 was underpinned in particular by federal- and state-level infrastructure funding along with continued residential and commercial activity, including robust warehouse construction activity. Creating Value CRH has built leadership positions in attractive construction markets across the US and Canada. These positions are supported by a network of strong reserves at quarry locations predominantly adjacent to and serving urban areas where demand is strongest. Our local businesses leverage their strong market knowledge, deep industry expertise and extensive array of essential materials to implement our differentiated strategy, offering value-add, end-to-end solutions which combine different types of materials, products, and services to satisfy multiple customer segment needs. This enables us to provide a unique, value enhancing, one-stop-shop experience saving time and reducing logistical complexity for our customers. This helps deepen our relationships and increase the share of wallet our customers spend with us. In addition, our operations are vertically integrated enabling us to optimise production throughout the value chain. Essential materials produced by our aggregates and cement businesses for example are supplied to our downstream materials businesses for use in products such as readymixed concrete and asphalt. 2022 Performance Highlights Size and Scale: % of Group$ million Sales 14,324 44% EBITDA (as defined)* 49%2,748 Operating Profit 49%1,909 49%Net Assets1 14,775 Annualised Sales Volumes3 Sales by end-use2 New Build 50%50% 50% 30% 20% Sales by sector2 Residential Repair Maintenance and Improvement (RMI) Non- residential Infrastructure EBITDA (as defined)* growth $bn 0.5 1.0 1.5 2.0 2.5 3.0 3.5 2020 2021 2022 $2.4 bn $2.6 bn $2.7 bn +8% +6% c. 29,100 employees c. 1,605 locations 44 US states and 6 Canadian provinces Aggregates: 196.8m tonnes Cement: 12.7m tonnes Readymixed Concrete: 12.6m m3 Asphalt: 48.0m tonnes 1 Net Assets at 31 December 2022 comprise segment assets less segment liabilities excluding lease liabilities as defined on page 260. 2 Sector exposure and end-use balance are based on sales. 3 Throughout this document annualised volumes have been used which reflect the full-year impact of development activity during the year and may vary from actual volumes sold. *EBITDA is defined as earnings from continuing operations before interest, taxes, depreciation, amortisation, asset impairment charges, profit on disposals and the Group’s share of equity accounted investments’ profit after tax.

Overview Strategy Report Business Performance & Segmental Reviews Governance Financial Statements Supplemental 20-F and Other Disclosures Shareholder Information CASE STUDY Empowering Sustainable Solutions How our Integrated Solutions Strategy Enhanced a Transport Infrastructure Project This approach is fundamental to our development strategy and sets CRH apart within our industry. The largely unconsolidated US building materials market presents further opportunities for value creation by allowing us to continue to identify and acquire businesses that can be efficiently integrated into our existing network and support our strong culture of safety and ongoing efforts towards a more inclusive and diverse workforce. An example of how we have been doing this is by collaborating with educational institutions to equip younger generations with the core skills needed within our industry and enable underrepresented individuals to access university. The CRH Canada Bridge Scholarship Program builds equity, diversity and inclusion by providing financial aid to students from underrepresented and underserved communities. In 2022 there were nine recipients from across Canada who were awarded a CRH Canada Bridge Scholarship, an example of how CRH also creates social value in the communities in which it operates. CRH’s vision is to develop sustainable solutions that build, connect, and improve our world. In 2022 we joined the NAPA 'The Road Forward' initiative which aims to achieve net-zero carbon emission asphalt pavements. Increasing our use of RAP will be critical to reducing emissions and in 2022 we further expanded our use of RAP in Michigan where our Cadillac Asphalt business began to utilise RAP for the first time. In addition to improving the sustainability attributes of our asphalt products, we also continued to make progress in other areas. For example, our American Rock Products business developed a specialised new sustainable readymixed concrete mix which can lower the carbon footprint of concrete used in data centres in Oregon by up to 23%. CRH provided a uniquely integrated highway construction solution which helped the Michigan Department of Transport (MDOT) reduce cost, decrease complexity, and save time when replacing 120 lane miles of freeway, and rehabilitating and replacing 27 bridges on Interstate Highway I-69. CRH employed its specialised design and engineering expertise to help MDOT create a single end-to-end design plan, integrating a variety of materials, products, and services into a single efficient construction solution, shortening the construction time from eight years to just three. The customer also benefited from CRH’s extensive experience in water management infrastructure. Our team worked with project architects and engineers to devise and implement an environmentally friendly solution which incorporated culverts and drainage systems from CRH’s Infrastructure Products Group. CRH also helped to enhance the sustainability attributes of the project by providing recycled asphalt and innovative asphalt mix designs. These technologies will ensure the road surface performs above specification for the complex freeze-thaw requirements of MDOT due to Michigan’s harsh climate.
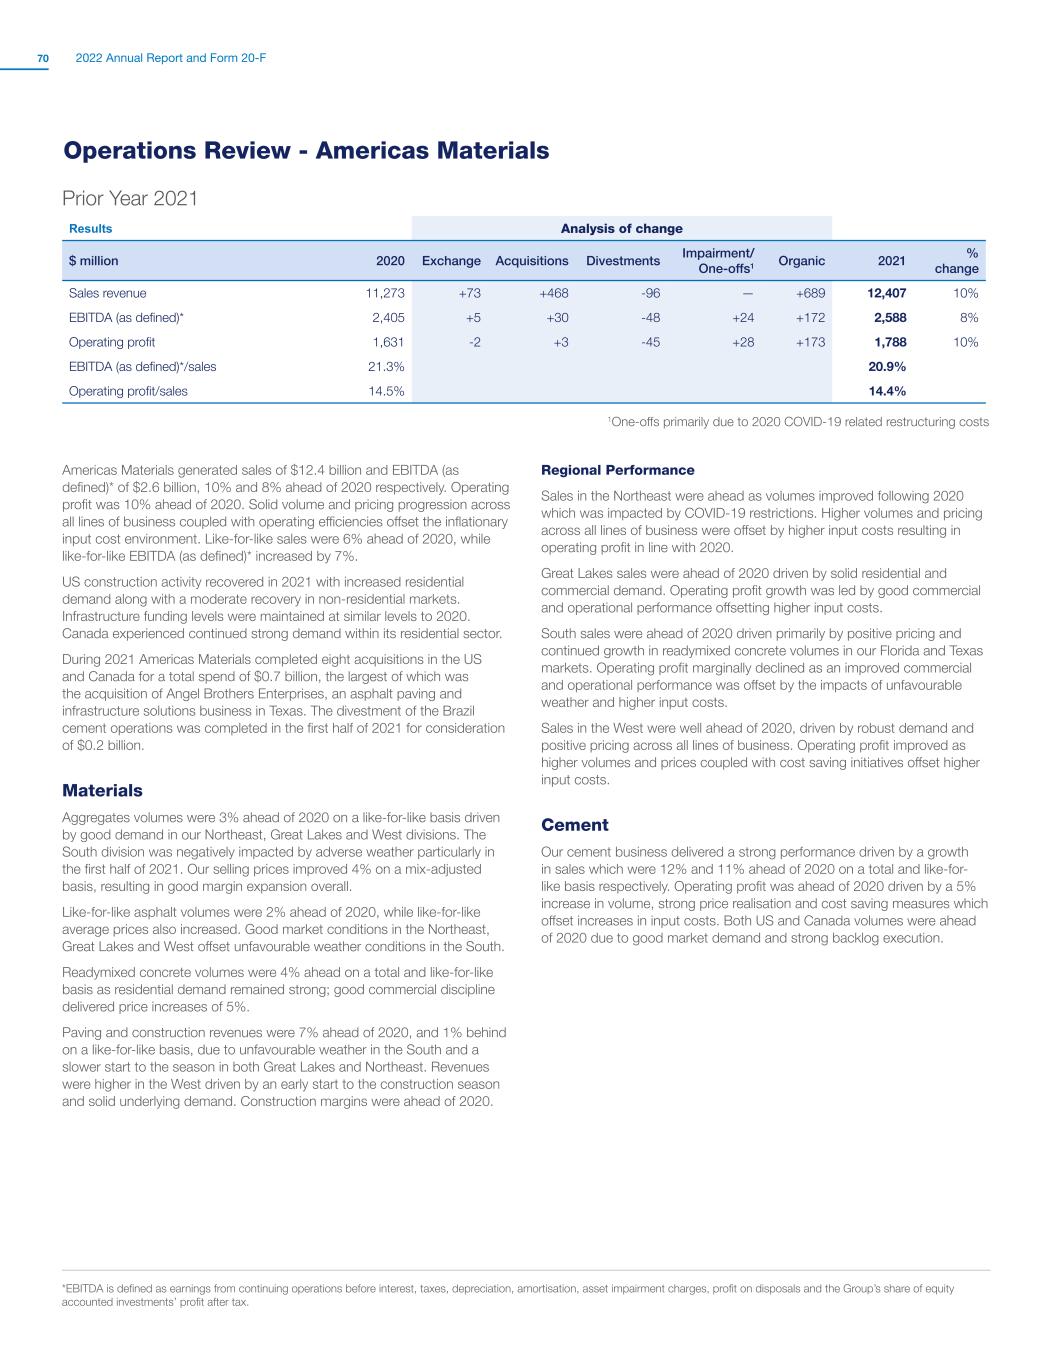
2022 Annual Report and Form 20-F70 2 *EBITDA is defined as earnings from continuing operations before interest, taxes, depreciation, amortisation, asset impairment charges, profit on disposals and the Group’s share of equity accounted investments’ profit after tax. Operations Review - Americas Materials2 Prior Year 2021 Results Analysis of change $ million 2020 Exchange Acquisitions Divestments Impairment/ One-offs1 Organic 2021 % change Sales revenue 11,273 +73 +468 -96 — +689 12,407 10% EBITDA (as defined)* 2,405 +5 +30 -48 +24 +172 2,588 8% Operating profit 1,631 -2 +3 -45 +28 +173 1,788 10% EBITDA (as defined)*/sales 21.3% 20.9% Operating profit/sales 14.5% 14.4% 1One-offs primarily due to 2020 COVID-19 related restructuring costs Americas Materials generated sales of $12.4 billion and EBITDA (as defined)* of $2.6 billion, 10% and 8% ahead of 2020 respectively. Operating profit was 10% ahead of 2020. Solid volume and pricing progression across all lines of business coupled with operating efficiencies offset the inflationary input cost environment. Like-for-like sales were 6% ahead of 2020, while like-for-like EBITDA (as defined)* increased by 7%. US construction activity recovered in 2021 with increased residential demand along with a moderate recovery in non-residential markets. Infrastructure funding levels were maintained at similar levels to 2020. Canada experienced continued strong demand within its residential sector. During 2021 Americas Materials completed eight acquisitions in the US and Canada for a total spend of $0.7 billion, the largest of which was the acquisition of Angel Brothers Enterprises, an asphalt paving and infrastructure solutions business in Texas. The divestment of the Brazil cement operations was completed in the first half of 2021 for consideration of $0.2 billion. Materials Aggregates volumes were 3% ahead of 2020 on a like-for-like basis driven by good demand in our Northeast, Great Lakes and West divisions. The South division was negatively impacted by adverse weather particularly in the first half of 2021. Our selling prices improved 4% on a mix-adjusted basis, resulting in good margin expansion overall. Like-for-like asphalt volumes were 2% ahead of 2020, while like-for-like average prices also increased. Good market conditions in the Northeast, Great Lakes and West offset unfavourable weather conditions in the South. Readymixed concrete volumes were 4% ahead on a total and like-for-like basis as residential demand remained strong; good commercial discipline delivered price increases of 5%. Paving and construction revenues were 7% ahead of 2020, and 1% behind on a like-for-like basis, due to unfavourable weather in the South and a slower start to the season in both Great Lakes and Northeast. Revenues were higher in the West driven by an early start to the construction season and solid underlying demand. Construction margins were ahead of 2020. Regional Performance Sales in the Northeast were ahead as volumes improved following 2020 which was impacted by COVID-19 restrictions. Higher volumes and pricing across all lines of business were offset by higher input costs resulting in operating profit in line with 2020. Great Lakes sales were ahead of 2020 driven by solid residential and commercial demand. Operating profit growth was led by good commercial and operational performance offsetting higher input costs. South sales were ahead of 2020 driven primarily by positive pricing and continued growth in readymixed concrete volumes in our Florida and Texas markets. Operating profit marginally declined as an improved commercial and operational performance was offset by the impacts of unfavourable weather and higher input costs. Sales in the West were well ahead of 2020, driven by robust demand and positive pricing across all lines of business. Operating profit improved as higher volumes and prices coupled with cost saving initiatives offset higher input costs. Cement Our cement business delivered a strong performance driven by a growth in sales which were 12% and 11% ahead of 2020 on a total and like-for- like basis respectively. Operating profit was ahead of 2020 driven by a 5% increase in volume, strong price realisation and cost saving measures which offset increases in input costs. Both US and Canada volumes were ahead of 2020 due to good market demand and strong backlog execution.

Overview Strategy Report Business Performance & Segmental Reviews Governance Financial Statements Supplemental 20-F and Other Disclosures Shareholder Information 3 *EBITDA is defined as earnings from continuing operations before interest, taxes, depreciation, amortisation, asset impairment charges, profit on disposals and the Group’s share of equity accounted investments’ profit after tax. Current Year 20223 Results Analysis of change $ million 2021 Exchange Acquisitions Divestments Organic 2022 % change Sales revenue 12,407 -41 +511 -60 +1,507 14,324 15% EBITDA (as defined)* 2,588 -4 +44 -13 +133 2,748 6% Operating profit 1,788 -2 -11 -11 +145 1,909 7% EBITDA (as defined)*/sales 20.9% 19.2% Operating profit/sales 14.4% 13.3% Americas Materials sales were 15% ahead driven primarily by solid price progression across all lines of business which was partly offset by lower volumes impacted by unfavourable weather. EBITDA (as defined)* of $2.7 billion and operating profit of $1.9 billion were 6% and 7% ahead of 2021 respectively, as positive pricing was impacted by higher input costs. Like- for-like sales and EBITDA (as defined)* were 12% and 5% ahead of 2021 respectively. Construction market growth remained positive in 2022, primarily driven by strong infrastructure activity, supported by increases in federal, state and local transportation funding. The non-residential market remained resilient, while parts of the new-build residential market faced challenges from rising interest rates and affordability constraints. Canada experienced solid growth in most provinces; however, rising interest rates and inflationary pressures negatively impacted the residential market. During 2022, Americas Materials completed ten solutions-focused acquisitions across the US with a total spend of $0.5 billion. The largest of these was the acquisition of Hinkle Contracting Company, a vertically integrated materials and road solutions business in Kentucky. Materials Aggregates volumes declined by 1% compared to 2021 as strong volumes in the South and Great Lakes divisions were offset by unfavourable weather which impacted activity in the Northeast and West divisions. Aggregates prices increased by 10%, driven by strong commercial management. Asphalt volumes were 3% ahead, driven by increases in the Great Lakes and South divisions, while volumes were lower in the Northeast and West divisions. Asphalt prices increased by 20% compared to prior year. Readymixed concrete volumes were 6% behind 2021 levels, impacted by less favourable weather conditions in the West and the Northeast. Strong commercial discipline delivered higher prices across all divisions, 14% ahead of 2021, which offset raw materials and energy cost inflation. Paving and construction revenues were 25% ahead of 2021 due to a strong order book and good project execution. Regional Performance Sales in the Northeast division were 10% ahead of 2021 as prices improved across all lines of business offsetting lower volumes due to less favourable weather. Operating profit increased, driven by improved pricing which offset lower volumes and higher input costs. Great Lakes sales were 20% ahead of 2021, led by improved pricing across all lines of business and solid construction demand. Growth in operating profit was achieved through strong commercial management and ongoing cost control, offsetting input cost inflation. South division sales were 26% ahead of 2021 with volumes ahead of prior year. Pricing was strong across all lines of business. Operating profit marginally declined as strong pricing was offset by increases in energy and bitumen costs. The West division delivered 10% sales growth, driven primarily by disciplined commercial management across all lines of business and strong construction revenues. Unfavourable weather and a late start to the season impacted volumes. Operating profit was slightly ahead of 2021 as lower volumes were offset by improved pricing. Cement Our cement division delivered sales growth of 8% driven primarily by price realisation of 12% which offset slightly lower volumes compared with 2021. Operating profit was ahead driven by strong price progression amid an inflationary cost environment.
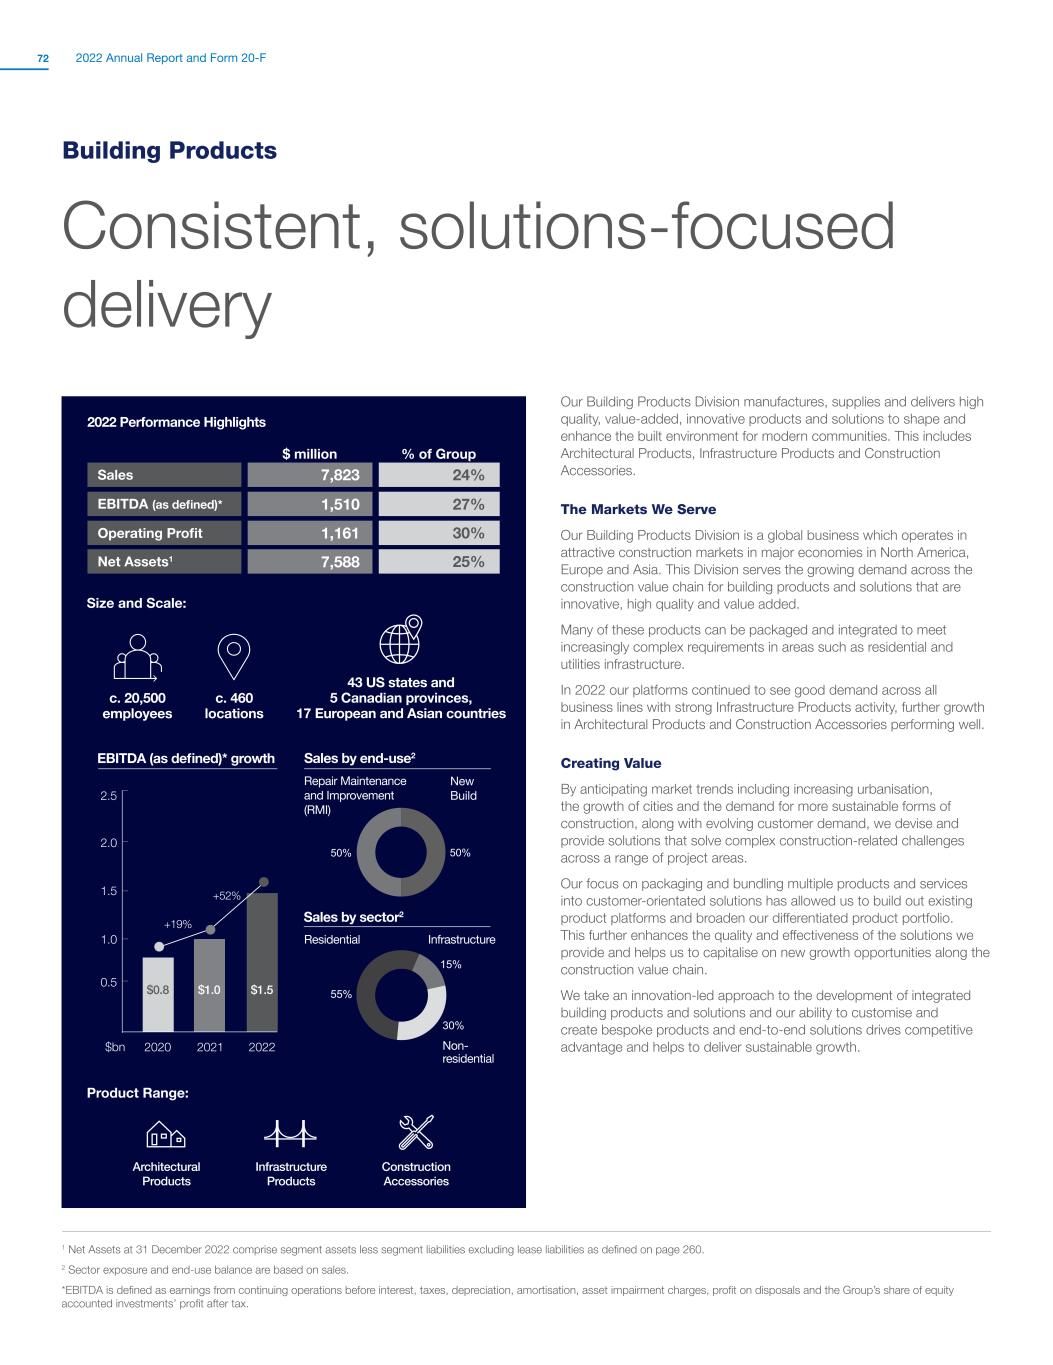
2022 Annual Report and Form 20-F72 Building Products Consistent, solutions-focused delivery1 Our Building Products Division manufactures, supplies and delivers high quality, value-added, innovative products and solutions to shape and enhance the built environment for modern communities. This includes Architectural Products, Infrastructure Products and Construction Accessories. The Markets We Serve Our Building Products Division is a global business which operates in attractive construction markets in major economies in North America, Europe and Asia. This Division serves the growing demand across the construction value chain for building products and solutions that are innovative, high quality and value added. Many of these products can be packaged and integrated to meet increasingly complex requirements in areas such as residential and utilities infrastructure. In 2022 our platforms continued to see good demand across all business lines with strong Infrastructure Products activity, further growth in Architectural Products and Construction Accessories performing well. Creating Value By anticipating market trends including increasing urbanisation, the growth of cities and the demand for more sustainable forms of construction, along with evolving customer demand, we devise and provide solutions that solve complex construction-related challenges across a range of project areas. Our focus on packaging and bundling multiple products and services into customer-orientated solutions has allowed us to build out existing product platforms and broaden our differentiated product portfolio. This further enhances the quality and effectiveness of the solutions we provide and helps us to capitalise on new growth opportunities along the construction value chain. We take an innovation-led approach to the development of integrated building products and solutions and our ability to customise and create bespoke products and end-to-end solutions drives competitive advantage and helps to deliver sustainable growth. 2022 Performance Highlights Size and Scale: % of Group$ million Sales 7,823 24% EBITDA (as defined)* 27%1,510 Operating Profit 30%1,161 25%Net Assets1 7,588 Sales by end-use2 New Build 50%50% Repair Maintenance and Improvement (RMI) c. 20,500 employees c. 460 locations 43 US states and 5 Canadian provinces, 17 European and Asian countries Product Range: Architectural Products Infrastructure Products Construction Accessories 15% 30% 55% Sales by sector2 Residential Non- residential Infrastructure EBITDA (as defined)* growth $bn 0.5 1.0 1.5 2.0 2.5 2020 2021 2022 $0.8 $1.0 $1.5 +19% +52% 1 Net Assets at 31 December 2022 comprise segment assets less segment liabilities excluding lease liabilities as defined on page 260. 2 Sector exposure and end-use balance are based on sales. *EBITDA is defined as earnings from continuing operations before interest, taxes, depreciation, amortisation, asset impairment charges, profit on disposals and the Group’s share of equity accounted investments’ profit after tax.
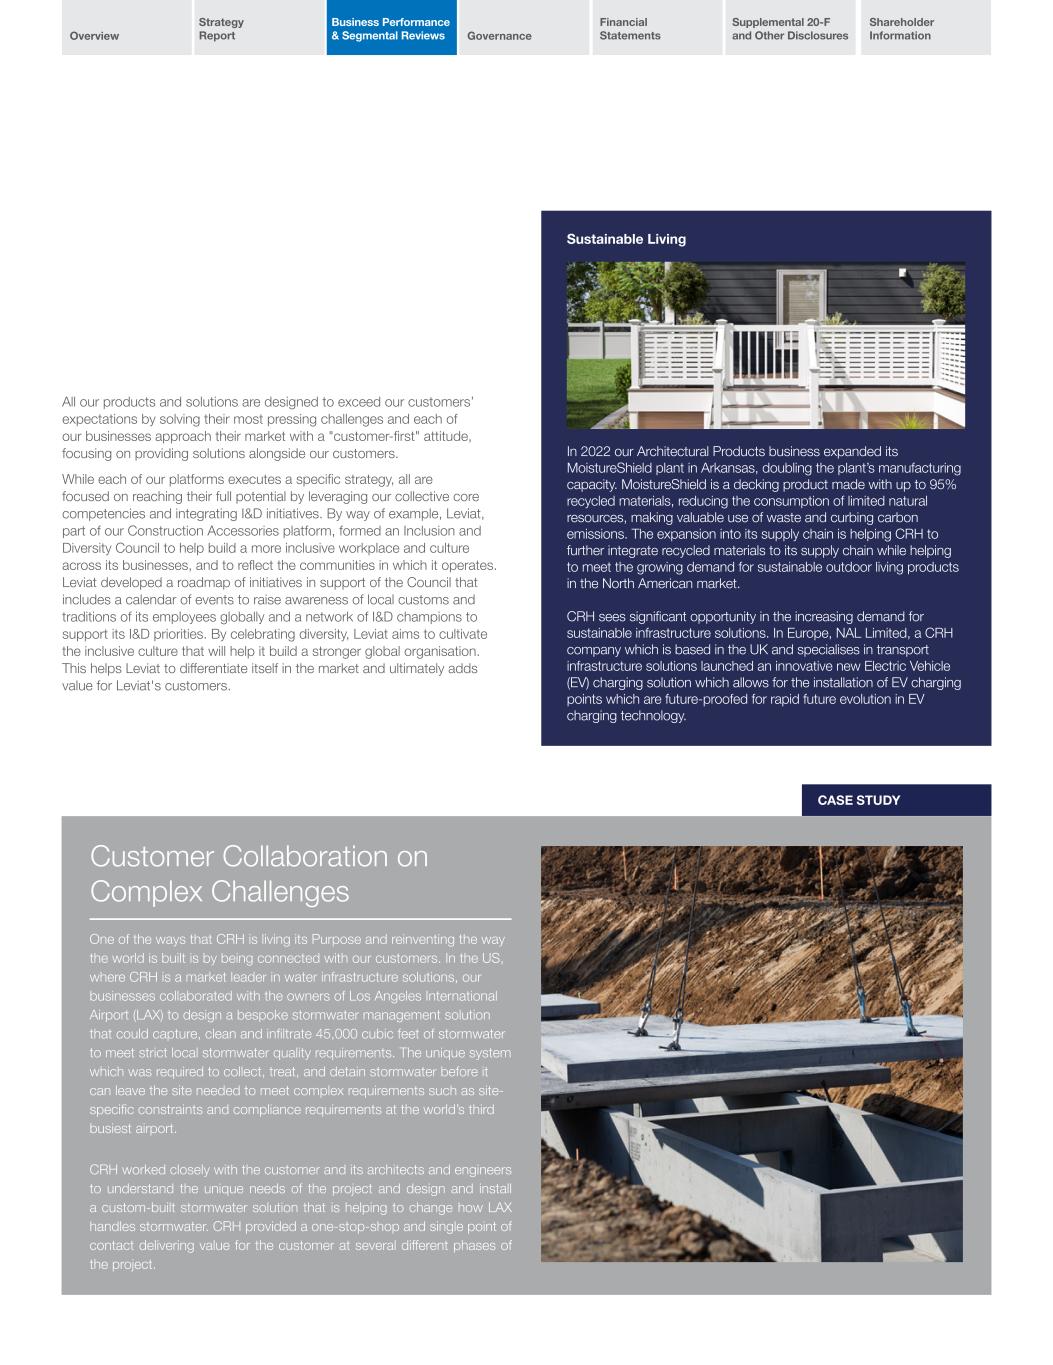
Overview Strategy Report Business Performance & Segmental Reviews Governance Financial Statements Supplemental 20-F and Other Disclosures Shareholder Information CASE STUDY All our products and solutions are designed to exceed our customers’ expectations by solving their most pressing challenges and each of our businesses approach their market with a "customer-first" attitude, focusing on providing solutions alongside our customers. While each of our platforms executes a specific strategy, all are focused on reaching their full potential by leveraging our collective core competencies and integrating I&D initiatives. By way of example, Leviat, part of our Construction Accessories platform, formed an Inclusion and Diversity Council to help build a more inclusive workplace and culture across its businesses, and to reflect the communities in which it operates. Leviat developed a roadmap of initiatives in support of the Council that includes a calendar of events to raise awareness of local customs and traditions of its employees globally and a network of I&D champions to support its I&D priorities. By celebrating diversity, Leviat aims to cultivate the inclusive culture that will help it build a stronger global organisation. This helps Leviat to differentiate itself in the market and ultimately adds value for Leviat's customers. Sustainable Living In 2022 our Architectural Products business expanded its MoistureShield plant in Arkansas, doubling the plant’s manufacturing capacity. MoistureShield is a decking product made with up to 95% recycled materials, reducing the consumption of limited natural resources, making valuable use of waste and curbing carbon emissions. The expansion into its supply chain is helping CRH to further integrate recycled materials to its supply chain while helping to meet the growing demand for sustainable outdoor living products in the North American market. CRH sees significant opportunity in the increasing demand for sustainable infrastructure solutions. In Europe, NAL Limited, a CRH company which is based in the UK and specialises in transport infrastructure solutions launched an innovative new Electric Vehicle (EV) charging solution which allows for the installation of EV charging points which are future-proofed for rapid future evolution in EV charging technology. Customer Collaboration on Complex Challenges One of the ways that CRH is living its Purpose and reinventing the way the world is built is by being connected with our customers. In the US, where CRH is a market leader in water infrastructure solutions, our businesses collaborated with the owners of Los Angeles International Airport (LAX) to design a bespoke stormwater management solution that could capture, clean and infiltrate 45,000 cubic feet of stormwater to meet strict local stormwater quality requirements. The unique system which was required to collect, treat, and detain stormwater before it can leave the site needed to meet complex requirements such as site- specific constraints and compliance requirements at the world’s third busiest airport. CRH worked closely with the customer and its architects and engineers to understand the unique needs of the project and design and install a custom-built stormwater solution that is helping to change how LAX handles stormwater. CRH provided a one-stop-shop and single point of contact delivering value for the customer at several different phases of the project.
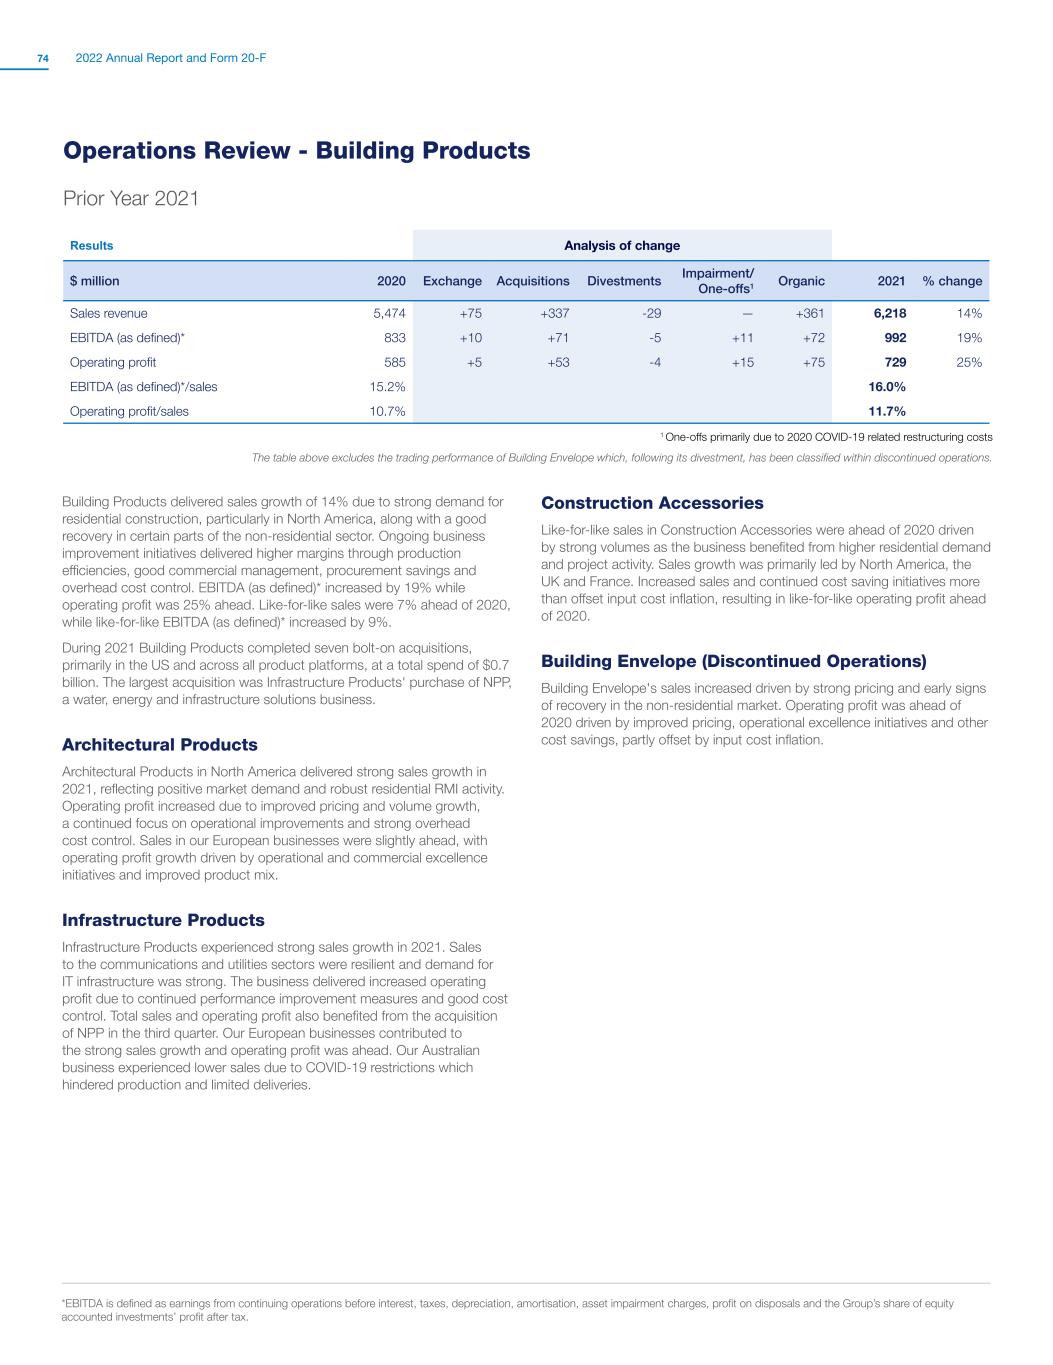
2022 Annual Report and Form 20-F74 Operations Review - Building Products Prior Year 20212 Results Analysis of change $ million 2020 Exchange Acquisitions Divestments Impairment/ One-offs1 Organic 2021 % change Sales revenue 5,474 +75 +337 -29 — +361 6,218 14% EBITDA (as defined)* 833 +10 +71 -5 +11 +72 992 19% Operating profit 585 +5 +53 -4 +15 +75 729 25% EBITDA (as defined)*/sales 15.2% 16.0% Operating profit/sales 10.7% 11.7% 1 One-offs primarily due to 2020 COVID-19 related restructuring costs The table above excludes the trading performance of Building Envelope which, following its divestment, has been classified within discontinued operations. Building Products delivered sales growth of 14% due to strong demand for residential construction, particularly in North America, along with a good recovery in certain parts of the non-residential sector. Ongoing business improvement initiatives delivered higher margins through production efficiencies, good commercial management, procurement savings and overhead cost control. EBITDA (as defined)* increased by 19% while operating profit was 25% ahead. Like-for-like sales were 7% ahead of 2020, while like-for-like EBITDA (as defined)* increased by 9%. During 2021 Building Products completed seven bolt-on acquisitions, primarily in the US and across all product platforms, at a total spend of $0.7 billion. The largest acquisition was Infrastructure Products' purchase of NPP, a water, energy and infrastructure solutions business. Architectural Products Architectural Products in North America delivered strong sales growth in 2021, reflecting positive market demand and robust residential RMI activity. Operating profit increased due to improved pricing and volume growth, a continued focus on operational improvements and strong overhead cost control. Sales in our European businesses were slightly ahead, with operating profit growth driven by operational and commercial excellence initiatives and improved product mix. Infrastructure Products Infrastructure Products experienced strong sales growth in 2021. Sales to the communications and utilities sectors were resilient and demand for IT infrastructure was strong. The business delivered increased operating profit due to continued performance improvement measures and good cost control. Total sales and operating profit also benefited from the acquisition of NPP in the third quarter. Our European businesses contributed to the strong sales growth and operating profit was ahead. Our Australian business experienced lower sales due to COVID-19 restrictions which hindered production and limited deliveries. Construction Accessories Like-for-like sales in Construction Accessories were ahead of 2020 driven by strong volumes as the business benefited from higher residential demand and project activity. Sales growth was primarily led by North America, the UK and France. Increased sales and continued cost saving initiatives more than offset input cost inflation, resulting in like-for-like operating profit ahead of 2020. Building Envelope (Discontinued Operations) Building Envelope's sales increased driven by strong pricing and early signs of recovery in the non-residential market. Operating profit was ahead of 2020 driven by improved pricing, operational excellence initiatives and other cost savings, partly offset by input cost inflation. 2 *EBITDA is defined as earnings from continuing operations before interest, taxes, depreciation, amortisation, asset impairment charges, profit on disposals and the Group’s share of equity accounted investments’ profit after tax.
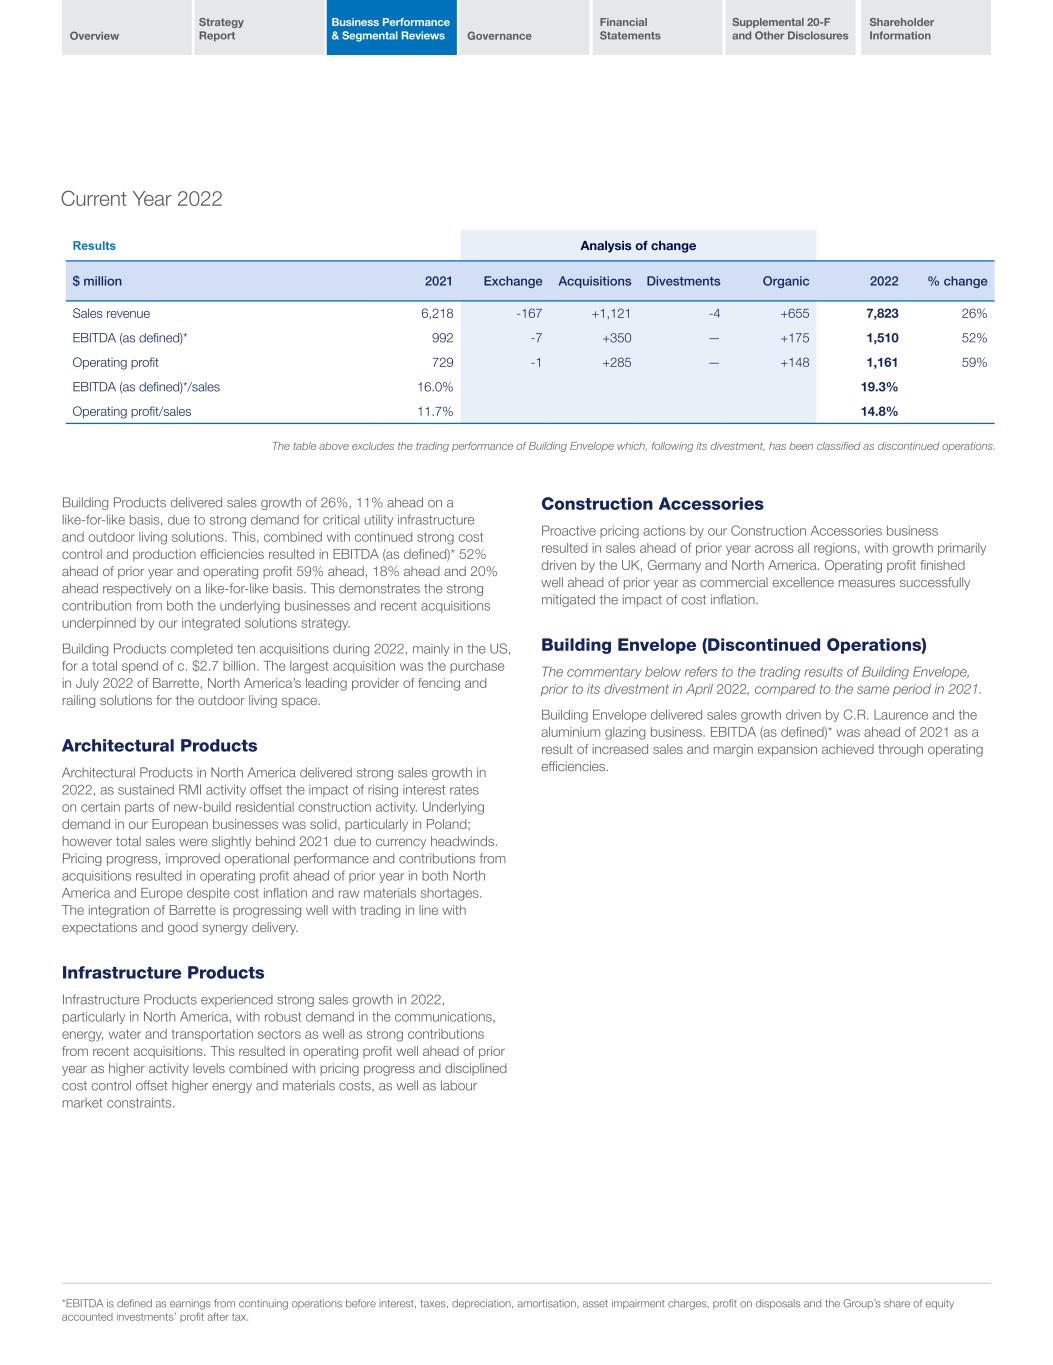
Overview Strategy Report Business Performance & Segmental Reviews Governance Financial Statements Supplemental 20-F and Other Disclosures Shareholder Information Current Year 20223 Results Analysis of change $ million 2021 Exchange Acquisitions Divestments Organic 2022 % change Sales revenue 6,218 -167 +1,121 -4 +655 7,823 26% EBITDA (as defined)* 992 -7 +350 — +175 1,510 52% Operating profit 729 -1 +285 — +148 1,161 59% EBITDA (as defined)*/sales 16.0% 19.3% Operating profit/sales 11.7% 14.8% Building Products delivered sales growth of 26%, 11% ahead on a like-for-like basis, due to strong demand for critical utility infrastructure and outdoor living solutions. This, combined with continued strong cost control and production efficiencies resulted in EBITDA (as defined)* 52% ahead of prior year and operating profit 59% ahead, 18% ahead and 20% ahead respectively on a like-for-like basis. This demonstrates the strong contribution from both the underlying businesses and recent acquisitions underpinned by our integrated solutions strategy. Building Products completed ten acquisitions during 2022, mainly in the US, for a total spend of c. $2.7 billion. The largest acquisition was the purchase in July 2022 of Barrette, North America’s leading provider of fencing and railing solutions for the outdoor living space. Architectural Products Architectural Products in North America delivered strong sales growth in 2022, as sustained RMI activity offset the impact of rising interest rates on certain parts of new-build residential construction activity. Underlying demand in our European businesses was solid, particularly in Poland; however total sales were slightly behind 2021 due to currency headwinds. Pricing progress, improved operational performance and contributions from acquisitions resulted in operating profit ahead of prior year in both North America and Europe despite cost inflation and raw materials shortages. The integration of Barrette is progressing well with trading in line with expectations and good synergy delivery. Infrastructure Products Infrastructure Products experienced strong sales growth in 2022, particularly in North America, with robust demand in the communications, energy, water and transportation sectors as well as strong contributions from recent acquisitions. This resulted in operating profit well ahead of prior year as higher activity levels combined with pricing progress and disciplined cost control offset higher energy and materials costs, as well as labour market constraints. Construction Accessories Proactive pricing actions by our Construction Accessories business resulted in sales ahead of prior year across all regions, with growth primarily driven by the UK, Germany and North America. Operating profit finished well ahead of prior year as commercial excellence measures successfully mitigated the impact of cost inflation. Building Envelope (Discontinued Operations) The commentary below refers to the trading results of Building Envelope, prior to its divestment in April 2022, compared to the same period in 2021. Building Envelope delivered sales growth driven by C.R. Laurence and the aluminium glazing business. EBITDA (as defined)* was ahead of 2021 as a result of increased sales and margin expansion achieved through operating efficiencies. The table above excludes the trading performance of Building Envelope which, following its divestment, has been classified as discontinued operations. 3 *EBITDA is defined as earnings from continuing operations before interest, taxes, depreciation, amortisation, asset impairment charges, profit on disposals and the Group’s share of equity accounted investments’ profit after tax.
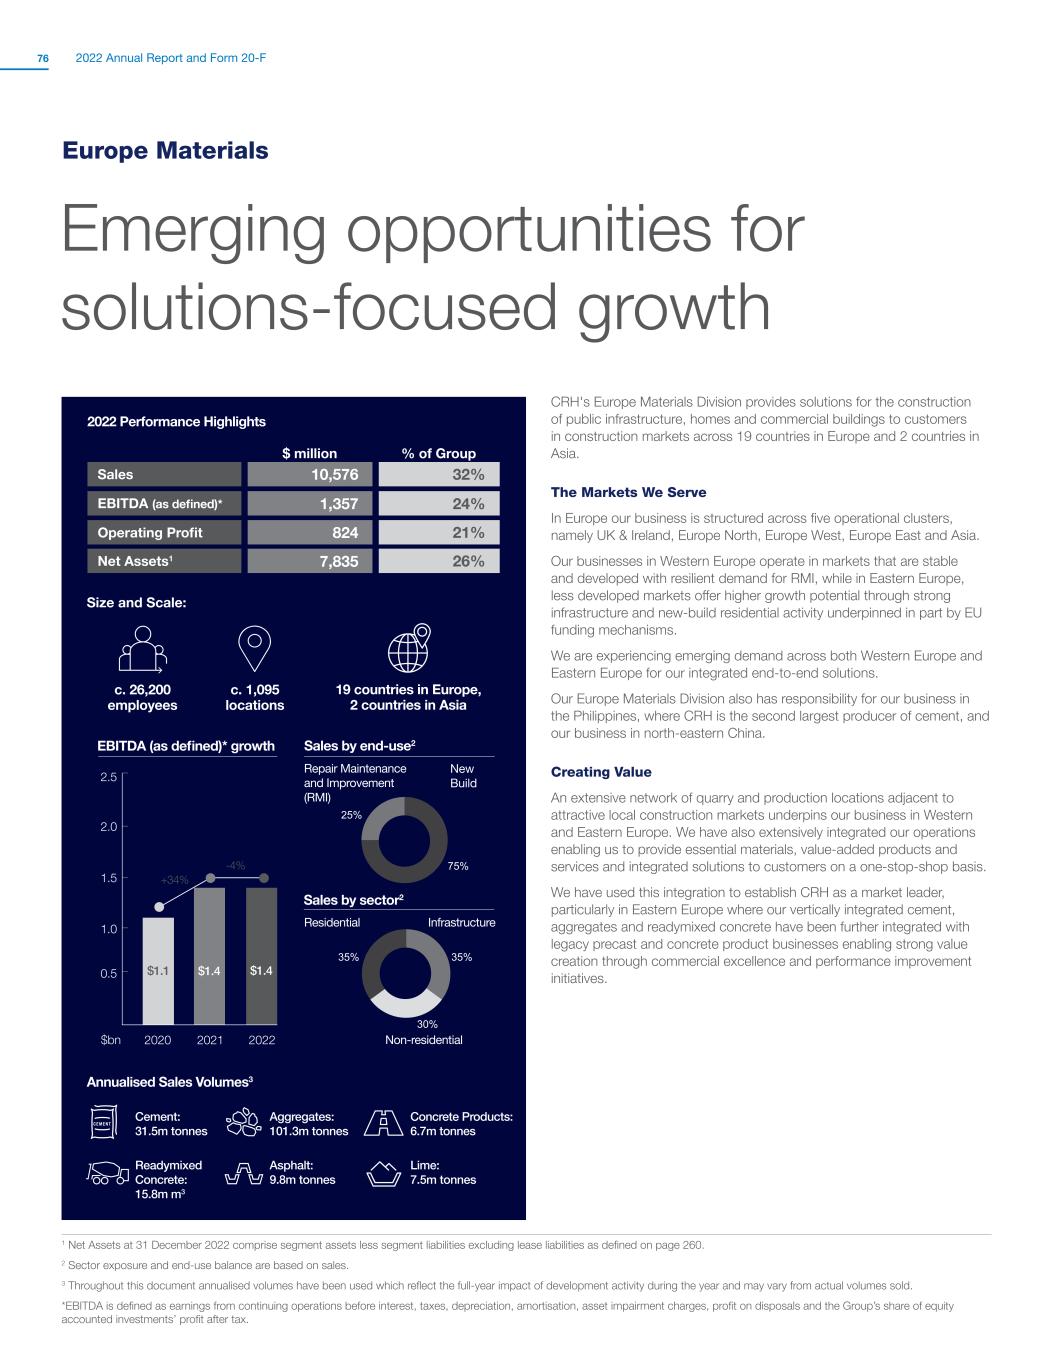
2022 Annual Report and Form 20-F76 Europe Materials Emerging opportunities for solutions-focused growth1 CRH's Europe Materials Division provides solutions for the construction of public infrastructure, homes and commercial buildings to customers in construction markets across 19 countries in Europe and 2 countries in Asia. The Markets We Serve In Europe our business is structured across five operational clusters, namely UK & Ireland, Europe North, Europe West, Europe East and Asia. Our businesses in Western Europe operate in markets that are stable and developed with resilient demand for RMI, while in Eastern Europe, less developed markets offer higher growth potential through strong infrastructure and new-build residential activity underpinned in part by EU funding mechanisms. We are experiencing emerging demand across both Western Europe and Eastern Europe for our integrated end-to-end solutions. Our Europe Materials Division also has responsibility for our business in the Philippines, where CRH is the second largest producer of cement, and our business in north-eastern China. Creating Value An extensive network of quarry and production locations adjacent to attractive local construction markets underpins our business in Western and Eastern Europe. We have also extensively integrated our operations enabling us to provide essential materials, value-added products and services and integrated solutions to customers on a one-stop-shop basis. We have used this integration to establish CRH as a market leader, particularly in Eastern Europe where our vertically integrated cement, aggregates and readymixed concrete have been further integrated with legacy precast and concrete product businesses enabling strong value creation through commercial excellence and performance improvement initiatives. 2022 Performance Highlights Size and Scale: % of Group$ million Sales 10,576 32% EBITDA (as defined)* 24%1,357 Operating Profit 21%824 26%Net Assets1 7,835 Sales by end-use2 New Build 75% 25% Repair Maintenance and Improvement (RMI) c. 26,200 employees c. 1,095 locations 19 countries in Europe, 2 countries in Asia Annualised Sales Volumes3 Aggregates: 101.3m tonnes Cement: 31.5m tonnes Readymixed Concrete: 15.8m m3 Concrete Products: 6.7m tonnes Lime: 7.5m tonnes Asphalt: 9.8m tonnes 35% 30% 35% Sales by sector2 Residential Non-residential Infrastructure EBITDA (as defined)* growth $bn 0.5 1.0 1.5 2.0 2.5 2020 2021 2022 $1.1 $1.4 $1.4 +34% -4% 1 Net Assets at 31 December 2022 comprise segment assets less segment liabilities excluding lease liabilities as defined on page 260. 2 Sector exposure and end-use balance are based on sales. 3 Throughout this document annualised volumes have been used which reflect the full-year impact of development activity during the year and may vary from actual volumes sold. *EBITDA is defined as earnings from continuing operations before interest, taxes, depreciation, amortisation, asset impairment charges, profit on disposals and the Group’s share of equity accounted investments’ profit after tax.
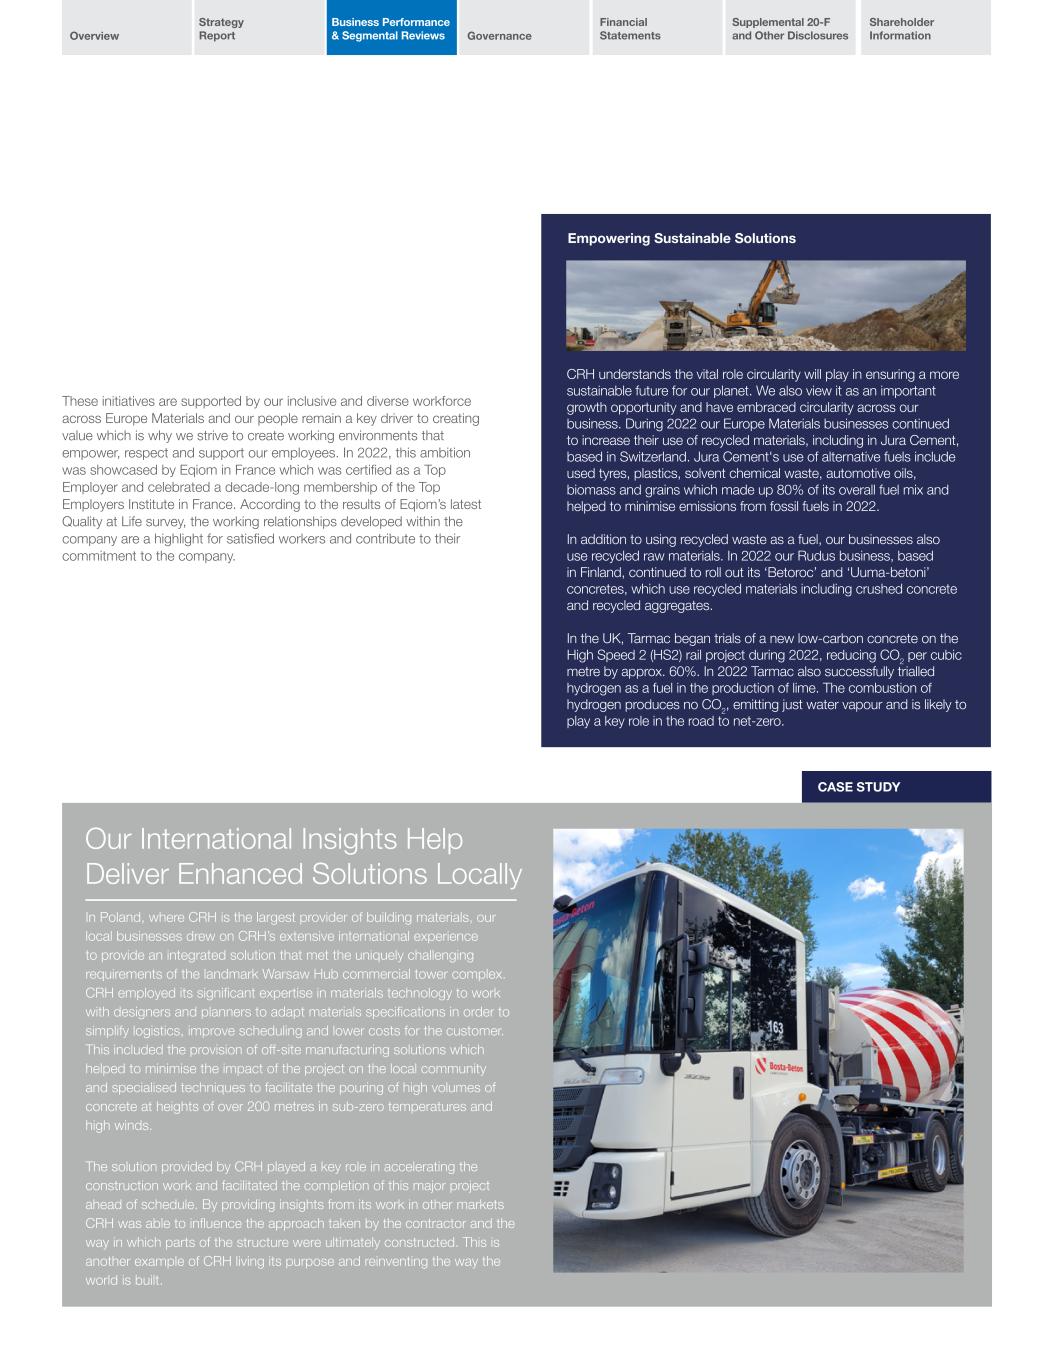
Overview Strategy Report Business Performance & Segmental Reviews Governance Financial Statements Supplemental 20-F and Other Disclosures Shareholder Information CASE STUDY These initiatives are supported by our inclusive and diverse workforce across Europe Materials and our people remain a key driver to creating value which is why we strive to create working environments that empower, respect and support our employees. In 2022, this ambition was showcased by Eqiom in France which was certified as a Top Employer and celebrated a decade-long membership of the Top Employers Institute in France. According to the results of Eqiom’s latest Quality at Life survey, the working relationships developed within the company are a highlight for satisfied workers and contribute to their commitment to the company. CRH understands the vital role circularity will play in ensuring a more sustainable future for our planet. We also view it as an important growth opportunity and have embraced circularity across our business. During 2022 our Europe Materials businesses continued to increase their use of recycled materials, including in Jura Cement, based in Switzerland. Jura Cement's use of alternative fuels include used tyres, plastics, solvent chemical waste, automotive oils, biomass and grains which made up 80% of its overall fuel mix and helped to minimise emissions from fossil fuels in 2022. In addition to using recycled waste as a fuel, our businesses also use recycled raw materials. In 2022 our Rudus business, based in Finland, continued to roll out its ‘Betoroc’ and ‘Uuma-betoni’ concretes, which use recycled materials including crushed concrete and recycled aggregates. In the UK, Tarmac began trials of a new low-carbon concrete on the High Speed 2 (HS2) rail project during 2022, reducing CO2 per cubic metre by approx. 60%. In 2022 Tarmac also successfully trialled hydrogen as a fuel in the production of lime. The combustion of hydrogen produces no CO2, emitting just water vapour and is likely to play a key role in the road to net-zero. Our International Insights Help Deliver Enhanced Solutions Locally In Poland, where CRH is the largest provider of building materials, our local businesses drew on CRH’s extensive international experience to provide an integrated solution that met the uniquely challenging requirements of the landmark Warsaw Hub commercial tower complex. CRH employed its significant expertise in materials technology to work with designers and planners to adapt materials specifications in order to simplify logistics, improve scheduling and lower costs for the customer. This included the provision of off-site manufacturing solutions which helped to minimise the impact of the project on the local community and specialised techniques to facilitate the pouring of high volumes of concrete at heights of over 200 metres in sub-zero temperatures and high winds. The solution provided by CRH played a key role in accelerating the construction work and facilitated the completion of this major project ahead of schedule. By providing insights from its work in other markets CRH was able to influence the approach taken by the contractor and the way in which parts of the structure were ultimately constructed. This is another example of CRH living its purpose and reinventing the way the world is built. Empowering Sustainable Solutions

2022 Annual Report and Form 20-F78 2 *EBITDA is defined as earnings from continuing operations before interest, taxes, depreciation, amortisation, asset impairment charges, profit on disposals and the Group’s share of equity accounted investments’ profit after tax. 3 Operations Review - Europe Materials Prior Year 20212 Results Analysis of change $ million 2020 Exchange Acquisitions Divestments Impairment1/ One-offs2 Organic 2021 % change Sales revenue 9,141 +403 +8 -57 — +1,086 10,581 16% EBITDA (as defined)* 1,055 +34 — -5 +83 +243 1,410 34% Operating (loss)/profit -190 +7 — -2 +748 +251 814 528% EBITDA (as defined)*/sales 11.5% 13.3% Operating (loss)/profit/sales (2.1)% 7.7% 1 Includes $0.7 billion 2020 impairment charge 2 One-offs primarily due to 2020 COVID-19 related restructuring costs Europe Materials benefited from continued growth in Eastern Europe and strong market recovery following the easing of COVID-19 restrictions in many of our key markets. Europe Materials generated sales of $10.6 billion and EBITDA (as defined)* of $1.4 billion, 16% and 34% ahead of 2020 respectively with an operating profit of $0.8 billion. Like-for-like sales were 11% ahead of 2020, while EBITDA (as defined)* increased by 22%. Energy market volatility resulted in increased cost inflation but positive pricing actions and a continued focus on cost savings and performance initiatives delivered margin expansion. UK & Ireland UK & Ireland sales were well ahead of 2020 reflecting an improved trading environment following significant COVID-19 disruption in 2020. Operating profit was also significantly ahead due to improved volumes across all product lines but also assisted by cost saving and restructuring initiatives which commenced in 2020. Significant pricing actions were undertaken in the second half of the year to offset input cost inflation, which also contributed to the strong 2021 performance. Europe North Despite prolonged winter weather, demand in Europe North (Finland, Germany and Switzerland) improved as the year progressed. Cement and lime volumes were ahead of 2020 which, combined with strong price increases, resulted in increased sales. Europe North experienced significant energy cost inflation, particularly in the second half, but additional pricing actions and a continued focus on cost saving initiatives resulted in operating profit well ahead of 2020 levels. Europe West Europe West (France, Benelux, Denmark and Spain) delivered a good trading performance with higher cement volumes combined with continued pricing progress across all markets. France in particular experienced a strong recovery as a result of improved underlying trading conditions which, together with significant cost saving actions implemented in 2020, have resulted in like-for-like operating profit well ahead of 2020. Our precast operations also delivered sales and operating profit ahead of 2020 despite experiencing significant raw material and energy cost inflation. Overall, continued cost saving actions and commercial initiatives resulted in operating profit well ahead of 2020. Europe East Europe East (Poland, Ukraine, Romania, Hungary, Slovakia, and Serbia) experienced mild weather in the fourth quarter and robust demand throughout the year, which resulted in cement volumes ahead of 2020 and continued growth in downstream products. Operating profit in Poland was significantly ahead of 2020 due to good volume and price increases combined with strong cost control. Despite rising energy cost inflation in the second half of the year, overall operating profit was well ahead of 2020 with good cost control and strong price increases across all markets. Asia Sales and operating profit in the Philippines were significantly ahead of 2020, which was severely impacted by COVID-19 restrictions. Cement volumes were well ahead in 2021 as the market recovered. Despite a competitive pricing environment and rising input costs, operational improvements and cost containment initiatives resulted in operating profit ahead of 2020. CRH's operations include a 26% stake in Yatai Building Materials in China, where strong price increases offset lower volumes to deliver significantly improved operating profit in 2021.
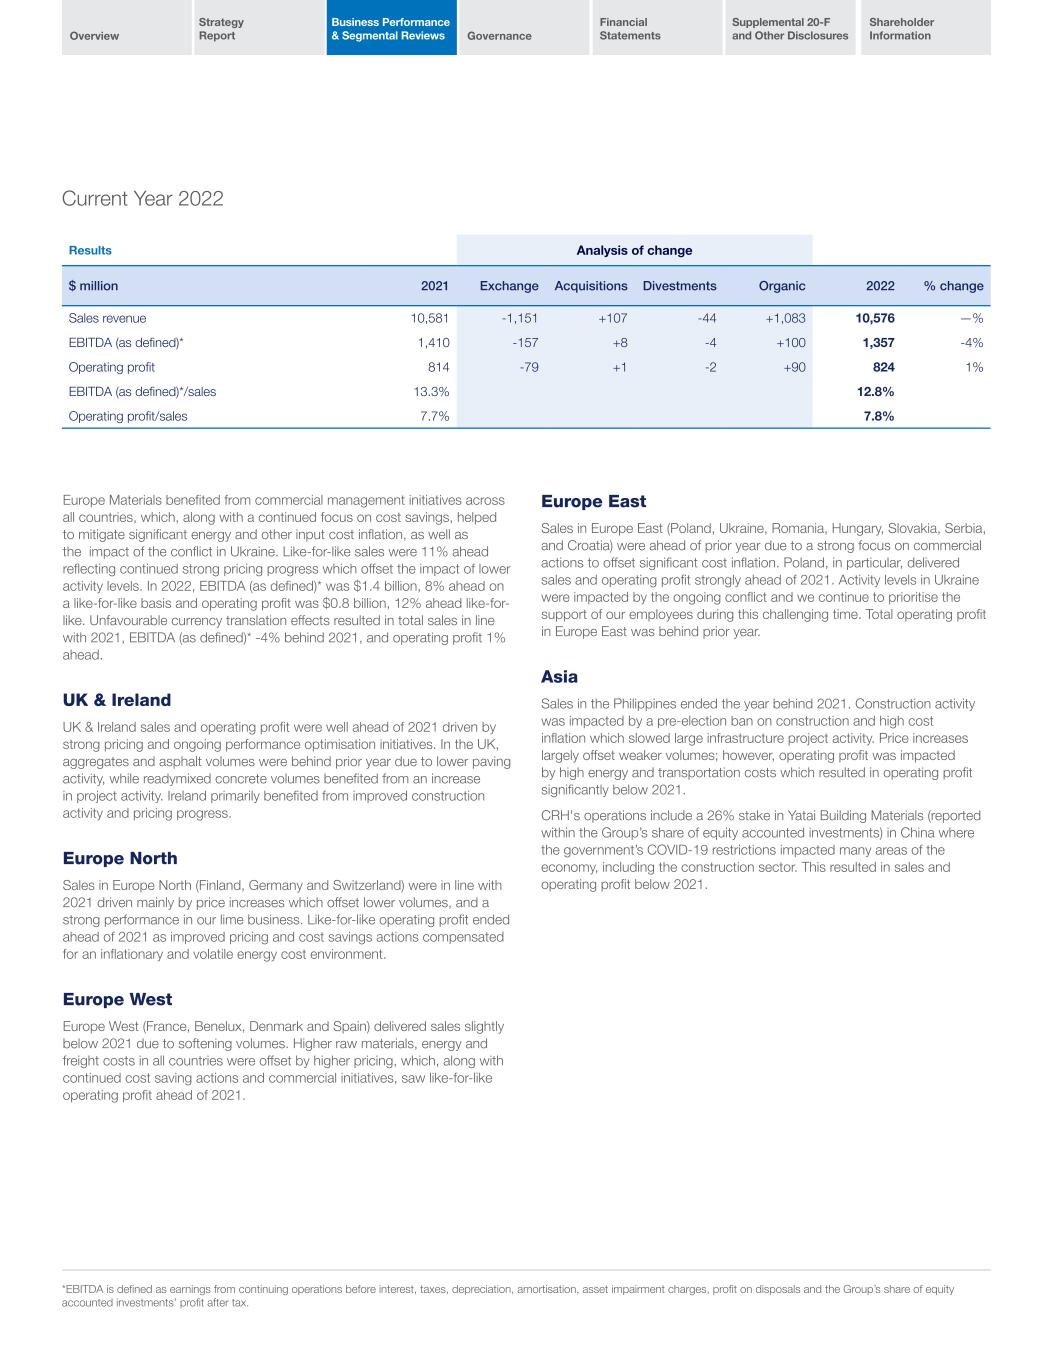
Overview Strategy Report Business Performance & Segmental Reviews Governance Financial Statements Supplemental 20-F and Other Disclosures Shareholder Information Results Analysis of change $ million 2021 Exchange Acquisitions Divestments Organic 2022 % change Sales revenue 10,581 -1,151 +107 -44 +1,083 10,576 —% EBITDA (as defined)* 1,410 -157 +8 -4 +100 1,357 -4% Operating profit 814 -79 +1 -2 +90 824 1% EBITDA (as defined)*/sales 13.3% 12.8% Operating profit/sales 7.7% 7.8% Europe Materials benefited from commercial management initiatives across all countries, which, along with a continued focus on cost savings, helped to mitigate significant energy and other input cost inflation, as well as the impact of the conflict in Ukraine. Like-for-like sales were 11% ahead reflecting continued strong pricing progress which offset the impact of lower activity levels. In 2022, EBITDA (as defined)* was $1.4 billion, 8% ahead on a like-for-like basis and operating profit was $0.8 billion, 12% ahead like-for- like. Unfavourable currency translation effects resulted in total sales in line with 2021, EBITDA (as defined)* -4% behind 2021, and operating profit 1% ahead. UK & Ireland UK & Ireland sales and operating profit were well ahead of 2021 driven by strong pricing and ongoing performance optimisation initiatives. In the UK, aggregates and asphalt volumes were behind prior year due to lower paving activity, while readymixed concrete volumes benefited from an increase in project activity. Ireland primarily benefited from improved construction activity and pricing progress. Europe North Sales in Europe North (Finland, Germany and Switzerland) were in line with 2021 driven mainly by price increases which offset lower volumes, and a strong performance in our lime business. Like-for-like operating profit ended ahead of 2021 as improved pricing and cost savings actions compensated for an inflationary and volatile energy cost environment. Europe West Europe West (France, Benelux, Denmark and Spain) delivered sales slightly below 2021 due to softening volumes. Higher raw materials, energy and freight costs in all countries were offset by higher pricing, which, along with continued cost saving actions and commercial initiatives, saw like-for-like operating profit ahead of 2021. Current Year 20223 Europe East Sales in Europe East (Poland, Ukraine, Romania, Hungary, Slovakia, Serbia, and Croatia) were ahead of prior year due to a strong focus on commercial actions to offset significant cost inflation. Poland, in particular, delivered sales and operating profit strongly ahead of 2021. Activity levels in Ukraine were impacted by the ongoing conflict and we continue to prioritise the support of our employees during this challenging time. Total operating profit in Europe East was behind prior year. Asia Sales in the Philippines ended the year behind 2021. Construction activity was impacted by a pre-election ban on construction and high cost inflation which slowed large infrastructure project activity. Price increases largely offset weaker volumes; however, operating profit was impacted by high energy and transportation costs which resulted in operating profit significantly below 2021. CRH's operations include a 26% stake in Yatai Building Materials (reported within the Group’s share of equity accounted investments) in China where the government’s COVID-19 restrictions impacted many areas of the economy, including the construction sector. This resulted in sales and operating profit below 2021. *EBITDA is defined as earnings from continuing operations before interest, taxes, depreciation, amortisation, asset impairment charges, profit on disposals and the Group’s share of equity accounted investments’ profit after tax.
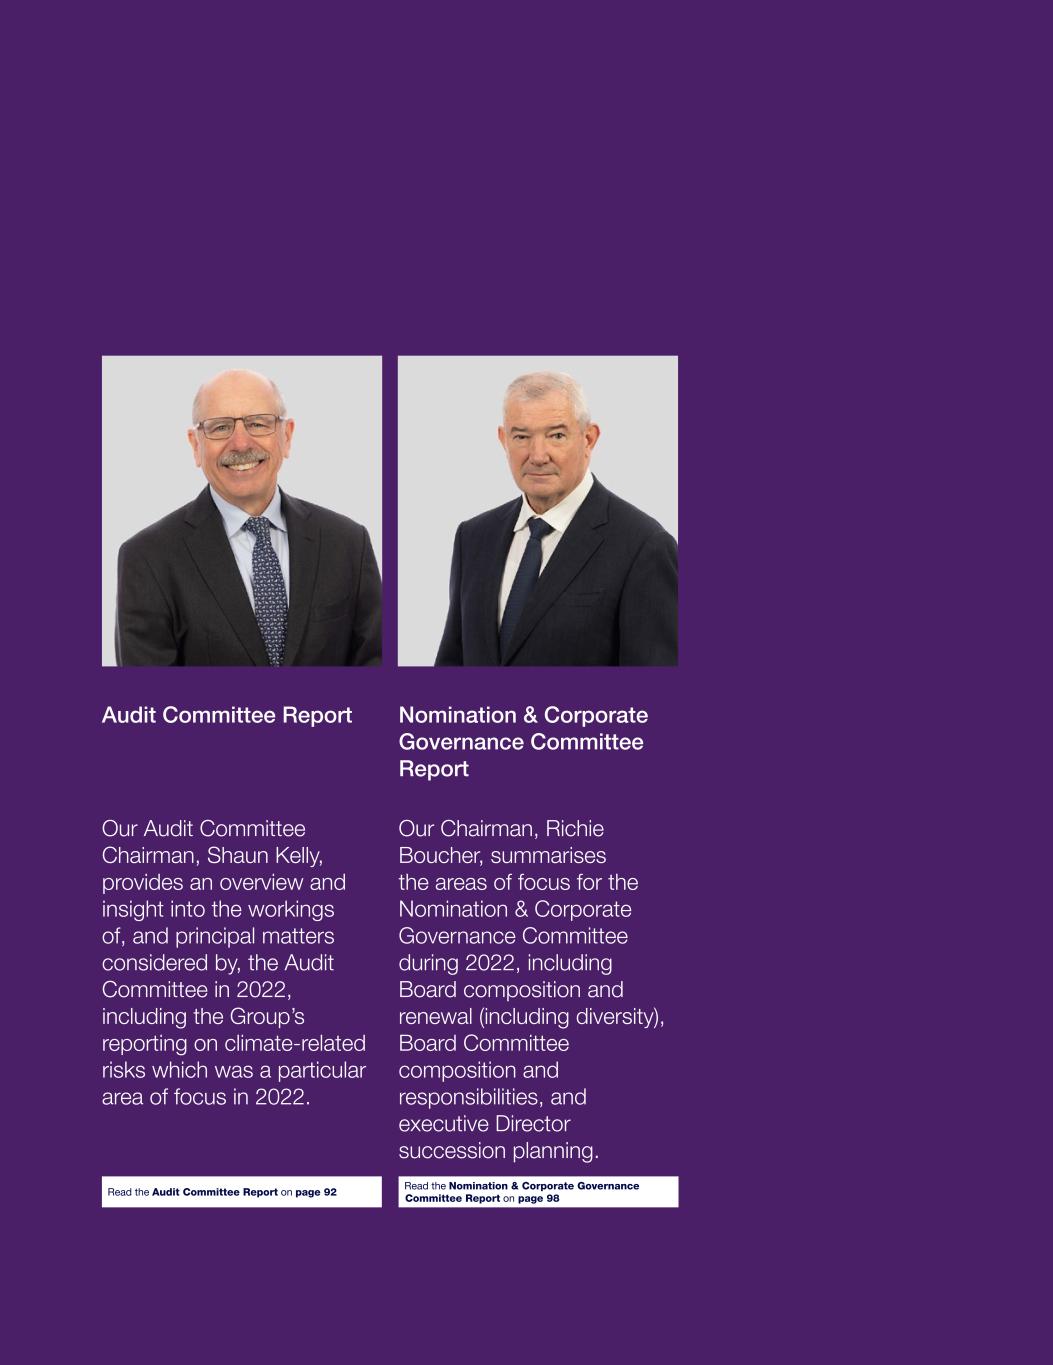
80 Audit Committee Report Nomination & Corporate Governance Committee Report Our Audit Committee Chairman, Shaun Kelly, provides an overview and insight into the workings of, and principal matters considered by, the Audit Committee in 2022, including the Group’s reporting on climate-related risks which was a particular area of focus in 2022. Our Chairman, Richie Boucher, summarises the areas of focus for the Nomination & Corporate Governance Committee during 2022, including Board composition and renewal (including diversity), Board Committee composition and responsibilities, and executive Director succession planning. Read the Audit Committee Report on page 92 Read the Nomination & Corporate Governance Committee Report on page 98
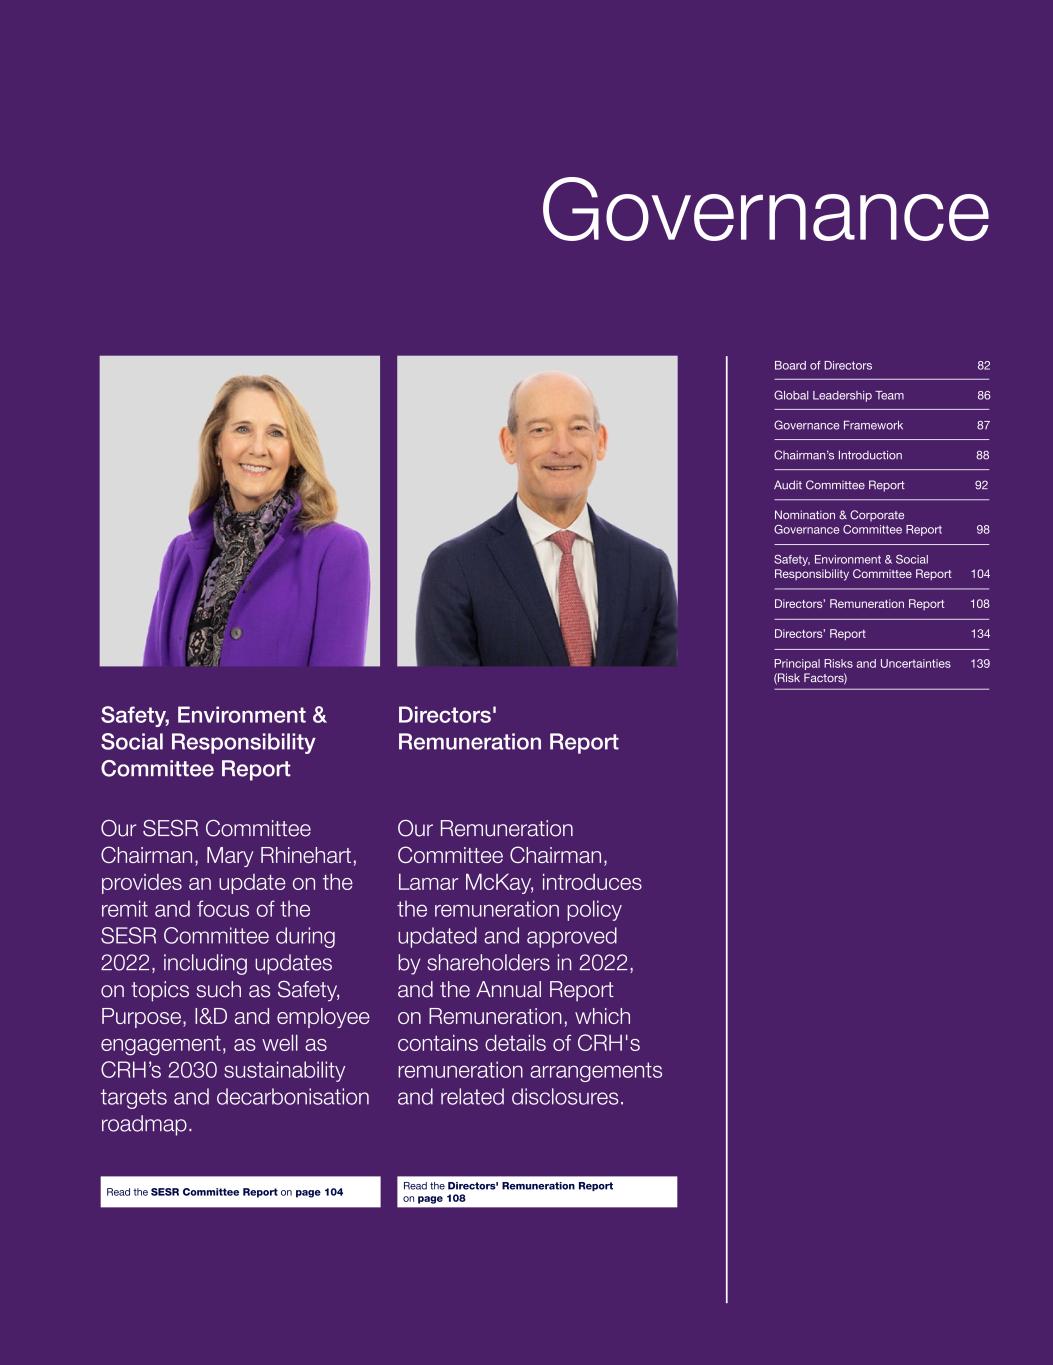
Governance Board of Directors 82 Global Leadership Team 86 Governance Framework 87 Chairman’s Introduction 88 Audit Committee Report 92 Nomination & Corporate Governance Committee Report 98 Safety, Environment & Social Responsibility Committee Report 104 Directors’ Remuneration Report 108 Directors’ Report 134 Principal Risks and Uncertainties (Risk Factors) 139 Safety, Environment & Social Responsibility Committee Report Directors' Remuneration Report Our SESR Committee Chairman, Mary Rhinehart, provides an update on the remit and focus of the SESR Committee during 2022, including updates on topics such as Safety, Purpose, I&D and employee engagement, as well as CRH’s 2030 sustainability targets and decarbonisation roadmap. Our Remuneration Committee Chairman, Lamar McKay, introduces the remuneration policy updated and approved by shareholders in 2022, and the Annual Report on Remuneration, which contains details of CRH's remuneration arrangements and related disclosures. Read the SESR Committee Report on page 104 Read the Directors' Remuneration Report on page 108

Overview Strategy Report Business Performance & Segmental Reviews Governance Financial Statements Supplemental 20-F and Other Disclosures Shareholder Information 2022 Annual Report and Form 20-F82 Board of Directors Richie Boucher Chairman Appointed to the Board: March 2018 Nationality: Irish Age: 64 Skills and experience: Richie has extensive experience in all aspects of financial services and was Chief Executive of Bank of Ireland Group plc between February 2009 and October 2017. He also held a number of key senior management roles within Bank of Ireland, Royal Bank of Scotland and Ulster Bank. He is a past President of the Institute of Banking in Ireland and of the Irish Banking Federation. Qualifications: Bachelor of Arts (Economics) from Trinity College, Dublin; Fellow of the Institute of Banking in Ireland. External appointments: Listed: Director of Kennedy-Wilson Holdings, Inc., a global real estate investment company. Non-listed: Non-executive Director of Clonbio Group Limited, which manufactures sustainable bio products and produces renewable energy. Committee membership: ADF (Chair); NCG (Chair); REM; and SESR Board Committees Acquisitions, Divestments and Finance Committee ADF Audit Committee AUDIT Nomination & Corporate Governance Committee NCG Remuneration Committee REM Safety, Environment & Social Responsibility Committee SESR Albert Manifold Chief Executive Appointed to the Board: January 2009 Nationality: Irish Age: 60 Skills and experience: Albert joined CRH in 1998. Prior to joining CRH, he was Chief Operating Officer with a private equity group. While at CRH he has held a variety of senior positions, including Finance Director of the Europe Materials Division, Group Development Director and Managing Director of Europe Materials. He became Chief Operating Officer in January 2009 and was appointed Group Chief Executive with effect from 1 January 2014. Qualifications: FCPA, MBA, MBS. External appointments: Listed: Non-executive Director of LyondellBasell Industries N.V., one of the largest plastics, chemicals and refining companies in the world. Non-listed: Not applicable. Committee membership: ADF and SESR Jim Mintern Chief Financial Officer Appointed to the Board: June 2021 Nationality: Irish Age: 55 Skills and experience: Jim has over 30 years' experience in the building materials industry, nearly 20 years of which have been with CRH. Jim joined CRH as Finance Director for Roadstone and since then has held several senior positions across the Group, including Country Manager for Ireland, Managing Director of each of the Western and Eastern regions of our Europe Materials Division and Chief of Staff to the Chief Executive. He was appointed to the Board and became Chief Financial Officer with effect from 1 June 2021. Qualifications: Fellow of Chartered Accountants Ireland; Bachelor of Commerce from University College Dublin. External appointments Listed: Not applicable. Non-listed: Not applicable. Committee membership: ADF Lamar McKay Senior Independent Director Appointed to the Board: December 2020 Nationality: United States Age: 64 Skills and experience: Lamar was, until July 2020, Chief Transition Officer of BP plc. During a 40 year career in Amoco and subsequently with BP, following the merger of the two companies, Lamar held a variety of senior executive roles, including responsibility for BP’s interests in the TNK-BP joint venture, Chairman and CEO of BP Americas (during which period he acted as President of the Gulf Coast Restoration Organization and Chief Executive Officer for BP’s worldwide Upstream Division). From April 2016 to February 2020 he was Deputy Group Chief Executive Officer of BP, a role in which he had a wide range of accountabilities, including safety, operational risk, legal affairs, technology, economic insight, long range planning and strategy with the latter responsibilities particularly influencing capital allocation planning and BP’s sustainability initiatives. Qualifications: Bachelor of Science from Mississippi State University. External appointments: Listed: Non-executive Chairman of APA Corporation. Non-listed: Not applicable. Committee membership: ADF; NCG; REM (Chair); and SESR

Overview Strategy Report Business Performance & Segmental Reviews Governance Financial Statements Supplemental 20-F and Other Disclosures Shareholder Information 2022 Annual Report and Form 20-F82 Shaun Kelly Non-executive Director Appointed to the Board: December 2019 Nationality: Dual Irish & United States Age: 63 Skills and experience: Shaun was until September 2019, the Global Chief Operating Officer of KPMG International, where he was responsible for the execution of the firm’s global strategy and for the delivery of various global initiatives. Over a thirty-year career with KPMG, the majority of which was spent in the US, he held a variety of senior leadership positions, including Partner in Charge, US Transaction Services (2001 to 2005), Vice Chair and Head of US Tax (2005 to 2010) and Vice Chair Operations and Chief Operating Officer Americas (2010 to 2015), before his appointment as Global Chief Operating Officer in 2015. Qualifications: Fellow of Chartered Accountants Ireland and a US Certified Public Accountant; Bachelor of Commerce and Diploma in Professional Accounting from University College Dublin; and an honorary doctorate from Queen’s University Belfast. External appointments: Listed: Not applicable. Non-listed: Non-executive Director of Park Indemnity Limited. Shaun holds a number of non-profit board memberships. Committee membership: ADF; AUDIT* (Chair); and REM *Audit Committee Financial Expert as determined by the Board Caroline Dowling Non-executive Director Appointed to the Board: March 2021 Nationality: Irish Age: 55 Skills and experience: Caroline was, until her retirement in February 2018, a Business Group President of Flex, an industry leading Fortune 500 company, with operations in 30 countries. In this role she led the Telecommunications, Enterprise Compute, Networking and Cloud Data Centre and was also responsible for managing the Global Services Division, supporting complex supply chains. Prior to this, Caroline held a range of senior executive roles in Flex, including responsibility for development & strategy, marketing, retail & technical services and global sales. External appointments: Listed: Non-executive Director of DCC plc and IMI plc. Non-listed: Non-executive Director of Orion SCM, Inc., a US-based software firm. Committee membership: ADF; REM; and SESR Richard Fearon Non-executive Director Appointed to the Board: December 2020 Nationality: United States Age: 66 Skills and experience: Richard was, until March 2021, the Vice Chairman and Chief Financial and Planning Officer of Eaton Corporation plc, a global power management company, roles he held since 2009 and 2002, respectively. He had responsibility and oversight for a number of key operational and strategic functions at Eaton, including accounting, control, corporate development, information systems, internal audit, investor relations, strategic planning, tax and treasury functions. Prior to joining Eaton, he worked at several large diversified companies, including Transamerica Corporation, NatSteel Ltd, and The Walt Disney Company. He also served as a management consultant with Booz Allen & Hamilton and The Boston Consulting Group. Qualifications: Bachelor of Arts in Economics from Stanford University; Masters of Business Administration from Harvard Business School; and a Juris Doctor from Harvard Law School. External appointments: Listed: Non-executive and Lead Director of Avient Corporation; non-executive Director of Crown Holdings, Inc and non-executive and Lead Director of Hennessy Capital Investment Corp. VI. Non-listed: Not applicable. Committee membership: ADF; AUDIT*; and SESR *Audit Committee Financial Expert as determined by the Board Johan Karlström Non-executive Director Appointed to the Board: September 2019 Nationality: Swedish Age: 66 Skills and experience: Johan was President and Chief Executive Officer of Skanska AB, a leading multinational construction and project development company until 2017. Over a thirty-year career with Skanska, he held a variety of leadership roles in Europe and America, before becoming President and Chief Executive in 2008. He also served as President and Chief Executive Officer of BPA (now Bravida), a listed mechanical and installation group from 1996 to 2000. Qualifications: Masters degree in Engineering from the KTH Royal Institute of Technology, Sweden. External appointments: Listed: Not applicable. Non-listed: Non-executive Director of Nimlas AB. Committee membership: ADF; REM; and SESR

Overview Strategy Report Business Performance & Segmental Reviews Governance Financial Statements Supplemental 20-F and Other Disclosures Shareholder Information 2022 Annual Report and Form 20-F84 Badar Khan Non-executive Director Appointed to the Board: October 2021 Nationality: Dual British & United States Age: 51 Skills and experience: Badar is currently a Senior Advisor with Global Infrastructure Partners, a leading global independent infrastructure fund manager. He was, until June 2022, President of National Grid US, a major business segment of the leading energy transmission and distribution company, National Grid plc. Prior to this, he held a variety of roles in National Grid, including responsibility for strategy and innovation. Before joining National Grid he worked at Centrica plc (2003 to 2017), a leading international energy services and solutions company, where he held a variety of senior executive positions in the UK and US, and has prior experience in marketing, consulting and project management. Qualifications: Bachelor of Engineering from Brunel University and an MBA from The Wharton School of the University of Pennsylvania. External appointments: Listed: Non-executive Director of EVgo Inc. Non-listed: Not applicable. Committee membership: AUDIT and SESR Gillian L. Platt Non-executive Director Appointed to the Board: January 2017 Nationality: Canadian Age: 69 Skills and experience: During the course of her executive career, Gillian held a number of senior leadership positions in a variety of industries, geographies and roles including human resources, corporate affairs and strategy. Most recently she was Executive Vice President and Chief Human Resources Officer at Finning International, Inc. (the world’s largest Caterpillar equipment dealer) with global responsibility for human resources, talent development and communications. She previously held senior executive roles at Aviva, the multinational insurance company, as Executive Vice President Human Resources and Executive Vice President Strategy and Corporate Development. Qualifications: Bachelor of Arts from the University of Western Ontario and a Masters of Education from the University of Toronto. External appointments: Listed: Non-executive Director of Interfor Corporation, a Canadian listed company, which is one of the world’s largest providers of lumber. Non-listed: Not applicable. Committee membership: NCG; REM; and SESR Mary K. Rhinehart Non-executive Director Appointed to the Board: October 2018 Nationality: United States Age: 64 Skills and experience: Mary is non-executive Chairman of Johns Manville Corporation, a Berkshire Hathaway company, which is a leading global manufacturer of premium-quality building products and engineered speciality materials. Over nearly 40 years with Johns Manville she has held a wide range of global leadership roles, encompassing responsibility for business management and strategic business development and was also Chief Financial Officer. Mary was formerly a non-executive Director of Ply Gem Holdings Inc., a leader in exterior building products in North America and Lead Director of CoBiz Financial Inc. Qualifications: Bachelor’s degree in Finance from the University of Colorado; MBA from the University of Denver. External appointments: Listed: Non-executive Director of Graphic Packaging Holding Company. Non-listed: Non-executive Chairman of Johns Manville Corporation; and member of the Board of Trustees of the University of Denver. Committee membership: NCG; REM; and SESR (Chair) Siobhán Talbot Non-executive Director Appointed to the Board: December 2018 Nationality: Irish Age: 59 Skills and experience: Siobhán is Group Managing Director of Glanbia plc, a global nutrition company with operations in 32 countries, a position she has held since 2013. She has been a member of the Glanbia Board since 2009 and was previously Finance Director, a role which encompassed responsibility for Glanbia’s strategic planning. Prior to joining Glanbia, she worked with PricewaterhouseCoopers in Dublin and Sydney. Qualifications: Fellow of Chartered Accountants Ireland; Bachelor of Commerce; and a Diploma in Professional Accounting from University College Dublin. External appointments: Listed: Group Managing Director of Glanbia plc. Non-listed: Director of the Irish Business Employers Confederation (IBEC). Committee membership: ADF; AUDIT*; and NCG *Audit Committee Financial Expert as determined by the Board Board of Directors continued Board Committees Acquisitions, Divestments and Finance Committee ADF Audit Committee AUDIT Nomination & Corporate Governance Committee NCG Remuneration Committee REM Safety, Environment & Social Responsibility Committee SESR

Overview Strategy Report Business Performance & Segmental Reviews Governance Financial Statements Supplemental 20-F and Other Disclosures Shareholder Information 2022 Annual Report and Form 20-F84 Membership of CRH Board (as at 31 December 2022) Table 1 ■ Independent ■ Non-Independent ■ 0-3 years ■ 3-6 years Gender Diversity Percentage of Female Directors at 31 December 83% 17% 67% 33% 40% 60% Geographical Spread (by residency) Ethnicity (based on information provided by Directors in line with the Parker Review) ■ N. America ■ Ireland ■White ■ Asian ■ Mainland Europe 50% 8% 42% 92% 8% Independence (determined by CRH Board annually) Tenure of Non-executive Directors ■Male ■ Female 23% 29% 33% 30% 38% 42% 42% 33% 33% 2014 2015 2016 2017 2018 2019 2020 2021 2022
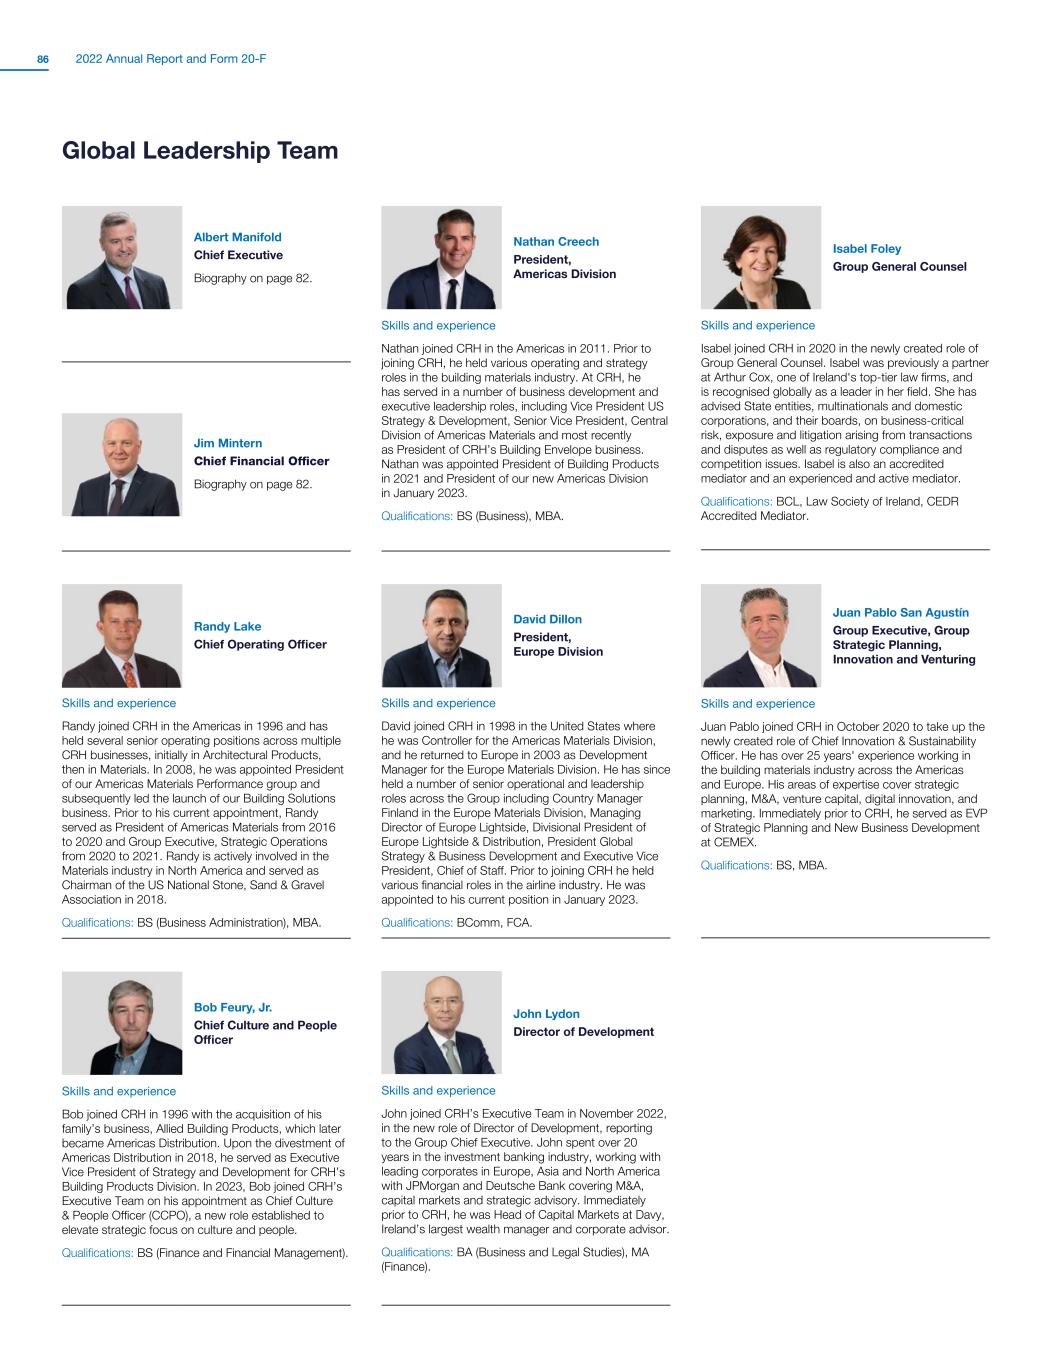
Overview Strategy Report Business Performance & Segmental Reviews Governance Financial Statements Supplemental 20-F and Other Disclosures Shareholder Information 2022 Annual Report and Form 20-F86 Randy Lake Chief Operating Officer Skills and experience Randy joined CRH in the Americas in 1996 and has held several senior operating positions across multiple CRH businesses, initially in Architectural Products, then in Materials. In 2008, he was appointed President of our Americas Materials Performance group and subsequently led the launch of our Building Solutions business. Prior to his current appointment, Randy served as President of Americas Materials from 2016 to 2020 and Group Executive, Strategic Operations from 2020 to 2021. Randy is actively involved in the Materials industry in North America and served as Chairman of the US National Stone, Sand & Gravel Association in 2018. Qualifications: BS (Business Administration), MBA. David Dillon President, Europe Division Skills and experience David joined CRH in 1998 in the United States where he was Controller for the Americas Materials Division, and he returned to Europe in 2003 as Development Manager for the Europe Materials Division. He has since held a number of senior operational and leadership roles across the Group including Country Manager Finland in the Europe Materials Division, Managing Director of Europe Lightside, Divisional President of Europe Lightside & Distribution, President Global Strategy & Business Development and Executive Vice President, Chief of Staff. Prior to joining CRH he held various financial roles in the airline industry. He was appointed to his current position in January 2023. Qualifications: BComm, FCA. Juan Pablo San Agustín Group Executive, Group Strategic Planning, Innovation and Venturing Skills and experience Juan Pablo joined CRH in October 2020 to take up the newly created role of Chief Innovation & Sustainability Officer. He has over 25 years' experience working in the building materials industry across the Americas and Europe. His areas of expertise cover strategic planning, M&A, venture capital, digital innovation, and marketing. Immediately prior to CRH, he served as EVP of Strategic Planning and New Business Development at CEMEX. Qualifications: BS, MBA. Global Leadership Team Albert Manifold Chief Executive Biography on page 82. Jim Mintern Chief Financial Officer Biography on page 82. Nathan Creech President, Americas Division Skills and experience Nathan joined CRH in the Americas in 2011. Prior to joining CRH, he held various operating and strategy roles in the building materials industry. At CRH, he has served in a number of business development and executive leadership roles, including Vice President US Strategy & Development, Senior Vice President, Central Division of Americas Materials and most recently as President of CRH’s Building Envelope business. Nathan was appointed President of Building Products in 2021 and President of our new Americas Division in January 2023. Qualifications: BS (Business), MBA. Isabel Foley Group General Counsel Skills and experience Isabel joined CRH in 2020 in the newly created role of Group General Counsel. Isabel was previously a partner at Arthur Cox, one of Ireland's top-tier law firms, and is recognised globally as a leader in her field. She has advised State entities, multinationals and domestic corporations, and their boards, on business-critical risk, exposure and litigation arising from transactions and disputes as well as regulatory compliance and competition issues. Isabel is also an accredited mediator and an experienced and active mediator. Qualifications: BCL, Law Society of Ireland, CEDR Accredited Mediator. Bob Feury, Jr. Chief Culture and People Officer Skills and experience Bob joined CRH in 1996 with the acquisition of his family’s business, Allied Building Products, which later became Americas Distribution. Upon the divestment of Americas Distribution in 2018, he served as Executive Vice President of Strategy and Development for CRH’s Building Products Division. In 2023, Bob joined CRH’s Executive Team on his appointment as Chief Culture & People Officer (CCPO), a new role established to elevate strategic focus on culture and people. Qualifications: BS (Finance and Financial Management). John Lydon Director of Development Skills and experience John joined CRH’s Executive Team in November 2022, in the new role of Director of Development, reporting to the Group Chief Executive. John spent over 20 years in the investment banking industry, working with leading corporates in Europe, Asia and North America with JPMorgan and Deutsche Bank covering M&A, capital markets and strategic advisory. Immediately prior to CRH, he was Head of Capital Markets at Davy, Ireland’s largest wealth manager and corporate advisor. Qualifications: BA (Business and Legal Studies), MA (Finance).

Overview Strategy Report Business Performance & Segmental Reviews Governance Financial Statements Supplemental 20-F and Other Disclosures Shareholder Information 2022 Annual Report and Form 20-F86 Governance Framework Board of Directors Collectively responsible for promoting the long-term sustainable success of the Group, generating value for shareholders and contributing to wider society. Its role is to provide leadership; to establish and monitor the Group’s purpose, values and strategy; to set the Group’s risk appetite and ensure that there is a robust framework of prudent and effective controls to enable risks and opportunities (including those related to climate change) to be assessed and managed; and to ensure that there is effective dialogue with shareholders and stakeholders on all relevant matters. The Board has established five permanent Committees to assist in the execution of its responsibilities. The terms of reference of each Committee are available on the CRH website, www.crh.com Audit Committee Supports the Board by providing governance and oversight of the Group’s financial reporting and monitoring and assessing the Group’s risk management and internal control systems. Safety, Environment & Social Responsibility Committee Supports the Board by monitoring and assessing performance in the areas of safety, climate change and sustainability and inclusion & diversity. Acquisitions, Divestments & Finance Committee Supports the Board by reviewing the strategic rationale and impact of proposed acquisitions, divestments, large capital expenditure projects and advising the Board on the financial requirements of the Group and on appropriate funding arrangements. Remuneration Committee Supports the Board by setting and ensuring that the Group’s Remuneration Policies are fair and responsible and that they incentivise and retain talent. The Committee also approves the remuneration packages for the Executive Directors, senior executives and the Chairman. Our purpose See pages 6 to 7 Our strategy See pages 11 to 59 Our principal risks & uncertainties See pages 139 to 148 Our stakeholder engagement processes See pages 44 to 45 Our key Board activities during 2022 See pages 88 to 132 Nomination & Corporate Governance Committee Supports the Board by monitoring the Board's structure, size, composition and balance of skills to ensure that the Board can meet its strategic objectives and regulatory responsibilities. It is also responsible for monitoring corporate governance developments and, with effect from January 2023, human capital management and employee engagement. The Board has delegated responsibility for the management of the Group, through the Chief Executive, to executive management Chief Executive The Chief Executive has responsibility for full day-to-day operational and profit performance of the Group and accountability to the Board for all authority delegated to executive management. He is also responsible for executing strategy agreed with the Board and reporting regularly on the progress and performance of the Group, including in relation to climate-related matters. See pages 14 to 15 The Global Leadership Team supports the Chief Executive in executing his responsibilities Global Leadership Team The Global Leadership Team is responsible for pursuing performance delivery and progressing the Group’s integrated solutions and climate-related strategy agenda. Members See page 86 Our Business Model See pages 20 to 21 Our Performance See pages 62 to 79 Our Sustainability Strategy See pages 22 to 59 Our Principal Risks & Uncertainties See pages 139 to 148 See pages 92 to 97 See pages 98 to 99 See pages 108 to 132 See the Governance AppendixSee pages 104 to 105

Overview Strategy Report Business Performance & Segmental Reviews Governance Financial Statements Supplemental 20-F and Other Disclosures Shareholder Information 2022 Annual Report and Form 20-F88 Corporate Governance Report Richie Boucher "The Board is responsible for setting the Group’s strategy. Each year the Board focuses on a number of key strategic topics for in depth review. In the past year the main areas of focus were on our solutions strategy, innovation and sustainability." Richie Boucher Chairman Governance Appendix - Further Information Further general information in relation to the following Board-related governance practices is contained in the Governance Appendix: • the operation of the Board • the respective responsibilities of the Chairman, Chief Executive, Senior Independent Director and non-executive Directors • how the Chairman is appointed • the induction process to support newly appointed non-executive Directors • the processes in place for appraising the performance of Directors and for evaluating the effectiveness of the Board and its Committees • how often the Board meets • the requirements for director retirements and re-election • how Board agendas are determined • how the Board assesses whether disclosures are fair, balanced and understandable • the provisions in place in relation to shareholder meetings • the Company's Constitution Introduction This section of the Annual Report provides an overview of the way in which your Board and its Committees operated in the past year, highlights the primary areas of focus and outlines the way in which the principles of the 2018 UK Corporate Governance Code (the "2018 Code") are implemented. CRH’s general governance practices are detailed in the governance appendix on CRH’s website, www.crh.com (the ‘Governance Appendix’)1. Our People The success of CRH derives from the efforts, expertise and collaboration of the c.75,800 people who work for the Company. Accordingly, the Board and management are committed to building a safe, inclusive and diverse organisation. During 2021, CRH conducted an organisational health survey across its businesses, which highlighted an overall good performance and identified areas for improvement. Action plans in line with these areas were developed and implemented. In the last quarter of 2022, a pulse survey was issued to broadly the same population to ascertain progress on the areas identified for improvement. There was a 76% response rate to the survey, which was very encouraging. All organisational health areas where improvements had been focused showed improvement. In terms of inclusion practices, there was a range of trends. In order to understand the underlying drivers of those trends tailored focus groups of employees will be set up. In addition, as outlined in the Directors' Remuneration Report on page 108, an improvement in CRH’s Inclusion Assessment, based on an externally validated Enterprise Score from engagement surveys, was included as a metric in our long-term incentive plans. Also during 2022, led by members of the SESR Committee, we continued our process of direct employee engagement through an in-person discussion with a cross-section of local employees in Houston, Texas during a Board visit. This was supplemented by separate virtual sessions with employees from across our European and Americas businesses. On behalf of the Board, I would like to take the opportunity to thank those employees who engaged openly with us on their experiences and perspectives of CRH across a broad range of topics, including: • safety; • CRH’s culture; • awareness of the Code of Business Conduct and the extent to which employees feel empowered to speak-up through the CRH Hotline or otherwise when they have good faith concerns; • career progression and personal development; • performance transparency in relation to the link between individual roles and the performance of businesses; • the integration process for newly-acquired businesses; • CRH’s employee benefit programmes; • our newly articulated corporate Purpose; and • the benefits of collaboration and innovation for employees and CRH We also had an opportunity during these engagements to explain our remuneration structures and the alignment of incentives with the Group's strategic priorities. In relation to I&D, we noted that progress and many positive improvements are becoming evident across the organisation along with a common view that this will be a long journey. The feedback from both the surveys and our direct engagement with employees has enabled us to conclude that there is a positive alignment 1. The Governance Appendix is published in conjunction with the Directors’ Report in compliance with Section 1373 of the Companies Act 2014. For the purposes of Section 1373(2) of the Companies Act 2014, the Governance Appendix and the risk management disclosures on pages 50 to 54 and 139 to 148 form part of, and are incorporated by reference into, this Corporate Governance Report. The primary (premium) listing of CRH plc is on the LSE, with the listing on Euronext Dublin characterised as secondary. For this reason, CRH plc is not subject to the same ongoing listing requirements as would apply to an Irish company with a primary listing on Euronext Dublin. For further information, shareholders should consult their financial adviser. Further details on the Group’s listing arrangements, including its premium listing on the LSE, are set out on page 101.
Overview Strategy Report Business Performance & Segmental Reviews Governance Financial Statements Supplemental 20-F and Other Disclosures Shareholder Information 2022 Annual Report and Form 20-F88 between our performance culture, training and career development opportunities, our strong safety culture, our corporate Purpose, the initiatives in place to support I&D and our strategy. Having robust talent management processes is a vital component of continued success. In that regard, the Board receives regular updates on talent reviews, which provide us with detailed insights into emerging talent within the organisation, the development programmes in place to support individuals and the plans to close any potential gaps in role succession or capability. We also receive regular reports on progress in relation to identified actions and key metrics in the area of talent management such as gender and diversity pipelines. In addition, during visits to operations in Europe and the US, which in 2022 were to Copenhagen, Denmark and, as noted above, to Houston, Texas, the Board had the opportunity to engage with the Divisional and local management teams, collectively and individually. Furthermore, I had the opportunity to attend management conferences held during the year. Following a suggestion made in the external Board evaluation report, conducted by Christopher Saul Associates in 2021, the outcome of which was reported in the 2021 Annual Report, the remit of the Nomination & Corporate Governance Committee has been expanded by the Board to include human capital management to the extent that this is not a Board agenda item. In line with this, and to balance more evenly the workload of the Committees, the Board has also decided that responsibility for employee engagement will transfer from the SESR Committee to the Nomination & Corporate Governance Committee with effect from January 2023. Strategy The Board is responsible for setting the Group’s strategy. Each year the Board focuses on a number of key strategic topics for in depth review. In the past year the main areas of focus were on our solutions strategy, innovation and sustainability. Further information on the Group's strategy and business model is included on pages 11 to 59. Solutions & Innovation A primary area of focus for the Board over the past 12 months has been on our accelerating solutions journey in the context of evolving construction trends. This included leveraging the Board site visits in Copenhagen and Houston to gain a detailed understanding of the opportunities and challenges that arise from developing, and expanding upon, the solutions CRH currently provides. The interaction between the execution of our solutions strategy and our work in the area of portfolio management is outlined in the Chief Executive’s Review on pages 14 and 15. In 2022, the Board considered and approved a $250 million venturing and innovation fund to identify new technologies and business models, and to foster innovation across the organisation. The operational and governance structures to support the fund, which will invest in internal projects and external partnerships, have been put in place and a number of initiatives are underway. The Board receives regular updates on the operation of the fund. Further information on the venturing and innovation fund is contained in the Strategy Report on page 30. During the year, the Board also considered, and approved, an updated organisation structure for the Group, resulting in two distinct Divisions, CRH Americas and CRH Europe. This new structure will support CRH in taking advantage of the opportunities resulting from the changing construction environment while retaining the strengths of the existing model. Sustainability Another area of significant focus for the Board in the past year was CRH’s decarbonisation roadmap. In particular, our industry leading absolute carbon emissions reduction target by 2030 which is aligned with our ambition to be a net-zero business by 2050. In early 2023, the SBTi validated that our revised targets1 are in line with the updated 1.5oC science-based framework which now equate to a 30% reduction in absolute carbon emissions by 2030 (from a 2021 base year). Further details in relation to the Board’s oversight of CRH's sustainability initiatives are set out in the SESR Committee Report on pages 104 and 105. In addition, the Directors' Remuneration Report on page 110 sets out the way in which sustainability has been integrated into CRH’s incentive plans. Business Performance and Capital Expenditure The Board has in place robust procedures to monitor business performance, against approved financial budgets, and in respect of the approval of capital expenditure projects and development activity. Significant projects and opportunities are brought to the attention of the Board early in the process so that the Board can provide feedback to management prior to a formal proposal being considered. In addition, each year the ADF Committee reports to the Board on a detailed review of acquisitions and capital expenditure after three years of performance following approval of the proposal. Table 2 sets out the limits which apply to projects that can be approved by the Board, the ADF Committee and management respectively. Limits for Acquisitions, Divestments and Capital Expenditure Projects Table 2 Board ADF Management/CEO >€/$100m €/$30-100m* <€/$30m *For new regions the limit is €/$50 million Dividends and Share Buybacks The Board is responsible for setting CRH’s dividend policy and decisions on the level and duration of the Group’s share buyback programme. In determining our approach to shareholder distributions, we take into consideration the views of shareholders received through the engagement processes outlined below. Stakeholder Engagement During the past 12 months, supported by other Committee Chairs and the Company Secretary as appropriate, I held meetings with shareholders holding c.35% of CRH’s issued share capital. These meetings provided a valuable opportunity for me to outline the Board’s priorities and perspectives on certain matters and to ascertain shareholders' views on a wide range of topics such as Board composition, succession planning, our strategy, capital allocation policies, our approach to sustainability and remuneration. The feedback from these meetings, which was broadly in line with the Board's priorities and perspectives, was provided to the Board and relevant Committees and factored into the Board's decision-making processes. The Board also regularly receives detailed reports from related engagement activities carried out by management. As noted above, the Board has transferred responsibility for employee engagement to the Nomination & Corporate Governance Committee from the SESR Committee with effect from January 2023. Given the footprint of CRH, the Board believes that having a Committee responsible for employee engagement is the most effective way of ensuring that the views of employees are understood and are taken into consideration in the Board’s decision-making processes. The feedback from employee engagement sessions, the results from organisational health surveys and reports from CRH’s Hotline also enable us to assess CRH’s culture. During both Board site visits in 2022, the Board had an opportunity to meet with, and hear directly from, customers with whom CRH is working on large scale projects. Customer perspectives on our water, road and urban construction solutions were also represented in our investor update in April 2022. We also engage with stakeholder and investor groups in relation to sustainability matters and take their views into account when considering the disclosures to be included in the Annual and Sustainability Reports. 1. Refer to page 27 for further detail on our decarbonisation targets.
Overview Strategy Report Business Performance & Segmental Reviews Governance Financial Statements Supplemental 20-F and Other Disclosures Shareholder Information 2022 Annual Report and Form 20-F90 As noted in last year’s Annual Report, following engagement with stakeholders, we undertook a review of climate change lobbying practices to ensure that there is an alignment between those practices and the expectations of the Board and our stakeholders. We also published the CRH Group Tax Strategy, which sets out the tax objectives, strategy and governance framework of the Group, due to the increasing importance for tax transparency across a number of different stakeholders, including Governments, sustainability analysts and investors. A summary of the full range in which we engage with our stakeholders, including the main areas of interest and outcomes of the various engagement processes in 2022, is set out on pages 44 and 45. Board Committees The Board has five permanent committees: the Acquisitions, Divestments & Finance Committee, the Audit Committee, the Nomination & Corporate Governance Committee, the Remuneration Committee and the Safety, Environment & Social Responsibility Committee. Reports from the Chairs of each of the main Committees are set out on pages 92 to 132. Detailed reports of all Committee meetings are provided to the Board, while Committee minutes and papers are available to all Board members electronically. The terms of reference of each Committee are available on the CRH website, www.crh.com. Board Training The Board has a programme of regular training in areas such as Compliance & Ethics and the Board’s responsibilities in respect of Market Abuse. In addition, an extensive tailored induction programme is put in place for newly appointed Directors. Litigation & Compliance The Group General Counsel regularly updates the Board on relevant legal and compliance matters and provides reports on any material matters that arise requiring Board decisions or detailed consideration. External Appointments During the year Badar Khan sought clearance to join the Board of EVgo Inc., the largest public fast charging network for electric vehicles in the US. Badar and the Board were satisfied that this would not impact on his time commitment to CRH or create any conflict of interests. Re-election of Directors Table 7 on page 100 provides a summary of competencies, important to the long-term success of the Group, that each Director seeking re-election at the 2023 AGM brings to the Board. I have evaluated the performance of each Director and am satisfied that each Director is committed to their role, provides constructive challenge and devotes sufficient time and energy to contribute effectively to the performance of the Board. I strongly recommend that shareholders vote in favour of the re-appointment of each Director going forward for re-election at the 2023 AGM. Modern Slavery Each year CRH publishes a Modern Slavery statement on the CRH website, www.crh.com, which sets out the measures CRH and its subsidiaries have taken during the relevant financial year to ensure that slavery or human trafficking is not taking place within CRH’s business or its supply chains. Our Legal & Compliance department work with our Procurement and Sustainability teams to update the Statement annually and keep it under review. The outcome of the review is reported to the Board, which approves the statement for publication. Dematerialisation of Shares Under the EU Central Securities Depositories Regulation (EU) 909/2014 (CSDR) there is a requirement for all shares in Irish issuers to be held in book-entry form. The period by which this transition must happen is from 1 January 2023 for new issues of shares and from 1 January 2025 for all remaining shares. Book-entry form means an electronic record of ownership such as an entry in an electronic register, without any further document such as a share certificate. In last year’s report, I noted that the Irish market was considering fully dispensing with share certificates with effect from 1 January 2023 to avoid potential confusion and complications that might arise in some circumstances by having two systems running in parallel. However, following further consideration, market participants no longer intend to accelerate the transition. Therefore, certificated shareholders will experience no change with respect to their existing shares in 2023 and 2024 and their share certificates will remain valid until 2025. Conclusion I hope that this report and the reports from the Board’s Committees provide shareholders with a good level of insight into the activities of the Board, the priority areas on which we are focused and the structures in place to enable the Board to fulfil our governance responsibilities to you. Richie Boucher Chairman 1 March 2023

Overview Strategy Report Business Performance & Segmental Reviews Governance Financial Statements Supplemental 20-F and Other Disclosures Shareholder Information 2022 Annual Report and Form 20-F90 UK Corporate Governance Code - Compliance Statement The principles set out in the 2018 Code emphasise the value of good corporate governance to the long-term sustainable success of listed companies. These principles, and the supporting provisions, cover five broad themes: • Board Leadership & Corporate Purpose • Division of Responsibilities • Composition, Succession & Evaluation • Audit, Risk & Internal Controls • Remuneration As demonstrated by the disclosures in this Report and the details of CRH’s general governance practices in the Governance Appendix, CRH applied the principles and complied with the provisions of the 2018 Code in 2022. A copy of the 2018 Code can be obtained from the Financial Reporting Council’s website, www.frc.org.uk. Further information on how we applied the principles, and supporting provisions, can be found as follows: Pages Board Leadership & Corporate Purpose The Board’s primary objective is to promote the long-term sustainable success of CRH. Further details on CRH’s purpose, values and strategy, and how the Board ensures that these are aligned with CRH’s culture, including how the Board engages with all of its stakeholders, are set out in the following sections: • Purpose 6 – 7 • Strategy Report 11 - 59 • Engaging with our Stakeholders 44 - 45 • Corporate Governance Report – Chairman’s Introduction 88 - 90 Division of Responsibilities The Board consists of two executive Directors and ten independent non-executive Directors (including the Chairman). The respective responsibilities of the Board, Chairman, Chief Executive, Chief Financial Officer, Senior Independent Director and non-executive Directors are set out in the Governance Appendix. Governance Appendix Composition, Succession & Evaluation The Nomination & Corporate Governance Committee Report provides details on the Board renewal processes and on the structure of the annual evaluation of the Board and its Committees. Additional details are included in the Governance Appendix. 98 - 99 Audit, Risk & Internal Controls The Board has delegated responsibility for monitoring the effectiveness of the Group’s risk management and internal control systems to the Audit Committee1. The Audit Committee Report describes the primary areas of focus for the Audit Committee in 2022 and how it discharged its various responsibilities, including those in relation to the monitoring of the Group’s risk and internal control frameworks. Additional details are included in the Governance Appendix. 92 - 97 Remuneration The Directors’ Remuneration Report describes the work of the Remuneration Committee and sets out how executive remuneration is aligned to the Company’s purpose, values and strategy. It also describes how the Committee considers workforce remuneration and related policies in its decision-making regarding executive remuneration. 108 - 132 1. In accordance with Section 167(7) of the Companies Act 2014.

Overview Strategy Report Business Performance & Segmental Reviews Governance Financial Statements Supplemental 20-F and Other Disclosures Shareholder Information 2022 Annual Report and Form 20-F92 Audit Committee Report Shaun Kelly "A particular area of focus for the Committee in its review of the 2022 Annual Report and Form 20-F was the Group's reporting on climate-related risks. This included the impact on the Group's accounting judgements, disclosures and financial statements, including their alignment with CRH's carbon emissions reduction targets." Shaun Kelly Audit Committee Chairman Committee Members Shaun Kelly (Chairman) Rick Fearon Badar Khan Siobhán Talbot Governance Appendix - Further Information Further general information in relation to the following Audit Committee related topics is contained in the Governance Appendix: • the typical Audit Committee calendar, including agenda and attendees • the Audit Committee's responsibility with regard to monitoring the effectiveness of the Group's risk management and internal controls systems • the processes in place for safeguarding and monitoring the independence of the external auditor • the Group's policy on the provision of non-audit services by the external auditor Introduction On behalf of the Committee, I am pleased to introduce the Audit Committee Report for the financial year ended 31 December 2022. The purpose of this report is to provide shareholders with an insight into the workings of, and principal matters considered by, the Committee in 2022, together with how the Committee has discharged its responsibilities and provided assurance on the integrity of the 2022 Annual Report and Form 20-F. The responsibilities of the Committee are set out in full in its Terms of Reference, which is available on our website, www.crh.com. The Committee has an extensive agenda which focuses on monitoring the effectiveness of risk management within the Group as well as ensuring the integrity of the Group’s financial reporting, that any judgements made are appropriate, that the external auditor is effective in its role and that the Group has an effective internal control framework. Table 3 on page 93 provides a high-level summary of the main activities of the Committee in 2022. Risk Management & Internal Control During 2022, the Committee continued to monitor and assess the Group’s ERM framework and the principal and emerging risks and uncertainties facing the Group, including those that could threaten its business model, future performance, solvency or liquidity. This included discussion with both management and the external auditor, Deloitte, on the impact of climate-related risks on the Group’s accounting judgements, disclosures and financial statements. We also considered an assessment of the Group’s risk management and internal control systems. This had regard to risk management strategies and all material controls, including financial, operational and compliance controls that could affect the Group’s business and concluded that the Group's internal control environment continued to be effective. In addition, in the context of ever-evolving cyber security threats, we continued to monitor and discuss with management the Group’s IT governance and information security programme and the Group’s ability to address and mitigate against evolving cyber security threats. Further details on the Group’s risk governance and risk assessment processes are included on pages 94 and 95 respectively. Further details on the Group's ERM framework are included on pages 50 to 54. Financial Reporting A key area of responsibility and focus of the Committee each year is to monitor the financial reporting process and the integrity of the financial statements, and to review significant financial reporting issues and judgements exercised in preparation thereof. Accordingly, during the past year, the Committee spent significant time reviewing and considering the interim and full year results statements and the 2022 Annual Report and Form 20-F, together with supporting reports from the Group Finance function highlighting all key estimates, judgements and disclosures made by management. This included consideration and discussion with management and Deloitte of the potential accounting and disclosure implications arising from: • the current volatile macroeconomic environment; • the ongoing conflict in Ukraine; and • engagement with stakeholders and relevant regulators in relation to potential additions to the climate-related disclosures included in the 2021 Annual Report and Form 20-F Through discussions with both management and Deloitte, we also reviewed management's impairment testing methodology and processes, including key judgement areas, assumptions and alignment with our carbon emissions reduction targets, as well as the relevant accounting and disclosure requirements. We found the methodology to be robust and the results of the testing process appropriate. Further details in relation to the impairment testing process for 2022 are outlined in Table 5 on page 97.
Overview Strategy Report Business Performance & Segmental Reviews Governance Financial Statements Supplemental 20-F and Other Disclosures Shareholder Information 2022 Annual Report and Form 20-F92 In June 2022, we met with Deloitte to agree the 2022 external audit plan. This included robust discussion and challenge with both Deloitte and management on the scope, materiality thresholds and the structure of the 2022 external audit plan. Table 5 on page 97 outlines the key areas identified as being potentially significant and how these were addressed during the year. Audit Committee - Key Points • The Audit Committee consists of four independent non-executive Directors who bring a broad range of relevant experience and expertise from a variety of industries • Richard Fearon, Shaun Kelly and Siobhán Talbot have been designated by the Board as the Audit Committee’s financial experts • The Audit Committee met six times during 2022 in order to discharge its duties and responsibilities, with meetings held around the financial reporting cycle • The Chief Financial Officer, Head of Internal Audit and representatives of the Group’s external auditor, Deloitte, typically attend Committee meetings, with other senior personnel (such as the Head of Group Finance, Head of Group Risk, Chief Information Security Officer and Head of Compliance) attending meetings to provide updates on certain key areas of the business, as appropriate • The Chairman of the Committee is available to all Board members to discuss any audit or risk related issues they may have and also meets with Deloitte and the Head of Internal Audit on a regular basis, in order to discuss any issues which may have arisen • Deloitte was appointed as the Group’s external auditor with effect from 1 January 2020. Richard Muschamp is the Group’s lead audit engagement partner • During 2022, the Audit Committee and the Board reviewed the operation, performance and effectiveness of the Committee and were satisfied that the Audit Committee continues to operate effectively A particular area of focus for the Committee in its review of the 2022 Annual Report and Form 20-F was the Group's reporting on climate-related risks. This included the impact on the Group's accounting judgements, disclosures and financial statements, their alignment with CRH's carbon emissions reduction targets, and its approach with regard to compliance with the recommendations of various regulatory bodies, the TCFD and EU Taxonomy requirements. We received a number of specific climate-related updates from management during 2022 and reviewed the climate-related disclosures, including the TCFD and EU Taxonomy disclosures included within the 2022 Annual Report and Form 20-F, and agreed that these are appropriate and that the assumptions used in the financial statements were consistent with these disclosures. We also considered and discussed with management and Deloitte various accounting and reporting changes that impacted on the 2022 Annual Report and Form 20-F and may impact future financial periods. This included discussion on the implications of the changes to the Group’s operating segments, which will be an area of focus for the Committee in 2023 (see page 193 for more details). In addition, we reviewed the Going Concern statement (see page 136), including the underlying assumptions (including alignment with the Group's carbon emissions reduction targets) and analysis to support the statement. We found the methodology and processes to be robust and recommended to the Board that it approve the statement. External Auditor Effectiveness The Committee, on behalf of the Board, is responsible for the relationship with the external auditor and for monitoring the effectiveness and quality of the external audit process and the independence of the auditor. The Committee’s primary means of assessing the effectiveness of the external audit process is by monitoring performance against the agreed audit plan. The Committee also considers the experience and knowledge of the external audit team and the results of post-audit interviews with management and the Audit Committee Chairman. These annual procedures are supplemented by periodic formal reviews of the performance of the external auditor. Summary of Committee Activities during 2022 Table 3 Financial Reporting • Recommended to the Board that it approve the interim and full year results statements and the 2022 Annual Report and Form 20-F • Reviewed and recommended to the Board that it approve the Going Concern Statement (see page 136) • Reviewed and discussed with management and Deloitte the Group's reporting on climate-related risks, including the impact on the Group's accounting judgements, disclosures and financial statements, including their alignment with CRH's carbon emissions reduction targets • Reviewed management's impairment testing methodology and processes, including key judgement areas, assumptions and alignment with our carbon emissions reduction targets • Reviewed the appropriateness, prominence, definition and consistency of Alternative Performance Measures (APMs) and Non-GAAP Measures included in the 2022 Annual Report and Form 20-F • Considered and discussed with management and Deloitte various accounting and reporting changes that impacted on the 2022 Annual Report and Form 20-F and which may impact future financial periods • Discussed with management and Deloitte the potential implications of the changes to the Group's operating segments during the first quarter of 2023 External Auditors • Approved the remuneration of Deloitte in respect of the 2022 financial year (see note 5 of the Consolidated Financial Statements on page 197) • Having received confirmation of their willingness to continue in office, recommended to the Board Deloitte's continuance in office for the 2023 financial year. Their continuance will be subject to a non-binding advisory vote at the 2023 AGM Internal Audit • Approved the Internal Audit Charter and audit plan for 2022 • Received regular updates from the Head of Internal Audit on the delivery of the 2022 internal audit plan • Considered and approved the Internal Audit Strategy for the 5-year period 2023 to 2027 Risk Management & Internal Controls • Reviewed an assessment by management of the effectiveness of the Group’s risk management and internal control systems. This had regard to risk management strategies and all material controls, including financial, operational and compliance controls that could affect the Group’s business
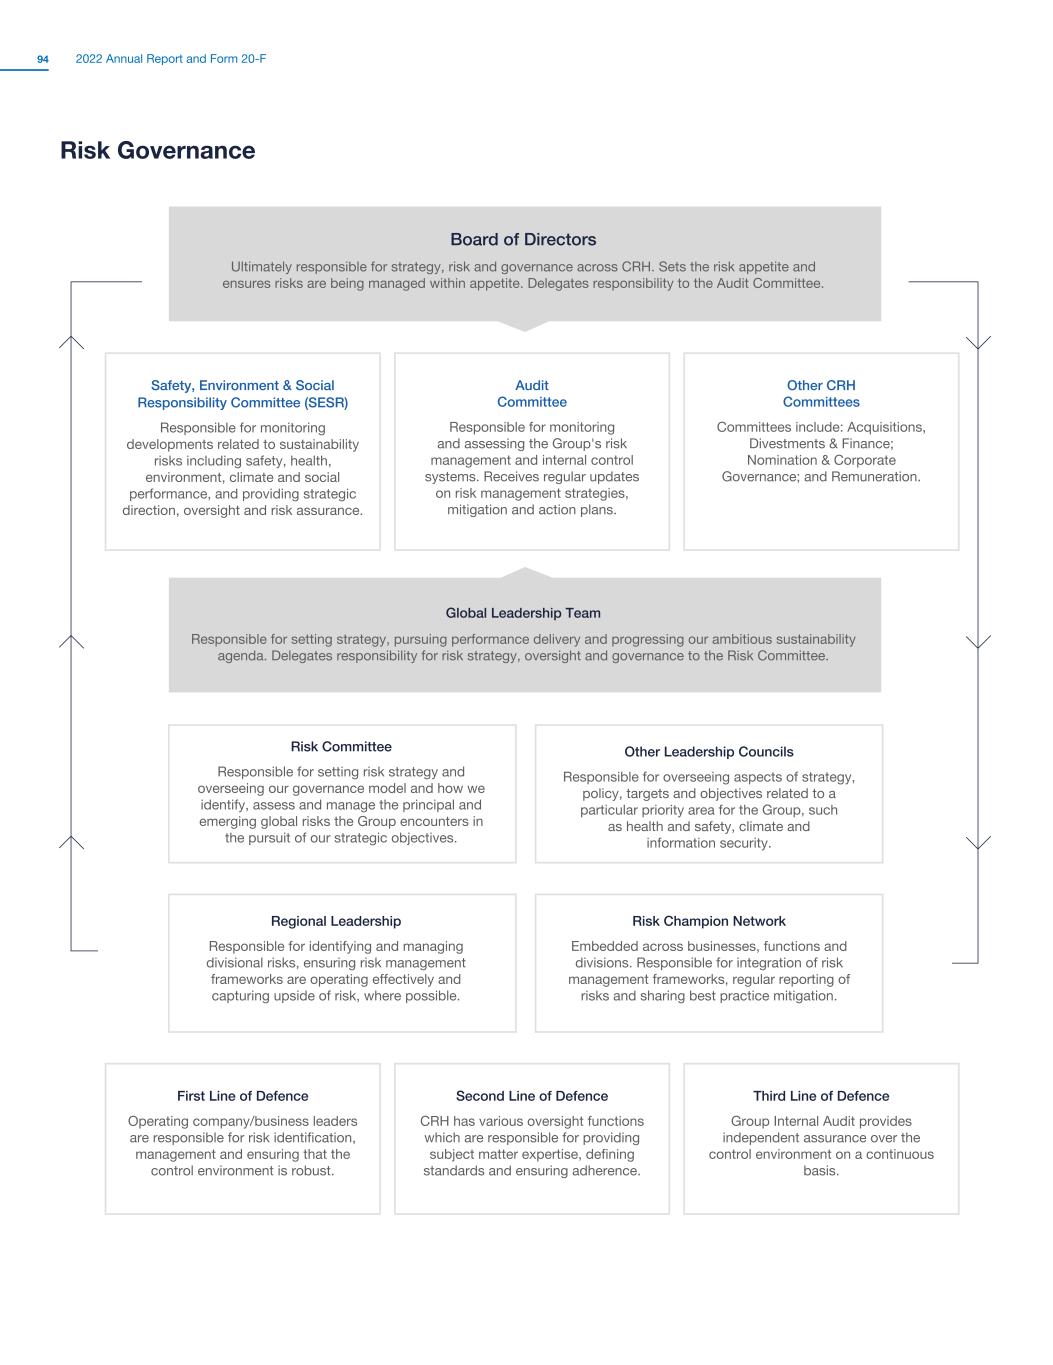
Overview Strategy Report Business Performance & Segmental Reviews Governance Financial Statements Supplemental 20-F and Other Disclosures Shareholder Information 2022 Annual Report and Form 20-F94 Risk Governance Board of Directors Ultimately responsible for strategy, risk and governance across CRH. Sets the risk appetite and ensures risks are being managed within appetite. Delegates responsibility to the Audit Committee. Global Leadership Team Responsible for setting strategy, pursuing performance delivery and progressing our ambitious sustainability agenda. Delegates responsibility for risk strategy, oversight and governance to the Risk Committee. Safety, Environment & Social Responsibility Committee (SESR) Responsible for monitoring developments related to sustainability risks including safety, health, environment, climate and social performance, and providing strategic direction, oversight and risk assurance. Audit Committee Responsible for monitoring and assessing the Group's risk management and internal control systems. Receives regular updates on risk management strategies, mitigation and action plans. Other CRH Committees Committees include: Acquisitions, Divestments & Finance; Nomination & Corporate Governance; and Remuneration. First Line of Defence Operating company/business leaders are responsible for risk identification, management and ensuring that the control environment is robust. Second Line of Defence CRH has various oversight functions which are responsible for providing subject matter expertise, defining standards and ensuring adherence. Third Line of Defence Group Internal Audit provides independent assurance over the control environment on a continuous basis. Risk Committee Responsible for setting risk strategy and overseeing our governance model and how we identify, assess and manage the principal and emerging global risks the Group encounters in the pursuit of our strategic objectives. Other Leadership Councils Responsible for overseeing aspects of strategy, policy, targets and objectives related to a particular priority area for the Group, such as health and safety, climate and information security. Regional Leadership Responsible for identifying and managing divisional risks, ensuring risk management frameworks are operating effectively and capturing upside of risk, where possible. Risk Champion Network Embedded across businesses, functions and divisions. Responsible for integration of risk management frameworks, regular reporting of risks and sharing best practice mitigation.
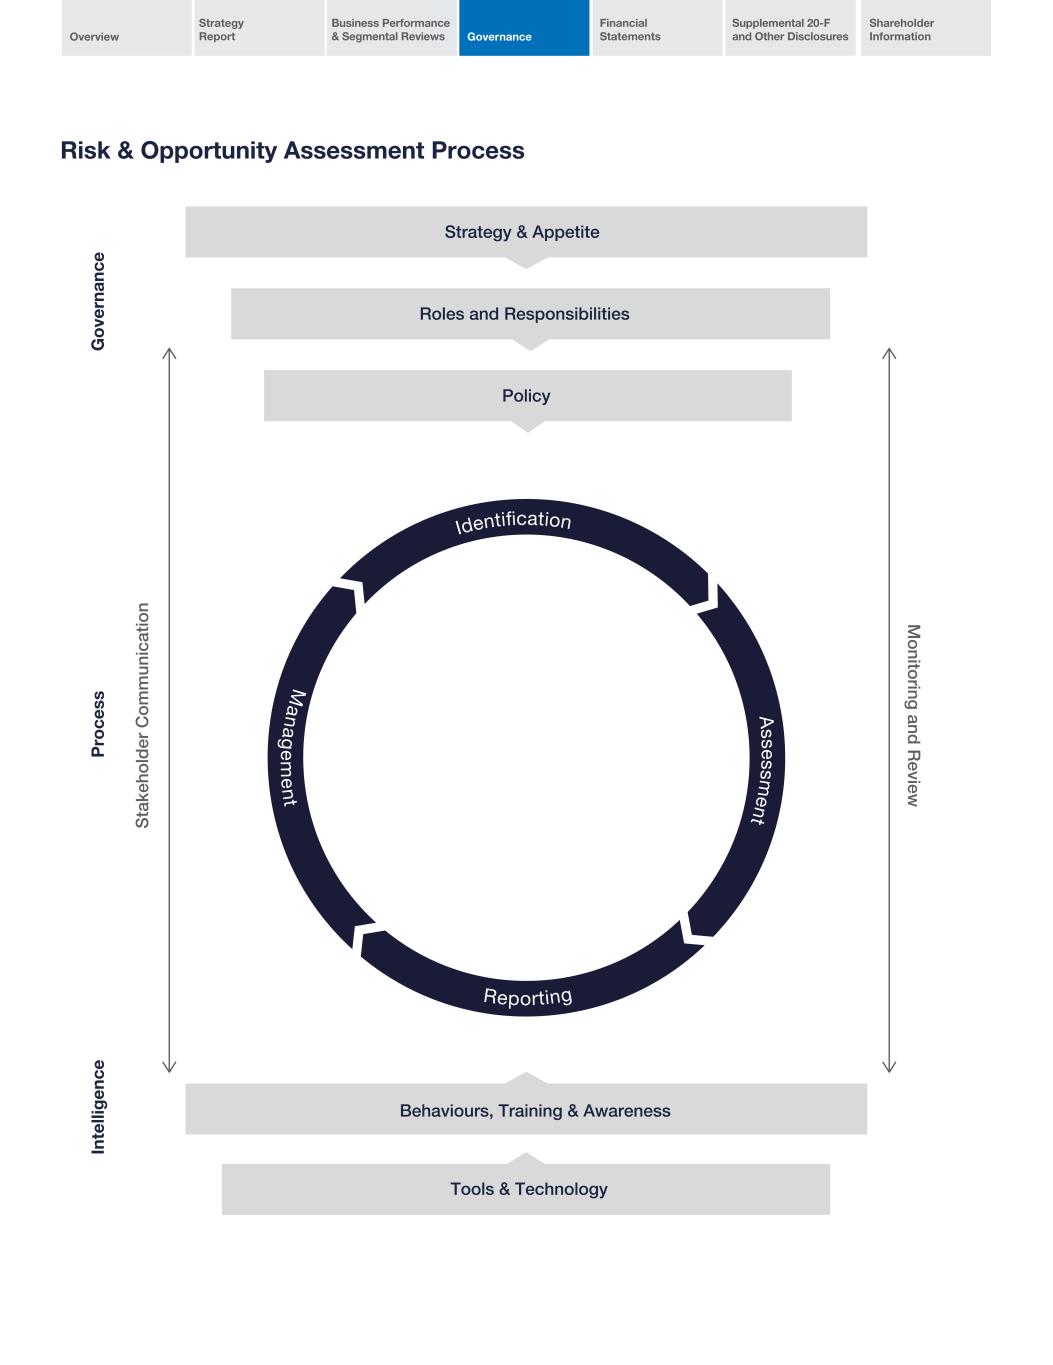
Overview Strategy Report Business Performance & Segmental Reviews Governance Financial Statements Supplemental 20-F and Other Disclosures Shareholder Information 2022 Annual Report and Form 20-F94 Risk & Opportunity Assessment Process S ta ke ho ld er C o m m un ic at io n M o nito ring and R eview G o ve rn an ce In te lli g en ce P ro ce ss Strategy & Appetite Roles and Responsibilities Policy Behaviours, Training & Awareness Tools & Technology Identification A ssessm ent M anag em ent Reporting
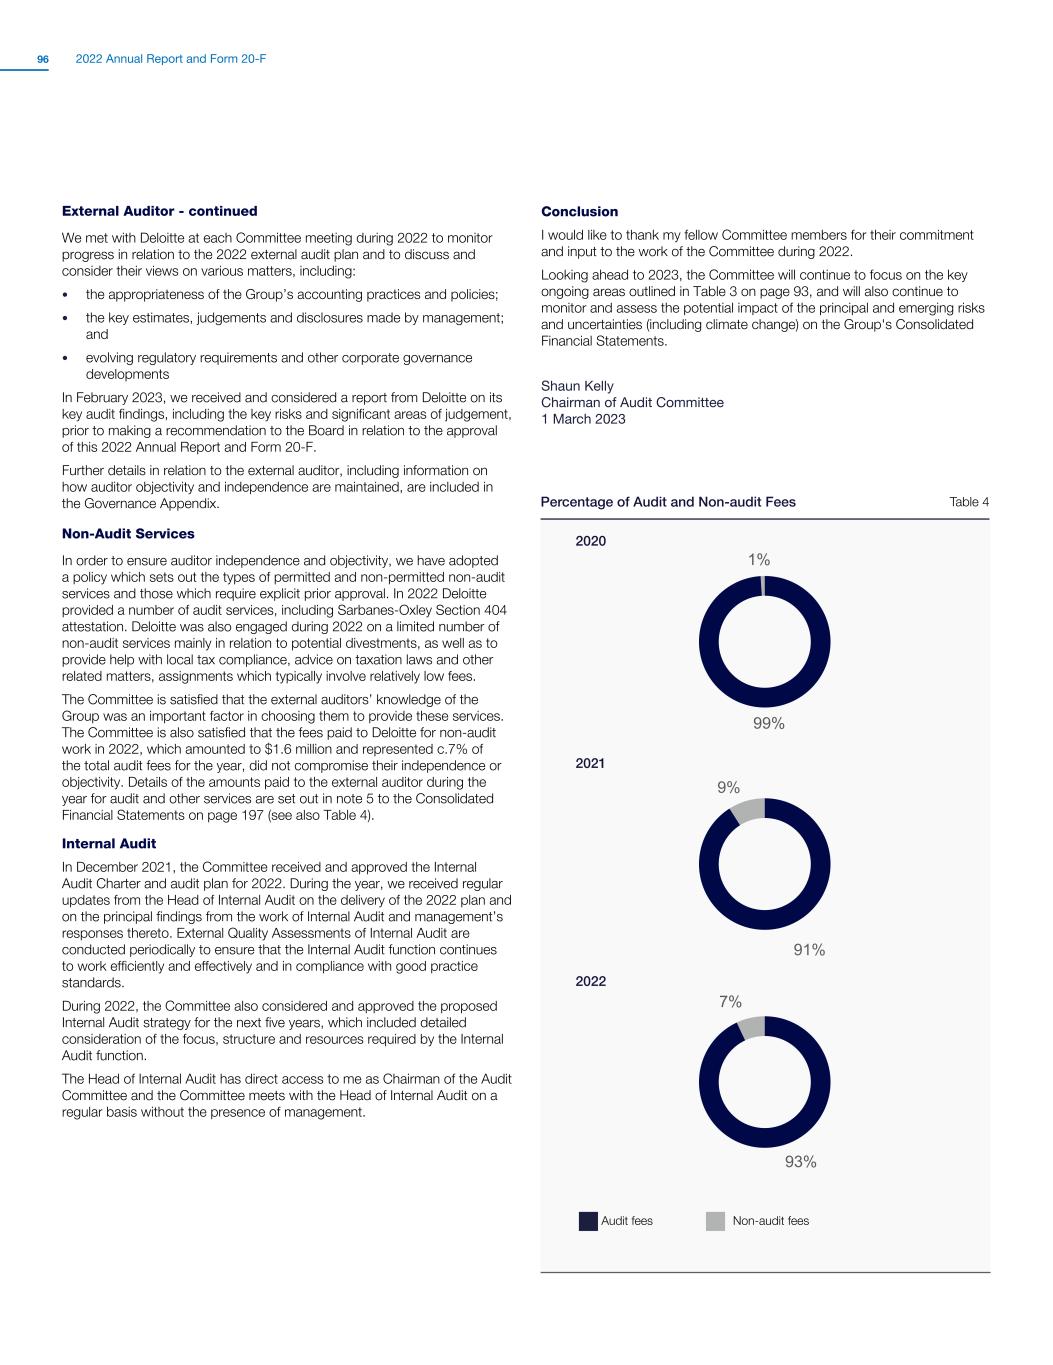
Overview Strategy Report Business Performance & Segmental Reviews Governance Financial Statements Supplemental 20-F and Other Disclosures Shareholder Information 2022 Annual Report and Form 20-F96 External Auditor - continued We met with Deloitte at each Committee meeting during 2022 to monitor progress in relation to the 2022 external audit plan and to discuss and consider their views on various matters, including: • the appropriateness of the Group’s accounting practices and policies; • the key estimates, judgements and disclosures made by management; and • evolving regulatory requirements and other corporate governance developments In February 2023, we received and considered a report from Deloitte on its key audit findings, including the key risks and significant areas of judgement, prior to making a recommendation to the Board in relation to the approval of this 2022 Annual Report and Form 20-F. Further details in relation to the external auditor, including information on how auditor objectivity and independence are maintained, are included in the Governance Appendix. Non-Audit Services In order to ensure auditor independence and objectivity, we have adopted a policy which sets out the types of permitted and non-permitted non-audit services and those which require explicit prior approval. In 2022 Deloitte provided a number of audit services, including Sarbanes-Oxley Section 404 attestation. Deloitte was also engaged during 2022 on a limited number of non-audit services mainly in relation to potential divestments, as well as to provide help with local tax compliance, advice on taxation laws and other related matters, assignments which typically involve relatively low fees. The Committee is satisfied that the external auditors’ knowledge of the Group was an important factor in choosing them to provide these services. The Committee is also satisfied that the fees paid to Deloitte for non-audit work in 2022, which amounted to $1.6 million and represented c.7% of the total audit fees for the year, did not compromise their independence or objectivity. Details of the amounts paid to the external auditor during the year for audit and other services are set out in note 5 to the Consolidated Financial Statements on page 197 (see also Table 4). Internal Audit In December 2021, the Committee received and approved the Internal Audit Charter and audit plan for 2022. During the year, we received regular updates from the Head of Internal Audit on the delivery of the 2022 plan and on the principal findings from the work of Internal Audit and management’s responses thereto. External Quality Assessments of Internal Audit are conducted periodically to ensure that the Internal Audit function continues to work efficiently and effectively and in compliance with good practice standards. During 2022, the Committee also considered and approved the proposed Internal Audit strategy for the next five years, which included detailed consideration of the focus, structure and resources required by the Internal Audit function. The Head of Internal Audit has direct access to me as Chairman of the Audit Committee and the Committee meets with the Head of Internal Audit on a regular basis without the presence of management. Conclusion I would like to thank my fellow Committee members for their commitment and input to the work of the Committee during 2022. Looking ahead to 2023, the Committee will continue to focus on the key ongoing areas outlined in Table 3 on page 93, and will also continue to monitor and assess the potential impact of the principal and emerging risks and uncertainties (including climate change) on the Group's Consolidated Financial Statements. Shaun Kelly Chairman of Audit Committee 1 March 2023 Percentage of Audit and Non-audit Fees Table 4 ■ Audit fees ■ Non-audit fees 2020 99% 1% 2021 91% 9% 2022 93% 7%

Overview Strategy Report Business Performance & Segmental Reviews Governance Financial Statements Supplemental 20-F and Other Disclosures Shareholder Information 2022 Annual Report and Form 20-F96 Areas Identified for Focus during 2022 External Audit Process Table 5 Impairment of Goodwill For the purposes of its annual impairment testing process, the Group assesses the recoverable amount of each of CRH's cash-generating units (CGUs—see details in note 14 to the Consolidated Financial Statements) based on a value-in-use computation. The annual goodwill impairment testing was conducted by management, and papers outlining the methodology and assumptions used in, and the results of, that assessment were presented to the Committee. This included review of key judgement areas and assumptions such as CGU determination, discount rates, growth rates, alignment with the Group's carbon emissions reduction targets and the impact of the ongoing conflict in Ukraine on our Ukrainian business. Following its deliberations, the Committee was satisfied that the methodology used by management (which was consistent with prior years) and the results of the assessment, together with the disclosures in note 14, were appropriate. As outlined in note 14, no impairment charge was recorded in 2022 (2021: $nil). Contract Revenue Recognition IFRS 15 Revenue from Contracts with Customers requires revenue and expenses to be recognised on uncompleted contracts, with the underlying principle that, once the outcome of a long-term construction contract can be reliably estimated, revenue and expenses associated with that contract should be recognised by reference to the percentage of completion. If it is anticipated that the contract will be onerous (i.e. its unavoidable cost exceeds the economic benefit of the contract), a provision is created. Following discussion with management, recognising that the majority of contracts were completed within one year, the Committee was satisfied that the recognition of contract revenue (including the associated disclosures) was appropriate for the Group in 2022.

Overview Strategy Report Business Performance & Segmental Reviews Governance Financial Statements Supplemental 20-F and Other Disclosures Shareholder Information 2022 Annual Report and Form 20-F98 Nomination & Corporate Governance Committee Report Introduction The Nomination & Corporate Governance Committee consists of five non-executive Directors, considered by the Board to be independent. The biographical details of each member are set out on pages 82 to 84. The Chief Executive normally attends meetings of the Committee. This report to shareholders summarises the areas of focus for the Committee over the course of the last year, which were primarily: Board composition and renewal, including diversity; Board Committee composition and responsibilities; and executive Director succession planning. Board Composition, Renewal and Diversity The Board currently comprises two executive Directors and 10 non-executive Directors. Following considerable refreshment over the past number of years, four non-executive Directors have been appointed in the last three years, while six have between three and six years’ experience on the Board. As can be seen from the biographies of each Director on pages 82 to 84 and the Tables outlining the Board’s composition and competencies on pages 85 and 100, your Board is diverse in terms of skills and experience, age, gender and ethnicity. We consider the current size and composition of the Board to be within a range which is appropriate. The spread of nationalities of the Directors reflects the geographical reach of the Group and we consider that the Board as a whole has the appropriate blend of skills, knowledge and experience, from a wide range of industries, regions and backgrounds, necessary to lead the Group. A primary area of focus for Board renewal over the last year has been on identifying potential candidates who would further enhance the Board's experience in capital intensive industries of a scale and scope similar to CRH, and in meeting the challenges of, and unlocking the value from, the transition to a low-carbon environment, while also enhancing diversity on the Board. Gender diversity on the Board, which has recently fallen below the year end levels of 2019 and 2020 when more than 40% of the Board was composed of women, continues to be a core criterion when providing role specifications to external agents engaged to identify candidates for consideration by the Committee. The Board's policy on diversity in respect of director appointments is set out on page 99. Details of Board gender and ethnicity are set out on page 85. The Nomination & Corporate Governance Committee and the SESR Committee work collectively with management on the I&D agenda at below Board level across CRH and monitor progress against agreed Group objectives and targets such as the Board’s target of having a minimum of 33% of senior leaders being women by 2030. Details of the current gender balance across the Group, including of the senior leadership team and their direct reports, is set out on page 1. Board Committee Composition and Responsibilities The Board appointed Mary Rhinehart as Chairman of the SESR Committee during the year. Mary’s report on the operation of the SESR Committee is set out on pages 104 and 105. Other changes to committee composition during the year are set out in Table 6 on page 99. As outlined in the introduction to the Corporate Governance Report, the Board has extended the remit of the Nomination & Corporate Governance Committee to include oversight of CRH’s human capital management. In addition, responsibility for employee engagement has been transferred to the Nomination & Corporate Governance Committee from the SESR Committee with effect from January 2023. Richie Boucher Image placeholder "A primary area of focus for Board renewal over the last year was identifying potential candidates who would further enhance the Board's experience in capital intensive industries of a scale and scope similar to CRH, and in meeting the challenges of, and unlocking the value from, the transition to a low-carbon environment, while also enhancing diversity on the Board." Richie Boucher Nomination & Corporate Governance Committee Chairman Committee Members Richie Boucher (Chairman) Lamar McKay Gillian L. Platt Mary K. Rhinehart Siobhán Talbot Governance Appendix - Further Information Further general information in relation to the following governance-related topics is contained in the Governance Appendix: • the operation of the Nomination & Corporate Governance Committee • how the Board plans for succession • the criteria used to determine the independence of non-executive Directors • the tenure of non-executive Directors • the responsibilities delegated to the Committee by the Board

Overview Strategy Report Business Performance & Segmental Reviews Governance Financial Statements Supplemental 20-F and Other Disclosures Shareholder Information 2022 Annual Report and Form 20-F98 Summary of Committee Composition changes Table 6 Name Joined Ceased R. Fearon SESR L. McKay Audit Chairman In advance of the completion of my initial three-year term as Chairman at the 2023 AGM, the Senior Independent Director engaged with my colleagues on the Board, individually and collectively, to ascertain whether the Board wished me to continue in the role. The Senior Independent Director also chaired this Committee when it considered this issue. I am delighted to have been invited to serve for a further three years and have accepted, subject, of course, to my continued annual re-election to the Board by shareholders. Senior Independent Director During the year, following a recommendation from the Committee, the Board appointed Lamar McKay as Senior Independent Director in place of Gillian Platt who had held the position since 2018. The responsibilities of the Senior Independent Director are set out in the Governance Appendix. Executive Director Succession Planning A priority of the Board and the Committee over the past number of years has been enhancing our long-term succession planning for the executive Directors and this is typically an agenda item at each meeting of the Committee and most Board meetings. Whilst our Chief Executive, Albert Manifold, has a contract of employment currently until age 62 and no decisions have been taken in relation to the timing of succession for this role or potential candidates, the Committee has continued to support the Board in relation to the long-term process of planning for Chief Executive succession. Working in the context of a number of planning scenarios, development programmes for potential internal candidates, which are supported by Egon Zehnder1, are in place and external candidate pools are regularly reviewed. Emergency arrangements are also in place for unexpected events. Internal Board Evaluation The Senior Independent Director undertook an internal Board performance evaluation, which built upon the findings of the externally facilitated evaluation conducted in 2021. The process, which included consideration of Board dynamics, composition and diversity, the relationship between management and the Board and areas of focus from a non-executive Director perspective, involved a series of one to one meetings, with a report of the feedback being considered by the Board. A number of suggestions were included in the report, including in relation to board composition priorities, strategic topics for in depth review, succession planning, agenda structures and meeting pre-read materials. Corporate Governance The Committee is responsible for reviewing the independence of Board members and has recommended to the Board that all of the non-executive Directors be deemed to be independent. The Committee also monitors developments in best practice in relation to corporate governance and makes recommendations to the Board in relation to changes and enhancements to current procedures, where appropriate. Policy on Board Diversity We are committed to ensuring that the Board is sufficiently diverse and appropriately balanced. In its work in the area of Board renewal and succession planning, the Nomination & Corporate Governance Committee looks at the following four criteria when considering Director roles: • International business experience, particularly in the regions in which the Group operates or into which it intends to expand; • Skills, knowledge and expertise (including education or professional background) in areas relevant to the operation of the Board; • Diversity in all aspects, including nationality, gender, social and ethnic backgrounds, cognitive and personal strengths; and • The need for an appropriately sized Board During the ongoing process of Board renewal, each, or a combination, of these factors can take priority. To date, the Board has not set any policy regarding age. The ages of the Directors range from 51 to 69, which the Nomination & Corporate Governance Committee believes is appropriate at the current time. Non-executive Director Appointment Process • Non-executive Director recruitment processes are supported by an external recruitment agent • A skills matrix is maintained to identify particular skills that would enhance the Board or which might need to be replaced following planned Board retirements • Potential candidate lists are collated based on specifications agreed following input from the Nomination & Corporate Governance Committee • The Nomination & Corporate Governance Committee reviews candidate lists and selects individuals for interview • Once a preferred candidate is identified other members of the Board are invited to meet with them prior to formal consideration of their appointment to the Board Pre-emption Rights The Pre-emption Group in the UK published a revised statement of principles on the disapplication of pre-emption rights in November 2022, which increased the guideline threshold for annual pre-emption rights authorities from 10% to 20% of the issued share capital, with some additional flexibility for follow up offers of up to a maximum of an additional 4% in certain circumstances. Having considered the matter, the Committee recommended to the Board that it seek a pre-emption authority of up to a maximum of 10% of the issued share capital at the 2023 AGM, which is in line with the authorities received in prior years. The Committee will keep under review evolving best practice and shareholders' perspectives in this area. Further details on the authorities to be sought at the 2023 AGM are set out in the Directors' Report on page 137. Richie Boucher Chairman of the Nomination & Corporate Governance Committee 1 March 2023 1. Egon Zehnder provide executive recruitment and support services as and when requested. Otherwise, they do not have any connection with CRH or individual directors.
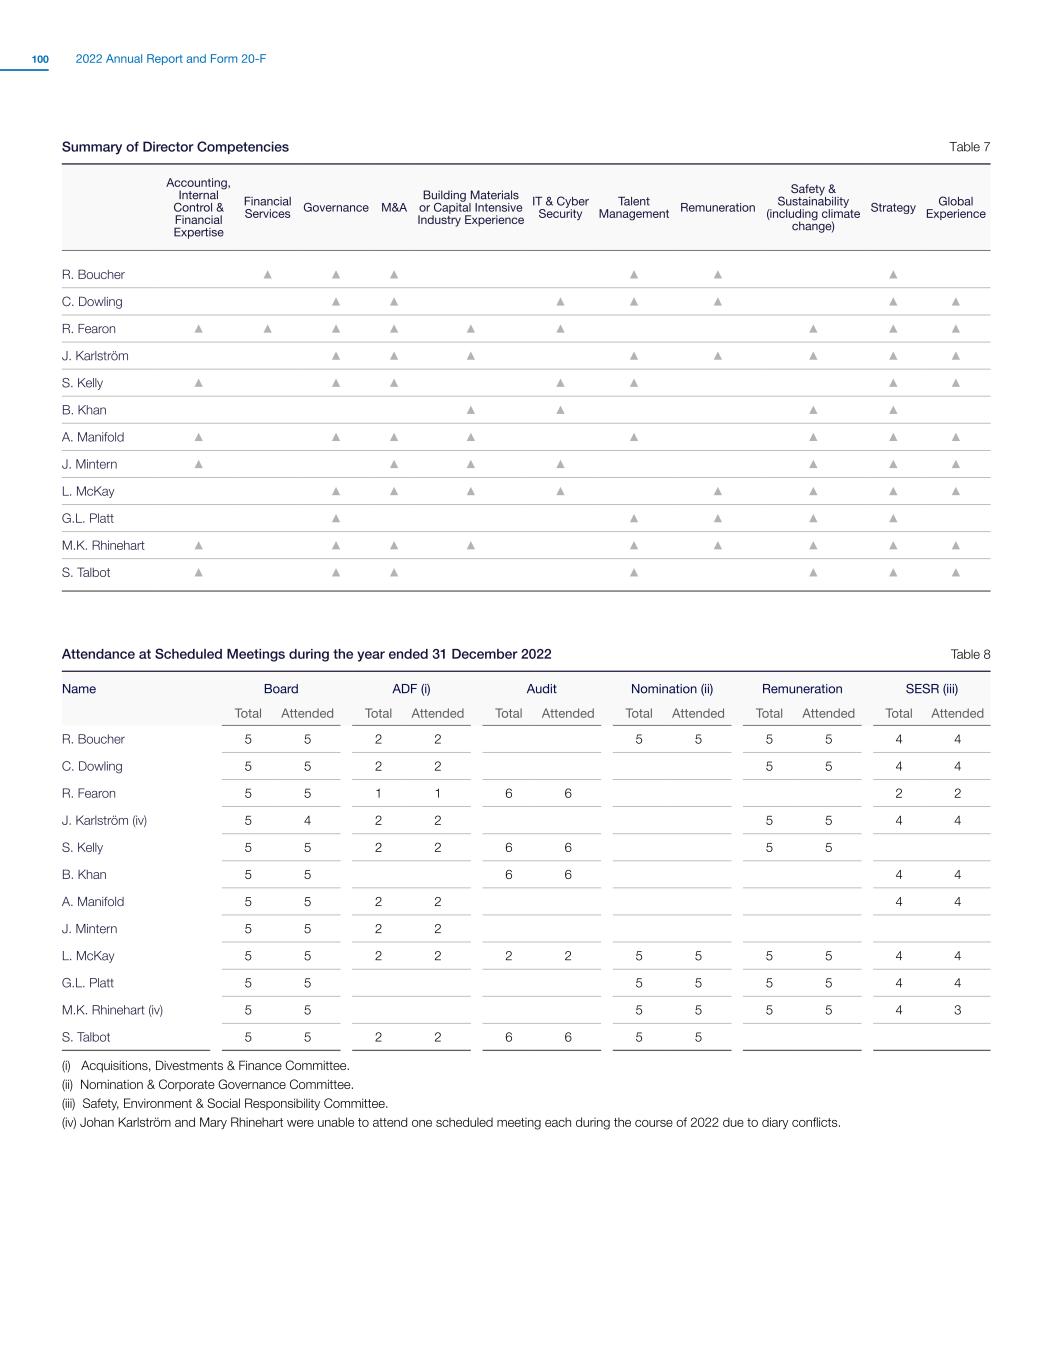
Overview Strategy Report Business Performance & Segmental Reviews Governance Financial Statements Supplemental 20-F and Other Disclosures Shareholder Information 2022 Annual Report and Form 20-F100 Summary of Director Competencies Table 7 Accounting, Internal Control & Financial Expertise Financial Services Governance M&A Building Materials or Capital Intensive Industry Experience IT & Cyber Security Talent Management Remuneration Safety & Sustainability (including climate change) Strategy Global Experience R. Boucher ▲ ▲ ▲ ▲ ▲ ▲ C. Dowling ▲ ▲ ▲ ▲ ▲ ▲ ▲ R. Fearon ▲ ▲ ▲ ▲ ▲ ▲ ▲ ▲ ▲ J. Karlström ▲ ▲ ▲ ▲ ▲ ▲ ▲ ▲ S. Kelly ▲ ▲ ▲ ▲ ▲ ▲ ▲ B. Khan ▲ ▲ ▲ ▲ A. Manifold ▲ ▲ ▲ ▲ ▲ ▲ ▲ ▲ J. Mintern ▲ ▲ ▲ ▲ ▲ ▲ ▲ L. McKay ▲ ▲ ▲ ▲ ▲ ▲ ▲ ▲ G.L. Platt ▲ ▲ ▲ ▲ ▲ M.K. Rhinehart ▲ ▲ ▲ ▲ ▲ ▲ ▲ ▲ ▲ S. Talbot ▲ ▲ ▲ ▲ ▲ ▲ ▲ Attendance at Scheduled Meetings during the year ended 31 December 2022 Table 8 Name Board ADF (i) Audit Nomination (ii) Remuneration SESR (iii) Total Attended Total Attended Total Attended Total Attended Total Attended Total Attended R. Boucher 5 5 2 2 5 5 5 5 4 4 C. Dowling 5 5 2 2 5 5 4 4 R. Fearon 5 5 1 1 6 6 2 2 J. Karlström (iv) 5 4 2 2 5 5 4 4 S. Kelly 5 5 2 2 6 6 5 5 B. Khan 5 5 6 6 4 4 A. Manifold 5 5 2 2 4 4 J. Mintern 5 5 2 2 L. McKay 5 5 2 2 2 2 5 5 5 5 4 4 G.L. Platt 5 5 5 5 5 5 4 4 M.K. Rhinehart (iv) 5 5 5 5 5 5 4 3 S. Talbot 5 5 2 2 6 6 5 5 (i) Acquisitions, Divestments & Finance Committee. (ii) Nomination & Corporate Governance Committee. (iii) Safety, Environment & Social Responsibility Committee. (iv) Johan Karlström and Mary Rhinehart were unable to attend one scheduled meeting each during the course of 2022 due to diary conflicts.

Overview Strategy Report Business Performance & Segmental Reviews Governance Financial Statements Supplemental 20-F and Other Disclosures Shareholder Information 2022 Annual Report and Form 20-F100 Substantial Holdings Table 9 As at 31 December 2022, the Company had received notification of the interests outlined in the table below in its Ordinary Share capital, which were equal to, or in excess of, 3%. 31 December 2022 31 December 2021 31 December 2020 Name Holding/Voting Rights % at year end Holding/Voting Rights % at year end Holding/ Voting Rights % at year end BlackRock, Inc. (i) 59,927,029 8.05 56,891,415 7.38 59,047,330 7.52 Cevian Capital II GP Limited 30,545,474 4.10 27,534,705 3.57 27,534,705 3.51 UBS AG 26,380,604 3.34 26,380,604 3.34 26,380,604 3.34 (i) BlackRock, Inc. has advised that its interests in CRH shares arise by reason of discretionary investment management arrangements entered into by it or its subsidiaries. Substantial Holdings The Company is not owned or controlled directly or indirectly by any government or by any corporation or by any other natural or legal person severally or jointly. The major shareholders do not have any special voting rights. Details of the substantial holdings as at 31 December 2022 are provided in Table 9. Stock Exchange Listings CRH, which is incorporated in Ireland and subject to Irish company law, has a premium listing on the London Stock Exchange (LSE), a secondary listing on Euronext Dublin (formerly the Irish Stock Exchange) and its American Depositary Shares are listed on the New York Stock Exchange (NYSE). Legal and Compliance CRH's Legal and Compliance function supports the Group in operating consistently with its values, providing advice and guidance to executive and operational management and working closely with them on a range of matters including establishing policies and procedures, providing compliance training and communications, providing legal advice on compliance and business issues, monitoring and investigating Hotline calls, competition/antitrust law, and ensuring the Group is informed of any changes to regulation and/or reporting requirements. CRH’s Legal and Compliance structure comprises experienced and qualified professionals. Operating companies exercise local Legal and Compliance oversight, and management ensures adequate resources are in place. Code of Business Conduct Our culture as a company is built on our commitment to uphold the CRH Values. At CRH, our values unite us in the way we work, every day, all over the world. They are the foundation of our culture — they show what’s important to us and are central to our success as a company. At CRH, we do the right things in the right way, with respect for one another and for the law. This has always been our approach and as we continually reshape and improve our business, the one thing that will never change is our character – that combination of integrity, honesty and dependability that is a real strength of CRH. The foundation of the Legal and Compliance programme is the Code of Business Conduct (CoBC) and supporting policies, which set out our standards of legal, honest and ethical behaviour. The CoBC complies with the applicable code of ethics regulations of the SEC arising from the Sarbanes-Oxley Act. The CoBC is applicable to all employees of the CRH Group, including the Chief Executive, our Global Leadership Team and senior financial officers. A refreshed CoBC and an enhanced training module was launched during 2021 and in 2022 both the CoBC and the training module were further updated to reflect the Group's refreshed values. CRH's Internal Audit function works side-by-side with Legal and Compliance in monitoring compliance with the CoBC and supporting policies, and in providing an integrated approach to assurance. This cross-functional collaboration supports CRH's goal: to ensure CRH leads with integrity. Awareness and Training In line with our commitment to maintain high ethical business conduct standards, we continue to update and improve awareness and training efforts on an ongoing basis. All new employees are provided with the CoBC and relevant employees undertake CoBC training and Advanced Compliance Training on a regular basis. Additional training modules are developed for more focused topics and audiences where necessary. CRH Hotline In 2022, CRH launched a Speak Up Policy which is available on www.crh.com in 22 languages. To provide guidance to reporters on our Speak Up channels and processes, Speak Up FAQs are also available to all employees in 22 languages. CRH engages an external service provider to administer an independent 24/7 multi-lingual confidential “Hotline” facility that allows reporters to make an anonymous report, if they wish. CRH is committed to supporting all persons, including current and potential employees, customers, independent contractors, suppliers and/or other external stakeholders to raise good faith concerns that may be relevant to the CoBC, inappropriate or illegal behaviour or violations of any CRH policies or local laws. Our Speak Up Policy outlines CRH’s commitment to providing various ways to speak up, handling those reports appropriately and confidentially and treating all reporters with fairness and respect to ensure they are comfortable when speaking up. All concerns are handled discreetly and are professionally investigated with appropriate actions taken based on investigation findings. CRH is committed to creating an atmosphere where employees feel empowered and feel comfortable to speak up when they have good faith concerns. The Policy also affirms our zero-tolerance approach to retaliation or any form of penalisation for Speaking Up. Communications with Shareholders Communications with shareholders are given high priority and the Group devotes considerable time and resources each year to shareholder engagement. We recognise the importance of effective dialogue as an integral element of good corporate governance. The Investor Relations team, together with the Chief Executive, Chief Financial Officer and other senior executives, regularly meet with institutional shareholders (each year covering over 60% of the shareholder base). Detailed reports on the issues covered in those meetings and the views of shareholders are circulated to the Board after each group of meetings. Table 11 on page 102 provides a brief outline of the nature of the activities undertaken by our Investor Relations team. In addition to the above, major acquisitions and disposals are notified to the Stock Exchanges in accordance with the requirements of the Listing Rules and development updates, giving details of other acquisitions or disposals completed and major capital expenditure projects, are issued periodically. During 2022, the Chairman, Remuneration Committee Chairman and Company Secretary again participated in a number of meetings with some of the Group’s major shareholders in advance of the 2022 AGM and as part of the Group's ongoing engagement processes. We respond throughout the year to correspondence from shareholders on a wide range of issues.
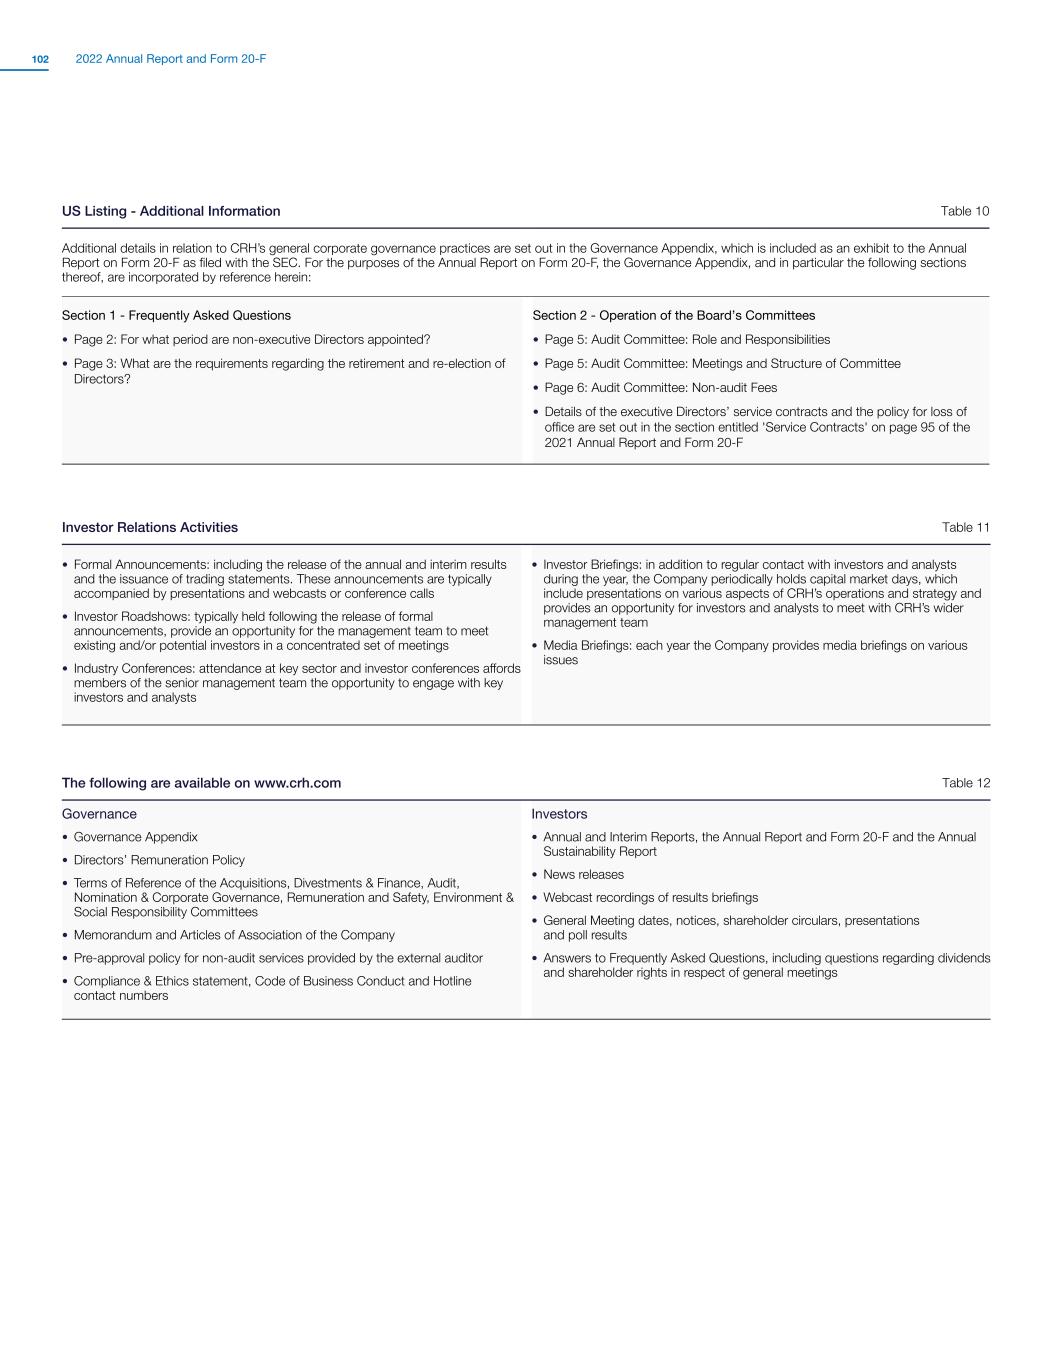
Overview Strategy Report Business Performance & Segmental Reviews Governance Financial Statements Supplemental 20-F and Other Disclosures Shareholder Information 2022 Annual Report and Form 20-F102 US Listing - Additional Information Table 10 Additional details in relation to CRH’s general corporate governance practices are set out in the Governance Appendix, which is included as an exhibit to the Annual Report on Form 20-F as filed with the SEC. For the purposes of the Annual Report on Form 20-F, the Governance Appendix, and in particular the following sections thereof, are incorporated by reference herein: Section 1 - Frequently Asked Questions • Page 2: For what period are non-executive Directors appointed? • Page 3: What are the requirements regarding the retirement and re-election of Directors? Section 2 - Operation of the Board’s Committees • Page 5: Audit Committee: Role and Responsibilities • Page 5: Audit Committee: Meetings and Structure of Committee • Page 6: Audit Committee: Non-audit Fees • Details of the executive Directors’ service contracts and the policy for loss of office are set out in the section entitled 'Service Contracts' on page 95 of the 2021 Annual Report and Form 20-F Investor Relations Activities Table 11 • Formal Announcements: including the release of the annual and interim results and the issuance of trading statements. These announcements are typically accompanied by presentations and webcasts or conference calls • Investor Roadshows: typically held following the release of formal announcements, provide an opportunity for the management team to meet existing and/or potential investors in a concentrated set of meetings • Industry Conferences: attendance at key sector and investor conferences affords members of the senior management team the opportunity to engage with key investors and analysts • Investor Briefings: in addition to regular contact with investors and analysts during the year, the Company periodically holds capital market days, which include presentations on various aspects of CRH’s operations and strategy and provides an opportunity for investors and analysts to meet with CRH’s wider management team • Media Briefings: each year the Company provides media briefings on various issues The following are available on www.crh.com Table 12 Governance Investors • Governance Appendix • Directors’ Remuneration Policy • Terms of Reference of the Acquisitions, Divestments & Finance, Audit, Nomination & Corporate Governance, Remuneration and Safety, Environment & Social Responsibility Committees • Memorandum and Articles of Association of the Company • Pre-approval policy for non-audit services provided by the external auditor • Compliance & Ethics statement, Code of Business Conduct and Hotline contact numbers • Annual and Interim Reports, the Annual Report and Form 20-F and the Annual Sustainability Report • News releases • Webcast recordings of results briefings • General Meeting dates, notices, shareholder circulars, presentations and poll results • Answers to Frequently Asked Questions, including questions regarding dividends and shareholder rights in respect of general meetings

Overview Strategy Report Business Performance & Segmental Reviews Governance Financial Statements Supplemental 20-F and Other Disclosures Shareholder Information 2022 Annual Report and Form 20-F102
Overview Strategy Report Business Performance & Segmental Reviews Governance Financial Statements Supplemental 20-F and Other Disclosures Shareholder Information 2022 Annual Report and Form 20-F104 Safety, Environment & Social Responsibility Committee Report Introduction The SESR Committee currently consists of nine Directors, including the Chief Executive. The biographical details of each Committee member are set out on pages 82 to 84. The Chief Operating Officer, whose remit includes responsibility for sustainability, typically attends meetings. Other executives attend as required. During the past 12 months, the Committee received updates at each meeting on topics such as Safety, Purpose, I&D and employee engagement, monitored progress against the Group’s ambitious 2030 sustainability targets and, together with the Board, considered CRH’s decarbonisation roadmap in depth. The Committee also received reports on environmental, health & safety and social reviews, climate lobbying practices, hotline reports on issues that fall within the Committee’s remit, the roll-out of the refreshed Code of Business Conduct and related training, and developments in relation to external reporting requirements. Safety Health, safety and well-being, and managing health and safety risks within our businesses, is our top priority in terms of our employees, contractors and customers. We are committed to going beyond industry-minimum requirements to create an empowering safety culture. Our ambition is to have a culture of safety and wellness working towards zero harm, with a target of zero fatalities in any year. As the Chairman mentioned in the introduction to the Annual Report, there were five reportable fatalities in 2022 involving one employee and four contractors. The Board received detailed reports on the background circumstances of these incidents. The Committee also received follow-up reports on the investigations into the root causes in each case. We are satisfied that none of the incidents were attributable to a lack of applicable training, deficient safety procedures or defective equipment being used. Furthermore, through detailed analysis and discussion of a range of measures, as well as through engagement with employees, we are satisfied that the appropriate safety culture is in place across the Group and that employees are, for example, comfortable to stop a work process if they believe unsafe practices are being employed. Nevertheless, management considers on an ongoing basis whether learnings or enhancements are possible, particularly in challenging areas such as road logistics and specialist contractors working from heights. The Committee advised the Remuneration Committee that it did not consider that there were any issues arising from its safety reviews that would require an override of remuneration incentive outcomes in 2022. We also receive regular reports in relation to trends in leading and lagging safety indicators. Leading indicators relate to reporting of serious safety incidents, safety audits and safety culture assessments. In addition, learnings from serious injury and fatal incidents are shared across the Group as soon as possible. Purpose Good progress has been made in sharing our newly articulated Purpose to all employees following its launch in 2022, and we will monitor the plans to embed our Purpose into all company processes. Further details in relation to CRH's Purpose are set out on pages 6 and 7. Inclusion & Diversity The Committee monitors the implementation of CRH's I&D strategy, including the roll-out of related initiatives such as the content of, and feedback from, a programme put in place for senior leaders across the organisation to provide them with tools to meet common I&D challenges, and the progress being made in relation to our 2030 targets. Employee Engagement As mentioned earlier in the Corporate Governance section, with effect from January 2023, the Nomination & Corporate Governance Committee has assumed responsibility for employee engagement. An update on employee engagement during 2022 is set out on page 88. Mary K. Rhinehart "During the past 12 months, the Committee received updates at each meeting on topics such as Safety, Purpose, I&D and employee engagement, monitored progress against the Group’s ambitious 2030 sustainability targets and, together with the Board, considered CRH’s decarbonisation roadmap in depth." Mary K. Rhinehart Chairman of the Safety, Environment & Social Responsibility Committee Committee Members Mary K. Rhinehart (Chairman) Richie Boucher Caroline Dowling Rick Fearon Johan Karlström Badar Khan Albert Manifold Lamar McKay Gillian L. Platt Governance Appendix - Further Information Further general information in relation to the following topics is contained in the Governance Appendix: • the operation of the Safety, Environment & Social Responsibility Committee • the responsibilities delegated to the Committee by the Board

Overview Strategy Report Business Performance & Segmental Reviews Governance Financial Statements Supplemental 20-F and Other Disclosures Shareholder Information 2022 Annual Report and Form 20-F104 Examples of Best Practice Initiatives Safety Automatic Fire Protection System for Mobile Equipment Summary • We are committed to implementing the systems and processes necessary to create a culture of safety excellence • For example, Romcim, part of our Europe Materials Division in Romania, implemented an automatic fire protection system for mobile equipment at their Hoghiz location Outcome • The detection and suppression system prevents injuries and damages that could arise from potentially hard to detect and intense engine fires. Preventative action like this will reduce risks for employees at the Hoghiz plant and help to ensure they are able to complete their work safely Inclusion & Diversity Inclusive Leadership Development Programme Summary • More than 250 senior leaders (including the Global Leadership Team) across CRH participated in the programme • It took place virtually over six months and was made up of three modules and three peer coaching sessions totalling 14 hours • The programme aimed to create lasting and sustainable change, developing inclusive leadership skills and habits • Participants also came away with a toolkit of nine practical tools that can be applied in day-to-day interactions and processes Outcome • Significant investment of leader's time, helping to develop their capability to build and lead a more inclusive organisation Contributing to a more Circular Economy Innovative Products & Solutions Summary • Our ambition is to deliver innovative products and solutions to drive progress towards a circular, net-zero built environment • CRH’s structural concrete business in Belgium, part of our Europe Materials Division, is collaborating with a Belgian start-up to establish a project involving the reuse of building insulation products • As part of this collaboration, CRH’s structural concrete business in Belgium is supplying recycled materials which are then converted into innovative insulation products Outcome • By continuously investing in sustainable solutions, we are driving toward our goal of 50% revenue coming from products with enhanced sustainability attributes by 2025 and contributing to a more circular economy Climate Change and Sustainability As reported last year, our 2030 absolute carbon emissions reduction target was put in place as part of our ambition to be a net-zero business by 2050 in accordance with the Paris Agreement. In early 2023, the SBTi validated that our revised targets1 are in line with the updated 1.5oC science-based framework which now equate to a 30% reduction in absolute carbon emissions by 2030 (on a 2021 base year). It will take some time for the many initiatives in areas such as low-carbon products, business optimisation, low-carbon fuels, transport and mobile equipment, clean electricity, new technologies etc. to take effect. To support delivery of our 2030 roadmap, we expect to invest approximately $150 million per annum in incremental capital expenditure. In addition, we have put in place a $250 million venturing and innovation fund referred to on page 30. This work is supported by our target for our cement plants to reduce cement specific net CO2 emissions per tonne of cementitious product to 520kg by 2025 (accelerated from 2030). For more information on our decarbonisation journey, please see pages 26 to 31. As a large scale landholder, we have a responsibility to continue to preserve and protect biodiversity. A core part of our Environmental Policy is to “Support and enhance biodiversity, ensuring responsible land use and biodiversity management”. CRH operates at approximately 1,200 quarries/pits covering c.130,000 hectares and has a responsibility to enhance and restore natural habitats while mitigating potential negative impacts. CRH adheres to all relevant biodiversity legislation at each operating location and engages in collaborative initiatives to enhance biodiversity. During the year we received and considered updates on progress in relation to the achievement of our 2030 target and the work in developing CRH’s biodiversity framework. For more information on our biodiversity policies and targets, please see pages 36 and 37. In order to play our part in driving positive change, CRH works with regulators to establish improved legislative frameworks and industry standards for a net-zero built environment and the Committee receives regular updates on our climate lobbying practices. During the course of the next year, we will continue to focus on CRH’s initiatives and achievement against our 2030 sustainability targets. Incorporating ESG Metrics in CRH's Remuneration Incentive Structures The Remuneration Committee has incorporated sustainability and I&D metrics into CRH’s incentive structures. Further details are set out on page 110. Regulatory Environment In 2021, CRH introduced new and enhanced disclosures in relation to both the TCFD and the EU Taxonomy Regulations. The TCFD framework requires disclosure on climate-related governance, strategy, risk management, as well as metrics and targets. CRH previously used the TCFD framework on a voluntary basis, and in line with our commitment to transparency, our disclosures are now consistent with TCFD recommendations and recommended disclosures. EU Taxonomy, which is an EU regulatory classification system that defines environmentally sustainable activities by providing “technical screening criteria” thresholds for activities to be reported as 'sustainable', requires CRH to disclose the percentage of activities that are taxonomy-eligible. TCFD related disclosures in respect of 2022 have been further enhanced and are set out on pages 56 to 59. Mary K. Rhinehart Chairman of the Safety, Environment & Social Responsibility Committee 1 March 2023 1. Refer to page 27 for further detail on our decarbonisation targets.

Overview Strategy Report Business Performance & Segmental Reviews Governance Financial Statements Supplemental 20-F and Other Disclosures Shareholder Information 2022 Annual Report and Form 20-F106 TCFD – Sustainability Governance Table 13 provides a high-level summary of the Board’s oversight of climate-related risks and opportunities during 2022. Further information is also included in the Governance Report on page 89 and in the SESR Committee Report on page 105. Further details in relation to the role and responsibilities of the Board and its Committees are set out in the Governance Report on pages 88 to 132. Management Responsibility The Chief Executive is responsible for the operational and profit performance of the Group and is accountable to the Board for all authority delegated to executive management. The Chief Executive executes strategy agreed with the Board and regularly reports to the Board on the progress and performance of the Group, including in relation to climate-related matters. The Chief Executive is supported by the Global Leadership Team, which is responsible for implementing strategy, pursuing performance delivery and progressing the Group’s sustainability and climate-related agenda. Responsibility for formulating and executing our climate strategy sits with the Chief Operating Officer. The Global Leadership Team receives support from various executive-level committees and other working groups and functions on sustainability and climate-related issues. For more information on the Group's organisation structure, including how responsibilities feed through each level, please see our Risk Governance Framework on page 94. Board and Committees Activities during 2022 Table 13 Climate-related Roles & Responsibilities Principal Actions during 2022 Board Ultimate responsibility for all risks, including climate-related risks and opportunities, and the delivery of our environmental targets • Put in place an industry leading-target of a 25% reduction in absolute group-wide carbon emissions by 2030. In early 2023, the SBTi validated that our revised targets1 are in line with the updated 1.5°C science-based framework which now equate to a 30% reduction in absolute carbon emissions by 2030 (from a 2021 base year) • A $250 million venturing and innovation fund was put in place to identify new technologies and business models, and to foster innovation across the organisation • Considered and approved the Group’s Risk Appetite & Tolerance Framework ADF Committee Reviewing the strategic rationale and impact of proposed acquisitions, disposals and large capital expenditure projects • Considered and approved a number of acquisitions and divestments, which further enhance our integrated sustainable solutions strategy Audit Committee Monitoring and assessing the Group's risk management processes (including climate risk) and internal control systems across the Group • Received and considered regular updates on the Group’s principal and emerging risks and uncertainties, including those that could threaten its business model, future performance, solvency or liquidity. This included detailed discussion on the impact of climate-related risks on the Group’s accounting judgements, disclosures, processes and financial statements Nomination & Corporate Governance Committee Monitoring the Board's structure, size, composition and balance of skills to ensure that the Board can meet its strategic objectives and regulatory responsibilities • Actively reviewed and monitored the structure, size, composition and balance of skills on the Board Remuneration Committee Designing incentive structures which support the achievement of the key strategic priorities such as our climate and sustainability objectives • Following consultation with shareholders, considered and finalised appropriate ESG-related targets for inclusion in the Group’s Performance Share Plan. This included a specific component related to decarbonisation SESR Committee Monitoring developments related to sustainability, including climate, and providing strategic direction, oversight and support to the Board • Received and considered updates on the Group’s sustainability and climate-related targets, actions and performance Board Oversight Sustainability, including addressing the impact of climate change, is embedded in the Group’s strategy and business model. The Board recognises the importance of decarbonisation in addressing the challenges of climate change and believes that the Group’s integrated strategy of value-added products and innovative solutions have a key role to play in delivering a more resilient and sustainable built environment. Climate change and sustainability are frequent discussion topics at Board and Board Committee meetings, with the Board and its Committees discussing various aspects of the Group’s climate strategy, the linkage between the Group’s remuneration policies and practices and the Group’s sustainability (and climate-related) objectives, stakeholder expectations, the regulatory environment and CRH’s carbon emissions reduction targets at the majority of meetings during 2022. In addition, climate change and sustainability-related matters form an integral part of discussions on the Group’s strategy and business model, capital allocation and risk management. The SESR Committee, to which the Board has delegated primary responsibility for monitoring developments related to sustainability, including climate, and providing strategic direction, oversight and support to the Board on these important topics, meets every quarter. The Board monitors and oversees progress against climate-related targets and goals through detailed reports of discussions and recommendations which are presented to it by the SESR Committee following the conclusion of each meeting. 1. Refer to page 27 for further detail on our decarbonisation targets.

Overview Strategy Report Business Performance & Segmental Reviews Governance Financial Statements Supplemental 20-F and Other Disclosures Shareholder Information 2022 Annual Report and Form 20-F106 Board and Committees Activities during 2022 Table 13 Climate-related Roles & Responsibilities Principal Actions during 2022 Board Ultimate responsibility for all risks, including climate-related risks and opportunities, and the delivery of our environmental targets • Put in place an industry leading-target of a 25% reduction in absolute group-wide carbon emissions by 2030. In early 2023, the SBTi validated that our revised targets1 are in line with the updated 1.5°C science-based framework which now equate to a 30% reduction in absolute carbon emissions by 2030 (from a 2021 base year) • A $250 million venturing and innovation fund was put in place to identify new technologies and business models, and to foster innovation across the organisation • Considered and approved the Group’s Risk Appetite & Tolerance Framework ADF Committee Reviewing the strategic rationale and impact of proposed acquisitions, disposals and large capital expenditure projects • Considered and approved a number of acquisitions and divestments, which further enhance our integrated sustainable solutions strategy Audit Committee Monitoring and assessing the Group's risk management processes (including climate risk) and internal control systems across the Group • Received and considered regular updates on the Group’s principal and emerging risks and uncertainties, including those that could threaten its business model, future performance, solvency or liquidity. This included detailed discussion on the impact of climate-related risks on the Group’s accounting judgements, disclosures, processes and financial statements Nomination & Corporate Governance Committee Monitoring the Board's structure, size, composition and balance of skills to ensure that the Board can meet its strategic objectives and regulatory responsibilities • Actively reviewed and monitored the structure, size, composition and balance of skills on the Board Remuneration Committee Designing incentive structures which support the achievement of the key strategic priorities such as our climate and sustainability objectives • Following consultation with shareholders, considered and finalised appropriate ESG-related targets for inclusion in the Group’s Performance Share Plan. This included a specific component related to decarbonisation SESR Committee Monitoring developments related to sustainability, including climate, and providing strategic direction, oversight and support to the Board • Received and considered updates on the Group’s sustainability and climate-related targets, actions and performance
Overview Strategy Report Business Performance & Segmental Reviews Governance Financial Statements Supplemental 20-F and Other Disclosures Shareholder Information 2022 Annual Report and Form 20-F108 Directors’ Remuneration Report Lamar McKay "Despite a challenging and volatile cost environment in both North America and Europe, CRH delivered another strong result in 2022, with increased sales, profits and margins driven by the continued execution of our integrated and sustainable solutions strategy." Lamar McKay, Chairman of the Remuneration Committee Committee Members Lamar McKay (Chairman) Richie Boucher Caroline Dowling Johan Karlström Shaun Kelly Gillian L. Platt Mary K. Rhinehart Governance Appendix - Further Information Further general information in relation to the following topics is contained in the Governance Appendix: • the operation of the Remuneration Committee • the responsibilities delegated to the Committee by the Board Introduction I am delighted to introduce, on behalf of my colleagues on the Remuneration Committee and on the Board, the Remuneration Report to shareholders, which is split into three sections: this introductory overview, a summary of the remuneration policy updated and approved by shareholders in 2022, and the Annual Report on Remuneration, which contains details of CRH's remuneration arrangements and includes various legislative, regulatory and best practice disclosures. Context and Performance in 2022 Despite a challenging and volatile cost environment in both North America and Europe, CRH delivered another strong result in 2022, with increased sales, profits and margins driven by the continued execution of our integrated and sustainable solutions strategy. The dividend for 2022 was increased by 5% and we continued our buyback programme returning $1.2 billion to shareholders, which brings the total returned to shareholders through the share buyback programme to over $4.1 billion. The Group’s disciplined approach to capital allocation provides further opportunities for value creation. Remuneration Policy I would like to thank shareholders for their strong support of CRH’s updated remuneration policy at the 2022 AGM. The updated policy provided for the enhancement of our long-term incentive scorecard by incorporating important metrics related to sustainability and our people, while retaining the broad structure of the previous policies which have served the Company well. A summary of the updated policy is set out on pages 113 to 118. We believe that our remuneration structures are fully aligned with and support CRH’s strategic priorities, our Purpose to reinvent the way that the world is built and our core values that people are our priority, character is our strength, performance is our commitment and innovation is our way forward. The alignment with strategy is summarised in Table 17 on page 110. Further details on our Purpose and our values are contained on pages 6 and 7. Executive Directors' Remuneration Base Salary As reported in last year’s Remuneration Report, the Committee approved salary increases of 2.75% for the executive Directors in respect of 2022. This was in line with the increases for the wider workforce in Ireland and the UK. Increases in salary for employees across the Group in 2023 will depend on a range of factors specific to a region or business. In Ireland increases will generally be 4.25%, while increases in the UK will be c.4.5%. For the executive Directors, salary increases have been set at a lower level of 3.5%. Pension Entitlements In line with the planned phased reduction, the contractual pension entitlements of our Chief Executive, Albert Manifold, ceased in full in August 2022 when he reached aged 60. As previously advised, the Chief Financial Officer’s pension contribution is aligned with the rate which is available to the wider workforce in Ireland and the UK. 2022 Annual Bonus Plan Reflecting the strong performance in 2022, the financial metrics for the annual bonus plan, which accounted for 80% of the overall opportunity were achieved in full. The Committee also assessed the performance of the Chief Executive and Chief Financial Officer against their personal and strategic objectives (which represent 20% of the overall opportunity), which the Committee concluded were met to the fullest extent possible. However, notwithstanding the outperformance during the year, in the context of the uncertain economic climate and backdrop of high inflation and rising costs, both management and the Committee judged that it would be appropriate to cap the bonus outcome at 85% of maximum.
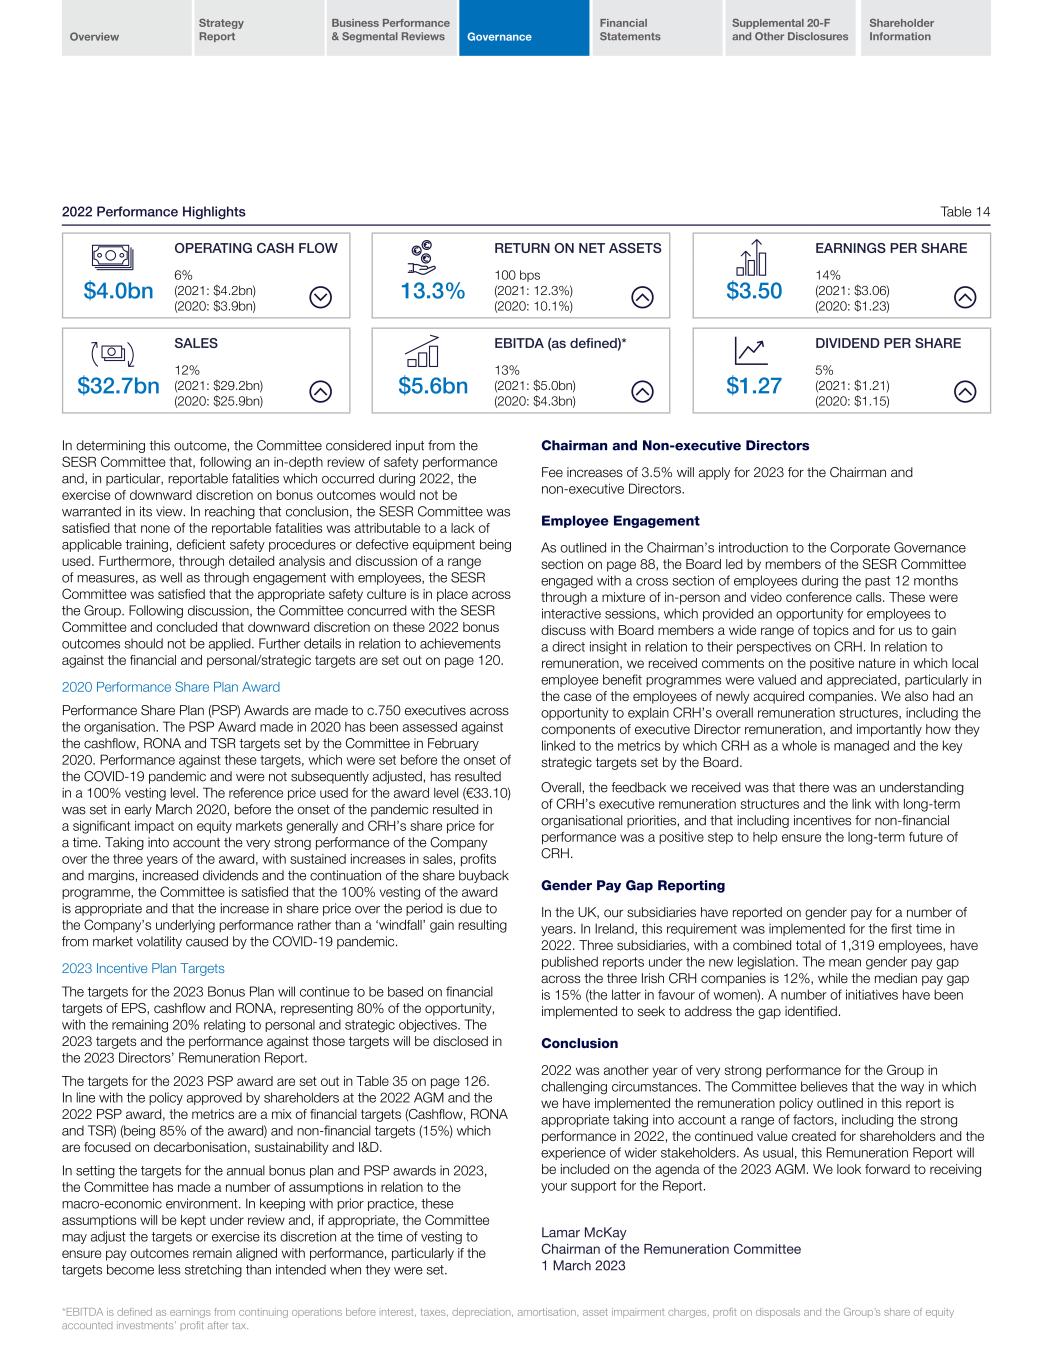
Overview Strategy Report Business Performance & Segmental Reviews Governance Financial Statements Supplemental 20-F and Other Disclosures Shareholder Information 2022 Annual Report and Form 20-F108 2022 Performance Highlights Table 14 OPERATING CASH FLOW RETURN ON NET ASSETS EARNINGS PER SHARE $4.0bn 6% (2021: $4.2bn) (2020: $3.9bn) 13.3% 100 bps (2021: 12.3%) (2020: 10.1%) $3.50 14% (2021: $3.06) (2020: $1.23) SALES EBITDA (as defined)* DIVIDEND PER SHARE $32.7bn 12% (2021: $29.2bn) (2020: $25.9bn) $5.6bn 13% (2021: $5.0bn) (2020: $4.3bn) $1.27 5% (2021: $1.21) (2020: $1.15) In determining this outcome, the Committee considered input from the SESR Committee that, following an in-depth review of safety performance and, in particular, reportable fatalities which occurred during 2022, the exercise of downward discretion on bonus outcomes would not be warranted in its view. In reaching that conclusion, the SESR Committee was satisfied that none of the reportable fatalities was attributable to a lack of applicable training, deficient safety procedures or defective equipment being used. Furthermore, through detailed analysis and discussion of a range of measures, as well as through engagement with employees, the SESR Committee was satisfied that the appropriate safety culture is in place across the Group. Following discussion, the Committee concurred with the SESR Committee and concluded that downward discretion on these 2022 bonus outcomes should not be applied. Further details in relation to achievements against the financial and personal/strategic targets are set out on page 120. 2020 Performance Share Plan Award Performance Share Plan (PSP) Awards are made to c.750 executives across the organisation. The PSP Award made in 2020 has been assessed against the cashflow, RONA and TSR targets set by the Committee in February 2020. Performance against these targets, which were set before the onset of the COVID-19 pandemic and were not subsequently adjusted, has resulted in a 100% vesting level. The reference price used for the award level (€33.10) was set in early March 2020, before the onset of the pandemic resulted in a significant impact on equity markets generally and CRH’s share price for a time. Taking into account the very strong performance of the Company over the three years of the award, with sustained increases in sales, profits and margins, increased dividends and the continuation of the share buyback programme, the Committee is satisfied that the 100% vesting of the award is appropriate and that the increase in share price over the period is due to the Company’s underlying performance rather than a ‘windfall’ gain resulting from market volatility caused by the COVID-19 pandemic. 2023 Incentive Plan Targets The targets for the 2023 Bonus Plan will continue to be based on financial targets of EPS, cashflow and RONA, representing 80% of the opportunity, with the remaining 20% relating to personal and strategic objectives. The 2023 targets and the performance against those targets will be disclosed in the 2023 Directors’ Remuneration Report. The targets for the 2023 PSP award are set out in Table 35 on page 126. In line with the policy approved by shareholders at the 2022 AGM and the 2022 PSP award, the metrics are a mix of financial targets (Cashflow, RONA and TSR) (being 85% of the award) and non-financial targets (15%) which are focused on decarbonisation, sustainability and I&D. In setting the targets for the annual bonus plan and PSP awards in 2023, the Committee has made a number of assumptions in relation to the macro-economic environment. In keeping with prior practice, these assumptions will be kept under review and, if appropriate, the Committee may adjust the targets or exercise its discretion at the time of vesting to ensure pay outcomes remain aligned with performance, particularly if the targets become less stretching than intended when they were set. Chairman and Non-executive Directors Fee increases of 3.5% will apply for 2023 for the Chairman and non-executive Directors. Employee Engagement As outlined in the Chairman’s introduction to the Corporate Governance section on page 88, the Board led by members of the SESR Committee engaged with a cross section of employees during the past 12 months through a mixture of in-person and video conference calls. These were interactive sessions, which provided an opportunity for employees to discuss with Board members a wide range of topics and for us to gain a direct insight in relation to their perspectives on CRH. In relation to remuneration, we received comments on the positive nature in which local employee benefit programmes were valued and appreciated, particularly in the case of the employees of newly acquired companies. We also had an opportunity to explain CRH’s overall remuneration structures, including the components of executive Director remuneration, and importantly how they linked to the metrics by which CRH as a whole is managed and the key strategic targets set by the Board. Overall, the feedback we received was that there was an understanding of CRH’s executive remuneration structures and the link with long-term organisational priorities, and that including incentives for non-financial performance was a positive step to help ensure the long-term future of CRH. Gender Pay Gap Reporting In the UK, our subsidiaries have reported on gender pay for a number of years. In Ireland, this requirement was implemented for the first time in 2022. Three subsidiaries, with a combined total of 1,319 employees, have published reports under the new legislation. The mean gender pay gap across the three Irish CRH companies is 12%, while the median pay gap is 15% (the latter in favour of women). A number of initiatives have been implemented to seek to address the gap identified. Conclusion 2022 was another year of very strong performance for the Group in challenging circumstances. The Committee believes that the way in which we have implemented the remuneration policy outlined in this report is appropriate taking into account a range of factors, including the strong performance in 2022, the continued value created for shareholders and the experience of wider stakeholders. As usual, this Remuneration Report will be included on the agenda of the 2023 AGM. We look forward to receiving your support for the Report. Lamar McKay Chairman of the Remuneration Committee 1 March 2023 *EBITDA is defined as earnings from continuing operations before interest, taxes, depreciation, amortisation, asset impairment charges, profit on disposals and the Group’s share of equity accounted investments’ profit after tax.

Overview Strategy Report Business Performance & Segmental Reviews Governance Financial Statements Supplemental 20-F and Other Disclosures Shareholder Information 2022 Annual Report and Form 20-F110 Remuneration Committee - Key Points Table 15 Policy • Updated in 2022. Approved by 90% of shareholders at the 2022 AGM Base Salary • 2023 salary increases for Irish & UK workforce were 4.25% and 4.5% respectively; 3.5% for executive Directors Pensions • The Chief Executive’s entitlement ceased in August 2022. The Chief Financial Officer’s pension remains aligned with that of the Irish and UK workforce Annual Bonus Plan • Payout of 85% of maximum. As explained on page 108, performance exceeded the stretch financial targets and personal/ strategic goals warranting 100% payout. However, both management and the Committee judged that it would be appropriate to cap the bonus outcome at 85% of maximum, in the context of the uncertain economic climate and backdrop of high inflation, and rising costs Performance Share Plan • 100% vesting for 2020 PSP award; opportunity calibrated using a reference price – and performance targets – set prior to COVID-19 impact on markets and macro-economic environment; 2022 and 2023 PSP scorecard includes ESG metrics aligned to our sustainability and I&D priorities. Non-executive Directors • Fees increased by 3.5% for 2023 Alignment of Executive Remuneration with Strategy Table 17 Performance Measure (i) Annual Bonus PSP Reason for Selection EPS ✔ EPS is a key measure of underlying profitability Cash Flow ✔ ✔ Cash flow is a key measure of CRH’s ability to generate cash to fund organic and acquisitive growth and provide returns to our shareholders via dividends and share buybacks RONA ✔ ✔ RONA is a key measure of CRH's ability to create value through excellence in operational performance TSR ✔ TSR is a key measure of CRH's returns to shareholders through the cycle Sustainability and I&D ✔ Sustainability is deeply embedded in all aspects of the Group's strategy and business model. We recognise the importance of decarbonisation in addressing the challenges of climate change and we are fully committed to achieving our ambition to be a net-zero business by 2050. We also believe that our integrated model of value-added products and innovative solutions strategy has a key part to play in the delivery of a more resilient built environment and a more sustainable future. Furthermore, we consider that an inclusive working environment, policies and practices will assist in further developing the diversity of our workforce and leadership teams, which will positively contribute to growing shareholder value over the longer term Personal/Strategic Objectives ✔ Personal strategic objectives enable a focus on specific factors aligned with CRH's short and medium- term strategic objectives that promote long-term performance (i) Please see the footnotes to Tables 26 and 27 on pages 120 and 121 respectively for further information on the operation of the financial metrics for the purposes of the Group's incentive schemes. 2022 Remuneration Snapshot (full details of 2022 remuneration are set out in Table 20 on page 112) Table 16 Fixed Performance-related Variable Remuneration Director Salary Annual Bonus (i) (% of Max) 2020 PSP Award (ii) (% of Max) Albert Manifold €1,651,635 85% 100% Jim Mintern €861,045 85% 100% (i) For the reasons outlined on page 108, the Committee and the executive Directors judged that the payout under the 2022 annual bonus plan should be capped at 85% of maximum. (ii) The awards, for which performance was measured over the three-year period to end 2022, will vest at 100%. The award for Mr. Mintern, which was granted before his appointment to the Board, is not subject to an additional holding period and will vest in April 2023. The award for Mr. Manifold is subject to an additional two-year holding period and, therefore, will vest in 2025. Further details in relation to the estimated value of the awards, split between the value created for performance and the value created through share price growth, are included in Table 20 on page 112. The market value per share on the date of award (in March 2020) was €33.10.
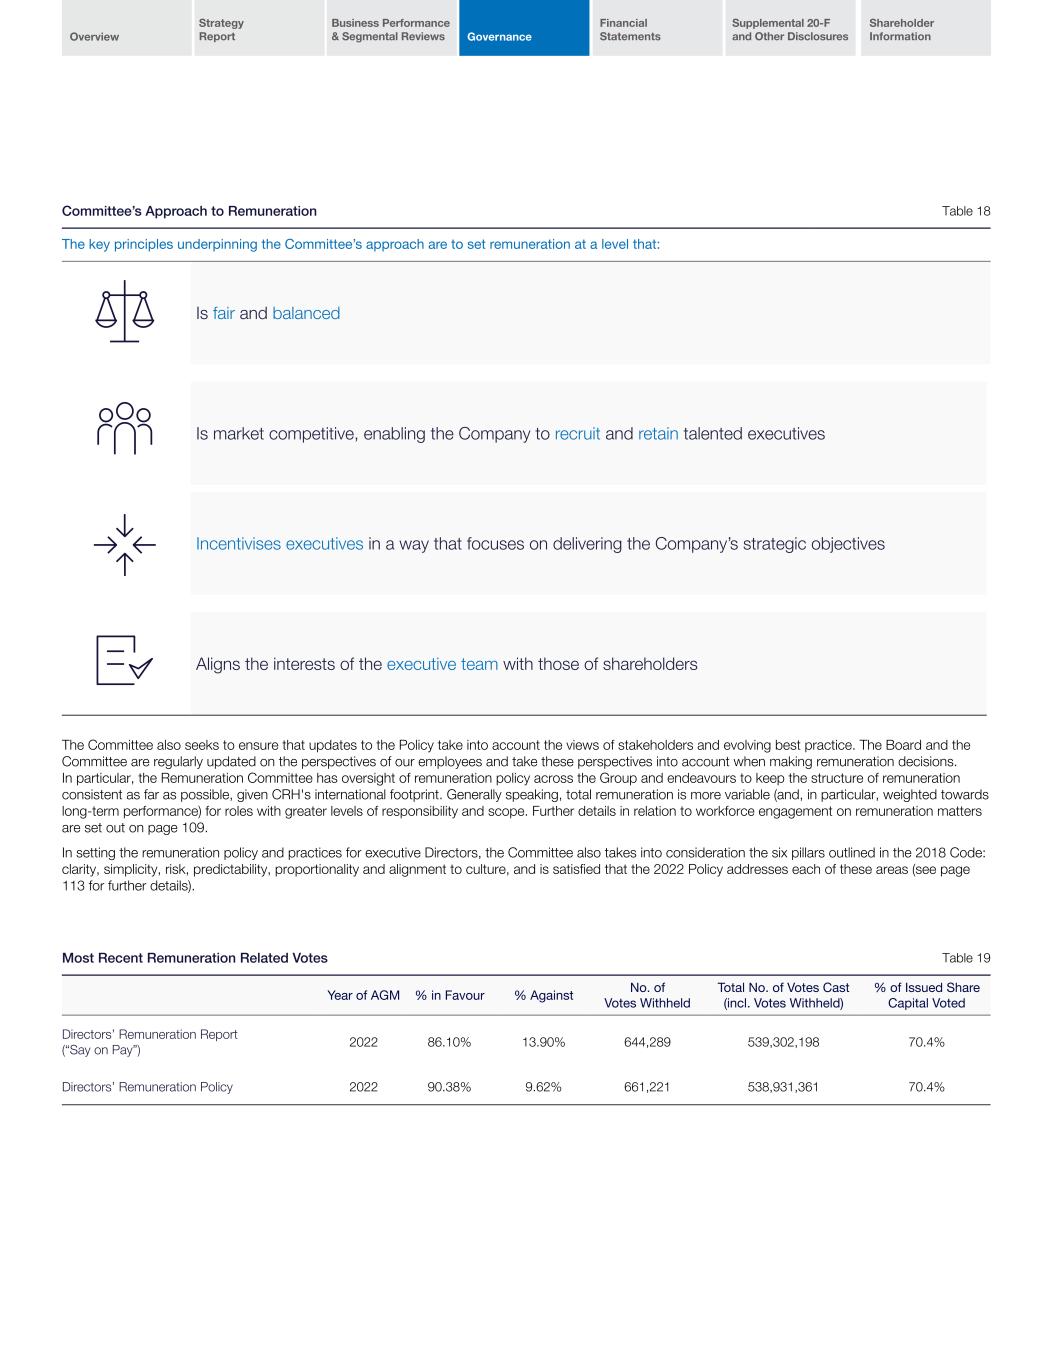
Overview Strategy Report Business Performance & Segmental Reviews Governance Financial Statements Supplemental 20-F and Other Disclosures Shareholder Information 2022 Annual Report and Form 20-F110 Committee’s Approach to Remuneration Table 18 The key principles underpinning the Committee’s approach are to set remuneration at a level that: Is fair and balanced Is market competitive, enabling the Company to recruit and retain talented executives Incentivises executives in a way that focuses on delivering the Company’s strategic objectives Aligns the interests of the executive team with those of shareholders The Committee also seeks to ensure that updates to the Policy take into account the views of stakeholders and evolving best practice. The Board and the Committee are regularly updated on the perspectives of our employees and take these perspectives into account when making remuneration decisions. In particular, the Remuneration Committee has oversight of remuneration policy across the Group and endeavours to keep the structure of remuneration consistent as far as possible, given CRH's international footprint. Generally speaking, total remuneration is more variable (and, in particular, weighted towards long-term performance) for roles with greater levels of responsibility and scope. Further details in relation to workforce engagement on remuneration matters are set out on page 109. In setting the remuneration policy and practices for executive Directors, the Committee also takes into consideration the six pillars outlined in the 2018 Code: clarity, simplicity, risk, predictability, proportionality and alignment to culture, and is satisfied that the 2022 Policy addresses each of these areas (see page 113 for further details). Most Recent Remuneration Related Votes Table 19 Year of AGM % in Favour % Against No. of Votes Withheld Total No. of Votes Cast (incl. Votes Withheld) % of Issued Share Capital Voted Directors’ Remuneration Report (“Say on Pay”) 2022 86.10% 13.90% 644,289 539,302,198 70.4% Directors’ Remuneration Policy 2022 90.38% 9.62% 661,221 538,931,361 70.4%
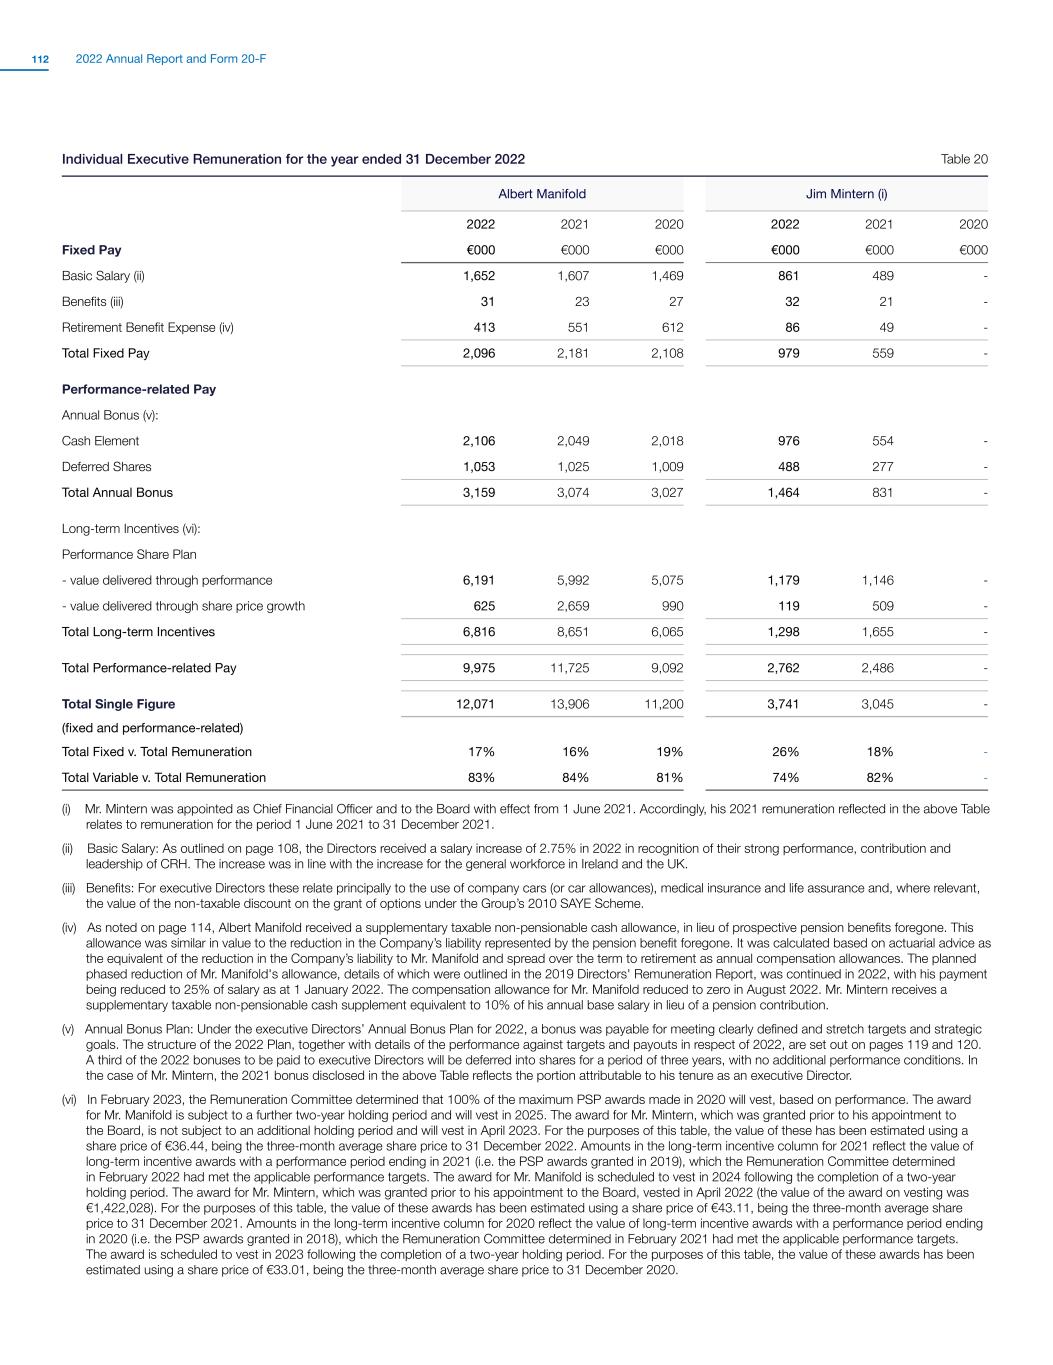
Overview Strategy Report Business Performance & Segmental Reviews Governance Financial Statements Supplemental 20-F and Other Disclosures Shareholder Information 2022 Annual Report and Form 20-F112 Individual Executive Remuneration for the year ended 31 December 2022 Table 20 Albert Manifold Jim Mintern (i) 2022 2021 2020 2022 2021 2020 Fixed Pay €000 €000 €000 €000 €000 €000 Basic Salary (ii) 1,652 1,607 1,469 861 489 - Benefits (iii) 31 23 27 32 21 - Retirement Benefit Expense (iv) 413 551 612 86 49 - Total Fixed Pay 2,096 2,181 2,108 979 559 - Performance-related Pay Annual Bonus (v): Cash Element 2,106 2,049 2,018 976 554 - Deferred Shares 1,053 1,025 1,009 488 277 - Total Annual Bonus 3,159 3,074 3,027 1,464 831 - Long-term Incentives (vi): Performance Share Plan - value delivered through performance 6,191 5,992 5,075 1,179 1,146 - - value delivered through share price growth 625 2,659 990 119 509 - Total Long-term Incentives 6,816 8,651 6,065 1,298 1,655 - Total Performance-related Pay 9,975 11,725 9,092 2,762 2,486 - Total Single Figure 12,071 13,906 11,200 3,741 3,045 - (fixed and performance-related) Total Fixed v. Total Remuneration 17% 16% 19% 26% 18% - Total Variable v. Total Remuneration 83% 84% 81% 74% 82% - (i) Mr. Mintern was appointed as Chief Financial Officer and to the Board with effect from 1 June 2021. Accordingly, his 2021 remuneration reflected in the above Table relates to remuneration for the period 1 June 2021 to 31 December 2021. (ii) Basic Salary: As outlined on page 108, the Directors received a salary increase of 2.75% in 2022 in recognition of their strong performance, contribution and leadership of CRH. The increase was in line with the increase for the general workforce in Ireland and the UK. (iii) Benefits: For executive Directors these relate principally to the use of company cars (or car allowances), medical insurance and life assurance and, where relevant, the value of the non-taxable discount on the grant of options under the Group’s 2010 SAYE Scheme. (iv) As noted on page 114, Albert Manifold received a supplementary taxable non-pensionable cash allowance, in lieu of prospective pension benefits foregone. This allowance was similar in value to the reduction in the Company’s liability represented by the pension benefit foregone. It was calculated based on actuarial advice as the equivalent of the reduction in the Company’s liability to Mr. Manifold and spread over the term to retirement as annual compensation allowances. The planned phased reduction of Mr. Manifold's allowance, details of which were outlined in the 2019 Directors' Remuneration Report, was continued in 2022, with his payment being reduced to 25% of salary as at 1 January 2022. The compensation allowance for Mr. Manifold reduced to zero in August 2022. Mr. Mintern receives a supplementary taxable non-pensionable cash supplement equivalent to 10% of his annual base salary in lieu of a pension contribution. (v) Annual Bonus Plan: Under the executive Directors’ Annual Bonus Plan for 2022, a bonus was payable for meeting clearly defined and stretch targets and strategic goals. The structure of the 2022 Plan, together with details of the performance against targets and payouts in respect of 2022, are set out on pages 119 and 120. A third of the 2022 bonuses to be paid to executive Directors will be deferred into shares for a period of three years, with no additional performance conditions. In the case of Mr. Mintern, the 2021 bonus disclosed in the above Table reflects the portion attributable to his tenure as an executive Director. (vi) In February 2023, the Remuneration Committee determined that 100% of the maximum PSP awards made in 2020 will vest, based on performance. The award for Mr. Manifold is subject to a further two-year holding period and will vest in 2025. The award for Mr. Mintern, which was granted prior to his appointment to the Board, is not subject to an additional holding period and will vest in April 2023. For the purposes of this table, the value of these has been estimated using a share price of €36.44, being the three-month average share price to 31 December 2022. Amounts in the long-term incentive column for 2021 reflect the value of long-term incentive awards with a performance period ending in 2021 (i.e. the PSP awards granted in 2019), which the Remuneration Committee determined in February 2022 had met the applicable performance targets. The award for Mr. Manifold is scheduled to vest in 2024 following the completion of a two-year holding period. The award for Mr. Mintern, which was granted prior to his appointment to the Board, vested in April 2022 (the value of the award on vesting was €1,422,028). For the purposes of this table, the value of these awards has been estimated using a share price of €43.11, being the three-month average share price to 31 December 2021. Amounts in the long-term incentive column for 2020 reflect the value of long-term incentive awards with a performance period ending in 2020 (i.e. the PSP awards granted in 2018), which the Remuneration Committee determined in February 2021 had met the applicable performance targets. The award is scheduled to vest in 2023 following the completion of a two-year holding period. For the purposes of this table, the value of these awards has been estimated using a share price of €33.01, being the three-month average share price to 31 December 2020.
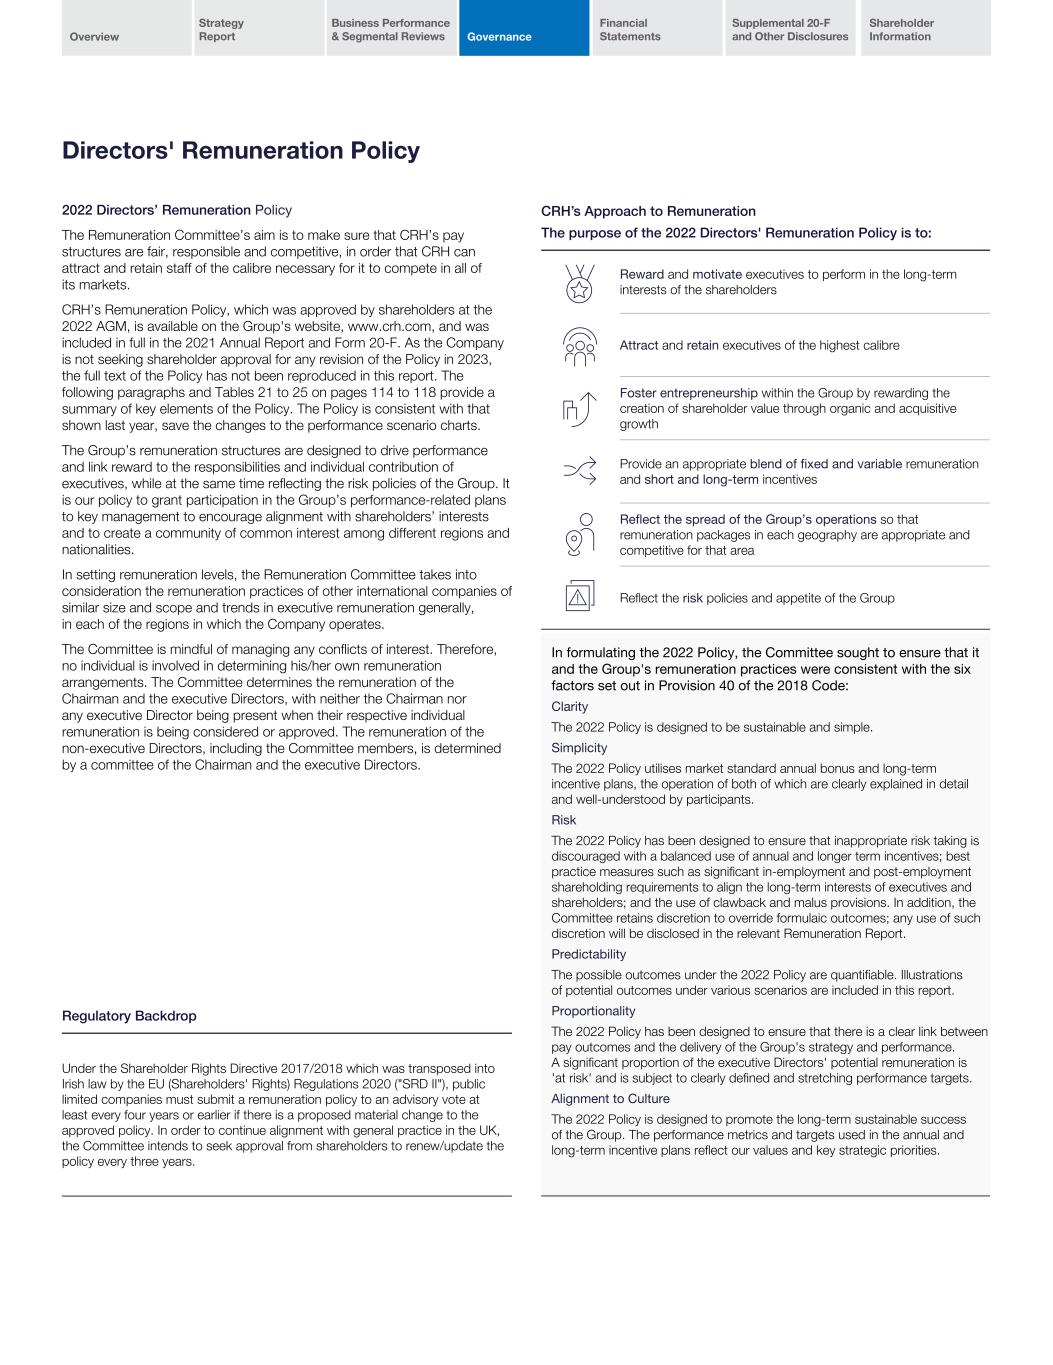
Overview Strategy Report Business Performance & Segmental Reviews Governance Financial Statements Supplemental 20-F and Other Disclosures Shareholder Information 2022 Annual Report and Form 20-F112 CRH’s Approach to Remuneration The purpose of the 2022 Directors' Remuneration Policy is to: Reward and motivate executives to perform in the long-term interests of the shareholders Attract and retain executives of the highest calibre Foster entrepreneurship within the Group by rewarding the creation of shareholder value through organic and acquisitive growth Provide an appropriate blend of fixed and variable remuneration and short and long-term incentives Reflect the spread of the Group’s operations so that remuneration packages in each geography are appropriate and competitive for that area Reflect the risk policies and appetite of the Group In formulating the 2022 Policy, the Committee sought to ensure that it and the Group's remuneration practices were consistent with the six factors set out in Provision 40 of the 2018 Code: Clarity The 2022 Policy is designed to be sustainable and simple. Simplicity The 2022 Policy utilises market standard annual bonus and long-term incentive plans, the operation of both of which are clearly explained in detail and well-understood by participants. Risk The 2022 Policy has been designed to ensure that inappropriate risk taking is discouraged with a balanced use of annual and longer term incentives; best practice measures such as significant in-employment and post-employment shareholding requirements to align the long-term interests of executives and shareholders; and the use of clawback and malus provisions. In addition, the Committee retains discretion to override formulaic outcomes; any use of such discretion will be disclosed in the relevant Remuneration Report. Predictability The possible outcomes under the 2022 Policy are quantifiable. Illustrations of potential outcomes under various scenarios are included in this report. Proportionality The 2022 Policy has been designed to ensure that there is a clear link between pay outcomes and the delivery of the Group's strategy and performance. A significant proportion of the executive Directors' potential remuneration is 'at risk' and is subject to clearly defined and stretching performance targets. Alignment to Culture The 2022 Policy is designed to promote the long-term sustainable success of the Group. The performance metrics and targets used in the annual and long-term incentive plans reflect our values and key strategic priorities. Directors' Remuneration Policy 2022 Directors’ Remuneration Policy The Remuneration Committee’s aim is to make sure that CRH’s pay structures are fair, responsible and competitive, in order that CRH can attract and retain staff of the calibre necessary for it to compete in all of its markets. CRH’s Remuneration Policy, which was approved by shareholders at the 2022 AGM, is available on the Group's website, www.crh.com, and was included in full in the 2021 Annual Report and Form 20-F. As the Company is not seeking shareholder approval for any revision of the Policy in 2023, the full text of the Policy has not been reproduced in this report. The following paragraphs and Tables 21 to 25 on pages 114 to 118 provide a summary of key elements of the Policy. The Policy is consistent with that shown last year, save the changes to the performance scenario charts. The Group’s remuneration structures are designed to drive performance and link reward to the responsibilities and individual contribution of executives, while at the same time reflecting the risk policies of the Group. It is our policy to grant participation in the Group’s performance-related plans to key management to encourage alignment with shareholders’ interests and to create a community of common interest among different regions and nationalities. In setting remuneration levels, the Remuneration Committee takes into consideration the remuneration practices of other international companies of similar size and scope and trends in executive remuneration generally, in each of the regions in which the Company operates. The Committee is mindful of managing any conflicts of interest. Therefore, no individual is involved in determining his/her own remuneration arrangements. The Committee determines the remuneration of the Chairman and the executive Directors, with neither the Chairman nor any executive Director being present when their respective individual remuneration is being considered or approved. The remuneration of the non-executive Directors, including the Committee members, is determined by a committee of the Chairman and the executive Directors. Regulatory Backdrop Under the Shareholder Rights Directive 2017/2018 which was transposed into Irish law by the EU (Shareholders' Rights) Regulations 2020 ("SRD II"), public limited companies must submit a remuneration policy to an advisory vote at least every four years or earlier if there is a proposed material change to the approved policy. In order to continue alignment with general practice in the UK, the Committee intends to seek approval from shareholders to renew/update the policy every three years.
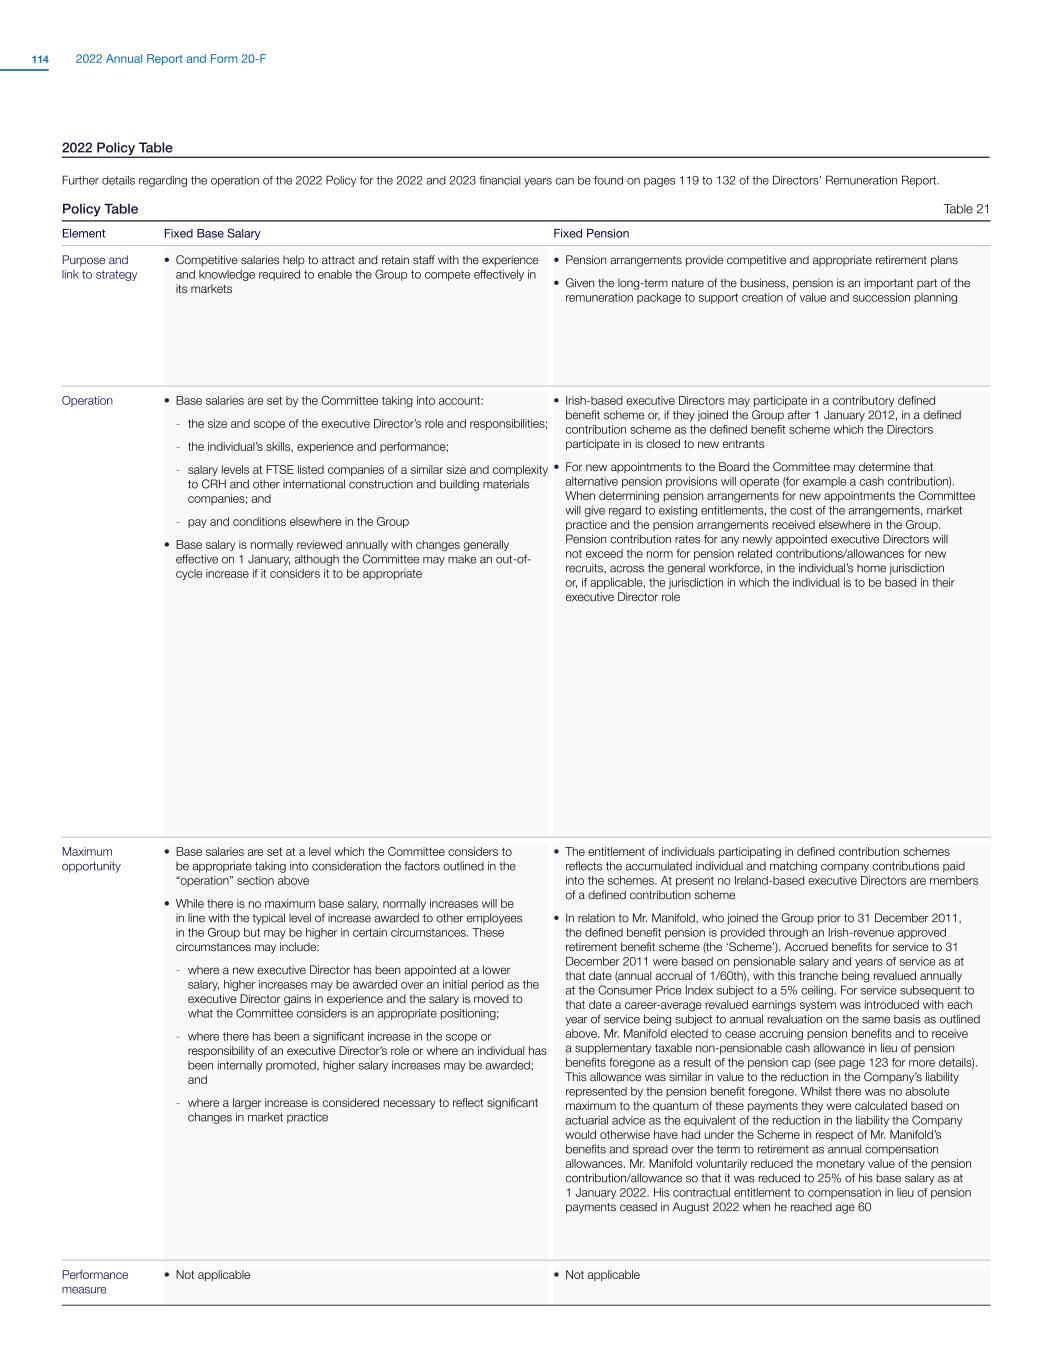
Overview Strategy Report Business Performance & Segmental Reviews Governance Financial Statements Supplemental 20-F and Other Disclosures Shareholder Information 2022 Annual Report and Form 20-F114 2022 Policy Table Further details regarding the operation of the 2022 Policy for the 2022 and 2023 financial years can be found on pages 119 to 132 of the Directors’ Remuneration Report. Policy Table Table 21 Element Fixed Base Salary Fixed Pension Purpose and link to strategy • Competitive salaries help to attract and retain staff with the experience and knowledge required to enable the Group to compete effectively in its markets • Pension arrangements provide competitive and appropriate retirement plans • Given the long-term nature of the business, pension is an important part of the remuneration package to support creation of value and succession planning Operation • Base salaries are set by the Committee taking into account: - the size and scope of the executive Director’s role and responsibilities; - the individual’s skills, experience and performance; - salary levels at FTSE listed companies of a similar size and complexity to CRH and other international construction and building materials companies; and - pay and conditions elsewhere in the Group • Base salary is normally reviewed annually with changes generally effective on 1 January, although the Committee may make an out-of- cycle increase if it considers it to be appropriate • Irish-based executive Directors may participate in a contributory defined benefit scheme or, if they joined the Group after 1 January 2012, in a defined contribution scheme as the defined benefit scheme which the Directors participate in is closed to new entrants • For new appointments to the Board the Committee may determine that alternative pension provisions will operate (for example a cash contribution). When determining pension arrangements for new appointments the Committee will give regard to existing entitlements, the cost of the arrangements, market practice and the pension arrangements received elsewhere in the Group. Pension contribution rates for any newly appointed executive Directors will not exceed the norm for pension related contributions/allowances for new recruits, across the general workforce, in the individual’s home jurisdiction or, if applicable, the jurisdiction in which the individual is to be based in their executive Director role Maximum opportunity • Base salaries are set at a level which the Committee considers to be appropriate taking into consideration the factors outlined in the “operation” section above • While there is no maximum base salary, normally increases will be in line with the typical level of increase awarded to other employees in the Group but may be higher in certain circumstances. These circumstances may include: - where a new executive Director has been appointed at a lower salary, higher increases may be awarded over an initial period as the executive Director gains in experience and the salary is moved to what the Committee considers is an appropriate positioning; - where there has been a significant increase in the scope or responsibility of an executive Director’s role or where an individual has been internally promoted, higher salary increases may be awarded; and - where a larger increase is considered necessary to reflect significant changes in market practice • The entitlement of individuals participating in defined contribution schemes reflects the accumulated individual and matching company contributions paid into the schemes. At present no Ireland-based executive Directors are members of a defined contribution scheme • In relation to Mr. Manifold, who joined the Group prior to 31 December 2011, the defined benefit pension is provided through an Irish-revenue approved retirement benefit scheme (the ‘Scheme’). Accrued benefits for service to 31 December 2011 were based on pensionable salary and years of service as at that date (annual accrual of 1/60th), with this tranche being revalued annually at the Consumer Price Index subject to a 5% ceiling. For service subsequent to that date a career-average revalued earnings system was introduced with each year of service being subject to annual revaluation on the same basis as outlined above. Mr. Manifold elected to cease accruing pension benefits and to receive a supplementary taxable non-pensionable cash allowance in lieu of pension benefits foregone as a result of the pension cap (see page 123 for more details). This allowance was similar in value to the reduction in the Company’s liability represented by the pension benefit foregone. Whilst there was no absolute maximum to the quantum of these payments they were calculated based on actuarial advice as the equivalent of the reduction in the liability the Company would otherwise have had under the Scheme in respect of Mr. Manifold’s benefits and spread over the term to retirement as annual compensation allowances. Mr. Manifold voluntarily reduced the monetary value of the pension contribution/allowance so that it was reduced to 25% of his base salary as at 1 January 2022. His contractual entitlement to compensation in lieu of pension payments ceased in August 2022 when he reached age 60 Performance measure • Not applicable • Not applicable
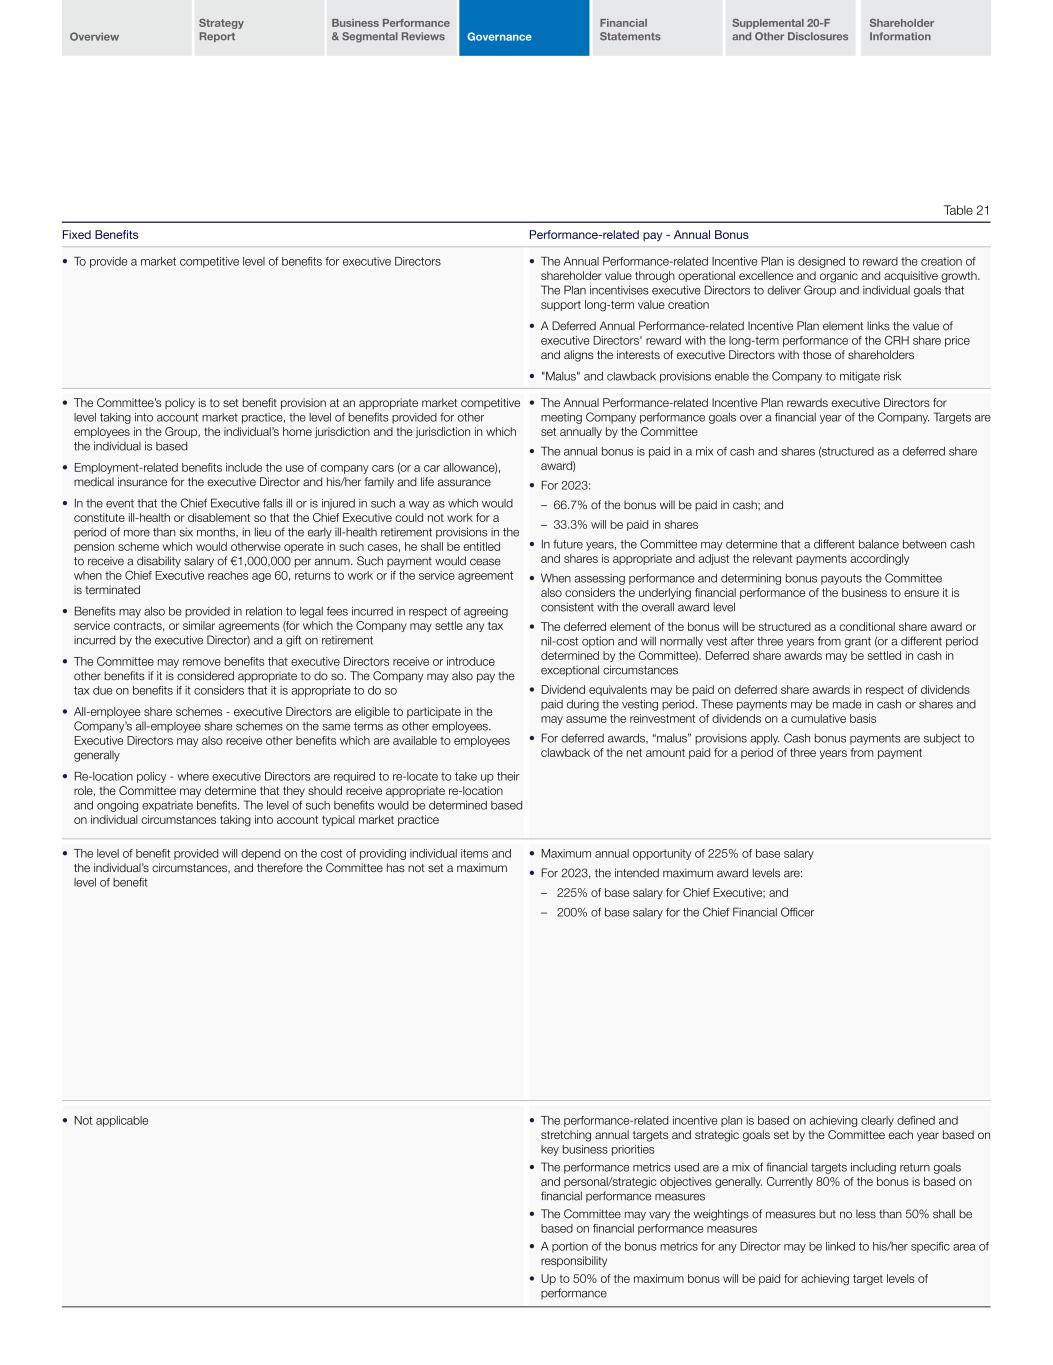
Overview Strategy Report Business Performance & Segmental Reviews Governance Financial Statements Supplemental 20-F and Other Disclosures Shareholder Information 2022 Annual Report and Form 20-F114 Table 21 Fixed Benefits Performance-related pay - Annual Bonus • To provide a market competitive level of benefits for executive Directors • The Annual Performance-related Incentive Plan is designed to reward the creation of shareholder value through operational excellence and organic and acquisitive growth. The Plan incentivises executive Directors to deliver Group and individual goals that support long-term value creation • A Deferred Annual Performance-related Incentive Plan element links the value of executive Directors' reward with the long-term performance of the CRH share price and aligns the interests of executive Directors with those of shareholders • "Malus" and clawback provisions enable the Company to mitigate risk • The Committee’s policy is to set benefit provision at an appropriate market competitive level taking into account market practice, the level of benefits provided for other employees in the Group, the individual’s home jurisdiction and the jurisdiction in which the individual is based • Employment-related benefits include the use of company cars (or a car allowance), medical insurance for the executive Director and his/her family and life assurance • In the event that the Chief Executive falls ill or is injured in such a way as which would constitute ill-health or disablement so that the Chief Executive could not work for a period of more than six months, in lieu of the early ill-health retirement provisions in the pension scheme which would otherwise operate in such cases, he shall be entitled to receive a disability salary of €1,000,000 per annum. Such payment would cease when the Chief Executive reaches age 60, returns to work or if the service agreement is terminated • Benefits may also be provided in relation to legal fees incurred in respect of agreeing service contracts, or similar agreements (for which the Company may settle any tax incurred by the executive Director) and a gift on retirement • The Committee may remove benefits that executive Directors receive or introduce other benefits if it is considered appropriate to do so. The Company may also pay the tax due on benefits if it considers that it is appropriate to do so • All-employee share schemes - executive Directors are eligible to participate in the Company’s all-employee share schemes on the same terms as other employees. Executive Directors may also receive other benefits which are available to employees generally • Re-location policy - where executive Directors are required to re-locate to take up their role, the Committee may determine that they should receive appropriate re-location and ongoing expatriate benefits. The level of such benefits would be determined based on individual circumstances taking into account typical market practice • The Annual Performance-related Incentive Plan rewards executive Directors for meeting Company performance goals over a financial year of the Company. Targets are set annually by the Committee • The annual bonus is paid in a mix of cash and shares (structured as a deferred share award) • For 2023: – 66.7% of the bonus will be paid in cash; and – 33.3% will be paid in shares • In future years, the Committee may determine that a different balance between cash and shares is appropriate and adjust the relevant payments accordingly • When assessing performance and determining bonus payouts the Committee also considers the underlying financial performance of the business to ensure it is consistent with the overall award level • The deferred element of the bonus will be structured as a conditional share award or nil-cost option and will normally vest after three years from grant (or a different period determined by the Committee). Deferred share awards may be settled in cash in exceptional circumstances • Dividend equivalents may be paid on deferred share awards in respect of dividends paid during the vesting period. These payments may be made in cash or shares and may assume the reinvestment of dividends on a cumulative basis • For deferred awards, “malus” provisions apply. Cash bonus payments are subject to clawback of the net amount paid for a period of three years from payment • The level of benefit provided will depend on the cost of providing individual items and the individual’s circumstances, and therefore the Committee has not set a maximum level of benefit • Maximum annual opportunity of 225% of base salary • For 2023, the intended maximum award levels are: – 225% of base salary for Chief Executive; and – 200% of base salary for the Chief Financial Officer • Not applicable • The performance-related incentive plan is based on achieving clearly defined and stretching annual targets and strategic goals set by the Committee each year based on key business priorities • The performance metrics used are a mix of financial targets including return goals and personal/strategic objectives generally. Currently 80% of the bonus is based on financial performance measures • The Committee may vary the weightings of measures but no less than 50% shall be based on financial performance measures • A portion of the bonus metrics for any Director may be linked to his/her specific area of responsibility • Up to 50% of the maximum bonus will be paid for achieving target levels of performance
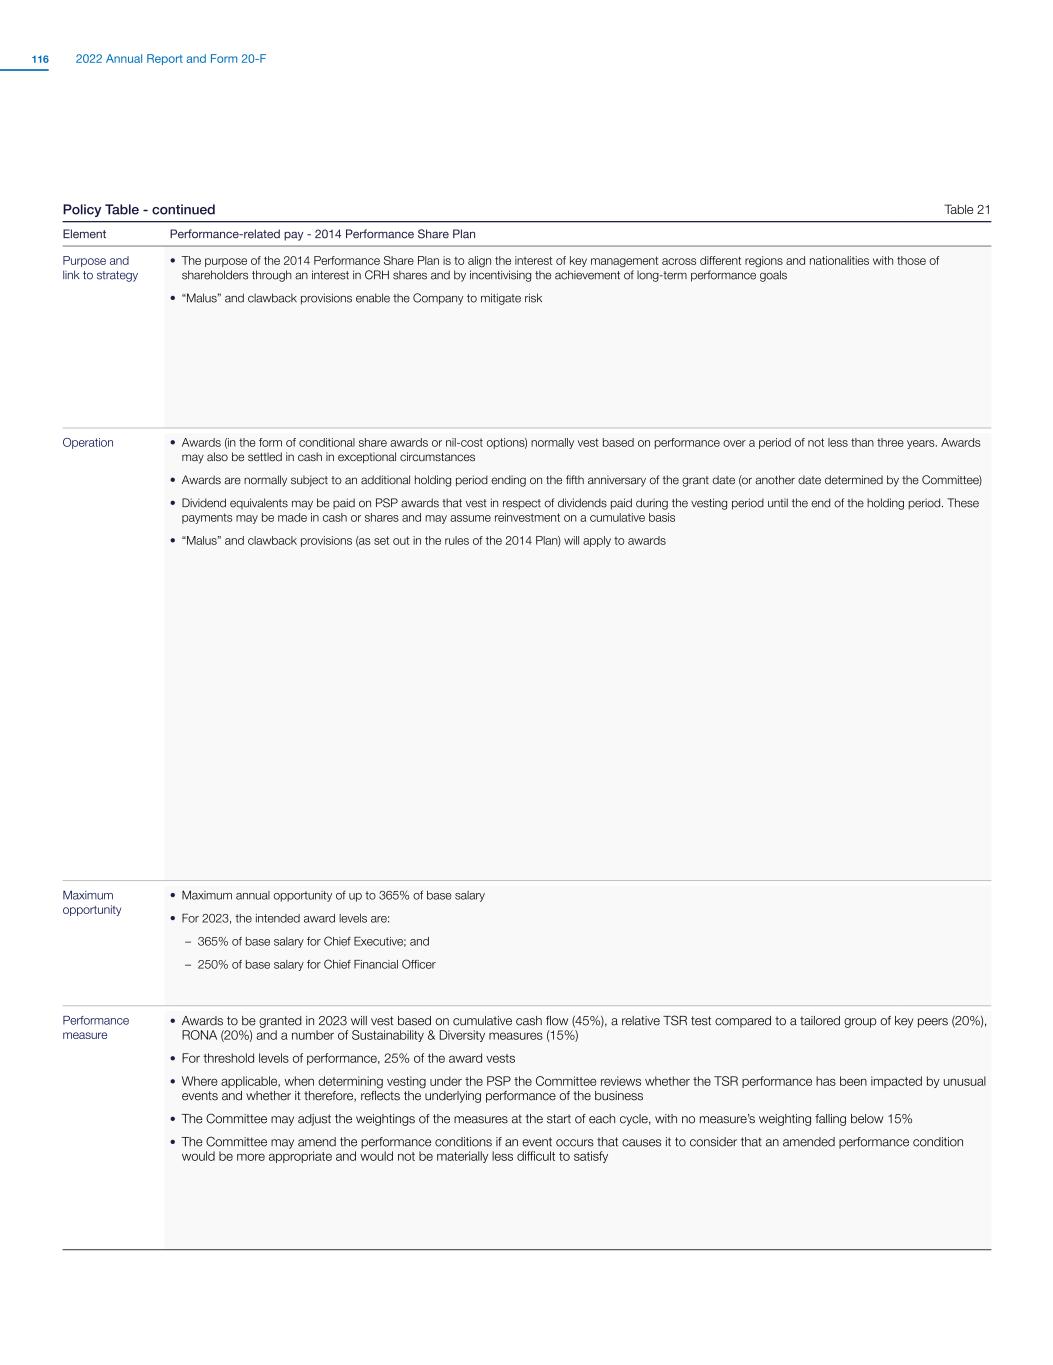
Overview Strategy Report Business Performance & Segmental Reviews Governance Financial Statements Supplemental 20-F and Other Disclosures Shareholder Information 2022 Annual Report and Form 20-F116 Policy Table - continued Table 21 Element Performance-related pay - 2014 Performance Share Plan Purpose and link to strategy • The purpose of the 2014 Performance Share Plan is to align the interest of key management across different regions and nationalities with those of shareholders through an interest in CRH shares and by incentivising the achievement of long-term performance goals • “Malus” and clawback provisions enable the Company to mitigate risk Operation • Awards (in the form of conditional share awards or nil-cost options) normally vest based on performance over a period of not less than three years. Awards may also be settled in cash in exceptional circumstances • Awards are normally subject to an additional holding period ending on the fifth anniversary of the grant date (or another date determined by the Committee) • Dividend equivalents may be paid on PSP awards that vest in respect of dividends paid during the vesting period until the end of the holding period. These payments may be made in cash or shares and may assume reinvestment on a cumulative basis • “Malus” and clawback provisions (as set out in the rules of the 2014 Plan) will apply to awards Maximum opportunity • Maximum annual opportunity of up to 365% of base salary • For 2023, the intended award levels are: – 365% of base salary for Chief Executive; and – 250% of base salary for Chief Financial Officer Performance measure • Awards to be granted in 2023 will vest based on cumulative cash flow (45%), a relative TSR test compared to a tailored group of key peers (20%), RONA (20%) and a number of Sustainability & Diversity measures (15%) • For threshold levels of performance, 25% of the award vests • Where applicable, when determining vesting under the PSP the Committee reviews whether the TSR performance has been impacted by unusual events and whether it therefore, reflects the underlying performance of the business • The Committee may adjust the weightings of the measures at the start of each cycle, with no measure’s weighting falling below 15% • The Committee may amend the performance conditions if an event occurs that causes it to consider that an amended performance condition would be more appropriate and would not be materially less difficult to satisfy
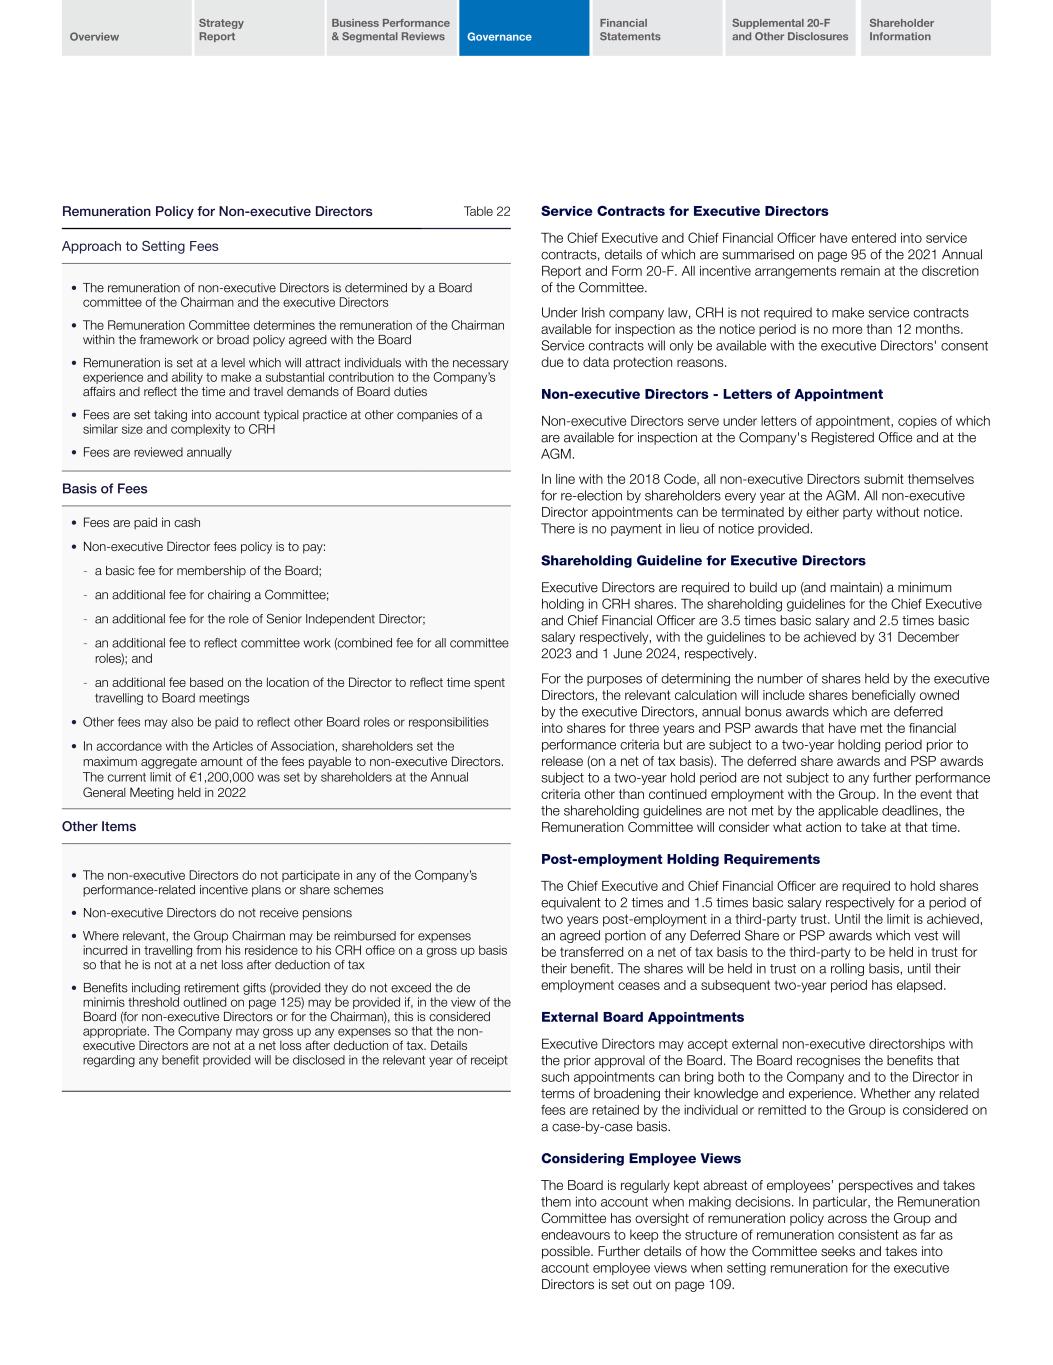
Overview Strategy Report Business Performance & Segmental Reviews Governance Financial Statements Supplemental 20-F and Other Disclosures Shareholder Information 2022 Annual Report and Form 20-F116 Remuneration Policy for Non-executive Directors Table 22 Approach to Setting Fees • The remuneration of non-executive Directors is determined by a Board committee of the Chairman and the executive Directors • The Remuneration Committee determines the remuneration of the Chairman within the framework or broad policy agreed with the Board • Remuneration is set at a level which will attract individuals with the necessary experience and ability to make a substantial contribution to the Company’s affairs and reflect the time and travel demands of Board duties • Fees are set taking into account typical practice at other companies of a similar size and complexity to CRH • Fees are reviewed annually Basis of Fees • Fees are paid in cash • Non-executive Director fees policy is to pay: - a basic fee for membership of the Board; - an additional fee for chairing a Committee; - an additional fee for the role of Senior Independent Director; - an additional fee to reflect committee work (combined fee for all committee roles); and - an additional fee based on the location of the Director to reflect time spent travelling to Board meetings • Other fees may also be paid to reflect other Board roles or responsibilities • In accordance with the Articles of Association, shareholders set the maximum aggregate amount of the fees payable to non-executive Directors. The current limit of €1,200,000 was set by shareholders at the Annual General Meeting held in 2022 Other Items • The non-executive Directors do not participate in any of the Company’s performance-related incentive plans or share schemes • Non-executive Directors do not receive pensions • Where relevant, the Group Chairman may be reimbursed for expenses incurred in travelling from his residence to his CRH office on a gross up basis so that he is not at a net loss after deduction of tax • Benefits including retirement gifts (provided they do not exceed the de minimis threshold outlined on page 125) may be provided if, in the view of the Board (for non-executive Directors or for the Chairman), this is considered appropriate. The Company may gross up any expenses so that the non- executive Directors are not at a net loss after deduction of tax. Details regarding any benefit provided will be disclosed in the relevant year of receipt Service Contracts for Executive Directors The Chief Executive and Chief Financial Officer have entered into service contracts, details of which are summarised on page 95 of the 2021 Annual Report and Form 20-F. All incentive arrangements remain at the discretion of the Committee. Under Irish company law, CRH is not required to make service contracts available for inspection as the notice period is no more than 12 months. Service contracts will only be available with the executive Directors' consent due to data protection reasons. Non-executive Directors - Letters of Appointment Non-executive Directors serve under letters of appointment, copies of which are available for inspection at the Company's Registered Office and at the AGM. In line with the 2018 Code, all non-executive Directors submit themselves for re-election by shareholders every year at the AGM. All non-executive Director appointments can be terminated by either party without notice. There is no payment in lieu of notice provided. Shareholding Guideline for Executive Directors Executive Directors are required to build up (and maintain) a minimum holding in CRH shares. The shareholding guidelines for the Chief Executive and Chief Financial Officer are 3.5 times basic salary and 2.5 times basic salary respectively, with the guidelines to be achieved by 31 December 2023 and 1 June 2024, respectively. For the purposes of determining the number of shares held by the executive Directors, the relevant calculation will include shares beneficially owned by the executive Directors, annual bonus awards which are deferred into shares for three years and PSP awards that have met the financial performance criteria but are subject to a two-year holding period prior to release (on a net of tax basis). The deferred share awards and PSP awards subject to a two-year hold period are not subject to any further performance criteria other than continued employment with the Group. In the event that the shareholding guidelines are not met by the applicable deadlines, the Remuneration Committee will consider what action to take at that time. Post-employment Holding Requirements The Chief Executive and Chief Financial Officer are required to hold shares equivalent to 2 times and 1.5 times basic salary respectively for a period of two years post-employment in a third-party trust. Until the limit is achieved, an agreed portion of any Deferred Share or PSP awards which vest will be transferred on a net of tax basis to the third-party to be held in trust for their benefit. The shares will be held in trust on a rolling basis, until their employment ceases and a subsequent two-year period has elapsed. External Board Appointments Executive Directors may accept external non-executive directorships with the prior approval of the Board. The Board recognises the benefits that such appointments can bring both to the Company and to the Director in terms of broadening their knowledge and experience. Whether any related fees are retained by the individual or remitted to the Group is considered on a case-by-case basis. Considering Employee Views The Board is regularly kept abreast of employees’ perspectives and takes them into account when making decisions. In particular, the Remuneration Committee has oversight of remuneration policy across the Group and endeavours to keep the structure of remuneration consistent as far as possible. Further details of how the Committee seeks and takes into account employee views when setting remuneration for the executive Directors is set out on page 109.
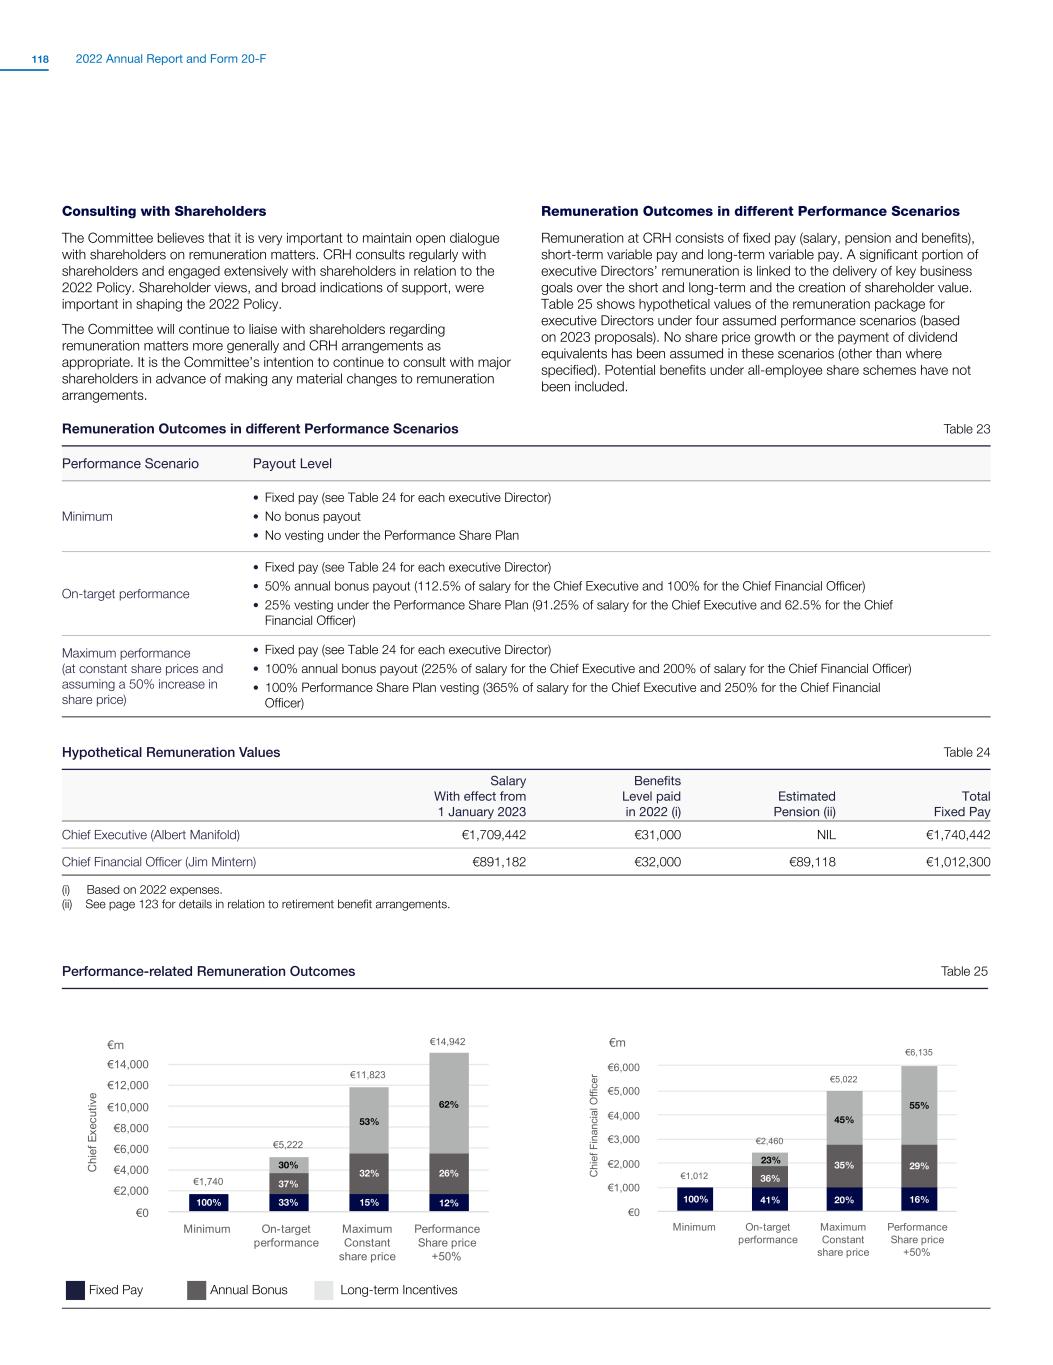
Overview Strategy Report Business Performance & Segmental Reviews Governance Financial Statements Supplemental 20-F and Other Disclosures Shareholder Information 2022 Annual Report and Form 20-F118 Consulting with Shareholders The Committee believes that it is very important to maintain open dialogue with shareholders on remuneration matters. CRH consults regularly with shareholders and engaged extensively with shareholders in relation to the 2022 Policy. Shareholder views, and broad indications of support, were important in shaping the 2022 Policy. The Committee will continue to liaise with shareholders regarding remuneration matters more generally and CRH arrangements as appropriate. It is the Committee’s intention to continue to consult with major shareholders in advance of making any material changes to remuneration arrangements. Remuneration Outcomes in different Performance Scenarios Remuneration at CRH consists of fixed pay (salary, pension and benefits), short-term variable pay and long-term variable pay. A significant portion of executive Directors’ remuneration is linked to the delivery of key business goals over the short and long-term and the creation of shareholder value. Table 25 shows hypothetical values of the remuneration package for executive Directors under four assumed performance scenarios (based on 2023 proposals). No share price growth or the payment of dividend equivalents has been assumed in these scenarios (other than where specified). Potential benefits under all-employee share schemes have not been included. Remuneration Outcomes in different Performance Scenarios Table 23 Performance Scenario Payout Level Minimum • Fixed pay (see Table 24 for each executive Director) • No bonus payout • No vesting under the Performance Share Plan On-target performance • Fixed pay (see Table 24 for each executive Director) • 50% annual bonus payout (112.5% of salary for the Chief Executive and 100% for the Chief Financial Officer) • 25% vesting under the Performance Share Plan (91.25% of salary for the Chief Executive and 62.5% for the Chief Financial Officer) Maximum performance (at constant share prices and assuming a 50% increase in share price) • Fixed pay (see Table 24 for each executive Director) • 100% annual bonus payout (225% of salary for the Chief Executive and 200% of salary for the Chief Financial Officer) • 100% Performance Share Plan vesting (365% of salary for the Chief Executive and 250% for the Chief Financial Officer) Hypothetical Remuneration Values Table 24 Salary With effect from 1 January 2023 Benefits Level paid in 2022 (i) Estimated Pension (ii) Total Fixed Pay Chief Executive (Albert Manifold) €1,709,442 €31,000 NIL €1,740,442 Chief Financial Officer (Jim Mintern) €891,182 €32,000 €89,118 €1,012,300 (i) Based on 2022 expenses. (ii) See page 123 for details in relation to retirement benefit arrangements. C hi ef E xe cu tiv e €1,740 €5,222 €11,823 €14,942 Minimum On-target performance Maximum Constant share price Performance Share price +50% €0 €2,000 €4,000 €6,000 €8,000 €10,000 €12,000 €14,000 100% 33% 15% 12% 26% 62% 32% 53% 37% 30% €m C hi ef F in an ci al O ffi ce r €1,012 €2,460 €5,022 €6,135 Minimum On-target performance Maximum Constant share price Performance Share price +50% €0 €1,000 €2,000 €3,000 €4,000 €5,000 €6,000 100% 41% 20% 16% 29% 55% 35% 45% 36% 23% €m ■ Fixed Pay ■ Annual Bonus ■ Long-term Incentives Performance-related Remuneration Outcomes Table 25

Overview Strategy Report Business Performance & Segmental Reviews Governance Financial Statements Supplemental 20-F and Other Disclosures Shareholder Information 2022 Annual Report and Form 20-F118 Annual Report on Remuneration When reviewing performance against the bonus plan, the Committee typically makes a number of routine adjustments to the financial targets, for example, to reflect significant development activity and actual share buyback activity during the year. The financial targets for the 2022 annual bonus plan, which represent 80% of the potential bonus opportunity, were set in early 2022. As a result of the record financial performance of the Group in 2022 and the highest ever EBITDA (as defined)* outturn of $5.6 billion, the maximum target under each of the financial metrics was exceeded, resulting in a calculated payout level of 100%. Further details are set out in Table 26 on page 120. The remaining 20% of the 2022 Annual Bonus Plan was linked to performance against key personal and strategic objectives. The Remuneration Committee assessed the achievements under the objectives set for 2022, as outlined in Table 26 on page 120, and concluded that they were met to the fullest extent possible. Notwithstanding the outperformance of the target ranges set for the financial metrics during the year, and the personal/strategic goals being met to the fullest extent possible, in the context of the uncertain economic climate and backdrop of high inflation and rising costs, both management and the Committee judged that it would be appropriate to cap the bonus outcome at 85% of maximum. In determining this outcome, the Committee considered input from the SESR Committee that, following an in-depth review of safety performance and, in particular, reportable fatalities which occurred during 2022, the exercise of downward discretion on bonus outcomes would not be warranted in its view. In reaching that conclusion, the SESR Committee was satisfied that none of the reportable fatalities was attributable to a lack of applicable training, deficient safety procedures or defective equipment being used. Furthermore, through detailed analysis and discussion of a range of measures, as well as through engagement with employees, the SESR Committee was satisfied that the appropriate safety culture is in place across the Group. Following discussion, the Committee concurred with the SESR Committee and concluded that downward discretion on the 2022 bonus outcomes outlined above should not be applied. In accordance with the Policy, 33.3% of the bonus amounts for Albert Manifold and Jim Mintern will be deferred into shares for a period of three years. Deferred Share awards are not subject to any additional performance conditions during the deferral period and are adjusted for dividend equivalents based on dividends paid by CRH. Annual bonus awards are subject to recovery provisions for three years from the date of payment (cash awards) or grant (deferred awards). Long-term Incentives Performance Share Plan — 2020 awards In 2020, the executive Directors were granted conditional awards under the 2014 Performance Share Plan. The awards were based on TSR (25% of the award) against a tailored group of key peers (see Table 29 on page 121), Cumulative Cash Flow (50% of the award) and RONA (25% of the award), and performance was measured over the three-year period 1 January 2020 to 31 December 2022. In respect of the TSR element, CRH's TSR over the period ranked in the top quartile of the tailored peer group weighted by market capitalisation and warrants 100% vesting for the TSR element. In respect of the cumulative cash flow element, the actual outturn over the period was $8.7 billion, resulting in 100% vesting for the cash flow element. In respect of the RONA element, the actual outturn was 13.5%, resulting in 100% vesting for the RONA element. Table 27 on page 121 sets out the targets for cashflow and RONA set by the Committee in 2020. When reviewing performance against the targets, the Committee considered a number of adjustments consistent with best practice, for example, to neutralise the impact of significant acquisitions and divestments, and the impairment of subsidiaries in 2020 (as described in the 2020 Annual Report and Form 20-F). The Remuneration Committee The Remuneration Committee consists of seven non-executive Directors considered by the Board to be independent. They bring the range of experience of large organisations and public companies, including experience in the area of senior executive remuneration, to enable the Committee to fulfil its role. Their biographical details are set out on pages 82 to 84. A schedule of attendance at Committee meetings is set out in Table 8 on page 100. The main focus of the Committee is to: • determine and agree with the Board the Group’s policy on executive remuneration; • seek shareholder approval for the Directors’ Remuneration Policy at least every three years; • ensure that CRH’s remuneration structures are fair and responsible; and • consider and approve salaries and other terms of the remuneration packages for the executive Directors and the fee for the Chairman In addition, the Committee: • recommends and monitors the level and structure of remuneration for senior management; and • oversees the preparation of this Directors’ Remuneration Report In considering remuneration levels for executive Directors particularly, the Committee takes into account remuneration trends across the CRH Group, which has a diverse range of operations in 29 countries, in geographic regions which are often at different stages in the economic cycle. The Committee also engages regularly with shareholders and employees on the structure of the remuneration policy and executive incentives (see pages 118 and 109 respectively for more details). Remuneration received by executive Directors in respect of 2022 Details of individual remuneration for executive Directors for the year ended 31 December 2022, including explanatory notes, are given in Table 20 on page 112. Details of Directors’ remuneration charged against profit in the year are given in Table 45 on page 132. The Group changed its reporting currency from euro to US Dollar with effect from 1 January 2020. Notwithstanding this, as the executive Directors are paid in euro, the Committee considers it appropriate that the remuneration figures disclosed in this Report continue to be presented in euro. 2022 Annual Bonus Plan CRH’s Annual Bonus Plan for 2022 was based on a combination of financial targets and personal/strategic goals. The metrics for target payout, which is up to a maximum of 50% of the total annual bonus opportunity, are based on achieving the budget set by the Board in respect of each metric. The threshold level for bonus payouts in 2022 was for the achievement of 92.5% of budget, whereas maximum payout is achieved for stretch performance of 107.5% of budget. The relative weighting of the components of the 2022 plan are set out in Table 26 on page 120. When setting the targets for the annual bonus plan, the Committee makes assumptions regarding exchange rates and development activity. The Committee also compares the proposed targets to the outturn for the previous year to ensure that the targets are sufficiently stretching. In this regard, it is important to note that the metrics in the plan are influenced by the economic cycle and other factors, such as ongoing portfolio management, government infrastructure spending programmes and items outside of management's control and which may not continue into the next financial year. * EBITDA is defined as earnings from continuing operations before interest, taxes, depreciation, amortisation, asset impairment charges, profit on disposals and the Group’s share of equity accounted investments’ profit after tax.

Overview Strategy Report Business Performance & Segmental Reviews Governance Financial Statements Supplemental 20-F and Other Disclosures Shareholder Information 2022 Annual Report and Form 20-F120 2022 Personal and Strategic Objectives Objectives Achievements Refining strategy for an increasingly solutions oriented CRH business (v) • Setting transformation and implementation roadmaps and defining future foundations to sustain such operating models (e.g. talent, technology, functions), and gaining Board support for these Defining a framework for the continuous development of the next-generation of CRH leaders (v) • Working closely with the Board, senior leadership team and employees across the Group to understand, define, articulate and clearly communicate our Purpose (see pages 6 and 7 for more details); • Providing leadership on the development and roll-out of our global talent strategy and development programmes, which help our people to grow their skillset and helps us to identify and attract talent and empower the next generation of leaders • Aligning leaders across the Group around the enablers that will deliver on our strategy to become a solutions-driven organisation and the critical role that our people, culture and mindsets will play in our future success Defining a framework for the continuous development of the next-generation of CRH leaders (v) • Implementation of organisation structure changes resulting in two distinct Divisions, CRH Americas and CRH Europe, with effect from January 2023 Continue the reorganization and design of CRH to reflect the strategic needs of the business (vi) • Setting up of US Investor Relations office in New York and provision of support for US investors and analysts • Supporting the Board during 2022 in its continued assessment of the Group’s listing structures (i) 0% of each element is earned at threshold, 50% at target and 100% at maximum, with a straight-line payout schedule between these points. (ii) Targets have been adjusted to reflect the impact of the share buyback programme and major development activity. (iii) For the purposes of the Annual Bonus Plan, the EPS outcome in the Table above differs from that disclosed elsewhere in this Report as it excludes profits and losses on divestments. Operating cash flow and RONA have been defined as reported internally. For cash flow the figure differs from the net cash inflow from operating activities reported in the Consolidated Statement of Cash Flows, primarily because it is calculated after deducting cash outflows on the purchase of property, plant and equipment (PP&E), net proceeds from the disposal of PP&E, and before deducting interest and tax payments. Similarly, RONA as reported internally differs from the RONA reported in the Non-GAAP Performance Measures in this report as it reflects seasonality and the timing impact of development activity. (iv) For the reasons outlined on page 108 the Committee and the executive Directors judged that the payout under the 2022 annual bonus plan should be capped at 85%. (v) Applies to both the Chief Executive and Chief Financial Officer. (vi) Chief Executive only. (vii) Chief Financial Officer only. As outlined in the Chairman's introduction on page 109, the Committee considers that the vesting outcome is reflective of the Company’s underlying performance over the performance period. In accordance with the Policy, the 2020 award to Albert Manifold will vest in 2025 on completion of an additional two-year holding period. The 2020 award for Jim Mintern was granted prior to his appointment as Chief Financial Officer and, under the terms of the award, is not subject to an additional holding period. Accordingly, the award will vest in April 2023. Vested awards will be adjusted to accrue dividend equivalents based on dividends in the period from grant to the applicable date of vesting. Table 27 on page 121 sets out details of the relevant targets. Table 28 on page 121 sets out details of the awards. 2022 Annual Bonus Plan - Achievement Table 26 2022 Targets - Performance needed for payout at (i) (ii) Measure Weighting (% of total bonus) Threshold Target Maximum 2022 Performance Achieved (iii) Percentage of Maximum Awarded (iv) CRH EPS (iii) 25% 251.7c 272.1c 292.6c 369.3c 21.25% CRH Cash Flow (iii) 30% $2,954m $3,194m $3,433m $4,020m 25.50% CRH RONA (iii) 25% 9.7% 10.5% 11.3% 13.5% 21.25% Personal/Strategic 20% See below 17.00% Total 100% 85.00%
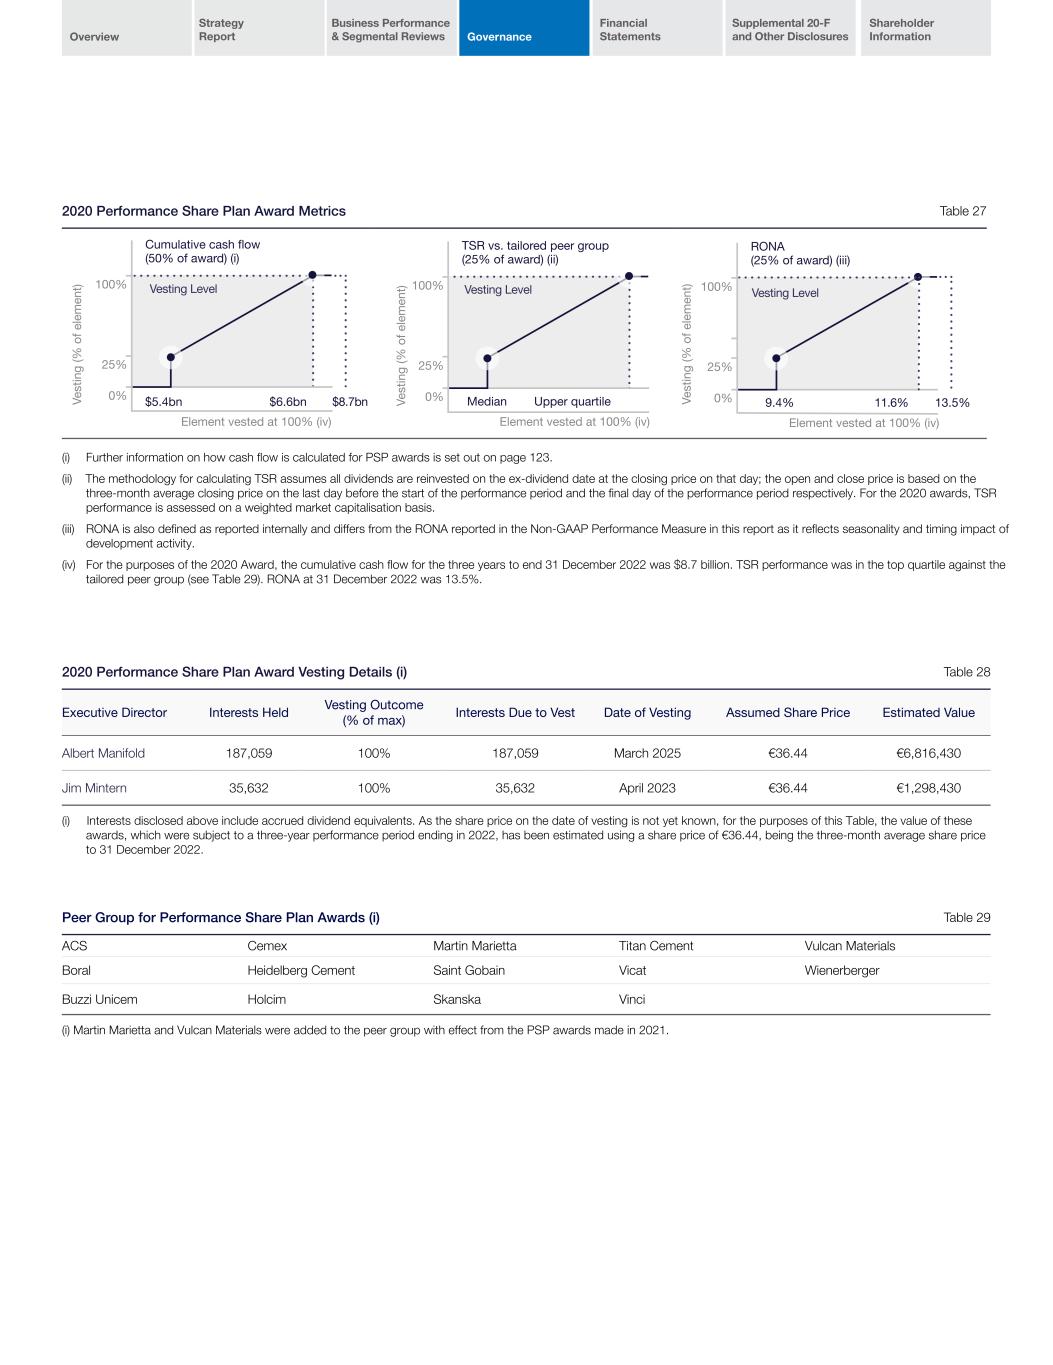
Overview Strategy Report Business Performance & Segmental Reviews Governance Financial Statements Supplemental 20-F and Other Disclosures Shareholder Information 2022 Annual Report and Form 20-F120 2020 Performance Share Plan Award Metrics Table 27 (i) Further information on how cash flow is calculated for PSP awards is set out on page 123. (ii) The methodology for calculating TSR assumes all dividends are reinvested on the ex-dividend date at the closing price on that day; the open and close price is based on the three-month average closing price on the last day before the start of the performance period and the final day of the performance period respectively. For the 2020 awards, TSR performance is assessed on a weighted market capitalisation basis. (iii) RONA is also defined as reported internally and differs from the RONA reported in the Non-GAAP Performance Measure in this report as it reflects seasonality and timing impact of development activity. (iv) For the purposes of the 2020 Award, the cumulative cash flow for the three years to end 31 December 2022 was $8.7 billion. TSR performance was in the top quartile against the tailored peer group (see Table 29). RONA at 31 December 2022 was 13.5%. Element vested at 100% (iv) 25% 0% $5.4bn $6.6bn $8.7bn 100% Cumulative cash flow (50% of award) (i) Vesting Level Ve st in g (% o f e le m en t) Element vested at 100% (iv) Vesting Level Ve st in g (% o f e le m en t) Median Upper quartile 25% 0% 100% TSR vs. tailored peer group (25% of award) (ii) Element vested at 100% (iv) 25% 0% 9.4% 11.6% 100% RONA (25% of award) (iii) Ve st in g (% o f e le m en t) Vesting Level 13.5% 2020 Performance Share Plan Award Vesting Details (i) Table 28 Executive Director Interests Held Vesting Outcome (% of max) Interests Due to Vest Date of Vesting Assumed Share Price Estimated Value Albert Manifold 187,059 100% 187,059 March 2025 €36.44 €6,816,430 Jim Mintern 35,632 100% 35,632 April 2023 €36.44 €1,298,430 (i) Interests disclosed above include accrued dividend equivalents. As the share price on the date of vesting is not yet known, for the purposes of this Table, the value of these awards, which were subject to a three-year performance period ending in 2022, has been estimated using a share price of €36.44, being the three-month average share price to 31 December 2022. Peer Group for Performance Share Plan Awards (i) Table 29 ACS Cemex Martin Marietta Titan Cement Vulcan Materials Boral Heidelberg Cement Saint Gobain Vicat Wienerberger Buzzi Unicem Holcim Skanska Vinci (i) Martin Marietta and Vulcan Materials were added to the peer group with effect from the PSP awards made in 2021.

Overview Strategy Report Business Performance & Segmental Reviews Governance Financial Statements Supplemental 20-F and Other Disclosures Shareholder Information 2022 Annual Report and Form 20-F122 2022 Performance Share Plan Award Metrics Table 30 Sustainability and Inclusion & Diversity scorecard (15% of award) Measure Baseline Threshold (25% vesting) Stretch (iv) (100% vesting) Reason for selection 5% - Driving to Carbon Neutrality • Delivery of roadmap for target of 25% emissions reduction by 2030 33.7mt of CO2 This element will be based on a qualitative assessment by the Committee (and feedback from the SESR Committee) in early 2025 in relation to the development and implementation of a strategy to meet this ambition. Assessment will be informed by a range of criteria, which will be disclosed fully in the relevant Remuneration Report Aligns with the Group’s revised SBTi approved target (v) for a 25% reduction in absolute Scope 1 and Scope 2 CO2e emissions by 2030 (from a 2020 baseline) • Embedding sustainability programmes in relevant operating companies: - for waste management (1/3) 95% 96% 98% Aligns directly with progress towards stated targets for 2030 (waste management target reflects acceleration of ambition to 2025) - for biodiversity (1/3) 91% 92% 94% - for water management (1/3) 80% 81% 91% 5% - Progress Toward a Net Zero Built Environment • Revenue from Products with Enhanced Sustainability Attributes 46% 47% 49% Aligns directly with our ambition to achieve 50% by 2025 5% - Creating an Inclusive & Diverse Company • Representation of Women in Senior Management 14% 16% 19% Aligns directly with our roadmap to our stated 2030 Ambition • Improvement in Inclusion Assessment 68 70 73 Consistent with CRH’s focus on inclusion as a driver of diversity and enabler of innovation. Quantitative assessment based on an externally validated Enterprise Score from engagement surveys (i), (ii) and (iii) see Table 27 on page 121. (iv) Vesting between threshold and stretch will be calculated on a straight-line sliding scale basis. (v) The SBTi's Target Validation Team has classified CRH's Scope 1 and Scope 2 target ambition and has determined that it is in line with a well-below 2oC trajectory. The target boundary includes biogenic emissions and removals from bioenergyy feedstocks. 25% 0% $7.1bn $8.2bn 100% Cumulative cash flow (45% of award) (i) Ve st in g (% o f e le m en t) 25% 0% 11.2% 13.0% 100% RONA (2024) (20% of award) (iii) Ve st in g (% o f e le m en t) 25% 0% Median Upper Quartile 100% TSR vs. tailored peer group (20% of award) (ii) Ve st in g (% o f e le m en t) 2022 Performance Share Plan Award - Grant Details Table 31 Executive Director Date of Grant Number of Shares Market Price on which Award was Based Face Value at Date of Award Face Value on which Award was Based (% of salary) Albert Manifold 3 May 2022 158,310 €38.08 €6,028,445 365% Jim Mintern 3 May 2022 56,528 €38.08 €2,152,586 250%
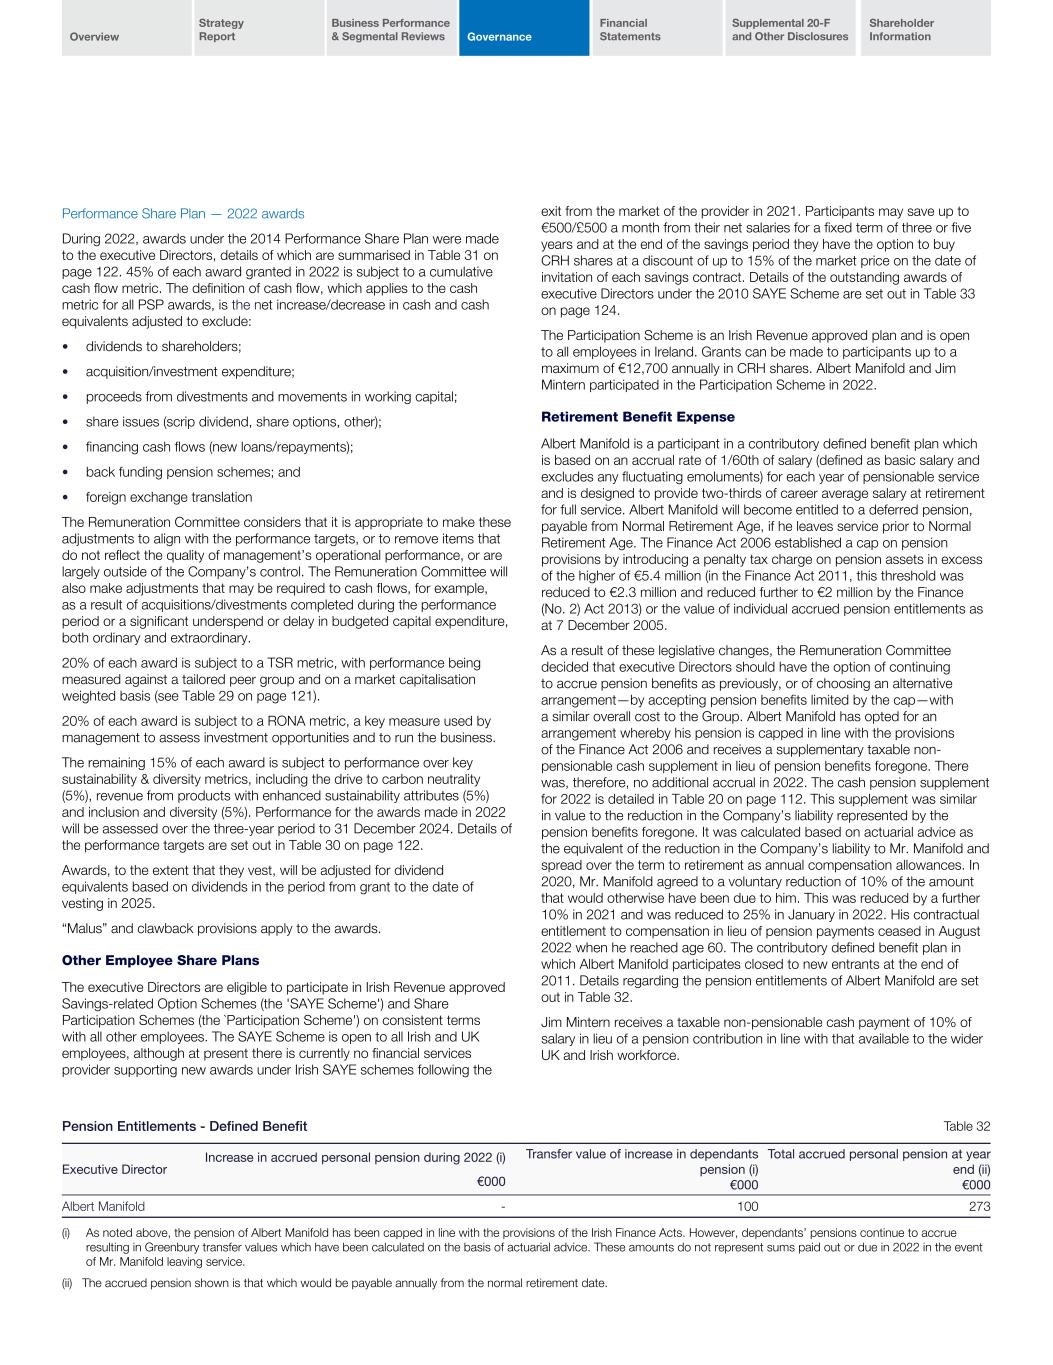
Overview Strategy Report Business Performance & Segmental Reviews Governance Financial Statements Supplemental 20-F and Other Disclosures Shareholder Information 2022 Annual Report and Form 20-F122 Performance Share Plan — 2022 awards During 2022, awards under the 2014 Performance Share Plan were made to the executive Directors, details of which are summarised in Table 31 on page 122. 45% of each award granted in 2022 is subject to a cumulative cash flow metric. The definition of cash flow, which applies to the cash metric for all PSP awards, is the net increase/decrease in cash and cash equivalents adjusted to exclude: • dividends to shareholders; • acquisition/investment expenditure; • proceeds from divestments and movements in working capital; • share issues (scrip dividend, share options, other); • financing cash flows (new loans/repayments); • back funding pension schemes; and • foreign exchange translation exit from the market of the provider in 2021. Participants may save up to €500/£500 a month from their net salaries for a fixed term of three or five years and at the end of the savings period they have the option to buy CRH shares at a discount of up to 15% of the market price on the date of invitation of each savings contract. Details of the outstanding awards of executive Directors under the 2010 SAYE Scheme are set out in Table 33 on page 124. The Participation Scheme is an Irish Revenue approved plan and is open to all employees in Ireland. Grants can be made to participants up to a maximum of €12,700 annually in CRH shares. Albert Manifold and Jim Mintern participated in the Participation Scheme in 2022. Retirement Benefit Expense Albert Manifold is a participant in a contributory defined benefit plan which is based on an accrual rate of 1/60th of salary (defined as basic salary and excludes any fluctuating emoluments) for each year of pensionable service and is designed to provide two-thirds of career average salary at retirement for full service. Albert Manifold will become entitled to a deferred pension, payable from Normal Retirement Age, if he leaves service prior to Normal Retirement Age. The Finance Act 2006 established a cap on pension provisions by introducing a penalty tax charge on pension assets in excess of the higher of €5.4 million (in the Finance Act 2011, this threshold was reduced to €2.3 million and reduced further to €2 million by the Finance (No. 2) Act 2013) or the value of individual accrued pension entitlements as at 7 December 2005. As a result of these legislative changes, the Remuneration Committee decided that executive Directors should have the option of continuing to accrue pension benefits as previously, or of choosing an alternative arrangement—by accepting pension benefits limited by the cap—with a similar overall cost to the Group. Albert Manifold has opted for an arrangement whereby his pension is capped in line with the provisions of the Finance Act 2006 and receives a supplementary taxable non- pensionable cash supplement in lieu of pension benefits foregone. There was, therefore, no additional accrual in 2022. The cash pension supplement for 2022 is detailed in Table 20 on page 112. This supplement was similar in value to the reduction in the Company’s liability represented by the pension benefits foregone. It was calculated based on actuarial advice as the equivalent of the reduction in the Company’s liability to Mr. Manifold and spread over the term to retirement as annual compensation allowances. In 2020, Mr. Manifold agreed to a voluntary reduction of 10% of the amount that would otherwise have been due to him. This was reduced by a further 10% in 2021 and was reduced to 25% in January in 2022. His contractual entitlement to compensation in lieu of pension payments ceased in August 2022 when he reached age 60. The contributory defined benefit plan in which Albert Manifold participates closed to new entrants at the end of 2011. Details regarding the pension entitlements of Albert Manifold are set out in Table 32. Jim Mintern receives a taxable non-pensionable cash payment of 10% of salary in lieu of a pension contribution in line with that available to the wider UK and Irish workforce. The Remuneration Committee considers that it is appropriate to make these adjustments to align with the performance targets, or to remove items that do not reflect the quality of management’s operational performance, or are largely outside of the Company’s control. The Remuneration Committee will also make adjustments that may be required to cash flows, for example, as a result of acquisitions/divestments completed during the performance period or a significant underspend or delay in budgeted capital expenditure, both ordinary and extraordinary. 20% of each award is subject to a TSR metric, with performance being measured against a tailored peer group and on a market capitalisation weighted basis (see Table 29 on page 121). 20% of each award is subject to a RONA metric, a key measure used by management to assess investment opportunities and to run the business. The remaining 15% of each award is subject to performance over key sustainability & diversity metrics, including the drive to carbon neutrality (5%), revenue from products with enhanced sustainability attributes (5%) and inclusion and diversity (5%). Performance for the awards made in 2022 will be assessed over the three-year period to 31 December 2024. Details of the performance targets are set out in Table 30 on page 122. Awards, to the extent that they vest, will be adjusted for dividend equivalents based on dividends in the period from grant to the date of vesting in 2025. “Malus” and clawback provisions apply to the awards. Other Employee Share Plans The executive Directors are eligible to participate in Irish Revenue approved Savings-related Option Schemes (the 'SAYE Scheme') and Share Participation Schemes (the `Participation Scheme') on consistent terms with all other employees. The SAYE Scheme is open to all Irish and UK employees, although at present there is currently no financial services provider supporting new awards under Irish SAYE schemes following the Pension Entitlements - Defined Benefit Table 32 Executive Director Increase in accrued personal pension during 2022 (i) €000 Transfer value of increase in dependants pension (i) €000 Total accrued personal pension at year end (ii) €000 Albert Manifold - 100 273 (i) As noted above, the pension of Albert Manifold has been capped in line with the provisions of the Irish Finance Acts. However, dependants’ pensions continue to accrue resulting in Greenbury transfer values which have been calculated on the basis of actuarial advice. These amounts do not represent sums paid out or due in 2022 in the event of Mr. Manifold leaving service. (ii) The accrued pension shown is that which would be payable annually from the normal retirement date.
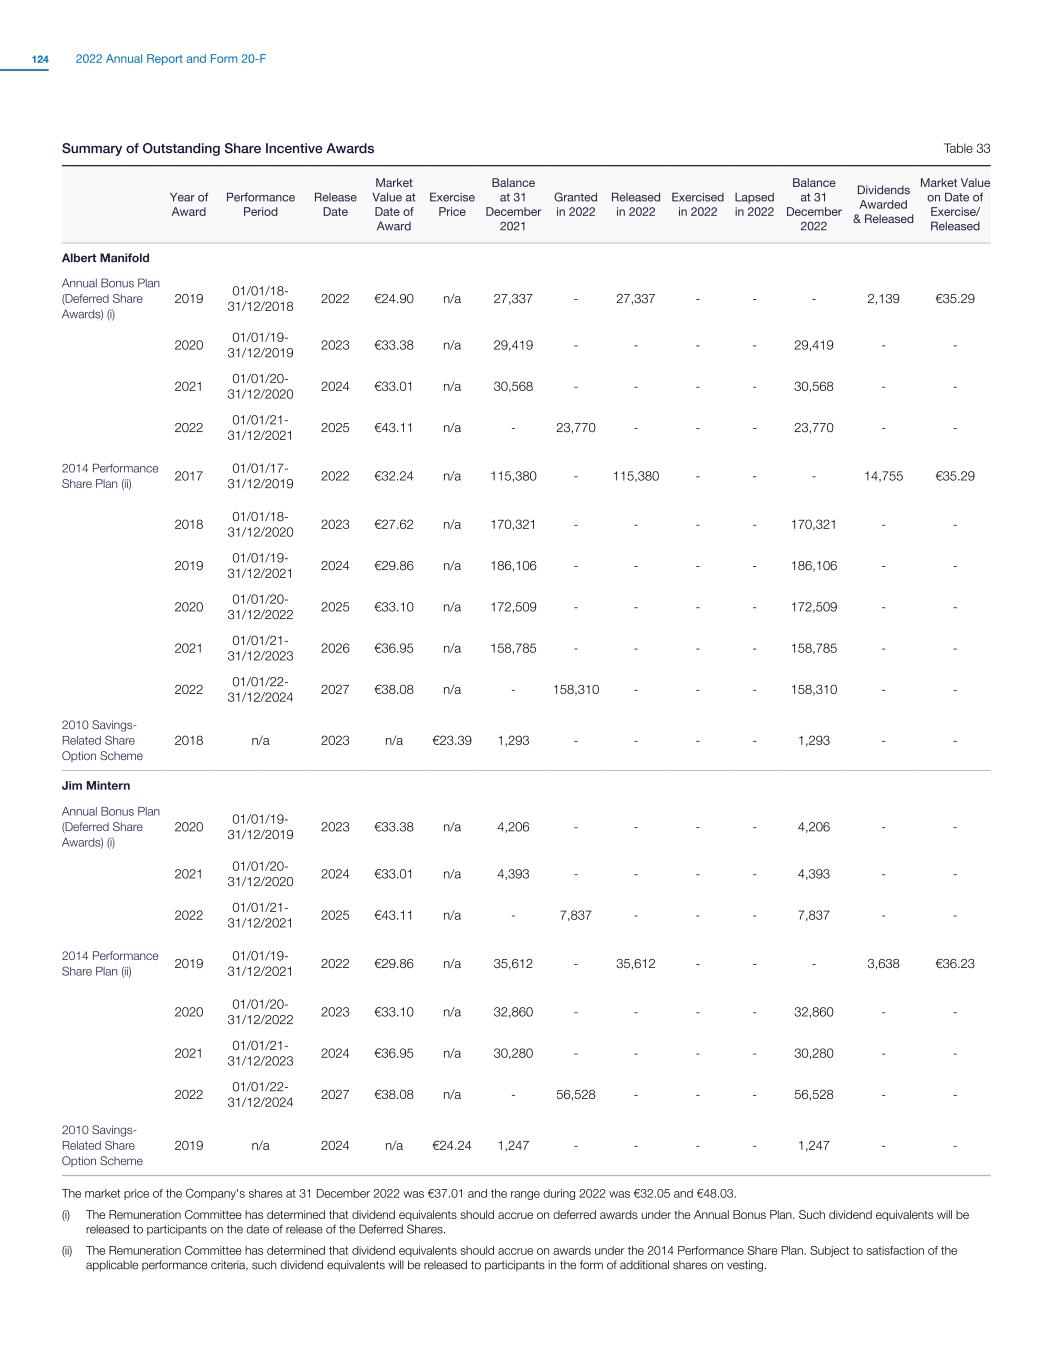
Overview Strategy Report Business Performance & Segmental Reviews Governance Financial Statements Supplemental 20-F and Other Disclosures Shareholder Information 2022 Annual Report and Form 20-F124 Summary of Outstanding Share Incentive Awards Table 33 Year of Award Performance Period Release Date Market Value at Date of Award Exercise Price Balance at 31 December 2021 Granted in 2022 Released in 2022 Exercised in 2022 Lapsed in 2022 Balance at 31 December 2022 Dividends Awarded & Released Market Value on Date of Exercise/ Released Albert Manifold Annual Bonus Plan (Deferred Share Awards) (i) 2019 01/01/18- 31/12/2018 2022 €24.90 n/a 27,337 - 27,337 - - - 2,139 €35.29 2020 01/01/19- 31/12/2019 2023 €33.38 n/a 29,419 - - - - 29,419 - - 2021 01/01/20- 31/12/2020 2024 €33.01 n/a 30,568 - - - - 30,568 - - 2022 01/01/21- 31/12/2021 2025 €43.11 n/a - 23,770 - - - 23,770 - - 2014 Performance Share Plan (ii) 2017 01/01/17- 31/12/2019 2022 €32.24 n/a 115,380 - 115,380 - - - 14,755 €35.29 2018 01/01/18- 31/12/2020 2023 €27.62 n/a 170,321 - - - - 170,321 - - 2019 01/01/19- 31/12/2021 2024 €29.86 n/a 186,106 - - - - 186,106 - - 2020 01/01/20- 31/12/2022 2025 €33.10 n/a 172,509 - - - - 172,509 - - 2021 01/01/21- 31/12/2023 2026 €36.95 n/a 158,785 - - - - 158,785 - - 2022 01/01/22- 31/12/2024 2027 €38.08 n/a - 158,310 - - - 158,310 - - 2010 Savings- Related Share Option Scheme 2018 n/a 2023 n/a €23.39 1,293 - - - - 1,293 - - Jim Mintern Annual Bonus Plan (Deferred Share Awards) (i) 2020 01/01/19- 31/12/2019 2023 €33.38 n/a 4,206 - - - - 4,206 - - 2021 01/01/20- 31/12/2020 2024 €33.01 n/a 4,393 - - - - 4,393 - - 2022 01/01/21- 31/12/2021 2025 €43.11 n/a - 7,837 - - - 7,837 - - 2014 Performance Share Plan (ii) 2019 01/01/19- 31/12/2021 2022 €29.86 n/a 35,612 - 35,612 - - - 3,638 €36.23 2020 01/01/20- 31/12/2022 2023 €33.10 n/a 32,860 - - - - 32,860 - - 2021 01/01/21- 31/12/2023 2024 €36.95 n/a 30,280 - - - - 30,280 - - 2022 01/01/22- 31/12/2024 2027 €38.08 n/a - 56,528 - - - 56,528 - - 2010 Savings- Related Share Option Scheme 2019 n/a 2024 n/a €24.24 1,247 - - - - 1,247 - - The market price of the Company's shares at 31 December 2022 was €37.01 and the range during 2022 was €32.05 and €48.03. (i) The Remuneration Committee has determined that dividend equivalents should accrue on deferred awards under the Annual Bonus Plan. Such dividend equivalents will be released to participants on the date of release of the Deferred Shares. (ii) The Remuneration Committee has determined that dividend equivalents should accrue on awards under the 2014 Performance Share Plan. Subject to satisfaction of the applicable performance criteria, such dividend equivalents will be released to participants in the form of additional shares on vesting.
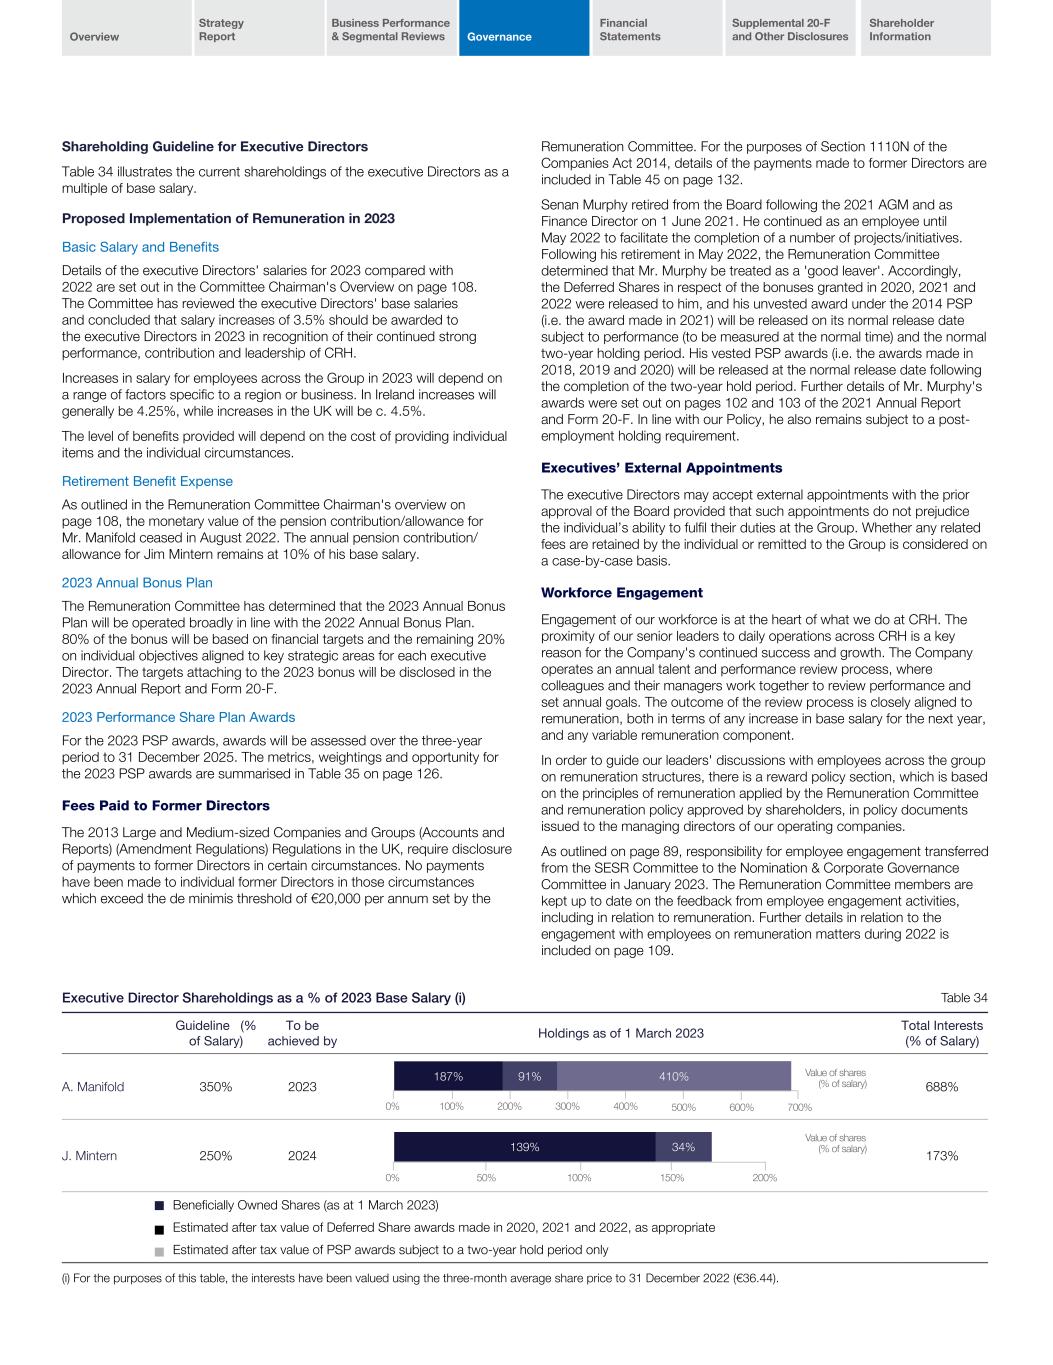
Overview Strategy Report Business Performance & Segmental Reviews Governance Financial Statements Supplemental 20-F and Other Disclosures Shareholder Information 2022 Annual Report and Form 20-F124 Shareholding Guideline for Executive Directors Table 34 illustrates the current shareholdings of the executive Directors as a multiple of base salary. Proposed Implementation of Remuneration in 2023 Basic Salary and Benefits Details of the executive Directors' salaries for 2023 compared with 2022 are set out in the Committee Chairman's Overview on page 108. The Committee has reviewed the executive Directors' base salaries and concluded that salary increases of 3.5% should be awarded to the executive Directors in 2023 in recognition of their continued strong performance, contribution and leadership of CRH. Increases in salary for employees across the Group in 2023 will depend on a range of factors specific to a region or business. In Ireland increases will generally be 4.25%, while increases in the UK will be c. 4.5%. The level of benefits provided will depend on the cost of providing individual items and the individual circumstances. Retirement Benefit Expense As outlined in the Remuneration Committee Chairman's overview on page 108, the monetary value of the pension contribution/allowance for Mr. Manifold ceased in August 2022. The annual pension contribution/ allowance for Jim Mintern remains at 10% of his base salary. 2023 Annual Bonus Plan The Remuneration Committee has determined that the 2023 Annual Bonus Plan will be operated broadly in line with the 2022 Annual Bonus Plan. 80% of the bonus will be based on financial targets and the remaining 20% on individual objectives aligned to key strategic areas for each executive Director. The targets attaching to the 2023 bonus will be disclosed in the 2023 Annual Report and Form 20-F. 2023 Performance Share Plan Awards For the 2023 PSP awards, awards will be assessed over the three-year period to 31 December 2025. The metrics, weightings and opportunity for the 2023 PSP awards are summarised in Table 35 on page 126. Fees Paid to Former Directors The 2013 Large and Medium-sized Companies and Groups (Accounts and Reports) (Amendment Regulations) Regulations in the UK, require disclosure of payments to former Directors in certain circumstances. No payments have been made to individual former Directors in those circumstances which exceed the de minimis threshold of €20,000 per annum set by the Remuneration Committee. For the purposes of Section 1110N of the Companies Act 2014, details of the payments made to former Directors are included in Table 45 on page 132. Senan Murphy retired from the Board following the 2021 AGM and as Finance Director on 1 June 2021. He continued as an employee until May 2022 to facilitate the completion of a number of projects/initiatives. Following his retirement in May 2022, the Remuneration Committee determined that Mr. Murphy be treated as a 'good leaver'. Accordingly, the Deferred Shares in respect of the bonuses granted in 2020, 2021 and 2022 were released to him, and his unvested award under the 2014 PSP (i.e. the award made in 2021) will be released on its normal release date subject to performance (to be measured at the normal time) and the normal two-year holding period. His vested PSP awards (i.e. the awards made in 2018, 2019 and 2020) will be released at the normal release date following the completion of the two-year hold period. Further details of Mr. Murphy's awards were set out on pages 102 and 103 of the 2021 Annual Report and Form 20-F. In line with our Policy, he also remains subject to a post- employment holding requirement. Executives’ External Appointments The executive Directors may accept external appointments with the prior approval of the Board provided that such appointments do not prejudice the individual’s ability to fulfil their duties at the Group. Whether any related fees are retained by the individual or remitted to the Group is considered on a case-by-case basis. Workforce Engagement Engagement of our workforce is at the heart of what we do at CRH. The proximity of our senior leaders to daily operations across CRH is a key reason for the Company's continued success and growth. The Company operates an annual talent and performance review process, where colleagues and their managers work together to review performance and set annual goals. The outcome of the review process is closely aligned to remuneration, both in terms of any increase in base salary for the next year, and any variable remuneration component. In order to guide our leaders' discussions with employees across the group on remuneration structures, there is a reward policy section, which is based on the principles of remuneration applied by the Remuneration Committee and remuneration policy approved by shareholders, in policy documents issued to the managing directors of our operating companies. As outlined on page 89, responsibility for employee engagement transferred from the SESR Committee to the Nomination & Corporate Governance Committee in January 2023. The Remuneration Committee members are kept up to date on the feedback from employee engagement activities, including in relation to remuneration. Further details in relation to the engagement with employees on remuneration matters during 2022 is included on page 109. Executive Director Shareholdings as a % of 2023 Base Salary (i) Table 34 Guideline (% of Salary) To be achieved by Holdings as of 1 March 2023 Total Interests (% of Salary) A. Manifold 350% 2023 688% J. Mintern 250% 2024 173% ■ Beneficially Owned Shares (as at 1 March 2023) Estimated after tax value of Deferred Share awards made in 2020, 2021 and 2022, as appropriate Estimated after tax value of PSP awards subject to a two-year hold period only ■ ■ (i) For the purposes of this table, the interests have been valued using the three-month average share price to 31 December 2022 (€36.44). Value of shares (% of salary) 139% 34% 0% 200%150%100%50% Value of shares (% of salary) 187% 91% 410% 0% 400%300%200%100% 500% 600% 700%

Overview Strategy Report Business Performance & Segmental Reviews Governance Financial Statements Supplemental 20-F and Other Disclosures Shareholder Information 2022 Annual Report and Form 20-F126 Performance Share Plan Metrics - 2023 Awards Table 35 Sustainability and Inclusion & Diversity scorecard (15% of award) Measure Baseline Threshold (25% vesting) Stretch (iv) (100% vesting) Reason for selection 5% - Driving to Net Zero • Delivery of roadmap for target of 30% emissions reduction by 2030 36.1mt of CO2 This element will be based on a qualitative assessment by the Committee (and feedback from the SESR Committee) in early 2026 in relation to the development and implementation of a strategy to meet this ambition. Assessment will be informed by a range of criteria, which will be disclosed fully in the relevant Remuneration Report Aligns with the Group’s target for a 30% reduction in absolute Scope 1 and Scope 2 CO2 emissions by 2030 (from a 2021 baseline) which has been validated by the SBTi (v) under the new 1.5°C science-based framework • Embedding sustainability programmes in relevant operating companies: - for waste management (1/3) 96% 97% 99% Aligns directly with progress towards stated targets for 2030 (waste management target reflects acceleration of ambition to 2025) - for biodiversity (1/3) 92% 93% 95% - for water management (1/3) 81% 82% 92% 5% - Progress Toward a Net Zero Built Environment • Revenue from Products with Enhanced Sustainability Attributes 47% 48% 50% Aligns directly with our ambition to achieve 50% by 2025 5% - Creating an Inclusive & Diverse Company • Representation of Women in Senior Management 15% 17% 20% Supports our roadmap to our stated 2030 Ambition • Improvement in Inclusion Assessment 66 70 73 Consistent with CRH’s focus on inclusion as a driver of diversity and enabler of innovation. Quantitative assessment based on an externally validated Enterprise Score from engagement surveys (i), (ii) and (iii) see Table 27 on page 121. (iv) Vesting between threshold and stretch will be calculated on a straight-line sliding scale basis. (v) The SBTi's Target Validation Team has classified CRH's Scope 1 and Scope 2 target ambition and has determined that it is in line with a 1.5°C trajectory. The target boundary includes biogenic emissions and removals from bioenergy feedstocks. 25% 0% $6.8bn $7.9bn 100% Cumulative cash flow (45% of award) (i) Ve st in g (% o f e le m en t) 25% 0% 10.3% 11.9% 100% RONA (2025) (20% of award) (iii) Ve st in g (% o f e le m en t) 25% 0% Median Upper Quartile 100% TSR vs. tailored peer group (20% of award) (ii) Ve st in g (% o f e le m en t)

Overview Strategy Report Business Performance & Segmental Reviews Governance Financial Statements Supplemental 20-F and Other Disclosures Shareholder Information 2022 Annual Report and Form 20-F126 Non-executive Directors The remuneration of non-executive Directors is determined by the Board of Directors. A Committee of the Chairman and the executive Directors considered and approved a 3.5% increase in the fees of the non-executive Directors with effect from 1 January 2023. The Remuneration Committee considered and approved a 3.5% increase for the Chairman. Both increases are in line with the increase received by the executive Directors (see Table 36 for details of the fees applicable with effect from 1 January 2023). Details of the remuneration paid to non-executive Directors in 2022 are set out in Table 37. Changes in the remuneration of the Directors Table 44 on page 131 shows the annual percentage change in the executive and non-executive Directors' salary/fees, benefits and bonus between 2020 and 2022 compared to the change in total average employment costs in respect of employees in the Group as a whole between 2020 and 2022. Total Shareholder Return The value at 31 December 2022 of €100 invested in CRH in 2012, compared with the value of €100 invested in the Eurofirst 300 Index and the FTSE100 Index (which CRH joined in December 2011) is shown in Table 38 on page 128. TSR performance has been compared against the FTSE100 and the Eurofirst 300 as these are broad general market indices of which CRH is a constituent. The Committee, therefore, considers that they offer a reasonable comparison for performance. Compound annual TSR since the formation of the Group in 1970 (assuming the reinvestment of dividends) is 14.8% (2021: 15.5%). Remuneration paid to Chief Executive 2013 – 2022 Table 39 on page 128 shows the total remuneration paid to the Chief Executive in the period 2013 to 2022 inclusive and shows bonuses and vested long-term incentive awards as a percentage of the maximum bonus and award that could have been received in respect of each year. Albert Manifold succeeded Myles Lee as Chief Executive in January 2014. Non-executive Director Fee Structure Table 36 Role 2023 2022 Group Chairman (including non-executive Director salary and fees for Committee work) €669,750 €647,250 Basic non-executive Director fee €93,400 €90,250 Committee fee €33,900 €32,750 Additional fees Senior Independent Director €26,400 €25,500 Remuneration Committee Chairman €31,825 €30,750 Audit Committee Chairman €41,400 €40,000 Combined Senior Independent Director and Committee Chairman €41,400 €40,000 SESR Committee Chairman €31,825 €30,750 Fee for Europe-based non-executive Directors €15,500 €15,000 Fee for US-based non-executive Directors €31,000 €30,000 Individual Remuneration for Non-executive Directors for the year ended 31 December 2022 Table 37 Basic fees (i) €000 Benefits (ii) €000 Other fees (iii) €000 Total €000 2022 2021 2022 2021 2022 2021 2022 2021 2020 Non-executive Directors R. Boucher 90 88 4 5 572 557 666 650 605 C. Dowling (iv) 90 69 3 3 48 37 141 109 – R. Fearon (v) 90 88 – – 63 62 153 150 10 J. Karlström 90 88 – – 48 47 138 135 127 S. Kelly 90 88 – – 103 101 193 189 178 B. Khan (vi) 90 4 – – 63 10 153 14 – L. McKay (v) 90 88 – – 97 62 187 150 10 G.L. Platt 90 88 – – 72 92 162 180 165 M.K. Rhinehart 90 88 – – 83 62 173 150 141 S. Talbot 90 88 3 3 48 47 141 138 127 900 777 10 11 1,197 1,077 2,107 1,865 1,363 (i) Further information in relation to the non-executive Director fee structure is set out in Table 36. (ii) Includes the cost of hotel accommodation for Irish based non-executive Directors in respect of meetings held in Ireland which have been grossed up for Irish tax purposes. (iii) Other Remuneration: Includes remuneration for Chairman, Board Committee work and allowances for non-executive Directors. (iv) Caroline Dowling became a Director on 22 March 2021. (v) Rick Fearon and Lamar McKay became Directors on 3 December 2020. (vi) Badar Khan became a Director on 27 October 2021.
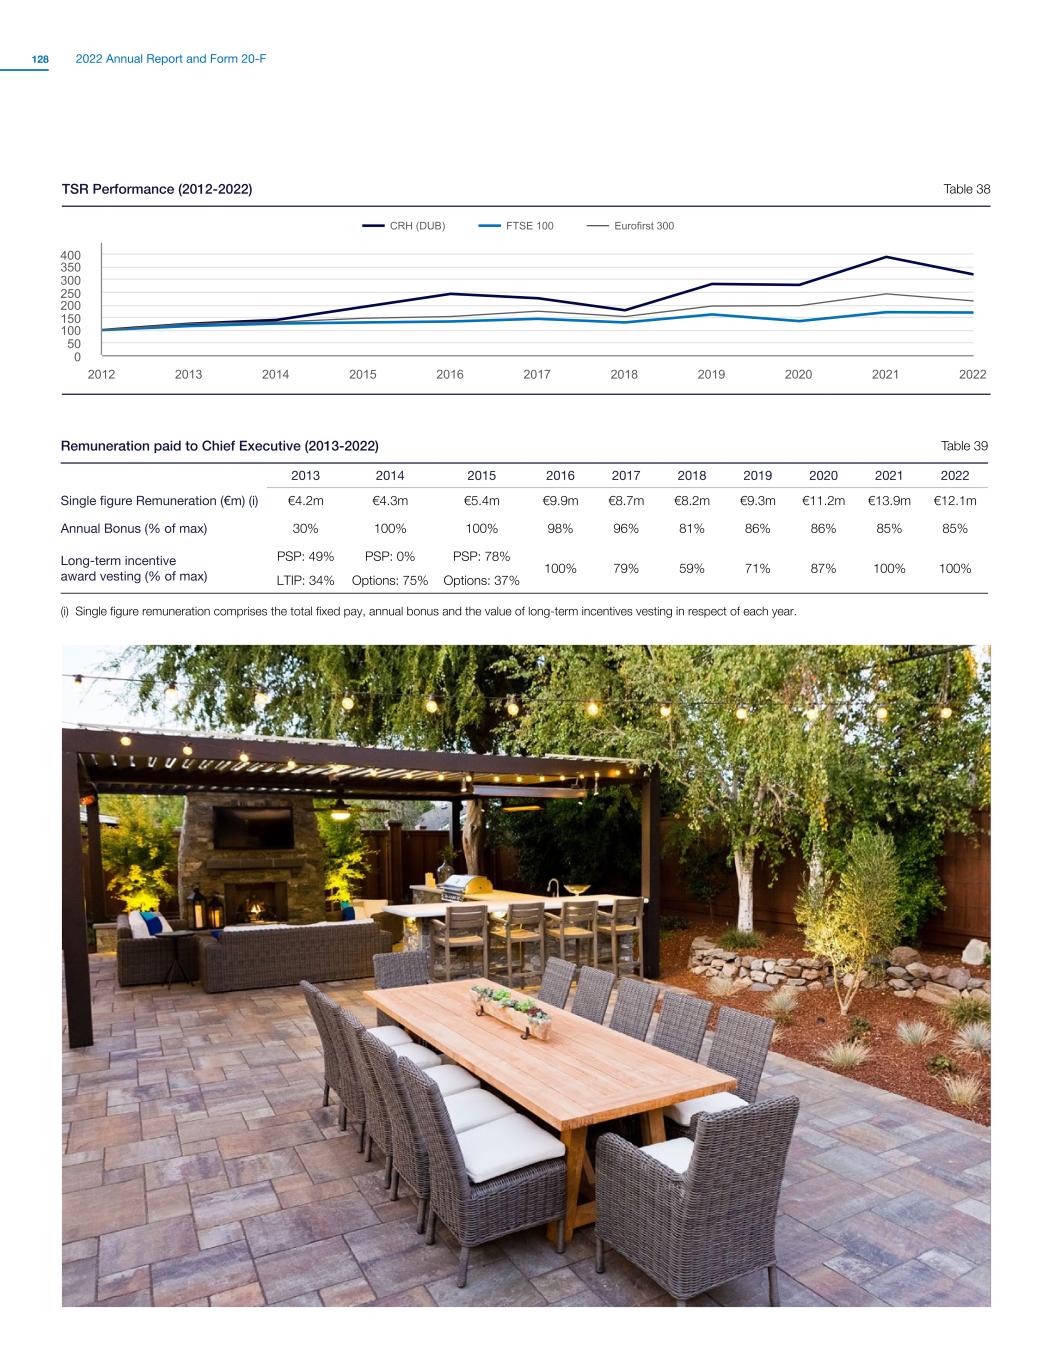
Overview Strategy Report Business Performance & Segmental Reviews Governance Financial Statements Supplemental 20-F and Other Disclosures Shareholder Information 2022 Annual Report and Form 20-F128 TSR Performance (2012-2022) Table 38 CRH (DUB) FTSE 100 Eurofirst 300 2012 2013 2014 2015 2016 2017 2018 2019 2020 2021 2022 0 50 100 150 200 250 300 350 400 Remuneration paid to Chief Executive (2013-2022) Table 39 2013 2014 2015 2016 2017 2018 2019 2020 2021 2022 Single figure Remuneration (€m) (i) €4.2m €4.3m €5.4m €9.9m €8.7m €8.2m €9.3m €11.2m €13.9m €12.1m Annual Bonus (% of max) 30% 100% 100% 98% 96% 81% 86% 86% 85% 85% Long-term incentive award vesting (% of max) PSP: 49% LTIP: 34% PSP: 0% Options: 75% PSP: 78% Options: 37% 100% 79% 59% 71% 87% 100% 100% (i) Single figure remuneration comprises the total fixed pay, annual bonus and the value of long-term incentives vesting in respect of each year.
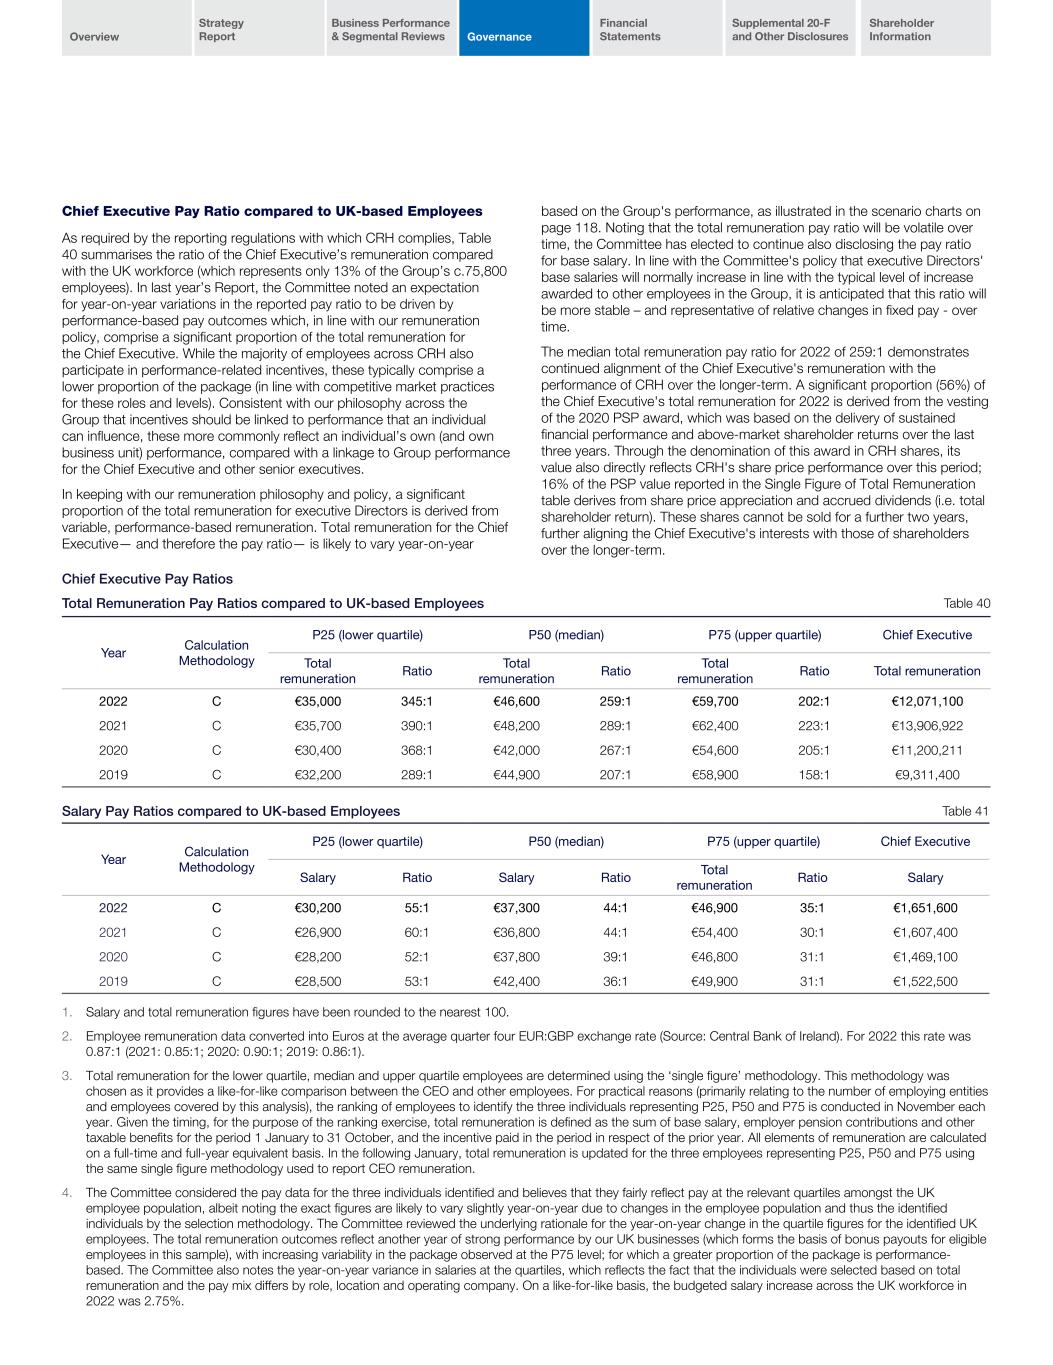
Overview Strategy Report Business Performance & Segmental Reviews Governance Financial Statements Supplemental 20-F and Other Disclosures Shareholder Information 2022 Annual Report and Form 20-F128 Chief Executive Pay Ratio compared to UK-based Employees As required by the reporting regulations with which CRH complies, Table 40 summarises the ratio of the Chief Executive’s remuneration compared with the UK workforce (which represents only 13% of the Group’s c.75,800 employees). In last year’s Report, the Committee noted an expectation for year-on-year variations in the reported pay ratio to be driven by performance-based pay outcomes which, in line with our remuneration policy, comprise a significant proportion of the total remuneration for the Chief Executive. While the majority of employees across CRH also participate in performance-related incentives, these typically comprise a lower proportion of the package (in line with competitive market practices for these roles and levels). Consistent with our philosophy across the Group that incentives should be linked to performance that an individual can influence, these more commonly reflect an individual’s own (and own business unit) performance, compared with a linkage to Group performance for the Chief Executive and other senior executives. In keeping with our remuneration philosophy and policy, a significant proportion of the total remuneration for executive Directors is derived from variable, performance-based remuneration. Total remuneration for the Chief Executive— and therefore the pay ratio— is likely to vary year-on-year Chief Executive Pay Ratios Total Remuneration Pay Ratios compared to UK-based Employees Table 40 Year Calculation Methodology P25 (lower quartile) P50 (median) P75 (upper quartile) Chief Executive Total remuneration Ratio Total remuneration Ratio Total remuneration Ratio Total remuneration 2022 C €35,000 345:1 €46,600 259:1 €59,700 202:1 €12,071,100 2021 C €35,700 390:1 €48,200 289:1 €62,400 223:1 €13,906,922 2020 C €30,400 368:1 €42,000 267:1 €54,600 205:1 €11,200,211 2019 C €32,200 289:1 €44,900 207:1 €58,900 158:1 €9,311,400 based on the Group's performance, as illustrated in the scenario charts on page 118. Noting that the total remuneration pay ratio will be volatile over time, the Committee has elected to continue also disclosing the pay ratio for base salary. In line with the Committee's policy that executive Directors' base salaries will normally increase in line with the typical level of increase awarded to other employees in the Group, it is anticipated that this ratio will be more stable – and representative of relative changes in fixed pay - over time. The median total remuneration pay ratio for 2022 of 259:1 demonstrates continued alignment of the Chief Executive's remuneration with the performance of CRH over the longer-term. A significant proportion (56%) of the Chief Executive's total remuneration for 2022 is derived from the vesting of the 2020 PSP award, which was based on the delivery of sustained financial performance and above-market shareholder returns over the last three years. Through the denomination of this award in CRH shares, its value also directly reflects CRH's share price performance over this period; 16% of the PSP value reported in the Single Figure of Total Remuneration table derives from share price appreciation and accrued dividends (i.e. total shareholder return). These shares cannot be sold for a further two years, further aligning the Chief Executive's interests with those of shareholders over the longer-term. Salary Pay Ratios compared to UK-based Employees Table 41 Year Calculation Methodology P25 (lower quartile) P50 (median) P75 (upper quartile) Chief Executive Salary Ratio Salary Ratio Total remuneration Ratio Salary 2022 C €30,200 55:1 €37,300 44:1 €46,900 35:1 €1,651,600 2021 C €26,900 60:1 €36,800 44:1 €54,400 30:1 €1,607,400 2020 C €28,200 52:1 €37,800 39:1 €46,800 31:1 €1,469,100 2019 C €28,500 53:1 €42,400 36:1 €49,900 31:1 €1,522,500 1. Salary and total remuneration figures have been rounded to the nearest 100. 2. Employee remuneration data converted into Euros at the average quarter four EUR:GBP exchange rate (Source: Central Bank of Ireland). For 2022 this rate was 0.87:1 (2021: 0.85:1; 2020: 0.90:1; 2019: 0.86:1). 3. Total remuneration for the lower quartile, median and upper quartile employees are determined using the ‘single figure’ methodology. This methodology was chosen as it provides a like-for-like comparison between the CEO and other employees. For practical reasons (primarily relating to the number of employing entities and employees covered by this analysis), the ranking of employees to identify the three individuals representing P25, P50 and P75 is conducted in November each year. Given the timing, for the purpose of the ranking exercise, total remuneration is defined as the sum of base salary, employer pension contributions and other taxable benefits for the period 1 January to 31 October, and the incentive paid in the period in respect of the prior year. All elements of remuneration are calculated on a full-time and full-year equivalent basis. In the following January, total remuneration is updated for the three employees representing P25, P50 and P75 using the same single figure methodology used to report CEO remuneration. 4. The Committee considered the pay data for the three individuals identified and believes that they fairly reflect pay at the relevant quartiles amongst the UK employee population, albeit noting the exact figures are likely to vary slightly year-on-year due to changes in the employee population and thus the identified individuals by the selection methodology. The Committee reviewed the underlying rationale for the year-on-year change in the quartile figures for the identified UK employees. The total remuneration outcomes reflect another year of strong performance by our UK businesses (which forms the basis of bonus payouts for eligible employees in this sample), with increasing variability in the package observed at the P75 level; for which a greater proportion of the package is performance- based. The Committee also notes the year-on-year variance in salaries at the quartiles, which reflects the fact that the individuals were selected based on total remuneration and the pay mix differs by role, location and operating company. On a like-for-like basis, the budgeted salary increase across the UK workforce in 2022 was 2.75%.

Overview Strategy Report Business Performance & Segmental Reviews Governance Financial Statements Supplemental 20-F and Other Disclosures Shareholder Information 2022 Annual Report and Form 20-F130 Relative Importance of Spend on Pay Table 42 sets out the amount paid by the Group in remuneration to employees compared to the amount returned to shareholders as part of the share buyback programme and dividend distributions made to shareholders in 2021 and 2022. We have also shown the change in EBITDA (as defined)* performance year-on-year to provide an indication of the change in profit performance. Advisers to the Remuneration Committee In 2022, Ellason acted as the Committee's independent remuneration consultants. The Committee has satisfied itself that the advice provided by Ellason is robust and independent and that the Ellason engagement partner and team that provide remuneration advice to the Committee do not have connections with CRH plc that may impair their independence. Ellason are signatories to the Voluntary Code of Conduct in relation to executive remuneration consulting in the UK. During 2022, Ellason provided the following remuneration services: • research and advice regarding remuneration trends, best practice and remuneration levels for executive and non-executive Directors in companies of similar size and complexity; • advice in relation to remuneration matters generally; and • attendance at Committee meetings, when required In 2022, the total fees paid to Ellason were £54,162. 2022 Annual General Meeting The voting outcome in respect of the remuneration-related votes at the 2022 AGM is set out in Table 19 on page 111. Lamar McKay Chair of Remuneration Committee 1 March 2023 Relative Importance of Spend on Pay Table 42 Share Buyback/ Dividends 2022 2021 Remuneration received by all employees 2022 2021 EBITDA (as defined)* 2022 2021 *EBITDA is defined as earnings from continuing operations before interest, taxes, depreciation, amortisation, asset impairment charges, profit on disposals and the Group’s share of equity accounted investments’ profit after tax. $5.6bn $5.0bn $6.4bn $6.2bn Shares Repurchased Dividends Paid $0.9bn $0.9bn Total: $1.8 billion $1.2bn $0.9bn Total: $2.1 billion

Overview Strategy Report Business Performance & Segmental Reviews Governance Financial Statements Supplemental 20-F and Other Disclosures Shareholder Information 2022 Annual Report and Form 20-F130 Shareholdings of Directors and Company Secretary Table 43 Beneficially Owned (i) Name 31 December 2022 31 December 2021 Executive Directors A. Manifold (ii) 87,692 89,727 J. Mintern (ii) 33,957 33,603 Non-executive Directors R. Boucher 23,450 23,300 C. Dowling 1,000 1,000 R. Fearon (iii) 5,000 5,000 J. Karlström 2,000 2,000 S. Kelly (iii) 1,000 1,000 B. Khan (iii) 1,000 1,000 L. McKay (iii) 4,000 4,000 G.L. Platt 1,108 1,082 M.K. Rhinehart (iii) 1,000 1,000 S. Talbot 1,550 1,550 Company Secretary N. Colgan 5,441 5,087 Total 168,198 169,349 (i) Excludes awards of Deferred Shares, details of which are disclosed on page 124. The Directors and Company Secretary do not have any special voting rights. (ii) The total interests of the executive Directors, using the methodology set out in the Shareholding Guidelines section on page 117, are illustrated in Table 34 on page 125. (iii) Holdings in the form of American Depositary Receipts (ADRs). Changes in the Remuneration of the Directors Table 44 Percentage change from prior year Salary/Fees Benefits Bonus 2022 2021 2020 2022 2021 2020 2022 2021 2020 Executive Directors A. Manifold +3% +9% -4% +35% -15% -37% +3% +2% +3% J. Mintern (i) +3% n/a n/a +52% n/a n/a +3% n/a n/a Non-executive Directors R. Boucher +3% +6% -6% -20% n/a n/a n/a n/a n/a C. Dowling (ii) +2% n/a n/a - n/a n/a n/a n/a n/a R. Fearon +2% +6% n/a n/a n/a n/a n/a n/a n/a J. Karlström +2% +6% -6% n/a n/a n/a n/a n/a n/a S. Kelly +2% +6% -6% n/a n/a n/a n/a n/a n/a B. Khan (iii) +2% n/a n/a n/a n/a n/a n/a n/a n/a L. McKay +25% +6% n/a n/a n/a n/a n/a n/a n/a G.L. Platt -10% +6% -6% n/a n/a n/a n/a n/a n/a M.K. Rhinehart +15% +6% -6% n/a n/a n/a n/a n/a n/a S. Talbot +2% +6% -6% - n/a n/a n/a n/a n/a Average Workforce Costs (iv) -1.6% +4.9% +1% (i) Appointed with effect from 1 June 2021. Increase in 2022 shown on a full year equivalent basis. (ii) Appointed with effect from 22 March 2021. Increase in 2022 shown on a full year equivalent basis. (iii) Appointed with effect from 27 October 2021. Increase in 2022 shown on a full year equivalent basis. (iv) For the purposes of Section 1110N(2)(e)(ii), CRH plc had no employees in each of the financial years from 2017 to 2022.
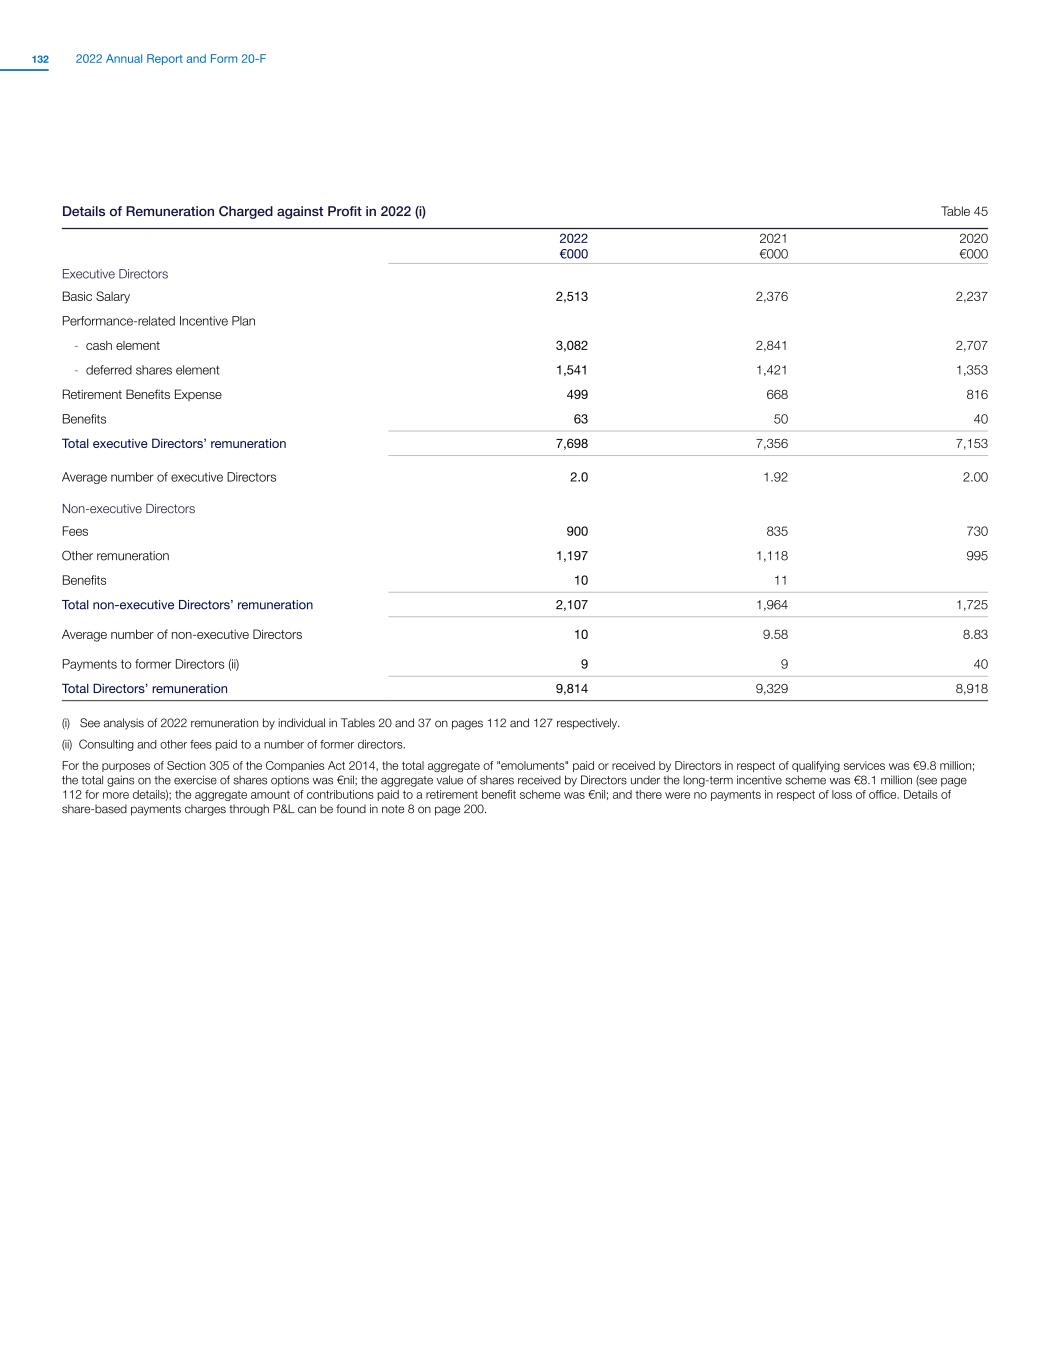
Overview Strategy Report Business Performance & Segmental Reviews Governance Financial Statements Supplemental 20-F and Other Disclosures Shareholder Information 2022 Annual Report and Form 20-F132 Details of Remuneration Charged against Profit in 2022 (i) Table 45 2022 €000 2021 €000 2020 €000 Executive Directors Basic Salary 2,513 2,376 2,237 Performance-related Incentive Plan - cash element 3,082 2,841 2,707 - deferred shares element 1,541 1,421 1,353 Retirement Benefits Expense 499 668 816 Benefits 63 50 40 Total executive Directors’ remuneration 7,698 7,356 7,153 Average number of executive Directors 2.0 1.92 2.00 Non-executive Directors Fees 900 835 730 Other remuneration 1,197 1,118 995 Benefits 10 11 Total non-executive Directors’ remuneration 2,107 1,964 1,725 Average number of non-executive Directors 10 9.58 8.83 Payments to former Directors (ii) 9 9 40 Total Directors’ remuneration 9,814 9,329 8,918 (i) See analysis of 2022 remuneration by individual in Tables 20 and 37 on pages 112 and 127 respectively. (ii) Consulting and other fees paid to a number of former directors. For the purposes of Section 305 of the Companies Act 2014, the total aggregate of "emoluments" paid or received by Directors in respect of qualifying services was €9.8 million; the total gains on the exercise of shares options was €nil; the aggregate value of shares received by Directors under the long-term incentive scheme was €8.1 million (see page 112 for more details); the aggregate amount of contributions paid to a retirement benefit scheme was €nil; and there were no payments in respect of loss of office. Details of share-based payments charges through P&L can be found in note 8 on page 200.
Overview Strategy Report Business Performance & Segmental Reviews Governance Financial Statements Supplemental 20-F and Other Disclosures Shareholder Information 2022 Annual Report and Form 20-F132

Overview Strategy Report Business Performance & Segmental Reviews Governance Financial Statements Supplemental 20-F and Other Disclosures Shareholder Information 2022 Annual Report and Form 20-F134 Directors’ Report The Directors submit their report and the audited Consolidated Financial Statements for the year ended 31 December 2022. Principal Activity, Results for the Year and Review of Business CRH is the leading building materials business in the world, employing c.75,800 people at c.3,160 locations in 29 countries. CRH manufactures and supplies a range of building materials, products and innovative solutions for the construction industry. From primary materials, to products that are highly engineered and high-value-added, to integrated building solutions that enable faster, more sustainable construction, CRH is uniquely positioned to address evolving trends in global construction markets. Our products can be found throughout the built environment in a wide range of construction projects from major public infrastructure to homes and commercial buildings. The Group has c.900 subsidiary, joint venture and associate undertakings; the principal ones as at 31 December 2022 are listed on pages 290 to 293. The Group's strategy, business model and development activity are summarised on pages 11 to 79 and are deemed to be incorporated in this part of the Directors' Report. As set out in the Consolidated Income Statement on page 176, the Group reported a profit before tax for the year of $3.5 billion from continuing operations. Comprehensive reviews of the financial and operating performance of the Group during 2022 are set out in the Business Performance section on pages 61 to 79; key financial performance indicators are set out on page 65. The treasury policy and objectives of the Group are set out in detail in note 22 to the Consolidated Financial Statements. During the year ended 31 December 2022, 29,755,861 ordinary shares were repurchased on the Euronext Dublin for a total of $1.2 billion, at an average price of $39.22 per share. Further details in relation to the buyback programme and the Company's profits available for distribution are set on pages 137 and 241 respectively. Dividend CRH's capital allocation policy reflects the Group's strategy of generating industry-leading returns through value-accretive allocation of capital while delivering long-term dividend growth for shareholders.The Board continues to believe that a progressive dividend policy is appropriate for the Group and further to the 5% dividend increase in 2021, an interim dividend of $0.24 (2021: $0.23) per share was paid in October 2022. The Board is recommending a final dividend of $1.03 per share. This would give a total dividend of $1.27 for the year (2021: $1.21), an increase of 5% over last year. The earnings per share for the year were $3.50, representing a cover of 2.8x the proposed dividend for the year. It is proposed to pay the final dividend on 4 May 2023 to shareholders registered at the close of business on 17 March 2023. The final dividend will be paid wholly in cash. Reflecting the resilience of our business model and continued strong cash generation, the Board believes that a through-the-cycle dividend cover of 2.0 to 2.5 times is appropriate for the Group going forward. 2023 Outlook The 2023 outlook set out in the Chief Executive’s Review on page 15 is deemed to be incorporated in this part of the Directors’ Report. Non-Financial Reporting The European Union (Disclosure of Non-Financial and Diversity Information by certain large undertakings and groups) Regulations 2017 (the ‘Non- Financial Regulations’) requires CRH to provide certain non-financial information to investors and other stakeholders necessary to provide them with an understanding of the Company’s development, performance, position and impact of its activity. Table 46 provides more details on the information required to be provided by the Non-Financial Regulations and where this information has been provided in this Annual Report and Form 20-F. Non-Financial Reporting Table 46 Reporting Requirement Relevant Policies (i) Environmental and Climate-Related Matters Environmental Policy Social & Employee Matters Health & Safety Policy, Social Policy Human Rights Social Policy, Code of Business Conduct Anti-bribery & Corruption Code of Business Conduct Business Model – Non-financial KPIs – Principal Risks – Location of Information (ii) Sustainability, Transparency on Climate, Risk, Governance Sustainability, SESR Committee Report and Principal Risks Sustainability Sustainability and Risk Factors Business Model Key Performance Indicators Risk Management Principal Risks and Uncertainties (Risk Factors) Pages 24 to 49, 56 to 59, 104 to 105, 142 and 150 to 156 24 to 49, 104 to 105 and 139 to 148 24 to 49, and 101 24 to 49, and 145 20 and 21 65 50 to 54 139 to 148 (i) Policies are available on CRH’s website, www.crh.com. (ii) The referenced sections are deemed to be incorporated within this Directors’ Report.
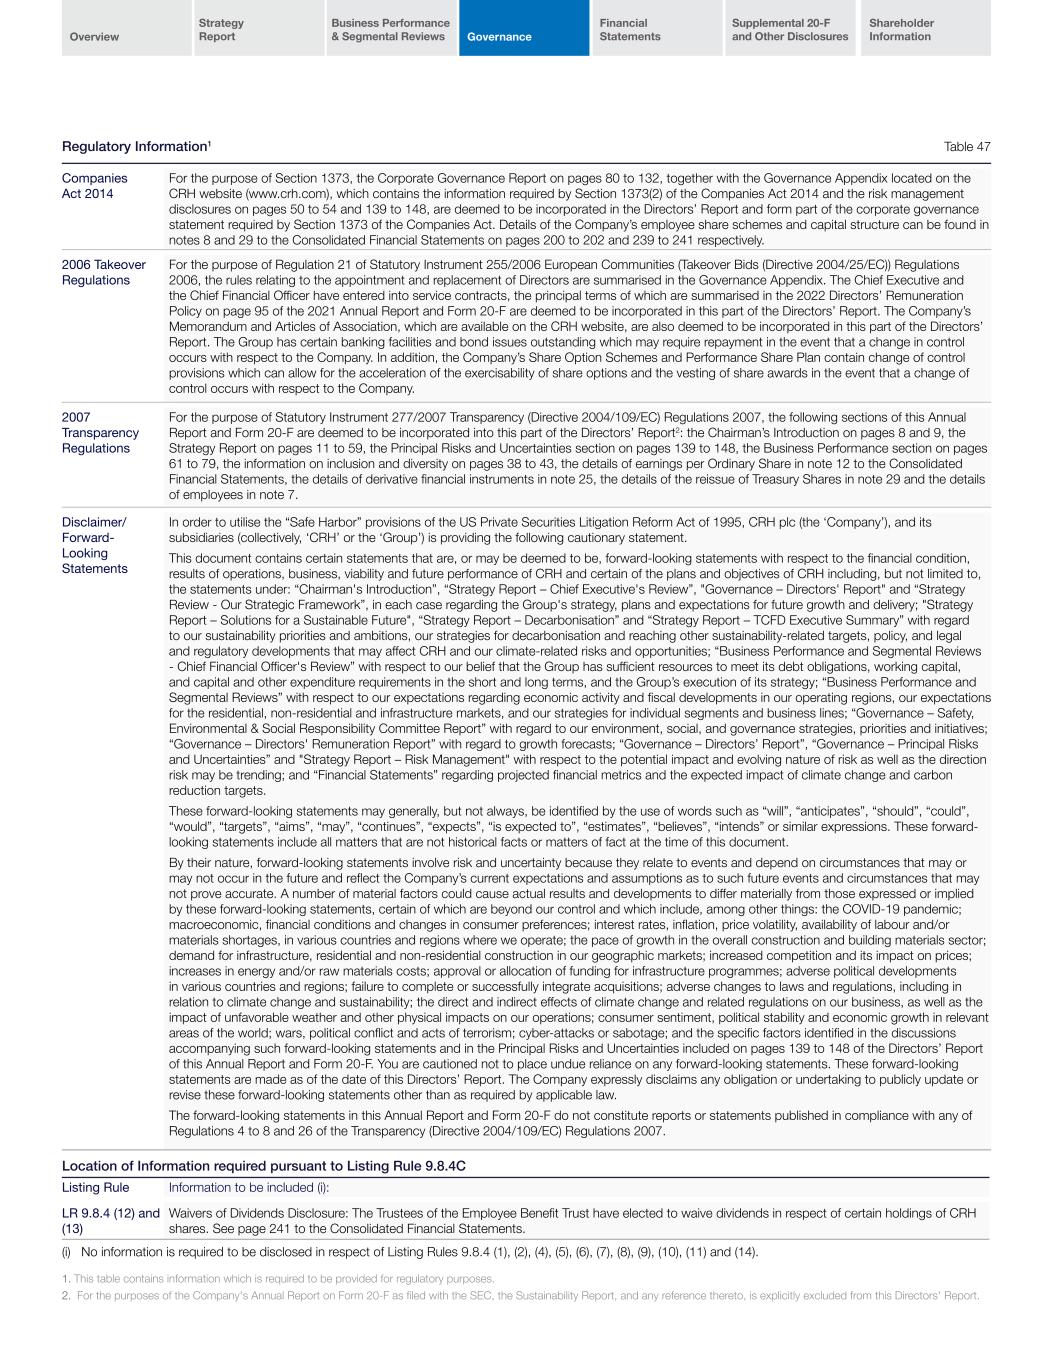
Overview Strategy Report Business Performance & Segmental Reviews Governance Financial Statements Supplemental 20-F and Other Disclosures Shareholder Information 2022 Annual Report and Form 20-F134 Regulatory Information1 Table 47 Companies Act 2014 For the purpose of Section 1373, the Corporate Governance Report on pages 80 to 132, together with the Governance Appendix located on the CRH website (www.crh.com), which contains the information required by Section 1373(2) of the Companies Act 2014 and the risk management disclosures on pages 50 to 54 and 139 to 148, are deemed to be incorporated in the Directors’ Report and form part of the corporate governance statement required by Section 1373 of the Companies Act. Details of the Company’s employee share schemes and capital structure can be found in notes 8 and 29 to the Consolidated Financial Statements on pages 200 to 202 and 239 to 241 respectively. 2006 Takeover Regulations For the purpose of Regulation 21 of Statutory Instrument 255/2006 European Communities (Takeover Bids (Directive 2004/25/EC)) Regulations 2006, the rules relating to the appointment and replacement of Directors are summarised in the Governance Appendix. The Chief Executive and the Chief Financial Officer have entered into service contracts, the principal terms of which are summarised in the 2022 Directors’ Remuneration Policy on page 95 of the 2021 Annual Report and Form 20-F are deemed to be incorporated in this part of the Directors’ Report. The Company’s Memorandum and Articles of Association, which are available on the CRH website, are also deemed to be incorporated in this part of the Directors’ Report. The Group has certain banking facilities and bond issues outstanding which may require repayment in the event that a change in control occurs with respect to the Company. In addition, the Company’s Share Option Schemes and Performance Share Plan contain change of control provisions which can allow for the acceleration of the exercisability of share options and the vesting of share awards in the event that a change of control occurs with respect to the Company. 2007 Transparency Regulations For the purpose of Statutory Instrument 277/2007 Transparency (Directive 2004/109/EC) Regulations 2007, the following sections of this Annual Report and Form 20-F are deemed to be incorporated into this part of the Directors’ Report2: the Chairman’s Introduction on pages 8 and 9, the Strategy Report on pages 11 to 59, the Principal Risks and Uncertainties section on pages 139 to 148, the Business Performance section on pages 61 to 79, the information on inclusion and diversity on pages 38 to 43, the details of earnings per Ordinary Share in note 12 to the Consolidated Financial Statements, the details of derivative financial instruments in note 25, the details of the reissue of Treasury Shares in note 29 and the details of employees in note 7. Disclaimer/ Forward- Looking Statements In order to utilise the “Safe Harbor” provisions of the US Private Securities Litigation Reform Act of 1995, CRH plc (the ‘Company’), and its subsidiaries (collectively, ‘CRH’ or the ‘Group’) is providing the following cautionary statement. This document contains certain statements that are, or may be deemed to be, forward-looking statements with respect to the financial condition, results of operations, business, viability and future performance of CRH and certain of the plans and objectives of CRH including, but not limited to, the statements under: “Chairman's Introduction”, “Strategy Report – Chief Executive's Review”, "Governance – Directors' Report" and “Strategy Review - Our Strategic Framework”, in each case regarding the Group's strategy, plans and expectations for future growth and delivery; "Strategy Report – Solutions for a Sustainable Future", “Strategy Report – Decarbonisation” and “Strategy Report – TCFD Executive Summary” with regard to our sustainability priorities and ambitions, our strategies for decarbonisation and reaching other sustainability-related targets, policy, and legal and regulatory developments that may affect CRH and our climate-related risks and opportunities; “Business Performance and Segmental Reviews - Chief Financial Officer's Review” with respect to our belief that the Group has sufficient resources to meet its debt obligations, working capital, and capital and other expenditure requirements in the short and long terms, and the Group’s execution of its strategy; “Business Performance and Segmental Reviews” with respect to our expectations regarding economic activity and fiscal developments in our operating regions, our expectations for the residential, non-residential and infrastructure markets, and our strategies for individual segments and business lines; “Governance – Safety, Environmental & Social Responsibility Committee Report” with regard to our environment, social, and governance strategies, priorities and initiatives; “Governance – Directors' Remuneration Report” with regard to growth forecasts; “Governance – Directors’ Report”, “Governance – Principal Risks and Uncertainties” and "Strategy Report – Risk Management" with respect to the potential impact and evolving nature of risk as well as the direction risk may be trending; and “Financial Statements” regarding projected financial metrics and the expected impact of climate change and carbon reduction targets. These forward-looking statements may generally, but not always, be identified by the use of words such as “will”, “anticipates”, “should”, “could”, “would”, “targets”, “aims”, “may”, “continues”, “expects”, “is expected to”, “estimates”, “believes”, “intends” or similar expressions. These forward- looking statements include all matters that are not historical facts or matters of fact at the time of this document. By their nature, forward-looking statements involve risk and uncertainty because they relate to events and depend on circumstances that may or may not occur in the future and reflect the Company’s current expectations and assumptions as to such future events and circumstances that may not prove accurate. A number of material factors could cause actual results and developments to differ materially from those expressed or implied by these forward-looking statements, certain of which are beyond our control and which include, among other things: the COVID-19 pandemic; macroeconomic, financial conditions and changes in consumer preferences; interest rates, inflation, price volatility, availability of labour and/or materials shortages, in various countries and regions where we operate; the pace of growth in the overall construction and building materials sector; demand for infrastructure, residential and non-residential construction in our geographic markets; increased competition and its impact on prices; increases in energy and/or raw materials costs; approval or allocation of funding for infrastructure programmes; adverse political developments in various countries and regions; failure to complete or successfully integrate acquisitions; adverse changes to laws and regulations, including in relation to climate change and sustainability; the direct and indirect effects of climate change and related regulations on our business, as well as the impact of unfavorable weather and other physical impacts on our operations; consumer sentiment, political stability and economic growth in relevant areas of the world; wars, political conflict and acts of terrorism; cyber-attacks or sabotage; and the specific factors identified in the discussions accompanying such forward-looking statements and in the Principal Risks and Uncertainties included on pages 139 to 148 of the Directors’ Report of this Annual Report and Form 20-F. You are cautioned not to place undue reliance on any forward-looking statements. These forward-looking statements are made as of the date of this Directors’ Report. The Company expressly disclaims any obligation or undertaking to publicly update or revise these forward-looking statements other than as required by applicable law. The forward-looking statements in this Annual Report and Form 20-F do not constitute reports or statements published in compliance with any of Regulations 4 to 8 and 26 of the Transparency (Directive 2004/109/EC) Regulations 2007. Location of Information required pursuant to Listing Rule 9.8.4C Listing Rule Information to be included (i): LR 9.8.4 (12) and (13) Waivers of Dividends Disclosure: The Trustees of the Employee Benefit Trust have elected to waive dividends in respect of certain holdings of CRH shares. See page 241 to the Consolidated Financial Statements. (i) No information is required to be disclosed in respect of Listing Rules 9.8.4 (1), (2), (4), (5), (6), (7), (8), (9), (10), (11) and (14). 1. This table contains information which is required to be provided for
regulatory purposes. 2. For the purposes of the Company's Annual Report on Form 20-F as filed with the SEC, the Sustainability Report, and any reference thereto, is explicitly excluded from this Directors' Report.
Overview Strategy Report Business Performance & Segmental Reviews Governance Financial Statements Supplemental 20-F and Other Disclosures Shareholder Information 2022 Annual Report and Form 20-F136 • the financial position of the Group, its cash flows, liquidity position and borrowing facilities which are described in the Business Performance Review on pages 60 to 79. In addition, notes 21 to 25 to the Consolidated Financial Statements include the Group's objectives, policies and processes for managing its capital; its financial risk management objectives; details of its financial instruments and hedging activities; and its exposures to credit, currency and liquidity risks Directors’ Report continued Going Concern Statement The Group continues to serve the societal need for building materials products and integrated solutions and in doing so creating long-term value and delivering superior returns for all our stakeholders. The Board’s consideration of the long-term prospects of the Group is an extension of the strategic planning process. This process includes regular budget reviews as part of the internal reporting cycle, financial forecasting and performance reviews, a comprehensive enterprise risk management assessment and scenario planning involving our principal risks and uncertainties. Our business strategy is focused on creating long-term value and delivering superior returns for all our stakeholders through disciplined capital management and operational efficiency. Going Concern The Group’s going concern assessment focuses on immediately available sources of liquidity to fund our anticipated trading pattern, plus anticipated acquisition spend, returns to shareholders and capital investment, ensuring appropriate headroom. The Directors are required to evaluate that the Group has adequate resources to continue in operational existence for a period of at least 12 months from the date of approval of the financial statements (the 'period of assessment'). Assessment of Going Concern In carrying out their assessment of going concern, the Directors considered a wide range of information, including: • the Group's business activities together with the factors likely to affect its future development, performance and position which are set out in the Strategy Review and in this report on pages 11 to 59; • the Group’s Strategic plan (“the plan”) and projections and the financial position of the Group considering the Group’s cash flows, committed funding and liquidity positions, forecast future funding requirements, other key financial ratios, including those relevant to maintaining the Group’s investment grade credit ratings and the Group’s 2030 climate targets; and 1. For more information in relation to the Group's risk management and internal control systems, please see the Risk Management and Internal Control section in the Supplemental 20-F and Other Disclosures section on page 269. Conclusion While the Board acknowledges that the potential severity, complexity and velocity of the risks assessed may change, based on its review of the Group's activities, cash flows, liquidity position and borrowing facilities for the period of assessment, and having assessed the principal risks facing the Group, the Board has a reasonable expectation that CRH plc, and the Group as a whole, has adequate financial and other resources to continue in operational existence for the period of assessment and will be able to meet its liabilities as they fall due over the aforementioned 12-month going concern period. For this reason, the Directors continue to adopt the going concern basis in preparing the Consolidated Financial Statements. Risk Management and Internal Control1 The Directors confirm that, in addition to the monitoring carried out by the Audit Committee under its Terms of Reference, they have reviewed the effectiveness of the Group’s risk management and internal control systems up to and including the date of approval of the financial statements. This review had regard to all material controls, including financial, operational and compliance controls that could affect the Group’s business.
Overview Strategy Report Business Performance & Segmental Reviews Governance Financial Statements Supplemental 20-F and Other Disclosures Shareholder Information 2022 Annual Report and Form 20-F136 Directors’ Remuneration Report Resolution 3 to be proposed at the 2023 AGM deals with the 2022 Directors’ Remuneration Report (excluding the Remuneration Policy summary), as set out on pages 108 to 132, which is being presented to shareholders for the purposes of a non-binding advisory vote in line with the requirements of Section 1110N(6) of the Companies Act, 2014. Changes to the Board of Directors Under the Company’s Articles of Association, co-opted Directors are required to submit themselves to shareholders for election at the AGM following their appointment and all Directors are required to submit themselves for re-election at intervals of not more than three years. However, in accordance with the provisions contained in the 2018 Code, the Board has decided that all Directors eligible for re-election should retire at each AGM and offer themselves for re-election. Auditor As required under Section 381(1)(b) of the Companies Act 2014, the AGM agenda includes a resolution authorising the Directors to fix the remuneration of the auditor. Section 383 of the Companies Act 2014 provides for the automatic re-appointment of the auditor of an Irish company at a company’s AGM, unless the auditor has given notice in writing of their unwillingness to be re-appointed or a resolution has been passed at that meeting appointing someone else or providing expressly that the incumbent auditor shall not be re-appointed. The auditor, Deloitte Ireland LLP, is willing to continue in office. Notwithstanding the provisions of Irish company law, the Board has decided to provide shareholders with an opportunity to have a say on the continuance in office of Deloitte Ireland LLP and a non-binding resolution has been included on the agenda for the 2023 AGM for this purpose. Authority to Allot Shares The Directors require the authority of the shareholders to allot any unissued Ordinary Share capital of the Company. Accordingly, an ordinary resolution will be proposed at the 2023 AGM (Resolution 7) to renew the annual authority for that purpose. The authority will be for an amount which represents just under 50% of the issued Ordinary Share capital as at 1 March 2023. Any allotment exceeding 33% of the issued Ordinary Share capital will only be made pursuant to a pre-emptive issue and no issue of shares will be made which could effectively alter control of the Company without prior approval of the Company in General Meeting. The Directors have no present intention of making any issue of shares, other than in connection with the Group’s share incentive plans. If approved, this authority will expire on the earlier of the date of the AGM in 2024 or 26 July 2024. Disapplication of Pre-emption Rights Resolution 8 is a special resolution which, if approved by shareholders, will renew the annual authority of the Directors to disapply statutory pre- emption rights in relation to allotments of Ordinary Shares for cash in certain circumstances. In November 2022, the Pre-Emption Group published a revised Statement of Principles, which increased the guideline threshold for the annual disapplication of pre-emption rights authorities from 10% to 20% of a company’s issued share capital, with some additional flexibility for follow-on offers of up to a maximum of an additional 4% of a company’s issued share capital in specified circumstances. Having considered the matter, the Board has decided to seek authority under Resolution 8 for the disapplication of pre-emption rights up to a maximum of 10% of the Company’s issued share capital and will keep this under review in future years. This proposal is in line with the authorities received by the Company in prior years. The 10% limit includes any Treasury Shares reissued by the Company while the authority in Resolution 8 remains operable. Transactions in Own Shares Under the share buyback programme, a total of 29,755,861 Ordinary Shares, equivalent to 3.96% of the Company’s issued share capital, were repurchased during 2022, at an average price of $39.22 per share. 22,000,000 Ordinary Shares, equivalent to 2.92% of the Company’s issued share capital were cancelled on 22 December 2022 as part of the Group's management of its Treasury Share requirements. As at 1 March 2023, 9,819,256 shares were held as Treasury Shares, equivalent to 1.32% of the Ordinary Shares in issue (excluding Treasury Shares). The Treasury Share balance at 31 December 2022 was 7,398,112, equivalent to 0.98% of the Ordinary Shares in issue (2021: 3,476,859 (0.5%)). During 2022, 3,834,608 (2021: 3,439,904) Treasury Shares were reissued under the Group’s employee share schemes. A special resolution will be proposed at the 2023 AGM (resolution 9) to renew the authority of the Company, or any of its subsidiaries, to purchase up to 10% of the Company’s Ordinary Shares in issue at the date of the AGM. If approved, the minimum price which may be paid for shares purchased by the Company shall not be less than the nominal value of the shares and the maximum price will be 105% of the higher of the last independent trade in the Company’s shares (or current independent bid, if higher) and the average market price of such shares over the preceding five days. A special resolution will also be proposed for the purpose of renewing the authority to set the maximum and minimum prices at which Treasury Shares (effectively shares purchased and not cancelled) may be reissued off-market by the Company. If granted, both of these authorities will expire on the earlier of the date of the AGM in 2024 or 26 July 2024. As at 1 March 2023, options to subscribe for a total of 1,132,656 Ordinary Shares are outstanding, representing 0.15% of the issued Ordinary Share capital (excluding Treasury Shares). If the authority to purchase Ordinary Shares was used in full, the options would represent 0.17% of the remaining shares in issue. As outlined on page 65, during 2022 the Group returned a further $1.2 billion of cash to shareholders under its share buyback programme. A further buyback tranche of $300 million is underway and is scheduled to complete by 30 March 2023. The Board believes that the Company should retain the ability to buyback its own shares so that it can be used in the best interests of shareholders generally. Events after the Balance Sheet Date Details of post-Balance Sheet events are outlined in the Accounting Policies and notes 2 and 29 to the Consolidated Financial Statements on pages 181, 193 and 241 respectively.

Overview Strategy Report Business Performance & Segmental Reviews Governance Financial Statements Supplemental 20-F and Other Disclosures Shareholder Information 2022 Annual Report and Form 20-F138 Annual General Meeting The Notice of Meeting for the 2023 AGM will be published in March on the CRH website (www.crh.com) and is expected to be posted to shareholders on 29 March 2023. On behalf of the Board, R. Boucher, A. Manifold Directors 1 March 2023
Overview Strategy Report Business Performance & Segmental Reviews Governance Financial Statements Supplemental 20-F and Other Disclosures Shareholder Information 2022 Annual Report and Form 20-F138 annual basis and represent the principal risks and uncertainties faced by the Group at the time of compilation of the 2022 Annual Report and Form 20-F. During the course of 2023, new risks and uncertainties may materialise attributable to changes in markets, regulatory environments and other factors and existing risks and uncertainties may become less relevant. Description Construction activity, and therefore demand for the Group’s products, is inherently cyclical and influenced by multiple factors, including global and national economic circumstances (particularly those affecting the infrastructure and construction markets), monetary policy, consumer sentiment, swings in fuel and other input costs, and weather conditions that may disrupt outdoor construction activity. In general, economic uncertainty exacerbates negative trends in construction activity leading to postponement of orders, and rising interest rates typically adversely impact construction activity and demand for building materials and services. The Group may also be adversely impacted by fluctuations in the price of fuel and principal energy-related raw materials such as bitumen and steel (which accounted for approximately 13% of annual Group sales revenues in 2022 (10% in 2021)), and monetary and public policies in the countries in which the Group operates. There is no guarantee that any future actions taken by Group management will be effective in managing these risks and maintaining financial performance in the face of current changes in economic conditions. In addition, there is no guarantee that the Group will continue to be able to absorb the inflationary pressures we are currently facing across fuel, energy, labour and transport, among other inputs, in many of our major markets. Failure to manage the above factors could have a material adverse effect on the Group’s operating results and the market price of CRH plc’s Ordinary Shares. Principal Risks and Uncertainties (Risk Factors) Under Section 327(1)(b) of the Companies Act 2014 and Regulation 5(4) (c)(ii) of the Transparency (Directive 2004/109/EC) Regulations 2007, the Group is required to give a description of the principal risks and uncertainties which it faces. These risks and uncertainties reflect the international scope of the Group’s operations and the Group’s decentralised structure. The risks and uncertainties presented below are reviewed on an Principal Strategic Risks and Uncertainties Industry Cyclicality and Economic Conditions People Management Description The Group may not achieve its strategic objectives if it is not successful in attracting, engaging, retaining and developing employees, planning for leadership succession, developing a diverse and inclusive workforce, and building constructive relationships with collective representation groups. The identification and subsequent assessment, management, development and deployment of talented individuals is of major importance in continuing to deliver on the Group’s strategy and in ensuring that succession planning objectives for key executive roles throughout its international operations are satisfied. As well as ensuring the Group identifies, hires, integrates, engages, develops and promotes talent, the Group must attract and retain a diverse workforce and maintain an inclusive working environment. The Group operates in a labour-intensive industry and can face frontline labour shortages that impact the Group's ability to produce goods, operate facilities and install products. Additionally, any significant loss of employee resources for a sustained period of time due to sickness or a public health emergency could impact the Group’s ability to maintain operations. The Group must also maintain constructive relationships with the trade/labour unions that represent certain employees under collective agreements. Failure to do so could mean that the Group cannot renegotiate on appropriate terms the relevant collective agreements upon expiration or may face strikes or work stoppages. Poor labour relations could create reputational risk for the Group and impact operational continuity, which could have a material adverse effect on the results of operations and financial condition of the Group.
Overview Strategy Report Business Performance & Segmental Reviews Governance Financial Statements Supplemental 20-F and Other Disclosures Shareholder Information 2022 Annual Report and Form 20-F140 Commodity Products and Substitution Description Many of the Group’s products are commodities that face strong volume and price competition. Such products may also face competition from substitute products, including new products, that the Group does not produce. The Group must maintain strong customer relationships to ensure it can respond to changing consumer preferences and approaches to construction. Failure to differentiate and innovate could lead to market share decline, thus adversely impacting financial performance. The Group operates in a competitive environment in which pricing is impacted by macroeconomic conditions, the number of competitors, the degree of utilisation of production capacity and the specifics of product demand, among other factors. The Group’s local competitors are increasingly innovative and cost competitive. The Group experiences downward pricing pressure from time to time across its different markets, and the Group may not always be able to raise prices to offset increased operating expenses and inflationary pressures. The Group’s profits are particularly sensitive to changes in volume, as the cement business is capital-intensive and thus has significant fixed and semi- fixed costs. Many Group products compete with building products that the Group does not produce. Any significant shift in demand preference to these alternate products could adversely impact market share and results of operations. If the Group falls behind its competitors in developing new products which respond to customer needs, such as innovative, sustainable products, demand for the Group’s products might decline, which could impact our financial performance. Portfolio Management Description The Group engages in acquisition and divestment activity as part of active portfolio management which presents risks around due diligence, execution and integration of assets. Additionally, the Group may be liable for liabilities of companies it has acquired or divested. Failure to efficiently identify and execute deals may limit the Group’s growth potential and impact financial performance. The Group’s acquisition strategy depends on successfully identifying and acquiring suitable assets at prices that satisfy our stringent cash flow and return on investment criteria. The Group may not be able to identify such companies, and, even if identified, may not be able to acquire them because of a variety of factors including the outcome of due diligence processes, the ability to raise required funds on acceptable terms, regulatory approvals (including in certain instances from competition authorities) and competition for transactions from peers and other entities acquiring companies in the building materials sector. In addition, situations may arise where the Group may be liable for the past acts, omissions or liabilities of acquired companies, or may remain liable in cases of divestment; for example, the potential environmental liabilities addressed under the Sustainability and Corporate Social Responsibility risk on page 144. In addition, the Group’s ability to realise the expected benefits from acquisitions depends in part on its ability to integrate newly-acquired businesses. If the Group fails to integrate acquisitions, it may not achieve expected growth synergies or other financial and operating benefits, and it may incur write-downs, impairment charges or unforeseen liabilities that could negatively affect its operating results or financial position or could otherwise harm its business. Further, integrating an acquired business, product or technology could divert management time and resources from other matters.
Overview Strategy Report Business Performance & Segmental Reviews Governance Financial Statements Supplemental 20-F and Other Disclosures Shareholder Information 2022 Annual Report and Form 20-F140 Public Policy and Geopolitics Description Adverse public policy, economic, social and political situations in any country in which the Group operates could lead to health and safety risks for the Group's people, a fall in demand for the Group’s products, business interruption, restrictions on repatriation of earnings or a loss of plant access. Public policy, as well as the financial resources and investment strategy of government bodies in our markets, affect demand for our products. The allocation of government funding for public infrastructure programmes is a key driver for our markets, such as the infrastructure and utilities elements of the Build Back America bill in the US. However, government budget deficits might reduce government infrastructure investment and reduce demand for the Group’s products. Similarly, any significant change in investment strategy by policy makers in any of the Group’s key markets could reduce market demand, adversely impacting financial performance. The Group currently operates mainly in Europe and North America, as well as, to a lesser extent, in less developed emerging markets in Eastern Europe, the Philippines and China. The economies of these countries are at varying stages of development, which could present multiple risks and uncertainties, including: • Changes in political, social or economic conditions; • New or strengthened trade protection measures, currency controls or import or export licensing requirements; • Political unrest and currency shocks; • Activism and civil disturbance, triggered by natural disasters, terrorist events or outbreak of armed conflict, among other potential causes; • Labour and procurement practices which contravene ethical considerations and regulatory requirements; • Unexpected changes in regulatory and tax requirements; and • Lockdowns or other restrictions due to public health emergencies, such as pandemics In addition, CRH has people and assets in Ukraine and neighbouring countries. The ongoing geopolitical conflict in Ukraine poses potential physical risks to our people and operations and continues to create economic uncertainty. The Board is actively monitoring the situation in Ukraine, with the priority being the safety and security of our people. Strategic Mineral Reserves Description Appropriate reserves are increasingly scarce, and licences and permits required for operations are becoming harder to secure. Numerous uncertainties are inherent in estimating reserves and projecting production rates of the minerals used in the Group’s products. Failure of the Group to plan for reserve depletion and secure or maintain permits may result in operation stoppages, adversely impacting financial performance. Continuity of the cash flows derived from the production and sale of building materials depends on satisfactory reserves planning, including appropriate long-term arrangements for their replacement. The Group cannot guarantee its ability to secure new reserves and plan for reserve depletion. In addition, the Group may not be able to obtain the required licences and permits for its mining operations, and cannot guarantee that it will continue to satisfy the many terms and conditions under which such licences and permits are granted. The failure to plan adequately for current and future extraction and utilisation or to ensure ongoing compliance with requirements of issuing authorities could lead to operational disruptions and negatively affect our financial results. For additional information on the Group’s reserve position, see pages 262 to 267.

Overview Strategy Report Business Performance & Segmental Reviews Governance Financial Statements Supplemental 20-F and Other Disclosures Shareholder Information 2022 Annual Report and Form 20-F142 Principal Operational Risks and Uncertainties Climate Change and Policy Description The impact of climate change may adversely affect the Group’s operations and cost base and the stability of markets in which the Group operates. Risks related to climate change that could affect the Group’s operations and financial performance include both physical risks (such as acute and chronic changes in weather) and transitional risks (such as technological development, policy and regulation change and market and economic responses). Physical Risks include: • Acute: A once-off weather event, such as a hurricane or flooding. An increase in these types of events may disrupt CRH’s production rates as facilities are damaged or closed; and • Chronic: Sustained weather events, such as increased precipitation which may lead to higher sea levels. An increase in these types of events can disrupt CRH’s supply chain and transport logistics These physical risks may reduce product revenues and increase costs of maintaining the integrity of facilities. Operational productivity and demand for the Group’s products may be reduced during these weather events leading to reduced financial performance. Transition Risks include: • Technology: The failure to keep up with the pace of technological change may lead to increased operational costs and financial loss through the inability to supply products to customers who require innovative and low-carbon sustainable solutions. Failure to leverage innovation and other sustainability initiatives, for example transitioning to innovative lower-carbon products such as lower-carbon cements, recycled asphalt pavement (RAP), permeable paving solutions and other high-performance sustainability solutions, may shorten product life cycles or give rise to early product obsolescence thus impairing financial performance and/or future value creation; • Legal and Regulatory: Changes to climate-related laws or regulation could increase risks and costs related to compliance and litigation related to CRH’s operations. Efforts to address climate change through laws and regulations, for example by requiring reductions in emissions of GHGs such as CO2 and additional disclosures of GHG emissions among other changes can create economic risks and uncertainties for the Group’s businesses. Such risks could include the cost of purchasing allowances or credits to meet GHG emissions caps, the cost of installing equipment to reduce emissions to comply with GHG limits and higher direct and indirect costs from the imposition of legislative or regulatory controls; • Reputation: The building materials industry is, by its nature, energy intensive and stakeholder expectations with regard to climate change continue to increase. Failing to reduce emissions arising from our operations or failing to meet investor expectations with regard to emissions reductions may adversely impact the Group's reputation; and • Market: Continued focus on climate change by investors and lenders may affect their preferences and sentiments, which could affect the Group’s access to capital markets, cost of capital, and potential investors, each of which could potentially increase the Group’s financing costs and affect its financial performance. In terms of operating markets, failure to transition to lower-carbon products could result in early product obsolescence thus impairing financial performance and/or future value creation The Group continues to be exposed to costs related to carbon emissions trading schemes. While these costs do not currently have a material financial impact, there can be no assurance that more extensive carbon cost mechanisms will not be introduced that could potentially impact the Group’s financial performance. Further, although the Group continues to engage with stakeholders to fully understand their expectations in relation to climate change, such expectations continue to evolve rapidly and the Group cannot guarantee that all stakeholders’ expectations will continue to be met. Please refer to page 150 to 156 for further details.
Overview Strategy Report Business Performance & Segmental Reviews Governance Financial Statements Supplemental 20-F and Other Disclosures Shareholder Information 2022 Annual Report and Form 20-F142 Information Technology and Cyber Security Description The Group is dependent on information and operational technology systems (including those for which third-parties are in whole or in part responsible) to support its business activities. Security incidents and cyber-attacks are becoming increasingly sophisticated, and our systems for protecting our assets and data against cyber security risks may be insufficient. Security breaches, IT interruptions or data loss could result in significant business disruption, loss of production, reputational damage and/or regulatory penalties. The Group collects, processes, and retains potentially sensitive and confidential information about our customers, suppliers, employees and business performance, and has been subject to cyber security attacks. Despite the security measures we have in place, and those of third party suppliers and vendors with which we do business, attacks or other significant IT interruptions or errors may result in interference with production software, corruption or theft of sensitive customer or employee data, manipulation of financial data and/or reputational losses. In addition, as cyber security threats evolve, the Group may be required to expend additional resources to continue to modify or enhance protection measures or to investigate and remediate any vulnerability to cyber incidents. The Group likewise may incur significant remediation costs following any major cyber security incident. Health and Safety Performance Description The Group’s businesses operate in an industry with inherent health and safety risks, including operation of heavy vehicles, working at height, and use of mechanised processes. Failure to ensure safe workplaces could result in a deterioration in the Group’s safety performance and related adverse regulatory action or legal liability. Health and safety incidents could significantly impact the Group’s operational and financial performance, as well as its reputation. The Group’s safety risks extend to sites not wholly within our control, including outdoor paving and construction sites. This environment presents a complex challenge which requires safe behaviours and engagement from employees as well as robust Group policies and procedures. A high number of accidents may pose additional challenges in recruiting new employees, ensuring operational continuity and maintaining licences and permits. Further, the Group is subject to a broad and stringent range of existing and evolving laws, regulations, standards and best practices with respect to health and safety in each of the jurisdictions in which it operates. Should the Group’s health and safety frameworks, processes and controls fail to comply with such regulations, the Group could be exposed to significant potential legal liabilities and penalties. In addition, potential health and safety issues with products could lead to welfare and security issues for our broad range of stakeholders including our employees, contractors, customers and communities. The COVID-19 pandemic has presented and continues to present additional health and safety challenges due to potential transmission of the virus and changes to traditional operating norms. There is no guarantee that efforts to mitigate the risk of transmission will be effective in preventing the spread of COVID-19 or other viral infections at our sites and locations.

Overview Strategy Report Business Performance & Segmental Reviews Governance Financial Statements Supplemental 20-F and Other Disclosures Shareholder Information 2022 Annual Report and Form 20-F144 Sustainability and Corporate Social Responsibility Description The nature of the Group’s activities poses certain environmental and social risks, which are also subject to an evolving regulatory framework and changing societal expectations. Failure to embed sustainability principles within the Group's businesses and strategy may result in non-compliance with relevant regulations, standards and best practices and lead to adverse stakeholder sentiment and reduced financial performance. Customers are increasingly demanding sustainable products, particularly products with reduced lifetime carbon emissions. If the Group fails to offer products with improved sustainability performance, demand for the Group’s products may fall and the Group will experience a deterioration in financial performance. Failing to leverage innovation and other sustainability initiatives may also shorten product life cycles or give rise to early product obsolescence thus impairing financial performance and/or future value creation. The Group is also subject to a broad and increasingly stringent range of laws, regulations, standards and best practices with respect to ESG performance, including new regulations related to climate change and pollution. As a result of this new regulatory environment, the Group faces rising compliance costs, potential new legal liability exposure and could be subject to an obligation to adapt certain of its current operations. Supply Chain Continuity Description The Group must reliably and economically source various raw materials, equipment and other inputs from various third-party suppliers and then transport finished products to satisfy customer demands and meet contractual requirements. Our ability to balance maintaining resilient supply chains with optimising our working capital and inventory levels is critical to the continuity and strong financial returns of our operations. Failure to manage any material disruption in our supply chains could adversely impact our ability to service our customers and result in a deterioration in operational and/or financial performance. Like many other industries, the global building materials industry has been adversely impacted by disruptions and threats to supply chains caused by the COVID-19 pandemic, and subsequently the conflict in Ukraine. Additionally, the inflationary environment within the Group’s major markets has resulted in increased cost and reduced availability of some key inputs and transportation. Some of the raw materials, equipment, transport and other inputs that the Group requires are limited to a small number of suppliers from which the Group can economically and/or practically source, which often have long lead times. Any of our suppliers may experience temporary, prolonged or even permanent operational disruption, which could have an adverse impact on the Group’s operations, financial performance and reputation. In addition, in certain markets in which the Group operates, including markets for steel, cement, bitumen and supplementary cementitious materials, contracted market demand can far outstrip supply, which may restrict the Group’s ability to obtain alternative suppliers or additional volumes where necessary. Our focus on responsible sourcing practices and other ESG considerations may also limit the pool of acceptable suppliers from which we may choose to source.
Overview Strategy Report Business Performance & Segmental Reviews Governance Financial Statements Supplemental 20-F and Other Disclosures Shareholder Information 2022 Annual Report and Form 20-F144 Principal Compliance Risks and Uncertainties Laws, Regulations and Business Conduct Description The Group is subject to a wide variety of local and international laws and regulations. There can be no assurance that the Group’s policies and procedures afford adequate protection against compliance failures or other fraudulent and/or corrupt activities. Potential breaches of local and international laws and regulations could result in litigation or investigations, the imposition of significant fines, sanctions, adverse operational impact (to include an inability to operate in key markets/debarment) and reputational damage. As an Irish incorporated company, with a premium listing on the LSE, a secondary listing on Euronext Dublin and an ADR listing on the NYSE, CRH must comply with various laws and regulations including, among others, the Irish Companies Acts, the UK and Euronext Dublin Listing Rules, the Market Abuse Regulation, the Irish Transparency Regulation, and reporting obligations under US securities laws. The Group is also subject to various statutes, regulations and laws affecting land usage, zoning, labour and employment practices, competition/anti-trust, financial reporting, taxation, anti-fraud and theft, anti-bribery, anti- corruption, governance, data protection and data privacy and security, environmental, health and safety, and international trade and sanctions laws, among other matters. Despite mandating that its employees comply with its Code of Business Conduct the Group cannot guarantee that its employees will comply with all demands of regulatory agencies. Any such activities or breaches of external regulations or internal policies could have a material adverse effect on the Group’s business, results of operations, financial condition, or prospects.
Overview Strategy Report Business Performance & Segmental Reviews Governance Financial Statements Supplemental 20-F and Other Disclosures Shareholder Information 2022 Annual Report and Form 20-F146 Principal Financial and Reporting Risks and Uncertainties Taxation Charge and Balance Sheet Provisioning Description The Group is exposed to uncertainties stemming from governmental actions in respect of taxes paid or payable in the future in all jurisdictions of operation. In addition, various assumptions are made in the computation of the overall tax charge and in balance sheet provisions which may need to be adjusted over time. Changes in tax regimes or assessment of additional tax liabilities in future tax audits could result in incremental tax liabilities which could have a material adverse effect on cash flows and the financial results of operations. The Group’s income tax charge is based on reported profits and statutory tax rates, which reflect various allowances and reliefs and tax efficiencies available to the Group in the multiple tax jurisdictions in which it operates. The determination of the Group’s provision for income tax requires certain judgements and estimates in relation to matters where the ultimate tax outcome may not be certain. The recognition of deferred tax assets also requires judgement as it involves an assessment of the future recoverability of those assets. In addition, the Group is subject to tax audits which can involve complex issues that could require extended periods to conclude, the resolution of which is often not within its control. Although management believes that the estimates included in the Consolidated Financial Statements and the Group’s tax return positions are reasonable, there can be no assurance that the final outcome of these matters will equal the estimates reflected in the Group’s historical income tax provisions and accruals. As a multinational corporation, the Group is subject to various taxes in all jurisdictions in which it operates. Economic and political conditions, tax rates and the interpretation of tax rules in these jurisdictions may be subject to significant change, particularly during periods of administrative change or fiscal deficit. For example, the introduction of a Global Minimum Tax as developed by the OECD could result in increased tax liabilities in respect of some jurisdictions. In addition, the Group’s future effective income tax rate could be affected (positively or negatively) by changes in the mix of earnings in countries with differing statutory tax rates, changes in the valuation of deferred tax assets or changes in tax laws or their interpretation. Finally, changes to international tax principles, for example at an EU level, could adversely affect the Group’s effective tax rate or result in higher cash tax liabilities. If the Group’s effective income tax rate was to increase, its cash flows and the financial results of operations could be adversely affected.
Overview Strategy Report Business Performance & Segmental Reviews Governance Financial Statements Supplemental 20-F and Other Disclosures Shareholder Information 2022 Annual Report and Form 20-F146 Financial Instruments Description The Group uses financial instruments throughout its businesses giving rise to interest rate and leverage, foreign currency, counterparty, credit rating and liquidity risks. A downgrade of the Group’s credit ratings may give rise to increases in future funding costs and may impair the Group’s ability to raise funds on acceptable terms. In addition, insolvency of the financial institutions with which the Group conducts business may adversely impact the Group’s financial position. Interest rate and leverage risks: As at 31 December 2022, the Group had outstanding gross indebtedness, including leases, of approximately $11.0 billion (2021: $12.0 billion) and cash and cash equivalents of approximately $5.9 billion (2021: $5.8 billion). The Group uses interest rate swaps to convert a portion of its fixed rate debt to floating rate. While current leverage is low, acquisition activity could adversely impact operating and financial flexibility as well as financial position. There can be no assurance that the Group will not be adversely impacted by increases in borrowing costs in the future. During 2021, the Group transitioned from some IBOR backed rates linked to its main banking facilities to alternative benchmark rates. These alternative benchmark rates are backward looking meaning the related interest charges would not be fully known until close to the end of the interest period. This transition process will continue until June 2023 after which US dollar IBOR rates will cease to be available. Foreign currency risks: If the Group’s reporting currency weakens relative to the basket of foreign currencies in which net debt is denominated (including the euro, Canadian Dollar, Swiss Franc, Polish Zloty, Philippine Peso and Pound Sterling), the net debt balance would increase; the converse would apply if the Group’s reporting currency was to strengthen. Where economically feasible, net debt is maintained in the same relative ratio as capital employed to act as an economic hedge of the underlying currency assets. Counterparty risks: Insolvency of the financial institutions with which the Group conducts business or a downgrade in their credit ratings may lead to losses in the cash balances that the Group holds with such financial institutions or losses in derivative transactions that the Group has entered into with these parties and may render it more difficult for the Group to utilise existing debt capacity or otherwise obtain financing for operations. The Group holds significant cash and cash equivalents on deposit and derivative transactions with a variety of highly rated financial institutions which at 31 December 2022, totalled $5.9 billion (2021: $5.8 billion) and $(86) million (2021: $122 million) respectively. In addition, certain of the Group’s activities give rise to significant amounts receivable from counterparties at the balance sheet date; at 31 December 2022, this balance was $3.9 billion (2021: $4.0 billion). Credit rating risks: A downgrade of the Group’s credit ratings may give rise to increases in funding costs in respect of future debt and may, among other concerns, impair its ability to access debt markets or otherwise raise funds or enter into lines of credit, for example, on acceptable terms. Such a downgrade may result from factors specific to the Group, including increased indebtedness stemming from acquisition activity, or from other factors such as general economic or sector specific weakness or sovereign credit rating ceilings. Liquidity risks: The principal liquidity risks stem from the maturation of debt obligations and derivative transactions. The Group aims to achieve flexibility in funding sources through a variety of means including (i) maintaining cash and cash equivalents with a number of highly rated counterparties; (ii) meeting the bulk of debt requirements through debt capital markets or other term financing; (iii) limiting the annual maturity of such balances; and (iv) having surplus committed bank lines of credit. However, market or economic conditions may make it difficult at times to realise this objective. For additional information on the above risks see note 22 to the Consolidated Financial Statements on pages 225 to 228.
Overview Strategy Report Business Performance & Segmental Reviews Governance Financial Statements Supplemental 20-F and Other Disclosures Shareholder Information 2022 Annual Report and Form 20-F148 Goodwill Impairment Description Significant under performance in any of the Group’s major cash-generating units or the divestment of businesses in the future may give rise to a material write-down of goodwill. While a non-cash item, a material write-down of goodwill could have a substantial impact on the Group’s income and equity. Under IFRS, goodwill and indefinite-lived intangible assets are subject to annual impairment testing. A detailed discussion of the impairment testing process, the key assumptions used, the results of that testing and the related sensitivity analysis is contained in note 14 to the Consolidated Financial Statements on pages 210 to 212. While a goodwill impairment charge does not impact cash flow, a full write-down at 31 December 2022 would have resulted in a charge to income and a reduction in equity of $9.2 billion (2021: $9.5 billion). Foreign Currency Translation Description The principal foreign exchange risks to which the Consolidated Financial Statements are exposed pertain to (i) adverse movements in reported results when translated into the reporting currency; and (ii) declines in the reporting currency value of net investments which are denominated in a wide basket of currencies other than the reporting currency. Adverse changes in the exchange rates could negatively affect retained earnings. Given the geographic diversity of the Group, a significant proportion of its revenues, expenses, assets and liabilities are denominated in currencies other than the Group’s reporting currency, including the euro, Canadian Dollar, Swiss Franc, Polish Zloty, Philippine Peso and Pound Sterling. From year to year, adverse changes in the exchange rates used to translate these and other foreign currencies into the reporting currency have impacted and will continue to impact consolidated results and net worth. For additional information on the impact of foreign exchange movements on the Consolidated Financial Statements for the Group for the year ended 31 December 2022, see the Business Performance and Segmental Reviews section commencing on page 61 and note 22 to the Consolidated Financial Statements on pages 225 to 228.

Overview Strategy Report Business Performance & Segmental Reviews Governance Financial Statements Supplemental 20-F and Other Disclosures Shareholder Information 2022 Annual Report and Form 20-F148
Overview Strategy Report Business Performance & Segmental Reviews Governance Financial Statements Supplemental 20-F and Other Disclosures Shareholder Information 2022 Annual Report and Form 20-F150 Focus on Climate Risks and Opportunities Management Every individual in CRH is responsible for managing risk and a core value in CRH is accountability. Every risk across the Group is assigned a risk owner who is responsible for ensuring that appropriate attention is directed towards that risk whether through current mitigation or future planning. Not all risks can be managed at the point of identification and as such the risk owner is responsible for the implementation of mitigation strategies that could be enacted should a risk materialise. Common risk criteria and topic hierarchies are used to assess and consistently categorise risks and opportunities, which helps identify and manage aggregate exposures that may be managed centrally more effectively. The size and significance of each risk is determined according to the product of its assessed impact on the organisation and its likelihood of occurrence, with consideration of factors such as impact velocity, for example, informing the prioritisation of risks for subsequent management to within agreed acceptable levels. In order to highlight the Group’s commitment towards managing our climate risks, from 2022, a portion of the Group’s Performance Share Plan is directly linked to specific actions related to managing climate change and the achievement of certain climate-related targets, such as delivery of our carbon emissions reduction target and embedding sustainability into relevant operating companies. Monitoring and Reporting All risks identified in CRH are recorded in the Group’s RMIS which facilitates the effective allocation of responsibility, tracking of risk performance and monitoring of mitigation activities. Our RMIS is integrated across the Group and enables the efficient reporting of risks through our bottom-up process, from operations up to the Board. Risks are reported to the Risk Committee from all divisions and functions on a rotational basis ensuring that all risks are presented, discussed and challenged in an appropriate forum. The Risk Committee sets the Group’s risk strategy and oversees the Group’s risk governance model and how the Group identifies, assesses and manages the principal and emerging risks the Group encounters in pursuit of its strategic objectives. Additionally, climate-related risks and opportunities are reported to our Climate Action Council, which reports to the Chief Operating Officer, and is responsible for considering and developing climate strategies for consideration by the Global Leadership Team and Board and for ensuring that they are fully embedded in the Group’s corporate priorities. For further information on risk governance structures, please see pages 94 and 95. The outputs of our climate-related workshops are included as part of our climate scenario analysis disclosure on page 156 and inform our strategy and risk planning going forward. CRH’s ERM framework supports risk identification, assessment and reporting activities across the Group; the below information is an example of how our ERM framework was applied to manage our climate risk. Identification As part of our continued commitment to understanding the potential climate-related risks and opportunities that CRH faces, during 2022 we undertook a number of risk workshops focused on where climate-related risks could adversely impact the Group, and where we see potential opportunities for CRH to create value and contribute to the development of a more resilient built environment and a more sustainable future. These sessions involved bringing senior leaders from across our business together to discuss, challenge and prioritise what participants believed to be the most material climate risks and opportunities the Group may face. Our sessions were facilitated by the Group Risk team with the support of other corporate functions who challenged the perceptions and opinions of the participants to ensure a robust discussion. Assessment While our traditional ERM process assesses risks over our strategic planning horizon, with longer-term risks being embedded into our emerging risk categories, the longer-term horizons over which we assessed the Group’s climate risks and opportunities necessitated redefining our time horizons to take a longer-term view. The climate risk and opportunity assessment process defined the business-relevant time horizons as: Short-term: The risks, opportunities and actions reasonably foreseeable up to 2025 (3-year window) and for which business planning has the highest degree of visibility. Medium-term: The period between 2025 and 2030 which represents the period up to our publicly disclosed group-wide target of reducing our absolute emissions by 30% by 2030 and a transitional period between current planning and the longer-term strategic goals for the Group. Long-term: The 2030 to 2050 period where transitioning to net-zero is fully embedded in the business structure and performance with climate driven solutions at the forefront of value creation. Our bottom-up analysis of risks and opportunities was complemented, and expanded upon, by feedback from stakeholders and expert advisors. The exercise included assessing emerging best practice in TCFD disclosures to ensure we provide a comprehensive and transparent disclosure. The Sustainability, Risk and Finance teams have created an extensive library of potential and wide-ranging climate-related risk impacts and their significance. As part of each workshop, these issues were categorised on a five-point scale from negligible to severe. Where one or more of the risk criteria were met our method categorises the risk in the higher impact band. Given the nature of climate change, it is viewed as both a current principal risk and an emerging risk for CRH. Some climate risks are near-term and acute and are treated as current enterprise risks, whereas other risks and challenges are longer-term and potentially enduring if left unmanaged and would be seen as emerging risks. Similarly, some opportunities are available now and in the near-term whereas others require facilitating action such as policy change or physical infrastructure to fully realise the benefits over the longer-term.
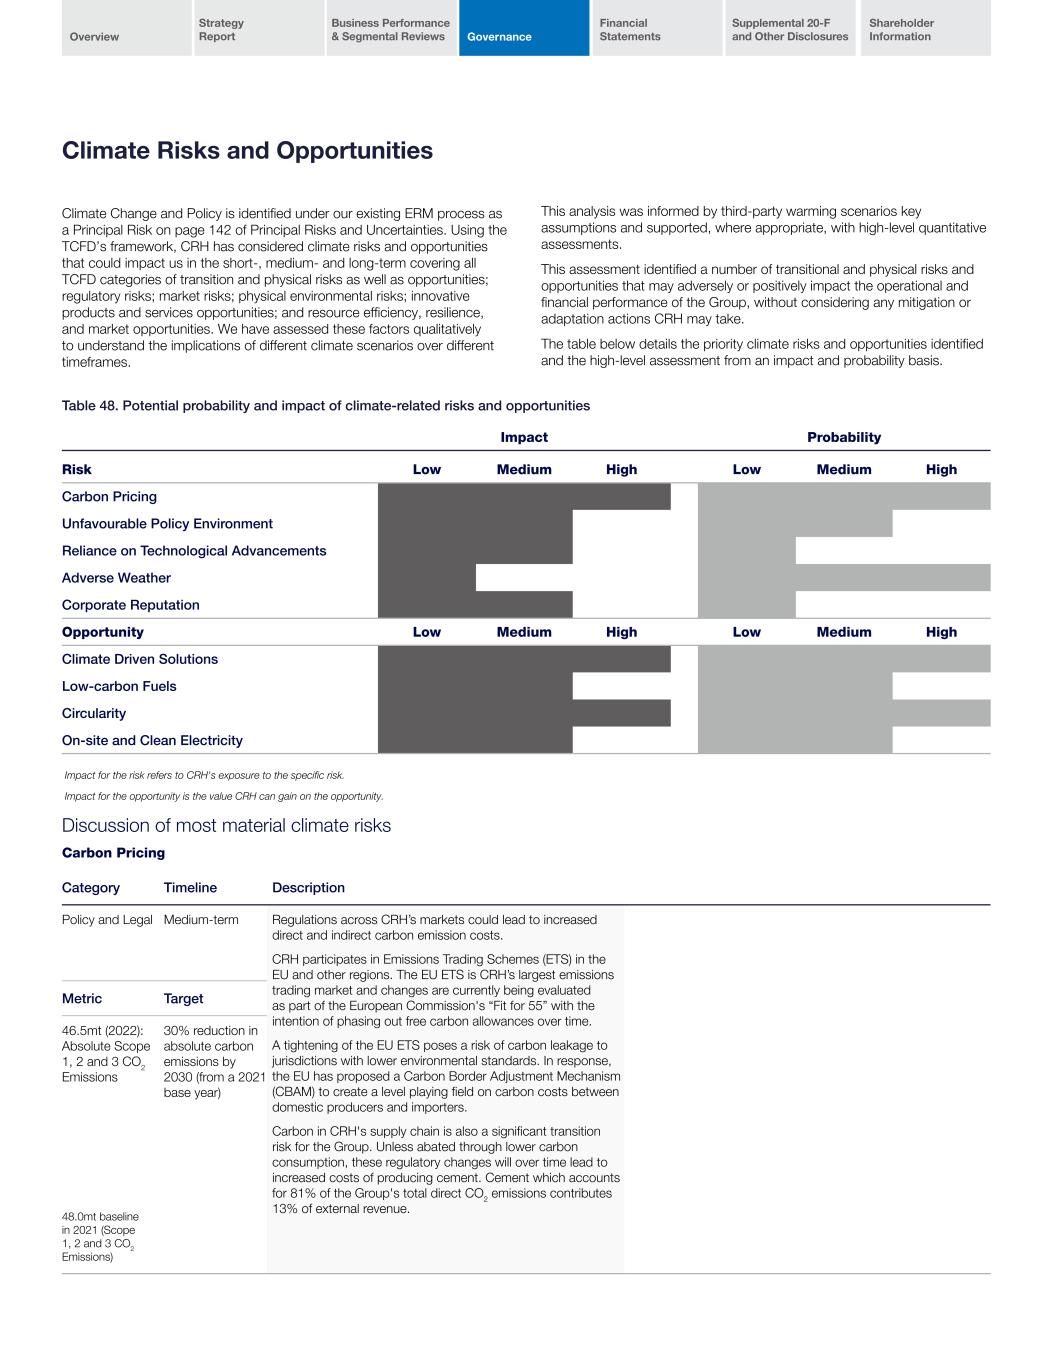
Overview Strategy Report Business Performance & Segmental Reviews Governance Financial Statements Supplemental 20-F and Other Disclosures Shareholder Information 2022 Annual Report and Form 20-F150 Climate Risks and Opportunities Climate Change and Policy is identified under our existing ERM process as a Principal Risk on page 142 of Principal Risks and Uncertainties. Using the TCFD’s framework, CRH has considered climate risks and opportunities that could impact us in the short-, medium- and long-term covering all TCFD categories of transition and physical risks as well as opportunities; regulatory risks; market risks; physical environmental risks; innovative products and services opportunities; and resource efficiency, resilience, and market opportunities. We have assessed these factors qualitatively to understand the implications of different climate scenarios over different timeframes. This analysis was informed by third-party warming scenarios key assumptions and supported, where appropriate, with high-level quantitative assessments. This assessment identified a number of transitional and physical risks and opportunities that may adversely or positively impact the operational and financial performance of the Group, without considering any mitigation or adaptation actions CRH may take. The table below details the priority climate risks and opportunities identified and the high-level assessment from an impact and probability basis. Table 48. Potential probability and impact of climate-related risks and opportunities Impact Probability Risk Low Medium High Low Medium High Carbon Pricing Unfavourable Policy Environment Reliance on Technological Advancements Adverse Weather Corporate Reputation Opportunity Low Medium High Low Medium High Climate Driven Solutions Low-carbon Fuels Circularity On-site and Clean Electricity Impact for the risk refers to CRH's exposure to the specific risk. Impact for the opportunity is the value CRH can gain on the opportunity. Discussion of most material climate risks Carbon Pricing Category Timeline Description Policy and Legal Medium-term Regulations across CRH’s markets could lead to increased direct and indirect carbon emission costs. CRH participates in Emissions Trading Schemes (ETS) in the EU and other regions. The EU ETS is CRH’s largest emissions trading market and changes are currently being evaluated as part of the European Commission's “Fit for 55” with the intention of phasing out free carbon allowances over time. A tightening of the EU ETS poses a risk of carbon leakage to jurisdictions with lower environmental standards. In response, the EU has proposed a Carbon Border Adjustment Mechanism (CBAM) to create a level playing field on carbon costs between domestic producers and importers. Carbon in CRH's supply chain is also a significant transition risk for the Group. Unless abated through lower carbon consumption, these regulatory changes will over time lead to increased costs of producing cement. Cement which accounts for 81% of the Group's total direct CO2 emissions contributes 13% of external revenue. Metric Target 46.5mt (2022): Absolute Scope 1, 2 and 3 CO2 Emissions 48.0mt baseline in 2021 (Scope 1, 2 and 3 CO2 Emissions) 30% reduction in absolute carbon emissions by 2030 (from a 2021 base year)
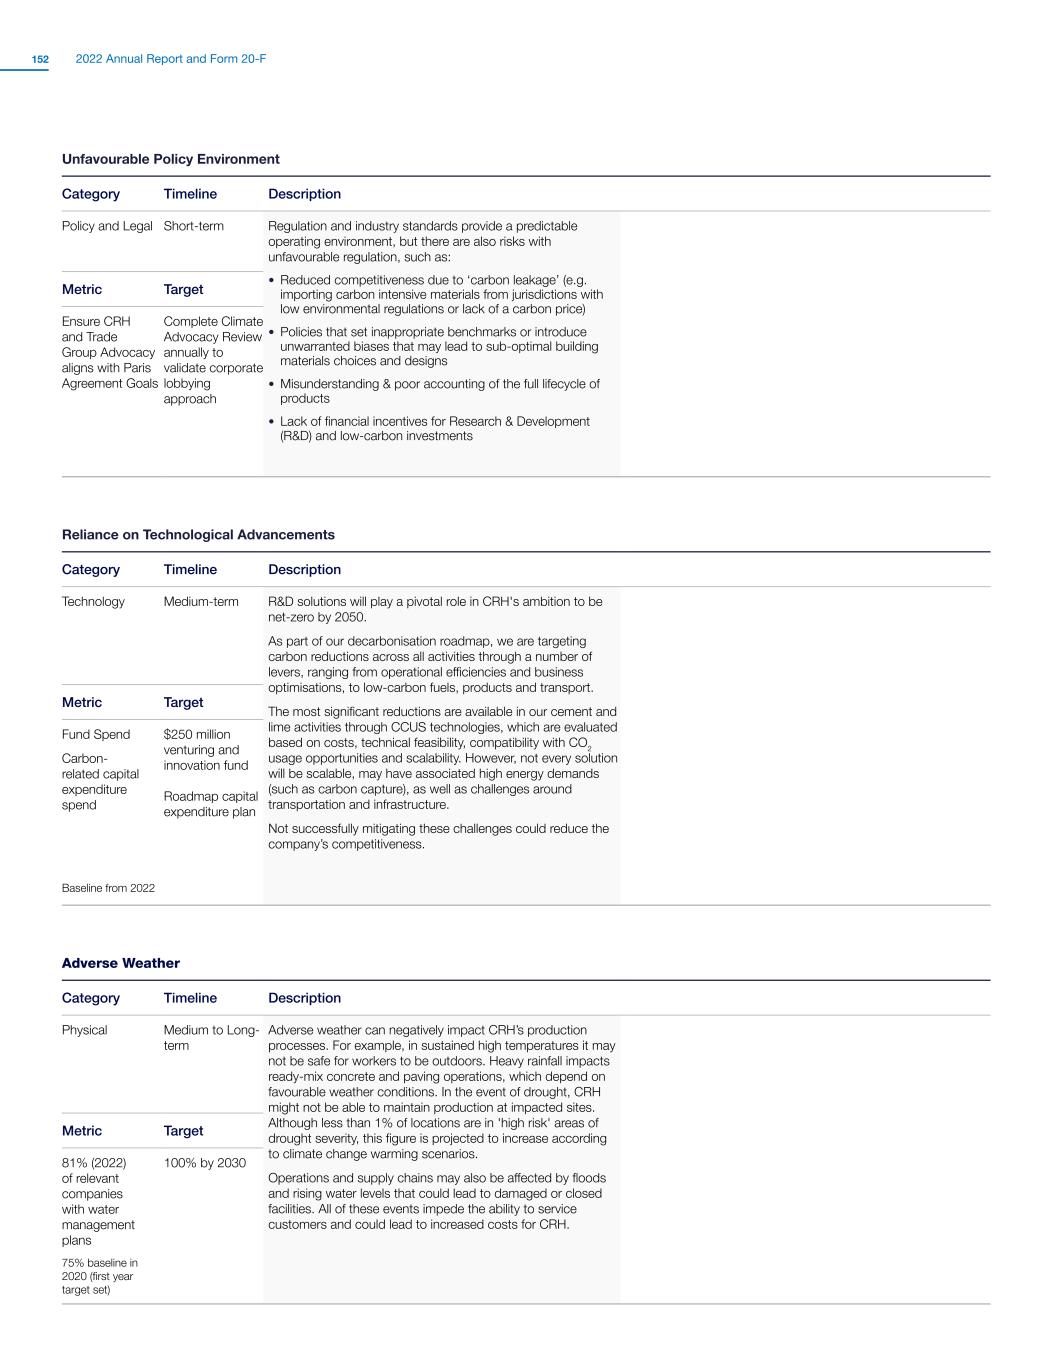
Overview Strategy Report Business Performance & Segmental Reviews Governance Financial Statements Supplemental 20-F and Other Disclosures Shareholder Information 2022 Annual Report and Form 20-F152 Unfavourable Policy Environment Category Timeline Description Policy and Legal Short-term Regulation and industry standards provide a predictable operating environment, but there are also risks with unfavourable regulation, such as: • Reduced competitiveness due to ‘carbon leakage’ (e.g. importing carbon intensive materials from jurisdictions with low environmental regulations or lack of a carbon price) • Policies that set inappropriate benchmarks or introduce unwarranted biases that may lead to sub-optimal building materials choices and designs • Misunderstanding & poor accounting of the full lifecycle of products • Lack of financial incentives for Research & Development (R&D) and low-carbon investments Metric Target Ensure CRH and Trade Group Advocacy aligns with Paris Agreement Goals Complete Climate Advocacy Review annually to validate corporate lobbying approach Reliance on Technological Advancements Category Timeline Description Technology Medium-term R&D solutions will play a pivotal role in CRH's ambition to be net-zero by 2050. As part of our decarbonisation roadmap, we are targeting carbon reductions across all activities through a number of levers, ranging from operational efficiencies and business optimisations, to low-carbon fuels, products and transport. The most significant reductions are available in our cement and lime activities through CCUS technologies, which are evaluated based on costs, technical feasibility, compatibility with CO2 usage opportunities and scalability. However, not every solution will be scalable, may have associated high energy demands (such as carbon capture), as well as challenges around transportation and infrastructure. Not successfully mitigating these challenges could reduce the company’s competitiveness. Metric Target Fund Spend Carbon- related capital expenditure spend Baseline from 2022 $250 million venturing and innovation fund Roadmap capital expenditure plan Adverse Weather Category Timeline Description Physical Medium to Long- term Adverse weather can negatively impact CRH’s production processes. For example, in sustained high temperatures it may not be safe for workers to be outdoors. Heavy rainfall impacts ready-mix concrete and paving operations, which depend on favourable weather conditions. In the event of drought, CRH might not be able to maintain production at impacted sites. Although less than 1% of locations are in 'high risk' areas of drought severity, this figure is projected to increase according to climate change warming scenarios. Operations and supply chains may also be affected by floods and rising water levels that could lead to damaged or closed facilities. All of these events impede the ability to service customers and could lead to increased costs for CRH. Metric Target 81% (2022) of relevant companies with water management plans 75% baseline in 2020 (first year target set) 100% by 2030

Overview Strategy Report Business Performance & Segmental Reviews Governance Financial Statements Supplemental 20-F and Other Disclosures Shareholder Information 2022 Annual Report and Form 20-F152 Corporate Reputation Category Timeline Description Reputational Short-term Increasing stakeholder expectations regarding climate ambition and environmental performance need to be constantly monitored. To avoid a negative perception it is important that the Group continues to illustrate its efforts in a proactive and transparent way. For example, cement production continues to be seen as a high emissions process. This could negatively affect CRH in several ways, such as: • Reduced access to capital • Challenges retaining/attracting talent • Local community opposition to cement production sites • Inability to secure licensing permits Metric Target Third-party ESG Rating scores Baseline: See 'External Benchmarks and Recognition' in the CRH Sustainability Report, 2021 and 2022 Industry leader in ESG Rating scores Discussion of most material climate opportunities Climate Solutions Category Timeline Description How we Realise the Opportunity Markets Medium-term Creating sustainable cities is an imperative for net-zero living, especially as the global population continues to grow. • Increasing customer demand for low-carbon, sustainable, climate-resilient products and solutions • Major investment is needed in addressing water scarcity, temperature extremes and flood management in the built environment • Infrastructure for clean energy, energy-efficient buildings, smart public transport networks and green infrastructure are also central to building more sustainable urban centres CRH already has in its portfolio a range of climate solutions as demonstrated by our progress on product revenue derived from products with enhanced sustainability attributes. CRH will continue to invest in solutions that strengthen circularity and climate-resilience in the built environment (see Solutions for a Sustainable Future beginning on page 24). CRH is a leader in sustainable products and our ICSC works to catalyse sustainable innovation opportunities. Currently, there are around >100 research projects ongoing across CRH to develop new innovative technologies. CRH has established a $250 million venturing and innovation fund. Metric Target 47% (2022) product revenue derived from products with enhanced sustainability attributes 42% baseline in 2018 (first year reported externally) 50% by 2025 Low-carbon Fuels Category Timeline Description How we Realise the Opportunity Energy Source Medium-term As a large energy consumer there is an opportunity for CRH to further reduce its reliance on fossil fuels by transitioning to alternative low-carbon fuel sources. With ongoing technological advancements and CRH’s relentless drive to limit its environmental impact, the scope for incremental fuel substitution continues to expand, which in turns creates new opportunities to reduce the release of harmful emissions in our production processes. Substituting traditional fuels with low-carbon alternatives is also proving a competitive advantage for CRH as it reduces our costs, diversifies supply, and limits the impact of volatile energy prices on our operations. CRH is an industry-leader in using low-carbon energy sources. For example, we are the leading user of alternative fuels in the cement sector and continue to work with suppliers on fuel substitution to low-carbon sources. The Group is also collaborating with partners in its own and other industries (one example being Shell in 2022) on decarbonisation opportunities across the value chain that will benefit transport, operations and sourcing materials and energy. Metric Target 36% (2022) Alternative and Bio-based Fuels in Energy Mix (Cement) 33% baseline in 2021 (based upon decarbonisation roadmap) Increase usage aligned to decarbonisation roadmap
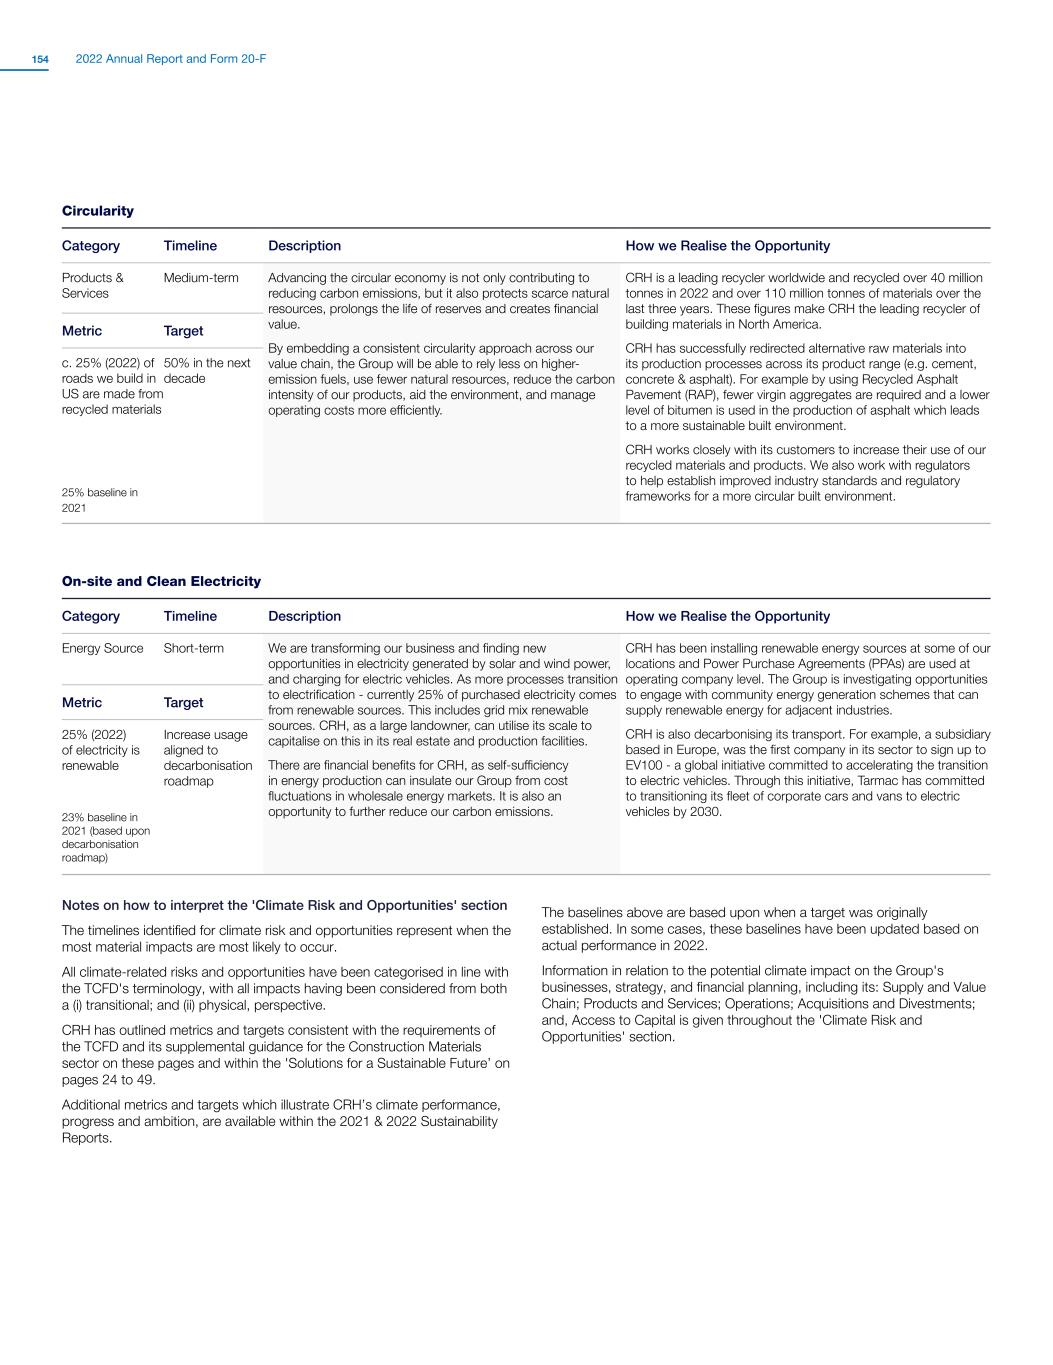
Overview Strategy Report Business Performance & Segmental Reviews Governance Financial Statements Supplemental 20-F and Other Disclosures Shareholder Information 2022 Annual Report and Form 20-F154 Circularity Category Timeline Description How we Realise the Opportunity Products & Services Medium-term Advancing the circular economy is not only contributing to reducing carbon emissions, but it also protects scarce natural resources, prolongs the life of reserves and creates financial value. By embedding a consistent circularity approach across our value chain, the Group will be able to rely less on higher- emission fuels, use fewer natural resources, reduce the carbon intensity of our products, aid the environment, and manage operating costs more efficiently. CRH is a leading recycler worldwide and recycled over 40 million tonnes in 2022 and over 110 million tonnes of materials over the last three years. These figures make CRH the leading recycler of building materials in North America. CRH has successfully redirected alternative raw materials into its production processes across its product range (e.g. cement, concrete & asphalt). For example by using Recycled Asphalt Pavement (RAP), fewer virgin aggregates are required and a lower level of bitumen is used in the production of asphalt which leads to a more sustainable built environment. CRH works closely with its customers to increase their use of our recycled materials and products. We also work with regulators to help establish improved industry standards and regulatory frameworks for a more circular built environment. Metric Target c. 25% (2022) of roads we build in US are made from recycled materials 25% baseline in 2021 50% in the next decade On-site and Clean Electricity Category Timeline Description How we Realise the Opportunity Energy Source Short-term We are transforming our business and finding new opportunities in electricity generated by solar and wind power, and charging for electric vehicles. As more processes transition to electrification - currently 25% of purchased electricity comes from renewable sources. This includes grid mix renewable sources. CRH, as a large landowner, can utilise its scale to capitalise on this in its real estate and production facilities. There are financial benefits for CRH, as self-sufficiency in energy production can insulate our Group from cost fluctuations in wholesale energy markets. It is also an opportunity to further reduce our carbon emissions. CRH has been installing renewable energy sources at some of our locations and Power Purchase Agreements (PPAs) are used at operating company level. The Group is investigating opportunities to engage with community energy generation schemes that can supply renewable energy for adjacent industries. CRH is also decarbonising its transport. For example, a subsidiary based in Europe, was the first company in its sector to sign up to EV100 - a global initiative committed to accelerating the transition to electric vehicles. Through this initiative, Tarmac has committed to transitioning its fleet of corporate cars and vans to electric vehicles by 2030. Metric Target 25% (2022) of electricity is renewable 23% baseline in 2021 (based upon decarbonisation roadmap) Increase usage aligned to decarbonisation roadmap Notes on how to interpret the 'Climate Risk and Opportunities' section The timelines identified for climate risk and opportunities represent when the most material impacts are most likely to occur. All climate-related risks and opportunities have been categorised in line with the TCFD's terminology, with all impacts having been considered from both a (i) transitional; and (ii) physical, perspective. CRH has outlined metrics and targets consistent with the requirements of the TCFD and its supplemental guidance for the Construction Materials sector on these pages and within the 'Solutions for a Sustainable Future’ on pages 24 to 49. Additional metrics and targets which illustrate CRH’s climate performance, progress and ambition, are available within the 2021 & 2022 Sustainability Reports. The baselines above are based upon when a target was originally established. In some cases, these baselines have been updated based on actual performance in 2022. Information in relation to the potential climate impact on the Group's businesses, strategy, and financial planning, including its: Supply and Value Chain; Products and Services; Operations; Acquisitions and Divestments; and, Access to Capital is given throughout the 'Climate Risk and Opportunities' section.
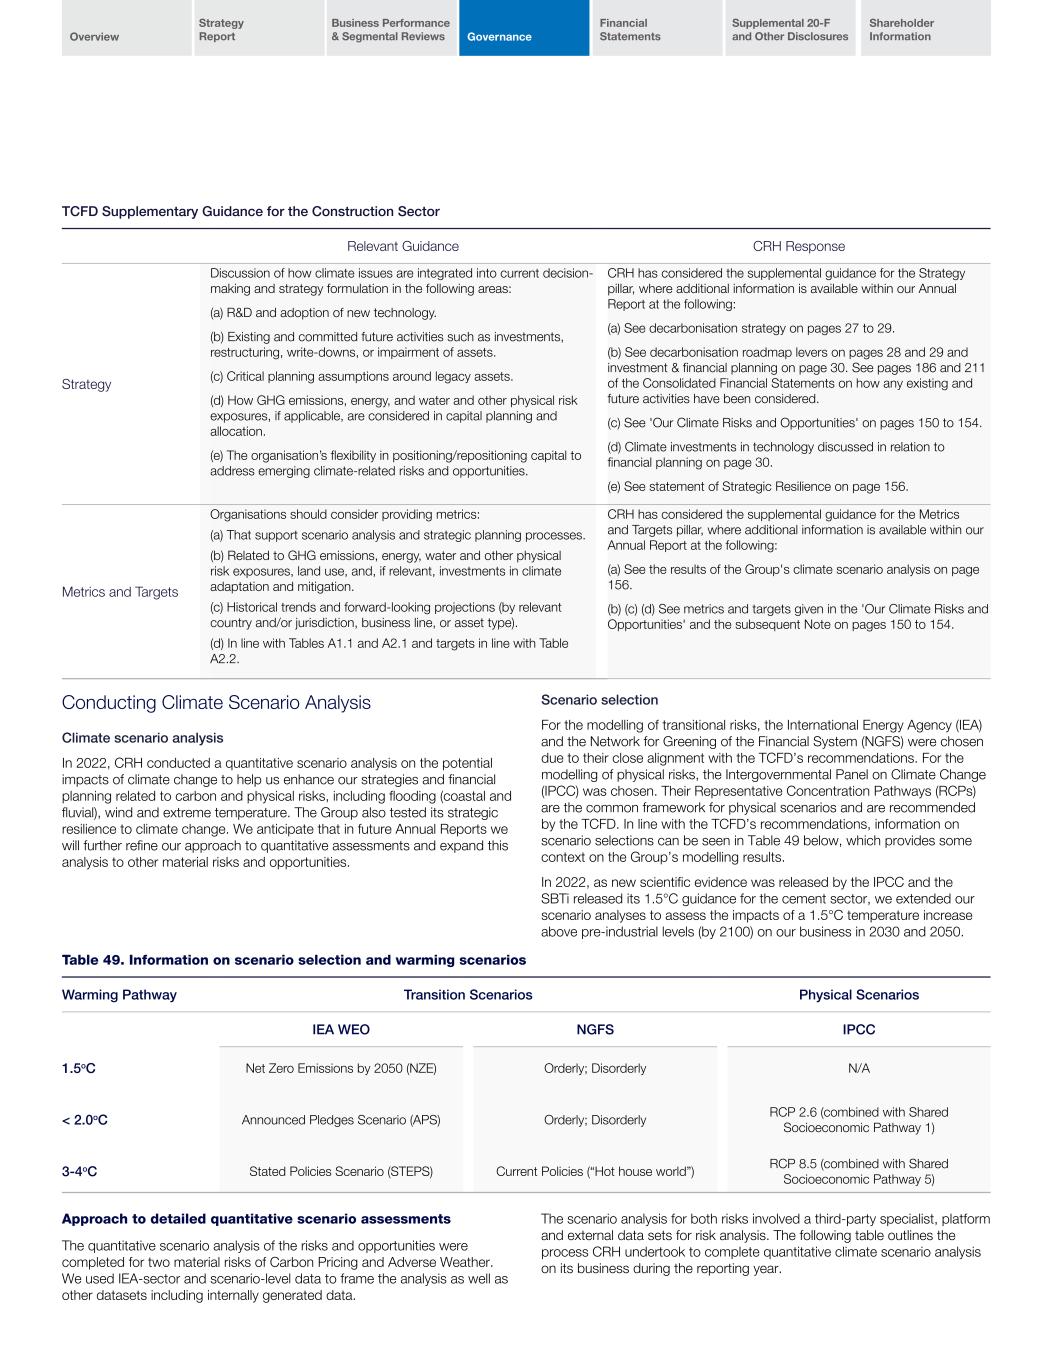
Overview Strategy Report Business Performance & Segmental Reviews Governance Financial Statements Supplemental 20-F and Other Disclosures Shareholder Information 2022 Annual Report and Form 20-F154 TCFD Supplementary Guidance for the Construction Sector Relevant Guidance CRH Response Strategy Discussion of how climate issues are integrated into current decision- making and strategy formulation in the following areas: (a) R&D and adoption of new technology. (b) Existing and committed future activities such as investments, restructuring, write-downs, or impairment of assets. (c) Critical planning assumptions around legacy assets. (d) How GHG emissions, energy, and water and other physical risk exposures, if applicable, are considered in capital planning and allocation. (e) The organisation’s flexibility in positioning/repositioning capital to address emerging climate-related risks and opportunities. CRH has considered the supplemental guidance for the Strategy pillar, where additional information is available within our Annual Report at the following: (a) See decarbonisation strategy on pages 27 to 29. (b) See decarbonisation roadmap levers on pages 28 and 29 and investment & financial planning on page 30. See pages 186 and 211 of the Consolidated Financial Statements on how any existing and future activities have been considered. (c) See 'Our Climate Risks and Opportunities' on pages 150 to 154. (d) Climate investments in technology discussed in relation to financial planning on page 30. (e) See statement of Strategic Resilience on page 156. Metrics and Targets Organisations should consider providing metrics: (a) That support scenario analysis and strategic planning processes. (b) Related to GHG emissions, energy, water and other physical risk exposures, land use, and, if relevant, investments in climate adaptation and mitigation. (c) Historical trends and forward-looking projections (by relevant country and/or jurisdiction, business line, or asset type). (d) In line with Tables A1.1 and A2.1 and targets in line with Table A2.2. CRH has considered the supplemental guidance for the Metrics and Targets pillar, where additional information is available within our Annual Report at the following: (a) See the results of the Group's climate scenario analysis on page 156. (b) (c) (d) See metrics and targets given in the 'Our Climate Risks and Opportunities' and the subsequent Note on pages 150 to 154. Conducting Climate Scenario Analysis Climate scenario analysis In 2022, CRH conducted a quantitative scenario analysis on the potential impacts of climate change to help us enhance our strategies and financial planning related to carbon and physical risks, including flooding (coastal and fluvial), wind and extreme temperature. The Group also tested its strategic resilience to climate change. We anticipate that in future Annual Reports we will further refine our approach to quantitative assessments and expand this analysis to other material risks and opportunities. Scenario selection For the modelling of transitional risks, the International Energy Agency (IEA) and the Network for Greening of the Financial System (NGFS) were chosen due to their close alignment with the TCFD’s recommendations. For the modelling of physical risks, the Intergovernmental Panel on Climate Change (IPCC) was chosen. Their Representative Concentration Pathways (RCPs) are the common framework for physical scenarios and are recommended by the TCFD. In line with the TCFD’s recommendations, information on scenario selections can be seen in Table 49 below, which provides some context on the Group’s modelling results. In 2022, as new scientific evidence was released by the IPCC and the SBTi released its 1.5°C guidance for the cement sector, we extended our scenario analyses to assess the impacts of a 1.5°C temperature increase above pre-industrial levels (by 2100) on our business in 2030 and 2050. Table 49. Information on scenario selection and warming scenarios Warming Pathway Transition Scenarios Physical Scenarios IEA WEO NGFS IPCC 1.5oC Net Zero Emissions by 2050 (NZE) Orderly; Disorderly N/A < 2.0oC Announced Pledges Scenario (APS) Orderly; Disorderly RCP 2.6 (combined with Shared Socioeconomic Pathway 1) 3-4oC Stated Policies Scenario (STEPS) Current Policies (“Hot house world”) RCP 8.5 (combined with Shared Socioeconomic Pathway 5) Approach to detailed quantitative scenario assessments The quantitative scenario analysis of the risks and opportunities were completed for two material risks of Carbon Pricing and Adverse Weather. We used IEA-sector and scenario-level data to frame the analysis as well as other datasets including internally generated data. The scenario analysis for both risks involved a third-party specialist, platform and external data sets for risk analysis. The following table outlines the process CRH undertook to complete quantitative climate scenario analysis on its business during the reporting year.
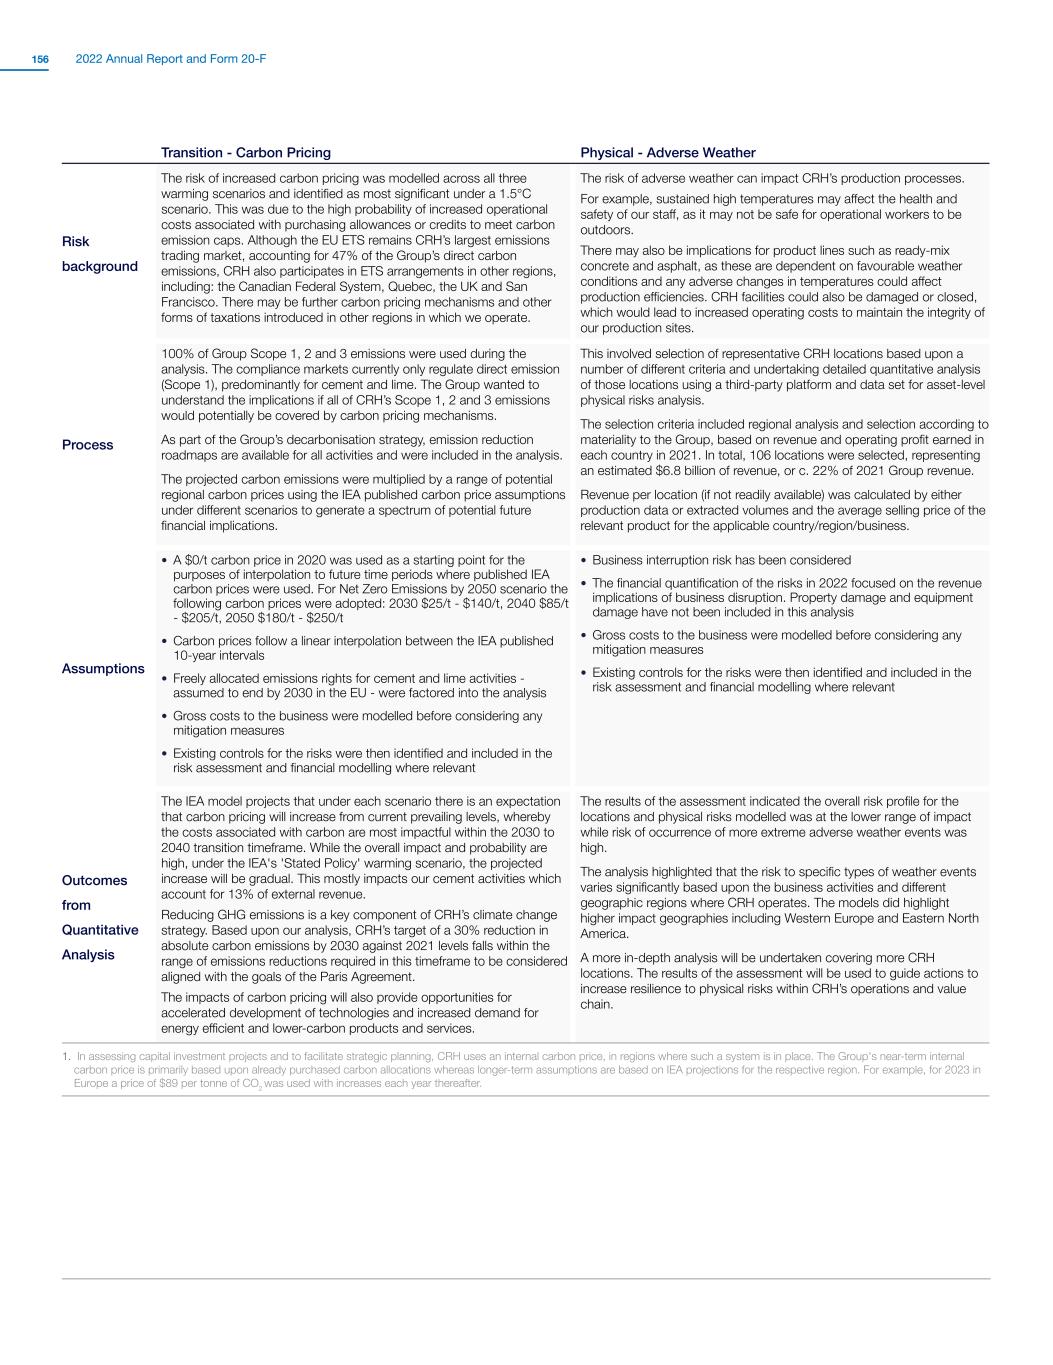
Overview Strategy Report Business Performance & Segmental Reviews Governance Financial Statements Supplemental 20-F and Other Disclosures Shareholder Information 2022 Annual Report and Form 20-F156 Transition - Carbon Pricing Physical - Adverse Weather Risk background The risk of increased carbon pricing was modelled across all three warming scenarios and identified as most significant under a 1.5°C scenario. This was due to the high probability of increased operational costs associated with purchasing allowances or credits to meet carbon emission caps. Although the EU ETS remains CRH’s largest emissions trading market, accounting for 47% of the Group’s direct carbon emissions, CRH also participates in ETS arrangements in other regions, including: the Canadian Federal System, Quebec, the UK and San Francisco. There may be further carbon pricing mechanisms and other forms of taxations introduced in other regions in which we operate. The risk of adverse weather can impact CRH’s production processes. For example, sustained high temperatures may affect the health and safety of our staff, as it may not be safe for operational workers to be outdoors. There may also be implications for product lines such as ready-mix concrete and asphalt, as these are dependent on favourable weather conditions and any adverse changes in temperatures could affect production efficiencies. CRH facilities could also be damaged or closed, which would lead to increased operating costs to maintain the integrity of our production sites. Process 100% of Group Scope 1, 2 and 3 emissions were used during the analysis. The compliance markets currently only regulate direct emission (Scope 1), predominantly for cement and lime. The Group wanted to understand the implications if all of CRH’s Scope 1, 2 and 3 emissions would potentially be covered by carbon pricing mechanisms. As part of the Group’s decarbonisation strategy, emission reduction roadmaps are available for all activities and were included in the analysis. The projected carbon emissions were multiplied by a range of potential regional carbon prices using the IEA published carbon price assumptions under different scenarios to generate a spectrum of potential future financial implications. This involved selection of representative CRH locations based upon a number of different criteria and undertaking detailed quantitative analysis of those locations using a third-party platform and data set for asset-level physical risks analysis. The selection criteria included regional analysis and selection according to materiality to the Group, based on revenue and operating profit earned in each country in 2021. In total, 106 locations were selected, representing an estimated $6.8 billion of revenue, or c. 22% of 2021 Group revenue. Revenue per location (if not readily available) was calculated by either production data or extracted volumes and the average selling price of the relevant product for the applicable country/region/business. Assumptions • A $0/t carbon price in 2020 was used as a starting point for the purposes of interpolation to future time periods where published IEA carbon prices were used. For Net Zero Emissions by 2050 scenario the following carbon prices were adopted: 2030 $25/t - $140/t, 2040 $85/t - $205/t, 2050 $180/t - $250/t • Carbon prices follow a linear interpolation between the IEA published 10-year intervals • Freely allocated emissions rights for cement and lime activities - assumed to end by 2030 in the EU - were factored into the analysis • Gross costs to the business were modelled before considering any mitigation measures • Existing controls for the risks were then identified and included in the risk assessment and financial modelling where relevant • Business interruption risk has been considered • The financial quantification of the risks in 2022 focused on the revenue implications of business disruption. Property damage and equipment damage have not been included in this analysis • Gross costs to the business were modelled before considering any mitigation measures • Existing controls for the risks were then identified and included in the risk assessment and financial modelling where relevant Outcomes from Quantitative Analysis The IEA model projects that under each scenario there is an expectation that carbon pricing will increase from current prevailing levels, whereby the costs associated with carbon are most impactful within the 2030 to 2040 transition timeframe. While the overall impact and probability are high, under the IEA's 'Stated Policy' warming scenario, the projected increase will be gradual. This mostly impacts our cement activities which account for 13% of external revenue. Reducing GHG emissions is a key component of CRH’s climate change strategy. Based upon our analysis, CRH’s target of a 30% reduction in absolute carbon emissions by 2030 against 2021 levels falls within the range of emissions reductions required in this timeframe to be considered aligned with the goals of the Paris Agreement. The impacts of carbon pricing will also provide opportunities for accelerated development of technologies and increased demand for energy efficient and lower-carbon products and services. The results of the assessment indicated the overall risk profile for the locations and physical risks modelled was at the lower range of impact while risk of occurrence of more extreme adverse weather events was high. The analysis highlighted that the risk to specific types of weather events varies significantly based upon the business activities and different geographic regions where CRH operates. The models did highlight higher impact geographies including Western Europe and Eastern North America. A more in-depth analysis will be undertaken covering more CRH locations. The results of the assessment will be used to guide actions to increase resilience to physical risks within CRH’s operations and value chain. 1. In assessing capital investment projects and to facilitate strategic planning, CRH uses an internal carbon price, in regions where such a system is in place. The Group's near-term internal carbon price is primarily based upon already purchased carbon allocations whereas longer-term assumptions are based on IEA projections for the respective region. For example, for 2023 in Europe a price of $89 per tonne of CO2 was used with increases each year thereafter.
Overview Strategy Report Business Performance & Segmental Reviews Governance Financial Statements Supplemental 20-F and Other Disclosures Shareholder Information 2022 Annual Report and Form 20-F156
| | | | | |
| 2022 Annual Report and Form 20-F | 159 |
| | | | | | | | | | | | | | | | | | | | | | | |
| Financial Statements |
| Independent Auditors’ Reports 172 Consolidated Income Statement 176 Consolidated Statement of Comprehensive Income 177 Consolidated Balance Sheet 178 Consolidated Statement of Changes in Equity 179 Consolidated Statement of Cash Flows 180 Accounting Policies 181 Notes on Consolidated Financial Statements 191 |
|
| | | | | |
| 2022 Annual Report and Form 20-F | 160 |
[THIS PAGE INTENTIONALLY LEFT BLANK]
[THIS PAGE INTENTIONALLY LEFT BLANK]
[THIS PAGE INTENTIONALLY LEFT BLANK]
[THIS PAGE INTENTIONALLY LEFT BLANK]
[THIS PAGE INTENTIONALLY LEFT BLANK]
[THIS PAGE INTENTIONALLY LEFT BLANK]
[THIS PAGE INTENTIONALLY LEFT BLANK]
[THIS PAGE INTENTIONALLY LEFT BLANK]
[THIS PAGE INTENTIONALLY LEFT BLANK]
[THIS PAGE INTENTIONALLY LEFT BLANK]
[THIS PAGE INTENTIONALLY LEFT BLANK]
[THIS PAGE INTENTIONALLY LEFT BLANK]
| | | | | |
| 2022 Annual Report and Form 20-F | 172 |
Independent Auditor’s US Reports
REPORT OF INDEPENDENT REGISTERED PUBLIC ACCOUNTING FIRM
To the shareholders and the Board of Directors of CRH public limited company (CRH plc)
Opinion on the Financial Statements
We have audited the accompanying consolidated balance sheets of CRH plc and subsidiaries (the ‘Company’) as at 31 December 2022 and 2021, the related consolidated income statements and consolidated statements of comprehensive income, changes in equity and cash flows, for each of the three years in the period ended 31 December 2022, and the related notes (collectively referred to as the ‘financial statements’). In our opinion, the financial statements present fairly, in all material respects, the consolidated financial position of the Company as at 31 December 2022 and 2021, and the consolidated results of its operations and its cash flows for each of the three years in the period ended 31 December 2022, in conformity with International Financial Reporting Standards as issued by the International Accounting Standards Board.
We have also audited, in accordance with the standards of the Public Company Accounting Oversight Board (United States) (PCAOB), the Company’s internal control over financial reporting as at 31 December 2022, based on criteria established in Internal Control — Integrated Framework (2013) issued by the Committee of Sponsoring Organizations of the Treadway Commission and our report dated 1 March 2023, expressed an unqualified opinion on the Company’s internal control over financial reporting.
Basis for Opinion
These financial statements are the responsibility of the Company’s management. Our responsibility is to express an opinion on the Company’s financial statements based on our audits. We are a public accounting firm registered with the PCAOB and are required to be independent with respect to the Company in accordance with the U.S. federal securities laws and the applicable rules and regulations of the Securities and Exchange Commission and the PCAOB.
We conducted our audits in accordance with the standards of the PCAOB. Those standards require that we plan and perform the audit to obtain reasonable assurance about whether the financial statements are free of material misstatement, whether due to error or fraud. Our audits included performing procedures to assess the risks of material misstatement of the financial statements, whether due to error or fraud, and performing procedures that respond to those risks. Such procedures included examining, on a test basis, evidence regarding the amounts and disclosures in the financial statements. Our audits also included evaluating the accounting principles used and significant estimates made by management, as well as evaluating the overall presentation of the financial statements. We believe that our audits provide a reasonable basis for our opinion.
Critical Audit Matters
The critical audit matters communicated below are matters arising from the current period audit of the financial statements that were communicated or required to be communicated to the Audit Committee and that (1) relate to accounts or disclosures that are material to the financial statements and (2) involved our especially challenging, subjective, or complex judgements. The communication of critical audit matters does not alter in any way our opinion on the financial statements, taken as a whole, and we are not, by communicating the critical audit matters below, providing separate opinions on the critical audit matters or on the accounts or disclosures to which they relate.
| | | | | |
| 2022 Annual Report and Form 20-F | 173 |
Intangible Assets – Assessment of the carrying value of goodwill associated with selected cash generating units – Refer to accounting policies and note 14 to the financial statements
Critical Audit Matter Description
As described in the accounting policies and note 14, the goodwill balance was $9.2 billion as at 31 December 2022 (2021: $9.5 billion). The Company did not record an impairment charge during the year.
The Company’s evaluation of the carrying value of goodwill for impairment involves the comparison of the recoverable amount of goodwill of each cash generating unit (CGU) to its carrying value. The Company used the value-in-use approach, which deploys a discounted cash flow model to estimate the recoverable amount. This requires management to make significant estimates and assumptions relating to discount rates, short-term forecasts and long-term growth rates ("key assumptions”). Changes in these key assumptions could have a significant impact on the recoverable amount, the amount of any goodwill impairment charge, or both.
With the assistance of our valuation and sustainability specialists, we performed risk assessment procedures and performed sensitivities on management’s key assumptions, to identify certain CGUs of interest. We focused on CGUs where the recoverable amount did not exceed its carrying value by a significant amount and on CGUs which had a significant reduction in cash flow forecasts compared to prior year (“selected CGUs”). Within the selected CGUs we focused on those assumptions which were most sensitive based on the individual facts and circumstances, which we determined to be discount rates and short-term forecasts of sales growth and energy costs.
We determined that the assessment of the carrying value of goodwill of the selected CGUs was a critical audit matter because it required a high degree of auditor judgement and an increased extent of effort when performing audit procedures to evaluate the reasonableness of management’s key assumptions.
The Audit Committee discussion of this critical audit matter is set out on page 97.
How the Critical Audit Matter Was Addressed in the Audit
Our audit procedures related to the discount rates and short-term forecasts of sales growth and energy costs of the selected CGUs, used by management to estimate the recoverable amount of the selected CGUs included the following, among others:
•We tested the effectiveness of relevant controls over management’s determination of discount rates, and the short-term forecasts of revenues and energy costs used to determine the recoverable amount of the selected CGU.
•With the assistance of our valuation specialists, we evaluated the reasonableness of the valuation methodology and discount rate for each selected CGU by:
•assessing the valuation methodology compared to generally accepted valuation practices and accounting standards; and
•developing a range of independent estimates and comparing those to the discount rate selected by management.
•We agreed the underlying cash flow forecasts to the Board approved projections and we evaluated management’s ability to accurately forecast future revenues and energy costs by:
•performing a look-back analysis and comparing actual results to management’s historical forecasts;
•assessing the reasonableness of the impact of macroeconomic activity on short-term cash flows;
•benchmarking management’s forecasts against independent third-party economic and industry projections; and
•comparing internal Company communications to management and the Board against the cash flow forecasts to evaluate for consistency.
•We compared the actual results for the year ended 31 December 2022 to management’s forecasts at the date of the annual impairment test to determine if any indicators of impairment existed.
•We considered the potential impact of climate change on the carrying value of goodwill by holding discussions with management, with our sustainability specialists and within the Company and component engagement teams. These discussions identified the areas in which climate change, and in particular the Company’s 2030 CO₂ emissions reduction target, may impact future projections. These projections include assumptions on cost of carbon and future climate-related capital expenditure required to meet the Company’s 2030 CO₂ emissions reduction target.
•We reviewed the disclosures related to intangible assets and assessed the assumptions used in the impairment assessment for consistency with the impairment models and other information presented in the Annual Report.
| | | | | |
| 2022 Annual Report and Form 20-F | 174 |
Independent Auditor’s US Reports continued
Revenue recognition for certain in-progress long-term contracts – Refer to accounting policies and note 1 to the financial statements
Critical Audit Matter Description
As described in the accounting policies and note 1, the Company’s revenues derived from long-term contracts accounted for 24% ($8.0 billion) of the total revenue in 2022 (2021: 23% ($6.8 billion)).
The Company recognises long-term contract revenue over the contract term as the work progresses because transfer of control and the fulfilment of performance obligations to the customer is continuous. Revenue derived from long-term contracts in-progress at the balance sheet date involves judgement, particularly as it relates to the process of estimating revenue to be recognised, and total estimated costs of the contract.
We identified revenue recognition for certain long-term contracts in-progress at the balance sheet date (“certain long-term contracts”) as a critical audit matter because of the judgements made by management to recognise revenue for certain long-term contracts in certain components whether due to bias or otherwise. This required extensive audit effort due to the complexity of certain long-term contracts and required a high degree of auditor judgement when performing audit procedures to audit management’s estimates and evaluating the results of those procedures. We focused a proportion of our audit effort on a number of contracts where we consider there to be the highest degree of management judgement required and designed procedures to mitigate the associated risks.
The Audit Committee discussion of this critical audit matter is set out on page 97.
How the Critical Audit Matter Was Addressed in the Audit
Our audit procedures related to management’s recognition of revenue for certain long-term contracts at the balance sheet date in certain components included the following, among others:
•We tested the effectiveness of relevant controls over long-term contract revenue, including management’s controls over the estimates of total costs for performance obligations, and over the assessment of the recoverability of uncertified work in progress (“WIP”) and aged debt.
•We selected a sample of long-term contracts and:
•assessed whether the contracts were properly included in management’s calculation of long-term contract revenue based on the terms and conditions of each contract, including whether continuous transfer of control to the customer occurred as progress was made toward fulfilling the performance obligation;
•tested the accuracy and completeness of the costs incurred to date for the performance obligation to supporting documentation;
•evaluated and challenged the estimates of total cost for the performance obligation by:
•comparing costs incurred to date to the costs management estimated, at either the inception of the contract or the start of the reporting period, to be incurred to date;
•evaluating management’s ability to accurately estimate the total cost by performing corroborating inquiries with the Company’s project managers and engineers, and comparing the estimates to management’s work plans, engineering specifications, and supplier contracts;
•comparing management’s estimates for the selected contracts to costs of similar performance obligations, when applicable; and
•considering whether there were any indicators of bias in arriving at the Company’s reported position.
•tested the accuracy of WIP held on contracts at the balance sheet date by obtaining supporting documentation including customer agreement and subsequent certification and payment;
•tested the mathematical accuracy of management’s calculation of revenue for the performance obligation.
•We evaluated management’s ability to estimate total costs accurately by comparing actual costs to management’s historical estimates for performance obligations that have been fulfilled.
/s/ Deloitte Ireland LLP
Dublin, Ireland
1 March 2023
The first accounting period we audited was 31 December 2020. In 2019, we began preparing for audit firm transition.
| | | | | |
| 2022 Annual Report and Form 20-F | 175 |
REPORT OF INDEPENDENT REGISTERED PUBLIC ACCOUNTING FIRM
To the shareholders and the Board of Directors of CRH public limited company (CRH plc).
Opinion on Internal Control over Financial Reporting
We have audited the internal control over financial reporting of CRH plc and subsidiaries (the ‘Company’) as at 31 December 2022, based on criteria established in Internal Control – Integrated Framework (2013) issued by the Committee of Sponsoring Organizations of the Treadway Commission (COSO). In our opinion, the Company maintained, in all material respects, effective internal control over financial reporting as at 31 December 2022, based on criteria established in Internal Control – Integrated Framework (2013) issued by COSO.
We have also audited, in accordance with the standards of the Public Company Accounting Oversight Board (United States) (PCAOB), the consolidated balance sheets of CRH plc as at 31 December 2022 and 2021, the related consolidated income statements and consolidated statements of comprehensive income, changes in equity and cash flows for each of the three years in the period ended 31 December 2022, and the related notes (collectively referred to as the ‘financial statements’) of the Company and our report dated 1 March 2023, expressed an unqualified opinion on those financial statements.
As described in Management’s Report on Internal Control over Financial Reporting, management excluded from its assessment the internal control over financial reporting at Barrette Outdoor Living Inc., which was acquired on 8 July 2022, and whose financial statements constitute 5.0% and 3.4% of net and total assets, respectively, 1.1% of revenues, and its loss reduced Group profit by 1.0% in the consolidated financial statement amounts as of and for the year ended 31 December 2022. Accordingly, our audit did not include the internal control over financial reporting at Barrette Outdoor Living Inc.
Basis for Opinion
The Company’s management is responsible for maintaining effective internal control over financial reporting and for its assessment of the effectiveness of internal control over financial reporting, included in the accompanying management’s report on internal control over financial reporting. Our responsibility is to express an opinion on the Company’s internal control over financial reporting based on our audit. We are a public accounting firm registered with the PCAOB and are required to be independent with respect to the Company in accordance with the U.S. federal securities laws and the applicable rules and regulations of the Securities and Exchange Commission and the PCAOB.
We conducted our audit in accordance with the standards of the PCAOB. Those standards require that we plan and perform the audit to obtain reasonable assurance about whether effective internal control over financial reporting was maintained in all material respects. Our audit included obtaining an understanding of internal control over financial reporting, assessing the risk that a material weakness exists, testing and evaluating the design and operating effectiveness of internal control based on the assessed risk, and performing such other procedures as we considered necessary in the circumstances. We believe that our audit provides a reasonable basis for our opinion.
Definition and Limitations of Internal Control over Financial Reporting
A company’s internal control over financial reporting is a process designed to provide reasonable assurance regarding the reliability of financial reporting and the preparation of financial statements for external purposes in accordance with generally accepted accounting principles. A company’s internal control over financial reporting includes those policies and procedures that (1) pertain to the maintenance of records that, in reasonable detail, accurately and fairly reflect the transactions and dispositions of the assets of the company; (2) provide reasonable assurance that transactions are recorded as necessary to permit preparation of financial statements in accordance with generally accepted accounting principles, and that receipts and expenditures of the company are being made only in accordance with authorizations of management and directors of the company; and (3) provide reasonable assurance regarding prevention or timely detection of unauthorized acquisition, use, or disposition of the company’s assets that could have a material effect on the financial statements.
Because of its inherent limitations, internal control over financial reporting may not prevent or detect misstatements. Also, projections of any evaluation of effectiveness to future periods are subject to the risk that controls may become inadequate because of changes in conditions, or that the degree of compliance with the policies or procedures may deteriorate.
/s/ Deloitte Ireland LLP
Dublin, Ireland
1 March 2023
| | | | | |
| 2022 Annual Report and Form 20-F | 176 |
Consolidated Income Statement
for the financial year ended 31 December 2022
| | | | | | | | | | | | | | |
| | | Restated (i) | Restated (i) |
| | 2022 | 2021 | 2020 |
| $m | $m | $m |
| Notes | | | | |
1,2 | Revenue | 32,723 | 29,206 | 25,888 |
| 4 | Cost of sales | (21,844) | (19,350) | (17,323) |
| Gross profit | 10,879 | 9,856 | 8,565 |
| 4 | Operating costs | (6,985) | (6,525) | (6,539) |
2,5,7 | Group operating profit | 3,894 | 3,331 | 2,026 |
2,6 | (Loss)/profit on disposals | (49) | 116 | 17 |
| Profit before finance costs | 3,845 | 3,447 | 2,043 |
| 9 | Finance costs | (401) | (357) | (438) |
| 9 | Finance income | 65 | - | - |
| 9 | Other financial expense | (40) | (42) | (33) |
| 2 | Share of equity accounted investments’ profit/(loss) | - | 55 | (118) |
| 2 | Profit before tax from continuing operations | 3,469 | 3,103 | 1,454 |
| 10 | Income tax expense | (785) | (661) | (445) |
| Group profit for the financial year from continuing operations | 2,684 | 2,442 | 1,009 |
| 3 | Profit after tax for the financial year from discontinued operations | 1,190 | 179 | 156 |
| Group profit for the financial year | 3,874 | 2,621 | 1,165 |
| Profit attributable to: | | | |
| Equity holders of the Company | | | |
| From continuing operations | 2,657 | 2,386 | 966 |
| From discontinued operations | 1,190 | 179 | 156 |
| Non-controlling interests | | | |
| From continuing operations | 27 | 56 | 43 |
| Group profit for the financial year | 3,874 | 2,621 | 1,165 |
| | | | |
| 12 | Basic earnings per Ordinary Share | $5.07 | $3.29 | $1.43 |
| 12 | Diluted earnings per Ordinary Share | $5.03 | $3.26 | $1.42 |
| | | | |
| 12 | Basic earnings per Ordinary Share from continuing operations | $3.50 | $3.06 | $1.23 |
| 12 | Diluted earnings per Ordinary Share from continuing operations | $3.48 | $3.03 | $1.22 |
(i)Restated to show the results of our former Building Envelope business in discontinued operations. See note 3 for further details.
| | | | | |
| 2022 Annual Report and Form 20-F | 177 |
Consolidated Statement of Comprehensive Income
for the financial year ended 31 December 2022
| | | | | | | | | | | | | | |
| | 2022 | 2021 | 2020 |
| $m | $m | $m |
| Notes | | | | |
| Group profit for the financial year | 3,874 | 2,621 | 1,165 |
| | | | |
|
Other comprehensive income | | | |
| Items that may be reclassified to profit or loss in subsequent years: | | | |
| Currency translation effects | (641) | (338) | 440 |
| 25 | Gains relating to cash flow hedges | 66 | 34 | 7 |
| 10 | Tax relating to cash flow hedges | (14) | (8) | - |
| | (589) | (312) | 447 |
| Items that will not be reclassified to profit or loss in subsequent years: | | | |
| 28 | Remeasurement of retirement benefit obligations | 279 | 264 | (33) |
| 10 | Tax relating to retirement benefit obligations | (63) | (36) | 11 |
| | 216 | 228 | (22) |
|
Total other comprehensive income for the financial year | (373) | (84) | 425 |
|
Total comprehensive income for the financial year | 3,501 | 2,537 | 1,590 |
|
Attributable to: | | | |
| Equity holders of the Company | 3,520 | 2,516 | 1,515 |
| Non-controlling interests | (19) | 21 | 75 |
| Total comprehensive income for the financial year | 3,501 | 2,537 | 1,590 |
| | | | | |
| 2022 Annual Report and Form 20-F | 178 |
Consolidated Balance Sheet
as at 31 December 2022
| | | | | | | | | | | |
| | 2022 | 2021 |
| | $m | $m |
Notes | | | |
| ASSETS | | |
| Non-current assets | | |
| 13 | Property, plant and equipment | 18,921 | 19,502 |
| 14 | Intangible assets | 10,287 | 9,848 |
| 15 | Investments accounted for using the equity method | 649 | 653 |
| 15 | Other financial assets | 14 | 12 |
| 17 | Other receivables | 164 | 239 |
| 28 | Retirement benefit assets | 261 | 166 |
| 25 | Derivative financial instruments | 3 | 97 |
| 27 | Deferred income tax assets | 88 | 109 |
| Total non-current assets | 30,387 | 30,626 |
| Current assets | | |
| 16 | Inventories | 4,194 | 3,611 |
| 17 | Trade and other receivables | 4,569 | 4,569 |
| Current income tax recoverable | 63 | 42 |
| 25 | Derivative financial instruments | 39 | 39 |
| 23 | Cash and cash equivalents | 5,936 | 5,783 |
| Total current assets | 14,801 | 14,044 |
| Total assets | 45,188 | 44,670 |
29 | EQUITY |
|
|
| Capital and reserves attributable to the Company’s equity holders | | |
| 29 | Equity share capital | 302 | 309 |
| 29 | Preference share capital | 1 | 1 |
| 29 | Treasury Shares and own shares | (297) | (195) |
| Other reserves | 380 | 445 |
| Cash flow hedging reserve | 5 | - |
| Foreign currency translation reserve | (692) | (97) |
| Retained income | 21,992 | 19,770 |
| Capital and reserves attributable to the Company’s equity holders | 21,691 | 20,233 |
| 31 | Non-controlling interests | 646 | 681 |
| Total equity | 22,337 | 20,914 |
| LIABILITIES | | |
| Non-current liabilities | | |
| 20 | Lease liabilities | 1,059 | 1,374 |
| 24 | Interest-bearing loans and borrowings | 8,145 | 9,938 |
| 25 | Derivative financial instruments | 77 | - |
| 27 | Deferred income tax liabilities | 2,868 | 2,734 |
| 18 | Other payables | 691 | 717 |
| 28 | Retirement benefit obligations | 277 | 475 |
| 26 | Provisions for liabilities | 845 | 937 |
| Total non-current liabilities | 13,962 | 16,175 |
| Current liabilities | | |
| 20 | Lease liabilities | 260 | 297 |
| 18 | Trade and other payables | 5,872 | 5,692 |
| Current income tax liabilities | 702 | 550 |
| 24 | Interest-bearing loans and borrowings | 1,491 | 549 |
| 25 | Derivative financial instruments | 51 | 14 |
| 26 | Provisions for liabilities | 513 | 479 |
| Total current liabilities | 8,889 | 7,581 |
| Total liabilities | 22,851 | 23,756 |
| Total equity and liabilities | 45,188 | 44,670 |
| R. Boucher, A. Manifold, Directors | | |
| | | | | |
| 2022 Annual Report and Form 20-F | 179 |
Consolidated Statement of Changes in Equity
for the financial year ended 31 December 2022 | | | | | | | | | | | | | | | | | | | | | | | | | | | | | | | | | | | |
| Attributable to the equity holders of the Company | | |
| Issued share capital | Share premium account | Treasury Shares/own shares | Other reserves | Cash flow hedging reserve | Foreign currency translation reserve | Retained income | Total | Non-controlling interests | Total equity |
$m | $m | $m | $m | $m | $m | $m | $m | $m | $m |
Notes | | | | | | | | | | |
| At 1 January 2022 | 310 | - | (195) | 445 | - | (97) | 19,770 | 20,233 | 681 | 20,914 |
| Group profit for the financial year | - | - | - | - | - | - | 3,847 | 3,847 | 27 | 3,874 |
| Other comprehensive income | - | - | - | - | 66 | (595) | 202 | (327) | (46) | (373) |
| Total comprehensive income | - | - | - | - | 66 | (595) | 4,049 | 3,520 | (19) | 3,501 |
| | | | | | | | | | | |
| Reclassifications | - | - | - | - | 35 | - | (35) | - | - | - |
| 8 | Share-based payment expense | - | - | - | 101 | - | - | - | 101 | - | 101 |
| 29 | Shares acquired by CRH plc (Treasury Shares) | - | - | (1,170) | - | - | - | 17 | (1,153) | - | (1,153) |
| 29 | Treasury Shares/own shares reissued | - | - | 24 | - | - | - | (24) | - | - | - |
| 29 | Shares acquired by Employee Benefit Trust (own shares) | - | - | (8) | - | - | - | - | (8) | - | (8) |
| 29 | Shares distributed under the Performance Share Plan Awards | - | - | 173 | (173) | - | - | - | - | - | - |
| 29 | Cancellation of Treasury Shares | (7) | - | 879 | 7 | - | - | (879) | - | - | - |
| Hedging gains transferred to inventory | - | - | - | - | (96) | - | - | (96) | - | (96) |
| 10 | Tax relating to cash flow hedges | - | - | - | - | - | - | 17 | 17 | - | 17 |
| 10 | Tax relating to share-based payment expense | - | - | - | - | - | - | (3) | (3) | - | (3) |
| Share option exercises | - | - | - | - | - | - | 11 | 11 | - | 11 |
| 11 | Dividends | - | - | - | - | - | - | (931) | (931) | (13) | (944) |
| Transactions involving non-controlling interests | - | - | - | - | - | - | - | - | (3) | (3) |
| At 31 December 2022 | 303 | - | (297) | 380 | 5 | (692) | 21,992 | 21,691 | 646 | 22,337 |
| | | | | | | | | | | |
| for the financial year ended 31 December 2021 |
| At 1 January 2021 | 334 | 7,493 | (386) | 444 | - | 206 | 11,565 | 19,656 | 692 | 20,348 |
| Group profit for the financial year | - | - | - | - | - | - | 2,565 | 2,565 | 56 | 2,621 |
| Other comprehensive income | - | - | - | - | - | (303) | 254 | (49) | (35) | (84) |
| Total comprehensive income | - | - | - | - | - | (303) | 2,819 | 2,516 | 21 | 2,537 |
| | | | | | | | | | | |
| 8 | Share-based payment expense | - | - | - | 110 | - | - | - | 110 | - | 110 |
| 29 | Shares acquired by CRH plc (Treasury Shares) | - | - | (880) | - | - | - | (281) | (1,161) | - | (1,161) |
| 29 | Treasury Shares/own shares reissued | - | - | 19 | - | - | - | (19) | - | - | - |
| 29 | Shares acquired by Employee Benefit Trust (own shares) | - | - | (16) | - | - | - | - | (16) | - | (16) |
| 29 | Shares distributed under the Performance Share Plan Awards | - | - | 117 | (117) | - | - | - | - | - | - |
| 29 | Reduction in Share Premium | - | (7,493) | - | - | - | - | 7,493 | - | - | - |
| 29 | Cancellation of Income Shares | (16) | - | - | - | - | - | 16 | - | - | - |
| 29 | Cancellation of Treasury Shares | (8) | - | 951 | 8 | - | - | (951) | - | - | - |
| 10 | Tax relating to share-based payment expense | - | - | - | - | - | - | 24 | 24 | - | 24 |
| Share option exercises | - | - | - | - | - | - | 13 | 13 | - | 13 |
| 11 | Dividends | - | - | - | - | - | - | (909) | (909) | (32) | (941) |
| At 31 December 2021 | 310 | - | (195) | 445 | - | (97) | 19,770 | 20,233 | 681 | 20,914 |
| | | | | | | | | | | |
| for the financial year ended 31 December 2020 |
| At 1 January 2020 | 336 | 7,493 | (360) | 411 | - | (202) | 11,350 | 19,028 | 607 | 19,635 |
| Group profit for the financial year | - | - | - | - | - | - | 1,122 | 1,122 | 43 | 1,165 |
| Other comprehensive income | - | - | - | - | - | 408 | (15) | 393 | 32 | 425 |
| Total comprehensive income | - | - | - | - | - | 408 | 1,107 | 1,515 | 75 | 1,590 |
| | | | | | | | | | | |
| 8 | Share-based payment expense | - | - | - | 96 | - | - | - | 96 | - | 96 |
| Shares acquired by CRH plc (Treasury Shares) | - | - | (220) | - | - | - | - | (220) | - | (220) |
| Treasury Shares/own shares reissued | - | - | 8 | - | - | - | (8) | - | - | - |
| Shares acquired by Employee Benefit Trust (own shares) | - | - | (29) | - | - | - | - | (29) | - | (29) |
| Shares distributed under the Performance Share Plan Awards | - | - | 65 | (65) | - | - | - | - | - | - |
| Cancellation of Treasury Shares | (2) | - | 150 | 2 | - | - | (150) | - | - | - |
| 10 | Tax relating to share-based payment expense | - | - | - | - | - | - | 1 | 1 | - | 1 |
| Share option exercises | - | - | - | - | - | - | 6 | 6 | - | 6 |
| 11 | Dividends | - | - | - | - | - | - | (710) | (710) | (15) | (725) |
| Disposal of non-controlling interests | - | - | - | - | - | - | - | - | (6) | (6) |
| Transactions involving non-controlling interests | - | - | - | - | - | - | (31) | (31) | 31 | - |
| At 31 December 2020 | 334 | 7,493 | (386) | 444 | - | 206 | 11,565 | 19,656 | 692 | 20,348 |
| | | | | |
| 2022 Annual Report and Form 20-F | 180 |
Consolidated Statement of Cash Flows
for the financial year ended 31 December 2022 | | | | | | | | | | | | | | |
| | | Restated (i) | Restated (i) |
| | 2022 | 2021 | 2020 |
| $m | $m | $m |
| Notes | Cash flows from operating activities | | | |
| Group profit for the financial year | 3,874 | 2,621 | 1,165 |
| 9 | Finance costs (net) | 382 | 417 | 490 |
| Share of equity accounted investments’ (profit)/loss | - | (55) | 118 |
| 6 | Profit on disposals | (1,422) | (119) | (9) |
13,20 | Depreciation charge | 1,644 | 1,691 | 1,624 |
| 14 | Amortisation of intangible assets | 113 | 74 | 70 |
13,14,20 | Impairment charge | - | - | 673 |
| 8 | Share-based payment expense | 101 | 110 | 96 |
| Income tax expense | 1,155 | 721 | 499 |
| Other | 42 | 21 | 6 |
| 19 | Net movement in inventories, receivables, payables and provisions | (518) | (228) | 196 |
| Cash generated from operations | 5,371 | 5,253 | 4,928 |
| Interest paid (including leases) | (374) | (401) | (432) |
| Corporation tax paid | (1,043) | (642) | (558) |
| Net cash inflow from operating activities | 3,954 | 4,210 | 3,938 |
| | | | |
| Cash flows from investing activities | | | |
| 6 | Proceeds from disposals (net of cash disposed and deferred proceeds) | 3,827 | 387 | 184 |
| 9 | Interest received | 65 | - | - |
| 15 | Dividends received from equity accounted investments | 36 | 32 | 35 |
| 13 | Purchase of property, plant and equipment | (1,523) | (1,554) | (996) |
| 30 | Acquisition of subsidiaries (net of cash acquired) | (3,253) | (1,494) | (351) |
| 15 | Other investments and advances | (45) | (4) | (1) |
| 21 | Net cash flow arising from derivative financial instruments | (11) | - | - |
| 19 | Deferred and contingent acquisition consideration paid | (32) | (33) | (54) |
| 19 | Deferred divestment consideration received | 52 | 120 | 123 |
| Net cash outflow from investing activities | (884) | (2,546) | (1,060) |
|
| | | |
| Cash flows from financing activities | | | |
| Proceeds from exercise of share options | 11 | 13 | 6 |
| Transactions involving non-controlling interests | (3) | - | - |
| 21 | Increase in interest-bearing loans and borrowings | 38 | - | 6,427 |
| 21 | Net cash flow arising from derivative financial instruments | (11) | (37) | 26 |
| 21 | Repayment of interest-bearing loans and borrowings | (364) | (1,183) | (4,943) |
| 20 | Repayment of lease liabilities (ii) | (249) | (264) | (258) |
| 29 | Treasury Shares/own shares purchased | (1,178) | (896) | (249) |
| 11 | Dividends paid to equity holders of the Company | (917) | (906) | (707) |
| 11 | Dividends paid to non-controlling interests | (13) | (32) | (15) |
| Net cash (outflow)/inflow from financing activities | (2,686) | (3,305) | 287 |
| | | | |
| Increase/(decrease) in cash and cash equivalents | 384 | (1,641) | 3,165 |
| | | | |
| Reconciliation of opening to closing cash and cash equivalents | | | |
| Cash and cash equivalents at 1 January | 5,783 | 7,721 | 4,218 |
| Translation adjustment | (231) | (297) | 338 |
| Increase/(decrease) in cash and cash equivalents | 384 | (1,641) | 3,165 |
| 23 | Cash and cash equivalents at 31 December | 5,936 | 5,783 | 7,721 |
(i)See the Accounting Policies on page 181 for further details.
(ii)Repayment of lease liabilities amounted to $297 million (2021: $328 million; 2020: $326 million), of which $48 million (2021: $64 million; 2020: $68 million) related to interest paid which is presented in cash flows from operating activities.
| | | | | |
| 2022 Annual Report and Form 20-F | 181 |
Accounting Policies
(including key accounting estimates and assumptions)
Basis of Preparation
The Consolidated Financial Statements of CRH plc have been prepared in accordance with International Financial Reporting Standards (IFRS) as issued by the International Accounting Standards Board.
CRH plc, the Parent Company, is a publicly traded limited company incorporated and domiciled in the Republic of Ireland.
The Consolidated Financial Statements, which are presented in US Dollar millions, have been prepared under the historical cost convention as modified by the measurement at fair value of share-based payments, retirement benefit obligations and certain financial assets and liabilities including derivative financial instruments.
The Consolidated Financial Statements have been prepared on a going concern basis. The Directors acknowledge that based on their review of the Group's activities, cash flows, liquidity position and borrowing facilities for the financial year ended 31 December 2022, and having assessed the principal risks facing the Group, the Board of Directors has a reasonable expectation that CRH plc, and the Group as a whole, has adequate financial and other resources to continue in operational existence and will be able to meet its liabilities as they fall due over the 12-month going concern period.
The accounting policies set out below have been applied consistently by all of the Group’s subsidiaries, joint ventures and associates to all periods presented in the Consolidated Financial Statements.
Certain prior year disclosures have been amended to conform to current year presentation. An amount of $46 million relating to the unwinding of the discount element of lease liabilities has been reclassified from other financial expense to finance costs in the period ended 31 December 2021 (31 December 2020: $49 million) to align with current year presentation. This has no impact on total net finance costs or any other financial statement line items for any of the periods presented.
In accordance with Section 304 of the Companies Act 2014, the Company is availing of the exemption from presenting its individual profit and loss account to the Annual General Meeting and from filing it with the Registrar of Companies.
Adoption of IFRS and International Financial
Reporting Interpretations Committee (IFRIC) interpretations
The following standard amendments became effective for the Group as of 1 January 2022:
•Amendments to IFRS 3 Business Combinations – Reference to the Conceptual Framework
•Amendments to IAS 16 Property, Plant and Equipment – Proceeds before Intended Use
•Amendments to IAS 37 Provisions, Contingent Liabilities and Contingent Assets – Onerous Contracts – Costs of Fulfilling a Contract
•Annual Improvements 2018 – 2020 Cycle
The standard amendments did not result in a material impact on the Group’s results.
IFRS and IFRIC interpretations being adopted in subsequent years
IFRS 17 Insurance Contracts
In May 2017, the IASB issued IFRS 17 which will be effective for reporting periods beginning on or after 1 January 2023, with presentation of comparative
figures required. The Group has evaluated the impact of this standard on future periods and it is not expected to be material.
There are no other IFRS or IFRIC interpretations that are effective subsequent to the CRH 2022 financial year-end that are expected to have a material impact on the results or financial position of the Group.
Impact of Climate Change and Carbon Emissions Reduction Targets
Climate change risks including the impact of achieving the Group's carbon emissions reduction targets and the risks identified in the TCFD disclosures on pages 56 to 59 have been considered and assessed in the preparation of the Consolidated Financial Statements for the year ended 31 December 2022. There has been no material impact identified on the estimates and underlying assumptions made in the preparation of the Group’s Consolidated Financial Statements as a result of climate change risks. In line with the application of our accounting policies, estimates and underlying assumptions are reviewed on an ongoing basis as we continue to develop and implement our strategy to meet our carbon emissions reduction targets. The table below provides details of where further information has been provided in these Consolidated Financial Statements.
| | | | | |
Climate Change and Carbon Emissions Reduction Targets References | Pages |
| Impairment testing of goodwill and property, plant and equipment | 182, 211 |
| Useful lives of assets | 186, 209 |
| Provisions for liabilities | 183 |
| Inventories | 187 |
| Retirement Benefit Obligations | 234 |
The Directors are aware of the ever-changing risks attached to climate change and regularly assess these risks against judgements and estimates made in the preparation of the Group’s Consolidated Financial Statements.
In early 2023, the Science Based Targets initiative (SBTi) validated the alignment of our existing Scope 1 and Scope 2 carbon emissions reduction target to a 1.5°C warming scenario. The target previously aligned to a well below 2.0°C scenario. The Group’s assessment is that the impact of the adoption of this updated target will not have a material impact on the estimates, judgements and assumptions set out in the relevant disclosures referenced above. The overall absolute Scope 1 and Scope 2 carbon emissions reduction target by 2030 is consistent with the previous target.
Voluntary Change in Accounting Policy
For the period ended 31 December 2022, the Group retrospectively adopted a voluntary change in accounting policy in accordance with IAS 8 Accounting Policies, Changes in Accounting Estimates and Errors with respect to the presentation of operating cash flows under IAS 7 Statement of Cash Flows. The impact of this change is to replace “Profit before tax” with “Group profit for the financial year” as the starting point for the reconciliation to net cash flows from operating activities in the Consolidated Statement of Cash Flows. The new presentation reconciles net cash flows from operating activities on a total Group basis, including both continuing and discontinued operations. This has no impact on net cash inflow from operating activities or any other financial statement line items for the period ended 31 December 2022 or any comparative periods presented.
Key Accounting Policies which involve Estimates, Assumptions and Judgements
The preparation of the Consolidated Financial Statements in accordance with IFRS requires management to make certain estimates, assumptions and judgements that affect the application of accounting policies and the reported amounts of assets, liabilities, income and expenses. Management believes that the estimates, assumptions and judgements upon which it relies are reasonable based on the information available to it at the time that those estimates, assumptions and judgements are made. In some cases, the accounting treatment of a particular transaction is specifically dictated by IFRS and does not require management’s judgement in its application.
| | | | | |
| 2022 Annual Report and Form 20-F | 182 |
Accounting Policies continued
Management considers that their use of estimates, assumptions and judgements in the application of the Group’s accounting policies are inter-related and therefore discuss them together below with the major sources of estimation uncertainty and significant judgements separately identified.
Estimates and underlying assumptions are reviewed on an ongoing basis. Changes in accounting estimates may be necessary if there are changes in the circumstances or experiences on which the estimate was based or as a result of new information. The critical accounting policies, which involve significant estimates, assumptions or judgements, the actual outcome of which could have a material impact on the Group’s results and financial position outlined below, are as follows:
Impairment of goodwill and property, plant and equipment – Notes 13 and 14
Goodwill
In the year in which a business combination is effected and where some or all of the goodwill allocated to a particular cash-generating unit (CGU) arose in respect of that combination, the CGU is tested for impairment prior to the end of the relevant annual period.
Goodwill is subject to impairment testing on an annual basis and at any time during the year if an indicator of impairment is considered to exist.
Where the carrying value exceeds the estimated recoverable amount (being the greater of fair value less costs of disposal and value-in-use), an impairment loss is recognised by writing down goodwill to its recoverable amount.
| | | | | | | | |
| | |
| Major sources of estimation uncertainty: Projected EBITDA (as defined)* margin, long-term growth and pre-tax discount rates The impairment testing process requires management to make significant judgements and estimates regarding the future cash flows expected to be generated by CGUs to which goodwill has been allocated. In assessing value-in-use net cash flow forecasts are extrapolated using long-term growth rates to determine the basis for an annuity-based terminal value. These net cash flow forecasts reflect volume, price and cost (including the cost of carbon where applicable) assumptions in addition to other cash flow movements. EBITDA (as defined)* margin is deemed an appropriate measure for assessing the estimation uncertainty associated with price and cost assumptions. Future cash flows, including the terminal value, are discounted to their present value using a pre-tax discount rate that reflects current market assessments of the time value of money and the risks specific to the asset for which the future cash flow estimates have not been adjusted. The estimates of future cash flows exclude cash inflows or outflows attributable to financing activities and income tax. Management periodically evaluates and updates the estimates based on the conditions which influence these variables. The assumptions and conditions for determining impairments of goodwill reflect management’s best assumptions and estimates, but these items involve inherent uncertainties described above, many of which are not under management’s control. As a result, the accounting for such items could result in different estimates or amounts if management used different assumptions or if different conditions occur in future accounting periods. A detailed discussion of the impairment methodology applied, key assumptions used and related sensitivity analyses by the Group in the context of goodwill is provided in note 14 to the Consolidated Financial Statements. | |
The recoverable amount of goodwill is determined by reference to the CGU to which the goodwill has been allocated. Impairment losses arising in respect of goodwill are not reversed once recognised.
Goodwill relating to associates and joint ventures is included in the carrying amount of the investment and is neither amortised nor individually tested for impairment. Where indicators of impairment of an investment arise in accordance with the requirements of IAS 36 Impairment of Assets, the carrying amount is tested for impairment by comparing its recoverable amount with its carrying amount.
Property, plant and equipment
The carrying values of items of property, plant and equipment are reviewed for indicators of impairment at each reporting date and are subject to impairment testing when events or changes in circumstances indicate that the carrying values may not be recoverable.
Property, plant and equipment assets are reviewed for potential impairment by applying a series of external and internal indicators specific to the assets under consideration. These indicators encompass macroeconomic issues including the inherent cyclicality of the building materials sector, actual obsolescence or physical damage, a deterioration in forecast performance in the internal reporting cycle and restructuring and rationalisation programmes. Consideration is also given to climate change and policy risks and uncertainties as set out on page 142, as well as to the actions required to deliver the Group’s carbon emissions reduction targets when reviewing assets for potential impairment. A detailed discussion on this consideration is provided in note 13 to the Consolidated Financial Statements.
Where the carrying value exceeds the estimated recoverable amount (being the greater of fair value less costs of disposal and value-in-use), an impairment loss is recognised by writing down the assets to their recoverable amount. For an asset that does not generate largely independent cash inflows, the recoverable amount is determined by reference to the CGU to which the asset belongs.
In assessing value-in-use, the estimated future cash flows are discounted to their present value using a pre-tax discount rate that reflects current market assessments of the time value of money and the risks specific to the CGU for which the future cash flow estimates have not been adjusted. The estimates of future cash flows exclude cash inflows or outflows attributable to financing activities and income tax.
Retirement benefit obligations – Note 28
Costs arising in respect of the Group’s defined contribution pension schemes are charged to the Consolidated Income Statement in the period in which they are incurred. The Group has no legal or constructive obligation to pay further contributions in the event that the fund does not hold sufficient assets to meet its benefit commitments.
The liabilities and costs associated with the Group’s defined benefit pension schemes (both funded and unfunded) are assessed on the basis of the projected unit credit method by professionally qualified actuaries and are arrived at using actuarial assumptions based on market expectations at the balance sheet date.
| | | | | | | | |
| Major sources of estimation uncertainty: Discount rates The assumptions underlying the actuarial valuations (including discount rates, rates of increase in future compensation levels, mortality rates and healthcare cost trends), from which the amounts recognised in the Consolidated Financial Statements are determined, are updated annually based on current economic conditions and for any relevant changes to the terms and conditions of the pension and post-retirement plans. These assumptions can be affected by (i) for the discount rates, changes in the rates of return on high-quality corporate bonds; (ii) for future compensation levels, future labour market conditions and (iii) for healthcare cost trend rates, the rate of medical cost inflation in the relevant regions. The weighted average actuarial assumptions used and sensitivity analysis in relation to the significant assumptions employed in the determination of pension and other post-retirement liabilities are contained in note 28 to the Consolidated Financial Statements. The assumptions that are the most significant to the measurement of retirement benefit obligations are the discount rates. The discount rates employed in determining the present value of the schemes’ liabilities are determined by reference to market yields at the balance sheet date on high-quality corporate bonds of a currency and term consistent with the currency and term of the associated post-employment benefit obligations. | |
* EBITDA is defined as earnings from continuing operations before interest, taxes, depreciation, amortisation, asset impairment charges, profit on disposals and the Group's share of equity accounted investments' profit after tax.
| | | | | |
| 2022 Annual Report and Form 20-F | 183 |
| | | | | | | | |
| Whilst management believes that the assumptions used are appropriate, differences in actual experience or changes in assumptions may affect the obligations and expenses recognised in future accounting periods. The assets and liabilities of defined benefit pension schemes may exhibit significant period-on-period volatility attributable primarily to changes in bond yields and longevity. In addition to future service contributions, significant cash contributions may be required to remediate past service deficits. | |
The net surplus or deficit arising on each of the Group’s defined benefit pension schemes, are shown either within non-current assets or non-current liabilities in the Consolidated Balance Sheet. The deferred tax impact of pension scheme surpluses and deficits is disclosed separately within deferred tax assets or liabilities as appropriate.
Remeasurements, comprising actuarial gains and losses, the return on plan assets (excluding net interest) and changes in the effect of the asset ceiling (if any, excluding net interest), are recognised immediately in the Consolidated Balance Sheet with a corresponding debit or credit to retained earnings through other comprehensive income in the period in which they occur. Remeasurements are not reclassified to profit or loss in subsequent periods.
The defined benefit pension asset or liability in the Consolidated Balance Sheet comprises the total for each plan of the present value of the defined benefit obligation less the fair value of plan assets out of which the obligations are to be settled directly. Plan assets are assets that are held by a long-term employee benefit fund or qualifying insurance policies. Fair value is based on market price information and, in the case of published quoted securities, it is the published bid price. The value of any defined benefit asset is limited to the present value of any economic benefits available in the form of refunds from the plan and reductions in the future contributions to the plan.
Defined benefit pension surpluses are recognised as assets to the extent that they are considered recoverable, which is generally by way of a refund or lower future employer contributions. Where there is no unconditional right to a refund or reduction in future contributions, we restrict the assets of the scheme by applying the asset ceiling test, which limits the net defined benefit surplus to the present value of available refunds and reductions in future contributions to the plan.
The Group’s obligation in respect of post-employment healthcare and life assurance benefits represents the amount of future benefit that employees have earned in return for service in the current and prior periods. The obligation is computed on the basis of the projected unit credit method and is discounted to present value using a discount rate equating to the market yield at the balance sheet date on high-quality corporate bonds of a currency and term consistent with the currency and estimated term of the post employment obligations.
Provisions for liabilities – Note 26
A provision is recognised when the Group has a present obligation (either legal or constructive) as a result of a past event, it is probable that a transfer of economic benefits will be required to settle the obligation and a reliable estimate can be made of the amount of the obligation.
| | | | | | | | |
| Significant judgement: Judgement is required in determining whether the Group has a present obligation and whether it is probable that an outflow of economic benefits will be required to settle this obligation. This judgement is applied to information available at the time of determining the liability including but not limited to judgements around interpretations of legislation, regulations, case law and insurance contracts depending on the nature of the provision. | |
Where the Group anticipates that a provision will be reimbursed, the reimbursement is recognised as a separate asset only when it is virtually certain that the reimbursement will arise. Provisions are measured at the present value of the expenditures expected to be required to settle the obligation.
The increase in the provision due to the passage of time is recognised as an interest expense.
Contingent liabilities arising on business combinations are recognised as provisions if the contingent liability can be reliably measured at its acquisition date fair value. Provisions are not recognised for future operating losses.
Management is not aware of any potential changes to key assumptions that have a significant risk of causing a material adjustment to the carrying value of provisions within the next financial year; however, due to the nature of some of our provisions, estimates may depend on the outcome of future events and need to be revised as circumstances change in future accounting periods. Refer to note 26 for the expected timing of outflows by provisions category.
Environmental and remediation provisions
The measurement of environmental and remediation provisions is based on an evaluation of currently available facts with respect to each individual site and considers factors such as existing technology, currently enacted laws and regulations and prior experience in remediation of sites. Inherent uncertainties exist in such evaluations primarily due to unknown conditions, changing governmental regulations and legal standards regarding liability, the protracted length of the clean-up periods and evolving technologies.
The environmental and remediation liabilities provided for in the Consolidated Financial Statements reflect the judgement applied by management in respect of information available at the time of determining the liability and are adjusted periodically as remediation efforts progress or as additional technical or legal information becomes available.
The impact of climate change and policy risks and uncertainties as set out on page 142 on environmental and remediation provisions has been considered, specifically the impact on timing and extent of costs and cash outflows. Changes to legislation, including those relating to climate change, are factored into the assessment of provisions when the legislation is virtually certain to be enacted. The Group’s carbon emissions reduction targets is also considered in these judgements. The measurement of our provisions is based on reasonable and supportable assumptions that represent management’s current best estimate of the range of economic conditions that will exist in the foreseeable future. These assumptions do not have a significant risk of resulting in a material adjustment to the carrying value of these provisions within the next financial year and therefore do not represent a major source of estimation uncertainty.
Due to the inherent uncertainties described above, many of which are not under management’s control, actual costs and cash outflows could differ if management used different assumptions or if different conditions occur in future accounting periods.
Legal contingencies
The status of each significant claim and legal proceeding in which the Group is involved is reviewed by management on a periodic basis and the Group’s potential financial exposure is assessed. If the potential loss from any claim or legal proceeding is considered probable, and the amount can be reliably estimated, a liability is recognised for the estimated loss.
Because of the uncertainties inherent in such matters, the related provisions are based on the best information available at the time; the issues taken into account by management and factored into the assessment of legal contingencies include, as applicable, the status of settlement negotiations, interpretations of contractual obligations, prior experience with similar contingencies/claims, and advice obtained from legal counsel and other third parties. As additional information becomes available on pending claims, the potential liability is reassessed and revisions are made to the amounts accrued where appropriate. Such revisions in the judgements and estimates of the potential liabilities could have an impact on the results of operations and financial position of the Group in future accounting periods.
Insurance provisions
Insurance provisions are subject to actuarial valuation and are based on actuarial triangulations which are extrapolated from historical claims experience. These provisions include claims which are classified as “incurred but not reported”, the status of which are reviewed periodically by management, in conjunction with appropriately qualified advisors. Changes in actuarial methodologies and assumptions, along with the receipt of new information, could have an impact on the financial position of the Group through recognition of additional, or release of, provisions in future accounting periods.
| | | | | |
| 2022 Annual Report and Form 20-F | 184 |
Accounting Policies continued
Other Significant Accounting Policies
Basis of consolidation
The Consolidated Financial Statements include the financial statements of the Parent Company and all subsidiaries drawn up to 31 December each year, and the Group’s share of the results of joint ventures and associates which are accounted for using the equity method. The financial year-ends of the Group’s subsidiaries, joint ventures and associates are coterminous.
Subsidiaries
Subsidiaries are all entities over which the Group has control. The Group controls an entity when the Group is exposed to, or has rights to, variable returns from its involvement with the entity and has the ability to affect those returns through its power over the entity. Subsidiaries are fully consolidated from the date on which control is transferred to the Group. They are deconsolidated from the date that control ceases. A change in the ownership interest of a subsidiary without a change in control is accounted for as an equity transaction.
When the Group holds less than the majority of voting rights, other facts and circumstances including contractual arrangements that give the Group power over the investee may result in the Group controlling the investee. The Group reassesses whether it controls an investee if, and when, facts and circumstances indicate that there are changes to the elements evidencing control.
Non-controlling interests represent the portion of the equity of a subsidiary not attributable either directly or indirectly to the Parent Company and are presented separately in the Consolidated Income Statement and within equity in the Consolidated Balance Sheet, distinguished from Parent Company shareholders’ equity. Acquisitions of non-controlling interests are accounted for as transactions with equity holders in their capacity as equity holders and therefore no goodwill is recognised as a result of such transactions. On an acquisition by acquisition basis, the Group recognises any non-controlling interest in the acquiree either at fair value or at the non-controlling interest’s proportionate share of the acquiree’s net assets.
Investments in associates and joint ventures – Note 15
An associate is an entity over which the Group has significant influence. Significant influence is the power to participate in the financial and operating policy decisions of an entity, but is not control or joint control over those policies.
A joint venture is a type of joint arrangement whereby the parties that have joint control of the arrangement have rights to the net assets of the joint venture. Joint control is the contractually agreed sharing of control of the arrangement, which exists only when decisions about the relevant activities require unanimous consent of the parties sharing control.
The Group’s investments in its associates and joint ventures are accounted for using the equity method from the date significant influence/joint control is deemed to arise until the date on which significant influence/joint control ceases to exist or when the interest becomes classified as an asset held for sale.
The Consolidated Income Statement reflects the Group’s share of result after tax of the related associates and joint ventures. Investments in associates and joint ventures are carried in the Consolidated Balance Sheet at cost adjusted in respect of post-acquisition changes in the Group’s share of net assets, less any impairment in value. Loans advanced to associates or joint ventures form part of the net investment in the associate or joint venture held in the Consolidated Balance Sheet. The Group applies IFRS 9 Financial Instruments, including the impairment requirements, to these loans as the equity method does not apply. If necessary, impairment losses on the carrying amount of an investment are reported within the Group’s share of equity accounted investments’ results in the Consolidated Income Statement. If the Group’s share of losses exceeds the carrying amount of an associate or joint venture, the carrying amount is reduced to nil and recognition of further losses is discontinued except to the extent that the Group has incurred obligations in respect of the associate or joint venture.
Joint operations
A joint operation is a type of joint arrangement whereby the parties that have joint control of the arrangement have rights to the assets and obligations for the liabilities, relating to the arrangement.
The Group’s investments in its joint operations are accounted for by recognising its assets and its liabilities, including its share of any assets or liabilities held
jointly; its share of the revenue from the sale of the output by the joint operation; and its expenses, including its share of any expenses incurred jointly.
Revenue recognition – Note 1
The Group recognises revenue in the amount of the price expected to be received for goods and services supplied at a point in time or over time, as contractual performance obligations are fulfilled and control of goods and services passes to the customer. It excludes trade discounts and value-added tax/sales tax.
Revenue derived from sale of goods (sources other than construction contracts)
The Group manufactures and supplies a diverse range of building materials and products. Whilst there are a number of different activities across the Group; recognition of revenue from the sale of goods is similar; being at the point in time when control is deemed to pass to the customer upon leaving a CRH premises or upon delivery to a customer depending on the terms of the sale. Contracts do not contain multiple performance obligations (as defined by IFRS 15 Revenue from Contracts with Customers).
Across the Group, goods are often sold with discounts or rebates based on cumulative sales over a period. This variable consideration is only recognised when it is highly probable that it will not be subsequently reversed and is recognised using the most likely amount or expected value methods, depending on the individual contract terms. In the application of appropriate revenue recognition, judgement is exercised by management in the determination of the likelihood and quantum of such items based on experience and historical trading patterns.
The Group is deemed to be a principal to an arrangement when it controls a promised good or service before transferring them to a customer and accordingly recognises revenue on a gross basis. Where the Group is determined to be an agent to a transaction, based on the principle of control, the net amount retained after the deduction of any costs to the principal is recognised as revenue. Within the non-construction contract businesses no element of financing is deemed present as transactions are all made with average credit terms (usually 90 days), consistent with market practice.
Revenue derived from construction contracts
The Group enters into a number of construction contracts, to complete large construction projects. Contracts usually commence and complete within one year and are generally fixed price, but may be subject to indexation and/or escalation clauses that can either increase or decrease the final transaction price.
The Group typically recognises revenue within its construction contract businesses over time, as it performs its obligations. Management believe this best reflects the transfer of control to the customer by providing a faithful depiction of primarily the enhancement of a customer controlled asset or the construction of an asset with no alternative use.
The percentage-of-completion method is used to recognise revenue when the outcome of a contract can be estimated reliably. The percentage-of-completion is calculated using an input method and based on the proportion of contract costs incurred at the balance sheet date relative to the total estimated costs of the contract. In all of our construction contract arrangements the Group has an enforceable right to payment for work and performance obligations completed to date.
Some of the Group’s construction contracts may contain forms of variable consideration that can either increase or decrease the transaction price. Variable consideration is estimated based on the most likely amount or expected value methods (depending on the contract terms) and the transaction price is adjusted to the extent it is highly probable that a significant reversal of revenue recognised will not occur.
In some instances revenue is recognised in the period subsequent to the contracted work being completed when there is final certainty over the remaining element of variable consideration.
| | | | | |
| 2022 Annual Report and Form 20-F | 185 |
Recognition of contract assets and liabilities
In our construction contract businesses, amounts are billed as work progresses in accordance with pre-agreed contractual terms. When a performance obligation is satisfied but a customer has not yet been billed this is recognised as a contract asset (unbilled revenue) and included within Trade and Other Receivables (note 17). Retentions (representing the percentage of consideration due which is retained by the customer until certain contractual activities are completed) are also a common feature of construction contracts and are recognised as a contract asset within Trade and Other Receivables when we have a right to consideration in exchange for the completion of the contract. Retentions are consistent with industry norms and the purpose of these is not to provide a form of financing. Apart from retentions, the Group does not have any construction contracts where the period between the transfer of the promised goods to the customer and payment by the customer exceeds one year. As a consequence, the Group applies the practical expedient in IFRS 15 and does not adjust any of its transaction prices for the time value of money.
When consideration is received in advance of work being performed, or we have billed an amount to a customer that is in excess of revenue recognised on the contract; this is recognised as a contract liability within Trade and Other Payables (note 18); and the revenue is generally recognised in the subsequent period when the right to recognise revenue has been determined. As a result, advance payments received for construction contract arrangements are not considered a significant form of financing.
Cumulative costs incurred, net of amounts transferred to cost of sales, after deducting onerous provisions, provisions for contingencies and payments on account not matched with revenue, are included as construction contract balances in inventories (note 16). Cost includes all expenditure directly related to specific projects and an allocation of fixed and variable overheads incurred in the Group’s contract activities based on normal operating capacity. The Group’s contracts generally are for a duration of less than one year and therefore the Group does not capitalise incremental contract costs; instead expensing as incurred, as permitted by the practical expedient under IFRS 15.
Onerous contracts and warranties
When a contract is identified as being onerous (i.e. its unavoidable cost exceeds the economic benefit of the contract), a provision is created; being the lower of costs to complete the contract and the cost of exiting the contract. The Group recognises a provision for assurance-type (standard) warranties offered across the Group under its terms and conditions in accordance with IAS 37 Provisions, Contingent Liabilities and Contingent Assets. The Group provides assurance-type warranties for general repairs and does not typically provide service-type (extended) warranties.
Segment reporting – Note 2
Operating segments are reported in a manner consistent with the internal organisational and management structure and the internal reporting information provided to the Chief Operating Decision Maker who is responsible for allocating resources and assessing performance of the operating segments.
Assets and liabilities held for sale – Note 3
Non-current assets and disposal groups classified as held for sale are measured at the lower of carrying amount and fair value less costs to sell.
Non-current assets and disposal groups are classified as held for sale if their carrying amounts will be recovered through a sale transaction rather than through continuing use. This condition is regarded as met only when the sale is highly probable and the asset or disposal group is available for immediate sale in its present condition subject only to terms that are usual and customary for sales of such assets. Management must be committed to the sale, which should be expected to qualify for recognition as a completed sale within 12 months from the date of classification as held for sale.
Property, plant and equipment and intangible assets are not depreciated or amortised once classified as held for sale. The Group ceases to use the equity method of accounting from the date on which an interest in a joint venture or associate becomes held for sale. Non-current assets classified as held for sale and liabilities directly associated with those assets are presented separately as current items in the Consolidated Balance Sheet.
Discontinued operations – Note 3
Discontinued operations are reported when a component of the Group, that represents a separate major line of business or geographical area of operation, has been disposed of, or when a sale is highly probable; its operations and cash flows can be clearly distinguished, operationally and for financial reporting purposes, from the rest of the Group and is classified as held for sale or has been disposed of. The Group classifies a non-current asset or disposal group as held for sale if its carrying value will be recovered through a sales transaction or distribution to shareholders rather than continuing use.
In the Consolidated Income Statement, discontinued operations are excluded from the results of continuing operations and are presented as a single amount as profit or loss after tax from discontinued operations. Corresponding notes to the Consolidated Income Statement exclude amounts for discontinued operations, unless stated otherwise.
Share-based payments – Note 8
The Group operates a number of equity-settled share-based payment plans. Details of these plans, together with the nature of the underlying market and non-market performance and other vesting conditions are outlined in note 8. The Group has no material exposure in respect of cash-settled share-based payment transactions and share-based payment transactions with cash alternatives.
Awards under Performance Share Plans
20% of the awards under the 2014 Performance Share Plan are subject to a TSR (and hence market-based) vesting condition measured against a tailored sector peer group (2020 and 2021: 25%). Accordingly, the fair value assigned to the related equity instruments at the grant date is derived using a Monte Carlo simulation technique to model the market-based performance conditions; and is adjusted to reflect the anticipated likelihood as at the grant date of achieving the vesting condition. Awards are treated as vesting irrespective of whether or not the market condition is satisfied, provided that all other performance and/or service conditions are satisfied.
The remaining awards granted under the 2014 Performance Share Plan are subject to non-market-based vesting conditions; 45% are subject to a cumulative cash flow target (2020 and 2021: 50%) and 20% are subject to a RONA metric (2020 and 2021: 25%). In 2022 a new sustainability and diversity scorecard metric of 15% was introduced for awards made in 2022 (a non-market-based vesting condition). The fair value of the awards is calculated as the market price of the shares at the date of grant. No expense is recognised for awards that do not ultimately vest. At the balance sheet date the estimate of the level of vesting is reviewed and any adjustment necessary is recognised in the Consolidated Income Statement.
If awards which vest under the 2014 Performance Share Plan are allotted to an Employee Benefit Trust, an increase in nominal share capital and share premium are recognised accordingly on allotment.
Savings-related Share Option Scheme
The fair values assigned to options under the Savings-related Share Option Scheme are derived in accordance with the trinomial valuation methodology on the basis that the services to be rendered by employees as consideration for the granting of share options will be received over the vesting period, which is assessed as at the grant date.
The cost is recognised, together with a corresponding increase in equity, over the period in which the performance and/or service conditions are fulfilled. The cumulative expense recognised at each reporting date until the vesting date reflects the extent to which the vesting period has expired and the Group’s best estimate of the number of equity instruments that will ultimately vest. The Consolidated Income Statement expense/credit for a period represents the movement in cumulative expense recognised at the beginning and end of that period. The cumulative charge to the Consolidated Income Statement is reversed only where an employee in receipt of share options leaves service prior to completion of the expected vesting period and those options forfeit in consequence.
Where an award is cancelled, it is treated as if it is vested on the date of cancellation, and any expense not yet recognised for the award is recognised immediately. This includes any award where non-vesting conditions within the control of either the Company or the employee are not met. All cancellations of awards are treated equally.
| | | | | |
| 2022 Annual Report and Form 20-F | 186 |
Accounting Policies continued
The proceeds received net of any directly attributable transaction costs are credited to share capital (nominal value) and share premium when the options are exercised.
The dilutive effect of outstanding options is reflected as additional share dilution in the determination of diluted earnings per share.
Taxation – current and deferred – Notes 10 and 27
Current tax represents the expected tax payable (or recoverable) on the taxable profit for the year using tax rates enacted for the period. Where items are accounted for outside of profit or loss, the related income tax is recognised either in other comprehensive income or directly in equity as appropriate.
Deferred tax is recognised using the liability method on temporary differences arising at the balance sheet date between the tax bases of assets and liabilities and their carrying amounts in the Consolidated Financial Statements. However, deferred tax liabilities are not recognised if they arise from the initial recognition of goodwill. In addition, deferred income tax is not accounted for if it arises from initial recognition of an asset or liability in a transaction other than a business combination that, at the time of the transaction, affects neither accounting nor taxable profit or loss. For the most part, no provision has been made for temporary differences applicable to investments in subsidiaries and joint ventures as the Group is in a position to control the timing of reversal of the temporary differences and it is probable that the temporary differences will not reverse in the foreseeable future. However, a temporary difference has been recognised to the extent that specific assets have been identified for sale or where there is a specific intention to unwind the temporary difference in the foreseeable future. Due to the absence of control in the context of associates (significant influence only), deferred tax liabilities are recognised where appropriate in respect of CRH’s investments in these entities on the basis that the exercise of significant influence would not necessarily prevent earnings being remitted by other shareholders in the undertaking.
Deferred tax is determined using tax rates (and laws) that have been enacted or substantively enacted by the balance sheet date and are expected to apply when the related deferred income tax asset is realised or the deferred income tax liability is settled. Deferred tax assets and liabilities are not subject to discounting. Deferred tax assets are recognised in respect of all deductible temporary differences, carry-forward of unused tax credits and unused tax losses to the extent that it is probable that taxable profits will be available against which the temporary differences can be utilised. The carrying amounts of deferred tax assets are subject to review at each balance sheet date and are reduced to the extent that future taxable profits are considered to be inadequate to allow all or part of any deferred tax asset to be utilised.
The Group’s income tax charge is based on reported profit and enacted statutory tax rates, which reflect various allowances and reliefs available to the Group in the multiple tax jurisdictions in which it operates. The determination of the Group’s provision for income tax requires certain judgements and estimates in relation to matters where the ultimate tax outcome may not be certain. The recognition or non-recognition of deferred tax assets as appropriate also requires judgement as it involves an assessment of the future recoverability of those assets. In addition, the Group is subject to tax audits which can involve complex issues that could require extended periods to conclude, the resolution of which is often not within the control of the Group. Although management believes that the estimates included in the Consolidated Financial Statements and its tax return positions are reasonable, there is no certainty that the final outcome of these matters will not be different than that which is reflected in the Group’s historical income tax provisions and accruals. Whilst it is possible, the Group does not currently anticipate that any such differences could have a material impact on the income tax provision and profit for the period in which such a determination is made nor does it expect any significant impact on its financial position within the next 12 months. This is based on the Group’s knowledge and experience, as well as the profile of the individual components which have been reflected in the current tax liability, the status of the tax audits, enquiries and negotiations in progress at each year-end, previous claims and any factors specific to the relevant tax environments.
Property, plant and equipment – Note 13
The carrying value of property, plant and equipment (excluding leased right-of-use assets) of $17,663 million at 31 December 2022 represents 39% of total assets at that date. Property, plant and equipment are stated at cost less any accumulated depreciation and any accumulated impairments except for certain
items that had been revalued to fair value prior to the date of transition to IFRS (1 January 2004).
Repair and maintenance expenditure is included in an asset’s carrying amount or recognised as a separate asset, as appropriate, only when it is probable that future economic benefits associated with the item will flow to the Group and the cost of the item can be measured reliably. All other repair and maintenance expenditure is charged to the Consolidated Income Statement during the financial period in which it is incurred.
Borrowing costs incurred in the construction of major assets which take a substantial period of time to complete are capitalised in the financial period in which they are incurred.
In the application of the Group’s accounting policy, judgement is exercised by management in the determination of residual values and useful lives.
Depreciation methods, useful lives and residual values are reviewed at each financial year-end. Changes in the expected useful life or the expected pattern of consumption of future economic benefits embodied in the asset are accounted for by changing the depreciation period or method as appropriate on a prospective basis.
Amongst other factors, consideration is given to climate change and policy risks and uncertainties as set out on page 142 when determining the useful lives of assets. The determination of useful lives also considers the Group’s carbon emissions reduction targets. Capital expenditure will continue to be required for ongoing projects and the useful lives of future capital expenditure may differ from current assumptions, however there were no significant changes in the estimates of useful lives during the current financial year.
Future developments in technology may also result in a risk of obsolescence for the Group’s current portfolio of plant and machinery assets, however the expected timeframe for these developments is not currently anticipated to impact their remaining useful lives as the majority of the Group’s plant and machinery assets will be fully depreciated within ten years.
Depreciation and depletion is calculated to write off the book value of each item of property, plant and equipment over its useful economic life on a straight-line basis at the following rates:
Land and buildings
The book value of mineral-bearing land, less an estimate of its residual value, is depleted over the period of the mineral extraction in the proportion which production for the year bears to the latest estimates of proven and probable mineral reserves. Land, other than mineral-bearing land, is not depreciated. In general, buildings are depreciated at 2.5% per annum (p.a.).
Plant and machinery
These are depreciated at rates ranging from 3.3% p.a. to 20% p.a. depending on the type of asset. Plant and machinery includes transport vehicles which are, on average, depreciated at 20% p.a.
Business combinations – Note 30
The Group applies the acquisition method in accounting for business combinations. The cost of an acquisition is measured as the aggregate of the consideration transferred (excluding amounts relating to the settlement of pre-existing relationships), the amount of any non-controlling interest in the acquiree and, in a business combination achieved in stages, the acquisition date fair value of the acquirer’s previously-held equity interest in the acquiree. Transaction costs that the Group incurs in connection with a business combination are expensed as incurred.
To the extent that settlement of all or any part of consideration for a business combination is deferred, the fair value of the deferred component is determined through discounting the amounts payable to their present value at the date of exchange. The discount component is unwound as an interest charge in the Consolidated Income Statement over the life of the obligation. Any contingent consideration is recognised at fair value at the acquisition date and included in the cost of the acquisition. The fair value of contingent consideration at acquisition date is arrived at through discounting the expected payment to present value. In general, in order for contingent consideration to become payable, pre-defined profit and/or profit/net asset ratios must be exceeded. Subsequent changes to the fair value of the contingent consideration will be
| | | | | |
| 2022 Annual Report and Form 20-F | 187 |
recognised in profit or loss unless the contingent consideration is classified as equity, in which case it is not remeasured and settlement is accounted for within equity.
The assets and liabilities arising on business combination activity are measured at their acquisition-date fair values. Contingent liabilities assumed in business combination activity are recognised as of the acquisition date, where such contingent liabilities are present obligations arising from past events and their fair value can be measured reliably. In the case of a business combination achieved in stages, the acquisition date fair value of the acquirer’s previously-held equity interest in the acquiree is remeasured to fair value as at the acquisition date through profit or loss. When the initial accounting for a business combination is determined provisionally, any adjustments to the provisional values allocated to the consideration, identifiable assets or liabilities (and contingent liabilities, if relevant) are made within the measurement period, a period of no more than one year from the acquisition date.
Goodwill – Note 14
Goodwill arising on a business combination is initially measured at cost, being the excess of the cost of an acquisition over the fair value of the net identifiable assets and liabilities assumed at the date of acquisition and relates to the future economic benefits arising from assets which are not capable of being individually identified and separately recognised. Following initial recognition, goodwill is measured at cost less any accumulated impairment losses. If the cost of the acquisition is lower than the fair value of the net assets of the subsidiary acquired, the identification and measurement of the related assets and liabilities and contingent liabilities are revisited and the cost is reassessed with any remaining balance recognised immediately in the Consolidated Income Statement.
The carrying amount of goodwill in respect of associates and joint ventures is included in investments accounted for using the equity method (i.e. within financial assets) in the Consolidated Balance Sheet.
Where a subsidiary is disposed of or terminated through closure, the carrying value of any goodwill of that subsidiary is included in the determination of the net profit or loss on disposal/termination.
Intangible assets (other than goodwill) arising on business combinations – Note 14
An intangible asset is capitalised separately from goodwill as part of a business combination at cost (fair value at date of acquisition).
Subsequent to initial recognition, intangible assets are carried at cost less any accumulated amortisation and any accumulated impairment losses. The carrying values of definite-lived intangible assets (the Group does not currently have any indefinite-lived intangible assets other than goodwill) are reviewed for indicators of impairment at each reporting date and are subject to impairment testing when events or changes in circumstances indicate that the carrying values may not be recoverable.
Intangible assets are amortised on a straight-line basis. In general, based on the current composition of definite-lived intangible assets, the useful lives for customer-related intangible assets range from five to twenty years and the useful lives for marketing related intangible assets range from ten to thirty years.
Amortisation periods, useful lives, expected patterns of consumption and residual values are reviewed at each financial year-end. Changes in the expected useful life or the expected pattern of consumption of future economic benefits embodied in the asset are accounted for by changing the amortisation period or method as appropriate on a prospective basis.
Leases – Notes 13 and 20
The Group enters into leases for a range of assets, principally relating to property. These property leases have varying terms, renewal rights and escalation clauses, including periodic rent reviews linked with a consumer price index and/or other indices. The Group also leases plant and machinery, vehicles and equipment. The terms and conditions of these leases do not impose significant financial restrictions on the Group.
A contract contains a lease if it is enforceable and conveys the right to control the use of a specified asset for a period of time in exchange for consideration, which
is assessed at inception. A right-of-use asset and lease liability are recognised at the commencement date for contracts containing a lease, with the exception of leases with a term of 12 months or less which do not contain a purchase option, leases where the underlying asset is of low value and leases with associated payments that vary directly in line with usage or sales. The commencement date is the date at which the asset is made available for use by the Group.
The lease liability is initially measured at the present value of the future lease payments, discounted using the incremental borrowing rate or the interest rate implicit in the lease, if this is readily determinable, over the remaining lease term. Lease payments include fixed payments less any lease incentives receivable, variable payments that are dependent on a rate or index known at the commencement date, amounts expected to be paid under residual value guarantees and any payments for an optional renewal period and purchase and termination option payments, if the Group is reasonably certain to exercise those options. The lease term is the non-cancellable period of the lease adjusted for any renewal or termination options which are reasonably certain to be exercised.
Variable lease payments that do not depend on an index or a rate and rentals relating to low value or short-term leases are recognised as an expense in the period in which they are incurred. Management applies judgement in determining whether it is reasonably certain that a renewal, termination or purchase option will be exercised.
Incremental borrowing rates are calculated using a portfolio approach, based on the risk profile of the entity holding the lease and the term and currency of the lease.
After initial recognition, the lease liability is measured at amortised cost using the effective interest method. It is remeasured when there is a change in future lease payments or when the Group changes its assessment of whether it is reasonably certain to exercise an option within the contract. A corresponding adjustment is made to the carrying amount of the right-of-use asset.
The right-of-use asset is initially measured at cost, which comprises the lease liability adjusted for any payments made at or before the commencement date, initial direct costs incurred, lease incentives received and an estimate of the cost to dismantle or restore the underlying asset or the site on which it is located at the end of the lease term. The right-of-use asset is depreciated over the lease term or, where a purchase option is reasonably certain to be exercised, over the useful economic life of the asset in line with depreciation rates for owned property, plant and equipment. The right-of-use asset is tested periodically for impairment if an impairment indicator is considered to exist.
Non-lease components in a contract such as maintenance and other service charges are separated from lease payments and are expensed as incurred.
Inventories – Note 16
Inventories are stated at the lower of cost and net realisable value. Cost is based on the first-in/first-out principle (and weighted average, where appropriate) and includes all expenditure incurred in acquiring the inventories and bringing them to their present location and condition. Raw materials are valued on the basis of purchase cost on a first-in/first-out basis. In the case of finished goods and work-in-progress, cost includes direct materials, direct labour and attributable overheads based on normal operating capacity and excludes borrowing costs.
Net realisable value is the estimated proceeds of sale less all further costs to completion, and less all costs to be incurred in marketing, selling and distribution. Estimates of net realisable value are based on the most reliable evidence available at the time the estimates are made, taking into consideration fluctuations of price or cost directly relating to events occurring after the end of the period, the likelihood of short-term changes in buyer preferences, product obsolescence or perishability (all of which are generally low given the nature of the Group’s products) and the purpose for which the inventory is held.
Climate change and policy risks and uncertainties as set out on page 142 may also result in additional costs, changes to selling prices or product obsolescence impacting the valuation of inventories in future years. However, due to the short inventory turnover cycle there were no material write-downs of inventories required in this regard during the current financial year.
Materials and other supplies held for use in the production of inventories are not written down below cost if the finished goods, in which they will be incorporated, are expected to be sold at or above cost.
| | | | | |
| 2022 Annual Report and Form 20-F | 188 |
Accounting Policies continued
Trade and other receivables – Note 17
The classification of financial assets depends on the Group’s business model for managing the financial assets and the contractual terms of the cash flows.
The Group’s principal financial assets are its trade and other receivables (including contract assets). Trade and other receivables are recognised when the Group becomes a party to the contract and has a legal right to receive cash. Trade receivables (including contract assets) are carried at original invoice amount, which is equivalent to amortised cost, less an expected credit loss provision.
The Group assesses on a forward looking basis the expected credit losses associated with trade and other receivables at each balance sheet date. The expected credit loss is estimated as the difference between the asset’s carrying amount and the present value of the future cash flows the Group expects to receive. Where the present value of such cash flows is lower than the carrying value, the carrying value of the asset is adjusted, with the impairment gain or loss recognised in the Consolidated Income Statement.
Further detail on the Group's methodology for providing for expected credit losses is provided in note 17.
Cash and cash equivalents – Note 23
Cash and cash equivalents comprise cash balances held for the purpose of meeting short-term cash commitments and investments which are readily convertible to a known amount of cash and are subject to an insignificant risk of change in value. Cash and cash equivalents are classified as financial assets measured at amortised cost or, in the case of certain money market deposits, fair value through profit or loss.
Bank overdrafts are included within current interest-bearing loans and borrowings in the Consolidated Balance Sheet. Where the overdrafts are repayable on demand and form an integral part of cash management, they are netted against cash and cash equivalents for the purposes of the Consolidated Statement of Cash Flows.
Interest-bearing loans and borrowings – Note 24
All loans and borrowings are initially recorded at the fair value of the consideration received net of directly attributable transaction costs. The computation of amortised cost includes any issue costs and any discount or premium materialising on settlement. Subsequent to initial recognition, current and non-current interest-bearing loans and borrowings are, in general, measured at amortised cost employing the effective interest methodology. Fixed rate loans and borrowings, which have been hedged to floating rates (using interest rate swaps), are measured at amortised cost adjusted for changes in value attributable to the hedged risks arising from changes in underlying market interest rates.
Borrowing costs arising on financial instruments are recognised as an expense in the period in which they are incurred (unless capitalised as part of the cost of property, plant and equipment).
Derivative financial instruments and hedging practices –
Note 25
In order to manage interest rate, foreign currency and commodity risks and to realise the desired currency profile of borrowings, the Group employs derivative financial instruments (principally interest rate swaps, currency forwards and currency swaps). Derivative financial instruments are recognised initially at fair value on the date on which a derivative contract is entered into and are subsequently remeasured at fair value. The carrying value of derivatives is fair
value based on discounted future cash flows and adjusted for counterparty risk. Future floating rate cash flows are estimated based on future interest rates (from observable yield curves at the end of the reporting period). Fixed and floating rate cash flows are discounted at future interest rates and translated at period-end foreign exchange rates. Short dated forward foreign exchange contracts are used to hedge the forward foreign exchange risk on currency exposures. The forward price elements to these contracts are excluded from the hedge.
At the inception of a derivative transaction, the Group documents the relationship between the hedged item and the hedging instrument together with its risk management objective and the strategy underlying the proposed transaction. The Group also documents its assessment, both at the inception of the hedging
relationship and subsequently on an ongoing basis, of the effectiveness of the hedging instrument in offsetting movements in the fair values or cash flows of the hedged items. Where derivatives do not fulfil the criteria for hedge accounting, changes in fair values are reported in the Consolidated Income Statement and Consolidated Balance Sheet.
Fair value and cash flow hedges
The Group uses fair value hedges and cash flow hedges in its treasury activities. For the purposes of hedge accounting, hedges are classified either as fair value hedges (which entail hedging the exposure to movements in the fair value of a recognised asset or liability or an unrecognised firm commitment that could affect profit or loss) or cash flow hedges (which hedge exposure to fluctuations in future cash flows derived from a particular risk associated with a recognised asset or liability, or a highly probable forecast transaction that could affect profit or loss).
Where the conditions for hedge accounting are satisfied and the hedging instrument concerned is classified as a fair value hedge, any gain or loss stemming from the remeasurement of the hedging instrument to fair value is reported in the Consolidated Income Statement. In addition, any gain or loss on the hedged item which is attributable to the hedged risk is adjusted against the carrying amount of the hedged item and reflected in the Consolidated Income Statement. Where the adjustment is to the carrying amount of a hedged interest-bearing financial instrument, the adjustment is amortised to the Consolidated Income Statement with the objective of achieving full amortisation by maturity.
Where a derivative financial instrument is designated as a hedge of the variability in cash flows of a recognised asset or liability or a highly probable forecast transaction that could affect profit or loss, the effective part of any gain or loss on the derivative financial instrument is recognised as other comprehensive income, net of the income tax effect, with the ineffective portion being reported in the Consolidated Income Statement. The associated gains or losses that had previously been recognised as other comprehensive income are transferred to the Consolidated Income Statement contemporaneously with the materialisation of the hedged transaction.
Hedge accounting is discontinued when the hedging instrument expires or is sold, terminated or exercised or no longer qualifies for hedge accounting. At that point in time, any cumulative gain or loss on the hedging instrument recognised as other comprehensive income remains there until the forecast transaction occurs. If a hedged transaction is no longer anticipated to occur, the net cumulative gain or loss previously recognised as other comprehensive income is transferred to the Consolidated Income Statement in the period.
Net investment hedges
Where foreign currency swaps provide a hedge against a net investment in a foreign operation, and the hedge is deemed to be effective, foreign exchange differences are taken directly to a foreign currency translation reserve. The ineffective portion of any gain or loss on the hedging instrument is recognised immediately in the Consolidated Income Statement. Cumulative gains and losses remain in equity until disposal of the net investment in the foreign operation at which point the related differences are transferred to the Consolidated Income Statement as part of the overall gain or loss on sale.
Share capital and dividends – Notes 29 and 11
Treasury Shares and own shares
Ordinary Shares acquired by the Parent Company through the share buyback programme (Treasury Shares) or purchased by the Employee Benefit Trust on behalf of the Parent Company under the terms of the Performance Share Plans and the Restricted Share Plan (own shares) are deducted from equity and presented on the face of the Consolidated Balance Sheet. No gain or loss is recognised in profit or loss on the purchase, sale, issue or cancellation of the Parent Company’s Ordinary Shares. A financial liability is recorded if a contractual obligation to repurchase shares exists at the balance sheet date.
Dividends
Dividends on Ordinary Shares are recognised as a liability in the Consolidated Financial Statements in the period in which they are declared by the Parent Company and approved by shareholders in respect of final dividends.
| | | | | |
| 2022 Annual Report and Form 20-F | 189 |
Other Reserves
Other Reserves primarily comprise reserves relating to the Group’s share-based payments expense.
Foreign currency translation
Items included in the financial statements of each of the Group’s entities are measured using the currency of the primary economic environment in which the entity operates (the functional currency). The Consolidated Financial Statements are presented in US Dollar, which is the presentation currency of the Group. The functional currency of the Parent Company is euro.
Transactions in foreign currencies are recorded at the rate of exchange in effect at the date of the transaction. Monetary assets and liabilities denominated in foreign currencies are retranslated at the rate of exchange in effect at the balance sheet date. All currency translation differences are taken to the Consolidated Income Statement with the exception of all monetary items that provide an effective hedge for a net investment in a foreign operation. These are recognised in other comprehensive income until the disposal of the net investment, at which time they are recognised in the Consolidated Income Statement.
Results and cash flows of subsidiaries, joint ventures and associates with non-US Dollar functional currencies have been translated into US Dollar at average exchange rates for the year, and the related balance sheets have been translated at the rates of exchange in effect at the balance sheet date. Adjustments arising on translation of the results and net assets of non-US Dollar subsidiaries, joint ventures, associates and joint operations are recognised in a separate translation reserve within equity, net of differences on related currency borrowings. All other translation differences are taken to the Consolidated Income Statement. Goodwill and fair value adjustments arising on acquisition of a foreign operation are regarded as assets and liabilities of the foreign operation and are translated accordingly.
| | | | | |
| 2022 Annual Report and Form 20-F | 190 |
Accounting Policies continued
The principal exchange rates used for the translation of results, cash flows and balance sheets into US Dollar were as follows:
| | | | | | | | | | | | | | | | | | | | |
| Average | | | Year-end |
US Dollar 1 = | 2022 | 2021 | 2020 | | 2022 | 2021 |
Brazilian Real | 5.1648 | 5.3968 | 5.1568 | | 5.2794 | 5.5716 |
Canadian Dollar | 1.3017 | 1.2538 | 1.3412 | | 1.3535 | 1.2716 |
Chinese Renminbi | 6.7334 | 6.4493 | 6.9010 | | 6.8987 | 6.3513 |
Danish Krone | 7.0805 | 6.2919 | 6.5388 | | 6.9662 | 6.5652 |
| Euro | 0.9518 | 0.8460 | 0.8771 | | 0.9368 | 0.8829 |
Hungarian Forint | 373.1682 | 303.3739 | 307.9331 | | 375.1400 | 325.9300 |
Indian Rupee | 78.6295 | 73.9391 | 74.1177 | | 82.7211 | 74.3009 |
Philippine Peso | 54.5318 | 49.2983 | 49.6071 | | 55.7290 | 50.9800 |
Polish Zloty | 4.4631 | 3.8633 | 3.8971 | | 4.3881 | 4.0579 |
Pound Sterling | 0.8120 | 0.7270 | 0.7798 | | 0.8310 | 0.7417 |
Romanian Leu | 4.6930 | 4.1641 | 4.2432 | | 4.6357 | 4.3692 |
Serbian Dinar | 111.7836 | 99.4732 | 103.1510 | | 109.8553 | 103.7590 |
Swiss Franc | 0.9551 | 0.9145 | 0.9387 | | 0.9230 | 0.9119 |
Ukrainian Hryvnia | 32.6730 | 27.2588 | 26.9857 | | 36.9172 | 27.2850 |
| | | | | |
| 2022 Annual Report and Form 20-F | 191 |
Notes on Consolidated Financial Statements
1. Revenue
CRH is the leading provider of building materials solutions that build, connect and improve our world. As the essential partner for road and critical utility infrastructure, commercial building projects and outdoor living solutions, CRH's unique offering of materials, products and value-added services helps to deliver a more resilient and sustainable built environment.
The Group has three operating segments (as identified under IFRS 8 Operating Segments) generating revenue through the following activities:
Our Americas Materials businesses provide solutions for the construction and RMI of public infrastructure, homes and commercial buildings across North America. Our businesses in the US and Canada utilise an extensive network of reserve backed quarry locations, to provide asphalt paving services and to produce and supply a range of materials including cement, aggregates, readymixed concrete and asphalt. This segment also includes the Group’s cement operations in Brazil, which was divested in April 2021.
Our Building Products segment manufactures, supplies and delivers high quality, value-added innovative products and solutions to shape and enhance the built environment for modern communities. This includes Architectural Products, Infrastructure Products and Construction Accessories. This is a global business operating in attractive construction markets in major economies in North America, Europe and Asia. The divestment of our Building Envelope business, formerly part of the Building Products segment, was completed in April 2022. As a result, it has been classified as discontinued operations in the current year; its performance in this year and comparative years is therefore part of discontinued operations.
Our Europe Materials businesses provides solutions for the construction of public infrastructure, homes and commercial buildings to customers in construction markets across 19 countries in Europe and 2 countries in Asia. An extensive network of quarry and production locations adjacent to attractive local construction markets produce cement, lime, aggregates, asphalt, readymixed concrete and concrete products, as well as providing paving and construction services.
A. Disaggregated revenue
In the following tables, revenue is disaggregated by primary geographic market and by principal activities and products. Due to the diversified nature of the Group, the basis on which management reviews its businesses varies across the Group. Geography is the primary basis for the Americas Materials and Europe Materials businesses; while activities and products are used for the Building Products businesses.
Revenue from external customers (as defined in IFRS 8) attributable to the country of domicile and all foreign countries of operation greater than 10% are included below. Further operating segment disclosures are set out in note 2.
| | | | | | | | | | | | | | | | | | | | | | | | | | | | | | | | | | | | | | | | | | | | |
| Year ended 31 December |
| Americas Materials | Building Products | Europe Materials |
Total | | Americas Materials | Building Products | Europe Materials |
Total | | Americas Materials | Building Products | Europe Materials |
Total |
| 2022 | 2022 | 2022 | 2022 | | 2021 | 2021 | 2021 | 2021 | | 2020 | 2020 | 2020 | 2020 |
Primary geographic markets | $m | $m | $m | $m | | $m | $m | $m | $m | | $m | $m | $m | $m |
| | | | | | | | | | | | | | |
| Continuing operations | | | | | | | | | | | | | | |
Republic of Ireland (country of domicile) | - | - | 801 | 801 | | - | - | 706 | 706 | | - | - | 632 | 632 |
United Kingdom | - | 238 | 4,003 | 4,241 | | - | 220 | 3,979 | 4,199 | | - | 161 | 3,157 | 3,318 |
Rest of Europe (i) | - | 1,074 | 5,219 | 6,293 | | - | 1,073 | 5,243 | 6,316 | | - | 982 | 4,841 | 5,823 |
United States | 13,050 | 6,038 | - | 19,088 | | 11,172 | 4,446 | - | 15,618 | | 9,984 | 3,946 | - | 13,930 |
Rest of World (ii) | 1,274 | 473 | 553 | 2,300 | | 1,235 | 479 | 653 | 2,367 | | 1,289 | 385 | 511 | 2,185 |
Total Group from continuing operations | 14,324 | 7,823 | 10,576 | 32,723 | | 12,407 | 6,218 | 10,581 | 29,206 | | 11,273 | 5,474 | 9,141 | 25,888 |
| Discontinued operations | | | | | | | | | | | | | | |
| United Kingdom - Building Envelope | - | 7 | - | 7 | | - | 24 | - | 24 | | - | 19 | - | 19 |
| Rest of Europe (i) - Building Envelope | - | 4 | - | 4 | | - | 12 | - | 12 | | - | 10 | - | 10 |
| United States - Building Envelope | - | 576 | - | 576 | | - | 1,575 | - | 1,575 | | - | 1,533 | - | 1,533 |
| Rest of World (ii) - Building Envelope | - | 58 | - | 58 | | - | 164 | - | 164 | | - | 137 | - | 137 |
Total Group from discontinued operations | - | 645 | - | 645 | | - | 1,775 | - | 1,775 | | - | 1,699 | - | 1,699 |
(i)The Rest of Europe principally includes Austria, Belgium, Czech Republic, Denmark, Estonia, Finland, France, Germany, Hungary, Luxembourg, the Netherlands, Poland, Romania, Serbia, Slovakia, Spain, Sweden, Switzerland and Ukraine.
(ii)The Rest of World principally includes Australia, Brazil, Canada and the Philippines.
| | | | | |
| 2022 Annual Report and Form 20-F | 192 |
1. Revenue continued
Year ended 31 December
| | | | | | | | | | | | | | | | | | | | | | | | | | | | | | | | | | | | | | | | | | | | |
| Americas Materials (iii) | Building Products | Europe Materials (iii) |
Total | | Americas Materials (iii) | Building Products | Europe Materials (iii) |
Total | | Americas Materials (iii) | Building Products | Europe Materials (iii) |
Total |
| 2022 | 2022 | 2022 | 2022 | | 2021 | 2021 | 2021 | 2021 | | 2020 | 2020 | 2020 | 2020 |
Principal activities and products | $m | $m | $m | $m | | $m | $m | $m | $m | | $m | $m | $m | $m |
| | | | | | | | | | | | | | |
Continuing operations | | | | | | | | | | | | | | |
Cement, lime and cement products | 1,554 | - | 3,481 | 5,035 | | 1,483 | - | 3,463 | 4,946 | | 1,403 | - | 2,974 | 4,377 |
Aggregates, asphalt and readymixed products | 6,979 | - | 3,515 | 10,494 | | 6,262 | - | 3,606 | 9,868 | | 5,604 | - | 3,100 | 8,704 |
Construction contract activities* | 5,791 | 88 | 2,101 | 7,980 | | 4,662 | 92 | 2,065 | 6,819 | | 4,266 | 131 | 1,732 | 6,129 |
Architectural products | - | 4,409 | 1,308 | 5,717 | | - | 3,790 | 1,264 | 5,054 | | - | 3,439 | 1,166 | 4,605 |
Infrastructure products | - | 2,531 | 171 | 2,702 | | - | 1,605 | 183 | 1,788 | | - | 1,278 | 169 | 1,447 |
Construction accessories | - | 795 | - | 795 | | - | 731 | - | 731 | | - | 626 | - | 626 |
| | | | | | | | | | | | | | |
| Total Group from continuing operations | 14,324 | 7,823 | 10,576 | 32,723 | | 12,407 | 6,218 | 10,581 | 29,206 | | 11,273 | 5,474 | 9,141 | 25,888 |
| Discontinued operations | | | | | | | | | | | | | | |
Construction contract activities* - Building Envelope | - | 16 | - | 16 | | - | 83 | - | 83 | | - | 37 | - | 37 |
Architectural glass and glazing systems and related hardware - Building Envelope | - | 629 | - | 629 | | - | 1,692 | - | 1,692 | | - | 1,662 | - | 1,662 |
Total Group from discontinued operations | - | 645 | - | 645 | | - | 1,775 | - | 1,775 | | - | 1,699 | - | 1,699 |
(iii) Americas Materials and Europe Materials both operate vertically integrated businesses, which are founded in resource-backed cement and aggregates assets and which support the manufacture and supply of aggregates, asphalt, cement, readymixed and precast concrete and landscaping products. Accordingly, for the purpose of disaggregation of revenue we have included certain products together, as this is how management reviews and evaluates this business line.
There are no material dependencies or concentrations of individual customers which would warrant disclosure under IFRS 8. The individual entities within the Group have a large number of customers spread across various activities, end-uses and geographies.
Revenue derived through the supply of services and intersegment revenue are not material to the Group. The transfer pricing policy implemented by the Group between operating segments and across its constituent entities is described in note 32. In addition, due to the nature of building materials, which have a low value-to-weight ratio, the Group’s revenue streams include a low level of cross-border transactions.
B. Contract balances
For information on the Group’s construction contract balances, including movements during the year, refer to notes 16, 17 and 18. Movements in our net contract balances are not considered significant and are primarily driven by the timing of billing work-in-progress within our construction contract businesses.
C. Unsatisfied long-term construction contracts and other performance obligations
Revenue yet to be recognised from long-term construction contracts, primarily within our Americas Materials and Europe Materials businesses, amounted to $3,742 million at 31 December 2022 (2021: $3,177 million; 2020: $2,604 million). The Group has applied the practical expedient set out in IFRS 15 Revenue from Contracts with Customers whereby revenue yet to be recognised on contracts that had an original expected duration of less than one year is not disclosed. The majority of open contracts at 31 December 2022 will close and revenue will be recognised within 12 months of the balance sheet date.
* Revenue principally recognised over time. Construction contracts are generally completed within the same financial reporting year.
| | | | | |
| 2022 Annual Report and Form 20-F | 193 |
2. Segment Information
As outlined in note 1, the Group has three operating segments. The segments reflect the Group’s organisational structure in 2022 and the nature of the financial information reported to and assessed by the Group Chief Executive, Chief Financial Officer and Chief Operating Officer, who are together determined to fulfil the role of Chief Operating Decision Maker (as defined in IFRS 8).
Effective 1 January 2022, following the appointment of the Chief Operating Officer and a resultant change in the reporting line of the “segment managers” as outlined in IFRS 8, the Group has determined that the Group Chief Executive, Chief Financial Officer and Chief Operating Officer (formerly the Group Chief Executive and Chief Financial Officer) together fulfil the role of Chief Operating Decision Maker (as defined in IFRS 8). This did not result in any change to the Group’s operating segments. No operating segments have been aggregated to form these reportable segments.
Effective 1 January 2023 the Group restructured into two Divisions, CRH Americas and CRH Europe. During the first quarter of 2023, the Group's reportable segments increased from three to the following four segments: Americas Materials Solutions, Americas Building Solutions, Europe Materials Solutions and Europe Building Solutions. This realignment reflects the way resources are allocated and performance is assessed by the Chief Operating Decision Maker.
In the Group's financial reporting for 2023 comparative information for 2021 and 2022 will be restated to reflect the changes in reportable segments. Segmental information presented in these financial statements is based on the segment structure as at 31 December 2022 being Americas Materials, Building Products and Europe Materials.
The change in segment reporting post year end does not have a financial impact on the Group's Consolidated Financial Statements.
The principal factors employed in the identification of the three segments reflected in this note include:
•the Group’s organisational structure in 2022 (during 2022 each divisional President fulfilled the role of “segment manager” as outlined in IFRS 8);
•the nature of the reporting lines to the Chief Operating Decision Maker (as defined in IFRS 8);
•the structure of internal reporting documentation such as management accounts and budgets; and
•the degree of homogeneity of products and services within each of the segments from which revenue is derived
The Chief Operating Decision Maker monitors the operating results of segments separately in order to allocate resources between segments and to assess performance. Segment performance is evaluated using EBITDA (as defined)*. Given that net finance costs and income tax are managed on a centralised basis, these items are not allocated between operating segments for the purposes of the information presented to the Chief Operating Decision Maker and are accordingly omitted from the detailed segmental analysis below. There are no asymmetrical allocations to reporting segments which would require disclosure.
A. Operating segments disclosures—Consolidated Income Statement data
| | | | | | | | | | | | | | | | | | | | | | | |
| Year ended 31 December |
| Revenue | | EBITDA (as defined)* |
| 2022 | 2021 | 2020 | | 2022 | 2021 | 2020 |
$m | $m | $m | | $m | $m | $m |
Continuing operations | | | | | | | |
| Americas Materials | 14,324 | 12,407 | 11,273 | | 2,748 | 2,588 | 2,405 |
Building Products | 7,823 | 6,218 | 5,474 | | 1,510 | 992 | 833 |
Europe Materials | 10,576 | 10,581 | 9,141 | | 1,357 | 1,410 | 1,055 |
Total Group from continuing operations | 32,723 | 29,206 | 25,888 | | 5,615 | 4,990 | 4,293 |
| Discontinued operations | | | | | | | |
Building Products - Building Envelope | 645 | 1,775 | 1,699 | | 131 | 360 | 337 |
Total Group from discontinued operations | 645 | 1,775 | 1,699 | | 131 | 360 | 337 |
Continuing operations | | | | | | | |
EBITDA (as defined)* | | | | | 5,615 | 4,990 | 4,293 |
Depreciation, amortisation and impairment (i) | | | | | (1,721) | (1,659) | (2,267) |
Group operating profit | | | | | 3,894 | 3,331 | 2,026 |
(Loss)/profit on disposals (ii) | | | | | (49) | 116 | 17 |
Finance costs less income | | | | | (336) | (357) | (438) |
Other financial expense | | | | | (40) | (42) | (33) |
Share of equity accounted investments’ profit/(loss) (iii) | | | | | - | 55 | (118) |
Profit before tax from continuing operations | | | | | 3,469 | 3,103 | 1,454 |
| | | | | | | | | | | | | | | | | | | | | | | | | | | | | | | | | | | |
| (i) Depreciation,
amortisation and
impairment | | (ii) (Loss)/profit on
disposals
(note 6) | | (iii) Share of equity
accounted investments’
profit/(loss) |
Continuing operations | 2022 | 2021 | 2020 | | 2022 | 2021 | 2020 | | 2022 | 2021 | 2020 |
$m | $m | $m | | $m | $m | $m | | $m | $m | $m |
Americas Materials | (839) | (800) | (774) | | 38 | 126 | 8 | | 10 | 17 | 34 |
Building Products | (349) | (263) | (248) | | 3 | (27) | 21 | | 15 | 17 | (4) |
Europe Materials | (533) | (596) | (1,245) | | (90) | 17 | (12) | | (25) | 21 | (148) |
Total | (1,721) | (1,659) | (2,267) | | (49) | 116 | 17 | | - | 55 | (118) |
* EBITDA is defined as earnings from continuing operations before interest, taxes, depreciation, amortisation, asset impairment charges, profit on disposals and the Group's share of equity accounted investments' profit after tax.
| | | | | |
| 2022 Annual Report and Form 20-F | 194 |
2. Segment Information continued
B. Operating segments disclosures - Consolidated Balance Sheet data
| | | | | | | | | | | | | | | | | |
| As at 31 December |
| | | | | |
| Total assets | | Total liabilities |
| 2022 | 2021 | | 2022 | 2021 |
$m | $m | | $m | $m |
| Americas Materials | 17,609 | 17,064 | | 3,227 | 3,292 |
Building Products | 9,165 | 8,504 | | 2,045 | 2,579 |
Europe Materials | 11,622 | 12,367 | | 4,245 | 4,100 |
Total Group | 38,396 | 37,935 | | 9,517 | 9,971 |
| Reconciliation to total assets as reported in the Consolidated Balance Sheet: | | | | | |
| Investments accounted for using the equity method | 649 | 653 | | | |
| Other financial assets | 14 | 12 | | | |
| Derivative financial instruments (current and non-current) | 42 | 136 | | | |
| Income tax assets (current and deferred) | 151 | 151 | | | |
| Cash and cash equivalents | 5,936 | 5,783 | | | |
| Total assets as reported in the Consolidated Balance Sheet | 45,188 | 44,670 | | | |
| | | | | |
| Reconciliation to total liabilities as reported in the Consolidated Balance Sheet: | | | | | |
| Interest-bearing loans and borrowings (current and non-current) | | | | 9,636 | 10,487 |
| Derivative financial instruments (current and non-current) | | | | 128 | 14 |
| Income tax liabilities (current and deferred) | | | | 3,570 | 3,284 |
| Total liabilities as reported in the Consolidated Balance Sheet | | | | 22,851 | 23,756 |
C. Operating segments disclosures - other items
Additions to non-current assets
| | | | | | | | | | | | | | | | | | | | | | | | | | | | | | | | | | | |
| Year ended 31 December |
| Property, plant and
equipment (i) (note 13, 20) | | Financial assets
(note 15) | | Total Group |
| 2022 | 2021 | 2020 | | 2022 | 2021 | 2020 | | 2022 | 2021 | 2020 |
| $m | $m | $m | | $m | $m | $m | | $m | $m | $m |
Continuing operations | | | | | | | | | | | |
| | | | | | | | | | | |
| Americas Materials | 752 | 750 | 527 | | 43 | 4 | 1 | | 795 | 754 | 528 |
Building Products | 377 | 355 | 215 | | - | - | - | | 377 | 355 | 215 |
Europe Materials | 529 | 607 | 384 | | 2 | - | - | | 531 | 607 | 384 |
Total Group from continuing operations | 1,658 | 1,712 | 1,126 | | 45 | 4 | 1 | | 1,703 | 1,716 | 1,127 |
Discontinued operations | | | | | | | | | | | |
Building Products - Building Envelope | 29 | 62 | 50 | | - | - | - | | 29 | 62 | 50 |
Total Group | 1,687 | 1,774 | 1,176 | | 45 | 4 | 1 | | 1,732 | 1,778 | 1,177 |
(i)Additions to property, plant and equipment include $10 million (2021: $10 million; 2020: $14 million) relating to leased mineral reserves which fall outside the scope of IFRS 16.
| | | | | |
| 2022 Annual Report and Form 20-F | 195 |
D. Information about geographical areas
The non-current assets (as defined in IFRS 8) attributable to the country of domicile and all foreign countries of operation, for which revenue exceeds 10% of total external Group revenue, are set out below.
| | | | | | | | |
| As at 31 December |
| | |
| Non-current assets* |
| 2022 | 2021 |
| $m | $m |
| | |
| Republic of Ireland (country of domicile) | 530 | 544 |
| United Kingdom | 2,268 | 2,595 |
| United States | 18,399 | 17,304 |
| Other | 8,660 | 9,560 |
Total Group | 29,857 | 30,003 |
3. Assets Held for Sale and Discontinued Operations
A. Profit on disposal of discontinued operations
In April 2022, the Group completed the divestment of its Building Envelope business, formerly part of our Building Products segment. With the exception of our Building Envelope business, no other businesses divested during 2022 are considered to be either separate major lines of business or geographical areas of operation and therefore do not constitute discontinued operations as defined in IFRS 5 Non-Current Assets Held for Sale and Discontinued Operations.
No businesses met the IFRS 5 held for sale criteria at 31 December 2022.
The table below sets out the proceeds and related profit recognised on divestment which were included in profit after tax for the financial year from discontinued operations.
| | | | | |
| 2022 |
| $m |
| Assets/(liabilities) disposed of at net carrying amount: | |
| - non-current assets* | 2,016 |
| - cash and cash equivalents | 27 |
| - inventories, receivables, payables and provisions | 406 |
| - lease liabilities | (338) |
| - interest-bearing loans and borrowings | (6) |
| - deferred tax | (42) |
| - retirement benefit obligations | (14) |
| Net assets disposed | 2,049 |
| Reclassification of currency translation effects on disposal | 5 |
| Total | 2,054 |
| Proceeds from disposal (net of disposal costs) | 3,525 |
| Profit on disposal from discontinued operations | 1,471 |
| Net cash inflow arising on disposal | |
| Proceeds from disposal from discontinued operations | 3,525 |
| Less: cash and cash equivalents disposed | (27) |
| Total | 3,498 |
* Non-current assets comprise property, plant and equipment, intangible assets and investments accounted for using the equity method.
| | | | | |
| 2022 Annual Report and Form 20-F | 196 |
3. Assets Held for Sale and Discontinued Operations continued
B. Results of discontinued operations
The results of the discontinued operations included in the Group profit for the financial year are set out as follows:
| | | | | | | | | | | |
| 2022 | 2021 | 2020 |
| $m | $m | $m |
| Revenue | 645 | 1,775 | 1,699 |
| Cost of sales (i) | (412) | (1,143) | (1,102) |
| Gross profit | 233 | 632 | 597 |
| Operating costs (i) | (138) | (378) | (360) |
| Operating profit | 95 | 254 | 237 |
| Profit/(loss) on disposals | 1,471 | 3 | (8) |
| Profit before finance costs | 1,566 | 257 | 229 |
| Finance costs | (6) | (18) | (19) |
| Profit before tax | 1,560 | 239 | 210 |
| Attributable income tax expense (ii) | (370) | (60) | (54) |
| Profit after tax for the financial year from discontinued operations | 1,190 | 179 | 156 |
| | | |
| Profit attributable to: | | | |
| Equity holders of the Company | 1,190 | 179 | 156 |
| Profit for the financial year from discontinued operations | 1,190 | 179 | 156 |
| | | |
| Basic earnings per Ordinary Share from discontinued operations | $1.57 | $0.23 | $0.20 |
| Diluted earnings per Ordinary Share from discontinued operations | $1.55 | $0.23 | $0.20 |
| | | |
| Cash flows from discontinued operations | | | |
| Net cash (outflow)/inflow from operating activities (iii) | (435) | 234 | 326 |
| Net cash inflow/(outflow) from investing activities (iv) | 3,446 | (102) | (60) |
| Net cash outflow from financing activities | (6) | (28) | (22) |
(i) The depreciation and amortisation charge for discontinued operations amounted to $26 million and $10 million respectively (2021: $78 million and $28 million; 2020: $74 million and $26 million).
(ii) 2022 attributable income tax expense includes $347 million relating to the profit on disposal of discontinued operations.
(iii) Includes the corporation tax paid on the sale of discontinued operations.
(iv) Includes the proceeds from the disposal of discontinued operations.
4. Cost Analysis
Continuing operations
| | | | | | | | | | | |
| 2022 | 2021 | 2020 |
$m | $m | $m |
| Cost of sales analysis | | | |
| Raw materials and goods for resale | 7,446 | 6,304 | 5,137 |
| Employment costs (note 7) | 3,978 | 3,770 | 3,565 |
| Energy conversion costs | 2,106 | 1,513 | 1,241 |
| Repairs and maintenance | 1,230 | 1,158 | 1,080 |
| Depreciation, amortisation and impairment (i) | 1,389 | 1,379 | 1,577 |
| Change in inventory | (655) | (392) | 33 |
| Other production expenses (primarily sub-contractor costs) | 6,350 | 5,618 | 4,690 |
| Total | 21,844 | 19,350 | 17,323 |
| | | |
| Operating costs analysis | | | |
| Selling and distribution costs | 5,003 | 4,613 | 4,235 |
| Administrative expenses | 1,982 | 1,912 | 2,304 |
Total | 6,985 | 6,525 | 6,539 |
| | | | | |
| 2022 Annual Report and Form 20-F | 197 |
(i) Depreciation, amortisation and impairment analysis
| | | | | | | | | | | | | | | | | | | | | | | | | | | | | | | | | | | |
| Cost of sales | | Operating costs | | Total |
| 2022 | 2021 | 2020 | | 2022 | 2021 | 2020 | | 2022 | 2021 | 2020 |
| $m | $m | $m | | $m | $m | $m | | $m | $m | $m |
Depreciation and depletion (note 13, 20) | 1,389 | 1,379 | 1,323 | | 229 | 234 | 227 | | 1,618 | 1,613 | 1,550 |
Amortisation of intangible assets (note 14) | - | - | - | | 103 | 46 | 44 | | 103 | 46 | 44 |
Impairment of property, plant and equipment (note 13, 20) (ii) | - | - | 254 | | - | - | 9 | | - | - | 263 |
Impairment of intangible assets (note 14) (ii) | - | - | - | | - | - | 410 | | - | - | 410 |
| Total | 1,389 | 1,379 | 1,577 | | 332 | 280 | 690 | | 1,721 | 1,659 | 2,267 |
(ii) Total impairment charges for the year ended 31 December 2022 amounted to $nil million (2021: $nil million, 2020: $827 million, including a charge of
$154 million related to equity accounted investments).
5. Auditor’s Remuneration
Continuing operations
In accordance with statutory requirements in Ireland, fees for professional services provided by the Group’s independent auditor in respect of each of the following categories were:
| | | | | | | | | | | | | | | | | | | | | | | | | | | | | | | | | | | |
| Deloitte Ireland | | Deloitte | | |
| (statutory auditor) | | (network firms) | | Total |
| 2022 | 2021 | 2020 | | 2022 | 2021 | 2020 | | 2022 | 2021 | 2020 |
| $m | $m | $m | | $m | $m | $m | | $m | $m | $m |
| Audit fees (i) (ii) | 7 | 7 | 6 | | 15 | 13 | 11 | | 22 | 20 | 17 |
| Other audit-related assurance fees (ii) | 1 | - | - | | - | - | - | | 1 | - | - |
| Tax advisory services (ii) | - | - | - | | - | - | - | | - | - | - |
| Total | 8 | 7 | 6 | | 15 | 13 | 11 | | 23 | 20 | 17 |
(i) Audit of the Group accounts includes the audit of internal control over financial reporting and parent and subsidiary statutory audit fees, but excludes $2 million (2021: $3 million; 2020: $3 million) paid to auditors other than Deloitte.
(ii) In accordance with the Companies Act 2014, audit fees including discontinued operations, amounted to $22 million (2021: $21 million; 2020: $18 million). Other audit-related assurance fees, including discontinued operations, amounted to $1 million (2021: $1 million; 2020: $nil million) and tax advisory services, including discontinued operations, amounted to $nil million (2021: $nil million; 2020: $nil million).
There were no other fees for services provided by the Group’s independent auditor (2021: $nil million; 2020: $nil million).
| | | | | |
| 2022 Annual Report and Form 20-F | 198 |
6. Business and Non-Current Asset Disposals
| | | | | | | | | | | | | | | | | | | | | | | | | | | | | | | | | | | |
| Business disposals | | Disposal of other non-current assets | | Total |
| 2022 | 2021 | 2020 | | 2022 | 2021 | 2020 | | 2022 | 2021 | 2020 |
$m | $m | $m | | $m | $m | $m | | $m | $m | $m |
Continuing operations | | | | | | | | | | | |
Assets/(liabilities) disposed of at net carrying amount: | | | | | | | | | | | |
- non-current assets | 344 | 135 | 69 | | 91 | 97 | 124 | | 435 | 232 | 193 |
- cash and cash equivalents | 4 | 31 | 7 | | - | - | - | | 4 | 31 | 7 |
| - inventories, receivables, payables and provisions | 10 | 25 | 29 | | - | - | - | | 10 | 25 | 29 |
- lease liabilities | (4) | (3) | (12) | | (26) | (17) | (32) | | (30) | (20) | (44) |
- deferred tax | (22) | 1 | (3) | | - | - | - | | (22) | 1 | (3) |
- retirement benefit obligations | (11) | (1) | (1) | | - | - | - | | (11) | (1) | (1) |
- non-controlling interests | - | - | (6) | | - | - | - | | - | - | (6) |
Net assets disposed | 321 | 188 | 83 | | 65 | 80 | 92 | | 386 | 268 | 175 |
Reclassification of currency translation effects on disposal | (4) | 29 | 13 | | - | - | - | | (4) | 29 | 13 |
| Total | 317 | 217 | 96 | | 65 | 80 | 92 | | 382 | 297 | 188 |
Proceeds from disposals (net of disposal costs) | 218 | 295 | 77 | | 115 | 118 | 128 | | 333 | 413 | 205 |
(Loss)/profit on disposals from continuing operations | (99) | 78 | (19) | | 50 | 38 | 36 | | (49) | 116 | 17 |
| Discontinued operations | | | | | | | | | | | |
Profit/(loss) on disposals from discontinued operations (note 3) | 1,471 | - | (5) | | - | 3 | (3) | | 1,471 | 3 | (8) |
Net cash inflow arising on disposal | | | | | | | | | | | |
Continuing operations | | | | | | | | | | | |
Proceeds from disposals from continuing operations | 218 | 295 | 77 | | 115 | 118 | 128 | | 333 | 413 | 205 |
Less: cash and cash equivalents disposed | (4) | (31) | (7) | | - | - | - | | (4) | (31) | (7) |
Less: deferred proceeds arising on disposal (note 19) | - | (1) | (14) | | - | - | - | | - | (1) | (14) |
Net cash inflow arising on disposal from continuing operations | 214 | 263 | 56 | | 115 | 118 | 128 | | 329 | 381 | 184 |
| Discontinued operations | | | | | | | | | | | |
Net cash inflow arising on disposal from discontinued operations | 3,498 | - | - | | - | 6 | - | | 3,498 | 6 | - |
Total Group net cash inflow arising on disposal | 3,712 | 263 | 56 | | 115 | 124 | 128 | | 3,827 | 387 | 184 |
| | | | | |
| 2022 Annual Report and Form 20-F | 199 |
7. Employment
Continuing operations
The average number of employees is as follows:
| | | | | | | | | | | |
| Year ended 31 December |
| 2022 | 2021 | 2020 |
Americas Materials | 29,092 | 28,272 | 27,412 |
Building Products | 20,527 | 17,069 | 16,389 |
Europe Materials | 26,219 | 25,636 | 26,785 |
Total | 75,838 | 70,977 | 70,586 |
In accordance with the Companies Act 2014, the average number of employees, including discontinued operations, was 77,520 (2021: 77,446; 2020: 77,099).
Employment costs charged in the Consolidated Income Statement for continuing operations are analysed as follows:
| | | | | | | | | | | |
| 2022 | 2021 | 2020 |
| $m | $m | $m |
Wages and salaries | 4,669 | 4,457 | 4,177 |
Social welfare costs | 480 | 464 | 432 |
Redundancy, healthcare and other employment benefit costs | 603 | 600 | 662 |
Share-based payment expense (note 8) | 100 | 108 | 93 |
Total retirement benefits expense (note 28) | 372 | 368 | 348 |
Total (i) | 6,224 | 5,997 | 5,712 |
| | | |
Total charge analysed between: | | | |
Cost of sales | 3,978 | 3,770 | 3,565 |
Operating costs | 2,240 | 2,217 | 2,136 |
Finance costs (net) - applicable to retirement benefit obligations (note 9) | 6 | 10 | 11 |
| Total | 6,224 | 5,997 | 5,712 |
(i)In accordance with the Companies Act 2014, employment costs including discontinued operations, are analysed as follows:
| | | | | | | | | | | |
Wages and salaries | 4,821 | 4,873 | 4,573 |
Social welfare costs | 491 | 495 | 461 |
Redundancy, healthcare and other employment benefit costs | 622 | 656 | 723 |
Share-based payment expense (note 8) | 101 | 110 | 96 |
Total retirement benefits expense (note 28) | 378 | 381 | 359 |
| Total | 6,413 | 6,515 | 6,212 |
| | | | | |
| 2022 Annual Report and Form 20-F | 200 |
8. Share-based Payment Expense
Continuing operations
| | | | | | | | | | | |
| 2022 | 2021 | 2020 |
| $m | $m | $m |
Performance Share Plans expense | 97 | | 106 | | 90 | |
Share option expense | 3 | | 2 | | 3 | |
Total share-based payment expense (i) | 100 | | 108 | | 93 | |
(i)The total share-based payment expense excludes $1 million (2021: $2 million; 2020: $3 million) relating to discontinued operations.
Share-based payment expense relates primarily to awards granted under the 2014 Performance Share Plan and the Group’s Savings-related Share Option Schemes. The expense is reflected in operating costs in the Consolidated Income Statement.
2014 Performance Share Plan
Details of the awards made under the 2014 Performance Share Plan are summarised below. An expense of $97 million was recognised in 2022 (2021: $106 million; 2020: $90 million).
Details of awards granted under the 2014 Performance Share Plan
| | | | | | | | | | | | | | |
| | | Number of shares |
| Share price at date of award | Period to earliest release date | Initial award (i) | Net outstanding at 31 December 2022 |
| Granted in 2022 | €38.37 | 3 years | 3,678,505 | 3,616,475 |
| Granted in 2021 | €39.79 | 3 years | 3,261,885 | 2,988,795 |
| Granted in 2020 | €31.50 | 3 years | 3,428,021 | 3,102,591 |
(i)Numbers represent the initial awards including those granted to employees of Building Envelope in 2021 and 2020. The Remuneration Committee has determined that dividend equivalents will accrue on awards under the 2014 Performance Share Plan. Subject to satisfaction of the applicable performance criteria, such dividend equivalents will be released to participants in the form of additional shares on vesting.
20% of each award made is subject to TSR performance measured against a tailored peer group; 20% is subject to a RONA metric; 15% is subject to a new sustainability and diversity scorecard metric introduced in 2022; with the remaining 45% subject to a cumulative cashflow metric (2021 and 2020: 25% of each award made is subject to TSR performance measured against a tailored peer group; 25% is subject to a RONA metric; with the remaining 50% subject to a cumulative cashflow metric). Performance for the awards will be assessed over a three-year period.
The fair values assigned to the portion of awards which are subject to TSR performance against peers was €19.04 (2021: €22.23; 2020: €18.52).
The fair value of these awards was calculated using a TSR pricing model taking account of peer group TSR, volatilities and correlations together with the following assumptions:
| | | | | | | | | | | |
| 2022 | 2021 | 2020 |
Risk-free interest rate (%) | 0.51 | (0.56) | (0.61) |
Expected volatility (%) | 36.9 | 35.1 | 22.1 |
The expected volatility was determined using a historical sample of daily CRH share prices.
The fair value of (i) the portion of awards subject to cash flow performance; (ii) the portion of awards subject to a RONA metric; (iii) and from 2022 the portion of awards subject to a sustainability and diversity scorecard metric; and (iv) the awards with no performance conditions (which are subject to a two year service period) was calculated as the closing CRH share price at the date the award was granted.
| | | | | |
| 2022 Annual Report and Form 20-F | 201 |
Share Option Schemes
The 2010 Share Option Scheme was replaced in 2014 by the 2014 Performance Share Plan, and accordingly no options have been granted since 2013.
Details of movement and options outstanding under Share Option Schemes (excluding Savings-related Share Option Schemes)
| | | | | | | | | | | | | | | | | | | | | | | | | | |
| Weighted average exercise | Number of options | | Weighted average exercise | Number of options | | Weighted average exercise | Number of options |
price | 2022 | | price | 2021 | | price | 2020 |
Outstanding at beginning of year | €16.19 | 145,731 | | €16.19 | 197,253 | | €16.19 | 278,349 |
Exercised (i) | €16.19 | (47,058) | | €16.19 | (51,522) | | €16.19 | (77,748) |
| Lapsed | €16.19 | (1,116) | | - | - | | €16.19 | (3,348) |
Outstanding at end of year (ii) | €16.19 | 97,557 | | €16.19 | 145,731 | | €16.19 | 197,253 |
Exercisable at end of year | €16.19 | 97,557 | | €16.19 | 145,731 | | €16.19 | 197,253 |
(i)The weighted average share price at the date of exercise of these options was €35.03 (2021: €42.10; 2020: €31.70).
(ii)All options granted have a life of ten years. All outstanding options are denominated in euro and have an exercise price of €16.19 (2021: €16.19; 2020: €16.19).
| | | | | | | | | | | | | | |
| | 2022 | 2021 | 2020 |
| Weighted average remaining contractual life for the share options outstanding at 31 December (years) | | 0.30 | 1.30 | 2.30 |
2010 and 2021 Savings-related Share Option Schemes
In April 2021, shareholders approved the adoption of the 2021 savings-related share option schemes, which replaced the schemes approved by shareholders in May 2010. Under both schemes, participants may save up to €500/Stg£500 per month from their net salaries for a fixed term of three or five years and at the end of the savings period they have the option to buy CRH shares at a discount of up to 15% of the market price on the date of invitation of each savings contract.
Details of options granted under the Savings-related Share Option Schemes
| | | | | | | | | | | | | | | | | | | | | | | | | | |
| Weighted average exercise | Number of options | | Weighted average exercise | Number of options | | Weighted average exercise | Number of options |
price | 2022 | | price | 2021 | | price | 2020 |
Outstanding at beginning of year | €24.28/Stg£25.42 | 1,085,163 | | €23.83/Stg£19.69 | 1,173,507 | | €23.67/Stg£20.17 | 1,508,862 |
Exercised (i) | €24.58/Stg£20.44 | (402,645) | | €22.77/Stg£18.69 | (470,001) | | €23.21/Stg£22.37 | (178,773) |
| Lapsed | €23.60/Stg£29.38 | (209,916) | | €24.75/Stg£21.49 | (73,411) | | €23.25/Stg£21.54 | (156,582) |
Granted (ii) | Stg£25.55 | 571,528 | | Stg£31.04 | 455,068 | | - | - |
Outstanding at end of year | €24.20/Stg£26.52 | 1,044,130 | | €24.28/Stg£25.42 | 1,085,163 | | €23.83/Stg£19.69 | 1,173,507 |
Exercisable at end of year | €25.75/Stg£20.28 | 18,941 | | €23.27/Stg£20.56 | 14,197 | | €24.66/Stg£24.51 | 16,528 |
(i)The weighted average share price at the date of exercise of these options was €34.99 (2021: €42.53; 2020: €31.70).
(ii)Pursuant to the 2010 and 2021 Savings-related Share Option Schemes operated by the Group, employees were granted options over 571,528 of CRH plc’s Ordinary Shares in October 2022 (2021: 455,068 share options in October 2021; 2020: nil). This figure comprises options over 476,454 (2021: 346,237; 2020: nil) shares and 95,074 (2021: 108,831; 2020: nil) shares which are normally exercisable within a period of six months after the third or the fifth anniversary of the contract, whichever is applicable. The exercise price at which the options are granted under the scheme represents a discount of 15% to the market price on the date of invitation of each savings contract.
| | | | | |
| 2022 Annual Report and Form 20-F | 202 |
8. Share-based Payment Expense continued
Continuing operations
| | | | | | | | | | | |
| 2022 | 2021 | 2020 |
Weighted average remaining contractual life for the share options outstanding at 31 December (years) | 2.45 | 1.81 | 1.14 |
euro-denominated options outstanding at end of year (number) | 79,910 | 132,769 | 214,826 |
Range of exercise prices (€) | 23.39-27.86 | 20.83-27.86 | 20.83-27.86 |
Pound Sterling-denominated options outstanding at end of year (number) | 964,220 | 952,394 | 958,681 |
Range of exercise prices (Stg£) | 20.11-31.04 | 16.16-31.04 | 16.16-24.51 |
The weighted fair values assigned to options issued under the Savings-related Share Option Schemes, which were computed in accordance with the trinomial valuation methodology, were as follows:
| | | | | | | | |
| 3-year | 5-year |
| Granted in 2022 (October) | €8.08 | €8.47 |
| Granted in 2021 (October) | €6.78 | €7.05 |
The fair value of these options were determined using the following assumptions:
| | | | | | | | | | | | | | | | | |
| 2022 | | 2021 |
| 3-year | 5-year | | 3-year | 5-year |
| October | | October |
Weighted average exercise price (€) | 29.28 | 29.28 | | 36.83 | 36.83 |
Risk free interest rate (%) | 2.08 | 2.24 | | (0.61) | (0.43) |
Expected dividend payments over the expected life (€) | 4.06 | 7.05 | | 3.25 | 5.65 |
Expected volatility (%) | 26.4 | 24.2 | | 23.5 | 21.2 |
Expected life in years | 3 | 5 | | 3 | 5 |
The expected volatility was determined using a historical sample of 37 month-end CRH share prices in respect of the three-year savings-related share options and 61 month-end share prices in respect of the five-year savings-related share options. The expected lives of the options are based on historical data and are therefore not necessarily indicative of exercise patterns that may materialise.
Other than the assumptions listed above, no other features of options grants were factored into the determination of fair value.
The terms of the options issued under the Savings-related Share Option Schemes do not contain any market conditions within the meaning of IFRS 2 Share-based Payment.
| | | | | |
| 2022 Annual Report and Form 20-F | 203 |
9. Finance Costs and Finance Income
Continuing operations
| | | | | | | | | | | |
| 2022 | 2021 | 2020 |
| $m | $m | $m |
| Finance costs | | | |
Interest payable on borrowings | 328 | 344 | 381 |
Net cost/(income) on interest rate and currency swaps | 8 | (31) | 2 |
Mark-to-market of derivatives and related fixed rate debt: | | | |
| - interest rate swaps (i) | 154 | 85 | (97) |
- currency forwards and currency swaps | 4 | 1 | 2 |
- fixed rate debt (i) | (159) | (90) | 80 |
Net loss/(gain) on non-derivative financial instruments | 24 | (4) | 21 |
Interest payable on cash and cash equivalents and other | - | 6 | - |
| Unwinding of discount element of lease liabilities | 42 | 46 | 49 |
Finance costs | 401 | 357 | 438 |
| | | |
| Finance income | | | |
Interest receivable on cash and cash equivalents and other | (65) | - | - |
Finance income | (65) | - | - |
| | | |
Finance costs less income | 336 | 357 | 438 |
| | | |
| Other financial expense | | | |
Unwinding of discount element of provisions for liabilities (note 26) | 16 | 18 | 21 |
Unwinding of discount applicable to deferred and contingent acquisition consideration (note 18) | 20 | 20 | 21 |
Unwinding of discount applicable to deferred divestment proceeds | (8) | (12) | (24) |
Unwinding of discount applicable to leased mineral reserves | 6 | 6 | 4 |
Pension-related finance cost (net) (note 28) | 6 | 10 | 11 |
Net other financial expense | 40 | 42 | 33 |
| | | |
Total net finance costs (ii) | 376 | 399 | 471 |
(i)The Group uses interest rate swaps to convert fixed rate debt to floating rate. Fixed rate debt, which has been converted to floating rate through the use of interest rate swaps, is stated in the Consolidated Balance Sheet at adjusted value to reflect movements in underlying fixed rates. The movement on this adjustment, together with the offsetting movement in the fair value of the related interest rate swaps, is included in finance costs in each reporting period.
(ii)Net finance costs excludes $6 million (2021: $18 million; 2020: $19 million) relating to discontinued operations.
| | | | | |
| 2022 Annual Report and Form 20-F | 204 |
10. Income Tax Expense
| | | | | | | | | | | |
| Recognised within the Consolidated Income Statement | | | |
| 2022 | 2021 | 2020 |
Continuing operations | $m | $m | $m |
| (a) Current tax | | | |
Republic of Ireland | 34 | 15 | 23 |
| Overseas | 731 | 548 | 520 |
Total current tax expense | 765 | 563 | 543 |
(b) Deferred tax | | | |
Origination and reversal of temporary differences: | | | |
| Retirement benefit obligations | (4) | 2 | (9) |
Share-based payment expense | 1 | (6) | (2) |
Derivative financial instruments | (4) | 2 | - |
Other items | 27 | 100 | (87) |
Total deferred tax expense/(income) | 20 | 98 | (98) |
| | | |
| | | |
Income tax reported in the Consolidated Income Statement | 785 | 661 | 445 |
| | | |
Recognised outside the Consolidated Income Statement | | | |
| | | |
| (a) Within the Consolidated Statement of Comprehensive Income: | | | |
Deferred tax - retirement benefit obligations | (63) | (36) | 11 |
Deferred tax - cash flow hedges | (14) | (8) | - |
| (77) | (44) | 11 |
(b) Within the Consolidated Statement of Changes in Equity: | | | |
| | | |
| Current tax | | | |
Current tax - share option exercises | 7 | 14 | 2 |
| | | |
Deferred tax | | | |
| Deferred tax - share-based payment expense | (10) | 10 | (1) |
Deferred tax - cash flow hedges | 17 | - | - |
| 14 | 24 | 1 |
Income tax recognised outside the Consolidated Income Statement | (63) | (20) | 12 |
| | | | | |
| 2022 Annual Report and Form 20-F | 205 |
| | | | | | | | | | | |
| 2022 | 2021 | 2020 |
Reconciliation of applicable tax rate to effective tax rate | | | |
| Continuing operations | | | |
Profit before tax ($m) | 3,469 | 3,103 | 1,454 |
| Tax charge expressed as a percentage of profit before tax (effective tax rate): | | | |
| - current tax expense only | 22.1 | % | 18.1 | % | 37.3 | % |
| - total income tax expense (current and deferred) | 22.6 | % | 21.3 | % | 30.6 | % |
The following table reconciles the applicable Republic of Ireland statutory tax rate to the effective tax rate (current and deferred) of the Group:
| | | | | | | | | | | |
| % of profit before tax |
| Irish corporation tax rate | 12.5 | 12.5 | 12.5 |
| Higher tax rates on overseas earnings | 9.8 | 9.6 | 10.4 |
| Other items | | | |
| - arising from 2020 impairment | - | - | 9.4 |
| - other items (primarily comprising items not chargeable to tax/expenses not deductible for tax) | 0.3 | (0.8) | (1.7) |
| Total effective tax rate | 22.6 | 21.3 | 30.6 |
Other disclosures
Effective tax rate
The 2022 effective tax rate is 22.6% (2021: 21.3%; 2020: 30.6%).
The tax charge associated with discontinued operations is recognised separately in “Profit after tax for the financial year from discontinued operations”. See note 3 for further details.
Changes in tax rates
The total tax charge in future periods will be affected by any changes to the tax rates in force in the countries in which the Group operates.
Proposed dividends
There are no income tax consequences for the Company in respect of dividends proposed prior to issuance of the Consolidated Financial Statements and for which a liability has not been recognised.
| | | | | |
| 2022 Annual Report and Form 20-F | 206 |
11. Dividends
The dividends paid and proposed in respect of each class of share capital are as follows:
| | | | | | | | | | | |
| 2022 | 2021 | 2020 |
| $m | $m | $m |
Dividends to shareholders (i) | | | |
| Equity | | | |
Final - paid $0.98 per Ordinary Share (2021: $0.93; 2020: $0.70) (ii) | 750 | 730 | 537 |
Interim - paid $0.24 per Ordinary Share (2021: $0.23; 2020: $0.22) | 181 | 179 | 173 |
| Total | 931 | 909 | 710 |
| | | |
| Reconciliation to Consolidated Statement of Cash Flows | | | |
Dividends to shareholders | 931 | 909 | 710 |
Translation adjustment (iii) | (14) | (3) | (3) |
Dividends paid to equity holders of the Company | 917 | 906 | 707 |
Dividends paid by subsidiaries to non-controlling interests | 13 | 32 | 15 |
Total dividends paid | 930 | 938 | 722 |
| | | |
| Dividends proposed (memorandum disclosure) | | | |
| Equity | | | |
Final 2022 - proposed $1.03 per Ordinary Share (2021: $0.98; 2020: $0.93) (ii) | 765 | 751 | 730 |
(i)In 2022 the 5% Cumulative Preference Shares paid a dividend of €3,175 (2021: €3,175; 2020: €3,175) and the 7% ‘A’ Cumulative Preference Shares paid a dividend of €77,521 (2021: €77,521; 2020: €77,521).
(ii)Dividends per share declared previously in euro have been translated to US Dollar using the dividend record date exchange rate.
(iii)Translation adjustment arising from US Dollar declared dividends paid in non-US Dollar currencies.
| | | | | |
| 2022 Annual Report and Form 20-F | 207 |
12. Earnings per Ordinary Share
The computation of basic and diluted earnings per Ordinary Share is set out below:
| | | | | | | | | | | |
| 2022 | 2021 | 2020 |
| $m | $m | $m |
Numerator computations | | | |
Group profit for the financial year | 3,874 | 2,621 | 1,165 |
Profit attributable to non-controlling interests | (27) | (56) | (43) |
Profit attributable to equity holders of the Company | 3,847 | 2,565 | 1,122 |
Preference dividends | - | - | - |
Profit attributable to ordinary equity holders of the Company - numerator for basic/diluted earnings per Ordinary Share | 3,847 | 2,565 | 1,122 |
Profit after tax for the financial year from discontinued operations - attributable to equity holders of the Company | 1,190 | 179 | 156 |
Profit attributable to ordinary equity holders of the Company - numerator for basic/diluted earnings per Ordinary Share from continuing operations | 2,657 | 2,386 | 966 |
| | | |
Denominator computations | | | |
Weighted average number of Ordinary Shares (millions) outstanding for the year (i) | 758.3 | 780.2 | 785.1 |
Effect of dilutive potential Ordinary Shares (employee share awards) (millions) (i) (ii) | 5.8 | 6.6 | 6.0 |
Denominator for diluted earnings per Ordinary Share | 764.1 | 786.8 | 791.1 |
| | | |
| Basic earnings per Ordinary Share | $5.07 | $3.29 | $1.43 |
Diluted earnings per Ordinary Share | $5.03 | $3.26 | $1.42 |
| | | |
Basic earnings per Ordinary Share from continuing operations | $3.50 | $3.06 | $1.23 |
Diluted earnings per Ordinary Share from continuing operations | $3.48 | $3.03 | $1.22 |
(i)The weighted average number of Ordinary Shares included in the computation of basic and diluted earnings per Ordinary Share has been adjusted to exclude shares held by the Employee Benefit Trust and Ordinary Shares repurchased and held by the Company (CRH plc) as Treasury Shares given that these shares do not rank for dividend. The number of Ordinary Shares so held at the balance sheet date is detailed in note 29.
(ii)Ordinary shares, that would only be issued contingent on certain conditions (totalling 4,209,404 at 31 December 2022, 3,630,633 at 31 December 2021 and 4,053,377 at 31 December 2020) are excluded from the computation of diluted earnings per Ordinary Share where the conditions governing exercisability have not been satisfied as at the end of the reporting period or they are antidilutive for the periods presented.
| | | | | |
| 2022 Annual Report and Form 20-F | 208 |
13. Property, Plant and Equipment
| | | | | | | | | | | | | | | | | |
| Mineral- bearing land | Land and buildings | Plant and machinery | Assets in course of construction | Total |
| $m | $m | $m | $m | $m |
At 31 December 2022 | | | | | |
| Owned | | | | | |
Cost/deemed cost | 4,831 | 5,786 | 19,577 | 1,090 | 31,284 |
Accumulated depreciation (and impairment charges) | (1,278) | (1,860) | (10,443) | (40) | (13,621) |
Net carrying amount | 3,553 | 3,926 | 9,134 | 1,050 | 17,663 |
At 1 January 2022, net carrying amount | 3,646 | 3,961 | 9,394 | 937 | 17,938 |
Translation adjustment | (89) | (150) | (319) | (48) | (606) |
| Reclassifications | 8 | 69 | 547 | (624) | - |
Transfer from leased assets (note 20) | - | - | 5 | - | 5 |
Additions at cost | 23 | 89 | 607 | 804 | 1,523 |
Additions to leased mineral reserves (note 19) (i) | 10 | - | - | - | 10 |
Arising on acquisition (note 30) | 76 | 258 | 426 | 39 | 799 |
Disposals at net carrying amount | (20) | (156) | (375) | (58) | (609) |
Depreciation charge for year (ii) | (101) | (145) | (1,151) | - | (1,397) |
At 31 December 2022, net carrying amount | 3,553 | 3,926 | 9,134 | 1,050 | 17,663 |
| | Land and buildings | Plant and machinery | Other | |
| | $m | $m | $m | |
Leased right-of-use assets (iii) | | | | | |
At 31 December 2022, net carrying amount (note 20) | | 930 | 302 | 26 | 1,258 |
Total property, plant and equipment | | | | | 18,921 |
The equivalent disclosure for the prior year is as follows: | | | | | |
| Mineral-bearing land | Land and buildings | Plant and machinery | Assets in course of construction | Total |
| $m | $m | $m | $m | $m |
At 31 December 2021 | | | | | |
| Owned | | | | | |
Cost/deemed cost | 4,890 | 5,865 | 19,754 | 977 | 31,486 |
Accumulated depreciation (and impairment charges) | (1,244) | (1,904) | (10,360) | (40) | (13,548) |
Net carrying amount | 3,646 | 3,961 | 9,394 | 937 | 17,938 |
At 1 January 2021, net carrying amount | 3,698 | 4,081 | 9,416 | 572 | 17,767 |
Translation adjustment | (59) | (111) | (146) | (22) | (338) |
| Reclassifications | 28 | 20 | 449 | (501) | (4) |
Transfer from leased assets (note 20) | - | - | 10 | - | 10 |
Additions at cost | 13 | 94 | 564 | 883 | 1,554 |
Additions to leased mineral reserves (note 19) (i) | 10 | - | - | - | 10 |
Arising on acquisition (note 30) | 81 | 86 | 346 | 8 | 521 |
Disposals at net carrying amount | (11) | (63) | (92) | (3) | (169) |
Depreciation charge for year (ii) | (114) | (146) | (1,153) | - | (1,413) |
At 31 December 2021, net carrying amount | 3,646 | 3,961 | 9,394 | 937 | 17,938 |
| | | | | |
| | Land and buildings | Plant and machinery | Other | |
| | $m | $m | $m | |
Leased right-of-use assets (iii) | | | | | |
At 31 December 2021, net carrying amount (note 20) | | 1,195 | 313 | 56 | 1,564 |
Total property, plant and equipment | | | | | 19,502 |
| | | | | |
| 2022 Annual Report and Form 20-F | 209 |
| | | | | | | | | | | | | | | | | |
| Mineral- bearing land | Land and buildings | Plant and machinery | Assets in course of construction | Total |
| $m | $m | $m | $m | $m |
Owned | | | | | |
At 1 January 2021 | | | | | |
Cost/deemed cost | 4,874 | 5,928 | 19,400 | 612 | 30,814 |
Accumulated depreciation (and impairment charges) | (1,176) | (1,847) | (9,984) | (40) | (13,047) |
Net carrying amount | 3,698 | 4,081 | 9,416 | 572 | 17,767 |
(i)Additions relating to leased mineral reserves which fall outside the scope of IFRS 16.
(ii)The depreciation charge includes $15 million (2021: $44 million; 2020: $41 million) relating to discontinued operations.
(iii)See note 20 for more detailed information on right-of-use assets and lease liabilities of the Group.
Climate risk and impairment of property, plant and equipment
Property, plant and equipment (PP&E) is reviewed for potential impairment by applying a series of external and internal indicators including climate-related risks. Specific climate-related considerations during 2022 included:
•considering potential future business optimisation levers that may occur and the impact on useful lives;
•assessing the useful lives of transport and mobile equipment in the context of decarbonisation of our transport and mobile equipment, this being identified as one of our decarbonisation roadmap levers. It is assumed that transport and mobile equipment will be transitioned to lower carbon emitting units in line with normal asset retirement timelines;
•assessing the impact of the capital expenditure required to meet the Group’s carbon emissions reduction targets on the useful lives of existing PP&E. The nature of the proposed projects required to deliver our targets, including technology advancements, and their impact on existing PP&E was also considered; and
•assessing the impact of physical risk to PP&E, in the context of the exposure of the Group’s locations to potential future adverse weather impacts
Capital expenditure will continue to be required to deliver our targets and mitigate potential physical risks. Therefore, the useful lives of future capital expenditure may differ from current assumptions. However, as a result of the assessments set out above, there were no significant changes in the estimates of useful lives or asset values during the current financial year.
| | | | | | | | |
Future purchase commitments for property, plant and equipment | 2022 | 2021 (iv) |
| $m | $m |
Contracted for but not provided in the financial statements | 862 | 628 |
Authorised by the Directors but not contracted for | 530 | 417 |
(iv)Includes contracted for but not provided for and authorised by the Directors but not contracted for commitments of $11 million and $25 million respectively relating to discontinued operations.
| | | | | |
| 2022 Annual Report and Form 20-F | 210 |
14. Intangible Assets
| | | | | | | | | | | | | | | | | |
| | Other intangible assets | |
| | | | | |
| Goodwill | Marketing-related | Customer-related (i) | Contract-based | Total |
| $m | $m | $m | $m | $m |
At 31 December 2022 | | | | | |
| Cost/deemed cost | 9,890 | 286 | 1,202 | 92 | 11,470 |
Accumulated amortisation (and impairment charges) | (691) | (78) | (369) | (45) | (1,183) |
Net carrying amount | 9,199 | 208 | 833 | 47 | 10,287 |
| | | | | |
At 1 January 2022, net carrying amount | 9,451 | 104 | 282 | 11 | 9,848 |
Translation adjustment | (239) | - | (3) | (1) | (243) |
| | | | | |
Arising on acquisition (note 30) (ii) | 1,320 | 177 | 763 | 47 | 2,307 |
| Disposals | (1,333) | (57) | (115) | (7) | (1,512) |
Amortisation charge for year (iii) | - | (16) | (94) | (3) | (113) |
At 31 December 2022, net carrying amount | 9,199 | 208 | 833 | 47 | 10,287 |
| | | | | |
The equivalent disclosure for the prior year is as follows: | | | | | |
| | | | | |
At 31 December 2021 | | | | | |
Cost/deemed cost | 10,251 | 202 | 705 | 77 | 11,235 |
Accumulated amortisation (and impairment charges) | (800) | (98) | (423) | (66) | (1,387) |
Net carrying amount | 9,451 | 104 | 282 | 11 | 9,848 |
| | | | | |
At 1 January 2021, net carrying amount | 9,032 | 87 | 240 | 14 | 9,373 |
Translation adjustment | (221) | (1) | - | 1 | (221) |
Arising on acquisition (note 30) | 679 | 32 | 99 | - | 810 |
| Disposals | (39) | - | (1) | - | (40) |
Amortisation charge for year (iii) | - | (14) | (56) | (4) | (74) |
At 31 December 2021, net carrying amount | 9,451 | 104 | 282 | 11 | 9,848 |
| | | | | |
At 1 January 2021 | | | | | |
| Cost/deemed cost | 9,790 | 172 | 601 | 75 | 10,638 |
Accumulated amortisation (and impairment charges) | (758) | (85) | (361) | (61) | (1,265) |
Net carrying amount | 9,032 | 87 | 240 | 14 | 9,373 |
(i)The customer-related intangible assets relate predominantly to non-contractual customer relationships.
(ii)Marketing-related, customer-related and contract-based intangible assets of $174 million, $594 million and $41 million respectively arose on the acquisition of Barrette Outdoor Living (Barrette) in July 2022. These primarily related to brand names, patents and non-contractual customer relationships.
(iii)The amortisation charge includes $10 million (2021: $28 million; 2020: $26 million) in respect of discontinued operations, which primarily relates to customer-related intangible assets.
| | | | | |
| 2022 Annual Report and Form 20-F | 211 |
Annual goodwill testing
Cash-generating units
Goodwill acquired through business combination activity has been allocated to CGUs that are expected to benefit from synergies in that combination. The CGUs represent the lowest level within the Group at which the associated goodwill is monitored for internal management purposes, and are not larger than the operating segments determined in accordance with IFRS 8. A total of 22 (2021:22) CGUs have been identified and these are analysed between the three business segments below. All businesses within the various CGUs exhibit similar and/or consistent profit margin and asset intensity characteristics. Assets, liabilities, deferred tax and goodwill have been assigned to the CGUs on a reasonable and consistent basis.
| | | | | | | | | | | | | | | | | |
| Number of cash-generating units | | Goodwill |
| 2022 | 2021 | | 2022 | 2021 |
| | | | $m | $m |
Americas Materials | 5 | 5 | | 4,407 | 4,292 |
Building Products | 1 | 1 | | 2,895 | 2,964 |
Europe Materials | 16 | 16 | | 1,897 | 2,195 |
Total Group | 22 | 22 | | 9,199 | 9,451 |
Impairment testing methodology and results
Goodwill is subject to impairment testing on an annual basis. The recoverable amount of 22 CGUs is determined based on a value-in-use (VIU) computation.
The cash flow forecasts are primarily based on a five-year strategic plan document formally approved by the Board of Directors and specifically exclude the impact of future development activity and capital expenditure that would enhance the assets' performance. To align with the Group’s acquisition modelling methodology, these cash flows are extrapolated out for an additional five years, using externally sourced growth rates, to determine the basis for an annuity-based terminal value. The methodology allows, in very limited circumstances, to adjust cash flows past the strategic plan horizon, where deemed appropriate.
No adjustments were made to years 6-10 cash flows for the purpose of the 2022 impairment testing.
As in prior years, the terminal value is based on a 20-year annuity, with the exception of certain long-lived cement assets, where an assumption of a 30-year annuity has been used. Projected cash flows beyond the initial evaluation period have been extrapolated using real growth rates ranging from 1.9% in the Americas, 0.8% to 3.0% in Europe and 3.0% in Asia. Such real growth rates do not exceed the long-term average growth rates for the countries in which each CGU operates. The VIU represents the present value of the future cash flows, including the terminal value, discounted at a rate appropriate to each CGU. The real pre-tax discount rate used for purposes of impairment testing on Ukraine CGU was 16.9%. Excluding Ukraine, the real pre-tax discount rates used range from 6.0% to 9.5% (2021: 6.5% to 8.6%). These rates are in line with the Group’s estimated weighted average cost of capital, arrived at using the Capital Asset Pricing Model. The 2022 annual goodwill impairment testing process has resulted in no intangible asset impairments (2021: $nil million).
Climate risk and impairment testing
The impact of climate change risks including the risks identified as part of the TCFD disclosures on pages 56 to 59, with a particular focus on carbon costs, has been considered as part of the impairment testing process through net cash flow estimations and the duration of discounted cash flow models. In addition, the capital expenditure required to meet our carbon emissions reduction targets was also incorporated into our net cash flows.
Our Cement and Lime businesses represent our largest contributor to CO2 emissions and consequently have the largest exposure to carbon costs. The net cash flows included in VIU assessments, reflect carbon costs that are reasonably estimated to be incurred over the assessment period, based on current Emissions Trading Schemes (ETS) in place at the date of testing and known changes to regulations over the strategic plan horizon. The internal carbon prices applied in VIU assessments reflect the most recent carbon credits purchased by the Group along with the latest International Energy Agency (IEA) carbon price projections for the applicable regions where the Group operates.
The purchase of carbon allowances is managed by a central unit which buys forward to secure supply and de-risk the cost bases ahead of time. This helps provide the Group with near-term certainty on carbon prices and associated costs.
While none of the significant CGUs identified on page 212 currently has a material exposure to carbon costs and as such carbon costs are not deemed a key assumption, the Directors are aware of the ever-changing risks attached to climate change and will regularly assess these risks against judgements and estimates made in future VIU assessments.
While no adjustments in relation to carbon costs were made to years 6-10 cash flows for the purposes of impairment testing, on the basis of assumed cost recovery through pricing, CRH completed a scenario analysis that was aligned to the Paris Agreement to assess the potential impacts of higher carbon costs past the strategic plan period. Key variables included carbon prices based upon the IEA Net Zero scenario (which assumes $140 per tonne in 2030 increasing to $250 per tonne in 2050) and higher costs arising from the EU’s introduction of the Carbon Border Adjustment Mechanism. The impact of increasing carbon prices and declining free allowances (where applicable) was analysed across our material Cement and Lime CGUs in combination with forecast levels of cost recovery through pricing. The analysis concluded there was no material impact on any of the CGUs reviewed primarily due to the levels of headroom in these CGUs and an assumption of cost recovery through pricing. The Group continues to monitor the emergence of CO2 regulatory pronouncements which will be factored into strategic plans once enacted.
Key sources of estimation uncertainty
The cash flows have been arrived at by taking into account the Group’s strong financial position, its established history of earnings and cash flow generation and the nature of the building materials industry. However, expected future cash flows are inherently uncertain and are therefore liable to material change over time. The key assumptions employed in arriving at the estimates of future cash flows factored into impairment testing are subjective and include projected EBITDA (as defined)* margins, long-term growth and discount rates used and the duration of the discounted cash flow model.
While carbon costs are considered a climate-related risk under our TCFD disclosures, they are not considered a major source of estimation uncertainty on their own for 2022. The impact of this risk from an impairment perspective is reflected through EBITDA (as defined)* margin which as set out on page 182 is a major source of estimation uncertainty.
* EBITDA is defined as earnings from continuing operations before interest, taxes, depreciation, amortisation, asset impairment charges, profit on disposals and the Group’s share of equity accounted investments’ profit after tax.
| | | | | |
| 2022 Annual Report and Form 20-F | 212 |
14. Intangible Assets continued
Significant goodwill amounts
The goodwill allocated to the Americas Cement, AMAT South (Americas Materials segment) and the Building Products (Building Products segment) CGUs account for between 11% and 32% of the total carrying amount shown on page 210.
The goodwill allocated to each of the remaining CGUs is less than 10% of the total carrying value in all other cases. The additional disclosures required for the three CGUs with significant goodwill are as follows: | | | | | | | | | | | | | | | | | | | | | | | | | | |
| Americas Cement | | AMAT South | | Building Products |
| 2022 | 2021 | | 2022 | 2021 | | 2022 | 2021 |
Goodwill allocated to the cash-generating unit at balance sheet date | $2,125m | $2,157m | | $981m | $944m | | $2,895m | $2,964m |
Discount rate applied to the cash flow projections (real pre-tax) | 8.1 | % | 7.5 | % | | 8.2 | % | 8.3 | % | | 8.4 | % | 8.3 | % |
Average EBITDA (as defined)* margin over the initial 5-year period | 48.3 | % | 53.8 | % | | 15.4 | % | 17.9 | % | | 20.1 | % | 19.1 | % |
Value-in-use (present value of future cash flows) | $10,050m | $10,749m | | $5,936m | $5,041m | | $18,050m | $14,831m |
Excess of value-in-use over carrying amount | $5,199m | $5,953m | | $3,524m | $2,749m | | $11,363m | $9,191m |
Long-term growth rates | 1.9 | % | 1.8 | % | | 1.9 | % | 1.8 | % | | 1.9 | % | 1.8 | % |
The key assumptions and methodology used in respect of these three CGUs are consistent with those described above. The values applied to each of the key estimates and assumptions are specific to the individual CGUs and were derived from a combination of internal and external factors based on historical experience and took into account the cash flows specifically associated with these businesses. The cash flows and annuity-based terminal value were projected in line with the methodology disclosed above.
The Americas Cement, AMAT South and Building Products CGUs are not included in the ‘Sensitivity analysis’ section below. Given the magnitude of the excess of VIU over carrying amount, and our belief that the key assumptions are reasonable, management believes that it is not reasonably possible that there would be a change in the key assumptions such that the carrying amount would exceed the VIU.
Consequently no further disclosures relating to sensitivity of the value-in-use computations for the Americas Cement, AMAT South or Building Products CGUs are considered to be warranted.
Sensitivity analysis
A qualitative and quantitative assessment has been performed and results in additional sensitivity disclosures for two of the total 22 CGUs. The key assumptions, methodology used and values applied to each of the key assumptions for these CGUs are in line with those outlined above (a 30-year annuity period has been used). The two CGUs have aggregate goodwill of $665 million at the date of testing. The table below identifies the amounts by which each of the following assumptions may either decline or increase to arrive at a zero excess of the present value of future cash flows over the book value of net assets in the two CGUs selected for sensitivity analysis disclosures:
| | | | | |
| two cash-generating units |
| Reduction in EBITDA (as defined)* margin | 2.6 and 3.8 percentage points |
| Reduction in long-term growth rate | 2.7 and 3.2 percentage points |
| Increase in pre-tax discount rate | 2.0 and 2.1 percentage points |
The average EBITDA (as defined)* margin for the aggregate of these two CGUs over the initial five-year period was 17.4%. The VIU (being the present value of the future net cash flows) was $2,474 million and the carrying amount was $1,960 million, resulting in an excess of value-in-use over carrying amounts of $514 million.
* EBITDA is defined as earnings from continuing operations before interest, taxes, depreciation, amortisation, asset impairment charges, profit on disposals and the Group’s share of equity accounted investments’ profit after tax.
| | | | | |
| 2022 Annual Report and Form 20-F | 213 |
15. Financial Assets
| | | | | | | | | | | | | | |
| Investments accounted for
using the equity method
(i.e. joint ventures and associates) | |
| | | | |
| Share of net assets (i) | Loans | Total | Other |
| $m | $m | $m | $m |
At 1 January 2022 | 640 | 13 | 653 | 12 |
Translation adjustment | (34) | - | (34) | - |
Investments and advances | 40 | 3 | 43 | 2 |
| Arising on acquisition (note 30) | 28 | - | 28 | - |
Disposals and repayments | - | (5) | (5) | - |
| | | | |
| | | | |
Dividends received | (36) | - | (36) | - |
At 31 December 2022 | 638 | 11 | 649 | 14 |
| | | | |
| The equivalent disclosure for the prior year is as follows: | | |
| | | | |
At 1 January 2021 | 609 | 17 | 626 | 13 |
Translation adjustment | 10 | (1) | 9 | - |
Investments and advances | - | 4 | 4 | - |
Disposals and repayments | - | (7) | (7) | (1) |
Return of share capital | (2) | - | (2) | - |
Share of profit after tax | 55 | - | 55 | - |
Dividends received | (32) | - | (32) | - |
At 31 December 2021 | 640 | 13 | 653 | 12 |
(i)The Group’s share of joint ventures and associates profit/(loss) after tax is equity accounted and is presented as a single line item in the Consolidated Income Statement. It is analysed as follows; profit after tax from joint ventures: $8 million (2021: $11 million; 2020: $22 million), loss after tax from associates: $8 million (2021: profit after tax of $44 million; 2020: loss after tax of $140 million).
A listing of the principal equity accounted investments is contained on page 293.
16. Inventories
| | | | | | | | |
| 2022 | 2021 |
| $m | $m |
Raw materials | 1,988 | 1,737 |
Work-in-progress (i) | 181 | 136 |
Finished goods | 2,025 | 1,738 |
Total inventories at the lower of cost and net realisable value | 4,194 | 3,611 |
(i)Work-in-progress includes $4 million (2021: $9 million) in respect of the cumulative costs incurred, net of amounts transferred to cost of sales under percentage-of-completion accounting, for construction contracts in progress at the balance sheet date.
An analysis of the Group’s cost of sales expense is provided in note 4 to the financial statements.
Write-downs of inventories recognised as an expense within cost of sales amounted to $17 million (2021: $2 million; 2020: $9 million).
| | | | | |
| 2022 Annual Report and Form 20-F | 214 |
17. Trade and Other Receivables
| | | | | | | | |
| 2022 | 2021 |
| $m | $m |
Current | | |
| Trade receivables | 3,435 | 3,586 |
Construction contract assets (i) | 606 | 565 |
Total trade receivables and construction contract assets, gross | 4,041 | 4,151 |
Loss allowance | (125) | (131) |
Total trade receivables and construction contract assets, net | 3,916 | 4,020 |
Amounts receivable from equity accounted investments | 37 | 31 |
| Prepayments | 269 | 251 |
Other receivables | 347 | 267 |
| Total | 4,569 | 4,569 |
| | |
| Non-current | | |
| Other receivables | 164 | 239 |
(i)Includes unbilled revenue and retentions held by customers in respect of construction contracts at the balance sheet date amounting to $402 million and $204 million respectively (2021: $361 million and $204 million respectively). The movements in these balances during the year was as follows:
| | | | | | | | | | | | | | | | | |
| Unbilled revenue | | Retentions |
| 2022 | 2021 | | 2022 | 2021 |
$m | $m | | $m | $m |
At 1 January | 361 | 297 | | 204 | 202 |
Translation adjustment | (19) | (4) | | (9) | (1) |
Additional contract balances recognised | 348 | 318 | | 144 | 130 |
Invoiced in the year | (279) | (239) | | - | - |
Received from customers | - | - | | (135) | (125) |
Written off during the year | - | (11) | | - | - |
| Disposals | (9) | - | | - | (2) |
At 31 December | 402 | 361 | | 204 | 204 |
Trade receivables, construction contract assets and deferred divestment consideration, which is included in other receivables, are measured at amortised cost (less any expected credit loss allowance) as the Group’s business model is to “hold to collect” contractual cash flows, and the cash flows arising from trade and other receivables are solely payments of principal and interest. The carrying amount of trade receivables, construction contract assets and deferred divestment consideration closely approximate their fair value.
Valuation and qualifying accounts (expected credit loss allowance)
The movements in the expected credit loss allowance for receivables during the financial year were as follows:
| | | | | | | | | | | |
| 2022 | 2021 | 2020 |
| $m | $m | $m |
At 1 January | 131 | 140 | 133 |
Translation adjustment | (8) | (5) | 5 |
Disposed of during year | (5) | (1) | (4) |
Written off during year | (19) | (14) | (23) |
Arising on acquisition (note 30) | 2 | 1 | - |
Net remeasurement of expected credit loss allowance | 24 | 10 | 29 |
At 31 December | 125 | 131 | 140 |
| | | | | |
| 2022 Annual Report and Form 20-F | 215 |
Given the common profile of CRH’s customers, how customer credit risk is managed at appropriate Group locations, and the breadth and scale of its international operations, a disclosure of concentrations of credit risk by segment best enables users of financial statements to assess CRH’s credit risk exposure. The following table sets out the gross carrying value of trade receivables and construction contract assets and expected credit loss allowance by segment:
| | | | | | | | | | | | | | | | | | | | | | | |
| Trade receivables and construction contract assets, gross | | Expected credit loss allowance |
| 2022 | 2021 | 2020 | | 2022 | 2021 | 2020 |
$m | $m | $m | | $m | $m | $m |
Americas Materials | 1,764 | 1,735 | 1,475 | | 22 | 27 | 34 |
Building Products (i) | 914 | 989 | 830 | | 22 | 25 | 23 |
Europe Materials | 1,363 | 1,427 | 1,403 | | 81 | 79 | 83 |
Total Group | 4,041 | 4,151 | 3,708 | | 125 | 131 | 140 |
| | | | | | | |
| | | | | | | | | | | | | | | | | | | | | | | |
(i) Analysis of Building Products segment by geographic location: | | | | | | | |
| | | | | | | |
| Americas | 747 | 821 | 676 | | 16 | 19 | 17 |
| Europe | 167 | 168 | 154 | | 6 | 6 | 6 |
| Total | 914 | 989 | 830 | | 22 | 25 | 23 |
Customer credit risk is managed according to established policies, procedures and controls. Customer credit quality is assessed in line with strict credit rating criteria and credit limits are established where appropriate. Outstanding customer balances are regularly monitored for evidence of customer financial difficulties including payment default, breach of contract, etc.
Significant balances are reviewed individually while smaller balances are grouped and assessed collectively. Receivables balances are in general unsecured and non-interest-bearing. Customer credit risk arising in the context of the Group’s receivables is not significant and the total expected credit loss allowance for impairment of trade receivables and construction contract assets amounts to 3.1% of the Group’s gross trade receivables and construction contract assets (2021: 3.2%). The Group considers the ageing of past due receivables a key factor in assessing credit risk. The trade receivables and construction contract assets balances disclosed above comprise a large number of customers spread across the Group’s activities and geographies with balances classified as “not past due” representing 69% of the total gross trade receivables and
construction contract assets balance at the balance sheet date (2021: 68%). There have been no significant changes to the Group’s credit risk parameters or to the composition of the Group’s trade receivables and construction contract assets portfolio during the financial year.
The Group applies the simplified approach to providing for expected credit losses (ECL) permitted by IFRS 9 which requires expected lifetime losses to be recognised from initial recognition of the receivables. Receivables such as those which relate to bonded government contracts and receivables which fall under credit insurance are considered lower risk and would not attract a material ECL. Considering the uncertain economic outlook for the next 12 months, our ECL allowance adequately represents the risk of default on our receivables balances.
Trade receivables are written off when there is no reasonable expectation of recovery, such as a debtor failing to engage in a repayment plan with the company. Where recoveries are made, these are recognised in the Consolidated Income Statement.
Aged analysis
The aged analysis of net trade receivables and construction contract assets at the balance sheet date was as follows:
| | | | | | | | | | | | | | | | | | | | | | | | | | | | | |
| Americas Materials | Building Products | Europe Materials | Total | | Americas Materials | Building Products | Europe Materials | Total |
| 2022 | 2022 | 2022 | 2022 | | 2021 | 2021 | 2021 | 2021 |
$m | $m | $m | $m | | $m | $m | $m | $m |
Not past due | 1,225 | 584 | 988 | 2,797 | | 1,139 | 626 | 1,050 | 2,815 |
| Past due: | | | | | | | | | |
| - less than 60 days | 415 | 190 | 218 | 823 | | 469 | 227 | 223 | 919 |
- 60 days or greater but less than 120 days | 73 | 76 | 42 | 191 | | 74 | 74 | 44 | 192 |
- 120 days or greater | 29 | 42 | 34 | 105 | | 26 | 37 | 31 | 94 |
Total trade receivables, net | 1,742 | 892 | 1,282 | 3,916 | | 1,708 | 964 | 1,348 | 4,020 |
Trade receivables and construction contract assets are in general receivable within 90 days of the balance sheet date.
| | | | | |
| 2022 Annual Report and Form 20-F | 216 |
18. Trade and Other Payables
| | | | | | | | |
| 2022 | 2021 |
| $m | $m |
| Current | | |
Trade payables | 2,927 | 2,727 |
Construction contract-related payables (i) | 344 | 336 |
Deferred and contingent acquisition consideration (ii) | 30 | 33 |
| Accruals | 2,132 | 2,184 |
Other payables | 436 | 410 |
Amounts payable to equity accounted investments | 3 | 2 |
| Total | 5,872 | 5,692 |
| | |
| Non-current | | |
| Other payables | 392 | 389 |
| Deferred and contingent acquisition consideration (ii) | 299 | 328 |
| Total | 691 | 717 |
(i)Construction contract-related payables include billings in excess of revenue, together with advances received from customers in respect of work to be performed under construction contracts and foreseeable losses thereon. $308 million was recognised in the Consolidated Income Statement during 2022 which was included in the contract-related payables balance at 31 December 2021. The movements in these balances during the year was as follows:
| | | | | | | | | | | | | | | | | |
| Advances received | | Billings in excess of
revenue |
| 2022 | 2021 | | 2022 | 2021 |
$m | $m | | $m | $m |
At 1 January | 56 | 31 | | 274 | 283 |
Translation adjustment | (5) | (3) | | (8) | (5) |
Additional contract balances recognised | 41 | 58 | | 264 | 255 |
Opening balances recognised as revenue | (55) | (30) | | (253) | (258) |
| Disposals | - | - | | (1) | (1) |
At 31 December | 37 | 56 | | 276 | 274 |
The carrying amounts of trade payables, construction contract-related payables and other payables approximate their fair value largely due to the short-term maturities and nature of these instruments.
(ii)The fair value of total contingent consideration is $293 million (2021: $317 million) (Level 3 in the fair value hierarchy), and deferred consideration is $36 million (2021: $44 million). On an undiscounted basis, the corresponding future payments relating to contingent consideration, for which the Group may be liable, ranges from $296 million to $448 million. This is based on a range of estimated potential outcomes of the expected payment amounts primarily dependent on underlying performance metrics as set out in the relevant agreements. The fair value of contingent consideration is arrived at through discounting the expected payment to present value. Based on a reasonable possible change in assumptions, the fair value ranges from $231 million to $351 million on a discounted basis. The movement in deferred and contingent consideration during the financial year was as follows:
| | | | | | | | |
| 2022 | 2021 |
| $m | $m |
At 1 January | 361 | 364 |
Translation adjustment | (1) | (1) |
Arising on acquisitions and investments during year (note 30) | 14 | 1 |
Changes in estimate | (33) | 10 |
Paid during year | (32) | (33) |
| Discount unwinding | 20 | 20 |
At 31 December | 329 | 361 |
| | |
| | | | | |
| 2022 Annual Report and Form 20-F | 217 |
19. Movement in Inventories, Receivables, Payables and Provisions | | | | | | | | | | | | | | | | | |
| | | | | |
Inventories | Trade and other receivables | Trade and other payables | Provisions for liabilities |
Total |
$m | $m | $m | $m | $m |
At 1 January 2022 | 3,611 | 4,808 | (6,409) | (1,416) | 594 |
Translation adjustment | (122) | (183) | 236 | 69 | - |
Arising on acquisition (note 30) | 375 | 227 | (195) | (19) | 388 |
| Disposals | (325) | (295) | 214 | (10) | (416) |
Deferred and contingent acquisition consideration: | | | | | |
- arising on acquisitions during year (note 30) | - | - | (14) | - | (14) |
- paid during year | - | - | 32 | - | 32 |
Deferred divestment consideration: | | | | | |
| | | | | |
- received during year | - | (52) | - | - | (52) |
| | | | | |
Interest accruals and discount unwinding | - | 19 | (37) | (16) | (34) |
| | | | | |
Additions to leased mineral reserves | - | - | (10) | - | (10) |
Increase/(decrease) in inventories, receivables, payables and provisions | 655 | 209 | (380) | 34 | 518 |
At 31 December 2022 | 4,194 | 4,733 | (6,563) | (1,358) | 1,006 |
| | | | | |
The equivalent disclosure for the prior years is as follows: | | | | | |
| | | | | |
At 1 January 2021 | 3,117 | 4,411 | (5,503) | (1,442) | 583 |
Translation adjustment | (84) | (102) | 147 | 37 | (2) |
Arising on acquisition (note 30) | 157 | 191 | (143) | (1) | 204 |
| Disposals | (22) | (20) | 11 | 6 | (25) |
Deferred and contingent acquisition consideration: | | | | | |
- arising on acquisitions during year (note 30) | - | - | (1) | - | (1) |
- paid during year | - | - | 33 | - | 33 |
Deferred divestment consideration: | | | | | |
- arising on disposals during year | - | 1 | - | - | 1 |
- received during year | - | (120) | - | - | (120) |
| Shares to be acquired by CRH plc (Treasury Shares) (note 29) | - | - | (281) | - | (281) |
Interest accruals and discount unwinding | - | 11 | (7) | (18) | (14) |
| Reclassification | 4 | - | (6) | - | (2) |
Additions to leased mineral reserves | - | - | (10) | - | (10) |
| Increase/(decrease) in inventories, receivables, payables and provisions | 439 | 436 | (649) | 2 | 228 |
At 31 December 2021 | 3,611 | 4,808 | (6,409) | (1,416) | 594 |
| | | | | |
At 1 January 2020 | 3,080 | 4,587 | (5,461) | (1,302) | 904 |
Translation adjustment | 71 | 107 | (150) | (43) | (15) |
Arising on acquisition (note 30) | 23 | 47 | (21) | - | 49 |
| Disposals | (14) | (37) | 17 | 5 | (29) |
Deferred and contingent acquisition consideration: | | | | | |
- arising on acquisitions during year (note 30) | - | - | (7) | - | (7) |
- paid during year | - | - | 54 | - | 54 |
| Deferred divestment consideration: | | | | | |
| - arising on disposals during year | - | 14 | - | - | 14 |
| - received during year | - | (123) | - | - | (123) |
Interest accruals and discount unwinding | - | 4 | (24) | (21) | (41) |
| Reclassification | 20 | (11) | (22) | - | (13) |
Additions to leased mineral reserves | - | - | (14) | - | (14) |
| (Decrease)/increase in inventories, receivables, payables and provisions | (63) | (177) | 125 | (81) | (196) |
At 31 December 2020 | 3,117 | 4,411 | (5,503) | (1,442) | 583 |
| | | | | |
| 2022 Annual Report and Form 20-F | 218 |
20. Leases
| | | | | | | | | | | | | | |
| Land and buildings | Plant and machinery | Other | Total |
Leased right-of-use assets | $m | $m | $m | $m |
At 31 December 2022 | | | | |
Cost | 1,302 | 609 | 64 | 1,975 |
Accumulated depreciation (and impairment charges) | (372) | (307) | (38) | (717) |
Net carrying amount | 930 | 302 | 26 | 1,258 |
At 1 January 2022, net carrying amount | 1,195 | 313 | 56 | 1,564 |
Translation adjustment | (35) | (13) | (3) | (51) |
| Transfer to owned assets | - | (5) | - | (5) |
Additions at cost | 41 | 101 | 12 | 154 |
Arising on acquisition (note 30) | 96 | 10 | 1 | 107 |
Disposals at net carrying amount | (289) | (9) | (27) | (325) |
Adjustment as a result of remeasurement of lease liability | 41 | 17 | 3 | 61 |
Depreciation charge for year (i) | (119) | (112) | (16) | (247) |
At 31 December 2022, net carrying amount | 930 | 302 | 26 | 1,258 |
The equivalent disclosure for the prior year is as follows: | | | | |
At 31 December 2021 | | | | |
Cost | 1,573 | 581 | 105 | 2,259 |
Accumulated depreciation (and impairment charges) | (378) | (268) | (49) | (695) |
Net carrying amount | 1,195 | 313 | 56 | 1,564 |
At 1 January 2021, net carrying amount | 1,151 | 342 | 57 | 1,550 |
Translation adjustment | (24) | (9) | (1) | (34) |
| Transfer to owned assets | - | (10) | - | (10) |
Additions at cost | 96 | 92 | 22 | 210 |
Arising on acquisition (note 30) | 77 | 11 | - | 88 |
Disposals at net carrying amount | (12) | (5) | (1) | (18) |
Adjustment as a result of remeasurement of lease liability | 45 | 9 | 2 | 56 |
Depreciation charge for year (i) | (138) | (117) | (23) | (278) |
At 31 December 2021, net carrying amount | 1,195 | 313 | 56 | 1,564 |
At 1 January 2021 | | | | |
Cost | 1,419 | 553 | 97 | 2,069 |
Accumulated depreciation | (268) | (211) | (40) | (519) |
Net carrying amount | 1,151 | 342 | 57 | 1,550 |
(i)The depreciation charge includes $11 million (2021: $34 million; 2020: $33 million) relating to discontinued operations.
| | | | | |
| 2022 Annual Report and Form 20-F | 219 |
| | | | | | | | | | | | | | |
| Land and buildings | Plant and machinery | Other | Total |
| Lease liabilities | $m | $m | $m | $m |
At 1 January 2022 | 1,296 | 319 | 56 | 1,671 |
Translation adjustment | (41) | (14) | (2) | (57) |
Addition of right-of-use assets | 41 | 101 | 12 | 154 |
Arising on acquisition (note 30) | 96 | 10 | 1 | 107 |
| Disposals | (332) | (8) | (28) | (368) |
| Remeasurements | 41 | 17 | 3 | 61 |
| Payments | (147) | (132) | (18) | (297) |
| Discount unwinding (ii) | 38 | 8 | 2 | 48 |
At 31 December 2022 | 992 | 301 | 26 | 1,319 |
| | | | |
| The equivalent disclosure for the prior year is as follows: | | | | |
| | | | |
At 1 January 2021 | 1,228 | 350 | 57 | 1,635 |
Translation adjustment | (24) | (9) | (1) | (34) |
Addition of right-of-use assets | 96 | 92 | 22 | 210 |
Arising on acquisition (note 30) | 77 | 11 | - | 88 |
| Disposals | (14) | (5) | (1) | (20) |
| Remeasurements | 45 | 9 | 2 | 56 |
| Payments | (164) | (139) | (25) | (328) |
| Discount unwinding (ii) | 52 | 10 | 2 | 64 |
At 31 December 2021 | 1,296 | 319 | 56 | 1,671 |
(ii)Discount unwinding includes $6 million (2021: $18 million; 2020: $19 million) relating to discontinued operations.
The table below shows a maturity analysis of the discounted and undiscounted lease liability arising from the Group’s leasing activities. The projections are based on the foreign exchange rates applying at the end of the relevant financial year and on interest rates (discounted projections only) applicable to the lease portfolio.
| | | | | | | | | | | | | | |
| As at 31 December 2022 | As at 31 December 2021 |
| Discounted | Undiscounted | Discounted | Undiscounted |
| $m | $m | $m | $m |
Within one year | 260 | 263 | 297 | 302 |
Between one and two years | 196 | 205 | 241 | 254 |
Between two and three years | 154 | 166 | 190 | 208 |
Between three and four years | 121 | 135 | 154 | 175 |
Between four and five years | 92 | 106 | 126 | 150 |
After five years | 496 | 798 | 663 | 1,099 |
| Total | 1,319 | 1,673 | 1,671 | 2,188 |
| | | | | |
| 2022 Annual Report and Form 20-F | 220 |
20. Leases continued
The Group avails of the exemption from capitalising lease costs for short-term leases and low-value assets where the relevant criteria are met. Variable lease payments directly linked to sales or usage are also expensed as incurred. The following lease costs have been charged to the Consolidated Income Statement as incurred:
| | | | | | | | |
| 2022 | 2021 |
Continuing operations | $m | $m |
Short-term leases | 273 | 239 |
Lease of low-value assets | 11 | 8 |
Variable lease payments not included in the lease liability | 94 | 97 |
| Total | 378 | 344 |
Total cash outflow for lease payments | 675 | 674 |
Lease commitments for short-term leases are similar to the portfolio of short-term leases for which the costs, as above, were expensed to the Consolidated Income Statement. The effect of excluding future cash outflows arising from variable lease payments, termination options, residual value guarantees and leases not yet commenced from lease liabilities was not material for the Group. The potential undiscounted future cash outflows arising from the exercise of renewal options that are not expected to be exercised (and are therefore not included in the lease term) are as follows:
| | | | | | | | |
| As at | As at |
31 December | 31 December |
| 2022 | 2021 |
$m | $m |
Within one year | 5 | 4 |
Between one and two years | 4 | 5 |
Between two and three years | 6 | 6 |
Between three and four years | 6 | 8 |
Between four and five years | 5 | 8 |
After five years | 296 | 568 |
| Total | 322 | 599 |
Income from subleasing and gains/losses on sale and leaseback transactions were not material for the Group.
| | | | | |
| 2022 Annual Report and Form 20-F | 221 |
21. Analysis of Net Debt
Components of net debt
Net debt comprises cash and cash equivalents, interest-bearing loans and borrowings, lease liabilities and derivative financial instrument assets and liabilities; it enables investors to see the economic effects of these in total (see note 22 for details of the capital and risk management policies employed by the Group). Net debt is commonly used in computations such as net debt as a % of total equity and net debt as a % of market capitalisation.
| | | | | | | | | | | | | | | | | |
| As at 31 December 2022 | | As at 31 December 2021 |
| Book value | Fair value | | Book value | Fair value |
| $m | $m | | $m | $m |
Cash and cash equivalents (note 23) | 5,936 | 5,936 | | 5,783 | 5,783 |
Interest-bearing loans and borrowings (note 24) (i) | (9,636) | (9,001) | | (10,487) | (11,340) |
Lease liabilities (note 20) | (1,319) | (1,319) | | (1,671) | (1,671) |
Derivative financial instruments (net) (note 25) | (86) | (86) | | 122 | 122 |
Group net debt | (5,105) | (4,470) | | (6,253) | (7,106) |
(i) Interest-bearing loans and borrowings are Level 2 instruments whose fair value is derived from quoted market prices.
| | | | | | | | | | | | | | | | | | | | | | | |
| Reconciliation of opening to closing net debt | | | | | Mark-to- | | |
| | | Movement | Movement | market | | |
| At 1 | | attributable | attributable | and other | | At 31 |
| January | | to acquired | to disposed | non-cash | Translation | December |
| Book value | Cash flow | companies | companies | adjustments | adjustment | Book value |
| 31 December 2022 | $m | $m | $m | $m | $m | $m | $m |
Cash and cash equivalents | 5,783 | 393 | 22 | (31) | - | (231) | 5,936 |
| | | | | | | |
Interest-bearing loans and borrowings | (10,487) | 326 | (8) | 6 | 159 | 368 | (9,636) |
Lease liabilities | (1,671) | 249 | (107) | 342 | (189) | 57 | (1,319) |
Derivative financial instruments - financing | 122 | 11 | - | - | (194) | (9) | (70) |
| Liabilities from financing activities | (12,036) | 586 | (115) | 348 | (224) | 416 | (11,025) |
| Derivative financial instruments - non-financing | - | (58) | - | - | 38 | 4 | (16) |
Group net debt | (6,253) | 921 | (93) | 317 | (186) | 189 | (5,105) |
| | | | | | | |
| The equivalent disclosure for the prior years is as follows: | | | | | | | |
| | | | | | | |
| 31 December 2021 | | | | | | | |
Cash and cash equivalents | 7,721 | (1,617) | 7 | (31) | - | (297) | 5,783 |
Interest-bearing loans and borrowings | (12,215) | 1,183 | (3) | - | 90 | 458 | (10,487) |
Lease liabilities | (1,635) | 264 | (88) | 3 | (249) | 34 | (1,671) |
Derivative financial instruments (net) | 188 | 37 | - | - | (52) | (51) | 122 |
Group net debt | (5,941) | (133) | (84) | (28) | (211) | 144 | (6,253) |
| | | | | | | |
| 31 December 2020 | | | | | | | |
Cash and cash equivalents (ii) | 4,218 | 3,172 | - | (7) | - | 338 | 7,721 |
Interest-bearing loans and borrowings (ii) | (10,127) | (1,484) | - | - | (80) | (524) | (12,215) |
Lease liabilities | (1,697) | 258 | (12) | 12 | (153) | (43) | (1,635) |
Derivative financial instruments (net) | 74 | (26) | - | - | 102 | 38 | 188 |
Group net debt | (7,532) | 1,920 | (12) | 5 | (131) | (191) | (5,941) |
| | | | | | | |
(ii) For the purposes of the Consolidated Statement of Cash Flows, cash and cash equivalents and bank overdrafts in notional cash pooling arrangements are presented net.
| | | | | |
| 2022 Annual Report and Form 20-F | 222 |
21. Analysis of Net Debt continued
The following table shows the effective interest rates on period-end fixed and gross debt:
| | | | | | | | | | | | | | | | | | | | | | | |
| As at 31 December 2022 | | As at 31 December 2021 |
| | Interest | Weighted average fixed period | | | Interest | Weighted average fixed period |
| $m | rate | Years | | $m | rate | Years |
Interest-bearing loans and borrowings nominal - fixed rate (i) | (9,398) | | | | (10,052) | | |
Derivative financial instruments - fixed rate | 1,775 | | | | 1,800 | | |
Net fixed rate debt including derivatives | (7,623) | 3.1 | % | 8.1 | | (8,252) | 2.9 | % | 8.6 |
Interest-bearing loans and borrowings nominal - floating rate (ii) | (280) | | | | (317) | | |
Cumulative fair value hedge adjustment (i) | 42 | | | | (118) | | |
Derivative financial instruments - floating rate (i) | (1,775) | | | | (1,800) | | |
Derivative financial instruments (net) - fair value | (86) | | | | 122 | | |
Gross debt including derivative financial instruments, excluding lease liabilities | (9,722) | 3.5 | % | | | (10,365) | 2.8 | % | |
Lease liabilities - fixed rate | (1,319) | | | | (1,671) | | |
Gross debt including derivative financial instruments, including lease liabilities | (11,041) | | | | (12,036) | | |
Cash and cash equivalents - floating rate (note 23) | 5,936 | | | | 5,783 | | |
Group net debt | (5,105) | | | | (6,253) | | |
(i)Of the Group’s nominal fixed rate debt at 31 December 2022, $1,775 million (2021: $1,800 million) is hedged to a mix of USD LIBOR and EURIBOR floating rates using interest rate swaps.
(ii)Floating rate debt comprises bank borrowings bearing interest at rates set in advance for periods ranging from overnight to less than one year largely by reference to inter-bank interest rates.
| | | | | |
| 2022 Annual Report and Form 20-F | 223 |
Currency profile
The currency profile of the Group’s net debt and net worth (capital and reserves attributable to the Company’s equity holders) as at 31 December 2022 and 31 December 2021 is as follows:
| | | | | | | | | | | | | | | | | | | | | | | | | | | | | |
| US Dollar | euro | Pound Sterling | Canadian Dollar | Philippine Peso | Polish Zloty | Swiss Franc | Other (i) | Total |
| 31 December 2022 | $m | $m | $m | $m | $m | $m | $m | $m | $m |
Cash and cash equivalents (note 23) | 2,309 | 2,334 | 523 | 210 | 24 | 194 | 57 | 285 | 5,936 |
Interest-bearing loans and borrowings (note 24) | (4,508) | (4,213) | (482) | (3) | (419) | - | - | (11) | (9,636) |
Lease liabilities (note 20) | (650) | (227) | (204) | (99) | (6) | (48) | (42) | (43) | (1,319) |
Derivative financial instruments (net) (note 25) | (23) | 1,443 | (391) | (291) | (34) | (258) | (128) | (404) | (86) |
Net debt by major currency including derivative financial instruments | (2,872) | (663) | (554) | (183) | (435) | (112) | (113) | (173) | (5,105) |
| Non-debt assets and liabilities analysed as follows: | | | | | | | | | |
Non-current assets | 18,849 | 3,690 | 2,295 | 1,658 | 1,456 | 399 | 535 | 1,502 | 30,384 |
Current assets | 4,740 | 1,496 | 1,065 | 545 | 231 | 193 | 85 | 471 | 8,826 |
Non-current liabilities | (3,136) | (656) | (315) | (209) | (113) | (18) | (154) | (80) | (4,681) |
Current liabilities | (3,065) | (1,634) | (1,185) | (330) | (194) | (211) | (87) | (381) | (7,087) |
Non-controlling interests | (126) | (41) | - | - | (444) | (2) | (8) | (25) | (646) |
Capital and reserves attributable to the Company’s equity holders | 14,390 | 2,192 | 1,306 | 1,481 | 501 | 249 | 258 | 1,314 | 21,691 |
| | | | | | | | | |
| The equivalent disclosure for the prior year is as follows: | | | | | | | | | |
| | | | | | | | | |
| 31 December 2021 | | | | | | | | | |
Cash and cash equivalents (note 23) | 2,266 | 2,386 | 365 | 274 | 19 | 166 | 103 | 204 | 5,783 |
Interest-bearing loans and borrowings (note 24) | (4,665) | (4,479) | (537) | (3) | (431) | - | (361) | (11) | (10,487) |
Lease liabilities (note 20) | (856) | (250) | (255) | (150) | (8) | (54) | (47) | (51) | (1,671) |
Derivative financial instruments (net) (note 25) | 189 | 1,463 | (339) | (606) | (91) | (184) | - | (310) | 122 |
Net debt by major currency including derivative financial instruments | (3,066) | (880) | (766) | (485) | (511) | (72) | (305) | (168) | (6,253) |
| Non-debt assets and liabilities analysed as follows: | | | | | | | | | |
Non-current assets | 17,661 | 4,204 | 2,614 | 1,844 | 1,621 | 371 | 608 | 1,606 | 30,529 |
Current assets | 4,369 | 1,498 | 993 | 564 | 176 | 161 | 84 | 377 | 8,222 |
Non-current liabilities | (3,115) | (714) | (431) | (213) | (132) | (19) | (168) | (71) | (4,863) |
Current liabilities | (2,866) | (1,593) | (1,156) | (348) | (153) | (178) | (83) | (344) | (6,721) |
Non-controlling interests | (105) | (45) | - | - | (498) | - | (8) | (25) | (681) |
Capital and reserves attributable to the Company’s equity holders | 12,878 | 2,470 | 1,254 | 1,362 | 503 | 263 | 128 | 1,375 | 20,233 |
(i)The principal currencies included in this category are Chinese Renminbi, Romanian Leu, Ukrainian Hryvnia, Serbian Dinar and Swedish Krona.
| | | | | |
| 2022 Annual Report and Form 20-F | 224 |
21. Analysis of Net Debt continued
Liquidity and capital resources
The following table provides certain information related to our cash generation and changes in our cash and cash equivalents position:
| | | | | | | | | | | |
| 2022 | 2021 | 2020 |
| $m | $m | $m |
Net cash inflow from operating activities | 3,954 | 4,210 | 3,938 |
Net cash outflow from investing activities | (884) | (2,546) | (1,060) |
Net cash (outflow)/inflow from financing activities | (2,686) | (3,305) | 287 |
Increase/(decrease) in cash and cash equivalents | 384 | (1,641) | 3,165 |
Cash and cash equivalents at beginning of year (note 23) | 5,783 | 7,721 | 4,218 |
Effect of exchange rate changes | (231) | (297) | 338 |
Cash and cash equivalents at end of year (note 23) | 5,936 | 5,783 | 7,721 |
| | | |
| Derivative financial instruments - non-financing | (16) | - | - |
| | | |
Lease liabilities | (1,319) | (1,671) | (1,635) |
Bank overdrafts | (94) | (111) | (120) |
| Borrowings | (9,542) | (10,376) | (12,095) |
Derivative financial instruments - financing | (70) | 122 | 188 |
Total liabilities from financing activities | (11,025) | (12,036) | (13,662) |
Net debt at end of year | (5,105) | (6,253) | (5,941) |
The Group believes that its financial resources (operating cash together with cash and cash equivalents of $5.9 billion and undrawn committed loan facilities of $3.7 billion) is sufficient to cover the Group’s cash requirements.
At 31 December 2022, US Dollar and euro denominated cash and cash equivalents represented 39% (2021: 39%) and 39% (2021: 41%) of total cash and cash equivalents respectively.
Significant borrowings
The main sources of Group debt funding are public bond markets in Europe and North America. The following external bonds were outstanding as at 31 December 2022:
| | | | | | | | | | | | | | |
| Annual coupons | Outstanding (millions) | Final maturity | Hedged to floating rate (millions) |
euro bonds | 3.125 | % | €750 | 2023 | €375 |
euro bonds | 0.875 | % | €500 | 2023 | - |
euro bonds | 1.875 | % | €600 | 2024 | - |
| US Dollar bonds | 3.875 | % | $1,250 | 2025 | $875 |
euro bonds | 1.250 | % | €750 | 2026 | - |
| US Dollar bonds | 3.400 | % | $600 | 2027 | - |
| US Dollar bonds | 3.950 | % | $900 | 2028 | $500 |
euro bonds | 1.375 | % | €600 | 2028 | - |
Pound Sterling bonds | 4.125 | % | £400 | 2029 | - |
euro bonds | 1.625 | % | €750 | 2030 | - |
US Dollar bonds (i) | 6.400 | % | $213 | 2033 | - |
| US Dollar bonds | 5.125 | % | $500 | 2045 | - |
| US Dollar bonds | 4.400 | % | $400 | 2047 | - |
| US Dollar bonds | 4.500 | % | $600 | 2048 | - |
(i)The $300 million bond was issued in September 2003, and at the time of issuance the bond was partially swapped to floating interest rates. In August 2009 and December 2010, $87 million of the issued notes were acquired by CRH plc as part of liability management exercises undertaken and the interest rate hedge was closed out. At 31 December 2022, the remaining fair value hedge adjustment on the hedged item on the Consolidated Balance Sheet was $33 million (2021: $35 million).
| | | | | |
| 2022 Annual Report and Form 20-F | 225 |
22. Capital and Financial Risk Management
Capital management
Overall summary
The primary objectives of CRH’s capital management strategy are to ensure that the Group maintains a strong credit rating to support its business and to create shareholder value by managing the debt and equity balance and the cost of capital. The Group is committed to optimising the use of its balance sheet within the confines of the overall objective to maintain an investment grade credit rating.
The capital structure of the Group, which comprises net debt and capital and reserves attributable to the Company’s equity holders, may be summarised as follows:
| | | | | | | | |
| 2022 | 2021 |
| $m | $m |
| Capital and reserves attributable to the Company’s equity holders | 21,691 | 20,233 |
| Net debt | 5,105 | 6,253 |
| Capital and net debt | 26,796 | 26,486 |
The Board periodically reviews the capital structure of the Group, including the cost of capital and the risks associated with each class of capital. The Group manages and, if necessary, adjusts its capital structure taking account of underlying economic conditions; any material adjustments to the Group’s capital structure in terms of the relative proportions of debt and equity are approved by the Board. In order to maintain or adjust the capital structure, the Group may issue new shares, dispose of assets, amend investment plans, alter dividend policy or return capital to shareholders.
Dividend cover for the year ended 31 December 2022 amounted to 4x; on a continuing basis 2.8x (2021: 2.7x; on a continuing basis 2.5x; 2020: 1.2x; on a continuing basis 1.1x).
No changes were made in the objectives or policies during 2022.
Financial risk management objectives and policies
The Group uses financial instruments throughout its businesses: interest-bearing loans and borrowings, cash and cash equivalents and leases are used to finance the Group’s operations; trade receivables and trade payables arise directly from operations; and derivatives, principally interest rate and currency swaps and currency forwards, are used to manage interest rate risks and currency exposures and to achieve the desired profile of borrowings.
In accordance with the UK Financial Conduct Authority’s announcement on 5 March 2021, LIBOR benchmark rates were discontinued after 31 December 2022 except for certain US Dollar settings which will be discontinued after 30 June 2023. Those rates that were discontinued were replaced by alternative risk-free rates (ARR) as part of the inter-bank offer rate (IBOR) reform.
The Group prepared an action plan, encompassing treasury, legal, accounting and IT functions, to enable a smooth transition to the alternative benchmark rates. The review identified a range of contracts that reference IBORs, including credit facilities, derivative instruments, money market deposits, lease agreements, and supply contract agreements. Action plans were developed for each of these arrangements to ensure a smooth transition to ARR. None of the changes had an impact on the Group’s financing or interest rate hedging strategies, nor did they have a material financial impact.
At 31 December 2022, the notional value of hedging instruments that reference 3-month US LIBOR is $1.4 billion. Whilst the Secured Overnight Financing Rate (SOFR) benchmark rate has been widely adopted by market participants and effectively replaced US LIBOR in new contracts since 31 December 2022, a number of US LIBOR settings, including 3-month and 6-month US LIBOR, will continue to be published until 30 June 2023. Accordingly, absent any agreement with counterparties to transition to an ARR before this date, the Group’s existing USD denominated interest rate swaps with maturity dates beyond 30 June 2023 will only transition to ARR once US LIBOR publication ceases. As at 31 December 2022, the Group has not transitioned any of its existing USD denominated interest rate swaps to ARRs. The Group’s other interest rate swaps reference EURIBOR rates and thus are not impacted by the IBOR reforms.
The Group does not trade in financial instruments nor does it enter into any leveraged derivative transactions.
The Group’s corporate treasury function provides services to the business units, coordinates access to domestic and international financial markets, and monitors and manages the financial risks relating to the operations of the Group. The Group Treasurer reports to the Head of Group Finance and the activities of the corporate treasury function are subject to regular internal audit. Systems and processes are in place to monitor and control the Group’s liquidity risks. The Group’s net debt position forms part of the monthly documentation presented to the Board.
The Group’s hedging activity is based on observable economic relationships, when there is confidence that such relationships will continue for the foreseeable future. Matching critical terms such as notional amount, tenor, timing and currency, the Group establishes relationships between a hedged item and hedging instrument where directional response to changes in fair value, driven by underlying economic conditions, are opposing and proportional in equal measure being an economic relationship under IFRS 9. Hedging ratios of 1:1 are used throughout all hedging activity as the hedged item and hedging instrument are of the same type and currency. The hedges employed mitigate identified risks and have consistently demonstrated close economic relationships. Ineffectiveness between the hedged item and hedging instrument are immaterial in the overall context of the Group.
The main risks attaching to the Group’s financial instruments are interest rate risk, foreign currency risk, credit risk, liquidity risk and commodity price risk. The Board reviews and agrees policies for the prudent management of each of these risks as documented below.
Interest rate risk
The Group’s exposure to market risk for changes in interest rates stems predominantly from its long-term debt obligations. Interest cost is managed using a mix of fixed and floating rate debt. With the objective of managing this mix in a cost-efficient manner, the Group enters into interest rate swaps, under which the Group contracts to exchange, at predetermined intervals, the difference between fixed and variable interest amounts calculated by reference to a pre-agreed notional principal. Such contracts enable the Group to mitigate the risk of changing interest rates on the fair value of issued fixed rate debt and the cash flow exposures of issued floating rate debt.
These swaps are designated under IFRS 9 to hedge underlying debt obligations and qualify for hedge accounting treatment.
The Group applies hedge accounting where there is an economic relationship between the hedged item and the hedging instrument. The existence of an economic relationship is determined initially by comparing the critical terms of the hedging instrument and those of the hedged item and it is prospectively assessed using linear regression analysis. The Group issues fixed rate debt and may enter into interest rate swaps with critical terms that match those of the debt and on a 1:1 hedge ratio basis. The hedge ratio is determined by comparing the notional amount of the derivative with the notional amount of the debt. The hedge relationship is designated for the full term and notional value of the debt.
| | | | | |
| 2022 Annual Report and Form 20-F | 226 |
22. Capital and Financial Risk Management continued
Whilst interest rate increases observed in the markets in which the Group operates were in the range of 2%-4.5% during 2022, the following table demonstrates the impact on profit before tax as a result of incremental changes of 1% in the interest rates applicable to floating rate net debt, which operate in a linear manner, with all other variables held constant. These impacts are calculated based on the closing balance sheet floating rate net debt for a full year and assume that all floating interest rates change by the same amount.
| | | | | | | | |
| Percentage change in cost of borrowings (i) | | +/-1% |
| Impact on profit before tax | 2022 | +/-$38m |
| 2021 | +/-$38m |
| 2020 | +/-$59m |
(i) Sensitivity analysis for cost of borrowing has been presented for continuing operations only.
Foreign currency risk
Due to the nature of building materials, which in general have a low value-to-weight ratio, the Group’s activities are conducted primarily in the local currency of the country of operation resulting in low levels of foreign currency transaction risk; variances arising in this regard are reflected in operating costs or cost of sales in the Consolidated Income Statement in the period in which they arise.
Given the Group’s presence in 29 countries worldwide, the principal foreign exchange risk arises from fluctuations in the US Dollar value of the Group’s net investment in a wide basket of currencies other than the US Dollar; such changes are reported separately within the Consolidated Statement of Comprehensive Income. A currency profile of the Group’s net debt and net worth is presented in note 21. The Group’s established policy is to spread its net worth across the currencies of its various operations with the objective of limiting its exposure to individual currencies and thus promoting consistency with the geographical balance of its operations. In order to achieve this objective, the Group manages its borrowings, where practicable and cost effective, to act as a natural foreign currency hedge of a portion of its foreign currency assets.
The Group’s foreign exchange hedging strategy and activity is based on the assumption that changes in international economic factors are reflected in current foreign exchange rates and impact the translation of the Group’s non-euro net assets (euro being the functional currency of the ultimate parent company). The economic relationship, being the translation impact of the Group’s net investment in non-euro subsidiaries (hedged item) is hedged against a foreign currency swap (hedging instrument) to counterbalance movements in foreign currency rates. The Group identifies certain portions of foreign currency net investments where foreign currency translation movements can be mitigated through the use of currency swaps in the same currency pairing. A hedge ratio of 1:1 is established. As at 31 December 2022, the notional amount of hedged net investments was $1,145 million (2021: $726 million). The primary currency pairs in use are euro versus Canadian Dollar, Pound Sterling, Romanian Leu, Polish Zloty and Danish Kroner. The fair value movements of the hedging instruments are inverse to the impact of the translation of the hedged net assets because the critical terms match. This reduces the Group’s exposure to fluctuations on the translation of the Group’s subsidiaries with a non-euro functional currency into euro. Potential sources of ineffectiveness are changes in the interest rate differentials of the hedged currency pairs, recorded through the Consolidated Income Statement. Past trends indicate that the economic relationship described will continue for the foreseeable future. The fair values and maturity analysis of the hedging instruments are set out in note 25. Undesignated financial instruments are termed “not designated as hedges”.
Whilst foreign exchange volatility observed in the markets in which the Group operates was in the range of +/-10% during 2022, the following table demonstrates the sensitivity of profit before tax and equity to incremental movements of 5% in the relevant US Dollar/euro exchange rate, which operate in a linear manner, with all other variables held constant. The euro has been selected as the appropriate currency for this analysis given the materiality of the Group’s activities in euro. The impact on profit before tax is based on changing the US Dollar/euro exchange rate used in calculating profit before tax for the period. The impact on total equity and financial instruments is calculated by changing the US Dollar/euro exchange rate used in measuring the closing balance sheet.
| | | | | | | | |
| Percentage change in relevant $/€ exchange rate strengthening/weakening (i) | | +/- 5% |
| Impact on profit before tax | 2022 | -/+$5m |
| 2021 | -/+$22m |
| 2020 | -/+ $19m |
| | |
| Impact on total equity* | 2022 | +/-$110m |
| 2021 | +/-$123m |
| 2020 | +/-$157m |
| | |
* Includes the impact on financial instruments which is as follows: | 2022 | -/+$33m |
| 2021 | -/+$44m |
| 2020 | -/+$27m |
(i) Sensitivity analysis for exchange rates has been presented for continuing operations only.
Financial instruments include deposits, money market funds, commercial paper, bank loans, medium-term notes and other fixed term debt, interest rate swaps, commodity swaps and foreign exchange contracts. They exclude trade receivables and trade payables on the basis that they are denominated in the currency of the underlying operations. The Group minimises the impact of movements in foreign exchange rates on the Group’s income statement through matching where possible, foreign currency monetary assets and liabilities or the use of derivative contracts at an entity level.
Credit/counterparty risk
In addition to cash at bank and in hand, the Group holds significant cash balances which are invested on a short-term basis and are classified as cash equivalents (see note 23). These deposits, investments and other financial instruments (principally certain derivatives and loans and receivables included within financial assets) give rise to credit risk on amounts due from counterparty financial institutions (stemming from their insolvency or a downgrade in their credit ratings). Credit risk is managed by limiting the aggregate amount and duration of exposure to any one counterparty primarily depending on its credit rating and by regular review of these ratings and internal treasury policies.
Acceptable credit ratings for deposits and other financial instruments are higher investment-grade ratings—in general, counterparties have ratings of A3/A-/A- or higher from at least two of Moody’s/ Standard & Poor’s/Fitch ratings agencies. The maximum exposure arising in the event of default on the part of the counterparty (including insolvency) is the carrying value of the relevant financial instrument.
Credit rating of counterparty (Moody’s/Standard & Poor’s/Fitch)
| | | | | | | | | | | | | | | | | |
| As at 31 December 2022 | | As at 31 December 2021 |
| $m | % | | $m | % |
| Aaa/AAA/AAA | 279 | 5 | % | | 2,021 | 35 | % |
| Aa/AA/AA | 2,194 | 37 | % | | 2,394 | 41 | % |
| A/A/A | 3,199 | 54 | % | | 1,216 | 21 | % |
Baa/BBB/BBB or lower | 264 | 4 | % | | 152 | 3 | % |
| 5,936 | 100 | % | | 5,783 | 100 | % |
Money market liquidity funds are managed by external third-party fund managers to maintain Aaa/AAA long-term ratings and P1/A1 short-term ratings from Moody’s/Standard & Poor’s. The Group limits its investment in each fund to a prescribed maximum amount or 5% of the fund’s assets under management, whichever is the lower. The Group has a number of managed investment funds that hold fixed income euro securities with an average credit quality of Aaa/AAA. As at 31 December 2022, 95% (2021: 65%) of cash and cash equivalents was held with higher investment grade bank counterparties, and 5% (2021: 35%) with the money market funds.
| | | | | |
| 2022 Annual Report and Form 20-F | 227 |
Credit risk arising in the context of the Group’s operations is not significant with the total loss allowance at the balance sheet date amounting to 3.1% of gross trade receivables and construction contract assets (2021: 3.2%). Information in relation to the Group’s credit risk management of trade receivables is provided in note 17. Amounts receivable from related parties (notes 17 and 32) are immaterial. Factoring arrangements and supplier financing arrangements are employed in certain of the Group’s operations where deemed to be of benefit by operational management and are deemed immaterial.
In its worldwide insurance programme, the Group carries appropriate levels of insurance for typical business risks (including product liability) with various leading insurance companies. However, in the event of the failure of one or more of its insurance counterparties, the Group could be impacted by losses where recovery from such counterparties is not possible.
Liquidity risk
The principal liquidity risks faced by the Group stem from the maturation of debt obligations and derivative transactions. A downgrade of CRH’s credit ratings may give rise to increases in funding costs in respect of future debt and may impair the Group’s ability to raise funds on acceptable terms. The Group’s corporate treasury function ensures that sufficient resources are available to meet such liabilities as they fall due through a combination of cash and cash equivalents, cash flows and undrawn committed bank facilities. Flexibility in funding sources is achieved through a variety of means including (i) maintaining cash and cash equivalents only with a diverse group of highly-rated counterparties; (ii) limiting the annual maturity of such balances; (iii) borrowing the bulk of the Group’s debt requirements under committed bank lines or other term financing; and (iv) having surplus committed lines of credit.
The undrawn committed facilities available to the Group as at the balance sheet date are quantified in note 24; these facilities span a wide number of highly-rated financial institutions thus minimising any potential exposure arising from concentrations in borrowing sources. The repayment schedule (analysed by maturity date) applicable to the Group’s outstanding interest-bearing loans and borrowings as at the balance sheet date is also presented in note 24.
The Group’s €1.5 billion Euro Commercial Paper Programme and $2.0 billion US Dollar Commercial Paper Programme means we have framework programmes in place in the money markets that allow the Group to issue in the relevant markets within a short period of time.
Commodity price risk
The principal commodity price risks are identified in a variety of highly probable and active commodity contracts where a significant part of the price to be paid relies on a reference to specific floating price indices (usually US Dollar) for a specific period. Programmes are in place to hedge the quantities and qualities of commodity products, including fuel oil and related products, electricity and carbon credits. The aim of the programmes is to neutralise the variability in the Consolidated Income Statement as a result of changes in associated commodity indices over a timeframe of approximately two years (2021: four years). A hedge ratio of 1:1 is established. Fixed price swap contracts in the entity’s operating currency are used to hedge the same specific floating index risk and currency risk where it is determined that those risks are better managed at a fixed price rather than being exposed to uncontrollable price fluctuations due to the floating price index element of the contract. Sources of ineffectiveness can relate to timing of cash flows and counterparty credit risk adjustments. The derivative contracts qualify for cash flow hedge accounting under IFRS 9 and the fair values by maturity are set out in note 25.
The notional and fair values in respect of derivative contracts as at 31 December 2022 and 31 December 2021 were as follows:
Profile of commodity products
| | | | | | | | | | | | | | | | | |
| As at 31 December 2022 | | As at 31 December 2021 |
| Notional value | Fair value | | Notional value | Fair value |
| $m | $m | | $m | $m |
| Carbon credits | 435 | (30) | | 10 | - |
| Electricity | 11 | 20 | | 12 | 6 |
| Fuel oil and related products | 94 | (10) | | 64 | 26 |
| 540 | (20) | | 86 | 32 |
| | | | | |
| 2022 Annual Report and Form 20-F | 228 |
22. Capital and Financial Risk Management continued
The tables below show the projected contractual undiscounted total cash outflows (principal and interest) arising from the Group’s trade and other payables, gross debt and derivative financial instruments. The tables also include the gross cash inflows projected to arise from derivative financial instruments. These projections are based on the interest and foreign exchange rates applying at the end of the relevant financial year.
| | | | | | | | | | | | | | | | | | | | | | | |
| Within 1 year | Between 1 and 2 years | Between 2 and 3 years | Between 3 and 4 years | Between 4 and 5 years | After 5 years | Total |
| $m | $m | $m | $m | $m | $m | $m |
At 31 December 2022 | | | | | | | |
| Financial liabilities - cash outflows | | | | | | | |
Trade and other payables | 5,878 | 356 | 29 | 26 | 24 | 521 | 6,834 |
Lease liabilities | 263 | 205 | 166 | 135 | 106 | 798 | 1,673 |
Other interest-bearing loans and borrowings | 1,502 | 696 | 1,253 | 804 | 893 | 4,584 | 9,732 |
Interest payments on other interest-bearing loans and borrowings (i) | 285 | 262 | 234 | 210 | 177 | 1,538 | 2,706 |
| Interest rate swaps - net cash outflows (ii) | 27 | 27 | 16 | 5 | 5 | 3 | 83 |
Currency forwards and currency swaps - gross cash outflows | 1,557 | - | - | - | - | - | 1,557 |
Other derivative financial instruments | 40 | - | - | - | - | - | 40 |
Gross projected cash outflows | 9,552 | 1,546 | 1,698 | 1,180 | 1,205 | 7,444 | 22,625 |
| | | | | | | |
| Derivative financial instruments - cash inflows | | | | | | | |
| | | | | | | |
Currency forwards and currency swaps - gross cash inflows | (1,561) | - | - | - | - | - | (1,561) |
Other derivative financial instruments | (17) | (3) | - | - | - | - | (20) |
Gross projected cash inflows | (1,578) | (3) | - | - | - | - | (1,581) |
| | | | | | | |
| The equivalent disclosure for the prior year is as follows: | | | | | | | |
| | | | | | | |
At 31 December 2021 | | | | | | | |
| Financial liabilities - cash outflows | | | | | | | |
Trade and other payables | 5,697 | 196 | 44 | 202 | 170 | 288 | 6,597 |
Lease liabilities | 302 | 254 | 208 | 175 | 150 | 1,099 | 2,188 |
Other interest-bearing loans and borrowings | 559 | 1,420 | 683 | 1,254 | 853 | 5,666 | 10,435 |
Interest payments on other interest-bearing loans and borrowings (i) | 315 | 286 | 264 | 238 | 214 | 1,715 | 3,032 |
Currency forwards and currency swaps - gross cash outflows | 1,567 | - | - | - | - | - | 1,567 |
Other derivative financial instruments | 1 | - | - | - | - | - | 1 |
Gross projected cash outflows | 8,441 | 2,156 | 1,199 | 1,869 | 1,387 | 8,768 | 23,820 |
| | | | | | | |
| Derivative financial instruments - cash inflows | | | | | | | |
Interest rate swaps - net cash inflows (ii) | (41) | (34) | (32) | (22) | (13) | (20) | (162) |
Currency forwards and currency swaps - gross cash inflows | (1,559) | - | - | - | - | - | (1,559) |
Other derivative financial instruments | (32) | (1) | - | - | - | - | (33) |
Gross projected cash inflows | (1,632) | (35) | (32) | (22) | (13) | (20) | (1,754) |
(i)At 31 December 2022 and 31 December 2021, a portion of the Group’s long-term debt carried variable interest rates. The Group uses the interest rates in effect on 31 December to calculate the interest payments on the long-term debt for the periods indicated.
(ii)The Group uses interest rate swaps to help manage its interest cost. Under these contracts the Group has agreed to exchange at predetermined intervals, the net difference between fixed and variable interest amounts calculated by reference to a pre-agreed notional principal. The Group uses the interest rates in effect on 31 December to calculate the net interest receipts or payments on these contracts.
| | | | | |
| 2022 Annual Report and Form 20-F | 229 |
23. Cash and Cash Equivalents
Cash and cash equivalents balances are spread across a wide number of highly-rated financial institutions. The credit risk attaching to these items is documented in note 22. Cash and cash equivalents are included in the Consolidated Balance Sheet and are analysed as follows:
| | | | | | | | |
| 2022 | 2021 |
| $m | $m |
Cash at bank and in hand | 873 | 925 |
Investments (short-term deposits) | 5,063 | 4,858 |
| Total | 5,936 | 5,783 |
Cash at bank earns/pays interest at floating rates based on daily deposit bank rates. Short-term deposits, which include bank and money market deposits, are made for varying periods of between one day and three months depending on the immediate cash requirements of the Group, earning interest at the respective short-term deposit rates.
Money market deposits are held at fair value through profit and loss and are Level 1 instruments. The fair values of money market deposits are calculated by multiplying the net asset value per share by the investment held at the balance sheet date.
24. Interest-bearing Loans and Borrowings
| | | | | | | | |
| 2022 | 2021 |
| $m | $m |
Bank overdrafts | 94 | 111 |
Bank loans | 420 | 430 |
| Bonds | 9,118 | 9,946 |
| Other Debt | 4 | - |
Interest-bearing loans and borrowings | 9,636 | 10,487 |
Interest-bearing loans and borrowings include borrowings of $nil million (2021: $nil million) secured on specific items of property, plant and equipment.
Maturity profile of loans and borrowings and undrawn committed facilities
| | | | | | | | | | | | | | | | | |
| As at 31 December 2022 | | As at 31 December 2021 |
| Loans and borrowings | Undrawn committed facilities | | Loans and borrowings | Undrawn committed facilities |
| $m | $m | | $m | $m |
Within one year | 1,491 | - | | 549 | 19 |
Between one and two years | 688 | - | | 1,422 | - |
Between two and three years | 1,202 | - | | 676 | - |
Between three and four years | 799 | 3,736 | | 1,277 | - |
Between four and five years | 890 | 9 | | 845 | 3,964 |
After five years | 4,566 | - | | 5,718 | - |
| Total | 9,636 | 3,745 | | 10,487 | 3,983 |
The Group manages its borrowing ability by entering into committed borrowing agreements. Revolving committed bank facilities are generally available to the Group for periods of up to five years from the date of inception. The undrawn committed facilities figures shown in the table above represent the facilities available to be drawn by the Group at 31 December 2022.
In September 2022 the Group repaid a CHF 330 million bond upon maturity. A positive translation adjustment of $0.3 billion and a reduction in cumulative fair value hedge adjustment of $0.2 billion further reduced the bond balance.
At the end of 2021 a number of LIBOR settings ceased to be published (including Sterling and Swiss Franc), while certain US Dollar LIBOR settings will continue to be provided until June 2023. There is no change to the publication of EURIBOR rates. The Group’s syndicated revolving credit facility (undrawn as at 31 December 2022) previously referenced USD LIBOR, GBP LIBOR and CHF LIBOR rates. During 2021 the Group negotiated with its Lenders, amendments to the facility to include market standard LIBOR replacement language. From 1 January 2022 the agreement adopted the Secured Overnight Financing Rate (SOFR), Sterling Overnight Index Average (SONIA) and Swiss Average Rate
Overnight (SARON) as the alternative benchmark rates in respect of USD, GBP and CHF LIBOR rates respectively.
Guarantees
The Company has given letters of guarantee to secure obligations of subsidiary undertakings as follows: $9.3 billion in respect of loans and borrowings, bank advances and derivative obligations (2021: $10.0 billion) and $0.4 billion in respect of letters of credit due within one year (2021: $0.4 billion).
Any Irish registered wholly-owned subsidiary of the Company may avail of the exemption from filing its statutory financial statements for the year ended 31 December 2022 as permitted by section 357 of the Companies Act 2014 and if an Irish registered wholly-owned subsidiary of the Company elects to avail of this exemption, there will be in force an irrevocable guarantee from the Company in respect of all commitments entered into by such wholly-owned subsidiary, including amounts shown as liabilities (within the meaning of section 357 (1) (b) of the Companies Act 2014) in such wholly-owned subsidiary’s statutory financial statements for the year ended 31 December 2022.
| | | | | |
| 2022 Annual Report and Form 20-F | 230 |
25. Derivative Financial Instruments
The fair values of derivative financial instruments are analysed by year of maturity and by accounting designation as follows:
| | | | | | | | | | | | | | | | | |
| Fair value hedges | Cash flow hedges | Net investment hedges | Not designated as hedges | Total |
| $m | $m | $m | $m | $m |
At 31 December 2022 | | | | | |
| Derivative assets | | | | | |
Within one year - current assets | 6 | 17 | 15 | 1 | 39 |
| | | | | |
Between one and two years | - | 3 | - | - | 3 |
Non-current assets | - | 3 | - | - | 3 |
| | | | | |
Total derivative assets | 6 | 20 | 15 | 1 | 42 |
| | | | | |
| Derivative liabilities | | | | | |
Within one year - current liabilities | - | (43) | (8) | - | (51) |
| | | | | |
| | | | | |
| Between two and three years | (47) | - | - | - | (47) |
| | | | | |
After five years | (30) | - | - | - | (30) |
| Non-current liabilities | (77) | - | - | - | (77) |
| | | | | |
Total derivative liabilities | (77) | (43) | (8) | - | (128) |
| | | | | |
Net (liability)/asset arising on derivative financial instruments | (71) | (23) | 7 | 1 | (86) |
The equivalent disclosure for the prior year is as follows: | | | | | |
At 31 December 2021 | | | | | |
| Derivative assets | | | | | |
Within one year - current assets | - | 36 | 1 | 2 | 39 |
| | | | | |
Between one and two years | 20 | 1 | - | - | 21 |
Between three and four years | 32 | - | - | - | 32 |
After five years | 44 | - | - | - | 44 |
Non-current assets | 96 | 1 | - | - | 97 |
| | | | | |
Total derivative assets | 96 | 37 | 1 | 2 | 136 |
Derivative liabilities | | | | | |
Within one year - current liabilities | - | (2) | (10) | (2) | (14) |
| | | | | |
Total derivative liabilities | - | (2) | (10) | (2) | (14) |
| | | | | |
Net asset/(liability) arising on derivative financial instruments | 96 | 35 | (9) | - | 122 |
| | | | | |
| 2022 Annual Report and Form 20-F | 231 |
At 31 December 2022 and 2021, the Group had no master netting or similar arrangements, no collateral posting requirements, or enforceable right of set-off agreements with any of its derivative counterparts.
Fair value hedges consist of interest rate swaps. These instruments hedge risks arising from changes in asset/liability fair values due to interest rate movements.
Cash flow hedges consist of currency forwards, currency swaps, commodity forwards and commodity swaps. These instruments hedge risks arising to future cash flows from movements in foreign exchange rates and commodity prices. Cash flow hedges are expected to affect profit and loss over the period to maturity.
Net investment hedges comprise of currency forwards and currency swaps and hedge changes in the value of net investments due to currency movements.
The profit/(loss) arising on fair value hedges, cash flow hedges, and related hedged items reflected in the Consolidated Income Statement is shown below:
| | | | | | | | | | | |
| 2022 | 2021 | 2020 |
| $m | $m | $m |
Fair value hedges and related hedged items | | | |
Movement in cumulative fair value of the hedge adjustment of hedge instruments | (154) | (85) | 97 |
Movement in cumulative fair value of the hedge adjustment of hedged items | 156 | 87 | (83) |
Components of other comprehensive income - cash flow hedges | | | |
Fair value gain/(loss) arising on hedging instruments: | | | |
| - commodity forwards | 61 | 34 | (2) |
| - currency forwards | 5 | - | 9 |
| Total | 66 | 34 | 7 |
| | | |
| 2022 | 2021 | |
Fair value hierarchy | Level 2 | Level 2 | |
| $m | $m | |
Assets measured at fair value | | | |
Fair value hedges - interest rate swaps | 6 | 96 | |
Cash flow hedges - currency forwards, currency swaps, commodity forwards and commodity swaps | 20 | 37 | |
Net investment hedges - currency forwards and currency swaps | 15 | 1 | |
Not designated as hedges (classified as held for trading) - currency forwards and currency swaps | 1 | 2 | |
Total | 42 | 136 | |
Liabilities measured at fair value | | | |
| Fair value hedges - interest rate swaps | (77) | - | |
Cash flow hedges - currency forwards, currency swaps, commodity forwards and commodity swaps | (43) | (2) | |
Net investment hedges - currency forwards and currency swaps | (8) | (10) | |
Not designated as hedges (classified as held for trading) - currency forwards and currency swaps | - | (2) | |
Total | (128) | (14) | |
At 31 December 2022 and 2021 there were no derivatives valued using Level 1 or Level 3 fair value techniques. | | | |
| | | | | |
| 2022 Annual Report and Form 20-F | 232 |
26. Provisions for Liabilities
| | | | | | | | | | | | | | | | | | | | | | | | | | | | | |
| At 1 January | Translation adjustment | Arising on acquisition (note 30) | Provided during year | Utilised during year | Disposed during year | Reversed unused | Discount unwinding | At 31 December |
| $m | $m | $m | $m | $m | $m | $m | $m | $m |
| 31 December 2022 | | | | | | | | | |
Insurance (i) | 395 | (6) | - | 178 | (108) | - | (44) | 6 | 421 |
Environment and remediation (ii) | 681 | (40) | 17 | 35 | (26) | (10) | (69) | 8 | 596 |
Rationalisation and redundancy (iii) | 21 | (1) | - | 16 | (11) | (2) | (6) | - | 17 |
Other (iv) | 319 | (22) | 2 | 83 | (41) | 22 | (41) | 2 | 324 |
Total | 1,416 | (69) | 19 | 312 | (186) | 10 | (160) | 16 | 1,358 |
Analysed as: | | | | | | | | | |
Non-current liabilities | 937 | | | | | | | | 845 |
Current liabilities | 479 | | | | | | | | 513 |
Total | 1,416 | | | | | | | | 1,358 |
| | | | | | | | | |
The equivalent disclosure for the prior year is as follows: | | | | | | | |
| 31 December 2021 | | | | | | | | | |
Insurance (i) | 349 | (4) | 1 | 137 | (76) | - | (17) | 5 | 395 |
Environment and remediation (ii) | 684 | (18) | - | 49 | (26) | (3) | (15) | 10 | 681 |
Rationalisation and redundancy (iii) | 48 | (1) | - | 29 | (36) | - | (19) | - | 21 |
Other (iv) | 361 | (14) | - | 100 | (63) | (3) | (65) | 3 | 319 |
Total | 1,442 | (37) | 1 | 315 | (201) | (6) | (116) | 18 | 1,416 |
Analysed as: | | | | | | | | | |
| Non-current liabilities | 953 | | | | | | | | 937 |
Current liabilities | 489 | | | | | | | | 479 |
Total | 1,442 | | | | | | | | 1,416 |
(i)This provision relates to obligations arising under the self-insurance components of the Group’s insurance arrangements which comprise employers’ liability (workers’ compensation in the US), public and products liability (general liability in the US), automobile liability, property damage, business interruption and various other insurances; a substantial proportion of the total provision pertains to claims which are classified as “incurred but not reported”. Due to the extended timeframe associated with many of the insurances, a significant proportion of the total provision is subject to periodic actuarial valuation. The projected cash flows underlying the discounting process are established through the application of actuarial triangulations, which are extrapolated from historical claims experience. The triangulations applied in the discounting process indicate that the Group’s insurance provisions have an average life of four years (2021: four years).
(ii)This provision comprises obligations governing site remediation, restoration and environmental works to be incurred in compliance with either local or national environmental regulations together with constructive obligations stemming from established best practice. The value of current obligations is $70 million
(2021: $96 million), whilst $282 million (2021: $310 million) of the total provision will be utilised in the medium-term (two to ten years). The value of legal and constructive obligations applicable to long-lived assets (principally mineral-bearing land) that will unwind over a 30-year timeframe is $244 million (2021: $275 million). In discounting the related obligations, expected future cash outflows have been determined with due regard to extraction status and anticipated remaining life. The discount rates used are consistent with the timing of the expected future cash outflows of the provision and the economic environment of the jurisdiction where the provision will be settled.
(iii)These provisions relate to irrevocable commitments under various rationalisation and redundancy programmes, none of which are individually material to the Group. In 2022 $16 million (2021: $29 million; 2020: $111 million) was provided in respect of rationalisation and redundancy activities as a consequence of undertaking various cost reduction initiatives across all operations. These initiatives included removing excess capacity from manufacturing and distribution networks and scaling operations to match supply and demand. The Group expects that these provisions will primarily be utilised within one to two years of the balance sheet date (2021: one to two years).
(iv)Other provisions primarily relate to legal claims and also include onerous contracts, guarantees and warranties and employee related provisions. The Group expects the majority of these provisions will be utilised within one to five years of the balance sheet date (2021: one to five years); however due to the nature of the legal provisions there is a level of uncertainty in the timing of settlement as the Group generally cannot determine the extent and duration of the legal process.
| | | | | |
| 2022 Annual Report and Form 20-F | 233 |
27. Deferred Income Tax
| | | | | | | | |
The deductible and taxable temporary differences in respect of which deferred tax has been recognised are as follows: |
| 2022 | 2021 |
| $m | $m |
Reported in balance sheet after offset | | |
Deferred tax liabilities | 2,868 | 2,734 |
Deferred tax assets | (88) | (109) |
Net deferred income tax liability | 2,780 | 2,625 |
Deferred income tax assets (deductible temporary differences) | | |
Deficits on Group retirement benefit schemes | 52 | 98 |
Revaluation of derivative financial instruments to fair value | 6 | 4 |
Tax loss carryforwards (primarily income tax losses) | 87 | 93 |
Share-based payment expense | 40 | 54 |
Provisions for liabilities, inventories, receivables and payables | 474 | 446 |
Lease liabilities | 263 | 335 |
Other deductible temporary differences | 79 | 87 |
| Total | 1,001 | 1,117 |
Deferred income tax assets have been recognised in respect of all deductible temporary differences, with the exception of some tax loss carryforwards. The amount of tax losses where recovery is not probable and is therefore not recognised in the Consolidated Balance Sheet is $1.2 billion (2021: $1.2 billion). The vast majority either do not expire based on current tax legislation or they expire post 2027 (2021: 2026). Of the losses not recognised in the Consolidated Balance Sheet, $0.1 billion
(2021: $0.1 billion) expire within five years, $0.2 billion (2021: $0.4 billion) expire post five years and the remainder of losses do not expire.
| | | | | | | | |
Deferred income tax liabilities (taxable temporary differences) | |
Taxable temporary differences principally attributable to accelerated tax depreciation and fair value adjustments arising on acquisition (i) | 3,312 | 3,218 |
Leased right-of-use assets | 250 | 314 |
Investment in subsidiaries | 159 | 164 |
Surpluses on Group retirement benefit schemes | 30 | 9 |
Revaluation of derivative financial instruments to fair value | 10 | 15 |
Rolled-over capital gains | 20 | 22 |
| Total | 3,781 | 3,742 |
Investments in subsidiaries
The aggregate temporary differences in relation to investments in subsidiaries for which deferred tax liabilities have not been recognised is $14.5 billion (2021: $12.1 billion) given the Group is in a position to control the timing of reversal and management’s intention not to unwind these temporary differences. Participation exemptions and tax credits are available in the majority of jurisdictions in which the Group operates. A deferred tax liability has been recognised in respect of any temporary differences relating to investments in subsidiaries expected to unwind in the foreseeable future.
| | | | | | | | |
Movement in net deferred income tax liability | |
At 1 January | 2,625 | 2,484 |
Translation adjustment | (44) | (34) |
Net (income)/expense for the year (ii) | (54) | 103 |
Arising on acquisition (note 30) | 247 | 37 |
| Disposals | (64) | 1 |
Movement in deferred tax recognised in the Consolidated Statement of Comprehensive Income | 77 | 44 |
Movement in deferred tax recognised in the Consolidated Statement of Changes in Equity | (7) | (10) |
At 31 December | 2,780 | 2,625 |
(i)Fair value adjustments arising on acquisition principally relate to property, plant and equipment.
(ii)The net (income)/expense includes income of $74 million (2021: expense of $5 million; 2020: expense of $3 million) relating to discontinued operations.
| | | | | |
| 2022 Annual Report and Form 20-F | 234 |
28. Retirement Benefit Obligations
The Group operates either defined benefit or defined contribution pension schemes in all of its principal operating areas. The disclosures included below relate to all pension schemes in the Group.
The Group operates defined benefit pension schemes in Belgium, Canada, France, Germany, Italy, the Netherlands, the Philippines, the Republic of Ireland, Romania, Serbia, Slovakia, Switzerland, the UK and the US. The Group also operated a defined benefit pension scheme in Brazil which was divested in April 2021. The Group has a mixture of funded and unfunded defined benefit pension schemes. The net surplus of the funded schemes is $221 million (2021: $54 million). Unfunded obligations (including jubilee, post-retirement healthcare obligations and long-term service commitments) comprise of a number of schemes in Canada, France, Germany, Italy, the Netherlands, the Philippines, Romania, Serbia, Slovakia, Switzerland and the US, totalling a net liability of $237 million (2021: $363 million).
Funded defined benefit schemes in the Republic of Ireland, Switzerland and the UK are administered by separate funds that are legally distinct from the Group under the jurisdiction of Trustees. The Trustees are required by law to act in the best interests of the scheme participants and are responsible for the definition of investment strategy and for scheme administration. Other schemes are also administered in line with the local regulatory environment. The level of benefits available to most members depends on length of service and either their average salary over their period of employment or their salary in the final years leading up to retirement. For Switzerland, the level of benefits depends on salary, level of savings contributions, the interest rate on old age accounts (which cannot be negative) and the annuity conversion factor on retirement. The Group’s pension schemes in Switzerland are contribution-based schemes with guarantees to provide further contributions in the event that the plan assets are insufficient to meet the benefit obligations.
Defined benefit pension schemes - principal risks
Through its defined benefit pension and jubilee schemes, long-term service commitments and post-retirement healthcare plans, the Group is exposed to a number of risks, the most significant of which are detailed below:
Asset volatility: Under IAS 19 Employee Benefits, the assets of the Group’s defined benefit pension schemes are reported at fair value (using bid prices, where relevant). The majority of the schemes’ assets comprise equities, bonds and property, all of which may fluctuate significantly in value from period to period including from fluctuations arising in respect of climate change and associated risks and uncertainties. Given that liabilities are discounted to present value based on bond yields and that bond prices are inversely related to yields, an increase in the liability discount rate (which would reduce liabilities) would reduce bond values, though not necessarily by an equal magnitude.
Given the maturity of certain of the Group’s funded defined benefit pension schemes, de-risking frameworks have been introduced to mitigate deficit volatility and enable better matching of investment returns with the cash outflows related to benefit obligations. These frameworks entail the usage of asset-liability matching techniques, whereby triggers are set for the conversion of equity holdings into bonds of similar average duration to the relevant liabilities.
Discount rates: The discount rates employed in determining the present value of the schemes’ liabilities are determined by reference to market yields at the balance sheet date on high-quality corporate bonds of a currency and term consistent with the currency and term of the associated post-employment benefit obligations. Changes in discount rates impact the quantum of liabilities as discussed above.
Inflation risk: A significant amount of the Group’s pension obligations are linked to inflation; higher inflation will lead to higher liabilities (although in most cases, caps on the level of inflationary increases are in place to protect the schemes against extreme inflation).
Longevity risk: In the majority of cases, the Group’s defined benefit pension schemes provide benefits for life with spousal and dependent child reversionary provisions; increases in life expectancy (decreases in mortality assumptions) will therefore give rise to higher liabilities.
Aggregation
For the purposes of the disclosures which follow; the schemes in Belgium, France, Germany, Italy, the Netherlands, the Republic of Ireland and Slovakia have been aggregated into a “Eurozone” category on the basis of common currency and financial assumptions; schemes in Brazil (which was divested in April 2021), the Philippines, Romania, Serbia and the UK have been aggregated into an “Other” category.
Financial assumptions — scheme liabilities
The major long-term assumptions used by the Group’s actuaries in the computation of scheme liabilities and post-retirement healthcare obligations are as follows:
| | | | | | | | | | | | | | | | | | | | | | | | | | | | | | | | | | | |
| Eurozone | | United States and Canada | | Switzerland |
| 2022 | 2021 | 2020 | | 2022 | 2021 | 2020 | | 2022 | 2021 | 2020 |
% | % | % | | % | % | % | | % | % | % |
| Rate of increase in: | | | | | | | | | | | |
| - salaries | 3.30 | 2.92 | 2.52 | | 3.00 | 3.03 | 3.37 | | 2.50 | 1.25 | 1.00 |
- pensions in payment | 2.10 | 1.90 | 1.45 | | - | - | - | | - | - | - |
| Inflation | 2.30 | 1.90 | 1.50 | | 2.10 | 2.00 | 2.00 | | 2.00 | 0.75 | 0.50 |
Discount rate | 4.20 | 1.43 | 1.14 | | 5.20 | 2.82 | 2.34 | | 2.20 | 0.30 | 0.20 |
Medical cost trend rate | n/a | n/a | n/a | | 1.87 | 5.91 | 5.97 | | n/a | n/a | n/a |
| | | | | |
| 2022 Annual Report and Form 20-F | 235 |
The mortality assumptions employed in determining the present value of scheme liabilities under IAS 19 represent actuarial guidelines in the relevant jurisdictions, taking account of mortality experience and industry circumstances. For schemes in the Republic of Ireland and the UK, the mortality assumptions used are in accordance with the underlying funding valuations. For the Group’s most material schemes, the future life expectations factored into the relevant valuations, based on retirement at 65 years of age for current and future retirees, are as follows:
| | | | | | | | | | | | | | | | | | | | | | | | | | | | | | | | | | | |
| Republic of Ireland | | United States and Canada | | Switzerland |
| 2022 | 2021 | 2020 | | 2022 | 2021 | 2020 | | 2022 | 2021 | 2020 |
Current retirees | | | | | | | | | | | |
| - men | 22.7 | 22.6 | 22.5 | | 20.5 | 20.5 | 20.1 | | 22.7 | 22.6 | 22.6 |
| - women | 24.6 | 24.5 | 24.4 | | 22.5 | 22.4 | 22.2 | | 24.5 | 24.4 | 24.7 |
Future retirees | | | | | | | | | | | |
| - men | 25.0 | 24.9 | 24.8 | | 22.3 | 22.2 | 22.0 | | 25.5 | 25.4 | 24.8 |
| - women | 26.9 | 26.8 | 26.7 | | 24.2 | 24.1 | 23.9 | | 26.9 | 26.9 | 26.8 |
The above data allows for future improvements in life expectancy.
Impact on Consolidated Income Statement
The total retirement benefit expense from continuing operations in the Consolidated Income Statement is as follows:
| | | | | | | | | | | |
| 2022 | 2021 | 2020 |
| $m | $m | $m |
Total defined contribution expense (i) | 316 | 297 | 279 |
Total defined benefit expense (i) | 56 | 71 | 69 |
Total expense in Consolidated Income Statement | 372 | 368 | 348 |
(i)The total defined contribution and defined benefit expense excludes $6 million and $nil million respectively (2021: $12 million and $1 million respectively;
2020: $10 million and $1 million respectively), relating to discontinued operations.
At 31 December 2022, $104 million (2021: $92 million) was included in trade and other payables in respect of defined contribution pension liabilities.
| | | | | | | | | | | |
Analysis of defined benefit expense | |
| | | |
| Charged in arriving at Group profit before finance costs: | | | |
| Current service cost | 46 | 54 | 52 |
Administration expenses | 5 | 4 | 5 |
Past service (credit)/cost net | (1) | (3) | 1 |
Loss on settlements | - | 6 | - |
| Subtotal | 50 | 61 | 58 |
| Included in finance income and finance costs respectively: | | | |
Interest income on scheme assets | (52) | (46) | (56) |
Interest cost on scheme liabilities | 58 | 56 | 67 |
Net interest expense | 6 | 10 | 11 |
| | | |
| Net expense to Consolidated Income Statement | 56 | 71 | 69 |
The composition of the net expense to the Consolidated Income Statement is as follows: | | | |
| Eurozone | 25 | 29 | 30 |
United States and Canada | 14 | 20 | 15 |
| Switzerland | 9 | 10 | 12 |
| Other | 8 | 12 | 12 |
| Total | 56 | 71 | 69 |
| | | | | |
| 2022 Annual Report and Form 20-F | 236 |
28. Retirement Benefit Obligations continued
| | | | | | | | |
| 2022 | 2021 |
Reconciliation of scheme assets (bid value) | $m | $m |
At 1 January | 3,174 | 3,321 |
| Movement in year | | |
Interest income on scheme assets | 52 | 46 |
| Remeasurement adjustments | | |
| - return on scheme assets excluding interest income | (534) | 165 |
Employer contributions paid | 35 | 43 |
Contributions paid by plan participants | 7 | 7 |
Benefit and settlement payments | (142) | (258) |
Administration expenses | (5) | (4) |
Translation adjustment | (144) | (146) |
| Fair value of plan assets | 2,443 | 3,174 |
| Remeasurement adjustments | | |
| - impact of asset ceiling | (88) | - |
At 31 December | 2,355 | 3,174 |
The composition of scheme assets is as follows: | | |
| Eurozone | 1,217 | 1,563 |
United States and Canada | 652 | 873 |
| Switzerland | 303 | 460 |
| Other | 183 | 278 |
| Total | 2,355 | 3,174 |
Reconciliation of actuarial value of liabilities | | |
| At 1 January | (3,483) | (3,877) |
| Movement in year | | |
Current service cost | (46) | (55) |
Past service credit net | 1 | 3 |
Loss on settlements | - | (6) |
Interest cost on scheme liabilities | (58) | (56) |
| Disposals | 25 | 1 |
Remeasurement adjustments | | |
| - experience variations | (48) | (7) |
| - actuarial gain from changes in financial assumptions | 951 | 70 |
| - actuarial (loss)/gain from changes in demographic assumptions | (2) | 36 |
Contributions paid by plan participants | (7) | (7) |
Benefit and settlement payments | 142 | 258 |
Translation adjustment | 154 | 157 |
At 31 December | (2,371) | (3,483) |
The composition of the actuarial value of liabilities is as follows: | | |
| Eurozone | (1,096) | (1,671) |
United States and Canada | (797) | (1,093) |
| Switzerland | (296) | (394) |
| Other | (182) | (325) |
| Total | (2,371) | (3,483) |
| | |
Net pension deficit (i) | (16) | (309) |
Related deferred income tax asset | 22 | 89 |
Net pension asset/(liability) | 6 | (220) |
The composition of the net pension asset/(liability) is as follows: | | |
| Eurozone | 106 | (87) |
United States and Canada | (109) | (164) |
| Switzerland | 6 | 66 |
| Other | 3 | (35) |
| Total | 6 | (220) |
(i) Reconciliation to Consolidated Balance Sheet | | |
Retirement benefit assets | 261 | 166 |
Retirement benefit obligations | (277) | (475) |
Net pension deficit | (16) | (309) |
| | | | | |
| 2022 Annual Report and Form 20-F | 237 |
Sensitivity analysis
The revised liabilities due to the impact of a reasonably possible change (as indicated below) in the principal actuarial assumptions would be as follows:
| | | | | | | | | | | | | | | | | | | | |
|
Eurozone | United States and Canada |
Switzerland |
Other |
Total Group |
| 2022 | 2022 | 2022 | 2022 | 2022 |
$m | $m | $m | $m | $m |
Scheme liabilities at 31 December | | (1,096) | (797) | (296) | (182) | (2,371) |
| Revised liabilities | | | | | | |
Discount rate | Increase by 0.25% | (1,055) | (777) | (286) | (176) | (2,294) |
| Decrease by 0.25% | (1,131) | (818) | (306) | (188) | (2,443) |
Inflation rate | Increase by 0.25% | (1,129) | (799) | (297) | (185) | (2,410) |
| Decrease by 0.25% | (1,057) | (796) | (295) | (180) | (2,328) |
Mortality assumption | Increase by 1 year | (1,058) | (777) | (287) | (177) | (2,299) |
| Decrease by 1 year | (1,127) | (817) | (305) | (188) | (2,437) |
The above sensitivity analysis is derived through changing the individual assumption while holding all other assumptions constant.
| | | | | | | | |
| 2022 | 2021 |
Split of scheme assets | $m | $m |
| Investments quoted in active markets | | |
Equity instruments (i) | 504 | 752 |
Debt instruments (ii) | 1,482 | 1,874 |
| Property | 113 | 128 |
Cash and cash equivalents | 42 | 40 |
Investment funds | 89 | 129 |
| | |
| Unquoted investments | | |
Equity instruments | 2 | 2 |
Debt instruments (iii) | 14 | 14 |
| Property | 74 | 71 |
Cash and cash equivalents | 13 | 9 |
Assets held by insurance company | 110 | 155 |
Total assets | 2,443 | 3,174 |
(i)Equity instruments primarily relate to developed markets.
(ii)Quoted debt instruments are made up of $991 million (2021: $1,317 million) and $491 million (2021: $557 million) of government and non-government instruments respectively.
(iii)Unquoted debt instruments primarily relate to government debt instruments.
| | | | | |
| 2022 Annual Report and Form 20-F | 238 |
28. Retirement Benefit Obligations continued
Actuarial valuations - funding requirements and future cash flows
In accordance with statutory requirements in the Republic of Ireland and funding requirements set by the Trustees in the UK, additional annual contributions and lump-sum payments are determined to get the plans to a fully funded position (on a funding basis). The funding requirements in relation to the Group’s defined benefit schemes are assessed in accordance with the advice of independent and qualified actuaries and valuations are prepared in this regard either annually, where local requirements mandate that this be done, or at triennial intervals at a
maximum in all other cases. In the Republic of Ireland and the UK, either the attained age or projected unit credit methods are used in the valuations. In Canada, Germany, Switzerland and the US, valuations are performed in accordance with the projected unit credit methodology. The dates of the funding valuations range from January 2020 to March 2022.
In general, funding valuations are not available for public inspection; however, the results of valuations are advised to the members of the various schemes on request.
The Group has contracted payments (presented on a discounted basis) to certain schemes in the UK as follows:
| | | | | | | | | | | |
| 2022 | 2021 | 2020 |
| $m | $m | $m |
Within one year | 3 | 2 | 2 |
Between one and two years | 3 | 2 | 2 |
Between two and three years | 3 | 2 | 2 |
Between three and four years | 3 | 2 | 2 |
Between four and five years | 2 | 2 | 2 |
After five years | 9 | 7 | 10 |
| Total | 23 | 17 | 20 |
Employer contributions payable in the 2023 financial year including minimum funding payments (expressed using year-end exchange rates for 2022) are estimated at $37 million.
Average duration and scheme composition
| | | | | | | | | | | | | | | | | | | | | | | | | | | | | | | | | | | |
| Eurozone | | United States and Canada | | Switzerland |
| 2022 | 2021 | 2020 | | 2022 | 2021 | 2020 | | 2022 | 2021 | 2020 |
Average duration of defined benefit obligation (years) | 14.0 | 18.3 | 18.3 | | 10.2 | 12.3 | 12.9 | | 13.5 | 17.0 | 17.6 |
| Allocation of defined benefit obligation by participant: | | | | | | | | | | | |
Active plan participants | 70 | % | 69 | % | 70 | % | | 47 | % | 49 | % | 43 | % | | 76 | % | 74 | % | 74 | % |
Deferred plan participants | 10 | % | 10 | % | 10 | % | | 15 | % | 15 | % | 12 | % | | — | % | — | % | — | % |
| Retirees | 20 | % | 21 | % | 20 | % | | 38 | % | 36 | % | 45 | % | | 24 | % | 26 | % | 26 | % |
| | | | | |
| 2022 Annual Report and Form 20-F | 239 |
29. Share Capital and Reserves
| | | | | | | | | | | | | | |
Equity share capital | 2022 | | 2021 |
| Ordinary Shares of €0.32 each (i) | | Ordinary Shares of €0.32 each (i) | Income Shares of €0.02 each |
| Authorised | | | | |
At 1 January ($m) | 491 | | 491 | 28 |
Cancellation of Income Shares (ii) | - | | - | (28) |
At 31 December ($m) | 491 | | 491 | - |
| | | | |
Number of Shares at 1 January (millions) | 1,250 | | 1,250 | 1,250 |
Cancellation of Income Shares (ii) | - | | - | (1,250) |
Number of Shares at 31 December (millions) | 1,250 | | 1,250 | - |
Allotted, called-up and fully paid | | | | |
At 1 January ($m) | 309 | | 317 | 16 |
Cancellation of Income Shares (ii) | - | | - | (16) |
Cancellation of Treasury Shares (iii) | (7) | | (8) | - |
At 31 December ($m) | 302 | | 309 | - |
The movement in the number of shares (expressed in millions) during the financial year was as follows: | | | |
At 1 January | 774 | | 795 | 795 |
Cancellation of Income Shares (ii) | - | | - | (795) |
Cancellation of Treasury Shares (iii) | (22) | | (21) | - |
At 31 December | 752 | | 774 | - |
(i)The Ordinary Shares represent 99.52% of the total issued share capital as at 31 December 2022 (2021: 99.53%).
(ii)The Income Shares were cancelled with effect from 9 February 2021 pursuant to a resolution approved by the Shareholders at an extraordinary general meeting of the Company held on 9 February 2021.
(iii)During 2022, 22,000,000 Ordinary Shares (2021: 21,000,000) were cancelled. The amount paid to repurchase these shares was initially recognised in Treasury Shares/own shares and was transferred to retained income on cancellation.
Share schemes
The aggregate number of shares which may be committed for issue in respect of any share option scheme, savings-related share option scheme, share participation scheme, performance share plan or any subsequent option scheme or share plan, may not exceed 10% of the issued ordinary share capital from time to time.
Share option schemes
Details of share options granted under the Company’s Share Option Schemes and the terms attaching thereto are provided in note 8 to the financial statements. A total of 449,703 Treasury Shares were re-issued during the financial year to satisfy the exercise of options over Ordinary Shares under these Schemes (2021: 521,523; 2020: 256,521).
| | | | | |
| 2022 Annual Report and Form 20-F | 240 |
29. Share Capital and Reserves continued
Share participation schemes
As at 31 December 2022, 8,593,666 (2021: 8,444,240) Ordinary Shares had been appropriated to participation schemes. In 2022 the appropriation was satisfied by the purchase of 149,426 shares (2021: 124,960 satisfied by the purchase of shares). The Ordinary Shares appropriated pursuant to these schemes were issued at market value on the dates of appropriation. The shares issued pursuant to these schemes are excluded from the scope of IFRS 2 and are hence not factored into the expense computation and the associated disclosures in note 8.
| | | | | | | | | | | | | | | | | |
Preference share capital | 5% Cumulative Preference Shares of €1.27 each | | 7% 'A' Cumulative Preference Shares of €1.27 each |
| Number of Shares | | | Number of Shares | |
| ‘000s | $m | | ‘000s | $m |
| Authorised | | | | | |
At 1 January 2022 and 31 December 2022 | 150 | - | | 872 | 1 |
Allotted, called-up and fully paid | | | | | |
At 1 January 2022 and 31 December 2022 | 50 | - | | 872 | 1 |
There was no movement in the number of cumulative preference shares in either the current or the prior year.
The holders of the 5% Cumulative Preference Shares are entitled to a fixed cumulative preference dividend at a rate of 5% per annum and priority in a winding-up to repayment of capital, but have no further right to participate in profits or assets and are not entitled to be present or vote at general meetings unless their dividend is in arrears. Dividends on the 5% Cumulative Preference Shares are payable half-yearly on 15 April and 15 October in each year. The 5% Cumulative Preference Shares represent 0.03% of the total issued share capital as at 31 December 2022 (2021: 0.03%).
The holders of the 7% ‘A’ Cumulative Preference Shares are entitled to a fixed cumulative preference dividend at a rate of 7% per annum, and subject to the rights of the holders of the 5% Cumulative Preference Shares, priority in a winding-up to repayment of capital, but have no further right to participate in profits or assets and are not entitled to be present or vote at general meetings unless their dividend is in arrears or unless the business of the meeting includes certain matters, which are specified in the Articles of Association. Dividends on the 7% ‘A’ Cumulative Preference Shares are payable half-yearly on 5 April and 5 October in each year. The 7% ‘A’ Cumulative Preference Shares represent 0.45% of the total issued share capital as at 31 December 2022 (2021: 0.44%).
| | | | | | | | |
Treasury Shares/own shares | 2022 | 2021 |
| $m | $m |
At 1 January | (195) | (386) |
Own Shares released by the Employee Benefit Trust under the 2014 Performance Share Plan | 173 | 117 |
Shares acquired by CRH plc (Treasury Shares) (i) | (1,170) | (880) |
Shares acquired by Employee Benefit Trust (own shares) | (8) | (16) |
Treasury Shares/own shares reissued (ii) | 24 | 19 |
Cancellation of Treasury Shares | 879 | 951 |
At 31 December | (297) | (195) |
Notes (i) to (ii) are set out overleaf. | | |
| | | | | |
| 2022 Annual Report and Form 20-F | 241 |
The movement in the number of Treasury Shares/own shares during the financial year is outlined in the table below.
| | | | | | | | |
| Number of shares |
| 2022 | 2021 |
At 1 January | 3,720,563 | 10,320,739 |
Own Shares released by the Employee Benefit Trust under the 2014 Performance Share Plan | (3,502,924) | (3,254,236) |
Shares acquired by CRH plc (Treasury Shares) (i) | 29,755,861 | 17,829,602 |
Shares acquired by Employee Benefit Trust (own shares) | 189,088 | 345,981 |
Treasury Shares/own shares reissued (ii) | (449,703) | (521,523) |
Cancellation of Treasury Shares | (22,000,000) | (21,000,000) |
At 31 December | 7,712,885 | 3,720,563 |
Split of Treasury Shares/own shares (iii) | | |
Treasury Shares | 7,398,112 | 3,476,859 |
Own shares | 314,773 | 243,704 |
| 7,712,885 | 3,720,563 |
(i)During 2022, CRH repurchased a total of 29,755,861 Ordinary Shares returning a further $1.2 billion of cash to shareholders. This brings total cash returned to shareholders under the share buyback programme (the Programme) to $4.1 billion since its commencement in May 2018.
(ii)These reissued Treasury Shares were previously purchased at an average price of $53.21 (2021: $37.15).
(iii)As at the balance sheet date, the nominal value of the Treasury Shares and own shares was €2.4 million and €0.1 million respectively (2021: €1.1 million and
€0.1 million respectively). Dividends have been waived by the Trustees of the own shares.
| | | | | | | | | | | | | | | | | |
| 2022 | | 2021 |
Number of Shares |
$m | | Number of Shares |
$m |
Ordinary Shares repurchased during the period (Treasury Shares) | 29,755,861 | 1,170 | | 17,829,602 | 880 |
Financial liability as at 31 December | | 281 | | | 281 |
| Total | | 1,451 | | | 1,161 |
At 31 December 2022 a financial liability of $281 million (2021: $281 million) was included in other payables in respect of the latest phase of the Programme which was entered into with Bank of America. This phase will end no later than 30 March 2023. Subsequent to year end, the Board approved the Group’s intention to increase its share buyback programme through the repurchase of up to $3 billion of CRH shares over the next 12 months subject to market conditions prevailing at the time and on the formal Shareholder approval of the share buyback authority at the AGM.
| | | | | | | | |
Share premium | | 2021 |
| | $m |
At 1 January | | 7,493 |
Reduction of share premium (iv) | | (7,493) |
At 31 December | | - |
(iv)Pursuant to a special resolution approved by shareholders at the Annual General Meeting of the Company held on 29 April 2021 and the subsequent order of the High Court of Ireland made on 3 June 2021, the capital of the Company was reduced by the entire amount standing to the credit of the Company’s share premium account as at 31 December 2020, with the reserve resulting from the reduction being treated as profits available for distribution as defined by Section 117 of the Companies Act 2014. A copy of the aforementioned order of the High Court was filed with the Companies Registration Office in Ireland on 3 June 2021.
| | | | | |
| 2022 Annual Report and Form 20-F | 242 |
30. Business Combinations
The acquisitions completed during the year ended 31 December 2022 by reportable segment, together with the completion dates, are detailed below; these transactions entailed the acquisition of an effective 100% stake except where indicated to the contrary:
Americas Materials:
Alabama: North Alabama Paving, Inc. (30 June);
Arkansas: Marion County Paving (18 March);
Colorado: Granby Sand & Gravel (31 March);
Florida: certain assets of Kudzue 3 Trucking, Inc. (11 March);
Kentucky: Hinkle Contracting, LLC (13 May);
Mississippi: Krystal Gravel, Inc. (23 December);
Texas: LD Construction Company and PTSS Investments, LLC (2 December) and Moore Brothers Construction Company (16 December);
Utah: Chapman Construction (16 December); and
West Virginia: Jefferson Asphalt Products Company (23 September).
Building Products:
Substantial Acquisition: on 8 July, CRH acquired Barrette Outdoor Living, Inc. (Barrette), North America's leading provider of residential fencing and railing solutions headquartered in Middleburg Heights, Ohio, US. The assets acquired are all in the US and are expected to enhance our existing offering of sustainable outdoor living solutions in North America.
Americas
California: Calstone Company (29 March);
Ohio: Normandy Industries, Inc. (21 October);
South Carolina: Sterling Sand, LLC (19 October);
Texas: certain assets of Rinker Materials (18 April); Soil Mender Products (25 July); and Inwesco, Inc. (12 December); and
West Virginia: Grant County Mulch, Inc. (19 December).
Other
Ireland: RS Sockets Ltd. (15 December); and
Poland: certain assets of Libet Company (2 September).
Europe Materials:
Croatia: Thermostone (1 April);
Denmark: Confac Holdings A/S (1 April) and Gunderup (1 December);
Finland: Terrawise Oy Stone Aggregates (31 May);
Poland: Mabau Group (75%, 21 March);
Romania: certain assets of SUT-ICIM and Irca SRL (23 February) and Simbeton SRL (29 July); and
Slovakia: certain assets of U.S. Steel Košice, s.r.o. (1 January) and certain assets of COLAS Slovakia, a.s. (10 January).
| | | | | |
| 2022 Annual Report and Form 20-F | 243 |
The identifiable net assets acquired, including adjustments to provisional fair values, were as follows:
| | | | | | | | | | | | | | | | | |
| | Other | | | |
| Barrette | acquisitions | Total | | |
| 2022 | 2022 | 2022 | 2021 | 2020 |
| $m | $m | $m | $m | $m |
| ASSETS | | | | | |
Non-current assets | | | | | |
Property, plant and equipment | 309 | 597 | 906 | 609 | 134 |
Intangible assets (i) | 809 | 178 | 987 | 131 | 31 |
| Equity accounted investments | - | 28 | 28 | - | - |
Total non-current assets | 1,118 | 803 | 1,921 | 740 | 165 |
Current assets | | | | | |
| Inventories | 247 | 128 | 375 | 157 | 23 |
Trade and other receivables (ii) | 168 | 59 | 227 | 191 | 47 |
Cash and cash equivalents | 8 | 14 | 22 | 7 | - |
Total current assets | 423 | 201 | 624 | 355 | 70 |
LIABILITIES | | | | | |
Trade and other payables | (148) | (47) | (195) | (143) | (21) |
Provisions for liabilities | (16) | (3) | (19) | (1) | - |
| | | | | |
Lease liabilities | (48) | (59) | (107) | (88) | (12) |
Interest-bearing loans and borrowings | - | (8) | (8) | (3) | - |
Current income tax liabilities | - | - | - | - | (1) |
Deferred income tax liabilities | (192) | (55) | (247) | (37) | - |
Total liabilities | (404) | (172) | (576) | (272) | (34) |
| | | | | |
Total identifiable net assets at fair value | 1,137 | 832 | 1,969 | 823 | 201 |
Goodwill arising on acquisition (iii) | 774 | 546 | 1,320 | 679 | 157 |
Total consideration | 1,911 | 1,378 | 3,289 | 1,502 | 358 |
Consideration satisfied by: | | | | | |
Cash payments | 1,911 | 1,364 | 3,275 | 1,501 | 351 |
Deferred consideration (stated at net present cost) | - | 10 | 10 | - | 4 |
| Contingent consideration | - | 4 | 4 | 1 | 3 |
Total consideration | 1,911 | 1,378 | 3,289 | 1,502 | 358 |
Net cash outflow arising on acquisition | | | | | |
Cash consideration | 1,911 | 1,364 | 3,275 | 1,501 | 351 |
Less: cash and cash equivalents acquired | (8) | (14) | (22) | (7) | - |
Total outflow in the Consolidated Statement of Cash Flows | 1,903 | 1,350 | 3,253 | 1,494 | 351 |
Notes (i) to (iii) are set out overleaf. | | | | | |
| | | | | |
| 2022 Annual Report and Form 20-F | 244 |
30. Business Combinations continued
The acquisition balance sheet presented on the previous page reflects the identifiable net assets acquired in respect of acquisitions completed during 2022, together with adjustments to provisional fair values in respect of acquisitions completed during 2021. The measurement period for a number of acquisitions completed in 2021, closed in 2022 with no material adjustments identified.
CRH performs a detailed quantitative and qualitative assessment of each acquisition in order to determine whether it is material for the purposes of separate disclosure under IFRS 3 Business Combinations. The acquisition of Barrette is deemed to be a material acquisition. None of the remaining acquisitions completed during the financial year were considered sufficiently material to warrant separate disclosure of the attributable fair values. Due to the size and scale of the Barrette acquisition, the determination of the fair values of identifiable assets acquired and liabilities assumed as disclosed above are provisional (principally in respect of property, plant and equipment, provisions for liabilities and the associated goodwill and deferred tax aspects). The fair value assigned to identifiable assets and liabilities acquired is based on estimates and assumptions made by management at the time of acquisition. CRH may revise its purchase price allocation during the subsequent reporting window as permitted under IFRS 3.
(i)Marketing-related, customer-related and contract-based intangible assets of $174 million, $594 million and $41 million respectively arose on the acquisition of Barrette. These primarily related to brand names, patents and non-contractual customer relationships. Due to the asset-intensive nature of operations in the Americas Materials and Europe Materials business segments, no significant separately identifiable intangible assets were recognised on business combinations in these segments.
(ii)Trade and other receivables
| | | | | | | | | | | | | | | | | | | | | | | | | | | | | | | | | | | |
| Gross contractual | | Loss | | |
| amounts due | | allowance | | Fair value |
| 2022 | 2021 | 2020 | | 2022 | 2021 | 2020 | | 2022 | 2021 | 2020 |
| $m | $m | $m | | $m | $m | $m | | $m | $m | $m |
| Barrette | 169 | - | - | | 1 | - | - | | 168 | - | - |
| Other acquisitions | 60 | 192 | 47 | | 1 | 1 | - | | 59 | 191 | 47 |
| Total | 229 | 192 | 47 | | 2 | 1 | - | | 227 | 191 | 47 |
(iii)The principal factor contributing to the recognition of goodwill on acquisitions entered into by the Group is the realisation of cost savings and other synergies with existing entities in the Group which do not qualify for separate recognition as intangible assets. $1,289 million of the goodwill recognised in respect of acquisitions completed in 2022 is expected to be deductible for tax purposes (2021: $284 million; 2020: $148 million).
| | | | | | | | | | | |
Acquisition-related costs | 2022 | 2021 | 2020 |
| $m | $m | $m |
| Barrette | 27 | - | - |
| Other acquisitions | 12 | 13 | 6 |
| Total | 39 | 13 | 6 |
The above acquisition-related costs, which exclude post-acquisition integration costs, have been included in operating costs in the Consolidated Income Statement (note 4).
| | | | | |
| 2022 Annual Report and Form 20-F | 245 |
The following table analyses the 29 acquisitions completed in 2022 (2021: 20 acquisitions; 2020: 17 acquisitions) by reportable segment and provides details of the goodwill and consideration figures arising in each of those segments:
| | | | | | | | | | | | | | | | | | | | | | | | | | | | | | | | | | | |
| Number of
acquisitions | | Goodwill | | Consideration |
Reportable segments | 2022 | 2021 | 2020 | | 2022 | 2021 | 2020 | | 2022 | 2021 | 2020 |
Continuing operations | | | | | $m | $m | $m | | $m | $m | $m |
Americas Materials | 10 | 8 | 7 | | 172 | 239 | 53 | | 493 | 694 | 163 |
Building Products | 10 | 7 | 6 | | 1,205 | 417 | 90 | | 2,652 | 734 | 182 |
Europe Materials | 9 | 4 | 4 | | 34 | 1 | - | | 144 | 17 | 7 |
Total Group from continuing operations | 29 | 19 | 17 | | 1,411 | 657 | 143 | | 3,289 | 1,445 | 352 |
| | | | | | | | | | | |
| Discontinued operations | | | | | | | | | | | |
Building Products - Building Envelope | - | 1 | - | | - | 17 | - | | - | 56 | - |
| | | | | 1,411 | 674 | 143 | | 3,289 | 1,501 | 352 |
| | | | | | | | | | | |
Adjustments to provisional fair values of prior year acquisitions | | | | | (91) | 5 | 14 | | - | 1 | 6 |
| Total | | | | | 1,320 | 679 | 157 | | 3,289 | 1,502 | 358 |
The post-acquisition impact of acquisitions completed during the year on the Group’s profit for the financial year was as follows:
| | | | | | | | | | | | | | | | | |
| | Other | | | |
| Barrette | acquisitions | Total | | |
| 2022 | 2022 | 2022 | 2021 | 2020 |
Continuing operations | $m | $m | $m | $m | $m |
| Revenue | 347 | 414 | 761 | 524 | 103 |
| (Loss)/profit before tax for the financial year | (33) | 25 | (8) | 55 | 9 |
The revenue and profit of the Group for the financial year determined in accordance with IFRS as though the acquisitions effected during the year had been at the beginning of the year would have been as follows:
| | | | | | | | | | | |
| 2022 acquisitions | CRH Group excluding 2022 acquisitions | Consolidated Group including acquisitions |
| $m | $m | $m |
| Revenue | 1,730 | 31,962 | 33,692 |
Profit before tax for the financial year | 51 | 3,477 | 3,528 |
There have been no acquisitions completed subsequent to the balance sheet date which would be individually material to the Group, thereby requiring disclosure under either IFRS 3 or IAS 10 Events after the Balance Sheet Date. Development updates, giving details of acquisitions which do not require separate disclosure on the grounds of materiality, are published periodically.
| | | | | |
| 2022 Annual Report and Form 20-F | 246 |
31. Non-controlling Interests
The total non-controlling interest at 31 December 2022 is $646 million (2021: $681 million) of which $444 million (2021: $498 million) relates to Republic Cement & Building Materials (RCBM), Inc. and Republic Cement Land & Resources (RCLR), Inc. The non-controlling interests in respect of the Group’s other subsidiaries are not considered to be material.
| | | | | | | | | | | |
| Name | Principal activity | Country of incorporation | Economic ownership interest held by non-controlling interest |
| Republic Cement & Building Materials, Inc. | Manufacture, development and | Philippines | 45% |
| and Republic Cement Land & Resources, Inc. | sale of cement and building materials |
The following is summarised financial information for RCBM and RCLR prepared in accordance with IFRS 12 Disclosure of Interests in Other Entities. This information is before intragroup eliminations with other Group companies.
| | | | | | | | |
| 2022 | 2021 |
Summarised financial information | $m | $m |
(Loss)/profit for the year | (26) | 61 |
| | |
Current assets | 265 | 210 |
Non-current assets | 1,455 | 1,618 |
Current liabilities | (267) | (240) |
Non-current liabilities | (699) | (737) |
Net assets | 754 | 851 |
| | |
Cash flows from operating activities | 13 | 77 |
There were no dividends paid to non-controlling interests of the combined Philippines business during the current or the prior year.
CRH holds 40% of the equity share capital in RCBM and RCLR and has an economic interest of 55% of the combined Philippines business. Non-controlling interest relates to another party who holds 60% of the equity share capital in RCBM and RCLR and has an economic interest of 45% of the combined Philippines business. CRH has obtained control (as defined under IFRS 10 Consolidated Financial Statements) by virtue of contractual arrangements which give CRH power to direct the relevant non-nationalised activities of the business, in compliance with Philippine law.
| | | | | |
| 2022 Annual Report and Form 20-F | 247 |
32. Related Party Transactions
The principal related party relationships requiring disclosure in the Consolidated Financial Statements of the Group under IAS 24 Related Party Disclosures pertain to: the existence of subsidiaries, joint ventures and associates; transactions with these entities entered into by the Group; the identification and compensation of key management personnel; and lease arrangements.
Subsidiaries, joint ventures and associates
The Consolidated Financial Statements include the financial statements of the Company (CRH plc, the ultimate parent) and its subsidiaries as well as its joint ventures and associates accounted for by applying the equity method as outlined in the accounting policies on pages 181 to 190. The Group’s principal subsidiaries, joint ventures and associates are disclosed on pages 290 to 293.
Sales to and purchases from joint ventures and associates are as follows:
| | | | | | | | | | | | | | | | | | | | | | | |
| Joint ventures | | Associates |
| 2022 | 2021 | 2020 | | 2022 | 2021 | 2020 |
Continuing operations | $m | $m | $m | | $m | $m | $m |
| Sales | 192 | 157 | 127 | | 45 | 42 | 31 |
| Purchases | 41 | 29 | 24 | | 20 | 19 | 15 |
Loans extended by the Group to joint ventures and associates (see note 15) are included in financial assets. Amounts receivable from and payable to equity accounted investments (arising from the aforementioned sales and purchases transactions) as at the balance sheet date are included as separate line items in notes 17 and 18 to the Consolidated Financial Statements.
Terms and conditions of transactions with subsidiaries, joint ventures and associates
In general, the transfer pricing policy implemented by the Group across its subsidiaries is market-based. Sales to and purchases from joint ventures and associates are conducted in the ordinary course of business and on terms equivalent to those that prevail in arms-length transactions. The outstanding balances included in receivables and payables as at the balance sheet date in respect of transactions with joint ventures and associates are unsecured and settlement of these arise in cash. No guarantees have been either requested or provided in relation to related party receivables and payables. Loans to joint ventures and associates (as disclosed in note 15) are extended on normal commercial terms in the ordinary course of business with interest accruing and, in general, paid to the Group at predetermined intervals.
Key management personnel
For the purposes of the disclosure requirements of IAS 24, the term “key management personnel” (i.e. those persons having authority and responsibility for planning, directing and controlling the activities of the Company) comprises of the Board of Directors and the Chief Operating Decision Maker (as defined in IFRS 8) which manage the business and affairs of the Company.
| | | | | | | | | | | |
| Key management remuneration amounted to: | 2022 | 2021 | 2020 |
| $m | $m | $m |
Short-term benefits | 14 | 10 | 9 |
Post-employment benefits | 1 | 1 | 1 |
Share-based payments - calculated in accordance with the principles disclosed in note 8 | 9 | 8 | 6 |
| Total | 24 | 19 | 16 |
Other than these compensation entitlements, there were no other transactions involving key management personnel.
Directors' emoluments and interests
Directors' emoluments (which are included in administrative expenses in note 4) and interests are presented in the Directors' Remuneration Report on pages 108 to 132.
Lease arrangements
CRH has a number of lease arrangements in place with related parties across the Group, which have been negotiated on an arms-length basis at market rates. We do not consider these arrangements to be material either individually or collectively in the context of the 2022, 2021 and 2020 Consolidated Financial Statements.
33. Board Approval
The Board of Directors approved and authorised for issue the financial statements on pages 176 to 247 in respect of the year ended 31 December 2022 on 1 March 2023.
| | | | | |
| 2022 Annual Report and Form 20-F | 248 |
[THIS PAGE INTENTIONALLY LEFT BLANK]
| | | | | |
| 2022 Annual Report and Form 20-F | 249 |
[THIS PAGE INTENTIONALLY LEFT BLANK]
| | | | | |
| 2022 Annual Report and Form 20-F | 250 |
[THIS PAGE INTENTIONALLY LEFT BLANK]
| | | | | |
| 2022 Annual Report and Form 20-F | 251 |
[THIS PAGE INTENTIONALLY LEFT BLANK]
| | | | | |
| 2022 Annual Report and Form 20-F | 252 |
[THIS PAGE INTENTIONALLY LEFT BLANK]
| | | | | |
| 2022 Annual Report and Form 20-F | 253 |
| | | | | |
| 2022 Annual Report and Form 20-F | 254 |
| | | | | |
| 2022 Annual Report and Form 20-F | 255 |
| | | | | | | | | | | | | | | | | | | | | | | | | | |
| Supplemental 20-F and Other Disclosures | |
| | | | | | | Key Financial Data 256 Non-GAAP Performance Measures 257 Supplemental Guarantor Information 261 Mineral Reserves and Resources 262 Property, Plants and Equipment 268 Corporate Governance Practices 269 Contractual Obligations 274 Other Disclosures 275 | |
| | | | | |
| 2022 Annual Report and Form 20-F | 256 |
Key Financial Data
The Consolidated Financial Statements of CRH plc have been prepared in accordance with IFRS as issued by the International Accounting Standards Board. Key financial data is presented below for the five years ended on 31 December 2022.
As at 31 December 2022 and 2021 and for the three years ended 31 December 2022, the selected financial data is qualified in its entirety by reference to, and should be read in conjunction with, the audited Consolidated Financial Statements, the related Notes and the Business Performance section included elsewhere in this Annual Report and Form 20‑F.
Year ended 31 December (amounts in millions, except per share data)
| | | | | | | | | | | | | | | | | |
| 2022 | 2021 (i) | 2020 (i) | 2019 (i) | 2018 (i) |
| $m | $m | $m | $m | $m |
Consolidated Income Statement data | | | | | |
| Revenue | 32,723 | 29,206 | 25,888 | 26,307 | 25,654 |
Group operating profit | 3,894 | 3,331 | 2,026 | 2,506 | 2,199 |
Profit attributable to equity holders of the Company | 2,657 | 2,386 | 966 | 1,424 | 1,370 |
Basic earnings per Ordinary Share | $3.50 | $3.06 | $1.23 | $1.78 | $1.65 |
Diluted earnings per Ordinary Share | $3.48 | $3.03 | $1.22 | $1.76 | $1.64 |
Dividends paid during the calendar year per Ordinary Share (ii) | $1.22 | $1.16 | $0.92 | $0.81 | $0.83 |
Average number of Ordinary Shares outstanding (iii) | 758.3 | 780.2 | 785.1 | 801.3 | 832.4 |
All data relates to continuing operations | | | | | |
Consolidated Balance Sheet data | | | | | |
Total assets | 45,188 | 44,670 | 44,944 | 47,612 | 46,777 |
Net assets (iv) | 22,337 | 20,914 | 20,348 | 19,635 | 18,952 |
Ordinary shareholders' equity | 21,690 | 20,232 | 19,655 | 19,027 | 18,349 |
Equity share capital | 302 | 309 | 333 | 335 | 352 |
Number of Ordinary Shares (iii) | 752.1 | 774.1 | 795.1 | 799.6 | 843.4 |
Number of Treasury Shares and own shares (iii) | 7.7 | 3.7 | 10.3 | 10.2 | 27.8 |
Number of Ordinary Shares net of Treasury Shares and own shares (iii) | 744.4 | 770.4 | 784.8 | 789.4 | 815.6 |
(i)Prior year comparative income statement data has been restated to show the results of our Building Envelope business in discontinued operations. See note 3 to the Consolidated Financial Statements for further details.
(ii)Interim and final dividends per share declared previously in euro have been translated to US Dollar using the dividends record date exchange rate.
(iii)All share numbers are shown in millions of shares.
(iv)Net assets is calculated as the sum of the total assets less total liabilities.
| | | | | |
2022 Annual Report and Form 20-F | 257 |
Non-GAAP Performance Measures
CRH uses a number of non‑GAAP performance measures to monitor financial performance. These measures are referred to throughout the discussion of our reported financial position and operating performance on a continuing operations basis unless otherwise defined and are measures which are regularly reviewed by CRH management.
These performance measures may not be uniformly defined by all companies and accordingly they may not be directly comparable with similarly titled measures and disclosures by other companies.
Certain information presented is derived from amounts calculated in accordance with IFRS but is not itself an expressly permitted GAAP measure. The non‑GAAP performance measures as summarised below should not be viewed in isolation or as an alternative to the equivalent GAAP measure.
Prior year comparative non-GAAP performance measures have been restated, where applicable, to show the results of our Building Envelope business as discontinued operations.
Reconciliation of Revenue, EBITDA (as defined)* and Operating Profit by segment
| | | | | | | | | | | | | | | | | | | | | | | | | | | | | | | | | | | | | | | | | | | | | | | |
| | | | | | | | | | | | | 2022 | 2021 | 2020 |
| | | | | | | | | | | | | $m | $m | $m |
Group profit for the financial year | | | | | | | | | | | | | 3,874 | 2,621 | 1,165 |
Profit after tax for the financial year from discontinued operations | | | | | | | | | | (1,190) | (179) | (156) |
Group profit for the financial year from continuing operations | | | | | | | | | | 2,684 | 2,442 | 1,009 |
Income tax expense | | | | | | | | | | | | | 785 | 661 | 445 |
Profit before tax from continuing operations | | | | | | | | | | | 3,469 | 3,103 | 1,454 |
Share of equity accounted investments' (profit)/loss | | | | | | | | | | | - | (55) | 118 |
Other financial expense | | | | | | | | | | | | | 40 | 42 | 33 |
Finance costs less income | | | | | | | | | | | | | 336 | 357 | 438 |
| Profit before finance costs | | | | | | | | | | | | | 3,845 | 3,447 | 2,043 |
Loss/(profit) on disposals | | | | | | | | | | | | | 49 | (116) | (17) |
Group operating profit | | | | | | | | | | | | 3,894 | 3,331 | 2,026 |
| Depreciation, amortisation and impairment | | | | | | | | | | | | | 1,721 | 1,659 | 2,267 |
| EBITDA (as defined)* | | | | | | | | | | | | | 5,615 | 4,990 | 4,293 |
| | | | | | | | | | | | | | | |
| Year ended 31 December |
|
Revenue | | Group operating profit (i) | | Depreciation, amortisation and impairment | |
EBITDA (as defined)* |
| 2022 | 2021 | 2020 | | 2022 | 2021 | 2020 | | 2022 | 2021 | 2020 | | 2022 | 2021 | 2020 |
| $m | $m | $m | | $m | $m | $m | | $m | $m | $m | | $m | $m | $m |
Continuing operations | | | | | | | | | | | | | | | |
Americas Materials | 14,324 | 12,407 | 11,273 | | 1,909 | 1,788 | 1,631 | | 839 | 800 | 774 | | 2,748 | 2,588 | 2,405 |
| Building Products | 7,823 | 6,218 | 5,474 | | 1,161 | 729 | 585 | | 349 | 263 | 248 | | 1,510 | 992 | 833 |
Europe Materials | 10,576 | 10,581 | 9,141 | | 824 | 814 | (190) | | 533 | 596 | 1,245 | | 1,357 | 1,410 | 1,055 |
| 32,723 | 29,206 | 25,888 | | 3,894 | 3,331 | 2,026 | | 1,721 | 1,659 | 2,267 | | 5,615 | 4,990 | 4,293 |
Discontinued operations | | | | | | | | | | | | | | | |
Building Products - Building Envelope | 645 | 1,775 | 1,699 | | 95 | 254 | 237 | | 36 | 106 | 100 | | 131 | 360 | 337 |
| | | | | | | | | | | | | | | |
(i)Throughout this document, Group operating profit is reported as shown in the Consolidated Income Statement and excludes profit on disposals.
* EBITDA is defined as earnings from continuing operations before interest, taxes, depreciation, amortisation, asset impairment charges, profit on disposals and the Group’s share of equity accounted investments’ profit after tax.
| | | | | |
| 2022 Annual Report and Form 20-F | 258 |
Non-GAAP Performance Measures continued
| | | | | | | | | | | | | | |
| Return on Net Assets (RONA) | | | | |
| | 2022 | 2021 | 2020 |
| | $m | $m | $m |
Group operating profit from continuing operations | A | 3,894 | 3,331 | 2,026 |
Group operating profit from discontinued operations | | 95 | 254 | 237 |
| | 3,989 | 3,585 | 2,263 |
Adjusted for impairment charges (i) | | - | - | 673 |
Numerator for RONA computation | | 3,989 | 3,585 | 2,936 |
| | | | |
Current year | | | | |
Segment assets (ii) | | 38,396 | 37,935 | 36,218 |
Segment liabilities (ii) | | (9,517) | (9,971) | (9,136) |
| B | 28,879 | 27,964 | 27,082 |
Lease liabilities (iii) | | 1,319 | 1,671 | 1,635 |
| | 30,198 | 29,635 | 28,717 |
Prior year | | | | |
Segment assets (ii) | | 37,935 | 36,218 | 36,716 |
Segment liabilities (ii) | | (9,971) | (9,136) | (8,940) |
| C | 27,964 | 27,082 | 27,776 |
Lease liabilities (iii) | | 1,671 | 1,635 | 1,697 |
| | 29,635 | 28,717 | 29,473 |
| | | | |
Denominator for RONA computation - average net assets | | 29,917 | 29,176 | 29,095 |
| | | | |
| Return on net segment assets (A divided by average of B and C) | | 13.7 | % | 12.1 | % | 7.4 | % |
| | | | |
| RONA | | 13.3 | % | 12.3 | % | 10.1 | % |
| | | | | | | | | | | | | | |
| Reconciliation of Segment Assets and Liabilities to Group Assets and Liabilities |
| 2022 | 2021 | 2020 | 2019 |
| $m | $m | $m | $m |
| Assets | | | | |
Segment assets (ii) | 38,396 | 37,935 | 36,218 | 36,716 |
Reconciliation to total assets as reported in the Consolidated Balance Sheet: | | | | |
Investments accounted for using the equity method | 649 | 653 | 626 | 775 |
Other financial assets | 14 | 12 | 13 | 13 |
Derivative financial instruments (current and non‑current) | 42 | 136 | 201 | 92 |
Income tax assets (current and deferred) | 151 | 151 | 165 | 98 |
Cash and cash equivalents | 5,936 | 5,783 | 7,721 | 9,918 |
Total assets as reported in the Consolidated Balance Sheet | 45,188 | 44,670 | 44,944 | 47,612 |
Liabilities | | | | |
Segment liabilities (ii) | 9,517 | 9,971 | 9,136 | 8,940 |
Reconciliation to total liabilities as reported in the Consolidated Balance Sheet: | | | | |
Interest‑bearing loans and borrowings (current and non‑current) | 9,636 | 10,487 | 12,215 | 15,827 |
Derivative financial instruments (current and non‑current) | 128 | 14 | 13 | 18 |
Income tax liabilities (current and deferred) | 3,570 | 3,284 | 3,232 | 3,192 |
Total liabilities as reported in the Consolidated Balance Sheet | 22,851 | 23,756 | 24,596 | 27,977 |
(i)Operating profit is adjusted for non‑cash impairment charges. Please see note 4 to the Consolidated Financial Statements for further detail on such impairment charges.
(ii)Segment assets and liabilities as disclosed in note 2 to the Consolidated Financial Statements.
(iii)Segment liabilities include lease liabilities which are debt in nature and are therefore adjusted for in the RONA calculation. Segment lease liabilities at 31 December 2022 amounted to: Americas Materials $393 million (2021: $381 million; 2020: $345 million; 2019: $408 million), Building Products $468 million (2021: $773 million; 2020: $743 million; 2019: $735 million) and Europe Materials $458 million (2021: $517 million; 2020: $547 million; 2019: $554 million).
| | | | | |
| 2022 Annual Report and Form 20-F | 259 |
Calculation of Net Debt/EBITDA (as defined)*
| | | | | | | | | | | |
| 2022 | 2021 | 2020 |
| $m | $m | $m |
Net debt | | | |
Cash and cash equivalents (i) | 5,936 | 5,783 | 7,721 |
Interest‑bearing loans and borrowings (i) | (9,636) | (10,487) | (12,215) |
Lease liabilities (i) | (1,319) | (1,671) | (1,635) |
Derivative financial instruments (net) (i) | (86) | 122 | 188 |
Group net debt (i) | (5,105) | (6,253) | (5,941) |
| | | |
| Profit after Tax | 3,874 | 2,621 | 1,165 |
| | | |
EBITDA (as defined)* | 5,615 | 4,990 | 4,293 |
| | | |
| Times |
| | | |
Interest‑bearing loans and borrowings divided by profit after tax | 2.5 | 4.0 | 10.5 |
| | | |
| | | |
Net Debt divided by EBITDA (as defined)* | 0.9 | 1.3 | 1.4 |
(i)These items appear in notes 20 to 25 to the Consolidated Financial Statements.
Total Shareholder Return (TSR)
Total shareholder return represents the total accumulated value delivered to shareholders (via gross dividends reinvested and share appreciation) if €100 was invested in CRH plc shares in 1970.
| | | | | | | | |
| 2022 | 2021 |
Investment in CRH plc shares (1970) | €100 | €100 |
Accumulated CRH plc shares (31 December) ‑ based on reinvestment of dividends | 3,661 | 3,548 |
Share price (31 December) ‑ Euronext Dublin | €37.01 | €46.52 |
Shareholder value (31 December) ‑ '000 | €136 | €165 |
Total shareholder return (i) | 14.8 | % | 15.5 | % |
(i)Calculated using Compound Average Growth Rate (CAGR) methodology.
Revenue from products with enhanced sustainability attributes
| | | | | | | | | | | |
| 2022 | 2021 | 2020 |
| $m | $m | $m |
| | | |
Group revenue (i) | 32,723 | 29,206 | 25,888 |
Adjusted for: | | | |
Non-product revenue (ii) | (6,103) | (5,186) | (5,669) |
Denominator - Group product revenue | 26,620 | 24,020 | 20,219 |
| | | |
Numerator - Group revenue from products with enhanced sustainability attributes (iii) | 12,591 | 11,408 | 9,402 |
| | | |
Percentage revenue from products with enhanced sustainability attributes | 47 | % | 47 | % | 47 | % |
| | | |
| | | |
(i)Group revenue as shown in the Consolidated Income Statement on page 176.
(ii)Non-product revenue relates to the sale of services (i.e., contracting, distribution and other services), excluding the component of construction contract activities that are product-based.
(iii)Product revenue derived from products that incorporate any, or a combination of; recycled materials; are produced using alternative energy and fuel sources; have a lower-carbon footprint as compared to those produced using traditional manufacturing processes; and/or are designed to specifically benefit the environment (i.e. water treatment and management systems, products with strong thermal mass/U-values).
* EBITDA is defined as earnings from continuing operations before interest, taxes, depreciation, amortisation, asset impairment charges, profit on disposals and the Group’s share of equity accounted investments’ profit after tax.
| | | | | |
2022 Annual Report and Form 20-F | 260 |
Non-GAAP Performance Measures continued
EBITDA (as defined)* EBITDA is defined as earnings from continuing operations before interest, taxes, depreciation, amortisation, asset impairment charges, profit on disposals and the Group’s share of equity accounted investments’ profit after tax and is quoted by management in conjunction with other GAAP and non‑GAAP financial measures, to aid investors in their analysis of the performance of the Group and to assist investors in the comparison of the Group’s performance with that of other companies. EBITDA (as defined)* by segment is monitored by management in order to allocate resources between segments and to assess performance. Given that net finance costs and income tax are managed on a centralised basis, these items are not allocated between operating segments for the purpose of the information presented to the Chief Operating Decision Maker. EBITDA (as defined)* margin is calculated by expressing EBITDA (as defined)* as a percentage of sales.
Net Debt. Net debt is used by management as it gives additional insight into the Group’s current debt situation less available cash. Net debt is provided to enable investors to see the economic effect of gross debt, related hedges and cash and cash equivalents in total. Net debt is a non‑GAAP measure and comprises current and non‑current interest‑bearing loans and borrowings, lease liabilities, cash and cash equivalents and current and non‑current derivative financial instruments (net).
Net Debt/EBITDA (as defined)* is monitored by management and is useful to investors in assessing the Company’s level of indebtedness relative to its profitability. It is the ratio of Net Debt to EBITDA (as defined)* and is calculated on page 259.
RONA. Return on Net Assets is a key internal pre‑tax and pre‑non‑cash impairment measure of operating performance throughout the CRH Group and can be used by management and investors to measure the relative use of assets between CRH’s business segments and to compare to other businesses. The metric measures management’s ability to generate profits from the net assets required to support that business, focusing on both profit maximisation and the maintenance of an efficient asset base; it encourages effective fixed asset maintenance programmes, good decisions regarding expenditure on property, plant and equipment and the timely disposal of surplus assets, and also supports the effective management of the Group’s working capital base. RONA is calculated by expressing Group operating profit from continuing operations and Group operating profit from discontinued operations excluding non‑cash impairment charges as a percentage of average net assets. Net assets comprise total assets by segment (including assets held for sale) less total liabilities by segment (excluding lease liabilities and including liabilities associated with assets classified as held for sale) as shown on page 258 and detailed in note 2 to the Consolidated Financial Statements, and excludes equity accounted investments and other financial assets, net debt (as previously defined) and tax assets & liabilities. The average net assets for the year is the simple average of the opening and closing balance sheet figures.
Organic Revenue, Organic Operating Profit and Organic EBITDA (as defined)* CRH pursues a strategy of growth through acquisitions and investments, with $3.3 billion spent on acquisitions and investments in 2022 (2021: $1.5 billion). Acquisitions completed in 2021 and 2022 contributed incremental sales revenue of $1,739 million, operating profit of $275 million and EBITDA (as defined)* of $402 million in 2022. Cash proceeds from divestments and non‑current asset disposals amounted to $3.9 billion (net of cash disposed and including deferred consideration proceeds in respect of prior year divestments (2021: $507 million). The sales impact of divested activities in 2022 was a negative $108 million and the impact at an operating profit and EBITDA (as defined)* level was a negative $13 million and $17million respectively.
The US Dollar strengthened against most major currencies during 2022 resulting in the average US Dollar/euro rate strengthening from 0.8460 in 2021 to 0.9518 in 2022 and likewise the US Dollar/Pound Sterling rate strengthening from an average of 0.7270 in 2021 to 0.8120 in 2022. Overall currency movements resulted in an unfavourable net foreign currency translation impact on our results as shown in the table on page 63. The average and year end 2022 exchange rates of the major currencies impacting on the Group are set out on page 190.
Because of the impact of acquisitions, divestments, exchange translation and other non‑recurring items on reported results each year, the Group uses organic revenue, organic operating profit and organic EBITDA (as defined)* as additional performance indicators to assess performance of pre‑existing (also referred to as underlying, heritage, like‑for‑like or ongoing) operations each year.
Organic revenue, organic operating profit and organic EBITDA (as defined)* are arrived at by excluding the incremental revenue, operating profit and EBITDA (as defined)* contributions from current and prior year acquisitions and divestments, the impact of exchange translation, the impact of impairment and the impact of any one-off items. In the Business Performance section on pages 60 to 79, changes in organic revenue, organic operating profit and organic EBITDA (as defined)* are presented as additional measures of revenue, operating profit and EBITDA (as defined)* to provide a greater understanding of the performance of the Group. Organic change % is calculated by expressing the organic movement as a percentage of the prior year (adjusted for exchange effects). A reconciliation of the changes in organic revenue, organic operating profit and organic EBITDA (as defined)* to the changes in total revenue, operating profit and EBITDA (as defined)* for the Group and by segment, is presented with the discussion of each segment’s performance in tables contained in the segment discussion commencing on page 60.
Revenue from products with enhanced sustainability attributes (i.e., excluding contracting, distribution, and other services) is defined as product revenue derived from those products that incorporate any, or a combination of; recycled materials; are produced using alternative energy and fuel sources; have a lower-carbon footprint as compared to those produced using traditional manufacturing processes; and/or are designed to specifically benefit the environment (i.e. water treatment and management systems, products with strong thermal mass/U-values). This measure as calculated on page 259 is monitored by management and is an aid to investors in their analysis of the performance of the Group and their understanding of how much of the product revenue of the Group meets any of these attributes.
Cash paid to Shareholders. Cash paid to shareholders is a measure of cash returned to shareholders representing dividends of $0.9 billion (2021: $0.9 billion) paid during the year and excess cash of $1.2 billion (2021: $0.9 billion) returned through the share buyback programme. The metric provides information on dividend growth for shareholders and is reflective of CRH’s continued commitment to return excess cash to shareholders. CRH monitors the cash paid to shareholders as part of its overall capital allocation strategy.
Total Shareholder Return (TSR). TSR is a measure of shareholder returns delivery through the cycle. It represents the total accumulated value delivered to shareholders since the formation of the Group in 1970 (via gross dividends reinvested and share appreciation) and is calculated on page 259. The metric provides information on total returns for shareholders and is provided to assist investors in the comparison of the Group's performance with that of other companies.
* EBITDA is defined as earnings from continuing operations before interest, taxes, depreciation, amortisation, asset impairment charges, profit on disposals and the Group’s share of equity accounted investments’ profit after tax.
| | | | | |
| 2022 Annual Report and Form 20-F | 261 |
Supplemental Guarantor Information
Guarantor Financial Information
As of 31 December 2022, CRH plc (the ‘Guarantor’) has fully and unconditionally guaranteed certain debt securities issued by CRH America, Inc. (the ‘Issuer’), including:
•US$300 million 6.40% Notes due 2033 – listed on Euronext Dublin (i) (the 'Notes')
(i)Originally issued as a US$300 million bond in September 2003. Subsequently in August 2009 and December 2010, US$87 million of the issued Notes were acquired by CRH plc as part of liability management exercises undertaken.
CRH America, Inc. is 100% owned by the Company (CRH plc). The Notes are fully and unconditionally guaranteed by CRH plc as defined in the indentures governing the Notes.
The Notes are unsecured and rank equally with all other present and future unsecured and unsubordinated obligations of CRH America, Inc and CRH plc, subject to exceptions for obligations preferred by law.
The guarantee is a full, irrevocable and unconditional guarantee of the principal, interest, premium, if any, and any other amounts payable in respect of the Notes given by CRH plc.
CRH plc also fully and unconditionally guarantees securities issued by CRH America Finance, Inc., which is a 100% owned finance subsidiary of CRH plc.
Basis of Presentation
The following summarised financial information reflects, on a combined basis, the Balance Sheet as at 31 December 2022 and the Income Statement for the year ended 31 December 2022 of CRH America, Inc and CRH plc, which guarantees the registered debt; collectively the ‘Obligor Group’.
Intercompany balances and transactions within the Obligor Group have been eliminated in the summarised financial information below. Amounts attributable to the Obligor Group’s investment in non‑obligor subsidiaries have also been excluded. Intercompany receivables/payables and transactions with non‑obligor subsidiaries are separately disclosed as applicable.
This summarised financial information has been prepared and presented pursuant to the Securities and Exchange Commission Regulation S‑X Rule 13‑01 and is not intended to present the financial position and results of operations of the Obligor Group in accordance with IFRS.
The summarised Income Statement information for the year ended 31 December 2022 is as follows:
| | | | | |
| For the year ended 31 December 2022 |
| $m |
Profit before tax from continuing operations (i) | 641 |
- of which relates to transactions with non-obligor subsidiaries | 704 |
Profit for the financial year – all of which is attributable to equity holders of the Company | 636 |
- of which relates to transactions with non-obligor subsidiaries | 704 |
(i) Revenue and Gross Profit for the Obligor Group for the year ended 31 December 2022 amounted to $nil million.
| | | | | |
The summarised Balance Sheet information as at the 31 December 2022 is as follows: |
| As at 31 December 2022 |
| $m |
Current assets | 1,919 |
Current assets – of which is due from non-obligor subsidiaries | 158 |
Non‑current assets | 2,835 |
Non‑current assets – of which is due from non-obligor subsidiaries | 2,835 |
Current liabilities | 1,312 |
Current liabilities – of which is due to non-obligor subsidiaries | 1,007 |
Non‑current liabilities | 2,009 |
Non‑current liabilities – of which is due to non-obligor subsidiaries | nil |
| | | | | |
| 2022 Annual Report and Form 20-F | 262 |
Mineral Reserves and Resources
Mineral Reserves and Resources Background
The Group’s mineral reserves (reserves) and mineral resources (resources) for the production of primary building materials (which encompasses aggregates (stone, sand and gravel), cement and lime, asphalt, readymixed concrete and concrete products) fall into a variety of categories spanning a wide number of rock types and geological classifications. These reserves and resources are found within our extensive network of quarry locations in attractive local markets globally. This disclosure of the Group’s mining properties has been prepared in accordance with the requirements of subpart 1300 of Regulation S-K (“Subpart 1300”). The Group has 1,235 properties with 90,293 hectares of owned and 38,613 hectares of leased land, respectively, as disclosed in the table on page 265, the locations of which are presented by geographic location in the maps on pages 266 to 267.
None of CRH’s mineral‑bearing properties are individually material to the Group as at 31 December 2022. A summary disclosure of CRH’s mining operations is provided on pages 263 to 267.
As at 31 December 2022, the Group’s reserves and resources estimations of 22.8 billion tonnes and 9.8 billion tonnes, respectively, as disclosed on pages 263 to 264, are calculated in accordance with Subpart 1300. The Group’s reserves and resources disclosures may not be comparable to similar disclosures disclosed in accordance with the requirements of other countries and should be read in conjunction with the disclosures that follow on pages 263 to 267.
CRH operates predominantly production stage properties, with a limited number of development and exploration stage properties, as such terms are defined in Subpart 1300. Predominantly, CRH’s production stage properties provide raw materials for on-site modern cement, lime and aggregates producing facilities. Almost exclusively, CRH utilises surface mining and, with a very limited number of exceptions, CRH and its subsidiaries are the only operators of the properties.
Reserves
Reserves are defined in Subpart 1300 as “an estimate of tonnage and grade or quality of indicated and measured mineral resources that, in the opinion of the qualified person, can be the basis of an economically viable project. More specifically, it is the economically mineable part of a measured or indicated mineral resource, which includes diluting materials and allowances for losses that may occur when the material is mined or extracted”. Reserves are classified into two categories, probable and proven reserves, in order of increasing geological confidence.
The Group’s estimate of 22.8 billion tonnes of reserves, as disclosed on page 263 analysed by rock type (Hard rock, Sand & Gravel and Other), are of recoverable stone, sand, and gravel of suitable quality for economic extraction, based on drilling and studies by the Group’s geologists and engineers. These estimates also consider reasonable economic and operating constraints as to maximum depth of overburden and stone excavation and are subject to permitting or other restrictions.
The disclosed reserves and resources estimations which include diluting materials and allowances for losses that may occur when the mineral is mined, extracted or processed have been estimated by qualified persons, as such term is defined within Subpart 1300.
Not all minerals that may be on CRH’s mineral-bearing properties have been assessed and such properties may be assessed for mineral reserves or resources in future years, as required by operational needs.
CRH’s properties are subject to a wide variety of permitting procedures and conditions, which vary between jurisdictions. Many of CRH’s properties require separate permits from multiple authorities, including but not limited to environmental, mining, regional and national administrative authorities. The periods of validity and the conditions of these permits may be different.
Resources
A mineral resource is defined in Subpart 1300 as "a concentration or occurrence of material of economic interest in or on the Earth's crust in such form, grade or quality, and quantity that there are reasonable prospects for economic extraction. A mineral resource is a reasonable estimate of mineralisation, taking into account relevant factors such as cut-off grade, likely mining dimensions, location or continuity, that, with the assumed and justifiable technical and economic conditions, is likely to, in whole or in part, become economically extractable". Resources are classified into three categories, inferred, indicated or
measured resources, in order of increasing geological confidence. Indicated or measured resources can be converted to reserves by the application of certain modifying factors which include, but are not limited to, consideration of mining, processing, metallurgical, infrastructure, economic, marketing, legal, environmental compliance, plans, negotiations, or agreements with local individuals or groups, and governmental factors. There is no certainty that any of the resources disclosed on page 264 will be converted into reserves. Resources have not been fully assessed using modifying factors, however, an initial assessment has been completed in accordance with Subpart 1300.
Internal Controls
CRH has established appropriate governance processes to support the publication of our 2022 reserves and resources disclosures, reserve and resource estimates are subject to annual review by each of the relevant operating companies across the Group in conjunction with the relevant qualified persons. CRH has established and maintains a number of internal controls to address the risks inherent in the mineral reserves and resources reporting process. These internal controls have been embedded into the local control environments and operate across the business, including controls at an Operating Company, Divisional and Group level.
As CRH’s reserves and resources are predominantly in production stage properties, features of the internal controls relating to quality assurance and quality control (QA/QC) include:
•Databases and data repositories for exploration and/or production data that contain accurate and precise data from which reserves and resources can be evaluated, and operational plans can be developed;
•Verification sampling and testing of known mineralisation. This is generally required to establish compliance with regulation on product qualities. Verification testing confirms geological maps prepared during earlier exploration programmes; and
•In the case of cement raw materials, facility laboratories participate in an externally managed annual review process with ISO 17025 accredited independent laboratories
When exploration programmes are conducted, QA/QC measures include:
•Ensuring that surface or drill sampling results in the highest quality sample possible. This would include down-hole surveying of drill holes as necessary;
•Obtaining pictures of drill sample (e.g. core) for future reference;
•Geological core logging prior to laboratory analysis. Description of sample at various intervals;
•Ensuring the integrity of samples from point of origin to analytical laboratory; and
•Using nationally or regionally accredited laboratories for all analyses and tests for exploration programmes in properties containing aggregates
In addition, to provide further assurance over the Group’s mineral reserves and resources reporting process, the Group’s Internal Audit function completed a limited scope review across a sample of material reporting entities on the operation of these internal controls as at 31 December 2022.
| | | | | |
| 2022 Annual Report and Form 20-F | 263 |
The table below presents, by segment and geographic location, the tonnes of proven and probable aggregates, cement and lime mineral reserves as at 31 December 2022 and the related percentages by rock type.
| | | | | | | | | | | | | | | | | | | | | | | | | | | | | | | | | | | | | | | | | | | | | | | | | | |
| Reserves |
| | | Proven | | Probable | | Total Reserves (i) (ii) |
| Country | | Tonnes (iii) | Grade: % by rock type | | Tonnes (iii) | Grade: % by rock type |
| Tonnes (iii) | Grade: % by rock type |
| | | | Hard Rock | Sand & Gravel | Other | | | Hard Rock | Sand & Gravel | Other | | | Hard Rock | Sand & Gravel | Other |
| Aggregates | | | | | | | | | | | | | | | | |
| Finland | | 165 | 80 | % | 20 | % | — | | 41 | 81 | % | 19 | % | — | | 206 | 80 | % | 20 | % | — |
| France | | 202 | 58 | % | 42 | % | — | | — | — | — | — | | 202 | 58 | % | 42 | % | — |
| Ireland | | 653 | 94 | % | 6 | % | — | | 276 | 54 | % | 46 | % | — | | 929 | 82 | % | 18 | % | — |
| Philippines | | 49 | 100 | % | — | — | | 5 | 100 | % | — | — | | 54 | 100 | % | — | — |
Europe Materials | Poland | | 120 | 100 | % | — | — | | — | — | — | — | | 120 | 100 | % | — | — |
| Romania | | 10 | 90 | % | 10 | % | — | | 38 | 96 | % | 4 | % | — | | 48 | 95 | % | 5 | % | — |
| Spain | | 55 | 100 | % | — | — | | 24 | 100 | % | — | — | | 79 | 100 | % | — | — |
| UK | | 605 | 80 | % | 20 | % | — | | 806 | 92 | % | 8 | % | — | | 1,411 | 87 | % | 13 | % | — |
| Other (iv) | | 107 | 27 | % | 73 | % | — | | 180 | 44 | % | 56 | % | — | | 287 | 37 | % | 63 | % | — |
Americas Materials | Canada | | 508 | 77 | % | 23 | % | — | | 192 | 83 | % | 17 | % | — | | 700 | 78 | % | 22 | % | — |
| US | | 6,964 | 76 | % | 16 | % | 8 | % | | 8,505 | 87 | % | 8 | % | 5 | % | | 15,469 | 81 | % | 12 | % | 7 | % |
| Subtotal | | | 9,438 | 77 | % | 17 | % | 6 | % | | 10,067 | 85 | % | 10 | % | 5 | % | | 19,505 | 82 | % | 13 | % | 5 | % |
| Cement | | | | | | | | | | | | | | | | |
| France | | 64 | 100 | % | — | — | | 2 | 100 | % | — | — | | 66 | 100 | % | — | — |
| Germany | | 19 | 100 | % | — | — | | — | — | — | — | | 19 | 100 | % | — | — |
| Ireland | | 174 | 93 | % | — | 7 | % | | 1 | 43 | % | — | 57 | % | | 175 | 93 | % | — | 7 | % |
| Philippines | | 291 | 98 | % | — | 2 | % | | 194 | 97 | % | — | 3 | % | | 485 | 98 | % | — | 2 | % |
| Poland | | 132 | 93 | % | 6 | % | 1 | % | | 48 | 93 | % | 6 | % | 1 | % | | 180 | 93 | % | 6 | % | 1 | % |
Europe Materials | Romania | | 40 | 91 | % | 1 | % | 8 | % | | 203 | 93 | % | 6 | % | 1 | % | | 243 | 93 | % | 5 | % | 2 | % |
| Serbia | | 103 | 100 | % | — | — | | — | — | — | — | | 103 | 100 | % | — | — |
| Slovakia | | 76 | 99 | % | — | 1 | % | | 234 | 92 | % | — | 8 | % | | 310 | 94 | % | — | 6 | % |
| Spain | | 12 | 100 | % | — | — | | 87 | 100 | % | — | — | | 99 | 100 | % | — | — |
| Switzerland | | 84 | 100 | % | — | — | | — | — | — | — | | 84 | 100 | % | — | — |
| Ukraine | | 68 | 100 | % | — | — | | 25 | 100 | % | — | — | | 93 | 100 | % | — | — |
| UK | | 181 | 98 | % | — | 2 | % | | 75 | 90 | % | — | 10 | % | | 256 | 96 | % | — | 4 | % |
Americas Materials | Canada | | 210 | 100 | % | — | – | | 22 | 100 | % | — | — | | 232 | 100 | % | — | — |
| US | | 524 | 100 | % | — | — | | 81 | 100 | % | — | — | | 605 | 100 | % | — | — |
| Subtotal | | | 1,978 | 98 | % | — | 2 | % | | 972 | 93 | % | 1 | % | 6 | % | | 2,950 | 96 | % | 1 | % | 3 | % |
| Lime | | | | | | | | | | | | | | | | |
Europe Materials | Germany | | 202 | 100 | % | — | — | | 52 | 100 | % | — | — | | 254 | 100 | % | — | — |
Ireland, Poland, UK, Czech Republic | | 67 | 100 | % | — | — | | 20 | 100 | % | — | — | | 87 | 100 | % | — | — |
| | | | | | | | | | | | | | |
| Subtotal | | | 269 | 100 | % | — | — | | 72 | 100 | % | — | — | | 341 | 100 | % | — | — |
| Total | | | 11,685 | 81 | % | 14 | % | 5 | % | | 11,111 | 86 | % | 9 | % | 5 | % | | 22,796 | 83 | % | 12 | % | 5 | % |
(i)CRH has no individually material mineral‑bearing properties requiring individual property disclosure under Subpart 1300.
(ii)CRH’s point of reference for the estimation of the Group’s mineral reserves is “in‑situ” reserves.
(iii)All reserves quantities are quoted in millions of tonnes.
(iv)Other includes Denmark, Slovakia and Switzerland.
CRH’s mineral reserves and resources are used predominantly for the production and sale of aggregates, cement and lime. The average sales price for the period 1 January 2022 to 31 October 2022 for aggregates and cement was $9.3 and $93.8 per tonne, respectively, for our Europe Materials businesses and $14.5 and $133.7 per tonne, respectively, for our Americas Materials businesses. The average sales price for lime within our Europe Materials businesses over this time period was $138.8 per tonne. These prices, which are used for estimation of both mineral reserves and resources, are impacted by product mix, geographic location and foreign currency.
| | | | | |
| 2022 Annual Report and Form 20-F | 264 |
Mineral Reserves and Resources continued
The table below presents, by segment and geographic location, the tonnes of measured, indicated, and inferred aggregates, cement and lime resources as at 31 December 2022 and the related percentage of these resources by rock type. CRH’s mineral resources in the table below are disclosed exclusive of mineral reserves.
| | | | | | | | | | | | | | | | | | | | | | | | | | | | | | | | | | | | | | | | | | | | | | | | | | | | | | | | | | | | | | | | | | | | |
| Resources |
| | Measured | | Indicated | | Total Measured & Indicated | | Inferred | | Total Resources
(i) (ii) |
| Country | Tonnes (iii) | Grade: % by rock type | | Tonnes (iii) | Grade: % by rock type | | Tonnes (iii) | Grade: % by rock type | | Tonnes (iii) | Grade: % by rock type | |
| | | Hard Rock | Sand & Gravel | Other | | | Hard Rock | Sand & Gravel | Other | | | Hard Rock | Sand & Gravel | Other | | | Hard Rock | Sand & Gravel | Other | |
| Aggregates | | | | | | | | | | | | | | | | | | | | | |
| Finland | 1 | 100 | % | — | — | | — | — | — | — | | 1 | 100 | % | — | — | | — | — | — | — | | 1 |
| France | 39 | 58 | % | 42 | % | — | | — | — | — | — | | 39 | 58 | % | 42 | % | — | | — | — | — | — | | 39 |
| Ireland | 90 | 13 | % | 87 | % | — | | 237 | 95 | % | 5 | % | — | | 327 | 73 | % | 27 | % | — | | 110 | 97 | % | 3 | % | — | | 437 |
Europe Materials | Philippines | 26 | 100 | % | — | — | | 2 | 100 | % | — | — | | 28 | 100 | % | — | — | | — | 100 | % | — | — | | 28 |
| Romania | 66 | 96 | % | 4 | % | — | | 56 | 82 | % | 18 | % | — | | 122 | 90 | % | 10 | % | — | | 34 | 83 | % | 17 | % | — | | 156 |
| UK | 167 | 12 | % | 88 | % | — | | 286 | 70 | % | 29 | % | 1 | % | | 453 | 48 | % | 51 | % | 1 | % | | 202 | 87 | % | 13 | % | — | | 655 |
| Other (iv) | 176 | 64 | % | 36 | % | — | | — | — | — | — | | 176 | 64 | % | 36 | % | — | | 8 | — | 100 | % | — | | 184 |
Americas Materials | Canada | 255 | 90 | % | 10 | % | — | | 46 | 93 | % | 7 | % | — | | 301 | 90 | % | 10 | % | — | | 273 | 100 | % | — | — | | 574 |
| US | 679 | 92 | % | 6 | % | 2 | % | | 1,421 | 86 | % | 13 | % | 1 | % | | 2,100 | 88 | % | 10 | % | 2 | % | | 3,736 | 76 | % | 22 | % | 2 | % | | 5,836 |
| Subtotal | | 1,499 | 74 | % | 25 | % | 1 | % | | 2,048 | 85 | % | 14 | % | 1 | % | | 3,547 | 80 | % | 19 | % | 1 | % | | 4,363 | 78 | % | 20 | % | 2 | % | | 7,910 |
| Cement | | | | | | | | | | | | | | | | | | | | | | |
| France | 25 | 100 | % | — | — | | — | 100 | % | — | — | | 25 | 100 | % | — | — | | — | 100 | % | — | — | | 25 |
| Germany | 4 | 100 | % | — | — | | — | — | — | — | | 4 | 100 | % | — | — | | — | — | — | — | | 4 |
| Ireland | 102 | 100 | % | — | — | | 21 | 100 | % | — | — | | 123 | 100 | % | — | — | | 28 | 92 | % | 8 | % | — | | 151 |
Europe Materials | Romania | 87 | 93 | % | — | 7 | % | | 87 | 100 | % | — | — | | 174 | 96 | % | — | 4 | % | | 16 | 99 | % | — | 1 | % | | 190 |
| Slovakia | 131 | 99 | % | — | 1 | % | | 19 | — | — | 100 | % | | 150 | 87 | % | — | 13 | % | | 43 | 100 | % | — | — | | 193 |
| Switzerland | 20 | 96 | % | 4 | % | — | | — | — | — | — | | 20 | 96 | % | 4 | % | — | | — | — | — | — | | 20 |
| Ukraine | 69 | 100 | % | — | — | | — | — | — | — | | 69 | 100 | % | — | — | | 45 | 100 | % | — | — | | 114 |
| UK | 4 | 100 | % | — | — | | 45 | 86 | % | — | 14 | % | | 49 | 87 | % | — | 13 | % | | 45 | 100 | % | — | — | | 94 |
Americas Materials | Canada | 54 | 91 | % | — | 9 | % | | 1 | 100 | % | — | — | | 55 | 91 | % | — | 9 | % | | 2 | 100 | % | — | — | | 57 |
| US | 14 | 100 | % | — | — | | 29 | 100 | % | — | — | | 43 | 100 | % | — | — | | 130 | 100 | % | — | — | | 173 |
| Subtotal | | 510 | 98 | % | — | 2 | % | | 202 | 87 | % | — | 13 | % | | 712 | 95 | % | — | 5 | % | | 309 | 99 | % | 1 | % | — | | 1,021 |
| Lime | | | | | | | | | | | | | | | | | | | | | | |
Europe Materials | Germany | 484 | 100 | % | — | — | | 207 | 100 | % | — | — | | 691 | 100 | % | — | — | | 111 | 100 | % | — | — | | 802 |
Ireland, Poland, UK, Czech Republic | 28 | 100 | % | — | — | | — | — | — | — | | 28 | 100 | % | — | — | | 18 | 100 | % | — | — | | 46 |
| Subtotal | | 512 | 100 | % | — | — | | 207 | 100 | % | — | — | | 719 | 100 | % | — | — | | 129 | 100 | % | — | — | | 848 |
| Total | | 2,521 | 84 | % | 15 | % | 1 | % | | 2,457 | 86 | % | 12 | % | 2 | % | | 4,978 | 85 | % | 13 | % | 2 | % | | 4,801 | 80 | % | 18 | % | 2 | % | | 9,779 |
(i)CRH has no individually material mineral‑bearing properties requiring individual property disclosure under Subpart 1300.
(ii)CRH’s point of reference for the estimation of the Group’s mineral resources is “in‑situ” resources.
(iii)All resources quantities are quoted in millions of tonnes.
(iv)Other includes Denmark, Slovakia and Switzerland.
| | | | | |
| 2022 Annual Report and Form 20-F | 265 |
The table below outlines the number of facilities by segment and geographic location along with the annualised extraction (in millions of tonnes) for each of the three years ending 31 December 2022.
| | | | | | | | | | | | | | | | | | | | | | | | | | | | | | | | | | | | | | | | | | | | |
|
Country | No. of Quarries/pits | | Surface acreage (hectares) (i) (ii) | | Annualised extraction (millions of tonnes) | | Years to Depletion (iii) |
| | | | Owned | | Leased | | 2020 | | 2021 | | 2022 | | |
| Aggregates | | | | | | | | | | | | | | |
| Finland | 93 | | 1,222 | | 953 | | 10.8 | | 10.0 | | 11.3 | | 18 |
| France | 41 | | 849 | | 1,181 | | 5.5 | | 7.0 | | 6.9 | | 29 |
| Ireland | 87 | | 5,107 | | 450 | | 13.7 | | 19.4 | | 20.4 | | 46 |
| Philippines | 1 | | - | | 178 | | - | | - | | - | | - |
Europe Materials | Poland | 2 | | 207 | | 10 | | 3.3 | | 3.4 | | 3.8 | | 31 |
| Romania | 16 | | 445 | | 197 | | 1.9 | | 2.1 | | 1.5 | | 31 |
| Spain | 8 | | 57 | | 110 | | 0.9 | | 1.2 | | 1.2 | | 68 |
| UK | 172 | | 8,567 | | 6,200 | | 32.4 | | 42.0 | | 37.1 | | 38 |
| Other (iv) | 21 | | 599 | | 261 | | 4.4 | | 4.8 | | 5.8 | | 50 |
Americas Materials | Canada | 36 | | 6,018 | | 734 | | 18.9 | | 17.4 | | 18.6 | | 38 |
| US | 684 | | 52,525 | | 26,023 | | 133.9 | | 177.2 | | 184.3 | | 84 |
| Subtotal | | 1,161 | | 75,596 | | 36,297 | | 225.7 | | 284.5 | | 290.9 | | |
| Cement | | | | | | | | | | | | | | |
| France | 3 | | 706 | | 31 | | 2.5 | | 3.8 | | 2.5 | | 27 |
| Germany | 1 | | 83 | | - | | 2.3 | | 2.6 | | 1.0 | | 18 |
| Ireland | 3 | | 1,128 | | - | | 3.1 | | 3.3 | | 3.9 | | 45 |
| Philippines | 5 | | 977 | | 212 | | 6.7 | | 8.4 | | 6.6 | | 74 |
| Poland | 1 | | 414 | | - | | 4.0 | | 4.3 | | 4.2 | | 42 |
| Europe Materials | Romania | 6 | | 301 | | 170 | | 4.2 | | 4.8 | | 3.4 | | 73 |
| Serbia | 2 | | 119 | | 41 | | 1.2 | | 1.2 | | 1.2 | | 88 |
| Slovakia | 5 | | 66 | | 309 | | 2.4 | | 2.8 | | 2.6 | | 118 |
| Spain | 2 | | 78 | | - | | 0.8 | | 1.0 | | 0.8 | | 123 |
| Switzerland | 3 | | 183 | | 25 | | 0.9 | | 1.0 | | 0.9 | | 89 |
| Ukraine | 9 | | - | | 974 | | 3.2 | | 3.8 | | 1.6 | | 59 |
| UK | 10 | | 1,301 | | 199 | | 4.4 | | 6.0 | | 5.8 | | 44 |
| Americas Materials | Canada | 3 | | 766 | | 7 | | 2.4 | | 2.3 | | 2.0 | | 119 |
| US | 9 | | 7,415 | | 325 | | 8.9 | | 9.8 | | 9.1 | | 66 |
| Subtotal | | 62 | | 13,537 | | 2,293 | | 47.0 | | 55.1 | | 45.6 | | |
| Lime | | | | | | | | | | | | | | |
| Europe Materials | Germany | 8 | | 680 | | 10 | | 6.1 | | 5.6 | | 5.7 | | 45 |
Ireland, Poland, UK, Czech Republic | 4 | | 480 | | 13 | | 3.1 | | 3.5 | | 3.1 | | 28 |
| Subtotal | | 12 | | 1,160 | | 23 | | 9.2 | | 9.1 | | 8.8 | | |
| Total | | 1,235 | | 90,293 | | 38,613 | | 281.9 | | 348.7 | | 345.3 | | |
(i)The disclosures in the table above include the surface area of infrastructure, process plants, waste piles, water storage, water treatment plants and boundary areas of CRH’s mineral-bearing properties. Remote properties such as offices, distribution facilities and readymixed concrete plants are not included.
(ii)1 hectare equals approximately 2.47 acres.
(iii)Years to depletion is based on the average of the three years' 2020 to 2022 annualised extraction.
(iv)Other includes Denmark, Slovakia and Switzerland.
| | | | | |
| 2022 Annual Report and Form 20-F | 266 |
CRH Mineral Locations
| | | | | |
| 2022 Annual Report and Form 20-F | 267 |
| | | | | |
| 2022 Annual Report and Form 20-F | 268 |
Property, Plants and Equipment
At 17 February 2023, CRH had a total of 3,159 building materials production locations. 1,043 locations are leased, with the remaining 2,116 locations held on a freehold basis. The significant subsidiary locations as at 31 December 2022 are the cement facilities in the US, Philippines, Poland, Ukraine, the UK, Romania, Canada, Ireland, Slovakia and France. The clinker (the key intermediate product in the manufacture of cement) capacity for these locations is set out in the table below. Further details on locations and products manufactured are provided on pages 294 and 295. None of CRH’s individual properties is of material significance to the Group.
CRH believes that all the facilities are in good condition, adequate for their purpose and suitably utilised according to the individual nature and requirements of the relevant operations. CRH has a continuing programme of improvements and replacements to properties when considered appropriate to meet the needs of the individual operations. Further information in relation to the Group’s accounting policy and process governing any impairment of property, plant and equipment is given on page 182 and in note 13 to the Consolidated Financial Statements on page 208.
Sources and Availability of Raw Materials
CRH generally owns or leases the real estate on which its main raw materials, namely aggregates, are found. CRH is a significant purchaser of certain important materials or resources such as cement, bitumen, steel, gas, fuel and other energy supplies, the cost of which can fluctuate significantly and consequently have an adverse impact on CRH’s business. CRH is not generally dependent on any one source for the supply of these materials or resources, other than in certain jurisdictions with regard to the supply of gas and electricity. Competitive markets generally exist in the jurisdictions in which CRH operates for the supply of cement, bitumen, steel and fuel.
Mine Safety Disclosures
The information concerning mine safety violations and other regulatory matters required by Section 1503(a) of the Dodd‑Frank Wall Street Reform and Consumer Protection Act is included in Exhibit 16 to CRH’s Annual Report on Form 20‑F, as filed with the Securities and Exchange Commission (SEC).
Significant Locations – Clinker Capacity
| | | | | | | | | | | |
Subsidiary | Country | Number of plants | Clinker capacity (tonnes per hour) |
| Ash Grove | United States | 10 | 1,169 |
| Republic Cement | Philippines | 5 | 628 |
| Grupa Ożarów | Poland | 1 | 342 |
| Podilsky Cement PJSC | Ukraine | 1 | 325 |
| Tarmac | United Kingdom | 3 | 306 |
| ROMCIM | Romania | 2 | 305 |
| Ash Grove | Canada | 2 | 288 |
| Irish Cement | Ireland | 2 | 288 |
| Danucem | Slovakia | 2 | 277 |
| Eqiom | France | 3 | 243 |
| | | | | |
| 2022 Annual Report and Form 20-F | 269 |
Corporate Governance Practices
Compliance Statement
Non‑US companies such as CRH are exempt from most of the corporate governance rules of the NYSE. In common with companies listed on the LSE and Euronext Dublin, CRH’s corporate governance practices reflect, inter alia, compliance with (a) domestic company law; (b) the Listing Rules of the UK Financial Conduct Authority and Euronext Dublin; and (c) the 2018 UK Corporate Governance Code, which is appended to the listing rules of the LSE and Euronext Dublin.
The Board of CRH has adopted a robust set of governance principles, which reflect the 2018 Code and its principles‑based approach to corporate governance. Accordingly, the way in which CRH makes determinations of Directors’ independence differs from the NYSE rules. The Board has determined that, in its judgement, all of the non‑executive Directors are independent. In doing so the Board did not explicitly take into consideration the independence requirements outlined in the NYSE’s listing standards. However, the Board has determined that all of the non-executive Directors on the Audit Committee are independent according to the requirements of Rule 10A-3 of the US Securities Exchange Act of 1934. Further, CRH considers that the Terms of Reference for its Audit Committee, Remuneration Committee and Nomination and Corporate Governance Committee are generally responsive to the relevant NYSE rules, but may not address all aspects of such rules.
Shareholder Approval of Equity Compensation Plans
The NYSE rules require that shareholders must be given the opportunity to vote on all equity‑compensation plans and material revisions to those plans with certain limited exceptions. CRH complies with Irish requirements, which are similar to the NYSE rules. The Board, however, does not explicitly take into consideration the NYSE’s detailed definition on what are considered “material revisions”.
Risk Management and Internal Control
The Board has delegated responsibility for monitoring the effectiveness of the Group’s risk management and internal control systems to the Audit Committee1. Such systems are designed to manage rather than eliminate the risk of failure to achieve business objectives and, in the case of internal control systems, can provide only reasonable and not absolute assurance against material misstatement or loss. The Consolidated Financial Statements are prepared subject to oversight and control of the Chief Financial Officer, who seeks to ensure that data is captured from Group locations and all required information for disclosure in the Consolidated Financial Statements is provided. An appropriate control framework has been put in place around the recording of appropriate consolidation journals and other adjustments. The Consolidated Financial Statements are reviewed by the internal CRH Financial Reporting and Disclosure Group prior to being reviewed by the Chief Financial Officer and Audit Committee and approved by the Board of Directors.
Group management has responsibility for major strategic development and financing decisions. Responsibility for operational issues is devolved, subject to limits of authority, to product group and operating company management. Management at all levels is responsible for internal control over the business functions that have been delegated. This embedding of the system of internal control throughout the Group’s operations is designed to enable the organisation to respond quickly to evolving business risks, and to ensure that significant internal control issues, should they arise, are reported promptly to appropriate levels of management.
Management's Report on Internal Control over Financial Reporting
In accordance with the requirements of Rule 13a-15 of the US Securities Exchange Act, the following report is provided by management in respect of the Company’s internal control over financial reporting. As defined by the SEC, internal control over financial reporting is a process designed by, or under the supervision of, the Company’s principal executive and principal financial officers, or persons performing similar functions, and effected by the Company’s Board of Directors, management and other personnel, to provide reasonable assurance regarding the reliability of financial reporting and the preparation of the
1. In accordance with Section 167(7) of the Companies Act 2014.
Consolidated Financial Statements for external purposes in accordance with generally accepted accounting principles and includes those policies and procedures that:
•pertain to the maintenance of records that in reasonable detail accurately and fairly reflect the transactions and dispositions of the assets of the Company;
•provide reasonable assurance that transactions are recorded as necessary to permit preparation of the Consolidated Financial Statements in accordance with generally accepted accounting principles, and that receipts and expenditures of the Company are being made only in accordance with authorisations of management and Directors of the Company; and
•provide reasonable assurance regarding prevention or timely detection of unauthorised acquisition, use or disposition of the Company’s assets that could have a material effect on the Consolidated Financial Statements
Our management is responsible for establishing and maintaining adequate internal control over financial reporting as defined in Rules 13a-15(f) and 15d-15(f) under the US Securities Exchange Act. Our internal control system was designed to provide reasonable assurance regarding the reliability of financial reporting and the preparation of our Company’s published Consolidated Financial Statements for external purposes under generally accepted accounting principles. In connection with the preparation of the Company’s annual Consolidated Financial Statements, management has undertaken an assessment of the effectiveness of the Company’s internal control over financial reporting as of 31 December 2022, based on criteria established in the Internal Control Integrated Framework (2013), issued by the Committee of Sponsoring Organisations of the Treadway Commission.
As permitted by the SEC, the Company has elected following a qualitative and quantitative review to exclude an assessment of the internal controls of the material acquisition made during the year 2022, being Barrette. The acquisition of Barrette represented 3.4% and 5.0% of total and net Group assets, respectively, and 1.1% of Group revenue. Its loss reduced Group profit by less than 1.0% for the financial year then ended.
Management’s assessment included an evaluation of the design of the Company’s internal control over financial reporting and testing of the operational effectiveness of those controls. Based on this assessment, management has concluded and hereby reports that as of 31 December 2022, the Company’s internal control over financial reporting is effective. Our auditor, Deloitte, a registered public accounting firm, who have audited the Consolidated Financial Statements for the year ended 31 December 2022, have audited the effectiveness of the Company’s internal controls over financial reporting. Their report, on which an unqualified opinion is expressed thereon, is included on page 175.
Changes in Internal Control over Financial Reporting
During 2022, there has been no change in our internal control over financial reporting identified in connection with the evaluation required by Rules 13a-15 that occurred during the period covered by this Annual Report and Form 20‑F that has materially affected, or is reasonably likely to materially affect, our internal control over financial reporting.
Evaluation of Disclosure Controls and Procedures
Management has evaluated the effectiveness of the design and operation of the disclosure controls and procedures as defined in Exchange Act Rule 13a-15(e) as of 31 December 2022. Based on that evaluation, the Chief Executive and the Chief Financial Officer have concluded that these disclosure controls and procedures were effective as of such date at the level of providing reasonable assurance.
In designing and evaluating our disclosure controls and procedures, management, including the Chief Executive and the Chief Financial Officer, recognised that any controls and procedures, no matter how well designed and operated, can provide only reasonable assurance of achieving the desired control objectives, and management necessarily was required to apply its judgement in evaluating the cost‑benefit relationship of possible controls and procedures. Because of the inherent limitations in all control systems, no evaluation of controls can provide absolute assurance that all control issues and instances of fraud, if any, within the Company have been detected.
| | | | | |
| 2022 Annual Report and Form 20-F | 270 |
[THIS PAGE INTENTIONALLY LEFT BLANK]
| | | | | |
| 2022 Annual Report and Form 20-F | 271 |
[THIS PAGE INTENTIONALLY LEFT BLANK]
| | | | | |
| 2022 Annual Report and Form 20-F | 272 |
[THIS PAGE INTENTIONALLY LEFT BLANK]
| | | | | |
| 2022 Annual Report and Form 20-F | 273 |
[THIS PAGE INTENTIONALLY LEFT BLANK]
| | | | | |
| 2022 Annual Report and Form 20-F | 274 |
Contractual Obligations
An analysis of the maturity profile of debt, leases capitalised, purchase obligations, deferred and contingent acquisition consideration and pension scheme contribution commitments at 31 December 2022 is as follows:
| | | | | | | | | | | | | | | | | |
Payments due by period | Total | Less than 1 year | 1-3 years | 3-5 years | More than 5 years |
| $m | $m | $m | $m | $m |
Interest‑bearing loans and borrowings (i) | 9,732 | 1,502 | 1,949 | 1,697 | 4,584 |
Lease liabilities (ii) | 1,673 | 263 | 371 | 241 | 798 |
Estimated interest payments on contractually‑committed debt (iii) | 2,706 | 285 | 496 | 387 | 1,538 |
Deferred and contingent acquisition consideration | 329 | 30 | 172 | 2 | 125 |
Purchase obligations (iv) | 2,080 | 1,282 | 360 | 159 | 279 |
Retirement benefit obligation commitments (v) | 23 | 3 | 6 | 5 | 9 |
Total (vi) | 16,543 | 3,365 | 3,354 | 2,491 | 7,333 |
(i)Of the $9.7 billion total gross debt, $0.1 billion is drawn on revolving facilities which may be repaid and redrawn up to the date of maturity. The interest payments are estimated assuming these loans are repaid on facility maturity dates.
(ii)Lease liabilities are presented on an undiscounted basis as detailed in note 20 and note 22 to the Consolidated Financial Statements.
(iii)These interest payments have been estimated on the basis of the following assumptions: (a) no change in variable interest rates; (b) no change in exchange rates; (c) that all debt is repaid as if it falls due from future cash generation; and (d) none is refinanced by future debt issuance.
(iv)Purchase obligations include contracted for capital expenditure. A summary of the Group’s future purchase commitments as at 31 December 2022 for capital expenditure is set out in note 13 to the Consolidated Financial Statements. These expenditures for replacement and new projects are in the ordinary course of business and will be financed from internal resources.
(v)These retirement benefit commitments comprise the contracted payments related to our pension schemes in the UK. See further details in note 28 to the Consolidated Financial Statements.
(vi)Over the long term, the Group believes that our available cash and cash equivalents, cash from operating activities, along with the access to borrowing facilities will be sufficient to fund our long‑term contractual obligations, maturing debt obligations and capital expenditures.
Quantitative and Qualitative Information about Market Risk
CRH measures the sensitivity of the Group’s interest rate swaps and debt obligations to changes in interest rates in a sensitivity analysis technique that measures the estimated impacts on the income statement and on equity of either an increase or decrease in market interest rates or a strengthening or weakening in the euro against all other currencies, from the rates applicable at 31 December 2022, for each class of financial instrument with all other variables remaining constant. The sensitivity analysis measures the estimated impact on profit before tax and on total equity arising on net year‑end floating rate debt and on year‑end equity, based on either an increase/decrease of 1% in floating interest rates or a 5% strengthening/weakening in the US Dollar/euro exchange rate. The US Dollar/euro rate has been selected for this sensitivity analysis given the materiality of the Group’s activities in euro. This analysis, set out in note 22 to the Consolidated Financial Statements, is for illustrative purposes only as in practice interest and foreign exchange rates rarely change in isolation.
Quantitative and qualitative information and sensitivity analysis of market risk is contained in notes 21 to 25 to the Consolidated Financial Statements.
Off-Balance Sheet Arrangements
CRH does not have any off‑balance sheet arrangements that have, or are reasonably likely to have a current or future effect on CRH’s financial condition, changes in financial condition, revenues or expenses, results of operations, liquidity, capital expenditures or capital resources that is material to investors.
| | | | | |
| 2022 Annual Report and Form 20-F | 275 |
Other Disclosures
History, Development and Organisational Structure of the Company
CRH resulted from the merger in 1970 of two leading Irish public companies, Cement Limited (established in 1936) and Roadstone Limited (incorporated in 1949). Cement Limited manufactured and supplied cement while Roadstone Limited was primarily involved in the manufacture and supply of aggregates, readymixed concrete, mortar, coated macadam, asphalt and contract surfacing to the Irish construction industry.
As a result of planned geographic diversification since the mid‑1970s, the Group has expanded by acquisition and organic growth into a leading manufacturer and supplier of building materials, products and integrated solutions with operations in 29 countries around the world.
The Company is incorporated and domiciled in Ireland. CRH is a public limited company operating under the Companies Act 2014 of Ireland. The Group’s worldwide headquarters is located in Dublin, Ireland. Our principal executive offices are located at Stonemason’s Way, Rathfarnham, Dublin 16, Ireland (telephone: +353 1 404 1000). The Company’s registered office is located at 42 Fitzwilliam Square, Dublin 2, Ireland and our US agent is CRH America, Inc., 900 Ashwood Parkway, Suite 600, Atlanta, Georgia 30338.
The Company is the holding company of the Group, with direct and indirect share and loan interests in subsidiaries, joint ventures and associates.
From Group headquarters, a small team of executives exercise strategic control over our decentralised operations.
In the detailed description of CRH’s business on pages 60 to 79, estimates of the Group’s various aggregates and stone reserves and resources have been provided by engineers employed by the individual operating companies. Further details are included on pages 262 to 267. Details of product end‑use by sector for each reporting segment are based on management estimates.
A listing of the principal subsidiary undertakings and equity accounted investments is contained on pages 290 to 293.
Statements Regarding Competitive Position and Construction Activity
Statements made in the Business Performance section and elsewhere in this document referring to the Group’s competitive position are based on the Group’s belief, and in some cases rely on a range of sources, including investment analysts’ reports, independent market studies and the Group’s internal assessment of market share based on publicly available information about the financial results and performance of market participants.
Unless otherwise specified, references to construction activity or other market activity relate to the relevant market as a whole and are based on publicly available information from a range of sources, including independent market studies, construction industry data and economic forecasts for individual jurisdictions.
Governmental Policies
The overall level of government capital expenditures and the allocation by state entities of available funds to different projects, as well as interest rate and tax policies, directly affect the overall levels of construction activity. The terms and general availability of government permits required to conduct Group business also has an impact on the scope of Group operations. As a result such governmental decisions and policies can have a significant impact on the operating results of the Group.
Exchange Rates
In this Annual Report and Form 20‑F, references to “US Dollar”, “US$”, “$”, “US cents”, “cent” or “c” are, unless otherwise stated, to the United States currency, references to “euro”, “euro cent” or “€” are to the euro currency and “Stg£” or “Pound Sterling” are to the currency of the United Kingdom of Great Britain and Northern Ireland (UK). Other currencies referred to in this Annual Report and Form 20‑F include Polish Zloty (PLN), Swiss Franc (CHF), Canadian Dollar (CAD), Chinese Renminbi (RMB), Indian Rupee (INR), Ukrainian Hryvnia (UAH), Philippine Peso (PHP), Romanian Leu (RON) and Serbian Dinar (RSD).
For a discussion on the effects of exchange rate fluctuations on the financial condition and results of the operations of the Group, see the Business Performance section beginning on page 60.
Legal Proceedings
Group companies are parties to various legal proceedings, including some in which claims for damages have been asserted against the companies. Having taken appropriate advice, we believe that the aggregate outcome of such proceedings will not have a material effect on the Group’s financial condition, results of operations or liquidity.
Possible Environmental Liabilities
At 17 February 2023, there were no pending legal proceedings relating to site remediation which are anticipated to have a material adverse effect on the financial position or results of operations or liquidity of the Group, nor have internal reviews revealed any situations of likely material environmental liability to the Group.
Research and Development
CRH is engaged in ongoing initiatives that advance its business as part of its relentless focus on continuous improvement. One of these areas is research and development, where such costs are not material in the context of the Consolidated Income Statement. CRH’s policy is to expense such costs as they occur.
Employees
The average number of employees for the past three financial years is disclosed in note 7 to the Consolidated Financial Statements on page 199. The Group believes that relations with its employees and labour unions are satisfactory.
Seasonality
Activity in the construction industry is characterised by cyclicality and is dependent to a considerable extent on the seasonal impact of weather in CRH’s operating locations, with activity in some markets reduced significantly in winter due to inclement weather. First‑half sales accounted for 46% of full‑year 2022 (2021: 45%), while EBITDA (as defined)* for the first six months of 2022 represented 39% of the full‑year out‑turn (2021: 36%).
Significant Change
No significant changes have occurred since the balance sheet date.
Latest Practicable Information
Where referenced in the Supplemental 20-F and Other Disclosures and Shareholder Information sections, information is provided at the latest practicable date, 17 February 2023.
* EBITDA is defined as earnings from continuing operations before interest, taxes, depreciation, amortisation, asset impairment charges, profit on disposals and the Group’s share of equity accounted investments’ profit after tax.
| | | | | |
| 2022 Annual Report and Form 20-F | 276 |
| | | | | |
| 2022 Annual Report and Form 20-F | 277 |
| | | | | | | | | | | | | | | | | | | | |
Shareholder
Information | |
| Stock Exchange Listings 278 Ownership of Ordinary Shares 278 Dividends 280 Share Plans 281 American Depositary Shares 282 Taxation 283 Memorandum and Articles of Association 285 General Information 287 | |
| | | | | |
| 2022 Annual Report and Form 20-F | 278 |
CRH has a premium listing on the LSE and a secondary listing on Euronext Dublin represented by the ticker symbols CRH and CRG respectively. American Depositary Shares (ADSs), each representing one Ordinary Share, are listed on the NYSE. The ADSs are evidenced by ADRs issued by The Bank of New York Mellon (the ‘Depositary’) as Depositary under an Amended and Restated Deposit Agreement dated 28 November 2006. The ticker symbol for the ADSs on the NYSE is CRH.
| | | | | | | | | | | | | | | | | | | | | | | |
| Share price data | | | | | | | |
| 2022 | | 2021 |
| LSE | Euronext Dublin | NYSE | | LSE | Euronext Dublin | NYSE |
Share price at 31 December | £32.99 | €37.01 | $39.79 | | £39.00 | €46.52 | $52.80 |
Market capitalisation | £24.6bn | €27.6bn | $29.6bn | | £30.1bn | €35.9bn | $40.7bn |
| Share price movement during year: | | | | | | | |
| -high | £40.02 | €48.03 | $54.23 | | £39.32 | €46.96 | $53.76 |
-low | £27.57 | €32.05 | $31.54 | | £30.22 | €34.38 | $41.14 |
For further information on CRH shares see note 29 to the Consolidated Financial Statements.
Ownership of Ordinary Shares
| | | | | | | | |
Shareholdings as at 31 December 2022 | | |
Geographic location (i) | Number of shares held '000s | % of total |
| North America | 241,393 | 32.1 |
| United Kingdom | 210,936 | 28.0 |
| Europe/Other | 145,648 | 19.3 |
| Retail | 120,764 | 16.1 |
| Ireland | 26,001 | 3.5 |
| Treasury (ii) | 7,398 | 1.0 |
| 752,140 | 100.0 |
(i)This represents a best estimate of the number of shares controlled by fund managers resident in the geographic regions indicated. Private shareholders are classified as retail above.
(ii)As detailed in note 29 to the Consolidated Financial Statements.
The Company is not owned or controlled directly or indirectly by any government or by any corporation or by any other natural or legal person severally or jointly. The major shareholders do not have any special voting rights.
As at 1 March 2023, the Company had received notification of certain interests in its Ordinary Share capital that were equal to, or in excess of, 3%. These interests are presented in Corporate Governance – Substantial Holdings on page 101.
Purchase of Equity Securities by the Issuer and Affiliated Persons
In April 2018, CRH announced its intention to introduce a share repurchase programme to repurchase Ordinary Shares (the ‘Programme’).
During 2021, CRH repurchased a total of 17,829,602 Ordinary Shares and returned a further $0.9 billion to shareholders. In 2022 CRH repurchased a total of 29,755,861 Ordinary Shares returning a further $1.2 billion of cash to shareholders. This brings the total cash returned to shareholders under the share buyback programme to $4.1 billion since its commencement in May 2018.
| | | | | |
| 2022 Annual Report and Form 20-F | 279 |
The tables below sets forth the Ordinary Shares repurchased under this programme together with details of the Ordinary Shares purchased by the Employee Benefit Trust (EBT) during 2021 and 2022. See note 29 to the Consolidated Financial Statements for further details.
| | | | | | | | | | | | | | |
| 2022 |
| Month | Total number of share buyback purchases | Total number of EBT purchases | Total number of shares purchased | Average price paid per share - share buyback (i) (ii) |
| January | 2,041,616 | - | 2,041,616 | €45.65 |
| February | 2,591,235 | - | 2,591,235 | €42.66 |
| March | 2,374,256 | 86,549 | 2,460,805 | €38.13 |
| April | 1,878,811 | 101,166 | 1,979,977 | €36.46 |
| May | 2,074,234 | 1,373 | 2,075,607 | €37.05 |
| June | 3,749,982 | - | 3,749,982 | €34.92 |
| July | 1,930,667 | - | 1,930,667 | €33.93 |
| August | 2,720,057 | - | 2,720,057 | €37.70 |
| September | 3,578,967 | - | 3,578,967 | €34.75 |
| October | 2,441,593 | - | 2,441,593 | €33.76 |
| November | 2,297,355 | - | 2,297,355 | €37.23 |
| December | 2,077,088 | - | 2,077,088 | €37.48 |
| 29,755,861 | 189,088 | 29,944,949 | |
| | | | | | | | | | | | | | | | | |
| 2021 | |
| Month | Total number of share buyback purchases | Total number of EBT purchases | Total number of shares purchased | Average price paid per share - share buyback (i) (ii) | |
| March | 1,642,000 | 307,410 | 1,949,410 | €38.89 | |
| April | 1,658,731 | 38,571 | 1,697,302 | €39.81 | |
| May | 1,042,547 | - | 1,042,547 | €41.25 | |
| June | 1,502,661 | - | 1,502,661 | €42.77 | |
| July | 2,095,200 | - | 2,095,200 | €41.66 | |
| August | 1,535,632 | - | 1,535,632 | €43.65 | |
| September | 2,358,058 | - | 2,358,058 | €42.87 | |
| October | 2,267,621 | - | 2,267,621 | €40.46 | |
| November | 2,366,929 | - | 2,366,929 | €43.64 | |
| December | 1,360,223 | - | 1,360,223 | €44.98 | |
| 17,829,602 | 345,981 | 18,175,583 | | |
(i)Average price paid per share in respect of 2022 EBT purchases; March €37.68, April €35.88 and May €38.81 (2021: March €38.99, April €39.84).
(ii)The average price paid per share in 2022 in respect of the share buyback programme was equal to $39.22 (2021: $49.30).
Other than the above, there were no purchases of equity securities by the issuer and/or affiliated persons during the course of 2022.
CREST and Migration to Euroclear Bank
From 1996 to 2021, CREST was the depository for the settlement of Irish issuers’ equity securities trading in Dublin and/or London. As a result of Brexit, CREST was no longer available to any Irish incorporated issuers, irrespective of whether they are listed in Ireland, London or both, and all Irish issuers had to migrate from CREST to the market’s chosen replacement system, Euroclear Bank Belgium. An Extraordinary General Meeting was held on 9 February 2021 to seek shareholder approval to the migration of the Company’s securities to Euroclear Bank’s central securities depository and to approve associated changes to the Articles of Association. All resolutions were passed and the migration took effect on 15 March 2021.
| | | | | |
| 2022 Annual Report and Form 20-F | 280 |
Dividends
The Company has paid dividends on its Ordinary Shares in respect of each fiscal year since the formation of the Group in 1970. Dividends are paid to shareholders on the Register of Members on the record date for the dividend. Record dates are set in accordance with the rules of the LSE and Euronext Dublin. An interim dividend is normally declared by the Board of Directors in August of each year and is generally paid in September/October. A final dividend is normally recommended by the Board of Directors following the end of the fiscal year to which it relates and, if approved by the shareholders at an AGM, is generally paid in April/May of that year.
The payment of future cash dividends will be dependent upon future earnings, the financial condition of the Group and other factors.
The below table sets forth the amounts of interim, final and total dividends declared in US Dollar (2020-2022) and euro (2018-2019) per Ordinary Share in respect of each fiscal year indicated. Solely for the convenience of the reader, dividends declared in the years 2018-2019 have been translated into US Dollar per Ordinary Share at the dividend record date exchange rate. An interim dividend of $0.24 was paid in respect of Ordinary Shares on 7 October 2022. The final dividend, if approved at the forthcoming AGM of shareholders to be held on 27 April 2023, will be paid on 4 May 2023 to shareholders on the Register of Members as at the close of business on 17 March 2023 and will bring the full-year dividend for 2022 to $1.27.
Dividend Withholding Tax (DWT) must be deducted from dividends paid by an Irish resident company, unless a shareholder is entitled to an exemption and has submitted a properly completed exemption form to the Company’s Registrars, Link Registrars Limited (the ‘Registrars’). DWT applies to dividends paid by way of cash or by way of shares under a scrip dividend scheme and is deducted at the standard rate of Income Tax (25%). Non-resident shareholders located in countries with a double tax treaty with Ireland and certain Irish companies, trusts, pension schemes, investment undertakings and charities may be entitled to claim exemption from DWT. Copies of the exemption form may be obtained from the Registrars. Shareholders should note that DWT will be deducted from dividends in cases where a properly completed form has not been received by the specified deadline notified when a dividend is announced. Individuals who are resident in the Republic of Ireland for tax purposes are not entitled to an exemption. If shares are held via Euroclear Bank (EB) or CREST, the owners of the shares will need to contact the intermediary through whom the shares are held in order to arrange for their dividends to be exempted.
Shareholders holding Ordinary Shares in certificated form who wish to have their dividend paid direct to their bank account, by electronic funds transfer, can do so by logging on to www.signalshares.com, selecting CRH plc and registering for
the share portal (the ‘Share Portal’). Shareholders should note that they will need to have their Investor Code (found on documents issued by the Registrars), and follow the instructions online to register.
Alternatively such shareholders can complete a paper dividend mandate form and submit it to the Registrars. A copy of the form can be obtained on the Registrars's Share Portal or can be requested directly from the Registrars. Tax vouchers will continue to be sent to the shareholder’s registered address under this arrangement.
If shares are held via EB or CREST, the dividend will be paid by the Company in accordance with the instructions received from EB.
Section 5 of the Euroclear Terms and Conditions governing use of the Euroclear system provides that income/dividends received by EB will be distributed pro-rata to the holders of the relevant securities (i.e. the relevant EB Participants).
Further details on the process of collection, distribution and payment of dividends are provided for in section 5.3 of the EB Operating Procedures, with reference to the Online Market Guides for market specific operational elements (currently the EB Service Description). All material information regarding the manner in which receipt of dividends and participation in corporate actions is processed is described in section 5 of the EB Services Description - (Version 4) – Custody - Income and Corporate Actions. The owners of the shares held via EB or CREST will need to contact the intermediary through whom the shares are held in order to arrange for the onward payment of the dividend to them.
While dividends are declared in US Dollar, the default payment currency is euro. In order to avoid costs to shareholders, dividends are paid in Pound Sterling and US Dollar to shareholders whose shares are held in certificated form and whose address, according to the Share Register, is in the UK and the US respectively, unless they require otherwise. In respect of the 2022 final dividend, the latest date for receipt of currency elections is 31 March 2023. Where shares are held in the EB system, dividends are automatically paid in euro unless a currency election is made.
Investors holding CREST Depositary Interests (CDIs) should refer to the CREST International Service Description for information on currency elections in respect of CDIs.
Dividends in respect of 7% ‘A’ Cumulative Preference Shares are paid half-yearly on 5 April and 5 October. Dividends in respect of 5% Cumulative Preference Shares are paid half-yearly on 15 April and 15 October.
| | | | | | | | | | | | | | | | | | | | | | | |
| | | | | US Dollar per Ordinary Share |
| Year ended 31 December | | | | | Interim | Final | Total |
| 2022 | $0.24 | $1.03(i) | $1.27 |
| 2021 | $0.23 | $0.98 | $1.21 |
| 2020 | $0.22 | $0.93 | $1.15 |
| euro per Ordinary Share | | US Dollar per Ordinary Share(ii) |
Years ended 31 December | Interim | Final | Total | | Interim | Final | Total |
| 2019 | €0.20 | €0.63 | €0.83 | | $0.22 | $0.70 | $0.92 |
| 2018 | €0.20 | €0.52 | €0.72 | | $0.23 | $0.59 | $0.82 |
(i)Proposed.
(ii)Interim and final dividends per Ordinary Share declared previously in euro have been translated to US Dollar using the dividend record date exchange rate.
| | | | | |
| 2022 Annual Report and Form 20-F | 281 |
Share Plans
The Group operates share option schemes, performance share plans, share participation schemes and savings-related share option schemes (the ‘Schemes’) for eligible employees in all regions where the regulations permit the operation of such schemes. A brief description of the Schemes is outlined below. Shares issued (whether by way of the allotment of new shares or the reissue of Treasury Shares) in connection with the Schemes rank pari passu in all respects with the existing shares in the Company.
2010 Share Option Schemes
At the AGM held on 5 May 2010, shareholders approved the adoption of new share option schemes to replace the schemes which were approved in May 2000 (2000 share option schemes). Following the approval by shareholders of the 2014 Performance Share Plan (see below), no further awards will be granted under the 2010 Share Option Schemes. Consequently, the last award under the 2010 Share Option Schemes was made in 2013.
The 2010 Share Option Schemes were based on one tier of options with a single vesting test. The performance criteria for the 2010 Share Option Schemes was EPS-based. Vesting only occurred once an initial performance target had been reached and, thereafter, exercise was dependent on continued employment in the Group. In considering the level of vesting based on EPS performance, the Remuneration Committee also considered the overall results of the Group.
Subject to the achievement of the EPS performance criteria, options may be exercised not later than ten years from the date of grant of the option, and not earlier than the expiration of three years from the date of grant. Benefits under the schemes are not pensionable.
2014 Performance Share Plan
The 2014 Performance Share Plan was approved by shareholders at the AGM on 7 May 2014. It replaces the 2010 Share Option Scheme. See page 119 of the 2022 Directors' Remuneration Report for more details.
Restricted Share Plan
In 2013, the Board approved the adoption of the 2013 Restricted Share Plan. Under the rules of the 2013 Restricted Share Plan, certain senior executives (excluding executive Board Directors) can receive conditional awards of shares. As executive Directors are excluded from awards; and no shares are allotted or reissued to satisfy the awards, the listing rules of the LSE and Euronext Dublin do not require shareholder approval for the 2013 Restricted Share Plan.
2010 Savings-related Share Option Schemes
At the AGM held on 5 May 2010, shareholders approved the adoption of savings-related share option schemes for the UK and Ireland (the ‘2010 Savings-related Share Option Schemes’) to replace the 2000 Savings-related Share Option Schemes. These schemes expired in May 2020.
Prior to the expiry of these schemes, all employees of a participating subsidiary in the Republic of Ireland or the UK, who had satisfied a required qualifying period, were invited to participate in this scheme.
Eligible employees who wished to participate in the scheme entered into a savings contract with a nominated savings institution, for a three or a five-year period, to save a maximum of €500 or Stg£500, as appropriate, per month.
At the commencement of each contract period employees were granted an option to acquire Ordinary Shares in the Company at an option price which was equal to the amount proposed to be saved plus the bonus payable by the nominated savings institution at the end of the savings period. The price payable for each Ordinary Share under an option could not be less than the higher of par or 75% (or in the case of the UK scheme 80%) of the market value of a share on the day the invitation to apply for the option was issued.
On completion of the savings contract, employees may use the amount saved, together with the bonus earned, to exercise the option.
At 1 March 2023, 2,515,738 Ordinary Shares have been issued1 pursuant to the 2010 Savings-related Share Option Schemes to date.
2021 Savings-related Share Option Schemes
At the AGM held on 29 April 2021, shareholders approved the adoption of savings-related share options schemes for the UK and Ireland (the '2021 Savings-related Share Option Schemes') to replace the 2010 Savings-related Share Option Schemes.
All employees of a participating subsidiary in the Republic of Ireland or the UK, who have satisfied a required qualifying period, are invited to participate in this scheme, although at present there is currently no financial services provider supporting new awards under Irish SAYE schemes following the exit from the market of the current provider in 2021. Eligible employees who wish to participate in the scheme enter into a savings contract with a nominated savings institution, for a three or a five-year period, to save a maximum of €500 or Stg£500, as appropriate, per month.
At the commencement of each contract period employees are granted an option to acquire Ordinary Shares in the Company at an option price which is equal to the amount proposed to be saved plus the bonus payable by the nominated savings institution at the end of the savings period. The price payable for each Ordinary Share under an option will not be less than the higher of par or 85% of the market value of a share on the day the invitation to apply for the option is issued.
On completion of the savings contract, employees may use the amount saved, together with the bonus earned, to exercise the option.
At 1 March 2023, 218 Ordinary Shares have been issued1 pursuant to the 2021 Savings-related Share Option Scheme to date.
Share Participation Schemes
At the AGM on 13 May 1987, shareholders approved the establishment of Share Participation Schemes for the Company, its subsidiaries and companies under its control. Directors and employees of the companies who are tax resident in Ireland and have at least one year’s service may elect to participate in these Share Participation Schemes.
At 1 March 2023, 8,593,666 Ordinary Shares have been issued1 pursuant to the Share Participation Schemes.
1. Whether by way of the allotment of new shares, the reissue of Treasury Shares or the purchase of Ordinary Shares.
| | | | | |
| 2022 Annual Report and Form 20-F | 282 |
American Depositary Shares
Fees and charges payable by a holder of ADSs
The Depositary collects fees for delivery and surrender of ADSs directly from investors or from intermediaries acting for them depositing shares or surrendering ADSs for the purpose of withdrawal.
The Depositary collects fees for making distributions to investors by deducting those fees from the amounts distributed or by selling a portion of distributable property to pay the fees. The Depositary may generally refuse to provide fee-attracting services until its fees for those services are paid.
| | | | | |
| Persons depositing or withdrawing shares must pay: | For: |
| $5.00 (or less) per 100 ADSs (or portion of 100 ADSs) | •Issuance of ADSs, including issuances resulting from a distribution of shares or rights or other property •Cancellation of ADSs for the purpose of withdrawal, including if the deposit agreement terminates |
$5.00 (or less) per 100 ADSs (or portion of 100 ADSs)
(A fee equivalent to the fee that would be payable if securities distributed had been shares and the shares had been deposited for issuance of ADSs) | •Distribution of deposited securities by the Depositary to ADS registered holders |
| Applicable Registration or Transfer fees | •Transfer and registration of shares on our share register to or from the name of the Depositary or its agent when the holder deposits or withdraws shares |
| Applicable Expenses of the Depositary | •Cable, telex and facsimile transmissions •Currency conversion |
| Applicable Taxes and other governmental charges the Depositary or the custodian have to pay on any ADS or share underlying an ADS, for example, stock transfer taxes, stamp duty or withholding taxes | •As necessary |
| | | | | | | | | | | | | | | | | | | | |
| Fees and direct/indirect payments made by the Depositary to the Company | | The Depositary has agreed to reimburse certain Company expenses related to the Company’s ADS programme and incurred by the Company in connection with the ADS programme. For the year ended 31 December 2022 the Depositary reimbursed to the Company, or paid amounts on its behalf to third-parties, a total sum of $425,813. This table sets forth the category of expense that the Depositary has agreed to reimburse to the Company and the amounts reimbursed for the year ended 31 December 2022. The Depositary has also agreed to waive fees for standard costs associated with the administration of the ADS programme and has paid certain expenses directly to third-parties on behalf of the Company. Under certain circumstances, including removal of the Depositary or termination of the ADS programme by the Company, the Company is required to repay the Depositary, up to a maximum of $250,000, the amounts waived, reimbursed and/or expenses paid by the Depositary to or on behalf of the Company. |
| Category of expense reimbursed to the Company | Amount reimbursed for the year ended 31 December 2022 |
| $ |
| New York Stock Exchange listing fees | 80,000 |
| Investor relations expenses | 345,000 |
| Total | 425,000 |
The table below sets forth the types of expenses that the Depositary has paid to third-parties and the amounts reimbursed for the year ended 31 December 2022: |
| Category of expense waived or paid directly to third parties | Amount reimbursed for the year ended 31 December 2022 |
| $ |
| Printing, distribution and administration costs paid directly to third-parties in connection with US shareholder communications and Annual General Meeting related expenses in connection with the American Depositary Share programme | 813 |
| Total | 813 |
| | | | | |
| 2022 Annual Report and Form 20-F | 283 |
Taxation
The following summary outlines the material aspects of US federal income and Republic of Ireland tax law regarding the ownership and disposition of Ordinary Shares or ADSs. Because it is a summary, holders of Ordinary Shares or ADSs are advised to consult their tax advisors with respect to the tax consequences of their ownership or disposition. The discussion regarding US federal income tax only applies to you if you hold your shares or ADSs as capital assets for US federal income tax purposes. This discussion addresses only US federal income and Republic of Ireland taxation and does not discuss all of the tax consequences that may be relevant to you in light of your individual circumstances, including foreign, state or local tax consequences, estate and gift tax consequences, and tax consequences arising under the Medicare contribution tax on net investment income or the alternative minimum tax. This summary does not take into account the specific circumstances of any particular holders (such as tax-exempt entities, certain insurance companies, broker-dealers, traders in securities that elect to mark-to-market, investors liable for alternative minimum tax, investors that actually or constructively own 10% or more of the stock of the Company (by vote or value), investors that hold Ordinary Shares or ADSs as part of a straddle or a hedging or conversion transaction, investors that hold Ordinary Shares or ADSs as part of a wash sale for tax purposes or investors whose functional currency is not the US Dollar), some of which may be subject to special rules. In addition, if a partnership holds the Ordinary Shares or ADSs, the US federal income tax treatment of a partner will generally depend on the status of the partner and the tax treatment of the partnership and may not be described fully below. Holders of Ordinary Shares or ADSs are advised to consult their tax advisors with respect to US federal, state and local, Republic of Ireland and other tax consequences of owning and disposing of Ordinary Shares and ADSs in their particular circumstances, and in particular whether they are eligible for the benefits of the Income Tax Treaty (as defined below) in respect of their investment in the Ordinary Shares or ADSs.
The statements regarding US and Irish laws set forth below are based, in part, on representations of the Depositary and assume that each obligation in the Deposit Agreement and any related agreement will be performed in accordance with their terms.
This section is based on the Internal Revenue Code of 1986, as amended, its legislative history, existing and proposed US Treasury regulations, published rulings and court decisions, and the laws of the Republic of Ireland all as currently in effect, as well as the Convention between the Government of the United States of America and the Government of Ireland for the Avoidance of Double Taxation and the Prevention of Fiscal Evasion with Respect to Taxes on Income and Capital Gains (the ‘Income Tax Treaty’). These laws are subject to change, possibly on a retroactive basis.
In general, holders of ADSs will be treated as the owners of Ordinary Shares represented thereby for the purposes of the Income Tax Treaty and for US federal income tax purposes. Exchanges of Ordinary Shares for ADSs, and ADSs for Ordinary Shares, generally will not be subject to US federal income or Irish tax.
As used herein, the term “US holder” means a beneficial owner of an Ordinary Share or ADS who, for US federal income tax purposes: (i) is a US citizen or resident, a US corporation, an estate whose income is subject to US federal income tax regardless of its source, or a trust if a US court can exercise primary supervision over the trust’s administration and one or more US persons are authorised to control all substantial decisions of the trust, and (ii) is not a resident of, or ordinarily resident in, the Republic of Ireland for purposes of Irish taxes.
Taxation of Dividends Paid to US Holders
Under general Irish tax law, US holders are not liable for Irish tax on dividends received from the Company. On the payment of dividends, the Company is obliged to withhold DWT. The statutory rate during 2022 was 25% of the dividend payable. Dividends paid by the Company to a US tax resident individual will be exempt from DWT provided the following conditions are met:
1.the individual (who must be the beneficial owner) is resident for tax purposes in the US (or any country with which Ireland has a double tax treaty) and neither resident nor ordinarily resident in Ireland; and
2.the individual signs a declaration to the Company, which states that he/she is a US tax resident individual at the time of making the declaration and that he/she will notify the Company in writing when he/she no longer meets the condition in (1) above; or
3.the individual provides the Company with a certificate of tax residency from the US tax authorities.
Dividends paid by the Company to a US tax resident company (which must be the beneficial owner) will be exempt from DWT, provided the following conditions are met:
1.the recipient company is resident for tax purposes in the US (or any country with which Ireland has a double tax treaty) and not under the control, either directly or indirectly, of Irish resident persons;
2.the recipient company is not tax resident in Ireland; and
3.the recipient company provides a declaration to the Company, which states that it is entitled to an exemption from DWT, on the basis that it meets the condition in (1) above at the time of making the declaration, and that it will notify the Company when it no longer meets the condition in (1) above.
For US federal income tax purposes, and subject to the passive foreign investment company (PFIC) rules discussed overleaf, US holders will include in gross income the gross amount of any dividend paid by the Company out of its current or accumulated earnings and profits (as determined for US federal income tax purposes) as ordinary income when the dividend is actually or constructively received by the US holder, in the case of Ordinary Shares, or by the Depositary, in the case of ADSs. Any Irish tax withheld from this dividend payment must be included in this gross amount even though the amount withheld is not in fact received. Dividends paid to non-corporate US holders that constitute qualified dividend income will be taxed at the preferential rates applicable to long-term capital gains provided certain holding period requirements are met. Dividends the Company pays with respect to Ordinary Shares or ADSs generally will be qualified dividend income.
Dividends paid by CRH will not be eligible for the dividends received deduction generally allowed to US corporations in respect of dividends received from other US corporations.
The amount of the dividend distribution includable in income of a US holder will be the US Dollar value of the dividends on the date they are distributed, regardless of whether the US holder elects to receive the payment in a currency other than US Dollars. If the US holder elects to receive the payment in a currency other than US Dollars, generally any gain or loss resulting from currency exchange fluctuations during the period from the date the dividend payment is distributed to the date such payment is received will be treated as ordinary income or loss and will not be eligible for the special tax rate applicable to qualified dividend income. Such gain or loss will generally be income or loss from sources within the US for foreign tax credit limitation purposes.
| | | | | |
| 2022 Annual Report and Form 20-F | 284 |
Distributions in excess of current and accumulated earnings and profits, as determined for US federal income tax purposes, will be treated as a non-taxable return of capital to the extent of the US holder’s basis in the Ordinary Shares or ADSs and thereafter as capital gain. However, the Company does not calculate earnings and profits in accordance with US federal income tax principles. Accordingly, US holders should expect to generally treat distributions the Company makes as dividends.
For foreign tax credit limitation purposes, dividends the Company pays with respect to Ordinary Shares or ADSs will generally be income from sources outside the US, and will, depending on your circumstances, generally be “passive” income for purposes of computing the foreign tax credit allowable to a US holder.
Subject to certain limitations, the Irish tax withheld in accordance with the Income Tax Treaty and paid over to the Republic of Ireland will be creditable or deductible against your US federal income tax liability. However, under recently finalised Treasury regulations, it is possible that the Irish tax may not be creditable unless you are eligible for and elect to apply the benefits of the Income Tax Treaty. Special rules apply in determining the foreign tax credit limitation with respect to dividends that are subject to the preferential tax rates. Any Irish tax withheld from distributions will not be eligible for a foreign tax credit to the extent an exemption from the tax withheld is available to the US holder.
Capital Gains Tax
A US holder will not be liable for Irish tax on gains realised on the sale or other disposition of Ordinary Shares or ADSs unless the Ordinary Shares or ADSs are held in connection with a trade or business carried on by such holder in the Republic of Ireland through a branch or agency. A US holder will be liable for US federal income tax on such gains in the same manner as gains from a sale or other disposition of any other shares in a company.
Subject to the PFIC rules below, US holders who sell or otherwise dispose of Ordinary Shares or ADSs will recognise a capital gain or loss for US federal income tax purposes equal to the difference between the US Dollar value of the amount realised on the sale or disposition and the tax basis, determined in US Dollars, in the Ordinary Shares or ADSs.
Capital gains of a non-corporate US holder are generally taxed at a preferential rate where the holder has a holding period greater than one year, and the capital gain or loss will generally be US source for foreign tax credit limitation purposes.
Capital Acquisitions Tax (Estate/Gift Tax)
Although non-residents may hold Ordinary Shares, the shares are deemed to be situated in the Republic of Ireland, because the Company is required to maintain its Share Register in the Republic of Ireland for Irish Capital Gains Tax purposes.
Accordingly, holders of Ordinary Shares may be subject to Irish gift or inheritance tax, notwithstanding that the parties involved are domiciled and resident outside the Republic of Ireland. Certain exemption thresholds apply to gifts and inheritances depending on the relationship between the donor and donee.
Under the Ireland-US Estate Tax Treaty with respect to taxes on the estates of deceased persons, credit against US federal estate tax is available in respect of any Irish inheritance tax payable in respect of transfers of Ordinary Shares.
Additional US Federal Income Tax Considerations
The Company believes that Ordinary Shares and ADSs should not currently be treated as stock of a PFIC for US federal income tax purposes and does not expect them to become stock of a PFIC in the foreseeable future. However, this conclusion is a factual determination that is made annually and thus may be subject to change. If the Company is treated as a PFIC and you are a US holder that did not make a mark-to-market election, you will be subject to special rules with respect to any gain you realise on the sale or other disposition of your Ordinary Shares or ADSs and any excess distribution that the Company makes to you. Generally, any such gain or excess distribution will be allocated ratably over your holding period for the Ordinary Shares or ADSs, the amount allocated to the taxable year in which you realised the gain or received the excess distribution, or to prior years before the first year in which we were a PFIC with respect to you, will be taxed as ordinary income, the amount allocated to each prior year will be generally taxed as ordinary income at the highest tax rate in effect for each other such year, and an interest charge will be applied to any tax attributable to such gain or excess distribution for the prior years. With certain
exceptions, Ordinary Shares or ADSs will be treated as stock in a PFIC if the company was a PFIC at any time during the investor’s holding period in the Ordinary Shares or ADSs. In addition, dividends that you receive from the Company will not constitute qualified dividend income to you if the Company is deemed to be a PFIC either in the taxable year of the distribution or the preceding taxable year, but instead will be taxable at rates applicable to ordinary income.
Stamp Duty
Section 90 Stamp Duties Consolidation Act 1999 exempts from Irish stamp duty transfers of ADSs where the ADSs are dealt in and quoted on a recognised stock exchange in the US and the underlying deposited securities are dealt in and quoted on a recognised stock exchange. The Irish tax authorities regard NASDAQ and the NYSE as recognised stock exchanges. Irish stamp duty will be charged at the rate of 1% of the amount or value of the consideration on any conveyance or transfer on sale of Ordinary Shares (exemption generally available in the case of single transfers with a value of less than €1,000). Exchanges of Ordinary Shares for ADSs, and ADSs for Ordinary Shares may be subject to Irish stamp duty in certain circumstances.
| | | | | |
| 2022 Annual Report and Form 20-F | 285 |
Memorandum and Articles of Association
The Company’s Memorandum of Association sets out the objects and powers of the Company. The Articles of Association detail the rights attaching to each share class; the method by which the Company’s shares can be purchased or reissued; the provisions which apply to the holding of and voting at general meetings; and the rules relating to the Directors, including their appointment, retirement, re-election, duties and powers.
A copy of the current Memorandum and Articles of Association can be obtained from the Group’s website, www.crh.com.
The following summarises certain provisions of CRH’s Memorandum and Articles of Association and applicable Irish law.
Objects and Purposes
CRH is incorporated under the name CRH public limited company and is registered in Ireland with registered number 12965. Clause 4 of CRH’s Memorandum of Association provides that its objects include the business of an investment holding company. Clause 4 also sets out other objects including the business of quarry masters and proprietors and lessees and workers of quarries, sand and gravel pits, mines and the like generally; the business of road-makers and contractors, building contractors, builders merchants and providers and dealers in road making and building materials, timber merchants; and the carrying on of any other business calculated to benefit CRH. The memorandum grants CRH a range of corporate capabilities to effect these objects.
Directors
The Directors manage the business and affairs of CRH.
Directors who are in any way, whether directly or indirectly, interested in contracts or other arrangements with CRH must declare the nature of their interest at a meeting of the Directors, and, subject to certain exemptions, may not vote in respect of any contract or arrangement or other proposal whatsoever in which they have any material interest other than by virtue of their interest in shares or debentures in the Company. However, in the absence of some other material interest not indicated below, a Director is entitled to vote and to be counted in a quorum for the purpose of any vote relating to a resolution concerning the following matters:
•the giving of security or indemnity with respect to money lent or obligations taken by the Director at the request or for the benefit of the Company;
•the giving of security or indemnity to a third party with respect to a debt or obligation of the Company which the Director has assumed responsibility for under a guarantee, indemnity or the giving of security;
•any proposal in which the Director is interested concerning the underwriting of Company shares, debentures or other securities;
•any other proposal concerning any other company in which the Director is interested, directly or indirectly (whether as an officer, shareholder or otherwise) provided that the Director is not the holder of 1% or more of the voting interest in the shares of such company; and
•proposals concerning the modification of certain retirement benefits under which the Director may benefit and which have been approved or are subject to approval by the Irish Revenue Commissioners
The Directors may exercise all the powers of the Company to borrow money, except that such general power is restricted to the aggregate amount of principal borrowed less cash balances of the Company and its subsidiaries not exceeding an amount twice the aggregate of (i) the share capital of the Company; and (ii) the amount standing to the credit of retained income, foreign currency translation reserve and other reserves, capital grants, deferred taxation and non-controlling interest; less any repayable government grants; less (iii) the aggregate amount of Treasury Shares and own shares held by the Company.
The Company in general meeting from time to time determines the fees payable to the Directors. The Board may grant special remuneration to any of its number who being called upon, shall render any special or extra services to the Company or go or reside abroad in connection with the conduct of any of the affairs of the Company.
The qualification of a Director is the holding alone and not jointly with any other person of 1,000 Ordinary Shares in the capital of the Company.
Voting Rights
The Articles provide that, at shareholders’ meetings, holders of Ordinary Shares, either in person or by proxy, are entitled to one vote on a show of hands and one vote per share on a poll. No member is entitled to vote at any general meeting unless all calls or other sums immediately payable in respect of shares in the Company have been paid.
Laws, Decrees or Other Regulations
There are no restrictions under the Memorandum and Articles of Association of the Company or under Irish law that limit the right of non-Irish residents or foreign owners freely to hold their Ordinary Shares or to vote their Ordinary Shares.
Liquidation Rights/Return of Capital
In the event of the Company being wound up, the liquidator may, with the sanction of a shareholders’ special resolution, divide among the holders of the Ordinary Shares the whole or any part of the net assets of the Company (after the return of capital and payment of accrued dividends on the preference shares) in cash or in kind, and may set such values as he deems fair upon any property to be so divided and determine how such division will be carried out. The liquidator may, with a like sanction, vest such assets in trust as he thinks fit, but no shareholders will be compelled to accept any shares or other assets upon which there is any liability.
Variation of Rights
Subject to the provisions of the Companies Act 2014, the rights attached to any class of shares may be varied with the consent in writing of the holders of not less than three fourths in nominal value of the issued shares of that class, or with the sanction of a special resolution passed at a separate general meeting of the holders of those shares.
Issue of Shares
Subject to the provisions of the Companies Act 2014 and the Articles of Association, the issue of shares is at the discretion of the Directors.
Dividends
Shareholders may by ordinary resolution declare final dividends and the Directors may declare interim dividends but no final dividend may be declared in excess of the amount recommended by the Directors and no dividend may be paid otherwise than out of income available for that purpose in accordance with the Companies Act 2014. There is provision to offer scrip dividends in lieu of cash. The preference shares rank for fixed rate dividends in priority to the Ordinary Shares for the time being of the Company. Any dividend which has remained unclaimed for 12 years from the date of its declaration shall, if the Directors so decide, be forfeited and cease to remain owing by the Company.
Meetings
Shareholder meetings may be convened by majority vote of the Directors or requisitioned by shareholders holding not less than 5% of the voting rights of the Company. A quorum for a general meeting of the Company is constituted by two or more shareholders present in person and entitled to vote. The passing of resolutions at a meeting of the Company, other than special resolutions, requires a simple majority. A special resolution, in respect of which not less than 21 clear days’ notice in writing must be given, requires the affirmative vote of at least 75% of the votes cast.
Disclosure of Shareholders' Interests
A shareholder may lose the right to vote by not complying with any statutory notice or notice pursuant to Article 14 of the Articles of Association given by the Company requiring an indication in writing of: (i) the capacity in which the shares are held or any interest therein; (ii) the persons who have an interest in the shares and the nature of their interest; or (iii) whether any of the voting rights carried by such shares are the subject of any agreement or arrangement under which another person is entitled to control the shareholder’s exercise of these rights.
| | | | | |
| 2022 Annual Report and Form 20-F | 286 |
Preference Shares
Details of the 5% and 7% ‘A’ Cumulative Preference Shares are disclosed in note 29 to the Consolidated Financial Statements.
Use of Electronic Communication
Whenever the Company, a Director, the Secretary, a member or any officer or person is required or permitted by the Articles of Association to give information in writing, such information may be given by electronic means or in electronic form, whether as electronic communication or otherwise, provided that the electronic means or electronic form has been approved by the Directors.
| | | | | |
| 2022 Annual Report and Form 20-F | 287 |
General Information
Electronic Communications
Following the introduction of the 2007 Transparency Regulations, and in order to adopt a more environmentally friendly and cost effective approach, the Company provides shareholders holding shares in certificated form with hard copy notifications that the Annual Report and Form 20-F and other shareholder communications are available electronically via the CRH website, www.crh.com, and only sends a printed copy to those shareholders who specifically request a copy. Alternatively, such shareholders can choose to elect to receive email notifications that the Annual Reports and other Shareholder communications are available electronically. However, shareholders holding shares in certificated form will continue to receive printed proxy forms, dividend documentation and, if the Company deems it appropriate, other documentation by post. Such shareholders can alter the method by which they receive communications by contacting the Registrars. If shares are held through the EB system or as CREST Depository Interests (CDIs), the owners of the shares will need to contact the intermediary through whom the shares are held if they wish to make arrangements regarding receipt of the Annual Report and Form 20-F and other shareholder communications.
CRH Website
Information on, or accessible through our website, www.crh.com, other than the item identified as the Annual Report and Form 20-F, does not form part of and is not incorporated into the Company’s Annual Report on Form 20-F as filed with the SEC (the ‘Form 20-F’). References in this document to other documents on the CRH website, such as the CRH Sustainability Report, are included only as an aid to their location and are not incorporated by reference into the Form 20-F. The Group’s website provides the full text of the Form 20-F, which is filed annually with the SEC, interim reports, trading updates, copies of presentations to analysts and investors and circulars to shareholders. News releases are made available in the News section of the website, immediately after release to the Stock Exchanges.
Electronic Proxy Voting
Shareholders holding shares in certificated form may lodge a proxy form for the 2023 AGM electronically by accessing the Registrars’ website www.signalshares.com and entering CRH plc in the company name field. Shareholders will need to register for Signal Shares by clicking on "registration section" (if you have not registered previously) and following the registration instructions. Investors who hold their interests in the Company's shares through either the EB system or as CREST Depository Interests (CDIs) should refer to the EB Service Description or the CREST International Manual respectively or to the broker or custodian through whom they hold their shares to give their voting instructions. Further details on how shareholders who do not hold their shares in certificated form can vote electronically at the 2023 AGM are available in the notes to the Notice of the AGM.
Registrars
Enquiries concerning shareholdings should be addressed to the Registrars: Link Registrars Limited, P.O. Box 7117, Dublin 2, Ireland. Telephone: +353 1 553 0050 Email: enquiries@linkgroup.ie Website: www.linkgroup.eu Shareholders with access to the internet may check their accounts by logging onto www.signalshares.com, selecting CRH plc and registering for the share portal. Shareholders should note that they will need to have their Investor Code (found on documents issued by the Registrar, such as proxy forms) and follow the instructions online to register. This facility allows shareholders to check their shareholdings and dividend payments, register e-mail addresses, appoint proxies electronically and download standard forms required to initiate changes in details held by the Registrars. Shareholders will need to register for a User ID before using some of the services. If shareholders hold their shares through a broker or intermediary, they should contact their broker directly.
American Depositary Receipts
The ADR programme is administered by the Bank of New York Mellon and enquiries regarding ADRs should be addressed to:
BNY Mellon Shareowner Services,
P.O. Box 43006, Providence,
RI 02940-3078, U.S.A.
Telephone:
Toll Free Number US residents: 1-888-269-2377
International: +1 201-680-6825
E-mail: shrrelations@cpushareownerservices.com
Website: www.mybnymdr.com
Frequently Asked Questions (FAQs)
The Group’s website contains answers to questions frequently asked by shareholders, including questions regarding shareholdings, dividend payments, electronic communications and shareholder rights. The FAQs can be accessed in the Investors section of the website under Shareholder Centre.
Exchange Controls
Certain aspects of CRH’s international monetary operations outside the European Union were, prior to 31 December 1992, subject to regulation by the Central Bank of Ireland. These controls have now ceased. There are currently no Irish foreign exchange controls, or other statute or regulations that restrict the export or import of capital, that affect the remittance of dividends, other than dividend withholding tax on the Ordinary Shares, or that affect the conduct of the Company’s operations.
Principal Accountant Fees and Services
Details of auditors’ fees for Deloitte Ireland LLP, Dublin Ireland, PCAOB ID No. 1193 are set out in note 5 to the Consolidated Financial Statements. For details on the audit and non-audit services pre-approval policy see Corporate Governance – External Auditor on page 93.
Documents on Display
The SEC maintains an internet site at http://www.sec.gov that contains reports filed electronically with the SEC, including this Form 20-F and documents referred to herein. SEC filings are also available to the public from commercial document retrieval services. This Form 20-F is also available at CRH's website, www.crh.com.
| | | | | | | | |
| Financial Calendar | | |
Announcement of final results for 2022 | 2 March 2023 |
| Ex-dividend date | 16 March 2023 |
| Record date for dividend | 17 March 2023 |
| Latest date for receipt of completed bank mandates | 31 March 2023 |
| Latest date for receipt of currency elections | 31 March 2023 |
| Latest date for revocation of existing bank mandates | 31 March 2023 |
| Annual General Meeting | 27 April 2023 |
| Dividend payment date | 4 May 2023 |
| Further updates to the calendar can be found on www.crh.com. |
| | | | | |
| 2022 Annual Report and Form 20-F | 288 |
| | | | | |
2022 Annual Report and Form 20-F | 289 |
| | | | | | | | | | | | | | | | | | | | |
| Other Information | |
| | | | | Principal Subsidiary Undertakings 290 Principal Equity Accounted Investments 293 Our Products and Services Locations 294 Exhibits 296 Cross Reference to Form 20-F Requirements 297 Index 298 Signatures 300 | |
| | | | | |
| 2022 Annual Report and Form 20-F | 290 |
Principal Subsidiary Undertakings
as at 31 December 2022
Americas Materials
| | | | | | | | | | | |
| Incorporated and operating in | | % held | Products and services |
| Canada | CRH Canada Group Inc. | 100 | Aggregates, asphalt, cement and readymixed concrete and provider of construction services |
| Ash Grove Cement Company | 100 | Aggregates and cement |
| Callanan Industries, Inc. | 100 | Aggregates, asphalt, readymixed concrete and related construction activities |
| CPM Development Corporation | 100 | Aggregates, asphalt, readymixed concrete, prestressed concrete and related construction activities |
| CRH Americas Materials, Inc. and subsidiaries | 100 | Holding company |
| Dolomite Products Company, Inc. | 100 | Aggregates, asphalt, readymixed concrete and related construction activities |
| Michigan Paving and Materials Company | 100 | Aggregates, asphalt and related construction activities |
| Mountain Enterprises, Inc. | 100 | Aggregates, asphalt and related construction activities |
| Mulzer Crushed Stone, Inc. | 100 | Aggregates, asphalt, readymixed concrete, aggregates distribution and related construction activities |
| Oldcastle SW Group, Inc. | 100 | Aggregates, asphalt, readymixed concrete and related construction activities |
| OMG Midwest, Inc. | 100 | Aggregates, asphalt, readymixed concrete and related construction activities |
| United States | P.J. Keating Company | 100 | Aggregates, asphalt and related construction activities |
| Pennsy Supply, Inc. | 100 | Aggregates, asphalt, readymixed concrete and related construction activities |
| Pike Industries, Inc. | 100 | Aggregates, asphalt, readymixed concrete and related construction activities |
| Preferred Materials, Inc. | 100 | Aggregates, asphalt, readymixed concrete, aggregates distribution and related construction activities |
| Staker & Parson Companies | 100 | Aggregates, asphalt, readymixed concrete and related construction activities |
| Suwannee American Cement Company, LLC (trading as Ash Grove South) | 80 | Cement |
| The Shelly Company | 100 | Aggregates, asphalt, readymixed concrete and related construction activities |
| Tilcon Connecticut Inc. | 100 | Aggregates, asphalt, readymixed concrete and related construction activities |
| Tilcon New York Inc. | 100 | Aggregates, asphalt and related construction activities |
| Trap Rock Industries, LLC* | 60 | Aggregates, asphalt and related construction activities |
| West Virginia Paving, Inc. | 100 | Aggregates, asphalt and related construction activities |
| | | | | |
2022 Annual Report and Form 20-F | 291 |
Building Products
| | | | | | | | | | | |
| Incorporated and operating in | | % held | Products and services |
| Australia | Infrastructure Products Australia Pty Ltd | 100 | Supplier of access chambers and ducting products |
| Leviat Pty Limited | 100 | Construction accessories |
| Plakabeton N.V. | 100 | Construction accessories |
| Belgium | Marlux N.V. | 100 | Concrete paving and landscaping products |
| Stradus N.V. | 100 | Concrete paving and landscaping products |
| Britain & Northern Ireland | Leviat Limited | 100 | Construction accessories |
| Canada | Oldcastle Building Products Canada, Inc. (trading as Groupe Permacon, Expocrete Concrete Products, Techniseal, Oldcastle BuildingEnvelope, C.R. Laurence of Canada, Oldcastle Enclosure Solutions) | 100 | Specialty masonry, hardscape and patio products, custom fabricated glass, architectural glazing systems and hardware for glass industry, utility boxes and trench systems |
| France | Plaka Group France S.A.S. | 100 | Construction accessories |
| Germany | EHL AG | 100 | Concrete paving and landscape walling products |
| Leviat GmbH | 100 | Construction accessories |
| Ireland | Cubis Systems Limited | 100 | Supplier of access chambers and ducting products |
| Netherlands | Struyk Verwo Groep B.V. | 100 | Concrete paving products |
| Leviat B.V. | 100 | Construction Accessories |
| Poland | Polbruk S.A. | 100 | Concrete paving products |
| Slovakia | Premac, spol. s.r.o.* | 100 | Concrete paving and floor elements |
| Switzerland | Leviat AG* | 100 | Construction accessories |
| APG Mid-Atlantic, Inc. | 100 | Specialty masonry, hardscape and patio products |
| Barrette Outdoor Living (Trading as Boyle Transportation Services, LLC and Barrette Logistics, Inc.) | 100 | Vinyl and aluminium fencing and railing and transportation |
| CRH America Finance, Inc. | 100 | Holding company |
| CRH America, Inc. | 100 | Holding company |
| CRH Americas, Inc. | 100 | Holding company |
| CRH Americas Products, Inc. | 100 | Holding company |
| Meadow Burke, LLC | 100 | Concrete accessories |
| MoistureShield, Inc. | 100 | Composite building products |
| United States | National Pipe & Plastics, Inc. | 100 | Pipe Products |
| Oldcastle APG Northeast, Inc. (trading principally as Anchor Concrete Products) | 100 | Specialty masonry, hardscape and patio products |
| Oldcastle APG South, Inc. (trading principally as Adams Products, Georgia Masonry Supply, Northfield Block Company, and Oldcastle Coastal) | 100 | Specialty masonry, hardscape and patio products |
| Oldcastle APG West, Inc. (trading principally as Amcor Masonry Products, Central Pre-Mix Concrete Products, Jewell Concrete, Sierra Building Products, US Mix, Superlite Block and Calstone) | 100 | Specialty masonry and stone products, hardscape and patio products |
| Oldcastle APG, Inc. (trading principally as EP Henry, Pebble Technology International, and Anchor Wall Systems) | 100 | Specialty masonry and stone products, hardscape, patio products, aggregate pool finishes and freestanding and retaining wall systems |
| Oldcastle Building Products, Inc. | 100 | Holding company |
| Oldcastle Infrastructure, Inc. | 100 | Precast concrete products, concrete pipe, prestressed plank and structural elements |
| Oldcastle Lawn & Garden, Inc. | 100 | Patio products, bagged stone, mulch and stone |
| | | | | |
| 2022 Annual Report and Form 20-F | 292 |
Principal Subsidiary Undertakings continued
as at 31 December 2022
Europe Materials
| | | | | | | | | | | |
| Incorporated and operating in | | % held | Products and services |
| Ergon N.V. | 100 | Precast concrete and structural elements |
| Belgium | Oeterbeton N.V. | 100 | Precast concrete |
| Prefaco N.V. | 100 | Precast concrete structural elements |
| Schelfhout N.V. | 100 | Precast concrete wall elements |
| VVM N.V.* | 100 | Clinker grinding and cement production |
| Northstone (NI) Limited (including Farrans Construction, Materials and Cubis divisions) | 100 | Aggregates, readymixed concrete, mortar, coated macadam, rooftiles, building and civil engineering contracting |
| Premier Cement Limited | 100 | Marketing and distribution of cement |
| Britain & Northern Ireland | Southern Cement Limited | 100 | Sale and distribution of cement |
| Tarmac Aggregates Limited | 100 | Aggregates, asphalt, readymixed concrete and contracting |
| Tarmac Building Products Limited | 100 | Building products |
| Tarmac Cement and Lime Limited | 100 | Cement and lime |
| Tarmac Trading Limited | 100 | Aggregates, asphalt, cement, readymixed concrete and contracting |
| Czech Republic | Vapenka Vitosov s.r.o | 75 | Production of lime and lime products |
| Betongruppen RBR A/S | 100 | Concrete paving manufacturer |
| Denmark | CRH Concrete A/S | 100 | Structural concrete products |
| RC Beton A/S | 100 | Manufacturer of concrete paving, concrete blocks and underground products |
| Finland | Finnsementti Oy | 100 | Cement |
| Rudus Oy | 100 | Aggregates, readymixed concrete and concrete products |
| Eqiom* | 99.99 | Aggregates, cement and readymixed concrete |
| France | L’industrielle du Béton S.A.* | 100 | Structural concrete products |
| Stradal | 100 | Utility and infrastructural concrete product |
| Fels Holding GmbH | 100 | Holding company |
| Fels Netz GmbH | 100 | Logistics and owned railway infrastructure operator |
| Germany | Fels Vertriebs und Service GmbH & Co. KG. | 100 | Lime and limestone, development of new products |
| Fels-Werke GmbH | 100 | Production and sale of lime and limestone |
| Opterra GmbH* | 100 | Cement and readymixed concrete |
| Hungary | Danucem Magyarország Kft. | 100 | Cement and readymixed concrete |
| Ferrobeton Dunaújvárosi Beton- és Vasbetonelem-gyártó Zrt* | 100 | Precast concrete structural elements |
| Clogrennane Lime Limited | 100 | Burnt and hydrated lime |
| Irish Cement Limited | 100 | Cement |
| Ireland | Roadstone Limited | 100 | Aggregates, readymixed concrete, mortar, coated macadam, concrete blocks and pipes, asphalt, agricultural and chemical limestone and contract surfacing |
| Calduran B.V. | 100 | Sand-lime bricks and building elements |
| Netherlands | Cementbouw B.V. | 100 | Cement transport and trading, readymixed concrete and aggregates |
| Dycore B.V. | 100 | Concrete flooring elements |
| Heembeton B.V. | 100 | Precast concrete structural elements |
| Philippines (i) | Republic Cement & Building Materials, Inc. | 40 | Cement |
| Republic Cement Land & Resources Inc. | 40 | Cement and Building Materials |
| Cement Ożarów S.A. | 100 | Cement |
| Drogomex Sp. z o.o.* | 100 | Asphalt and contract surfacing |
| Poland | Masfalt Sp. z o.o.* | 100 | Asphalt and contract surfacing |
| Przedsiebiorstwo Produkcji Mas Betonowych Bosta Beton Sp. z o.o. | 90.3 | Readymixed concrete |
| Trzuskawica S.A. | 100 | Production of lime and lime products |
(i) 55% economic interest in the combined Philippines business (see note 31 to the Consolidated Financial Statements).
| | | | | |
2022 Annual Report and Form 20-F | 293 |
Europe Materials - continued
| | | | | | | | | | | |
| Incorporated and operating in | | % held | Products and services |
| ROMCIM S.A. | 98.61 | Cement |
| Romania | Elpreco S.A. | 100 | Architectural concrete products |
| Ferrobeton Romania SRL* | 100 | Structural concrete products |
| Serbia | Moravacem d.o.o. Popovac | 100 | Cement |
| Danucem Slovensko a.s. | 99.79 | Cement and readymixed concrete |
| Slovakia | Ferrobeton Slovensko s.r.o. | 100 | Precast concrete structural elements |
| Spain | Beton Catalan, S.A. | 100 | Readymixed concrete |
| Cementos Lemona, S.A. | 98.75 | Cement |
| Switzerland | JURA-Holding AG* | 100 | Cement, aggregates and readymixed concrete |
| LLC Cement | 100 | Cement |
| Ukraine | PJSC Mykolaivcement | 100 | Cement |
| Podilsky Cement PJSC* | 100 | Cement |
Principal Equity Accounted Investments
as at 31 December 2022
Europe Materials
| | | | | | | | | | | |
| Incorporated and operating in | | % held | Products and services |
| China | Yatai Building Materials Group Company Limited* | 26 | Cement |
| Ireland | Kemek Limited* | 50 | Commercial explosives |
Americas Materials
| | | | | | | | | | | |
| Airlinx Transit Partners Inc.* | 50 | Special-purpose entity on Ontario infrastructure construction |
| Blackbird Infrastructure 407 General Partnership* | 50 | Special-purpose entity on highway infrastructure construction |
| Blackbird Maintenance 407 General Partnership* | 50 | Construction |
| Blackbird Constructors 407 General Partnership* | 50 | Construction |
| Blackbird Infrastructure 407 CRH GP Inc* | 50 | Special-purpose entity on highway infrastructure construction |
| Canada | DAD (Finch West LRT Inc.)* | 33 | Special-purpose entity on Ontario infrastructure construction |
| Kiewit-Dufferin Midtown Partnership* | 35 | Construction |
| Mosaic Transit Partners General Partnership* | 33 | Special-purpose entity on Ontario infrastructure |
| Mosaic Transit Constructors General Partnership* | 33 | Construction |
| United States | Buckeye Ready-Mix, LLC* | 45 | Readymixed concrete |
| Cadillac Asphalt, LLC* | 50 | Asphalt |
| Piedmont Asphalt, LLC* | 50 | Asphalt |
| Southside Materials, LLC* | 50 | Aggregates |
| Camden Materials, LLC* | 50 | Asphalt |
| Asphalt Inc., LLC* | 20 | Asphalt and Construction |
| Carrollton River Terminal, LLC* | 50 | Liquid Asphalt Storage |
| Nally and Gibson Georgetown, LLC | 50 | Aggregates, Asphalt and Construction |
* Audited by firms other than Deloitte.
Pursuant to Sections 314-316 of the Companies Act 2014, a full list of subsidiaries, joint ventures and associated undertakings will be annexed to the Company’s Annual Return to be filed in the Companies Registration Office in Ireland.
| | | | | |
| 2022 Annual Report and Form 20-F | 294 |
Our Products and Services Locations
| | | | | | | | | | | | | | | | | |
| Our
Locations | Cement | Aggregates | Lime | Readymixed Concrete |
| | | | | |
| Australia | | | | |
| Austria | | | | |
| Belgium | • | | | |
| Canada | • | • | | • |
| China1 | • | | | • |
| Croatia | | | | |
| Czech Republic | | | • | • |
| Denmark | | | | |
| Estonia | | • | | • |
| Finland | • | • | | • |
| France | • | • | | • |
| Germany | • | | • | |
| Hungary | • | | | • |
| Ireland | • | • | • | • |
| Italy | | | | |
| Malaysia | | | | |
| Netherlands | • | • | • | • |
| Norway | | | | |
| Philippines | • | | | |
| Poland | • | • | • | • |
| Romania | • | • | • | • |
| Serbia | • | | | • |
| Slovakia | • | • | | • |
| Spain | • | • | | • |
| Sweden | | | | |
| Switzerland | • | • | | • |
| Ukraine | • | | | • |
| United Kingdom | • | • | • | • |
| United States | • | • | | • |
* Includes Infrastructure Products, Architectural Products and Network Access Products.
1. Includes the Group's equity accounted investment.
| | | | | |
2022 Annual Report and Form 20-F | 295 |
| | | | | | | | | | | | | | |
| Asphalt | Paving & Construction | Concrete Products* | Construction Accessories |
| | | | |
| | | • | • |
| | | | • |
| | | • | • |
| • | • | • | |
| | | • | • |
| | | • | |
| | | | |
| | • | • | |
| | | | |
| | | • | |
| | | • | • |
| | | • | • |
| | • | • | |
| • | • | • | |
| | | | • |
| | | | • |
| | • | • | • |
| | | | • |
| | | | |
| • | • | • | • |
| | | • | |
| | | | |
| | | • | |
| | • | • | • |
| | | | • |
| • | | | • |
| | | • | |
| • | • | • | • |
| • | • | • | • |
| | | | | |
| 2022 Annual Report and Form 20-F | 296 |
Exhibits
The following documents are filed in the SEC’s EDGAR system, as part of this Annual Report on Form 20-F, and can be viewed on the SEC’s website.
8. Listing of principal subsidiary undertakings and equity accounted investments (included on pages 290 to 293 of this Annual Report and Form 20-F).
101. Inline eXtensible Business Reporting Language (XBRL).
* Incorporated by reference to Annual Report on Form 20-F for the year ended 31 December 2020 that was filed by the company on 12 March 2021.
** Incorporated by reference to Annual Report on Form 20-F for the year ended 31 December 2006 that was filed by the Company on 3 May 2007.
*** Furnished but not filed.
The total amount of long-term debt of the Registrant and its subsidiaries authorised under any one instrument does not exceed 10% of the total assets of CRH plc and its subsidiaries on a consolidated basis.
The Company agrees to furnish copies of any such instrument to the SEC upon request.
| | | | | |
2022 Annual Report and Form 20-F | 297 |
Cross Reference to Form 20-F Requirements
This table has been provided as a cross reference from the information included in this Annual Report and Form 20-F to the requirements of this 20-F.
| | | | | | | | | | | | | | | | | | | | | | | | | | | | | | | | | | | | | | | | | | | | | | | | | | | | | |
| | | | | | | | Page | | | | | | | | | Page |
| PART I | | | | | | | | | | | | | | | | | |
| Item 1. | Identity of Directors, Senior | | n/a | | Item 9. | The Offer and Listing | | | |
| Management and Advisors | | | | | A - | Offer and Listing Details | | | 278 |
| Item 2. | Offer Statistics and Expected | | n/a | | | B - | Plan of Distribution | | | n/a |
| Timetable | | | | | C - | Markets | | | 278 |
| Item 3. | Key Information | | | | | D - | Selling Shareholders | | | n/a |
| A - | [Reserved] | | n/a | | | E - | Dilution | | | n/a |
| B - | Capitalisation and Indebtedness | | n/a | | | F - | Expenses of the Issue | | | n/a |
| C - | Reasons for the Offer and Use of | | n/a | | Item 10. | Additional Information | | | |
| | Proceeds | | | | | A - | Share Capital | | | n/a |
| D - | Risk Factors | 139-148 | | | B - | Memorandum and Articles of | 285-286 |
| Item 4. | Information on the Company | | | | | | Association | | | |
| A - | History and Development | 2-3, 16, 23, 63-64, 67, 195-196, 198, 208-209, 242-245, 275, 287 | | | C - | Material Contracts | | | None |
| | of the Company | | | D - | Exchange Controls | | | 287 |
| | | | | | | | E - | Taxation | | 283-284 |
| B - | Business Overview | 2-3, 16, 19, 68-79, 113, 135, 141-146, 156, 191-195, 262, 268, 275 | | | F - | Dividends and Paying Agents | | n/a |
| | | | | | | | G - | Statements by Experts | | | n/a |
| | | | | | | | H - | Documents on Display | | | 287 |
| C - | Organisational Structure | 275, 290-293 | | | I - | Subsidiary Information | | 290-293 |
| D - | Property, Plants and Equipment | 182, 208-209, 262-268 | | | J - | Annual Report to Security Holders | | n/a |
| | | | | | | Item 11. | Quantitative and Qualitative | | | 274 |
| Item 4A. | Unresolved Staff Comments | | | None | | | Disclosure about Market Risk | | | |
| Item 5. | Operating and Financial Review and Prospects | | | Item 12. | Description of Securities Other than Equity Securities |
| A - | Operating Results | 14-16, 30, 51, 62-79, 92-93, 139, 141, 148, 179, 189, 221-228, 230-231, 275 | | | A - | Debt Securities | | | n/a |
| | | | | | | | B - | Warrants and Rights | | | n/a |
| | | | | | | | C - | Other Securities | | | n/a |
| B - | Liquidity and Capital | 62-67, 147, 180, 188, 191-192, 195-196, 203, 208-209, 216-238, 274 | | | D - | American Depositary Shares | | 282 |
| | Resources | | | | | | | | | |
| | | | | | | PART II | | | | | | | |
| C - | Research and Development, | | | 275 | | Item 13. | Defaults, Dividend Arrearages and | | None |
| | Patents and Licences, etc. | | | | | | Delinquencies | | |
| D - | Trend Information | 16, 62-64, 68-79 | | Item 14. | Material Modifications to the Rights of | | None |
| E - | Critical Accounting Estimates | | | n/a | | | Security Holders and Use of Proceeds | | |
| Supplemental Guarantor Information | | 261 | | Item 15. | Controls and Procedures | 175, 269 |
| Item 6. | Directors, Senior Management and | | | | Item 16A. | Audit Committee Financial Expert | 82-84, 93 |
| Employees | | | | Item 16B. | Code of Ethics | 101 |
| A - | Directors and Senior Management | 82-84, 86, 117 | | Item 16C. | Principle Accountant Fees and Services | 96, 197, 287 |
| B - | Compensation | 108-132, 234-238 | | Item 16D. | Exemptions from the Listing | | n/a |
| C - | Board Practices | 82-84, 87, 92-102, 114-117, 132 | | | Standards for Audit Committee | | |
| | | | | | | Item 16E. | Purchases of Equity Securities by the | 278-279 |
| D - | Employees | 38, 199, 275 | | | Issuer and Affiliated Purchasers | | |
| E - | Share Ownership | 119-132, 281 | | Item 16F. | Change in Registrant's Certifying | | None |
| F - | Disclosure of a Registrant’s Action to | n/a | | | Accountant | | |
| | Recover Erroneously Awarded Compensation | | | Item 16G. | Corporate Governance | | 269 |
| Item 7. | Major Shareholders and Related Party Transactions | | Item 16H. | Mine Safety Disclosures | | 268 |
| A - | Major Shareholders | 101, 278 | | Item 16I. | Disclosure Regarding Foreign | | n/a |
| B - | Related Party Transactions | 247 | | | Jurisdictions that Prevent Inspections | | |
| C - | Interests of Experts and Counsel | | n/a | | Item 16J. | Insider Trading Policies | | n/a |
| Item 8. | Financial Information | | | | | | | | | | | |
| A - | Consolidated Statements and Other | 172-247 | | PART III | | | | | | | |
| | Financial Information | | | | Item 17. | Financial Statements | | n/a |
| | - Legal Proceedings | | 275 | | Item 18. | Financial Statements | 172-247 |
| | - Dividends | 206, 240, 280, 285 | | Item 19. | Exhibits | | 296 |
| B - | Significant Changes | | 275 | | | | | | | | | |
| | | | | | | | | | | | | | | | | |
| | | | | |
| 2022 Annual Report and Form 20-F | 298 |
Index
| | | | | |
| A | |
Accounting Policies | 181 |
Acquisitions, Divestments & Finance Committee | 87 |
| Alternative Performance Measures | 257 |
American Depositary Shares | 282 |
Americas Materials | 68 |
Annual General Meeting | 130, 138 |
Audit Committee | 92 |
Auditors (Directors’ Report) | 137 |
Auditor’s Remuneration | 96, 197, 252 |
Auditor’s Report, Independent (US) | 172 |
| |
B | |
Balance Sheet | |
- Consolidated | 178 |
Board Approval of Financial Statements (note 33) | 247 |
Board Committees | 87, 90 |
Board Effectiveness | 99 |
Board of Directors | 82 |
Board Responsibilities | 98 |
Building Products | 72 |
Business and Non-Current Asset Disposals (note 6) | 198 |
Business Combinations (note 30) | 186, 242 |
Business Model | 20 |
Business Performance | 60 |
| |
C | |
Capital and Financial Risk Management (note 22) | 225 |
| Carbon | 15, 26, 57 |
Cash and Cash Equivalents (note 23) | 188, 229 |
Cash Flow, Operating | 5 |
Cash Flow Statement, Consolidated | 180 |
Chairman’s Introduction | 8 |
Chief Executive’s Review | 14 |
| Chief Financial Officer’s Review | 62 |
| Chief Operating Decision Maker | 193 |
| | | | | |
| Climate | |
- Strategy | 57 |
- Targets | 58 |
- TCFD | 56 |
Communications with Shareholders | 101 |
Company Secretary | 101 |
Compliance and Ethics | 101 |
| Contractual Obligations | 274 |
Corporate Governance Practices | 269 |
Corporate Governance Report | 88 |
Cost Analysis (note 4) | 196 |
Credit Ratings | 226 |
CREST and Migration to Euroclear Bank | 279 |
| |
D | |
Debt, Analysis of Net (note 21) | 221 |
| Decarbonisation | 26 |
Deferred Income Tax | |
- expense (note 10) | 186, 204 |
- assets and liabilities (note 27) | 186, 233 |
| Depreciation | |
- cost analysis (note 4) | 196 |
- property, plant and equipment
(note 13) | 182, 186, 208 |
| - segment analysis (note 2) | 193 |
Derivative Financial Instruments (note 25) | 188, 230 |
Directors’ Emoluments and Interests | 108, 247 |
Directors’ Interests in Share Capital | 131 |
Directors’ Remuneration Report | 108 |
Directors’ Report | 134 |
Directors’ Share Options | 124 |
Discontinued Operations (note 3) | 185, 195 |
Dividend Payments (Shareholder Information) | 280 |
Dividend per Share | 1 |
Dividends (note 11) | 206 |
| | | | | |
| E | |
Earnings per Ordinary Share (note 12) | 207 |
Employees, Average Number (note 7) | 199 |
Employment Costs (note 7) | 199 |
| Environment | 36 |
Equity Accounted Investments’ Profit, Share of | 193 |
Europe Materials | 76 |
Exchange Rates | 190 |
| Exhibits | 296 |
| |
F | |
| Finance Costs and Finance Income (note 9) | 203 |
| Financial Assets (note 15) | 213 |
| Financial Calendar | 287 |
| Financial Statements, Consolidated | 176 |
| Foreign Currency Translation | 148 |
| Frequently Asked Questions | 287 |
| |
G | |
Global Business | 2 |
Going Concern | 136, 181 |
| Governance | 80 |
Greenhouse Gas Emissions | 30 |
Guarantees (note 24) | 229 |
| |
H | |
Health and Safety | 38 |
| | | | | |
2022 Annual Report and Form 20-F | 299 |
| | | | | |
| I | |
| Inclusion and Diversity | 40, 104 |
| Income Statement, Consolidated | 176 |
| Income Tax Expense (note 10) | 204 |
| Intangible Assets (note 14) | 187, 210 |
| Inventories (note 16) | 187, 213 |
| Investor Relations Activities | 102 |
| Innovation | 3, 4, 30, 89 |
| |
| K | |
| Key Components of 2022 Performance | 63 |
| Key Financial Data | 256 |
| Key Management Personnel | 247 |
| KPIs, Financial | 65 |
| KPIs, Non-Financial | 65 |
| |
| L | |
| Leases (note 20) | 187, 218 |
| Listing Rule 9.8.4C | 135 |
Loans and Borrowings,Interest-Bearing (note 24) | 188, 229 |
| |
| M | |
| Measuring Performance | 65 |
Memorandum and Articles of Association | 102, 285 |
| Movement in Inventories, Receivables, Payables and Provisions for Liabilities (note 19) | 217 |
| |
| N | |
| Natural World | 36 |
| Net Zero | 9, 26, 105 |
Nomination & Corporate Governance Committee | 98 |
| Non-controlling Interests (note 31) | 246 |
| Non-GAAP Performance Measures | 257 |
Notes on Consolidated Financial Statements | 191 |
| |
| O | |
| Operating Costs (note 4) | 196 |
| | | | | |
| P | |
Pensions, Retirement Benefit
Obligations (note 28) | 182, 234 |
| People | 38, 139 |
Principal Equity Accounted Investments | 293 |
| Principal Subsidiary Undertakings | 290 |
| Profit on Disposals (note 6) | 198 |
Property, Plant and Equipment
(note 13) | 182, 186, 208 |
| Property, Plants and Equipment | 268 |
| Provisions for Liabilities (note 26) | 183, 232 |
| Proxy Voting, Electronic | 287 |
| Purpose | 6 |
| |
| R | |
| Registrars | 287 |
| Regulatory Information | 135 |
| Related Party Transactions (note 32) | 247 |
| Remuneration Committee | 119 |
| Research and Development | 275 |
| Reserves, Mineral | 262 |
| Responsible Business | 46 |
| Resources, Mineral | 262 |
Retirement Benefit Obligations
(note 28) | 182, 234 |
| Return on Net Assets (RONA) | 5, 65, 258, 260 |
| Revenue (note 1) | 184, 191 |
| Revenue from products with enhanced sustainability attributes | 35, 259, 260 |
| Risk Governance | 94 |
| Risk Management and Internal Control | 136, 269 |
| Risk Factors | 139 |
| |
| S | |
| Safety | 38 |
Safety, Environment & Social Responsibility Committee | 104 |
| Science Based Targets Initiative | 4, 14, 27, 58, 181 |
| Sector Exposure and End-Use | |
| - Americas Materials | 68 |
| - Building Materials | 72 |
| - Europe Materials | 76 |
| Segment Information (note 2) | 185, 193 |
| Senior Independent Director | 82 |
| | | | | |
| Share-based Payments (note 8) | 185, 200 |
| Share Buyback Programme | 5, 241, 279 |
Share Capital and Reserves (note 29) | 188, 239 |
| Share Options | |
| - Directors | 124 |
| - Employees (note 8) | 200 |
| Share Premium | 241, 252 |
| Share Price Data | 278 |
| Shareholder Communication | 101 |
| Shareholdings as at 31 December 2022 | 101, 278 |
| Solutions | 24 |
Statement of Changes in Equity,
Consolidated | 179 |
Statement of Comprehensive Income, Consolidated | 177 |
| Stock Exchange Listings | 101, 278 |
| Strategy | 12 |
| Substantial Holdings | 101 |
| Sustainability | 24 |
| |
| T | |
Task Force on Climate-related Financial Disclosures (TCFD) | 56 |
| Total Shareholder Return (TSR) | 4, 65, 127, 259 |
| Trade and Other Payables (note 18) | 216 |
| Trade and Other Receivables (note 17) | 188, 214 |
| |
| V | |
| Volumes, Annualised | |
| - Americas Materials | 68 |
| - Europe Materials | 76 |
| |
| W | |
| Waste | 32 |
| Water | 34 |
| Website | 287 |
| | | | | |
| 2022 Annual Report and Form 20-F | 300 |
Signatures
The registrant hereby certifies that it meets all of the requirements for filing on Form 20-F and that it has duly caused and authorised the undersigned to sign this Annual Report on its behalf.
| | | | | |
| CRH public limited company |
| (Registrant) |
| /s/ J. Mintern |
| By: | |
| Jim Mintern |
| Chief Financial Officer |
Dated: 10 March 2023
CRH plc
Stonemason’s Way
Rathfarnham
Dublin 16
D16 KH51
Ireland
Telephone: +353 1 404 1000
E-mail: mail@crh.com
Website: www.crh.com
Registered Office
42 Fitzwilliam Square
Dublin 2
D02 R279
Ireland
Telephone: +353 1 634 4340
E-mail: crh42@crh.com
CRH® is a registered trade mark
of CRH plc.
Cover image: Towering nearly 200 metres and spanning almost two kilometres across the river Danube, the Brăila Bridge is the most complex road infrastructure project undertaken in Romania in recent decades. ROMCIM, a CRH Company, created innovative new concrete solutions to meet the unique technical requirements of this enormous structure, ensuring durability in challenging environmental conditions. The Bridge demonstrates how, at CRH, we provide solutions for the built environment, that will stand the test of time.