Exhibit 99.1
Press Release
For Further Information Contact:
| INVESTORS: | MEDIA: |
| Byron Purcell | Christopher Savarese |
| (717) 975-5809 | (717) 975-5718 |
| Or investor@riteaid.com | |
FOR IMMEDIATE RELEASE
Rite Aid Corporation Reports Fiscal 2020 Third Quarter Results
| · | Third Quarter Net Income from Continuing Operations of $52.3 Million or $0.98 Per Share, Compared to the Prior Year Third Quarter Net Loss of $17.3 Million or $0.33 Per Share |
| · | Third Quarter Adjusted Net Income from Continuing Operations of $29.1 Million or $0.54 Per Share, Compared to the Prior Year Third Quarter Adjusted Net Income of $14.7 Million or $0.28 Per Share |
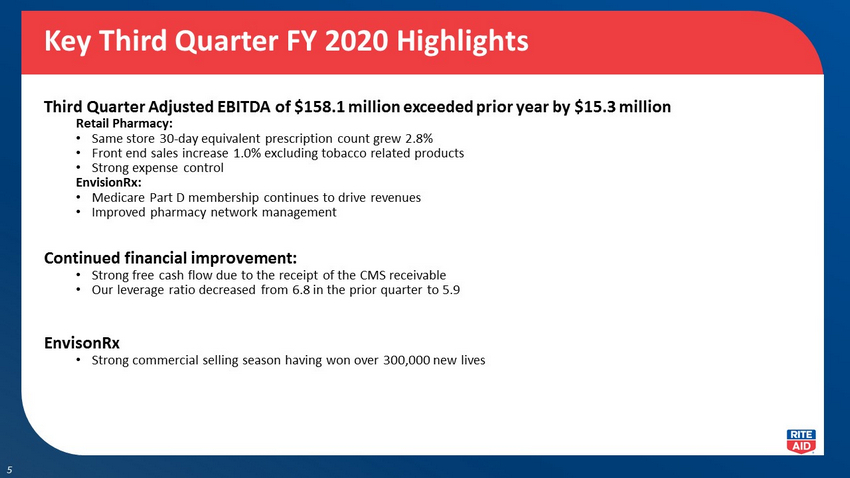
| · | Third Quarter Adjusted EBITDA from Continuing Operations of $158.1 Million, Compared to the Prior Year Third Quarter Adjusted EBITDA of $142.8 Million |
| o | Improved Adjusted EBITDA in both the Retail Pharmacy and Pharmacy Services Segments |
| · | Achieved Growth in Both Same Store Front-End Sales (Excluding Cigarettes and Tobacco Products) and Same Store Prescription Volume |
CAMP HILL, Pa. (Dec. 19, 2019) - Rite Aid Corporation (NYSE: RAD) today reported operating results for its third fiscal quarter ended November 30, 2019.
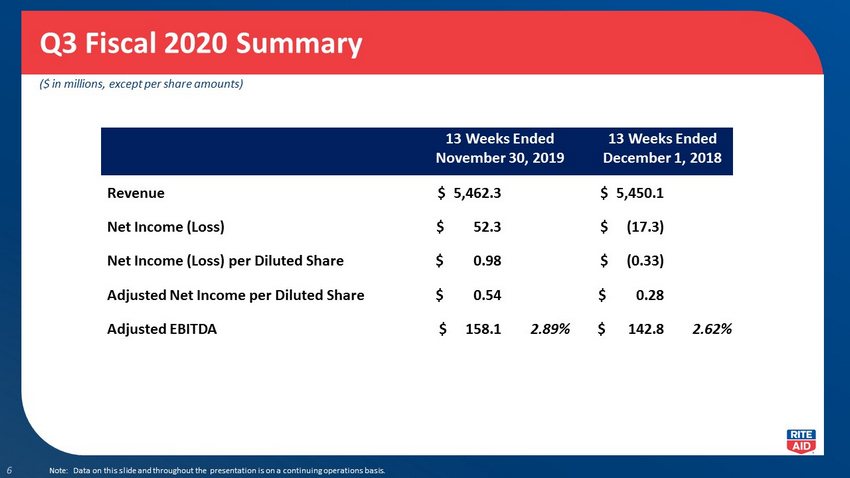
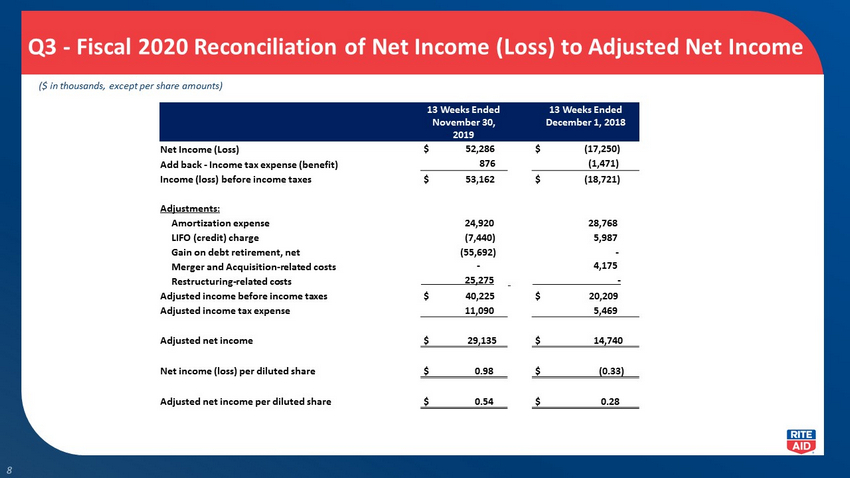
For the third quarter, the company reported net income from continuing operations of $52.3 million, or $0.98 per share, Adjusted net income from continuing operations of $29.1 million, or $0.54 per share, and Adjusted EBITDA from continuing operations of $158.1 million, or 2.9 percent of revenues.
“Our team delivered a strong quarter that provides us
with momentum as we prepare to roll out our long-term strategy and position Rite Aid Corporation as an innovative leader in our
industry,” said Rite Aid Corporation CEO Heyward Donigan. “Adjusted EBITDA grew in our retail business due to tight
expense control and prescription count growth in our retail pharmacies, which benefited from solid growth in immunizations. At
the same time, we saw improved pharmacy network management at EnvisionRxOptions.
“While we are pleased with these results, we have important work ahead of us to put our company on a path to long-term sustainable growth. We will soon reveal our comprehensive strategy that revitalizes Rite Aid retail pharmacies as fresh and relevant, leveraging the trust and expertise of our pharmacists in meeting the unique health and wellbeing needs of our communities. We are also investing in the expansion and integration of EnvisionRxOptions, particularly its services, technologies and clinical offerings. This will provide us scale to deliver lower total cost of care, an enhanced client experience and heightened consumer engagement. We are making great progress, and we are excited to share more details at our upcoming Analyst Day on March 16.”
-More-
Rite Aid FY 2020 Q3 Press Release - page 2
Third Quarter Summary
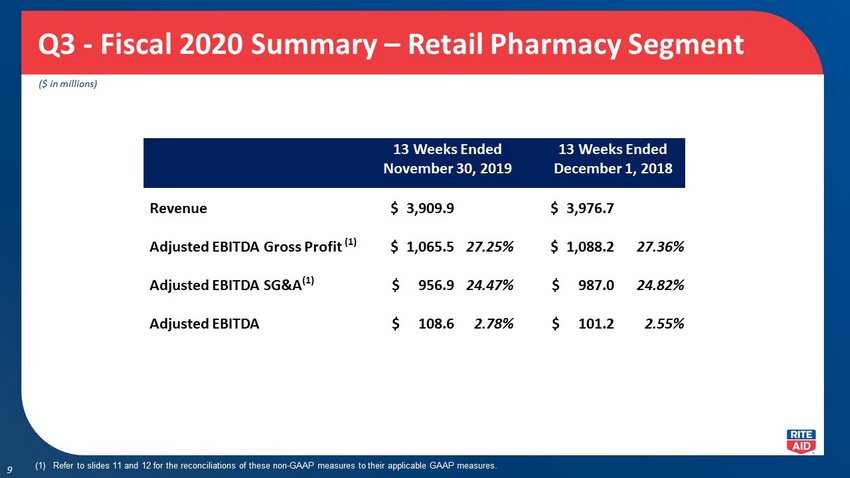
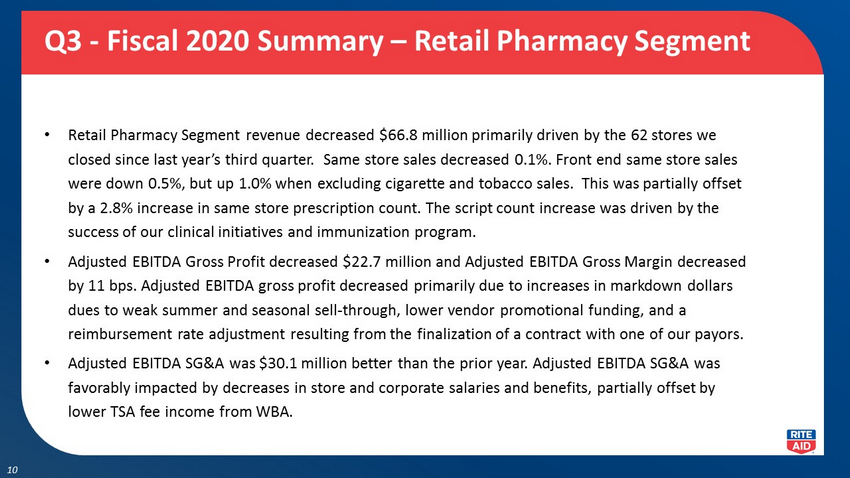
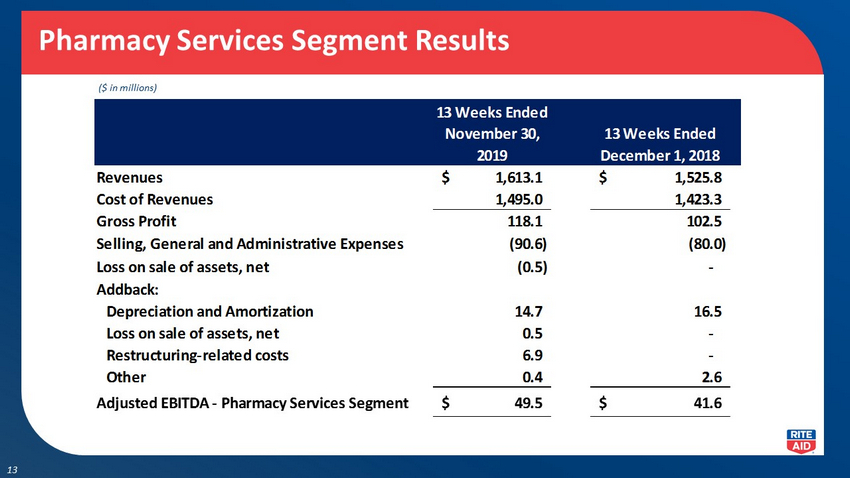
Revenues from continuing operations for the quarter were $5.46 billion compared to revenues from continuing operations of $5.45 billion in the prior year’s quarter. Retail Pharmacy Segment revenues were $3.91 billion and decreased 1.7 percent compared to the prior year period due to a reduction in store count. Revenues in the Pharmacy Services Segment were $1.61 billion, an increase of 5.7 percent compared to the prior year period, which was due to an increase in Medicare Part D membership.
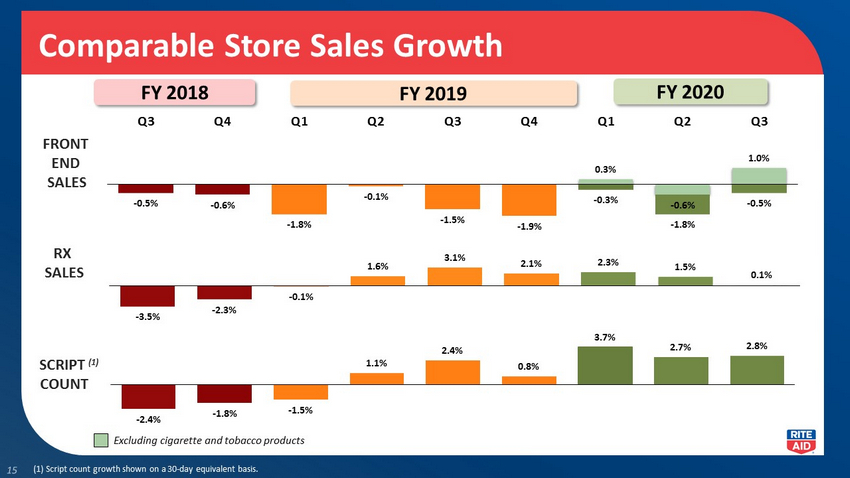
Retail Pharmacy Segment same store sales from continuing operations for the third quarter decreased 0.1 percent over the prior year period, consisting of a 0.1 percent increase in pharmacy sales and a 0.5 percent decrease in front-end sales. Front-end same store sales, excluding cigarettes and tobacco products, increased 1.0 percent. Pharmacy sales were negatively impacted by approximately 331 basis points as a result of new generic introductions. The number of prescriptions filled in same stores, adjusted to 30-day equivalents, increased 2.8 percent over the prior year period resulting primarily from the company’s continued emphasis on driving clinical services, including immunizations. Prescription sales from continuing operations accounted for 67.7 percent of total drugstore sales.
Net income from continuing operations was $52.3 million or $0.98 per share compared to last year’s third quarter net loss from continuing operations of $17.3 million or $0.33 per share. The increase in net income was due primarily to a $55.7 million gain on debt retirements and an increase in Adjusted EBITDA.
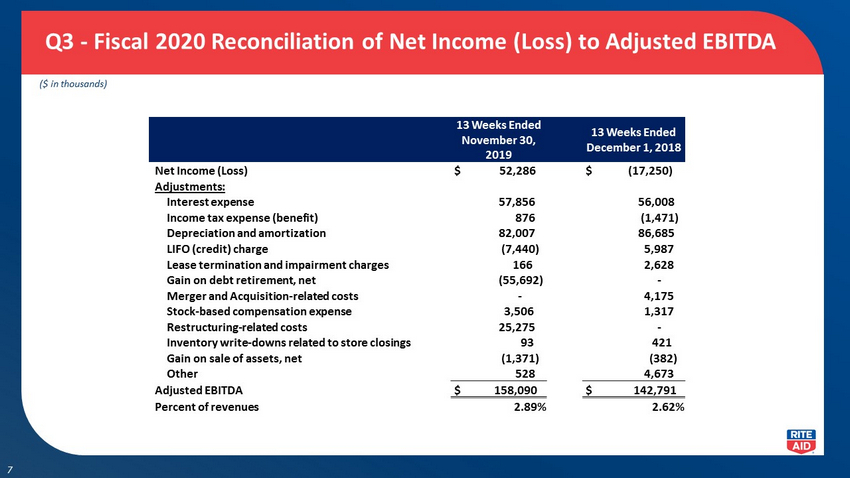
Adjusted EBITDA from continuing operations was $158.1 million or 2.9 percent of revenues for the third quarter compared to last year’s third quarter Adjusted EBITDA from continuing operations of $142.8 million or 2.6 percent of revenues, an increase of $15.3 million. Retail Pharmacy Segment Adjusted EBITDA from continuing operations increased $7.4 million due to strong labor and benefits expense control. These improvements were partially offset by a reduction in gross profit and a reduction in Transition Service Agreement fee income from Walgreens Boots Alliance. The Pharmacy Services Segment Adjusted EBITDA increased $7.9 million compared to the prior year due to improvements in pharmacy network management.
Outlook for Fiscal 2020
Rite Aid Corporation is updating its fiscal 2020 outlook, which includes narrowing its guidance for Adjusted EBITDA. The company’s outlook assumes continued prescription count growth, improvements in generic drug costs and strong SG&A expense control, offset by a decline in prescription reimbursement rates. The fiscal 2020 guidance for EnvisionRxOptions assumes sustained improvements in pharmacy network management and initial results of SG&A reduction, benefits integration and restructuring initiatives.
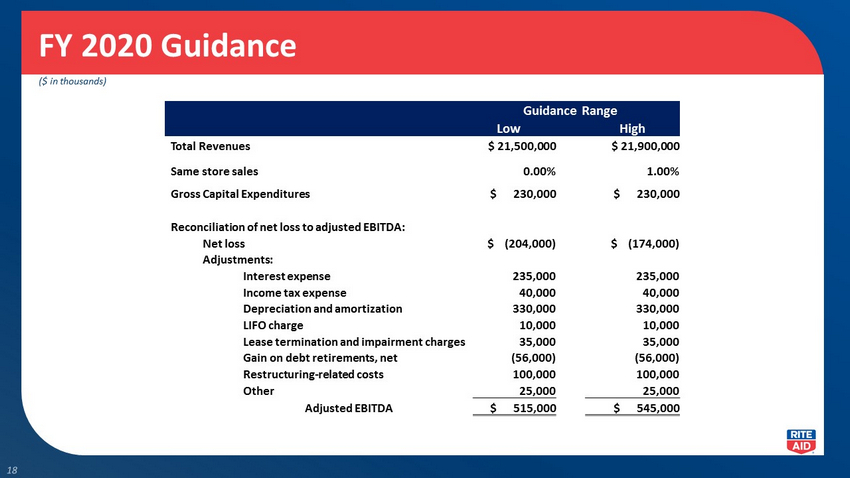
Rite Aid Corporation expects revenues to be between $21.5 billion and $21.9 billion in fiscal 2020 with same store sales expected to range from an increase of 0.0 percent to an increase of 1.0 percent over fiscal 2019.
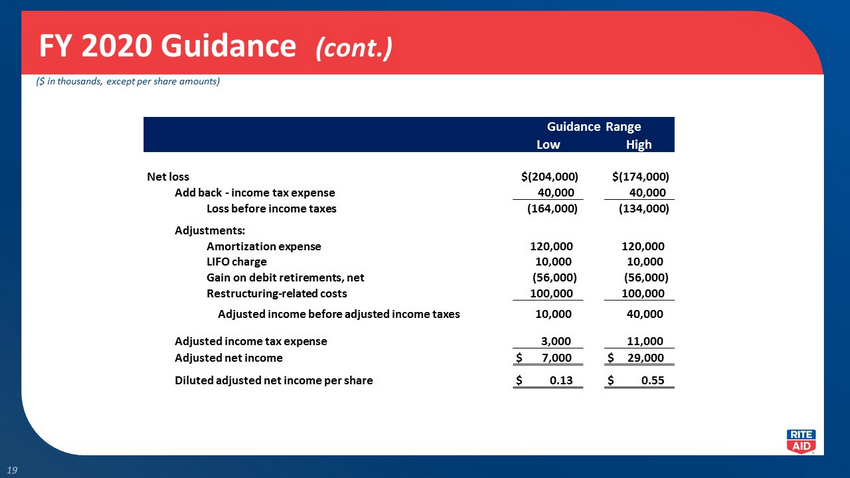
Net loss is expected to be between $174.0 million and $204.0 million.
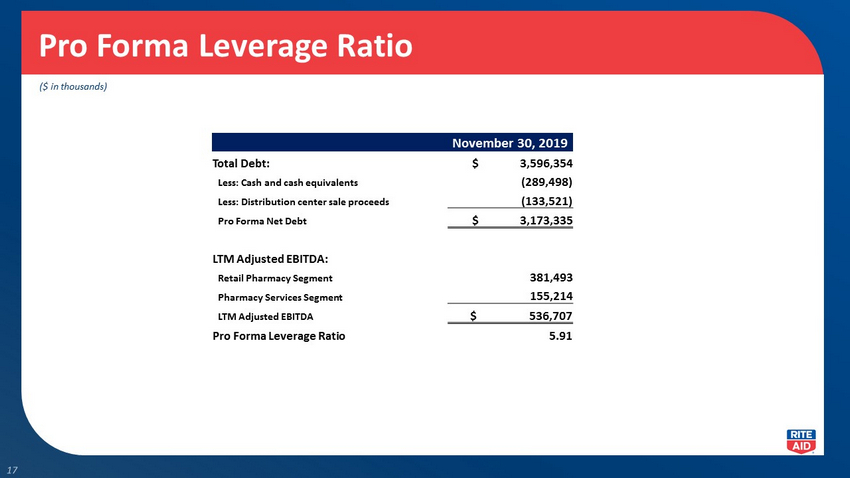
Adjusted EBITDA is expected to be between $515.0 million and $545.0 million.
Adjusted net income per share is expected to be between $0.13 and $0.55.
Capital expenditures are expected to be approximately $230 million.
-More-
Rite Aid FY 2020 Q3 Press Release - page 3
Conference Call Broadcast
Rite Aid Corporation will hold an analyst call at 8:30 a.m. Eastern Time today with remarks by Rite Aid's management team. The call will be simulcast via the internet and can be accessed at www.riteaid.com in the conference call section of investor information. A playback of the call will also be available by telephone beginning at 12:00 p.m. Eastern Time today until 11:59 p.m. Eastern Time on Dec. 21, 2019. The playback number is 1-855-859-2056 from within the U.S. and Canada or 1-404-537-3406 from outside the U.S. and Canada with the reservation number 6188277.
About Rite Aid Corporation
Rite Aid Corporation is on the front lines of delivering health care services and retail products to over 1.6 million Americans
daily. Our pharmacists are uniquely positioned to engage with customers and improve their health outcomes. We provide an array
of whole being health products and services for the entire family through over 2,400 retail pharmacy locations across 18 states.
Through EnvisionRxOptions, we also deliver pharmacy benefit management to approximately 1,900 clients and 3.4 million members.
For more information, visit www.riteaid.com.
Cautionary Statement Regarding Forward-Looking Statements
Statements in this release that are not historical, are forward-looking statements made pursuant to the safe harbor provisions of the Private Securities Litigation Reform Act of 1995. Such statements include, but are not limited to, statements regarding Rite Aid’s outlook and guidance for fiscal 2020; Rite Aid’s competitive position and ability to realize its growth initiatives and operating efficiencies; and any assumptions underlying any of the foregoing. Words such as “anticipate,” “believe,” “continue,” “could,” “estimate,” “expect,” “intend,” “may,” “plan,” “predict,” “project,” “should,” and “will” and variations of such words and similar expressions are intended to identify such forward-looking statements.
These forward-looking statements are not guarantees of future performance and involve risks, assumptions and uncertainties, including, but not limited to, our high level of indebtedness and our ability to make interest and principal payments on our debt and satisfy the other covenants contained in our debt agreements; general economic, industry, market, competitive, regulatory and political conditions; our ability to improve the operating performance of our stores in accordance with our long term strategy; the ongoing impact of private and public third-party payers continued reduction in prescription drug reimbursements and efforts to encourage mail order; our ability to manage expenses and our investments in working capital; outcomes of legal and regulatory matters; changes in legislation or regulations, including healthcare reform; our ability to achieve the benefits of our efforts to reduce the costs of our generic and other drugs; risks related to the pending sale of the remaining Rite Aid distribution center and related assets to Walgreens Boots Alliance, Inc. ("WBA"), including the possibility that the transaction may not close due to the failure to satisfy the minimal remaining conditions; our ability to successfully achieve benefits from our leadership transition plan and organizational restructuring, including managing the transition to our new chief executive officer and other management; the potential for operational disruptions due to, among other things, concerns of management, employees, current and potential customers, other third parties with whom we do business and shareholders; the success of any changes to our business strategy that may be implemented under our new chief executive officer and other management; our ability to achieve cost savings through the organizational restructurings within the anticipated timeframe, if at all; possible changes in the size and components of the expected costs and charges associated with the organizational restructuring plan; and the outlook for and future growth of the Company.
These and other risks, assumptions and uncertainties are more fully described in Item 1A (Risk Factors) of our most recent Annual Report on Form 10-K and in other documents that we file or furnish with the Securities and Exchange Commission, which you are encouraged to read.
-More-
Rite Aid FY 2020 Q3 Press Release - page 4
Should one or more of these risks or uncertainties materialize, or should underlying assumptions prove incorrect, actual results may vary materially from those indicated or anticipated by such forward-looking statements. Accordingly, you are cautioned not to place undue reliance on these forward-looking statements, which speak only as of the date they are made. Rite Aid expressly disclaims any current intention to update publicly any forward-looking statement after the distribution of this release, whether as a result of new information, future events, changes in assumptions or otherwise.
Reconciliation of Non-GAAP Financial Measures
Rite Aid separately reports financial results on the basis of Adjusted Net Income (Loss), Adjusted Net Income (Loss) per Diluted Share and Adjusted EBITDA which are non-GAAP financial measures. See the attached tables for a reconciliation of Adjusted Net Income (Loss), Adjusted Net Income (Loss) per Diluted Share and Adjusted EBITDA to net income (loss), and net income (loss) per diluted share, which are the most directly comparable GAAP financial measures. Adjusted Net Income (Loss) and Adjusted Net Income (Loss) per Diluted Share exclude amortization expense, merger and acquisition-related costs, non-recurring litigation settlement, gains and losses on debt retirements, LIFO adjustments, goodwill and intangible asset impairment charges, restructuring-related costs and the WBA merger termination fee. The current calculations of Adjusted Net Income (Loss) and Adjusted Net Income (Loss) per Diluted Share reflect a modification made in the second quarter of fiscal 2019 to add back all amortization expenses rather than the amortization of EnvisionRx intangible assets only. Adjusted EBITDA is defined as net income (loss) excluding the impact of income taxes, interest expense, depreciation and amortization, LIFO adjustments, charges or credits for facility closing and impairment, goodwill and intangible asset impairment charges, inventory write-downs related to store closings, gains or losses on debt retirements, the WBA merger termination fee, and other items (including stock-based compensation expense, merger and acquisition-related costs, non-recurring litigation settlement, severance, restructuring-related costs and costs related to facility closures and gain or loss on sale of assets). The current calculation of Adjusted EBITDA reflects a modification made in the second quarter of fiscal 2019 to eliminate the add back of revenue deferrals related to our customer loyalty program and to present amounts previously included within other as separate reconciling items. We further note that the add back of LIFO (credit) charge when calculating Adjusted EBITDA, Adjusted Net Income (Loss) and Adjusted Net Income (Loss) per Diluted Share removes the entire impact of LIFO (credits) charges, and effectively reflects Rite Aid’s results as if the company was on a FIFO inventory basis.
In addition to Adjusted EBITDA, Adjusted Net (Loss) Income and Adjusted Net (Loss) Income per Diluted Share, we occasionally refer to several other Non-GAAP measures, on a less frequent basis, in order to describe certain components of our business and how we utilize them to describe our results. Adjusted EBITDA Gross Profit includes LIFO adjustments, depreciation and amortization (COGS portion only) and other items. The presentation includes a reconciliation of Adjusted EBITDA Gross Profit to Revenue, which is the most directly comparable GAAP financial measure. Adjusted EBITDA SG&A excludes depreciation and amortization (SG&A portion only), stock-based compensation expense, merger and acquisition-related costs, litigation settlement, restructuring-related costs and other items. The presentation includes a reconciliation of Adjusted EBITDA SG&A to Revenue, which is the most directly comparable GAAP financial measure.
###
RITE AID CORPORATION AND SUBSIDIARIES
CONSOLIDATED BALANCE SHEETS
(Dollars in thousands)
(unaudited)
| November 30, 2019 | March 2, 2019 | |||||||
| ASSETS | ||||||||
| Current assets: | ||||||||
| Cash and cash equivalents | $ | 289,498 | $ | 144,353 | ||||
| Accounts receivable, net | 1,689,838 | 1,788,712 | ||||||
| Inventories, net of LIFO reserve of $611,997 and $604,444 | 1,957,045 | 1,871,941 | ||||||
| Prepaid expenses and other current assets | 178,292 | 179,132 | ||||||
| Current assets held for sale | 101,594 | 117,581 | ||||||
| Total current assets | 4,216,267 | 4,101,719 | ||||||
| Property, plant and equipment, net | 1,254,234 | 1,308,514 | ||||||
| Operating lease right-of-use assets | 2,935,104 | - | ||||||
| Goodwill | 1,108,136 | 1,108,136 | ||||||
| Other intangibles, net | 374,660 | 448,706 | ||||||
| Deferred tax assets | 382,105 | 409,084 | ||||||
| Other assets | 158,285 | 215,208 | ||||||
| Total assets | $ | 10,428,791 | $ | 7,591,367 | ||||
| LIABILITIES AND STOCKHOLDERS' EQUITY | ||||||||
| Current liabilities: | ||||||||
| Current maturities of long-term debt and lease financing obligations | $ | 9,486 | $ | 16,111 | ||||
| Accounts payable | 1,534,302 | 1,618,585 | ||||||
| Accrued salaries, wages and other current liabilities | 806,739 | 808,439 | ||||||
| Current portion of operating lease liabilities | 493,699 | - | ||||||
| Current liabilities held for sale | 42,422 | - | ||||||
| Total current liabilities | 2,886,648 | 2,443,135 | ||||||
| Long-term debt, less current maturities | 3,566,261 | 3,454,585 | ||||||
| Long-term operating lease liabilities | 2,732,339 | - | ||||||
| Lease financing obligations, less current maturities | 20,607 | 24,064 | ||||||
| Other noncurrent liabilities | 207,078 | 482,893 | ||||||
| Total liabilities | 9,412,933 | 6,404,677 | ||||||
| Commitments and contingencies | - | - | ||||||
| Stockholders' equity: | ||||||||
| Common stock | 54,862 | 54,016 | ||||||
| Additional paid-in capital | 5,888,870 | 5,876,977 | ||||||
| Accumulated deficit | (4,897,473 | ) | (4,713,244 | ) | ||||
| Accumulated other comprehensive loss | (30,401 | ) | (31,059 | ) | ||||
| Total stockholders' equity | 1,015,858 | 1,186,690 | ||||||
| Total liabilities and stockholders' equity | $ | 10,428,791 | $ | 7,591,367 | ||||
RITE AID CORPORATION AND SUBSIDIARIES
CONSOLIDATED STATEMENTS OF OPERATIONS
(Dollars in thousands, except per share amounts)
(unaudited)
| Thirteen weeks ended November 30, 2019 | Thirteen weeks ended December 1, 2018 | |||||||
| Revenues | $ | 5,462,298 | $ | 5,450,060 | ||||
| Costs and expenses: | ||||||||
| Cost of revenues | 4,273,323 | 4,267,972 | ||||||
| Selling, general and administrative expenses | 1,134,854 | 1,142,555 | ||||||
| Lease termination and impairment charges | 166 | 2,628 | ||||||
| Interest expense | 57,856 | 56,008 | ||||||
| Gain on debt retirements, net | (55,692 | ) | - | |||||
| Gain on sale of assets, net | (1,371 | ) | (382 | ) | ||||
| 5,409,136 | 5,468,781 | |||||||
| Income (loss) from continuing operations before income taxes | 53,162 | (18,721 | ) | |||||
| Income tax expense (benefit) | 876 | (1,471 | ) | |||||
| Net income (loss) from continuing operations | 52,286 | (17,250 | ) | |||||
| Net (loss) income from discontinued operations, net of tax | (801 | ) | 12,740 | |||||
| Net income (loss) | $ | 51,485 | $ | (4,510 | ) | |||
| Basic and diluted income (loss) per share: | ||||||||
| Numerator for income (loss) per share: | ||||||||
| Net income (loss) from continuing operations attributable to common stockholders - basic and diluted | $ | 52,286 | $ | (17,250 | ) | |||
| Net (loss) income from discontinued operations attributable to common stockholders - basic and diluted | (801 | ) | 12,740 | |||||
| Income (loss) attributable to common stockholders - basic and diluted | $ | 51,485 | $ | (4,510 | ) | |||
| Denominator: | ||||||||
| Basic weighted average shares | 53,310 | 52,920 | ||||||
| Outstanding options and restricted shares, net | 274 | - | ||||||
| Diluted weighted average shares | 53,584 | 52,920 | ||||||
| Basic income (loss) per share | ||||||||
| Continuing operations | $ | 0.98 | $ | (0.33 | ) | |||
| Discontinued operations | $ | (0.01 | ) | $ | 0.24 | |||
| Net basic income (loss) per share | $ | 0.97 | $ | (0.09 | ) | |||
| Diluted income (loss) per share | ||||||||
| Continuing operations | $ | 0.98 | $ | (0.33 | ) | |||
| Discontinued operations | $ | (0.02 | ) | $ | 0.24 | |||
| Net diluted income (loss) per share | $ | 0.96 | $ | (0.09 | ) | |||
RITE AID CORPORATION AND SUBSIDIARIES
CONSOLIDATED STATEMENTS OF OPERATIONS
(Dollars in thousands, except per share amounts)
(unaudited)
| Thirty-nine weeks ended November 30, 2019 | Thirty-nine weeks ended December 1, 2018 | |||||||
| Revenues | $ | 16,201,151 | $ | 16,259,912 | ||||
| Costs and expenses: | ||||||||
| Cost of revenues | 12,741,014 | 12,747,924 | ||||||
| Selling, general and administrative expenses | 3,433,036 | 3,449,173 | ||||||
| Lease termination and impairment charges | 2,115 | 52,096 | ||||||
| Goodwill and intangible asset impairment charges | - | 375,190 | ||||||
| Interest expense | 176,228 | 175,033 | ||||||
| (Gain) loss on debt retirements, net | (55,692 | ) | 554 | |||||
| Gain on sale of assets, net | (5,670 | ) | (11,206 | ) | ||||
| 16,291,031 | 16,788,764 | |||||||
| Loss from continuing operations before income taxes | (89,880 | ) | (528,852 | ) | ||||
| Income tax expense (benefit) | 35,878 | (117,527 | ) | |||||
| Net loss from continuing operations | (125,758 | ) | (411,325 | ) | ||||
| Net (loss) income from discontinued operations, net of tax | (1,695 | ) | 262,091 | |||||
| Net loss | $ | (127,453 | ) | $ | (149,234 | ) | ||
| Basic and diluted loss per share: | ||||||||
| Numerator for loss per share: | ||||||||
| Net loss from continuing operations attributable to common stockholders - basic and diluted | $ | (125,758 | ) | $ | (411,325 | ) | ||
| Net (loss) income from discontinued operations attributable to common stockholders - basic and diluted | (1,695 | ) | 262,091 | |||||
| Loss attributable to common stockholders - basic and diluted | $ | (127,453 | ) | $ | (149,234 | ) | ||
| Denominator: | ||||||||
| Basic and diluted weighted average shares | 53,159 | 52,824 | ||||||
| Basic and diluted loss per share | ||||||||
| Continuing operations | $ | (2.37 | ) | $ | (7.79 | ) | ||
| Discontinued operations | $ | (0.03 | ) | $ | 4.96 | |||
| Net basic and diluted loss per share | $ | (2.40 | ) | $ | (2.83 | ) | ||
RITE AID CORPORATION AND SUBSIDIARIES
CONSOLIDATED STATEMENTS OF CASH FLOWS
(Dollars in thousands)
(unaudited)
| Thirteen weeks ended November 30, 2019 | Thirteen weeks ended December 1, 2018 | |||||||
| OPERATING ACTIVITIES: | ||||||||
| Net income (loss) | $ | 51,485 | $ | (4,510 | ) | |||
| Net (loss) income from discontinued operations, net of tax | (801 | ) | 12,740 | |||||
| Net income (loss) from continuing operations | $ | 52,286 | $ | (17,250 | ) | |||
| Adjustments to reconcile to net cash provided by operating activities of continuing operations: | ||||||||
| Depreciation and amortization | 82,007 | 86,685 | ||||||
| Lease termination and impairment charges | 166 | 2,628 | ||||||
| LIFO (credit) charge | (7,440 | ) | 5,987 | |||||
| Gain on sale of assets, net | (1,371 | ) | (382 | ) | ||||
| Stock-based compensation expense | 3,506 | 1,317 | ||||||
| Gain on debt retirements, net | (55,692 | ) | - | |||||
| Changes in deferred taxes | - | (1,295 | ) | |||||
| Changes in operating assets and liabilities: | ||||||||
| Accounts receivable | 252,767 | 318,287 | ||||||
| Inventories | 19,333 | (46,839 | ) | |||||
| Accounts payable | 47,378 | (26,446 | ) | |||||
| Operating lease right-of-use assets and operating lease liabilities | (12,179 | ) | - | |||||
| Other assets | 1,959 | (1,072 | ) | |||||
| Other liabilities | 40,993 | 29,501 | ||||||
| Net cash provided by operating activities of continuing operations | 423,713 | 351,121 | ||||||
| INVESTING ACTIVITIES: | ||||||||
| Payments for property, plant and equipment | (45,075 | ) | (46,653 | ) | ||||
| Intangible assets acquired | (17,727 | ) | (11,054 | ) | ||||
| Proceeds from dispositions of assets and investments | 51,548 | 72 | ||||||
| Net cash used in investing activities of continuing operations | (11,254 | ) | (57,635 | ) | ||||
| FINANCING ACTIVITIES: | ||||||||
| Net payments to revolver | (115,000 | ) | (90,000 | ) | ||||
| Principal payments on long-term debt | (101,251 | ) | (3,851 | ) | ||||
| Change in zero balance cash accounts | (66,461 | ) | 1,137 | |||||
| Net proceeds from the issuance of common stock | - | 992 | ||||||
| Payments for taxes related to net share settlement of equity awards | (587 | ) | (175 | ) | ||||
| Financing fees paid for early debt redemption | (518 | ) | - | |||||
| Net cash used in financing activities of continuing operations | (283,817 | ) | (91,897 | ) | ||||
| Cash flows from discontinued operations: | ||||||||
| Operating activities of discontinued operations | (4,876 | ) | 14,735 | |||||
| Investing activities of discontinued operations | 23,551 | 61,251 | ||||||
| Net cash provided by discontinued operations | 18,675 | 75,986 | ||||||
| Increase in cash and cash equivalents | 147,317 | 277,575 | ||||||
| Cash and cash equivalents, beginning of period | 142,181 | 132,468 | ||||||
| Cash and cash equivalents, end of period | $ | 289,498 | $ | 410,043 | ||||
RITE AID CORPORATION AND SUBSIDIARIES
CONSOLIDATED STATEMENTS OF CASH FLOWS
(Dollars in thousands)
(unaudited)
| Thirty-nine weeks ended November 30, 2019 | Thirty-nine weeks ended December 1, 2018 | |||||||
| OPERATING ACTIVITIES: | ||||||||
| Net loss | $ | (127,453 | ) | $ | (149,234 | ) | ||
| Net (loss) income from discontinued operations, net of tax | (1,695 | ) | 262,091 | |||||
| Net loss from continuing operations | $ | (125,758 | ) | $ | (411,325 | ) | ||
| Adjustments to reconcile to net cash provided by operating activities of continuing operations: | ||||||||
| Depreciation and amortization | 248,977 | 270,957 | ||||||
| Lease termination and impairment charges | 2,115 | 52,096 | ||||||
| Goodwill and intangible asset impairment charges | - | 375,190 | ||||||
| LIFO charge | 7,553 | 19,311 | ||||||
| Gain on sale of assets, net | (5,670 | ) | (11,206 | ) | ||||
| Stock-based compensation expense | 13,598 | 11,563 | ||||||
| (Gain) loss on debt retirements, net | (55,692 | ) | 554 | |||||
| Changes in deferred taxes | 26,979 | (126,102 | ) | |||||
| Changes in operating assets and liabilities: | ||||||||
| Accounts receivable | 99,498 | (5,437 | ) | |||||
| Inventories | (92,657 | ) | (78,489 | ) | ||||
| Accounts payable | (38,245 | ) | 181,497 | |||||
| Operating lease right-of-use assets and operating lease liabilities | 22,803 | - | ||||||
| Other assets | (42,715 | ) | (12,304 | ) | ||||
| Other liabilities | 32,889 | (216,086 | ) | |||||
| Net cash provided by operating activities of continuing operations | 93,675 | 50,219 | ||||||
| INVESTING ACTIVITIES: | ||||||||
| Payments for property, plant and equipment | (129,135 | ) | (139,218 | ) | ||||
| Intangible assets acquired | (33,435 | ) | (31,573 | ) | ||||
| Proceeds from dispositions of assets and investments | 55,971 | 15,801 | ||||||
| Proceeds from sale-leaseback transactions | - | 2,587 | ||||||
| Net cash used in investing activities of continuing operations | (106,599 | ) | (152,403 | ) | ||||
| FINANCING ACTIVITIES: | ||||||||
| Net proceeds from revolver | 260,000 | 1,245,000 | ||||||
| Principal payments on long-term debt | (104,702 | ) | (437,597 | ) | ||||
| Change in zero balance cash accounts | (11,749 | ) | (15,964 | ) | ||||
| Net proceeds from the issuance of common stock | - | 2,294 | ||||||
| Payments for taxes related to net share settlement of equity awards | (1,573 | ) | (2,419 | ) | ||||
| Financing fees paid for early debt redemption | (518 | ) | (13 | ) | ||||
| Deferred financing costs paid | (315 | ) | - | |||||
| Net cash provided by financing activities of continuing operations | 141,143 | 791,301 | ||||||
| Cash flows from discontinued operations: | ||||||||
| Operating activities of discontinued operations | (7,148 | ) | (47,268 | ) | ||||
| Investing activities of discontinued operations | 24,074 | 664,653 | ||||||
| Financing activities of discontinued operations | - | (1,343,793 | ) | |||||
| Net cash provided by (used in) discontinued operations | 16,926 | (726,408 | ) | |||||
| Increase (decrease) in cash and cash equivalents | 145,145 | (37,291 | ) | |||||
| Cash and cash equivalents, beginning of period | 144,353 | 447,334 | ||||||
| Cash and cash equivalents, end of period | $ | 289,498 | $ | 410,043 | ||||
RITE AID CORPORATION AND SUBSIDIARIES
SUPPLEMENTAL SEGMENT OPERATING INFORMATION
(Dollars in thousands)
(unaudited)
| Thirteen weeks ended November 30, 2019 | Thirteen weeks ended December 1, 2018 | |||||||
| Retail Pharmacy Segment | ||||||||
| Revenues from continuing operations (a) | $ | 3,909,946 | $ | 3,976,719 | ||||
| Cost of revenues from continuing operations (a) | 2,839,094 | 2,897,135 | ||||||
| Gross profit from continuing operations | 1,070,852 | 1,079,584 | ||||||
| LIFO (credit) charge from continuing operations | (7,440 | ) | 5,987 | |||||
| FIFO gross profit from continuing operations | 1,063,412 | 1,085,571 | ||||||
| Adjusted EBITDA gross profit from continuing operations | 1,065,523 | 1,088,213 | ||||||
| Gross profit as a percentage of revenues - continuing operations | 27.39 | % | 27.15 | % | ||||
| LIFO (credit) charge as a percentage of revenues - continuing operations | -0.19 | % | 0.15 | % | ||||
| FIFO gross profit as a percentage of revenues - continuing operations | 27.20 | % | 27.30 | % | ||||
| Adjusted EBITDA gross profit as a percentage of revenues - continuing operations | 27.25 | % | 27.36 | % | ||||
| Selling, general and administrative expenses from continuing operations | 1,044,236 | 1,062,598 | ||||||
| Adjusted EBITDA selling, general and administrative expenses from continuing operations | 956,944 | 986,988 | ||||||
| Selling, general and administrative expenses as a percentage of revenues - continuing operations | 26.71 | % | 26.72 | % | ||||
| Adjusted EBITDA selling, general and administrative expenses as a percentage of revenues - continuing operations | 24.47 | % | 24.82 | % | ||||
| Cash interest expense | 54,068 | 52,074 | ||||||
| Non-cash interest expense | 3,788 | 3,934 | ||||||
| Total interest expense | 57,856 | 56,008 | ||||||
| Interest expense - continuing operations | 57,856 | 56,008 | ||||||
| Interest expense - discontinued operations | - | - | ||||||
| Adjusted EBITDA - continuing operations | 108,579 | 101,225 | ||||||
| Adjusted EBITDA as a percentage of revenues - continuing operations | 2.78 | % | 2.55 | % | ||||
| Pharmacy Services Segment | ||||||||
| Revenues (a) | $ | 1,613,109 | $ | 1,525,837 | ||||
| Cost of revenues (a) | 1,494,986 | 1,423,333 | ||||||
| Gross profit | 118,123 | 102,504 | ||||||
| Gross profit as a percentage of revenues | 7.32 | % | 6.72 | % | ||||
| Adjusted EBITDA | 49,511 | 41,566 | ||||||
| Adjusted EBITDA as a percentage of revenues | 3.07 | % | 2.72 | % | ||||
(a) - Revenues and cost of revenues include $60,757 and $52,496 of inter-segment activity for the thirteen weeks ended November 30, 2019 and December 1, 2018, respectively, that is eliminated in consolidation.
RITE AID CORPORATION AND SUBSIDIARIES
SUPPLEMENTAL SEGMENT OPERATING INFORMATION
(Dollars in thousands)
(unaudited)
| Thirty-nine weeks ended November 30, 2019 | Thirty-nine weeks ended December 1, 2018 | |||||||
| Retail Pharmacy Segment | ||||||||
| Revenues from continuing operations (a) | $ | 11,622,858 | $ | 11,785,996 | ||||
| Cost of revenues from continuing operations (a) | 8,489,067 | 8,585,318 | ||||||
| Gross profit from continuing operations | 3,133,791 | 3,200,678 | ||||||
| LIFO charge from continuing operations | 7,553 | 19,311 | ||||||
| FIFO gross profit from continuing operations | 3,141,344 | 3,219,989 | ||||||
| Adjusted EBITDA gross profit from continuing operations | 3,151,043 | 3,229,993 | ||||||
| Gross profit as a percentage of revenues - continuing operations | 26.96 | % | 27.16 | % | ||||
| LIFO charge as a percentage of revenues - continuing operations | 0.06 | % | 0.16 | % | ||||
| FIFO gross profit as a percentage of revenues - continuing operations | 27.03 | % | 27.32 | % | ||||
| Adjusted EBITDA gross profit as a percentage of revenues - continuing operations | 27.11 | % | 27.41 | % | ||||
| Selling, general and administrative expenses from continuing operations | 3,160,379 | 3,195,929 | ||||||
| Adjusted EBITDA selling, general and administrative expenses from continuing operations | 2,865,783 | 2,921,021 | ||||||
| Selling, general and administrative expenses as a percentage of revenues - continuing operations | 27.19 | % | 27.12 | % | ||||
| Adjusted EBITDA selling, general and administrative expenses as a percentage of revenues - continuing operations | 24.66 | % | 24.78 | % | ||||
| Cash interest expense | 164,982 | 167,270 | ||||||
| Non-cash interest expense | 11,246 | 12,378 | ||||||
| Total interest expense | 176,228 | 179,648 | ||||||
| Interest expense - continuing operations | 176,228 | 175,033 | ||||||
| Interest expense - discontinued operations | - | 4,615 | ||||||
| Adjusted EBITDA - continuing operations | 285,260 | 308,972 | ||||||
| Adjusted EBITDA as a percentage of revenues - continuing operations | 2.45 | % | 2.62 | % | ||||
| Pharmacy Services Segment | ||||||||
| Revenues (a) | $ | 4,758,470 | $ | 4,630,410 | ||||
| Cost of revenues (a) | 4,432,124 | 4,319,100 | ||||||
| Gross profit | 326,346 | 311,310 | ||||||
| Gross profit as a percentage of revenues | 6.86 | % | 6.72 | % | ||||
| Adjusted EBITDA | 117,367 | 120,392 | ||||||
| Adjusted EBITDA as a percentage of revenues | 2.47 | % | 2.60 | % | ||||
(a) - Revenues and cost of revenues include $180,177 and $156,494 of inter-segment activity for the thirty-nine weeks ended November 30, 2019 and December 1, 2018, respectively, that is eliminated in consolidation.
RITE AID CORPORATION AND SUBSIDIARIES
SUPPLEMENTAL INFORMATION
RECONCILIATION OF NET INCOME (LOSS) TO ADJUSTED EBITDA
(In thousands)
(unaudited)
| Thirteen weeks ended November 30, 2019 | Thirteen weeks ended December 1, 2018 | |||||||
| Reconciliation of net income (loss) to adjusted EBITDA: | ||||||||
| Net income (loss) - continuing operations | $ | 52,286 | $ | (17,250 | ) | |||
| Adjustments: | ||||||||
| Interest expense | 57,856 | 56,008 | ||||||
| Income tax expense (benefit) | 876 | (1,471 | ) | |||||
| Depreciation and amortization | 82,007 | 86,685 | ||||||
| LIFO (credit) charge | (7,440 | ) | 5,987 | |||||
| Lease termination and impairment charges | 166 | 2,628 | ||||||
| Gain on debt retirements, net | (55,692 | ) | - | |||||
| Merger and Acquisition-related costs | - | 4,175 | ||||||
| Stock-based compensation expense | 3,506 | 1,317 | ||||||
| Restructuring-related costs | 25,275 | - | ||||||
| Inventory write-downs related to store closings | 93 | 421 | ||||||
| Gain on sale of assets, net | (1,371 | ) | (382 | ) | ||||
| Other | 528 | 4,673 | ||||||
| Adjusted EBITDA - continuing operations | $ | 158,090 | $ | 142,791 | ||||
| Percent of revenues - continuing operations | 2.89 | % | 2.62 | % | ||||
RITE AID CORPORATION AND SUBSIDIARIES
SUPPLEMENTAL INFORMATION
RECONCILIATION OF NET LOSS TO ADJUSTED EBITDA
(In thousands)
(unaudited)
| Thirty-nine weeks ended November 30, 2019 | Thirty-nine weeks ended December 1, 2018 | |||||||
| Reconciliation of net loss to adjusted EBITDA: | ||||||||
| Net loss - continuing operations | $ | (125,758 | ) | $ | (411,325 | ) | ||
| Adjustments: | ||||||||
| Interest expense | 176,228 | 175,033 | ||||||
| Income tax expense (benefit) | 35,878 | (117,527 | ) | |||||
| Depreciation and amortization | 248,977 | 270,957 | ||||||
| LIFO charge | 7,553 | 19,311 | ||||||
| Lease termination and impairment charges | 2,115 | 52,096 | ||||||
| Goodwill and intangible asset impairment charges | - | 375,190 | ||||||
| (Gain) loss on debt retirements, net | (55,692 | ) | 554 | |||||
| Merger and Acquisition-related costs | 3,599 | 30,394 | ||||||
| Stock-based compensation expense | 13,598 | 11,563 | ||||||
| Restructuring-related costs | 93,770 | - | ||||||
| Inventory write-downs related to store closings | 4,083 | 5,554 | ||||||
| Litigation settlement | - | 18,000 | ||||||
| Gain on sale of assets, net | (5,670 | ) | (11,206 | ) | ||||
| Other | 3,946 | 10,770 | ||||||
| Adjusted EBITDA - continuing operations | $ | 402,627 | $ | 429,364 | ||||
| Percent of revenues - continuing operations | 2.49 | % | 2.64 | % | ||||
RITE AID CORPORATION AND SUBSIDIARIES
SUPPLEMENTAL INFORMATION
ADJUSTED NET INCOME
(Dollars in thousands, except per share amounts)
(unaudited)
| Thirteen weeks ended November 30, 2019 | Thirteen weeks ended December 1, 2018 | |||||||
| Net income (loss) from continuing operations | $ | 52,286 | $ | (17,250 | ) | |||
| Add back - Income tax expense (benefit) | 876 | (1,471 | ) | |||||
| Income (loss) before income taxes - continuing operations | 53,162 | (18,721 | ) | |||||
| Adjustments: | ||||||||
| Amortization expense | 24,920 | 28,768 | ||||||
| LIFO (credit) charge | (7,440 | ) | 5,987 | |||||
| Gain on debt retirements, net | (55,692 | ) | - | |||||
| Merger and Acquisition-related costs | - | 4,175 | ||||||
| Restructuring-related costs | 25,275 | - | ||||||
| Adjusted income before income taxes - continuing operations | 40,225 | 20,209 | ||||||
| Adjusted income tax expense (a) | 11,090 | 5,469 | ||||||
| Adjusted net income from continuing operations | $ | 29,135 | $ | 14,740 | ||||
| Adjusted net income per diluted share - continuing operations: | ||||||||
| Numerator for adjusted net income per diluted share: | ||||||||
| Adjusted net income from continuing operations | $ | 29,135 | $ | 14,740 | ||||
| Denominator: | ||||||||
| Basic weighted average shares | 53,310 | 52,920 | ||||||
| Outstanding options and restricted shares, net | 274 | 10 | ||||||
| Diluted weighted average shares | 53,584 | 52,930 | ||||||
| Net income (loss) from continuing operations per diluted share - continuing operations | $ | 0.98 | $ | (0.33 | ) | |||
| Adjusted net income per diluted share - continuing operations | $ | 0.54 | $ | 0.28 | ||||
(a) The fiscal year 2020 and 2019 annual effective tax rates, calculated using a federal rate plus a net state rate that excluded the impact of state NOL's, state credits and valuation allowance, was used for the thirteen weeks ended November 30, 2019 and December 1, 2018, respectively.
RITE AID CORPORATION AND SUBSIDIARIES
SUPPLEMENTAL INFORMATION
ADJUSTED NET INCOME
(Dollars in thousands, except per share amounts)
(unaudited)
| Thirty-nine weeks ended November 30, 2019 | Thirty-nine weeks ended December 1, 2018 | |||||||
| Net loss from continuing operations | $ | (125,758 | ) | $ | (411,325 | ) | ||
| Add back - Income tax expense (benefit) | 35,878 | (117,527 | ) | |||||
| Loss before income taxes - continuing operations | (89,880 | ) | (528,852 | ) | ||||
| Adjustments: | ||||||||
| Amortization expense | 79,176 | 96,668 | ||||||
| LIFO charge | 7,553 | 19,311 | ||||||
| Goodwill and intangible asset impairment charges | - | 375,190 | ||||||
| (Gain) loss on debt retirements, net | (55,692 | ) | 554 | |||||
| Merger and Acquisition-related costs | 3,599 | 30,394 | ||||||
| Restructuring-related costs | 93,770 | - | ||||||
| Litigation settlement | - | 18,000 | ||||||
| Adjusted income before income taxes - continuing operations | 38,526 | 11,265 | ||||||
| Adjusted income tax expense (a) | 10,622 | 3,049 | ||||||
| Adjusted net income from continuing operations | $ | 27,904 | $ | 8,216 | ||||
| Adjusted net income per diluted share - continuing operations: | ||||||||
| Numerator for adjusted net income per diluted share: | ||||||||
| Adjusted net income from continuing operations | $ | 27,904 | $ | 8,216 | ||||
| Denominator: | ||||||||
| Basic weighted average shares | 53,159 | 52,824 | ||||||
| Outstanding options and restricted shares, net | 775 | 124 | ||||||
| Diluted weighted average shares | 53,934 | 52,948 | ||||||
| Net loss from continuing operations per diluted share - continuing operations | $ | (2.37 | ) | $ | (7.79 | ) | ||
| Adjusted net income diluted share - continuing operations | $ | 0.52 | $ | 0.16 | ||||
(a) The fiscal year 2020 and 2019 annual effective tax rates, calculated using a federal rate plus a net state rate that excluded the impact of state NOL's, state credits and valuation allowance, was used for the thirty-nine weeks ended November 30, 2019 and December 1, 2018, respectively.
RITE AID CORPORATION AND SUBSIDIARIES
SUPPLEMENTAL INFORMATION
RECONCILIATION OF ADJUSTED EBITDA GROSS PROFIT AND RECONCILIATION OF ADJUSTED EBITDA SELLING,
GENERAL AND ADMINISTRATIVE EXPENSES- RETAIL PHARMACY SEGMENT
(In thousands)
(unaudited)
| Thirteen weeks ended November 30, 2019 | Thirteen weeks ended December 1, 2018 | |||||||
| Reconciliation of adjusted EBITDA gross profit: | ||||||||
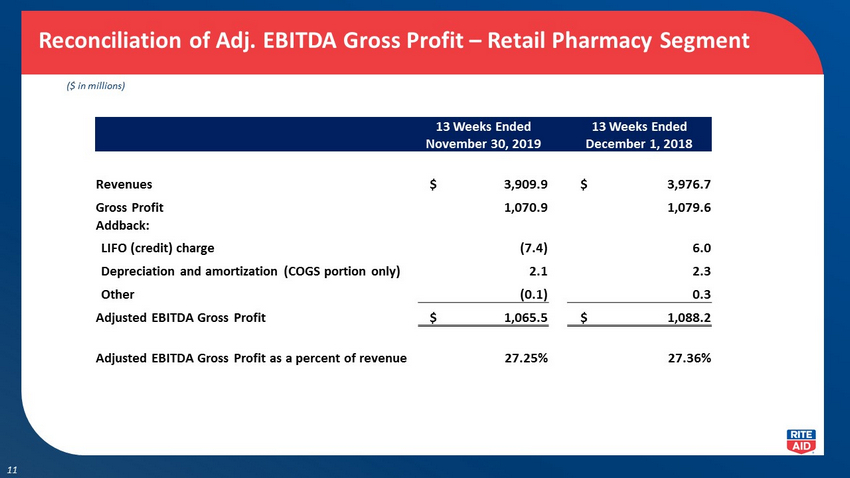
| Revenues | $ | 3,909,946 | $ | 3,976,719 | ||||
| Gross Profit | 1,070,852 | 1,079,584 | ||||||
| Addback: | ||||||||
| LIFO (credit) charge | (7,440 | ) | 5,987 | |||||
| Depreciation and amortization (cost of goods sold portion only) | 2,070 | 2,308 | ||||||
| Other | 41 | 334 | ||||||
| Adjusted EBITDA gross profit - continuing operations | $ | 1,065,523 | $ | 1,088,213 | ||||
| Percent of revenues - continuing operations | 27.25 | % | 27.36 | % | ||||
| Reconciliation of adjusted EBITDA selling, general and administrative expenses: | ||||||||
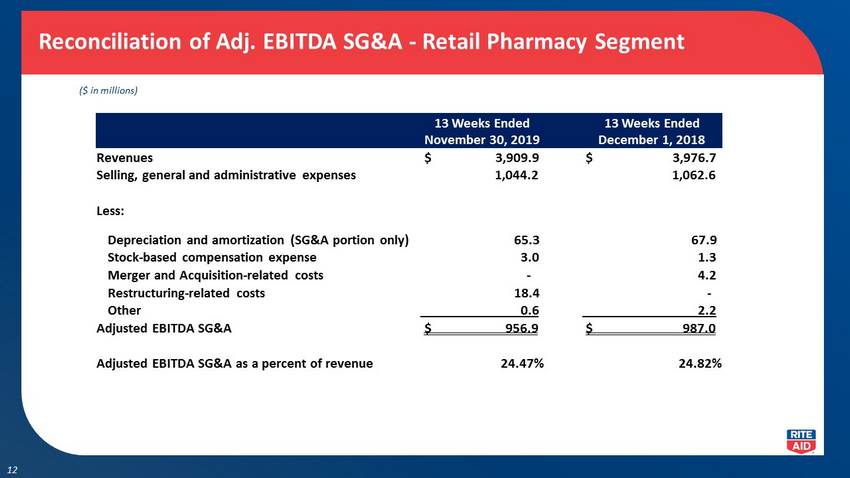
| Revenues | $ | 3,909,946 | $ | 3,976,719 | ||||
| Selling, general and administrative expenses | 1,044,236 | 1,062,598 | ||||||
| Less: | ||||||||
| Depreciation and amortization (SG&A portion only) | 65,267 | 67,905 | ||||||
| Stock-based compensation expense | 2,976 | 1,317 | ||||||
| Merger and Acquisition-related costs | - | 4,175 | ||||||
| Restructuring-related costs | 18,415 | - | ||||||
| Other | 634 | 2,213 | ||||||
| Adjusted EBITDA selling, general and administrative expenses - continuing operations | $ | 956,944 | $ | 986,988 | ||||
| Percent of revenues - continuing operations | 24.47 | % | 24.82 | % | ||||
| Adjusted EBITDA - continuing operations | $ | 108,579 | $ | 101,225 | ||||
RITE AID CORPORATION AND SUBSIDIARIES
SUPPLEMENTAL INFORMATION
RECONCILIATION OF ADJUSTED EBITDA GROSS PROFIT AND RECONCILIATION OF ADJUSTED EBITDA SELLING,
GENERAL AND ADMINISTRATIVE EXPENSES- RETAIL PHARMACY SEGMENT
(In thousands)
(unaudited)
| Thirty-nine weeks ended November 30, 2019 | Thirty-nine weeks ended December 1, 2018 | |||||||
| Reconciliation of adjusted EBITDA gross profit: | ||||||||
| Revenues | $ | 11,622,858 | $ | 11,785,996 | ||||
| Gross Profit | 3,133,791 | 3,200,678 | ||||||
| Addback: | ||||||||
| LIFO charge | 7,553 | 19,311 | ||||||
| Depreciation and amortization (cost of goods sold portion only) | 6,538 | 6,929 | ||||||
| Other | 3,161 | 3,075 | ||||||
| Adjusted EBITDA gross profit - continuing operations | $ | 3,151,043 | $ | 3,229,993 | ||||
| Percent of revenues - continuing operations | 27.11 | % | 27.41 | % | ||||
| Reconciliation of adjusted EBITDA selling, general and administrative expenses: | ||||||||
| Revenues | $ | 11,622,858 | $ | 11,785,996 | ||||
| Selling, general and administrative expenses | 3,160,379 | 3,195,929 | ||||||
| Less: | ||||||||
| Depreciation and amortization (SG&A portion only) | 195,281 | 205,972 | ||||||
| Stock-based compensation expense | 12,673 | 11,563 | ||||||
| Merger and Acquisition-related costs | 2,828 | 30,394 | ||||||
| Restructuring-related costs | 78,851 | - | ||||||
| Litigation settlement | - | 18,000 | ||||||
| Other | 4,963 | 8,979 | ||||||
| Adjusted EBITDA selling, general and administrative expenses - continuing operations | $ | 2,865,783 | $ | 2,921,021 | ||||
| Percent of revenues - continuing operations | 24.66 | % | 24.78 | % | ||||
| Adjusted EBITDA - continuing operations | $ | 285,260 | $ | 308,972 | ||||
RITE AID CORPORATION AND SUBSIDIARIES
SUPPLEMENTAL INFORMATION
RECONCILIATION OF NET LOSS GUIDANCE TO ADJUSTED EBITDA GUIDANCE
YEAR ENDING FEBRUARY 29, 2020
(In thousands)
(unaudited)
| Guidance Range | ||||||||
| Low | High | |||||||
| Total Revenues | $ | 21,500,000 | $ | 21,900,000 | ||||
| Same store sales | 0.00 | % | 1.00 | % | ||||
| Gross Capital Expenditures | $ | 230,000 | $ | 230,000 | ||||
| Reconciliation of net loss to adjusted EBITDA: | ||||||||
| Net loss | $ | (204,000 | ) | $ | (174,000 | ) | ||
| Adjustments: | ||||||||
| Interest expense | 235,000 | 235,000 | ||||||
| Income tax expense | 40,000 | 40,000 | ||||||
| Depreciation and amortization | 330,000 | 330,000 | ||||||
| LIFO charge | 10,000 | 10,000 | ||||||
| Lease termination and impairment charges | 35,000 | 35,000 | ||||||
| Gain on debt retirements, net | (56,000 | ) | (56,000 | ) | ||||
| Restructuring-related costs | 100,000 | 100,000 | ||||||
| Other | 25,000 | 25,000 | ||||||
| Adjusted EBITDA | $ | 515,000 | $ | 545,000 | ||||
RITE AID CORPORATION AND SUBSIDIARIES
SUPPLEMENTAL INFORMATION
RECONCILIATION OF NET LOSS GUIDANCE TO ADJUSTED NET INCOME GUIDANCE
YEAR ENDING FEBRUARY 29, 2020
(In thousands)
(unaudited)
| Guidance Range | ||||||||
| Low | High | |||||||
| Net loss | $ | (204,000 | ) | $ | (174,000 | ) | ||
| Add back - income tax expense | 40,000 | 40,000 | ||||||
| Loss before income taxes | (164,000 | ) | (134,000 | ) | ||||
| Adjustments: | ||||||||
| Amortization expense | 120,000 | 120,000 | ||||||
| LIFO charge | 10,000 | 10,000 | ||||||
| Gain on debt retirements, net | (56,000 | ) | (56,000 | ) | ||||
| Restructuring-related costs | 100,000 | 100,000 | ||||||
| Adjusted income before adjusted income taxes | 10,000 | 40,000 | ||||||
| Adjusted income tax expense | 3,000 | 11,000 | ||||||
| Adjusted net income | $ | 7,000 | $ | 29,000 | ||||
| Diluted adjusted net income per share | $ | 0.13 | $ | 0.55 | ||||