UNITED STATES
SECURITIES AND EXCHANGE COMMISSION
Washington, D.C. 20549
Form N-CSR
CERTIFIED SHAREHOLDER REPORT OF
REGISTERED MANAGEMENT INVESTMENT COMPANIES
Investment Company Act file number: 811-05629
Voya Investors Trust
(Exact name of registrant as specified in charter)
| 7337 East Doubletree Ranch Road, Suite 100, Scottsdale, AZ | 85258 |
| (Address of principal executive offices) | (Zip code) |
CT Corporation System, 101 Federal Street, Boston, MA 02110
(Name and address of agent for service)
Registrant’s telephone number, including area code: 1-800-366-0066
Date of fiscal year end: December 31
Date of reporting period: December 31, 2019
Item 1. Reports to Stockholders.
The following is a copy of the report transmitted to stockholders pursuant to Rule 30e-1 under the Act (17 CFR 270.30e-1):


Voya Investors Trust
n |
Voya Government Liquid Assets Portfolio | |
n |
VY® Clarion Global Real Estate Portfolio | |
n |
VY® Invesco Growth and Income Portfolio | |
n |
VY® JPMorgan Emerging Markets Equity Portfolio |
n |
VY® Morgan Stanley Global Franchise Portfolio | |
n |
VY® T. Rowe Price Capital Appreciation Portfolio | |
n |
VY® T. Rowe Price Equity Income Portfolio | |
n |
VY® T. Rowe Price International Stock Portfolio |
|
Beginning on January 1, 2021, as permitted by regulations
adopted by the U.S. Securities and Exchange Commission, paper copies of each Portfolio’s annual and semi-annual shareholder reports, like this
annual report, will no longer be sent by mail, unless you specifically request paper copies of the reports. Instead, the reports will be made available
on a website and you will be notified by mail each time a report is posted and provided with a website link to access the report.
If you already
elected to receive shareholder reports electronically, you will not be affected by this change and you need not take any action. You may elect to
receive shareholder reports and other communications from your insurance carrier electronically by contacting them directly.
You may elect to receive all future reports in paper free of charge. If you received this document in the mail, please follow the instructions provided to elect to continue receiving paper copies of your shareholder reports. You can inform us that you wish to continue receiving paper copies by calling 1-800-283-3427. Your election to receive reports in paper will apply to all the funds in which you invest. |
|
This report is submitted for general information to shareholders of the Voya mutual funds. It is not authorized for distribution to prospective shareholders unless accompanied or preceded by a prospectus which includes details regarding the funds’ investment objectives, risks, charges, expenses and other information. This information should be read carefully. |
| INVESTMENT MANAGEMENT |  |
| voyainvestments.com |
| 1 | |||
| 2 | |||
| 4 | |||
| 20 | |||
| 22 | |||
| 23 | |||
| 27 | |||
| 29 | |||
| 33 | |||
| 38 | |||
| 56 | |||
| 89 | |||
| 91 | |||
| 95 |
PROXY VOTING INFORMATION
A description of the policies and procedures that the Portfolios use to determine how to vote proxies related to portfolio securities is available: (1) without charge, upon request, by calling Shareholder Services toll-free at (800) 992-0180; (2) on the Portfolios’ website at www.voyainvestments.com; and (3) on the U.S. Securities and Exchange Commission’s (“SEC’s”) website at www.sec.gov. Information regarding how the Portfolios voted proxies related to portfolio securities during the most recent 12-month year ended December 31 is available without charge on the Portfolios’ website at www.voyainvestments.com and on the SEC’s website at www.sec.gov.
QUARTERLY PORTFOLIO HOLDINGS
The Portfolios file their complete schedule of portfolio holdings with the SEC for the first and third quarters of each fiscal year on Form N-Q or Form N-PORT, available for filings after March 31, 2019. This report contains a summary portfolio of investments for certain Portfolios. The Portfolios’ Form N-Q or Form N-PORT is available on the SEC’s website at www.sec.gov. The Portfolios’ complete schedule of portfolio holdings, as filed on Form N-Q or Form N-PORT, are available: on www.voyainvestments.com and without charge upon request from the Portfolio by calling Shareholder Services toll-free at (800) 992-0180. Voya Government Liquid Assets Portfolio does not file on Form N-PORT.

Sincerely,

President
Voya Family of Funds
January 21, 2020
| Index | Description |
|---|---|
Bloomberg Barclays
U.S. Aggregate Bond Index |
An
index of publicly issued investment grade U.S. government, mortgage-backed, asset-backed and corporate debt securities. |
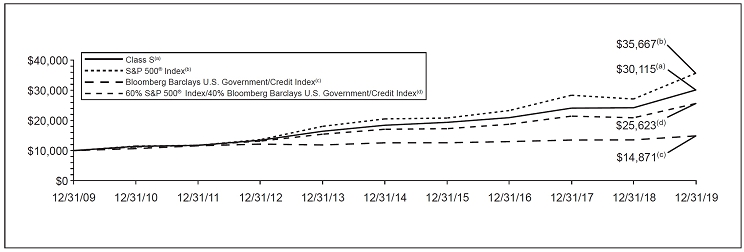
Bloomberg Barclays
U.S. Government/Credit Index |
An
index made up of the Barclays Government and Credit indices, including securities issued by the U.S. government and its agencies and publicly issued
U.S. corporate and foreign debentures and secured notes that meet specified maturity, liquidity and quality requirements. |
Bloomberg Barclays
Long-Term U.S. Treasury Index |
This
index measures the performance of U.S. Treasury bills with long-term maturity. The credit level for this index is investment grade. The rebalance
scheme is monthly. |
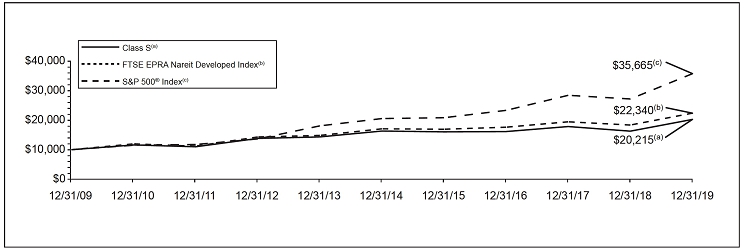
FTSE EPRA Nareit
Developed Index |
The
index is designed to track the performance of listed real estate companies and real-estate investment trusts (REITs) worldwide. Relevant activities are
defined as the ownership, disposal and development of income-producing real estate. Constituents are classified into distinct property sectors based on
gross invested book assets, as disclosed in the latest published financial statement. Index constituents are free-float adjusted, liquidity, size and
revenue screened. |
iMoneyNet
Government Institutional Index |
The
average return for a category of money market funds that includes all government institutional funds: Treasury Institutional, Treasury and Repo
Institutional and Government and Agencies Institutional. |
MSCI All Country
World (ex-US) IndexSM |
A free
float-adjusted market capitalization index that is designed to measure equity market performance in global developed and emerging markets, excluding
the U.S. It includes the reinvestment of dividends net of withholding taxes, but does not reflect fees, brokerage commissions or other expenses of
investing. |
MSCI Emerging
Markets IndexSM |
An
index that measures the performance of securities listed on exchanges in developing nations throughout the world. It includes the reinvestment of
dividends and distributions net of withholding taxes, but does not reflect fees, brokerage commissions or other expenses of
investing. |
MSCI Europe ex
U.K.® Index |
A free
float-adjusted market capitalization index that is designed to measure developed market equity performance in Europe, excluding the
UK. |
MSCI Japan®
Index |
A free
float-adjusted market capitalization index that is designed to measure developed market equity performance in Japan. |
MSCI U.K.®
Index |
A free
float-adjusted market capitalization index that is designed to measure developed market equity performance in the UK. |
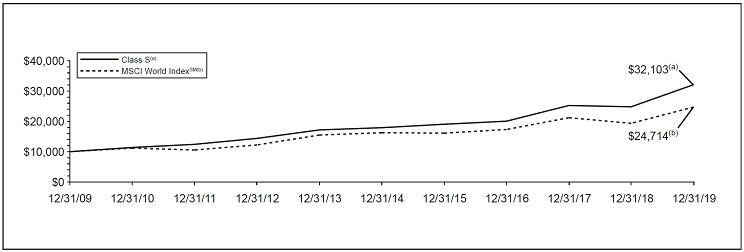
MSCI World
IndexSM |
An
index that measures the performance of over 1,600 securities listed on exchanges in the U.S., Europe, Canada, Australia, New Zealand and the Far
East. |
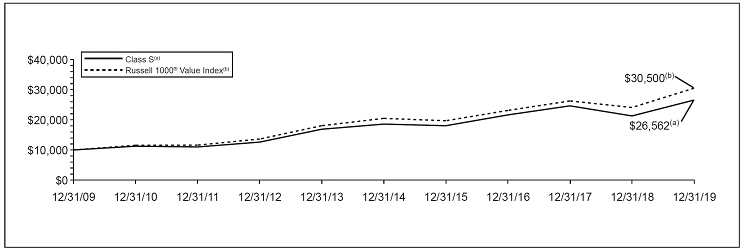
Russell 1000®
Value Index |
An
index that measures the performance of those Russell 1000® securities with lower price-to-book ratios and lower forecasted growth
values. |
S&P 500®
Index |
An
index that measures the performance of securities of approximately 500 large-capitalization companies whose securities are traded on major U.S. stock
markets. |
| VOYA GOVERNMENT LIQUID ASSETS PORTFOLIO | PORTFOLIO MANAGERS’ REPORT |
|
Investment Type Allocation
as of December 31, 2019 (as a percentage of net assets) | |||
U.S.
Treasury Repurchase Agreement |
43.2 | % | |
U.S.
Government Agency Debt |
34.6 | ||
U.S.
Treasury Debt |
14.3 | ||
Investment Companies |
7.6 | ||
Assets in
Excess of Other Liabilities |
0.3 | ||
Net
Assets |
100.0 | % | |
|
Portfolio holdings are subject to change daily. | |||
|
Top Ten Holdings
as of December 31, 2019 (as a percentage of net assets) | |||
Deutsche
Bank Repurchase Agreement dated 12/31/2019, 1.55%, due 1/2/2020, $111,763,623 to be received upon repurchase (Collateralized by $135,443,927, multiple
securities, 0.00%, Market Value plus accrued interest $115,106,620 due 2/15/2028-2/15/2031), 1.550% |
15.4 | % | |
Federal
Home Loan Bank Discount Notes, 14.600%, 01/07/20 |
14.5 | % | |
United
States Treasury Bill, 14.340%, 06/18/20 |
14.3 | % | |
Deutsche
Bank Repurchase Agreement dated 12/31/2019, 1.50%, due 1/2/2020, $101,008,697 to be received upon repurchase (Collateralized by $74,642,100, Bond,
4.500%, Market Value plus accrued interest $103,020,131 due 8/15/2039), 1.550% |
13.9 | % | |
Deutsche
Bank Repurchase Agreement dated 12/31/2019, 1.50%, due 1/2/2020, $101,008,417 to be received upon repurchase (Collateralized by $150,941,745, TINT,
0.00%, Market Value plus accrued interest $104,030,000 due 2/15/2028-3/15/2037), 1.500% |
13.9 | % | |
BlackRock
Liquidity Funds, FedFund, Institutional Class, 1.520%, 01/02/20 |
4.5 | % | |
Federal
Farm Credit Banks, 1.791%, 07/02/20 |
3.7 | % | |
Federal
Home Loan Banks, 1.670%, 10/16/20 |
3.6 | % | |
Federal
Home Loan Banks, 1.782%, 03/25/20 |
3.3 | % | |
Goldman
Sachs Financial Square Government Fund — Institutional Shares, 1.550%, 01/02/20 |
3.1 | % | |
|
Portfolio holdings are subject to change daily. | |||
* |
Please see Note 5 for more information regarding the contractual waiver in place to reimburse certain expenses of the Portfolio to the extent necessary to assist the Portfolio in maintaining a yield of not less than zero. |
| PORTFOLIO MANAGERS’ REPORT | VY® CLARION GLOBAL REAL ESTATE PORTFOLIO |
|
Geographic Diversification
as of December 31, 2019 (as a percentage of net assets) | |||
United
States |
54.0 | % | |
Japan |
11.9 | % | |
Hong
Kong |
6.3 | % | |
United
Kingdom |
6.0 | % | |
Germany |
4.2 | % | |
Australia |
3.5 | % | |
Sweden |
2.7 | % | |
France |
2.7 | % | |
Singapore |
2.5 | % | |
Canada |
2.0 | % | |
Countries
between 0.4%–0.8%ˆ |
3.4 | % | |
Assets in
Excess of Other Liabilities* |
0.8 | % | |
Net
Assets |
100.0 | % | |
|
* Includes short-term investments. | |||
|
ˆ Includes 6 countries, which each represents 0.4%–0.8% of net assets. | |||
|
Portfolio holdings are subject to change daily. | |||
|
Top Ten Holdings | |||
ProLogis,
Inc. |
5.1 | % | |
Equity
Residential |
3.3 | % | |
Link
REIT |
3.2 | % | |
Simon
Property Group, Inc. |
3.1 | % | |
Invitation Homes, Inc. |
2.7 | % | |
VEREIT,
Inc. |
2.5 | % | |
Welltower, Inc. |
2.2 | % | |
Mitsubishi Estate Co., Ltd. |
2.2 | % | |
Alexandria Real Estate Equities, Inc. |
2.1 | % | |
GLP
J-Reit |
2.0 | % | |
|
Portfolio holdings are subject to change daily. | |||
| VY® CLARION GLOBAL REAL ESTATE PORTFOLIO | PORTFOLIO MANAGERS’ REPORT |
| PORTFOLIO MANAGERS’ REPORT | VY® CLARION GLOBAL REAL ESTATE PORTFOLIO |
| Average Annual Total Returns for the Periods Ended December 31, 2019 | ||||||||||||
|---|---|---|---|---|---|---|---|---|---|---|---|---|
| 1 Year | 5 Year | 10 Year | ||||||||||
Class
ADV |
23.99 | % | 4.06 | % | 6.92 | % | ||||||
Class
I |
24.74 | % | 4.68 | % | 7.57 | % | ||||||
Class
S |
24.35 | % | 4.40 | % | 7.29 | % | ||||||
Class
S2 |
24.15 | % | 4.26 | % | 7.13 | % | ||||||
FTSE
EPRA Nareit Developed Index |
21.91 | % | 5.56 | % | 8.37 | % | ||||||
S&P
500® Index |
31.49 | % | 11.70 | % | 13.56 | % | ||||||
| VY® INVESCO GROWTH AND INCOME PORTFOLIO | PORTFOLIO MANAGERS’ REPORT |
|
Sector Diversification
as of December 31, 2019 (as a percentage of net assets) | |||
Financials |
25.5 | % | |
Health
Care |
16.4 | % | |
Information Technology |
10.9 | % | |
Energy |
10.6 | % | |
Consumer
Discretionary |
8.6 | % | |
Consumer
Staples |
7.8 | % | |
Industrials |
6.6 | % | |
Materials |
4.1 | % | |
Communication Services |
4.0 | % | |
Utilities |
2.1 | % | |
Assets in
Excess of Other Liabilities* |
3.4 | % | |
Net
Assets |
100.0 | % | |
|
* Includes short-term investments. | |||
|
Portfolio holdings are subject to change daily. | |||
VY® Invesco Growth and Income Portfolio (the “Portfolio”) seeks long-term growth of capital and income. The Portfolio is managed* by Brian Jurkash, co-lead portfolio manager, Matthew Titus, co-lead portfolio manager and Sergio Marcheli, portfolio manager, of Invesco Advisers, Inc. — the Sub-Adviser.
|
Top Ten Holdings | |||
Johnson & Johnson |
3.6 | % | |
Bank of
America Corp. |
3.4 | % | |
Philip
Morris International, Inc. |
3.2 | % | |
Citigroup, Inc. |
3.1 | % | |
American
International Group, Inc. |
2.9 | % | |
Morgan
Stanley |
2.6 | % | |
General
Motors Co. |
2.6 | % | |
PNC
Financial Services Group, Inc. |
2.5 | % | |
General
Dynamics Corp. |
2.2 | % | |
Royal
Dutch Shell PLC — Class A |
2.1 | % | |
|
* Excludes short-term investments. | |||
|
Portfolio holdings are subject to change daily. | |||
* |
Effective December 31, 2019, Thomas B. Bastian was removed as a portfolio manager to the Portfolio. |
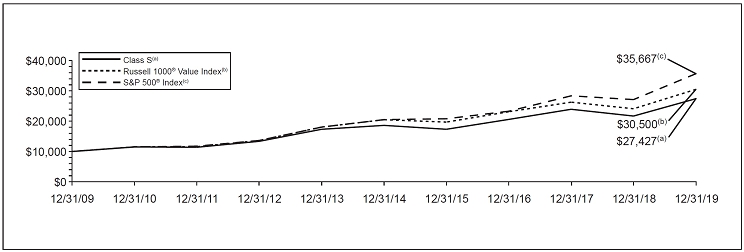
| PORTFOLIO MANAGERS’ REPORT | VY® INVESCO GROWTH AND INCOME PORTFOLIO |
| Average Annual Total Returns for the Periods Ended December 31, 2019 | ||||||||||||
|---|---|---|---|---|---|---|---|---|---|---|---|---|
| 1 Year | 5 Year | 10 Year | ||||||||||
Class
ADV |
24.30 | % | 7.02 | % | 9.88 | % | ||||||
Class
I |
24.98 | % | 7.67 | % | 10.54 | % | ||||||
Class
S |
24.73 | % | 7.40 | % | 10.26 | % | ||||||
Class
S2 |
24.47 | % | 7.23 | % | 10.09 | % | ||||||
Russell
1000® Value Index |
26.54 | % | 8.29 | % | 11.80 | % | ||||||
| VY® JPMORGAN
EMERGING MARKETS EQUITY PORTFOLIO |
PORTFOLIO MANAGERS’ REPORT |
|
Geographic Diversification
as of December 31, 2019 (as a percentage of net assets) | |||
China |
29.1 | % | |
India |
19.9 | % | |
Hong
Kong |
7.8 | % | |
Taiwan |
7.5 | % | |
Brazil |
6.3 | % | |
South
Korea |
5.2 | % | |
South
Africa |
4.2 | % | |
Mexico |
3.6 | % | |
Indonesia |
2.5 | % | |
Russia |
2.3 | % | |
Countries
between 0.2%–2.0%ˆ |
11.5 | % | |
Assets in
Excess of Other Liabilities* |
0.1 | % | |
Net
Assets |
100.0 | % | |
|
* Includes short-term investments. | |||
|
ˆ Includes 11 countries, which each represents 0.2%–2.0% of
net assets. | |||
|
Portfolio holdings are subject to change daily. | |||
In South Africa, the Portfolio’s exposure to Mr. Price, a discount retail store, weighed on relative performance. The stock fell 20.7% (in USD terms) during the period, on the back of the weak consumer environment in South Africa.
|
Top Ten Holdings | |||
Alibaba
Group Holding Ltd. ADR |
5.6 | % | |
Housing
Development Finance Corp. |
4.8 | % | |
AIA Group
Ltd. |
4.6 | % | |
HDFC Bank
Ltd. ADR |
4.1 | % | |
Samsung
Electronics Co., Ltd. |
4.1 | % | |
Tencent
Holdings Ltd. |
4.0 | % | |
Taiwan
Semiconductor Manufacturing Co., Ltd. ADR |
3.5 | % | |
Ping An
Insurance Group Co. of China Ltd. — H Shares |
2.6 | % | |
Sberbank
of Russia PJSC |
2.3 | % | |
Techtronic Industries Co., Ltd. |
2.1 | % | |
|
Portfolio holdings are subject to change daily. | |||
Current Strategy and Outlook: In 2020, in our view, the biggest risks for emerging markets (“EM”) remain slowing global growth, trade tensions, and a stubbornly-strong U.S. dollar. However, over the past six months, key emerging & developed market central banks have cut interest rates a cumulative 41 times, a number comparable to the 2008 financial crisis. We believe this easing has already helped economic indicators improve since the middle of 2019 and could continue to support a recovery.
The views expressed in this commentary are informed opinions. They should not be considered promises or advice. The views expressed reflect those of the portfolio managers, only through the end of the period as stated on the cover. The portfolio managers’ views are subject to change at any time based on market and other conditions.
| PORTFOLIO MANAGERS’ REPORT | VY® JPMORGAN
EMERGING MARKETS EQUITY PORTFOLIO |

| Average Annual Total Returns for the Periods Ended December 31, 2019 | ||||||||||||
|---|---|---|---|---|---|---|---|---|---|---|---|---|
| 1 Year | 5 Year | 10 Year | ||||||||||
Class
ADV |
31.47 | % | 7.98 | % | 4.85 | % | ||||||
Class
I |
32.23 | % | 8.64 | % | 5.48 | % | ||||||
Class
S |
31.91 | % | 8.36 | % | 5.22 | % | ||||||
Class
S2 |
31.64 | % | 8.19 | % | 5.06 | % | ||||||
MSCI EM
IndexSM |
18.42 | % | 5.61 | % | 3.68 | % | ||||||
| VY® MORGAN
STANLEY GLOBAL FRANCHISE PORTFOLIO |
PORTFOLIO MANAGERS’ REPORT |
|
Geographic Diversification
as of December 31, 2019 (as a percentage of net assets) | |||
United
States |
64.5 | % | |
United
Kingdom |
18.4 | % | |
France |
5.7 | % | |
Germany |
5.6 | % | |
Netherlands |
3.3 | % | |
Italy |
0.9 | % | |
Assets in
Excess of Other Liabilities* |
1.6 | % | |
Net
Assets |
100.0 | % | |
|
* Includes short-term investments. | |||
|
Portfolio holdings are subject to change daily. | |||
|
Top Ten Holdings | |||
Microsoft
Corp. |
8.3 | % | |
Philip
Morris International, Inc. |
7.9 | % | |
Reckitt
Benckiser Group PLC |
7.4 | % | |
SAP
SE |
5.6 | % | |
Visa,
Inc. — Class A |
5.4 | % | |
Accenture
PLC |
4.8 | % | |
Automatic
Data Processing, Inc. |
4.2 | % | |
Baxter
International, Inc. |
4.0 | % | |
Danaher
Corp. |
3.8 | % | |
Becton
Dickinson & Co. |
3.7 | % | |
|
Portfolio holdings are subject to change daily. | |||
* |
Effective May 1, 2019, Nathan Wong was added as a portfolio manager to the Portfolio. |
| PORTFOLIO MANAGERS’ REPORT | VY® MORGAN STANLEY GLOBAL FRANCHISE PORTFOLIO |
| Average Annual Total Returns for the Periods Ended December 31, 2019 | ||||||||||||
|---|---|---|---|---|---|---|---|---|---|---|---|---|
| 1 Year | 5 Year | 10 Year | ||||||||||
Class
ADV |
28.89 | % | 11.98 | % | 11.97 | % | ||||||
Class
R6(1) |
29.74 | % | 12.59 | % | 12.47 | % | ||||||
Class
S |
29.34 | % | 12.37 | % | 12.36 | % | ||||||
Class
S2 |
29.15 | % | 12.20 | % | 12.20 | % | ||||||
MSCI World
IndexSM |
27.67 | % | 8.74 | % | 9.47 | % | ||||||
(1) |
Class R6 incepted on May 3, 2016. The Class R6 shares performance shown for the period prior to their inception date is the performance of Class S shares without adjustment for any differences in the expenses between the two classes. If adjusted for such differences, returns would be different. |
| VY® T. ROWE
PRICE CAPITAL APPRECIATION PORTFOLIO |
PORTFOLIO MANAGERS’ REPORT |
|
Investment Type Allocation
as of December 31, 2019 (as a percentage of net assets) | |||
Common
Stock |
63.3 | % | |
Corporate
Bonds/Notes |
16.4 | % | |
Preferred
Stock |
5.3 | % | |
Bank
Loans |
4.6 | % | |
Asset-Backed Securities |
0.3 | % | |
Assets in
Excess of Other Liabilities* |
10.1 | % | |
Net
Assets |
100.0 | % | |
|
* Includes short-term investments. | |||
|
Portfolio holdings are subject to change daily. | |||
VY® T. Rowe Price Capital Appreciation Portfolio (the “Portfolio”) seeks, over the long-term, a high total investment return, consistent with the preservation of capital and with prudent investment risk. The Portfolio is managed by David R. Giroux, CFA and Vice President of T. Rowe Price Associates, Inc. — the Sub-Adviser.
|
Top Ten Holdings | |||
Microsoft
Corp. |
4.2 | % | |
Visa,
Inc. — Class A |
3.6 | % | |
General
Electric Co. |
3.6 | % | |
PerkinElmer, Inc. |
3.1 | % | |
Fiserv,
Inc. |
3.2 | % | |
Marsh & McLennan Cos., Inc. |
3.0 | % | |
Danaher
Corp. |
2.6 | % | |
Becton
Dickinson & Co. |
2.5 | % | |
Alphabet,
Inc. — Class C |
2.3 | % | |
Thermo
Fisher Scientific, Inc. |
2.3 | % | |
|
* Excludes short-term investments. | |||
|
Portfolio holdings are subject to change daily. | |||
| PORTFOLIO MANAGERS’ REPORT | VY® T. ROWE PRICE
CAPITAL APPRECIATION PORTFOLIO |
| Average Annual Total Returns for the Periods Ended December 31, 2019 | ||||||||||||
|---|---|---|---|---|---|---|---|---|---|---|---|---|
| 1 Year | 5 Year | 10 Year | ||||||||||
Class
ADV |
23.99 | % | 9.95 | % | 11.27 | % | ||||||
Class
I |
24.71 | % | 10.61 | % | 11.93 | % | ||||||
Class
R6(1) |
24.74 | % | 10.62 | % | 11.94 | % | ||||||
Class
S |
24.36 | % | 10.33 | % | 11.65 | % | ||||||
Class
S2 |
24.19 | % | 10.17 | % | 11.49 | % | ||||||
S&P
500® Index |
31.49 | % | 11.70 | % | 13.56 | % | ||||||
Bloomberg
Barclays U.S. Government/Credit Index |
9.71 | % | 3.23 | % | 3.96 | % | ||||||
60% S&P
500® Index/40% Bloomberg Barclays U.S. Government/Credit Index |
22.64 | % | 8.45 | % | 9.87 | % | ||||||
(1) |
Class R6 incepted on May 3, 2016. The Class R6 shares performance shown for the period prior to their inception date is the performance of Class I shares without adjustment for any differences in the expenses between the two classes. If adjusted for such differences, returns would be different. |
| VY® T. ROWE PRICE EQUITY INCOME PORTFOLIO | PORTFOLIO MANAGERS’ REPORT |
|
Sector Diversification
as of December 31, 2019 (as a percentage of net assets) | |||
Financials |
23.9 | % | |
Health
Care |
13.4 | % | |
Industrials |
11.9 | % | |
Energy |
8.7 | % | |
Utilities |
8.4 | % | |
Information Technology |
8.0 | % | |
Consumer
Staples |
7.9 | % | |
Communication Services |
6.1 | % | |
Materials |
4.5 | % | |
Real
Estate |
3.5 | % | |
Consumer
Discretionary |
2.4 | % | |
Assets in
Excess of Other Liabilities* |
1.3 | % | |
Net
Assets |
100.0 | % | |
|
* Includes short-term investments. | |||
|
Portfolio holdings are subject to change daily. | |||
VY® T. Rowe Price Equity Income Portfolio (the “Portfolio”) seeks a high level of dividend income as well as long-term growth of capital primarily through investments in stocks. The Portfolio is managed by John Linehan, Head of U.S. Equity and Portfolio Manager of T. Rowe Price Associates, Inc. — the Sub-Adviser.
|
Top Ten Holdings | |||
Wells
Fargo & Co. |
3.8 | % | |
JPMorgan
Chase & Co. |
3.4 | % | |
Qualcomm,
Inc. |
2.5 | % | |
Total
S.A. ADR |
2.4 | % | |
Southern
Co. |
2.4 | % | |
Johnson & Johnson |
2.3 | % | |
Morgan
Stanley |
1.9 | % | |
Chubb
Ltd. |
1.9 | % | |
Tyson
Foods, Inc. |
1.8 | % | |
General
Electric Co. |
1.8 | % | |
|
Portfolio holdings are subject to change daily. | |||
The views expressed in this commentary are informed opinions. They should not be considered promises or advice. The views expressed reflect those of the portfolio managers, only through the end of the period as stated on the cover. The portfolio managers’ views are subject to change at any time based on market and other conditions.
| PORTFOLIO MANAGERS’ REPORT | VY® T. ROWE PRICE EQUITY INCOME PORTFOLIO |
| Average Annual Total Returns for the Periods Ended December 31, 2019 | ||||||||||||
|---|---|---|---|---|---|---|---|---|---|---|---|---|
| 1 Year | 5 Year | 10 Year | ||||||||||
Class
ADV |
25.93 | % | 7.66 | % | 10.22 | % | ||||||
Class
I |
26.66 | % | 8.31 | % | 10.88 | % | ||||||
Class
S |
26.42 | % | 8.06 | % | 10.62 | % | ||||||
Class
S2 |
26.13 | % | 7.88 | % | 10.44 | % | ||||||
Russell
1000® Value Index |
26.54 | % | 8.29 | % | 11.80 | % | ||||||
S&P
500® Index |
31.49 | % | 11.70 | % | 13.56 | % | ||||||
| VY® T. ROWE
PRICE INTERNATIONAL STOCK PORTFOLIO |
PORTFOLIO MANAGERS’ REPORT |
|
Geographic Diversification
as of December 31, 2019 (as a percentage of net assets) | |||
Japan |
14.5 | % | |
Netherlands |
8.3 | % | |
Switzerland |
7.6 | % | |
France |
7.1 | % | |
China |
6.8 | % | |
United
Kingdom |
6.4 | % | |
India |
5.0 | % | |
Germany |
4.6 | % | |
South
Korea |
4.4 | % | |
Canada |
4.1 | % | |
Countries
between 0.2%–3.0%ˆ |
29.3 | % | |
Assets in
Excess of Other Liabilities* |
1.9 | % | |
Net
Assets |
100.0 | % | |
|
* Includes short-term investments. | |||
|
ˆ Includes 21 countries, which each represents 0.2%–3.0% of
net assets. | |||
|
Portfolio holdings are subject to change daily. | |||
VY® T. Rowe Price International Stock Portfolio (the “Portfolio”) seeks long-term growth of capital. The Portfolio is managed by Richard N. Clattenburg, CFA and Vice President, Portfolio Manager of T. Rowe Price Associates, Inc. — the Sub-Adviser.
|
Top Ten Holdings | |||
Thales
S.A. |
2.6 | % | |
Taiwan
Semiconductor Manufacturing Co., Ltd. |
2.2 | % | |
Alibaba
Group Holding Ltd. ADR |
2.2 | % | |
Takeda
Pharmaceutical Co., Ltd. |
2.1 | % | |
Housing
Development Finance Corp. |
2.0 | % | |
NXP
Semiconductor NV — NXPI — US |
2.0 | % | |
Naspers
Ltd. |
2.0 | % | |
Essity
AB |
2.0 | % | |
Samsung
Electronics Co., Ltd. |
1.9 | % | |
NAVER
Corp. |
1.9 | % | |
|
Portfolio holdings are subject to change daily. | |||
The views expressed in this commentary are informed opinions. They should not be considered promises or advice. The views expressed reflect those of the portfolio managers, only through the end of the period as stated on the cover. The portfolio managers’ views are subject to change at any time based on market and other conditions.
| PORTFOLIO MANAGERS’ REPORT | VY® T. ROWE PRICE
INTERNATIONAL STOCK PORTFOLIO |
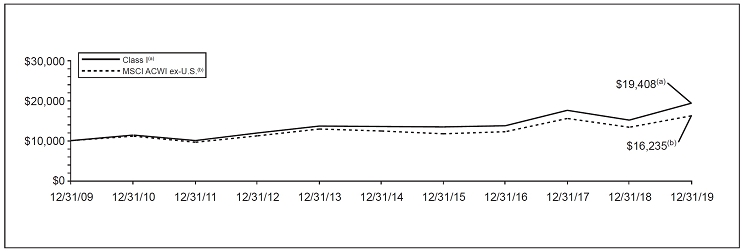
| Average Annual Total Returns for the Periods Ended December 31, 2019 | ||||||||||||
|---|---|---|---|---|---|---|---|---|---|---|---|---|
| 1 Year | 5 Year | 10 Year | ||||||||||
Class
ADV |
27.20 | % | 6.80 | % | 6.22 | % | ||||||
Class
I |
28.04 | % | 7.46 | % | 6.86 | % | ||||||
Class
S |
27.64 | % | 7.19 | % | 6.60 | % | ||||||
MSCI ACWI
ex-U.S. |
21.51 | % | 5.51 | % | 4.97 | % | ||||||
| Actual Portfolio Return | Hypothetical (5% return before expenses) | |||||||||||||||||||||||||||||||||
|---|---|---|---|---|---|---|---|---|---|---|---|---|---|---|---|---|---|---|---|---|---|---|---|---|---|---|---|---|---|---|---|---|---|---|
| Beginning Account Value July 1, 2019 |
Ending Account Value December 31, 2019 |
Annualized Expense Ratio |
Expenses Paid During the Period Ended December 31, 2019* |
Beginning Account Value July 1, 2019 |
Ending Account Value December 31, 2019 |
Annualized Expense Ratio |
Expenses Paid During the Period Ended December 31, 2019* |
|||||||||||||||||||||||||||
Voya Government Liquid Assets Portfolio
|
||||||||||||||||||||||||||||||||||
Class
I |
$ | 1,000.00 | $ | 1,009.00 | 0.29 | % | $ | 1.47 | $ | 1,000.00 | $ | 1,023.74 | 0.29 | % | $ | 1.48 | ||||||||||||||||||
Class
S |
1,000.00 | 1,007.70 | 0.54 | 2.73 | 1,000.00 | 1,022.48 | 0.54 | 2.75 | ||||||||||||||||||||||||||
Class
S2 |
1,000.00 | 1,006.90 | 0.69 | 3.49 | 1,000.00 | 1,021.73 | 0.69 | 3.52 | ||||||||||||||||||||||||||
VY® Clarion Global Real Estate Portfolio
|
||||||||||||||||||||||||||||||||||
Class
ADV |
1,000.00 | 1,068.40 | 1.49 | % | 7.77 | 1,000.00 | 1,017.69 | 1.49 | % | 7.58 | ||||||||||||||||||||||||
Class
I |
1,000.00 | 1,071.90 | 0.89 | 4.65 | 1,000.00 | 1,020.72 | 0.89 | 4.53 | ||||||||||||||||||||||||||
Class
S |
1,000.00 | 1,069.50 | 1.14 | 5.95 | 1,000.00 | 1,019.46 | 1.14 | 5.80 | ||||||||||||||||||||||||||
Class
S2 |
1,000.00 | 1,069.90 | 1.29 | 6.73 | 1,000.00 | 1,018.70 | 1.29 | 6.56 | ||||||||||||||||||||||||||
VY® Invesco Growth and Income Portfolio
|
||||||||||||||||||||||||||||||||||
Class
ADV |
1,000.00 | 1,072.60 | 1.24 | % | 6.48 | 1,000.00 | 1,018.95 | 1.24 | % | 6.31 | ||||||||||||||||||||||||
Class
I |
1,000.00 | 1,075.90 | 0.64 | 3.35 | 1,000.00 | 1,021.98 | 0.64 | 3.26 | ||||||||||||||||||||||||||
Class
S |
1,000.00 | 1,074.50 | 0.89 | 4.65 | 1,000.00 | 1,020.72 | 0.89 | 4.53 | ||||||||||||||||||||||||||
Class
S2 |
1,000.00 | 1,073.50 | 1.04 | 5.44 | 1,000.00 | 1,019.96 | 1.04 | 5.30 | ||||||||||||||||||||||||||
| Actual Portfolio Return | Hypothetical (5% return before expenses) | |||||||||||||||||||||||||||||||||
|---|---|---|---|---|---|---|---|---|---|---|---|---|---|---|---|---|---|---|---|---|---|---|---|---|---|---|---|---|---|---|---|---|---|---|
| Beginning Account Value July 1, 2019 |
Ending Account Value December 31, 2019 |
Annualized Expense Ratio |
Expenses Paid During the Period Ended December 31, 2019* |
Beginning Account Value July 1, 2019 |
Ending Account Value December 31, 2019 |
Annualized Expense Ratio |
Expenses Paid During the Period Ended December 31, 2019* |
|||||||||||||||||||||||||||
VY® JPMorgan Emerging Markets Equity Portfolio
|
||||||||||||||||||||||||||||||||||
Class
ADV |
$ | 1,000.00 | $ | 1,082.20 | 1.86 | % | $ | 9.76 | $ | 1,000.00 | $ | 1,015.83 | 1.86 | % | $ | 9.45 | ||||||||||||||||||
Class
I |
1,000.00 | 1,085.70 | 1.26 | 6.62 | 1,000.00 | 1,018.85 | 1.26 | 6.41 | ||||||||||||||||||||||||||
Class
S |
1,000.00 | 1,084.50 | 1.51 | 7.93 | 1,000.00 | 1,017.59 | 1.51 | 7.68 | ||||||||||||||||||||||||||
Class
S2 |
1,000.00 | 1,083.30 | 1.66 | 8.72 | 1,000.00 | 1,016.84 | 1.66 | 8.44 | ||||||||||||||||||||||||||
VY® Morgan Stanley Global Franchise Portfolio
|
||||||||||||||||||||||||||||||||||
Class
ADV |
1,000.00 | 1,067.80 | 1.54 | % | 8.03 | 1,000.00 | 1,017.44 | 1.54 | % | 7.83 | ||||||||||||||||||||||||
Class
R6 |
1,000.00 | 1,071.20 | 0.94 | 4.91 | 1,000.00 | 1,020.47 | 0.94 | 4.79 | ||||||||||||||||||||||||||
Class
S |
1,000.00 | 1,070.10 | 1.19 | 6.21 | 1,000.00 | 1,019.21 | 1.19 | 6.06 | ||||||||||||||||||||||||||
Class
S2 |
1,000.00 | 1,069.20 | 1.34 | 6.99 | 1,000.00 | 1,018.45 | 1.34 | 6.82 | ||||||||||||||||||||||||||
VY® T. Rowe Price Capital Appreciation Portfolio
|
||||||||||||||||||||||||||||||||||
Class
ADV |
1,000.00 | 1,058.80 | 1.24 | % | 6.43 | 1,000.00 | 1,018.95 | 1.24 | % | 6.31 | ||||||||||||||||||||||||
Class
I |
1,000.00 | 1,061.90 | 0.64 | 3.33 | 1,000.00 | 1,021.98 | 0.64 | 3.26 | ||||||||||||||||||||||||||
Class
R6 |
1,000.00 | 1,061.90 | 0.64 | 3.33 | 1,000.00 | 1,021.98 | 0.64 | 3.26 | ||||||||||||||||||||||||||
Class
S |
1,000.00 | 1,060.50 | 0.89 | 4.62 | 1,000.00 | 1,020.72 | 0.89 | 4.53 | ||||||||||||||||||||||||||
Class
S2 |
1,000.00 | 1,059.60 | 1.04 | 5.40 | 1,000.00 | 1,019.96 | 1.04 | 5.30 | ||||||||||||||||||||||||||
VY® T. Rowe Price Equity Income Portfolio
|
||||||||||||||||||||||||||||||||||
Class
ADV |
1,000.00 | 1,089.80 | 1.21 | % | 6.37 | 1,000.00 | 1,019.11 | 1.21 | % | 6.16 | ||||||||||||||||||||||||
Class
I |
1,000.00 | 1,093.20 | 0.61 | 3.22 | 1,000.00 | 1,022.13 | 0.61 | 3.11 | ||||||||||||||||||||||||||
Class
S |
1,000.00 | 1,093.30 | 0.86 | 4.54 | 1,000.00 | 1,020.87 | 0.86 | 4.38 | ||||||||||||||||||||||||||
Class
S2 |
1,000.00 | 1,090.90 | 1.01 | 5.32 | 1,000.00 | 1,020.11 | 1.01 | 5.14 | ||||||||||||||||||||||||||
VY® T. Rowe Price International Stock Portfolio
|
||||||||||||||||||||||||||||||||||
Class
ADV |
1,000.00 | 1,093.10 | 1.36 | % | 7.18 | 1,000.00 | 1,018.35 | 1.36 | % | 6.92 | ||||||||||||||||||||||||
Class
I |
1,000.00 | 1,096.90 | 0.76 | 4.02 | 1,000.00 | 1,021.37 | 0.76 | 3.87 | ||||||||||||||||||||||||||
Class
S |
1,000.00 | 1,095.00 | 1.01 | 5.33 | 1,000.00 | 1,020.11 | 1.01 | 5.14 | ||||||||||||||||||||||||||
* |
Expenses are equal to each Portfolio’s respective annualized expense ratios multiplied by the average account value over the period, multiplied by 184/365 to reflect the most recent fiscal half-year. |
Voya Investors Trust:

February 21, 2020
| Voya Government Liquid Assets Portfolio |
VY® Clarion Global Real Estate Portfolio |
VY® Invesco Growth and Income Portfolio |
VY® JPMorgan Emerging Markets Equity Portfolio |
|||||||||||||
|---|---|---|---|---|---|---|---|---|---|---|---|---|---|---|---|---|
ASSETS: |
||||||||||||||||
Investments in
securities at fair value+* |
$ | — | $ | 232,525,859 | $ | 428,207,839 | $ | 511,109,746 | ||||||||
Short-term
investments at fair value** |
— | 632,792 | 18,754,732 | 5,671,239 | ||||||||||||
Repurchase
agreements |
313,754,000 | — | — | — | ||||||||||||
Short-term
investments at amortized cost |
410,608,687 | — | — | — | ||||||||||||
Cash |
8,639 | 638,241 | 27,479 | — | ||||||||||||
Foreign
currencies at value*** |
— | — | 244,833 | 411 | ||||||||||||
Receivables: |
||||||||||||||||
Investment
securities and currencies sold |
— | 1,252,762 | — | — | ||||||||||||
Fund shares
sold |
2,698,980 | 164,002 | 12,576 | 4,989 | ||||||||||||
Dividends |
32,595 | 953,347 | 606,190 | 516,815 | ||||||||||||
Interest |
168,245 | — | — | — | ||||||||||||
Foreign tax
reclaims |
— | 34,518 | 162,060 | 16,033 | ||||||||||||
Unrealized
appreciation on forward foreign currency contracts |
— | 65 | 8,521 | — | ||||||||||||
Prepaid
expenses |
— | 1,632 | — | — | ||||||||||||
Reimbursement
due from manager |
— | 16,612 | — | — | ||||||||||||
Other
assets |
32,927 | 13,828 | 26,297 | 28,088 | ||||||||||||
Total
assets |
727,304,073 | 236,233,658 | 448,050,527 | 517,347,321 | ||||||||||||
LIABILITIES: |
||||||||||||||||
Payable for
investment securities and currencies purchased |
— | 760,509 | — | — | ||||||||||||
Payable for fund
shares redeemed |
299,089 | 61,904 | 291,950 | 3,042,006 | ||||||||||||
Payable upon
receipt of securities loaned |
— | 632,792 | 3,296,644 | 1,342,970 | ||||||||||||
Unrealized
depreciation on forward foreign currency contracts |
— | — | 711,215 | — | ||||||||||||
Payable for
unified fees |
175,486 | — | 236,954 | 535,334 | ||||||||||||
Payable for
investment management fees |
— | 175,087 | — | — | ||||||||||||
Payable for
distribution and shareholder service fees |
188,368 | 29,317 | 95,801 | 106,935 | ||||||||||||
Payable to
trustees under the deferred compensation plan (Note 6) |
32,927 | 13,828 | 26,297 | 28,088 | ||||||||||||
Payable for
trustee fees |
13,003 | 1,163 | — | — | ||||||||||||
Payable for
Indian capital gains tax |
— | — | — | 387,445 | ||||||||||||
Other accrued
expenses and liabilities |
— | 184,726 | — | — | ||||||||||||
Total
liabilities |
708,873 | 1,859,326 | 4,658,861 | 5,442,778 | ||||||||||||
NET
ASSETS |
$ | 726,595,200 | $ | 234,374,332 | $ | 443,391,666 | $ | 511,904,543 | ||||||||
NET ASSETS
WERE COMPRISED OF: |
||||||||||||||||
Paid-in
capital |
$ | 726,616,758 | $ | 172,439,302 | $ | 330,484,890 | $ | 306,794,137 | ||||||||
Total
distributable earnings (loss) |
(21,558 | ) | 61,935,030 | 112,906,776 | 205,110,406 | |||||||||||
NET
ASSETS |
$ | 726,595,200 | $ | 234,374,332 | $ | 443,391,666 | $ | 511,904,543 | ||||||||
|
| ||||||||||||||||
+ Including
securities loaned at value |
$ | — | $ | 608,472 | $ | 3,219,502 | $ | 1,275,539 | ||||||||
* Cost of
investments in securities |
$ | — | $ | 184,978,901 | $ | 352,519,931 | $ | 338,319,763 | ||||||||
** Cost of
short-term investments |
$ | — | $ | 632,792 | $ | 18,754,732 | $ | 5,671,239 | ||||||||
*** Cost of
foreign currencies |
$ | — | $ | — | $ | 241,576 | $ | 550 | ||||||||
| Voya Government Liquid Assets Portfolio |
VY® Clarion Global Real Estate Portfolio |
VY® Invesco Growth and Income Portfolio |
VY® JPMorgan Emerging Markets Equity Portfolio | |||||||||||||
|---|---|---|---|---|---|---|---|---|---|---|---|---|---|---|---|---|
Class ADV |
||||||||||||||||
Net
assets |
n/a | $ | 17,308,114 | $ | 18,400,643 | $ | 50,223,700 | |||||||||
Shares
authorized |
n/a | unlimited | unlimited | unlimited | ||||||||||||
Par
value |
n/a | $ | 0.001 | $ | 0.001 | $ | 0.001 | |||||||||
Shares
outstanding |
n/a | 1,355,711 | 809,619 | 2,389,524 | ||||||||||||
Net asset value
and redemption price per share |
n/a | $ | 12.77 | $ | 22.73 | $ | 21.02 | |||||||||
Class
I |
||||||||||||||||
Net
assets |
$ | 52,514,863 | $ | 119,641,915 | $ | 29,773,353 | $ | 79,673,639 | ||||||||
Shares
authorized |
unlimited | unlimited | unlimited | unlimited | ||||||||||||
Par
value |
$ | 0.001 | $ | 0.001 | $ | 0.001 | $ | 0.001 | ||||||||
Shares
outstanding |
52,508,417 | 9,127,430 | 1,293,881 | 3,582,968 | ||||||||||||
Net asset value
and redemption price per share |
$ | 1.00 | $ | 13.11 | $ | 23.01 | $ | 22.24 | ||||||||
Class
S |
||||||||||||||||
Net
assets |
$ | 314,785,844 | $ | 96,518,652 | $ | 367,940,978 | $ | 370,440,699 | ||||||||
Shares
authorized |
unlimited | unlimited | unlimited | unlimited | ||||||||||||
Par
value |
$ | 0.001 | $ | 0.001 | $ | 0.001 | $ | 0.001 | ||||||||
Shares
outstanding |
314,747,299 | 7,399,660 | 15,827,445 | 16,776,949 | ||||||||||||
Net asset value
and redemption price per share |
$ | 1.00 | $ | 13.04 | $ | 23.25 | $ | 22.08 | ||||||||
Class
S2 |
||||||||||||||||
Net
assets |
$ | 359,294,493 | $ | 905,651 | $ | 27,276,692 | $ | 11,566,505 | ||||||||
Shares
authorized |
unlimited | unlimited | unlimited | unlimited | ||||||||||||
Par
value |
$ | 0.001 | $ | 0.001 | $ | 0.001 | $ | 0.001 | ||||||||
Shares
outstanding |
359,250,365 | 68,893 | 1,185,731 | 530,485 | ||||||||||||
Net asset value
and redemption price per share |
$ | 1.00 | $ | 13.15 | $ | 23.00 | $ | 21.80 | ||||||||
| VY® Morgan Stanley Global Franchise Portfolio |
VY® T. Rowe Price Capital Appreciation Portfolio |
VY® T. Rowe Price Equity Income Portfolio |
VY® T. Rowe Price International Stock Portfolio |
|||||||||||||
|---|---|---|---|---|---|---|---|---|---|---|---|---|---|---|---|---|
ASSETS: |
||||||||||||||||
Investments in
securities at fair value+* |
$ | 409,670,964 | $ | 6,697,883,287 | $ | 379,370,400 | $ | 211,982,919 | ||||||||
Short-term
investments at fair value** |
7,383,153 | 1,070,559,121 | 17,587,273 | 5,292,397 | ||||||||||||
Cash |
1,878 | 11,054,216 | 2,991,533 | 996,313 | ||||||||||||
Foreign
currencies at value*** |
— | 350,995 | 104,163 | 864,251 | ||||||||||||
Receivables: |
||||||||||||||||
Investment
securities sold |
29,069 | 16,681,697 | — | 333,789 | ||||||||||||
Fund shares
sold |
— | 329,484 | 10,018 | 31,420 | ||||||||||||
Dividends |
846,369 | 3,433,350 | 1,020,714 | 260,422 | ||||||||||||
Interest |
— | 15,092,852 | 43,149 | 997 | ||||||||||||
Foreign tax
reclaims |
101,286 | 2,098 | 59,551 | 203,319 | ||||||||||||
Unrealized
appreciation on forward foreign currency contracts |
— | 161 | — | 2,925 | ||||||||||||
Prepaid
expenses |
— | — | — | 1,479 | ||||||||||||
Other
assets |
17,266 | 223,594 | 49,610 | 11,998 | ||||||||||||
Total
assets |
418,049,985 | 7,815,610,855 | 401,236,411 | 219,982,229 | ||||||||||||
LIABILITIES: |
||||||||||||||||
Payable for
investment securities purchased |
— | 32,597,173 | 7,175 | 163,648 | ||||||||||||
Payable for fund
shares redeemed |
1,330,318 | 3,826,144 | 3,141,158 | 859,439 | ||||||||||||
Payable upon
receipt of securities loaned |
— | 252,644,249 | 13,136,628 | 2,344,711 | ||||||||||||
Unrealized
depreciation on forward foreign currency contracts |
— | — | — | 35 | ||||||||||||
Payable for
unified fees |
328,783 | 3,988,970 | 313,216 | — | ||||||||||||
Payable for
investment management fees |
— | — | — | 124,993 | ||||||||||||
Payable for
distribution and shareholder service fees |
125,076 | 1,586,291 | 139,900 | 43,480 | ||||||||||||
Payable to
trustees under the deferred compensation plan (Note 6) |
17,266 | 223,594 | 49,610 | 11,998 | ||||||||||||
Payable for
trustee fees |
— | — | — | 1,039 | ||||||||||||
Other accrued
expenses and liabilities |
— | — | — | 221,680 | ||||||||||||
Written options,
at fair valueˆ |
— | 75,492,168 | — | 6,490 | ||||||||||||
Total
liabilities |
1,801,443 | 370,358,589 | 16,787,687 | 3,777,513 | ||||||||||||
NET
ASSETS |
$ | 416,248,542 | $ | 7,445,252,266 | $ | 384,448,724 | $ | 216,204,716 | ||||||||
NET ASSETS
WERE COMPRISED OF: |
||||||||||||||||
Paid-in
capital |
$ | 269,580,554 | $ | 5,726,740,816 | $ | 294,181,843 | $ | 168,908,581 | ||||||||
Total
distributable earnings |
146,667,988 | 1,718,511,450 | 90,266,881 | 47,296,135 | ||||||||||||
NET
ASSETS |
$ | 416,248,542 | $ | 7,445,252,266 | $ | 384,448,724 | $ | 216,204,716 | ||||||||
|
| ||||||||||||||||
+ Including
securities loaned at value |
$ | — | $ | 246,886,369 | $ | 12,848,169 | $ | 2,228,726 | ||||||||
* Cost of
investments in securities |
$ | 296,563,351 | $ | 5,510,785,316 | $ | 299,795,789 | $ | 170,686,360 | ||||||||
** Cost of
short-term investments |
$ | 7,383,153 | $ | 1,070,559,121 | $ | 17,587,273 | $ | 5,292,397 | ||||||||
*** Cost of
foreign currencies |
$ | — | $ | 350,995 | $ | 103,263 | $ | 870,708 | ||||||||
ˆ Premiums
received on written options |
$ | — | $ | 35,855,815 | $ | — | $ | 4,232 | ||||||||
| VY® Morgan Stanley Global Franchise Portfolio |
VY® T. Rowe Price Capital Appreciation Portfolio |
VY® T. Rowe Price Equity Income Portfolio |
VY® T. Rowe Price International Stock Portfolio | |||||||||||||
|---|---|---|---|---|---|---|---|---|---|---|---|---|---|---|---|---|
Class ADV |
||||||||||||||||
Net
assets |
$ | 110,092,725 | $ | 1,353,245,555 | $ | 51,292,969 | $ | 23,415,362 | ||||||||
Shares
authorized |
unlimited | unlimited | unlimited | unlimited | ||||||||||||
Par
value |
$ | 0.001 | $ | 0.001 | $ | 0.001 | $ | 0.001 | ||||||||
Shares
outstanding |
6,854,064 | 48,365,680 | 5,143,006 | 1,439,941 | ||||||||||||
Net asset value
and redemption price per share |
$ | 16.06 | $ | 27.98 | $ | 9.97 | $ | 16.26 | ||||||||
Class
I |
||||||||||||||||
Net
assets |
n/a | $ | 1,673,641,857 | $ | 81,596,127 | $ | 41,352,437 | |||||||||
Shares
authorized |
n/a | unlimited | unlimited | unlimited | ||||||||||||
Par
value |
n/a | $ | 0.001 | $ | 0.001 | $ | 0.001 | |||||||||
Shares
outstanding |
n/a | 56,903,678 | 7,942,290 | 2,529,939 | ||||||||||||
Net asset value
and redemption price per share |
n/a | $ | 29.41 | $ | 10.27 | $ | 16.35 | |||||||||
Class
R6 |
||||||||||||||||
Net
assets |
$ | 634,976 | $ | 181,834,684 | n/a | n/a | ||||||||||
Shares
authorized |
unlimited | unlimited | n/a | n/a | ||||||||||||
Par
value |
$ | 0.001 | $ | 0.001 | n/a | n/a | ||||||||||
Shares
outstanding |
36,641 | 6,179,152 | n/a | n/a | ||||||||||||
Net asset value
and redemption price per share |
$ | 17.33 | $ | 29.43 | n/a | n/a | ||||||||||
Class
S |
||||||||||||||||
Net
assets |
$ | 266,632,784 | $ | 4,163,308,319 | $ | 161,387,842 | $ | 151,436,917 | ||||||||
Shares
authorized |
unlimited | unlimited | unlimited | unlimited | ||||||||||||
Par
value |
$ | 0.001 | $ | 0.001 | $ | 0.001 | $ | 0.001 | ||||||||
Shares
outstanding |
15,357,611 | 141,491,336 | 15,660,293 | 9,304,140 | ||||||||||||
Net asset value
and redemption price per share |
$ | 17.36 | $ | 29.42 | $ | 10.31 | $ | 16.28 | ||||||||
Class
S2 |
||||||||||||||||
Net
assets |
$ | 38,888,057 | $ | 73,221,851 | $ | 90,171,786 | n/a | |||||||||
Shares
authorized |
unlimited | unlimited | unlimited | n/a | ||||||||||||
Par
value |
$ | 0.001 | $ | 0.001 | $ | 0.001 | n/a | |||||||||
Shares
outstanding |
2,263,419 | 2,508,248 | 8,951,588 | n/a | ||||||||||||
Net asset value
and redemption price per share |
$ | 17.18 | $ | 29.19 | $ | 10.07 | n/a | |||||||||
| Voya Government Liquid Assets Portfolio |
VY® Clarion Global Real Estate Portfolio |
VY® Invesco Growth and Income Portfolio |
VY® JPMorgan Emerging Markets Equity Portfolio |
||||||||||||||
|---|---|---|---|---|---|---|---|---|---|---|---|---|---|---|---|---|---|
INVESTMENT
INCOME: |
|||||||||||||||||
Dividends, net
of foreign taxes withheld* |
$ | 83,995 | $ | 6,739,867 | $ | 11,905,456 | $ | 9,068,180 | |||||||||
Interest |
16,623,585 | — | — | 172 | |||||||||||||
Securities
lending income, net |
— | 9,857 | 14,514 | 78,739 | |||||||||||||
Total
investment income |
16,707,580 | 6,749,724 | 11,919,970 | 9,147,091 | |||||||||||||
EXPENSES: |
|||||||||||||||||
Investment
management fees |
— | 2,093,943 | — | — | |||||||||||||
Unified
fees |
2,144,215 | — | 2,842,832 | 6,056,524 | |||||||||||||
Distribution and
shareholder service fees: |
|||||||||||||||||
Class
ADV |
— | 105,949 | 107,785 | 276,189 | |||||||||||||
Class
S |
839,603 | 244,925 | 927,759 | 888,426 | |||||||||||||
Class
S2 |
1,447,416 | 3,745 | 111,643 | 45,974 | |||||||||||||
Transfer agent
fees |
— | 558 | — | — | |||||||||||||
Shareholder
reporting expense |
— | 72,320 | — | — | |||||||||||||
Professional
fees |
— | 23,177 | — | — | |||||||||||||
Custody and
accounting expense |
— | 152,103 | — | — | |||||||||||||
Trustee fees and
expenses |
36,939 | 9,306 | 29,260 | 29,934 | |||||||||||||
Miscellaneous
expense |
— | 19,462 | — | — | |||||||||||||
Interest
expense |
— | 360 | 132 | 3,027 | |||||||||||||
Total
expenses |
4,468,173 | 2,725,848 | 4,019,411 | 7,300,074 | |||||||||||||
Waived and
reimbursed fees |
— | (299,336 | ) | — | — | ||||||||||||
Brokerage
commission recapture |
— | (3,282 | ) | (1,613 | ) | (908 | ) | ||||||||||
Net
expenses |
4,468,173 | 2,423,230 | 4,017,798 | 7,299,166 | |||||||||||||
Net investment
income |
12,239,407 | 4,326,494 | 7,902,172 | 1,847,925 | |||||||||||||
REALIZED AND
UNREALIZED GAIN (LOSS): |
|||||||||||||||||
Net realized
gain (loss) on: |
|||||||||||||||||
Investments
(net of Indian capital gains tax withheldˆ) |
539,733 | 19,761,711 | 32,270,670 | 32,010,003 | |||||||||||||
Forward
foreign currency contracts |
— | (31,124 | ) | 309,376 | — | ||||||||||||
Foreign
currency related transactions |
— | 15,219 | 1,372 | (118,102 | ) | ||||||||||||
Net realized
gain |
539,733 | 19,745,806 | 32,581,418 | 31,891,901 | |||||||||||||
Net change in
unrealized appreciation (depreciation) on: |
|||||||||||||||||
Investments
(net of Indian capital gains tax accrued#) |
— | 25,796,071 | 57,885,325 | 98,283,309 | |||||||||||||
Forward
foreign currency contracts |
— | 12,954 | (645,803 | ) | — | ||||||||||||
Foreign
currency related transactions |
— | (13,057 | ) | 11,869 | 1,302 | ||||||||||||
Net change in
unrealized appreciation (depreciation) |
— | 25,795,968 | 57,251,391 | 98,284,611 | |||||||||||||
Net realized and
unrealized gain |
539,733 | 45,541,774 | 89,832,809 | 130,176,512 | |||||||||||||
Increase in
net assets resulting from operations |
$ | 12,779,140 | $ | 49,868,268 | $ | 97,734,981 | $ | 132,024,437 | |||||||||
|
| |||||||||||||||||
| * | Foreign taxes withheld | $ | — | $ | 269,550 | $ | 221,736 | $ | 841,141 | ||||||||
| ˆ | Foreign taxes on sale of Indian investments | $ | — | $ | — | $ | — | $ | 130,694 | ||||||||
| # | Foreign taxes accrued on Indian investments | $ | — | $ | — | $ | — | $ | 387,445 | ||||||||
| VY® Morgan Stanley Global Franchise Portfolio |
VY® T. Rowe Price Capital Appreciation Portfolio |
VY® T. Rowe Price Equity Income Portfolio |
VY® T. Rowe Price International Stock Portfolio |
|||||||||||||||
|---|---|---|---|---|---|---|---|---|---|---|---|---|---|---|---|---|---|---|
INVESTMENT
INCOME: |
||||||||||||||||||
Dividends, net
of foreign taxes withheld* |
$ | 8,027,439 | $ | 77,996,286 | $ | 23,420,765 | $ | 4,566,062 | ||||||||||
Interest |
— | 78,625,232 | 290,513 | 5,271 | ||||||||||||||
Securities
lending income, net |
15,230 | 499,521 | 49,579 | 30,590 | ||||||||||||||
Total
investment income |
8,042,669 | 157,121,039 | 23,760,857 | 4,601,923 | ||||||||||||||
EXPENSES: |
||||||||||||||||||
Investment
management fees |
— | — | — | 1,330,589 | ||||||||||||||
Unified
fees |
3,844,675 | 44,215,071 | 5,041,938 | — | ||||||||||||||
Distribution and
shareholder service fees: |
||||||||||||||||||
Class
ADV |
578,573 | 7,156,822 | 290,318 | 127,542 | ||||||||||||||
Class
S |
659,366 | 10,064,849 | 1,408,297 | 367,619 | ||||||||||||||
Class
S2 |
155,080 | 295,287 | 399,174 | — | ||||||||||||||
Transfer agent
fees |
— | — | — | 713 | ||||||||||||||
Shareholder
reporting expense |
— | — | — | 39,054 | ||||||||||||||
Professional
fees |
— | — | — | 43,300 | ||||||||||||||
Custody and
accounting expense |
— | — | — | 236,809 | ||||||||||||||
Trustee fees and
expenses |
24,729 | 383,663 | 50,080 | 8,316 | ||||||||||||||
Miscellaneous
expense |
— | — | — | 15,451 | ||||||||||||||
Interest
expense |
— | 3,918 | — | — | ||||||||||||||
Total
expenses |
5,262,423 | 62,119,610 | 7,189,807 | 2,169,393 | ||||||||||||||
Waived and
reimbursed fees |
(112,402 | ) | — | (246,216 | ) | (103,533 | ) | |||||||||||
Net
expenses |
5,150,021 | 62,119,610 | 6,943,591 | 2,065,860 | ||||||||||||||
Net investment
income |
2,892,648 | 95,001,429 | 16,817,266 | 2,536,063 | ||||||||||||||
REALIZED AND
UNREALIZED GAIN (LOSS): |
||||||||||||||||||
Net realized
gain (loss) on: |
||||||||||||||||||
Investments |
31,363,050 | 537,935,234 | 146,249,332 | 4,789,667 | ||||||||||||||
Forward
foreign currency contracts |
— | 59,360 | — | (26,155 | ) | |||||||||||||
Foreign
currency related transactions |
(44,702 | ) | (99,534 | ) | 4,748 | (3,543 | ) | |||||||||||
Futures |
— | — | (645 | ) | — | |||||||||||||
Written
options |
— | 23,749,238 | — | 22,514 | ||||||||||||||
Net realized
gain |
31,318,348 | 561,644,298 | 146,253,435 | 4,782,483 | ||||||||||||||
Net change in
unrealized appreciation (depreciation) on: |
||||||||||||||||||
Investments |
66,316,347 | 869,467,673 | 16,618,668 | 42,878,091 | ||||||||||||||
Forward
foreign currency contracts |
— | 161 | — | 40,768 | ||||||||||||||
Foreign
currency related transactions |
6,974 | (3,154 | ) | 2,487 | (7,556 | ) | ||||||||||||
Written
options |
— | (55,394,858 | ) | — | (2,258 | ) | ||||||||||||
Unfunded
commitments |
— | 121,864 | — | — | ||||||||||||||
Net change in
unrealized appreciation (depreciation) |
66,323,321 | 814,191,686 | 16,621,155 | 42,909,045 | ||||||||||||||
Net realized and
unrealized gain |
97,641,669 | 1,375,835,984 | 162,874,590 | 47,691,528 | ||||||||||||||
Increase in
net assets resulting from operations |
$ | 100,534,317 | $ | 1,470,837,413 | $ | 179,691,856 | $ | 50,227,591 | ||||||||||
| * Foreign taxes withheld | $ | 156,680 | $ | 166,809 | $ | 239,904 | $ | 362,570 | ||||||||||
| Voya Government Liquid Assets Portfolio |
VY® Clarion Global Real Estate Portfolio |
|||||||||||||||
|---|---|---|---|---|---|---|---|---|---|---|---|---|---|---|---|---|
| Year Ended December 31, 2019 |
Year Ended December 31, 2018 |
Year Ended December 31, 2019 |
Year Ended December 31, 2018 |
|||||||||||||
FROM
OPERATIONS: |
||||||||||||||||
Net investment
income |
$ | 12,239,407 | $ | 9,751,274 | $ | 4,326,494 | $ | 5,490,218 | ||||||||
Net realized
gain |
539,733 | 140,230 | 19,745,806 | 19,214,606 | ||||||||||||
Net change in
unrealized appreciation (depreciation) |
— | — | 25,795,968 | (47,591,249 | ) | |||||||||||
Increase
(decrease) in net assets resulting from operations |
12,779,140 | 9,891,504 | 49,868,268 | (22,886,425 | ) | |||||||||||
FROM DISTRIBUTIONS TO SHAREHOLDERS:
| ||||||||||||||||
Total
distributions (excluding return of capital): |
||||||||||||||||
Class
ADV |
— | — | (394,514 | ) | (965,808 | ) | ||||||||||
Class
I |
(1,149,041 | ) | (898,299 | ) | (3,315,314 | ) | (9,056,924 | ) | ||||||||
Class
S |
(5,870,729 | ) | (4,772,366 | ) | (2,549,899 | ) | (5,350,931 | ) | ||||||||
Class
S2 |
(5,767,381 | ) | (4,204,653 | ) | (23,042 | ) | (47,888 | ) | ||||||||
Total
distributions |
(12,787,151 | ) | (9,875,318 | ) | (6,282,769 | ) | (15,421,551 | ) | ||||||||
| FROM CAPITAL SHARE TRANSACTIONS: | ||||||||||||||||
Net proceeds
from sale of shares |
214,336,336 | 302,336,752 | 9,881,253 | 14,446,149 | ||||||||||||
Reinvestment of
distributions |
12,787,151 | 9,875,318 | 6,282,769 | 15,421,551 | ||||||||||||
| 227,123,487 | 312,212,070 | 16,164,022 | 29,867,700 | |||||||||||||
Cost of shares
redeemed |
(303,425,500 | ) | (291,563,651 | ) | (36,020,088 | ) | (101,991,489 | ) | ||||||||
Net increase
(decrease) in net assets resulting from capital share transactions |
(76,302,013 | ) | 20,648,419 | (19,856,066 | ) | (72,123,789 | ) | |||||||||
Net increase
(decrease) in net assets |
(76,310,024 | ) | 20,664,605 | 23,729,433 | (110,431,765 | ) | ||||||||||
NET
ASSETS: |
||||||||||||||||
Beginning of
year or period |
802,905,224 | 782,240,619 | 210,644,899 | 321,076,664 | ||||||||||||
End of year or
period |
$ | 726,595,200 | $ | 802,905,224 | $ | 234,374,332 | $ | 210,644,899 | ||||||||
| VY® Invesco Growth and Income Portfolio |
VY® JPMorgan Emerging Markets Equity Portfolio |
|||||||||||||||
|---|---|---|---|---|---|---|---|---|---|---|---|---|---|---|---|---|
| Year Ended December 31, 2019 |
Year Ended December 31, 2018 |
Year Ended December 31, 2019 |
Year Ended December 31, 2018 |
|||||||||||||
FROM
OPERATIONS: |
||||||||||||||||
Net investment
income |
$ | 7,902,172 | $ | 8,147,604 | $ | 1,847,925 | $ | 1,424,693 | ||||||||
Net realized
gain |
32,581,418 | 56,358,652 | 31,891,901 | 33,757,755 | ||||||||||||
Net change in
unrealized appreciation (depreciation) |
57,251,391 | (131,014,689 | ) | 98,284,611 | (128,801,367 | ) | ||||||||||
Increase
(decrease) in net assets resulting from operations |
97,734,981 | (66,508,433 | ) | 132,024,437 | (93,618,919 | ) | ||||||||||
FROM DISTRIBUTIONS TO SHAREHOLDERS:
| ||||||||||||||||
Total distributions (excluding return of capital):
| ||||||||||||||||
Class
ADV |
(2,498,575 | ) | (2,545,460 | ) | (2,713,856 | ) | (173,376 | ) | ||||||||
Class
I |
(4,251,471 | ) | (4,159,490 | ) | (4,082,963 | ) | (623,640 | ) | ||||||||
Class
S |
(51,840,265 | ) | (53,854,097 | ) | (20,116,064 | ) | (2,244,617 | ) | ||||||||
Class
S2 |
(3,938,465 | ) | (3,923,246 | ) | (656,400 | ) | (52,676 | ) | ||||||||
Total
distributions |
(62,528,776 | ) | (64,482,293 | ) | (27,569,283 | ) | (3,094,309 | ) | ||||||||
FROM CAPITAL
SHARE TRANSACTIONS: |
||||||||||||||||
Net proceeds
from sale of shares |
6,101,952 | 14,555,116 | 30,196,135 | 43,086,889 | ||||||||||||
Reinvestment of
distributions |
62,528,776 | 64,482,293 | 27,569,283 | 3,094,309 | ||||||||||||
| 68,630,728 | 79,037,409 | 57,765,418 | 46,181,198 | |||||||||||||
Cost of shares
redeemed |
(82,036,184 | ) | (92,321,940 | ) | (83,129,759 | ) | (126,128,800 | ) | ||||||||
Net decrease in
net assets resulting from capital share transactions |
(13,405,456 | ) | (13,284,531 | ) | (25,364,341 | ) | (79,947,602 | ) | ||||||||
Net increase
(decrease) in net assets |
21,800,749 | (144,275,257 | ) | 79,090,813 | (176,660,830 | ) | ||||||||||
NET
ASSETS: |
||||||||||||||||
Beginning of
year or period |
421,590,917 | 565,866,174 | 432,813,730 | 609,474,560 | ||||||||||||
End of year or
period |
$ | 443,391,666 | $ | 421,590,917 | $ | 511,904,543 | $ | 432,813,730 | ||||||||
| VY® Morgan Stanley Global Franchise Portfolio |
VY® T. Rowe Price Capital Appreciation Portfolio |
|||||||||||||||
|---|---|---|---|---|---|---|---|---|---|---|---|---|---|---|---|---|
| Year Ended December 31, 2019 |
Year Ended December 31, 2018 |
Year Ended December 31, 2019 |
Year Ended December 31, 2018 |
|||||||||||||
FROM
OPERATIONS: |
||||||||||||||||
Net investment
income |
$ | 2,892,648 | $ | 2,839,250 | $ | 95,001,429 | $ | 145,908,046 | ||||||||
Net realized
gain |
31,318,348 | 41,896,516 | 561,644,298 | 369,902,205 | ||||||||||||
Net change in
unrealized appreciation (depreciation) |
66,323,321 | (50,740,526 | ) | 814,191,686 | (476,124,555 | ) | ||||||||||
Increase
(decrease) in net assets resulting from operations |
100,534,317 | (6,004,760 | ) | 1,470,837,413 | 39,685,696 | |||||||||||
FROM DISTRIBUTIONS TO SHAREHOLDERS:
|
||||||||||||||||
Total distributions (excluding return of capital):
| ||||||||||||||||
Class
ADV |
(11,237,040 | ) | (13,099,859 | ) | (79,837,274 | ) | (95,178,479 | ) | ||||||||
Class
I |
— | — | (105,346,487 | ) | (124,567,106 | ) | ||||||||||
Class
R6 |
(75,422 | ) | (10,394 | ) | (10,487,555 | ) | (7,964,813 | ) | ||||||||
Class
S |
(29,140,576 | ) | (41,529,824 | ) | (265,075,287 | ) | (363,602,203 | ) | ||||||||
Class
S2 |
(4,241,616 | ) | (6,082,883 | ) | (4,744,849 | ) | (6,795,562 | ) | ||||||||
Total
distributions |
(44,694,654 | ) | (60,722,960 | ) | (465,491,452 | ) | (598,108,163 | ) | ||||||||
FROM CAPITAL SHARE TRANSACTIONS:
| ||||||||||||||||
Net proceeds
from sale of shares |
18,802,058 | 12,634,552 | 630,958,784 | 378,731,621 | ||||||||||||
Reinvestment of
distributions |
44,694,654 | 60,722,960 | 465,491,452 | 598,108,163 | ||||||||||||
| 63,496,712 | 73,357,512 | 1,096,450,236 | 976,839,784 | |||||||||||||
Cost of shares
redeemed |
(60,226,756 | ) | (57,300,170 | ) | (696,028,997 | ) | (735,693,220 | ) | ||||||||
Net increase in
net assets resulting from capital share transactions |
3,269,956 | 16,057,342 | 400,421,239 | 241,146,564 | ||||||||||||
Net increase
(decrease) in net assets |
59,109,619 | (50,670,378 | ) | 1,405,767,200 | (317,275,903 | ) | ||||||||||
NET
ASSETS: |
||||||||||||||||
Beginning of
year or period |
357,138,923 | 407,809,301 | 6,039,485,066 | 6,356,760,969 | ||||||||||||
End of year or
period |
$ | 416,248,542 | $ | 357,138,923 | $ | 7,445,252,266 | $ | 6,039,485,066 | ||||||||
| VY® T. Rowe Price Equity Income Portfolio |
VY® T. Rowe Price International Stock Portfolio |
|||||||||||||||
|---|---|---|---|---|---|---|---|---|---|---|---|---|---|---|---|---|
| Year Ended December 31, 2019 |
Year Ended December 31, 2018 |
Year Ended December 31, 2019 |
Year Ended December 31, 2018 |
|||||||||||||
FROM
OPERATIONS: |
||||||||||||||||
Net investment
income |
$ | 16,817,266 | $ | 19,224,254 | $ | 2,536,063 | $ | 2,467,070 | ||||||||
Net realized
gain |
146,253,435 | 78,408,295 | 4,782,483 | 13,238,548 | ||||||||||||
Net change in
unrealized appreciation (depreciation) |
16,621,155 | (175,226,109 | ) | 42,909,045 | (47,937,027 | ) | ||||||||||
Increase
(decrease) in net assets resulting from operations |
179,691,856 | (77,593,560 | ) | 50,227,591 | (32,231,409 | ) | ||||||||||
FROM DISTRIBUTIONS TO SHAREHOLDERS:
|
||||||||||||||||
Total
distributions (excluding return of capital): |
||||||||||||||||
Class
ADV |
(14,085,259 | ) | (8,544,546 | ) | (1,356,151 | ) | (293,947 | ) | ||||||||
Class
I |
(22,140,633 | ) | (16,430,325 | ) | (2,725,607 | ) | (800,891 | ) | ||||||||
Class
S |
(162,548,177 | ) | (110,181,926 | ) | (9,755,870 | ) | (2,820,796 | ) | ||||||||
Class
S2 |
(28,955,674 | ) | (18,499,686 | ) | — | — | ||||||||||
Total
distributions |
(227,729,743 | ) | (153,656,483 | ) | (13,837,628 | ) | (3,915,634 | ) | ||||||||
FROM CAPITAL SHARE TRANSACTIONS:
|
||||||||||||||||
Net proceeds
from sale of shares |
34,697,046 | 23,487,241 | 9,219,945 | 14,802,681 | ||||||||||||
Reinvestment of
distributions |
227,729,743 | 153,656,483 | 13,837,628 | 3,915,634 | ||||||||||||
| 262,426,789 | 177,143,724 | 23,057,573 | 18,718,315 | |||||||||||||
Cost of shares
redeemed |
(589,365,595 | ) | (146,890,620 | ) | (34,974,404 | ) | (32,054,118 | ) | ||||||||
Net increase
(decrease) in net assets resulting from capital share transactions |
(326,938,806 | ) | 30,253,104 | (11,916,831 | ) | (13,335,803 | ) | |||||||||
Net increase
(decrease) in net assets |
(374,976,693 | ) | (200,996,939 | ) | 24,473,132 | (49,482,846 | ) | |||||||||
NET
ASSETS: |
||||||||||||||||
Beginning of
year or period |
759,425,417 | 960,422,356 | 191,731,584 | 241,214,430 | ||||||||||||
End of year or
period |
$ | 384,448,724 | $ | 759,425,417 | $ | 216,204,716 | $ | 191,731,584 | ||||||||
| Income (loss) from investment operations |
Less distributions | Ratios to average net assets |
Supplemental data |
|||||||||||||||||||||||||||||||||||||||||||||||||||||||||||||||||
|---|---|---|---|---|---|---|---|---|---|---|---|---|---|---|---|---|---|---|---|---|---|---|---|---|---|---|---|---|---|---|---|---|---|---|---|---|---|---|---|---|---|---|---|---|---|---|---|---|---|---|---|---|---|---|---|---|---|---|---|---|---|---|---|---|---|---|---|---|
| Year or period |
Net asset value, beginning of year or period |
Net investment income (loss) |
Net realized and unrealized gain (loss) |
Total from investment operations |
From net investment income |
From net realized gains |
From return of capital |
Total distributions |
Payment by affiliate |
Net asset value, end of year or period |
Total Return(1) | Expenses before reductions/ additions(2)(3)(4) |
Expenses net of fee waivers and/or recoupments if any(2)(3)(4) |
Expenses net of all reductions/ additions(2)(3)(4) |
Net investment income (loss)(2)(3) |
Net assets, end of year or period |
Portfolio turnover rate |
|||||||||||||||||||||||||||||||||||||||||||||||||||
| ended | ($) | ($) | ($) | ($) | ($) | ($) | ($) | ($) | ($) | ($) | (%) | (%) | (%) | (%) | (%) | ($000’s) | (%) | |||||||||||||||||||||||||||||||||||||||||||||||||||
Voya Government Liquid Assets
Portfolio
|
||||||||||||||||||||||||||||||||||||||||||||||||||||||||||||||||||||
Class I |
||||||||||||||||||||||||||||||||||||||||||||||||||||||||||||||||||||
12-31-19 |
1.00 | 0.02 | 0.00 | * | 0.02 | 0.02 | 0.00 | * | — | 0.02 | — | 1.00 | 2.01 | 0.29 | 0.29 | 0.29 | 1.93 | 52,515 | — | |||||||||||||||||||||||||||||||||||||||||||||||||
12-31-18 |
1.00 | 0.02 | 0.00 | * | 0.02 | 0.02 | 0.00 | * | — | 0.02 | — | 1.00 | 1.61 | 0.29 | 0.29 | 0.29 | 1.61 | 62,115 | — | |||||||||||||||||||||||||||||||||||||||||||||||||
12-31-17 |
1.00 | 0.01 | 0.00 | * | 0.01 | 0.01 | 0.00 | * | — | 0.01 | — | 1.00 | 0.66 | 0.29 | 0.29 | 0.29 | 0.62 | 50,773 | — | |||||||||||||||||||||||||||||||||||||||||||||||||
12-31-16 |
1.00 | 0.00 | * | 0.00 | * | 0.00 | * | 0.00 | * | 0.00 | * | — | 0.00 | * | — | 1.00 | 0.23 | 0.28 | 0.28 | 0.28 | 0.13 | 66,214 | — | |||||||||||||||||||||||||||||||||||||||||||||
12-31-15 |
1.00 | — | 0.00 | * | 0.00 | 0.00 | * | 0.00 | * | — | 0.00 | * | — | 1.00 | 0.01 | 0.28 | 0.22 | 0.22 | 0.00 | * | 81,636 | — | ||||||||||||||||||||||||||||||||||||||||||||||
Class S |
||||||||||||||||||||||||||||||||||||||||||||||||||||||||||||||||||||
12-31-19 |
1.00 | 0.02 | 0.00 | * | 0.02 | 0.02 | 0.00 | * | — | 0.02 | — | 1.00 | 1.75 | 0.54 | 0.54 | 0.54 | 1.68 | 314,786 | — | |||||||||||||||||||||||||||||||||||||||||||||||||
12-31-18 |
1.00 | 0.01 | 0.00 | * | 0.01 | 0.01 | 0.00 | * | — | 0.01 | — | 1.00 | 1.36 | 0.54 | 0.54 | 0.54 | 1.33 | 354,423 | — | |||||||||||||||||||||||||||||||||||||||||||||||||
12-31-17 |
1.00 | 0.00 | * | 0.00 | * | 0.00 | * | 0.00 | * | 0.00 | * | — | 0.00 | * | — | 1.00 | 0.41 | 0.54 | 0.54 | 0.54 | 0.37 | 372,943 | — | |||||||||||||||||||||||||||||||||||||||||||||
12-31-16 |
1.00 | — | 0.00 | * | 0.00 | 0.00 | * | 0.00 | * | — | 0.00 | * | — | 1.00 | 0.09 | 0.53 | 0.42 | 0.42 | 0.00 | * | 488,208 | — | ||||||||||||||||||||||||||||||||||||||||||||||
12-31-15 |
1.00 | — | 0.00 | * | 0.00 | — | 0.00 | * | — | 0.00 | * | — | 1.00 | 0.01 | 0.53 | 0.22 | 0.22 | (0.00 | )* | 552,706 | — | |||||||||||||||||||||||||||||||||||||||||||||||
Class S2 |
||||||||||||||||||||||||||||||||||||||||||||||||||||||||||||||||||||
12-31-19 |
1.00 | 0.02 | 0.00 | * | 0.02 | 0.02 | 0.00 | * | — | 0.02 | — | 1.00 | 1.60 | 0.69 | 0.69 | 0.69 | 1.52 | 359,294 | — | |||||||||||||||||||||||||||||||||||||||||||||||||
12-31-18 |
1.00 | 0.01 | 0.00 | * | 0.01 | 0.01 | 0.00 | * | — | 0.01 | — | 1.00 | 1.21 | 0.69 | 0.69 | 0.69 | 1.19 | 386,368 | — | |||||||||||||||||||||||||||||||||||||||||||||||||
12-31-17 |
1.00 | 0.00 | * | 0.00 | * | 0.00 | * | 0.00 | * | 0.00 | * | — | 0.00 | * | — | 1.00 | 0.28 | 0.69 | 0.67 | 0.67 | 0.25 | 358,525 | — | |||||||||||||||||||||||||||||||||||||||||||||
12-31-16 |
1.00 | — | 0.00 | * | 0.00 | — | 0.00 | * | — | 0.00 | * | — | 1.00 | 0.09 | 0.71 | 0.42 | 0.42 | (0.00 | )* | 416,495 | — | |||||||||||||||||||||||||||||||||||||||||||||||
12-31-15 |
1.00 | — | 0.00 | * | 0.00 | — | 0.00 | * | — | 0.00 | * | — | 1.00 | 0.01 | 0.78 | 0.22 | 0.22 | (0.00 | )* | 348,078 | — | |||||||||||||||||||||||||||||||||||||||||||||||
VY® Clarion Global Real
Estate Portfolio
|
||||||||||||||||||||||||||||||||||||||||||||||||||||||||||||||||||||
Class ADV |
||||||||||||||||||||||||||||||||||||||||||||||||||||||||||||||||||||
12-31-19 |
10.53 | 0.17 | • | 2.34 | 2.51 | 0.27 | — | — | 0.27 | — | 12.77 | 23.99 | 1.62 | 1.49 | 1.49 | 1.40 | 17,308 | 77 | ||||||||||||||||||||||||||||||||||||||||||||||||||
12-31-18 |
12.17 | 0.18 | • | (1.24 | ) | (1.06 | ) | 0.58 | — | — | 0.58 | — | 10.53 | (9.10 | ) | 1.62 | 1.49 | 1.49 | 1.54 | 16,608 | 107 | |||||||||||||||||||||||||||||||||||||||||||||||
12-31-17 |
11.41 | 0.19 | • | 0.95 | 1.14 | 0.38 | — | — | 0.38 | — | 12.17 | 10.20 | 1.57 | 1.49 | 1.49 | 1.63 | 22,826 | 90 | ||||||||||||||||||||||||||||||||||||||||||||||||||
12-31-16 |
11.47 | 0.16 | (0.13 | ) | 0.03 | 0.09 | — | — | 0.09 | — | 11.41 | 0.23 | 1.61 | 1.49 | 1.49 | 1.33 | 25,983 | 49 | ||||||||||||||||||||||||||||||||||||||||||||||||||
12-31-15 |
12.04 | 0.11 | • | (0.35 | ) | (0.24 | ) | 0.33 | — | — | 0.33 | — | 11.47 | (1.99 | ) | 1.72 | 1.49 | 1.49 | 0.95 | 27,513 | 50 | |||||||||||||||||||||||||||||||||||||||||||||||
Class I |
||||||||||||||||||||||||||||||||||||||||||||||||||||||||||||||||||||
12-31-19 |
10.81 | 0.25 | • | 2.41 | 2.66 | 0.36 | — | — | 0.36 | — | 13.11 | 24.74 | 1.02 | 0.89 | 0.89 | 2.02 | 119,642 | 77 | ||||||||||||||||||||||||||||||||||||||||||||||||||
12-31-18 |
12.49 | 0.25 | • | (1.27 | ) | (1.02 | ) | 0.66 | — | — | 0.66 | — | 10.81 | (8.52 | ) | 1.02 | 0.89 | 0.89 | 2.14 | 103,029 | 107 | |||||||||||||||||||||||||||||||||||||||||||||||
12-31-17 |
11.72 | 0.27 | • | 0.96 | 1.23 | 0.46 | — | — | 0.46 | — | 12.49 | 10.77 | 0.97 | 0.89 | 0.89 | 2.28 | 183,921 | 90 | ||||||||||||||||||||||||||||||||||||||||||||||||||
12-31-16 |
11.77 | 0.22 | (0.10 | ) | 0.12 | 0.17 | — | — | 0.17 | — | 11.72 | 0.89 | 0.96 | 0.89 | 0.89 | 1.94 | 183,084 | 49 | ||||||||||||||||||||||||||||||||||||||||||||||||||
12-31-15 |
12.34 | 0.18 | (0.35 | ) | (0.17 | ) | 0.40 | — | — | 0.40 | — | 11.77 | (1.42 | ) | 0.97 | 0.89 | 0.89 | 1.55 | 165,604 | 50 | ||||||||||||||||||||||||||||||||||||||||||||||||
Class S |
||||||||||||||||||||||||||||||||||||||||||||||||||||||||||||||||||||
12-31-19 |
10.76 | 0.22 | • | 2.39 | 2.61 | 0.33 | — | — | 0.33 | — | 13.04 | 24.35 | 1.27 | 1.14 | 1.14 | 1.76 | 96,519 | 77 | ||||||||||||||||||||||||||||||||||||||||||||||||||
12-31-18 |
12.43 | 0.22 | • | (1.26 | ) | (1.04 | ) | 0.63 | — | — | 0.63 | — | 10.76 | (8.74 | ) | 1.27 | 1.14 | 1.14 | 1.91 | 90,159 | 107 | |||||||||||||||||||||||||||||||||||||||||||||||
12-31-17 |
11.66 | 0.24 | • | 0.96 | 1.20 | 0.43 | — | — | 0.43 | — | 12.43 | 10.50 | 1.22 | 1.14 | 1.14 | 2.00 | 113,281 | 90 | ||||||||||||||||||||||||||||||||||||||||||||||||||
12-31-16 |
11.71 | 0.20 | • | (0.12 | ) | 0.08 | 0.13 | — | — | 0.13 | — | 11.66 | 0.62 | 1.21 | 1.14 | 1.14 | 1.67 | 123,103 | 49 | |||||||||||||||||||||||||||||||||||||||||||||||||
12-31-15 |
12.28 | 0.15 | • | (0.36 | ) | (0.21 | ) | 0.36 | — | — | 0.36 | — | 11.71 | (1.69 | ) | 1.22 | 1.14 | 1.14 | 1.27 | 141,067 | 50 | |||||||||||||||||||||||||||||||||||||||||||||||
Class S2 |
||||||||||||||||||||||||||||||||||||||||||||||||||||||||||||||||||||
12-31-19 |
10.85 | 0.20 | • | 2.41 | 2.61 | 0.31 | — | — | 0.31 | — | 13.15 | 24.15 | 1.42 | 1.29 | 1.29 | 1.61 | 906 | 77 | ||||||||||||||||||||||||||||||||||||||||||||||||||
12-31-18 |
12.52 | 0.21 | • | (1.27 | ) | (1.06 | ) | 0.61 | — | — | 0.61 | — | 10.85 | (8.84 | ) | 1.42 | 1.29 | 1.29 | 1.76 | 850 | 107 | |||||||||||||||||||||||||||||||||||||||||||||||
12-31-17 |
11.73 | 0.22 | • | 0.98 | 1.20 | 0.41 | — | — | 0.41 | — | 12.52 | 10.42 | 1.37 | 1.29 | 1.29 | 1.87 | 1,048 | 90 | ||||||||||||||||||||||||||||||||||||||||||||||||||
12-31-16 |
11.78 | 0.18 | • | (0.12 | ) | 0.06 | 0.11 | — | — | 0.11 | — | 11.73 | 0.44 | 1.39 | 1.29 | 1.29 | 1.52 | 1,117 | 49 | |||||||||||||||||||||||||||||||||||||||||||||||||
12-31-15 |
12.34 | 0.14 | • | (0.36 | ) | (0.22 | ) | 0.34 | — | — | 0.34 | — | 11.78 | (1.84 | ) | 1.47 | 1.29 | 1.29 | 1.11 | 1,343 | 50 | |||||||||||||||||||||||||||||||||||||||||||||||
VY® Invesco Growth and
Income Portfolio
|
||||||||||||||||||||||||||||||||||||||||||||||||||||||||||||||||||||
Class ADV |
||||||||||||||||||||||||||||||||||||||||||||||||||||||||||||||||||||
12-31-19 |
21.15 | 0.32 | • | 4.64 | 4.96 | 0.50 | 2.88 | — | 3.38 | — | 22.73 | 24.30 | 1.24 | 1.24 | 1.24 | 1.43 | 18,401 | 22 | ||||||||||||||||||||||||||||||||||||||||||||||||||
12-31-18 |
27.94 | 0.32 | • | (3.71 | ) | (3.39 | ) | 0.30 | 3.10 | — | 3.40 | — | 21.15 | (13.88 | ) | 1.24 | 1.24 | 1.24 | 1.22 | 16,868 | 31 | |||||||||||||||||||||||||||||||||||||||||||||||
12-31-17 |
26.55 | 0.38 | • | 3.04 | 3.42 | 0.51 | 1.52 | — | 2.03 | — | 27.94 | 13.46 | 1.24 | 1.24 | 1.24 | 1.43 | 22,246 | 17 | ||||||||||||||||||||||||||||||||||||||||||||||||||
12-31-16 |
25.48 | 0.30 | • | 4.19 | 4.49 | 0.52 | 2.90 | — | 3.42 | — | 26.55 | 19.52 | 1.29 | 1.24 | 1.24 | 1.21 | 18,641 | 23 | ||||||||||||||||||||||||||||||||||||||||||||||||||
12-31-15 |
31.49 | 0.30 | • | (0.98 | ) | (0.68 | ) | 0.93 | 4.40 | — | 5.33 | — | 25.48 | (3.26 | ) | 1.39 | 1.24 | 1.24 | 1.05 | 15,551 | 19 | |||||||||||||||||||||||||||||||||||||||||||||||
| Income (loss) from investment operations |
Less distributions | Ratios to average net assets |
Supplemental data |
|||||||||||||||||||||||||||||||||||||||||||||||||||||||||||||||||
|---|---|---|---|---|---|---|---|---|---|---|---|---|---|---|---|---|---|---|---|---|---|---|---|---|---|---|---|---|---|---|---|---|---|---|---|---|---|---|---|---|---|---|---|---|---|---|---|---|---|---|---|---|---|---|---|---|---|---|---|---|---|---|---|---|---|---|---|---|
| Year or period |
Net asset value, beginning of year or period |
Net investment income (loss) |
Net realized and unrealized gain (loss) |
Total from investment operations |
From net investment income |
From net realized gains |
From return of capital |
Total distributions |
Payment by affiliate |
Net asset value, end of year or period |
Total Return(1) | Expenses before reductions/ additions(2)(3)(4) |
Expenses net of fee waivers and/or recoupments if any(2)(3)(4) |
Expenses net of all reductions/ additions(2)(3)(4) |
Net investment income (loss)(2)(3) |
Net assets, end of year or period |
Portfolio turnover rate |
|||||||||||||||||||||||||||||||||||||||||||||||||||
| ended | ($) | ($) | ($) | ($) | ($) | ($) | ($) | ($) | ($) | ($) | (%) | (%) | (%) | (%) | (%) | ($000’s) | (%) | |||||||||||||||||||||||||||||||||||||||||||||||||||
VY® Invesco Growth
and Income Portfolio (continued) |
||||||||||||||||||||||||||||||||||||||||||||||||||||||||||||||||||||
Class I |
||||||||||||||||||||||||||||||||||||||||||||||||||||||||||||||||||||
12-31-19 |
21.41 | 0.46 | • | 4.69 | 5.15 | 0.67 | 2.88 | — | 3.55 | — | 23.01 | 24.98 | 0.64 | 0.64 | 0.64 | 2.02 | 29,773 | 22 | ||||||||||||||||||||||||||||||||||||||||||||||||||
12-31-18 |
28.23 | 0.48 | • | (3.73 | ) | (3.25 | ) | 0.47 | 3.10 | — | 3.57 | — | 21.41 | (13.31 | ) | 0.64 | 0.64 | 0.64 | 1.82 | 27,943 | 31 | |||||||||||||||||||||||||||||||||||||||||||||||
12-31-17 |
26.77 | 0.55 | • | 3.07 | 3.62 | 0.64 | 1.52 | — | 2.16 | — | 28.23 | 14.13 | 0.64 | 0.64 | 0.64 | 2.02 | 33,894 | 17 | ||||||||||||||||||||||||||||||||||||||||||||||||||
12-31-16 |
25.68 | 0.45 | • | 4.23 | 4.68 | 0.69 | 2.90 | — | 3.59 | — | 26.77 | 20.23 | 0.64 | 0.64 | 0.64 | 1.81 | 28,117 | 23 | ||||||||||||||||||||||||||||||||||||||||||||||||||
12-31-15 |
31.71 | 0.47 | • | (0.98 | ) | (0.51 | ) | 1.12 | 4.40 | — | 5.52 | — | 25.68 | (2.69 | ) | 0.64 | 0.64 | 0.64 | 1.63 | 23,008 | 19 | |||||||||||||||||||||||||||||||||||||||||||||||
Class S |
||||||||||||||||||||||||||||||||||||||||||||||||||||||||||||||||||||
12-31-19 |
21.58 | 0.41 | • | 4.73 | 5.14 | 0.59 | 2.88 | — | 3.47 | — | 23.25 | 24.73 | 0.89 | 0.89 | 0.89 | 1.78 | 367,941 | 22 | ||||||||||||||||||||||||||||||||||||||||||||||||||
12-31-18 |
28.43 | 0.42 | • | (3.78 | ) | (3.36 | ) | 0.39 | 3.10 | — | 3.49 | — | 21.58 | (13.58 | ) | 0.89 | 0.89 | 0.89 | 1.56 | 350,968 | 31 | |||||||||||||||||||||||||||||||||||||||||||||||
12-31-17 |
26.94 | 0.48 | • | 3.10 | 3.58 | 0.57 | 1.52 | — | 2.09 | — | 28.43 | 13.89 | 0.89 | 0.89 | 0.89 | 1.76 | 476,317 | 17 | ||||||||||||||||||||||||||||||||||||||||||||||||||
12-31-16 |
25.81 | 0.41 | 4.23 | 4.64 | 0.61 | 2.90 | — | 3.51 | — | 26.94 | 19.92 | 0.89 | 0.89 | 0.89 | 1.56 | 507,524 | 23 | |||||||||||||||||||||||||||||||||||||||||||||||||||
12-31-15 |
31.83 | 0.40 | • | (0.99 | ) | (0.59 | ) | 1.03 | 4.40 | — | 5.43 | — | 25.81 | (2.93 | ) | 0.89 | 0.89 | 0.89 | 1.39 | 451,452 | 19 | |||||||||||||||||||||||||||||||||||||||||||||||
Class S2 |
||||||||||||||||||||||||||||||||||||||||||||||||||||||||||||||||||||
12-31-19 |
21.39 | 0.37 | • | 4.67 | 5.04 | 0.55 | 2.88 | — | 3.43 | — | 23.00 | 24.47 | 1.04 | 1.04 | 1.04 | 1.63 | 27,277 | 22 | ||||||||||||||||||||||||||||||||||||||||||||||||||
12-31-18 |
28.19 | 0.37 | • | (3.73 | ) | (3.36 | ) | 0.34 | 3.10 | — | 3.44 | — | 21.39 | (13.67 | ) | 1.04 | 1.04 | 1.04 | 1.41 | 25,812 | 31 | |||||||||||||||||||||||||||||||||||||||||||||||
12-31-17 |
26.73 | 0.44 | • | 3.06 | 3.50 | 0.52 | 1.52 | — | 2.04 | — | 28.19 | 13.67 | 1.04 | 1.04 | 1.04 | 1.62 | 33,409 | 17 | ||||||||||||||||||||||||||||||||||||||||||||||||||
12-31-16 |
25.62 | 0.35 | • | 4.23 | 4.58 | 0.57 | 2.90 | — | 3.47 | — | 26.73 | 19.80 | 1.07 | 1.04 | 1.04 | 1.41 | 38,721 | 23 | ||||||||||||||||||||||||||||||||||||||||||||||||||
12-31-15 |
31.63 | 0.36 | • | (0.99 | ) | (0.63 | ) | 0.98 | 4.40 | — | 5.38 | — | 25.62 | (3.10 | ) | 1.14 | 1.04 | 1.04 | 1.24 | 38,764 | 19 | |||||||||||||||||||||||||||||||||||||||||||||||
VY® JPMorgan Emerging
Markets Equity Portfolio
|
||||||||||||||||||||||||||||||||||||||||||||||||||||||||||||||||||||
Class ADV |
||||||||||||||||||||||||||||||||||||||||||||||||||||||||||||||||||||
12-31-19 |
16.95 | 0.01 | 5.24 | 5.25 | — | 1.18 | — | 1.18 | — | 21.02 | 31.47 | 1.86 | 1.86 | 1.86 | 0.03 | 50,224 | 21 | |||||||||||||||||||||||||||||||||||||||||||||||||||
12-31-18 |
20.52 | (0.01 | ) | (3.49 | ) | (3.50 | ) | 0.07 | — | — | 0.07 | — | 16.95 | (17.12 | ) | 1.86 | 1.86 | 1.86 | (0.07 | ) | 40,881 | 21 | ||||||||||||||||||||||||||||||||||||||||||||||
12-31-17 |
14.43 | (0.05 | ) | 6.19 | 6.14 | 0.05 | — | — | 0.05 | — | 20.52 | 42.55 | 1.86 | 1.86 | 1.86 | (0.24 | ) | 57,093 | 26 | |||||||||||||||||||||||||||||||||||||||||||||||||
12-31-16 |
12.92 | 0.02 | • | 1.61 | 1.63 | 0.12 | — | — | 0.12 | — | 14.43 | 12.62 | 1.90 | 1.85 | 1.85 | 0.12 | 35,873 | 24 | ||||||||||||||||||||||||||||||||||||||||||||||||||
12-31-15 |
16.63 | 0.07 | (2.56 | ) | (2.49 | ) | 0.14 | 1.08 | — | 1.22 | — | 12.92 | (16.07 | )(a) | 2.01 | 1.86 | 1.86 | 0.45 | 34,072 | 15 | ||||||||||||||||||||||||||||||||||||||||||||||||
Class I |
||||||||||||||||||||||||||||||||||||||||||||||||||||||||||||||||||||
12-31-19 |
17.80 | 0.13 | 5.52 | 5.65 | 0.03 | 1.18 | — | 1.21 | — | 22.24 | 32.23 | 1.26 | 1.26 | 1.26 | 0.62 | 79,674 | 21 | |||||||||||||||||||||||||||||||||||||||||||||||||||
12-31-18 |
21.52 | 0.12 | (3.67 | ) | (3.55 | ) | 0.17 | — | — | 0.17 | — | 17.80 | (16.58 | ) | 1.26 | 1.26 | 1.26 | 0.53 | 61,663 | 21 | ||||||||||||||||||||||||||||||||||||||||||||||||
12-31-17 |
15.10 | 0.08 | 6.47 | 6.55 | 0.13 | — | — | 0.13 | — | 21.52 | 43.45 | 1.26 | 1.26 | 1.26 | 0.34 | 82,567 | 26 | |||||||||||||||||||||||||||||||||||||||||||||||||||
12-31-16 |
13.52 | 0.10 | • | 1.70 | 1.80 | 0.22 | — | — | 0.22 | — | 15.10 | 13.27 | 1.25 | 1.25 | 1.25 | 0.71 | 63,276 | 24 | ||||||||||||||||||||||||||||||||||||||||||||||||||
12-31-15 |
17.36 | 0.17 | (2.68 | ) | (2.51 | ) | 0.25 | 1.08 | — | 1.33 | — | 13.52 | (15.57 | )(a) | 1.26 | 1.26 | 1.26 | 1.05 | 58,250 | 15 | ||||||||||||||||||||||||||||||||||||||||||||||||
Class S |
||||||||||||||||||||||||||||||||||||||||||||||||||||||||||||||||||||
12-31-19 |
17.70 | 0.08 | 5.48 | 5.56 | 0.00 | * | 1.18 | — | 1.18 | — | 22.08 | 31.91 | 1.51 | 1.51 | 1.51 | 0.38 | 370,441 | 21 | ||||||||||||||||||||||||||||||||||||||||||||||||||
12-31-18 |
21.40 | 0.05 | • | (3.63 | ) | (3.58 | ) | 0.12 | — | — | 0.12 | — | 17.70 | (16.81 | ) | 1.51 | 1.51 | 1.51 | 0.27 | 319,682 | 21 | |||||||||||||||||||||||||||||||||||||||||||||||
12-31-17 |
15.02 | 0.03 | 6.44 | 6.47 | 0.09 | — | — | 0.09 | — | 21.40 | 43.11 | 1.51 | 1.51 | 1.51 | 0.11 | 454,764 | 26 | |||||||||||||||||||||||||||||||||||||||||||||||||||
12-31-16 |
13.45 | 0.07 | • | 1.67 | 1.74 | 0.17 | — | — | 0.17 | — | 15.02 | 12.95 | 1.50 | 1.50 | 1.50 | 0.47 | 362,865 | 24 | ||||||||||||||||||||||||||||||||||||||||||||||||||
12-31-15 |
17.26 | 0.13 | • | (2.66 | ) | (2.53 | ) | 0.20 | 1.08 | — | 1.28 | — | 13.45 | (15.75 | )(a) | 1.51 | 1.51 | 1.51 | 0.81 | 367,861 | 15 | |||||||||||||||||||||||||||||||||||||||||||||||
Class S2 |
||||||||||||||||||||||||||||||||||||||||||||||||||||||||||||||||||||
12-31-19 |
17.52 | 0.05 | 5.41 | 5.46 | — | 1.18 | — | 1.18 | — | 21.80 | 31.64 | 1.66 | 1.66 | 1.66 | 0.24 | 11,567 | 21 | |||||||||||||||||||||||||||||||||||||||||||||||||||
12-31-18 |
21.17 | 0.04 | (3.61 | ) | (3.57 | ) | 0.08 | — | — | 0.08 | — | 17.52 | (16.92 | ) | 1.66 | 1.66 | 1.66 | 0.12 | 10,587 | 21 | ||||||||||||||||||||||||||||||||||||||||||||||||
12-31-17 |
14.86 | (0.01 | )• | 6.37 | 6.36 | 0.05 | — | — | 0.05 | — | 21.17 | 42.85 | 1.66 | 1.66 | 1.66 | (0.03 | ) | 15,050 | 26 | |||||||||||||||||||||||||||||||||||||||||||||||||
12-31-16 |
13.30 | 0.05 | • | 1.65 | 1.70 | 0.14 | — | — | 0.14 | — | 14.86 | 12.79 | 1.68 | 1.65 | 1.65 | 0.32 | 14,570 | 24 | ||||||||||||||||||||||||||||||||||||||||||||||||||
12-31-15 |
17.08 | 0.10 | • | (2.64 | ) | (2.54 | ) | 0.16 | 1.08 | — | 1.24 | — | 13.30 | (15.91 | )(a) | 1.76 | 1.66 | 1.66 | 0.65 | 16,530 | 15 | |||||||||||||||||||||||||||||||||||||||||||||||
VY® Morgan Stanley
Global Franchise Portfolio
|
||||||||||||||||||||||||||||||||||||||||||||||||||||||||||||||||||||
Class ADV |
||||||||||||||||||||||||||||||||||||||||||||||||||||||||||||||||||||
12-31-19 |
14.01 | 0.06 | 3.89 | 3.95 | 0.10 | 1.80 | — | 1.90 | — | 16.06 | 28.89 | 1.57 | 1.54 | 1.54 | 0.48 | 110,093 | 16 | |||||||||||||||||||||||||||||||||||||||||||||||||||
12-31-18 |
16.98 | 0.07 | (0.23 | ) | (0.16 | ) | 0.14 | 2.67 | — | 2.81 | — | 14.01 | (2.07 | ) | 1.57 | 1.54 | 1.54 | 0.47 | 78,112 | 27 | ||||||||||||||||||||||||||||||||||||||||||||||||
12-31-17 |
14.58 | 0.10 | 3.53 | 3.63 | 0.17 | 1.06 | — | 1.23 | — | 16.98 | 25.47 | 1.57 | 1.55 | 1.55 | 0.60 | 83,492 | 29 | |||||||||||||||||||||||||||||||||||||||||||||||||||
12-31-16 |
15.29 | 0.13 | • | 0.68 | 0.81 | 0.17 | 1.35 | — | 1.52 | — | 14.58 | 4.94 | 1.61 | 1.54 | 1.54 | 0.83 | 68,606 | 26 | ||||||||||||||||||||||||||||||||||||||||||||||||||
12-31-15 |
16.56 | 0.15 | 0.87 | 1.02 | 0.28 | 2.01 | — | 2.29 | — | 15.29 | 5.95 | 1.71 | 1.55 | 1.55 | 0.90 | 56,395 | 27 | |||||||||||||||||||||||||||||||||||||||||||||||||||
| Income (loss) from investment operations |
Less distributions | Ratios to average net assets |
Supplemental data |
|||||||||||||||||||||||||||||||||||||||||||||||||||||||||||||||||
|---|---|---|---|---|---|---|---|---|---|---|---|---|---|---|---|---|---|---|---|---|---|---|---|---|---|---|---|---|---|---|---|---|---|---|---|---|---|---|---|---|---|---|---|---|---|---|---|---|---|---|---|---|---|---|---|---|---|---|---|---|---|---|---|---|---|---|---|---|
| Year or period |
Net asset value, beginning of year or period |
Net investment income (loss) |
Net realized and unrealized gain (loss) |
Total from investment operations |
From net investment income |
From net realized gains |
From return of capital |
Total distributions |
Payment by affiliate |
Net asset value, end of year or period |
Total Return(1) | Expenses before reductions/ additions(2)(3)(4) |
Expenses net of fee waivers and/or recoupments if any(2)(3)(4) |
Expenses net of all reductions/ additions(2)(3)(4) |
Net investment income (loss)(2)(3) |
Net assets, end of year or period |
Portfolio turnover rate |
|||||||||||||||||||||||||||||||||||||||||||||||||||
| ended | ($) | ($) | ($) | ($) | ($) | ($) | ($) | ($) | ($) | ($) | (%) | (%) | (%) | (%) | (%) | ($000’s) | (%) | |||||||||||||||||||||||||||||||||||||||||||||||||||
VY® Morgan Stanley Global Franchise
Portfolio (continued)
|
||||||||||||||||||||||||||||||||||||||||||||||||||||||||||||||||||||
Class R6 |
||||||||||||||||||||||||||||||||||||||||||||||||||||||||||||||||||||
12-31-19 |
14.97 | 0.18 | • | 4.17 | 4.35 | 0.19 | 1.80 | — | 1.99 | — | 17.33 | 29.74 | 0.97 | 0.94 | 0.94 | 1.07 | 635 | 16 | ||||||||||||||||||||||||||||||||||||||||||||||||||
12-31-18 |
17.96 | 0.19 | • | (0.27 | ) | (0.08 | ) | 0.24 | 2.67 | — | 2.91 | — | 14.97 | (1.51 | ) | 0.97 | 0.94 | 0.94 | 1.14 | 84 | 27 | |||||||||||||||||||||||||||||||||||||||||||||||
12-31-17 |
15.35 | 0.21 | • | 3.71 | 3.92 | 0.25 | 1.06 | — | 1.31 | — | 17.96 | 26.16 | 0.97 | 0.95 | 0.95 | 1.21 | 44 | 29 | ||||||||||||||||||||||||||||||||||||||||||||||||||
05-03-16(5) – 12-31-16 |
16.66 | 0.22 | • | 0.07 | 0.29 | 0.25 | 1.35 | — | 1.60 | — | 15.35 | 1.46 | 0.96 | 0.94 | 0.94 | 1.48 | 49 | 26 | ||||||||||||||||||||||||||||||||||||||||||||||||||
Class S |
||||||||||||||||||||||||||||||||||||||||||||||||||||||||||||||||||||
12-31-19 |
15.00 | 0.14 | • | 4.16 | 4.30 | 0.14 | 1.80 | — | 1.94 | — | 17.36 | 29.34 | 1.22 | 1.19 | 1.19 | 0.82 | 266,633 | 16 | ||||||||||||||||||||||||||||||||||||||||||||||||||
12-31-18 |
17.97 | 0.14 | • | (0.25 | ) | (0.11 | ) | 0.19 | 2.67 | — | 2.86 | — | 15.00 | (1.69 | ) | 1.22 | 1.19 | 1.19 | 0.81 | 243,512 | 27 | |||||||||||||||||||||||||||||||||||||||||||||||
12-31-17 |
15.36 | 0.16 | • | 3.71 | 3.87 | 0.20 | 1.06 | — | 1.26 | — | 17.97 | 25.81 | 1.22 | 1.20 | 1.20 | 0.95 | 282,442 | 29 | ||||||||||||||||||||||||||||||||||||||||||||||||||
12-31-16 |
16.02 | 0.20 | 0.70 | 0.90 | 0.21 | 1.35 | — | 1.56 | — | 15.36 | 5.30 | 1.21 | 1.19 | 1.19 | 1.20 | 299,965 | 26 | |||||||||||||||||||||||||||||||||||||||||||||||||||
12-31-15 |
17.23 | 0.21 | • | 0.92 | 1.13 | 0.33 | 2.01 | — | 2.34 | — | 16.02 | 6.36 | 1.21 | 1.20 | 1.20 | 1.26 | 319,681 | 27 | ||||||||||||||||||||||||||||||||||||||||||||||||||
Class S2 |
||||||||||||||||||||||||||||||||||||||||||||||||||||||||||||||||||||
12-31-19 |
14.86 | 0.11 | • | 4.13 | 4.24 | 0.12 | 1.80 | — | 1.92 | — | 17.18 | 29.15 | 1.37 | 1.34 | 1.34 | 0.67 | 38,888 | 16 | ||||||||||||||||||||||||||||||||||||||||||||||||||
12-31-18 |
17.83 | 0.12 | (0.26 | ) | (0.14 | ) | 0.16 | 2.67 | — | 2.83 | — | 14.86 | (1.89 | ) | 1.37 | 1.34 | 1.34 | 0.66 | 35,431 | 27 | ||||||||||||||||||||||||||||||||||||||||||||||||
12-31-17 |
15.24 | 0.14 | • | 3.69 | 3.83 | 0.18 | 1.06 | — | 1.24 | — | 17.83 | 25.69 | 1.37 | 1.35 | 1.35 | 0.80 | 41,831 | 29 | ||||||||||||||||||||||||||||||||||||||||||||||||||
12-31-16 |
15.90 | 0.17 | • | 0.70 | 0.87 | 0.18 | 1.35 | — | 1.53 | — | 15.24 | 5.16 | 1.39 | 1.34 | 1.34 | 1.05 | 44,381 | 26 | ||||||||||||||||||||||||||||||||||||||||||||||||||
12-31-15 |
17.12 | 0.19 | • | 0.90 | 1.09 | 0.30 | 2.01 | — | 2.31 | — | 15.90 | 6.17 | 1.46 | 1.35 | 1.35 | 1.11 | 50,093 | 27 | ||||||||||||||||||||||||||||||||||||||||||||||||||
VY® T. Rowe Price Capital Appreciation
Portfolio
|
||||||||||||||||||||||||||||||||||||||||||||||||||||||||||||||||||||
Class ADV |
||||||||||||||||||||||||||||||||||||||||||||||||||||||||||||||||||||
12-31-19 |
24.10 | 0.25 | 5.46 | 5.71 | 0.34 | 1.49 | — | 1.83 | — | 27.98 | 23.99 | 1.24 | 1.24 | 1.24 | 1.02 | 1,353,246 | 53 | |||||||||||||||||||||||||||||||||||||||||||||||||||
12-31-18 |
26.53 | 0.48 | (0.36 | ) | 0.12 | 0.50 | 2.05 | — | 2.55 | — | 24.10 | 0.10 | 1.24 | 1.24 | 1.24 | 1.94 | 990,787 | 75 | ||||||||||||||||||||||||||||||||||||||||||||||||||
12-31-17 |
24.54 | 0.19 | 3.36 | 3.55 | 0.25 | 1.31 | — | 1.56 | — | 26.53 | 14.72 | 1.24 | 1.24 | 1.24 | 0.78 | 954,071 | 61 | |||||||||||||||||||||||||||||||||||||||||||||||||||
12-31-16 |
25.27 | 0.24 | • | 1.68 | 1.92 | 0.28 | 2.37 | — | 2.65 | — | 24.54 | 7.65 | 1.29 | 1.24 | 1.24 | 0.97 | 778,133 | 69 | ||||||||||||||||||||||||||||||||||||||||||||||||||
12-31-15 |
28.02 | 0.24 | • | 1.14 | 1.38 | 0.28 | 3.85 | — | 4.13 | — | 25.27 | 4.85 | 1.39 | 1.24 | 1.24 | 0.89 | 596,730 | 67 | ||||||||||||||||||||||||||||||||||||||||||||||||||
Class I |
||||||||||||||||||||||||||||||||||||||||||||||||||||||||||||||||||||
12-31-19 |
25.23 | 0.43 | 5.73 | 6.16 | 0.49 | 1.49 | — | 1.98 | — | 29.41 | 24.71 | 0.64 | 0.64 | 0.64 | 1.62 | 1,673,642 | 53 | |||||||||||||||||||||||||||||||||||||||||||||||||||
12-31-18 |
27.64 | 0.67 | (0.38 | ) | 0.29 | 0.65 | 2.05 | — | 2.70 | — | 25.23 | 0.74 | 0.64 | 0.64 | 0.64 | 2.57 | 1,245,366 | 75 | ||||||||||||||||||||||||||||||||||||||||||||||||||
12-31-17 |
25.49 | 0.36 | 3.50 | 3.86 | 0.40 | 1.31 | — | 1.71 | — | 27.64 | 15.39 | 0.64 | 0.64 | 0.64 | 1.38 | 1,217,289 | 61 | |||||||||||||||||||||||||||||||||||||||||||||||||||
12-31-16 |
26.12 | 0.40 | 1.75 | 2.15 | 0.41 | 2.37 | — | 2.78 | — | 25.49 | 8.31 | 0.64 | 0.64 | 0.64 | 1.55 | 1,084,776 | 69 | |||||||||||||||||||||||||||||||||||||||||||||||||||
12-31-15 |
28.80 | 0.40 | 1.18 | 1.58 | 0.41 | 3.85 | — | 4.26 | — | 26.12 | 5.47 | 0.64 | 0.64 | 0.64 | 1.48 | 1,027,480 | 67 | |||||||||||||||||||||||||||||||||||||||||||||||||||
Class R6 |
||||||||||||||||||||||||||||||||||||||||||||||||||||||||||||||||||||
12-31-19 |
25.24 | 0.46 | • | 5.71 | 6.17 | 0.49 | 1.49 | — | 1.98 | — | 29.43 | 24.74 | 0.64 | 0.64 | 0.64 | 1.62 | 181,835 | 53 | ||||||||||||||||||||||||||||||||||||||||||||||||||
12-31-18 |
27.66 | 0.70 | • | (0.42 | ) | 0.28 | 0.65 | 2.05 | — | 2.70 | — | 25.24 | 0.70 | 0.64 | 0.64 | 0.64 | 2.57 | 94,159 | 75 | |||||||||||||||||||||||||||||||||||||||||||||||||
12-31-17 |
25.49 | 0.38 | • | 3.50 | 3.88 | 0.40 | 1.31 | — | 1.71 | — | 27.66 | 15.47 | 0.64 | 0.64 | 0.64 | 1.38 | 59,752 | 61 | ||||||||||||||||||||||||||||||||||||||||||||||||||
05-03-16(5) – 12-31-16 |
27.00 | 0.48 | • | 0.79 | 1.27 | 0.41 | 2.37 | — | 2.78 | — | 25.49 | 4.78 | 0.64 | 0.64 | 0.64 | 1.91 | 8,696 | 69 | ||||||||||||||||||||||||||||||||||||||||||||||||||
Class S |
||||||||||||||||||||||||||||||||||||||||||||||||||||||||||||||||||||
12-31-19 |
25.25 | 0.39 | • | 5.69 | 6.08 | 0.42 | 1.49 | — | 1.91 | — | 29.42 | 24.36 | 0.89 | 0.89 | 0.89 | 1.37 | 4,163,308 | 53 | ||||||||||||||||||||||||||||||||||||||||||||||||||
12-31-18 |
27.65 | 0.63 | • | (0.40 | ) | 0.23 | 0.58 | 2.05 | — | 2.63 | — | 25.25 | 0.51 | 0.89 | 0.89 | 0.89 | 2.29 | 3,640,431 | 75 | |||||||||||||||||||||||||||||||||||||||||||||||||
12-31-17 |
25.50 | 0.31 | • | 3.48 | 3.79 | 0.33 | 1.31 | — | 1.64 | — | 27.65 | 15.10 | 0.89 | 0.89 | 0.89 | 1.13 | 4,050,729 | 61 | ||||||||||||||||||||||||||||||||||||||||||||||||||
12-31-16 |
26.13 | 0.34 | 1.74 | 2.08 | 0.34 | 2.37 | — | 2.71 | — | 25.50 | 8.05 | 0.89 | 0.89 | 0.89 | 1.30 | 4,074,922 | 69 | |||||||||||||||||||||||||||||||||||||||||||||||||||
12-31-15 |
28.82 | 0.33 | 1.18 | 1.51 | 0.35 | 3.85 | — | 4.20 | — | 26.13 | 5.18 | 0.89 | 0.89 | 0.89 | 1.23 | 4,044,261 | 67 | |||||||||||||||||||||||||||||||||||||||||||||||||||
Class S2 |
||||||||||||||||||||||||||||||||||||||||||||||||||||||||||||||||||||
12-31-19 |
25.06 | 0.34 | • | 5.65 | 5.99 | 0.37 | 1.49 | — | 1.86 | — | 29.19 | 24.19 | 1.04 | 1.04 | 1.04 | 1.22 | 73,222 | 53 | ||||||||||||||||||||||||||||||||||||||||||||||||||
12-31-18 |
27.47 | 0.58 | • | (0.40 | ) | 0.18 | 0.54 | 2.05 | — | 2.59 | — | 25.06 | 0.33 | 1.04 | 1.04 | 1.04 | 2.13 | 68,741 | 75 | |||||||||||||||||||||||||||||||||||||||||||||||||
12-31-17 |
25.33 | 0.26 | • | 3.47 | 3.73 | 0.28 | 1.31 | — | 1.59 | — | 27.47 | 14.96 | 1.04 | 1.04 | 1.04 | 0.98 | 74,919 | 61 | ||||||||||||||||||||||||||||||||||||||||||||||||||
12-31-16 |
25.98 | 0.31 | 1.71 | 2.02 | 0.30 | 2.37 | — | 2.67 | — | 25.33 | 7.86 | 1.07 | 1.04 | 1.04 | 1.15 | 82,812 | 69 | |||||||||||||||||||||||||||||||||||||||||||||||||||
12-31-15 |
28.67 | 0.30 | 1.16 | 1.46 | 0.30 | 3.85 | — | 4.15 | — | 25.98 | 5.06 | 1.14 | 1.04 | 1.04 | 1.08 | 87,130 | 67 | |||||||||||||||||||||||||||||||||||||||||||||||||||
| Income (loss) from investment operations |
Less distributions | Ratios to average net assets |
Supplemental data |
|||||||||||||||||||||||||||||||||||||||||||||||||||||||||||||||||
|---|---|---|---|---|---|---|---|---|---|---|---|---|---|---|---|---|---|---|---|---|---|---|---|---|---|---|---|---|---|---|---|---|---|---|---|---|---|---|---|---|---|---|---|---|---|---|---|---|---|---|---|---|---|---|---|---|---|---|---|---|---|---|---|---|---|---|---|---|
| Year or period |
Net asset value, beginning of year or period |
Net investment income (loss) |
Net realized and unrealized gain (loss) |
Total from investment operations |
From net investment income |
From net realized gains |
From return of capital |
Total distributions |
Payment by affiliate |
Net asset value, end of year or period |
Total Return(1) | Expenses before reductions/ additions(2)(3)(4) |
Expenses net of fee waivers and/or recoupments if any(2)(3)(4) |
Expenses net of all reductions/ additions(2)(3)(4) |
Net investment income (loss)(2)(3) |
Net assets, end of year or period |
Portfolio turnover rate |
|||||||||||||||||||||||||||||||||||||||||||||||||||
| ended | ($) | ($) | ($) | ($) | ($) | ($) | ($) | ($) | ($) | ($) | (%) | (%) | (%) | (%) | (%) | ($000’s) | (%) | |||||||||||||||||||||||||||||||||||||||||||||||||||
VY® T. Rowe Price
Equity Income Portfolio
|
||||||||||||||||||||||||||||||||||||||||||||||||||||||||||||||||||||
Class ADV |
||||||||||||||||||||||||||||||||||||||||||||||||||||||||||||||||||||
12-31-19 |
10.74 | 0.21 | • | 2.42 | 2.63 | 0.26 | 3.14 | — | 3.40 | — | 9.97 | 25.93 | 1.24 | 1.21 | 1.21 | 1.82 | 51,293 | 17 | ||||||||||||||||||||||||||||||||||||||||||||||||||
12-31-18 |
14.34 | 0.23 | (1.38 | ) | (1.15 | ) | 0.23 | 2.22 | — | 2.45 | — | 10.74 | (9.69 | )(b) | 1.24 | 1.09 | (c) | 1.09 | 1.80 | (d) | 43,287 | 16 | ||||||||||||||||||||||||||||||||||||||||||||||
12-31-17 |
13.63 | 0.20 | 1.86 | 2.06 | 0.25 | 1.10 | — | 1.35 | — | 14.34 | 15.89 | 1.24 | 1.24 | 1.24 | 1.38 | 53,101 | 19 | |||||||||||||||||||||||||||||||||||||||||||||||||||
12-31-16 |
13.03 | 0.23 | 2.04 | 2.27 | 0.26 | 1.41 | — | 1.67 | — | 13.63 | 18.30 | 1.29 | 1.24 | 1.24 | 1.67 | 50,794 | 26 | |||||||||||||||||||||||||||||||||||||||||||||||||||
12-31-15 |
16.29 | 0.23 | (1.27 | ) | (1.04 | ) | 0.26 | 1.96 | — | 2.22 | — | 13.03 | (7.24 | ) | 1.39 | 1.24 | 1.24 | 1.52 | 50,413 | 27 | ||||||||||||||||||||||||||||||||||||||||||||||||
Class I |
||||||||||||||||||||||||||||||||||||||||||||||||||||||||||||||||||||
12-31-19 |
10.97 | 0.29 | • | 2.47 | 2.76 | 0.32 | 3.14 | — | 3.46 | — | 10.27 | 26.66 | 0.64 | 0.61 | 0.61 | 2.42 | 81,596 | 17 | ||||||||||||||||||||||||||||||||||||||||||||||||||
12-31-18 |
14.59 | 0.31 | (1.41 | ) | (1.10 | ) | 0.30 | 2.22 | — | 2.52 | — | 10.97 | (9.09 | )(b) | 0.64 | 0.49 | (c) | 0.49 | 2.40 | (d) | 82,300 | 16 | ||||||||||||||||||||||||||||||||||||||||||||||
12-31-17 |
13.85 | 0.28 | • | 1.90 | 2.18 | 0.34 | 1.10 | — | 1.44 | — | 14.59 | 16.48 | 0.64 | 0.64 | 0.64 | 1.94 | 99,204 | 19 | ||||||||||||||||||||||||||||||||||||||||||||||||||
12-31-16 |
13.20 | 0.31 | • | 2.09 | 2.40 | 0.34 | 1.41 | — | 1.75 | — | 13.85 | 19.07 | 0.64 | 0.64 | 0.64 | 2.32 | 135,151 | 26 | ||||||||||||||||||||||||||||||||||||||||||||||||||
12-31-15 |
16.47 | 0.32 | • | (1.28 | ) | (0.96 | ) | 0.35 | 1.96 | — | 2.31 | — | 13.20 | (6.65 | ) | 0.64 | 0.64 | 0.64 | 2.09 | 90,800 | 27 | |||||||||||||||||||||||||||||||||||||||||||||||
Class S |
||||||||||||||||||||||||||||||||||||||||||||||||||||||||||||||||||||
12-31-19 |
11.00 | 0.25 | • | 2.50 | 2.75 | 0.30 | 3.14 | — | 3.44 | — | 10.31 | 26.42 | 0.89 | 0.86 | 0.86 | 2.13 | 161,388 | 17 | ||||||||||||||||||||||||||||||||||||||||||||||||||
12-31-18 |
14.62 | 0.29 | (1.42 | ) | (1.13 | ) | 0.27 | 2.22 | — | 2.49 | — | 11.00 | (9.32 | )(b) | 0.89 | 0.74 | (c) | 0.74 | 2.15 | (d) | 541,914 | 16 | ||||||||||||||||||||||||||||||||||||||||||||||
12-31-17 |
13.87 | 0.25 | • | 1.90 | 2.15 | 0.30 | 1.10 | — | 1.40 | — | 14.62 | 16.23 | 0.89 | 0.89 | 0.89 | 1.73 | 694,870 | 19 | ||||||||||||||||||||||||||||||||||||||||||||||||||
12-31-16 |
13.22 | 0.28 | 2.08 | 2.36 | 0.30 | 1.41 | — | 1.71 | — | 13.87 | 18.77 | 0.89 | 0.89 | 0.89 | 2.01 | 772,218 | 26 | |||||||||||||||||||||||||||||||||||||||||||||||||||
12-31-15 |
16.49 | 0.28 | • | (1.28 | ) | (1.00 | ) | 0.31 | 1.96 | — | 2.27 | — | 13.22 | (6.90 | ) | 0.89 | 0.89 | 0.89 | 1.86 | 758,358 | 27 | |||||||||||||||||||||||||||||||||||||||||||||||
Class S2 |
||||||||||||||||||||||||||||||||||||||||||||||||||||||||||||||||||||
12-31-19 |
10.82 | 0.23 | • | 2.44 | 2.67 | 0.28 | 3.14 | — | 3.42 | — | 10.07 | 26.13 | 1.04 | 1.01 | 1.01 | 2.01 | 90,172 | 17 | ||||||||||||||||||||||||||||||||||||||||||||||||||
12-31-18 |
14.42 | 0.26 | (1.39 | ) | (1.13 | ) | 0.25 | 2.22 | — | 2.47 | — | 10.82 | (9.45 | )(b) | 1.04 | 0.89 | (c) | 0.89 | 2.00 | (d) | 91,924 | 16 | ||||||||||||||||||||||||||||||||||||||||||||||
12-31-17 |
13.70 | 0.23 | 1.87 | 2.10 | 0.28 | 1.10 | — | 1.38 | — | 14.42 | 16.07 | 1.04 | 1.04 | 1.04 | 1.58 | 113,247 | 19 | |||||||||||||||||||||||||||||||||||||||||||||||||||
12-31-16 |
13.08 | 0.25 | 2.06 | 2.31 | 0.28 | 1.41 | — | 1.69 | — | 13.70 | 18.59 | 1.07 | 1.04 | 1.04 | 1.86 | 113,380 | 26 | |||||||||||||||||||||||||||||||||||||||||||||||||||
12-31-15 |
16.35 | 0.25 | (1.27 | ) | (1.02 | ) | 0.29 | 1.96 | — | 2.25 | — | 13.08 | (7.08 | ) | 1.14 | 1.04 | 1.04 | 1.72 | 111,098 | 27 | ||||||||||||||||||||||||||||||||||||||||||||||||
VY® T. Rowe Price
International Stock Portfolio
|
||||||||||||||||||||||||||||||||||||||||||||||||||||||||||||||||||||
Class ADV |
||||||||||||||||||||||||||||||||||||||||||||||||||||||||||||||||||||
12-31-19 |
13.63 | 0.12 | 3.49 | 3.61 | 0.06 | 0.92 | — | 0.98 | — | 16.26 | 27.20 | 1.41 | 1.36 | 1.36 | 0.87 | 23,415 | 30 | |||||||||||||||||||||||||||||||||||||||||||||||||||
12-31-18 |
16.16 | 0.10 | (2.41 | ) | (2.31 | ) | 0.22 | — | — | 0.22 | — | 13.63 | (14.46 | ) | 1.45 | 1.40 | 1.40 | 0.70 | 18,465 | 35 | ||||||||||||||||||||||||||||||||||||||||||||||||
12-31-17 |
12.79 | 0.08 | 3.42 | 3.50 | 0.13 | — | — | 0.13 | — | 16.16 | 27.42 | 1.40 | 1.40 | 1.40 | 0.64 | 21,086 | 37 | |||||||||||||||||||||||||||||||||||||||||||||||||||
12-31-16 |
12.73 | 0.11 | 0.09 | 0.20 | 0.14 | — | — | 0.14 | — | 12.79 | 1.59 | 1.43 | 1.38 | 1.38 | 0.82 | 15,001 | 33 | |||||||||||||||||||||||||||||||||||||||||||||||||||
12-31-15 |
12.98 | 0.07 | • | (0.24 | ) | (0.17 | ) | 0.08 | — | — | 0.08 | — | 12.73 | (1.36 | )(e) | 1.50 | 1.35 | 1.35 | 0.49 | 15,149 | 43 | |||||||||||||||||||||||||||||||||||||||||||||||
Class I |
||||||||||||||||||||||||||||||||||||||||||||||||||||||||||||||||||||
12-31-19 |
13.69 | 0.23 | 3.50 | 3.73 | 0.15 | 0.92 | — | 1.07 | — | 16.35 | 28.04 | 0.81 | 0.76 | 0.76 | 1.47 | 41,352 | 30 | |||||||||||||||||||||||||||||||||||||||||||||||||||
12-31-18 |
16.22 | 0.20 | • | (2.42 | ) | (2.22 | ) | 0.31 | — | — | 0.31 | — | 13.69 | (13.96 | ) | 0.85 | 0.80 | 0.80 | 1.30 | 35,717 | 35 | |||||||||||||||||||||||||||||||||||||||||||||||
12-31-17 |
12.82 | 0.19 | • | 3.41 | 3.60 | 0.20 | — | — | 0.20 | — | 16.22 | 28.21 | 0.80 | 0.80 | 0.80 | 1.26 | 44,832 | 37 | ||||||||||||||||||||||||||||||||||||||||||||||||||
12-31-16 |
12.76 | 0.19 | 0.09 | 0.28 | 0.22 | — | — | 0.22 | — | 12.82 | 2.18 | 0.78 | 0.78 | 0.78 | 1.41 | 38,010 | 33 | |||||||||||||||||||||||||||||||||||||||||||||||||||
12-31-15 |
12.99 | 0.16 | • | (0.24 | ) | (0.08 | ) | 0.15 | — | — | 0.15 | — | 12.76 | (0.73 | )(e) | 0.75 | 0.75 | 0.75 | 1.15 | 39,288 | 43 | |||||||||||||||||||||||||||||||||||||||||||||||
Class S |
||||||||||||||||||||||||||||||||||||||||||||||||||||||||||||||||||||
12-31-19 |
13.64 | 0.18 | • | 3.49 | 3.67 | 0.11 | 0.92 | — | 1.03 | — | 16.28 | 27.64 | 1.06 | 1.01 | 1.01 | 1.20 | 151,437 | 30 | ||||||||||||||||||||||||||||||||||||||||||||||||||
12-31-18 |
16.15 | 0.17 | • | (2.42 | ) | (2.25 | ) | 0.26 | — | — | 0.26 | — | 13.64 | (14.12 | ) | 1.10 | 1.05 | 1.05 | 1.07 | 137,550 | 35 | |||||||||||||||||||||||||||||||||||||||||||||||
12-31-17 |
12.77 | 0.15 | • | 3.40 | 3.55 | 0.17 | — | — | 0.17 | — | 16.15 | 27.87 | 1.05 | 1.05 | 1.05 | 1.01 | 175,297 | 37 | ||||||||||||||||||||||||||||||||||||||||||||||||||
12-31-16 |
12.71 | 0.15 | • | 0.09 | 0.24 | 0.18 | — | — | 0.18 | — | 12.77 | 1.90 | 1.03 | 1.03 | 1.03 | 1.17 | 154,225 | 33 | ||||||||||||||||||||||||||||||||||||||||||||||||||
12-31-15 |
12.94 | 0.12 | (0.23 | ) | (0.11 | ) | 0.12 | — | — | 0.12 | — | 12.71 | (0.94 | )(e) | 1.00 | 1.00 | 1.00 | 0.88 | 171,416 | 43 | ||||||||||||||||||||||||||||||||||||||||||||||||
(1) |
Total return is calculated assuming reinvestment of all dividends, capital gain distributions and return of capital distributions, if any, at net asset value and does not reflect the effect of insurance contract charges. Total return for periods less than one year is not annualized. | |
(2) |
Annualized for periods less than one year. | |
(3) |
Ratios reflect operating expenses of a Portfolio. Expenses before reductions/additions do not reflect amounts reimbursed or recouped by the Investment Adviser and/or Distributor or reductions from brokerage service arrangements or other expense offset arrangements and do not represent the amount paid by a Portfolio during periods when reimbursements or reductions occur. Expenses net of fee waivers reflect expenses after reimbursement |
| by the Investment Adviser and/or Distributor or recoupment ofpreviously reimbursed fees by the Investment Adviser, but prior to reductions from brokerage service arrangements or other expense offset arrangements. Expenses net of all reductions/additions |
| represent the net expenses paid by a Portfolio. Net investment income (loss) is net of all such additions or reductions. | ||
(4) |
Ratios do not include fees and expenses charged under the variable annuity contract or variable life insurance policy. | |
(5) |
Commencement of operations. | |
(a) |
Excluding amounts related to a foreign currency settlement recorded in the fiscal year ended December 31, 2015, total return for VY® JPMorgan Emerging Markets Equity Portfolio would have been (16.33)%, (15.82)%, (16.00)% and (16.16)% for Classes ADV, I, S and S2, respectively. | |
(b) |
Excluding amounts related to a securities lending settlement and a cumulative underpayment of prior years’ waivers of management fees recorded in the year ended December 31, 2018, total return for VY® T.Rowe Price Equity Income Portfolio would have been (9.84)%, (9.24)%, (9.47)% and (9.60)% for Classes ADV, I, S and S2, respectively. | |
(c) |
Excluding amounts related to a cumulative underpayment of prior years’ waivers of management fees recorded in the year ended |
| December 31, 2018, VY® T.Rowe Price Equity Income Portfolio’s Net Expense Ratios would have been 1.23%, 0.63%, 0.88% and 1.03% for Class ADV, I, S and S2, respectively. | ||
(d) |
Excluding amounts related to a securities lending settlement and a cumulative underpayment of prior years’ waivers of management fees recorded in the year ended December 31, 2018, VY® T.Rowe Price Equity Income Portfolio’s Net Investment Income Ratios would have been 1.65%, 2.25%, 2.00% and 1.85% for Classes ADV, I, S and S2, respectively. | |
(e) |
Excluding amounts related to a foreign currency settlement recorded in the fiscal year ended December 31, 2015, total return for VY® T.Rowe Price International Stock Portfolio would have been (1.44)%, (0.80)% and (1.10)% for Classes ADV, I and S, respectively. |
• |
Calculated using average number of shares outstanding throughout the year or period. | |
* |
Amount is less than $0.005 or 0.005% or more than $(0.005) or (0.005)%. |
NOTE 1 — ORGANIZATION
Voya Investments, LLC (“Voya Investments” or the “Investment Adviser”), an Arizona limited liability company, serves as the Investment Adviser to the Portfolios. Voya Investment Management Co. LLC (“Voya IM”), a Delaware limited liability company, serves as the sub-adviser to Government Liquid Assets. Voya Investments Distributor, LLC (“VID” or the “Distributor”), a Delaware limited liability company, serves as the principal underwriter to the Portfolios.
NOTES TO FINANCIAL STATEMENTS AS OF DECEMBER 31, 2019 (CONTINUED)
NOTE 2 — SIGNIFICANT ACCOUNTING POLICIES (continued)
(1) |
Market value of investment securities, other assets and liabilities — at the exchange rates prevailing at Market Close. |
(2) |
Purchases and sales of investment securities, income and expenses — at the rates of exchange prevailing on the respective dates of such transactions. |
NOTE 2 — SIGNIFICANT ACCOUNTING POLICIES (continued)
G. Risk Exposures and the Use of Derivative Instruments. The Portfolios’ investment strategies permit the Portfolios to enter into various types of derivatives contracts, including, but not limited to, futures contracts, forward foreign currency exchange contracts, credit default swaps, interest rate swaps, total return swaps, and purchased and written options. In doing so, a Portfolio will employ strategies in differing combinations to permit it to increase or decrease the level of risk, or change the level or types of exposure to risk factors. This may allow a Portfolio to pursue its objectives more quickly, and
efficiently than if it were to make direct purchases or sales of securities capable of affecting a similar response to market or credit factors.
NOTE 2 — SIGNIFICANT ACCOUNTING POLICIES (continued)
Generally, derivatives are sophisticated financial instruments whose performance is derived, at least in part, from the performance of an underlying asset or assets. Derivatives include, among other things, swap agreements, options, forwards and futures. Investments in derivatives are generally negotiated OTC with a single counterparty and as a result are
subject to credit risks related to the counterparty’s ability or willingness to perform its obligations; any deterioration in the counterparty’s creditworthiness could adversely affect the value of the derivative. In addition, derivatives and their underlying securities may experience periods of illiquidity which could cause a Portfolio to hold a security it might otherwise sell, or to sell a security it otherwise might hold at inopportune times or at an unanticipated price. A manager might imperfectly judge the direction of the market. For instance, if a derivative is used as a hedge to offset investment risk in another security, the hedge might not correlate to the market’s movements and may have unexpected or undesired results such as a loss or a reduction in gains.
NOTE 2 — SIGNIFICANT ACCOUNTING POLICIES (continued)
I. Forward Foreign Currency Transactions and Futures Contracts. Certain Portfolios may enter into forward foreign currency contracts primarily to hedge against foreign currency exchange rate risks on their non-U.S. dollar denominated investment securities. When entering into a forward currency contract, a Portfolio agrees to receive or deliver a fixed quantity of foreign currency for
an agreed-upon price on an agreed future date. These contracts are valued daily and a Portfolio’s net equity therein, representing unrealized gain or loss on the contracts as measured by the difference between the forward foreign exchange rates at the dates of entry into the contracts and the forward rates at the reporting date, is included in the Statements of Assets and Liabilities. Realized and unrealized gains and losses are included in the Statements of Operations. These instruments involve market and/or credit risk in excess of the amount recognized in the Statements of Assets and Liabilities. Risks arise from the possible inability of counterparties to meet the terms of their contracts and from movement in currency and securities values and interest rates. Open forward foreign currency contracts are presented following the respective Portfolio of Investments.
| Purchased | Sold | |||||||||
|---|---|---|---|---|---|---|---|---|---|---|
Clarion Global
Real Estate |
$ | — | $ | 676,457 | ||||||
Invesco Growth
and Income |
503,265 | 33,698,810 | ||||||||
T. Rowe Price
Capital Appreciation |
1,553,571 | — | ||||||||
T. Rowe Price
International Stock |
97,481 | 1,142,444 | ||||||||
NOTE 2 — SIGNIFICANT ACCOUNTING POLICIES (continued)
J. Options Contracts. Certain Portfolios may purchase put and call options and may write (sell) put options and covered call options. The Portfolios may engage in option transactions as a hedge against adverse movements in the value of portfolio holdings or to increase market exposure. Option contracts are valued daily and unrealized gains or losses are recorded based upon the last sales price on the principal exchange on which the options are traded. An amount equal to the proceeds of the premium received by the Portfolios upon the writing of a put or call option is included in the Statements of Assets and Liabilities as an asset and equivalent liability which is subsequently marked-to-market until it is exercised or closed, or it expires. The Portfolios will realize a gain or loss upon the expiration or closing of the option contract. When an option is exercised, the proceeds on sales of the underlying security for a written call option, the purchase cost of the security for a written put option, or the cost of the security for a purchased put or call option is adjusted by the amount of premium received or paid. Realized and unrealized gains or losses on option contracts
are reflected in the accompanying financial statements. The risk in writing a covered call option is that the Portfolios give up the opportunity for profit if the market price of the security increases and the option is exercised. The risk in writing a put option is that the Portfolios may incur a loss if the market price of the security decreases and the option is exercised. The risk in buying an option is that the Portfolios pay a premium whether or not the option is exercised. Risks may also arise from an illiquid secondary market or from the inability of counterparties to meet the terms of the contract.
NOTE 2 — SIGNIFICANT ACCOUNTING POLICIES (continued)
N. Indemnifications. In the normal course of business, the Trust may enter into contracts that provide certain indemnifications. The Trust’s maximum exposure under these arrangements is dependent on future claims that may be made against the Portfolios and, therefore, cannot be estimated; however, based on experience, management considers the risk of loss from such claims remote.
| Purchases | Sales | |||||||||
|---|---|---|---|---|---|---|---|---|---|---|
Clarion Global
Real Estate |
$ | 177,449,921 | $ | 198,658,692 | ||||||
Invesco Growth
and Income |
92,624,721 | 164,196,293 | ||||||||
JPMorgan
Emerging Markets Equity |
100,403,136 | 149,280,877 | ||||||||
Morgan Stanley
Global Franchise |
63,232,628 | 103,250,765 | ||||||||
T. Rowe Price
Capital Appreciation |
3,191,634,265 | 3,716,168,131 | ||||||||
T. Rowe Price
Equity Income |
127,316,834 | 656,144,383 | ||||||||
T. Rowe Price
International Stock |
60,397,168 | 81,700,974 | ||||||||
| Purchases | Sales | |||||||||
|---|---|---|---|---|---|---|---|---|---|---|
T. Rowe Price
Capital Appreciation |
$ | 220,531,624 | $ | 364,375,046 | ||||||
| Portfolio | Fee | ||
|---|---|---|---|
Clarion Global
Real Estate |
0.90%
on the first $250 million; 0.875% on the next $250 million; 0.80% on the amount in excess of $500 million |
||
T. Rowe Price
International Stock(1) |
0.64%
on the first $4 billion; 0.63% on the amount in excess of $4 billion |
(1) |
The Investment Adviser is contractually obligated to waive 0.04% of the management fee for T. Rowe Price International Stock. This waiver is not eligible for recoupment. Termination or modification of this obligation requires approval by the Board. |
NOTE 4 — INVESTMENT MANAGEMENT FEES (continued)
| Portfolio | Fee | |||
|---|---|---|---|---|
Government Liquid
Assets(2) |
0.35%
on the first $200 million; 0.30% on the next $300 million; 0.25% on the amount in excess of $500 million |
|||
JPMorgan Emerging
Markets Equity |
1.25% |
|||
Morgan Stanley
Global Franchise |
1.00%
on the first $250 million; 0.90% on the next $250 million; 0.75% on the amount in excess of $500 million |
|||
Invesco Growth
and Income, T. Rowe Price Capital Appreciation, and T. Rowe Price Equity Income(3) |
0.75%
first $750 million; 0.70% on the next $1.25 billion; 0.65% on the next $1.5 billion; 0.60% on the amount in excess of $3.5 billion |
(2) |
The assets of Government Liquid Assets are aggregated with those of Voya Limited Maturity Bond Portfolio, which is not included in this report, to determine the Unified Fee applicable to the Portfolio. |
(3) |
The assets of these Portfolios are aggregated with those of VY® Clarion Real Estate Portfolio, which is not included in this report, to determine the Unified Fee applicable to each respective Portfolio. |
fee for Clarion Global Real Estate(4), Morgan Stanley Global Franchise and T. Rowe Price Equity Income. For Clarion Global Real Estate and Morgan Stanley Global Franchise, the waivers were effective in connection with a sub-advisory fee reduction that occurred on May 1, 2009 and July 1, 2015, respectively. The waivers were calculated as follows: Waiver = 50% x (former sub-advisory fee rate minus new sub-advisory fee rate) x average daily net assets as of the calculation date. The waiver for T. Rowe Price Equity Income was based on the total savings in excess of $500,000 as a result of the aggregated sub-advisory fee schedules of T. Rowe Price Equity Income and VY® T. Rowe Price Growth Equity Portfolio, which is not included in this report. The aggregated amount of savings is allocated to the two Portfolios pro rata based on each Portfolio’s contribution to the amount saved. For the period ended April 30, 2019, the Investment Adviser waived $12,502, $41,370 and $88,791 of management fees for Clarion Global Real Estate, Morgan Stanley Global Franchise and T. Rowe Price Equity Income, respectively, based on the sub-advisory fee reductions. Effective May 1, 2019, the Investment Adviser is no longer obligated to waive a portion of the management fee for these Portfolios based on the sub-advisory fee reductions. The termination of these obligations was approved by the Board and replaced with a management fee waiver.
(4) |
The waiver for Clarion Global Real Estate was limited to an annual 50% of the savings based on the Portfolio’s assets as of May 1, 2009. |
| Portfolio | Sub-Adviser | |
|---|---|---|
Government Liquid
Assets |
Voya
Investment Management Co. LLC* |
|
Clarion Global
Real Estate |
CBRE
Clarion Securities LLC |
|
Invesco Growth
and Income |
Invesco Advisers, Inc. |
|
JPMorgan Emerging
Markets Equity |
J.P.
Morgan Investment Management Inc. |
|
Morgan Stanley
Global Franchise |
Morgan
Stanley Investment Management Inc. |
|
T. Rowe Price
Capital Appreciation |
T.
Rowe Price Associates, Inc. |
|
T. Rowe Price
Equity Income |
T.
Rowe Price Associates, Inc. |
|
T. Rowe Price
International Stock |
T.
Rowe Price Associates, Inc. |
NOTE 5 — DISTRIBUTION AND SERVICE FEES
NOTE 6 — OTHER TRANSACTIONS WITH AFFILIATES AND RELATED PARTIES
| Subsidiary | Portfolio | Percentage | ||||
|---|---|---|---|---|---|---|
ReliaStar Life
Insurance |
T.
Rowe Price Equity Income |
6.28 | % | |||
Company |
T.
Rowe Price International Stock |
13.20 | ||||
Security Life of
Denver |
Government Liquid Assets |
6.07 | ||||
Insurance
Company |
Clarion Global Real Estate |
5.03 | ||||
JPMorgan Emerging Markets Equity |
8.12 | |||||
T.
Rowe Price Equity Income |
7.97 | |||||
T.
Rowe Price International Stock |
5.30 | |||||
Voya
Institutional Trust |
Government Liquid Assets |
48.63 | ||||
Company |
Clarion Global Real Estate |
11.61 | ||||
Invesco Growth and Income |
5.09 | |||||
JPMorgan Emerging Markets Equity |
9.88 | |||||
Morgan Stanley Global Franchise |
27.83 | |||||
T.
Rowe Price Capital Appreciation |
28.41 | |||||
T.
Rowe Price Equity Income |
37.17 | |||||
T.
Rowe Price International Stock |
10.97 | |||||
Voya
Retirement |
Clarion Global Real Estate |
36.40 | ||||
Insurance and
Annuity |
Invesco Growth and Income |
17.39 | ||||
Company |
JPMorgan Emerging Markets Equity |
14.83 | ||||
T.
Rowe Price Capital Appreciation |
29.41 | |||||
T.
Rowe Price Equity Income |
47.74 | |||||
T.
Rowe Price International Stock |
8.12 | |||||
NOTE 6 — OTHER TRANSACTIONS WITH AFFILIATES AND RELATED PARTIES (continued)
| Portfolio | Accrued Expense | Amount | ||||||
|---|---|---|---|---|---|---|---|---|
Clarion Global
Real Estate |
Custody |
$107,213 |
| Portfolio | Class ADV | Class I | Class S | Class S2 | ||||||||||||||
|---|---|---|---|---|---|---|---|---|---|---|---|---|---|---|---|---|---|---|
Clarion Global
Real Estate |
1.50 | % | 0.90 | % | 1.15 | % | 1.30 | % | ||||||||||
T. Rowe Price
International Stock |
1.40 | % | 0.80 | % | 1.05 | % | N/A | |||||||||||
As of December 31, 2019, the amounts of waived and/or reimbursed fees that are subject to possible recoupment by the Investment Adviser, and the related expiration dates are as follows:
| December 31, | ||||||||||||||||||
|---|---|---|---|---|---|---|---|---|---|---|---|---|---|---|---|---|---|---|
| 2020 | 2021 | 2022 | Total | |||||||||||||||
Clarion Global
Real Estate |
$ | 221,339 | $ | 336,627 | $ | 271,097 | $ | 829,063 | ||||||||||
T. Rowe Price
International Stock |
— | 100,434 | 7,153 | 107,587 | ||||||||||||||
| Portfolio | Days Utilized |
Approximate Average Daily Balance For Days Utilized |
Approximate Weighted Average Interest Rate For Days Utilized |
|||||||||||
|---|---|---|---|---|---|---|---|---|---|---|---|---|---|---|
Clarion Global
Real Estate |
2 | $ | 640,000 | 2.55 | % | |||||||||
Invesco Growth
and Income |
7 | 269,571 | 2.55 | |||||||||||
JPMorgan
Emerging Markets Equity |
17 | 2,188,412 | 2.97 | |||||||||||
T. Rowe Price
Capital Appreciation |
1 | 45,688,000 | 3.13 | |||||||||||
| Net | ||||||||||||||||||||||||||||||||||||||||
| increase | Proceeds | |||||||||||||||||||||||||||||||||||||||
| Shares | Reinvestment | (decrease) | from shares | Reinvestment | Net | |||||||||||||||||||||||||||||||||||
| Shares | issued in | of | Shares | in shares | Shares | issued in | of | Shares | increase | |||||||||||||||||||||||||||||||
| Year or | sold | merger | distributions | redeemed | outstanding | sold | merger | distributions | redeemed | (decrease) | ||||||||||||||||||||||||||||||
| period ended | # | # | # | # | # | ($) | ($) | ($) | ($) | ($) | ||||||||||||||||||||||||||||||
| Government Liquid Assets | ||||||||||||||||||||||||||||||||||||||||
| Class I | ||||||||||||||||||||||||||||||||||||||||
| 12/31/2019 | 27,338,984 | — | 1,149,040 | (38,086,906 | ) | (9,598,882 | ) | 27,338,984 | — | 1,149,041 | (38,086,906 | ) | (9,598,881 | ) | ||||||||||||||||||||||||||
| 12/31/2018 | 53,679,939 | — | 898,299 | (43,238,147 | ) | 11,340,091 | 53,679,939 | — | 898,299 | (43,238,147 | ) | 11,340,091 | ||||||||||||||||||||||||||||
| Class S | ||||||||||||||||||||||||||||||||||||||||
| 12/31/2019 | 105,890,206 | — | 5,870,727 | (151,393,326 | ) | (39,632,393 | ) | 105,890,203 | — | 5,870,729 | (151,393,326 | ) | (39,632,393 | ) | ||||||||||||||||||||||||||
| 12/31/2018 | 110,350,043 | — | 4,772,369 | (133,647,164 | ) | (18,524,752 | ) | 110,350,043 | — | 4,772,366 | (133,647,164 | ) | (18,524,755 | ) | ||||||||||||||||||||||||||
| Class S2 | ||||||||||||||||||||||||||||||||||||||||
| 12/31/2019 | 81,107,149 | — | 5,767,380 | (113,945,268 | ) | (27,070,739 | ) | 81,107,149 | — | 5,767,381 | (113,945,268 | ) | (27,070,739 | ) | ||||||||||||||||||||||||||
| 12/31/2018 | 138,306,770 | — | 4,204,649 | (114,678,340 | ) | 27,833,079 | 138,306,770 | — | 4,204,653 | (114,678,340 | ) | 27,833,083 | ||||||||||||||||||||||||||||
| Clarion Global Real Estate | ||||||||||||||||||||||||||||||||||||||||
| Class ADV | ||||||||||||||||||||||||||||||||||||||||
| 12/31/2019 | 70,100 | — | 32,152 | (323,215 | ) | (220,963 | ) | 860,644 | — | 394,514 | (3,916,605 | ) | (2,661,447 | ) | ||||||||||||||||||||||||||
| 12/31/2018 | 101,408 | — | 84,794 | (485,242 | ) | (299,040 | ) | 1,169,305 | — | 965,808 | (5,537,167 | ) | (3,402,054 | ) | ||||||||||||||||||||||||||
| Class I | ||||||||||||||||||||||||||||||||||||||||
| 12/31/2019 | 526,561 | — | 263,954 | (1,189,789 | ) | (399,274 | ) | 6,485,549 | — | 3,315,314 | (14,748,857 | ) | (4,947,995 | ) | ||||||||||||||||||||||||||
| 12/31/2018 | 844,331 | — | 776,752 | (6,816,857 | ) | (5,195,774 | ) | 10,117,636 | — | 9,056,924 | (79,343,586 | ) | (60,169,026 | ) | ||||||||||||||||||||||||||
| Class S | ||||||||||||||||||||||||||||||||||||||||
| 12/31/2019 | 202,999 | — | 203,825 | (1,384,294 | ) | (977,470 | ) | 2,531,379 | — | 2,549,899 | (17,208,225 | ) | (12,126,947 | ) | ||||||||||||||||||||||||||
| 12/31/2018 | 261,239 | — | 460,493 | (1,455,833 | ) | (734,101 | ) | 3,150,172 | — | 5,350,931 | (16,992,074 | ) | (8,490,971 | ) | ||||||||||||||||||||||||||
| Class S2 | ||||||||||||||||||||||||||||||||||||||||
| 12/31/2019 | 284 | — | 1,826 | (11,562 | ) | (9,452 | ) | 3,681 | — | 23,042 | (146,401 | ) | (119,677 | ) | ||||||||||||||||||||||||||
| 12/31/2018 | 758 | — | 4,086 | (10,201 | ) | (5,357 | ) | 9,036 | — | 47,888 | (118,662 | ) | (61,738 | ) | ||||||||||||||||||||||||||
| Invesco Growth and Income | ||||||||||||||||||||||||||||||||||||||||
| Class ADV | ||||||||||||||||||||||||||||||||||||||||
| 12/31/2019 | 32,842 | — | 115,836 | (136,407 | ) | 12,271 | 752,319 | — | 2,498,575 | (3,095,163 | ) | 155,732 | ||||||||||||||||||||||||||||
| 12/31/2018 | 144,067 | — | 102,972 | (245,999 | ) | 1,040 | 3,550,737 | — | 2,545,460 | (5,986,189 | ) | 110,008 | ||||||||||||||||||||||||||||
| Class I | ||||||||||||||||||||||||||||||||||||||||
| 12/31/2019 | 53,646 | — | 195,201 | (260,360 | ) | (11,513 | ) | 1,206,116 | — | 4,251,471 | (5,977,085 | ) | (519,498 | ) | ||||||||||||||||||||||||||
| 12/31/2018 | 124,873 | — | 166,780 | (186,808 | ) | 104,845 | 3,326,506 | — | 4,159,490 | (4,935,536 | ) | 2,550,460 | ||||||||||||||||||||||||||||
| Class S | ||||||||||||||||||||||||||||||||||||||||
| 12/31/2019 | 161,662 | — | 2,353,167 | (2,948,227 | ) | (433,398 | ) | 3,651,615 | — | 51,840,265 | (67,944,103 | ) | (12,452,224 | ) | ||||||||||||||||||||||||||
| 12/31/2018 | 267,475 | — | 2,138,765 | (2,902,185 | ) | (495,945 | ) | 7,037,487 | — | 53,854,097 | (77,272,478 | ) | (16,380,894 | ) | ||||||||||||||||||||||||||
| Class S2 | ||||||||||||||||||||||||||||||||||||||||
| 12/31/2019 | 21,817 | — | 180,581 | (223,561 | ) | (21,163 | ) | 491,902 | — | 3,938,465 | (5,019,833 | ) | (589,466 | ) | ||||||||||||||||||||||||||
| 12/31/2018 | 25,054 | — | 157,118 | (160,399 | ) | 21,773 | 640,386 | — | 3,923,246 | (4,127,737 | ) | 435,895 | ||||||||||||||||||||||||||||
| JPMorgan Emerging Markets Equity | ||||||||||||||||||||||||||||||||||||||||
| Class ADV | ||||||||||||||||||||||||||||||||||||||||
| 12/31/2019 | 281,136 | — | 138,039 | (441,406 | ) | (22,231 | ) | 5,470,948 | — | 2,713,856 | (8,522,028 | ) | (337,224 | ) | ||||||||||||||||||||||||||
| 12/31/2018 | 347,242 | — | 9,011 | (727,322 | ) | (371,069 | ) | 6,813,378 | — | 173,376 | (13,696,008 | ) | (6,709,254 | ) | ||||||||||||||||||||||||||
| Class I | ||||||||||||||||||||||||||||||||||||||||
| 12/31/2019 | 467,321 | — | 196,864 | (545,797 | ) | 118,388 | 9,650,512 | — | 4,082,963 | (11,218,091 | ) | 2,515,384 | ||||||||||||||||||||||||||||
| 12/31/2018 | 659,944 | — | 30,950 | (1,062,946 | ) | (372,052 | ) | 13,482,036 | — | 623,640 | (21,475,810 | ) | (7,370,134 | ) | ||||||||||||||||||||||||||
| Class S | ||||||||||||||||||||||||||||||||||||||||
| 12/31/2019 | 723,015 | — | 975,561 | (2,981,926 | ) | (1,283,350 | ) | 14,525,557 | — | 20,116,064 | (60,692,033 | ) | (26,050,412 | ) | ||||||||||||||||||||||||||
| 12/31/2018 | 1,073,675 | — | 111,895 | (4,376,095 | ) | (3,190,525 | ) | 22,142,279 | — | 2,244,617 | (88,213,515 | ) | (63,826,619 | ) | ||||||||||||||||||||||||||
| Class S2 | ||||||||||||||||||||||||||||||||||||||||
| 12/31/2019 | 27,135 | — | 32,208 | (133,304 | ) | (73,961 | ) | 549,118 | — | 656,400 | (2,697,607 | ) | (1,492,089 | ) | ||||||||||||||||||||||||||
| 12/31/2018 | 32,262 | — | 2,652 | (141,406 | ) | (106,492 | ) | 649,196 | — | 52,676 | (2,743,467 | ) | (2,041,595 | ) | ||||||||||||||||||||||||||
| Morgan Stanley Global Franchise | ||||||||||||||||||||||||||||||||||||||||
| Class ADV | ||||||||||||||||||||||||||||||||||||||||
| 12/31/2019 | 884,610 | — | 733,488 | (339,344 | ) | 1,278,754 | 13,740,896 | — | 11,237,040 | (5,296,512 | ) | 19,681,424 | ||||||||||||||||||||||||||||
| 12/31/2018 | 396,736 | — | 870,423 | (609,572 | ) | 657,587 | 6,164,455 | — | 13,099,859 | (9,863,794 | ) | 9,400,520 | ||||||||||||||||||||||||||||
| Class R6 | ||||||||||||||||||||||||||||||||||||||||
| 12/31/2019 | 36,839 | — | 4,577 | (10,413 | ) | 31,003 | 624,916 | — | 75,422 | (172,697 | ) | 527,641 | ||||||||||||||||||||||||||||
| 12/31/2018 | 4,443 | — | 648 | (1,920 | ) | 3,171 | 76,150 | — | 10,394 | (35,281 | ) | 51,263 | ||||||||||||||||||||||||||||
| Class S | ||||||||||||||||||||||||||||||||||||||||
| 12/31/2019 | 248,447 | — | 1,762,890 | (2,887,863 | ) | (876,526 | ) | 4,196,048 | — | 29,140,576 | (48,204,362 | ) | (14,867,738 | ) | ||||||||||||||||||||||||||
| 12/31/2018 | 345,570 | — | 2,581,095 | (2,405,916 | ) | 520,749 | 5,908,738 | — | 41,529,824 | (41,096,073 | ) | 6,342,489 | ||||||||||||||||||||||||||||
| Class S2 | ||||||||||||||||||||||||||||||||||||||||
| 12/31/2019 | 14,454 | — | 259,109 | (394,495 | ) | (120,932 | ) | 240,198 | — | 4,241,616 | (6,553,185 | ) | (2,071,371 | ) | ||||||||||||||||||||||||||
| 12/31/2018 | 29,074 | — | 381,372 | (372,812 | ) | 37,634 | 485,209 | — | 6,082,883 | (6,305,022 | ) | 263,070 | ||||||||||||||||||||||||||||
| Net | ||||||||||||||||||||||||||||||||||||
| increase | Proceeds | |||||||||||||||||||||||||||||||||||
| Shares | Reinvestment | (decrease) | from shares | Reinvestment | Net | |||||||||||||||||||||||||||||||
| Shares | issued in | of | Shares | in shares | Shares | issued in | of | Shares | increase | |||||||||||||||||||||||||||
| Year or | sold | merger | distributions | redeemed | outstanding | sold | merger | distributions | redeemed | (decrease) | ||||||||||||||||||||||||||
| period ended | # | # | # | # | # | ($) | ($) | ($) | ($) | ($) | ||||||||||||||||||||||||||
| T. Rowe Price Capital Appreciation | ||||||||||||||||||||||||||||||||||||
| Class ADV | ||||||||||||||||||||||||||||||||||||
| 12/31/2019 | 5,575,422 | — | 2,946,529 | (1,260,108 | ) | 7,261,843 | 150,351,658 | — | 79,837,274 | (33,969,913 | ) | 196,219,019 | ||||||||||||||||||||||||
| 12/31/2018 | 3,115,179 | — | 3,760,244 | (1,735,675 | ) | 5,139,748 | 81,802,098 | — | 95,178,479 | (44,879,687 | ) | 132,100,890 | ||||||||||||||||||||||||
| Class I | ||||||||||||||||||||||||||||||||||||
| 12/31/2019 | 9,759,628 | — | 3,684,129 | (5,896,777 | ) | 7,546,980 | 277,225,757 | — | 105,346,487 | (167,049,242 | ) | 215,523,002 | ||||||||||||||||||||||||
| 12/31/2018 | 6,659,889 | — | 4,706,697 | (6,046,493 | ) | 5,320,093 | 184,182,763 | — | 124,567,106 | (166,070,288 | ) | 142,679,581 | ||||||||||||||||||||||||
| Class R6 | ||||||||||||||||||||||||||||||||||||
| 12/31/2019 | 2,439,618 | — | 366,413 | (356,708 | ) | 2,449,323 | 68,813,224 | — | 10,487,555 | (10,246,153 | ) | 69,054,625 | ||||||||||||||||||||||||
| 12/31/2018 | 1,577,953 | — | 301,696 | (310,408 | ) | 1,569,241 | 43,403,614 | — | 7,964,813 | (8,501,758 | ) | 42,866,669 | ||||||||||||||||||||||||
| Class S | ||||||||||||||||||||||||||||||||||||
| 12/31/2019 | 4,635,615 | — | 9,290,071 | (16,631,924 | ) | (2,706,238 | ) | 130,238,436 | — | 265,075,287 | (469,100,432 | ) | (73,786,709 | ) | ||||||||||||||||||||||
| 12/31/2018 | 2,355,404 | — | 13,722,558 | (18,360,494 | ) | (2,282,532 | ) | 64,615,518 | — | 363,602,203 | (504,979,291 | ) | (76,761,570 | ) | ||||||||||||||||||||||
| Class S2 | ||||||||||||||||||||||||||||||||||||
| 12/31/2019 | 155,586 | — | 167,850 | (558,499 | ) | (235,063 | ) | 4,329,709 | — | 4,744,849 | (15,663,257 | ) | (6,588,698 | ) | ||||||||||||||||||||||
| 12/31/2018 | 172,954 | — | 258,341 | (415,693 | ) | 15,602 | 4,727,628 | — | 6,795,562 | (11,262,196 | ) | 260,994 | ||||||||||||||||||||||||
| T. Rowe Price Equity Income | ||||||||||||||||||||||||||||||||||||
| Class ADV | ||||||||||||||||||||||||||||||||||||
| 12/31/2019 | 353,400 | — | 1,377,723 | (617,449 | ) | 1,113,674 | 4,050,765 | — | 14,085,259 | (7,032,973 | ) | 11,103,050 | ||||||||||||||||||||||||
| 12/31/2018 | 250,918 | — | 707,295 | (632,721 | ) | 325,492 | 3,259,664 | — | 8,544,546 | (8,482,699 | ) | 3,321,511 | ||||||||||||||||||||||||
| Class I | ||||||||||||||||||||||||||||||||||||
| 12/31/2019 | 568,006 | — | 2,106,466 | (2,233,897 | ) | 440,575 | 6,692,225 | — | 22,140,633 | (26,950,544 | ) | 1,882,314 | ||||||||||||||||||||||||
| 12/31/2018 | 537,040 | — | 1,333,165 | (1,166,853 | ) | 703,352 | 7,391,108 | — | 16,430,325 | (16,046,569 | ) | 7,774,864 | ||||||||||||||||||||||||
| Class S | ||||||||||||||||||||||||||||||||||||
| 12/31/2019 | 1,718,437 | — | 15,400,962 | (50,726,943 | ) | (33,607,544 | ) | 19,394,246 | — | 162,548,177 | (526,249,689 | ) | (344,307,265 | ) | ||||||||||||||||||||||
| 12/31/2018 | 823,928 | — | 8,908,634 | (7,994,575 | ) | 1,737,987 | 11,277,412 | — | 110,181,926 | (109,083,800 | ) | 12,375,538 | ||||||||||||||||||||||||
| Class S2 | ||||||||||||||||||||||||||||||||||||
| 12/31/2019 | 392,404 | — | 2,805,920 | (2,743,533 | ) | 454,791 | 4,559,810 | — | 28,955,674 | (29,132,389 | ) | 4,383,095 | ||||||||||||||||||||||||
| 12/31/2018 | 122,058 | — | 1,520,959 | (999,152 | ) | 643,865 | 1,559,057 | — | 18,499,686 | (13,277,552 | ) | 6,781,191 | ||||||||||||||||||||||||
| T. Rowe Price International Stock | ||||||||||||||||||||||||||||||||||||
| Class ADV | ||||||||||||||||||||||||||||||||||||
| 12/31/2019 | 140,915 | — | 90,834 | (146,404 | ) | 85,345 | 2,134,977 | — | 1,356,151 | (2,216,933 | ) | 1,274,195 | ||||||||||||||||||||||||
| 12/31/2018 | 225,885 | — | 18,711 | (194,894 | ) | 49,702 | 3,502,776 | — | 293,947 | (3,028,069 | ) | 768,654 | ||||||||||||||||||||||||
| Class I | ||||||||||||||||||||||||||||||||||||
| 12/31/2019 | 155,424 | — | 182,071 | (415,646 | ) | (78,151 | ) | 2,322,996 | — | 2,725,607 | (6,317,799 | ) | (1,269,196 | ) | ||||||||||||||||||||||
| 12/31/2018 | 87,450 | — | 50,883 | (294,169 | ) | (155,836 | ) | 1,336,303 | — | 800,891 | (4,648,852 | ) | (2,511,658 | ) | ||||||||||||||||||||||
| Class S | ||||||||||||||||||||||||||||||||||||
| 12/31/2019 | 312,719 | — | 653,879 | (1,749,366 | ) | (782,768 | ) | 4,761,972 | — | 9,755,870 | (26,439,672 | ) | (11,921,830 | ) | ||||||||||||||||||||||
| 12/31/2018 | 636,418 | — | 179,669 | (1,582,543 | ) | (766,456 | ) | 9,963,602 | — | 2,820,796 | (24,377,197 | ) | (11,592,799 | ) | ||||||||||||||||||||||
NOTE 11 — SECURITIES LENDING
respect to the investment of collateral with the following exception: BNY provides the Portfolios indemnification from loss with respect to the investment of collateral to the extent the cash collateral is invested in overnight repurchase agreements.
NOTE 11 — SECURITIES LENDING (continued)
| Clarion Global Real Estate | ||||||||||||||||
|---|---|---|---|---|---|---|---|---|---|---|---|---|---|---|---|---|
| Counterparty | Securities Loaned at Value |
Cash Collateral Received(1) |
Net Amount |
|||||||||||||
RBC Capital
Markets, LLC |
$ | 608,472 | $ | (608,472 | ) | $ | — | |||||||||
Total |
$ | 608,472 | $ | (608,472 | ) | $ | — | |||||||||
(1) |
Collateral with a fair value of $632,792 has been received in connection with the above securities lending transactions. Excess collateral received from the individual counterparty is not shown for financial reporting purposes. |
| Invesco Growth and Income | ||||||||||||||||
|---|---|---|---|---|---|---|---|---|---|---|---|---|---|---|---|---|
| Counterparty | Securities Loaned at Value |
Cash Collateral Received(1) |
Net Amount |
|||||||||||||
|---|---|---|---|---|---|---|---|---|---|---|---|---|---|---|---|---|
BofA Securities
Inc |
$ | 3,219,502 | $ | (3,219,502 | ) | $ | — | |||||||||
Total |
$ | 3,219,502 | $ | (3,219,502 | ) | $ | — | |||||||||
(1) |
Collateral with a fair value of $3,296,644 has been received in connection with the above securities lending transactions. Excess collateral received from the individual counterparty is not shown for financial reporting purposes. |
| Counterparty | Securities Loaned at Value |
Cash Collateral Received(1) |
Net Amount |
|||||||||||||
|---|---|---|---|---|---|---|---|---|---|---|---|---|---|---|---|---|
Goldman Sachs
& Co. LLC |
$ | 1,275,539 | $ | (1,275,539 | ) | $ | — | |||||||||
Total |
$ | 1,275,539 | $ | (1,275,539 | ) | $ | — | |||||||||
(1) |
Collateral with a fair value of $1,342,970 has been received in connection with the above securities lending transactions. Excess collateral received from the individual counterparty is not shown for financial reporting purposes. |
| T. Rowe Price Capital
Appreciation |
||||||||||||||||
|---|---|---|---|---|---|---|---|---|---|---|---|---|---|---|---|---|
| Counterparty | Securities Loaned at Value |
Cash Collateral Received(1) |
Net Amount |
|||||||||||||
|---|---|---|---|---|---|---|---|---|---|---|---|---|---|---|---|---|
Barclays Bank
PLC |
$ | 3,032,503 | $ | (3,032,503 | ) | $ | — | |||||||||
BMO Capital
Markets Corp |
1,946,690 | (1,946,690 | ) | — | ||||||||||||
BNP
Paribas |
2,230,478 | (2,230,478 | ) | — | ||||||||||||
BofA Securities
Inc |
52,312,296 | (52,312,296 | ) | — | ||||||||||||
Citadel Clearing
LLC |
20,270,875 | (20,270,875 | ) | — | ||||||||||||
Citadel
Securities LLC |
137,779 | (137,779 | ) | — | ||||||||||||
Citigroup Global
Markets Inc |
55,604,866 | (55,604,866 | ) | — | ||||||||||||
Cowen Execution
Services LLC |
514,045 | (514,045 | ) | — | ||||||||||||
Credit Suisse
AG |
13,770,990 | (13,770,990 | ) | — | ||||||||||||
Deutsche Bank
Securities Inc |
8,390,448 | (8,390,448 | ) | — | ||||||||||||
Goldman Sachs
& Co. LLC |
5,395,988 | (5,395,988 | ) | — | ||||||||||||
J.P. Morgan
Securities LLC |
29,383,643 | (29,383,643 | ) | — | ||||||||||||
Jefferies
LLC |
1,976,156 | (1,976,156 | ) | — | ||||||||||||
Morgan Stanley
& Co. LLC |
505,409 | (505,409 | ) | — | ||||||||||||
National Bank of
Canada Financial Inc |
1,203,879 | (1,203,879 | ) | — | ||||||||||||
Nomura
Securities International, Inc |
2,244,626 | (2,244,626 | ) | — | ||||||||||||
RBC Capital
Markets, LLC |
4,275,949 | (4,275,949 | ) | — | ||||||||||||
RBC Dominion
Securities Inc |
160,382 | (160,382 | ) | — | ||||||||||||
Scotia Capital
(USA) Inc |
14,105,248 | (14,105,248 | ) | — | ||||||||||||
State Street
Bank and Trust Company |
13,289,041 | (13,289,041 | ) | — | ||||||||||||
TD Prime
Services LLC |
2,378,426 | (2,378,426 | ) | — | ||||||||||||
TD Securities
(USA) Inc |
2,900,394 | (2,900,394 | ) | — | ||||||||||||
UBS
AG |
1,036,143 | (1,036,143 | ) | — | ||||||||||||
Wells Fargo Bank
NA |
3,929,354 | (3,929,354 | ) | — | ||||||||||||
Wells Fargo
Securities LLC |
5,890,761 | (5,890,761 | ) | — | ||||||||||||
Total |
$ | 246,886,369 | $ | (246,886,369 | ) | $ | — | |||||||||
(1) |
Collateral with a fair value of $252,644,249 has been received in connection with the above securities lending transactions. Excess collateral received from the individual counterparty is not shown for financial reporting purposes. |
| T. Rowe Price Equity Income |
||||||||||||||||
|---|---|---|---|---|---|---|---|---|---|---|---|---|---|---|---|---|
| Counterparty | Securities Loaned at Value |
Cash Collateral Received(1) |
Net Amount |
|||||||||||||
|---|---|---|---|---|---|---|---|---|---|---|---|---|---|---|---|---|
Barclays Bank
PLC |
$ | 454,555 | $ | (454,555 | ) | $ | — | |||||||||
BMO Capital
Markets Corp |
242,997 | (242,997 | ) | — | ||||||||||||
BofA Securities
Inc |
134,554 | (134,554 | ) | — | ||||||||||||
Goldman Sachs
& Co. LLC |
2,263,568 | (2,263,568 | ) | — | ||||||||||||
Morgan Stanley
& Co. LLC |
631,362 | (631,362 | ) | — | ||||||||||||
National
Financial Services LLC |
83,524 | (83,524 | ) | — | ||||||||||||
Scotia Capital
(USA) Inc |
7,385,575 | (7,385,575 | ) | — | ||||||||||||
Wells Fargo Bank
NA |
1,651,610 | (1,651,610 | ) | — | ||||||||||||
Wells Fargo
Securities LLC |
424 | (424 | ) | — | ||||||||||||
Total |
$ | 12,848,169 | $ | (12,848,169 | ) | $ | — | |||||||||
(1) |
Collateral with a fair value of $13,136,628 has been received in connection with the above securities lending transactions. Excess collateral received from the individual counterparty is not shown for financial reporting purposes. |
NOTE 11 — SECURITIES LENDING (continued)
| T. Rowe Price International
Stock |
||||||||||||||||
|---|---|---|---|---|---|---|---|---|---|---|---|---|---|---|---|---|
| Counterparty | Securities Loaned at Value |
Cash Collateral Received(1) |
Net Amount |
|||||||||||||
|---|---|---|---|---|---|---|---|---|---|---|---|---|---|---|---|---|
Credit Suisse
Securities (USA) LLC |
$ | 941,275 | $ | (941,275 | ) | $ | — | |||||||||
HSBC Bank
Plc |
324,893 | (324,893 | ) | — | ||||||||||||
JP Morgan
Securities, Plc |
305,989 | (305,989 | ) | — | ||||||||||||
Nomura
Securities International, Inc |
656,569 | (656,569 | ) | — | ||||||||||||
Total |
$ | 2,228,726 | $ | (2,228,726 | ) | $ | — | |||||||||
(1) |
Collateral with a fair value of $2,344,711 has been received in connection with the above securities lending transactions. Excess collateral received from the individual counterparty is not shown for financial reporting purposes. |
NOTE 12 — UNFUNDED LOAN COMMITMENTS
| Paid-in Capital |
Distributable Earnings |
||||||||||
|---|---|---|---|---|---|---|---|---|---|---|---|
Clarion Global
Real Estate |
$ | 16,235 | $ | (16,235 | ) | ||||||
T. Rowe Price
Capital Appreciation |
(824 | ) | 824 | ||||||||
| Year Ended December 31, 2019 | Year Ended December 31, 2018 | |||||||||||||||||
|---|---|---|---|---|---|---|---|---|---|---|---|---|---|---|---|---|---|---|
| Ordinary Income |
Long-term Capital Gains |
Ordinary Income |
Long-term Capital Gains |
|||||||||||||||
Government
Liquid Assets |
$ | 12,787,150 | $ | — | $ | 9,875,318 | $ | — | ||||||||||
Clarion Global
Real Estate |
6,282,769 | — | 15,421,551 | — | ||||||||||||||
Invesco Growth
and Income |
10,636,889 | 51,891,887 | 7,121,509 | 57,360,784 | ||||||||||||||
JPMorgan
Emerging Markets Equity |
1,435,190 | 26,134,093 | 3,094,309 | — | ||||||||||||||
Morgan Stanley
Global Franchise |
3,001,531 | 41,693,123 | 4,848,074 | 55,874,886 | ||||||||||||||
T. Rowe Price
Capital Appreciation |
104,681,934 | 360,809,518 | 255,040,429 | 343,067,734 | ||||||||||||||
T. Rowe Price
Equity Income |
22,961,755 | 204,767,988 | 21,746,801 | 131,909,682 | ||||||||||||||
T. Rowe Price
International Stock |
2,426,161 | 11,411,467 | 3,915,634 | — | ||||||||||||||
| Undistributed Ordinary Income |
Undistributed Long-term Capital Gains |
Unrealized Appreciation/ (Depreciation) |
||||||||||||
|---|---|---|---|---|---|---|---|---|---|---|---|---|---|---|
Government
Liquid Assets |
$ | 13,516 | $ | — | $ | — | ||||||||
Clarion Global
Real Estate |
12,255,192 | 14,559,953 | 35,132,775 | |||||||||||
Invesco Growth
and Income |
7,564,552 | 30,987,138 | 74,375,324 | |||||||||||
JPMorgan
Emerging Markets Equity |
1,707,646 | 31,734,342 | 171,696,185 | |||||||||||
Morgan Stanley
Global Franchise |
3,587,077 | 30,532,623 | 112,560,884 | |||||||||||
T. Rowe Price
Capital Appreciation |
117,314,807 | 469,741,721 | 1,131,610,742 | |||||||||||
T. Rowe Price
Equity Income |
10,790,686 | 1,198,631 | 78,275,896 | |||||||||||
T. Rowe Price
International Stock |
5,237,501 | 4,237,539 | 37,830,299 | |||||||||||
NOTE 14 — LITIGATION
Procedural History of the State Law Constructive Fraudulent Transfer Cases
NOTE 14 — LITIGATION (continued)
defendants, and because it did not resolve all of the pending motions to dismiss, it did not facilitate an appeal of the dismissal of claims against the shareholder defendants (which had been dismissed almost two years prior). On December 1, 2018, the FitzSimons Action (along with all other Tribune cases still pending in the District Court) were reassigned from Judge Sullivan to Judge Denise Cote. On December 17, 2018, the Trustee filed a motion for reconsideration of Judge Sullivan’s November 30, 2018 decision. On February 12, 2019, Judge Cote denied the Trustee’s motion for reconsideration in its entirety.
NOTE 15 — OTHER ACCOUNTING PRONOUNCEMENTS (continued)
disclaimer of opinion nor were they qualified or modified as to uncertainty, audit scope or accounting principle.
| Type | Per Share Amount |
Payable Date |
Record Date |
|||||
|---|---|---|---|---|---|---|---|---|
Government Liquid Assets |
||||||||
Class
I |
NII |
$0.0011 |
February 3, 2020 |
Daily |
||||
Class
S |
NII |
$0.0009 |
February 3, 2020 |
Daily |
||||
Class
S2 |
NII |
$0.0008 |
February 3, 2020 |
Daily |
||||
All
Classes |
STCG | $0.0001 |
February 3, 2020 |
January 30,
2020 |
||||
NII—Net investment income
STCG—Short-term capital gain
VOYA GOVERNMENT
LIQUID |
PORTFOLIO OF INVESTMENTS AS OF DECEMBER 31, 2019 |
| Principal Amount† |
Value | Percentage of Net Assets |
||||||||||
|---|---|---|---|---|---|---|---|---|---|---|---|---|
U.S.
GOVERNMENT AGENCY DEBT: 34.6% |
||||||||||||
| 2,100,000 | Federal Farm Credit Banks Funding Corp., 1.764%, (US0001M + 0.000%), 06/19/2020 |
$ | 2,100,011 | 0.3 | ||||||||
| 1,900,000 | Federal Farm Credit Banks Funding Corp., 1.772%, (US0003M + (0.130)%), 02/03/2020 |
1,900,000 | 0.3 | |||||||||
| 18,500,000 | Federal Farm Credit Banks, 1.755%, (US0001M + (0.030)%), 04/22/2020 |
18,498,417 | 2.5 | |||||||||
| 26,750,000 | Federal Farm Credit Banks, 1.791%, (US0001M + 0.010%), 07/02/2020 |
26,750,000 | 3.7 | |||||||||
| 7,750,000 | Federal Farm Credit Banks, 1.835%, (US0001M + 0.050%), 02/21/2020 |
7,750,831 | 1.1 | |||||||||
| 2,415,000 | Federal Home Loan Bank Discount Notes, 0.330%, 04/24/2020 |
2,402,955 | 0.3 | |||||||||
| 7,000,000 | Federal Home Loan Bank Discount Notes, 0.970%, 02/28/2020 |
6,982,147 | 1.0 | |||||||||
| 20,310,000 | Federal Home Loan Bank Discount Notes, 2.810%, 01/03/2020 |
20,308,533 | 2.8 | |||||||||
| 105,700,000 | Federal Home Loan Bank Discount Notes, 14.600%, 01/07/2020 |
105,674,808 | 14.5 | |||||||||
| 5,250,000 | Federal Home Loan Banks, 1.605%, (SOFRRATE + 0.065%), 03/26/2020 |
5,250,000 | 0.7 | |||||||||
| 26,000,000 | Federal Home Loan Banks, 1.670%, (SOFRRATE + 0.130%), 10/16/2020 |
26,000,000 | 3.6 | |||||||||
| 24,250,000 | Federal Home Loan Banks, 1.782%, (US0001M + (0.010)%), 03/25/2020 |
24,250,000 | 3.3 | |||||||||
| 3,500,000 | Federal Home Loan Banks, 1.852%, (US0003M + (0.150)%), 01/17/2020 |
3,499,958 | 0.5 | |||||||||
Total
U.S. Government Agency Debt (Cost $251,367,660) |
251,367,660 | 34.6 | ||||||||||
U.S.
TREASURY DEBT: 14.3% |
||||||||||||
| 104,500,000 | (1) |
United States Treasury Bill, 1.580%, 06/18/2020 |
103,741,027 | 14.3 | ||||||||
Total
U.S. Treasury Debt (Cost $103,741,027) |
103,741,027 | 14.3 | ||||||||||
U.S.
TREASURY REPURCHASE AGREEMENT: 43.2% |
||||||||||||
Repurchase Agreement: 43.2% |
||||||||||||
| 101,000,000 | Deutsche Bank Repurchase Agreement dated 12/31/2019, 1.50%, due 1/2/2020, $101,008,417 to be received upon repurchase (Collateralized by
$150,941,745, TINT, 0.00%, Market Value plus accrued interest $104,030,000 due 2/15/2028–3/15/2037), 1.500% |
101,000,000 | 13.9 | |||||||||
U.S.
TREASURY REPURCHASE AGREEMENT: (continued) |
||||||||||||
Repurchase Agreement: (continued) |
||||||||||||
| 101,000,000 | Deutsche Bank Repurchase Agreement dated 12/31/2019, 1.50%, due 1/2/2020, $101,008,697 to be received upon repurchase (Collateralized by
$74,642,100, Bond, 4.500%, Market Value plus accrued interest $103,020,131 due 8/15/2039), 1.550% |
$ | 101,000,000 | 13.9 | ||||||||
| 111,754,000 | Deutsche Bank Repurchase Agreement dated 12/31/2019, 1.55%, due 1/2/2020, $111,763,623 to be received upon repurchase (Collateralized by
$135,443,927, multiple securities, 0.00%, Market Value plus accrued interest $115,106,620 due 2/15/2028-2/15/2031), 1.550% |
111,754,000 | 15.4 | |||||||||
Total
U.S. Treasury Repurchase Agreement (Cost $313,754,000) |
313,754,000 | 43.2 | ||||||||||
| Shares | Value | Percentage of Net Assets |
||||||||||
|---|---|---|---|---|---|---|---|---|---|---|---|---|
INVESTMENT COMPANIES: 7.6% |
||||||||||||
| 33,000,000 | (2) |
BlackRock Liquidity Funds, FedFund, Institutional Class, 1.520%, 01/02/20 |
33,000,000 | 4.5 | ||||||||
| 22,500,000 | (2) |
Goldman Sachs Financial Square Government Fund — Institutional Shares, 1.550%,
01/02/20 |
22,500,000 | 3.1 | ||||||||
Total
Investment Companies (Cost $55,500,000) |
55,500,000 | 7.6 | ||||||||||
Total Investments in Securities (Cost $724,362,687) |
$ | 724,362,687 | 99.7 | |||||||||
Assets in Excess of Other Liabilities |
2,232,513 | 0.3 | ||||||||||
Net
Assets |
$ | 726,595,200 | 100.0 | |||||||||
† |
Unless otherwise indicated, principal amount is shown in USD. | |
(1) |
Represents a zero coupon bond. Rate shown reflects the effective yield as of December 31, 2019. | |
(2) |
Rate shown is the 7-day yield as of December 31, 2019. |
SOFRRATE |
Secured Overnight Financing Rate | |
US0001M |
1-month LIBOR | |
US0003M |
3-month LIBOR |
VOYA GOVERNMENT
LIQUID |
PORTFOLIO OF INVESTMENTS AS OF DECEMBER 31, 2019 (CONTINUED) |
| Quoted Prices in Active Markets for Identical Investments (Level 1) |
Significant Other Observable Inputs (Level 2) |
Significant Unobservable Inputs (Level 3) |
Fair Value at December 31, 2019 |
|||||||||||||||||
|---|---|---|---|---|---|---|---|---|---|---|---|---|---|---|---|---|---|---|---|---|
Asset
Table |
||||||||||||||||||||
Investments,
at fair value |
||||||||||||||||||||
Investment
Companies |
$ | 55,500,000 | $ | — | $ | — | $ | 55,500,000 | ||||||||||||
U.S. Government
Agency Debt |
— | 251,367,660 | — | 251,367,660 | ||||||||||||||||
U.S. Treasury
Debt |
— | 103,741,027 | — | 103,741,027 | ||||||||||||||||
U.S. Treasury
Repurchase Agreement |
— | 313,754,000 | — | 313,754,000 | ||||||||||||||||
Total
Investments, at fair value |
$ | 55,500,000 | $ | 668,862,687 | $ | — | $ | 724,362,687 | ||||||||||||
ˆ |
See Note 2, “Significant Accounting Policies” in the Notes to Financial Statements for additional information. |
| Counterparty | Government Repurchase Agreement, at fair value |
Fair Value of Non-Cash Collateral Received Including Accrued Interest(1) |
Net Amount |
|||||||||||||
|---|---|---|---|---|---|---|---|---|---|---|---|---|---|---|---|---|
Deutsche
Bank |
$ | 313,754,000 | $ | (313,754,000 | ) | $ | — | |||||||||
Totals |
$ | 313,754,000 | $ | (313,754,000 | ) | $ | — | |||||||||
(1) |
Collateral with a fair value of $322,156,751 has been pledged in connection with the above government repurchase agreement. Excess collateral received from the individual counterparty is not shown for financial reporting purposes. |
VY® CLARION
GLOBAL |
SUMMARY PORTFOLIO OF INVESTMENTS AS OF DECEMBER 31, 2019 |
| Shares | Value | Percentage of Net Assets |
||||||||||
|---|---|---|---|---|---|---|---|---|---|---|---|---|
COMMON STOCK: 99.2% |
||||||||||||
Australia: 3.5% |
||||||||||||
| 183,870 | Goodman Group |
$ | 1,727,860 | 0.8 | ||||||||
| 1,899,616 | Mirvac Group |
4,251,904 | 1.8 | |||||||||
| 418,405 | Other Securities |
2,106,662 | 0.9 | |||||||||
| 8,086,426 | 3.5 | |||||||||||
Belgium: 0.8% |
||||||||||||
| 27,813 | Other Securities |
1,827,040 | 0.8 | |||||||||
Canada: 2.0% |
||||||||||||
| 91,315 | Canadian Apartment Properties REIT |
3,727,702 | 1.6 | |||||||||
| 93,200 | Other Securities |
997,636 | 0.4 | |||||||||
| 4,725,338 | 2.0 | |||||||||||
Finland: 0.4% |
||||||||||||
| 49,666 | Other Securities |
902,512 | 0.4 | |||||||||
France: 2.7% |
||||||||||||
| 16,613 | ICADE |
1,808,949 | 0.8 | |||||||||
| 23,285 | Unibail-Rodamco-Westfield |
3,673,623 | 1.6 | |||||||||
| 20,737 | Other Securities |
788,921 | 0.3 | |||||||||
| 6,271,493 | 2.7 | |||||||||||
Germany: 4.2% |
||||||||||||
| 60,486 | Vonovia SE |
3,248,679 | 1.4 | |||||||||
| 252,278 | Other Securities |
6,616,877 | 2.8 | |||||||||
| 9,865,556 | 4.2 | |||||||||||
Hong Kong: 6.3% |
||||||||||||
| 703,842 | Link
REIT |
7,456,487 | 3.2 | |||||||||
| 1,974,000 | Sino Land Co. |
2,865,278 | 1.2 | |||||||||
| 1,894,500 | Other Securities |
4,452,581 | 1.9 | |||||||||
| 14,774,346 | 6.3 | |||||||||||
Ireland: 0.4% |
||||||||||||
| 556,353 | Other Securities |
891,163 | 0.4 | |||||||||
Japan: 11.9% |
||||||||||||
| 53,300 | Aeon
Mall Co., Ltd. |
945,410 | 0.4 | |||||||||
| 1,048 | AEON
REIT Investment Corp. |
1,434,985 | 0.6 | |||||||||
| 3,817 | GLP
J-Reit |
4,738,975 | 2.0 | |||||||||
| 1,277 | LaSalle Logiport REIT |
1,898,229 | 0.8 | |||||||||
| 265,700 | Mitsubishi Estate Co., Ltd. |
5,084,137 | 2.2 | |||||||||
| 87,729 | Mitsui
Fudosan Co., Ltd. |
2,144,091 | 0.9 | |||||||||
| 2,174 | Orix
JREIT, Inc. |
4,712,239 | 2.0 | |||||||||
| 117,800 | Tokyo Tatemono Co., Ltd. |
1,838,717 | 0.8 | |||||||||
| 60,746 | Other Securities |
5,107,611 | 2.2 | |||||||||
| 27,904,394 | 11.9 | |||||||||||
Luxembourg: 0.6% |
||||||||||||
| 62,606 | Other Securities |
1,502,616 | 0.6 | |||||||||
Norway: 0.8% |
||||||||||||
| 111,708 | (1) |
Entra ASA |
1,846,739 | 0.8 | ||||||||
| Shares | Value | Percentage of Net Assets |
||||||||||
COMMON STOCK: (continued) |
||||||||||||
Singapore: 2.5% |
||||||||||||
| 1,406,400 | CapitaLand Ltd. |
$ | 3,924,584 | 1.7 | ||||||||
| 1,515,099 | Mapletree Logistics Trust |
1,959,796 | 0.8 | |||||||||
| 5,884,380 | 2.5 | |||||||||||
Spain: 0.4% |
||||||||||||
| 71,094 | Other Securities |
1,021,864 | 0.4 | |||||||||
Sweden: 2.7% |
||||||||||||
| 119,581 | Castellum AB |
2,808,759 | 1.2 | |||||||||
| 133,467 | Fabege AB |
2,217,043 | 0.9 | |||||||||
| 102,578 | Other Securities |
1,413,892 | 0.6 | |||||||||
| 6,439,694 | 2.7 | |||||||||||
United Kingdom: 6.0% |
||||||||||||
| 36,607 | Derwent London PLC |
1,944,447 | 0.8 | |||||||||
| 304,792 | Segro
PLC |
3,629,326 | 1.6 | |||||||||
| 601,898 | (1) |
Tritax
EuroBox PLC |
755,018 | 0.3 | ||||||||
| 169,797 | Unite Group PLC |
2,833,924 | 1.2 | |||||||||
| 435,644 | Other Securities |
4,871,832 | 2.1 | |||||||||
| 14,034,547 | 6.0 | |||||||||||
United States: 54.0% |
||||||||||||
| 30,060 | Alexandria Real Estate Equities, Inc. |
4,857,095 | 2.1 | |||||||||
| 62,935 | American Campus Communities, Inc. |
2,959,833 | 1.3 | |||||||||
| 113,339 | Brandywine Realty Trust |
1,785,089 | 0.8 | |||||||||
| 181,709 | Brixmor Property Group, Inc. |
3,926,731 | 1.7 | |||||||||
| 36,047 | Camden
Property Trust |
3,824,587 | 1.6 | |||||||||
| 76,684 | Cousins Properties, Inc. |
3,159,381 | 1.3 | |||||||||
| 28,934 | Crown
Castle International Corp. |
4,112,968 | 1.8 | |||||||||
| 92,907 | CubeSmart |
2,924,712 | 1.2 | |||||||||
| 60,068 | CyrusOne, Inc. |
3,930,249 | 1.7 | |||||||||
| 73,631 | Duke
Realty Corp. |
2,552,787 | 1.1 | |||||||||
| 3,994 | Equinix, Inc. |
2,331,298 | 1.0 | |||||||||
| 95,912 | Equity
Residential |
7,761,199 | 3.3 | |||||||||
| 15,318 | Essex
Property Trust, Inc. |
4,608,573 | 2.0 | |||||||||
| 112,020 | Healthcare Trust of America, Inc. |
3,391,966 | 1.4 | |||||||||
| 129,783 | Healthpeak Properties, Inc. |
4,473,620 | 1.9 | |||||||||
| 199,980 | Host
Hotels & Resorts, Inc. |
3,709,629 | 1.6 | |||||||||
| 83,820 | Hudson
Pacific Properties, Inc. |
3,155,823 | 1.3 | |||||||||
| 213,114 | Invitation Homes, Inc. |
6,387,027 | 2.7 | |||||||||
| 102,984 | Medical Properties Trust, Inc. |
2,173,992 | 0.9 | |||||||||
| 90,298 | MGM
Growth Properties LLC |
2,796,529 | 1.2 | |||||||||
| 81,202 | Piedmont Office Realty Trust, Inc. |
1,805,932 | 0.8 | |||||||||
| 133,295 | ProLogis, Inc. |
11,881,916 | 5.1 | |||||||||
| 137,929 | Retail
Properties of America, Inc. |
1,848,249 | 0.8 | |||||||||
| 49,331 | Simon
Property Group, Inc. |
7,348,346 | 3.1 | |||||||||
| 116,627 | STORE
Capital Corp. |
4,343,189 | 1.8 | |||||||||
VY® CLARION
GLOBAL |
SUMMARY PORTFOLIO OF INVESTMENTS AS OF DECEMBER 31, 2019 (CONTINUED) |
| Shares | Value | Percentage of Net Assets |
||||||||||
|---|---|---|---|---|---|---|---|---|---|---|---|---|
COMMON STOCK: (continued) |
||||||||||||
United States: (continued) |
||||||||||||
| 623,100 | VEREIT, Inc. |
$ | 5,757,444 | 2.5 | ||||||||
| 167,270 | VICI
Properties, Inc. |
4,273,749 | 1.8 | |||||||||
| 62,306 | Welltower, Inc. |
5,095,385 | 2.2 | |||||||||
| 399,583 | (2) |
Other Securities |
9,370,453 | 4.0 | ||||||||
| 126,547,751 | 54.0 | |||||||||||
Total
Common Stock (Cost $184,978,901) |
232,525,859 | 99.2 | ||||||||||
| Principal Amount† |
Value | Percentage of Net Assets |
||||||||||
|---|---|---|---|---|---|---|---|---|---|---|---|---|
SHORT-TERM INVESTMENTS: 0.3% |
||||||||||||
Repurchase Agreements: 0.3% |
||||||||||||
| 632,792 | (3) |
RBC Dominion Securities Inc., Repurchase Agreement dated 12/31/19, 1.57%, due 01/02/20 (Repurchase Amount
$632,846, collateralized by various U.S. Government/U.S. Government Agency Obligations, 0.000%–6.500%, Market Value plus accrued interest
$645,448, due 06/30/21–12/01/49) (Cost $632,792) |
632,792 | 0.3 | ||||||||
Total
Short-Term Investments (Cost $632,792) |
632,792 | 0.3 | ||||||||||
Total Investments in Securities (Cost $185,611,693) |
$ | 233,158,651 | 99.5 | |||||||||
Assets in Excess of Other Liabilities |
1,215,681 | 0.5 | ||||||||||
Net
Assets |
$ | 234,374,332 | 100.0 | |||||||||
† |
Unless otherwise indicated, principal amount is shown in USD. | |
(1) |
Securities with purchases pursuant to Rule 144A or section 4(a)(2), under the Securities Act of 1933 and may not be resold subject to that rule except to qualified institutional buyers. | |
(2) |
The grouping contains securities on loan. | |
(3) |
All or a portion of the security represents securities purchased with cash collateral received for securities on loan. |
| REIT Diversification | Percentage of Net Assets |
|||||
|---|---|---|---|---|---|---|
Residential
REITs |
14.1 | % | ||||
Industrial
REITs |
13.2 | |||||
Retail
REITs |
12.9 | |||||
Office
REITs |
12.5 | |||||
Specialized
REITs |
9.2 | |||||
Real Estate
Operating Companies |
9.1 | |||||
Diversified
REITs |
8.7 | |||||
Diversified Real
Estate Activities |
7.8 | |||||
Health Care
REITs |
6.4 | |||||
Hotel &
Resort REITs |
3.4 | |||||
Real Estate
Development |
1.2 | |||||
Health Care
Facilities |
0.4 | |||||
Hotels, Resorts & Cruise Lines |
0.3 | |||||
Assets in Excess
of Other Liabilities* |
0.8 | |||||
Net
Assets |
100.0 | % | ||||
* |
Includes short-term investments. |
| Quoted Prices in Active Markets for Identical Investments (Level 1) |
Significant Other Observable Inputs# (Level 2) |
Significant Unobservable Inputs (Level 3) |
Fair Value at December 31, 2019 |
|||||||||||||||||
|---|---|---|---|---|---|---|---|---|---|---|---|---|---|---|---|---|---|---|---|---|
Asset
Table |
||||||||||||||||||||
Investments,
at fair value |
||||||||||||||||||||
Common
Stock |
||||||||||||||||||||
Australia |
$ | 930,848 | $ | 7,155,578 | $ | — | $ | 8,086,426 | ||||||||||||
Belgium |
857,723 | 969,317 | — | 1,827,040 | ||||||||||||||||
Canada |
4,725,338 | — | — | 4,725,338 | ||||||||||||||||
Finland |
902,512 | — | — | 902,512 | ||||||||||||||||
France |
3,673,623 | 2,597,870 | — | 6,271,493 | ||||||||||||||||
Germany |
4,290,162 | 5,575,394 | — | 9,865,556 | ||||||||||||||||
Hong
Kong |
— | 14,774,346 | — | 14,774,346 | ||||||||||||||||
Ireland |
891,163 | — | — | 891,163 | ||||||||||||||||
Japan |
5,767,055 | 22,137,339 | — | 27,904,394 | ||||||||||||||||
Luxembourg |
— | 1,502,616 | — | 1,502,616 | ||||||||||||||||
VY® CLARION
GLOBAL |
SUMMARY PORTFOLIO OF INVESTMENTS AS OF DECEMBER 31, 2019 (CONTINUED) |
| Quoted Prices in Active Markets for Identical Investments (Level 1) |
Significant Other Observable Inputs# (Level 2) |
Significant Unobservable Inputs (Level 3) |
Fair Value at December 31, 2019 | |||||||||||||||||
|---|---|---|---|---|---|---|---|---|---|---|---|---|---|---|---|---|---|---|---|---|
Common Stock
(continued) |
||||||||||||||||||||
Norway |
$ | — | $ | 1,846,739 | $ | — | $ | 1,846,739 | ||||||||||||
Singapore |
— | 5,884,380 | — | 5,884,380 | ||||||||||||||||
Spain |
— | 1,021,864 | — | 1,021,864 | ||||||||||||||||
Sweden |
4,222,651 | 2,217,043 | — | 6,439,694 | ||||||||||||||||
United
Kingdom |
7,132,884 | 6,901,663 | — | 14,034,547 | ||||||||||||||||
United
States |
126,547,751 | — | — | 126,547,751 | ||||||||||||||||
Total Common
Stock |
159,941,710 | 72,584,149 | — | 232,525,859 | ||||||||||||||||
Short-Term
Investments |
— | 632,792 | — | 632,792 | ||||||||||||||||
Total
Investments, at fair value |
$ | 159,941,710 | $ | 73,216,941 | $ | — | $ | 233,158,651 | ||||||||||||
Other
Financial Instruments+ |
||||||||||||||||||||
Forward Foreign
Currency Contracts |
— | 65 | — | 65 | ||||||||||||||||
Total
Assets |
$ | 159,941,710 | $ | 73,217,006 | $ | — | $ | 233,158,716 | ||||||||||||
ˆ |
See Note 2, “Significant Accounting Policies” in the Notes to Financial Statements for additional information. |
+ |
Other Financial Instruments may include open forward foreign currency contracts, futures, centrally cleared swaps, OTC swaps and written options. Forward foreign currency contracts, futures and centrally cleared swaps are valued at the unrealized gain (loss) on the instrument. OTC swaps and written options are valued at the fair value of the instrument. |
# |
The earlier close of the foreign markets gives rise to the possibility that significant events, including broad market moves, may have occurred in the interim and may materially affect the value of those securities. To account for this, the Portfolio may frequently value many of its foreign equity securities using fair value prices based on third party vendor modeling tools to the extent available. Accordingly, a portion of the Portfolio’s investments are categorized as Level 2 investments. |
| Derivatives not accounted for as hedging instruments |
Location on Statement of Assets and Liabilities |
Fair Value | |||||||
|---|---|---|---|---|---|---|---|---|---|
Asset
Derivatives |
|||||||||
Foreign exchange
contracts |
Unrealized
appreciation on forward foreign currency contracts |
$ | 65 | ||||||
Total Asset
Derivatives |
$ | 65 | |||||||
| Amount of Realized Gain or (Loss) on Derivatives Recognized in Income |
||||||
|---|---|---|---|---|---|---|
| Derivatives not accounted for as hedging instruments | Forward foreign currency contracts |
|||||
Foreign exchange
contracts |
$ | (31,124 | ) | |||
Total |
$ | (31,124 | ) | |||
| Change in Unrealized Appreciation or (Depreciation) on Derivatives Recognized in Income |
||||||
|---|---|---|---|---|---|---|
| Derivatives not accounted for as hedging instruments | Forward foreign currency contracts |
|||||
Foreign exchange
contracts |
$ | 12,954 | ||||
Total |
$ | 12,954 | ||||
| Cost for federal income tax purposes was $198,027,407. |
Net unrealized
appreciation consisted of: |
||||||
Gross
Unrealized Appreciation |
$ | 41,003,581 | ||||
Gross
Unrealized Depreciation |
(5,870,806 | ) | ||||
Net Unrealized
Appreciation |
$ | 35,132,775 |
VY® INVESCO
GROWTH |
SUMMARY PORTFOLIO OF INVESTMENTS AS OF DECEMBER 31, 2019 |
| Shares | Value | Percentage of Net Assets |
||||||||||
|---|---|---|---|---|---|---|---|---|---|---|---|---|
COMMON STOCK: 96.6% |
||||||||||||
Communication Services: 4.0% |
||||||||||||
| 13,886 | (1) |
Charter Communications, Inc. |
$ | 6,735,821 | 1.5 | |||||||
| 117,538 | Comcast Corp. — Class A |
5,285,684 | 1.2 | |||||||||
| 2,829,045 | Vodafone Group PLC |
5,492,272 | 1.3 | |||||||||
| 17,513,777 | 4.0 | |||||||||||
Consumer Discretionary: 8.6% |
||||||||||||
| 216,734 | (1) |
Capri
Holdings Ltd. |
8,268,402 | 1.9 | ||||||||
| 175,922 | Carnival Corp. |
8,942,115 | 2.0 | |||||||||
| 154,147 | eBay,
Inc. |
5,566,248 | 1.3 | |||||||||
| 317,193 | General Motors Co. |
11,609,264 | 2.6 | |||||||||
| 1,306,532 | Other Securities |
3,761,177 | 0.8 | |||||||||
| 38,147,206 | 8.6 | |||||||||||
Consumer Staples: 7.8% |
||||||||||||
| 67,231 | Kellogg Co. |
4,649,696 | 1.0 | |||||||||
| 153,226 | Mondelez International, Inc. |
8,439,688 | 1.9 | |||||||||
| 165,055 | Philip
Morris International, Inc. |
14,044,530 | 3.2 | |||||||||
| 177,501 | (1) |
US Foods Holding Corp. |
7,435,517 | 1.7 | ||||||||
| 34,569,431 | 7.8 | |||||||||||
Energy: 10.6% |
||||||||||||
| 1,124,908 | BP
PLC |
7,076,626 | 1.6 | |||||||||
| 188,897 | Canadian Natural Resources Ltd. |
6,109,641 | 1.4 | |||||||||
| 55,200 | Chevron Corp. |
6,652,152 | 1.5 | |||||||||
| 244,570 | Devon
Energy Corp. |
6,351,483 | 1.4 | |||||||||
| 423,607 | Marathon Oil Corp. |
5,752,583 | 1.3 | |||||||||
| 315,954 | Royal
Dutch Shell PLC — Class A |
9,356,794 | 2.1 | |||||||||
| 260,814 | TechnipFMC PLC |
5,591,852 | 1.3 | |||||||||
| 46,891,131 | 10.6 | |||||||||||
Financials: 25.5% |
||||||||||||
| 248,608 | American International Group, Inc. |
12,761,049 | 2.9 | |||||||||
| 430,454 | Bank
of America Corp. |
15,160,590 | 3.4 | |||||||||
| 171,244 | Citigroup, Inc. |
13,680,683 | 3.1 | |||||||||
| 217,724 | Citizens Financial Group, Inc. |
8,841,772 | 2.0 | |||||||||
| 38,963 | Goldman Sachs Group, Inc. |
8,958,763 | 2.0 | |||||||||
| 53,688 | JPMorgan Chase & Co. |
7,484,107 | 1.7 | |||||||||
| 229,603 | Morgan
Stanley |
11,737,305 | 2.6 | |||||||||
| 69,801 | PNC
Financial Services Group, Inc. |
11,142,334 | 2.5 | |||||||||
| 141,208 | Truist
Financial Corp. |
7,952,834 | 1.8 | |||||||||
| 95,074 | Wells
Fargo & Co. |
5,114,981 | 1.1 | |||||||||
| 32,544 | Willis Towers Watson PLC |
6,571,935 | 1.5 | |||||||||
| 155,213 | Other Securities |
3,846,178 | 0.9 | |||||||||
| 113,252,531 | 25.5 | |||||||||||
Health Care: 16.4% |
||||||||||||
| 19,201 | Anthem, Inc. |
5,799,278 | 1.3 | |||||||||
| 136,415 | Bristol-Myers Squibb Co. |
8,756,479 | 2.0 | |||||||||
| 94,574 | CVS
Health Corp. |
7,025,902 | 1.6 | |||||||||
| 110,062 | Johnson & Johnson |
16,054,744 | 3.6 | |||||||||
| 43,587 | McKesson Corp. |
6,028,954 | 1.3 | |||||||||
| 53,243 | Medtronic PLC |
6,040,418 | 1.4 | |||||||||
| 65,304 | Sanofi |
6,558,344 | 1.5 | |||||||||
| 39,589 | Zimmer Biomet Holdings, Inc. |
5,925,682 | 1.3 | |||||||||
| 301,661 | (2) |
Other Securities |
10,613,404 | 2.4 | ||||||||
| 72,803,205 | 16.4 | |||||||||||
| Shares | Value | Percentage of Net Assets |
||||||||||
COMMON STOCK: (continued) |
||||||||||||
Industrials: 6.6% |
||||||||||||
| 93,495 | CSX
Corp. |
$ | 6,765,298 | 1.5 | ||||||||
| 54,452 | General Dynamics Corp. |
9,602,610 | 2.2 | |||||||||
| 51,218 | Ingersoll-Rand PLC — Class A |
6,807,897 | 1.5 | |||||||||
| 148,742 | Johnson Controls International plc |
6,055,287 | 1.4 | |||||||||
| 29,231,092 | 6.6 | |||||||||||
Information Technology: 10.9% |
||||||||||||
| 25,246 | Apple,
Inc. |
7,413,488 | 1.7 | |||||||||
| 99,086 | Cisco
Systems, Inc. |
4,752,164 | 1.1 | |||||||||
| 121,813 | Cognizant Technology Solutions Corp. |
7,554,842 | 1.7 | |||||||||
| 140,560 | Intel
Corp. |
8,412,516 | 1.9 | |||||||||
| 37,137 | NXP
Semiconductor NV — NXPI — US |
4,726,055 | 1.1 | |||||||||
| 159,015 | Oracle
Corp. |
8,424,615 | 1.9 | |||||||||
| 78,138 | Qualcomm, Inc. |
6,894,116 | 1.5 | |||||||||
| 48,177,796 | 10.9 | |||||||||||
Materials: 4.1% |
||||||||||||
| 239,699 | Corteva, Inc. |
7,085,503 | 1.6 | |||||||||
| 76,962 | Dow, Inc. |
4,212,130 | 0.9 | |||||||||
| 125,436 | (3) |
Other Securities |
6,934,650 | 1.6 | ||||||||
| 18,232,283 | 4.1 | |||||||||||
Utilities: 2.1% |
||||||||||||
| 174,389 | Other Securities |
9,389,387 | 2.1 | |||||||||
Total
Common Stock (Cost $352,519,931) |
428,207,839 | 96.6 | ||||||||||
| Principal Amount† |
Value | Percentage of Net Assets |
||||||||||
|---|---|---|---|---|---|---|---|---|---|---|---|---|
SHORT-TERM INVESTMENTS: 4.2% |
||||||||||||
Repurchase Agreements: 0.7% |
||||||||||||
| 1,000,000 | (4) |
Bank
of Nova Scotia, Repurchase Agreement dated 12/31/19, 1.57%, due 01/02/20 (Repurchase Amount $1,000,086, collateralized by various U.S. Government
Agency Obligations, 2.500%–6.500%, Market Value plus accrued interest $1,020,089, due 09/01/24–11/01/49) |
1,000,000 | 0.2 | ||||||||
| 296,644 | (4) |
Citadel Securities LLC, Repurchase Agreement dated 12/31/19, 1.60%, due 01/02/20 (Repurchase Amount $296,670, collateralized by various U.S.
Government Securities, 0.000%–8.500%, Market Value plus accrued interest $302,604, due 01/15/20–11/15/48) |
296,644 | 0.1 | ||||||||
VY® INVESCO
GROWTH |
SUMMARY PORTFOLIO OF INVESTMENTS AS OF DECEMBER 31, 2019 (CONTINUED) |
| Principal Amount† |
Value | Percentage of Net Assets |
||||||||||
|---|---|---|---|---|---|---|---|---|---|---|---|---|
SHORT-TERM INVESTMENTS: (continued) |
||||||||||||
Repurchase Agreements: (continued) |
||||||||||||
| 1,000,000 | (4) |
Citigroup, Inc., Repurchase Agreement dated 12/31/19, 1.57%, due 01/02/20 (Repurchase Amount $1,000,086, collateralized by various U.S.
Government/U.S. Government Agency Obligations, 0.000%–9.000%, Market Value plus accrued interest $1,020,000, due
02/13/20–09/20/69) |
$ | 1,000,000 | 0.2 | |||||||
| 1,000,000 | (4) |
Daiwa
Capital Markets, Repurchase Agreement dated 12/31/19, 1.58%, due 01/02/20 (Repurchase Amount $1,000,087, collateralized by various U.S. Government/U.S.
Government Agency Obligations, 0.000%–6.030%, Market Value plus accrued interest $1,020,000, due 01/14/20–12/20/49) |
1,000,000 | 0.2 | ||||||||
Total
Repurchase Agreements (Cost $3,296,644) |
3,296,644 | 0.7 | ||||||||||
| Shares | Value | Percentage of Net Assets |
||||||||||
|---|---|---|---|---|---|---|---|---|---|---|---|---|
SHORT-TERM INVESTMENTS: (continued) |
||||||||||||
Mutual Funds: 3.5% |
||||||||||||
| 15,458,088 | (5) |
BlackRock Liquidity Funds, FedFund, Institutional Class, 1.520% (Cost $15,458,088) |
$ | 15,458,088 | 3.5 | |||||||
Total
Short-Term Investments |
||||||||||||
(Cost
$18,754,732) |
18,754,732 | 4.2 | ||||||||||
Total Investments in Securities (Cost $371,274,663) |
$ | 446,962,571 | 100.8 | |||||||||
Liabilities in Excess of Other Assets |
(3,570,905 | ) | (0.8 | ) | ||||||||
Net
Assets |
$ | 443,391,666 | 100.0 | |||||||||
† |
Unless otherwise indicated, principal amount is shown in USD. |
(1) |
Non-income producing security. |
(2) |
The grouping contains non-income producing securities. |
(3) |
The grouping contains securities on loan. |
(4) |
All or a portion of the security represents securities purchased with cash collateral received for securities on loan. |
(5) |
Rate shown is the 7-day yield as of December 31, 2019. |
| Quoted Prices in Active Markets for Identical Investments (Level 1) |
Significant Other Observable Inputs# (Level 2) |
Significant Unobservable Inputs (Level 3) |
Fair Value at December 31, 2019 |
|||||||||||||||||
|---|---|---|---|---|---|---|---|---|---|---|---|---|---|---|---|---|---|---|---|---|
Asset
Table |
||||||||||||||||||||
Investments,
at fair value |
||||||||||||||||||||
Common
Stock |
||||||||||||||||||||
Communication
Services |
$ | 12,021,505 | $ | 5,492,272 | $ | — | $ | 17,513,777 | ||||||||||||
Consumer
Discretionary |
34,386,029 | 3,761,177 | — | 38,147,206 | ||||||||||||||||
Consumer
Staples |
34,569,431 | — | — | 34,569,431 | ||||||||||||||||
Energy |
30,457,711 | 16,433,420 | — | 46,891,131 | ||||||||||||||||
Financials |
113,252,531 | — | — | 113,252,531 | ||||||||||||||||
Health Care |
59,664,529 | 13,138,676 | — | 72,803,205 | ||||||||||||||||
Industrials |
29,231,092 | — | — | 29,231,092 | ||||||||||||||||
Information
Technology |
48,177,796 | — | — | 48,177,796 | ||||||||||||||||
Materials |
18,232,283 | — | — | 18,232,283 | ||||||||||||||||
Utilities |
9,389,387 | — | — | 9,389,387 | ||||||||||||||||
Total Common
Stock |
389,382,294 | 38,825,545 | — | 428,207,839 | ||||||||||||||||
Short-Term
Investments |
15,458,088 | 3,296,644 | — | 18,754,732 | ||||||||||||||||
Total
Investments, at fair value |
$ | 404,840,382 | $ | 42,122,189 | $ | — | $ | 446,962,571 | ||||||||||||
Other
Financial Instruments+ |
||||||||||||||||||||
Forward Foreign
Currency Contracts |
— | 8,521 | — | 8,521 | ||||||||||||||||
Total
Assets |
$ | 404,840,382 | $ | 42,130,710 | $ | — | $ | 446,971,092 | ||||||||||||
Liabilities
Table |
||||||||||||||||||||
Other
Financial Instruments+ |
||||||||||||||||||||
Forward Foreign
Currency Contracts |
$ | — | $ | (711,215 | ) | $ | — | $ | (711,215 | ) | ||||||||||
Total
Liabilities |
$ | — | $ | (711,215 | ) | $ | — | $ | (711,215 | ) | ||||||||||
VY® INVESCO
GROWTH |
SUMMARY PORTFOLIO OF INVESTMENTS AS OF DECEMBER 31, 2019 (CONTINUED) |
ˆ |
See Note 2, “Significant Accounting Policies” in the Notes to Financial Statements for additional information. | |
+ |
Other Financial Instruments may include open forward foreign currency contracts, futures, centrally cleared swaps, OTC swaps and written options. Forward foreign currency contracts, futures and centrally cleared swaps are valued at the unrealized gain (loss) on the instrument. OTC swaps and written options are valued at the fair value of the instrument. | |
# |
The earlier close of the foreign markets gives rise to the possibility that significant events, including broad market moves, may have occurred in the interim and may materially affect the value of those securities. To account for this, the Portfolio may frequently value many of its foreign equity securities using fair value prices based on third party vendor modeling tools to the extent available. Accordingly, a portion of the Portfolio’s investments are categorized as Level 2 investments. |
| Currency Purchased | Currency Sold | Counterparty | Settlement Date |
Unrealized Appreciation (Depreciation) |
|||||||||||
|---|---|---|---|---|---|---|---|---|---|---|---|---|---|---|---|
USD
335,590 |
GBP
256,551 |
State Street
Bank and Trust Co. |
01/17/20 | $ | (4,381 | ) | |||||||||
USD
45,451 |
CHF
44,538 |
State Street
Bank and Trust Co. |
01/17/20 | (617 | ) | ||||||||||
USD
155,162 |
CAD
204,009 |
State Street
Bank and Trust Co. |
01/17/20 | (1,955 | ) | ||||||||||
USD
679,206 |
GBP
518,554 |
State Street
Bank and Trust Co. |
01/17/20 | (7,959 | ) | ||||||||||
USD
79,363 |
EUR
71,019 |
State Street
Bank and Trust Co. |
01/17/20 | (370 | ) | ||||||||||
USD
65,641 |
EUR
58,773 |
State Street
Bank and Trust Co. |
01/17/20 | (344 | ) | ||||||||||
USD
130,100 |
CAD
171,424 |
State Street
Bank and Trust Co. |
01/17/20 | (1,922 | ) | ||||||||||
USD
37,451 |
CHF
36,753 |
State Street
Bank and Trust Co. |
01/17/20 | (564 | ) | ||||||||||
USD
70,482 |
EUR
63,182 |
State Street
Bank and Trust Co. |
01/17/20 | (453 | ) | ||||||||||
CHF
42,375 |
USD
43,269 |
State Street
Bank and Trust Co. |
01/17/20 | 561 | |||||||||||
USD
262,500 |
EUR
235,094 |
State Street
Bank and Trust Co. |
01/17/20 | (1,442 | ) | ||||||||||
EUR
99,426 |
USD
110,645 |
State Street
Bank and Trust Co. |
01/17/20 | 981 | |||||||||||
USD
679,102 |
GBP
515,633 |
State Street
Bank and Trust Co. |
01/17/20 | (4,194 | ) | ||||||||||
USD
161,698 |
CAD
213,926 |
State Street
Bank and Trust Co. |
01/17/20 | (3,056 | ) | ||||||||||
USD
74,722 |
EUR
67,100 |
State Street
Bank and Trust Co. |
01/17/20 | (612 | ) | ||||||||||
USD
127,970 |
CAD
168,589 |
State Street
Bank and Trust Co. |
01/17/20 | (1,869 | ) | ||||||||||
CAD
127,505 |
USD
96,631 |
State Street
Bank and Trust Co. |
01/17/20 | 1,566 | |||||||||||
GBP
311,824 |
USD
408,881 |
State Street
Bank and Trust Co. |
01/17/20 | 4,336 | |||||||||||
EUR
97,466 |
USD
108,349 |
State Street
Bank and Trust Co. |
01/17/20 | 1,077 | |||||||||||
USD
2,411,527 |
CHF
2,387,267 |
State Street
Bank and Trust Co. |
01/17/20 | (57,719 | ) | ||||||||||
USD
3,955,524 |
CAD
5,257,476 |
State Street
Bank and Trust Co. |
01/17/20 | (93,510 | ) | ||||||||||
USD
4,596,132 |
EUR
4,139,131 |
State Street
Bank and Trust Co. |
01/17/20 | (50,915 | ) | ||||||||||
USD
10,218,183 |
GBP
7,889,246 |
State Street
Bank and Trust Co. |
01/17/20 | (236,312 | ) | ||||||||||
CHF
56,645 |
USD
58,587 |
State Street
Bank and Trust Co. |
01/17/20 | (234 | ) | ||||||||||
GBP
226,083 |
USD
299,485 |
State Street
Bank and Trust Co. |
01/17/20 | (2,351 | ) | ||||||||||
USD
10,251,509 |
GBP
7,917,507 |
The Bank of New
York Mellon |
01/17/20 | (240,436 | ) | ||||||||||
| $ | (702,694 | ) | |||||||||||||
| Currency Abbreviations | ||
CAD |
— Canadian Dollar | |
CHF |
— Swiss Franc |
EUR |
— EU Euro |
GBP |
— British Pound |
USD |
— United States Dollar |
VY® INVESCO
GROWTH |
SUMMARY PORTFOLIO OF INVESTMENTS AS OF DECEMBER 31, 2019 (CONTINUED) |
| Derivatives not accounted for as hedging instruments |
Location on Statement of Assets and Liabilities |
Fair Value | |||||||
|---|---|---|---|---|---|---|---|---|---|
Asset
Derivatives |
|||||||||
Foreign exchange
contracts |
Unrealized
appreciation on forward foreign currency contracts |
$ | 8,521 | ||||||
Total Asset
Derivatives |
$ | 8,521 | |||||||
Liability
Derivatives |
|||||||||
Foreign exchange
contracts |
Unrealized
depreciation on forward foreign currency contracts |
$ | 711,215 | ||||||
Total Liability
Derivatives |
$ | 711,215 | |||||||
| Amount of Realized Gain or (Loss) on Derivatives Recognized in Income |
||||||
|---|---|---|---|---|---|---|
| Derivatives not accounted for as hedging
instruments |
Forward foreign currency contracts |
|||||
Foreign exchange
contracts |
$ | 309,376 | ||||
Total |
$ | 309,376 | ||||
| Change in Unrealized Appreciation or (Depreciation) on Derivatives Recognized in Income |
||||||
|---|---|---|---|---|---|---|
| Derivatives not accounted for as hedging instruments | Forward foreign currency contracts |
|||||
Foreign exchange
contracts |
$ | (645,803 | ) | |||
Total |
$ | (645,803 | ) | |||
| State Street Bank and Trust Co. |
The Bank of New York Mellon |
Totals | ||||||||||||||
|---|---|---|---|---|---|---|---|---|---|---|---|---|---|---|---|---|
Assets: |
||||||||||||||||
Forward foreign
currency contracts |
$ | 8,521 | $ | — | $ | 8,521 | ||||||||||
Total
Assets |
$ | 8,521 | $ | — | $ | 8,521 | ||||||||||
Liabilities: |
||||||||||||||||
Forward foreign
currency contracts |
$ | 470,779 | $ | 240,436 | $ | 711,215 | ||||||||||
Total
Liabilities |
$ | 470,779 | $ | 240,436 | $ | 711,215 | ||||||||||
Net OTC
derivative instruments by counterparty, at fair value |
$ | (462,258 | ) | $ | (240,436 | ) | (702,694 | ) | ||||||||
Total
collateral pledged by the Portfolio/(Received from counterparty) |
$ | — | $ | — | $ | — | ||||||||||
Net
Exposure(1) |
$ | (462,258 | ) | $ | (240,436 | ) | $ | (702,694 | ) | |||||||
(1) |
Positive net exposure represents amounts due from each respective counterparty. Negative exposure represents amounts due from the Portfolio. Please refer to Note 2 for additional details regarding counterparty credit risk and credit related contingent features. |
| Cost for federal income tax purposes was $372,137,549. |
Net unrealized
appreciation consisted of: |
||||||
Gross
Unrealized Appreciation |
$ | 89,123,566 | ||||
Gross
Unrealized Depreciation |
(14,748,242 | ) | ||||
Net Unrealized
Appreciation |
$ | 74,375,324 |
VY® JPMORGAN
EMERGING |
SUMMARY PORTFOLIO OF INVESTMENTS AS OF DECEMBER 31, 2019 |
| Shares | Value | Percentage of Net Assets |
||||||||||
|---|---|---|---|---|---|---|---|---|---|---|---|---|
COMMON STOCK: 98.7% |
||||||||||||
Argentina: 1.5% |
||||||||||||
| 13,888 | (1) |
MercadoLibre, Inc. |
$ | 7,943,103 | 1.5 | |||||||
Australia: 0.2% |
||||||||||||
| 161,935 | Other Securities |
825,713 | 0.2 | |||||||||
Brazil: 5.1% |
||||||||||||
| 1,332,434 | Ambev
SA ADR |
6,209,142 | 1.2 | |||||||||
| 601,970 | B3 SA
— Brasil Bolsa Balcao |
6,430,172 | 1.2 | |||||||||
| 441,285 | Lojas Renner SA |
6,163,971 | 1.2 | |||||||||
| 228,461 | (2) |
Other Securities |
7,552,031 | 1.5 | ||||||||
| 26,355,316 | 5.1 | |||||||||||
China: 29.1% |
||||||||||||
| 134,592 | (1) |
Alibaba Group Holding Ltd. ADR |
28,546,963 | 5.6 | ||||||||
| 2,631,300 | (1),(3) |
Budweiser Brewing Co. APAC Ltd. |
8,880,971 | 1.7 | ||||||||
| 366,876 | Foshan
Haitian Flavouring & Food Co. Ltd. — A Shares |
5,672,285 | 1.1 | |||||||||
| 149,816 | Huazhu
Group Ltd. ADR |
6,003,127 | 1.2 | |||||||||
| 34,600 | Kweichow Moutai Co. Ltd. — A Shares |
5,888,136 | 1.2 | |||||||||
| 555,577 | (1) |
Meituan Dianping- Class B |
7,259,255 | 1.4 | ||||||||
| 702,200 | Midea
Group Co. Ltd. — A Shares |
5,887,406 | 1.1 | |||||||||
| 21,487 | NetEase, Inc. ADR |
6,588,774 | 1.3 | |||||||||
| 57,105 | (1) |
New
Oriental Education & Technology Group, Inc. ADR |
6,923,981 | 1.4 | ||||||||
| 2,796,475 | Ping
An Bank Co. Ltd. — A Shares |
6,616,675 | 1.3 | |||||||||
| 1,106,000 | Ping
An Insurance Group Co. of China Ltd. — H Shares |
13,087,815 | 2.6 | |||||||||
| 366,400 | Shenzhou International Group Holdings Ltd. |
5,354,964 | 1.0 | |||||||||
| 420,000 | Tencent Holdings Ltd. |
20,233,986 | 4.0 | |||||||||
| 528,000 | (1),(3) |
Wuxi
Biologics Cayman, Inc. — H Shares |
6,687,357 | 1.3 | ||||||||
| 131,536 | Yum China Holdings, Inc. |
6,315,043 | 1.2 | |||||||||
| 1,323,384 | Other Securities |
8,863,501 | 1.7 | |||||||||
| 148,810,239 | 29.1 | |||||||||||
Egypt: 0.9% |
||||||||||||
| 901,337 | Other Securities |
4,596,819 | 0.9 | |||||||||
Hong Kong: 7.8% |
||||||||||||
| 2,226,600 | AIA
Group Ltd. |
23,419,304 | 4.6 | |||||||||
| 177,900 | Hong
Kong Exchanges and Clearing Ltd. |
5,779,567 | 1.1 | |||||||||
| 1,328,500 | Techtronic Industries Co., Ltd. |
10,842,814 | 2.1 | |||||||||
| 40,041,685 | 7.8 | |||||||||||
Hungary: 1.1% |
||||||||||||
| 105,128 | OTP Bank Nyrt |
5,504,502 | 1.1 | |||||||||
India: 19.9% |
||||||||||||
| 335,570 | HDFC
Bank Ltd. ADR |
21,265,071 | 4.1 | |||||||||
| 32,053 | HDFC
Bank Ltd. |
571,939 | 0.1 | |||||||||
| Shares | Value | Percentage of Net Assets |
||||||||||
COMMON STOCK: (continued) |
||||||||||||
India: (continued) |
||||||||||||
| 962,710 | (3) |
HDFC
Life Insurance Co., Ltd. |
$ | 8,447,273 | 1.6 | |||||||
| 215,530 | Hindustan Unilever Ltd. |
5,808,322 | 1.1 | |||||||||
| 724,345 | Housing Development Finance Corp. |
24,491,882 | 4.8 | |||||||||
| 303,548 | IndusInd Bank Ltd. |
6,422,735 | 1.3 | |||||||||
| 1,678,098 | ITC
Ltd. |
5,589,464 | 1.1 | |||||||||
| 293,978 | Kotak
Mahindra Bank Ltd. |
6,938,530 | 1.4 | |||||||||
| 64,790 | Maruti
Suzuki India Ltd. |
6,689,651 | 1.3 | |||||||||
| 274,282 | Tata Consultancy Services Ltd. |
8,306,679 | 1.6 | |||||||||
| 247,390 | Other Securities |
7,613,007 | 1.5 | |||||||||
| 102,144,553 | 19.9 | |||||||||||
Indonesia: 2.5% |
||||||||||||
| 2,969,800 | Bank
Central Asia Tbk PT |
7,142,388 | 1.4 | |||||||||
| 18,697,200 | Bank Rakyat Indonesia |
5,918,149 | 1.1 | |||||||||
| 13,060,537 | 2.5 | |||||||||||
Macau: 1.2% |
||||||||||||
| 1,111,600 | Sands China Ltd. |
5,939,357 | 1.2 | |||||||||
Mexico: 3.6% |
||||||||||||
| 1,283,124 | Grupo
Financiero Banorte |
7,163,643 | 1.4 | |||||||||
| 1,991,870 | Wal-Mart de Mexico SAB de CV |
5,718,297 | 1.1 | |||||||||
| 718,335 | Other Securities |
5,592,162 | 1.1 | |||||||||
| 18,474,102 | 3.6 | |||||||||||
Panama: 1.1% |
||||||||||||
| 51,730 | Copa Holdings S.A. — Class A |
5,590,978 | 1.1 | |||||||||
Peru: 0.9% |
||||||||||||
| 20,772 | Other Securities |
4,427,136 | 0.9 | |||||||||
Portugal: 1.3% |
||||||||||||
| 395,130 | Jeronimo Martins SGPS SA |
6,511,492 | 1.3 | |||||||||
Russia: 2.3% |
||||||||||||
| 2,826,059 | Sberbank of Russia PJSC |
11,607,025 | 2.3 | |||||||||
South Africa: 4.2% |
||||||||||||
| 375,937 | Bid
Corp. Ltd. |
8,865,172 | 1.7 | |||||||||
| 56,301 | (4) |
Capitec Bank Holdings Ltd. |
5,813,322 | 1.2 | ||||||||
| 825,987 | Sanlam Ltd. |
4,666,727 | 0.9 | |||||||||
| 152,435 | Other Securities |
1,990,130 | 0.4 | |||||||||
| 21,335,351 | 4.2 | |||||||||||
South Korea: 5.2% |
||||||||||||
| 12,390 | NCSoft
Corp. |
5,781,238 | 1.1 | |||||||||
| 431,546 | Samsung Electronics Co., Ltd. |
20,794,856 | 4.1 | |||||||||
| 26,576,094 | 5.2 | |||||||||||
Spain: 0.2% |
||||||||||||
| 283,126 | Other Securities |
1,168,709 | 0.2 | |||||||||
Taiwan: 7.5% |
||||||||||||
| 34,000 | Largan
Precision Co. Ltd. |
5,679,300 | 1.1 | |||||||||
VY® JPMORGAN
EMERGING |
SUMMARY PORTFOLIO OF INVESTMENTS AS OF DECEMBER 31, 2019 (CONTINUED) |
| Shares | Value | Percentage of Net Assets |
||||||||||
|---|---|---|---|---|---|---|---|---|---|---|---|---|
COMMON STOCK: (continued) |
||||||||||||
Taiwan: (continued) |
||||||||||||
| 455,000 | President Chain Store Corp. |
$ | 4,620,376 | 0.9 | ||||||||
| 307,031 | Taiwan
Semiconductor Manufacturing Co., Ltd. ADR |
17,838,501 | 3.5 | |||||||||
| 953,223 | Taiwan Semiconductor Manufacturing Co., Ltd. |
10,550,110 | 2.0 | |||||||||
| 38,688,287 | 7.5 | |||||||||||
Turkey: 1.1% |
||||||||||||
| 580,910 | Other Securities |
5,424,562 | 1.1 | |||||||||
United States: 2.0% |
||||||||||||
| 47,630 | (1) |
EPAM Systems, Inc. |
10,105,181 | 2.0 | ||||||||
Total
Common Stock (Cost $334,560,118) |
505,130,741 | 98.7 | ||||||||||
PREFERRED STOCK: 1.2% |
||||||||||||
Brazil: 1.2% |
||||||||||||
| 648,295 | Itau Unibanco Holding S.A. |
5,979,005 | 1.2 | |||||||||
Total
Preferred Stock (Cost $3,759,645) |
5,979,005 | 1.2 | ||||||||||
Total
Long-Term Investments (Cost $338,319,763) |
511,109,746 | 99.9 | ||||||||||
| Principal Amount† |
Value | Percentage of Net Assets |
||||||||||
|---|---|---|---|---|---|---|---|---|---|---|---|---|
SHORT-TERM INVESTMENTS: 1.1% |
||||||||||||
Repurchase Agreements: 0.3% |
||||||||||||
| 342,970 | (5) |
Cantor
Fitzgerald Securities, Repurchase Agreement dated 12/31/19, 1.58%, due 01/02/20 (Repurchase Amount $343,000, collateralized by various U.S.
Government/U.S. Government Agency Obligations, 0.000%–8.500%, Market Value plus accrued interest $349,829, due
01/25/20–10/15/60) |
342,970 | 0.1 | ||||||||
| Principal Amount† |
Value | Percentage of Net Assets |
||||||||||
SHORT-TERM INVESTMENTS: (continued) |
||||||||||||
Repurchase Agreements: (continued) |
||||||||||||
| 1,000,000 | (5) |
Millennium Fixed Income Ltd., Repurchase Agreement dated 12/31/19, 1.75%, due 01/02/20 (Repurchase Amount
$1,000,096, collateralized by various U.S. Government Securities, 0.125%–2.250%, Market Value plus accrued interest $1,020,000, due
04/15/20–03/31/21) |
$ | 1,000,000 | 0.2 | |||||||
Total
Repurchase Agreements (Cost $1,342,970) |
1,342,970 | 0.3 | ||||||||||
| Shares | Value | Percentage of Net Assets |
||||||||||
|---|---|---|---|---|---|---|---|---|---|---|---|---|
Mutual Funds: 0.8% |
||||||||||||
| 4,328,269 | (6) |
BlackRock Liquidity Funds, FedFund, Institutional Class, 1.520% (Cost $4,328,269) |
4,328,269 | 0.8 | ||||||||
Total
Short-Term Investments (Cost $5,671,239) |
5,671,239 | 1.1 | ||||||||||
Total Investments in Securities (Cost $343,991,002) |
$ | 516,780,985 | 101.0 | |||||||||
Liabilities in Excess of Other Assets |
(4,876,442 | ) | (1.0 | ) | ||||||||
Net
Assets |
$ | 511,904,543 | 100.0 | |||||||||
“Other Securities” represents issues not
identified as the top 50 holdings in terms of market value and issues or issuers not exceeding 1% of net assets individually or in aggregate
respectively as of December 31, 2019.
The following footnotes apply to either the individual
securities noted or one or more of the securities aggregated and listed as a single line item.
† |
Unless otherwise indicated, principal amount is shown in USD. |
ADR |
American Depositary Receipt |
(1) |
Non-income producing security. |
(2) |
The grouping contains non-income producing securities. |
(3) |
Securities with purchases pursuant to Rule 144A or section 4(a)(2), under the Securities Act of 1933 and may not be resold subject to that rule except to qualified institutional buyers. |
(4) |
Security, or a portion of the security, is on loan. |
(5) |
All or a portion of the security represents securities purchased with cash collateral received for securities on loan. |
(6) |
Rate shown is the 7-day yield as of December 31, 2019. |
VY® JPMORGAN
EMERGING |
SUMMARY PORTFOLIO OF INVESTMENTS AS OF DECEMBER 31, 2019 (CONTINUED) |
| Sector Diversification | Percentage of Net Assets |
|||||
|---|---|---|---|---|---|---|
Financials |
37.3 | % | ||||
Consumer
Discretionary |
19.1 | |||||
Consumer
Staples |
15.7 | |||||
Information
Technology |
15.1 | |||||
Communication
Services |
6.4 | |||||
Industrials |
3.4 | |||||
Health
Care |
1.3 | |||||
Materials |
0.8 | |||||
Utilities |
0.6 | % | ||||
Energy |
0.2 | |||||
Short-Term
Investments |
1.1 | |||||
Liabilities in
Excess of Other Assets |
(1.0 | ) | ||||
Net
Assets |
100.0 | % | ||||
| Quoted Prices in Active Markets for Identical Investments (Level 1) |
Significant Other Observable Inputs# (Level 2) |
Significant Unobservable Inputs (Level 3) |
Fair Value at December 31, 2019 |
|||||||||||||||||
|---|---|---|---|---|---|---|---|---|---|---|---|---|---|---|---|---|---|---|---|---|
Asset
Table |
||||||||||||||||||||
Investments,
at fair value |
||||||||||||||||||||
Common
Stock |
||||||||||||||||||||
Argentina |
$ | 7,943,103 | $ | — | $ | — | $ | 7,943,103 | ||||||||||||
Australia |
— | 825,713 | — | 825,713 | ||||||||||||||||
Brazil |
26,355,316 | — | — | 26,355,316 | ||||||||||||||||
China |
63,258,859 | 85,551,380 | — | 148,810,239 | ||||||||||||||||
Egypt |
4,596,819 | — | — | 4,596,819 | ||||||||||||||||
Hong
Kong |
— | 40,041,685 | — | 40,041,685 | ||||||||||||||||
Hungary |
— | 5,504,502 | — | 5,504,502 | ||||||||||||||||
India |
29,571,750 | 72,572,803 | — | 102,144,553 | ||||||||||||||||
Indonesia |
— | 13,060,537 | — | 13,060,537 | ||||||||||||||||
Macau |
— | 5,939,357 | — | 5,939,357 | ||||||||||||||||
Mexico |
18,474,102 | — | — | 18,474,102 | ||||||||||||||||
Panama |
5,590,978 | — | — | 5,590,978 | ||||||||||||||||
Peru |
4,427,136 | — | — | 4,427,136 | ||||||||||||||||
Portugal |
— | 6,511,492 | — | 6,511,492 | ||||||||||||||||
Russia |
— | 11,607,025 | — | 11,607,025 | ||||||||||||||||
South
Africa |
5,813,322 | 15,522,029 | — | 21,335,351 | ||||||||||||||||
South
Korea |
— | 26,576,094 | — | 26,576,094 | ||||||||||||||||
Spain |
1,168,709 | — | — | 1,168,709 | ||||||||||||||||
Taiwan |
17,838,501 | 20,849,786 | — | 38,688,287 | ||||||||||||||||
Turkey |
2,880,073 | 2,544,489 | — | 5,424,562 | ||||||||||||||||
United
States |
10,105,181 | — | — | 10,105,181 | ||||||||||||||||
Total Common
Stock |
198,023,849 | 307,106,892 | — | 505,130,741 | ||||||||||||||||
Preferred
Stock |
5,979,005 | — | — | 5,979,005 | ||||||||||||||||
Short-Term
Investments |
4,328,269 | 1,342,970 | — | 5,671,239 | ||||||||||||||||
Total
Investments, at fair value |
$ | 208,331,123 | $ | 308,449,862 | $ | — | $ | 516,780,985 | ||||||||||||
ˆ |
See Note 2, “Significant Accounting Policies” in the Notes to Financial Statements for additional information. | |
# |
The earlier close of the foreign markets gives rise to the possibility that significant events, including broad market moves, may have occurred in the interim and may materially affect the value of those securities. To account for this, the Portfolio may frequently value many of its foreign equity securities using fair value prices based on third party vendor modeling tools to the extent available. Accordingly, a portion of the Portfolio’s investments are categorized as Level 2 investments. |
| Cost for federal income tax purposes was $345,086,450. |
Net unrealized
appreciation consisted of: |
||||||
Gross
Unrealized Appreciation |
$ | 176,159,301 | ||||
Gross
Unrealized Depreciation |
(4,463,116 | ) | ||||
Net Unrealized
Appreciation |
$ | 171,696,185 |
VY® MORGAN
STANLEY GLOBAL |
PORTFOLIO OF INVESTMENTS AS OF DECEMBER 31, 2019 |
| Shares | Value | Percentage of Net Assets |
||||||||||
|---|---|---|---|---|---|---|---|---|---|---|---|---|
COMMON STOCK: 98.4% |
||||||||||||
France: 5.7% |
||||||||||||
| 42,146 | L’Oreal S.A. |
$ | 12,462,941 | 3.0 | ||||||||
| 62,551 | Pernod Ricard SA |
11,192,782 | 2.7 | |||||||||
| 23,655,723 | 5.7 | |||||||||||
Germany: 5.6% |
||||||||||||
| 172,821 | SAP SE |
23,261,509 | 5.6 | |||||||||
Italy: 0.9% |
||||||||||||
| 402,042 | Davide Campari-Milano SpA |
3,673,592 | 0.9 | |||||||||
Netherlands: 3.3% |
||||||||||||
| 130,632 | Heineken NV |
13,942,142 | 3.3 | |||||||||
United Kingdom: 18.4% |
||||||||||||
| 300,349 | British American Tobacco PLC |
12,765,543 | 3.1 | |||||||||
| 318,728 | Experian PLC |
10,804,783 | 2.6 | |||||||||
| 380,745 | Reckitt Benckiser Group PLC |
30,927,543 | 7.4 | |||||||||
| 158,748 | Relx
PLC (EUR Exchange) |
4,004,089 | 0.9 | |||||||||
| 410,486 | Relx
PLC (GBP Exchange) |
10,362,110 | 2.5 | |||||||||
| 137,362 | Unilever PLC |
7,863,018 | 1.9 | |||||||||
| 76,727,086 | 18.4 | |||||||||||
United States: 64.5% |
||||||||||||
| 153,042 | Abbott
Laboratories |
13,293,228 | 3.2 | |||||||||
| 95,069 | Accenture PLC |
20,018,679 | 4.8 | |||||||||
| 103,382 | Automatic Data Processing, Inc. |
17,626,631 | 4.2 | |||||||||
| 197,100 | Baxter
International, Inc. |
16,481,502 | 4.0 | |||||||||
| 55,908 | Becton
Dickinson & Co. |
15,205,299 | 3.7 | |||||||||
| 67,571 | Church & Dwight Co., Inc. |
4,752,944 | 1.1 | |||||||||
| 263,502 | Coca-Cola Co. |
14,584,836 | 3.5 | |||||||||
| 102,682 | Danaher Corp. |
15,759,634 | 3.8 | |||||||||
| 18,883 | Factset Research Systems, Inc. |
5,066,309 | 1.2 | |||||||||
| 68,190 | Fidelity National Information Services, Inc. |
9,484,547 | 2.3 | |||||||||
| 89,104 | Fox
Corp. — Class A |
3,303,085 | 0.8 | |||||||||
| 74,410 | Fox
Corp. — Class B |
2,708,524 | 0.6 | |||||||||
| 220,216 | Microsoft Corp. |
34,728,063 | 8.3 | |||||||||
| 26,228 | Moody’s Corp. |
6,226,790 | 1.5 | |||||||||
| 85,855 | Nike,
Inc. |
8,697,970 | 2.1 | |||||||||
| 384,516 | Philip
Morris International, Inc. |
32,718,467 | 7.9 | |||||||||
| 45,675 | Thermo
Fisher Scientific, Inc. |
14,838,437 | 3.6 | |||||||||
| 119,589 | Visa,
Inc. — Class A |
22,470,773 | 5.4 | |||||||||
| 78,921 | Zoetis, Inc. |
10,445,194 | 2.5 | |||||||||
| 268,410,912 | 64.5 | |||||||||||
Total
Common Stock (Cost $296,563,351) |
409,670,964 | 98.4 | ||||||||||
| Shares | Value | Percentage of Net Assets |
||||||||||
SHORT-TERM INVESTMENTS: 1.8% |
||||||||||||
Mutual Funds: 1.8% |
||||||||||||
| 7,383,153 | (1) |
BlackRock Liquidity Funds, FedFund, Institutional Class, 1.520% (Cost $7,383,153) |
$ | 7,383,153 | 1.8 | |||||||
Total
Short-Term Investments (Cost $7,383,153) |
7,383,153 | 1.8 | ||||||||||
Total Investments in Securities (Cost $303,946,504) |
$ | 417,054,117 | 100.2 | |||||||||
Liabilities in Excess of Other Assets |
(805,575 | ) | (0.2 | ) | ||||||||
Net
Assets |
$ | 416,248,542 | 100.0 | |||||||||
(1) |
Rate shown is the 7-day yield as of December 31, 2019. |
| Sector Diversification | Percentage of Net Assets |
|||||
|---|---|---|---|---|---|---|
Consumer
Staples |
34.8 | % | ||||
Information
Technology |
30.7 | |||||
Health
Care |
20.7 | |||||
Industrials |
6.0 | |||||
Financials |
2.7 | |||||
Consumer
Discretionary |
2.1 | |||||
Communication
Services |
1.4 | |||||
Short-Term
Investments |
1.8 | |||||
Liabilities in
Excess of Other Assets |
(0.2 | ) | ||||
Net
Assets |
100.0 | % | ||||
VY® MORGAN
STANLEY GLOBAL |
PORTFOLIO OF INVESTMENTS AS OF DECEMBER 31, 2019 (CONTINUED) |
| Quoted Prices in Active Markets for Identical Investments (Level 1) |
Significant Other Observable Inputs# (Level 2) |
Significant Unobservable Inputs (Level 3) |
Fair Value at December 31, 2019 |
|||||||||||||||||
|---|---|---|---|---|---|---|---|---|---|---|---|---|---|---|---|---|---|---|---|---|
Asset
Table |
||||||||||||||||||||
Investments,
at fair value |
||||||||||||||||||||
Common
Stock |
||||||||||||||||||||
France |
$ | — | $ | 23,655,723 | $ | — | $ | 23,655,723 | ||||||||||||
Germany |
— | 23,261,509 | — | 23,261,509 | ||||||||||||||||
Italy |
— | 3,673,592 | — | 3,673,592 | ||||||||||||||||
Netherlands |
— | 13,942,142 | — | 13,942,142 | ||||||||||||||||
United
Kingdom |
— | 76,727,086 | — | 76,727,086 | ||||||||||||||||
United
States |
268,410,912 | — | — | 268,410,912 | ||||||||||||||||
Total Common
Stock |
268,410,912 | 141,260,052 | — | 409,670,964 | ||||||||||||||||
Short-Term
Investments |
7,383,153 | — | — | 7,383,153 | ||||||||||||||||
Total
Investments, at fair value |
$ | 275,794,065 | $ | 141,260,052 | $ | — | $ | 417,054,117 | ||||||||||||
ˆ |
See Note 2, “Significant Accounting Policies” in the Notes to Financial Statements for additional information. | |
# |
The earlier close of the foreign markets gives rise to the possibility that significant events, including broad market moves, may have occurred in the interim and may materially affect the value of those securities. To account for this, the Portfolio may frequently value many of its foreign equity securities using fair value prices based on third party vendor modeling tools to the extent available. Accordingly, a portion of the Portfolio’s investments are categorized as Level 2 investments. |
| Cost for federal income tax purposes was $304,496,350. |
Net unrealized
appreciation consisted of: |
||||||
Gross
Unrealized Appreciation |
$ | 120,960,671 | ||||
Gross
Unrealized Depreciation |
(8,399,787 | ) | ||||
Net Unrealized
Appreciation |
$ | 112,560,884 |
VY® T. ROWE
PRICE |
SUMMARY PORTFOLIO OF INVESTMENTS AS OF DECEMBER 31, 2019 |
| Shares | Value | Percentage of Net Assets |
||||||||||
|---|---|---|---|---|---|---|---|---|---|---|---|---|
COMMON STOCK: 63.3% |
||||||||||||
Communication Services: 3.9% |
||||||||||||
11,332 |
(1),(2) |
Alphabet, Inc. — Class A |
$ | 15,177,967 | 0.2 | |||||||
128,385 |
(2) |
Alphabet, Inc. — Class C |
171,653,313 | 2.3 | ||||||||
507,900 |
(2) |
Facebook, Inc. — Class A |
104,246,475 | 1.4 | ||||||||
| 291,077,755 | 3.9 | |||||||||||
Consumer Discretionary: 5.5% |
||||||||||||
84,100 |
(2) |
Amazon.com, Inc. |
155,403,344 | 2.1 | ||||||||
464,743 |
Aptiv
PLC |
44,136,643 | 0.6 | |||||||||
900,440 |
Hilton
Worldwide Holdings, Inc. |
99,867,800 | 1.3 | |||||||||
875,061 |
(1) |
Yum! Brands, Inc. |
88,144,895 | 1.2 | ||||||||
115,300 |
Other Securities |
22,784,433 | 0.3 | |||||||||
| 410,337,115 | 5.5 | |||||||||||
Consumer Staples: 1.1% |
||||||||||||
2,910,056 |
(3) |
Keurig Dr Pepper, Inc. |
84,246,121 | 1.1 | ||||||||
Energy: 0.3% |
||||||||||||
233,600 |
(4) |
Other Securities |
20,456,352 | 0.3 | ||||||||
Financials: 5.8% |
||||||||||||
879,037 |
Intercontinental Exchange, Inc. |
81,354,874 | 1.1 | |||||||||
2,023,333 |
Marsh & McLennan Cos., Inc. |
225,419,530 | 3.0 | |||||||||
381,144 |
S&P Global, Inc. |
104,071,369 | 1.4 | |||||||||
126,900 |
Other Securities |
20,257,047 | 0.3 | |||||||||
| 431,102,820 | 5.8 | |||||||||||
Health Care: 14.5% |
||||||||||||
2,594,734 |
(2) |
Alcon,
Inc. |
146,969,924 | 2.0 | ||||||||
1,591,430 |
(2) |
Avantor, Inc. |
28,884,454 | 0.4 | ||||||||
676,778 |
(1) |
Becton
Dickinson & Co. |
184,063,313 | 2.5 | ||||||||
1,262,599 |
Danaher Corp. |
193,783,695 | 2.6 | |||||||||
1,566,765 |
(2) |
Envista Holdings Corp. |
46,438,915 | 0.6 | ||||||||
2,431,580 |
(3) |
PerkinElmer, Inc. |
236,106,418 | 3.1 | ||||||||
525,521 |
Thermo
Fisher Scientific, Inc. |
170,726,007 | 2.3 | |||||||||
248,100 |
(1) |
UnitedHealth Group, Inc. |
72,936,438 | 1.0 | ||||||||
| 1,079,909,164 | 14.5 | |||||||||||
Industrials: 8.8% |
||||||||||||
2,026,569 |
Fortive Corp. |
154,809,606 | 2.1 | |||||||||
23,741,116 |
General Electric Co. |
264,950,854 | 3.6 | |||||||||
453,216 |
Roper
Technologies, Inc. |
160,542,704 | 2.1 | |||||||||
810,662 |
Waste Connections, Inc. |
73,600,003 | 1.0 | |||||||||
| 653,903,167 | 8.8 | |||||||||||
Information Technology: 16.9% |
||||||||||||
2,036,793 |
(2) |
Fiserv, Inc. |
235,514,375 | 3.2 | ||||||||
681,360 |
Global
Payments, Inc. |
124,389,082 | 1.7 | |||||||||
1,453,199 |
Maxim
Integrated Products |
89,386,270 | 1.2 | |||||||||
1,978,300 |
Microsoft Corp. |
311,977,910 | 4.2 | |||||||||
729,324 |
NXP
Semiconductor NV — NXPI — US |
92,813,772 | 1.2 | |||||||||
457,998 |
TE
Connectivity Ltd. |
43,894,528 | 0.6 | |||||||||
705,400 |
(1) |
Texas
Instruments, Inc. |
90,495,766 | 1.2 | ||||||||
1,442,775 |
(1),(3) |
Visa, Inc. — Class A |
271,097,423 | 3.6 | ||||||||
| 1,259,569,126 | 16.9 | |||||||||||
| Shares | Value | Percentage of Net Assets |
||||||||||
COMMON STOCK: (continued) |
||||||||||||
Real Estate: 0.1% |
||||||||||||
32,100 |
Other Securities |
$ | 7,377,222 | 0.1 | ||||||||
Utilities: 6.4% |
||||||||||||
1,489,743 |
American Electric Power Co., Inc. |
140,795,611 | 1.9 | |||||||||
436,287 |
(3) |
American Water Works Co., Inc. |
53,597,858 | 0.7 | ||||||||
392,101 |
(3) |
Eversource Energy |
33,356,032 | 0.5 | ||||||||
188,311 |
NextEra Energy, Inc. |
45,601,392 | 0.6 | |||||||||
3,122,729 |
NiSource, Inc. |
86,936,775 | 1.2 | |||||||||
1,794,116 |
Xcel Energy, Inc. |
113,908,425 | 1.5 | |||||||||
| 474,196,093 | 6.4 | |||||||||||
Total
Common Stock (Cost $3,626,169,992) |
4,712,174,935 | 63.3 | ||||||||||
PREFERRED STOCK: 5.3% |
||||||||||||
Consumer Discretionary: 0.1% |
||||||||||||
576,340 |
(2), (5),(6) |
Aurora Innovation, Inc., — Series B |
5,325,555 | 0.1 | ||||||||
Financials: 1.6% |
||||||||||||
62,289 |
(2) |
Wells Fargo & Co. |
90,319,050 | 1.2 | ||||||||
1,239,000 |
(4),(7) |
Other Securities |
33,580,920 | 0.4 | ||||||||
| 123,899,970 | 1.6 | |||||||||||
Health Care: 1.7% |
||||||||||||
982,882 |
(2),(3) |
Avantor, Inc. |
61,921,566 | 0.8 | ||||||||
951,470 |
(2) |
Becton Dickinson and Co. |
62,283,226 | 0.9 | ||||||||
| 124,204,792 | 1.7 | |||||||||||
Industrials: 0.2% |
||||||||||||
17,812 |
(2),(3) |
Fortive Corp. |
17,326,801 | 0.2 | ||||||||
Utilities: 1.7% |
||||||||||||
1,850,000 |
(2), (3),(8) |
CMS Energy Corp. |
50,091,500 | 0.7 | ||||||||
2,613,523 |
(4),(7) |
Other Securities |
73,939,865 | 1.0 | ||||||||
| 124,031,365 | 1.7 | |||||||||||
Total
Preferred Stock (Cost $346,867,456) |
394,788,483 | 5.3 | ||||||||||
| Principal Amount† |
Value | Percentage of Net Assets |
||||||||||
|---|---|---|---|---|---|---|---|---|---|---|---|---|
CORPORATE BONDS/NOTES: 16.4% |
||||||||||||
Communications: 5.1% |
||||||||||||
8,975,000 |
(3),(9) |
CCO
Holdings LLC / CCO Holdings Capital Corp., 4.000%, 03/01/2023 |
9,120,754 | 0.1 | ||||||||
12,375,000 |
(9) |
CCO
Holdings LLC / CCO Holdings Capital Corp., 5.125%, 05/01/2023 |
12,656,098 | 0.2 | ||||||||
28,235,000 |
(9) |
CCO
Holdings LLC / CCO Holdings Capital Corp., 5.125%, 05/01/2027 |
29,840,160 | 0.4 | ||||||||
38,178,000 |
(9) |
CCO
Holdings LLC / CCO Holdings Capital Corp., 5.000%, 02/01/2028 |
40,131,568 | 0.6 | ||||||||
9,901,000 |
(9) |
CCO
Holdings LLC / CCO Holdings Capital Corp., 5.875%, 04/01/2024 |
10,255,802 | 0.1 | ||||||||
VY® T. ROWE
PRICE |
SUMMARY PORTFOLIO OF INVESTMENTS AS OF DECEMBER 31, 2019 (CONTINUED) |
| Principal Amount† |
Value | Percentage of Net Assets | ||||||||||
|---|---|---|---|---|---|---|---|---|---|---|---|---|
CORPORATE BONDS/NOTES: (continued) |
||||||||||||
Communications: (continued) |
||||||||||||
21,424,000 |
(3) |
CCO
Holdings LLC / CCO Holdings Capital Corp., 5.125%–5.750%, 09/30/2022–01/15/2024 |
$ | 21,765,843 | 0.3 | |||||||
5,540,000 |
Comcast Corp., 2.239%, (US0003M + 0.330%), 10/01/2020 |
5,550,258 | 0.1 | |||||||||
4,375,000 |
Comcast Corp., 2.349%, (US0003M + 0.440%), 10/01/2021 |
4,397,661 | 0.0 | |||||||||
48,465,000 |
Netflix, Inc., 4.875%, 04/15/2028 |
50,462,970 | 0.7 | |||||||||
48,940,000 |
(3) |
Netflix, Inc., 5.875%, 11/15/2028 |
54,343,465 | 0.7 | ||||||||
30,475,000 |
(3) |
Netflix, Inc., 6.375%, 05/15/2029 |
34,759,785 | 0.5 | ||||||||
45,780,000 |
(3) |
Netflix, Inc., 4.375%–5.875%, 02/01/2021–11/15/2026 |
48,258,415 | 0.6 | ||||||||
7,870,000 |
(9) |
Sirius
XM Radio, Inc., 3.875%, 08/01/2022 |
8,056,858 | 0.1 | ||||||||
6,510,000 |
(3),(9) |
Sirius
XM Radio, Inc., 4.625%, 05/15/2023 |
6,621,223 | 0.1 | ||||||||
7,275,000 |
(3) |
Verizon Communications, Inc., 2.894%, (US0003M + 1.000%), 03/16/2022 |
7,398,895 | 0.1 | ||||||||
11,207,000 |
(9) |
Zayo Group LLC / Zayo Capital, Inc., 5.750%, 01/15/2027 |
11,421,026 | 0.2 | ||||||||
22,421,000 |
Other Securities |
22,953,915 | 0.3 | |||||||||
| 377,994,696 | 5.1 | |||||||||||
Consumer, Cyclical: 2.3% |
||||||||||||
2,090,000 |
Dollar
Tree, Inc., 2.702%, (US0003M + 0.700%), 04/17/2020 |
2,090,401 | 0.0 | |||||||||
3,715,000 |
Home
Depot, Inc./The, 2.217%, (US0003M + 0.310%), 03/01/2022 |
3,724,488 | 0.0 | |||||||||
27,235,000 |
(3),(9) |
KFC
Holding Co/Pizza Hut Holdings LLC/Taco Bell of America LLC, 4.750%, 06/01/2027 |
28,728,091 | 0.4 | ||||||||
9,980,000 |
(9) |
KFC
Holding Co/Pizza Hut Holdings LLC/Taco Bell of America LLC, 5.000%, 06/01/2024 |
10,362,583 | 0.1 | ||||||||
18,800,000 |
(9) |
KFC
Holding Co/Pizza Hut Holdings LLC/Taco Bell of America LLC, 5.250%, 06/01/2026 |
19,881,470 | 0.3 | ||||||||
2,340,000 |
Marriott International, Inc./MD, 2.535%, (US0003M + 0.650%), 03/08/2021 |
2,349,168 | 0.0 | |||||||||
2,895,000 |
(3),(9) |
Six
Flags Entertainment Corp., 4.875%, 07/31/2024 |
3,005,980 | 0.1 | ||||||||
1,050,000 |
(3),(9) |
Six
Flags Entertainment Corp., 5.500%, 04/15/2027 |
1,121,505 | 0.0 | ||||||||
61,505,000 |
(3) |
Yum! Brands, Inc., 3.750%-6.875%, 11/01/2020-11/01/2043 |
63,295,609 | 0.9 | ||||||||
37,447,219 |
(4) |
Other Securities |
39,188,471 | 0.5 | ||||||||
| 173,747,766 | 2.3 | |||||||||||
| Principal Amount† |
Value | Percentage of Net Assets | ||||||||||
CORPORATE BONDS/NOTES: (continued) |
||||||||||||
Consumer, Non-cyclical: 4.0% |
||||||||||||
15,900,000 |
(9) |
Avantor, Inc., 6.000%, 10/01/2024 |
$ | 16,986,208 | 0.2 | |||||||
65,084,000 |
(9) |
Avantor, Inc., 9.000%, 10/01/2025 |
72,869,023 | 1.0 | ||||||||
6,185,000 |
(3) |
Becton
Dickinson and Co., 2.917%, (US0003M + 1.030%), 06/06/2022 |
6,232,572 | 0.1 | ||||||||
23,355,000 |
Becton
Dickinson and Co., 2.894%–3.363%, 06/06/2022–06/06/2024 |
23,980,768 | 0.3 | |||||||||
11,120,000 |
(9) |
Bristol-Myers Squibb Co., 2.104%, (US0003M + 0.200%), 11/16/2020 |
11,128,023 | 0.2 | ||||||||
17,005,000 |
(3),(9) |
Bristol-Myers Squibb Co., 2.550%, 05/14/2021 |
17,173,732 | 0.2 | ||||||||
2,790,000 |
Conagra Brands, Inc., 2.703%, (US0003M + 0.750%), 10/22/2020 |
2,790,287 | 0.0 | |||||||||
1,297,000 |
(9) |
Fresenius Medical Care US Finance, Inc., 5.750%, 02/15/2021 |
1,345,475 | 0.0 | ||||||||
7,545,000 |
(3),(9) |
Hologic, Inc., 4.375%, 10/15/2025 |
7,805,944 | 0.1 | ||||||||
1,565,000 |
(9) |
Korn
Ferry, 4.625%, 12/15/2027 |
1,576,738 | 0.0 | ||||||||
23,365,000 |
(9) |
Nestle
Holdings, Inc., 3.100%, 09/24/2021 |
23,888,728 | 0.3 | ||||||||
3,890,000 |
Philip
Morris International, Inc., 2.315%, (US0003M + 0.420%), 02/21/2020 |
3,891,955 | 0.1 | |||||||||
11,975,000 |
(9) |
Reckitt Benckiser Treasury Services PLC, 2.375%, 06/24/2022 |
12,062,206 | 0.2 | ||||||||
7,945,000 |
(9) |
Reckitt Benckiser Treasury Services PLC, 2.495%, (US0003M + 0.560%), 06/24/2022 |
7,965,456 | 0.1 | ||||||||
9,125,000 |
(3),(9) |
Refinitiv US Holdings, Inc., 6.250%, 05/15/2026 |
9,974,537 | 0.1 | ||||||||
11,970,000 |
(9) |
Refinitiv US Holdings, Inc., 8.250%, 11/15/2026 |
13,503,357 | 0.2 | ||||||||
62,095,000 |
(4) |
Other Securities |
64,008,954 | 0.9 | ||||||||
| 297,183,963 | 4.0 | |||||||||||
Energy: 0.3% |
||||||||||||
10,335,000 |
Shell International Finance BV, 2.351%, (US0003M + 0.450%), 05/11/2020 |
10,352,037 | 0.2 | |||||||||
9,415,000 |
Other Securities |
9,648,076 | 0.1 | |||||||||
| 20,000,113 | 0.3 | |||||||||||
Financial: 1.6% |
||||||||||||
33,232,000 |
Crown
Castle International Corp., 4.875%–5.250%, 04/15/2022–01/15/2023 |
35,763,971 | 0.5 | |||||||||
33,220,000 |
SBA Communications Corp., 4.000%–4.875%, 07/15/2022–09/01/2024 |
33,903,582 | 0.4 | |||||||||
49,910,000 |
(4) |
Other Securities |
51,856,387 | 0.7 | ||||||||
| 121,523,940 | 1.6 | |||||||||||
VY® T. ROWE
PRICE |
SUMMARY PORTFOLIO OF INVESTMENTS AS OF DECEMBER 31, 2019 (CONTINUED) |
| Principal Amount† |
Value | Percentage of Net Assets | ||||||||||
|---|---|---|---|---|---|---|---|---|---|---|---|---|
CORPORATE BONDS/NOTES: (continued) |
||||||||||||
Industrial: 1.5% |
||||||||||||
275,000 |
(9) |
Moog,
Inc., 5.250%, 12/01/2022 |
$ | 279,455 | 0.0 | |||||||
6,845,000 |
(9) |
Reynolds Group Issuer, Inc. / Reynolds Group Issuer LLC / Reynolds Group Issuer Lu, 5.125%, 07/15/2023 |
7,021,841 | 0.1 | ||||||||
8,525,000 |
(3),(9) |
Reynolds Group Issuer, Inc. / Reynolds Group Issuer LLC / Reynolds Group Issuer Lu, 5.501%, (US0003M + 3.500%), 07/15/2021 |
8,554,837 | 0.1 | ||||||||
25,899,403 |
Reynolds Group Issuer, Inc., 5.750%, 10/15/2020 |
25,964,151 | 0.4 | |||||||||
4,220,000 |
(9) |
Sensata Technologies BV, 4.875%, 10/15/2023 |
4,504,808 | 0.0 | ||||||||
5,100,000 |
(3),(9) |
Sensata Technologies BV, 5.000%, 10/01/2025 |
5,550,509 | 0.1 | ||||||||
1,430,000 |
(9) |
Sensata Technologies BV, 5.625%, 11/01/2024 |
1,595,043 | 0.0 | ||||||||
57,385,000 |
(4) |
Other Securities |
57,773,320 | 0.8 | ||||||||
| 111,243,964 | 1.5 | |||||||||||
Technology: 0.9% |
||||||||||||
2,840,000 |
(3),(9) |
Sensata Technologies UK Financing Co. PLC, 6.250%, 02/15/2026 |
3,065,354 | 0.0 | ||||||||
47,166,000 |
(9) |
Solera LLC / Solera Finance, Inc., 10.500%, 03/01/2024 |
50,144,297 | 0.7 | ||||||||
10,840,000 |
Other Securities |
11,082,270 | 0.2 | |||||||||
| 64,291,921 | 0.9 | |||||||||||
Utilities: 0.7% |
||||||||||||
6,300,000 |
Eversource Energy, 2.750%–3.800%, 03/15/2022–12/01/2023 |
6,472,051 | 0.1 | |||||||||
45,012,000 |
(4) |
Other Securities |
46,826,035 | 0.6 | ||||||||
| 53,298,086 | 0.7 | |||||||||||
Total
Corporate Bonds/Notes (Cost $1,170,337,078) |
1,219,284,449 | 16.4 | ||||||||||
BANK LOANS: 4.6% |
||||||||||||
Basic Materials: 0.0% |
||||||||||||
3,160,354 |
H.B. Fuller Co. 1st Lien Term Loan B, 3.765%, (US0001M + 2.000%), 10/20/2024 |
3,173,191 | 0.0 | |||||||||
Communications: 0.1% |
||||||||||||
3,949,239 |
Zayo
Group LLC — TL B1 1L, 3.799%, (US0001M + 2.000%), 01/19/2021 |
3,962,287 | 0.0 | |||||||||
6,850,000 |
Zayo Group LLC TL B2 1L, 4.049%, (US0001M + 2.250%), 01/19/2024 |
6,879,016 | 0.1 | |||||||||
| 10,841,303 | 0.1 | |||||||||||
Consumer, Cyclical: 0.1% |
||||||||||||
6,850,000 |
Formula One TL B3 1L, 4.299%, (US0003M + 2.500%), 02/01/2024 |
6,893,881 | 0.1 | |||||||||
| Principal Amount† |
Value | Percentage of Net Assets | ||||||||||
BANK LOANS: (continued) |
||||||||||||
Consumer, Non-cyclical: 1.8% |
||||||||||||
1,377,740 |
Gartner, Inc. — TL A 1L, 3.935%, (US0003M + 2.000%), 03/20/2022 |
$ | 1,384,628 | 0.0 | ||||||||
15,225,000 |
NVA
Holdings Inc. — TL A-3 1L, 4.158%, (US0003M + 2.250%), 09/19/2022 |
15,244,031 | 0.2 | |||||||||
7,781,177 |
NVA
Holdings Inc. — TL B3 1L, 6.500%, (US0001M + 2.750%), 02/02/2025 |
7,784,219 | 0.1 | |||||||||
398,211 |
Prestige Brands, Inc. Term Loan B4, 3.799%, (US0001M + 2.000%), 01/26/2024 |
401,509 | 0.0 | |||||||||
83,188,644 |
Refinitiv — TL B 1L, 4.952%, (US0001M + 3.750%), 10/01/2025 |
84,007,553 | 1.2 | |||||||||
23,860,000 |
Sunshine Luxembourg VII Sarl — TL B 1L, 6.349%, (US0003M + 4.250%), 07/17/2026 |
24,117,784 | 0.3 | |||||||||
| 132,939,724 | 1.8 | |||||||||||
Financial: 0.9% |
||||||||||||
2,060,000 |
AmWINS
Group, Inc. — TL B 1L, 4.658%, (US0003M + 2.750%), 01/25/2024 |
2,078,798 | 0.0 | |||||||||
16,130,000 |
HUB
International Ltd. — TL B 1L, 5.785%, (US0001M + 4.000%), 04/25/2025 |
16,306,430 | 0.2 | |||||||||
50,286,973 |
HUB
International Ltd. TL B 1L, 4.690%, (US0001M + 3.000%), 04/25/2025 |
50,330,169 | 0.7 | |||||||||
374,043 |
USI, Inc. — TL B 1L, 4.945%, (US0003M + 3.000%), 05/16/2024 |
374,464 | 0.0 | |||||||||
| 69,089,861 | 0.9 | |||||||||||
Health Care: 0.1% |
||||||||||||
7,206,938 |
Emerald TopCo Inc Term Loan, 5.299%, (US0001M + 3.500%), 07/24/2026 |
7,260,089 | 0.1 | |||||||||
Technology: 1.6% |
||||||||||||
32,843,510 |
Cypress Intermediate Holdings III Inc TL B 1L, 4.550%, (US0001M + 3.000%), 04/29/2024 |
33,048,782 | 0.5 | |||||||||
80,131,996 |
Kronos
Inc./MA — TL B 1L, 4.909%, (US0003M + 3.000%), 11/01/2023 |
80,632,821 | 1.1 | |||||||||
2,867,813 |
Ultimate Software Group, Inc. — TL 1L, 5.549%, (US0003M + 3.750%), 05/04/2026 |
2,886,932 | 0.0 | |||||||||
| 116,568,535 | 1.6 | |||||||||||
Total
Bank Loans (Cost $343,338,837) |
346,766,584 | 4.6 | ||||||||||
ASSET-BACKED SECURITIES: 0.3% |
||||||||||||
Other Asset-Backed Securities: 0.3% |
||||||||||||
8,009,540 |
(9) |
Domino’s Pizza Master Issuer LLC 2017-1A A23, 4.118%, 07/25/2047 |
8,308,959 | 0.1 | ||||||||
VY® T. ROWE
PRICE |
SUMMARY PORTFOLIO OF INVESTMENTS AS OF DECEMBER 31, 2019 (CONTINUED) |
| Principal Amount† |
Value | Percentage of Net Assets | ||||||||||
|---|---|---|---|---|---|---|---|---|---|---|---|---|
ASSET-BACKED SECURITIES: (continued) |
||||||||||||
Other Asset-Backed Securities: (continued) |
||||||||||||
7,495,125 |
(9) |
Domino’s Pizza Master Issuer LLC 2018-1A A2I, 4.116%, 07/25/2048 |
$ | 7,721,704 | 0.1 | |||||||
3,710,000 |
(9) |
Domino’s Pizza Master Issuer LLC 2019-1A A2, 3.668%, 10/25/2049 |
3,715,268 | 0.0 | ||||||||
5,063,660 |
(9) |
Wendys Funding LLC 2018-1A A2I, 3.573%, 03/15/2048 |
5,122,905 | 0.1 | ||||||||
Total
Asset-Backed Securities (Cost $24,071,953) |
24,868,836 | 0.3 | ||||||||||
Total
Long-Term Investments (Cost $5,510,785,316) |
6,697,883,287 | 89.9 | ||||||||||
SHORT-TERM INVESTMENTS: 14.4% |
||||||||||||
Commercial Paper: 0.2% |
||||||||||||
2,200,000 |
(10) |
Australia & New Zealand Banking, 1.830%, 03/13/2020 |
2,191,805 | 0.1 | ||||||||
1,875,000 |
(10) |
Banco
Santander S.A., 1.950%, 02/05/2020 |
1,871,629 | 0.0 | ||||||||
950,000 |
(10) |
DBS
Bank Ltd., 1.710%, 01/07/2020 |
949,701 | 0.0 | ||||||||
2,775,000 |
(10) |
DBS
Bank Ltd., 1.820%, 02/18/2020 |
2,768,246 | 0.1 | ||||||||
1,525,000 |
(10) |
Le
Mouvement Des Caisses Desjardins, 1.850%, 02/10/2020 |
1,522,010 | 0.0 | ||||||||
975,000 |
(10) |
Matchpoint Finance PLC, 1.850%, 02/03/2020 |
973,347 | 0.0 | ||||||||
1,875,000 |
(10) |
Nederlandse Waterschapsbank, 1.870%, 02/12/2020 |
1,871,134 | 0.0 | ||||||||
2,122,000 |
(10) |
Societe Generale, 1.970%, 01/09/2020 |
2,121,045 | 0.0 | ||||||||
Total
Commercial Paper (Cost $14,268,917) |
14,268,917 | 0.2 | ||||||||||
Floating Rate Notes: 0.8% |
||||||||||||
2,775,000 |
(10) |
Australia & New Zealand Banking Group Ltd., 1.940%, 05/20/2020 |
2,774,877 | 0.0 | ||||||||
275,000 |
(10) |
BNP
Paribas, 1.950%, 05/14/2020 |
275,020 | 0.0 | ||||||||
2,375,000 |
(10) |
Canadian Imperial Bank of Commerce, 1.990%, 04/10/2020 |
2,377,417 | 0.0 | ||||||||
2,150,000 |
(10) |
Commonwealth Bank of Australia, 1.920%, 01/24/2020 |
2,150,274 | 0.1 | ||||||||
1,275,000 |
(10) |
Commonwealth Bank of Australia, 1.940%, 06/10/2020 |
1,274,997 | 0.0 | ||||||||
1,700,000 |
(10) |
Coöperatieve Rabobank U.A., 1.980%, 04/20/2020 |
1,700,475 | 0.0 | ||||||||
| Principal Amount† |
Value | Percentage of Net Assets | ||||||||||
SHORT-TERM INVESTMENTS: (continued) |
||||||||||||
Floating Rate Notes: (continued) |
||||||||||||
2,400,000 |
(10) |
Credit
Suisse Group AG, 1.890%, 04/17/2020 |
$ | 2,401,074 | 0.0 | |||||||
3,725,000 |
(10) |
HSBC
Bank PLC, 1.970%, 06/03/2020 |
3,724,989 | 0.1 | ||||||||
1,850,000 |
(10) |
Lloyds
Bank PLC, 1.960%, 01/24/2020 |
1,850,270 | 0.0 | ||||||||
1,825,000 |
(10) |
Mitsubishi UFJ Financial Group, Inc., 1.960%, 01/23/2020 |
1,825,265 | 0.0 | ||||||||
2,700,000 |
(10) |
Mitsubishi UFJ Financial Group, Inc., 1.970%, 03/18/2020 |
2,700,514 | 0.1 | ||||||||
1,425,000 |
(10) |
Mitsubishi UFJ Financial Group, Inc., 1.980%, 05/26/2020 |
1,425,109 | 0.0 | ||||||||
3,000,000 |
(10) |
Mizuho
Financial Group Inc., 2.010%, 05/22/2020 |
3,000,141 | 0.1 | ||||||||
2,300,000 |
(10) |
Mizuho
Financial Group Inc., 2.020%, 05/26/2020 |
2,300,198 | 0.0 | ||||||||
1,000,000 |
(10) |
National Australia Bank Ltd., 1.890%, 02/10/2020 |
1,000,021 | 0.0 | ||||||||
2,350,000 |
(10) |
Skandinaviska Enskilda Banken AB, 1.950%, 05/11/2020 |
2,350,075 | 0.0 | ||||||||
2,950,000 |
(10) |
Skandinaviska Enskilda Banken AB, 2.010%, 05/26/2020 |
2,950,355 | 0.1 | ||||||||
3,300,000 |
(10) |
Svenska Handelsbanken AB, 1.970%, 05/20/2020 |
3,300,111 | 0.1 | ||||||||
2,450,000 |
(10) |
The
Norinchukin Bank, 2.050%, 04/24/2020 |
2,450,881 | 0.0 | ||||||||
1,225,000 |
(10) |
The
Sumitomo Mitsui Financial Group, 1.930%, 06/05/2020 |
1,224,732 | 0.0 | ||||||||
750,000 |
(10) |
The
Sumitomo Mitsui Financial Group, 1.960%, 01/22/2020 |
750,053 | 0.0 | ||||||||
750,000 |
(10) |
The
Sumitomo Mitsui Financial Group, 1.970%, 05/12/2020 |
749,873 | 0.0 | ||||||||
1,950,000 |
(10) |
The
Sumitomo Mitsui Financial Group, 1.990%, 01/31/2020 |
1,950,162 | 0.1 | ||||||||
3,025,000 |
(10) |
Toronto-Dominion Bank, 1.850%, 02/13/2020 |
3,025,087 | 0.0 | ||||||||
1,025,000 |
(10) |
Toyota
Motor Corp., 2.020%, 01/10/2020 |
1,025,051 | 0.0 | ||||||||
716,000 |
(10) |
Wells
Fargo & Co., 1.860%, 02/14/2020 |
716,085 | 0.0 | ||||||||
704,000 |
(10) |
Wells
Fargo Bank N.A., 1.830%, 03/06/2020 |
704,131 | 0.0 | ||||||||
1,550,000 |
(10) |
Westpac Banking Corp, 1.830%, 02/10/2020 |
1,550,123 | 0.0 | ||||||||
3,300,000 |
(10) |
Westpac Banking Corp, 1.970%, 06/03/2020 |
3,300,127 | 0.1 | ||||||||
Total
Floating Rate Notes (Cost $56,827,487) |
56,827,487 | 0.8 | ||||||||||
VY® T. ROWE
PRICE |
SUMMARY PORTFOLIO OF INVESTMENTS AS OF DECEMBER 31, 2019 (CONTINUED) |
| Principal Amount† |
Value | Percentage of Net Assets | ||||||||||
|---|---|---|---|---|---|---|---|---|---|---|---|---|
SHORT-TERM INVESTMENTS: (continued) |
||||||||||||
Repurchase Agreements: 1.9% |
||||||||||||
58,830,853 |
(10) |
Bank
of Nova Scotia, Repurchase Agreement dated 12/31/19, 1.57%, due 01/02/20 (Repurchase Amount $58,835,914, collateralized by various U.S. Government
Agency Obligations, 2.500%–6.500%, Market Value plus accrued interest $60,012,704, due 09/01/24–11/01/49) |
$ | 58,830,853 | 0.8 | |||||||
5,403,327 |
(10) |
Citadel Securities LLC, Repurchase Agreement dated 12/31/19, 1.60%, due 01/02/20 (Repurchase Amount $5,403,801, collateralized by various U.S.
Government Securities, 0.000%–8.500%, Market Value plus accrued interest $5,511,884, due 01/15/20–11/15/48) |
5,403,327 | 0.1 | ||||||||
58,830,853 |
(10) |
Citigroup, Inc., Repurchase Agreement dated 12/31/19, 1.57%, due 01/02/20 (Repurchase Amount $58,835,914, collateralized by various U.S.
Government/U.S. Government Agency Obligations, 0.000%–9.000%, Market Value plus accrued interest $60,007,470, due
02/13/20–09/20/69) |
58,830,853 | 0.8 | ||||||||
18,095,586 |
(10) |
State of Wisconsin Investment Board, Repurchase Agreement dated 12/31/19, 1.75%, due 01/02/20 (Repurchase
Amount $18,097,321, collateralized by various U.S. Government Securities, 0.125%–3.875%, Market Value plus accrued interest $18,457,995, due
04/15/21–02/15/47) |
18,095,586 | 0.2 | ||||||||
Total
Repurchase Agreements (Cost $141,160,619) |
141,160,619 | 1.9 | ||||||||||
Certificates of Deposit: 0.2% |
||||||||||||
2,125,000 |
(10) |
Deutscher Sparkassen- und Giroverband, 1.860%, 02/13/2020 |
2,125,601 | 0.0 | ||||||||
2,850,000 |
(10) |
Deutscher Sparkassen- und Giroverband, 1.860%, 02/20/2020 |
2,850,909 | 0.1 | ||||||||
2,350,000 |
(10) |
Dz
Bank Ag Deutsche Zentral-Genossenschaftsbank, 1.830%, 02/13/2020 |
2,349,810 | 0.0 | ||||||||
| Principal Amount† |
Value | Percentage of Net Assets | ||||||||||
SHORT-TERM INVESTMENTS: (continued) |
||||||||||||
Certificates of Deposit: (continued) |
||||||||||||
2,600,000 |
(10) |
Dz
Bank Ag Deutsche Zentral-Genossenschaftsbank, 1.850%, 02/27/2020 |
$ | 2,599,636 | 0.1 | |||||||
2,250,000 |
(10) |
Landesbank Baden-Wurttemberg, 1.830%, 01/14/2020 |
2,250,090 | 0.0 | ||||||||
2,325,000 |
(10) |
Landesbank Baden-Wurttemberg, 1.830%, 01/16/2020 |
2,325,081 | 0.0 | ||||||||
2,225,000 |
(10) |
The
Norinchukin Bank, 1.870%, 03/05/2020 |
2,225,078 | 0.0 | ||||||||
450,000 |
(10) |
The Norinchukin Bank, 1.890%, 03/13/2020 |
450,021 | 0.0 | ||||||||
Total
Certificates of Deposit (Cost $17,176,226) |
17,176,226 | 0.2 | ||||||||||
| Shares | Value | Percentage of Net Assets |
||||||||||
|---|---|---|---|---|---|---|---|---|---|---|---|---|
Mutual Funds: 11.3% |
||||||||||||
| 4,581,000 | (10), (11) |
BlackRock Liquidity Funds, FedFund, Institutional Class, 1.520% |
4,581,000 | 0.1 | ||||||||
| 9,060,000 | (10) |
Fidelity Investments Money Market Government Portfolio — Institutional Class, 1.520% |
9,060,000 | 0.1 | ||||||||
| 9,570,000 | (10), (11) |
Goldman Sachs Financial Square Government Fund — Institutional Shares, 1.500% |
9,570,000 | 0.1 | ||||||||
| 817,914,872 | (11) |
T. Rowe Price Government Reserve Fund, 1.590% |
817,914,872 | 11.0 | ||||||||
Total
Mutual Funds (Cost $841,125,872) |
841,125,872 | 11.3 | ||||||||||
Total
Short-Term Investments (Cost $1,070,559,121) |
1,070,559,121 | 14.4 | ||||||||||
Total Investments in Securities (Cost $6,581,344,437) |
$ | 7,768,442,408 | 104.3 | |||||||||
Liabilities in Excess of Other Assets |
(323,190,142 | ) | (4.3 | ) | ||||||||
Net
Assets |
$ | 7,445,252,266 | 100.0 | |||||||||
“Other Securities” represents issues not identified as the top 50 holdings in terms of market value and issues or issuers not
exceeding 1% of net assets individually or in aggregate respectively as of December 31, 2019.
The following footnotes apply to either the
individual securities noted or one or more of the securities aggregated and listed as a single line item.
† |
Unless otherwise indicated, principal amount is shown in USD. | |
(1) |
All or a portion of this security is pledged to cover open written call options at December 31, 2019. | |
(2) |
Non-income producing security. | |
(3) |
Security, or a portion of the security, is on loan. | |
(4) |
The grouping contains securities on loan. |
VY® T. ROWE
PRICE |
SUMMARY PORTFOLIO OF INVESTMENTS AS OF DECEMBER 31, 2019 (CONTINUED) |
(5) |
For fair value measurement disclosure purposes, security is categorized as Level 3, whose value was determined using significant unobservable inputs. | |
(6) |
Restricted security as to resale, excluding Rule 144A securities. As of December 31, 2019, the Portfolio held restricted securities with a fair value of $5,325,555 or 0.1% of net assets. Please refer to the table below for additional details. | |
(7) |
The grouping contains non-income producing securities. | |
(8) |
Preferred Stock may be called prior to convertible date. | |
(9) |
Securities with purchases pursuant to Rule 144A or section 4(a)(2), under the Securities Act of 1933 and may not be resold subject to that rule except to qualified institutional buyers. | |
(10) |
All or a portion of the security represents securities purchased with cash collateral received for securities on loan. | |
(11) |
Rate shown is the 7-day yield as of December 31, 2019. |
US0001M |
1-month LIBOR | |
US0003M |
3-month LIBOR |
| Quoted
Prices in Active Markets for Identical Investments (Level 1) |
Significant Other Observable Inputs# (Level 2) |
Significant Unobservable Inputs (Level 3) |
Fair
Value at December 31, 2019 |
||||||||||||||||
|---|---|---|---|---|---|---|---|---|---|---|---|---|---|---|---|---|---|---|---|
Asset
Table |
|||||||||||||||||||
Investments,
at fair value |
|||||||||||||||||||
Common
Stock |
|||||||||||||||||||
Communication
Services |
$ | 291,077,755 | $ | — | $ | — | $ | 291,077,755 | |||||||||||
Consumer
Discretionary |
410,337,115 | — | — | 410,337,115 | |||||||||||||||
Consumer
Staples |
84,246,121 | — | — | 84,246,121 | |||||||||||||||
Energy |
20,456,352 | — | — | 20,456,352 | |||||||||||||||
Financials |
431,102,820 | — | — | 431,102,820 | |||||||||||||||
Health
Care |
932,939,240 | 146,969,924 | — | 1,079,909,164 | |||||||||||||||
Industrials |
653,903,167 | — | — | 653,903,167 | |||||||||||||||
Information
Technology |
1,259,569,126 | — | — | 1,259,569,126 | |||||||||||||||
Real
Estate |
7,377,222 | — | — | 7,377,222 | |||||||||||||||
Utilities |
474,196,093 | — | — | 474,196,093 | |||||||||||||||
Total Common
Stock |
4,565,205,011 | 146,969,924 | — | 4,712,174,935 | |||||||||||||||
Preferred
Stock |
389,462,928 | — | 5,325,555 | 394,788,483 | |||||||||||||||
Corporate
Bonds/Notes |
— | 1,219,284,449 | — | 1,219,284,449 | |||||||||||||||
Asset-Backed
Securities |
— | 24,868,836 | — | 24,868,836 | |||||||||||||||
Bank
Loans |
— | 346,766,584 | — | 346,766,584 | |||||||||||||||
Short-Term
Investments |
841,125,872 | 229,433,249 | — | 1,070,559,121 | |||||||||||||||
Total
Investments, at fair value |
$ | 5,795,793,811 | $ | 1,967,323,042 | $ | 5,325,555 | $ | 7,768,442,408 | |||||||||||
Other
Financial Instruments+ |
|||||||||||||||||||
Forward Foreign
Currency Contracts |
— | 161 | — | 161 | |||||||||||||||
Total
Assets |
$ | 5,795,793,811 | $ | 1,967,323,203 | $ | 5,325,555 | $ | 7,768,442,569 | |||||||||||
Liabilities
Table |
|||||||||||||||||||
Other
Financial Instruments+ |
|||||||||||||||||||
Written
Options |
$ | — | $ | (75,492,168 | ) | $ | — | $ | (75,492,168 | ) | |||||||||
Total
Liabilities |
$ | — | $ | (75,492,168 | ) | $ | — | $ | (75,492,168 | ) | |||||||||
ˆ |
See Note 2, “Significant Accounting Policies” in the Notes to Financial Statements for additional information. | |
+ |
Other Financial Instruments may include open forward foreign currency contracts, futures, centrally cleared swaps, OTC swaps and written options. Forward foreign currency contracts, futures and centrally cleared swaps are valued at the unrealized gain (loss) on the instrument. OTC swaps and written options are valued at the fair value of the instrument. | |
# |
The earlier close of the foreign markets gives rise to the possibility that significant events, including broad market moves, may have occurred in the interim and may materially affect the value of those securities. To account for this, the Portfolio may frequently value many of its foreign equity securities using fair value prices based on third party vendor modeling tools to the extent available. Accordingly, a portion of the Portfolio’s investments are categorized as Level 2 investments. |
| Security | Acquisition Date |
Acquisition Cost |
Fair Value |
|||||||||||
|---|---|---|---|---|---|---|---|---|---|---|---|---|---|---|
Aurora
Innovation, Inc., — Series B |
3/1/2019 | $ | 5,325,555 | $ | 5,325,555 | |||||||||
| $ | 5,325,555 | $ | 5,325,555 | |||||||||||
VY® T. ROWE
PRICE |
SUMMARY PORTFOLIO OF INVESTMENTS AS OF DECEMBER 31, 2019 (CONTINUED) |
| Currency Purchased | Currency Sold | Counterparty | Settlement Date |
Unrealized Appreciation (Depreciation) |
|||||||
|---|---|---|---|---|---|---|---|---|---|---|---|
CHF
1,503,701 |
USD
1,553,571 |
UBS
AG |
01/03/20 | $ | 161 | ||||||
| $ | 161 | ||||||||||
| Description | Counterparty | Put/Call | Expiration Date |
Exercise Price |
Number of Contracts |
Notional Amount |
Premiums Received |
Fair Value |
||||||||||||||||||||||
|---|---|---|---|---|---|---|---|---|---|---|---|---|---|---|---|---|---|---|---|---|---|---|---|---|---|---|---|---|---|---|
Alphabet,
Inc. — Class C |
Citigroup Global Markets |
Call | 01/15/21 | USD 1,500.000 | 49 | USD 6,551,398 | $ | 325,850 | $ | (325,850 | ) | |||||||||||||||||||
Microsoft
Corp. |
Credit Suisse Securities (USA) LLC |
Call | 01/17/20 | USD 125.000 | 1,912 | USD 30,152,240 | 883,461 | (6,268,909 | ) | |||||||||||||||||||||
Microsoft
Corp. |
Credit Suisse Securities (USA) LLC |
Call | 01/17/20 | USD 130.000 | 442 | USD 6,970,340 | 146,214 | (1,229,119 | ) | |||||||||||||||||||||
Microsoft
Corp. |
RBC Capital Markets, LLC |
Call | 01/17/20 | USD 130.000 | 1,470 | USD 23,181,900 | 420,365 | (4,087,795 | ) | |||||||||||||||||||||
Texas
Instruments, Inc. |
Goldman Sachs & Co. |
Call | 01/17/20 | USD 130.000 | 134 | USD 1,719,086 | 97,245 | (26,916 | ) | |||||||||||||||||||||
Visa, Inc.
— Class A |
Credit Suisse Securities (USA) LLC |
Call | 01/17/20 | USD 170.000 | 752 | USD 14,130,080 | 394,123 | (1,373,452 | ) | |||||||||||||||||||||
Visa, Inc.
— Class A |
Credit Suisse Securities (USA) LLC |
Call | 01/17/20 | USD 175.000 | 751 | USD 14,111,290 | 270,135 | (1,010,094 | ) | |||||||||||||||||||||
Alphabet,
Inc. — Class A |
Goldman Sachs & Co. |
Call | 01/17/20 | USD 1,270.000 | 37 | USD 4,955,743 | 193,766 | (273,042 | ) | |||||||||||||||||||||
Alphabet,
Inc. — Class A |
Goldman Sachs & Co. |
Call | 01/17/20 | USD 1,300.000 | 38 | USD 5,089,682 | 160,966 | (182,911 | ) | |||||||||||||||||||||
Alphabet,
Inc. — Class A |
Goldman Sachs & Co. |
Call | 01/17/20 | USD 1,350.000 | 38 | USD 5,089,682 | 110,122 | (61,025 | ) | |||||||||||||||||||||
Alphabet,
Inc. — Class C |
Citigroup Global Markets |
Call | 01/17/20 | USD 1,300.000 | 319 | USD 42,650,938 | 1,539,076 | (1,456,743 | ) | |||||||||||||||||||||
Alphabet,
Inc. — Class C |
Citigroup Global Markets |
Call | 01/17/20 | USD 1,340.000 | 76 | USD 10,161,352 | 603,766 | (141,725 | ) | |||||||||||||||||||||
Alphabet,
Inc. — Class C |
Citigroup Global Markets |
Call | 01/17/20 | USD 1,350.000 | 98 | USD 13,102,796 | 372,106 | (133,507 | ) | |||||||||||||||||||||
Alphabet,
Inc. — Class C |
Citigroup Global Markets |
Call | 01/17/20 | USD 1,400.000 | 77 | USD 10,295,054 | 475,703 | (13,651 | ) | |||||||||||||||||||||
Alphabet,
Inc. — Class C |
Citigroup Global Markets |
Call | 01/17/20 | USD 1,500.000 | 77 | USD 10,295,054 | 310,803 | (57 | ) | |||||||||||||||||||||
Amazon.com,
Inc. |
Citigroup Global Markets |
Call | 01/17/20 | USD 1,800.000 | 59 | USD 10,902,256 | 1,105,424 | (373,251 | ) | |||||||||||||||||||||
Amazon.com,
Inc. |
Citigroup Global Markets |
Call | 01/17/20 | USD 2,000.000 | 20 | USD 3,695,680 | 232,160 | (6,819 | ) | |||||||||||||||||||||
Amazon.com,
Inc. |
Citigroup Global Markets |
Call | 01/17/20 | USD 2,025.000 | 20 | USD 3,695,680 | 218,160 | (4,840 | ) | |||||||||||||||||||||
Amazon.com,
Inc. |
Citigroup Global Markets |
Call | 01/17/20 | USD 2,100.000 | 20 | USD 3,695,680 | 179,160 | (1,929 | ) | |||||||||||||||||||||
Amazon.com,
Inc. |
Citigroup Global Markets |
Call | 01/17/20 | USD 2,300.000 | 92 | USD 17,000,128 | 982,555 | (1,373 | ) | |||||||||||||||||||||
Amazon.com,
Inc. |
Credit Suisse Securities (USA) LLC |
Call | 01/17/20 | USD 2,500.000 | 39 | USD 7,206,576 | 481,544 | (145 | ) | |||||||||||||||||||||
Amazon.com,
Inc. |
Credit Suisse Securities (USA) LLC |
Call | 01/17/20 | USD 2,600.000 | 39 | USD 7,206,576 | 400,532 | (81 | ) | |||||||||||||||||||||
Amazon.com,
Inc. |
Credit Suisse Securities (USA) LLC |
Call | 01/17/20 | USD 2,700.000 | 40 | USD 7,391,360 | 341,896 | (50 | ) | |||||||||||||||||||||
American
Electric Power Co., Inc. |
Citigroup Global Markets |
Call | 01/17/20 | USD 85.000 | 2,666 | USD 25,196,366 | 376,925 | (2,563,747 | ) | |||||||||||||||||||||
American
Electric Power Co., Inc. |
Citigroup Global Markets |
Call | 01/17/20 | USD 95.000 | 1,959 | USD 18,514,509 | 342,405 | (139,588 | ) | |||||||||||||||||||||
American
Tower Corp. |
Citigroup Global Markets |
Call | 01/17/20 | USD 175.000 | 321 | USD 7,377,222 | 242,095 | (1,766,356 | ) | |||||||||||||||||||||
Danaher
Corp. |
Citigroup Global Markets |
Call | 01/17/20 | USD 150.000 | 323 | USD 4,957,404 | 84,768 | (157,003 | ) | |||||||||||||||||||||
Facebook,
Inc. — Class A |
JPMorgan Chase Bank N.A. |
Call | 01/17/20 | USD 200.000 | 949 | USD 19,478,225 | 930,096 | (719,087 | ) | |||||||||||||||||||||
Facebook,
Inc. — Class A |
JPMorgan Chase Bank N.A. |
Call | 01/17/20 | USD 220.000 | 1,655 | USD 33,968,875 | 731,497 | (55,321 | ) | |||||||||||||||||||||
McDonald’s Corp. |
Citigroup Global Markets |
Call | 01/17/20 | USD 195.000 | 422 | USD 8,339,142 | 424,005 | (172,007 | ) | |||||||||||||||||||||
McDonald’s Corp. |
Citigroup Global Markets |
Call | 01/17/20 | USD 200.000 | 422 | USD 8,339,142 | 349,994 | (51,217 | ) | |||||||||||||||||||||
McDonald’s Corp. |
Credit Suisse Securities (USA) LLC |
Call | 01/17/20 | USD 195.000 | 177 | USD 3,497,697 | 134,042 | (72,145 | ) | |||||||||||||||||||||
McDonald’s Corp. |
Credit Suisse Securities (USA) LLC |
Call | 01/17/20 | USD 200.000 | 132 | USD 2,608,452 | 81,259 | (16,020 | ) | |||||||||||||||||||||
Microsoft
Corp. |
Citigroup Global Markets |
Call | 01/17/20 | USD 120.000 | 886 | USD 13,972,220 | 549,648 | (3,342,103 | ) | |||||||||||||||||||||
Microsoft
Corp. |
Citigroup Global Markets |
Call | 01/17/20 | USD 125.000 | 1,559 | USD 24,585,430 | 887,036 | (5,111,522 | ) | |||||||||||||||||||||
Microsoft
Corp. |
Citigroup Global Markets |
Call | 01/17/20 | USD 130.000 | 1,558 | USD 24,569,660 | 671,735 | (4,332,507 | ) | |||||||||||||||||||||
Microsoft
Corp. |
Citigroup Global Markets |
Call | 01/17/20 | USD 135.000 | 1,595 | USD 25,153,150 | 939,310 | (3,643,277 | ) | |||||||||||||||||||||
PNC
Financial Services Group, Inc. |
Credit Suisse Securities (USA) LLC |
Call | 01/17/20 | USD 140.000 | 1,269 | USD 20,257,047 | 663,053 | (2,510,183 | ) | |||||||||||||||||||||
S&P
Global, Inc. |
Citigroup Global Markets |
Call | 01/17/20 | USD 220.000 | 651 | USD 17,775,555 | 628,247 | (3,464,638 | ) | |||||||||||||||||||||
S&P
Global, Inc. |
Citigroup Global Markets |
Call | 01/17/20 | USD 230.000 | 652 | USD 17,802,860 | 375,546 | (2,819,161 | ) | |||||||||||||||||||||
Texas
Instruments, Inc. |
Goldman Sachs & Co. |
Call | 01/17/20 | USD 135.000 | 168 | USD 2,155,272 | 70,896 | (9,160 | ) | |||||||||||||||||||||
Texas
Instruments, Inc. |
Goldman Sachs & Co. |
Call | 01/17/20 | USD 140.000 | 168 | USD 2,155,272 | 44,016 | (2,182 | ) | |||||||||||||||||||||
Texas
Instruments, Inc. |
JPMorgan Chase Bank N.A. |
Call | 01/17/20 | USD 120.000 | 657 | USD 8,428,653 | 167,995 | (596,703 | ) | |||||||||||||||||||||
Texas
Instruments, Inc. |
JPMorgan Chase Bank N.A. |
Call | 01/17/20 | USD 130.000 | 1,462 | USD 18,755,998 | 564,837 | (293,665 | ) | |||||||||||||||||||||
Texas
Instruments, Inc. |
RBC Capital Markets, LLC |
Call | 01/17/20 | USD 125.000 | 3,049 | USD 39,115,621 | 1,004,591 | (1,522,002 | ) | |||||||||||||||||||||
UnitedHealth Group, Inc. |
Citigroup Global Markets |
Call | 01/17/20 | USD 270.000 | 266 | USD 7,819,868 | 393,101 | (652,617 | ) | |||||||||||||||||||||
UnitedHealth Group, Inc. |
Citigroup Global Markets |
Call | 01/17/20 | USD 280.000 | 265 | USD 7,790,470 | 290,027 | (413,386 | ) | |||||||||||||||||||||
UnitedHealth Group, Inc. |
Citigroup Global Markets |
Call | 01/17/20 | USD 290.000 | 309 | USD 9,083,982 | 561,023 | (252,736 | ) | |||||||||||||||||||||
UnitedHealth Group, Inc. |
Citigroup Global Markets |
Call | 01/17/20 | USD 300.000 | 456 | USD 13,405,488 | 669,522 | (144,698 | ) | |||||||||||||||||||||
UnitedHealth Group, Inc. |
Goldman Sachs & Co. |
Call | 01/17/20 | USD 290.000 | 152 | USD 4,468,496 | 278,172 | (124,323 | ) | |||||||||||||||||||||
UnitedHealth Group, Inc. |
Goldman Sachs & Co. |
Call | 01/17/20 | USD 310.000 | 33 | USD 970,134 | 27,333 | (2,832 | ) | |||||||||||||||||||||
Visa, Inc.
— Class A |
Credit Suisse Securities (USA) LLC |
Call | 01/17/20 | USD 150.000 | 549 | USD 10,315,710 | 508,594 | (2,091,490 | ) | |||||||||||||||||||||
VY® T. ROWE
PRICE |
SUMMARY PORTFOLIO OF INVESTMENTS AS OF DECEMBER 31, 2019 (CONTINUED) |
| Description | Counterparty | Put/Call | Expiration Date |
Exercise Price |
Number of Contracts |
Notional Amount |
Premiums Received |
Fair Value |
||||||||||||||||||||||
|---|---|---|---|---|---|---|---|---|---|---|---|---|---|---|---|---|---|---|---|---|---|---|---|---|---|---|---|---|---|---|
Visa, Inc.
— Class A |
Credit Suisse Securities (USA) LLC |
Call | 01/17/20 | USD 155.000 | 549 | USD 10,315,710 | $ | 413,177 | $ | (1,818,307 | ) | |||||||||||||||||||
Visa, Inc.
— Class A |
Credit Suisse Securities (USA) LLC |
Call | 01/17/20 | USD 160.000 | 885 | USD 16,629,150 | 612,574 | (2,491,871 | ) | |||||||||||||||||||||
Visa, Inc.
— Class A |
Credit Suisse Securities (USA) LLC |
Call | 01/17/20 | USD 165.000 | 758 | USD 14,242,820 | 378,722 | (1,759,719 | ) | |||||||||||||||||||||
Visa, Inc.
— Class A |
Goldman Sachs & Co. |
Call | 01/17/20 | USD 170.000 | 760 | USD 14,280,400 | 442,401 | (1,388,063 | ) | |||||||||||||||||||||
Visa, Inc.
— Class A |
Goldman Sachs & Co. |
Call | 01/17/20 | USD 175.000 | 1,820 | USD 34,197,800 | 866,108 | (2,447,897 | ) | |||||||||||||||||||||
Visa, Inc.
— Class A |
Goldman Sachs & Co. |
Call | 01/17/20 | USD 180.000 | 624 | USD 11,724,960 | 412,339 | (550,258 | ) | |||||||||||||||||||||
Yum!
Brands, Inc. |
Citigroup Global Markets |
Call | 01/17/20 | USD 100.000 | 843 | USD 8,491,539 | 306,076 | (187,849 | ) | |||||||||||||||||||||
Yum!
Brands, Inc. |
Citigroup Global Markets |
Call | 01/17/20 | USD 115.000 | 470 | USD 4,734,310 | 167,790 | (1,003 | ) | |||||||||||||||||||||
Yum!
Brands, Inc. |
Citigroup Global Markets |
Call | 01/17/20 | USD 115.000 | 166 | USD 1,672,118 | 59,262 | (354 | ) | |||||||||||||||||||||
Yum!
Brands, Inc. |
Citigroup Global Markets |
Call | 01/17/20 | USD 120.000 | 166 | USD 1,672,118 | 30,723 | (90 | ) | |||||||||||||||||||||
Yum!
Brands, Inc. |
Citigroup Global Markets |
Call | 01/17/20 | USD 120.000 | 471 | USD 4,744,383 | 85,251 | (255 | ) | |||||||||||||||||||||
Alphabet,
Inc. — Class C |
Citigroup Global Markets |
Call | 01/15/21 | USD 1,500.000 | 75 | USD 10,027,650 | 566,025 | (484,024 | ) | |||||||||||||||||||||
Alphabet,
Inc. — Class C |
Citigroup Global Markets |
Call | 01/15/21 | USD 1,500.000 | 75 | USD 10,027,650 | 554,025 | (484,024 | ) | |||||||||||||||||||||
Alphabet,
Inc. — Class C |
Citigroup Global Markets |
Call | 01/15/21 | USD 1,500.000 | 75 | USD 10,027,650 | 600,525 | (484,024 | ) | |||||||||||||||||||||
Amazon.com,
Inc. |
Credit Suisse Securities (USA) LLC |
Call | 01/15/21 | USD 2,200.000 | 37 | USD 6,837,008 | 232,027 | (315,343 | ) | |||||||||||||||||||||
Amazon.com,
Inc. |
Credit Suisse Securities (USA) LLC |
Call | 01/15/21 | USD 2,200.000 | 62 | USD 11,456,608 | 401,617 | (528,413 | ) | |||||||||||||||||||||
Amazon.com,
Inc. |
Credit Suisse Securities (USA) LLC |
Call | 01/15/21 | USD 2,200.000 | 49 | USD 9,054,416 | 294,598 | (417,617 | ) | |||||||||||||||||||||
Amazon.com,
Inc. |
Credit Suisse Securities (USA) LLC |
Call | 01/15/21 | USD 2,200.000 | 62 | USD 11,456,608 | 395,417 | (528,413 | ) | |||||||||||||||||||||
American
Electric Power Co., Inc. |
Citigroup Global Markets |
Call | 01/15/21 | USD 105.000 | 1,000 | USD 9,451,000 | 157,000 | (187,258 | ) | |||||||||||||||||||||
American
Electric Power Co., Inc. |
Citigroup Global Markets |
Call | 01/15/21 | USD 105.000 | 988 | USD 9,337,588 | 155,116 | (185,010 | ) | |||||||||||||||||||||
Becton
Dickinson & Co. |
Goldman Sachs & Co. |
Call | 01/15/21 | USD 300.000 | 250 | USD 6,799,250 | 249,820 | (311,522 | ) | |||||||||||||||||||||
Becton
Dickinson & Co. |
Goldman Sachs & Co. |
Call | 01/15/21 | USD 300.000 | 212 | USD 5,765,764 | 257,181 | (249,100 | ) | |||||||||||||||||||||
Becton
Dickinson & Co. |
Goldman Sachs & Co. |
Call | 01/15/21 | USD 300.000 | 75 | USD 2,039,775 | 70,180 | (93,457 | ) | |||||||||||||||||||||
Becton
Dickinson & Co. |
Goldman Sachs & Co. |
Call | 01/15/21 | USD 300.000 | 175 | USD 4,759,475 | 159,917 | (218,065 | ) | |||||||||||||||||||||
General
Electric Co. |
JPMorgan Chase Bank N.A. |
Call | 01/15/21 | USD 15.000 | 6,248 | USD 6,972,768 | 353,137 | (292,218 | ) | |||||||||||||||||||||
General
Electric Co. |
JPMorgan Chase Bank N.A. |
Call | 01/15/21 | USD 15.000 | 6,247 | USD 6,971,652 | 324,844 | (292,171 | ) | |||||||||||||||||||||
Microsoft
Corp. |
Credit Suisse Securities (USA) LLC |
Call | 01/15/21 | USD 165.000 | 1,258 | USD 19,838,660 | 849,276 | (1,456,225 | ) | |||||||||||||||||||||
Microsoft
Corp. |
Credit Suisse Securities (USA) LLC |
Call | 01/15/21 | USD 165.000 | 1,200 | USD 18,924,000 | 830,400 | (1,389,086 | ) | |||||||||||||||||||||
NXP
Semiconductor NV — NXPI — US |
Credit Suisse Securities (USA) LLC |
Call | 01/15/21 | USD 140.000 | 409 | USD 5,204,934 | 302,987 | (435,765 | ) | |||||||||||||||||||||
NXP
Semiconductor NV — NXPI — US |
Credit Suisse Securities (USA) LLC |
Call | 01/15/21 | USD 140.000 | 174 | USD 2,214,324 | 121,835 | (185,387 | ) | |||||||||||||||||||||
NXP
Semiconductor NV — NXPI — US |
Credit Suisse Securities (USA) LLC |
Call | 01/15/21 | USD 140.000 | 973 | USD 12,382,398 | 737,145 | (1,036,674 | ) | |||||||||||||||||||||
Texas
Instruments, Inc. |
Goldman Sachs & Co. |
Call | 01/15/21 | USD 135.000 | 503 | USD 6,452,987 | 327,212 | (455,022 | ) | |||||||||||||||||||||
Texas
Instruments, Inc. |
Goldman Sachs & Co. |
Call | 01/15/21 | USD 140.000 | 503 | USD 6,452,987 | 254,402 | (358,039 | ) | |||||||||||||||||||||
Thermo
Fisher Scientific, Inc. |
RBC Capital Markets, LLC |
Call | 01/15/21 | USD 400.000 | 74 | USD 2,404,038 | 52,505 | (56,979 | ) | |||||||||||||||||||||
Thermo
Fisher Scientific, Inc. |
RBC Capital Markets, LLC |
Call | 01/15/21 | USD 400.000 | 327 | USD 10,623,249 | 231,284 | (251,784 | ) | |||||||||||||||||||||
Thermo
Fisher Scientific, Inc. |
RBC Capital Markets, LLC |
Call | 01/15/21 | USD 400.000 | 173 | USD 5,620,251 | 134,883 | (133,207 | ) | |||||||||||||||||||||
Yum!
Brands, Inc. |
Bank of America N.A. |
Call | 01/17/20 | USD 115.000 | 351 | USD 3,535,623 | 43,071 | (749 | ) | |||||||||||||||||||||
Yum!
Brands, Inc. |
Bank of America N.A. |
Call | 01/17/20 | USD 120.000 | 351 | USD 3,535,623 | 14,416 | (190 | ) | |||||||||||||||||||||
Yum!
Brands, Inc. |
Citigroup Global Markets |
Call | 01/17/20 | USD 115.000 | 347 | USD 3,495,331 | 63,619 | (740 | ) | |||||||||||||||||||||
Yum!
Brands, Inc. |
Citigroup Global Markets |
Call | 01/17/20 | USD 115.000 | 178 | USD 1,792,994 | 35,956 | (380 | ) | |||||||||||||||||||||
Yum!
Brands, Inc. |
Citigroup Global Markets |
Call | 01/17/20 | USD 115.000 | 139 | USD 1,400,147 | 28,078 | (297 | ) | |||||||||||||||||||||
Yum!
Brands, Inc. |
Citigroup Global Markets |
Call | 01/17/20 | USD 120.000 | 138 | USD 1,390,074 | 10,212 | (75 | ) | |||||||||||||||||||||
Yum!
Brands, Inc. |
Citigroup Global Markets |
Call | 01/17/20 | USD 120.000 | 348 | USD 3,505,404 | 22,610 | (188 | ) | |||||||||||||||||||||
Yum!
Brands, Inc. |
Citigroup Global Markets |
Call | 01/17/20 | USD 120.000 | 178 | USD 1,792,994 | 13,172 | (96 | ) | |||||||||||||||||||||
| $ | 35,855,815 | $ | (75,492,168 | ) | ||||||||||||||||||||||||||
Currency Abbreviations
CHF |
— Swiss Franc | |
USD |
— United States Dollar |
VY® T. ROWE
PRICE |
SUMMARY PORTFOLIO OF INVESTMENTS AS OF DECEMBER 31, 2019 (CONTINUED) |
| Derivatives not accounted for as hedging instruments |
Location on Statement of Assets and Liabilities |
Fair Value | ||||
|---|---|---|---|---|---|---|
Asset
Derivatives |
||||||
Foreign exchange
contracts |
Unrealized
appreciation on forward foreign currency contracts |
$ | 161 | |||
Total Asset
Derivatives |
$ | 161 | ||||
Liability
Derivatives |
||||||
Equity
contracts |
Written
options, at fair value |
$ | 75,492,168 | |||
Total Liability
Derivatives |
$ | 75,492,168 | ||||
* |
Includes purchased options. |
| Amount of Realized Gain or (Loss) on Derivatives Recognized in Income |
||||||||||||||||||||
|---|---|---|---|---|---|---|---|---|---|---|---|---|---|---|---|---|---|---|---|---|
| Derivatives not accounted for as hedging instruments |
Investments* | Forward foreign currency contracts |
Written options |
Totals | ||||||||||||||||
Equity
contracts |
$ | 1,430,983 | $ | — | $ | 23,749,238 | $ | 25,180,221 | ||||||||||||
Foreign exchange
contracts |
— | 59,360 | — | 59,360 | ||||||||||||||||
Total |
$ | 1,430,983 | $ | 59,360 | $ | 23,749,238 | $ | 25,239,581 | ||||||||||||
| Change in Unrealized Appreciation or (Depreciation) on Derivatives Recognized in Income |
||||||||||||||||||||
|---|---|---|---|---|---|---|---|---|---|---|---|---|---|---|---|---|---|---|---|---|
| Derivatives not accounted for as hedging instruments |
Investments* | Forward foreign currency contracts |
Written options |
Totals | ||||||||||||||||
Equity
contracts |
$ | — | $ | — | $ | (55,394,858 | ) | $ | (55,394,858 | ) | ||||||||||
Foreign exchange
contracts |
— | 161 | — | 161 | ||||||||||||||||
Total |
$ | — | $ | 161 | $ | (55,394,858 | ) | $ | (55,394,697 | ) | ||||||||||
* |
Amounts recognized for purchased options are included in net realized gain (loss) on investments and net change in unrealized appreciation or depreciation on investments. |
| Bank of America N.A. |
Citigroup Global Markets |
Credit Suisse Securities (USA) LLC |
Goldman Sachs & Co. |
JPMorgan Chase Bank N.A. |
RBC Capital Markets |
UBS AG | Totals | ||||||||||||||||||||||||||||
|---|---|---|---|---|---|---|---|---|---|---|---|---|---|---|---|---|---|---|---|---|---|---|---|---|---|---|---|---|---|---|---|---|---|---|---|
Assets: |
|||||||||||||||||||||||||||||||||||
Forward foreign
currency contracts |
$ | — | $ | — | $ | — | $ | — | $ | — | $ | — | $ | 161 |
$ | 161 |
|||||||||||||||||||
Total
Assets |
$ | — | $ | — | $ | — | $ | — | $ | — | $ | — | $ | 161 |
$ | 161 |
|||||||||||||||||||
Liabilities: |
|||||||||||||||||||||||||||||||||||
Written
options |
$ | 939 | $ | 33,501,975 | $ | 26,934,508 | $ | 6,753,814 | $ | 2,249,165 | $ | 6,051,767 | $ | — |
$ | 75,492,168 |
|||||||||||||||||||
Total
Liabilities |
$ | 939 | $ | 33,501,975 | $ | 26,934,508 | $ | 6,753,814 | $ | 2,249,165 | $ | 6,051,767 | $ | — |
$ | 75,492,168 |
|||||||||||||||||||
Net OTC
derivative instruments by counterparty, at fair value |
$ | (939 | ) | $ | (33,501,975 | ) | $ | (26,934,508 | ) | $ | (6,753,814 | ) | $ | (2,249,165 | ) | $ | (6,051,767 | ) | $ | 161 |
$ | (75,492,007) |
|||||||||||||
Total
collateral pledged by the Portfolio/(Received from counterparty) |
$ | — | $ | — | $ | — | $ | — | $ | — | $ | — | $ | — |
$ | — |
|||||||||||||||||||
Net
Exposure(1) |
$ | (939 | ) | $ | (33,501,975 | ) | $ | (26,934,508 | ) | $ | (6,753,814 | ) | $ | (2,249,165 | ) | $ | (6,051,767 | ) | $ | 161 |
$ | (75,492,007) |
|||||||||||||
(1) |
Positive net exposure represents amounts due from each respective counterparty. Negative exposure represents amounts due from the Portfolio. Please refer to Note 2 for additional details regarding counterparty credit risk and credit related contingent features. |
VY® T. ROWE
PRICE |
SUMMARY PORTFOLIO OF INVESTMENTS AS OF DECEMBER 31, 2019 (CONTINUED) |
Cost for federal income tax purposes was $6,561,687,655. |
|||||||
Net unrealized
appreciation consisted of: |
|||||||
Gross
Unrealized Appreciation |
$ | 1,202,292,298 | |||||
Gross
Unrealized Depreciation |
(70,681,556 | ) | |||||
Net Unrealized
Appreciation |
$ | 1,131,610,742 | |||||
VY® T. ROWE
PRICE |
SUMMARY PORTFOLIO OF INVESTMENTS AS OF DECEMBER 31, 2019 |
| Shares | Value | Percentage of Net Assets |
||||||||||
|---|---|---|---|---|---|---|---|---|---|---|---|---|
| COMMON STOCK: 96.3% | ||||||||||||
Communication Services: 6.1% |
||||||||||||
| 97,183 | Comcast Corp. — Class A |
$ | 4,370,319 | 1.1 | ||||||||
| 118,360 | Fox
Corp. — Class B |
4,308,304 | 1.1 | |||||||||
| 239,934 | News
Corp — Class A |
3,392,667 | 0.9 | |||||||||
| 107,596 | Verizon Communications, Inc. |
6,606,394 | 1.7 | |||||||||
| 290,727 | Other Securities |
4,787,039 | 1.3 | |||||||||
| 23,464,723 | 6.1 | |||||||||||
Consumer Discretionary: 2.4% |
||||||||||||
| 56,423 | Las Vegas Sands Corp. |
3,895,444 | 1.0 | |||||||||
| 246,696 | (1),(2) |
Other Securities |
5,432,735 | 1.4 | ||||||||
| 9,328,179 | 2.4 | |||||||||||
Consumer Staples: 7.9% |
||||||||||||
| 158,412 | Conagra Brands, Inc. |
5,424,027 | 1.4 | |||||||||
| 43,979 | Kimberly-Clark Corp. |
6,049,311 | 1.6 | |||||||||
| 78,028 | Philip
Morris International, Inc. |
6,639,403 | 1.7 | |||||||||
| 78,317 | Tyson Foods, Inc. |
7,129,980 | 1.8 | |||||||||
| 65,436 | Other Securities |
5,229,873 | 1.4 | |||||||||
| 30,472,594 | 7.9 | |||||||||||
Energy: 8.7% |
||||||||||||
| 95,627 | Exxon
Mobil Corp. |
6,672,852 | 1.7 | |||||||||
| 111,383 | Occidental Petroleum Corp. |
4,590,093 | 1.2 | |||||||||
| 129,742 | (3) |
TC
Energy Corp. |
6,916,546 | 1.8 | ||||||||
| 164,698 | (3) |
Total S.A. ADR |
9,107,799 | 2.4 | ||||||||
| 99,405 | Other Securities |
6,231,873 | 1.6 | |||||||||
| 33,519,163 | 8.7 | |||||||||||
Financials: 23.7% |
||||||||||||
| 124,321 | American International Group, Inc. |
6,381,397 | 1.7 | |||||||||
| 47,175 | Chubb
Ltd. |
7,343,261 | 1.9 | |||||||||
| 14,266 | Citigroup, Inc. |
1,139,711 | 0.3 | |||||||||
| 186,582 | Fifth
Third Bancorp |
5,735,531 | 1.5 | |||||||||
| 92,912 | JPMorgan Chase & Co. |
12,951,933 | 3.4 | |||||||||
| 61,376 | Loews
Corp. |
3,221,626 | 0.9 | |||||||||
| 104,126 | Metlife, Inc. |
5,307,302 | 1.4 | |||||||||
| 145,591 | Morgan
Stanley |
7,442,612 | 1.9 | |||||||||
| 27,332 | PNC
Financial Services Group, Inc. |
4,363,007 | 1.1 | |||||||||
| 77,816 | State
Street Corp. |
6,155,246 | 1.6 | |||||||||
| 70,587 | US
Bancorp |
4,185,103 | 1.1 | |||||||||
| 273,233 | Wells Fargo & Co. |
14,699,935 | 3.8 | |||||||||
| 242,548 | Other Securities |
11,989,043 | 3.1 | |||||||||
| 90,915,707 | 23.7 | |||||||||||
Health Care: 12.5% |
||||||||||||
| 17,703 | Allergan plc |
3,384,283 | 0.9 | |||||||||
| 17,850 | Anthem, Inc. |
5,391,236 | 1.4 | |||||||||
| 84,351 | CVS
Health Corp. |
6,266,436 | 1.6 | |||||||||
| 57,320 | Gilead
Sciences, Inc. |
3,724,654 | 1.0 | |||||||||
| 59,474 | Johnson & Johnson |
8,675,472 | 2.3 | |||||||||
| 49,861 | Medtronic PLC |
5,656,730 | 1.5 | |||||||||
| 152,155 | Pfizer, Inc. |
5,961,433 | 1.5 | |||||||||
| 136,245 | Other Securities |
8,875,624 | 2.3 | |||||||||
| 47,935,868 | 12.5 | |||||||||||
| Shares | Value | Percentage of Net Assets |
||||||||||
COMMON STOCK: (continued) |
||||||||||||
Industrials: 11.9% |
||||||||||||
| 18,864 | Boeing
Co. |
$ | 6,145,137 | 1.6 | ||||||||
| 627,060 | General Electric Co. |
6,997,989 | 1.8 | |||||||||
| 28,831 | L3Harris Technologies, Inc. |
5,704,790 | 1.5 | |||||||||
| 49,469 | United Parcel Service, Inc. — Class B |
5,790,841 | 1.5 | |||||||||
| 446,434 | (1),(2) |
Other Securities |
20,988,753 | 5.5 | ||||||||
| 45,627,510 | 11.9 | |||||||||||
Information Technology: 8.0% |
||||||||||||
| 92,845 | Cisco
Systems, Inc. |
4,452,846 | 1.2 | |||||||||
| 37,627 | Microsoft Corp. |
5,933,778 | 1.5 | |||||||||
| 110,029 | Qualcomm, Inc. |
9,707,858 | 2.5 | |||||||||
| 25,461 | Texas Instruments, Inc. |
3,266,392 | 0.9 | |||||||||
| 107,349 | Other Securities |
7,408,176 | 1.9 | |||||||||
| 30,769,050 | 8.0 | |||||||||||
Materials: 4.5% |
||||||||||||
| 78,743 | CF
Industries Holdings, Inc. |
3,759,191 | 1.0 | |||||||||
| 55,942 | Dow,
Inc. |
3,061,705 | 0.8 | |||||||||
| 57,621 | DowDuPont, Inc. |
3,699,268 | 0.9 | |||||||||
| 73,618 | International Paper Co. |
3,390,109 | 0.9 | |||||||||
| 73,373 | Other Securities |
3,383,532 | 0.9 | |||||||||
| 17,293,805 | 4.5 | |||||||||||
Real Estate: 3.5% |
||||||||||||
| 42,916 | Equity
Residential |
3,472,763 | 0.9 | |||||||||
| 154,274 | Weyerhaeuser Co. |
4,659,075 | 1.2 | |||||||||
| 115,762 | Other Securities |
5,323,689 | 1.4 | |||||||||
| 13,455,527 | 3.5 | |||||||||||
Utilities: 7.1% |
||||||||||||
| 66,485 | Edison
International |
5,013,634 | 1.3 | |||||||||
| 16,095 | NextEra Energy, Inc. |
3,897,565 | 1.0 | |||||||||
| 197,880 | NiSource, Inc. |
5,508,979 | 1.4 | |||||||||
| 142,422 | Southern Co. |
9,072,282 | 2.4 | |||||||||
| 81,245 | Other Securities |
3,903,105 | 1.0 | |||||||||
| 27,395,565 | 7.1 | |||||||||||
Total
Common Stock (Cost $292,182,521) |
370,177,691 | 96.3 | ||||||||||
PREFERRED STOCK: 2.2% |
||||||||||||
Health Care: 0.9% |
||||||||||||
| 50,016 | Becton Dickinson and Co. |
3,274,048 | 0.9 | |||||||||
Utilities: 1.3% |
||||||||||||
| 63,419 | (1),(2) |
Other Securities |
5,027,098 | 1.3 | ||||||||
Total
Preferred Stock (Cost $6,841,268) |
8,301,146 | 2.2 | ||||||||||
VY® T. ROWE
PRICE |
SUMMARY PORTFOLIO OF INVESTMENTS AS OF DECEMBER 31, 2019 (CONTINUED) |
| Principal Amount† |
Value | Percentage of Net Assets |
||||||||||
|---|---|---|---|---|---|---|---|---|---|---|---|---|
CONVERTIBLE BONDS/NOTES: 0.2% |
||||||||||||
Financial: 0.2% |
||||||||||||
| 772,000 | (4) |
AXA SA, 7.250%, 05/15/2021 |
$ | 891,563 | 0.2 | |||||||
Total
Convertible Bonds/Notes (Cost $772,000) |
891,563 | 0.2 | ||||||||||
Total
Long-Term Investments (Cost $299,795,789) |
379,370,400 | 98.7 | ||||||||||
SHORT-TERM INVESTMENTS: 4.6% |
||||||||||||
Repurchase Agreements: 3.4% |
||||||||||||
| 3,057,659 | (5) |
Cantor
Fitzgerald Securities, Repurchase Agreement dated 12/31/19, 1.58%, due 01/02/20 (Repurchase Amount $3,057,924, collateralized by various U.S. Government/U.S. Government Agency Obligations, 0.000%–8.500%, Market Value plus accrued interest $3,118,812, due 01/25/20–10/15/60) |
3,057,659 | 0.8 | ||||||||
| 905,992 | (5) |
Citadel Securities LLC, Repurchase Agreement dated 12/31/19, 1.60%, due 01/02/20 (Repurchase Amount $906,071, collateralized by various U.S.
Government Securities, 0.000%–8.500%, Market Value plus accrued interest $924,194, due 01/15/20-11/15/48) |
905,992 | 0.2 | ||||||||
| 3,057,659 | (5) |
Citigroup, Inc., Repurchase Agreement dated 12/31/19, 1.57%, due 01/02/20 (Repurchase Amount $3,057,922, collateralized by various U.S.
Government/U.S. Government Agency Obligations, 0.000%–9.000%, Market Value plus accrued interest $3,118,812, due
02/13/20–09/20/69) |
3,057,659 | 0.8 | ||||||||
| 3,057,659 | (5) |
Jefferies LLC, Repurchase Agreement dated 12/31/19, 1.58%, due 01/02/20 (Repurchase Amount $3,057,924, collateralized by various U.S. Government Securities, 0.000%–2.875%, Market Value plus accrued interest $3,118,813, due 01/28/20–05/15/27) |
3,057,659 | 0.8 | ||||||||
| Principal Amount† |
Value | Percentage of Net Assets |
||||||||||
SHORT-TERM INVESTMENTS: (continued) |
||||||||||||
Repurchase Agreements: (continued) |
||||||||||||
| 3,057,659 | (5) |
RBC Dominion Securities Inc., Repurchase Agreement dated 12/31/19, 1.57%, due 01/02/20 (Repurchase Amount $3,057,922, collateralized by various U.S. Government/U.S. Government Agency Obligations, 0.000%–6.500%, Market Value plus accrued interest $3,118,812, due 06/30/21–12/01/49) |
$ | 3,057,659 | 0.8 | |||||||
Total
Repurchase Agreements (Cost $13,136,628) |
13,136,628 | 3.4 | ||||||||||
| Shares | Value | Percentage of Net Assets |
||||||||||
|---|---|---|---|---|---|---|---|---|---|---|---|---|
Mutual Funds: 1.2% |
||||||||||||
| 4,450,645 | (6) |
T. Rowe Price Government Reserve Fund, 1.590% (Cost $4,450,645) |
4,450,645 | 1.2 | ||||||||
Total
Short-Term Investments (Cost $17,587,273) |
17,587,273 | 4.6 | ||||||||||
Total Investments in Securities (Cost $317,383,062) |
$ | 396,957,673 | 103.3 |
|||||||||
Liabilities in Excess of Other Assets |
(12,508,949 | ) | (3.3 | ) | ||||||||
Net
Assets |
$ | 384,448,724 | 100.0 | |||||||||
“Other Securities” represents issues not
identified as the top 50 holdings in terms of market value and issues or issuers not exceeding 1% of net assets individually or in aggregate
respectively as of December 31, 2019.
The following footnotes apply to either the individual
securities noted or one or more of the securities aggregated and listed as a single line item.
† |
Unless otherwise indicated, principal amount is shown in USD. | |
ADR |
American Depositary Receipt | |
(1) |
The grouping contains securities on loan. | |
(2) |
The grouping contains non-income producing securities. | |
(3) |
Security, or a portion of the security, is on loan. | |
(4) |
Securities with purchases pursuant to Rule 144A or section 4(a)(2), under the Securities Act of 1933 and may not be resold subject to that rule except to qualified institutional buyers. | |
(5) |
All or a portion of the security represents securities purchased with cash collateral received for securities on loan. | |
(6) |
Rate shown is the 7-day yield as of December 31, 2019. |
VY® T. ROWE
PRICE |
SUMMARY PORTFOLIO OF INVESTMENTS AS OF DECEMBER 31, 2019 (CONTINUED) |
| Quoted Prices in Active Markets for Identical Investments (Level 1) |
Significant Other Observable Inputs# (Level 2) |
Significant Unobservable Inputs (Level 3) |
Fair Value at December 31, 2019 |
|||||||||||||||||
|---|---|---|---|---|---|---|---|---|---|---|---|---|---|---|---|---|---|---|---|---|
Asset
Table |
||||||||||||||||||||
Investments,
at fair value |
||||||||||||||||||||
Common
Stock |
||||||||||||||||||||
Communication
Services |
$ | 21,944,065 | $ | 1,520,658 | $ | — | $ | 23,464,723 | ||||||||||||
Consumer
Discretionary |
9,328,179 | — | — | 9,328,179 | ||||||||||||||||
Consumer
Staples |
30,472,594 | — | — | 30,472,594 | ||||||||||||||||
Energy |
33,519,163 | — | — | 33,519,163 | ||||||||||||||||
Financials |
90,915,707 | — | — | 90,915,707 | ||||||||||||||||
Health
Care |
46,476,504 | 1,459,364 | — | 47,935,868 | ||||||||||||||||
Industrials |
45,627,510 | — | — | 45,627,510 | ||||||||||||||||
Information
Technology |
30,769,050 | — | — | 30,769,050 | ||||||||||||||||
Materials |
16,669,110 | 624,695 | — | 17,293,805 | ||||||||||||||||
Real
Estate |
13,455,527 | — | — | 13,455,527 | ||||||||||||||||
Utilities |
27,395,565 | — | — | 27,395,565 | ||||||||||||||||
Total Common
Stock |
366,572,974 | 3,604,717 | — | 370,177,691 | ||||||||||||||||
Preferred
Stock |
6,668,125 | 1,633,021 | — | 8,301,146 | ||||||||||||||||
Convertible
Bonds/Notes |
— | 891,563 | — | 891,563 | ||||||||||||||||
Short-Term
Investments |
4,450,645 | 13,136,628 | — | 17,587,273 | ||||||||||||||||
Total
Investments, at fair value |
$ | 377,691,744 | $ | 19,265,929 | $ | — | $ | 396,957,673 | ||||||||||||
ˆ |
See Note 2, “Significant Accounting Policies” in the Notes to Financial Statements for additional information. | |
# |
The earlier close of the foreign markets gives rise to the possibility that significant events, including broad market moves, may have occurred in the interim and may materially affect the value of those securities. To account for this, the Portfolio may frequently value many of its foreign equity securities using fair value prices based on third party vendor modeling tools to the extent available. Accordingly, a portion of the Portfolio’s investments are categorized as Level 2 investments. |
| Amount of Realized Gain or (Loss) on Derivatives Recognized in Income |
|||||
|---|---|---|---|---|---|
| Derivatives not accounted for as hedging instruments | Futures | ||||
Equity
contracts |
$ | (645 | ) | ||
Total |
$ | (645 | ) | ||
| Cost for federal income tax purposes was $318,787,327. | ||||
Net unrealized
appreciation consisted of: |
||||
Gross
Unrealized Appreciation |
$ | 88,217,532 | ||
Gross
Unrealized Depreciation |
(9,941,636) | |||
Net Unrealized
Appreciation |
$ | 78,275,896 | ||
VY® T. ROWE
PRICE INTERNATIONAL |
SUMMARY PORTFOLIO OF INVESTMENTS AS OF DECEMBER 31, 2019 |
| Shares | Value | Percentage of Net Assets |
||||||||||
|---|---|---|---|---|---|---|---|---|---|---|---|---|
COMMON STOCK: 97.5% |
||||||||||||
Argentina: 0.2% |
||||||||||||
| 4,819 | (1) |
Other Securities |
$ | 511,055 | 0.2 | |||||||
Australia: 1.9% |
||||||||||||
| 280,893 | Amcor PLC |
3,071,343 | 1.4 | |||||||||
| 602,110 | Other Securities |
1,136,853 | 0.5 | |||||||||
| 4,208,196 | 1.9 | |||||||||||
Austria: 1.3% |
||||||||||||
| 74,868 | Erste Group Bank AG |
2,812,217 | 1.3 | |||||||||
Belgium: 0.4% |
||||||||||||
| 4,563 | (1),(2) |
Other Securities |
950,238 | 0.4 | ||||||||
Bermuda: 1.0% |
||||||||||||
| 116,936 | (1) |
Other Securities |
2,242,167 | 1.0 | ||||||||
Brazil: 1.1% |
||||||||||||
| 174,917 | (1) |
Other Securities |
2,441,959 | 1.1 | ||||||||
Canada: 4.1% |
||||||||||||
| 52,192 | Magna
International, Inc. |
2,862,209 | 1.3 | |||||||||
| 23,456 | Waste Connections, Inc. |
2,129,570 | 1.0 | |||||||||
| 277,583 | (1) |
Other Securities |
3,945,089 | 1.8 | ||||||||
| 8,936,868 | 4.1 | |||||||||||
China: 6.6% |
||||||||||||
| 22,621 | (3) |
Alibaba Group Holding Ltd. ADR |
4,797,914 | 2.2 | ||||||||
| 195,300 | Gree
Electric Appliances, Inc. of Zhuhai — A Shares |
1,841,825 | 0.9 | |||||||||
| 11,189 | Kweichow Moutai Co. Ltd. — A Shares |
1,904,114 | 0.9 | |||||||||
| 54,500 | Tencent Holdings Ltd. |
2,625,601 | 1.2 | |||||||||
| 513,562 | (1) |
Other Securities |
3,068,708 | 1.4 | ||||||||
| 14,238,162 | 6.6 | |||||||||||
France: 7.1% |
||||||||||||
| 12,713 | Air
Liquide SA |
1,802,341 | 0.8 | |||||||||
| 1,768 | Dassault Aviation SA |
2,320,314 | 1.1 | |||||||||
| 18,932 | EssilorLuxottica SA |
2,894,366 | 1.3 | |||||||||
| 53,780 | Thales S.A. |
5,596,097 | 2.6 | |||||||||
| 34,206 | (1) |
Other Securities |
2,695,768 | 1.3 | ||||||||
| 15,308,886 | 7.1 | |||||||||||
Germany: 4.4% |
||||||||||||
| 33,896 | Bayer
AG |
2,755,643 | 1.3 | |||||||||
| 17,504 | SAP
SE |
2,356,019 | 1.1 | |||||||||
| 11,162 | (3),(4) |
Zalando SE |
562,904 | 0.2 | ||||||||
| 79,424 | (1),(2) |
Other Securities |
3,929,810 | 1.8 | ||||||||
| 9,604,376 | 4.4 | |||||||||||
Hong Kong: 2.6% |
||||||||||||
| 354,200 | AIA Group Ltd. |
3,725,464 | 1.7 | |||||||||
| 146,140 | Other Securities |
1,803,915 | 0.9 | |||||||||
| 5,529,379 | 2.6 | |||||||||||
India: 5.0% |
||||||||||||
| 240,854 | Axis
Bank Ltd. |
2,546,042 | 1.2 | |||||||||
| 130,454 | Housing Development Finance Corp. |
4,410,970 | 2.0 | |||||||||
| 1,516,934 | NTPC Ltd. |
2,530,060 | 1.2 | |||||||||
| 13,173 | Other Securities |
1,360,129 | 0.6 | |||||||||
| 10,847,201 | 5.0 | |||||||||||
| Shares | Value | Percentage of Net Assets |
||||||||||
COMMON STOCK: (continued) |
||||||||||||
Indonesia: 1.9% |
||||||||||||
| 1,171,600 | Bank Central Asia Tbk PT |
$ | 2,817,706 | 1.3 | ||||||||
| 21,527,600 | Other Securities |
1,248,314 | 0.6 | |||||||||
| 4,066,020 | 1.9 | |||||||||||
Italy: 0.7% |
||||||||||||
| 141,009 | Other Securities |
1,401,231 | 0.7 | |||||||||
Japan: 14.5% |
||||||||||||
| 77,900 | Fujitsu General Ltd. |
1,748,151 | 0.8 | |||||||||
| 39,600 | Murata
Manufacturing Co., Ltd. |
2,437,325 | 1.1 | |||||||||
| 133,700 | Nippon
Telegraph & Telephone Corp. |
3,379,092 | 1.6 | |||||||||
| 76,200 | Seven & I Holdings Co., Ltd. |
2,793,144 | 1.3 | |||||||||
| 114,660 | Takeda
Pharmaceutical Co., Ltd. |
4,535,058 | 2.1 | |||||||||
| 514,600 | Z Holdings Corp. |
2,172,700 | 1.0 | |||||||||
| 495,300 | (1),(2) |
Other Securities |
14,168,625 | 6.6 | ||||||||
| 31,234,095 | 14.5 | |||||||||||
Netherlands: 8.3% |
||||||||||||
| 443 | (3),(4) |
Adyen
NV |
364,412 | 0.2 | ||||||||
| 12,653 | Airbus
SE |
1,857,029 | 0.9 | |||||||||
| 11,025 | ASML
Holding NV |
3,264,038 | 1.5 | |||||||||
| 67,278 | Koninklijke Philips NV |
3,288,813 | 1.5 | |||||||||
| 34,005 | NXP
Semiconductor NV — NXPI — US |
4,327,476 | 2.0 | |||||||||
| 40,634 | (3) |
Prosus
NV |
3,041,127 | 1.4 | ||||||||
| 29,969 | Unilever NV |
1,719,950 | 0.8 | |||||||||
| 17,862,845 | 8.3 | |||||||||||
Peru: 0.6% |
||||||||||||
| 6,356 | Other Securities |
1,354,654 | 0.6 | |||||||||
Philippines: 0.4% |
||||||||||||
| 40,145 | Other Securities |
826,111 | 0.4 | |||||||||
Poland: 0.5%9 |
||||||||||||
| 107,724 | Other Securities |
1,137,721 | 0.5 | |||||||||
Portugal: 2.6% |
||||||||||||
| 193,074 | Galp
Energia SGPS SA |
3,241,352 | 1.5 | |||||||||
| 146,094 | Jeronimo Martins SGPS SA |
2,407,536 | 1.1 | |||||||||
| 5,648,888 | 2.6 | |||||||||||
Saudi Arabia: 0.4% |
||||||||||||
| 47,562 | Other Securities |
829,396 | 0.4 | |||||||||
South Africa: 2.7% |
||||||||||||
| 26,063 | Naspers Ltd. |
4,265,132 | 2.0 | |||||||||
| 326,814 | Other Securities |
1,466,410 | 0.7 | |||||||||
| 5,731,542 | 2.7 | |||||||||||
South Korea: 4.4% |
||||||||||||
| 25,359 | NAVER
Corp. |
4,080,135 | 1.9 | |||||||||
| 86,997 | Samsung Electronics Co., Ltd. |
4,192,114 | 1.9 | |||||||||
| 1,173 | Other Securities |
1,274,174 | 0.6 | |||||||||
| 9,546,423 | 4.4 | |||||||||||
VY® T. ROWE
PRICE INTERNATIONAL |
SUMMARY PORTFOLIO OF INVESTMENTS AS OF DECEMBER 31, 2019 (CONTINUED) |
| Shares | Value | Percentage of Net Assets | ||||||||||
|---|---|---|---|---|---|---|---|---|---|---|---|---|
COMMON STOCK: (continued) |
||||||||||||
Spain: 1.2% |
||||||||||||
| 32,676 | Amadeus IT Group SA |
$ | 2,676,071 | 1.2 | ||||||||
Sweden: 2.6% |
||||||||||||
| 130,772 | Essity AB |
4,211,674 | 2.0 | |||||||||
| 23,838 | Other Securities |
1,336,151 | 0.6 | |||||||||
| 5,547,825 | 2.6 | |||||||||||
Switzerland: 7.6% |
||||||||||||
| 42,195 | Julius
Baer Group Ltd. |
2,175,276 | 1.0 | |||||||||
| 8,366 | Lonza
Group AG |
3,051,979 | 1.4 | |||||||||
| 37,005 | Nestle
SA |
4,006,356 | 1.9 | |||||||||
| 6,460 | Roche
Holding AG |
2,099,518 | 1.0 | |||||||||
| 220,560 | UBS Group AG |
2,783,332 | 1.3 | |||||||||
| 23,324 | (1) |
Other Securities |
2,258,063 | 1.0 | ||||||||
| 16,374,524 | 7.6 | |||||||||||
Taiwan: 2.2% |
||||||||||||
| 434,000 | Taiwan Semiconductor Manufacturing Co., Ltd. |
4,803,438 | 2.2 | |||||||||
Thailand: 0.6% |
||||||||||||
| 546,000 | Other Securities |
1,315,626 | 0.6 | |||||||||
United Arab Emirates: 1.4% |
||||||||||||
| 198,302 | (3),(4) |
Network International Holdings PLC |
1,678,693 | 0.8 | ||||||||
| 298,583 | Other Securities |
1,234,623 | 0.6 | |||||||||
| 2,913,316 | 1.4 | |||||||||||
United Kingdom: 6.2% |
||||||||||||
| 52,418 | British American Tobacco PLC |
2,227,889 | 1.0 | |||||||||
| 11,567 | Linde
PLC |
2,481,953 | 1.2 | |||||||||
| 26,188 | London Stock Exchange Group PLC |
2,691,413 | 1.2 | |||||||||
| 673,501 | (1) |
Other Securities |
6,016,802 | 2.8 | ||||||||
| 13,418,057 | 6.2 | |||||||||||
United States: 3.0% |
||||||||||||
| 1,049 | (3) |
Booking Holdings, Inc. |
2,154,363 | 1.0 | ||||||||
| 34,469 | Philip Morris International, Inc. |
2,932,967 | 1.4 | |||||||||
| 4,557 | Other Securities |
1,360,675 | 0.6 | |||||||||
| 6,448,005 | 3.0 | |||||||||||
Total
Common Stock (Cost $169,810,217) |
210,766,492 | 97.5 | ||||||||||
PREFERRED STOCK: 0.6% |
||||||||||||
China: 0.2% |
||||||||||||
| 9,427 | (3),(5), (6) |
Xiaoju Kuaizhi, Inc., Series A-17 (DiDi Chuxing, Inc.) |
480,137 | 0.2 | ||||||||
Germany: 0.2% |
||||||||||||
| 1,509 | Other Securities |
322,568 | 0.2 | |||||||||
| Shares | Value | Percentage of Net Assets |
||||||||||
PREFERRED STOCK: (continued) |
||||||||||||
United Kingdom: 0.2% |
||||||||||||
| 990 | (3),(5), (6) |
Roofoods Ltd. — Series G |
$ | 413,722 | 0.2 | |||||||
Total
Preferred Stock (Cost $876,143) |
1,216,427 | 0.6 | ||||||||||
Total
Long-Term Investments (Cost $170,686,360) |
211,982,919 | 98.1 |
||||||||||
| Principal Amount† |
Value | Percentage of Net Assets |
||||||||||
|---|---|---|---|---|---|---|---|---|---|---|---|---|
SHORT-TERM INVESTMENTS: 2.4% |
||||||||||||
Repurchase Agreements: 1.1% |
||||||||||||
| 344,711 | (7) |
Citadel Securities LLC, Repurchase Agreement dated 12/31/19, 1.60%, due 01/02/20 (Repurchase Amount $344,741, collateralized by various U.S.
Government Securities, 0.000%–8.500%, Market Value plus accrued interest $351,636, due 01/15/20–11/15/48) |
344,711 | 0.1 | ||||||||
| 1,000,000 | (7) |
Citigroup, Inc., Repurchase Agreement dated 12/31/19, 1.57%, due 01/02/20 (Repurchase Amount $1,000,086, collateralized by various U.S.
Government/U.S. Government Agency Obligations, 0.000%–9.000%, Market Value plus accrued interest $1,020,000, due
02/13/20–09/20/69) |
1,000,000 | 0.5 | ||||||||
| 1,000,000 | (7) |
Daiwa Capital Markets, Repurchase Agreement dated 12/31/19, 1.58%, due 01/02/20 (Repurchase Amount
$1,000,087, collateralized by various U.S. Government/U.S. Government Agency Obligations, 0.000%–6.030%, Market Value plus accrued interest
$1,020,000, due 01/14/20–12/20/49) |
1,000,000 | 0.5 | ||||||||
Total
Repurchase Agreements (Cost $2,344,711) |
2,344,711 | 1.1 | ||||||||||
VY® T. ROWE
PRICE INTERNATIONAL |
SUMMARY PORTFOLIO OF INVESTMENTS AS OF DECEMBER 31, 2019 (CONTINUED) |
| Shares | Value | Percentage of Net Assets |
||||||||||
|---|---|---|---|---|---|---|---|---|---|---|---|---|
SHORT-TERM INVESTMENTS: (continued) |
||||||||||||
Mutual Funds: 1.3% |
||||||||||||
| 2,947,686 | (8) |
T. Rowe Price Government Reserve Fund, 1.590% (Cost $2,947,686) |
$ | 2,947,686 | 1.3 | |||||||
Total
Short-Term Investments (Cost $5,292,397) |
5,292,397 | 2.4 | ||||||||||
Total Investments in Securities (Cost $175,978,757) |
$ | 217,275,316 | 100.5 | |||||||||
Liabilities in Excess of Other Assets |
(1,070,600 | ) | (0.5 | ) | ||||||||
Net
Assets |
$ | 216,204,716 | 100.0 | |||||||||
† |
Unless otherwise indicated, principal amount is shown in USD. | |
ADR |
American Depositary Receipt | |
(1) |
The grouping contains non-income producing securities. | |
(2) |
The grouping contains securities on loan. | |
(3) |
Non-income producing security. | |
(4) |
Securities with purchases pursuant to Rule 144A or section 4(a)(2), under the Securities Act of 1933 and may not be resold subject to that rule except to qualified institutional buyers. | |
(5) |
For fair value measurement disclosure purposes, security is categorized as Level 3, whose value was determined using significant unobservable inputs. | |
(6) |
Restricted security as to resale, excluding Rule 144A securities. As of December 31, 2019, the Portfolio held restricted securities with a fair value of $893,859 or 0.4% of net assets. Please refer to the table below for additional details. | |
(7) |
All or a portion of the security represents securities purchased with cash collateral received for securities on loan. | |
(8) |
Rate shown is the 7-day yield as of December 31, 2019. |
| Sector Diversification | Percentage of Net Assets |
|||
|---|---|---|---|---|
Financials |
15.7 | % | ||
Information
Technology |
15.3 | |||
Consumer
Discretionary |
15.0 | |||
Consumer
Staples |
12.3 | |||
Health
Care |
11.9 | |||
Industrials |
11.3 | |||
Communication
Services |
8.5 | |||
Materials |
4.2 | |||
Energy |
2.7 | |||
Utilities |
1.2 | |||
Short-Term
Investments |
2.4 | |||
Liabilities in
Excess of Other Assets |
(0.5 | ) | ||
Net
Assets |
100.0 | % | ||
| Quoted Prices in Active Markets for Identical Investments (Level 1) |
Significant Other Observable Inputs# (Level 2) |
Significant Unobservable Inputs (Level 3) |
Fair Value at December 31, 2019 |
|||||||||||||||||
|---|---|---|---|---|---|---|---|---|---|---|---|---|---|---|---|---|---|---|---|---|
Asset
Table |
||||||||||||||||||||
Investments,
at fair value |
||||||||||||||||||||
Common
Stock |
||||||||||||||||||||
Argentina |
$ | 511,055 | $ | — | $ | — | $ | 511,055 | ||||||||||||
Australia |
— | 4,208,196 | — | 4,208,196 | ||||||||||||||||
Austria |
— | 2,812,217 | — | 2,812,217 | ||||||||||||||||
Belgium |
— | 950,238 | — | 950,238 | ||||||||||||||||
Bermuda |
2,242,167 | — | — | 2,242,167 | ||||||||||||||||
Brazil |
2,441,959 | — | — | 2,441,959 | ||||||||||||||||
Canada |
8,936,868 | — | — | 8,936,868 | ||||||||||||||||
China |
6,109,473 | 8,128,689 | — | 14,238,162 | ||||||||||||||||
France |
2,320,314 | 12,988,572 | — | 15,308,886 | ||||||||||||||||
Germany |
2,250,588 | 7,353,788 | — | 9,604,376 | ||||||||||||||||
Hong
Kong |
— | 5,529,379 | — | 5,529,379 | ||||||||||||||||
India |
2,530,060 | 8,317,141 | — | 10,847,201 | ||||||||||||||||
Indonesia |
1,248,314 | 2,817,706 | — | 4,066,020 | ||||||||||||||||
Italy |
— | 1,401,231 | — | 1,401,231 | ||||||||||||||||
Japan |
— | 31,234,095 | — | 31,234,095 | ||||||||||||||||
Netherlands |
4,327,476 | 13,535,369 | — | 17,862,845 | ||||||||||||||||
Peru |
1,354,654 | — | — | 1,354,654 | ||||||||||||||||
Philippines |
— | 826,111 | — | 826,111 | ||||||||||||||||
Poland |
— | 1,137,721 | — | 1,137,721 | ||||||||||||||||
Portugal |
— | 5,648,888 | — | 5,648,888 | ||||||||||||||||
Saudi
Arabia |
— | 829,396 | — | 829,396 | ||||||||||||||||
South
Africa |
— | 5,731,542 | — | 5,731,542 | ||||||||||||||||
South
Korea |
— | 9,546,423 | — | 9,546,423 | ||||||||||||||||
Spain |
— | 2,676,071 | — | 2,676,071 | ||||||||||||||||
Sweden |
— | 5,547,825 | — | 5,547,825 | ||||||||||||||||
Switzerland |
1,017,498 | 15,357,026 | — | 16,374,524 | ||||||||||||||||
VY® T. ROWE PRICE INTERNATIONAL |
SUMMARY PORTFOLIO OF INVESTMENTS AS OF DECEMBER 31, 2019 (CONTINUED) |
| Quoted Prices in Active Markets for Identical Investments (Level 1) |
Significant Other Observable Inputs# (Level 2) |
Significant Unobservable Inputs (Level 3) |
Fair Value at December 31, 2019 | |||||||||||||
Common Stock
(continued) |
||||||||||||||||
Taiwan |
$ | — | $ | 4,803,438 | $ | — | $ | 4,803,438 | ||||||||
Thailand |
— | 1,315,626 | — | 1,315,626 | ||||||||||||
United Arab
Emirates |
— | 2,913,316 | — | 2,913,316 | ||||||||||||
United
Kingdom |
2,872,977 | 10,545,080 | — | 13,418,057 | ||||||||||||
United
States |
6,448,005 | — | — | 6,448,005 | ||||||||||||
Total Common
Stock |
44,611,408 | 166,155,084 | — | 210,766,492 | ||||||||||||
Preferred
Stock |
— | 322,568 | 893,859 | 1,216,427 | ||||||||||||
Short-Term
Investments |
2,947,686 | 2,344,711 | — | 5,292,397 | ||||||||||||
Total
Investments, at fair value |
$ | 47,559,094 | $ | 168,822,363 | $ | 893,859 | $ | 217,275,316 | ||||||||
Other
Financial Instruments+ |
||||||||||||||||
Forward Foreign
Currency Contracts |
— | 2,925 | — | 2,925 | ||||||||||||
Total
Assets |
$ | 47,559,094 | $ | 168,825,288 | $ | 893,859 | $ | 217,278,241 | ||||||||
Liabilities
Table |
||||||||||||||||
Other
Financial Instruments+ |
||||||||||||||||
Forward Foreign
Currency Contracts |
$ | — | $ | (35 | ) | $ | — | $ | (35 | ) | ||||||
Written
Options |
— | (6,490 | ) | — | (6,490 | ) | ||||||||||
Total
Liabilities |
$ | — | $ | (6,525 | ) | $ | — | $ | (6,525 | ) | ||||||
ˆ |
See Note 2, “Significant Accounting Policies” in the Notes to Financial Statements for additional information. | |
+ |
Other Financial Instruments may include open forward foreign currency contracts, futures, centrally cleared swaps, OTC swaps and written options. Forward foreign currency contracts, futures and centrally cleared swaps are valued at the unrealized gain (loss) on the instrument. OTC swaps and written options are valued at the fair value of the instrument. | |
# |
The earlier close of the foreign markets gives rise to the possibility that significant events, including broad market moves, may have occurred in the interim and may materially affect the value of those securities. To account for this, the Portfolio may frequently value many of its foreign equity securities using fair value prices based on third party vendor modeling tools to the extent available. Accordingly, a portion of the Portfolio’s investments are categorized as Level 2 investments. |
| Security | Acquisition Date |
Acquisition Cost |
Fair Value |
|||||||||
|---|---|---|---|---|---|---|---|---|---|---|---|---|
Roofoods Ltd.
— Series G |
5/16/2019 | $ | 413,722 | $ | 413,722 | |||||||
Xiaoju Kuaizhi,
Inc., Series A-17 (DiDi Chuxing, Inc.) |
10/19/2015 | 258,547 | 480,137 | |||||||||
| $ | 672,269 | $ | 893,859 | |||||||||
| Currency Purchased | Currency Sold | Counterparty | Settlement Date |
Unrealized Appreciation (Depreciation) |
||||||||||||||
|---|---|---|---|---|---|---|---|---|---|---|---|---|---|---|---|---|---|---|
| USD | 1,049,399 |
JPY | 113,665,000 |
CIBC
World Markets Corp. |
01/15/20 | $ | 2,579 | |||||||||||
| JPY | 4,312,009 |
USD | 39,373 |
The
Bank of New York Mellon |
01/06/20 | 312 | ||||||||||||
| JPY | 807,314 |
USD | 7,397 |
The
Bank of New York Mellon |
01/07/20 | 34 | ||||||||||||
| USD | 7,645 |
JPY | 834,486 |
The
Bank of New York Mellon |
01/07/20 | (35 | ) | |||||||||||
| $ | 2,890 | |||||||||||||||||
| Description | Counterparty | Put/Call | Expiration Date |
Exercise Price |
Number
of Contracts |
Notional Amount |
Premiums Received |
Fair Value |
||||||||||||||||||
|---|---|---|---|---|---|---|---|---|---|---|---|---|---|---|---|---|---|---|---|---|---|---|---|---|---|---|
Erste
Group Bank AG |
JPMorgan
Chase & Co. |
Call | 01/17/20 | EUR | 35.000 | 29 | EUR | 97,324 | $ | 1,417 | $ | (473 | ) | |||||||||||||
Hexagon
AB — B Shares |
JPMorgan
Chase & Co. |
Call | 01/17/20 | SEK | 570.000 | 1 | SEK | 52,500 | 58 | (7 | ) | |||||||||||||||
Ubisoft
Entertainment |
JPMorgan
Chase & Co. |
Call | 01/17/20 | EUR | 60.000 | 16 | EUR | 98,528 | 2,160 | (4,579 | ) | |||||||||||||||
Ubisoft
Entertainment |
JPMorgan
Chase & Co. |
Call | 01/17/20 | EUR | 60.000 | 5 | EUR | 30,790 | 597 | (1,431 | ) | |||||||||||||||
| $ | 4,232 | $ | (6,490 | ) | ||||||||||||||||||||||
VY® T. ROWE PRICE INTERNATIONAL |
SUMMARY PORTFOLIO OF INVESTMENTS AS OF DECEMBER 31, 2019 (CONTINUED) |
Currency Abbreviations
EUR |
— EU Euro | |
JPY |
— Japanese Yen | |
SEK |
— Swedish Krona | |
USD |
— United States Dollar |
| Derivatives not accounted for as hedging instruments |
Location on Statement of Assets and Liabilities |
Fair Value | |||||
|---|---|---|---|---|---|---|---|
Asset
Derivatives |
|||||||
Foreign exchange
contracts |
Unrealized
appreciation on forward foreign currency contracts |
$ | 2,925 | ||||
Total Asset
Derivatives |
$ | 2,925 | |||||
Liability
Derivatives |
|||||||
Foreign exchange
contracts |
Unrealized
depreciation on forward foreign currency contracts |
$ | 35 | ||||
Equity
contracts |
Written
options, at fair value |
6,490 | |||||
Total
Liability Derivatives |
$ | 6,525 | |||||
| Amount of Realized Gain or (Loss) on Derivatives Recognized in Income |
|||||||||||||||
|---|---|---|---|---|---|---|---|---|---|---|---|---|---|---|---|
| Derivatives not accounted for as hedging instruments |
Forward foreign currency contracts |
Written options | Total | ||||||||||||
Equity
contracts |
$ | — | $ | 22,514 | $ | 22,514 | |||||||||
Foreign exchange
contracts |
(26,155 | ) | — | (26,155 | ) | ||||||||||
Total |
$ | (26,155 | ) | $ | 22,514 | $ | (3,641 | ) | |||||||
| Change in Unrealized Appreciation or (Depreciation) on Derivatives Recognized in Income |
|||||||||||||||
|---|---|---|---|---|---|---|---|---|---|---|---|---|---|---|---|
| Derivatives not accounted for as hedging instruments |
Forward foreign currency contracts |
Written options | Total | ||||||||||||
Equity
contracts |
$ | — | $ | (2,258 | ) | $ | (2,258 | ) | |||||||
Foreign exchange
contracts |
40,768 | — | 40,768 | ||||||||||||
Total |
$ | 40,768 | $ | (2,258 | ) | $ | 38,510 | ||||||||
| CIBC
World Markets Corp. |
JPMorgan Chase & Co. |
The
Bank of New York Mellon |
Totals | |||||||||||||||||
|---|---|---|---|---|---|---|---|---|---|---|---|---|---|---|---|---|---|---|---|---|
Assets: |
||||||||||||||||||||
Forward
foreign currency contracts |
$ | 2,579 | $ | — | $ | 346 | $ | 2,925 |
||||||||||||
Total
Assets |
$ | 2,579 | $ | — | $ | 346 | $ | 2,925 |
||||||||||||
Liabilities: |
||||||||||||||||||||
Forward
foreign currency contracts |
$ | — | $ | — | $ | 35 | $ | 35 |
||||||||||||
Written
options |
— | 6,490 | — | 6,490 |
||||||||||||||||
Total
Liabilities |
$ | — | $ | 6,490 | $ | 35 | $ | 6,525 |
||||||||||||
Net
OTC derivative instruments by counterparty, at fair value |
$ | 2,579 | $ | (6,490 | ) | $ | 311 | (3,600) |
||||||||||||
Total
collateral pledged by the Portfolio/(Received from counterparty) |
$ | — | $ | — | $ | — | $ | — |
||||||||||||
Net
Exposure(1) |
$ | 2,579 | $ | (6,490 | ) | $ | 311 | $ | (3,600) |
|||||||||||
(1) |
Positive net exposure represents amounts due from each respective counterparty. Negative exposure represents amounts due from the Portfolio. Please refer to Note 2 for additional details regarding counterparty credit risk and credit related contingent features. |
VY® T. ROWE PRICE INTERNATIONAL |
SUMMARY PORTFOLIO OF INVESTMENTS AS OF DECEMBER 31, 2019 (CONTINUED) |
| Cost for federal income tax purposes was $180,305,760. |
Net unrealized
appreciation consisted of: |
|||||
Gross
Unrealized Appreciation |
$ | 45,154,942 | |||
Gross
Unrealized Depreciation |
(7,324,643 | ) | |||
Net Unrealized
Appreciation |
$ | 37,830,299 |
| Portfolio Name | Type | Per Share Amount | |||||||
|---|---|---|---|---|---|---|---|---|---|
Voya Government
Liquid Assets Portfolio |
|||||||||
Class
I |
NII |
$ | 0.0192 | ||||||
Class
S |
NII |
$ | 0.0167 | ||||||
Class
S2 |
NII |
$ | 0.0152 | ||||||
All
Classes |
STCG |
$ | 0.0007 | ||||||
VY®
Clarion Global Real Estate Portfolio |
|||||||||
Class
ADV |
NII |
$ | 0.2748 | ||||||
Class
I |
NII |
$ | 0.3585 | ||||||
Class
S |
NII |
$ | 0.3258 | ||||||
Class
S2 |
NII |
$ | 0.3073 | ||||||
VY®
Invesco Growth and Income Portfolio |
|||||||||
Class
ADV |
NII |
$ | 0.4951 | ||||||
Class
I |
NII |
$ | 0.6657 | ||||||
Class
S |
NII |
$ | 0.5922 | ||||||
Class
S2 |
NII |
$ | 0.5544 | ||||||
All
Classes |
LTCG |
$ | 2.8817 | ||||||
VY®
JPMorgan Emerging Markets Equity Portfolio |
|||||||||
Class
ADV |
NII |
$ | — | ||||||
Class
I |
NII |
$ | 0.0286 | ||||||
Class
S |
NII |
$ | 0.0027 | ||||||
Class
S2 |
NII |
$ | — | ||||||
All
Classes |
STCG |
$ | 0.0557 | ||||||
All
Classes |
LTCG |
$ | 1.1260 | ||||||
VY®
Morgan Stanley Global Franchise Portfolio |
|||||||||
Class
ADV |
NII |
$ | 0.1033 | ||||||
Class
R6 |
NII |
$ | 0.1869 | ||||||
Class
S |
NII |
$ | 0.1421 | ||||||
Class
S2 |
NII |
$ | 0.1153 | ||||||
All
Classes |
LTCG |
$ | 1.8019 | ||||||
| Portfolio Name | Type | Per Share Amount | |||||||
|---|---|---|---|---|---|---|---|---|---|
VY®
T. Rowe Price Capital Appreciation Portfolio |
|||||||||
Class
ADV |
NII |
$ | 0.3389 | ||||||
Class
I |
NII |
$ | 0.4873 | ||||||
Class
R6 |
NII |
$ | 0.4873 | ||||||
Class
S |
NII |
$ | 0.4156 | ||||||
Class
S2 |
NII |
$ | 0.3685 | ||||||
All
Classes |
LTCG |
$ | 1.4876 | ||||||
VY®
T. Rowe Price Equity Income Portfolio |
|||||||||
Class
ADV |
NII |
$ | 0.2605 | ||||||
Class
I |
NII |
$ | 0.3244 | ||||||
Class
S |
NII |
$ | 0.2960 | ||||||
Class
S2 |
NII |
$ | 0.2812 | ||||||
All
Classes |
STCG |
$ | 0.0492 | ||||||
All
Classes |
LTCG |
$ | 3.0931 | ||||||
VY®
T. Rowe Price International Stock Portfolio |
|||||||||
Class
ADV |
NII |
$ | 0.0642 | ||||||
Class
I |
NII |
$ | 0.1547 | ||||||
Class
S |
NII |
$ | 0.1106 | ||||||
All
Classes |
STCG |
$ | 0.0680 | ||||||
All
Classes |
LTCG |
$ | 0.8569 | ||||||
NII — Net investment income
STCG — Short-term capital gain
LTCG — Long-term capital gain
VY®
Invesco Growth and Income Portfolio |
84.18% |
||
VY®
JPMorgan Emerging Markets Equity Portfolio |
2.49% |
||
VY®
Morgan Stanley Global Franchise Portfolio |
100.00% |
||
VY®
T. Rowe Price Capital Appreciation Portfolio |
43.11% |
||
VY®
T. Rowe Price Equity Income Portfolio |
73.42% |
||
VY®
T. Rowe Price International Stock Portfolio |
2.36% |
VY®
Invesco Growth and Income Portfolio |
$ | 51,891,887 | |
VY®
JPMorgan Emerging Markets Equity Portfolio |
$ | 26,134,093 | |
VY®
Morgan Stanley Global Franchise Portfolio |
$ | 41,693,123 | |
VY®
T. Rowe Price Capital Appreciation Portfolio |
$ | 360,809,518 | |
VY®
T. Rowe Price Equity Income Portfolio |
$ | 204,767,988 | |
VY®
T. Rowe Price International Stock Portfolio |
$ | 11,411,467 |
| Creditable Foreign Taxes Paid |
Per Share Amount |
Portion of Ordinary
Income Distribution Derived from Foreign Sourced Income* |
|||||||||||||
|---|---|---|---|---|---|---|---|---|---|---|---|---|---|---|---|
VY®
JPMorgan Emerging Markets Equity Portfolio |
$ | 738,923 | $ | 0.0316 | 98.13 | % | |||||||||
VY®
T. Rowe Price International Stock Portfolio |
$ | 266,812 | $ | 0.0200 | 91.05 | % | |||||||||
* |
None of the Portfolios listed above derived any income from ineligible foreign sources as defined under Section 901(j) of the Internal Revenue Code. |
| Name, Address and Age | Position(s) Held with the Trust |
Term of Office and Length of Time Served(1) |
Principal Occupation(s) — During the Past 5 Years |
Number of funds in Fund Complex Overseen by Trustee(2) |
Other Board Positions Held by Trustee |
|||||
|---|---|---|---|---|---|---|---|---|---|---|
Independent Trustees*: |
||||||||||
Colleen
D. Baldwin 7337 East Doubletree Ranch Rd. Suite 100 Scottsdale, Arizona 85258 Age: 59 |
Trustee Chairperson |
November 2007–Present January 2020–Present |
President, Glantuam Partners, LLC, a business consulting firm (January 2009–Present). |
146 |
Dentaquest (February 2014–Present); RSR Partners, Inc. (2016–Present). |
|||||
John V.
Boyer 7337 East Doubletree Ranch Rd. Suite 100 Scottsdale, Arizona 85258 Age: 66 |
Trustee |
January 2005–Present |
Retired. Formerly, President and Chief Executive Officer, Bechtler Arts Foundation, an arts and education foundation (January
2008–December 2019). |
146 |
None. |
|||||
Patricia
W. Chadwick 7337 East Doubletree Ranch Rd. Suite 100 Scottsdale, Arizona 85258 Age: 71 |
Trustee |
January 2006–Present |
Consultant and President, Ravengate Partners LLC, a consulting firm that provides advice regarding financial markets and the global economy
(January 2000–Present). |
146 |
Wisconsin Energy Corporation (June 2006–Present); The Royce Fund (22 funds) (December 2009–Present); and AMICA Mutual Insurance
Company (1992–Present). |
|||||
Martin
J. Gavin 7337 East Doubletree Ranch Rd. Suite 100 Scottsdale, AZ 85258 Age: 69 |
Trustee |
August 2015–Present |
Retired. Formerly, President and Chief Executive Officer, Connecticut Children’s Medical Center (May 2006–November
2015). |
146 |
None. |
|||||
Joseph
E. Obermeyer 7337 East Doubletree Ranch Rd. Suite 100 Scottsdale, Arizona 85258 Age: 62 |
Trustee |
May 2013–Present |
President, Obermeyer & Associates, Inc., a provider of financial and economic consulting services (November
1999–Present). |
146 |
None. |
|||||
Sheryl
K. Pressler 7337 East Doubletree Ranch Rd. Suite 100 Scottsdale, Arizona 85258 Age: 69 |
Trustee |
January 2006–Present |
Consultant (May 2001–Present). |
146 |
None. |
|||||
Christopher P. Sullivan 7337 East Doubletree Ranch Rd. Suite 100 Scottsdale, Arizona 85258 Age: 66 |
Trustee |
October 2015–Present |
Retired. |
146 |
None. |
|||||
Trustee who is an “interested person”: |
||||||||||
Dina
Santoro 230 Park Avenue New York, New York 10169 Age: 46 |
Trustee |
July 2018–Present |
President, Voya Investments, LLC and Voya Capital, LLC (March 2018–Present); Senior Vice President, Voya Investments Distributor, LLC
(April 2018–Present); Senior Managing Director, Head of Product and Marketing Strategy, Voya Investment Management (September 2017–Present).
Formerly, Managing Director, Quantitative Management Associates, LLC (January 2004–August 2017). |
146 |
Voya
Investments, LLC, Voya Capital, LLC, and Voya Funds Services, LLC (March 2018–Present); Voya Investments Distributor, LLC (April
2018–Present). | |||||
(1) |
Trustees serve until their successors are duly elected and qualified. The tenure of each Trustee who is not an “interested person” as defined in the 1940 Act, of each Portfolio (“Independent Trustee”) is subject to the Board’s retirement policy which states that each duly elected or appointed Independent Trustee shall retire from and cease to be a member of the Board of Trustees at the close of business on December 31 of the calendar year in which the Independent Trustee attains the age of 75. A majority vote of the Board’s other Independent Trustees may extend the retirement date of an Independent Trustee if the retirement would trigger a requirement to hold a meeting of shareholders of the Trust under applicable law, whether for the purposes of appointing a successor to the Independent Trustee or otherwise comply under applicable law, in which case the extension would apply until such time as the shareholder meeting can be held or is no longer required (as determined by a vote of a majority of the other Independent Trustees). |
(2) |
For the purposes of this table, “Fund Complex” means the Voya family of funds including the following investment companies: Voya Asia Pacific High Dividend Equity Income Fund; Voya Balanced Portfolio, Inc.; Voya Emerging Markets High Dividend Equity Fund; Voya Equity Trust; Voya Funds Trust; Voya Global Advantage and Premium Opportunity Fund; Voya Global Equity Dividend and Premium Opportunity Fund; Voya Government Money Market Portfolio; Voya Infrastructure, Industrials and Materials Fund; Voya Intermediate Bond Portfolio; Voya International High Dividend Equity Income Fund; Voya Investors Trust; Voya Mutual Funds; Voya Natural Resources Equity Income Fund; Voya Partners, Inc.; Voya Prime Rate Trust; Voya Senior Income Fund; Voya Separate Portfolios Trust; Voya Strategic Allocation Portfolios, Inc.; Voya Variable Funds; Voya Variable Insurance Trust; Voya Variable Portfolios, Inc.; and Voya Variable Products Trust. The number of funds in the Fund Complex is as of January 31, 2020. | |
* |
Effective December 31, 2019, Russell H. Jones and Roger B. Vincent each retired as a Trustee of the Board. |
| Name, Address and Age | Position(s) Held With the Trust |
Term of Office and Length of Time Served(1) |
Principal Occupation(s) — During the Past 5 Years |
|||
|---|---|---|---|---|---|---|
Michael
Bell One Orange Way Windsor, Connecticut 06095 Age: 51 |
Chief Executive
Officer |
March
2018–Present |
Chief
Executive Officer and Director, Voya Investments, LLC, Voya Capital, LLC, and Voya Funds Services, LLC (March 2018–Present); Senior Vice President
and Chief Financial Officer, Voya Investments Distributor, LLC (September 2019–Present); Chief Financial Officer, Voya Investment Management
(September 2014–Present). Formerly, Senior Vice President, Chief Financial Officer and Treasurer, Voya Investments, LLC (November 2015–March
2018). |
|||
Dina
Santoro 230 Park Avenue New York, New York 10169 Age: 46 |
President |
March
2018–Present |
President and Director, Voya Investments, LLC and Voya Capital, LLC (March 2018–Present); Director, Voya Funds Services, LLC (March
2018–Present); Director and Senior Vice President, Voya Investments Distributor, LLC (April 2018–Present); Senior Managing Director, Head of
Product and Marketing Strategy, Voya Investment Management (September 2017–Present). Formerly, Managing Director, Quantitative Management
Associates, LLC (January 2004–August 2017). |
|||
Stanley
D. Vyner 230 Park Avenue New York, New York 10169 Age: 69 |
Executive Vice
President Chief Investment Risk Officer |
March
2003–Present September 2009–Present |
Executive Vice President, Voya Investments, LLC (July 2000–Present) and Chief Investment Risk Officer, Voya Investments, LLC (January
2003–Present). |
|||
James M.
Fink 5780 Powers Ferry Road NW Atlanta, Georgia 30327 Age: 61 |
Executive Vice
President |
March
2018–Present |
Managing Director, Voya Investments, LLC, Voya Capital, LLC, and Voya Funds Services, LLC (March 2018–Present); Senior Vice President,
Voya Investments Distributor, LLC (April 2018–Present); Chief Administrative Officer, Voya Investment Management (September 2017–Present).
Formerly, Managing Director, Operations, Voya Investment Management (March 1999–September 2017). |
|||
Kevin M.
Gleason 7337 East Doubletree Ranch Rd. Suite 100 Scottsdale, Arizona 85258 Age: 53 |
Chief Compliance
Officer |
February
2012–Present |
Senior
Vice President, Voya Investment Management and Chief Compliance Officer, Voya Family of Funds (February 2012–Present). |
|||
Todd
Modic 7337 East Doubletree Ranch Rd. Suite 100 Scottsdale, Arizona 85258 Age: 52 |
Senior Vice
President, Chief/Principal Financial Officer and Assistant Secretary |
March
2005–Present |
President, Voya Funds Services, LLC (March 2018–Present) and Senior Vice President, Voya Investments, LLC (April
2005–Present). |
|||
Kimberly
A. Anderson 7337 East Doubletree Ranch Rd. Suite 100 Scottsdale, Arizona 85258 Age: 55 |
Senior Vice
President |
November
2003–Present |
Senior
Vice President, Voya Investments, LLC (September 2003–Present). |
|||
Robert
Terris 5780 Powers Ferry Road NW Atlanta, Georgia 30327 Age: 49 |
Senior Vice
President |
May
2006–Present |
Senior
Vice President, Voya Investments Distributor, LLC (April 2018–Present); Senior Vice President, Head of Division Operations, Voya Investments, LLC
(October 2015–Present) and Voya Funds Services, LLC (March 2006–Present). |
|||
Fred
Bedoya 7337 East Doubletree Ranch Rd. Suite 100 Scottsdale, Arizona 85258 Age: 47 |
Vice President and
Treasurer |
September
2012–Present |
Vice
President, Voya Investments, LLC (October 2015–Present) and Voya Funds Services, LLC (July 2012–Present). |
|||
Maria M.
Anderson 7337 East Doubletree Ranch Rd. Suite 100 Scottsdale, Arizona 85258 Age: 61 |
Vice
President |
September
2004–Present |
Vice
President, Voya Investments, LLC (October 2015–Present) and Voya Funds Services, LLC (September 2004–Present). |
| Name, Address and Age | Position(s) Held With the Trust |
Term of Office and Length of Time Served(1) |
Principal Occupation(s) — During the Past 5 Years | |||
|---|---|---|---|---|---|---|
Sara M.
Donaldson 7337 East Doubletree Ranch Rd. Suite 100 Scottsdale, Arizona 85258 Age: 60 |
Vice
President |
September
2014–Present |
Vice
President, Voya Investments, LLC (October 2015–Present). Formerly, Vice President, Voya Funds Services, LLC (April 2014–October
2015). |
|||
Micheline S. Faver 7337 East Doubletree Ranch Rd. Suite 100 Scottsdale, Arizona 85258 Age: 42 |
Vice
President |
September
2016–Present |
Vice
President, Head of Fund Compliance and Chief Compliance Officer, Voya Investments, LLC (June 2016–Present). Formerly, Vice President, Mutual Fund
Compliance (March 2014–June 2016). |
|||
Robyn L.
Ichilov 7337 East Doubletree Ranch Rd. Suite 100 Scottsdale, Arizona 85258 Age: 52 |
Vice
President |
November
1999–Present |
Vice
President, Voya Funds Services, LLC (November 1995–Present) and Voya Investments, LLC (August 1997–Present). |
|||
Jason
Kadavy 7337 East Doubletree Ranch Rd. Suite 100 Scottsdale, Arizona 85258 Age: 43 |
Vice
President |
September
2012–Present |
Vice
President, Voya Investments, LLC (October 2015–Present) and Voya Funds Services, LLC (July 2007–Present). |
|||
Andrew
K. Schlueter 7337 East Doubletree Ranch Rd. Suite 100 Scottsdale, Arizona 85258 Age: 43 |
Vice
President |
March
2018–Present |
Vice
President, Voya Investments Distributor, LLC (April 2018–Present); Vice President, Voya Investments, LLC and Voya Funds Services, LLC (March
2018–Present); Vice President, Head of Mutual Fund Operations, Voya Investment Management (February 2018–Present). Formerly, Vice President,
Voya Investment Management (March 2014– February 2018). |
|||
Craig
Wheeler 7337 East Doubletree Ranch Rd. Suite 100 Scottsdale, Arizona 85258 Age: 50 |
Vice
President |
May
2013–Present |
Vice
President — Director of Tax, Voya Investments, LLC (October 2015–Present). Formerly, Vice President — Director of Tax, Voya Funds
Services, LLC (March 2013–October 2015). |
|||
Monia
Piacenti One Orange Way Windsor, Connecticut 06095 Age: 43 |
Anti-Money
Laundering Officer |
June
2018–Present |
Anti-Money Laundering Officer, Voya Investments Distributor, LLC, Voya Investment Management and Voya Investment Management Trust Co. (June
2018–Present); Compliance Consultant, Voya Financial, Inc. (January 2019–Present). Formerly, Senior Compliance Officer, Voya Investment
Management (December 2009–December 2018). |
|||
Theresa
K. Kelety 7337 East Doubletree Ranch Rd. Suite 100 Scottsdale, Arizona 85258 Age: 57 |
Secretary |
January
2020–Present |
Vice
President and Senior Counsel, Voya Investment Management — Mutual Fund Legal Department (March 2010–Present). |
|||
Paul A.
Caldarelli 7337 East Doubletree Ranch Rd. Suite 100 Scottsdale, Arizona 85258 Age: 68 |
Assistant
Secretary |
June
2010–Present |
Vice
President and Senior Counsel, Voya Investment Management — Mutual Fund Legal Department (March 2010–Present). |
|||
Joanne
F. Osberg 7337 East Doubletree Ranch Rd. Suite 100 Scottsdale, Arizona 85258 Age: 38 |
Assistant
Secretary |
January
2020–Present |
Vice
President and Counsel, Voya Investment Management — Mutual Fund Legal Department (January 2013–Present). |
(1) |
The Officers hold office until the next annual meeting of the Board of Trustees and until their successors shall have been elected and qualified. |
Voya Investments, LLC
7337 East Doubletree Ranch Road, Suite 100
Scottsdale, Arizona 85258
Voya Investments Distributor, LLC
7337 East Doubletree Ranch Road, Suite 100
Scottsdale, Arizona 85258
BNY Mellon Investment Servicing (U.S.) Inc.
301 Bellevue Parkway
Wilmington, Delaware 19809
KPMG LLP
Two Financial Center
60 South Street
Boston, Massachusetts 02111
The Bank of New York Mellon
225 Liberty Street
New York, New York 10286
Ropes & Gray LLP
Prudential Tower
800 Boylston Street
Boston, Massachusetts 02199
| RETIREMENT | INVESTMENTS | INSURANCE | |
| voyainvestments.com | VPAR-VIT1AISS2 (1219-022020) |
![[MISSING IMAGE: ing_cov.jpg]](ing_cov.jpg)
| |
■
Voya Balanced Income Portfolio
|
| |
■
Voya Limited Maturity Bond Portfolio
|
|
| |
■
Voya High Yield Portfolio
|
| |
■
Voya U.S. Stock Index Portfolio
|
|
| |
■
Voya Large Cap Growth Portfolio
|
| |
■
VY® Clarion Real Estate Portfolio
|
|
| |
■
Voya Large Cap Value Portfolio
|
| |
■
VY® JPMorgan Small Cap Core Equity Portfolio
|
|
| | |
Beginning on January 1, 2021, as permitted by regulations adopted by the U.S. Securities and Exchange Commission, paper copies of each Portfolio’s annual and semi-annual shareholder reports, like this annual report, will no longer be sent by mail, unless you specifically request paper copies of the reports. Instead, the reports will be made available on a website and you will be notified by mail each time a report is posted and provided with a website link to access the report.
|
| |
| | |
If you already elected to receive shareholder reports electronically, you will not be affected by this change and you need not take any action. You may elect to receive shareholder reports and other communications from your insurance carrier electronically by contacting them directly.
|
| |
| | |
You may elect to receive all future reports in paper free of charge. If you received this document in the mail, please follow the instructions provided to elect to continue receiving paper copies of your shareholder reports. You can inform us that you wish to continue receiving paper copies by calling 1-800-283-3427. Your election to receive reports in paper will apply to all the funds in which you invest.
|
| |
| | | This report is submitted for general information to shareholders of the Voya mutual funds. It is not authorized for distribution to prospective shareholders unless accompanied or preceded by a prospectus which includes details regarding the funds’ investment objectives, risks, charges, expenses and other information. This information should be read carefully. | | |
![[MISSING IMAGE: voya_covinvmgt.jpg]](voya_covinvmgt.jpg)
| | | | | | 1 | | | |
| | | | | | 2 | | | |
| | | | | | 4 | | | |
| | | | | | 22 | | | |
| | | | | | 24 | | | |
| | | | | | 25 | | | |
| | | | | | 29 | | | |
| | | | | | 31 | | | |
| | | | | | 35 | | | |
| | | | | | 42 | | | |
| | | | | | 63 | | | |
| | | | | | 123 | | | |
| | | | | | 125 | | | |
| | | | | | 130 | | |
![[MISSING IMAGE: ph_dina-santoro.jpg]](ph_dina-santoro.jpg)
President
Voya Family of Funds
January 21, 2020
| | |
Index
|
| | |
Description
|
| |
| | | Bloomberg Barclays High Yield Bond — 2% Issuer Constrained Composite Index | | | | An index that includes all fixed-income securities having a maximum quality rating of Ba1, a minimum amount outstanding of $150 million, and at least one year to maturity. | | |
| | | Bloomberg Barclays U.S. 1-3 Year Government/Credit Bond Index | | | | A widely recognized index of publicly issued fixed rate, investment grade debt securities, including Treasuries, Agencies and credit securities with a maturity of one to three years. | | |
| | | Bloomberg Barclays U.S. Aggregate Bond Index | | | | An index of publicly issued investment grade U.S. government, mortgage-backed, asset-backed and corporate debt securities. | | |
| | | Bloomberg Barclays Long-Term U.S. Treasury Index | | | | This index measures the performance of U.S. Treasury bills with long-term maturity. The credit level for this index is investment grade. The rebalance scheme is monthly. | | |
| | | MSCI Europe ex U.K.® Index | | | | A free float-adjusted market capitalization index that is designed to measure developed market equity performance in Europe, excluding the UK. | | |
| | | MSCI Japan® Index | | | | A free float-adjusted market capitalization index that is designed to measure developed market equity performance in Japan. | | |
| | | MSCI U.S. REIT® Index | | | | A free float-adjusted market capitalization weighted index that is comprised of equity real estate investment trusts that are included in the MSCI U.S. Investable Market 2500 Index (with the exception of specialty REITs that do not generate a majority of their revenue and income from real estate rental and leasing obligations). The index represents approximately 85% of the U.S. REIT market. | | |
| | | MSCI U.K.® Index | | | | A free float-adjusted market capitalization index that is designed to measure developed market equity performance in the UK. | | |
| | | MSCI World IndexSM | | | | An index that measures the performance of over 1,600 securities listed on exchanges in the U.S., Europe, Canada, Australia, New Zealand and the Far East. | | |
| | | Russell 1000® Growth Index | | | | Measures the performance of the 1,000 largest companies in the Russell 3000® Index with higher price-to-book ratios and higher forecasted growth. | | |
| | | Russell 1000® Value Index | | | | An index that measures the performance of those Russell 1000® securities with lower price-to-book ratios and lower forecasted growth values. | | |
| | | Russell 2000® Index | | | | An index that measures the performance of securities of small U.S. companies. | | |
| | | S&P 500® Index | | | | An index that measures the performance of securities of approximately 500 large-capitalization companies whose securities are traded on major U.S. stock markets. | | |
| Voya Balanced Income Portfolio | Portfolio Managers’ Report |
| |
Investment Type Allocation
as of December 31, 2019 (as a percentage of net assets) |
| |||
| | | | | | |
| | Common Stock | | |
39.4%
|
|
| | Collateralized Mortgage Obligations | | |
14.6%
|
|
| | Commercial Mortgage-Backed Securities | | |
11.8%
|
|
| | Mutual Funds | | |
8.5%
|
|
| | Asset-Backed Securities | | |
8.1%
|
|
| | Corporate Bonds/Notes | | |
6.6%
|
|
| | U.S. Government Agency Obligations | | |
2.4%
|
|
| | U.S. Treasury Obligations | | |
2.3%
|
|
| | Sovereign Bonds | | |
2.1%
|
|
| | Exchange-Traded Funds | | |
0.6%
|
|
| | Preferred Stock | | |
0.5%
|
|
| | Purchased Options* | | |
0.0%
|
|
| | Rights* | | |
0.0%
|
|
| | Assets in Excess of Other Liabilities** | | |
3.1%
|
|
| | Net Assets | | |
100.0%
|
|
| |
*
Amount is less than 0.05%
|
| |||
| |
**
Includes short-term investments and exchange-traded funds.
|
| |||
| |
Portfolio holdings are subject to change daily.
|
| |||
| |
Top Ten Holdings
as of December 31, 2019 (as a percentage of net assets) |
| |||
| | | | | | |
| | Voya Floating Rate Fund - Class P | | |
8.5%
|
|
| | Microsoft Corp. | | |
1.4%
|
|
| |
Uniform Mortgage-Backed Securities, 3.500%, 06/25/42
|
| |
1.1%
|
|
| | Ginnie Mae, 3.000%, 01/20/50 | | |
1.1%
|
|
| |
United States Treasury Note, 1.625%, 12/31/21
|
| |
1.1%
|
|
| |
Citigroup Commercial Mortgage Trust
2013-GC15 D, 5.214%, 09/10/46 |
| |
0.6%
|
|
| | JPMorgan Chase & Co. | | |
0.6%
|
|
| | Johnson & Johnson | | |
0.6%
|
|
| |
United States Treasury Bond, 2.250%, 08/15/49
|
| |
0.6%
|
|
| | iShares Russell 1000 ETF | | |
0.6%
|
|
| |
Portfolio holdings are subject to change daily.
|
| |||
| Portfolio Managers’ Report | Voya Balanced Income Portfolio |
| Voya Balanced Income Portfolio | Portfolio Managers’ Report |
| | |
![[MISSING IMAGE: tv536350_lc-fi.jpg]](tv536350_lc-fi.jpg)
|
| |
| | |
Average Annual Total Returns for the Periods Ended December 31, 2019
|
| | |||||||||||||||
| | | | | |
1 Year
|
| |
5 Year
|
| |
10 Year
|
| | ||||||
| | | Class ADV | | | | | 17.93% | | | | | | 5.71% | | | |
7.36%
|
| |
| | | Class I | | | | | 18.73% | | | | | | 6.31% | | | |
7.99%
|
| |
| | | Class S | | | | | 18.40% | | | | | | 6.10% | | | |
7.75%
|
| |
| | | Class S2 | | | | | 18.15% | | | | | | 5.92% | | | |
7.58%
|
| |
| | |
60% Bloomberg Barclays U.S. Aggregate Bond Index/30% Russell 1000® Index/10% MSCI EAFE® Index
|
| | | | 16.72% | | | | | | 6.00% | | | |
7.04%
|
| |
| | | Bloomberg Barclays U.S. Aggregate Bond Index | | | | | 8.72% | | | | | | 3.05% | | | |
3.75%
|
| |
| | | Russell 1000® Index | | | | | 31.43% | | | | | | 11.48% | | | |
13.54%
|
| |
| | | MSCI EAFE® Index | | | | | 22.01% | | | | | | 5.67% | | | |
5.50%
|
| |
| | | S&P 500® Index | | | | | 31.49% | | | | | | 11.70% | | | |
13.56%
|
| |
| | | | | | |||||||||||||||
| Portfolio Managers’ Report | Voya High Yield Portfolio |
| |
Investment Type Allocation
as of December 31, 2019 (as a percentage of net assets) |
| |||
| | | | | | |
| | Corporate Bonds/Notes | | |
95.4%
|
|
| | Bank Loans | | |
1.0%
|
|
| | Convertible Bonds/Notes | | |
0.2%
|
|
| | Common Stock | | |
0.1%
|
|
| | Warrants* | | |
0.0%
|
|
| | Preferred Stock* | | |
0.0%
|
|
| | Other* | | |
0.0%
|
|
| | Assets in Excess of Other Liabilities** | | |
3.3%
|
|
| | Net Assets | | |
100.0%
|
|
| |
*
Amount is less than 0.05%
|
| |||
| |
**
Includes short-term investments.
|
| |||
| |
Portfolio holdings are subject to change daily.
|
| |||
| | Top Ten Holdings as of December 31, 2019* (as a percentage of net assets) | | |||
| | | | | | |
| | HCA, Inc., 5.375%, 02/01/25 | | | 0.9% | |
| | Bausch Health Americas, Inc., 8.500%, 01/31/27 | | | 0.8% | |
| | Sprint Corp., 7.125%, 06/15/24 | | | 0.7% | |
| | 1011778 BC ULC / New Red Finance, Inc., 5.000%, 10/15/25 | | | 0.7% | |
| | CSC Holdings LLC, 5.250%, 06/01/24 | | | 0.7% | |
| | CommScope Tech Finance LLC, 6.000%, 06/15/25 | | | 0.6% | |
| | Standard Industries, Inc./NJ, 6.000%, 10/15/25 | | | 0.6% | |
| | Icahn Enterprises L.P. / Icahn Enterprises Finance Corp., 6.250%, 05/15/26 | | | 0.5% | |
| | CCO Holdings LLC / CCO Holdings Capital Corp., 5.750%, 02/15/26 | | | 0.6% | |
| | Post Holdings, Inc., 5.625%, 01/15/28 | | | 0.6% | |
| | * Excludes short-term investments. | | |||
| | Portfolio holdings are subject to change daily. | | |||
| Voya High Yield Portfolio | Portfolio Managers’ Report |
| | |
![[MISSING IMAGE: tv536350_lc-hy.jpg]](tv536350_lc-hy.jpg)
|
| |
| | |
Average Annual Total Returns for the Periods Ended December 31, 2019
|
| | |||||||||||||||
| | | | | |
1 Year
|
| |
5 Year
|
| |
10 Year
|
| | ||||||
| | | Class ADV | | | | | 14.82% | | | | | | 5.51% | | | |
6.45%
|
| |
| | | Class I | | | | | 15.37% | | | | | | 6.11% | | | |
7.08%
|
| |
| | | Class S | | | | | 15.22% | | | | | | 5.87% | | | |
6.82%
|
| |
| | | Class S2 | | | | | 14.91% | | | | | | 5.71% | | | |
6.62%
|
| |
| | |
Bloomberg Barclays High Yield Bond - 2% Issuer Constrained Composite Index
|
| | | | 14.32% | | | | | | 6.14% | | | |
7.55%
|
| |
| | | | | | |||||||||||||||
| Portfolio Managers’ Report | Voya Large Cap Growth Portfolio |
| |
Sector Diversification
as of December 31, 2019 (as a percentage of net assets) |
| |||
| | | | | | |
| | Information Technology | | |
37.9%
|
|
| | Health Care | | |
14.9%
|
|
| | Consumer Discretionary | | |
13.9%
|
|
| | Communication Services | | |
11.4%
|
|
| | Industrials | | |
9.8%
|
|
| | Consumer Staples | | |
4.7%
|
|
| | Financials | | |
3.0%
|
|
| | Real Estate | | |
2.4%
|
|
| | Materials | | |
1.4%
|
|
| | Assets in Excess of Other Liabilities* | | |
0.6%
|
|
| | Net Assets | | |
100.0%
|
|
| |
*
Includes short-term investments.
|
| |||
| |
Portfolio holdings are subject to change daily.
|
| |||
| | Top Ten Holdings as of December 31, 2019 (as a percentage of net assets) | | |||
| | | | | | |
| | Amazon.com, Inc. | | | 6.5% | |
| | Microsoft Corp. | | | 6.3% | |
| | Apple, Inc. | | | 5.9% | |
| | Facebook, Inc. - Class A | | | 5.6% | |
| | Visa, Inc. - Class A | | | 4.4% | |
| | Merck & Co., Inc. | | | 3.0% | |
| | Intuit, Inc. | | | 2.9% | |
| | Alphabet, Inc. - Class A | | | 2.5% | |
| | American Tower Corp. | | | 2.4% | |
| | O’Reilly Automotive, Inc. | | | 2.4% | |
| | Portfolio holdings are subject to change daily. | | |||
| Voya Large Cap Growth Portfolio | Portfolio Managers’ Report |
| | |
![[MISSING IMAGE: tv536350_lc-lcg.jpg]](tv536350_lc-lcg.jpg)
|
| |
| | |
Average Annual Total Returns for the Periods Ended December 31, 2019
|
| | |||||||||||||||
| | | | | |
1 Year
|
| |
5 Year
|
| |
10 Year
|
| | ||||||
| | | Class ADV | | | | | 31.90% | | | | | | 12.73% | | | |
13.84%
|
| |
| | | Class I | | | | | 32.77% | | | | | | 13.42% | | | |
14.50%
|
| |
| | | Class R6(1) | | | | | 32.82% | | | | | | 13.42% | | | |
14.50%
|
| |
| | | Class S | | | | | 32.41% | | | | | | 13.13% | | | |
14.21%
|
| |
| | | Class S2 | | | | | 32.16% | | | | | | 12.95% | | | |
14.04%
|
| |
| | | Russell 1000® Growth Index | | | | | 36.39% | | | | | | 14.63% | | | |
15.22%
|
| |
| | | | | | |||||||||||||||
| Portfolio Managers’ Report | Voya Large Cap Value Portfolio |
| |
Sector Diversification
as of December 31, 2019 (as a percentage of net assets) |
| |||
| | | | | | |
| | Financials | | |
23.6%
|
|
| | Health Care | | |
13.7%
|
|
| | Industrials | | |
9.5%
|
|
| | Consumer Staples | | |
8.9%
|
|
| | Energy | | |
8.5%
|
|
| | Communication Services | | |
8.2%
|
|
| | Information Technology | | |
6.3%
|
|
| | Utilities | | |
6.2%
|
|
| | Consumer Discretionary | | |
5.6%
|
|
| | Real Estate | | |
5.0%
|
|
| | Materials | | |
4.0%
|
|
| | Communications* | | |
0.0%
|
|
| | Assets in Excess of Other Liabilities** | | |
0.5%
|
|
| | Net Assets | | |
100.0%
|
|
| |
*
Amount is less than 0.05%
|
| |||
| |
**
Includes short-term investments.
|
| |||
| |
Portfolio holdings are subject to change daily.
|
| |||
| |
Top Ten Holdings
as of December 31, 2019 (as a percentage of net assets) |
| |||
| | | | | | |
| | JPMorgan Chase & Co. | | |
3.8%
|
|
| | AT&T, Inc. | | |
3.8%
|
|
| | Bank of America Corp. | | |
3.7%
|
|
| | Johnson & Johnson | | |
3.7%
|
|
| | Walt Disney Co. | | |
2.8%
|
|
| | US Bancorp | | |
2.6%
|
|
| | Philip Morris International, Inc. | | |
2.4%
|
|
| | Procter & Gamble Co. | | |
2.4%
|
|
| | Goldman Sachs Group, Inc. | | |
2.3%
|
|
| | Chevron Corp. | | |
2.2%
|
|
| |
Portfolio holdings are subject to change daily.
|
| |||
| Voya Large Cap Value Portfolio | Portfolio Managers’ Report |
| | |
![[MISSING IMAGE: tv536350_lc-lcv.jpg]](tv536350_lc-lcv.jpg)
|
| |
| | |
Average Annual Total Returns for the Periods Ended December 31, 2019
|
| | ||||||||||||||||||||||||
| | | | | |
1 Year
|
| |
5 Year
|
| |
10 Year
|
| |
Since Inception
of Class S2 September 9, 2013 |
| | ||||||||||||
| | | Class ADV | | | | | 24.45% | | | | | | 6.71% | | | | | | 10.62% | | | | | | — | | | |
| | | Class I | | | | | 25.12% | | | | | | 7.34% | | | | | | 11.27% | | | | | | — | | | |
| | | Class R6(1) | | | | | 25.14% | | | | | | 7.33% | | | | | | 11.27% | | | | | | — | | | |
| | | Class S | | | | | 24.78% | | | | | | 7.08% | | | | | | 11.01% | | | | | | — | | | |
| | | Class S2 | | | | | 24.63% | | | | | | 6.93% | | | | | | — | | | | | | 8.49% | | | |
| | | Russell 1000® Value | | | | | 26.54% | | | | | | 8.29% | | | | | | 11.80% | | | | | | 10.35% | | | |
| | | | | | ||||||||||||||||||||||||
| Portfolio Managers’ Report | Voya Limited Maturity Bond Portfolio |
| |
Investment Type Allocation
as of December 31, 2019 (as a percentage of net assets) |
| |||
| | | | | | |
| | Corporate Bonds/Notes | | |
43.7%
|
|
| | U.S. Treasury Obligations | | |
20.2%
|
|
| | Asset-Backed Securities | | |
17.1%
|
|
| | Commercial Mortgage-Backed Securities | | |
11.1%
|
|
| | Collateralized Mortgage Obligations | | |
5.5%
|
|
| | Supranational Bonds | | |
0.1%
|
|
| | U.S. Government Agency Obligations* | | |
0.0%
|
|
| | Assets in Excess of Other Liabilities** | | |
2.3%
|
|
| | Net Assets | | |
100.0%
|
|
| |
*
Amount is less than 0.05%
|
| |||
| |
**
Includes short-term investments.
|
| |||
| |
Portfolio holdings are subject to change daily.
|
| |||
| | Top Ten Holdings as of December 31, 2019* (as a percentage of net assets) | | |||
| | | | | | |
| | United States Treasury Note, 2.125%, 01/31/21 | | | 9.2% | |
| | United States Treasury Note, 1.625%, 12/15/22 | | | 7.8% | |
| | United States Treasury Note, 1.625%, 12/31/21 | | | 2.6% | |
| | Kreditanstalt fuer Wiederaufbau, 4.000%, 01/27/20 | | | 1.0% | |
| | JP Morgan Chase Commercial Mortgage Securities Trust 2011-C5 B, 5.418%, 08/15/46 | | | 1.0% | |
| | Ginnie Mae Series 2012-H31 FD, 2.114%, 12/20/62 | | | 0.9% | |
| | Fannie Mae REMICS 2011-68 F, 2.062%, 07/25/31 | | | 0.9% | |
| | Fannie Mae REMICS 2011-51 FM, 2.442%, 06/25/41 | | | 0.7% | |
| | BX Commercial Mortgage Trust 2019-XL D, 3.190%, 10/15/36 | | | 0.6% | |
| | Fannie Mae REMICS 2006-43-FJ, 2.202%, 06/25/36 | | | 0.6% | |
| | * Excludes short-term investments. | | |||
| | Portfolio holdings are subject to change daily. | | |||
| | | | | ||
| Voya Limited Maturity Bond Portfolio | Portfolio Managers’ Report |
| | |
![[MISSING IMAGE: tv536350_chart-maturity.jpg]](tv536350_chart-maturity.jpg)
|
| |
| | |
Average Annual Total Returns for the Periods Ended December 31, 2019
|
| | ||||||||||||||||||
| | | | | |
1 Year
|
| |
5 Year
|
| |
10 Year
|
| | |||||||||
| | | Class ADV | | | | | 3.66% | | | | | | 1.26% | | | | | | 1.19% | | | |
| | | Class I | | | | | 4.33% | | | | | | 1.88% | | | | | | 1.79% | | | |
| | | Class S | | | | | 4.06% | | | | | | 1.63% | | | | | | 1.53% | | | |
| | | Bloomberg Barclays U.S. 1-3 Year Government/Credit Bond Index | | | | | 4.03% | | | | | | 1.67% | | | | | | 1.54% | | | |
| | | | | | ||||||||||||||||||
| Portfolio Managers’ Report | Voya U.S. Stock Index Portfolio |
| |
Sector Diversification
as of December 31, 2019 (as a percentage of net assets) |
| |||
| | | | | | |
| | Information Technology | | |
22.9%
|
|
| | Health Care | | |
14.0%
|
|
| | Financials | | |
12.8%
|
|
| | Communication Services | | |
10.3%
|
|
| | Consumer Discretionary | | |
9.6%
|
|
| | Industrials | | |
8.9%
|
|
| | Consumer Staples | | |
7.1%
|
|
| | Energy | | |
4.3%
|
|
| | Utilities | | |
3.3%
|
|
| | Real Estate | | |
2.9%
|
|
| | Materials | | |
2.6%
|
|
| | Assets in Excess of Other Liabilities* | | |
1.3%
|
|
| | Net Assets | | |
100.0%
|
|
| |
*
Includes short-term investments.
|
| |||
| |
Portfolio holdings are subject to change daily.
|
| |||
| | Top Ten Holdings as of December 31, 2019* (as a percentage of net assets) | | |||
| | | | | | |
| | Apple, Inc. | | | 4.5% | |
| | Microsoft Corp. | | | 4.4% | |
| | Amazon.com, Inc. | | | 2.8% | |
| | Facebook, Inc. - Class A | | | 1.8% | |
| | Berkshire Hathaway, Inc. – Class B | | | 1.6% | |
| | JPMorgan Chase & Co. | | | 1.6% | |
| | Alphabet, Inc. - Class A | | | 1.5% | |
| | Alphabet, Inc. - Class C | | | 1.5% | |
| | Johnson & Johnson | | | 1.4% | |
| | Visa, Inc. - Class A | | | 1.2% | |
| | * Excludes short-term investments. | | |||
| | Portfolio holdings are subject to change daily. | | |||
| Voya U.S. Stock Index Portfolio | Portfolio Managers’ Report |
| | |
![[MISSING IMAGE: tv536350_lc-uss.jpg]](tv536350_lc-uss.jpg)
|
| |
| | |
Average Annual Total Returns for the Periods Ended December 31, 2019
|
| | |||||||||||||||
| | | | | |
1 Year
|
| |
5 Year
|
| |
10 Year
|
| | ||||||
| | | Class ADV | | | | | 30.43% | | | | | | 10.81% | | | |
12.66%
|
| |
| | | Class I | | | | | 31.12% | | | | | | 11.39% | | | |
13.25%
|
| |
| | | Class P2(1) | | | | | 31.27% | | | | | | 11.46% | | | |
13.29%
|
| |
| | | Class S | | | | | 30.77% | | | | | | 11.13% | | | |
12.99%
|
| |
| | | Class S2 | | | | | 30.60% | | | | | | 10.96% | | | |
12.80%
|
| |
| | | S&P 500® Index | | | | | 31.49% | | | | | | 11.70% | | | |
13.56%
|
| |
| | | | | | |||||||||||||||
| Portfolio Managers’ Report | VY® Clarion Real Estate Portfolio |
| |
REIT Diversification
as of December 31, 2019 (as a percentage of net assets) |
| |||
| | | | | | |
| | Specialized REITs | | |
19.1%
|
|
| | Residential REITs | | |
18.4%
|
|
| | Office REITs | | |
14.7%
|
|
| | Industrial REITs | | |
12.1%
|
|
| | Retail REITs | | |
11.4%
|
|
| | Health Care REITs | | |
10.5%
|
|
| | Hotel & Resort REITs | | |
5.9%
|
|
| | Diversified REITs | | |
5.9%
|
|
| | IT Consulting & Other Services | | |
0.8%
|
|
| | Assets in Excess of Other Liabilities* | | |
1.2%
|
|
| | Net Assets | | |
100.0%
|
|
| |
*
Includes short-term investments.
|
| |||
| |
Portfolio holdings are subject to change daily.
|
| |||
| |
Top Ten Holdings
as of December 31, 2019 (as a percentage of net assets) |
| |||
| | | | | | |
| | ProLogis, Inc. | | |
7.2%
|
|
| | Equity Residential | | |
5.4%
|
|
| | Equinix, Inc. | | |
5.4%
|
|
| | Healthpeak Properties, Inc. | | |
4.1%
|
|
| | Invitation Homes, Inc. | | |
3.8%
|
|
| | Simon Property Group, Inc. | | |
3.6%
|
|
| | VEREIT, Inc. | | |
3.6%
|
|
| | VICI Properties, Inc. | | |
3.2%
|
|
| | Healthcare Trust of America, Inc. | | |
3.2%
|
|
| | Alexandria Real Estate Equities, Inc. | | |
3.2%
|
|
| |
Portfolio holdings are subject to change daily.
|
| |||
| VY® Clarion Real Estate Portfolio | Portfolio Managers’ Report |
| | |
![[MISSING IMAGE: tv536350_lc-crep.jpg]](tv536350_lc-crep.jpg)
|
| |
| | |
Average Annual Total Returns for the Periods Ended December 31, 2019
|
| | |||||||||||||||
| | | | | |
1 Year
|
| |
5 Year
|
| |
10 Year
|
| | ||||||
| | | Class ADV | | | | | 27.71% | | | | | | 5.59% | | | |
10.72%
|
| |
| | | Class I | | | | | 28.47% | | | | | | 6.23% | | | |
11.39%
|
| |
| | | Class S | | | | | 28.15% | | | | | | 5.96% | | | |
11.11%
|
| |
| | | Class S2 | | | | | 27.97% | | | | | | 5.80% | | | |
10.94%
|
| |
| | | MSCI U.S. REIT® Index | | | | | 25.84% | | | | | | 7.03% | | | |
11.93%
|
| |
| | | | | | |||||||||||||||
| Portfolio Managers’ Report | VY® JPMorgan Small Cap Core Equity Portfolio |
| |
Sector Diversification
as of December 31, 2019 (as a percentage of net assets) |
| |||
| | | | | | |
| | Industrials | | |
20.0%
|
|
| | Financials | | |
17.7%
|
|
| | Health Care | | |
14.3%
|
|
| | Information Technology | | |
12.2%
|
|
| | Consumer Discretionary | | |
9.6%
|
|
| | Real Estate | | |
6.8%
|
|
| | Materials | | |
5.4%
|
|
| | Consumer Staples | | |
3.3%
|
|
| | Utilities | | |
2.9%
|
|
| | Energy | | |
2.2%
|
|
| | Communication Services | | |
2.2%
|
|
| | Assets in Excess of Other Liabilities* | | |
3.4%
|
|
| | Net Assets | | |
100.0%
|
|
| |
*
Includes short-term investments.
|
| |||
| |
Portfolio holdings are subject to change daily.
|
| |||
| |
Top Ten Holdings
as of December 31, 2019* (as a percentage of net assets) |
| |||
| | | | | | |
| | Performance Food Group Co. | | |
1.7%
|
|
| | Toro Co. | | |
1.4%
|
|
| | Pool Corp. | | |
1.4%
|
|
| | Aptargroup, Inc. | | |
1.2%
|
|
| | Molina Healthcare, Inc. | | |
1.0%
|
|
| | Portland General Electric Co. | | |
1.0%
|
|
| | EastGroup Properties, Inc. | | |
0.9%
|
|
| | First Horizon National Corp. | | |
0.9%
|
|
| | Catalent, Inc. | | |
0.9%
|
|
| | Encompass Health Corp. | | |
0.9%
|
|
| |
*
Excludes short-term investments.
|
| |||
| |
Portfolio holdings are subject to change daily.
|
| |||
| VY® JPMorgan Small Cap Core Equity Portfolio | Portfolio Managers’ Report |
| Portfolio Managers’ Report | VY® JPMorgan Small Cap Core Equity Portfolio |
| | |
![[MISSING IMAGE: tv536350_lc-jpmscceq.jpg]](tv536350_lc-jpmscceq.jpg)
|
| |
| | |
Average Annual Total Returns for the Periods Ended December 31, 2019
|
| | |||||||||||||||
| | | | | |
1 Year
|
| |
5 Year
|
| |
10 Year
|
| | ||||||
| | | Class ADV | | | | | 25.96% | | | | | | 8.51% | | | |
12.70%
|
| |
| | | Class I | | | | | 26.75% | | | | | | 9.16% | | | |
13.37%
|
| |
| | | Class R6(1) | | | | | 26.78% | | | | | | 9.15% | | | |
13.37%
|
| |
| | | Class S | | | | | 26.39% | | | | | | 8.88% | | | |
13.08%
|
| |
| | | Class S2 | | | | | 26.20% | | | | | | 8.72% | | | |
12.92%
|
| |
| | | Russell 2000® Index | | | | | 25.52% | | | | | | 8.23% | | | |
11.83%
|
| |
| | | | | | |||||||||||||||
| | | |
Actual Portfolio Return
|
| |
Hypothetical (5% return before expenses)
|
| ||||||||||||||||||||||||||||||||||||||||||
| | | |
Beginning
Account Value July 1, 2019 |
| |
Ending
Account Value December 31, 2019 |
| |
Annualized
Expense Ratio |
| |
Expenses Paid
During the Period Ended December 31, 2019* |
| |
Beginning
Account Value July 1, 2019 |
| |
Ending
Account Value December 31, 2019 |
| |
Annualized
Expense Ratio |
| |
Expenses Paid
During the Period Ended December 31, 2019* |
| ||||||||||||||||||||||||
| Voya Balanced Income Portfolio | | ||||||||||||||||||||||||||||||||||||||||||||||||
| Class ADV | | | | $ | 1,000.00 | | | | | $ | 1,036.00 | | | | | | 1.22% | | | | | $ | 6.26 | | | | | $ | 1,000.00 | | | | | $ | 1,019.06 | | | | | | 1.22% | | | | | $ | 6.21 | | |
| Class I | | | | | 1,000.00 | | | | | | 1,038.90 | | | | | | 0.62 | | | | | | 3.19 | | | | | | 1,000.00 | | | | | | 1,022.08 | | | | | | 0.62 | | | | | | 3.16 | | |
| Class S | | | | | 1,000.00 | | | | | | 1,037.90 | | | | | | 0.87 | | | | | | 4.47 | | | | | | 1,000.00 | | | | | | 1,020.82 | | | | | | 0.87 | | | | | | 4.43 | | |
| Class S2 | | | | | 1,000.00 | | | | | | 1,036.40 | | | | | | 1.02 | | | | | | 5.24 | | | | | | 1,000.00 | | | | | | 1,020.06 | | | | | | 1.02 | | | | | | 5.19 | | |
| Voya High Yield Portfolio | | ||||||||||||||||||||||||||||||||||||||||||||||||
| Class ADV | | | | $ | 1,000.00 | | | | | $ | 1,038.60 | | | | | | 1.08% | | | | | $ | 5.55 | | | | | $ | 1,000.00 | | | | | $ | 1,019.76 | | | | | | 1.08% | | | | | $ | 5.50 | | |
| Class I | | | | | 1,000.00 | | | | | | 1,040.70 | | | | | | 0.48 | | | | | | 2.47 | | | | | | 1,000.00 | | | | | | 1,022.79 | | | | | | 0.48 | | | | | | 2.45 | | |
| Class S | | | | | 1,000.00 | | | | | | 1,040.40 | | | | | | 0.73 | | | | | | 3.75 | | | | | | 1,000.00 | | | | | | 1,021.53 | | | | | | 0.73 | | | | | | 3.72 | | |
| Class S2 | | | | | 1,000.00 | | | | | | 1,039.60 | | | | | | 0.88 | | | | | | 4.52 | | | | | | 1,000.00 | | | | | | 1,020.77 | | | | | | 0.88 | | | | | | 4.48 | | |
| Voya Large Cap Growth Portfolio | | ||||||||||||||||||||||||||||||||||||||||||||||||
| Class ADV | | | | $ | 1,000.00 | | | | | $ | 1,109.50 | | | | | | 1.27% | | | | | $ | 6.75 | | | | | $ | 1,000.00 | | | | | $ | 1,018.80 | | | | | | 1.27% | | | | | $ | 6.46 | | |
| Class I | | | | | 1,000.00 | | | | | | 1,112.90 | | | | | | 0.67 | | | | | | 3.57 | | | | | | 1,000.00 | | | | | | 1,021.83 | | | | | | 0.67 | | | | | | 3.41 | | |
| Class R6 | | | | | 1,000.00 | | | | | | 1,112.90 | | | | | | 0.67 | | | | | | 3.57 | | | | | | 1,000.00 | | | | | | 1,021.83 | | | | | | 0.67 | | | | | | 3.41 | | |
| Class S | | | | | 1,000.00 | | | | | | 1,111.00 | | | | | | 0.92 | | | | | | 4.90 | | | | | | 1,000.00 | | | | | | 1,020.57 | | | | | | 0.92 | | | | | | 4.69 | | |
| Class S2 | | | | | 1,000.00 | | | | | | 1,110.30 | | | | | | 1.07 | | | | | | 5.69 | | | | | | 1,000.00 | | | | | | 1,019.81 | | | | | | 1.07 | | | | | | 5.45 | | |
| | | |
Actual Portfolio Return
|
| |
Hypothetical (5% return before expenses)
|
| ||||||||||||||||||||||||||||||||||||||||||
| | | |
Beginning
Account Value July 1, 2019 |
| |
Ending
Account Value December 31, 2019 |
| |
Annualized
Expense Ratio |
| |
Expenses Paid
During the Period Ended December 31, 2019* |
| |
Beginning
Account Value July 1, 2019 |
| |
Ending
Account Value December 31, 2019 |
| |
Annualized
Expense Ratio |
| |
Expenses Paid
During the Period Ended December 31, 2019* |
| ||||||||||||||||||||||||
| Voya Large Cap Value Portfolio | | ||||||||||||||||||||||||||||||||||||||||||||||||
| Class ADV | | | | $ | 1,000.00 | | | | | $ | 1,077.90 | | | | | | 1.24% | | | | | $ | 6.49 | | | | | $ | 1,000.00 | | | | | $ | 1,018.95 | | | | | | 1.24% | | | | | $ | 6.31 | | |
| Class I | | | | | 1,000.00 | | | | | | 1,080.40 | | | | | | 0.64 | | | | | | 3.36 | | | | | | 1,000.00 | | | | | | 1,021.98 | | | | | | 0.64 | | | | | | 3.26 | | |
| Class R6 | | | | | 1,000.00 | | | | | | 1,080.40 | | | | | | 0.64 | | | | | | 3.36 | | | | | | 1,000.00 | | | | | | 1,021.98 | | | | | | 0.64 | | | | | | 3.26 | | |
| Class S | | | | | 1,000.00 | | | | | | 1,079.00 | | | | | | 0.89 | | | | | | 4.66 | | | | | | 1,000.00 | | | | | | 1,020.72 | | | | | | 0.89 | | | | | | 4.53 | | |
| Class S2 | | | | | 1,000.00 | | | | | | 1,077.90 | | | | | | 1.04 | | | | | | 5.45 | | | | | | 1,000.00 | | | | | | 1,019.96 | | | | | | 1.04 | | | | | | 5.30 | | |
| Voya Limited Maturity Bond Portfolio | | ||||||||||||||||||||||||||||||||||||||||||||||||
| Class ADV | | | | $ | 1,000.00 | | | | | $ | 1,010.00 | | | | | | 0.89% | | | | | $ | 4.51 | | | | | $ | 1,000.00 | | | | | $ | 1,020.72 | | | | | | 0.89% | | | | | $ | 4.53 | | |
| Class I | | | | | 1,000.00 | | | | | | 1,013.00 | | | | | | 0.29 | | | | | | 1.47 | | | | | | 1,000.00 | | | | | | 1,023.74 | | | | | | 0.29 | | | | | | 1.48 | | |
| Class S | | | | | 1,000.00 | | | | | | 1,011.70 | | | | | | 0.54 | | | | | | 2.74 | | | | | | 1,000.00 | | | | | | 1,022.48 | | | | | | 0.54 | | | | | | 2.75 | | |
| Voya U.S. Stock Index Portfolio | | ||||||||||||||||||||||||||||||||||||||||||||||||
| Class ADV | | | | $ | 1,000.00 | | | | | $ | 1,105.30 | | | | | | 0.80% | | | | | $ | 4.25 | | | | | $ | 1,000.00 | | | | | $ | 1,021.17 | | | | | | 0.80% | | | | | $ | 4.08 | | |
| Class I | | | | | 1,000.00 | | | | | | 1,108.00 | | | | | | 0.27 | | | | | | 1.43 | | | | | | 1,000.00 | | | | | | 1,023.84 | | | | | | 0.27 | | | | | | 1.38 | | |
| Class P2 | | | | | 1,000.00 | | | | | | 1,108.30 | | | | | | 0.15 | | | | | | 0.80 | | | | | | 1,000.00 | | | | | | 1,024.05 | | | | | | 0.15 | | | | | | 0.77 | | |
| Class S | | | | | 1,000.00 | | | | | | 1,106.50 | | | | | | 0.51 | | | | | | 2.71 | | | | | | 1,000.00 | | | | | | 1,022.63 | | | | | | 0.51 | | | | | | 2.60 | | |
| Class S2 | | | | | 1,000.00 | | | | | | 1,105.50 | | | | | | 0.67 | | | | | | 3.56 | | | | | | 1,000.00 | | | | | | 1,021.83 | | | | | | 0.67 | | | | | | 3.41 | | |
| VY® Clarion Real Estate Portfolio | | ||||||||||||||||||||||||||||||||||||||||||||||||
| Class ADV | | | | $ | 1,000.00 | | | | | $ | 1,079.80 | | | | | | 1.31% | | | | | $ | 6.87 | | | | | $ | 1,000.00 | | | | | $ | 1,018.60 | | | | | | 1.31% | | | | | $ | 6.67 | | |
| Class I | | | | | 1,000.00 | | | | | | 1,082.80 | | | | | | 0.71 | | | | | | 3.73 | | | | | | 1,000.00 | | | | | | 1,021.63 | | | | | | 0.71 | | | | | | 3.62 | | |
| Class S | | | | | 1,000.00 | | | | | | 1,081.30 | | | | | | 0.96 | | | | | | 5.04 | | | | | | 1,000.00 | | | | | | 1,020.37 | | | | | | 0.96 | | | | | | 4.89 | | |
| Class S2 | | | | | 1,000.00 | | | | | | 1,080.70 | | | | | | 1.11 | | | | | | 5.82 | | | | | | 1,000.00 | | | | | | 1,019.61 | | | | | | 1.11 | | | | | | 5.65 | | |
| VY® JPMorgan Small Cap Core Equity Portfolio | | ||||||||||||||||||||||||||||||||||||||||||||||||
| Class ADV | | | | $ | 1,000.00 | | | | | $ | 1,069.30 | | | | | | 1.45% | | | | | $ | 7.56 | | | | | $ | 1,000.00 | | | | | $ | 1,017.90 | | | | | | 1.45% | | | | | $ | 7.37 | | |
| Class I | | | | | 1,000.00 | | | | | | 1,072.00 | | | | | | 0.85 | | | | | | 4.44 | | | | | | 1,000.00 | | | | | | 1,020.92 | | | | | | 0.85 | | | | | | 4.33 | | |
| Class R6 | | | | | 1,000.00 | | | | | | 1,072.70 | | | | | | 0.85 | | | | | | 4.44 | | | | | | 1,000.00 | | | | | | 1,020.92 | | | | | | 0.85 | | | | | | 4.33 | | |
| Class S | | | | | 1,000.00 | | | | | | 1,070.90 | | | | | | 1.10 | | | | | | 5.74 | | | | | | 1,000.00 | | | | | | 1,019.66 | | | | | | 1.10 | | | | | | 5.60 | | |
| Class S2 | | | | | 1,000.00 | | | | | | 1,070.20 | | | | | | 1.25 | | | | | | 6.52 | | | | | | 1,000.00 | | | | | | 1,018.90 | | | | | | 1.25 | | | | | | 6.36 | | |
Voya Investors Trust:
February 21, 2020
| | | |
Voya Balanced
Income Portfolio |
| |
Voya High Yield
Portfolio |
| |
Voya Large Cap
Growth Portfolio |
| |
Voya Large Cap
Value Portfolio |
| ||||||||||||
| ASSETS: | | | | | | | | | | | | | | | | | | | | | | | | | |
| Investments in securities at fair value+* | | | | $ | 343,708,755 | | | | | $ | 568,103,780 | | | | | $ | 5,818,110,098 | | | | | $ | 1,080,579,804 | | |
| Investments in affiliated underlying funds at fair value** | | | | | 33,156,275 | | | | | | — | | | | | | — | | | | | | — | | |
| Short-term investments at fair value*** | | | | | 2,178,222 | | | | | | 123,820,457 | | | | | | 87,532,651 | | | | | | 35,966,985 | | |
| Cash | | | | | 17,602,841 | | | | | | 489 | | | | | | 1,823,723 | | | | | | 224,715 | | |
| Cash collateral for futures | | | | | 400,337 | | | | | | — | | | | | | — | | | | | | — | | |
| Cash pledged for centrally cleared swaps (Note 2) | | | | | 400,000 | | | | | | — | | | | | | — | | | | | | — | | |
| Foreign currencies at value**** | | | | | 96,117 | | | | | | — | | | | | | — | | | | | | 133,609 | | |
| Receivables: | | | | | | | | | | | | | | | | | | | | | | | | | |
|
Investment securities and currencies sold
|
| | | | 30,220 | | | | | | 7,681,033 | | | | | | — | | | | | | 1,094,716 | | |
|
Fund shares sold
|
| | | | 1,614,600 | | | | | | 1,713,417 | | | | | | 414,421 | | | | | | 82,485 | | |
|
Dividends
|
| | | | 227,116 | | | | | | — | | | | | | 5,123,926 | | | | | | 1,602,289 | | |
|
Interest
|
| | | | 1,159,340 | | | | | | 8,792,328 | | | | | | 286 | | | | | | 107 | | |
|
Foreign tax reclaims
|
| | | | 190,011 | | | | | | — | | | | | | — | | | | | | 113,998 | | |
|
Unrealized appreciation on forward foreign currency contracts
|
| | | | 1,037,336 | | | | | | — | | | | | | — | | | | | | — | | |
| Prepaid expenses | | | | | 2,794 | | | | | | — | | | | | | 39,405 | | | | | | 7,656 | | |
| Reimbursement due from manager | | | | | — | | | | | | — | | | | | | — | | | | | | 88,285 | | |
| Other assets | | | | | 23,196 | | | | | | 33,353 | | | | | | 248,103 | | | | | | 72,101 | | |
|
Total assets
|
| | | | 401,827,160 | | | | | | 710,144,857 | | | | | | 5,913,292,613 | | | | | | 1,119,966,750 | | |
| LIABILITIES: | | | | | | | | | | | | | | | | | | | | | | | | | |
| Payable for investment securities and currencies purchased | | | | | 311,630 | | | | | | 3,451,137 | | | | | | — | | | | | | — | | |
|
Payable for investment securities purchased on a delayed-delivery or when-issued basis
|
| | | | 9,539,477 | | | | | | — | | | | | | — | | | | | | — | | |
| Payable for fund shares redeemed | | | | | 4,151 | | | | | | 311,709 | | | | | | 21,768,244 | | | | | | 1,252,233 | | |
| Payable upon receipt of securities loaned | | | | | 2,178,222 | | | | | | 118,699,752 | | | | | | 33,895,651 | | | | | | 31,192,985 | | |
|
Unrealized depreciation on forward foreign currency contracts
|
| | | | 697,516 | | | | | | — | | | | | | — | | | | | | — | | |
| Unrealized depreciation on OTC swap agreements | | | | | 36,587 | | | | | | — | | | | | | — | | | | | | — | | |
| Variation margin payable on centrally cleared swaps | | | | | 2,651 | | | | | | — | | | | | | — | | | | | | — | | |
| Payable for unified fees | | | | | — | | | | | | 234,658 | | | | | | — | | | | | | — | | |
| Payable for investment management fees | | | | | 186,709 | | | | | | — | | | | | | 3,204,238 | | | | | | 656,078 | | |
| Payable for distribution and shareholder service fees | | | | | 104,020 | | | | | | 109,871 | | | | | | 1,374,208 | | | | | | 168,426 | | |
|
Payable to trustees under the deferred compensation plan (Note 6)
|
| | | | 23,196 | | | | | | 33,353 | | | | | | 248,103 | | | | | | 72,101 | | |
| Payable for trustee fees | | | | | 1,951 | | | | | | — | | | | | | 28,262 | | | | | | 5,370 | | |
| Other accrued expenses and liabilities | | | | | 127,292 | | | | | | — | | | | | | 690,159 | | | | | | 173,034 | | |
| Written options, at fair value^ | | | | | 1,015 | | | | | | — | | | | | | — | | | | | | — | | |
|
Total liabilities
|
| | | | 13,214,417 | | | | | | 122,840,480 | | | | | | 61,208,865 | | | | | | 33,520,227 | | |
|
NET ASSETS
|
| | | $ | 388,612,743 | | | | | $ | 587,304,377 | | | | | $ | 5,852,083,748 | | | | | $ | 1,086,446,523 | | |
| NET ASSETS WERE COMPRISED OF: | | | | | | | | | | | | | | | | | | | | | | | | | |
| Paid-in capital | | | | $ | 334,565,649 | | | | | $ | 608,559,433 | | | | | $ | 3,967,194,125 | | | | | $ | 880,136,229 | | |
| Total distributable earnings (loss) | | | | | 54,047,094 | | | | | | (21,255,056) | | | | | | 1,884,889,623 | | | | | | 206,310,294 | | |
|
NET ASSETS
|
| | | $ | 388,612,743 | | | | | $ | 587,304,377 | | | | | $ | 5,852,083,748 | | | | | $ | 1,086,446,523 | | |
|
+
Including securities loaned at value
|
| | | $ | 2,109,005 | | | | | $ | 115,799,622 | | | | | $ | 33,082,121 | | | | | $ | 30,471,864 | | |
|
*
Cost of investments in securities
|
| | | $ | 324,823,563 | | | | | $ | 551,003,567 | | | | | $ | 4,626,656,984 | | | | | $ | 961,661,927 | | |
|
**
Cost of investments in affiliated underlying funds
|
| | | $ | 33,771,324 | | | | | $ | — | | | | | $ | — | | | | | $ | — | | |
|
***
Cost of short-term investments
|
| | | $ | 2,178,222 | | | | | $ | 123,820,222 | | | | | $ | 87,532,651 | | | | | $ | 35,966,985 | | |
|
****
Cost of foreign currencies
|
| | | $ | 97,765 | | | | | $ | — | | | | | $ | — | | | | | $ | 131,202 | | |
|
^
Premiums received on written options
|
| | | $ | 28,704 | | | | | $ | — | | | | | $ | — | | | | | $ | — | | |
| | | |
Voya Balanced
Income Portfolio |
| |
Voya High Yield
Portfolio |
| |
Voya Large Cap
Growth Portfolio |
| |
Voya Large Cap
Value Portfolio |
| ||||||||||||
| Class ADV | | | | | | | | | | | | | | | | | | | | | | | | | |
|
Net assets
|
| | | $ | 78,155,140 | | | | | $ | 87,539,716 | | | | | $ | 1,890,631,161 | | | | | $ | 53,097,525 | | |
|
Shares authorized
|
| | | | unlimited | | | | | | unlimited | | | | | | unlimited | | | | | | unlimited | | |
|
Par value
|
| | | $ | 0.001 | | | | | $ | 0.001 | | | | | $ | 0.001 | | | | | $ | 0.001 | | |
|
Shares outstanding
|
| | | | 7,337,214 | | | | | | 8,811,037 | | | | | | 105,248,799 | | | | | | 4,440,872 | | |
|
Net asset value and redemption price per share
|
| | | $ | 10.65 | | | | | $ | 9.94 | | | | | $ | 17.96 | | | | | $ | 11.96 | | |
| Class I | | | | | | | | | | | | | | | | | | | | | | | | | |
|
Net assets
|
| | | $ | 8,836,068 | | | | | $ | 189,247,475 | | | | | $ | 2,000,466,393 | | | | | $ | 367,345,273 | | |
|
Shares authorized
|
| | | | unlimited | | | | | | unlimited | | | | | | unlimited | | | | | | unlimited | | |
|
Par value
|
| | | $ | 0.001 | | | | | $ | 0.001 | | | | | $ | 0.001 | | | | | $ | 0.001 | | |
|
Shares outstanding
|
| | | | 789,728 | | | | | | 19,033,491 | | | | | | 100,904,765 | | | | | | 30,056,027 | | |
|
Net asset value and redemption price per share
|
| | | $ | 11.19 | | | | | $ | 9.94 | | | | | $ | 19.83 | | | | | $ | 12.22 | | |
| Class R6 | | | | | | | | | | | | | | | | | | | | | | | | | |
|
Net assets
|
| | | | n/a | | | | | | n/a | | | | | $ | 59,938,225 | | | | | $ | 306,238 | | |
|
Shares authorized
|
| | | | n/a | | | | | | n/a | | | | | | unlimited | | | | | | unlimited | | |
|
Par value
|
| | | | n/a | | | | | | n/a | | | | | $ | 0.001 | | | | | $ | 0.001 | | |
|
Shares outstanding
|
| | | | n/a | | | | | | n/a | | | | | | 3,021,820 | | | | | | 25,075 | | |
|
Net asset value and redemption price per share
|
| | | | n/a | | | | | | n/a | | | | | $ | 19.84 | | | | | $ | 12.21 | | |
| Class S | | | | | | | | | | | | | | | | | | | | | | | | | |
|
Net assets
|
| | | $ | 295,942,214 | | | | | $ | 307,505,569 | | | | | $ | 1,839,828,783 | | | | | $ | 665,552,586 | | |
|
Shares authorized
|
| | | | unlimited | | | | | | unlimited | | | | | | unlimited | | | | | | unlimited | | |
|
Par value
|
| | | $ | 0.001 | | | | | $ | 0.001 | | | | | $ | 0.001 | | | | | $ | 0.001 | | |
|
Shares outstanding
|
| | | | 26,600,053 | | | | | | 30,949,844 | | | | | | 95,755,327 | | | | | | 55,268,226 | | |
|
Net asset value and redemption price per share
|
| | | $ | 11.13 | | | | | $ | 9.94 | | | | | $ | 19.21 | | | | | $ | 12.04 | | |
| Class S2 | | | | | | | | | | | | | | | | | | | | | | | | | |
|
Net assets
|
| | | $ | 5,679,321 | | | | | $ | 3,011,617 | | | | | $ | 61,219,186 | | | | | $ | 144,901 | | |
|
Shares authorized
|
| | | | unlimited | | | | | | unlimited | | | | | | unlimited | | | | | | unlimited | | |
|
Par value
|
| | | $ | 0.001 | | | | | $ | 0.001 | | | | | $ | 0.001 | | | | | $ | 0.001 | | |
|
Shares outstanding
|
| | | | 511,422 | | | | | | 302,695 | | | | | | 3,216,216 | | | | | | 12,014 | | |
|
Net asset value and redemption price per share
|
| | | $ | 11.10 | | | | | $ | 9.95 | | | | | $ | 19.03 | | | | | $ | 12.06 | | |
| | | |
Voya Limited
Maturity Bond Portfolio |
| |
Voya U.S. Stock
Index Portfolio |
| |
VY® Clarion Real
Estate Portfolio |
| |
VY® JPMorgan
Small Cap Core Equity Portfolio |
| ||||||||||||
| ASSETS: | | | | | | | | | | | | | | | | | | | | | | | | | |
| Investments in securities at fair value+* | | | | $ | 281,245,791 | | | | | $ | 6,905,394,427 | | | | | $ | 329,975,949 | | | | | $ | 529,478,595 | | |
| Short-term investments at fair value** | | | | | 5,224,075 | | | | | | 168,400,367 | | | | | | 7,263,409 | | | | | | 35,398,291 | | |
| Cash | | | | | 921,889 | | | | | | 1,255,974 | | | | | | — | | | | | | — | | |
| Cash collateral for futures | | | | | 222,327 | | | | | | 3,858,562 | | | | | | — | | | | | | 383,530 | | |
| Receivables: | | | | | | | | | | | | | | | | | | | | | | | | | |
|
Investment securities sold
|
| | | | 7,917 | | | | | | — | | | | | | 3,621,427 | | | | | | 404,287 | | |
|
Fund shares sold
|
| | | | 487,322 | | | | | | 1,733,143 | | | | | | 273,964 | | | | | | 1,254,919 | | |
|
Dividends
|
| | | | 12,011 | | | | | | 7,008,017 | | | | | | 1,834,328 | | | | | | 652,610 | | |
|
Interest
|
| | | | 1,566,315 | | | | | | — | | | | | | — | | | | | | — | | |
|
Other
|
| | | | — | | | | | | — | | | | | | — | | | | | | 135,398 | | |
| Prepaid expenses | | | | | — | | | | | | — | | | | | | 2,483 | | | | | | — | | |
| Reimbursement due from manager | | | | | — | | | | | | 218,046 | | | | | | 30,142 | | | | | | — | | |
| Receivable due from manager | | | | | — | | | | | | — | | | | | | — | | | | | | 109,207 | | |
| Other assets | | | | | 14,146 | | | | | | 162,981 | | | | | | 26,762 | | | | | | 26,334 | | |
|
Total assets
|
| | | | 289,701,793 | | | | | | 7,088,031,517 | | | | | | 343,028,464 | | | | | | 567,843,171 | | |
| LIABILITIES: | | | | | | | | | | | | | | | | | | | | | | | | | |
| Payable for investment securities purchased | | | | | 1,500,703 | | | | | | — | | | | | | 2,942,863 | | | | | | 848,114 | | |
| Payable for fund shares redeemed | | | | | 260,297 | | | | | | 10,026,071 | | | | | | 151,608 | | | | | | 2,004,045 | | |
| Payable upon receipt of securities loaned | | | | | 5,075 | | | | | | 80,158,367 | | | | | | 5,500,430 | | | | | | 16,382,548 | | |
| Payable for unified fees | | | | | 69,949 | | | | | | 1,495,896 | | | | | | — | | | | | | 482,606 | | |
| Payable for investment management fees | | | | | — | | | | | | — | | | | | | 221,889 | | | | | | — | | |
| Payable for distribution and shareholder service fees | | | | | 23,817 | | | | | | 130,811 | | | | | | 86,194 | | | | | | 124,674 | | |
|
Payable to trustees under the deferred compensation plan (Note 6)
|
| | | | 14,146 | | | | | | 162,981 | | | | | | 26,762 | | | | | | 26,334 | | |
| Payable for trustee fees | | | | | — | | | | | | — | | | | | | 1,721 | | | | | | — | | |
| Other accrued expenses and liabilities | | | | | — | | | | | | — | | | | | | 71,652 | | | | | | — | | |
|
Total liabilities
|
| | | | 1,873,987 | | | | | | 91,974,126 | | | | | | 9,003,119 | | | | | | 19,868,321 | | |
|
NET ASSETS
|
| | | $ | 287,827,806 | | | | | $ | 6,996,057,391 | | | | | $ | 334,025,345 | | | | | $ | 547,974,850 | | |
| NET ASSETS WERE COMPRISED OF: | | | | | | | | | | | | | | | | | | | | | | | | | |
| Paid-in capital | | | | $ | 286,155,400 | | | | | $ | 4,081,387,746 | | | | | $ | 268,965,356 | | | | | $ | 466,189,338 | | |
| Total distributable earnings | | | | | 1,672,406 | | | | | | 2,914,669,645 | | | | | | 65,059,989 | | | | | | 81,785,512 | | |
|
NET ASSETS
|
| | | $ | 287,827,806 | | | | | $ | 6,996,057,391 | | | | | $ | 334,025,345 | | | | | $ | 547,974,850 | | |
|
+
Including securities loaned at value
|
| | | $ | 4,972 | | | | | $ | 78,310,394 | | | | | $ | 5,356,212 | | | | | $ | 15,940,332 | | |
|
*
Cost of investments in securities
|
| | | $ | 279,796,185 | | | | | $ | 4,268,478,242 | | | | | $ | 293,950,748 | | | | | $ | 444,089,002 | | |
|
**
Cost of short-term investments
|
| | | $ | 5,224,075 | | | | | $ | 168,400,367 | | | | | $ | 7,263,409 | | | | | $ | 35,398,291 | | |
| | | |
Voya Limited
Maturity Bond Portfolio |
| |
Voya U.S. Stock
Index Portfolio |
| |
VY® Clarion Real
Estate Portfolio |
| |
VY® JPMorgan
Small Cap Core Equity Portfolio |
| ||||||||||||
| Class ADV | | | | | | | | | | | | | | | | | | | | | | | | | |
|
Net assets
|
| | | $ | 15,578,953 | | | | | $ | 102,812,951 | | | | | $ | 63,873,129 | | | | | $ | 130,058,360 | | |
|
Shares authorized
|
| | | | unlimited | | | | | | unlimited | | | | | | unlimited | | | | | | unlimited | | |
|
Par value
|
| | | $ | 0.001 | | | | | $ | 0.001 | | | | | $ | 0.001 | | | | | $ | 0.001 | | |
|
Shares outstanding
|
| | | | 1,571,892 | | | | | | 6,278,275 | | | | | | 1,755,358 | | | | | | 8,728,997 | | |
|
Net asset value and redemption price per share
|
| | | $ | 9.91 | | | | | $ | 16.38 | | | | | $ | 36.39 | | | | | $ | 14.90 | | |
| Class I | | | | | | | | | | | | | | | | | | | | | | | | | |
|
Net assets
|
| | | $ | 197,182,414 | | | | | $ | 4,065,090,885 | | | | | $ | 24,411,801 | | | | | $ | 240,957,456 | | |
|
Shares authorized
|
| | | | unlimited | | | | | | unlimited | | | | | | unlimited | | | | | | unlimited | | |
|
Par value
|
| | | $ | 0.001 | | | | | $ | 0.001 | | | | | $ | 0.001 | | | | | $ | 0.001 | | |
|
Shares outstanding
|
| | | | 19,498,018 | | | | | | 239,266,245 | | | | | | 636,052 | | | | | | 14,863,177 | | |
|
Net asset value and redemption price per share
|
| | | $ | 10.11 | | | | | $ | 16.99 | | | | | $ | 38.38 | | | | | $ | 16.21 | | |
| Class P2 | | | | | | | | | | | | | | | | | | | | | | | | | |
|
Net assets
|
| | | | n/a | | | | | $ | 2,395,088,708 | | | | | | n/a | | | | | | n/a | | |
|
Shares authorized
|
| | | | n/a | | | | | | unlimited | | | | | | n/a | | | | | | n/a | | |
|
Par value
|
| | | | n/a | | | | | $ | 0.001 | | | | | | n/a | | | | | | n/a | | |
|
Shares outstanding
|
| | | | n/a | | | | | | 140,466,505 | | | | | | n/a | | | | | | n/a | | |
|
Net asset value and redemption price per share
|
| | | | n/a | | | | | $ | 17.05 | | | | | | n/a | | | | | | n/a | | |
| Class R6 | | | | | | | | | | | | | | | | | | | | | | | | | |
|
Net assets
|
| | | | n/a | | | | | | n/a | | | | | | n/a | | | | | $ | 38,160,727 | | |
|
Shares authorized
|
| | | | n/a | | | | | | n/a | | | | | | n/a | | | | | | unlimited | | |
|
Par value
|
| | | | n/a | | | | | | n/a | | | | | | n/a | | | | | $ | 0.001 | | |
|
Shares outstanding
|
| | | | n/a | | | | | | n/a | | | | | | n/a | | | | | | 2,355,798 | | |
|
Net asset value and redemption price per share
|
| | | | n/a | | | | | | n/a | | | | | | n/a | | | | | $ | 16.20 | | |
| Class S | | | | | | | | | | | | | | | | | | | | | | | | | |
|
Net assets
|
| | | $ | 75,066,439 | | | | | $ | 283,767,561 | | | | | $ | 230,345,978 | | | | | $ | 129,784,126 | | |
|
Shares authorized
|
| | | | unlimited | | | | | | unlimited | | | | | | unlimited | | | | | | unlimited | | |
|
Par value
|
| | | $ | 0.001 | | | | | $ | 0.001 | | | | | $ | 0.001 | | | | | $ | 0.001 | | |
|
Shares outstanding
|
| | | | 7,366,989 | | | | | | 16,867,301 | | | | | | 6,010,590 | | | | | | 8,134,473 | | |
|
Net asset value and redemption price per share
|
| | | $ | 10.19 | | | | | $ | 16.82 | | | | | $ | 38.32 | | | | | $ | 15.95 | | |
| Class S2 | | | | | | | | | | | | | | | | | | | | | | | | | |
|
Net assets
|
| | | | n/a | | | | | $ | 149,297,286 | | | | | $ | 15,394,437 | | | | | $ | 9,014,181 | | |
|
Shares authorized
|
| | | | n/a | | | | | | unlimited | | | | | | unlimited | | | | | | unlimited | | |
|
Par value
|
| | | | n/a | | | | | $ | 0.001 | | | | | $ | 0.001 | | | | | $ | 0.001 | | |
|
Shares outstanding
|
| | | | n/a | | | | | | 8,983,402 | | | | | | 404,370 | | | | | | 572,712 | | |
|
Net asset value and redemption price per share
|
| | | | n/a | | | | | $ | 16.62 | | | | | $ | 38.07 | | | | | $ | 15.74 | | |
| | | |
Voya Balanced
Income Portfolio |
| |
Voya High Yield
Portfolio |
| |
Voya Large Cap
Growth Portfolio |
| |
Voya Large Cap
Value Portfolio |
| ||||||||||||
| INVESTMENT INCOME: | | | | | | | | | | | | | | | | | | | | | | | | | |
| Dividends, net of foreign taxes withheld* | | | | $ | 5,433,819 | | | | | $ | — | | | | | $ | 68,322,443 | | | | | $ | 28,268,572 | | |
| Dividends from affiliated underlying funds | | | | | 1,453,862 | | | | | | — | | | | | | — | | | | | | — | | |
| Interest, net of foreign taxes withheld* | | | | | 8,752,462 | | | | | | 32,597,213 | | | | | | 379 | | | | | | 4,653 | | |
| Securities lending income, net | | | | | 134,719 | | | | | | 482,302 | | | | | | 545,110 | | | | | | 80,020 | | |
|
Total investment income
|
| | | | 15,774,862 | | | | | | 33,079,515 | | | | | | 68,867,932 | | | | | | 28,353,245 | | |
| EXPENSES: | | | | | | | | | | | | | | | | | | | | | | | | | |
| Investment management fees | | | | | 2,401,449 | | | | | | — | | | | | | 36,688,490 | | | | | | 7,768,154 | | |
| Unified fees | | | | | — | | | | | | 2,580,656 | | | | | | — | | | | | | — | | |
| Distribution and shareholder service fees: | | | | | | | | | | | | | | | | | | | | | | | | | |
|
Class ADV
|
| | | | 458,824 | | | | | | 512,029 | | | | | | 11,143,673 | | | | | | 312,911 | | |
|
Class S
|
| | | | 749,854 | | | | | | 836,038 | | | | | | 4,561,204 | | | | | | 1,671,312 | | |
|
Class S2
|
| | | | 20,298 | | | | | | 15,587 | | | | | | 251,008 | | | | | | 631 | | |
| Transfer agent fees | | | | | 475 | | | | | | 31 | | | | | | 7,123 | | | | | | 1,687 | | |
| Shareholder reporting expense | | | | | 24,455 | | | | | | 2,523 | | | | | | 178,850 | | | | | | 70,796 | | |
| Professional fees | | | | | 21,763 | | | | | | — | | | | | | 217,720 | | | | | | 49,252 | | |
| Custody and accounting expense | | | | | 66,379 | | | | | | — | | | | | | 484,110 | | | | | | 95,472 | | |
| Trustee fees | | | | | 15,603 | | | | | | — | | | | | | 226,097 | | | | | | 42,961 | | |
| Trustee fees and expenses | | | | | — | | | | | | 31,189 | | | | | | — | | | | | | 35,715 | | |
| Shareholder notification costs (Note 6) | | | | | 26,100 | | | | | | — | | | | | | — | | | | | | — | | |
| Miscellaneous expense | | | | | 16,348 | | | | | | 289 | | | | | | 171,338 | | | | | | 633 | | |
| Interest expense | | | | | 7,210 | | | | | | — | | | | | | 4,795 | | | | | | 2,356 | | |
|
Total expenses
|
| | | | 3,808,758 | | | | | | 3,978,342 | | | | | | 53,934,408 | | | | | | 10,051,880 | | |
|
Waived and reimbursed fees
|
| | | | (151,980) | | | | | | (85,174) | | | | | | — | | | | | | (1,176,264) | | |
|
Brokerage commission recapture
|
| | | | (180) | | | | | | — | | | | | | — | | | | | | — | | |
|
Net expenses
|
| | | | 3,656,598 | | | | | | 3,893,168 | | | | | | 53,934,408 | | | | | | 8,875,616 | | |
| Net investment income | | | | | 12,118,264 | | | | | | 29,186,347 | | | | | | 14,933,524 | | | | | | 19,477,629 | | |
| REALIZED AND UNREALIZED GAIN (LOSS): | | | | | | | | | | | | | | | | | | | | | | | | | |
| Net realized gain (loss) on: | | | | | | | | | | | | | | | | | | | | | | | | | |
|
Investments (net of Indian capital gains tax withheld^)
|
| | | | 22,043,590 | | | | | | (2,317,688) | | | | | | 682,759,477 | | | | | | 85,830,105 | | |
|
Sale of affiliated underlying funds
|
| | | | (252,558) | | | | | | — | | | | | | — | | | | | | — | | |
|
Forward foreign currency contracts
|
| | | | (151,882) | | | | | | — | | | | | | — | | | | | | — | | |
|
Foreign currency related transactions
|
| | | | 73,678 | | | | | | 184 | | | | | | (11,264) | | | | | | 3,133 | | |
|
Futures
|
| | | | 473,854 | | | | | | — | | | | | | — | | | | | | — | | |
|
Swaps
|
| | | | 762,017 | | | | | | — | | | | | | — | | | | | | — | | |
|
Written options
|
| | | | 98,591 | | | | | | — | | | | | | — | | | | | | — | | |
|
Net realized gain (loss)
|
| | | | 23,047,290 | | | | | | (2,317,504) | | | | | | 682,748,213 | | | | | | 85,833,238 | | |
| Net change in unrealized appreciation (depreciation) on: | | | | | | | | | | | | | | | | | | | | | | | | | |
|
Investments
|
| | | | 30,025,678 | | | | | | 45,325,720 | | | | | | 862,616,382 | | | | | | 131,843,488 | | |
|
Affiliated underlying funds
|
| | | | (615,048) | | | | | | — | | | | | | — | | | | | | — | | |
|
Forward foreign currency contracts
|
| | | | 339,820 | | | | | | — | | | | | | — | | | | | | — | | |
|
Foreign currency related transactions
|
| | | | (2,306) | | | | | | — | | | | | | 10,137 | | | | | | (6,006) | | |
|
Futures
|
| | | | 75,587 | | | | | | — | | | | | | — | | | | | | — | | |
|
Swaps
|
| | | | 48,035 | | | | | | — | | | | | | — | | | | | | — | | |
|
Written options
|
| | | | (2,340) | | | | | | — | | | | | | — | | | | | | — | | |
|
Net change in unrealized appreciation (depreciation)
|
| | | | 29,869,426 | | | | | | 45,325,720 | | | | | | 862,626,519 | | | | | | 131,837,482 | | |
| Net realized and unrealized gain | | | | | 52,916,716 | | | | | | 43,008,216 | | | | | | 1,545,374,732 | | | | | | 217,670,720 | | |
|
Increase in net assets resulting from operations
|
| | | $ | 65,034,980 | | | | | $ | 72,194,563 | | | | | $ | 1,560,308,256 | | | | | $ | 237,148,349 | | |
|
*
Foreign taxes withheld
|
| | | $ | 111,105 | | | | | $ | — | | | | | $ | 114,120 | | | | | $ | 125,132 | | |
|
^
Foreign taxes on sale of Indian investments
|
| | | $ | 197 | | | | | $ | — | | | | | $ | — | | | | | $ | — | | |
| | | |
Voya Limited
Maturity Bond Portfolio |
| |
Voya U.S. Stock
Index Portfolio |
| |
VY® Clarion Real
Estate Portfolio |
| |
VY® JPMorgan
Small Cap Core Equity Portfolio |
| ||||||||||||
| INVESTMENT INCOME: | | | | | | | | | | | | | | | | | | | | | | | | | |
| Dividends, net of foreign taxes withheld* | | | | $ | 202,673 | | | | | $ | 119,195,578 | | | | | $ | 9,489,247 | | | | | $ | 10,752,442 | | |
| Interest | | | | | 7,326,405 | | | | | | 46,588 | | | | | | 33 | | | | | | 941 | | |
| Securities lending income, net | | | | | 20,743 | | | | | | 246,069 | | | | | | 3,879 | | | | | | 274,016 | | |
|
Total investment income
|
| | | | 7,549,821 | | | | | | 119,488,235 | | | | | | 9,493,159 | | | | | | 11,027,399 | | |
| EXPENSES: | | | | | | | | | | | | | | | | | | | | | | | | | |
| Investment management fees | | | | | — | | | | | | — | | | | | | 2,852,451 | | | | | | — | | |
| Unified fees | | | | | 783,457 | | | | | | 15,418,906 | | | | | | — | | | | | | 6,285,657 | | |
| Distribution and shareholder service fees: | | | | | | | | | | | | | | | | | | | | | | | | | |
|
Class ADV
|
| | | | 97,263 | | | | | | 524,043 | | | | | | 375,243 | | | | | | 758,345 | | |
|
Class S
|
| | | | 188,483 | | | | | | 158,066 | | | | | | 588,633 | | | | | | 845,136 | | |
|
Class S2
|
| | | | — | | | | | | 603,775 | | | | | | 60,490 | | | | | | 115,900 | | |
| Transfer agent fees | | | | | — | | | | | | — | | | | | | 536 | | | | | | — | | |
| Shareholder reporting expense | | | | | — | | | | | | — | | | | | | 22,380 | | | | | | — | | |
| Professional fees | | | | | — | | | | | | — | | | | | | 14,973 | | | | | | — | | |
| Custody and accounting expense | | | | | — | | | | | | — | | | | | | 35,620 | | | | | | — | | |
| Trustee fees | | | | | — | | | | | | — | | | | | | 13,762 | | | | | | — | | |
| Trustee fees and expenses | | | | | 18,380 | | | | | | 314,506 | | | | | | — | | | | | | 45,447 | | |
| Miscellaneous expense | | | | | — | | | | | | — | | | | | | 13,340 | | | | | | — | | |
| Interest expense | | | | | — | | | | | | 19,321 | | | | | | 4,916 | | | | | | — | | |
|
Total expenses
|
| | | | 1,087,583 | | | | | | 17,038,617 | | | | | | 3,982,344 | | | | | | 8,050,485 | | |
|
Waived and reimbursed fees
|
| | | | — | | | | | | (2,294,200) | | | | | | (531,592) | | | | | | — | | |
|
Brokerage commission recapture
|
| | | | — | | | | | | — | | | | | | — | | | | | | (51,259) | | |
|
Net expenses
|
| | | | 1,087,583 | | | | | | 14,744,417 | | | | | | 3,450,752 | | | | | | 7,999,226 | | |
| Net investment income | | | | | 6,462,238 | | | | | | 104,743,818 | | | | | | 6,042,407 | | | | | | 3,028,173 | | |
| REALIZED AND UNREALIZED GAIN (LOSS): | | | | | | | | | | | | | | | | | | | | | | | | | |
| Net realized gain (loss) on: | | | | | | | | | | | | | | | | | | | | | | | | | |
|
Investments
|
| | | | 1,526,516 | | | | | | 259,747,399 | | | | | | 27,661,531 | | | | | | 107,303,048 | | |
|
Futures
|
| | | | 67,840 | | | | | | 13,816,430 | | | | | | — | | | | | | 971,535 | | |
|
Swaps
|
| | | | (54,539) | | | | | | — | | | | | | — | | | | | | — | | |
|
Net realized gain
|
| | | | 1,539,817 | | | | | | 273,563,829 | | | | | | 27,661,531 | | | | | | 108,274,583 | | |
| Net change in unrealized appreciation (depreciation) on: | | | | | | | | | | | | | | | | | | | | | | | | | |
|
Investments
|
| | | | 3,458,126 | | | | | | 1,156,662,223 | | | | | | 51,173,622 | | | | | | 53,822,397 | | |
|
Futures
|
| | | | (196,576) | | | | | | 4,136,798 | | | | | | — | | | | | | 480,781 | | |
|
Net change in unrealized appreciation (depreciation)
|
| | | | 3,261,550 | | | | | | 1,160,799,021 | | | | | | 51,173,622 | | | | | | 54,303,178 | | |
| Net realized and unrealized gain | | | | | 4,801,367 | | | | | | 1,434,362,850 | | | | | | 78,835,153 | | | | | | 162,577,761 | | |
|
Increase in net assets resulting from operations
|
| | | $ | 11,263,605 | | | | | $ | 1,539,106,668 | | | | | $ | 84,877,560 | | | | | $ | 165,605,934 | | |
|
*
Foreign taxes withheld
|
| | | $ | — | | | | | $ | — | | | | | $ | — | | | | | $ | 34,094 | | |
| | | |
Voya Balanced Income Portfolio
|
| |
Voya High Yield Portfolio
|
| ||||||||||||||||||
| | | |
Year Ended
December 31, 2019 |
| |
Year Ended
December 31, 2018 |
| |
Year Ended
December 31, 2019 |
| |
Year Ended
December 31, 2018 |
| ||||||||||||
| FROM OPERATIONS: | | | | | | | | | | | | | | | | | | | | | | | | | |
| Net investment income | | | | $ | 12,118,264 | | | | | $ | 17,718,908 | | | | | $ | 29,186,347 | | | | | $ | 28,161,541 | | |
| Net realized gain (loss) | | | | | 23,047,290 | | | | | | 22,262,236 | | | | | | (2,317,504) | | | | | | (6,645,975) | | |
| Net change in unrealized appreciation (depreciation) | | | | | 29,869,426 | | | | | | (59,819,558) | | | | | | 45,325,720 | | | | | | (37,284,503) | | |
|
Increase (decrease) in net assets resulting from operations
|
| | | | 65,034,980 | | | | | | (19,838,414) | | | | | | 72,194,563 | | | | | | (15,768,937) | | |
| FROM DISTRIBUTIONS TO SHAREHOLDERS: | | | | | | | | | | | | | | | | | | | | | | | | | |
| Total distributions (excluding return of capital): | | | | | | | | | | | | | | | | | | | | | | | | | |
|
Class ADV
|
| | | | (7,922,532) | | | | | | (3,926,322) | | | | | | (4,184,086) | | | | | | (4,784,764) | | |
|
Class I
|
| | | | (894,071) | | | | | | (483,308) | | | | | | (5,691,493) | | | | | | (3,566,820) | | |
|
Class S
|
| | | | (30,519,786) | | | | | | (16,723,472) | | | | | | (17,552,628) | | | | | | (21,269,549) | | |
|
Class S2
|
| | | | (501,395) | | | | | | (254,904) | | | | | | (198,505) | | | | | | (285,512) | | |
| Total distributions | | | | | (39,837,784) | | | | | | (21,388,006) | | | | | | (27,626,712) | | | | | | (29,906,645) | | |
| FROM CAPITAL SHARE TRANSACTIONS: | | | | | | | | | | | | | | | | | | | | | | | | | |
| Net proceeds from sale of shares | | | | | 11,771,113 | | | | | | 6,585,736 | | | | | | 64,608,084 | | | | | | 30,736,899 | | |
| Proceeds from shares issued in merger (Note 13) | | | | | — | | | | | | — | | | | | | 98,023,284 | | | | | | — | | |
| Reinvestment of distributions | | | | | 39,837,784 | | | | | | 21,388,006 | | | | | | 27,626,712 | | | | | | 29,906,645 | | |
| | | | | | 51,608,897 | | | | | | 27,973,742 | | | | | | 190,258,080 | | | | | | 60,643,544 | | |
| Cost of shares redeemed | | | | | (56,146,969) | | | | | | (76,678,608) | | | | | | (121,673,150) | | | | | | (108,628,679) | | |
|
Net increase (decrease) in net assets resulting from capital share transactions
|
| | | | (4,538,072) | | | | | | (48,704,866) | | | | | | 68,584,930 | | | | | | (47,985,135) | | |
| Net increase (decrease) in net assets | | | | | 20,659,124 | | | | | | (89,931,286) | | | | | | 113,152,781 | | | | | | (93,660,717) | | |
| NET ASSETS: | | | | | | | | | | | | | | | | | | | | | | | | | |
| Beginning of year or period | | | | | 367,953,619 | | | | | | 457,884,905 | | | | | | 474,151,596 | | | | | | 567,812,313 | | |
| End of year or period | | | | $ | 388,612,743 | | | | | $ | 367,953,619 | | | | | $ | 587,304,377 | | | | | $ | 474,151,596 | | |
| | | |
Voya Large Cap Growth Portfolio
|
| |
Voya Large Cap Value Portfolio
|
| ||||||||||||||||||
| | | |
Year Ended
December 31, 2019 |
| |
Year Ended
December 31, 2018 |
| |
Year Ended
December 31, 2019 |
| |
Year Ended
December 31, 2018 |
| ||||||||||||
| FROM OPERATIONS: | | | | | | | | | | | | | | | | | | | | | | | | | |
| Net investment income | | | | $ | 14,933,524 | | | | | $ | 21,901,527 | | | | | $ | 19,477,629 | | | | | $ | 21,734,108 | | |
| Net realized gain | | | | | 682,748,213 | | | | | | 941,533,006 | | | | | | 85,833,238 | | | | | | 76,571,425 | | |
| Net change in unrealized appreciation (depreciation) | | | | | 862,626,519 | | | | | | (976,787,864) | | | | | | 131,837,482 | | | | | | (185,618,451) | | |
|
Increase (decrease) in net assets resulting from operations
|
| | | | 1,560,308,256 | | | | | | (13,353,331) | | | | | | 237,148,349 | | | | | | (87,312,918) | | |
| FROM DISTRIBUTIONS TO SHAREHOLDERS: | | | | | | | | | | | | | | | | | | | | | | | | | |
| Total distributions (excluding return of capital): | | | | | | | | | | | | | | | | | | | | | | | | | |
|
Class ADV
|
| | | | (322,539,115) | | | | | | (276,524,927) | | | | | | (4,505,178) | | | | | | (7,149,519) | | |
|
Class I
|
| | | | (308,037,331) | | | | | | (278,916,876) | | | | | | (31,729,269) | | | | | | (48,700,372) | | |
|
Class R6
|
| | | | (8,633,943) | | | | | | (6,367,270) | | | | | | (25,122) | | | | | | (126,099) | | |
|
Class S
|
| | | | (304,557,434) | | | | | | (268,490,262) | | | | | | (59,337,191) | | | | | | (93,408,002) | | |
|
Class S2
|
| | | | (10,362,576) | | | | | | (8,678,633) | | | | | | (13,567) | | | | | | (19,541) | | |
| Total distributions | | | | | (954,130,399) | | | | | | (838,977,968) | | | | | | (95,610,327) | | | | | | (149,403,533) | | |
| FROM CAPITAL SHARE TRANSACTIONS: | | | | | | | | | | | | | | | | | | | | | | | | | |
| Net proceeds from sale of shares | | | | | 151,286,163 | | | | | | 223,873,923 | | | | | | 13,066,833 | | | | | | 13,566,103 | | |
| Reinvestment of distributions | | | | | 954,130,399 | | | | | | 838,977,968 | | | | | | 95,610,327 | | | | | | 149,403,149 | | |
| | | | | | 1,105,416,562 | | | | | | 1,062,851,891 | | | | | | 108,677,160 | | | | | | 162,969,252 | | |
| Cost of shares redeemed | | | | | (953,005,018) | | | | | | (1,396,896,531) | | | | | | (174,590,335) | | | | | | (206,228,690) | | |
|
Net increase (decrease) in net assets resulting from capital
share transactions |
| | | | 152,411,544 | | | | | | (334,044,640) | | | | | | (65,913,175) | | | | | | (43,259,438) | | |
| Net increase (decrease) in net assets | | | | | 758,589,401 | | | | | | (1,186,375,939) | | | | | | 75,624,847 | | | | | | (279,975,889) | | |
| NET ASSETS: | | | | | | | | | | | | | | | | | | | | | | | | | |
| Beginning of year or period | | | | | 5,093,494,347 | | | | | | 6,279,870,286 | | | | | | 1,010,821,676 | | | | | | 1,290,797,565 | | |
| End of year or period | | | | $ | 5,852,083,748 | | | | | $ | 5,093,494,347 | | | | | $ | 1,086,446,523 | | | | | $ | 1,010,821,676 | | |
| | | |
Voya Limited Maturity Bond Portfolio
|
| |
Voya U.S. Stock Index Portfolio
|
| ||||||||||||||||||
| | | |
Year Ended
December 31, 2019 |
| |
Year Ended
December 31, 2018 |
| |
Year Ended
December 31, 2019 |
| |
Year Ended
December 31, 2018 |
| ||||||||||||
| FROM OPERATIONS: | | | | | | | | | | | | | | | | | | | | | | | | | |
| Net investment income | | | | $ | 6,462,238 | | | | | $ | 6,231,042 | | | | | $ | 104,743,818 | | | | | $ | 87,481,321 | | |
| Net realized gain (loss) | | | | | 1,539,817 | | | | | | (1,707,205) | | | | | | 273,563,829 | | | | | | 362,433,393 | | |
| Net change in unrealized appreciation (depreciation) | | | | | 3,261,550 | | | | | | (1,065,923) | | | | | | 1,160,799,021 | | | | | | (645,694,271) | | |
|
Increase (decrease) in net assets resulting from operations
|
| | | | 11,263,605 | | | | | | 3,457,914 | | | | | | 1,539,106,668 | | | | | | (195,779,557) | | |
| FROM DISTRIBUTIONS TO SHAREHOLDERS: | | | | | | | | | | | | | | | | | | | | | | | | | |
| Total distributions (excluding return of capital): | | | | | | | | | | | | | | | | | | | | | | | | | |
|
Class ADV
|
| | | | (201,180) | | | | | | (202,049) | | | | | | (6,766,870) | | | | | | (7,544,736) | | |
|
Class I
|
| | | | (3,418,858) | | | | | | (3,241,396) | | | | | | (280,363,883) | | | | | | (241,875,952) | | |
|
Class P2
|
| | | | — | | | | | | — | | | | | | (148,647,312) | | | | | | (109,017,631) | | |
|
Class S
|
| | | | (1,202,654) | | | | | | (1,158,960) | | | | | | (6,466,557) | | | | | | (3,983,988) | | |
|
Class S2
|
| | | | — | | | | | | — | | | | | | (10,110,281) | | | | | | (12,017,762) | | |
| Total distributions | | | | | (4,822,692) | | | | | | (4,602,405) | | | | | | (452,354,903) | | | | | | (374,440,069) | | |
| FROM CAPITAL SHARE TRANSACTIONS: | | | | | | | | | | | | | | | | | | | | | | | | | |
| Net proceeds from sale of shares | | | | | 83,942,429 | | | | | | 79,908,894 | | | | | | 1,995,915,747 | | | | | | 1,146,608,168 | | |
| Reinvestment of distributions | | | | | 4,808,922 | | | | | | 4,602,405 | | | | | | 452,354,903 | | | | | | 374,440,069 | | |
| | | | | | 88,751,351 | | | | | | 84,511,299 | | | | | | 2,448,270,650 | | | | | | 1,521,048,237 | | |
| Cost of shares redeemed | | | | | (94,912,870) | | | | | | (87,597,471) | | | | | | (1,238,299,796) | | | | | | (1,330,695,268) | | |
|
Net increase (decrease) in net assets resulting from capital share transactions
|
| | | | (6,161,519) | | | | | | (3,086,172) | | | | | | 1,209,970,854 | | | | | | 190,352,969 | | |
| Net increase (decrease) in net assets | | | | | 279,394 | | | | | | (4,230,663) | | | | | | 2,296,722,619 | | | | | | (379,866,657) | | |
| NET ASSETS: | | | | | | | | | | | | | | | | | | | | | | | | | |
| Beginning of year or period | | | | | 287,548,412 | | | | | | 291,779,075 | | | | | | 4,699,334,772 | | | | | | 5,079,201,429 | | |
| End of year or period | | | | $ | 287,827,806 | | | | | $ | 287,548,412 | | | | | $ | 6,996,057,391 | | | | | $ | 4,699,334,772 | | |
| | | |
VY® Clarion Real Estate Portfolio
|
| |
VY® JPMorgan Small
Cap Core Equity Portfolio |
| ||||||||||||||||||
| | | |
Year Ended
December 31, 2019 |
| |
Year Ended
December 31, 2018 |
| |
Year Ended
December 31, 2019 |
| |
Year Ended
December 31, 2018 |
| ||||||||||||
| FROM OPERATIONS: | | | | | | | | | | | | | | | | | | | | | | | | | |
| Net investment income | | | | $ | 6,042,407 | | | | | $ | 6,758,543 | | | | | $ | 3,028,173 | | | | | $ | 2,195,335 | | |
| Net realized gain | | | | | 27,661,531 | | | | | | 1,408,407 | | | | | | 108,274,583 | | | | | | 79,213,912 | | |
| Net change in unrealized appreciation (depreciation) | | | | | 51,173,622 | | | | | | (40,459,187) | | | | | | 54,303,178 | | | | | | (160,577,469) | | |
| Increase (decrease) in net assets resulting from operations | | | | | 84,877,560 | | | | | | (32,292,237) | | | | | | 165,605,934 | | | | | | (79,168,222) | | |
| FROM DISTRIBUTIONS TO SHAREHOLDERS: | | | | | | | | | | | | | | | | | | | | | | | | | |
| Total distributions (excluding return of capital): | | | | | | | | | | | | | | | | | | | | | | | | | |
|
Class ADV
|
| | | | (1,436,002) | | | | | | (8,092,673) | | | | | | (33,003,163) | | | | | | (16,763,544) | | |
|
Class I
|
| | | | (626,652) | | | | | | (5,278,443) | | | | | | (58,503,358) | | | | | | (24,223,499) | | |
|
Class R6
|
| | | | — | | | | | | — | | | | | | (8,660,615) | | | | | | (2,813,490) | | |
|
Class S
|
| | | | (5,986,907) | | | | | | (30,337,693) | | | | | | (85,946,558) | | | | | | (47,325,409) | | |
|
Class S2
|
| | | | (359,516) | | | | | | (1,937,174) | | | | | | (7,278,863) | | | | | | (4,165,809) | | |
| Return of capital: | | | | | | | | | | | | | | | | | | | | | | | | | |
|
Class ADV
|
| | | | — | | | | | | — | | | | | | (1,680,212) | | | | | | — | | |
|
Class I
|
| | | | — | | | | | | — | | | | | | (2,858,137) | | | | | | — | | |
|
Class R6
|
| | | | — | | | | | | — | | | | | | (437,725) | | | | | | — | | |
|
Class S
|
| | | | — | | | | | | — | | | | | | (4,217,107) | | | | | | — | | |
|
Class S2
|
| | | | — | | | | | | — | | | | | | (357,279) | | | | | | — | | |
| Total distributions | | | | | (8,409,077) | | | | | | (45,645,983) | | | | | | (202,943,017) | | | | | | (95,291,751) | | |
| FROM CAPITAL SHARE TRANSACTIONS: | | | | | | | | | | | | | | | | | | | | | | | | | |
| Net proceeds from sale of shares | | | | | 18,492,283 | | | | | | 14,223,944 | | | | | | 93,535,915 | | | | | | 92,399,835 | | |
| Reinvestment of distributions | | | | | 8,409,077 | | | | | | 45,645,983 | | | | | | 202,943,018 | | | | | | 95,291,751 | | |
| | | | | | 26,901,360 | | | | | | 59,869,927 | | | | | | 296,478,933 | | | | | | 187,691,586 | | |
| Cost of shares redeemed | | | | | (90,802,217) | | | | | | (145,124,853) | | | | | | (370,553,943) | | | | | | (111,630,222) | | |
|
Net increase (decrease) in net assets resulting from capital share
transactions |
| | | | (63,900,857) | | | | | | (85,254,926) | | | | | | (74,075,010) | | | | | | 76,061,364 | | |
| Net increase (decrease) in net assets | | | | | 12,567,626 | | | | | | (163,193,146) | | | | | | (111,412,093) | | | | | | (98,398,609) | | |
| NET ASSETS: | | | | | | | | | | | | | | | | | | | | | | | | | |
| Beginning of year or period | | | | | 321,457,719 | | | | | | 484,650,865 | | | | | | 659,386,943 | | | | | | 757,785,552 | | |
| End of year or period | | | | $ | 334,025,345 | | | | | $ | 321,457,719 | | | | | $ | 547,974,850 | | | | | $ | 659,386,943 | | |
| | | | | | | | | |
Income
(loss) from investment operations |
| | | | | | | |
Less
Distributions |
| | | | |
Ratios to average
net assets |
| |
Supplemental
Data |
| |||||||||||||||||||||||||||||||||||||||||||||||||||||||||||||||||||||||||||
| | | | Net asset value, beginning of year or period |
| | Net investment income (loss) | | | Net realized and unrealized gain (loss) |
| | Total from investment operations | | | From net investment income | | | From net realized gains | | | From return of capital | | | Total distributions | | | Payment by affiliate | | | Net asset value, end of year or period |
| |
Total Return(1)
|
| | Expenses before reductions/additions(2)(3)(4) |
| | Expenses net of fee waivers and/or recoupments if any(2)(3)(4) |
| | Expense net of all reductions/additions(2)(3)(4) |
| | Net investment income (loss)(2)(3) | | | Net assets, end of year or period | | | Portfolio turnover rate | | |||||||||||||||||||||||||||||||||||||||||||||||||||
| Year or period ended |
| |
($)
|
| |
($)
|
| |
($)
|
| |
($)
|
| |
($)
|
| |
($)
|
| |
($)
|
| |
($)
|
| |
($)
|
| |
($)
|
| |
(%)
|
| |
(%)
|
| |
(%)
|
| |
(%)
|
| |
(%)
|
| |
($000’s)
|
| |
(%)
|
| |||||||||||||||||||||||||||||||||||||||||||||||||||
|
Voya Balanced Income Portfolio
|
| | | | | | | | | | | | | | | | | | | | | | | | | | | | | | | | | | | | | | | | | | | | | | | | | | | | | | | | | | | | | | | | | | | | | | | | | | | | | | | | | | | | | | | | | | | | | | | | | | | | | | |
| Class ADV | | | | | | | | | | | | | | | | | | | | | | | | | | | | | | | | | | | | | | | | | | | | | | | | | | | | | | | | | | | | | | | | | | | | | | | | | | | | | | | | | | | | | | | | | | | | | | | | | | | | | | | |
| 12-31-19 | | | | | 10.05 | | | | | | 0.30 | | | | | | 1.47 | | | | | | 1.77 | | | | | | 0.50 | | | | | | 0.67 | | | | | | — | | | | | | 1.17 | | | | | | — | | | | | | 10.65 | | | | |
|
17.93
|
| | | | | 1.26 | | | | | | 1.22 | | | | | | 1.22 | | | | | | 2.79 | | | | | | 78,155 | | | | | | 231 | | |
| 12-31-18 | | | | | 11.18 | | | | | | 0.43• | | | | | | (1.00) | | | | | | (0.57) | | | | | | 0.56 | | | | | | — | | | | | | — | | | | | | 0.56 | | | | | | — | | | | | | 10.05 | | | | |
|
(5.39)
|
| | | | | 1.39 | | | | | | 1.26 | | | | | | 1.26 | | | | | | 3.91 | | | | | | 69,593 | | | | | | 45 | | |
| 12-31-17 | | | | | 10.62 | | | | | | 0.46• | | | | | | 0.58 | | | | | | 1.04 | | | | | | 0.48 | | | | | | — | | | | | | — | | | | | | 0.48 | | | | | | — | | | | | | 11.18 | | | | |
|
10.03
|
| | | | | 1.39 | | | | | | 1.26 | | | | | | 1.26 | | | | | | 4.16 | | | | | | 81,767 | | | | | | 22 | | |
| 12-31-16 | | | | | 9.82 | | | | | | 0.42• | | | | | | 1.05 | | | | | | 1.47 | | | | | | 0.67 | | | | | | — | | | | | | — | | | | | | 0.67 | | | | | | — | | | | | | 10.62 | | | | |
|
15.26
|
| | | | | 1.43 | | | | | | 1.36 | | | | | | 1.36 | | | | | | 4.14 | | | | | | 72,064 | | | | | | 42 | | |
| 12-31-15 | | | | | 11.03 | | | | | | 0.40• | | | | | | (1.11) | | | | | | (0.71) | | | | | | 0.50 | | | | | | — | | | | | | — | | | | | | 0.50 | | | | | | — | | | | | | 9.82 | | | | |
|
(6.72)
|
| | | | | 1.52 | | | | | | 1.37 | | | | | | 1.37 | | | | | | 3.80 | | | | | | 68,152 | | | | | | 18 | | |
| Class I | | | | | | | | | | | | | | | | | | | | | | | | | | | | | | | | | | | | | | | | | | | | | | | | | | | | | | | | | | | | | | | | | | | | | | | | | | | | | | | | | | | | | | | | | | | | | | | | | | | | | | | |
| 12-31-19 | | | | | 10.50 | | | | | | 0.38• | | | | | | 1.55 | | | | | | 1.93 | | | | | | 0.57 | | | | | | 0.67 | | | | | | — | | | | | | 1.24 | | | | | | — | | | | | | 11.19 | | | | |
|
18.73
|
| | | | | 0.66 | | | | | | 0.62 | | | | | | 0.62 | | | | | | 3.38 | | | | | | 8,836 | | | | | | 231 | | |
| 12-31-18 | | | | | 11.65 | | | | | | 0.51• | | | | | | (1.03) | | | | | | (0.52) | | | | | | 0.63 | | | | | | — | | | | | | — | | | | | | 0.63 | | | | | | — | | | | | | 10.50 | | | | |
|
(4.79)
|
| | | | | 0.79 | | | | | | 0.66 | | | | | | 0.66 | | | | | | 4.51 | | | | | | 7,921 | | | | | | 45 | | |
| 12-31-17 | | | | | 11.05 | | | | | | 0.54• | | | | | | 0.60 | | | | | | 1.14 | | | | | | 0.54 | | | | | | — | | | | | | — | | | | | | 0.54 | | | | | | — | | | | | | 11.65 | | | | |
|
10.56
|
| | | | | 0.79 | | | | | | 0.66 | | | | | | 0.66 | | | | | | 4.76 | | | | | | 9,393 | | | | | | 22 | | |
| 12-31-16 | | | | | 10.18 | | | | | | 0.50• | | | | | | 1.09 | | | | | | 1.59 | | | | | | 0.72 | | | | | | — | | | | | | — | | | | | | 0.72 | | | | | | — | | | | | | 11.05 | | | | |
|
16.02
|
| | | | | 0.78 | | | | | | 0.76 | | | | | | 0.76 | | | | | | 4.74 | | | | | | 9,478 | | | | | | 42 | | |
| 12-31-15 | | | | | 11.43 | | | | | | 0.47• | | | | | | (1.16) | | | | | | (0.69) | | | | | | 0.56 | | | | | | — | | | | | | — | | | | | | 0.56 | | | | | | — | | | | | | 10.18 | | | | |
|
(6.34)
|
| | | | | 0.77 | | | | | | 0.77 | | | | | | 0.77 | | | | | | 4.11 | | | | | | 9,222 | | | | | | 18 | | |
| Class S | | | | | | | | | | | | | | | | | | | | | | | | | | | | | | | | | | | | | | | | | | | | | | | | | | | | | | | | | | | | | | | | | | | | | | | | | | | | | | | | | | | | | | | | | | | | | | | | | | | | | | | |
| 12-31-19 | | | | | 10.45 | | | | | | 0.36• | | | | | | 1.52 | | | | | | 1.88 | | | | | | 0.53 | | | | | | 0.67 | | | | | | — | | | | | | 1.20 | | | | | | — | | | | | | 11.13 | | | | |
|
18.40
|
| | | | | 0.91 | | | | | | 0.87 | | | | | | 0.87 | | | | | | 3.18 | | | | | | 295,942 | | | | | | 231 | | |
| 12-31-18 | | | | | 11.59 | | | | | | 0.48• | | | | | | (1.02) | | | | | | (0.54) | | | | | | 0.60 | | | | | | — | | | | | | — | | | | | | 0.60 | | | | | | — | | | | | | 10.45 | | | | |
|
(5.01)
|
| | | | | 1.04 | | | | | | 0.91 | | | | | | 0.91 | | | | | | 4.26 | | | | | | 285,793 | | | | | | 45 | | |
| 12-31-17 | | | | | 10.99 | | | | | | 0.51• | | | | | | 0.60 | | | | | | 1.11 | | | | | | 0.51 | | | | | | — | | | | | | — | | | | | | 0.51 | | | | | | — | | | | | | 11.59 | | | | |
|
10.33
|
| | | | | 1.04 | | | | | | 0.91 | | | | | | 0.91 | | | | | | 4.52 | | | | | | 361,336 | | | | | | 22 | | |
| 12-31-16 | | | | | 10.14 | | | | | | 0.47• | | | | | | 1.09 | | | | | | 1.56 | | | | | | 0.71 | | | | | | — | | | | | | — | | | | | | 0.71 | | | | | | — | | | | | | 10.99 | | | | |
|
15.68
|
| | | | | 1.03 | | | | | | 1.01 | | | | | | 1.01 | | | | | | 4.49 | | | | | | 411,297 | | | | | | 42 | | |
| 12-31-15 | | | | | 11.35 | | | | | | 0.45• | | | | | | (1.13) | | | | | | (0.68) | | | | | | 0.53 | | | | | | — | | | | | | — | | | | | | 0.53 | | | | | | — | | | | | | 10.14 | | | | |
|
(6.31)
|
| | | | | 1.02 | | | | | | 1.02 | | | | | | 1.02 | | | | | | 4.14 | | | | | | 414,907 | | | | | | 18 | | |
| Class S2 | | | | | | | | | | | | | | | | | | | | | | | | | | | | | | | | | | | | | | | | | | | | | | | | | | | | | | | | | | | | | | | | | | | | | | | | | | | | | | | | | | | | | | | | | | | | | | | | | | | | | | | |
| 12-31-19 | | | | | 10.43 | | | | | | 0.32 | | | | | | 1.54 | | | | | | 1.86 | | | | | | 0.52 | | | | | | 0.67 | | | | | | — | | | | | | 1.19 | | | | | | — | | | | | | 11.10 | | | | |
|
18.15
|
| | | | | 1.06 | | | | | | 1.02 | | | | | | 1.02 | | | | | | 2.97 | | | | | | 5,679 | | | | | | 231 | | |
| 12-31-18 | | | | | 11.56 | | | | | | 0.46• | | | | | | (1.02) | | | | | | (0.56) | | | | | | 0.57 | | | | | | — | | | | | | — | | | | | | 0.57 | | | | | | — | | | | | | 10.43 | | | | |
|
(5.15)
|
| | | | | 1.19 | | | | | | 1.06 | | | | | | 1.06 | | | | | | 4.11 | | | | | | 4,647 | | | | | | 45 | | |
| 12-31-17 | | | | | 10.96 | | | | | | 0.50• | | | | | | 0.59 | | | | | | 1.09 | | | | | | 0.49 | | | | | | — | | | | | | — | | | | | | 0.49 | | | | | | — | | | | | | 11.56 | | | | |
|
10.16
|
| | | | | 1.19 | | | | | | 1.06 | | | | | | 1.06 | | | | | | 4.38 | | | | | | 5,389 | | | | | | 22 | | |
| 12-31-16 | | | | | 10.11 | | | | | | 0.45• | | | | | | 1.09 | | | | | | 1.54 | | | | | | 0.69 | | | | | | — | | | | | | — | | | | | | 0.69 | | | | | | — | | | | | | 10.96 | | | | |
|
15.52
|
| | | | | 1.21 | | | | | | 1.16 | | | | | | 1.16 | | | | | | 4.34 | | | | | | 7,701 | | | | | | 42 | | |
| 12-31-15 | | | | | 11.32 | | | | | | 0.44• | | | | | | (1.15) | | | | | | (0.71) | | | | | | 0.50 | | | | | | — | | | | | | — | | | | | | 0.50 | | | | | | — | | | | | | 10.11 | | | | |
|
(6.51)
|
| | | | | 1.27 | | | | | | 1.17 | | | | | | 1.17 | | | | | | 3.99 | | | | | | 7,770 | | | | | | 18 | | |
|
Voya High Yield Portfolio
|
| | | | | | | | | | | | | | | | | | | | | | | | | | | | | | | | | | | | | | | | | | | | | | | | | | | | | | | | | | | | | | | | | | | | | | | | | | | | | | | | | | | | | | | | | | | | | | | | | | | | | | |
| Class ADV | | | | | | | | | | | | | | | | | | | | | | | | | | | | | | | | | | | | | | | | | | | | | | | | | | | | | | | | | | | | | | | | | | | | | | | | | | | | | | | | | | | | | | | | | | | | | | | | | | | | | | | |
| 12-31-19 | | | | | 9.09 | | | | | | 0.50 | | | | | | 0.83 | | | | | | 1.33 | | | | | | 0.48 | | | | | | — | | | | | | — | | | | | | 0.48 | | | | | | — | | | | | | 9.94 | | | | |
|
14.82
|
| | | | | 1.10 | | | | | | 1.08 | | | | | | 1.08 | | | | | | 5.20 | | | | | | 87,540 | | | | | | 59 | | |
| 12-31-18 | | | | | 9.94 | | | | | | 0.48 | | | | | | (0.81) | | | | | | (0.33) | | | | | | 0.52 | | | | | | — | | | | | | — | | | | | | 0.52 | | | | | | — | | | | | | 9.09 | | | | |
|
(3.53)
|
| | | | | 1.10 | | | | | | 1.08 | | | | | | 1.08 | | | | | | 5.02 | | | | | | 80,872 | | | | | | 35 | | |
| 12-31-17 | | | | | 10.01 | | | | | | 0.54 | | | | | | 0.03 | | | | | | 0.57 | | | | | | 0.62 | | | | | | — | | | | | | 0.02 | | | | | | 0.64 | | | | | | — | | | | | | 9.94 | | | | |
|
5.83
|
| | | | | 1.10 | | | | | | 1.08 | | | | | | 1.08 | | | | | | 5.36 | | | | | | 96,011 | | | | | | 37 | | |
| 12-31-16 | | | | | 9.33 | | | | | | 0.55 | | | | | | 0.74 | | | | | | 1.29 | | | | | | 0.61 | | | | | | — | | | | | | — | | | | | | 0.61 | | | | | | — | | | | | | 10.01 | | | | |
|
14.21
|
| | | | | 1.14 | | | | | | 1.08 | | | | | | 1.08 | | | | | | 5.56 | | | | | | 98,835 | | | | | | 31 | | |
| 12-31-15 | | | | | 10.10 | | | | | | 0.56• | | | | | | (0.78) | | | | | | (0.22) | | | | | | 0.55 | | | | | | — | | | | | | — | | | | | | 0.55 | | | | | | — | | | | | | 9.33 | | | | |
|
(2.35)
|
| | | | | 1.24 | | | | | | 1.08 | | | | | | 1.08 | | | | | | 5.57 | | | | | | 94,398 | | | | | | 33 | | |
| Class I | | | | | | | | | | | | | | | | | | | | | | | | | | | | | | | | | | | | | | | | | | | | | | | | | | | | | | | | | | | | | | | | | | | | | | | | | | | | | | | | | | | | | | | | | | | | | | | | | | | | | | | |
| 12-31-19 | | | | | 9.10 | | | | | | 0.57• | | | | | | 0.81 | | | | | | 1.38 | | | | | | 0.54 | | | | | | — | | | | | | — | | | | | | 0.54 | | | | | | — | | | | | | 9.94 | | | | |
|
15.37
|
| | | | | 0.50 | | | | | | 0.48 | | | | | | 0.48 | | | | | | 5.84 | | | | | | 189,247 | | | | | | 59 | | |
| 12-31-18 | | | | | 9.95 | | | | | | 0.54 | | | | | | (0.82) | | | | | | (0.28) | | | | | | 0.57 | | | | | | — | | | | | | — | | | | | | 0.57 | | | | | | — | | | | | | 9.10 | | | | |
|
(2.96)
|
| | | | | 0.50 | | | | | | 0.48 | | | | | | 0.48 | | | | | | 5.62 | | | | | | 56,385 | | | | | | 35 | | |
| 12-31-17 | | | | | 10.01 | | | | | | 0.60 | | | | | | 0.04 | | | | | | 0.64 | | | | | | 0.68 | | | | | | — | | | | | | 0.02 | | | | | | 0.70 | | | | | | — | | | | | | 9.95 | | | | |
|
6.58
|
| | | | | 0.50 | | | | | | 0.48 | | | | | | 0.48 | | | | | | 5.96 | | | | | | 62,380 | | | | | | 37 | | |
| 12-31-16 | | | | | 9.33 | | | | | | 0.60• | | | | | | 0.75 | | | | | | 1.35 | | | | | | 0.67 | | | | | | — | | | | | | — | | | | | | 0.67 | | | | | | — | | | | | | 10.01 | | | | |
|
14.89
|
| | | | | 0.49 | | | | | | 0.48 | | | | | | 0.48 | | | | | | 6.16 | | | | | | 57,828 | | | | | | 31 | | |
| 12-31-15 | | | | | 10.11 | | | | | | 0.60 | | | | | | (0.77) | | | | | | (0.17) | | | | | | 0.61 | | | | | | — | | | | | | — | | | | | | 0.61 | | | | | | — | | | | | | 9.33 | | | | |
|
(1.86)
|
| | | | | 0.49 | | | | | | 0.48 | | | | | | 0.48 | | | | | | 6.18 | | | | | | 63,622 | | | | | | 33 | | |
| | | | | | | | | |
Income
(loss) from investment operations |
| | | | | | | |
Less
Distributions |
| | | | |
Ratios to average
net assets |
| |
Supplemental
Data |
| |||||||||||||||||||||||||||||||||||||||||||||||||||||||||||||||||||||||||||
| | | | Net asset value, beginning of year or period |
| | Net investment income (loss) | | | Net realized and unrealized gain (loss) |
| | Total from investment operations | | | From net investment income | | | From net realized gains | | | From return of capital | | | Total distributions | | | Payment by affiliate | | | Net asset value, end of year or period |
| |
Total Return(1)
|
| | Expenses before reductions/additions(2)(3)(4) |
| | Expenses net of fee waivers and/or recoupments if any(2)(3)(4) |
| | Expense net of all reductions/additions(2)(3)(4) |
| | Net investment income (loss)(2)(3) | | | Net assets, end of year or period | | | Portfolio turnover rate | | |||||||||||||||||||||||||||||||||||||||||||||||||||
| Year or period ended |
| |
($)
|
| |
($)
|
| |
($)
|
| |
($)
|
| |
($)
|
| |
($)
|
| |
($)
|
| |
($)
|
| |
($)
|
| |
($)
|
| |
(%)
|
| |
(%)
|
| |
(%)
|
| |
(%)
|
| |
(%)
|
| |
($000’s)
|
| |
(%)
|
| |||||||||||||||||||||||||||||||||||||||||||||||||||
|
Voya High Yield Portfolio (continued)
|
| | | | | | | | | | | | | | | | | | | | | | | | | | | | | | | | | | | | | | | | | | | | | | | | | | | | | | | | | | | | | | | | | | | | | | | | | | | | | | | | | | | | | | | | | | | | | | | | | | | | | | |
| Class S | | | | | | | | | | | | | | | | | | | | | | | | | | | | | | | | | | | | | | | | | | | | | | | | | | | | | | | | | | | | | | | | | | | | | | | | | | | | | | | | | | | | | | | | | | | | | | | | | | | | | | | |
| 12-31-19 | | | | | 9.09 | | | | | | 0.54 | | | | | | 0.82 | | | | | | 1.36 | | | | | | 0.51 | | | | | | — | | | | | | — | | | | | | 0.51 | | | | | | — | | | | | | 9.94 | | | | |
|
15.22
|
| | | | | 0.75 | | | | | | 0.73 | | | | | | 0.73 | | | | | | 5.54 | | | | | | 307,506 | | | | | | 59 | | |
| 12-31-18 | | | | | 9.94 | | | | | | 0.51 | | | | | | (0.81) | | | | | | (0.30) | | | | | | 0.55 | | | | | | — | | | | | | — | | | | | | 0.55 | | | | | | — | | | | | | 9.09 | | | | |
|
(3.20)
|
| | | | | 0.75 | | | | | | 0.73 | | | | | | 0.73 | | | | | | 5.36 | | | | | | 332,669 | | | | | | 35 | | |
| 12-31-17 | | | | | 10.01 | | | | | | 0.58 | | | | | | 0.02 | | | | | | 0.60 | | | | | | 0.65 | | | | | | — | | | | | | 0.02 | | | | | | 0.67 | | | | | | — | | | | | | 9.94 | | | | |
|
6.20
|
| | | | | 0.75 | | | | | | 0.73 | | | | | | 0.73 | | | | | | 5.71 | | | | | | 403,630 | | | | | | 37 | | |
| 12-31-16 | | | | | 9.33 | | | | | | 0.58 | | | | | | 0.75 | | | | | | 1.33 | | | | | | 0.65 | | | | | | — | | | | | | — | | | | | | 0.65 | | | | | | — | | | | | | 10.01 | | | | |
|
14.61
|
| | | | | 0.74 | | | | | | 0.73 | | | | | | 0.73 | | | | | | 5.91 | | | | | | 484,963 | | | | | | 31 | | |
| 12-31-15 | | | | | 10.10 | | | | | | 0.59• | | | | | | (0.77) | | | | | | (0.18) | | | | | | 0.59 | | | | | | — | | | | | | — | | | | | | 0.59 | | | | | | — | | | | | | 9.33 | | | | |
|
(2.01)
|
| | | | | 0.74 | | | | | | 0.73 | | | | | | 0.73 | | | | | | 5.91 | | | | | | 472,161 | | | | | | 33 | | |
| Class S2 | | | | | | | | | | | | | | | | | | | | | | | | | | | | | | | | | | | | | | | | | | | | | | | | | | | | | | | | | | | | | | | | | | | | | | | | | | | | | | | | | | | | | | | | | | | | | | | | | | | | | | | |
| 12-31-19 | | | | | 9.11 | | | | | | 0.51 | | | | | | 0.83 | | | | | | 1.34 | | | | | | 0.50 | | | | | | — | | | | | | — | | | | | | 0.50 | | | | | | — | | | | | | 9.95 | | | | |
|
14.91
|
| | | | | 0.90 | | | | | | 0.88 | | | | | | 0.88 | | | | | | 5.37 | | | | | | 3,012 | | | | | | 59 | | |
| 12-31-18 | | | | | 9.95 | | | | | | 0.50 | | | | | | (0.80) | | | | | | (0.30) | | | | | | 0.54 | | | | | | — | | | | | | — | | | | | | 0.54 | | | | | | — | | | | | | 9.11 | | | | |
|
(3.23)
|
| | | | | 0.90 | | | | | | 0.88 | | | | | | 0.88 | | | | | | 5.20 | | | | | | 4,226 | | | | | | 35 | | |
| 12-31-17 | | | | | 10.02 | | | | | | 0.56 | | | | | | 0.03 | | | | | | 0.59 | | | | | | 0.64 | | | | | | — | | | | | | 0.02 | | | | | | 0.66 | | | | | | — | | | | | | 9.95 | | | | |
|
6.04
|
| | | | | 0.90 | | | | | | 0.88 | | | | | | 0.88 | | | | | | 5.56 | | | | | | 5,792 | | | | | | 37 | | |
| 12-31-16 | | | | | 9.34 | | | | | | 0.56 | | | | | | 0.75 | | | | | | 1.31 | | | | | | 0.63 | | | | | | — | | | | | | — | | | | | | 0.63 | | | | | | — | | | | | | 10.02 | | | | |
|
14.43
|
| | | | | 0.92 | | | | | | 0.88 | | | | | | 0.88 | | | | | | 5.76 | | | | | | 5,815 | | | | | | 31 | | |
| 12-31-15 | | | | | 10.11 | | | | | | 0.58• | | | | | | (0.77) | | | | | | (0.19) | | | | | | 0.58 | | | | | | — | | | | | | — | | | | | | 0.58 | | | | | | — | | | | | | 9.34 | | | | |
|
(2.15)
|
| | | | | 0.99 | | | | | | 0.88 | | | | | | 0.88 | | | | | | 5.76 | | | | | | 5,327 | | | | | | 33 | | |
|
Voya Large Cap Growth Portfolio
|
| | | | | | | | | | | | | | | | | | | | | | | | | | | | | | | | | | | | | | | | | | | | | | | | | | | | | | | | | | | | | | | | | | | | | | | | | | | | | | | | | | | | | | | | | | | | | | | | | | | | | | |
| Class ADV | | | | | | | | | | | | | | | | | | | | | | | | | | | | | | | | | | | | | | | | | | | | | | | | | | | | | | | | | | | | | | | | | | | | | | | | | | | | | | | | | | | | | | | | | | | | | | | | | | | | | | | |
| 12-31-19 | | | | | 16.37 | | | | | | (0.01) | | | | | | 4.97 | | | | | | 4.96 | | | | | | 0.02 | | | | | | 3.35 | | | | | | — | | | | | | 3.37 | | | | | | — | | | | | | 17.96 | | | | |
|
31.90
|
| | | | | 1.27 | | | | | | 1.27 | | | | | | 1.27 | | | | | | (0.05) | | | | | | 1,890,631 | | | | | | 78 | | |
| 12-31-18 | | | | | 19.36 | | | | | | 0.01 | | | | | | (0.11) | | | | | | (0.10) | | | | | | 0.01 | | | | | | 2.88 | | | | | | — | | | | | | 2.89 | | | | | | — | | | | | | 16.37 | | | | |
|
(2.07)
|
| | | | | 1.27 | | | | | | 1.27 | | | | | | 1.27 | | | | | | 0.04 | | | | | | 1,686,805 | | | | | | 85 | | |
| 12-31-17 | | | | | 16.22 | | | | | | 0.02 | | | | | | 4.53 | | | | | | 4.55 | | | | | | 0.01 | | | | | | 1.40 | | | | | | — | | | | | | 1.41 | | | | | | — | | | | | | 19.36 | | | | |
|
29.01
|
| | | | | 1.27 | | | | | | 1.27 | | | | | | 1.27 | | | | | | 0.04 | | | | | | 2,015,843 | | | | | | 65 | | |
| 12-31-16 | | | | | 18.13 | | | | | | 0.01 | | | | | | 0.57 | | | | | | 0.58 | | | | | | — | | | | | | 2.49 | | | | | | — | | | | | | 2.49 | | | | | | — | | | | | | 16.22 | | | | |
|
3.33
|
| | | | | 1.32 | | | | | | 1.27 | | | | | | 1.27 | | | | | | 0.08 | | | | | | 1,986,387 | | | | | | 74 | | |
| 12-31-15 | | | | | 19.04 | | | | | | (0.01) | | | | | | 1.12 | | | | | | 1.11 | | | | | | 0.00* | | | | | | 2.02 | | | | | | — | | | | | | 2.02 | | | | | | — | | | | | | 18.13 | | | | |
|
5.72
|
| | | | | 1.42 | | | | | | 1.24 | | | | | | 1.24 | | | | | | (0.05) | | | | | | 2,244,745 | | | | | | 70 | | |
| Class I | | | | | | | | | | | | | | | | | | | | | | | | | | | | | | | | | | | | | | | | | | | | | | | | | | | | | | | | | | | | | | | | | | | | | | | | | | | | | | | | | | | | | | | | | | | | | | | | | | | | | | | |
| 12-31-19 | | | | | 17.78 | | | | | | 0.11 | | | | | | 5.43 | | | | | | 5.54 | | | | | | 0.14 | | | | | | 3.35 | | | | | | — | | | | | | 3.49 | | | | | | — | | | | | | 19.83 | | | | |
|
32.77
|
| | | | | 0.67 | | | | | | 0.67 | | | | | | 0.67 | | | | | | 0.54 | | | | | | 2,000,466 | | | | | | 78 | | |
| 12-31-18 | | | | | 20.80 | | | | | | 0.13• | | | | | | (0.13) | | | | | | 0.00* | | | | | | 0.14 | | | | | | 2.88 | | | | | | — | | | | | | 3.02 | | | | | | — | | | | | | 17.78 | | | | |
|
(1.48)
|
| | | | | 0.67 | | | | | | 0.67 | | | | | | 0.67 | | | | | | 0.63 | | | | | | 1,623,952 | | | | | | 85 | | |
| 12-31-17 | | | | | 17.34 | | | | | | 0.12 | | | | | | 4.87 | | | | | | 4.99 | | | | | | 0.13 | | | | | | 1.40 | | | | | | — | | | | | | 1.53 | | | | | | — | | | | | | 20.80 | | | | |
|
29.74
|
| | | | | 0.67 | | | | | | 0.67 | | | | | | 0.67 | | | | | | 0.63 | | | | | | 2,124,109 | | | | | | 65 | | |
| 12-31-16 | | | | | 19.21 | | | | | | 0.13 | | | | | | 0.60 | | | | | | 0.73 | | | | | | 0.11 | | | | | | 2.49 | | | | | | — | | | | | | 2.60 | | | | | | — | | | | | | 17.34 | | | | |
|
3.96
|
| | | | | 0.67 | | | | | | 0.67 | | | | | | 0.67 | | | | | | 0.68 | | | | | | 1,769,295 | | | | | | 74 | | |
| 12-31-15 | | | | | 20.05 | | | | | | 0.11 | | | | | | 1.19 | | | | | | 1.30 | | | | | | 0.12 | | | | | | 2.02 | | | | | | — | | | | | | 2.14 | | | | | | — | | | | | | 19.21 | | | | |
|
6.38
|
| | | | | 0.67 | | | | | | 0.64 | | | | | | 0.64 | | | | | | 0.55 | | | | | | 1,876,362 | | | | | | 70 | | |
| Class R6 | | | | | | | | | | | | | | | | | | | | | | | | | | | | | | | | | | | | | | | | | | | | | | | | | | | | | | | | | | | | | | | | | | | | | | | | | | | | | | | | | | | | | | | | | | | | | | | | | | | | | | | |
| 12-31-19 | | | | | 17.78 | | | | | | 0.11 | | | | | | 5.44 | | | | | | 5.55 | | | | | | 0.14 | | | | | | 3.35 | | | | | | — | | | | | | 3.49 | | | | | | — | | | | | | 19.84 | | | | |
|
32.82
|
| | | | | 0.67 | | | | | | 0.67 | | | | | | 0.67 | | | | | | 0.54 | | | | | | 59,938 | | | | | | 78 | | |
| 12-31-18 | | | | | 20.81 | | | | | | 0.12 | | | | | | (0.13) | | | | | | (0.01) | | | | | | 0.14 | | | | | | 2.88 | | | | | | — | | | | | | 3.02 | | | | | | — | | | | | | 17.78 | | | | |
|
(1.53)
|
| | | | | 0.67 | | | | | | 0.67 | | | | | | 0.67 | | | | | | 0.68 | | | | | | 46,242 | | | | | | 85 | | |
| 12-31-17 | | | | | 17.34 | | | | | | 0.13• | | | | | | 4.87 | | | | | | 5.00 | | | | | | 0.13 | | | | | | 1.40 | | | | | | — | | | | | | 1.53 | | | | | | — | | | | | | 20.81 | | | | |
|
29.80
|
| | | | | 0.67 | | | | | | 0.67 | | | | | | 0.67 | | | | | | 0.65 | | | | | | 33,736 | | | | | | 65 | | |
| 12-31-16 | | | | | 19.21 | | | | | | 0.13• | | | | | | 0.60 | | | | | | 0.73 | | | | | | 0.11 | | | | | | 2.49 | | | | | | — | | | | | | 2.60 | | | | | | — | | | | | | 17.34 | | | | |
|
3.95
|
| | | | | 0.67 | | | | | | 0.67 | | | | | | 0.67 | | | | | | 0.77 | | | | | | 6,970 | | | | | | 74 | | |
| 11-24-15(5) - 12-31-15 |
| | | | 19.47 | | | | | | 0.02• | | | | | | (0.28) | | | | | | (0.26) | | | | | | — | | | | | | — | | | | | | — | | | | | | — | | | | | | — | | | | | | 19.21 | | | | |
|
(1.34)
|
| | | | | 0.67 | | | | | | 0.67 | | | | | | 0.67 | | | | | | 1.02 | | | | | | 3 | | | | | | 70 | | |
| Class S | | | | | | | | | | | | | | | | | | | | | | | | | | | | | | | | | | | | | | | | | | | | | | | | | | | | | | | | | | | | | | | | | | | | | | | | | | | | | | | | | | | | | | | | | | | | | | | | | | | | | | | |
| 12-31-19 | | | | | 17.31 | | | | | | 0.06 | | | | | | 5.27 | | | | | | 5.33 | | | | | | 0.08 | | | | | | 3.35 | | | | | | — | | | | | | 3.43 | | | | | | — | | | | | | 19.21 | | | | |
|
32.41
|
| | | | | 0.92 | | | | | | 0.92 | | | | | | 0.92 | | | | | | 0.30 | | | | | | 1,839,829 | | | | | | 78 | | |
| 12-31-18 | | | | | 20.32 | | | | | | 0.08• | | | | | | (0.13) | | | | | | (0.05) | | | | | | 0.08 | | | | | | 2.88 | | | | | | — | | | | | | 2.96 | | | | | | — | | | | | | 17.31 | | | | |
|
(1.73)
|
| | | | | 0.92 | | | | | | 0.92 | | | | | | 0.92 | | | | | | 0.39 | | | | | | 1,677,848 | | | | | | 85 | | |
| 12-31-17 | | | | | 16.97 | | | | | | 0.07 | | | | | | 4.76 | | | | | | 4.83 | | | | | | 0.08 | | | | | | 1.40 | | | | | | — | | | | | | 1.48 | | | | | | — | | | | | | 20.32 | | | | |
|
29.42
|
| | | | | 0.92 | | | | | | 0.92 | | | | | | 0.92 | | | | | | 0.39 | | | | | | 2,040,159 | | | | | | 65 | | |
| 12-31-16 | | | | | 18.85 | | | | | | 0.08 | | | | | | 0.59 | | | | | | 0.67 | | | | | | 0.06 | | | | | | 2.49 | | | | | | — | | | | | | 2.55 | | | | | | — | | | | | | 16.97 | | | | |
|
3.69
|
| | | | | 0.92 | | | | | | 0.92 | | | | | | 0.92 | | | | | | 0.43 | | | | | | 2,014,562 | | | | | | 74 | | |
| 12-31-15 | | | | | 19.72 | | | | | | 0.06• | | | | | | 1.16 | | | | | | 1.22 | | | | | | 0.07 | | | | | | 2.02 | | | | | | — | | | | | | 2.09 | | | | | | — | | | | | | 18.85 | | | | |
|
6.11
|
| | | | | 0.92 | | | | | | 0.89 | | | | | | 0.89 | | | | | | 0.30 | | | | | | 2,077,008 | | | | | | 70 | | |
| | | | | | | | | |
Income
(loss) from investment operations |
| | | | | | | |
Less
Distributions |
| | | | |
Ratios to average
net assets |
| |
Supplemental
Data |
| |||||||||||||||||||||||||||||||||||||||||||||||||||||||||||||||||||||||||||
| | | | Net asset value, beginning of year or period |
| | Net investment income (loss) | | | Net realized and unrealized gain (loss) |
| | Total from investment operations | | | From net investment income | | | From net realized gains | | | From return of capital | | | Total distributions | | | Payment by affiliate | | | Net asset value, end of year or period |
| |
Total Return(1)
|
| | Expenses before reductions/additions(2)(3)(4) |
| | Expenses net of fee waivers and/or recoupments if any(2)(3)(4) |
| | Expense net of all reductions/additions(2)(3)(4) |
| | Net investment income (loss)(2)(3) | | | Net assets, end of year or period | | | Portfolio turnover rate | | |||||||||||||||||||||||||||||||||||||||||||||||||||
| Year or period ended |
| |
($)
|
| |
($)
|
| |
($)
|
| |
($)
|
| |
($)
|
| |
($)
|
| |
($)
|
| |
($)
|
| |
($)
|
| |
($)
|
| |
(%)
|
| |
(%)
|
| |
(%)
|
| |
(%)
|
| |
(%)
|
| |
($000’s)
|
| |
(%)
|
| |||||||||||||||||||||||||||||||||||||||||||||||||||
|
Voya Large Cap Growth Portfolio (continued)
|
| | | | | | | | | | | | | | | | | | | | | | | | | | | | | | | | | | | | | | | | | | | | | | | | | | | | | | | | | | | | | | | | | | | | | | | | | | | | | | | | | | | | | | | | | | | | | | | | | | | | | | |
| Class S2 | | | | | | | | | | | | | | | | | | | | | | | | | | | | | | | | | | | | | | | | | | | | | | | | | | | | | | | | | | | | | | | | | | | | | | | | | | | | | | | | | | | | | | | | | | | | | | | | | | | | | | | |
| 12-31-19 | | | | | 17.18 | | | | | | 0.04 | | | | | | 5.21 | | | | | | 5.25 | | | | | | 0.05 | | | | | | 3.35 | | | | | | — | | | | | | 3.40 | | | | | | — | | | | | | 19.03 | | | | |
|
32.16
|
| | | | | 1.07 | | | | | | 1.07 | | | | | | 1.07 | | | | | | 0.15 | | | | | | 61,219 | | | | | | 78 | | |
| 12-31-18 | | | | | 20.18 | | | | | | 0.05 | | | | | | (0.12) | | | | | | (0.07) | | | | | | 0.05 | | | | | | 2.88 | | | | | | — | | | | | | 2.93 | | | | | | — | | | | | | 17.18 | | | | |
|
(1.86)
|
| | | | | 1.07 | | | | | | 1.07 | | | | | | 1.07 | | | | | | 0.25 | | | | | | 58,647 | | | | | | 85 | | |
| 12-31-17 | | | | | 16.86 | | | | | | 0.04• | | | | | | 4.73 | | | | | | 4.77 | | | | | | 0.05 | | | | | | 1.40 | | | | | | — | | | | | | 1.45 | | | | | | — | | | | | | 20.18 | | | | |
|
29.22
|
| | | | | 1.07 | | | | | | 1.07 | | | | | | 1.07 | | | | | | 0.24 | | | | | | 66,024 | | | | | | 65 | | |
| 12-31-16 | | | | | 18.73 | | | | | | 0.05 | | | | | | 0.59 | | | | | | 0.64 | | | | | | 0.02 | | | | | | 2.49 | | | | | | — | | | | | | 2.51 | | | | | | — | | | | | | 16.86 | | | | |
|
3.57
|
| | | | | 1.10 | | | | | | 1.07 | | | | | | 1.07 | | | | | | 0.28 | | | | | | 66,897 | | | | | | 74 | | |
| 12-31-15 | | | | | 19.62 | | | | | | 0.03• | | | | | | 1.15 | | | | | | 1.18 | | | | | | 0.05 | | | | | | 2.02 | | | | | | — | | | | | | 2.07 | | | | | | — | | | | | | 18.73 | | | | |
|
5.90
|
| | | | | 1.17 | | | | | | 1.04 | | | | | | 1.04 | | | | | | 0.15 | | | | | | 78,138 | | | | | | 70 | | |
|
Voya Large Cap Value Portfolio
|
| | | | | | | | | | | | | | | | | | | | | | | | | | | | | | | | | | | | | | | | | | | | | | | | | | | | | | | | | | | | | | | | | | | | | | | | | | | | | | | | | | | | | | | | | | | | | | | | | | | | | | |
| Class ADV | | | | | | | | | | | | | | | | | | | | | | | | | | | | | | | | | | | | | | | | | | | | | | | | | | | | | | | | | | | | | | | | | | | | | | | | | | | | | | | | | | | | | | | | | | | | | | | | | | | | | | | |
| 12-31-19 | | | | | 10.48 | | | | | | 0.17 | | | | | | 2.34 | | | | | | 2.51 | | | | | | 0.18 | | | | | | 0.85 | | | | | | — | | | | | | 1.03 | | | | | | — | | | | | | 11.96 | | | | |
|
24.45
|
| | | | | 1.35 | | | | | | 1.24 | | | | | | 1.24 | | | | | | 1.40 | | | | | | 53,098 | | | | | | 95 | | |
| 12-31-18 | | | | | 13.06 | | | | | | 0.18 | | | | | | (1.15) | | | | | | (0.97) | | | | | | 0.17 | | | | | | 1.44 | | | | | | — | | | | | | 1.61 | | | | | | — | | | | | | 10.48 | | | | |
|
(8.33)(a)
|
| | | | | 1.35 | | | | | | 1.24 | | | | | | 1.24 | | | | | | 1.41(b) | | | | | | 49,230 | | | | | | 97 | | |
| 12-31-17 | | | | | 11.79 | | | | | | 0.18• | | | | | | 1.33 | | | | | | 1.51 | | | | | | 0.24 | | | | | | — | | | | | | — | | | | | | 0.24 | | | | | | — | | | | | | 13.06 | | | | |
|
12.84
|
| | | | | 1.35 | | | | | | 1.24 | | | | | | 1.24 | | | | | | 1.44 | | | | | | 61,244 | | | | | | 79 | | |
| 12-31-16 | | | | | 10.94 | | | | | | 0.21 | | | | | | 1.21 | | | | | | 1.42 | | | | | | 0.22 | | | | | | 0.35 | | | | | | — | | | | | | 0.57 | | | | | | — | | | | | | 11.79 | | | | |
|
13.20
|
| | | | | 1.40 | | | | | | 1.24 | | | | | | 1.24 | | | | | | 1.79 | | | | | | 64,578 | | | | | | 118 | | |
| 12-31-15 | | | | | 12.32 | | | | | | 0.16 | | | | | | (0.74) | | | | | | (0.58) | | | | | | 0.16 | | | | | | 0.64 | | | | | | — | | | | | | 0.80 | | | | | | — | | | | | | 10.94 | | | | |
|
(5.06)
|
| | | | | 1.50 | | | | | | 1.24 | | | | | | 1.24 | | | | | | 1.50 | | | | | | 67,001 | | | | | | 83 | | |
| Class I | | | | | | | | | | | | | | | | | | | | | | | | | | | | | | | | | | | | | | | | | | | | | | | | | | | | | | | | | | | | | | | | | | | | | | | | | | | | | | | | | | | | | | | | | | | | | | | | | | | | | | | |
| 12-31-19 | | | | | 10.69 | | | | | | 0.24 | | | | | | 2.39 | | | | | | 2.63 | | | | | | 0.25 | | | | | | 0.85 | | | | | | — | | | | | | 1.10 | | | | | | — | | | | | | 12.22 | | | | |
|
25.12
|
| | | | | 0.75 | | | | | | 0.64 | | | | | | 0.64 | | | | | | 2.00 | | | | | | 367,345 | | | | | | 95 | | |
| 12-31-18 | | | | | 13.30 | | | | | | 0.25• | | | | | | (1.17) | | | | | | (0.92) | | | | | | 0.25 | | | | | | 1.44 | | | | | | — | | | | | | 1.69 | | | | | | — | | | | | | 10.69 | | | | |
|
(7.81)(a)
|
| | | | | 0.75 | | | | | | 0.64 | | | | | | 0.64 | | | | | | 2.01(b) | | | | | | 330,038 | | | | | | 97 | | |
| 12-31-17 | | | | | 12.00 | | | | | | 0.26• | | | | | | 1.36 | | | | | | 1.62 | | | | | | 0.32 | | | | | | — | | | | | | — | | | | | | 0.32 | | | | | | — | | | | | | 13.30 | | | | |
|
13.55
|
| | | | | 0.75 | | | | | | 0.64 | | | | | | 0.64 | | | | | | 2.06 | | | | | | 428,068 | | | | | | 79 | | |
| 12-31-16 | | | | | 11.12 | | | | | | 0.28 | | | | | | 1.23 | | | | | | 1.51 | | | | | | 0.28 | | | | | | 0.35 | | | | | | — | | | | | | 0.63 | | | | | | — | | | | | | 12.00 | | | | |
|
13.89
|
| | | | | 0.75 | | | | | | 0.64 | | | | | | 0.64 | | | | | | 2.39 | | | | | | 572,744 | | | | | | 118 | | |
| 12-31-15 | | | | | 12.50 | | | | | | 0.25• | | | | | | (0.76) | | | | | | (0.51) | | | | | | 0.23 | | | | | | 0.64 | | | | | | — | | | | | | 0.87 | | | | | | — | | | | | | 11.12 | | | | |
|
(4.46)
|
| | | | | 0.75 | | | | | | 0.64 | | | | | | 0.64 | | | | | | 2.09 | | | | | | 560,041 | | | | | | 83 | | |
| Class R6 | | | | | | | | | | | | | | | | | | | | | | | | | | | | | | | | | | | | | | | | | | | | | | | | | | | | | | | | | | | | | | | | | | | | | | | | | | | | | | | | | | | | | | | | | | | | | | | | | | | | | | | |
| 12-31-19 | | | | | 10.68 | | | | | | 0.25• | | | | | | 2.38 | | | | | | 2.63 | | | | | | 0.25 | | | | | | 0.85 | | | | | | — | | | | | | 1.10 | | | | | | — | | | | | | 12.21 | | | | |
|
25.14
|
| | | | | 0.75 | | | | | | 0.64 | | | | | | 0.64 | | | | | | 2.16 | | | | | | 306 | | | | | | 95 | | |
| 12-31-18 | | | | | 13.28 | | | | | | 0.25• | | | | | | (1.16) | | | | | | (0.91) | | | | | | 0.25 | | | | | | 1.44 | | | | | | — | | | | | | 1.69 | | | | | | — | | | | | | 10.68 | | | | |
|
(7.74)(a)
|
| | | | | 0.75 | | | | | | 0.64 | | | | | | 0.64 | | | | | | 2.03(b) | | | | | | 1,182 | | | | | | 97 | | |
| 12-31-17 | | | | | 11.99 | | | | | | 0.26• | | | | | | 1.35 | | | | | | 1.61 | | | | | | 0.32 | | | | | | — | | | | | | — | | | | | | 0.32 | | | | | | — | | | | | | 13.28 | | | | |
|
13.47
|
| | | | | 0.75 | | | | | | 0.64 | | | | | | 0.64 | | | | | | 2.06 | | | | | | 836 | | | | | | 79 | | |
| 12-31-16 | | | | | 11.12 | | | | | | 0.23• | | | | | | 1.27 | | | | | | 1.50 | | | | | | 0.28 | | | | | | 0.35 | | | | | | — | | | | | | 0.63 | | | | | | — | | | | | | 11.99 | | | | |
|
13.80
|
| | | | | 0.75 | | | | | | 0.64 | | | | | | 0.64 | | | | | | 2.01 | | | | | | 550 | | | | | | 118 | | |
| 11-24-15(5) - 12-31-15 |
| | | | 11.59 | | | | | | 0.03• | | | | | | (0.30) | | | | | | (0.27) | | | | | | 0.20 | | | | | | — | | | | | | — | | | | | | 0.20 | | | | | | — | | | | | | 11.12 | | | | |
|
(2.37)
|
| | | | | 0.75 | | | | | | 0.64 | | | | | | 0.64 | | | | | | 2.71 | | | | | | 3 | | | | | | 83 | | |
| Class S | | | | | | | | | | | | | | | | | | | | | | | | | | | | | | | | | | | | | | | | | | | | | | | | | | | | | | | | | | | | | | | | | | | | | | | | | | | | | | | | | | | | | | | | | | | | | | | | | | | | | | | |
| 12-31-19 | | | | | 10.55 | | | | | | 0.20• | | | | | | 2.36 | | | | | | 2.56 | | | | | | 0.22 | | | | | | 0.85 | | | | | | — | | | | | | 1.07 | | | | | | — | | | | | | 12.04 | | | | |
|
24.78
|
| | | | | 1.00 | | | | | | 0.89 | | | | | | 0.89 | | | | | | 1.75 | | | | | | 665,553 | | | | | | 95 | | |
| 12-31-18 | | | | | 13.14 | | | | | | 0.22• | | | | | | (1.15) | | | | | | (0.93) | | | | | | 0.22 | | | | | | 1.44 | | | | | | — | | | | | | 1.66 | | | | | | — | | | | | | 10.55 | | | | |
|
(8.00)(a)
|
| | | | | 1.00 | | | | | | 0.89 | | | | | | 0.89 | | | | | | 1.76(b) | | | | | | 630,221 | | | | | | 97 | | |
| 12-31-17 | | | | | 11.86 | | | | | | 0.23• | | | | | | 1.34 | | | | | | 1.57 | | | | | | 0.29 | | | | | | — | | | | | | — | | | | | | 0.29 | | | | | | — | | | | | | 13.14 | | | | |
|
13.23
|
| | | | | 1.00 | | | | | | 0.89 | | | | | | 0.89 | | | | | | 1.80 | | | | | | 800,421 | | | | | | 79 | | |
| 12-31-16 | | | | | 11.00 | | | | | | 0.24• | | | | | | 1.22 | | | | | | 1.46 | | | | | | 0.25 | | | | | | 0.35 | | | | | | — | | | | | | 0.60 | | | | | | — | | | | | | 11.86 | | | | |
|
13.58
|
| | | | | 1.00 | | | | | | 0.89 | | | | | | 0.89 | | | | | | 2.14 | | | | | | 934,779 | | | | | | 118 | | |
| 12-31-15 | | | | | 12.37 | | | | | | 0.21 | | | | | | (0.74) | | | | | | (0.53) | | | | | | 0.20 | | | | | | 0.64 | | | | | | — | | | | | | 0.84 | | | | | | — | | | | | | 11.00 | | | | |
|
(4.66)
|
| | | | | 1.00 | | | | | | 0.89 | | | | | | 0.89 | | | | | | 1.84 | | | | | | 999,196 | | | | | | 83 | | |
| Class S2 | | | | | | | | | | | | | | | | | | | | | | | | | | | | | | | | | | | | | | | | | | | | | | | | | | | | | | | | | | | | | | | | | | | | | | | | | | | | | | | | | | | | | | | | | | | | | | | | | | | | | | | |
| 12-31-19 | | | | | 10.56 | | | | | | 0.19• | | | | | | 2.36 | | | | | | 2.55 | | | | | | 0.20 | | | | | | 0.85 | | | | | | — | | | | | | 1.05 | | | | | | — | | | | | | 12.06 | | | | |
|
24.63
|
| | | | | 1.15 | | | | | | 1.04 | | | | | | 1.04 | | | | | | 1.60 | | | | | | 145 | | | | | | 95 | | |
| 12-31-18 | | | | | 13.15 | | | | | | 0.20 | | | | | | (1.15) | | | | | | (0.95) | | | | | | 0.20 | | | | | | 1.44 | | | | | | — | | | | | | 1.64 | | | | | | — | | | | | | 10.56 | | | | |
|
(8.12)(a)
|
| | | | | 1.15 | | | | | | 1.04 | | | | | | 1.04 | | | | | | 1.60(b) | | | | | | 151 | | | | | | 97 | | |
| 12-31-17 | | | | | 11.86 | | | | | | 0.20• | | | | | | 1.35 | | | | | | 1.55 | | | | | | 0.26 | | | | | | — | | | | | | — | | | | | | 0.26 | | | | | | — | | | | | | 13.15 | | | | |
|
13.10
|
| | | | | 1.15 | | | | | | 1.04 | | | | | | 1.04 | | | | | | 1.64 | | | | | | 229 | | | | | | 79 | | |
| 12-31-16 | | | | | 11.00 | | | | | | 0.22• | | | | | | 1.22 | | | | | | 1.44 | | | | | | 0.23 | | | | | | 0.35 | | | | | | — | | | | | | 0.58 | | | | | | — | | | | | | 11.86 | | | | |
|
13.40
|
| | | | | 1.18 | | | | | | 1.04 | | | | | | 1.04 | | | | | | 2.00 | | | | | | 537 | | | | | | 118 | | |
| 12-31-15 | | | | | 12.36 | | | | | | 0.20• | | | | | | (0.75) | | | | | | (0.55) | | | | | | 0.17 | | | | | | 0.64 | | | | | | — | | | | | | 0.81 | | | | | | — | | | | | | 11.00 | | | | |
|
(4.82)
|
| | | | | 1.25 | | | | | | 1.04 | | | | | | 1.04 | | | | | | 1.68 | | | | | | 596 | | | | | | 83 | | |
| | | | | | | | | |
Income
(loss) from investment operations |
| | | | | | | |
Less
Distributions |
| | | | |
Ratios to average
net assets |
| |
Supplemental
Data |
| |||||||||||||||||||||||||||||||||||||||||||||||||||||||||||||||||||||||||||
| | | | Net asset value, beginning of year or period |
| | Net investment income (loss) | | | Net realized and unrealized gain (loss) |
| | Total from investment operations | | | From net investment income | | | From net realized gains | | | From return of capital | | | Total distributions | | | Payment by affiliate | | | Net asset value, end of year or period |
| |
Total Return(1)
|
| | Expenses before reductions/additions(2)(3)(4) |
| | Expenses net of fee waivers and/or recoupments if any(2)(3)(4) |
| | Expense net of all reductions/additions(2)(3)(4) |
| | Net investment income (loss)(2)(3) | | | Net assets, end of year or period | | | Portfolio turnover rate | | |||||||||||||||||||||||||||||||||||||||||||||||||||
| Year or period ended |
| |
($)
|
| |
($)
|
| |
($)
|
| |
($)
|
| |
($)
|
| |
($)
|
| |
($)
|
| |
($)
|
| |
($)
|
| |
($)
|
| |
(%)
|
| |
(%)
|
| |
(%)
|
| |
(%)
|
| |
(%)
|
| |
($000’s)
|
| |
(%)
|
| |||||||||||||||||||||||||||||||||||||||||||||||||||
|
Voya Limited Maturity Bond Portfolio
|
| | | | | | | | | | | | | | | | | | | | | | | | | | | | | | | | | | | | | | | | | | | | | | | | | | | | | | | | | | | | | | | | | | | | | | | | | | | | | | | | | | | | | | | | | | | | | | | | | | | | | | |
| Class ADV | | | | | | | | | | | | | | | | | | | | | | | | | | | | | | | | | | | | | | | | | | | | | | | | | | | | | | | | | | | | | | | | | | | | | | | | | | | | | | | | | | | | | | | | | | | | | | | | | | | | | | | |
| 12-31-19 | | | | | 9.68 | | | | | | 0.19 | | | | | | 0.16 | | | | | | 0.35 | | | | | | 0.12 | | | | | | — | | | | | | — | | | | | | 0.12 | | | | | | — | | | | | | 9.91 | | | | |
|
3.66
|
| | | | | 0.89 | | | | | | 0.89 | | | | | | 0.89 | | | | | | 1.85 | | | | | | 15,579 | | | | | | 330 | | |
| 12-31-18 | | | | | 9.72 | | | | | | 0.17 | | | | | | (0.10) | | | | | | 0.07 | | | | | | 0.11 | | | | | | — | | | | | | — | | | | | | 0.11 | | | | | | — | | | | | | 9.68 | | | | |
|
0.71
|
| | | | | 0.89 | | | | | | 0.89 | | | | | | 0.89 | | | | | | 1.67 | | | | | | 16,812 | | | | | | 281 | | |
| 12-31-17 | | | | | 9.76 | | | | | | 0.10 | | | | | | 0.00* | | | | | | 0.10 | | | | | | 0.13 | | | | | | — | | | | | | 0.01 | | | | | | 0.14 | | | | | | — | | | | | | 9.72 | | | | |
|
0.94
|
| | | | | 0.89 | | | | | | 0.89 | | | | | | 0.89 | | | | | | 1.03 | | | | | | 19,695 | | | | | | 305 | | |
| 12-31-16 | | | | | 9.83 | | | | | | 0.09• | | | | | | 0.00* | | | | | | 0.09 | | | | | | 0.16 | | | | | | — | | | | | | — | | | | | | 0.16 | | | | | | — | | | | | | 9.76 | | | | |
|
0.91
|
| | | | | 0.93 | | | | | | 0.88 | | | | | | 0.88 | | | | | | 0.87 | | | | | | 22,864 | | | | | | 174 | | |
| 12-31-15 | | | | | 9.87 | | | | | | 0.06• | | | | | | (0.05) | | | | | | 0.01 | | | | | | 0.05 | | | | | | — | | | | | | — | | | | | | 0.05 | | | | | | — | | | | | | 9.83 | | | | |
|
0.15
|
| | | | | 1.03 | | | | | | 0.88 | | | | | | 0.88 | | | | | | 0.59 | | | | | | 28,178 | | | | | | 325 | | |
| Class I | | | | | | | | | | | | | | | | | | | | | | | | | | | | | | | | | | | | | | | | | | | | | | | | | | | | | | | | | | | | | | | | | | | | | | | | | | | | | | | | | | | | | | | | | | | | | | | | | | | | | | | |
| 12-31-19 | | | | | 9.87 | | | | | | 0.24 | | | | | | 0.19 | | | | | | 0.43 | | | | | | 0.19 | | | | | | — | | | | | | — | | | | | | 0.19 | | | | | | — | | | | | | 10.11 | | | | |
|
4.33
|
| | | | | 0.29 | | | | | | 0.29 | | | | | | 0.29 | | | | | | 2.44 | | | | | | 197,182 | | | | | | 330 | | |
| 12-31-18 | | | | | 9.91 | | | | | | 0.22 | | | | | | (0.09) | | | | | | 0.13 | | | | | | 0.17 | | | | | | — | | | | | | — | | | | | | 0.17 | | | | | | — | | | | | | 9.87 | | | | |
|
1.33
|
| | | | | 0.29 | | | | | | 0.29 | | | | | | 0.29 | | | | | | 2.30 | | | | | | 195,851 | | | | | | 281 | | |
| 12-31-17 | | | | | 9.96 | | | | | | 0.16 | | | | | | (0.01) | | | | | | 0.15 | | | | | | 0.19 | | | | | | — | | | | | | 0.01 | | | | | | 0.20 | | | | | | — | | | | | | 9.91 | | | | |
|
1.45
|
| | | | | 0.29 | | | | | | 0.29 | | | | | | 0.29 | | | | | | 1.63 | | | | | | 188,672 | | | | | | 305 | | |
| 12-31-16 | | | | | 10.09 | | | | | | 0.15• | | | | | | 0.00* | | | | | | 0.15 | | | | | | 0.28 | | | | | | — | | | | | | — | | | | | | 0.28 | | | | | | — | | | | | | 9.96 | | | | |
|
1.53
|
| | | | | 0.28 | | | | | | 0.28 | | | | | | 0.28 | | | | | | 1.46 | | | | | | 170,578 | | | | | | 174 | | |
| 12-31-15 | | | | | 10.13 | | | | | | 0.12• | | | | | | (0.04) | | | | | | 0.08 | | | | | | 0.12 | | | | | | — | | | | | | — | | | | | | 0.12 | | | | | | — | | | | | | 10.09 | | | | |
|
0.82
|
| | | | | 0.28 | | | | | | 0.28 | | | | | | 0.28 | | | | | | 1.20 | | | | | | 162,082 | | | | | | 325 | | |
| Class S | | | | | | | | | | | | | | | | | | | | | | | | | | | | | | | | | | | | | | | | | | | | | | | | | | | | | | | | | | | | | | | | | | | | | | | | | | | | | | | | | | | | | | | | | | | | | | | | | | | | | | | |
| 12-31-19 | | | | | 9.95 | | | | | | 0.22 | | | | | | 0.18 | | | | | | 0.40 | | | | | | 0.16 | | | | | | — | | | | | | — | | | | | | 0.16 | | | | | | — | | | | | | 10.19 | | | | |
|
4.06
|
| | | | | 0.54 | | | | | | 0.54 | | | | | | 0.54 | | | | | | 2.20 | | | | | | 75,066 | | | | | | 330 | | |
| 12-31-18 | | | | | 9.99 | | | | | | 0.20 | | | | | | (0.09) | | | | | | 0.11 | | | | | | 0.15 | | | | | | — | | | | | | — | | | | | | 0.15 | | | | | | — | | | | | | 9.95 | | | | |
|
1.07
|
| | | | | 0.54 | | | | | | 0.54 | | | | | | 0.54 | | | | | | 2.02 | | | | | | 74,885 | | | | | | 281 | | |
| 12-31-17 | | | | | 10.04 | | | | | | 0.14 | | | | | | (0.02) | | | | | | 0.12 | | | | | | 0.16 | | | | | | — | | | | | | 0.01 | | | | | | 0.17 | | | | | | — | | | | | | 9.99 | | | | |
|
1.20
|
| | | | | 0.54 | | | | | | 0.54 | | | | | | 0.54 | | | | | | 1.38 | | | | | | 83,412 | | | | | | 305 | | |
| 12-31-16 | | | | | 10.15 | | | | | | 0.13 | | | | | | 0.00* | | | | | | 0.13 | | | | | | 0.24 | | | | | | — | | | | | | — | | | | | | 0.24 | | | | | | — | | | | | | 10.04 | | | | |
|
1.28
|
| | | | | 0.53 | | | | | | 0.53 | | | | | | 0.53 | | | | | | 1.21 | | | | | | 99,063 | | | | | | 174 | | |
| 12-31-15 | | | | | 10.19 | | | | | | 0.10 | | | | | | (0.04) | | | | | | 0.06 | | | | | | 0.10 | | | | | | — | | | | | | — | | | | | | 0.10 | | | | | | — | | | | | | 10.15 | | | | |
|
0.55
|
| | | | | 0.53 | | | | | | 0.53 | | | | | | 0.53 | | | | | | 0.94 | | | | | | 99,356 | | | | | | 325 | | |
|
Voya U.S. Stock Index Portfolio
|
| | | | | | | | | | | | | | | | | | | | | | | | | | | | | | | | | | | | | | | | | | | | | | | | | | | | | | | | | | | | | | | | | | | | | | | | | | | | | | | | | | | | | | | | | | | | | | | | | | | | | | |
| Class ADV | | | | | | | | | | | | | | | | | | | | | | | | | | | | | | | | | | | | | | | | | | | | | | | | | | | | | | | | | | | | | | | | | | | | | | | | | | | | | | | | | | | | | | | | | | | | | | | | | | | | | | | |
| 12-31-19 | | | | | 13.44 | | | | | | 0.19• | | | | | | 3.82 | | | | | | 4.01 | | | | | | 0.17 | | | | | | 0.90 | | | | | | — | | | | | | 1.07 | | | | | | — | | | | | | 16.38 | | | | |
|
30.43
|
| | | | | 0.80 | | | | | | 0.80 | | | | | | 0.80 | | | | | | 1.22 | | | | | | 102,813 | | | | | | 9 | | |
| 12-31-18 | | | | | 15.19 | | | | | | 0.17• | | | | | | (0.86) | | | | | | (0.69) | | | | | | 0.18 | | | | | | 0.88 | | | | | | — | | | | | | 1.06 | | | | | | — | | | | | | 13.44 | | | | |
|
(5.10)
|
| | | | | 0.80 | | | | | | 0.80 | | | | | | 0.80 | | | | | | 1.14 | | | | | | 92,071 | | | | | | 12 | | |
| 12-31-17 | | | | | 13.38 | | | | | | 0.18 | | | | | | 2.53 | | | | | | 2.71 | | | | | | 0.18 | | | | | | 0.72 | | | | | | — | | | | | | 0.90 | | | | | | — | | | | | | 15.19 | | | | |
|
20.82
|
| | | | | 0.80 | | | | | | 0.80 | | | | | | 0.80 | | | | | | 1.23 | | | | | | 116,091 | | | | | | 6 | | |
| 12-31-16 | | | | | 12.97 | | | | | | 0.19 | | | | | | 1.21 | | | | | | 1.40 | | | | | | 0.20 | | | | | | 0.79 | | | | | | — | | | | | | 0.99 | | | | | | — | | | | | | 13.38 | | | | |
|
11.11
|
| | | | | 0.87 | | | | | | 0.80 | | | | | | 0.80 | | | | | | 1.37 | | | | | | 116,242 | | | | | | 5 | | |
| 12-31-15 | | | | | 14.32 | | | | | | 0.18 | | | | | | (0.07) | | | | | | 0.11 | | | | | | 0.18 | | | | | | 1.28 | | | | | | — | | | | | | 1.46 | | | | | | — | | | | | | 12.97 | | | | |
|
0.54
|
| | | | | 1.01 | | | | | | 0.79 | | | | | | 0.79 | | | | | | 1.33 | | | | | | 119,692 | | | | | | 12 | | |
| Class I | | | | | | | | | | | | | | | | | | | | | | | | | | | | | | | | | | | | | | | | | | | | | | | | | | | | | | | | | | | | | | | | | | | | | | | | | | | | | | | | | | | | | | | | | | | | | | | | | | | | | | | |
| 12-31-19 | | | | | 13.90 | | | | | | 0.26 | | | | | | 3.99 | | | | | | 4.25 | | | | | | 0.26 | | | | | | 0.90 | | | | | | — | | | | | | 1.16 | | | | | | — | | | | | | 16.99 | | | | |
|
31.12
|
| | | | | 0.27 | | | | | | 0.27 | | | | | | 0.27 | | | | | | 1.75 | | | | | | 4,065,091 | | | | | | 9 | | |
| 12-31-18 | | | | | 15.69 | | | | | | 0.26• | | | | | | (0.90) | | | | | | (0.64) | | | | | | 0.27 | | | | | | 0.88 | | | | | | — | | | | | | 1.15 | | | | | | — | | | | | | 13.90 | | | | |
|
(4.62)
|
| | | | | 0.27 | | | | | | 0.27 | | | | | | 0.27 | | | | | | 1.67 | | | | | | 2,966,664 | | | | | | 12 | | |
| 12-31-17 | | | | | 13.79 | | | | | | 0.26• | | | | | | 2.63 | | | | | | 2.89 | | | | | | 0.27 | | | | | | 0.72 | | | | | | — | | | | | | 0.99 | | | | | | — | | | | | | 15.69 | | | | |
|
21.46
|
| | | | | 0.27 | | | | | | 0.27 | | | | | | 0.27 | | | | | | 1.75 | | | | | | 3,469,721 | | | | | | 6 | | |
| 12-31-16 | | | | | 13.34 | | | | | | 0.26 | | | | | | 1.25 | | | | | | 1.51 | | | | | | 0.27 | | | | | | 0.79 | | | | | | — | | | | | | 1.06 | | | | | | — | | | | | | 13.79 | | | | |
|
11.65
|
| | | | | 0.27 | | | | | | 0.27 | | | | | | 0.27 | | | | | | 1.90 | | | | | | 4,195,761 | | | | | | 5 | | |
| 12-31-15 | | | | | 14.68 | | | | | | 0.26• | | | | | | (0.06) | | | | | | 0.20 | | | | | | 0.26 | | | | | | 1.28 | | | | | | — | | | | | | 1.54 | | | | | | — | | | | | | 13.34 | | | | |
|
1.11
|
| | | | | 0.26 | | | | | | 0.26 | | | | | | 0.26 | | | | | | 1.86 | | | | | | 4,149,051 | | | | | | 12 | | |
| Class P2 | | | | | | | | | | | | | | | | | | | | | | | | | | | | | | | | | | | | | | | | | | | | | | | | | | | | | | | | | | | | | | | | | | | | | | | | | | | | | | | | | | | | | | | | | | | | | | | | | | | | | | | |
| 12-31-19 | | | | | 13.93 | | | | | | 0.30• | | | | | | 3.98 | | | | | | 4.28 | | | | | | 0.26 | | | | | | 0.90 | | | | | | — | | | | | | 1.16 | | | | | | — | | | | | | 17.05 | | | | |
|
31.27
|
| | | | | 0.27 | | | | | | 0.15 | | | | | | 0.15 | | | | | | 1.86 | | | | | | 2,395,089 | | | | | | 9 | | |
| 12-31-18 | | | | | 15.71 | | | | | | 0.26 | | | | | | (0.89) | | | | | | (0.63) | | | | | | 0.27 | | | | | | 0.88 | | | | | | — | | | | | | 1.15 | | | | | | — | | | | | | 13.93 | | | | |
|
(4.55)
|
| | | | | 0.27 | | | | | | 0.15 | | | | | | 0.15 | | | | | | 1.80 | | | | | | 1,442,733 | | | | | | 12 | | |
| 05-03-17(5) - 12-31-17 |
| | | | 14.79 | | | | | | 0.19• | | | | | | 1.72 | | | | | | 1.91 | | | | | | 0.27 | | | | | | 0.72 | | | | | | — | | | | | | 0.99 | | | | | | — | | | | | | 15.71 | | | | |
|
13.39
|
| | | | | 0.27 | | | | | | 0.15 | | | | | | 0.15 | | | | | | 1.92 | | | | | | 1,225,483 | | | | | | 6 | | |
| | | | | | | | | |
Income
(loss) from investment operations |
| | | | | | | |
Less
Distributions |
| | | | |
Ratios to average
net assets |
| |
Supplemental
Data |
| |||||||||||||||||||||||||||||||||||||||||||||||||||||||||||||||||||||||||||
| | | | Net asset value, beginning of year or period |
| | Net investment income (loss) | | | Net realized and unrealized gain (loss) |
| | Total from investment operations | | | From net investment income | | | From net realized gains | | | From return of capital | | | Total distributions | | | Payment by affiliate | | | Net asset value, end of year or period |
| |
Total Return(1)
|
| | Expenses before reductions/additions(2)(3)(4) |
| | Expenses net of fee waivers and/or recoupments if any(2)(3)(4) |
| | Expense net of all reductions/additions(2)(3)(4) |
| | Net investment income (loss)(2)(3) | | | Net assets, end of year or period | | | Portfolio turnover rate | | |||||||||||||||||||||||||||||||||||||||||||||||||||
| Year or period ended |
| |
($)
|
| |
($)
|
| |
($)
|
| |
($)
|
| |
($)
|
| |
($)
|
| |
($)
|
| |
($)
|
| |
($)
|
| |
($)
|
| |
(%)
|
| |
(%)
|
| |
(%)
|
| |
(%)
|
| |
(%)
|
| |
($000’s)
|
| |
(%)
|
| |||||||||||||||||||||||||||||||||||||||||||||||||||
|
Voya U.S. Stock Index Portfolio (continued)
|
| | | | | | | | | | | | | | | | | | | | | | | | | | | | | | | | | | | | | | | | | | | | | | | | | | | | | | | | | | | | | | | | | | | | | | | | | | | | | | | | | | | | | | | | | | | | | | | | | | | | | | |
| Class S | | | | | | | | | | | | | | | | | | | | | | | | | | | | | | | | | | | | | | | | | | | | | | | | | | | | | | | | | | | | | | | | | | | | | | | | | | | | | | | | | | | | | | | | | | | | | | | | | | | | | | | |
| 12-31-19 | | | | | 13.80 | | | | | | 0.23• | | | | | | 3.94 | | | | | | 4.17 | | | | | | 0.25 | | | | | | 0.90 | | | | | | — | | | | | | 1.15 | | | | | | — | | | | | | 16.82 | | | | |
|
30.77
|
| | | | | 0.52 | | | | | | 0.51 | | | | | | 0.51 | | | | | | 1.46 | | | | | | 283,768 | | | | | | 9 | | |
| 12-31-18 | | | | | 15.57 | | | | | | 0.22• | | | | | | (0.88) | | | | | | (0.66) | | | | | | 0.23 | | | | | | 0.88 | | | | | | — | | | | | | 1.11 | | | | | | — | | | | | | 13.80 | | | | |
|
(4.84)
|
| | | | | 0.52 | | | | | | 0.51 | | | | | | 0.51 | | | | | | 1.42 | | | | | | 47,740 | | | | | | 12 | | |
| 12-31-17 | | | | | 13.69 | | | | | | 0.21 | | | | | | 2.62 | | | | | | 2.83 | | | | | | 0.23 | | | | | | 0.72 | | | | | | — | | | | | | 0.95 | | | | | | — | | | | | | 15.57 | | | | |
|
21.22
|
| | | | | 0.52 | | | | | | 0.51 | | | | | | 0.51 | | | | | | 1.52 | | | | | | 78,577 | | | | | | 6 | | |
| 12-31-16 | | | | | 13.26 | | | | | | 0.22• | | | | | | 1.25 | | | | | | 1.47 | | | | | | 0.25 | | | | | | 0.79 | | | | | | — | | | | | | 1.04 | | | | | | — | | | | | | 13.69 | | | | |
|
11.35
|
| | | | | 0.52 | | | | | | 0.51 | | | | | | 0.51 | | | | | | 1.66 | | | | | | 61,754 | | | | | | 5 | | |
| 12-31-15 | | | | | 14.59 | | | | | | 0.23• | | | | | | (0.07) | | | | | | 0.16 | | | | | | 0.21 | | | | | | 1.28 | | | | | | — | | | | | | 1.49 | | | | | | — | | | | | | 13.26 | | | | |
|
0.89
|
| | | | | 0.51 | | | | | | 0.50 | | | | | | 0.50 | | | | | | 1.62 | | | | | | 50,470 | | | | | | 12 | | |
| Class S2 | | | | | | | | | | | | | | | | | | | | | | | | | | | | | | | | | | | | | | | | | | | | | | | | | | | | | | | | | | | | | | | | | | | | | | | | | | | | | | | | | | | | | | | | | | | | | | | | | | | | | | | |
| 12-31-19 | | | | | 13.62 | | | | | | 0.21• | | | | | | 3.88 | | | | | | 4.09 | | | | | | 0.19 | | | | | | 0.90 | | | | | | — | | | | | | 1.09 | | | | | | — | | | | | | 16.62 | | | | |
|
30.60
|
| | | | | 0.67 | | | | | | 0.67 | | | | | | 0.67 | | | | | | 1.35 | | | | | | 149,297 | | | | | | 9 | | |
| 12-31-18 | | | | | 15.39 | | | | | | 0.20• | | | | | | (0.88) | | | | | | (0.68) | | | | | | 0.21 | | | | | | 0.88 | | | | | | — | | | | | | 1.09 | | | | | | — | | | | | | 13.62 | | | | |
|
(5.03)
|
| | | | | 0.67 | | | | | | 0.67 | | | | | | 0.67 | | | | | | 1.27 | | | | | | 150,127 | | | | | | 12 | | |
| 12-31-17 | | | | | 13.54 | | | | | | 0.21 | | | | | | 2.56 | | | | | | 2.77 | | | | | | 0.20 | | | | | | 0.72 | | | | | | — | | | | | | 0.92 | | | | | | — | | | | | | 15.39 | | | | |
|
21.03
|
| | | | | 0.67 | | | | | | 0.67 | | | | | | 0.67 | | | | | | 1.35 | | | | | | 189,330 | | | | | | 6 | | |
| 12-31-16 | | | | | 13.12 | | | | | | 0.21 | | | | | | 1.22 | | | | | | 1.43 | | | | | | 0.22 | | | | | | 0.79 | | | | | | — | | | | | | 1.01 | | | | | | — | | | | | | 13.54 | | | | |
|
11.19
|
| | | | | 0.70 | | | | | | 0.67 | | | | | | 0.67 | | | | | | 1.50 | | | | | | 175,340 | | | | | | 5 | | |
| 12-31-15 | | | | | 14.46 | | | | | | 0.20• | | | | | | (0.06) | | | | | | 0.14 | | | | | | 0.20 | | | | | | 1.28 | | | | | | — | | | | | | 1.48 | | | | | | — | | | | | | 13.12 | | | | |
|
0.75
|
| | | | | 0.76 | | | | | | 0.66 | | | | | | 0.66 | | | | | | 1.46 | | | | | | 182,682 | | | | | | 12 | | |
|
VY® Clarion Real Estate Portfolio
|
| | | | | | | | | | | | | | | | | | | | | | | | | | | | | | | | | | | | | | | | | | | | | | | | | | | | | | | | | | | | | | | | | | | | | | | | | | | | | | | | | | | | | | | | | | | | | | | | | | | | | | |
| Class ADV | | | | | | | | | | | | | | | | | | | | | | | | | | | | | | | | | | | | | | | | | | | | | | | | | | | | | | | | | | | | | | | | | | | | | | | | | | | | | | | | | | | | | | | | | | | | | | | | | | | | | | | |
| 12-31-19 | | | | | 29.16 | | | | | | 0.51• | | | | | | 7.53 | | | | | | 8.04 | | | | | | 0.63 | | | | | | 0.18 | | | | | | — | | | | | | 0.81 | | | | | | — | | | | | | 36.39 | | | | |
|
27.71
|
| | | | | 1.46 | | | | | | 1.31 | | | | | | 1.31 | | | | | | 1.49 | | | | | | 63,873 | | | | | | 69 | | |
| 12-31-18 | | | | | 36.01 | | | | | | 0.49• | | | | | | (3.01) | | | | | | (2.52) | | | | | | 0.83 | | | | | | 3.50 | | | | | | — | | | | | | 4.33 | | | | | | — | | | | | | 29.16 | | | | |
|
(7.97)
|
| | | | | 1.47 | | | | | | 1.31 | | | | | | 1.31 | | | | | | 1.50 | | | | | | 56,062 | | | | | | 103 | | |
| 12-31-17 | | | | | 35.00 | | | | | | 0.53• | | | | | | 1.14 | | | | | | 1.67 | | | | | | 0.66 | | | | | | — | | | | | | — | | | | | | 0.66 | | | | | | — | | | | | | 36.01 | | | | |
|
4.82
|
| | | | | 1.45 | | | | | | 1.31 | | | | | | 1.31 | | | | | | 1.50 | | | | | | 75,575 | | | | | | 82 | | |
| 12-31-16 | | | | | 34.11 | | | | | | 0.47• | | | | | | 0.88 | | | | | | 1.35 | | | | | | 0.46 | | | | | | — | | | | | | — | | | | | | 0.46 | | | | | | — | | | | | | 35.00 | | | | |
|
3.86
|
| | | | | 1.49 | | | | | | 1.31 | | | | | | 1.31 | | | | | | 1.33 | | | | | | 90,084 | | | | | | 43 | | |
| 12-31-15 | | | | | 33.65 | | | | | | 0.36• | | | | | | 0.49 | | | | | | 0.85 | | | | | | 0.39 | | | | | | — | | | | | | — | | | | | | 0.39 | | | | | | — | | | | | | 34.11 | | | | |
|
2.58
|
| | | | | 1.59 | | | | | | 1.31 | | | | | | 1.31 | | | | | | 1.08 | | | | | | 90,056 | | | | | | 41 | | |
| Class I | | | | | | | | | | | | | | | | | | | | | | | | | | | | | | | | | | | | | | | | | | | | | | | | | | | | | | | | | | | | | | | | | | | | | | | | | | | | | | | | | | | | | | | | | | | | | | | | | | | | | | | |
| 12-31-19 | | | | | 30.72 | | | | | | 0.68• | | | | | | 8.01 | | | | | | 8.69 | | | | | | 0.85 | | | | | | 0.18 | | | | | | — | | | | | | 1.03 | | | | | | — | | | | | | 38.38 | | | | |
|
28.47
|
| | | | | 0.86 | | | | | | 0.71 | | | | | | 0.71 | | | | | | 1.88 | | | | | | 24,412 | | | | | | 69 | | |
| 12-31-18 | | | | | 37.76 | | | | | | 0.71• | | | | | | (3.15) | | | | | | (2.44) | | | | | | 1.10 | | | | | | 3.50 | | | | | | — | | | | | | 4.60 | | | | | | — | | | | | | 30.72 | | | | |
|
(7.42)
|
| | | | | 0.87 | | | | | | 0.71 | | | | | | 0.71 | | | | | | 2.05 | | | | | | 38,978 | | | | | | 103 | | |
| 12-31-17 | | | | | 36.68 | | | | | | 0.79• | | | | | | 1.19 | | | | | | 1.98 | | | | | | 0.90 | | | | | | — | | | | | | — | | | | | | 0.90 | | | | | | — | | | | | | 37.76 | | | | |
|
5.47
|
| | | | | 0.85 | | | | | | 0.71 | | | | | | 0.71 | | | | | | 2.14 | | | | | | 100,423 | | | | | | 82 | | |
| 12-31-16 | | | | | 35.71 | | | | | | 0.72• | | | | | | 0.92 | | | | | | 1.64 | | | | | | 0.67 | | | | | | — | | | | | | — | | | | | | 0.67 | | | | | | — | | | | | | 36.68 | | | | |
|
4.47
|
| | | | | 0.84 | | | | | | 0.71 | | | | | | 0.71 | | | | | | 1.96 | | | | | | 105,754 | | | | | | 43 | | |
| 12-31-15 | | | | | 35.17 | | | | | | 0.58• | | | | | | 0.52 | | | | | | 1.10 | | | | | | 0.56 | | | | | | — | | | | | | — | | | | | | 0.56 | | | | | | — | | | | | | 35.71 | | | | |
|
3.20
|
| | | | | 0.84 | | | | | | 0.71 | | | | | | 0.71 | | | | | | 1.65 | | | | | | 128,447 | | | | | | 41 | | |
| Class S | | | | | | | | | | | | | | | | | | | | | | | | | | | | | | | | | | | | | | | | | | | | | | | | | | | | | | | | | | | | | | | | | | | | | | | | | | | | | | | | | | | | | | | | | | | | | | | | | | | | | | | |
| 12-31-19 | | | | | 30.67 | | | | | | 0.66• | | | | | | 7.93 | | | | | | 8.59 | | | | | | 0.76 | | | | | | 0.18 | | | | | | — | | | | | | 0.94 | | | | | | — | | | | | | 38.32 | | | | |
|
28.15
|
| | | | | 1.11 | | | | | | 0.96 | | | | | | 0.96 | | | | | | 1.82 | | | | | | 230,346 | | | | | | 69 | | |
| 12-31-18 | | | | | 37.67 | | | | | | 0.63• | | | | | | (3.16) | | | | | | (2.53) | | | | | | 0.97 | | | | | | 3.50 | | | | | | — | | | | | | 4.47 | | | | | | — | | | | | | 30.67 | | | | |
|
(7.65)
|
| | | | | 1.12 | | | | | | 0.96 | | | | | | 0.96 | | | | | | 1.85 | | | | | | 212,673 | | | | | | 103 | | |
| 12-31-17 | | | | | 36.58 | | | | | | 0.68• | | | | | | 1.19 | | | | | | 1.87 | | | | | | 0.78 | | | | | | — | | | | | | — | | | | | | 0.78 | | | | | | — | | | | | | 37.67 | | | | |
|
5.18
|
| | | | | 1.10 | | | | | | 0.96 | | | | | | 0.96 | | | | | | 1.83 | | | | | | 290,716 | | | | | | 82 | | |
| 12-31-16 | | | | | 35.60 | | | | | | 0.61• | | | | | | 0.94 | | | | | | 1.55 | | | | | | 0.57 | | | | | | — | | | | | | — | | | | | | 0.57 | | | | | | — | | | | | | 36.58 | | | | |
|
4.24
|
| | | | | 1.09 | | | | | | 0.96 | | | | | | 0.96 | | | | | | 1.66 | | | | | | 375,761 | | | | | | 43 | | |
| 12-31-15 | | | | | 35.06 | | | | | | 0.48• | | | | | | 0.53 | | | | | | 1.01 | | | | | | 0.47 | | | | | | — | | | | | | — | | | | | | 0.47 | | | | | | — | | | | | | 35.60 | | | | |
|
2.95
|
| | | | | 1.09 | | | | | | 0.96 | | | | | | 0.96 | | | | | | 1.38 | | | | | | 430,712 | | | | | | 41 | | |
| Class S2 | | | | | | | | | | | | | | | | | | | | | | | | | | | | | | | | | | | | | | | | | | | | | | | | | | | | | | | | | | | | | | | | | | | | | | | | | | | | | | | | | | | | | | | | | | | | | | | | | | | | | | | |
| 12-31-19 | | | | | 30.47 | | | | | | 0.60• | | | | | | 7.88 | | | | | | 8.48 | | | | | | 0.70 | | | | | | 0.18 | | | | | | — | | | | | | 0.88 | | | | | | — | | | | | | 38.07 | | | | |
|
27.97
|
| | | | | 1.26 | | | | | | 1.11 | | | | | | 1.11 | | | | | | 1.67 | | | | | | 15,394 | | | | | | 69 | | |
| 12-31-18 | | | | | 37.44 | | | | | | 0.58• | | | | | | (3.14) | | | | | | (2.56) | | | | | | 0.91 | | | | | | 3.50 | | | | | | — | | | | | | 4.41 | | | | | | — | | | | | | 30.47 | | | | |
|
(7.78)
|
| | | | | 1.27 | | | | | | 1.11 | | | | | | 1.11 | | | | | | 1.71 | | | | | | 13,745 | | | | | | 103 | | |
| 12-31-17 | | | | | 36.35 | | | | | | 0.62• | | | | | | 1.18 | | | | | | 1.80 | | | | | | 0.71 | | | | | | — | | | | | | — | | | | | | 0.71 | | | | | | — | | | | | | 37.44 | | | | |
|
5.02
|
| | | | | 1.25 | | | | | | 1.11 | | | | | | 1.11 | | | | | | 1.68 | | | | | | 17,937 | | | | | | 82 | | |
| 12-31-16 | | | | | 35.39 | | | | | | 0.55• | | | | | | 0.93 | | | | | | 1.48 | | | | | | 0.52 | | | | | | — | | | | | | — | | | | | | 0.52 | | | | | | — | | | | | | 36.35 | | | | |
|
4.07
|
| | | | | 1.27 | | | | | | 1.11 | | | | | | 1.11 | | | | | | 1.52 | | | | | | 22,911 | | | | | | 43 | | |
| 12-31-15 | | | | | 34.85 | | | | | | 0.44• | | | | | | 0.51 | | | | | | 0.95 | | | | | | 0.41 | | | | | | — | | | | | | — | | | | | | 0.41 | | | | | | — | | | | | | 35.39 | | | | |
|
2.79
|
| | | | | 1.34 | | | | | | 1.11 | | | | | | 1.11 | | | | | | 1.26 | | | | | | 26,084 | | | | | | 41 | | |
| | | | | | | | | |
Income
(loss) from investment operations |
| | | | | | | |
Less
Distributions |
| | | | |
Ratios to average
net assets |
| |
Supplemental
Data |
| |||||||||||||||||||||||||||||||||||||||||||||||||||||||||||||||||||||||||||
| | | | Net asset value, beginning of year or period |
| | Net investment income (loss) | | | Net realized and unrealized gain (loss) |
| | Total from investment operations | | | From net investment income | | | From net realized gains | | | From return of capital | | | Total distributions | | | Payment by affiliate | | | Net asset value, end of year or period |
| |
Total Return(1)
|
| | Expenses before reductions/additions(2)(3)(4) |
| | Expenses net of fee waivers and/or recoupments if any(2)(3)(4) |
| | Expense net of all reductions/additions(2)(3)(4) |
| | Net investment income (loss)(2)(3) | | | Net assets, end of year or period | | | Portfolio turnover rate | | |||||||||||||||||||||||||||||||||||||||||||||||||||
| Year or period ended |
| |
($)
|
| |
($)
|
| |
($)
|
| |
($)
|
| |
($)
|
| |
($)
|
| |
($)
|
| |
($)
|
| |
($)
|
| |
($)
|
| |
(%)
|
| |
(%)
|
| |
(%)
|
| |
(%)
|
| |
(%)
|
| |
($000’s)
|
| |
(%)
|
| |||||||||||||||||||||||||||||||||||||||||||||||||||
|
VY® JPMorgan Small Cap Core Equity Portfolio
|
| | | | | | | | | | | | | | | | | | | | | | | | | | | | | | | | | | | | | | | | | | | | | | | | | | | | | | | | | | | | | | | | | | | | | | | | | | | | | | | | | | | | | | | | | | | | | | | | | | | | | | |
| Class ADV | | | | | | | | | | | | | | | | | | | | | | | | | | | | | | | | | | | | | | | | | | | | | | | | | | | | | | | | | | | | | | | | | | | | | | | | | | | | | | | | | | | | | | | | | | | | | | | | | | | | | | | |
| 12-31-19 | | | | | 15.79 | | | | | | 0.00* | | | | | | 3.92 | | | | | | 3.92 | | | | | | 0.03 | | | | | | 4.55 | | | | | | 0.23 | | | | | | 4.81 | | | | | | — | | | | | | 14.90 | | | | |
|
25.96
|
| | | | | 1.45 | | | | | | 1.45 | | | | | | 1.44 | | | | | | 0.05 | | | | | | 130,058 | | | | | | 50 | | |
| 12-31-18 | | | | | 20.12 | | | | | | (0.02) | | | | | | (1.67) | | | | | | (1.69) | | | | | | 0.02 | | | | | | 2.62 | | | | | | — | | | | | | 2.64 | | | | | | — | | | | | | 15.79 | | | | |
|
(10.82)
|
| | | | | 1.45 | | | | | | 1.45 | | | | | | 1.45 | | | | | | (0.07) | | | | | | 114,664 | | | | | | 43 | | |
| 12-31-17 | | | | | 18.54 | | | | | | 0.01 | | | | | | 2.71 | | | | | | 2.72 | | | | | | 0.04 | | | | | | 1.10 | | | | | | — | | | | | | 1.14 | | | | | | — | | | | | | 20.12 | | | | |
|
15.17
|
| | | | | 1.45 | | | | | | 1.45 | | | | | | 1.45 | | | | | | 0.03 | | | | | | 131,488 | | | | | | 36 | | |
| 12-31-16 | | | | | 16.82 | | | | | | 0.03 | | | | | | 3.33 | | | | | | 3.36 | | | | | | 0.04 | | | | | | 1.60 | | | | | | — | | | | | | 1.64 | | | | | | — | | | | | | 18.54 | | | | |
|
21.17
|
| | | | | 1.50 | | | | | | 1.45 | | | | | | 1.45 | | | | | | 0.17 | | | | | | 120,442 | | | | | | 40 | | |
| 12-31-15 | | | | | 19.83 | | | | | | 0.01 | | | | | | (0.58) | | | | | | (0.57) | | | | | | — | | | | | | 2.44 | | | | | | — | | | | | | 2.44 | | | | | | — | | | | | | 16.82 | | | | |
|
(4.02)
|
| | | | | 1.60 | | | | | | 1.45 | | | | | | 1.45 | | | | | | 0.12 | | | | | | 105,259 | | | | | | 38 | | |
| Class I | | | | | | | | | | | | | | | | | | | | | | | | | | | | | | | | | | | | | | | | | | | | | | | | | | | | | | | | | | | | | | | | | | | | | | | | | | | | | | | | | | | | | | | | | | | | | | | | | | | | | | | |
| 12-31-19 | | | | | 16.89 | | | | | | 0.12 | | | | | | 4.20 | | | | | | 4.32 | | | | | | 0.22 | | | | | | 4.55 | | | | | | 0.23 | | | | | | 5.00 | | | | | | — | | | | | | 16.21 | | | | |
|
26.75
|
| | | | | 0.85 | | | | | | 0.85 | | | | | | 0.84 | | | | | | 0.66 | | | | | | 240,957 | | | | | | 50 | | |
| 12-31-18 | | | | | 21.35 | | | | | | 0.11 | | | | | | (1.81) | | | | | | (1.70) | | | | | | 0.14 | | | | | | 2.62 | | | | | | — | | | | | | 2.76 | | | | | | — | | | | | | 16.89 | | | | |
|
(10.34)
|
| | | | | 0.85 | | | | | | 0.85 | | | | | | 0.85 | | | | | | 0.53 | | | | | | 165,568 | | | | | | 43 | | |
| 12-31-17 | | | | | 19.59 | | | | | | 0.13 | | | | | | 2.88 | | | | | | 3.01 | | | | | | 0.15 | | | | | | 1.10 | | | | | | — | | | | | | 1.25 | | | | | | — | | | | | | 21.35 | | | | |
|
15.86
|
| | | | | 0.85 | | | | | | 0.85 | | | | | | 0.85 | | | | | | 0.62 | | | | | | 188,213 | | | | | | 36 | | |
| 12-31-16 | | | | | 17.68 | | | | | | 0.14 | | | | | | 3.52 | | | | | | 3.66 | | | | | | 0.15 | | | | | | 1.60 | | | | | | — | | | | | | 1.75 | | | | | | — | | | | | | 19.59 | | | | |
|
21.92
|
| | | | | 0.85 | | | | | | 0.85 | | | | | | 0.85 | | | | | | 0.77 | | | | | | 178,586 | | | | | | 40 | | |
| 12-31-15 | | | | | 20.70 | | | | | | 0.14 | | | | | | (0.62) | | | | | | (0.48) | | | | | | 0.10 | | | | | | 2.44 | | | | | | — | | | | | | 2.54 | | | | | | — | | | | | | 17.68 | | | | |
|
(3.45)
|
| | | | | 0.85 | | | | | | 0.85 | | | | | | 0.85 | | | | | | 0.72 | | | | | | 159,243 | | | | | | 38 | | |
| Class R6 | | | | | | | | | | | | | | | | | | | | | | | | | | | | | | | | | | | | | | | | | | | | | | | | | | | | | | | | | | | | | | | | | | | | | | | | | | | | | | | | | | | | | | | | | | | | | | | | | | | | | | | |
| 12-31-19 | | | | | 16.88 | | | | | | 0.12 | | | | | | 4.20 | | | | | | 4.32 | | | | | | 0.22 | | | | | | 4.55 | | | | | | 0.23 | | | | | | 5.00 | | | | | | — | | | | | | 16.20 | | | | |
|
26.78
|
| | | | | 0.85 | | | | | | 0.85 | | | | | | 0.84 | | | | | | 0.66 | | | | | | 38,161 | | | | | | 50 | | |
| 12-31-18 | | | | | 21.34 | | | | | | 0.09 | | | | | | (1.79) | | | | | | (1.70) | | | | | | 0.14 | | | | | | 2.62 | | | | | | — | | | | | | 2.76 | | | | | | — | | | | | | 16.88 | | | | |
|
(10.34)
|
| | | | | 0.85 | | | | | | 0.85 | | | | | | 0.85 | | | | | | 0.55 | | | | | | 23,951 | | | | | | 43 | | |
| 12-31-17 | | | | | 19.58 | | | | | | 0.15• | | | | | | 2.86 | | | | | | 3.01 | | | | | | 0.15 | | | | | | 1.10 | | | | | | — | | | | | | 1.25 | | | | | | — | | | | | | 21.34 | | | | |
|
15.87
|
| | | | | 0.85 | | | | | | 0.85 | | | | | | 0.85 | | | | | | 0.73 | | | | | | 17,009 | | | | | | 36 | | |
| 05-03-16(5) - 12-31-16 |
| | | | 17.80 | | | | | | 0.15 | | | | | | 3.38 | | | | | | 3.53 | | | | | | 0.15 | | | | | | 1.60 | | | | | | — | | | | | | 1.75 | | | | | | — | | | | | | 19.58 | | | | |
|
21.04
|
| | | | | 0.85 | | | | | | 0.85 | | | | | | 0.85 | | | | | | 1.22 | | | | | | 30 | | | | | | 40 | | |
| Class S | | | | | | | | | | | | | | | | | | | | | | | | | | | | | | | | | | | | | | | | | | | | | | | | | | | | | | | | | | | | | | | | | | | | | | | | | | | | | | | | | | | | | | | | | | | | | | | | | | | | | | | |
| 12-31-19 | | | | | 16.65 | | | | | | 0.07 | | | | | | 4.14 | | | | | | 4.21 | | | | | | 0.13 | | | | | | 4.55 | | | | | | 0.23 | | | | | | 4.91 | | | | | | — | | | | | | 15.95 | | | | |
|
26.39
|
| | | | | 1.10 | | | | | | 1.10 | | | | | | 1.09 | | | | | | 0.37 | | | | | | 129,784 | | | | | | 50 | | |
| 12-31-18 | | | | | 21.07 | | | | | | 0.06 | | | | | | (1.78) | | | | | | (1.72) | | | | | | 0.08 | | | | | | 2.62 | | | | | | — | | | | | | 2.70 | | | | | | — | | | | | | 16.65 | | | | |
|
(10.52)
|
| | | | | 1.10 | | | | | | 1.10 | | | | | | 1.10 | | | | | | 0.28 | | | | | | 327,752 | | | | | | 43 | | |
| 12-31-17 | | | | | 19.35 | | | | | | 0.07• | | | | | | 2.85 | | | | | | 2.92 | | | | | | 0.10 | | | | | | 1.10 | | | | | | — | | | | | | 1.20 | | | | | | — | | | | | | 21.07 | | | | |
|
15.56
|
| | | | | 1.10 | | | | | | 1.10 | | | | | | 1.10 | | | | | | 0.37 | | | | | | 385,636 | | | | | | 36 | | |
| 12-31-16 | | | | | 17.48 | | | | | | 0.10 | | | | | | 3.46 | | | | | | 3.56 | | | | | | 0.09 | | | | | | 1.60 | | | | | | — | | | | | | 1.69 | | | | | | — | | | | | | 19.35 | | | | |
|
21.59
|
| | | | | 1.10 | | | | | | 1.10 | | | | | | 1.10 | | | | | | 0.52 | | | | | | 436,518 | | | | | | 40 | | |
| 12-31-15 | | | | | 20.49 | | | | | | 0.09 | | | | | | (0.62) | | | | | | (0.53) | | | | | | 0.04 | | | | | | 2.44 | | | | | | — | | | | | | 2.48 | | | | | | — | | | | | | 17.48 | | | | |
|
(3.68)
|
| | | | | 1.10 | | | | | | 1.10 | | | | | | 1.10 | | | | | | 0.47 | | | | | | 404,369 | | | | | | 38 | | |
| Class S2 | | | | | | | | | | | | | | | | | | | | | | | | | | | | | | | | | | | | | | | | | | | | | | | | | | | | | | | | | | | | | | | | | | | | | | | | | | | | | | | | | | | | | | | | | | | | | | | | | | | | | | | |
| 12-31-19 | | | | | 16.46 | | | | | | 0.04• | | | | | | 4.09 | | | | | | 4.13 | | | | | | 0.07 | | | | | | 4.55 | | | | | | 0.23 | | | | | | 4.85 | | | | | | — | | | | | | 15.74 | | | | |
|
26.20
|
| | | | | 1.25 | | | | | | 1.25 | | | | | | 1.24 | | | | | | 0.22 | | | | | | 9,014 | | | | | | 50 | | |
| 12-31-18 | | | | | 20.85 | | | | | | 0.03 | | | | | | (1.76) | | | | | | (1.73) | | | | | | 0.04 | | | | | | 2.62 | | | | | | — | | | | | | 2.66 | | | | | | — | | | | | | 16.46 | | | | |
|
(10.64)
|
| | | | | 1.25 | | | | | | 1.25 | | | | | | 1.25 | | | | | | 0.13 | | | | | | 27,453 | | | | | | 43 | | |
| 12-31-17 | | | | | 19.15 | | | | | | 0.04• | | | | | | 2.82 | | | | | | 2.86 | | | | | | 0.06 | | | | | | 1.10 | | | | | | — | | | | | | 1.16 | | | | | | — | | | | | | 20.85 | | | | |
|
15.42
|
| | | | | 1.25 | | | | | | 1.25 | | | | | | 1.25 | | | | | | 0.22 | | | | | | 35,440 | | | | | | 36 | | |
| 12-31-16 | | | | | 17.31 | | | | | | 0.06• | | | | | | 3.44 | | | | | | 3.50 | | | | | | 0.06 | | | | | | 1.60 | | | | | | — | | | | | | 1.66 | | | | | | — | | | | | | 19.15 | | | | |
|
21.39
|
| | | | | 1.28 | | | | | | 1.25 | | | | | | 1.25 | | | | | | 0.37 | | | | | | 39,721 | | | | | | 40 | | |
| 12-31-15 | | | | | 20.32 | | | | | | 0.06 | | | | | | (0.62) | | | | | | (0.56) | | | | | | 0.01 | | | | | | 2.44 | | | | | | — | | | | | | 2.45 | | | | | | — | | | | | | 17.31 | | | | |
|
(3.87)
|
| | | | | 1.35 | | | | | | 1.25 | | | | | | 1.25 | | | | | | 0.33 | | | | | | 40,756 | | | | | | 38 | | |
| | | |
Purchased
|
| |
Sold
|
| ||||||
| Balanced Income | | | | $ | 138,857,630 | | | | | $ | 18,554,026 | | |
| Limited Maturity Bond | | | | | 73,413,522 | | | | | | 15,741,640 | | |
| U.S. Stock Index | | | | | 69,770,121 | | | | | | — | | |
| JPMorgan Small Cap Core Equity | | | | | 10,566,634 | | | | | | — | | |
| | | |
Buy
|
| |
Sell
|
| ||||||
| Balanced Income | | | | $ | 14,482,431 | | | | | $ | 11,329,315 | | |
| Limited Maturity | | | | | 7,945,000 | | | | | | — | | |
| | | |
Purchases
|
| |
Sales
|
| ||||||
| Balanced Income | | | | $ | 463,811,507 | | | | | $ | 503,360,583 | | |
| High Yield | | | | | 299,782,384 | | | | | | 331,523,264 | | |
| Large Cap Growth | | | | | 4,326,981,573 | | | | | | 5,073,473,323 | | |
| Large Cap Value | | | | | 993,712,267 | | | | | | 1,110,807,416 | | |
| Limited Maturity Bond | | | | | 105,477,633 | | | | | | 111,205,874 | | |
| U.S. Stock Index | | | | | 1,351,858,898 | | | | | | 518,985,677 | | |
| Clarion Real Estate | | | | | 235,978,092 | | | | | | 300,519,743 | | |
|
JPMorgan Small Cap Core Equity
|
| | | | 354,204,886 | | | | | | 618,977,760 | | |
| | | |
Purchases
|
| |
Sales
|
| ||||||
| Balanced Income | | | | $ | 430,695,747 | | | | | $ | 426,291,718 | | |
| Limited Maturity Bond | | | | | 786,702,642 | | | | | | 788,296,051 | | |
|
Portfolio
|
| |
Fee
|
|
|
Balanced Income(1)
|
| | 0.55% on all assets | |
| Large Cap Growth | | | 0.65% on the first $5.5 billion; 0.62% on the next $1.5 billion; 0.60% on the next $3 billion; and 0.59% on the amount in excess of $10 billion |
|
| Large Cap Value | | | 0.75% on the first $500 million; 0.70% on the next $1.5 billion; and 0.65% on the amount in excess of $2 billion |
|
|
Clarion Real Estate
|
| | 0.85% on the first $200 million; 0.80% on the next $550 million; and 0.75% on the amount in excess of $750 million |
|
|
Portfolio
|
| |
Fee
|
|
| High Yield | | | 0.490% on the first $1 billion; 0.480% on the next $1 billion; 0.470% on the amount in excess of $2 billion |
|
|
Limited Maturity Bond(1)
|
| | 0.350% on the first $200 million; 0.300% on the next $300 million; 0.250% on the amount in excess of $500 million |
|
| U.S. Stock Index | | | 0.260% | |
|
Portfolio
|
| |
Fee
|
|
|
JPMorgan Small Cap Core Equity
|
| | 0.900% on the first $200 million; 0.850% on the next $300 million; 0.800% on the next $250 million; 0.750% on the amount in excess of $750 million |
|
|
Portfolio
|
| |
Sub-Adviser
|
|
|
Balanced Income(1)
|
| | Voya Investment Management Co. LLC* | |
| High Yield | | | Voya Investment Management Co. LLC* | |
| Large Cap Growth | | | Voya Investment Management Co. LLC* | |
|
Portfolio
|
| |
Sub-Adviser
|
|
| Large Cap Value | | | Voya Investment Management Co. LLC* | |
|
Limited Maturity Bond
|
| | Voya Investment Management Co. LLC* | |
| U.S. Stock Index | | | Voya Investment Management Co. LLC* | |
|
Clarion Real Estate
|
| | CBRE Clarion Securities LLC | |
|
JPMorgan Small Cap Core Equity
|
| | J.P. Morgan Investment Management Inc. | |
| Subsidiary/Affiliated Investment Company |
| |
Portfolio
|
| |
Percentage
|
| |||
| ReliaStar Life Insurance Company | | |
Limited Maturity Bond
|
| | | | 6.44% | | |
| | | | JPMorgan Small Cap Core Equity |
| | | | 10.30 | | |
|
Security Life of Denver Insurance
Company |
| |
Limited Maturity Bond
|
| | | | 9.84 | | |
| | | | JPMorgan Small Cap Core Equity |
| | | | 6.45 | | |
| Voya Index Solution 2025 Portfolio | | | U.S. Stock Index | | | | | 5.80 | | |
| Voya Index Solution 2035 Portfolio | | | U.S. Stock Index | | | | | 7.13 | | |
| Voya Index Solution 2045 Portfolio | | | U.S. Stock Index | | | | | 5.46 | | |
| Voya Institutional Trust Company | | | Balanced Income | | | | | 20.30 | | |
| | | | High Yield | | | | | 14.44 | | |
| | | | Large Cap Growth | | | | | 19.25 | | |
| | | | Large Cap Value | | | | | 5.10 | | |
| | | |
Limited Maturity Bond
|
| | | | 5.58 | | |
| | | | Clarion Real Estate | | | | | 21.99 | | |
| | | | JPMorgan Small Cap Core Equity |
| | | | 34.63 | | |
| Voya Retirement Growth Portfolio | | | U.S. Stock Index | | | | | 16.12 | | |
|
Voya Retirement Insurance and
Annuity Company |
| | High Yield | | | | | 32.52 | | |
| | | | Large Cap Growth | | | | | 26.63 | | |
| | | | Large Cap Value | | | | | 30.09 | | |
| | | | U.S. Stock Index | | | | | 10.92 | | |
| | | | Clarion Real Estate | | | | | 38.19 | | |
| | | | JPMorgan Small Cap Core Equity |
| | | | 39.59 | | |
|
Voya Retirement Moderate Growth
Portfolio |
| | U.S. Stock Index | | | | | 11.12 | | |
|
Portfolio
|
| |
Class
ADV |
| |
Class
I |
| |
Class
P2 |
| |
Class
R6 |
| |
Class
S |
| |
Class
S2 |
| ||||||||||||||||||
| Balanced Income(1) | | | | | 1.20% | | | | | | 0.60% | | | | | | N/A | | | | | | N/A | | | | | | 0.85% | | | | | | 1.00% | | |
| Large Cap Growth(2) | | | | | 1.27% | | | | | | 0.67% | | | | | | N/A | | | | | | 0.67% | | | | | | 0.92% | | | | | | 1.07% | | |
| Large Cap Value(3) | | | | | 1.29% | | | | | | 0.69% | | | | | | N/A | | | | | | 0.69% | | | | | | 0.94% | | | | | | 1.09% | | |
| U.S. Stock Index | | | | | N/A | | | | | | N/A | | | | | | 0.15% | | | | | | N/A | | | | | | N/A | | | | | | N/A | | |
| Clarion Real Estate | | | | | 1.35% | | | | | | 0.75% | | | | | | N/A | | | | | | N/A | | | | | | 1.00% | | | | | | 1.15% | | |
| | | |
December 31,
|
| | ||||||||||||||||||||
| | | |
2020
|
| |
2021
|
| |
2022
|
| |
Total
|
| ||||||||||||
| Balanced Income | | | | $ | 496,880 | | | | | $ | 448,434 | | | | | $ | 98,813 | | | | | $ | 1,044,127 | | |
| U.S. Stock Index | | | | | 837,720 | | | | | | 1,667,050 | | | | | | 2,287,877 | | | | | | 4,792,647 | | |
| Clarion Real Estate | | | | | 549,763 | | | | | | 452,664 | | | | | | 365,899 | | | | | | 1,368,326 | | |
|
Portfolio
|
| |
Days
Utilized |
| |
Approximate
Average Daily Balance For Days Utilized |
| |
Approximate
Weighted Average Interest Rate For Days Utilized |
| |||||||||
| Balanced Income | | | | | 33 | | | | | $ | 2,389,636 | | | | | | 3.15% | | |
| U.S. Stock Index | | | | | 6 | | | | | | 39,978,667 | | | | | | 2.94 | | |
| Clarion Real Estate | | | | | 7 | | | | | | 7,350,571 | | | | | | 3.37 | | |
| | | |
Shares
sold |
| |
Shares
issued in merger |
| |
Reinvestment
of distributions |
| |
Shares
redeemed |
| |
Net increase
(decrease) in shares outstanding |
| |
Shares
sold |
| |
Proceeds
from shares issued in merger |
| |
Reinvestment
of distributions |
| |
Shares
redeemed |
| |
Net increase
(decrease) |
| ||||||||||||||||||||||||||||||
| Year or period ended |
| |
#
|
| |
#
|
| |
#
|
| |
#
|
| |
#
|
| |
($)
|
| |
($)
|
| |
($)
|
| |
($)
|
| |
($)
|
| ||||||||||||||||||||||||||||||
| Balanced Income | | ||||||||||||||||||||||||||||||||||||||||||||||||||||||||||||
| Class ADV | | | | | | | | | | | | ||||||||||||||||||||||||||||||||||||||||||||||||||
| 12/31/2019 | | | | | 483,953 | | | | | | — | | | | | | 765,462 | | | | | | (839,081) | | | | | | 410,334 | | | | | | 5,164,269 | | | | | | — | | | | | | 7,922,532 | | | | | | (8,959,080) | | | | | | 4,127,721 | | |
| 12/31/2018 | | | | | 343,500 | | | | | | — | | | | | | 365,920 | | | | | | (1,098,907) | | | | | | (389,487) | | | | | | 3,765,288 | | | | | | — | | | | | | 3,926,322 | | | | | | (12,008,384) | | | | | | (4,316,774) | | |
| Class I | | | | | | | | | | | | | | | | | | | | | | | | | | | | | | | | | | | | | | | | | | | | | | | | | | | | | | | | | | | | | |
| 12/31/2019 | | | | | 23,412 | | | | | | — | | | | | | 82,479 | | | | | | (70,383) | | | | | | 35,508 | | | | | | 262,125 | | | | | | — | | | | | | 894,071 | | | | | | (784,282) | | | | | | 371,914 | | |
| 12/31/2018 | | | | | 13,833 | | | | | | — | | | | | | 43,191 | | | | | | (108,802) | | | | | | (51,778) | | | | | | 157,449 | | | | | | — | | | | | | 483,308 | | | | | | (1,231,681) | | | | | | (590,924) | | |
| Class S | | | | | | | | | | | | | | | | | | | | | | | | | | | | | | | | | | | | | | | | | | | | | | | | | | | | | | | | | | | | | |
| 12/31/2019 | | | | | 461,969 | | | | | | — | | | | | | 2,828,525 | | | | | | (4,051,474) | | | | | | (760,980) | | | | | | 5,118,548 | | | | | | — | | | | | | 30,519,786 | | | | | | (45,382,273) | | | | | | (9,743,939) | | |
| 12/31/2018 | | | | | 209,670 | | | | | | — | | | | | | 1,501,209 | | | | | | (5,528,181) | | | | | | (3,817,302) | | | | | | 2,402,543 | | | | | | — | | | | | | 16,723,472 | | | | | | (62,687,213) | | | | | | (43,561,198) | | |
| Class S2 | | | | | | | | | | | | | | | | | | | | | | | | | | | | | | | | | | | | | | | | | | | | | | | | | | | | | | | | | | | | | |
| 12/31/2019 | | | | | 112,288 | | | | | | — | | | | | | 46,512 | | | | | | (93,027) | | | | | | 65,773 | | | | | | 1,226,171 | | | | | | — | | | | | | 501,395 | | | | | | (1,021,334) | | | | | | 706,232 | | |
| 12/31/2018 | | | | | 22,911 | | | | | | — | | | | | | 22,902 | | | | | | (66,257) | | | | | | (20,444) | | | | | | 260,456 | | | | | | — | | | | | | 254,904 | | | | | | (751,330) | | | | | | (235,970) | | |
| High Yield | | ||||||||||||||||||||||||||||||||||||||||||||||||||||||||||||
| Class ADV | | | | | | | | | | | | | | | | | | | | | | | | | | | | | | | | | | | | | | | | | | | | | | | | | | | | | | | | | | | | | |
| 12/31/2019 | | | | | 634,371 | | | | | | — | | | | | | 429,020 | | | | | | (1,145,593) | | | | | | (82,202) | | | | | | 6,187,500 | | | | | | — | | | | | | 4,184,086 | | | | | | (11,117,739) | | | | | | (746,153) | | |
| 12/31/2018 | | | | | 468,091 | | | | | | — | | | | | | 496,778 | | | | | | (1,731,374) | | | | | | (766,505) | | | | | | 4,535,058 | | | | | | — | | | | | | 4,784,764 | | | | | | (16,724,655) | | | | | | (7,404,833) | | |
| Class I | | | | | | | | | | | | | | | | | | | | | | | | | | | | | | | | | | | | | | | | | | | | | | | | | | | | | | | | | | | | | |
| 12/31/2019 | | | | | 4,042,390 | | | | | | 9,811,076 | | | | | | 581,119 | | | | | | (1,596,538) | | | | | | 12,838,047 | | | | | | 39,614,104 | | | | | | 96,181,491 | | | | | | 5,691,493 | | | | | | (15,569,611) | | | | | | 125,917,477 | | |
| 12/31/2018 | | | | | 1,099,810 | | | | | | — | | | | | | 370,227 | | | | | | (1,547,007) | | | | | | (76,970) | | | | | | 10,708,127 | | | | | | — | | | | | | 3,566,820 | | | | | | (15,025,441) | | | | | | (750,494) | | |
| Class S | | | | | | | | | | | | | | | | | | | | | | | | | | | | | | | | | | | | | | | | | | | | | | | | | | | | | | | | | | | | | |
| 12/31/2019 | | | | | 1,874,367 | | | | | | 188,038 | | | | | | 1,800,210 | | | | | | (9,495,599) | | | | | | (5,632,984) | | | | | | 18,111,582 | | | | | | 1,841,793 | | | | | | 17,552,628 | | | | | | (92,507,126) | | | | | | (55,001,123) | | |
| 12/31/2018 | | | | | 1,541,065 | | | | | | — | | | | | | 2,209,002 | | | | | | (7,781,306) | | | | | | (4,031,239) | | | | | | 14,969,371 | | | | | | — | | | | | | 21,269,549 | | | | | | (74,934,147) | | | | | | (38,695,227) | | |
| Class S2 | | | | | | | | | | | | | | | | | | | | | | | | | | | | | | | | | | | | | | | | | | | | | | | | | | | | | | | | | | | | | |
| 12/31/2019 | | | | | 71,454 | | | | | | — | | | | | | 20,355 | | | | | | (253,238) | | | | | | (161,429) | | | | | | 694,898 | | | | | | — | | | | | | 198,505 | | | | | | (2,478,674) | | | | | | (1,585,271) | | |
| 12/31/2018 | | | | | 53,890 | | | | | | — | | | | | | 29,579 | | | | | | (201,318) | | | | | | (117,849) | | | | | | 524,343 | | | | | | — | | | | | | 285,512 | | | | | | (1,944,436) | | | | | | (1,134,581) | | |
| Large Cap Growth | | ||||||||||||||||||||||||||||||||||||||||||||||||||||||||||||
| Class ADV | | | | | | | | | | | | | | | | | | | | | | | | | | | | | | | | | | | | | | | | | | | | | | | | | | | | | | | | | | | | | |
| 12/31/2019 | | | | | 1,035,445 | | | | | | — | | | | | | 19,360,091 | | | | | | (18,219,100) | | | | | | 2,176,436 | | | | | | 18,555,068 | | | | | | — | | | | | | 322,539,115 | | | | | | (322,447,976) | | | | | | 18,646,207 | | |
| 12/31/2018 | | | | | 918,683 | | | | | | — | | | | | | 15,118,914 | | | | | | (17,104,293) | | | | | | (1,066,696) | | | | | | 17,424,747 | | | | | | — | | | | | | 276,524,927 | | | | | | (326,912,484) | | | | | | (32,962,810) | | |
| Class I | | | | | | | | | | | | | | | | | | | | | | | | | | | | | | | | | | | | | | | | | | | | | | | | | | | | | | | | | | | | | |
| 12/31/2019 | | | | | 4,994,678 | | | | | | — | | | | | | 16,795,929 | | | | | | (12,234,448) | | | | | | 9,556,159 | | | | | | 97,655,872 | | | | | | — | | | | | | 308,037,331 | | | | | | (235,572,055) | | | | | | 170,121,148 | | |
| 12/31/2018 | | | | | 7,417,403 | | | | | | — | | | | | | 14,079,600 | | | | | | (32,272,260) | | | | | | (10,775,257) | | | | | | 155,902,826 | | | | | | — | | | | | | 278,916,876 | | | | | | (675,708,149) | | | | | | (240,888,447) | | |
| Class R6 | | | | | | | | | | | | | | | | | | | | | | | | | | | | | | | | | | | | | | | | | | | | | | | | | | | | | | | | | | | | | |
| 12/31/2019 | | | | | 486,351 | | | | | | — | | | | | | 470,515 | | | | | | (535,128) | | | | | | 421,738 | | | | | | 9,358,324 | | | | | | — | | | | | | 8,633,943 | | | | | | (10,360,682) | | | | | | 7,631,585 | | |
| 12/31/2018 | | | | | 1,023,337 | | | | | | — | | | | | | 321,255 | | | | | | (365,872) | | | | | | 978,720 | | | | | | 21,158,162 | | | | | | — | | | | | | 6,367,270 | | | | | | (7,357,087) | | | | | | 20,168,345 | | |
| Class S | | | | | | | | | | | | | | | | | | | | | | | | | | | | | | | | | | | | | | | | | | | | | | | | | | | | | | | | | | | | | |
| 12/31/2019 | | | | | 1,219,268 | | | | | | — | | | | | | 17,119,586 | | | | | | (19,498,439) | | | | | | (1,159,585) | | | | | | 23,058,635 | | | | | | — | | | | | | 304,557,434 | | | | | | (367,320,864) | | | | | | (39,704,795) | | |
| 12/31/2018 | | | | | 1,131,475 | | | | | | — | | | | | | 13,904,209 | | | | | | (18,503,810) | | | | | | (3,468,126) | | | | | | 22,894,103 | | | | | | — | | | | | | 268,490,262 | | | | | | (374,074,067) | | | | | | (82,689,702) | | |
| Class S2 | | | | | | | | | | | | | | | | | | | | | | | | | | | | | | | | | | | | | | | | | | | | | | | | | | | | | | | | | | | | | |
| 12/31/2019 | | | | | 143,587 | | | | | | — | | | | | | 587,448 | | | | | | (929,352) | | | | | | (198,317) | | | | | | 2,658,264 | | | | | | — | | | | | | 10,362,576 | | | | | | (17,303,441) | | | | | | (4,282,601) | | |
| 12/31/2018 | | | | | 325,126 | | | | | | — | | | | | | 452,720 | | | | | | (635,056) | | | | | | 142,790 | | | | | | 6,494,085 | | | | | | — | | | | | | 8,678,633 | | | | | | (12,844,744) | | | | | | 2,327,974 | | |
| Large Cap Value | | ||||||||||||||||||||||||||||||||||||||||||||||||||||||||||||
| Class ADV | | | | | | | | | | | | | | | | | | | | | | | | | | | | | | | | | | | | | | | | | | | | | | | | | | | | | | | | | | | | | |
| 12/31/2019 | | | | | 112,168 | | | | | | — | | | | | | 391,693 | | | | | | (759,527) | | | | | | (255,666) | | | | | | 1,285,654 | | | | | | — | | | | | | 4,505,178 | | | | | | (8,725,259) | | | | | | (2,934,427) | | |
| 12/31/2018 | | | | | 132,555 | | | | | | — | | | | | | 622,235 | | | | | | (746,247) | | | | | | 8,543 | | | | | | 1,613,261 | | | | | | — | | | | | | 7,149,519 | | | | | | (9,153,440) | | | | | | (390,660) | | |
| Class I | | | | | | | | | | | | | | | | | | | | | | | | | | | | | | | | | | | | | | | | | | | | | | | | | | | | | | | | | | | | | |
| 12/31/2019 | | | | | 577,141 | | | | | | — | | | | | | 2,685,229 | | | | | | (4,077,981) | | | | | | (815,611) | | | | | | 6,825,780 | | | | | | — | | | | | | 31,729,269 | | | | | | (48,240,843) | | | | | | (9,685,794) | | |
| 12/31/2018 | | | | | 589,887 | | | | | | — | | | | | | 4,162,204 | | | | | | (6,070,579) | | | | | | (1,318,488) | | | | | | 7,303,720 | | | | | | — | | | | | | 48,700,372 | | | | | | (77,402,054) | | | | | | (21,397,962) | | |
| Class R6 | | | | | | | | | | | | | | | | | | | | | | | | | | | | | | | | | | | | | | | | | | | | | | | | | | | | | | | | | | | | | |
| 12/31/2019 | | | | | 14,817 | | | | | | — | | | | | | 2,126 | | | | | | (102,570) | | | | | | (85,627) | | | | | | 176,027 | | | | | | — | | | | | | 25,122 | | | | | | (1,219,884) | | | | | | (1,018,735) | | |
| 12/31/2018 | | | | | 70,339 | | | | | | — | | | | | | 10,828 | | | | | | (33,405) | | | | | | 47,762 | | | | | | 883,122 | | | | | | — | | | | | | 125,715 | | | | | | (439,756) | | | | | | 569,081 | | |
| Class S | | | | | | | | | | | | | | | | | | | | | | | | | | | | | | | | | | | | | | | | | | | | | | | | | | | | | | | | | | | | | |
| 12/31/2019 | | | | | 406,811 | | | | | | — | | | | | | 5,109,077 | | | | | | (9,995,327) | | | | | | (4,479,439) | | | | | | 4,776,267 | | | | | | — | | | | | | 59,337,191 | | | | | | (116,360,700) | | | | | | (52,247,242) | | |
| 12/31/2018 | | | | | 298,273 | | | | | | — | | | | | | 8,086,285 | | | | | | (9,550,944) | | | | | | (1,166,386) | | | | | | 3,740,165 | | | | | | — | | | | | | 93,408,002 | | | | | | (119,140,322) | | | | | | (21,992,155) | | |
| | | |
Shares
sold |
| |
Shares
issued in merger |
| |
Reinvestment
of distributions |
| |
Shares
redeemed |
| |
Net increase
(decrease) in shares outstanding |
| |
Shares
sold |
| |
Proceeds
from shares issued in merger |
| |
Reinvestment
of distributions |
| |
Shares
redeemed |
| |
Net increase
(decrease) |
| ||||||||||||||||||||||||||||||
| Year or period ended |
| |
#
|
| |
#
|
| |
#
|
| |
#
|
| |
#
|
| |
($)
|
| |
($)
|
| |
($)
|
| |
($)
|
| |
($)
|
| ||||||||||||||||||||||||||||||
| Large Cap Value (continued) | | ||||||||||||||||||||||||||||||||||||||||||||||||||||||||||||
| Class S2 | | | | | | | | | | | | | | | | | | | | | | | | | | | | | | | | | | | | | | | | | | | | | | | | | | | | | | | | | | | | | |
| 12/31/2019 | | | | | 278 | | | | | | — | | | | | | 1,168 | | | | | | (3,730) | | | | | | (2,284) | | | | | | 3,105 | | | | | | — | | | | | | 13,567 | | | | | | (43,649) | | | | | | (26,977) | | |
| 12/31/2018 | | | | | 2,023 | | | | | | — | | | | | | 1,692 | | | | | | (6,815) | | | | | | (3,100) | | | | | | 25,835 | | | | | | — | | | | | | 19,541 | | | | | | (93,118) | | | | | | (47,742) | | |
| Limited Maturity Bond | | ||||||||||||||||||||||||||||||||||||||||||||||||||||||||||||
| Class ADV | | | | | | | | | | | | | | | | | | | | | | | | | | | | | | | | | | | | | | | | | | | | | | | | | | | | | | | | | | | | | |
| 12/31/2019 | | | | | 42,085 | | | | | | — | | | | | | 20,414 | | | | | | (228,289) | | | | | | (165,790) | | | | | | 412,070 | | | | | | — | | | | | | 201,180 | | | | | | (2,241,012) | | | | | | (1,627,762) | | |
| 12/31/2018 | | | | | 106,531 | | | | | | — | | | | | | 20,943 | | | | | | (416,823) | | | | | | (289,349) | | | | | | 1,029,191 | | | | | | — | | | | | | 202,049 | | | | | | (4,023,906) | | | | | | (2,792,666) | | |
| Class I | | | | | | | | | | | | | | | | | | | | | | | | | | | | | | | | | | | | | | | | | | | | | | | | | | | | | | | | | | | | | |
| 12/31/2019 | | | | | 7,089,807 | | | | | | — | | | | | | 338,544 | | | | | | (7,771,113) | | | | | | (342,762) | | | | | | 71,343,640 | | | | | | — | | | | | | 3,405,088 | | | | | | (77,660,342) | | | | | | (2,911,614) | | |
| 12/31/2018 | | | | | 7,255,841 | | | | | | — | | | | | | 329,270 | | | | | | (6,778,612) | | | | | | 806,499 | | | | | | 71,412,856 | | | | | | — | | | | | | 3,241,396 | | | | | | (66,800,849) | | | | | | 7,853,403 | | |
| Class S | | | | | | | | | | | | | | | | | | | | | | | | | | | | | | | | | | | | | | | | | | | | | | | | | | | | | | | | | | | | | |
| 12/31/2019 | | | | | 1,202,703 | | | | | | — | | | | | | 118,672 | | | | | | (1,482,759) | | | | | | (161,384) | | | | | | 12,186,719 | | | | | | — | | | | | | 1,202,654 | | | | | | (15,011,516) | | | | | | (1,622,143) | | |
| 12/31/2018 | | | | | 752,352 | | | | | | — | | | | | | 116,839 | | | | | | (1,691,082) | | | | | | (821,891) | | | | | | 7,466,847 | | | | | | — | | | | | | 1,158,960 | | | | | | (16,772,716) | | | | | | (8,146,909) | | |
| U.S. Stock Index | | ||||||||||||||||||||||||||||||||||||||||||||||||||||||||||||
| Class ADV | | | | | | | | | | | | | | | | | | | | | | | | | | | | | | | | | | | | | | | | | | | | | | | | | | | | | | | | | | | | | |
| 12/31/2019 | | | | | 555,076 | | | | | | — | | | | | | 438,702 | | | | | | (1,568,533) | | | | | | (574,755) | | | | | | 8,469,406 | | | | | | — | | | | | | 6,766,870 | | | | | | (23,904,340) | | | | | | (8,668,064) | | |
| 12/31/2018 | | | | | 481,218 | | | | | | — | | | | | | 508,638 | | | | | | (1,778,054) | | | | | | (788,198) | | | | | | 7,229,694 | | | | | | — | | | | | | 7,544,736 | | | | | | (27,144,431) | | | | | | (12,370,001) | | |
| Class I | | | | | | | | | | | | | | | | | | | | | | | | | | | | | | | | | | | | | | | | | | | | | | | | | | | | | | | | | | | | | |
| 12/31/2019 | | | | | 60,694,599 | | | | | | — | | | | | | 17,421,336 | | | | | | (52,302,066) | | | | | | 25,813,869 | | | | | | 983,475,304 | | | | | | — | | | | | | 280,363,883 | | | | | | (822,981,841) | | | | | | 440,857,346 | | |
| 12/31/2018 | | | | | 32,350,213 | | | | | | — | | | | | | 15,849,349 | | | | | | (55,847,056) | | | | | | (7,647,494) | | | | | | 497,912,308 | | | | | | — | | | | | | 241,875,952 | | | | | | (883,699,636) | | | | | | (143,911,376) | | |
| Class P2 | | | | | | | | | | | | | | | | | | | | | | | | | | | | | | | | | | | | | | | | | | | | | | | | | | | | | | | | | | | | | |
| 12/31/2019 | | | | | 47,769,380 | | | | | | — | | | | | | 9,196,809 | | | | | | (20,074,473) | | | | | | 36,891,716 | | | | | | 754,993,771 | | | | | | — | | | | | | 148,647,312 | | | | | | (318,047,628) | | | | | | 585,593,455 | | |
| 12/31/2018 | | | | | 39,278,304 | | | | | | — | | | | | | 7,144,924 | | | | | | (20,865,797) | | | | | | 25,557,431 | | | | | | 612,519,550 | | | | | | — | | | | | | 109,017,631 | | | | | | (329,420,625) | | | | | | 392,116,556 | | |
| Class S | | | | | | | | | | | | | | | | | | | | | | | | | | | | | | | | | | | | | | | | | | | | | | | | | | | | | | | | | | | | | |
| 12/31/2019 | | | | | 14,345,061 | | | | | | — | | | | | | 396,914 | | | | | | (1,334,663) | | | | | | 13,407,312 | | | | | | 238,856,166 | | | | | | — | | | | | | 6,466,557 | | | | | | (21,719,201) | | | | | | 223,603,522 | | |
| 12/31/2018 | | | | | 917,512 | | | | | | — | | | | | | 262,206 | | | | | | (2,765,324) | | | | | | (1,585,606) | | | | | | 14,441,478 | | | | | | — | | | | | | 3,983,988 | | | | | | (43,522,881) | | | | | | (25,097,415) | | |
| Class S2 | | | | | | | | | | | | | | | | | | | | | | | | | | | | | | | | | | | | | | | | | | | | | | | | | | | | | | | | | | | | | |
| 12/31/2019 | | | | | 654,067 | | | | | | — | | | | | | 645,397 | | | | | | (3,340,876) | | | | | | (2,041,412) | | | | | | 10,121,100 | | | | | | — | | | | | | 10,110,281 | | | | | | (51,646,786) | | | | | | (31,415,405) | | |
| 12/31/2018 | | | | | 939,572 | | | | | | — | | | | | | 800,753 | | | | | | (3,019,732) | | | | | | (1,279,407) | | | | | | 14,505,138 | | | | | | — | | | | | | 12,017,762 | | | | | | (46,907,695) | | | | | | (20,384,795) | | |
| Clarion Real Estate | | ||||||||||||||||||||||||||||||||||||||||||||||||||||||||||||
| Class ADV | | | | | | | | | | | | | | | | | | | | | | | | | | | | | | | | | | | | | | | | | | | | | | | | | | | | | | | | | | | | | |
| 12/31/2019 | | | | | 122,043 | | | | | | — | | | | | | 41,563 | | | | | | (330,899) | | | | | | (167,293) | | | | | | 4,297,969 | | | | | | — | | | | | | 1,436,002 | | | | | | (11,385,004) | | | | | | (5,651,033) | | |
| 12/31/2018 | | | | | 99,786 | | | | | | — | | | | | | 255,048 | | | | | | (530,837) | | | | | | (176,003) | | | | | | 3,327,982 | | | | | | — | | | | | | 8,092,673 | | | | | | (17,297,135) | | | | | | (5,876,480) | | |
| Class I | | | | | | | | | | | | | | | | | | | | | | | | | | | | | | | | | | | | | | | | | | | | | | | | | | | | | | | | | | | | | |
| 12/31/2019 | | | | | 152,211 | | | | | | — | | | | | | 17,244 | | | | | | (802,224) | | | | | | (632,769) | | | | | | 5,565,892 | | | | | | — | | | | | | 626,652 | | | | | | (29,242,868) | | | | | | (23,050,324) | | |
| 12/31/2018 | | | | | 141,774 | | | | | | — | | | | | | 158,369 | | | | | | (1,691,012) | | | | | | (1,390,869) | | | | | | 4,863,797 | | | | | | — | | | | | | 5,278,443 | | | | | | (60,809,529) | | | | | | (50,667,289) | | |
| Class S | | | | | | | | | | | | | | | | | | | | | | | | | | | | | | | | | | | | | | | | | | | | | | | | | | | | | | | | | | | | | |
| 12/31/2019 | | | | | 186,835 | | | | | | — | | | | | | 164,792 | | | | | | (1,274,973) | | | | | | (923,346) | | | | | | 6,777,048 | | | | | | — | | | | | | 5,986,907 | | | | | | (46,338,103) | | | | | | (33,574,148) | | |
| 12/31/2018 | | | | | 148,358 | | | | | | — | | | | | | 910,495 | | | | | | (1,841,822) | | | | | | (782,969) | | | | | | 5,218,210 | | | | | | — | | | | | | 30,337,693 | | | | | | (63,290,411) | | | | | | (27,734,508) | | |
| Class S2 | | | | | | | | | | | | | | | | | | | | | | | | | | | | | | | | | | | | | | | | | | | | | | | | | | | | | | | | | | | | | |
| 12/31/2019 | | | | | 49,904 | | | | | | — | | | | | | 9,953 | | | | | | (106,580) | | | | | | (46,723) | | | | | | 1,851,374 | | | | | | — | | | | | | 359,516 | | | | | | (3,836,242) | | | | | | (1,625,352) | | |
| 12/31/2018 | | | | | 23,688 | | | | | | — | | | | | | 58,490 | | | | | | (110,129) | | | | | | (27,951) | | | | | | 813,955 | | | | | | — | | | | | | 1,937,174 | | | | | | (3,727,778) | | | | | | (976,649) | | |
| JPMorgan Small Cap Core Equity | | ||||||||||||||||||||||||||||||||||||||||||||||||||||||||||||
| Class ADV | | | | | | | | | | | | | | | | | | | | | | | | | | | | | | | | | | | | | | | | | | | | | | | | | | | | | | | | | | | | | |
| 12/31/2019 | | | | | 401,726 | | | | | | — | | | | | | 2,259,407 | | | | | | (1,195,069) | | | | | | 1,466,064 | | | | | | 6,885,294 | | | | | | — | | | | | | 34,683,375 | | | | | | (20,300,223) | | | | | | 21,268,446 | | |
| 12/31/2018 | | | | | 697,387 | | | | | | — | | | | | | 865,438 | | | | | | (834,426) | | | | | | 728,399 | | | | | | 13,057,873 | | | | | | — | | | | | | 16,763,544 | | | | | | (16,260,829) | | | | | | 13,560,588 | | |
| Class I | | | | | | | | | | | | | | | | | | | | | | | | | | | | | | | | | | | | | | | | | | | | | | | | | | | | | | | | | | | | | |
| 12/31/2019 | | | | | 3,148,820 | | | | | | — | | | | | | 3,686,325 | | | | | | (1,772,364) | | | | | | 5,062,781 | | | | | | 61,273,417 | | | | | | — | | | | | | 61,361,495 | | | | | | (32,081,291) | | | | | | 90,553,621 | | |
| 12/31/2018 | | | | | 1,069,628 | | | | | | — | | | | | | 1,171,916 | | | | | | (1,257,213) | | | | | | 984,331 | | | | | | 22,820,403 | | | | | | — | | | | | | 24,223,499 | | | | | | (26,094,331) | | | | | | 20,949,571 | | |
| Class R6 | | | | | | | | | | | | | | | | | | | | | | | | | | | | | | | | | | | | | | | | | | | | | | | | | | | | | | | | | | | | | |
| 12/31/2019 | | | | | 659,970 | | | | | | — | | | | | | 548,604 | | | | | | (271,262) | | | | | | 937,312 | | | | | | 12,104,470 | | | | | | — | | | | | | 9,098,340 | | | | | | (4,926,046) | | | | | | 16,276,764 | | |
| 12/31/2018 | | | | | 625,694 | | | | | | — | | | | | | 136,181 | | | | | | (140,544) | | | | | | 621,331 | | | | | | 13,183,474 | | | | | | — | | | | | | 2,813,490 | | | | | | (2,961,018) | | | | | | 13,035,946 | | |
| Class S | | | | | | | | | | | | | | | | | | | | | | | | | | | | | | | | | | | | | | | | | | | | | | | | | | | | | | | | | | | | | |
| 12/31/2019 | | | | | 658,703 | | | | | | — | | | | | | 5,496,427 | | | | | | (17,703,790) | | | | | | (11,548,660) | | | | | | 12,062,734 | | | | | | — | | | | | | 90,163,666 | | | | | | (287,137,394) | | | | | | (184,910,994) | | |
| 12/31/2018 | | | | | 2,024,662 | | | | | | — | | | | | | 2,319,873 | | | | | | (2,960,199) | | | | | | 1,384,336 | | | | | | 42,016,660 | | | | | | — | | | | | | 47,325,409 | | | | | | (60,041,906) | | | | | | 29,300,163 | | |
| | | |
Shares
sold |
| |
Shares
issued in merger |
| |
Reinvestment
of distributions |
| |
Shares
redeemed |
| |
Net increase
(decrease) in shares outstanding |
| |
Shares
sold |
| |
Proceeds
from shares issued in merger |
| |
Reinvestment
of distributions |
| |
Shares
redeemed |
| |
Net increase
(decrease) |
| ||||||||||||||||||||||||||||||
| Year or period ended |
| |
#
|
| |
#
|
| |
#
|
| |
#
|
| |
#
|
| |
($)
|
| |
($)
|
| |
($)
|
| |
($)
|
| |
($)
|
| ||||||||||||||||||||||||||||||
| JPMorgan Small Cap Core Equity (continued) | | ||||||||||||||||||||||||||||||||||||||||||||||||||||||||||||
| Class S2 | | | | | | | | | | | | | | | | | | | | | | | | | | | | | | | | | | | | | | | | | | | | | | | | | | | | | | | | | | | | | |
| 12/31/2019 | | | | | 66,390 | | | | | | — | | | | | | 471,344 | | | | | | (1,633,302) | | | | | | (1,095,568) | | | | | | 1,210,000 | | | | | | — | | | | | | 7,636,142 | | | | | | (26,108,989) | | | | | | (17,262,847) | | |
| 12/31/2018 | | | | | 66,344 | | | | | | — | | | | | | 206,535 | | | | | | (304,232) | | | | | | (31,353) | | | | | | 1,321,425 | | | | | | — | | | | | | 4,165,809 | | | | | | (6,272,138) | | | | | | (784,904) | | |
|
Counterparty
|
| |
Securities
Loaned at Value |
| |
Cash
Collateral Received(1) |
| |
Net
Amount |
| |||||||||
| Barclays Bank PLC | | | | $ | 90,035 | | | | | $ | (90,035) | | | | | $ | — | | |
| Citigroup Global Markets Inc | | | | | 419,743 | | | | | | (419,743) | | | | | | — | | |
| Citigroup Global Markets Limited | | | | | 131,542 | | | | | | (131,542) | | | | | | — | | |
| Cowen Execution Services LLC | | | | | 103,927 | | | | | | (103,927) | | | | | | — | | |
| Goldman Sachs & Co. LLC | | | | | 627,247 | | | | | | (627,247) | | | | | | — | | |
| J.P. Morgan Securities LLC | | | | | 128,936 | | | | | | (128,936) | | | | | | — | | |
| Janney Montgomery Scott LLC | | | | | 20,133 | | | | | | (20,133) | | | | | | — | | |
| Morgan Stanley & Co. LLC | | | | | 186,262 | | | | | | (186,262) | | | | | | — | | |
| RBC Dominion Securities Inc | | | | | 107,106 | | | | | | (107,106) | | | | | | — | | |
| TD Securities (USA) Inc | | | | | 199,973 | | | | | | (199,973) | | | | | | — | | |
| UBS Securities LLC | | | | | 89,843 | | | | | | (89,843) | | | | | | — | | |
| Wells Fargo Securities LLC | | | | | 4,258 | | | | | | (4,258) | | | | | | — | | |
| Total | | | | $ | 2,109,005 | | | | | $ | (2,109,005) | | | | | $ | — | | |
|
Counterparty
|
| |
Securities
Loaned at Value |
| |
Cash
Collateral Received(1) |
| |
Net
Amount |
| |||||||||
| Barclays Bank PLC | | | | $ | 8,427 | | | | | $ | (8,427) | | | | | $ | — | | |
| Barclays Capital Inc | | | | | 9,518,628 | | | | | | (9,518,628) | | | | | | — | | |
| BNP Paribas | | | | | 4,752,867 | | | | | | (4,752,867) | | | | | | — | | |
|
BNP Paribas Prime Brokerage Intl Ltd
|
| | | | 4,702,882 | | | | | | (4,702,882) | | | | | | — | | |
| BofA Securities Inc | | | | | 13,725,491 | | | | | | (13,725,491) | | | | | | — | | |
| Citadel Clearing LLC | | | | | 3,816,350 | | | | | | (3,816,350) | | | | | | — | | |
| Citigroup Global Markets Inc | | | | | 6,068,717 | | | | | | (6,068,717) | | | | | | — | | |
|
Cowen Execution Services LLC
|
| | | | 1,856,985 | | | | | | (1,856,985) | | | | | | — | | |
|
Credit Suisse Securities (USA) LLC
|
| | | | 505,064 | | | | | | (505,064) | | | | | | — | | |
| Deutsche Bank Securities Inc | | | | | 4,585,342 | | | | | | (4,585,342) | | | | | | — | | |
| Goldman Sachs & Co. LLC | | | | | 13,847,769 | | | | | | (13,847,769) | | | | | | — | | |
| J.P. Morgan Securities LLC | | | | | 23,742,157 | | | | | | (23,742,157) | | | | | | — | | |
| Morgan Stanley & Co. LLC | | | | | 4,930,818 | | | | | | (4,930,818) | | | | | | — | | |
|
Nomura Securities International,
Inc |
| | | | 1,071,430 | | | | | | (1,071,430) | | | | | | — | | |
| RBC Capital Markets, LLC | | | | | 2,704,662 | | | | | | (2,704,662) | | | | | | — | | |
| RBC Dominion Securities Inc | | | | | 5,252,815 | | | | | | (5,252,815) | | | | | | — | | |
| Scotia Capital (USA) Inc | | | | | 394,841 | | | | | | (394,841) | | | | | | — | | |
|
State Street Bank and Trust Company
|
| | | | 125,530 | | | | | | (125,530) | | | | | | — | | |
|
SunTrust Robinson Humphrey, Inc
|
| | | | 1,112,580 | | | | | | (1,112,580) | | | | | | — | | |
| TD Securities (USA) Inc | | | | | 807,666 | | | | | | (807,666) | | | | | | — | | |
| Wells Fargo Securities LLC | | | | | 12,268,601 | | | | | | (12,268,601) | | | | | | — | | |
| Total | | | | $ | 115,799,622 | | | | | $ | (115,799,622) | | | | | $ | — | | |
|
Counterparty
|
| |
Securities
Loaned at Value |
| |
Cash
Collateral Received(1) |
| |
Net
Amount |
| |||||||||
| BofA Securities Inc | | | | $ | 14,613,174 | | | | | $ | (14,613,174) | | | | | $ | — | | |
| Citigroup Global Markets Inc | | | | | 5,837,390 | | | | | | (5,837,390) | | | | | | — | | |
| J.P. Morgan Securities LLC | | | | | 12,280,566 | | | | | | (12,280,566) | | | | | | — | | |
| Wells Fargo Securities LLC | | | | | 350,991 | | | | | | (350,991) | | | | | | — | | |
| Total | | | | $ | 33,082,121 | | | | | $ | (33,082,121) | | | | | $ | — | | |
|
Counterparty
|
| |
Securities
Loaned at Value |
| |
Cash
Collateral Received(1) |
| |
Net
Amount |
| |||||||||
| Barclays Capital Inc | | | | $ | 98,496 | | | | | $ | (98,496) | | | | | $ | — | | |
| BofA Securities Inc | | | | | 9,132,022 | | | | | | (9,132,022) | | | | | | — | | |
| Citigroup Global Markets Inc | | | | | 3,642,113 | | | | | | (3,642,113) | | | | | | — | | |
| J.P. Morgan Securities LLC | | | | | 10,363,121 | | | | | | (10,363,121) | | | | | | — | | |
| Janney Montgomery Scott LLC | | | | | 2,356,380 | | | | | | (2,356,380) | | | | | | — | | |
|
National Bank of Canada Financial
Inc |
| | | | 109,706 | | | | | | (109,706) | | | | | | — | | |
| Scotia Capital (USA) Inc | | | | | 2,693,051 | | | | | | (2,693,051) | | | | | | — | | |
| TD Prime Services LLC | | | | | 1,379,206 | | | | | | (1,379,206) | | | | | | — | | |
| UBS AG | | | | | 102,874 | | | | | | (102,874) | | | | | | — | | |
| Wells Fargo Bank NA | | | | | 594,895 | | | | | | (594,895) | | | | | | — | | |
| Total | | | | $ | 30,471,864 | | | | | $ | (30,471,864) | | | | | $ | — | | |
|
Counterparty
|
| |
Securities
Loaned at Value |
| |
Cash
Collateral Received(1) |
| |
Net
Amount |
| |||||||||
| Barclays Capital Inc | | | | $ | 4,972 | | | | | $ | (4,972) | | | | | $ | — | | |
| Total | | | | $ | 4,972 | | | | | $ | (4,972) | | | | | $ | — | | |
|
Counterparty
|
| |
Securities
Loaned at Value |
| |
Cash
Collateral Received(1) |
| |
Net
Amount |
| |||||||||
| BMO Capital Markets Corp | | | | $ | 577,824 | | | | | $ | (577,824) | | | | | $ | — | | |
|
BNP Paribas Prime Brokerage Intl
Ltd |
| | | | 1,407,613 | | | | | | (1,407,613) | | | | | | — | | |
| BofA Securities Inc | | | | | 2,764,103 | | | | | | (2,764,103) | | | | | | — | | |
| Citadel Clearing LLC | | | | | 3,975,845 | | | | | | (3,975,845) | | | | | | — | | |
| Citadel Securities LLC | | | | | 5,145,194 | | | | | | (5,145,194) | | | | | | — | | |
| Citigroup Global Markets Inc | | | | | 8,134,851 | | | | | | (8,134,851) | | | | | | — | | |
| Credit Suisse AG | | | | | 917,280 | | | | | | (917,280) | | | | | | — | | |
| Goldman Sachs & Co. LLC | | | | | 5,753,236 | | | | | | (5,753,236) | | | | | | — | | |
| J.P. Morgan Securities LLC | | | | | 9,893,287 | | | | | | (9,893,287) | | | | | | — | | |
| Jefferies LLC | | | | | 132,883 | | | | | | (132,883) | | | | | | — | | |
| Morgan Stanley & Co. LLC | | | | | 11,679,720 | | | | | | (11,679,720) | | | | | | — | | |
|
National Bank of Canada Financial
Inc |
| | | | 416,798 | | | | | | (416,798) | | | | | | — | | |
U.S. Stock Index (continued)
|
Counterparty
|
| |
Securities
Loaned at Value |
| |
Cash
Collateral Received(1) |
| |
Net
Amount |
| |||||||||
| National Financial Services LLC | | | | | 1,941,539 | | | | | | (1,941,539) | | | | | | — | | |
| RBC Capital Markets, LLC | | | | | 145,543 | | | | | | (145,543) | | | | | | — | | |
| Scotia Capital (USA) Inc | | | | | 830,529 | | | | | | (830,529) | | | | | | — | | |
|
State Street Bank and Trust Company
|
| | | | 11,868,597 | | | | | | (11,868,597) | | | | | | — | | |
| TD Prime Services LLC | | | | | 1,795,790 | | | | | | (1,795,790) | | | | | | — | | |
| UBS Securities LLC | | | | | 4,679,821 | | | | | | (4,679,821) | | | | | | — | | |
| Wells Fargo Bank NA | | | | | 3,145,321 | | | | | | (3,145,321) | | | | | | — | | |
| Wells Fargo Securities LLC | | | | | 3,104,620 | | | | | | (3,104,620) | | | | | | — | | |
| Total | | | | $ | 78,310,394 | | | | | $ | (78,310,394) | | | | | $ | — | | |
| | |||||||||||||||||||
|
Counterparty
|
| |
Securities
Loaned at Value |
| |
Cash
Collateral Received(1) |
| |
Net
Amount |
| |||||||||
|
National Bank of Canada Financial Inc
|
| | | $ | 5,356,212 | | | | | $ | (5,356,212) | | | | | $ | — | | |
| Total | | | | $ | 5,356,212 | | | | | $ | (5,356,212) | | | | | $ | — | | |
|
Counterparty
|
| |
Securities
Loaned at Value |
| |
Cash
Collateral Received(1) |
| |
Net
Amount |
| |||||||||
| Barclays Capital Inc | | | | $ | 452,930 | | | | | $ | (452,930) | | | | | $ | — | | |
| BMO Capital Markets Corp | | | | | 7,617 | | | | | | (7,617) | | | | | | — | | |
| BofA Securities Inc | | | | | 304,634 | | | | | | (304,634) | | | | | | — | | |
| Citadel Clearing LLC | | | | | 4,468,544 | | | | | | (4,468,544) | | | | | | — | | |
| Citadel Securities LLC | | | | | 36,575 | | | | | | (36,575) | | | | | | — | | |
| Citigroup Global Markets Inc | | | | | 479,697 | | | | | | (479,697) | | | | | | — | | |
| Credit Suisse AG | | | | | 803,820 | | | | | | (803,820) | | | | | | — | | |
|
Counterparty
|
| |
Securities
Loaned at Value |
| |
Cash
Collateral Received(1) |
| |
Net
Amount |
| |||||||||
|
Credit Suisse Securities (USA) LLC
|
| | | | 44,746 | | | | | | (44,746) | | | | | | — | | |
|
Daiwa Capital Markets America Inc
|
| | | | 203,422 | | | | | | (203,422) | | | | | | — | | |
| Goldman Sachs &Co. LLC | | | | | 423,173 | | | | | | (423,173) | | | | | | — | | |
| HSBC Bank PLC | | | | | 6,768 | | | | | | (6,768) | | | | | | — | | |
|
Industrial And Commercial Bank Of China
|
| | | | 257,507 | | | | | | (257,507) | | | | | | — | | |
| Jefferies LLC | | | | | 23,723 | | | | | | (23,723) | | | | | | — | | |
| Morgan Stanley & Co. LLC | | | | | 1,682,077 | | | | | | (1,682,077) | | | | | | — | | |
|
National Bank of Canada Financial
Inc |
| | | | 951,395 | | | | | | (951,395) | | | | | | — | | |
| National Financial Services LLC | | | | | 3,857,651 | | | | | | (3,857,651) | | | | | | — | | |
| Scotia Capital (USA) Inc | | | | | 1,486,428 | | | | | | (1,486,428) | | | | | | — | | |
| SG Americas Securities, LLC | | | | | 186 | | | | | | (186) | | | | | | — | | |
|
State Street Bank and Trust Company
|
| | | | 150,736 | | | | | | (150,736) | | | | | | — | | |
| Wells Fargo Securities LLC | | | | | 298,703 | | | | | | (298,703) | | | | | | — | | |
| Total | | | | $ | 15,940,332 | | | | | $ | (15,940,332) | | | | | $ | — | | |
| | |||||||||||||||||||
| | | |
Year Ended
December 31, 2019 |
| |
Year Ended
December 31, 2018 |
| ||||||||||||||||||||||||
| | | |
Ordinary
Income |
| |
Long-term
Capital Gains |
| |
Return of Capital
|
| |
Ordinary
Income |
| |
Long-term
Capital Gains |
| |||||||||||||||
| Balanced Income | | | | $ | 17,507,119 | | | | | $ | 22,330,665 | | | | | $ | — | | | | | $ | 21,388,006 | | | | | $ | — | | |
| High Yield | | | | | 27,626,712 | | | | | | — | | | | | | — | | | | | | 29,906,645 | | | | | | — | | |
| Large Cap Growth | | | | | 92,570,069 | | | | | | 861,560,330 | | | | | | — | | | | | | 100,614,276 | | | | | | 738,363,692 | | |
| Large Cap Value | | | | | 20,135,479 | | | | | | 75,474,848 | | | | | | — | | | | | | 36,185,341 | | | | | | 113,218,192 | | |
| Limited Maturity Bond | | | | | 4,822,692 | | | | | | — | | | | | | — | | | | | | 4,602,405 | | | | | | — | | |
| U.S. Stock Index | | | | | 102,304,549 | | | | | | 350,050,354 | | | | | | — | | | | | | 90,048,735 | | | | | | 284,391,334 | | |
| Clarion Real Estate | | | | | 6,789,635 | | | | | | 1,619,442 | | | | | | — | | | | | | 9,797,840 | | | | | | 35,848,143 | | |
| JPMorgan Small Cap Core Equity | | | | | 17,498,317 | | | | | | 175,897,372 | | | | | | 9,547,328 | | | | | | 16,561,211 | | | | | | 78,730,540 | | |
| | | |
Undistributed
Ordinary Income |
| |
Undistributed
Long-term Capital Gains |
| |
Unrealized
Appreciation/ (Depreciation) |
| |
Capital Loss Carryforwards
|
| |||||||||||||||||||||
| | | |
Amount
|
| |
Character
|
| |
Expiration
|
| ||||||||||||||||||||||||
| Balanced Income | | | | $ | 21,831,849 | | | | | $ | 14,167,103 | | | | | $ | 18,069,843 | | | | | | — | | | |
—
|
| | | | — | | |
| High Yield | | | | | 173,288 | | | | | | — | | | | | | 16,758,916 | | | | | $ | (1,630,216) | | | |
Short-term
|
| | | | None | | |
| | | | | | | | | | | | | | | | | | | | | | | | (36,518,131) | | | |
Long-term
|
| | | | None | | |
| | | | | | | | | | | | | | | | | | | | | | | $ | (38,148,347) | | | | | | | | | | | |
| Large Cap Growth | | | | | 31,894,555 | | | | | | 669,794,412 | | | | | | 1,183,390,589 | | | | | | — | | | |
—
|
| | | | — | | |
| Large Cap Value | | | | | 3,944,962 | | | | | | 85,409,561 | | | | | | 117,012,757 | | | | | | — | | | |
—
|
| | | | — | | |
| Limited Maturity Bond | | | | | 3,427,298 | | | | | | — | | | | | | 1,447,797 | | | | | $ | (826,824) | | | |
Short-term
|
| | | | None | | |
| | | | | | | | | | | | | | | | | | | | | | | | (2,362,268) | | | |
Long-term
|
| | | | None | | |
| | | | | | | | | | | | | | | | | | | | | | | $ | (3,189,092) | | | | | | | | | | | |
| U.S. Stock Index | | | | | 26,966,468 | | | | | | 271,466,903 | | | | | | 2,616,351,356 | | | | | | — | | | |
—
|
| | | | — | | |
| Clarion Real Estate | | | | | 14,812,854 | | | | | | 18,855,671 | | | | | | 31,412,215 | | | | | | — | | | |
—
|
| | | | — | | |
| JPMorgan Small Cap Core Equity | | | | | — | | | | | | — | | | | | | 81,696,538 | | | | | | — | | | |
—
|
| | | | — | | |
| | Net investment income | | | | $ | 32,344,944 | | |
| | Net realized and unrealized loss on investments | | | | $ | 49,001,240 | | |
| | Net decrease in net assets resulting from operations | | | | $ | 81,346,184 | | |
| |
Total Net
Assets of Acquired Portfolio (000s) |
| |
Total Net
Assets of Acquiring Portfolio (000s) |
| |
Acquired
Portfolio’s Capital Loss Carryforwards (000s) |
| |
Acquired
Portfolio’s Unrealized Depreciation (000s) |
| |
Portfolios’
Conversion Ratio |
| ||||||||||||
| |
$98,023
|
| | | $ | 492,447 | | | | | $ | 3,146 | | | | | $ | 911 | | | | | | 1.1651 | | |
| | | |
Per Share
Amount |
| |
Payable
Date |
| |
Record
Date |
| ||||||
| High Yield | | | | | | | | | | | | | | | | |
| Class ADV | | | | $ | 0.0415 | | | |
February 3, 2020
|
| | | | Daily | | |
| Class I | | | | $ | 0.0466 | | | |
February 3, 2020
|
| | | | Daily | | |
| Class S | | | | $ | 0.0445 | | | |
February 3, 2020
|
| | | | Daily | | |
| Class S2 | | | | $ | 0.0433 | | | |
February 3, 2020
|
| | | | Daily | | |
| | | |
Per Share
Amount |
| |
Payable
Date |
| |
Record
Date |
| ||||||
| Limited Maturity Bond | | | | | | | | | | | | | | | | |
| Class ADV | | | | $ | 0.0136 | | | |
February 3, 2020
|
| | | | Daily | | |
| Class I | | | | $ | 0.0191 | | | |
February 3, 2020
|
| | | | Daily | | |
| Class S | | | | $ | 0.0171 | | | |
February 3, 2020
|
| | | | Daily | | |
| Voya Balanced Income Portfolio | as of December 31, 2019 |
|
Shares
|
| |
Value
|
| |
Percentage
of Net Assets |
| |||||||||
| COMMON STOCK: 39.4% | | |||||||||||||||
| | | | Communication Services: 2.5% | | ||||||||||||
| 50,031 | | | AT&T, Inc. | | | | $ | 1,955,211 | | | | | | 0.5 | | |
| 24,462 (1) | | | Auto Trader Group PLC | | | | | 193,181 | | | | | | 0.1 | | |
| 27,609 | | | Verizon Communications, Inc. |
| | | | 1,695,193 | | | | | | 0.4 | | |
| 521,090 (2) | | | Other Securities | | | | | 5,683,813 | | | | | | 1.5 | | |
| | | | | | | | | 9,527,398 | | | | | | 2.5 | | |
| | | | Consumer Discretionary: 3.4% | | ||||||||||||
| 442,195 (3) | | | Other Securities | | | |
|
13,202,828
|
| | | |
|
3.4
|
| |
| | | | | | ||||||||||||
| | | | Consumer Staples: 3.3% | | ||||||||||||
| 10,732 | | | PepsiCo, Inc. | | | | | 1,466,742 | | | | | | 0.4 | | |
| 15,590 | | | Philip Morris International, Inc. |
| | | | 1,326,553 | | | | | | 0.3 | | |
| 15,784 | | | Procter & Gamble Co. | | | | | 1,971,422 | | | | | | 0.5 | | |
| 229,958 | | | Other Securities | | | | | 8,153,001 | | | | | | 2.1 | | |
| | | | | | | | | 12,917,718 | | | | | | 3.3 | | |
| | | | Energy: 1.6% | | ||||||||||||
| 12,916 | | | Chevron Corp. | | | | | 1,556,507 | | | | | | 0.4 | | |
| 203,010 (3) | | | Other Securities | | | | | 4,762,078 | | | | | | 1.2 | | |
| | | | | | | | | 6,318,585 | | | | | | 1.6 | | |
| | | | Financials: 5.4% | | ||||||||||||
| 10,296 (1) | | | ABN AMRO Bank NV | | | | | 187,659 | | | | | | 0.1 | | |
| 17,068 | | | JPMorgan Chase & Co. | | | | | 2,379,279 | | | | | | 0.6 | | |
| 24,698 | | | Wells Fargo & Co. | | | | | 1,328,753 | | | | | | 0.3 | | |
| 827,815 (3) | | | Other Securities | | | | | 17,172,908 | | | | | | 4.4 | | |
| | | | | | | | | 21,068,599 | | | | | | 5.4 | | |
| | | | Health Care: 5.2% | | ||||||||||||
| 14,846 | | | AbbVie, Inc. | | | | | 1,314,465 | | | | | | 0.3 | | |
| 20,730 | | | Bristol-Myers Squibb Co. | | | | | 1,330,659 | | | | | | 0.4 | | |
| 16,102 | | | Johnson & Johnson | | | | | 2,348,799 | | | | | | 0.6 | | |
| 17,766 | | | Merck & Co., Inc. | | | | | 1,615,818 | | | | | | 0.4 | | |
| 41,014 | | | Pfizer, Inc. | | | | | 1,606,928 | | | | | | 0.4 | | |
| 131,888 | | | Other Securities | | | | | 12,067,379 | | | | | | 3.1 | | |
| | | | | | | | | 20,284,048 | | | | | | 5.2 | | |
| | | | Industrials: 4.0% | | ||||||||||||
| 1,055 (1) | | | Aena SME SA | | | | | 202,263 | | | | | | 0.0 | | |
| 453,649 | | | Other Securities | | | | | 15,463,067 | | | | | | 4.0 | | |
| | | | | | | | | 15,665,330 | | | | | | 4.0 | | |
| | | | Information Technology: 9.5% | | ||||||||||||
| 30,608 | | | Cisco Systems, Inc. | | | | | 1,467,960 | | | | | | 0.4 | | |
| 30,634 | | | Intel Corp. | | | | | 1,833,445 | | | | | | 0.5 | | |
| 35,478 | | | Microsoft Corp. | | | | | 5,594,880 | | | | | | 1.4 | | |
| 474,734 (2)(3) | | | Other Securities | | | | | 27,776,068 | | | | | | 7.2 | | |
| | | | | | | | | 36,672,353 | | | | | | 9.5 | | |
|
Shares
|
| |
Value
|
| |
Percentage
of Net Assets |
| |||||||||
| COMMON STOCK: (continued) | | |||||||||||||||
| | | | Materials: 1.1% | | ||||||||||||
|
221,945
|
| |
Other Securities
|
| | | $ | 4,119,138 | | | | | | 1.1 | | |
| | | | | | ||||||||||||
| | | | Real Estate: 1.7% | | ||||||||||||
| 352,937 | | | Other Securities | | | |
|
6,651,292
|
| | | |
|
1.7
|
| |
| | | | Utilities: 1.7% | | ||||||||||||
| 251,497 | | | Other Securities | | | |
|
6,620,451
|
| | | |
|
1.7
|
| |
| | | | Total Common Stock (Cost $134,651,115) |
| | |
|
153,047,740
|
| | | |
|
39.4
|
| |
| EXCHANGE-TRADED FUNDS: 0.6% | | |||||||||||||||
| 12,760 | | |
iShares Russell 1000 ETF
|
| | | | 2,276,639 | | | | | | 0.6 | | |
| 1,034 | | | Other Securities | | | | | 71,801 | | | | | | 0.0 | | |
| | | | Total Exchange-Traded Funds (Cost $2,273,955) |
| | |
|
2,348,440
|
| | | |
|
0.6
|
| |
| MUTUAL FUNDS: 8.5% | | |||||||||||||||
| | | | Affiliated Investment Companies: 8.5% | | ||||||||||||
| 3,493,812 | | | Voya Floating Rate Fund - Class P |
| | |
|
33,156,275
|
| | | |
|
8.5
|
| |
| | | | Total Mutual Funds (Cost $33,771,324) |
| | |
|
33,156,275
|
| | | |
|
8.5
|
| |
| PREFERRED STOCK: 0.5% | | |||||||||||||||
| | | | Financials: 0.5% | | ||||||||||||
| 50 (4)(5) | | | Fannie Mae | | | |
|
2,012,442
|
| | | |
|
0.5
|
| |
| | | | Total Preferred Stock (Cost $4,100,000) |
| | |
|
2,012,442
|
| | | |
|
0.5
|
| |
| RIGHTS: 0.0% | | |||||||||||||||
| | | | Energy: 0.0% | | ||||||||||||
| 1,886 (2) | | | Other Securities | | | |
|
895
|
| | | |
|
0.0
|
| |
| | | | Total Rights (Cost $892) |
| | |
|
895
|
| | | |
|
0.0
|
| |
| | ||||||||||||||||
| Principal Amount† |
| |
Value
|
| |
Percentage
of Net Assets |
| |||||||||
| CORPORATE BONDS/NOTES: 6.6% | | |||||||||||||||
| | | | Basic Materials: 0.5% | | ||||||||||||
| 200,000 (1) | | | Celulosa Arauco y Constitucion SA, 4.250%, 04/30/2029 |
| | | | 203,569 | | | | | | 0.0 | | |
| 100,000 (1) | | | Compass Minerals International, Inc., 6.750%, 12/01/2027 |
| | | | 106,435 | | | | | | 0.0 | | |
| 250,000 (1) | | | Evraz PLC, 5.250%, 04/02/2024 |
| | | | 271,606 | | | | | | 0.1 | | |
| 200,000 (1) | | | Gold Fields Orogen Holdings BVI Ltd., 5.125%, 05/15/2024 |
| | | | 214,017 | | | | | | 0.1 | | |
| 225,000 (1) | | | MMK International Capital DAC, 4.375%, 06/13/2024 |
| | | | 238,004 | | | | | | 0.1 | | |
| Voya Balanced Income Portfolio | as of December 31, 2019 (continued) |
| Principal Amount† |
| |
Value
|
| |
Percentage
of Net Assets |
| |||||||||
| CORPORATE BONDS/NOTES: (continued) | | |||||||||||||||
| | | | Basic Materials (continued) | | ||||||||||||
| 100,000 (1) | | | Novelis Corp., 5.875%, 09/30/2026 |
| | | $ | 106,643 | | | | | | 0.0 | | |
| 100,000 (1) | | | Schweitzer-Mauduit International, Inc., 6.875%, 10/01/2026 |
| | | | 108,035 | | | | | | 0.0 | | |
| 100,000 (1) | | | Tronox, Inc., 6.500%, 04/15/2026 |
| | | | 103,272 | | | | | | 0.0 | | |
| 100,000 (1) | | | Univar Solutions USA, Inc., 5.125%, 12/01/2027 |
| | | | 104,563 | | | | | | 0.0 | | |
| 600,000 (3) | | | Other Securities | | | | | 639,493 | | | | | | 0.2 | | |
| | | | | | | | | 2,095,637 | | | | | | 0.5 | | |
| | | | Communications: 0.9% | | ||||||||||||
| 100,000 (1) | | | Block Communications, Inc., 6.875%, 02/15/2025 |
| | | | 103,999 | | | | | | 0.0 | | |
| 100,000 (1) | | | CCO Holdings LLC / CCO Holdings Capital Corp., 5.750%, 02/15/2026 |
| | | | 105,687 | | | | | | 0.1 | | |
| 86,000 (1) | | | Clear Channel Worldwide Holdings, Inc., 9.250%, 02/15/2024 |
| | | | 95,424 | | | | | | 0.0 | | |
| 100,000 (1) | | | CommScope, Inc., 5.500%, 06/15/2024 |
| | | | 101,501 | | | | | | 0.0 | | |
| 100,000 (1) | | | Cumulus Media New Holdings, Inc., 6.750%, 07/01/2026 |
| | | | 107,312 | | | | | | 0.1 | | |
| 50,000 (1) | | | Diamond Sports Group LLC / Diamond Sports Finance Co., 5.375%, 08/15/2026 |
| | | | 50,671 | | | | | | 0.0 | | |
| 50,000 (1)(6) | | | Diamond Sports Group LLC / Diamond Sports Finance Co., 6.625%, 08/15/2027 |
| | | | 48,718 | | | | | | 0.0 | | |
| 100,000 (1)(6) | | | Entercom Media Corp., 7.250%, 11/01/2024 |
| | | | 105,541 | | | | | | 0.1 | | |
| 25,000 (1) | | | Frontier Communications Corp., 8.000%, 04/01/2027 |
| | | | 26,171 | | | | | | 0.0 | | |
| 100,000 (1) | | | Gray Television, Inc., 7.000%, 05/15/2027 |
| | | | 111,310 | | | | | | 0.1 | | |
| 25,000 (1) | | | Intelsat Jackson Holdings SA, 8.500%, 10/15/2024 |
| | | | 22,823 | | | | | | 0.0 | | |
| 100,000 (1) | | | MDC Partners, Inc., 6.500%, 05/01/2024 |
| | | | 90,750 | | | | | | 0.0 | | |
| 90,000 (1) | | | Midcontinent Communications / Midcontinent Finance Corp., 5.375%, 08/15/2027 |
| | | | 95,431 | | | | | | 0.0 | | |
| 100,000 (1) | | | Nexstar Broadcasting, Inc., 5.625%, 08/01/2024 |
| | | | 104,459 | | | | | | 0.0 | | |
| 100,000 (1) | | | Plantronics, Inc., 5.500%, 05/31/2023 |
| | | | 97,999 | | | | | | 0.0 | | |
| 100,000 (1) | | | Sinclair Television Group, Inc., 5.125%, 02/15/2027 |
| | | | 103,035 | | | | | | 0.0 | | |
| 35,000 (1) | | | Sirius XM Radio, Inc., 4.625%, 07/15/2024 |
| | | | 36,823 | | | | | | 0.0 | | |
| Principal Amount† |
| |
Value
|
| |
Percentage
of Net Assets |
| |||||||||
| CORPORATE BONDS/NOTES: (continued) | | |||||||||||||||
| | | | Communications (continued) | | ||||||||||||
| 50,000 (1) | | | Sirius XM Radio, Inc., 5.000%, 08/01/2027 |
| | | $ | 52,842 | | | | | | 0.0 | | |
| 100,000 (1) | | | TEGNA, Inc., 5.000%, 09/15/2029 |
| | | | 101,875 | | | | | | 0.0 | | |
| 100,000 (1) | | | Telesat Canada / Telesat LLC, 6.500%, 10/15/2027 |
| | | | 104,435 | | | | | | 0.0 | | |
| 100,000 (1) | | | Terrier Media Buyer, Inc., 8.875%, 12/15/2027 |
| | | | 106,000 | | | | | | 0.1 | | |
| 40,000 (1) | | | Townsquare Media, Inc., 6.500%, 04/01/2023 |
| | | | 40,717 | | | | | | 0.0 | | |
| 100,000 (1) | | | ViaSat, Inc., 5.625%, 09/15/2025 |
| | | | 103,209 | | | | | | 0.0 | | |
| 200,000 (1) | | | Virgin Media Secured Finance PLC, 5.500%, 05/15/2029 |
| | | | 212,120 | | | | | | 0.1 | | |
| 1,124,000 (3) | | | Other Securities | | | | | 1,194,041 | | | | | | 0.3 | | |
| | | | | | | | | 3,322,893 | | | | | | 0.9 | | |
| | | | Consumer, Cyclical: 1.1% | | ||||||||||||
| 100,000 (1) | | | 1011778 BC ULC / New Red Finance, Inc., 5.000%, 10/15/2025 |
| | | | 103,459 | | | | | | 0.0 | | |
| 100,000 (1) | | | Allison Transmission, Inc., 5.875%, 06/01/2029 |
| | | | 109,732 | | | | | | 0.1 | | |
| 100,000 (1) | | | Ashton Woods USA LLC / Ashton Woods Finance Co., 6.750%, 08/01/2025 |
| | | | 102,541 | | | | | | 0.0 | | |
| 100,000 (1) | | | Caesars Resort Collection LLC / CRC Finco, Inc., 5.250%, 10/15/2025 |
| | | | 103,625 | | | | | | 0.0 | | |
| 100,000 (1) | | | Cedar Fair L.P., 5.250%, 07/15/2029 |
| | | | 107,935 | | | | | | 0.1 | | |
| 100,000 (1) | | | Core & Main L.P., 6.125%, 08/15/2025 |
| | | | 103,999 | | | | | | 0.0 | | |
| 100,000 (1) | | | Golden Entertainment, Inc., 7.625%, 04/15/2026 |
| | | | 107,987 | | | | | | 0.1 | | |
| 100,000 (1) | | | Golden Nugget, Inc., 6.750%, 10/15/2024 |
| | | | 103,749 | | | | | | 0.0 | | |
| 100,000 (1) | | | IAA, Inc., 5.500%, 06/15/2027 |
| | | | 106,435 | | | | | | 0.0 | | |
| 100,000 (1) | | | Installed Building Products, Inc., 5.750%, 02/01/2028 |
| | | | 107,160 | | | | | | 0.1 | | |
| 100,000 (1) | | | Lions Gate Capital Holdings LLC, 5.875%, 11/01/2024 |
| | | | 101,791 | | | | | | 0.0 | | |
| 100,000 (1) | | | Live Nation Entertainment, Inc., 4.750%, 10/15/2027 |
| | | | 103,685 | | | | | | 0.0 | | |
| 100,000 (1) | | | Mattel, Inc., 5.875%, 12/15/2027 |
| | | | 105,560 | | | | | | 0.0 | | |
| 100,000 (1)(6) | | | Michaels Stores, Inc., 8.000%, 07/15/2027 |
| | | | 95,685 | | | | | | 0.0 | | |
| 100,000 (1) | | | Navistar International Corp., 6.625%, 11/01/2025 |
| | | | 102,084 | | | | | | 0.0 | | |
| Voya Balanced Income Portfolio | as of December 31, 2019 (continued) |
| Principal Amount† |
| |
Value
|
| |
Percentage
of Net Assets |
| |||||||||
| CORPORATE BONDS/NOTES: (continued) | | |||||||||||||||
| | | | Consumer, Cyclical (continued) | | ||||||||||||
| 100,000 (1) | | | Penn National Gaming, Inc., 5.625%, 01/15/2027 |
| | | $ | 105,965 | | | | | | 0.0 | | |
| 100,000 (1) | | | Performance Food Group, Inc., 5.500%, 10/15/2027 |
| | | | 107,128 | | | | | | 0.0 | | |
| 50,000 (1) | | | PetSmart, Inc., 5.875%, 06/01/2025 |
| | | | 51,062 | | | | | | 0.0 | | |
| 50,000 (1) | | | PetSmart, Inc., 7.125%, 03/15/2023 |
| | | | 49,125 | | | | | | 0.0 | | |
| 100,000 (1) | | | Resideo Funding, Inc., 6.125%, 11/01/2026 |
| | | | 101,003 | | | | | | 0.0 | | |
| 50,000 (1) | | | Scientific Games International, Inc., 5.000%, 10/15/2025 |
| | | | 52,500 | | | | | | 0.0 | | |
| 50,000 (1) | | | Scientific Games International, Inc., 8.250%, 03/15/2026 |
| | | | 55,219 | | | | | | 0.1 | | |
| 100,000 (1) | | | Six Flags Entertainment Corp., 5.500%, 04/15/2027 |
| | | | 106,810 | | | | | | 0.0 | | |
| 100,000 (1) | | | Speedway Motorsports LLC / Speedway Funding II, Inc., 4.875%, 11/01/2027 |
| | | | 101,625 | | | | | | 0.0 | | |
| 100,000 (1) | | | Staples, Inc., 7.500%, 04/15/2026 |
| | | | 103,937 | | | | | | 0.0 | | |
| 100,000 (1) | | | Station Casinos LLC, 5.000%, 10/01/2025 |
| | | | 102,000 | | | | | | 0.0 | | |
| 100,000 (1) | | | Taylor Morrison Communities, Inc., 5.750%, 01/15/2028 |
| | | | 109,285 | | | | | | 0.1 | | |
| 100,000 (1) | | | Viking Cruises Ltd., 5.875%, 09/15/2027 |
| | | | 107,060 | | | | | | 0.0 | | |
| 100,000 (1) | | | William Carter Co/The, 5.625%, 03/15/2027 |
| | | | 107,732 | | | | | | 0.1 | | |
| 100,000 (1) | | | Wolverine World Wide, Inc., 5.000%, 09/01/2026 |
| | | | 101,750 | | | | | | 0.0 | | |
| 1,400,000 (3) | | | Other Securities | | | | | 1,456,028 | | | | | | 0.4 | | |
| | | | | | | | | 4,383,656 | | | | | | 1.1 | | |
| | | | Consumer, Non-cyclical: 1.0% | | ||||||||||||
| 200,000 (1) | | | Adani Ports & Special Economic Zone Ltd., 4.375%, 07/03/2029 |
| | | | 207,443 | | | | | | 0.1 | | |
| 100,000 (1) | | | Albertsons Cos, Inc. / Safeway, Inc. / New Albertsons L.P. / Albertsons LLC, 5.875%, 02/15/2028 |
| | | | 106,435 | | | | | | 0.0 | | |
| 100,000 (1) | | | AMN Healthcare, Inc., 4.625%, 10/01/2027 |
| | | | 100,535 | | | | | | 0.0 | | |
| 50,000 (1) | | | Bausch Health Cos, Inc., 5.500%,11/01/2025 |
| | | | 52,354 | | | | | | 0.0 | | |
| 50,000 (1) | | | Bausch Health Cos, Inc., 6.125%, 04/15/2025 |
| | | | 51,766 | | | | | | 0.0 | | |
| 100,000 (1) | | | Cardtronics, Inc. / Cardtronics USA, Inc., 5.500%, 05/01/2025 |
| | | | 104,041 | | | | | | 0.0 | | |
| Principal Amount† |
| |
Value
|
| |
Percentage
of Net Assets |
| |||||||||
| CORPORATE BONDS/NOTES: (continued) | | |||||||||||||||
| | | | Consumer, Non-cyclical (continued) | | ||||||||||||
| 55,000 (1) | | | Catalent Pharma Solutions, Inc., 5.000%, 07/15/2027 |
| | | $ | 57,714 | | | | | | 0.0 | | |
| 100,000 (1) | | | Chobani LLC / Chobani Finance Corp., Inc., 7.500%, 04/15/2025 |
| | | | 100,749 | | | | | | 0.0 | | |
| 100,000 (1) | | | Cott Holdings, Inc., 5.500%, 04/01/2025 |
| | | | 104,708 | | | | | | 0.0 | | |
| 225,000 (1) | | | DP World Crescent Ltd., 3.750%, 01/30/2030 |
| | | | 228,050 | | | | | | 0.1 | | |
| 100,000 (1)(7) | | | Eagle Holding CO II LLC, 7.625% (PIK Rate 8.375%, Cash Rate 7.625%), 05/15/2022 |
| | | | 101,823 | | | | | | 0.0 | | |
| 100,000 (1) | | | Garda World Security Corp., 8.750%, 05/15/2025 |
| | | | 104,249 | | | | | | 0.0 | | |
| 100,000 (1) | | | Graham Holdings Co., 5.750%, 06/01/2026 |
| | | | 107,035 | | | | | | 0.1 | | |
| 100,000 (1) | | | Hertz Corp./The, 7.125%, 08/01/2026 |
| | | | 108,487 | | | | | | 0.1 | | |
| 100,000 (1) | | | JBS USA LUX SA / JBS USA Finance, Inc., 6.750%, 02/15/2028 |
| | | | 110,686 | | | | | | 0.1 | | |
| 100,000 (1) | | | KeHE Distributors LLC / KeHE Finance Corp., 8.625%, 10/15/2026 |
| | | | 104,938 | | | | | | 0.0 | | |
| 50,000 (1) | | | MPH Acquisition Holdings LLC, 7.125%, 06/01/2024 |
| | | | 48,500 | | | | | | 0.0 | | |
| 100,000 (1)(6) | | | Par Pharmaceutical, Inc., 7.500%,04/01/2027 |
| | | | 99,753 | | | | | | 0.0 | | |
| 100,000 (1) | | | Pilgrim’s Pride Corp., 5.750%, 03/15/2025 |
| | | | 103,572 | | | | | | 0.0 | | |
| 50,000 (1)(6)(7) | | | Polaris Intermediate Corp., 8.500% (PIK Rate 9.250%, Cash Rate 8.500%), 12/01/2022 |
| | | | 46,687 | | | | | | 0.0 | | |
| 100,000 (1) | | | Post Holdings, Inc., 5.000%, 08/15/2026 |
| | | | 105,810 | | | | | | 0.0 | | |
| 100,000 (1) | | | Select Medical Corp., 6.250%, 08/15/2026 |
| | | | 108,436 | | | | | | 0.1 | | |
| 100,000 (1) | | | Simmons Foods, Inc., 5.750%, 11/01/2024 |
| | | | 100,709 | | | | | | 0.0 | | |
| 100,000 (1) | | | West Street Merger Sub, Inc., 6.375%, 09/01/2025 |
| | | | 99,999 | | | | | | 0.0 | | |
| 1,345,000 | | | Other Securities | | | | | 1,445,433 | | | | | | 0.4 | | |
| | | | | | | | | 3,909,912 | | | | | | 1.0 | | |
| | | | Energy: 1.0% | | ||||||||||||
| 50,000 (1) | | | Archrock Partners L.P. / Archrock Partners Finance Corp., 6.250%, 04/01/2028 |
| | | | 51,625 | | | | | | 0.0 | | |
| 100,000 (1) | | | Enviva Partners L.P. / Enviva Partners Finance Corp., 6.500%, 01/15/2026 |
| | | | 107,313 | | | | | | 0.0 | | |
| Voya Balanced Income Portfolio | as of December 31, 2019 (continued) |
| Principal Amount† |
| |
Value
|
| |
Percentage
of Net Assets |
| |||||||||
| CORPORATE BONDS/NOTES: (continued) | | |||||||||||||||
| | | | Energy (continued) | | ||||||||||||
| 100,000 (1) | | | Tallgrass Energy Partners L.P. / Tallgrass Energy Finance Corp., 5.500%, 01/15/2028 |
| | | $ | 98,233 | | | | | | 0.0 | | |
| 100,000 (1) | | | Targa Resources Partners L.P. / Targa Resources Partners Finance Corp., 6.875%, 01/15/2029 |
| | | | 111,185 | | | | | | 0.1 | | |
| 3,175,000 (3) | | | Other Securities | | | | | 3,402,241 | | | | | | 0.9 | | |
| | | | | | | | | 3,770,597 | | | | | | 1.0 | | |
| | | | Financial: 0.4% | | ||||||||||||
| 50,000 (1) | | | Allied Universal Holdco LLC / Allied Universal Finance Corp., 6.625%, 07/15/2026 |
| | | | 53,829 | | | | | | 0.0 | | |
| 50,000 (1) | | | Allied Universal Holdco LLC / Allied Universal Finance Corp., 9.750%, 07/15/2027 |
| | | | 53,529 | | | | | | 0.0 | | |
| 100,000 (1) | | | ESH Hospitality, Inc., 5.250%, 05/01/2025 |
| | | | 103,584 | | | | | | 0.0 | | |
| 200,000 (1)(8) | | | Kookmin Bank, 4.350%, 12/31/2199 |
| | | | 203,925 | | | | | | 0.1 | | |
| 105,000 (1) | | | LPL Holdings, Inc., 4.625%, 11/15/2027 |
| | | | 107,363 | | | | | | 0.1 | | |
| 100,000 (1) | | | Quicken Loans, Inc., 5.250%, 01/15/2028 |
| | | | 103,732 | | | | | | 0.0 | | |
| 100,000 (1) | | | Realogy Group LLC / Realogy Co-Issuer Corp., 5.250%, 12/01/2021 |
| | | | 101,225 | | | | | | 0.0 | | |
| 800,000 | | | Other Securities | | | | | 879,374 | | | | | | 0.2 | | |
| | | | | | | | | 1,606,561 | | | | | | 0.4 | | |
| | | | Industrial: 0.7% | | ||||||||||||
| 100,000 (1) | | | Amsted Industries, Inc., 5.625%, 07/01/2027 |
| | | | 106,285 | | | | | | 0.0 | | |
| 100,000 (1) | | | Berry Global, Inc., 5.625%, 07/15/2027 |
| | | | 107,502 | | | | | | 0.0 | | |
| 100,000 (1) | | | BMC East LLC, 5.500%, 10/01/2024 |
| | | | 104,291 | | | | | | 0.0 | | |
| 100,000 (1) | | | Builders FirstSource, Inc., 6.750%, 06/01/2027 |
| | | | 109,910 | | | | | | 0.1 | | |
| 100,000 (1) | | | Cascades, Inc./Cascades USA, Inc., 5.375%, 01/15/2028 |
| | | | 103,000 | | | | | | 0.0 | | |
| 100,000 (1) | | | Clean Harbors, Inc., 5.125%, 07/15/2029 |
| | | | 107,545 | | | | | | 0.0 | | |
| 100,000 (1) | | | FXI Holdings, Inc., 7.875%, 11/01/2024 |
| | | | 96,249 | | | | | | 0.0 | | |
| 100,000 (1) | | | GFL Environmental, Inc., 8.500%, 05/01/2027 |
| | | | 110,185 | | | | | | 0.1 | | |
| 100,000 (1) | | | Granite Holdings US Acquisition Co., 11.000%, 10/01/2027 |
| | | | 101,535 | | | | | | 0.0 | | |
| 200,000 (1) | | | Klabin Austria GmbH, 5.750%, 04/03/2029 |
| | | | 213,372 | | | | | | 0.1 | | |
| Principal Amount† |
| |
Value
|
| |
Percentage
of Net Assets |
| |||||||||
| CORPORATE BONDS/NOTES: (continued) | | |||||||||||||||
| | | | Industrial (continued) | | ||||||||||||
| 100,000 (1) | | | Masonite International Corp., 5.750%, 09/15/2026 |
| | | $ | 106,535 | | | | | | 0.0 | | |
| 100,000 (1) | | | Mauser Packaging Solutions Holding Co., 7.250%, 04/15/2025 |
| | | | 98,999 | | | | | | 0.0 | | |
| 100,000 (1) | | | Norbord, Inc., 5.750%, 07/15/2027 |
| | | | 104,035 | | | | | | 0.0 | | |
| 100,000 (1) | | | Owens-Brockway Glass Container, Inc., 5.375%, 01/15/2025 |
| | | | 103,291 | | | | | | 0.0 | | |
| 100,000 (1) | | | PGT Escrow Issuer, Inc., 6.750%, 08/01/2026 |
| | | | 107,410 | | | | | | 0.0 | | |
| 100,000 (1) | | | Reynolds Group Issuer, Inc. / Reynolds Group Issuer LLC / Reynolds Group Issuer Lu, 5.125%, 07/15/2023 |
| | | | 102,583 | | | | | | 0.0 | | |
| 100,000 (1) | | | Sealed Air Corp., 5.500%, 09/15/2025 |
| | | | 110,292 | | | | | | 0.1 | | |
| 100,000 (1)(6) | | | SSL Robotics LLC, 9.750%, 12/31/2023 |
| | | | 109,000 | | | | | | 0.1 | | |
| 100,000 (1) | | | Standard Industries, Inc./NJ, 5.000%, 02/15/ 2027 |
| | | | 104,482 | | | | | | 0.0 | | |
| 100,000 (1) | | | Stevens Holding Co., Inc., 6.125%, 10/01/2026 |
| | | | 109,535 | | | | | | 0.1 | | |
| 100,000 (1) | | | TransDigm, Inc., 6.250%, 03/15/2026 |
| | | | 108,448 | | | | | | 0.0 | | |
| 376,000 | | | Other Securities | | | | | 420,417 | | | | | | 0.1 | | |
| | | | | | | | | 2,744,901 | | | | | | 0.7 | | |
| | | | Technology: 0.3% | | ||||||||||||
| 100,000 (1) | | | Ascend Learning LLC, 6.875%, 08/01/2025 |
| | | | 105,291 | | | | | | 0.0 | | |
| 100,000 (1) | | | Change Healthcare Holdings LLC / Change Healthcare Finance, Inc., 5.750%, 03/01/2025 |
| | | | 102,999 | | | | | | 0.0 | | |
| 100,000 (1) | | | Dell International LLC / EMC Corp., 7.125%, 06/15/2024 |
| | | | 105,625 | | | | | | 0.1 | | |
| 100,000 (1) | | | MTS Systems Corp., 5.750%, 08/15/2027 |
| | | | 104,785 | | | | | | 0.0 | | |
| 100,000 (1) | | | Open Text Corp., 5.875%, 06/01/2026 |
| | | | 107,185 | | | | | | 0.1 | | |
| 100,000 (1) | | | RP Crown Parent LLC, 7.375%, 10/15/2024 |
| | | | 104,167 | | | | | | 0.0 | | |
| 100,000 (1) | | | Tempo Acquisition LLC / Tempo Acquisition Finance Corp., 6.750%, 06/01/2025 |
| | | | 103,499 | | | | | | 0.0 | | |
| 200,000 | | | Other Securities | | | | | 207,250 | | | | | | 0.1 | | |
| | | | | | | | | 940,801 | | | | | | 0.3 | | |
| | | | Utilities: 0.7% | | ||||||||||||
| 100,000 (1) | | | Vistra Operations Co. LLC, 5.625%, 02/15/2027 |
| | | | 105,560 | | | | | | 0.0 | | |
| Voya Balanced Income Portfolio | as of December 31, 2019 (continued) |
| Principal Amount† |
| |
Value
|
| |
Percentage
of Net Assets |
| |||||||||
| CORPORATE BONDS/NOTES: (continued) | | |||||||||||||||
| | | | Utilities (continued) | | ||||||||||||
| 2,550,000 | | | Other Securities | | | | $ | 2,723,382 | | | | | | 0.7 | | |
| | | | | | | | | 2,828,942 | | | | | | 0.7 | | |
| | | | Total Corporate Bonds/Notes (Cost $24,596,370) |
| | |
|
25,603,900
|
| | | |
|
6.6
|
| |
| | | | | | ||||||||||||
| COLLATERALIZED MORTGAGE OBLIGATIONS: 14.6% | | |||||||||||||||
| 887,703 (1)(8) | | | Agate Bay Mortgage Trust 2015-1 B4, 3.807%, 01/25/2045 |
| | | | 855,912 | | | | | | 0.2 | | |
| 554,530 (1)(8) | | | Chase Mortgage Finance Corp. 2016-SH1 M2, 3.750%, 04/25/2045 |
| | | | 568,469 | | | | | | 0.1 | | |
| 1,578,154 (1)(8) | | | CIM Trust 2019-INV2 A3, 4.000%, 05/25/2049 |
| | | | 1,617,290 | | | | | | 0.4 | | |
| 688,583 (1)(8) | | | CIM Trust 2019-J2 A13, 3.500%, 10/25/2049 |
| | | | 698,098 | | | | | | 0.2 | | |
| 6,878,482 (9) | | | Fannie Mae Interest Strip Series 367 2, 5.500%, 01/01/2036 |
| | | | 1,461,219 | | | | | | 0.4 | | |
| 5,489,389 (9) | | | Fannie Mae REMICS 2012-144 SC, 4.308%, (-1.000*US0001M + 6.100%), 01/25/2043 |
| | | | 1,132,812 | | | | | | 0.3 | | |
| 2,704,669 (9) | | | Fannie Mae REMICS 2012-151 WS, 4.408%, (-1.000*US0001M + 6.200%), 03/25/2042 |
| | | | 377,203 | | | | | | 0.1 | | |
| 6,801,703 (9) | | | Fannie Mae REMICS 2012-35 LS, 4.808%, (-1.000*US0001M + 6.600%), 04/25/2041 |
| | | | 891,242 | | | | | | 0.2 | | |
| 4,988,838 (9) | | | Fannie Mae REMICS 2013-20 SK, 4.408%, (-1.000*US0001M + 6.200%), 05/25/2041 |
| | | | 551,045 | | | | | | 0.1 | | |
| 1,510,767 (9) | | | Fannie Mae REMICS 2018-86 DS, 4.308%, (-1.000*US0001M + 6.100%), 12/25/2048 |
| | | | 191,122 | | | | | | 0.1 | | |
| 7,017,910 (9) | | | Freddie Mac REMICS 4517 KI, 0.450%, (-0.357*US0001M + 1.071%), 04/15/2043 |
| | | | 151,247 | | | | | | 0.0 | | |
| 9,519,553 (9) | | | Freddie Mac REMICS 4596 DI, 3.500%, 06/15/2046 |
| | | | 1,431,131 | | | | | | 0.4 | | |
| 4,043,938 (9) | | | Freddie Mac REMICS 4619 KS, 2.559%, (-1.000*US0001M + 4.250%), 06/15/2039 |
| | | | 506,713 | | | | | | 0.1 | | |
| 1,594,713 (9) | | | Ginnie Mae Series 2013-148 DS, 3.940%, (-1.000*US0001M + 5.680%), 10/16/2043 |
| | | | 267,221 | | | | | | 0.1 | | |
| Principal Amount† |
| |
Value
|
| |
Percentage
of Net Assets |
| |||||||||
| COLLATERALIZED MORTGAGE OBLIGATIONS: (continued) | | |||||||||||||||
| 13,031,128 (9) | | | Ginnie Mae Series 2015-20 CI, 3.500%, 02/20/2030 |
| | | $ | 1,292,960 | | | | | | 0.3 | | |
| 1,263,693 (9) | | | Ginnie Mae Series 2015-42 IY, 5.500%, 08/20/2039 |
| | | | 152,503 | | | | | | 0.0 | | |
| 9,748,223 (9) | | | Ginnie Mae Series 2019-23 MT, 0.600%, (-1.000*US0001M + 6.700%), 03/20/2042 |
| | | | 197,673 | | | | | | 0.1 | | |
| 1,364,957 (1)(8) | | | PSMC 2019-1 A1 Trust, 4.000%, 07/25/2049 |
| | | | 1,391,855 | | | | | | 0.4 | | |
| 1,351,641 (1)(8) | | | Starwood Mortgage Residential Trust 2019-1 A3, 3.299%, 06/25/2049 |
| | | | 1,355,415 | | | | | | 0.3 | | |
| 1,000,000 (1)(8) | | | Deephaven Residential Mortgage Trust 2018-1A M1, 3.939%, 12/25/2057 |
| | | | 1,007,663 | | | | | | 0.3 | | |
| 1,000,009 | | | Fannie Mae Connecticut Avenue Securities 2016-C05 2M2, 6.242%, (US0001M + 4.450%), 01/25/2029 |
| | | | 1,057,300 | | | | | | 0.3 | | |
| 922,609 | | | Fannie Mae Connecticut Avenue Securities 2016-C07 2M2, 6.142%, (US0001M + 4.350%), 05/25/2029 |
| | | | 973,675 | | | | | | 0.3 | | |
| 400,000 | | | Fannie Mae Connecticut Avenue Securities 2017-C06 1M2, 4.442%, (US0001M + 2.650%), 02/25/2030 |
| | | $ | 410,831 | | | | | | 0.1 | | |
| 501,262 | | | Fannie Mae Connecticut Avenue Securities 2017-CO6 2M2, 4.592%, (US0001M + 2.800%), 02/25/2030 |
| | | | 515,233 | | | | | | 0.1 | | |
| 1,100,000 | | | Fannie Mae Connecticut Avenue Securities 2018-C03 1M2, 3.942%, (US0001M + 2.150%), 10/25/2030 |
| | | | 1,109,482 | | | | | | 0.3 | | |
| 1,200,000 | | | Fannie Mae Connecticut Avenue Securities 2018-C04 2M2, 4.342%, (US0001M + 2.550%), 12/25/2030 |
| | | | 1,222,386 | | | | | | 0.3 | | |
| 1,000,000 | | | Fannie Mae Connecticut Avenue Securities 2018-C05 1M2, 4.142%, (US0001M + 2.350%), 01/25/2031 |
| | | | 1,015,208 | | | | | | 0.3 | | |
| 1,138,850 | | | Fannie Mae Connecticut Avenue Securities 2018-C06 1M2, 3.792%, (US0001M + 2.000%), 03/25/2031 |
| | | | 1,144,537 | | | | | | 0.3 | | |
| Voya Balanced Income Portfolio | as of December 31, 2019 (continued) |
| Principal Amount† |
| |
Value
|
| |
Percentage
of Net Assets |
| |||||||||
| COLLATERALIZED MORTGAGE OBLIGATIONS: (continued) | | |||||||||||||||
| 300,000 | | | Fannie Mae Connecticut Avenue Securities 2018-CO1 1M2, 4.042%, (US0001M + 2.250%), 07/25/2030 |
| | | $ | 304,243 | | | | | | 0.1 | | |
| 1,200,000 (1) | | | Fannie Mae Connecticut Avenue Securities 2019-R02 1M2, 4.092%, (US0001M + 2.300%), 08/25/2031 |
| | | | 1,212,129 | | | | | | 0.3 | | |
| 941,671 (1) | | | Fannie Mae Connecticut Avenue Securities Trust 2018-R07 1M2, 4.192%, (US0001M + 2.400%), 04/25/2031 |
| | | | 953,372 | | | | | | 0.2 | | |
| 2,652,122 (9) | | | Fannie Mae REMICS 2008-36 YI, 5.408%, (-1.000*US0001M + 7.200%), 07/25/2036 |
| | | | 403,036 | | | | | | 0.1 | | |
| 1,164,413 (9) | | | Fannie Mae REMICS 2010-59 NS, 3.978%, (-1.000*US0001M + 5.770%), 06/25/2040 |
| | | | 176,660 | | | | | | 0.0 | | |
| 5,902,874 (9) | | | Fannie Mae REMICS 2012-121 ID, 3.000%, 11/25/2027 |
| | | | 402,564 | | | | | | 0.1 | | |
| 7,144,445 (9) | | | Fannie Mae REMICS 2013-71 AI, 3.000%, 07/25/2028 |
| | | | 541,731 | | | | | | 0.1 | | |
| 500,000 (1)(8) | | | Flagstar Mortgage Trust 2017-1 1A7, 3.500%, 03/25/2047 |
| | | | 512,770 | | | | | | 0.1 | | |
| 931,866 (1)(8) | | | Flagstar Mortgage Trust 2017-1 B3, 3.684%, 03/25/2047 |
| | | | 938,386 | | | | | | 0.3 | | |
| 1,985,165 (1)(8) | | | Flagstar Mortgage Trust 2018-3INV A3, 4.000%, 05/25/2048 |
| | | | 2,029,898 | | | | | | 0.5 | | |
| 700,000 | | | Freddie Mac Structured Agency Credit Risk Debt Notes 2015-DNA2 M3, 5.692%, (US0001M + 3.900%), 12/25/2027 |
| | | | 724,426 | | | | | | 0.2 | | |
| 540,183 | | | Freddie Mac Structured Agency Credit Risk Debt Notes 2015-HQ1 M3, 5.592%, (US0001M + 3.800%), 03/25/2025 |
| | | | 554,343 | | | | | | 0.1 | | |
| 700,000 | | | Freddie Mac Structured Agency Credit Risk Debt Notes 2016-DNA1 M3, 7.342%, (US0001M + 5.550%), 07/25/2028 |
| | | | 772,912 | | | | | | 0.2 | | |
| 600,000 | | | Freddie Mac Structured Agency Credit Risk Debt Notes 2017-DNA2 M2, 5.242%, (US0001M + 3.450%), 10/25/2029 |
| | | | 639,736 | | | | | | 0.2 | | |
| 1,300,000 (1) | | | Freddie Mac Structured Agency Credit Risk Debt Notes 2019-DNA1 M2, 4.442%, (US0001M + 2.650%), 01/25/2049 |
| | | | 1,325,259 | | | | | | 0.3 | | |
| Principal Amount† |
| |
Value
|
| |
Percentage
of Net Assets |
| |||||||||
| COLLATERALIZED MORTGAGE OBLIGATIONS: (continued) | | |||||||||||||||
| 1,158,902 (9) | | | Freddie Mac REMICS 3318 KS, 4.670%, (-1.000*US0001M + 6.410%), 05/15/2037 |
| | | $ | 146,601 | | | | | | 0.0 | | |
| 1,397,579 (9) | | | Freddie Mac REMICS 3879 SL, 4.860%, (-1.000*US0001M + 6.600%), 01/15/2041 |
| | | | 186,539 | | | | | | 0.1 | | |
| 5,715,989 (9) | | | Freddie Mac REMICS 4120 JS, 4.460%, (-1.000*US0001M + 6.200%), 10/15/2032 |
| | | | 878,737 | | | | | | 0.2 | | |
| 4,281,440 (9) | | | Freddie Mac REMICS 4141 EI, 3.000%, 09/15/2027 |
| | | | 253,665 | | | | | | 0.1 | | |
| 5,286,311 (9) | | | Freddie Mac REMICS 4153 IB, 2.500%, 01/15/2028 |
| | | | 314,209 | | | | | | 0.1 | | |
| 733,471 (1)(8) | | | GS Mortgage-Backed Securities Corp. Trust 2019-PJ2 A1, 4.000%, 11/25/2049 |
| | | | 744,831 | | | | | | 0.2 | | |
| 754,083 (1)(8) | | | J.P. Morgan Mortgage Trust 2019-2 A15, 4.000%, 08/25/2049 |
| | | | 766,610 | | | | | | 0.2 | | |
| 1,775,106 (1)(8) | | | J.P. Morgan Mortgage Trust 2019-LTV1 A3, 4.000%, 06/25/2049 |
| | | | 1,802,598 | | | | | | 0.5 | | |
| 637,695 (1)(8) | | | JP Morgan Mortgage Trust 2016-4 A13, 3.500%, 10/25/2046 |
| | | | 640,620 | | | | | | 0.2 | | |
| 877,772 (1)(8) | | | JP Morgan Mortgage Trust 2017-5 B2, 3.155%, 10/26/2048 |
| | | | 868,480 | | | | | | 0.2 | | |
| 1,156,482 (1)(8) | | | JP Morgan Mortgage Trust 2018-3 B2, 3.762%, 09/25/2048 |
| | | | 1,174,585 | | | | | | 0.3 | | |
| 749,896 (1)(8) | | | JP Morgan Mortgage Trust 2018-4 B2, 3.779%, 10/25/2048 |
| | | | 762,420 | | | | | | 0.2 | | |
| 971,172 (1)(8) | | | JP MORGAN MORTGAGE TRUST 2018-5 A13, 3.500%, 10/25/2048 |
| | | | 997,205 | | | | | | 0.2 | | |
| 756,896 (1)(8) | | | JP Morgan Mortgage Trust 2019-1 A3, 4.000%, 05/25/2049 |
| | | | 768,619 | | | | | | 0.2 | | |
| 792,837 (1)(8) | | | JP Morgan Mortgage Trust 2019-5 A3, 4.000%, 11/25/2049 |
| | | | 805,116 | | | | | | 0.2 | | |
| 990,795 (1)(8) | | | JP Morgan Mortgage Trust 2019-INV1 B2, 5.151%, 10/25/2049 |
| | | | 1,074,003 | | | | | | 0.3 | | |
| 1,288,827 (1)(8) | | | JP Morgan Mortgage Trust 2019-LTV2 A18, 4.000%, 12/25/2049 |
| | | | 1,322,860 | | | | | | 0.3 | | |
| 595,654 (1)(8) | | | JP Morgan Mortgage Trust 2019-LTV2 B3, 4.830%, 12/25/2049 |
| | | | 629,836 | | | | | | 0.2 | | |
| Voya Balanced Income Portfolio | as of December 31, 2019 (continued) |
| Principal Amount† |
| |
Value
|
| |
Percentage
of Net Assets |
| |||||||||
| COLLATERALIZED MORTGAGE OBLIGATIONS: (continued) | | |||||||||||||||
| 1,080,805 (1)(8) | | | New Residential Mortgage Loan Trust 2019-NQM3 A3, 3.086%, 07/25/2049 |
| | | $ | 1,082,051 | | | | | | 0.3 | | |
| 972,731 (1)(8) | | | OBX 2019-INV2 A25 Trust, 4.000%, 05/27/2049 |
| | | | 988,248 | | | | | | 0.3 | | |
| 1,182,632 (1)(8) | | | Sequoia Mortgage Trust 2019-2 B2, 4.244%, 06/25/2049 |
| | | | 1,228,332 | | | | | | 0.3 | | |
| 1,182,632 (1)(8) | | | Sequoia Mortgage Trust 2019-2 B3, 4.244%, 06/25/2049 |
| | | | 1,205,176 | | | | | | 0.3 | | |
| 263,168 (1)(8) | | | Sequoia Mortgage Trust 2019-3 A2, 3.500%, 09/25/2049 |
| | | | 266,602 | | | | | | 0.1 | | |
| 589,867 (1)(8) | | | Sequoia Mortgage Trust 2019-4 A19, 3.500%, 11/25/2049 |
| | | | 598,448 | | | | | | 0.1 | | |
| 761,404 (1)(8) | | | Sequoia Mortgage Trust 2019-CH2 A1, 4.500%, 08/25/2049 |
| | | | 774,406 | | | | | | 0.2 | | |
| 295,300 (1)(8) | | | Verus Securitization Trust 2018-INV1 A1, 3.626%, 03/25/2058 |
| | | | 298,026 | | | | | | 0.1 | | |
| 639,415 (1)(8) | | | Verus Securitization Trust 2019-INV2 A2, 3.117%, 07/25/2059 |
| | | | 641,214 | | | | | | 0.1 | | |
| 581,825 (1)(8) | | | Wells Fargo Mortgage Backed Securities 2018-1 B3, 3.697%, 07/25/2047 |
| | | | 583,768 | | | | | | 0.2 | | |
| | | | Total Collateralized Mortgage Obligations (Cost $56,630,240) |
| | |
|
56,842,715
|
| | | |
|
14.6
|
| |
| | | | | | ||||||||||||
| U.S. GOVERNMENT AGENCY OBLIGATIONS: 2.4% | | |||||||||||||||
| | | | Government National Mortgage Association: 1.1% |
| ||||||||||||
| 4,099,000 (10) | | | 3.000%,01/20/2050 | | | |
|
4,208,020
|
| | | |
|
1.1
|
| |
| | | | | | ||||||||||||
| | | | Uniform Mortgage-Backed Securities: 1.3% | | ||||||||||||
| 813,000 (10) | | | 3.000%,01/25/2035 | | | | | 833,014 | | | | | | 0.2 | | |
| 4,380,000 (10) | | | 3.500%,06/25/2042 | | | | | 4,503,641 | | | | | | 1.1 | | |
| | | | | | | | | 5,336,655 | | | | | | 1.3 | | |
| | | | Total U.S. Government Agency Obligations (Cost $9,539,477) |
| | |
|
9,544,675
|
| | | |
|
2.4
|
| |
| | | | | | ||||||||||||
| U.S. TREASURY OBLIGATIONS: 2.3% | | |||||||||||||||
| | | | U.S. Treasury Bonds: 0.7% | | ||||||||||||
| 2,416,000 | | | 2.250%,08/15/2049 | | | | | 2,341,676 | | | | | | 0.6 | | |
| 180,000 | | | 3.500%,02/15/2039 | | | | | 215,568 | | | | | | 0.1 | | |
| | | | | | | | | 2,557,244 | | | | | | 0.7 | | |
| | | | | | ||||||||||||
| | | | U.S. Treasury Notes: 1.6% | | ||||||||||||
| 4,079,200 | | | 1.625%,12/31/2021 | | | | | 4,083,316 | | | | | | 1.1 | | |
| Principal Amount† |
| |
Value
|
| |
Percentage
of Net Assets |
| |||||||||
| U.S. TREASURY OBLIGATIONS: (continued) | | |||||||||||||||
| | | | U.S. Treasury Notes (continued) | | ||||||||||||
| 2,152,000 | | | 1.750%-2.125%, 01/31/2021-11/15/2029 |
| | | $ | 2,131,336 | | | | | | 0.5 | | |
| | | | | | | | | 6,214,652 | | | | | | 1.6 | | |
| | | | Total U.S. Treasury Obligations (Cost $8,793,697) |
| | |
|
8,771,896
|
| | | |
|
2.3
|
| |
| | | | | | ||||||||||||
| COMMERCIAL MORTGAGE-BACKED SECURITIES: 11.8% |
| |||||||||||||||
| 330,000 (1)(8) | | | BAMLL Re-REMIC Trust 2016-FRR16 B, 1.003%, 05/27/2021 |
| | | | 317,261 | | | | | | 0.1 | | |
| 410,000 (1)(8) | | | Jackson Park Trust 2019-LIC F, 3.242%, 10/14/2039 |
| | | | 353,977 | | | | | | 0.1 | | |
| 370,000 (1)(8) | | | JPMCC Re-REMIC Trust 2015-FRR2 AK36, 2.205%, 12/27/2046 |
| | | | 352,355 | | | | | | 0.1 | | |
| 17,717,664 (8)(9) | | | Morgan Stanley Capital I Trust 2019-L3 XA, 0.645%, 11/15/2029 |
| | | | 948,134 | | | | | | 0.2 | | |
| 200,000 (1) | | | MRCD 2019-PARK E Mortgage Trust, 2.718%, 12/15/2036 |
| | | | 189,307 | | | | | | 0.1 | | |
| 370,000 (1) | | | MRCD 2019-PARK F Mortgage Trust, 2.718%, 12/15/2036 |
| | | | 344,271 | | | | | | 0.1 | | |
| 650,000 (1) | | | BANK 2017-BNK4 D, 3.357%, 05/15/2050 |
| | | | 596,356 | | | | | | 0.1 | | |
| 2,000,000 (1)(8) | | | BANK 2017-BNK5 D, 3.078%, 06/15/2060 |
| | | | 1,813,995 | | | | | | 0.5 | | |
| 1,170,000 (1) | | | BANK 2017-BNK8 D, 2.600%, 11/15/2050 |
| | | | 1,032,867 | | | | | | 0.3 | | |
| 1,460,000 (1) | | | BANK 2019-BNK17 D, 3.000%, 04/15/2052 |
| | | | 1,330,964 | | | | | | 0.3 | | |
| 1,000,000 (1)(8) | | | Benchmark 2018-B3 D Mortgage Trust, 3.057%, 04/10/2051 |
| | | | 911,912 | | | | | | 0.2 | | |
| 12,422,039 (8)(9) | | | BENCHMARK 2019-B10 XA Mortgage Trust, 1.232%, 03/15/2062 |
| | | | 1,113,000 | | | | | | 0.3 | | |
| 800,000 (1) | | | BX Commercial Mortgage Trust 2019-XL J, 4.390%, (US0001M + 2.650%), 10/15/2036 |
| | | | 803,027 | | | | | | 0.2 | | |
| 310,000 (1) | | | BX Trust 2019-OC11 E, 4.076%, 12/09/2041 |
| | | | 301,051 | | | | | | 0.1 | | |
| 2,000,000 (1)(8) | | | CALI Mortgage Trust 2019-101C E, 4.324%, 03/10/2039 |
| | | | 2,079,441 | | | | | | 0.5 | | |
| 16,260,000 (8)(9) | | | Citigroup Commercial Mortgage Trust 2019-C7 XA, 1.009%, 12/15/2072 |
| | | | 1,144,888 | | | | | | 0.3 | | |
| 2,350,000 (1)(8) | | | Citigroup Commercial Mortgage Trust 2013-GC15 D, 5.214%, 09/10/2046 |
| | | | 2,469,755 | | | | | | 0.6 | | |
| Voya Balanced Income Portfolio | as of December 31, 2019 (continued) |
| Principal Amount† |
| |
Value
|
| |
Percentage
of Net Assets |
| |||||||||
|
COMMERCIAL MORTGAGE-BACKED SECURITIES: (continued)
|
| |||||||||||||||
| 2,000,000 (8) | | | Commercial Mortgage Pass Through Certificates 2016-CR28 D, 3.896%, 02/10/2049 |
| | | $ | 2,025,473 | | | | | | 0.5 | | |
| 650,000 (1)(8) | | | COMM 2014-LC15 D Mortgage Trust, 4.984%, 04/10/2047 |
| | | | 660,937 | | | | | | 0.2 | | |
| 2,000,000 (8) | | | COMM 2015-CCRE26 D Mortgage Trust, 3.484%, 10/10/2048 |
| | | | 1,891,285 | | | | | | 0.5 | | |
| 520,000 (1) | | | Credit Suisse Mortgage Capital Certificates 2019-ICE4 F, 4.390%, (US0001M + 2.650%), 05/15/2036 |
| | | | 522,308 | | | | | | 0.1 | | |
| 2,000,000 (8) | | | CSAIL 2015-C2 C Commercial Mortgage Trust, 4.192%, 06/15/2057 |
| | | | 1,942,466 | | | | | | 0.5 | | |
| 190,000 (1)(8) | | | DBUBS 2017-BRBK E Mortgage Trust, 3.530%, 10/10/2034 |
| | | | 189,188 | | | | | | 0.1 | | |
| 205,000 (1)(8) | | | GRACE 2014-GRCE F Mortgage Trust, 3.590%, 06/10/2028 |
| | | | 205,761 | | | | | | 0.1 | | |
| 13,790,457 (8)(9) | | | GS Mortgage Securities Trust 2019-GC39 XA, 1.143%, 05/10/2052 |
| | | | 1,105,155 | | | | | | 0.3 | | |
| 2,000,000 (1) | | | Hawaii Hotel Trust 2019-MAUI F, 4.490%, (US0001M + 3.000%), 05/15/2038 |
| | | | 2,005,939 | | | | | | 0.5 | | |
| 931,460 (1) | | | HPLY Trust 2019-HIT E, 4.090%, (US0001M + 2.350%), 11/15/2036 |
| | | | 934,289 | | | | | | 0.2 | | |
| 200,000 (1)(8) | | | JPMBB Commercial Mortgage Securities Trust 2013-C17 F, 3.867%, 01/15/2047 |
| | | | 176,281 | | | | | | 0.0 | | |
| 27,618,815 (8)(9) | | | JPMDB Commercial Mortgage Securities Trust 2018-C8 XA, 0.649%, 06/15/2051 |
| | | | 1,089,897 | | | | | | 0.3 | | |
| 2,000,000 (1) | | | KNDL 2019-KNSQ E Mortgage Trust, 3.540%, (US0001M + 1.800%), 05/15/2036 |
| | | | 2,001,216 | | | | | | 0.5 | | |
| 560,000 (1) | | | Morgan Stanley Bank of America Merrill Lynch Trust 2013-C13 F, 3.707%, 11/15/2046 |
| | | | 528,809 | | | | | | 0.2 | | |
| 530,000 (1) | | | Morgan Stanley Capital I Trust 2011-C1 M, 4.193%, 09/15/2047 |
| | | | 515,384 | | | | | | 0.1 | | |
| 1,955,000 (1)(8) | | | Morgan Stanley Capital I Trust 2016-BNK2 D, 3.000%, 11/15/2049 |
| | | | 1,787,477 | | | | | | 0.5 | | |
| Principal Amount† |
| |
Value
|
| |
Percentage
of Net Assets |
| |||||||||
|
COMMERCIAL MORTGAGE-BACKED SECURITIES: (continued)
|
| |||||||||||||||
| 2,000,000 (1) | | | Morgan Stanley Capital I Trust 2019-PLND E, 3.890%, (US0001M + 2.150%), 05/15/2036 |
| | | $ | 2,004,001 | | | | | | 0.5 | | |
| 2,000,000 (1) | | | UBS Commercial Mortgage Trust 2018-NYCH C, 3.240%, (US0001M + 1.500%), 02/15/2032 |
| | | | 1,998,809 | | | | | | 0.5 | | |
| 2,240,000 (1) | | | Wells Fargo Commercial Mortgage Trust 2019- C49 D, 3.000%, 03/15/2052 |
| | | | 1,966,853 | | | | | | 0.5 | | |
| 2,000,000 (1)(8) | | | WFRBS Commercial Mortgage Trust 2011- C5 E, 5.671%, 11/15/2044 |
| | | | 2,051,310 | | | | | | 0.6 | | |
| 2,210,000 (1) | | | WFRBS Commercial Mortgage Trust 2013- C12 E, 3.500%, 03/15/2048 |
| | | | 2,030,917 | | | | | | 0.5 | | |
| 1,920,000 (8) | | | WFRBS Commercial Mortgage Trust 2014- C19 C, 4.646%, 03/15/2047 |
| | | | 2,016,987 | | | | | | 0.5 | | |
| | | | Total Commercial Mortgage-Backed Securities |
| | | | | | | | | | | | |
| | | | (Cost $44,715,508) | | | |
|
45,753,303
|
| | | |
|
11.8
|
| |
| | | | | | ||||||||||||
| ASSET-BACKED SECURITIES: 8.1% | | |||||||||||||||
| | | | Automobile Asset-Backed Securities: 1.5% | | ||||||||||||
| 550,000 (1) | | | Oscar US Funding XI LLC 2019-2A A4, 2.680%, 09/10/2026 |
| | | | 554,587 | | | | | | 0.2 | | |
| 550,000 | | | Santander Drive Auto Receivables Trust 2019-1 D, 3.650%, 04/15/2025 |
| | | | 563,478 | | | | | | 0.1 | | |
| 1,000,000 | | | Santander Drive Auto Receivables Trust 2019-2 D, 3.220%, 07/15/2025 |
| | | | 1,020,239 | | | | | | 0.3 | | |
| 150,000 | | | Santander Drive Auto Receivables Trust 2019-3 C, 2.490%, 10/15/2025 |
| | | | 150,622 | | | | | | 0.0 | | |
| 350,000 | | | Santander Drive Auto Receivables Trust 2019-3 D, 2.680%, 10/15/2025 |
| | | | 348,797 | | | | | | 0.1 | | |
| 600,000 (1) | | | Santander Retail Auto Lease Trust 2019-B C, 2.770%, 08/21/2023 |
| | | | 602,843 | | | | | | 0.2 | | |
| 2,450,000 | | | Other Securities | | | | | 2,472,566 | | | | | | 0.6 | | |
| | | | | | | | | 5,713,132 | | | | | | 1.5 | | |
| | | | | | ||||||||||||
| Voya Balanced Income Portfolio | as of December 31, 2019 (continued) |
| Principal Amount† |
| |
Value
|
| |
Percentage
of Net Assets |
| |||||||||
| ASSET-BACKED SECURITIES: (continued) | | |||||||||||||||
| | | | Home Equity Asset-Backed Securities: 0.2% |
| ||||||||||||
| 629,928 (1)(8) | | | ACE Securities Corp. Mortgage Loan Trust Series 2007-D1 A2, 6.336%, 02/25/2038 |
| | |
$
|
602,511
|
| | | |
|
0.2
|
| |
| | | | | | ||||||||||||
| | | | Other Asset-Backed Securities: 6.3% | | ||||||||||||
| 150,000 (1) | | | Applebee’s Funding LLC / IHOP Funding LLC 2019-1A A2II, 4.723%, 06/07/2049 |
| | | | 154,011 | | | | | | 0.0 | | |
| 400,000 (1) | | | Applebee’s Funding LLC / IHOP Funding LLC 2019-1A A2I, 4.194%, 06/07/2049 |
| | | | 406,004 | | | | | | 0.1 | | |
| 300,000 (1) | | | Babson CLO Ltd. 2018-3A C, 3.866%, (US0003M + 1.900%), 07/20/2029 |
| | | | 291,578 | | | | | | 0.1 | | |
| 750,000 (1) | | | Benefit Street Partners CLO II Ltd. 2013-IIA BR, 4.551%, (US0003M + 2.550%), 07/15/2029 |
| | | | 730,719 | | | | | | 0.2 | | |
| 750,000 (1) | | | Benefit Street Partners CLO X Ltd. 2016-10A BR, 4.401%, (US0003M + 2.400%), 01/15/2029 |
| | | | 738,977 | | | | | | 0.2 | | |
| 700,000 (1) | | | Dryden 43 Senior Loan Fund 2016-43A CR, 4.366%, (US0003M + 2.400%), 07/20/2029 |
| | | | 694,071 | | | | | | 0.2 | | |
| 453,197 (1) | | | J.G. Wentworth XXXVIII LLC 2017-1A A, 3.990%, 08/16/2060 |
| | | | 484,030 | | | | | | 0.1 | | |
| 750,000 (1) | | | LCM XV L.P. 15A CR, 4.366%, (US0003M + 2.400%), 07/20/2030 |
| | | | 740,380 | | | | | | 0.2 | | |
| 750,000 (1) | | | Neuberger Berman CLO XVII Ltd. 2014-17A CR, 4.603%, (US0003M + 2.650%), 04/22/2029 |
| | | | 738,502 | | | | | | 0.2 | | |
| 1,000,000 (1) | | | Neuberger Berman Loan Advisers CLO 25 Ltd. 2017-25A C, 4.153%, (US0003M + 2.150%), 10/18/2029 |
| | | | 988,584 | | | | | | 0.3 | | |
| 750,000 (1) | | | Neuberger Berman Loan Advisers CLO 33 Ltd. 2019-33A C, 4.590%, (US0003M + 2.450%), 10/16/2032 |
| | | | 750,392 | | | | | | 0.2 | | |
| 800,000 (1) | | | Palmer Square Loan Funding 2019-2A B Ltd., 4.216%, (US0003M + 2.250%), 04/20/2027 |
| | | | 799,983 | | | | | | 0.2 | | |
| 500,000 (1) | | | Shackleton CLO Ltd. 2019-15A C, 4.703%, (US0003M + 2.800%), 01/15/2030 |
| | | | 499,980 | | | | | | 0.1 | | |
| Principal Amount† |
| |
Value
|
| |
Percentage
of Net Assets |
| |||||||||
| ASSET-BACKED SECURITIES: (continued) | | |||||||||||||||
| | | | Other Asset-Backed Securities (continued) | | ||||||||||||
| 500,000 (1) | | | Silver Creek CLO Ltd. 2014-1A CR, 4.266%, (US0003M + 2.300%), 07/20/2030 |
| | | $ | 495,808 | | | | | | 0.1 | | |
| 500,000 (1) | | | BlueMountain CLO XXV Ltd. 2019-25A C, 4.736%, (US0003M + 2.450%), 07/15/2032 |
| | | | 500,127 | | | | | | 0.1 | | |
| 392,000 (1) | | | Domino’s Pizza Master Issuer LLC 2017-1A A2II, 3.082%, 07/25/2047 |
| | | | 393,222 | | | | | | 0.1 | | |
| 609,288 (1) | | | Domino’s Pizza Master Issuer LLC 2018-1A A2I, 4.116%, 07/25/2048 |
| | | | 627,707 | | | | | | 0.2 | | |
| 500,000 (1) | | | Dryden 75 CLO Ltd. 2019-75A CR, 4.401%, (US0003M + 2.400%), 07/15/2030 |
| | | | 496,768 | | | | | | 0.1 | | |
| 750,000 (1) | | | LCM XXII Ltd. 22A BR, 3.966%, (US0003M + 2.000%), 10/20/2028 |
| | | | 723,904 | | | | | | 0.2 | | |
| 700,000 (1) | | | LCM XXIV Ltd. 24A C, 4.216%, (US0003M + 2.250%), 03/20/2030 |
| | | | 675,937 | | | | | | 0.2 | | |
| 500,000 (1) | | | Madison Park Funding XXI Ltd. 2016-21A BR, 4.790%, (US0003M + 2.850%), 10/15/2032 |
| | | | 500,341 | | | | | | 0.1 | | |
| 650,000 (1) | | | Marlette Funding Trust 2019-3A B, 3.070%, 09/17/2029 |
| | | | 652,411 | | | | | | 0.2 | | |
| 567,373 (1) | | | Mill City Solar Loan 2019-2GS A Ltd., 3.690%, 07/20/2043 |
| | | | 573,820 | | | | | | 0.1 | | |
| 935,521 (1) | | | Mosaic Solar Loans 2017-2A A LLC, 3.820%, 06/22/2043 |
| | | | 953,201 | | | | | | 0.2 | | |
| 750,000 (1) | | | OCP Clo 2019-17A C1 Ltd., 4.847%, (US0003M + 2.550%), 07/20/2032 |
| | | | 750,522 | | | | | | 0.2 | | |
| 250,000 (1) | | | Octagon Loan Funding Ltd. 2014-1A CRR, 4.104%, (US0003M + 2.200%), 11/18/2031 |
| | | | 238,584 | | | | | | 0.1 | | |
| 750,000 (1) | | | OHA Credit Funding 3 Ltd. 2019-3A C, 5.075%, (US0003M + 2.450%), 07/20/2032 |
| | | | 750,751 | | | | | | 0.2 | | |
| 1,000,000 (1) | | | Palmer Square CLO 2015-1A BR2 Ltd., 4.145%, (US0003M + 2.250%), 05/21/2029 |
| | | | 986,045 | | | | | | 0.2 | | |
| 150,000 (1) | | | Sofi Consumer Loan Program 2018-2 B Trust, 3.790%, 04/26/2027 |
| | | | 152,827 | | | | | | 0.0 | | |
| Voya Balanced Income Portfolio | as of December 31, 2019 (continued) |
| Principal Amount† |
| |
Value
|
| |
Percentage
of Net Assets |
| |||||||||
| ASSET-BACKED SECURITIES: (continued) | | |||||||||||||||
| | | | Other Asset-Backed Securities (continued) | | ||||||||||||
| 150,000 (1) | | | SoFi Consumer Loan Program 2018-4 B Trust, 3.960%, 11/26/2027 |
| | | $ | 153,320 | | | | | | 0.0 | | |
| 1,000,000 (1) | | | SoFi Consumer Loan Program 2019-3 D Trust, 3.890%, 05/25/2028 |
| | | | 1,018,205 | | | | | | 0.3 | | |
| 200,000 (1) | | | SoFi Consumer Loan Program 2019-4 C Trust, 2.840%, 08/25/2028 |
| | | | 199,539 | | | | | | 0.1 | | |
| 100,000 (1) | | | SoFi Consumer Loan Program 2019-4 D Trust, 3.480%, 08/25/2028 |
| | | | 99,747 | | | | | | 0.0 | | |
| 384,079 (1) | | | Sunrun Xanadu Issuer 2019-1A A LLC, 3.980%, 06/30/2054 |
| | | | 389,366 | | | | | | 0.1 | | |
| 750,000 (1) | | | THL Credit Wind River 2016-1A CR CLO Ltd., 4.086%, (US0003M + 2.100%), 07/15/2028 |
| | | | 734,431 | | | | | | 0.2 | | |
| 2,000,000 (1)(8) | | | Towd Point Mortgage Trust 2015-4 M2, 3.750%, 04/25/2055 |
| | | | 2,090,053 | | | | | | 0.5 | | |
| 180,000 (1)(8) | | | Towd Point Mortgage Trust 2015-6 M2, 3.750%, 04/25/2055 |
| | | | 191,099 | | | | | | 0.1 | | |
| 1,176,000 (1) | | | Wendy’s Funding LLC 2018-1A A2II, 3.884%, 03/15/2048 |
| | | | 1,197,321 | | | | | | 0.3 | | |
| 248,750 (1) | | | Wendy’s Funding LLC 2019-1A A2I, 3.783%, 06/15/2049 |
| | | | 254,018 | | | | | | 0.1 | | |
| 780,000 (1) | | | Westcott Park CLO Ltd. 2016-1A CR, 4.216%, (US0003M + 2.250%), 07/20/2028 |
| | | | 775,287 | | | | | | 0.2 | | |
| | | | | | | | | 24,591,572 | | | | | | 6.3 | | |
| | | | Student Loan Asset-Backed Securities: 0.1% |
| ||||||||||||
| 600,000 (1) | | | Sofi Professional Loan Program 2019-C BFX LLC, 3.050%, 11/16/2048 |
| | |
|
579,001
|
| | | |
|
0.1
|
| |
| | | | Total Asset-Backed Securities (Cost $31,431,731) |
| | |
|
31,486,216
|
| | | |
|
8.1
|
| |
| SOVEREIGN BONDS: 2.1% | | |||||||||||||||
|
BRL5,000,000
|
| |
Brazil Notas do Tesouro
Nacional Serie F, 10.000%, 01/01/2027 |
| | | | 1,461,399 | | | | | | 0.4 | | |
| 200,000 (1) | | |
Kenya Government
International Bond, 7.000%, 05/22/2027 |
| | | | 213,388 | | | | | | 0.0 | | |
|
PEN1,303,000 (1)
|
| |
Peru Government Bond,
6.150%, 08/12/2032 |
| | | | 446,060 | | | | | | 0.1 | | |
| Principal Amount† |
| |
Value
|
| |
Percentage
of Net Assets |
| |||||||||
| SOVEREIGN BONDS: (continued) | | |||||||||||||||
|
RUB12,298,392,000
|
| |
Other Securities
|
| | | $ | 6,156,739 | | | | | | 1.6 | | |
| | | |
Total Sovereign Bonds
(Cost $8,058,364) |
| | |
|
8,277,586
|
| | | |
|
2.1
|
| |
| | ||||||||||||||||
| | | |
Value
|
| |
Percentage
of Net Assets |
| |||||||||
| PURCHASED OPTIONS(11): 0.0% | | |||||||||||||||
| | | | Total Purchased Options (Cost $32,214) |
| | |
|
18,947
|
| | | |
|
0.0
|
| |
| | | | Total Long-Term Investments (Cost $358,594,887) |
| | |
|
376,865,030
|
| | | |
|
96.9
|
| |
| | ||||||||||||||||
| Principal Amount† |
| | | | |
Value
|
| |
Percentage
of Net Assets |
| ||||||
| SHORT-TERM INVESTMENTS: 0.6% | | |||||||||||||||
| | | | Repurchase Agreements: 0.6% | | ||||||||||||
| 1,000,000 (12) | | | Bank of Nova Scotia, Repurchase Agreement dated 12/31/19, 1.57%, due 01/02/20 (Repurchase Amount $1,000,086, collateralized by various U.S. Government Agency Obligations, 2.500%-6.500%, Market Value plus accrued interest $1,020,089, due 09/01/24-11/01/49) |
| | | | 1,000,000 | | | | | | 0.3 | | |
| 178,222 (12) | | | Citadel Securities LLC, Repurchase Agreement dated 12/31/19, 1.60%, due 01/02/20 (Repurchase Amount $178,238, collateralized by various U.S. Government Securities, 0.000%-8.500%, Market Value plus accrued interest $181,803, due 01/15/20-11/15/48) |
| | | | 178,222 | | | | | | 0.0 | | |
| 1,000,000 (12) | | | RBC Dominion Securities Inc., Repurchase Agreement dated 12/31/19, 1.57%, due 01/02/20 (Repurchase Amount $1,000,086, collateralized by various U.S. Government/U.S. Government Agency Obligations, 0.000%-6.500%, Market Value plus accrued interest $1,020,000, due 06/30/21-12/01/49) |
| | | | 1,000,000 | | | | | | 0.3 | | |
| Voya Balanced Income Portfolio | as of December 31, 2019 (continued) |
| Principal Amount† |
| | | | |
Value
|
| |
Percentage
of Net Assets |
| ||||||
| SHORT-TERM INVESTMENTS: (continued) | | |||||||||||||||
| | | | Repurchase Agreements (continued) | | ||||||||||||
| | | | Total Repurchase Agreements |
| | | | | | | | | | | | |
| | | | Total Short-Term Investments (Cost $2,178,222) |
| | |
$
|
2,178,222
|
| | | |
|
0.6
|
| |
| | | | Total Investments in Securities (Cost $360,773,109) |
| | | $ | 379,043,252 | | | | | | 97.5 | | |
| | | | Assets in Excess of Other Liabilities |
| | | | 9,569,491 | | | | | | 2.5 | | |
| | | | Net Assets | | | | $ | 388,612,743 | | | | | | 100.0 | | |
| | ||||||||||||||||
BRL Brazilian Real
EUR EU Euro
IDR Indonesian Rupiah
PEN Peruvian Nuevo Sol
RUB Russian Ruble
US0001M 1-month LIBOR
US0003M 3-month LIBOR
| | | |
Quoted Prices
in Active Markets for Identical Investments (Level 1) |
| |
Significant
Other Observable Inputs# (Level 2) |
| |
Significant
Unobservable Inputs (Level 3) |
| |
Fair Value
at December 31, 2019 |
| ||||||||||||
| Asset Table | | | | | | | | | | | | | | | | | | | | | | | | | |
| Investments, at fair value | | | | | | | | | | | | | | | | | | | | | | | | | |
| Common Stock | | | | | | | | | | | | | | | | | | | | | | | | | |
|
Communication Services
|
| | | $ | 7,640,988 | | | | | $ | 1,886,410 | | | | | $ | — | | | | | $ | 9,527,398 | | |
|
Consumer Discretionary
|
| | | | 11,237,512 | | | | | | 1,965,316 | | | | | | — | | | | | | 13,202,828 | | |
|
Consumer Staples
|
| | | | 9,735,624 | | | | | | 3,182,094 | | | | | | — | | | | | | 12,917,718 | | |
|
Energy
|
| | | | 4,810,730 | | | | | | 1,507,855 | | | | | | — | | | | | | 6,318,585 | | |
|
Financials
|
| | | | 15,786,539 | | | | | | 5,282,060 | | | | | | — | | | | | | 21,068,599 | | |
|
Health Care
|
| | | | 16,883,809 | | | | | | 3,400,239 | | | | | | — | | | | | | 20,284,048 | | |
|
Industrials
|
| | | | 10,326,044 | | | | | | 5,339,286 | | | | | | — | | | | | | 15,665,330 | | |
|
Information Technology
|
| | | | 34,974,137 | | | | | | 1,698,216 | | | | | | — | | | | | | 36,672,353 | | |
|
Materials
|
| | | | 2,066,600 | | | | | | 2,052,538 | | | | | | — | | | | | | 4,119,138 | | |
|
Real Estate
|
| | | | 5,255,549 | | | | | | 1,395,743 | | | | | | — | | | | | | 6,651,292 | | |
|
Utilities
|
| | | | 5,320,393 | | | | | | 1,300,058 | | | | | | — | | | | | | 6,620,451 | | |
| Total Common Stock | | | | | 124,037,925 | | | | | | 29,009,815 | | | | | | — | | | | | | 153,047,740 | | |
| Exchange-Traded Funds | | | | | 2,348,440 | | | | | | — | | | | | | — | | | | | | 2,348,440 | | |
| Mutual Funds | | | | | 33,156,275 | | | | | | — | | | | | | — | | | | | | 33,156,275 | | |
| Voya Balanced Income Portfolio | as of December 31, 2019 (continued) |
| | | |
Quoted Prices
in Active Markets for Identical Investments (Level 1) |
| |
Significant
Other Observable Inputs# (Level 2) |
| |
Significant
Unobservable Inputs (Level 3) |
| |
Fair Value
at December 31, 2019 |
| ||||||||||||
| Preferred Stock | | | | | — | | | | | | 2,012,442 | | | | | | — | | | | | | 2,012,442 | | |
| Rights | | | | | 895 | | | | | | — | | | | | | — | | | | | | 895 | | |
| Purchased Options | | | | | — | | | | | | 18,947 | | | | | | — | | | | | | 18,947 | | |
| Corporate Bonds/Notes | | | | | — | | | | | | 25,603,900 | | | | | | — | | | | | | 25,603,900 | | |
| Collateralized Mortgage Obligations | | | | | — | | | | | | 56,842,715 | | | | | | — | | | | | | 56,842,715 | | |
| Asset-Backed Securities | | | | | — | | | | | | 31,486,216 | | | | | | — | | | | | | 31,486,216 | | |
| U.S. Government Agency Obligations | | | | | — | | | | | | 9,544,675 | | | | | | — | | | | | | 9,544,675 | | |
| Commercial Mortgage-Backed Securities | | | | | — | | | | | | 45,753,303 | | | | | | — | | | | | | 45,753,303 | | |
| Sovereign Bonds | | | | | — | | | | | | 8,277,586 | | | | | | — | | | | | | 8,277,586 | | |
| U.S. Treasury Obligations | | | | | — | | | | | | 8,771,896 | | | | | | — | | | | | | 8,771,896 | | |
| Short-Term Investments | | | | | — | | | | | | 2,178,222 | | | | | | — | | | | | | 2,178,222 | | |
| Total Investments, at fair value | | | | $ | 159,543,535 | | | | | $ | 219,499,717 | | | | | $ | — | | | | | $ | 379,043,252 | | |
| Other Financial Instruments+ | | | | | | | | | | | | | | | | | | | | | | | | | |
| Centrally Cleared Swaps | | | | | — | | | | | | 115,231 | | | | | | — | | | | | | 115,231 | | |
| Forward Foreign Currency Contracts | | | | | — | | | | | | 1,037,336 | | | | | | — | | | | | | 1,037,336 | | |
| Futures | | | | | 394,930 | | | | | | — | | | | | | — | | | | | | 394,930 | | |
| Total Assets | | | | $ | 159,938,465 | | | | | $ | 220,652,284 | | | | | $ | — | | | | | $ | 380,590,749 | | |
| Liabilities Table | | | | | | | | | | | | | | | | | | | | | | | | | |
| Other Financial Instruments+ | | | | | | | | | | | | | | | | | | | | | | | | | |
| Centrally Cleared Swaps | | | | $ | — | | | | | $ | (30,609) | | | | | $ | — | | | | | $ | (30,609) | | |
| Forward Foreign Currency Contracts | | | | | — | | | | | | (697,516) | | | | | | — | | | | | | (697,516) | | |
| Futures | | | | | (319,343) | | | | | | — | | | | | | — | | | | | | (319,343) | | |
| Volatility Swaps | | | | | — | | | | | | (36,587) | | | | | | — | | | | | | (36,587) | | |
| Written Options | | | | | — | | | | | | (1,015) | | | | | | — | | | | | | (1,015) | | |
| Total Liabilities | | | | $ | (319,343) | | | | | $ | (765,727) | | | | | $ | — | | | | | $ | (1,085,070) | | |
|
Issuer
|
| |
Beginning
Fair Value at 12/31/18 |
| |
Purchases
at Cost |
| |
Sales
at Cost |
| |
Change in
Unrealized Appreciation/ (Depreciation) |
| |
Ending Fair
Value at 12/31/2019 |
| |
Investment
Income |
| |
Realized
Gains/ (Losses) |
| |
Net
Capital Gain Distributions |
| ||||||||||||||||||||||||
|
Voya Floating Rate Fund – Class P
|
| | | | | | | | | $ | 43,978,877 | | | | | $ | (10,207,554) | | | | | $ | (615,048) | | | | | $ | 33,156,275 | | | | | $ | 1,453,862 | | | | | $ | (252,558) | | | | | $ | — | | |
| | | | | $ | — | | | | | $ | 43,978,877 | | | | | $ | (10,207,554) | | | | | $ | (615,048) | | | | | $ | 33,156,275 | | | | | $ | 1,453,862 | | | | | $ | (252,558) | | | | | $ | — | | |
| Voya Balanced Income Portfolio | as of December 31, 2019 (continued) |
|
Currency Purchased
|
| |
Currency Sold
|
| |
Counterparty
|
| |
Settlement
Date |
| |
Unrealized
Appreciation (Depreciation) |
| ||||||
| USD 2,394,000 | | | GBP 1,827,314 | | |
Bank of America N.A.
|
| | | | 01/17/20 | | | | | $ | (27,479) | | |
| USD 539,000 | | | NZD 800,771 | | |
Bank of America N.A.
|
| | | | 01/17/20 | | | | | | (195) | | |
| NZD 2,023,030 | | | USD 1,325,784 | | |
Bank of America N.A.
|
| | | | 01/17/20 | | | | | | 36,413 | | |
| GBP 1,644,744 | | | USD 2,158,000 | | |
Bank of America N.A.
|
| | | | 01/17/20 | | | | | | 21,545 | | |
| COP 12,994,599 | | | USD 3,898 | | |
Bank of America N.A.
|
| | | | 02/07/20 | | | | | | 50 | | |
| NOK 33,452,479 | | | USD 3,659,545 | | |
BNP Paribas
|
| | | | 01/17/20 | | | | | | 151,085 | | |
| SEK 71,366,076 | | | USD 7,511,881 | | |
BNP Paribas
|
| | | | 01/17/20 | | | | | | 112,873 | | |
| USD 2,458,366 | | | GBP 1,865,536 | | |
BNP Paribas
|
| | | | 01/17/20 | | | | | | (13,763) | | |
| USD 7,955,661 | | | EUR 7,166,134 | | |
BNP Paribas
|
| | | | 01/17/20 | | | | | | (89,837) | | |
| RUB 2,710,816 | | | USD 42,283 | | |
BNP Paribas
|
| | | | 02/07/20 | | | | | | 1,200 | | |
| USD 46,000 | | | RUB 2,951,566 | | |
BNP Paribas
|
| | | | 02/07/20 | | | | | | (1,345) | | |
| USD 920,321 | | | PEN 3,078,380 | | |
BNP Paribas
|
| | | | 02/07/20 | | | | | | (7,723) | | |
| USD 1,187,000 | | | CHF 1,163,395 | | |
Brown Brothers Harriman & Co.
|
| | | | 01/17/20 | | | | | | (16,346) | | |
| USD 3,545,000 | | | CHF 3,471,264 | | |
Brown Brothers Harriman & Co.
|
| | | | 01/17/20 | | | | | | (45,467) | | |
| EUR 742,980 | | | USD 825,000 | | |
Brown Brothers Harriman & Co.
|
| | | | 01/17/20 | | | | | | 9,152 | | |
| USD 2,713,000 | | | NOK 23,916,302 | | |
Brown Brothers Harriman & Co.
|
| | | | 01/17/20 | | | | | | (11,348) | | |
| USD 3,090,000 | | | CAD 4,032,849 | | |
Brown Brothers Harriman & Co.
|
| | | | 01/17/20 | | | | | | (15,890) | | |
| USD 3,504,000 | | | SEK 32,720,447 | | |
Brown Brothers Harriman & Co.
|
| | | | 01/17/20 | | | | | | 8,147 | | |
| EUR 897,016 | | | USD 997,000 | | |
Brown Brothers Harriman & Co.
|
| | | | 01/17/20 | | | | | | 10,089 | | |
| SEK 11,161,983 | | | USD 1,185,000 | | |
Brown Brothers Harriman & Co.
|
| | | | 01/17/20 | | | | | | 7,546 | | |
| EUR 7,952,909 | | | USD 8,890,000 | | |
Brown Brothers Harriman & Co.
|
| | | | 01/17/20 | | | | | | 38,818 | | |
| USD 1,921,000 | | | AUD 2,743,549 | | |
Brown Brothers Harriman & Co.
|
| | | | 01/17/20 | | | | | | (4,991) | | |
| EUR 1,494,884 | | | USD 1,676,000 | | |
Brown Brothers Harriman & Co.
|
| | | | 01/17/20 | | | | | | 2,323 | | |
| USD 954,000 | | | SEK 8,905,899 | | |
Brown Brothers Harriman & Co.
|
| | | | 01/17/20 | | | | | | 2,494 | | |
| USD 829,000 | | | GBP 636,403 | | |
Brown Brothers Harriman & Co.
|
| | | | 01/17/20 | | | | | | (14,335) | | |
| USD 1,178,000 | | | SEK 11,075,597 | | |
Brown Brothers Harriman & Co.
|
| | | | 01/17/20 | | | | | | (5,317) | | |
| USD 1,230,000 | | | CHF 1,202,999 | | |
Brown Brothers Harriman & Co.
|
| | | | 01/17/20 | | | | | | (14,310) | | |
| USD 1,016,000 | | | CAD 1,331,204 | | |
Brown Brothers Harriman & Co.
|
| | | | 01/17/20 | | | | | | (9,224) | | |
| CHF 1,176,316 | | | USD 1,203,000 | | |
Brown Brothers Harriman & Co.
|
| | | | 01/17/20 | | | | | | 13,711 | | |
| JPY 196,659,234 | | | USD 1,808,000 | | |
Brown Brothers Harriman & Co.
|
| | | | 01/17/20 | | | | | | 3,376 | | |
| AUD 2,162,931 | | | USD 1,487,000 | | |
Brown Brothers Harriman & Co.
|
| | | | 01/17/20 | | | | | | 31,393 | | |
| USD 1,001,000 | | | CAD 1,317,384 | | |
Brown Brothers Harriman & Co.
|
| | | | 01/17/20 | | | | | | (13,581) | | |
| USD 675,000 | | | CHF 663,725 | | |
Brown Brothers Harriman & Co.
|
| | | | 01/17/20 | | | | | | (11,517) | | |
| NOK 27,105,341 | | | USD 2,980,000 | | |
Brown Brothers Harriman & Co.
|
| | | | 01/17/20 | | | | | | 107,617 | | |
| USD 8,742,000 | | | EUR 7,824,695 | | |
Brown Brothers Harriman & Co.
|
| | | | 01/17/20 | | | | | | (42,871) | | |
| CHF 1,222,021 | | | USD 1,245,000 | | |
Brown Brothers Harriman & Co.
|
| | | | 01/17/20 | | | | | | 18,985 | | |
| NZD 1,466,728 | | | USD 966,000 | | |
Brown Brothers Harriman & Co.
|
| | | | 01/17/20 | | | | | | 21,614 | | |
| USD 2,305,000 | | | CAD 3,037,826 | | |
Brown Brothers Harriman & Co.
|
| | | | 01/17/20 | | | | | | (34,575) | | |
| USD 1,444,000 | | | JPY 157,425,602 | | |
Brown Brothers Harriman & Co.
|
| | | | 01/17/20 | | | | | | (6,005) | | |
| USD 1,734,000 | | | SEK 16,258,019 | | |
Brown Brothers Harriman & Co.
|
| | | | 01/17/20 | | | | | | (3,007) | | |
| CHF 909,864 | | | USD 941,000 | | |
Brown Brothers Harriman & Co.
|
| | | | 01/17/20 | | | | | | 109 | | |
| EUR 8,836,446 | | | USD 9,805,000 | | |
Brown Brothers Harriman & Co.
|
| | | | 01/17/20 | | | | | | 115,775 | | |
| USD 471,000 | | | JPY 51,323,080 | | |
Brown Brothers Harriman & Co.
|
| | | | 01/17/20 | | | | | | (1,723) | | |
| USD 2,106,000 | | | CAD 2,776,534 | | |
Brown Brothers Harriman & Co.
|
| | | | 01/17/20 | | | | | | (32,341) | | |
| AUD 1,387,068 | | | USD 946,000 | | |
Brown Brothers Harriman & Co.
|
| | | | 01/17/20 | | | | | | 27,732 | | |
| SEK 11,468,291 | | | USD 1,228,000 | | |
Brown Brothers Harriman & Co.
|
| | | | 01/17/20 | | | | | | (2,728) | | |
| GBP 2,485,235 | | | USD 3,273,000 | | |
Brown Brothers Harriman & Co.
|
| | | | 01/17/20 | | | | | | 20,328 | | |
| Voya Balanced Income Portfolio | as of December 31, 2019 (continued) |
|
Currency Purchased
|
| |
Currency Sold
|
| |
Counterparty
|
| |
Settlement
Date |
| |
Unrealized
Appreciation (Depreciation) |
| ||||||
| USD 2,276,436 | | | AUD 3,333,713 | | |
Brown Brothers Harriman & Co.
|
| | | | 01/17/20 | | | | | | (63,854) | | |
| USD 580,000 | | | CAD 767,023 | | |
Brown Brothers Harriman & Co.
|
| | | | 01/17/20 | | | | | | (10,721) | | |
| USD 1,361,000 | | | AUD 1,990,575 | | |
Brown Brothers Harriman & Co.
|
| | | | 01/17/20 | | | | | | (36,398) | | |
| NZD 2,421,507 | | | USD 1,615,000 | | |
Brown Brothers Harriman & Co.
|
| | | | 01/17/20 | | | | | | 15,510 | | |
| USD 1,231,000 | | | SEK 11,507,107 | | |
Brown Brothers Harriman & Co.
|
| | | | 01/17/20 | | | | | | 1,580 | | |
| USD 964,000 | | | JPY 104,491,845 | | |
Citibank N.A.
|
| | | | 01/17/20 | | | | | | 1,553 | | |
| GBP 460,821 | | | USD 609,000 | | |
Citibank N.A.
|
| | | | 01/17/20 | | | | | | 1,661 | | |
| USD 838,000 | | | GBP 647,178 | | |
Citibank N.A.
|
| | | | 01/17/20 | | | | | | (19,612) | | |
| AUD 1,675,231 | | | USD 1,151,000 | | |
Citibank N.A.
|
| | | | 01/17/20 | | | | | | 25,024 | | |
| USD 577,000 | | | CAD 762,947 | | |
Citibank N.A.
|
| | | | 01/17/20 | | | | | | (10,582) | | |
| USD 1,198,000 | | | CHF 1,173,777 | | |
Citibank N.A.
|
| | | | 01/17/20 | | | | | | (16,084) | | |
| AUD 815,013 | | | USD 562,000 | | |
Citibank N.A.
|
| | | | 01/17/20 | | | | | | 10,145 | | |
| PLN 42,850 | | | USD 11,169 | | |
Citibank N.A.
|
| | | | 02/07/20 | | | | | | 126 | | |
| USD 954,748 | | |
IDR 13,403,326,575
|
| |
Citibank N.A.
|
| | | | 02/07/20 | | | | | | (11,350) | | |
| USD 1,520,624 | | | BRL 6,124,466 | | |
Citibank N.A.
|
| | | | 02/07/20 | | | | | | (180) | | |
| CAD 3,948,427 | | | USD 2,979,547 | | |
Morgan Stanley Capital Services LLC
|
| | | | 01/17/20 | | | | | | 61,326 | | |
| USD 1,518,000 | | | CAD 1,994,100 | | |
Morgan Stanley Capital Services LLC
|
| | | | 01/17/20 | | | | | | (17,752) | | |
| SEK 11,285,714 | | | USD 1,202,000 | | |
Morgan Stanley Capital Services LLC
|
| | | | 01/17/20 | | | | | | 3,766 | | |
| EUR 676,338 | | | USD 750,000 | | |
Morgan Stanley Capital Services LLC
|
| | | | 01/17/20 | | | | | | 9,332 | | |
| CHF 1,165,039 | | | USD 1,188,000 | | |
Morgan Stanley Capital Services LLC
|
| | | | 01/17/20 | | | | | | 17,047 | | |
| CHF 2,427,007 | | | USD 2,508,000 | | |
Morgan Stanley Capital Services LLC
|
| | | | 01/17/20 | | | | | | 2,351 | | |
| USD 858,000 | | | GBP 661,777 | | |
Morgan Stanley Capital Services LLC
|
| | | | 01/17/20 | | | | | | (18,958) | | |
| AUD 2,635,537 | | | USD 1,830,000 | | |
Morgan Stanley Capital Services LLC
|
| | | | 01/17/20 | | | | | | 20,166 | | |
| EUR 1,472,702 | | | USD 1,638,000 | | |
Morgan Stanley Capital Services LLC
|
| | | | 01/17/20 | | | | | | 15,418 | | |
| JPY 284,593,178 | | | USD 2,630,376 | | |
Morgan Stanley Capital Services LLC
|
| | | | 01/17/20 | | | | | | (9,064) | | |
| SEK 4,075,830 | | | USD 434,000 | | |
Morgan Stanley Capital Services LLC
|
| | | | 01/17/20 | | | | | | 1,462 | | |
| USD 1,223,000 | | | GBP 939,207 | | |
Morgan Stanley Capital Services LLC
|
| | | | 01/17/20 | | | | | | (21,598) | | |
| CHF 4,052,611 | | | USD 4,105,941 | | |
Morgan Stanley Capital Services LLC
|
| | | | 01/17/20 | | | | | | 85,835 | | |
| USD 1,169,000 | | | JPY 126,680,590 | | |
Morgan Stanley Capital Services LLC
|
| | | | 01/17/20 | | | | | | 2,179 | | |
| IDR 464,138,381 | | | USD 32,975 | | |
Morgan Stanley Capital Services LLC
|
| | | | 02/07/20 | | | | | | 480 | | |
| USD 1,239,145 | | | RUB 79,459,930 | | |
Morgan Stanley Capital Services LLC
|
| | | | 02/07/20 | | | | | | (35,445) | | |
| | | | | | | | | | | | | | | | | $ | 339,820 | | |
| | |||||||||||||||||||
|
Description
|
| |
Number
of Contracts |
| |
Expiration
Date |
| |
Notional
Value |
| |
Unrealized
Appreciation/ (Depreciation) |
| ||||||||||||
| Long Contracts: | | | | | | | | | | | | | | | | | | | | | | | | | |
| U.S. Treasury 2-Year Note | | | | | 239 | | | | | | 03/31/20 | | | | | $ | 51,504,500 | | | | | $ | (20,420) | | |
| U.S. Treasury 5-Year Note | | | | | 794 | | | | | | 03/31/20 | | | | | | 94,175,844 | | | | | | (298,923) | | |
| | | | | | | | | | | | | | | | | $ | 145,680,344 | | | | | $ | (319,343) | | |
| Short Contracts: | | | | | | | | | | | | | | | | | | | | | | | | | |
| U.S. Treasury 10-Year Note | | | | | (76) | | | | | | 03/20/20 | | | | | | (9,760,062) | | | | | | 47,244 | | |
| U.S. Treasury Long Bond | | | | | (26) | | | | | | 03/20/20 | | | | | | (4,053,562) | | | | | | 58,875 | | |
| U.S. Treasury Ultra 10-Year Note | | | | | (37) | | | | | | 03/20/20 | | | | | | (5,206,016) | | | | | | 135,314 | | |
| U.S. Treasury Ultra Long Bond | | | | | (23) | | | | | | 03/20/20 | | | | | | (4,178,094) | | | | | | 153,497 | | |
| | | | | | | | | | | | | | | | | $ | (23,197,734) | | | | | $ | 394,930 | | |
| Voya Balanced Income Portfolio | as of December 31, 2019 (continued) |
| Reference Entity/Obligation |
| |
Buy/Sell
Protection |
| |
(Pay)/
Receive Financing Rate (%)(2) |
| |
Termination
Date |
| |
Notional Amount(3)
|
| |
Fair
Value(4) |
| |
Unrealized
Appreciation/ (Depreciation) |
| ||||||||||||||||||
| iTraxx Cross-over Index, Series 32, Version 1 | | | | | Buy | | | | | | (5.000) | | | | | | 12/20/24 | | | | | | EUR 9,488,000 | | | | | $ | (1,450,190) | | | | | $ | (30,609) | | |
| | | | | | | | | | | | | | | | | | | | | | | | | | | | | $ | (1,450,190) | | | | | $ | (30,609) | | |
| Reference Entity/Obligation |
| |
Buy/Sell
Protection |
| |
(Pay)/
Receive Financing Rate (%)(6) |
| |
Termination
Date |
| |
Notional Amount(3)
|
| |
Fair
Value(4) |
| |
Unrealized
Appreciation/ (Depreciation) |
| ||||||||||||||||||
| CDX North American High Yield Index, Series 33, Version 2 | | | | | Sell | | | | | | 5.000 | | | | | | 12/20/24 | | | | | | USD 3,798,630 | | | | | $ | 365,941 | | | | | $ | 115,231 | | |
| | | | | | | | | | | | | | | | | | | | | | | | | | | | | $ | 365,941 | | | | | $ | 115,231 | | |
| Pay/Receive Volatility(1) |
| |
Reference Entity
|
| |
Volatility
Strike Rate |
| |
Counterparty
|
| |
Maturity
Date |
| |
Currency
|
| |
Notional
Amount |
| |
Fair Value
|
| |
Unrealized
Appreciation (Depreciation) |
| ||||||||||||||||||
| Receive | | |
USD vs. JPY
Spot Exchange Rate |
| | | | 5.800% | | | |
Citibank N.A.
|
| | | | 01/27/20 | | | | | | USD | | | | | | 23,000 | | | | | $ | (26,346) | | | | | $ | (26,346) | | |
| Receive | | |
USD vs. CAD Spot Exchange Rate
|
| | | | 4.050% | | | |
Citibank N.A.
|
| | | | 01/09/20 | | | | | | USD | | | | | | 23,000 | | | | | | (3,503) | | | | | | (3,503) | | |
| Receive | | |
USD vs. CAD Spot Exchange Rate
|
| | | | 4.100% | | | |
Morgan Stanley
Capital Services LLC |
| | | | 01/08/20 | | | | | | USD | | | | | | 23,000 | | | | | | (6,738) | | | | | | (6,738) | | |
| | | | | | | | | | | | | | | | | | | | | | | | | | | | | | | | | | | $ | (36,587) | | | | | $ | (36,587) | | |
|
Description
|
| |
Counterparty
|
| |
Expiration
Date |
| |
Exercise
Price |
| |
Notional
Amount |
| |
Cost
|
| |
Fair Value
|
| ||||||||||||||||||
| Call USD vs. Put JPY | | | | | BNP Paribas | | | | | | 02/26/20 | | | | | | 108.500 USD | | | | | | 2,340,000 | | | | | $ | 15,717 | | | | | $ | 18,550 | | |
| Put USD vs. Call JPY | | | | | BNP Paribas | | | | | | 02/26/20 | | | | | | 97.000 USD | | | | | | 3,510,000 | | | | | | 16,497 | | | | | | 397 | | |
| | | | | | | | | | | | | | | | | | | | | | | | | | | | | $ | 32,214 | | | | | $ | 18,947 | | |
| Voya Balanced Income Portfolio | as of December 31, 2019 (continued) |
|
Description
|
| |
Counterparty
|
| |
Expiration
Date |
| |
Exercise
Price |
| |
Notional
Amount |
| |
Premiums
Received |
| |
Fair Value
|
| ||||||||||||||||||
| Put USD vs. Call JPY | | | | | BNP Paribas | | | | | | 02/26/20 | | | | | | 100.000 USD | | | | | | 3,510,000 | | | | | $ | 28,704 | | | | | $ | (1,015) | | |
| | | | | | | | | | | | | | | | | | | | | | | | | | | | | $ | 28,704 | | | | | $ | (1,015) | | |
| | AUD | | | – | | | Australian Dollar | |
| | BRL | | | – | | | Brazilian Real | |
| | CAD | | | – | | | Canadian Dollar | |
| | CHF | | | – | | | Swiss Franc | |
| | COP | | | – | | | Colombian Peso | |
| | EUR | | | – | | | EU Euro | |
| | GBP | | | – | | | British Pound | |
| | IDR | | | – | | | Indonesian Rupiah | |
| | JPY | | | – | | | Japanese Yen | |
| | NOK | | | – | | | Norwegian Krone | |
| | NZD | | | – | | | New Zealand Dollar | |
| | PEN | | | – | | | Peruvian Nuevo Sol | |
| | PLN | | | – | | | Polish Zloty | |
| | RUB | | | – | | | Russian Ruble | |
| | SEK | | | – | | | Swedish Krona | |
| | USD | | | – | | | United States Dollar | |
|
Derivatives not accounted for as hedging instruments
|
| |
Location on Statement
of Assets and Liabilities |
| |
Fair Value
|
| |||
| Asset Derivatives | | | | | | | | | | |
| Foreign exchange contracts | | |
Investments in securities at value*
|
| | | $ | 18,947 | | |
| Foreign exchange contracts | | |
Unrealized appreciation on forward foreign currency contracts
|
| | | | 1,037,336 | | |
| Interest rate contracts | | |
Net Assets — Unrealized appreciation**
|
| | | | 394,930 | | |
| Credit contracts | | |
Net Assets — Unrealized appreciation***
|
| | | | 115,231 | | |
|
Total Asset Derivatives
|
| | | | | | $ | 1,566,444 | | |
| Liability Derivatives | | | | | | | | | | |
| Foreign exchange contracts | | |
Unrealized depreciation on forward foreign currency contracts
|
| | | $ | 697,516 | | |
| Interest rate contracts | | |
Net Assets — Unrealized depreciation**
|
| | | | 319,343 | | |
| Credit contracts | | |
Net Assets — Unrealized depreciation***
|
| | | | 30,609 | | |
| Foreign exchange contracts | | |
Unrealized depreciation on OTC swap agreements
|
| | | | 36,587 | | |
| Foreign exchange contracts | | |
Written options, at fair value
|
| | | | 1,015 | | |
|
Total Liability Derivatives
|
| | | | | | $ | 1,085,070 | | |
| Voya Balanced Income Portfolio | as of December 31, 2019 (continued) |
|
Derivatives not accounted for as hedging instruments
|
| |
Investments*
|
| |
Forward foreign
currency contracts |
| |
Futures
|
| |
Swaps
|
| |
Written
options |
| |
Total
|
| ||||||||||||||||||
| Credit contracts | | | | $ | — | | | | | $ | — | | | | | $ | — | | | | | $ | 745,403 | | | | | $ | — | | | | | $ | 745,403 | | |
| Equity contracts | | | | | 35,420 | | | | | | — | | | | | | — | | | | | | — | | | | | | — | | | | | | 35,420 | | |
| Foreign exchange contracts | | | | | — | | | | | | (151,882) | | | | | | — | | | | | | (14,289) | | | | | | — | | | | | | (166,171) | | |
| Interest rate contracts | | | | | (63,183) | | | | | | — | | | | | | 473,854 | | | | | | 30,903 | | | | | | 98,591 | | | | | | 540,165 | | |
|
Total
|
| | | $ | (27,763) | | | | | $ | (151,882) | | | | | $ | 473,854 | | | | | $ | 762,017 | | | | | $ | 98,591 | | | | | $ | 1,154,817 | | |
|
Derivatives not accounted for as hedging instruments
|
| |
Investments*
|
| |
Forward foreign
currency contracts |
| |
Futures
|
| |
Swaps
|
| |
Written
options |
| |
Total
|
| ||||||||||||||||||
| Credit contracts | | | | $ | — | | | | | $ | — | | | | | $ | — | | | | | $ | 84,622 | | | | | $ | — | | | | | $ | 84,622 | | |
| Equity contracts | | | | | — | | | | | | — | | | | | | — | | | | | | — | | | | | | (30,029) | | | | | | (30,029) | | |
| Foreign exchange contracts | | | | | (13,267) | | | | | | 339,820 | | | | | | — | | | | | | (36,587) | | | | | | 27,689 | | | | | | 317,655 | | |
| Interest rate contracts | | | | | — | | | | | | — | | | | | | 75,587 | | | | | | — | | | | | | — | | | | | | 75,587 | | |
|
Total
|
| | | $ | (13,267) | | | | | $ | 339,820 | | | | | $ | 75,587 | | | | | $ | 48,035 | | | | | $ | (2,340) | | | | | $ | 447,835 | | |
| | | |
Bank of
America N.A. |
| |
BNP
Paribas |
| |
Brown Brothers
Harriman |
| |
Citibank N.A.
|
| |
Morgan Stanley
Capital Services LLC |
| |
Totals
|
| ||||||||||||||||||
| Assets: | | | | | | | | | | | | | | | | | | | | | | | | | | | | | | | | | | | | | |
| Purchased options | | | | $ | — | | | | | $ | 18,947 | | | | | $ | — | | | | | $ | — | | | | | $ | — | | | | | $ | 18,947 | | |
| Forward foreign currency contracts | | | | | 58,008 | | | | | | 265,158 | | | | | | 456,299 | | | | | | 38,509 | | | | | | 219,362 | | | | | | 1,037,336 | | |
|
Total Assets
|
| | | $ | 58,008 | | | | | $ | 284,105 | | | | | $ | 456,299 | | | | | $ | 38,509 | | | | | $ | 219,362 | | | | | $ | 1,056,283 | | |
| Liabilities: | | | | | | | | | | | | | | | | | | | | | | | | | | | | | | | | | | | | | |
| Forward foreign currency contracts | | | | $ | 27,674 | | | | | $ | 112,668 | | | | | $ | 396,549 | | | | | $ | 57,808 | | | | | $ | 102,817 | | | | | $ | 697,516 | | |
| Volatility swaps | | | | | — | | | | | | — | | | | | | — | | | | | | 29,849 | | | | | | 6,738 | | | | | | 36,587 | | |
| Written options | | | | | — | | | | | | 1,015 | | | | | | — | | | | | | — | | | | | | — | | | | | | 1,015 | | |
|
Total Liabilities
|
| | | $ | 27,674 | | | | | $ | 113,683 | | | | | $ | 396,549 | | | | | $ | 87,657 | | | | | $ | 109,555 | | | | | $ | 735,118 | | |
|
Net OTC derivative instruments by counterparty, at fair value
|
| | | $ | 30,334 | | | | | $ | 170,422 | | | | | $ | 59,750 | | | | | $ | (49,148) | | | | | $ | 109,807 | | | | | | 321,165 | | |
|
Total collateral pledged by the Portfolio/(Received from counterparty)
|
| | | $ | — | | | | | $ | — | | | | | $ | — | | | | | $ | — | | | | | $ | — | | | | | $ | — | | |
|
Net Exposure(1)
|
| | | $ | 30,334 | | | | | $ | 170,422 | | | | | $ | 59,750 | | | | | $ | (49,148) | | | | | $ | 109,807 | | | | | $ | 321,165 | | |
| Voya Balanced Income Portfolio | as of December 31, 2019 (continued) |
| | Cost for federal income tax purposes was $360,387,346. | | | | | | | |
| | Net unrealized appreciation consisted of: | | | | | | | |
| |
Gross Unrealized Appreciation
|
| | | $ | 25,321,256 | | |
| |
Gross Unrealized Depreciation
|
| | | | (7,251,413) | | |
| |
Net Unrealized Appreciation
|
| | | $ | 18,069,843 | | |
| Voya High Yield Portfolio | as of December 31, 2019 |
| Principal Amount† |
| |
Value
|
| |
Percentage
of Net Assets |
| |||||||||
| CORPORATE BONDS/NOTES: 95.4% | | |||||||||||||||
| | | | Basic Materials: 4.4% | | ||||||||||||
| 2,200,000 (1) | | | Aruba Investments, Inc., 8.750%, 02/15/2023 |
| | | $ | 2,195,413 | | | | | | 0.4 | | |
| 1,450,000 (1) | | | Compass Minerals International, Inc., 6.750%, 12/01/2027 |
| | | | 1,543,307 | | | | | | 0.2 | | |
| 1,330,000 (1) | | | Constellium SE, 5.750%, 05/15/2024 |
| | | | 1,370,452 | | | | | | 0.2 | | |
| 250,000 (1)(2) | | | Constellium SE, 5.875%, 02/15/2026 |
| | | | 265,006 | | | | | | 0.1 | | |
| 1,100,000 (1)(2) | | | Constellium SE, 6.625%, 03/01/2025 |
| | | | 1,144,099 | | | | | | 0.2 | | |
| 1,740,000 (1) | | | First Quantum Minerals Ltd., 6.500%, 03/01/2024 |
| | | | 1,747,978 | | | | | | 0.3 | | |
| 2,275,000 (1) | | | Novelis Corp., 5.875%, 09/30/2026 |
| | | | 2,426,123 | | | | | | 0.4 | | |
| 400,000 (1) | | | Novelis Corp., 6.250%, 08/15/2024 |
| | | | 420,496 | | | | | | 0.1 | | |
| 1,250,000 (1) | | | OCI NV, 5.250%, 11/01/2024 |
| | | | 1,303,125 | | | | | | 0.2 | | |
| 2,500,000 (1) | | | OCI NV, 6.625%, 04/15/2023 |
| | | | 2,615,000 | | | | | | 0.4 | | |
| 2,000,000 (1) | | | Schweitzer-Mauduit International, Inc., 6.875%, 10/01/2026 |
| | | | 2,160,695 | | | | | | 0.4 | | |
| 1,015,000 (1) | | | SPCM SA, 4.875%, 09/15/2025 |
| | | | 1,058,127 | | | | | | 0.2 | | |
| 1,625,000 (1)(2) | | | Tronox, Inc., 6.500%, 04/15/2026 |
| | | | 1,678,178 | | | | | | 0.3 | | |
| 1,450,000 (1) | | | Univar Solutions USA, Inc., 5.125%, 12/01/2027 |
| | | | 1,516,164 | | | | | | 0.2 | | |
| 4,425,000 (3) | | | Other Securities | | | | | 4,565,172 | | | | | | 0.8 | | |
| | | | | | | | | 26,009,335 | | | | | | 4.4 | | |
| | | | Communications: 21.9% | | ||||||||||||
| 1,000,000 (1) | | | Altice France SA/France, 8.125%, 02/01/2027 |
| | | | 1,128,100 | | | | | | 0.2 | | |
| 950,000 (1) | | | Altice Luxembourg SA, 7.625%, 02/15/2025 |
| | | | 990,375 | | | | | | 0.1 | | |
| 2,438,000 (1) | | | Altice Luxembourg SA, 10.500%, 05/15/2027 |
| | | | 2,783,952 | | | | | | 0.5 | | |
| 1,625,000 (1) | | | Altice Finco SA, 7.625%, 02/15/2025 |
| | | | 1,686,612 | | | | | | 0.3 | | |
| 2,000,000 (2) | | | AMC Networks, Inc., 4.750%, 08/01/2025 |
| | | | 2,011,670 | | | | | | 0.3 | | |
| 2,100,000 (1) | | | Block Communications, Inc., 6.875%, 02/15/2025 |
| | | | 2,183,979 | | | | | | 0.4 | | |
| 2,300,000 (1) | | | C&W Senior Financing DAC, 7.500%, 10/15/2026 |
| | | | 2,495,920 | | | | | | 0.4 | | |
| 2,775,000 (1) | | | CCO Holdings LLC / CCO Holdings Capital Corp., 5.125%, 05/01/2027 |
| | | | 2,932,759 | | | | | | 0.5 | | |
| 1,290,000 (1) | | | CCO Holdings LLC / CCO Holdings Capital Corp., 5.000%, 02/01/2028 |
| | | | 1,356,009 | | | | | | 0.2 | | |
| 1,635,000 (1) | | | CCO Holdings LLC / CCO Holdings Capital Corp., 5.500%, 05/01/2026 |
| | | | 1,726,679 | | | | | | 0.3 | | |
| Principal Amount† |
| |
Value
|
| |
Percentage
of Net Assets |
| |||||||||
| CORPORATE BONDS/NOTES: (continued) | | |||||||||||||||
| | | | Communications (continued) | | ||||||||||||
| 3,000,000 (1) | | | CCO Holdings LLC / CCO Holdings Capital Corp., 5.750%, 02/15/2026 |
| | | $ | 3,170,610 | | | | | | 0.6 | | |
| 940,000 (1) | | | CCO Holdings LLC / CCO Holdings Capital Corp., 4.750%, 03/01/2030 |
| | | | 960,567 | | | | | | 0.2 | | |
| 2,025,000 (1)(2) | | | Clear Channel Worldwide Holdings, Inc., 9.250%, 02/15/2024 |
| | | | 2,246,910 | | | | | | 0.4 | | |
| 3,800,000 (1) | | | CommScope Tech Finance LLC, 6.000%, 06/15/2025 |
| | | | 3,813,794 | | | | | | 0.6 | | |
| 375,000 (1) | | | CommScope Technologies LLC, 5.000%, 03/15/2027 |
| | | | 353,447 | | | | | | 0.1 | | |
| 2,150,000 (1) | | | Connect Finco SARL / Connect US Finco LLC, 6.750%, 10/01/2026 |
| | | | 2,292,437 | | | | | | 0.4 | | |
| 3,550,000 (2) | | | CSC Holdings LLC, 5.250%, 06/01/2024 |
| | | | 3,832,527 | | | | | | 0.7 | | |
| 2,350,000 (1) | | | CSC Holdings LLC, 5.500%, 05/15/2026 |
| | | | 2,493,497 | | | | | | 0.4 | | |
| 1,125,000 (1) | | | CSC Holdings LLC, 5.750%, 01/15/2030 |
| | | | 1,202,344 | | | | | | 0.2 | | |
| 850,000 (1) | | | CSC Holdings LLC, 7.500%, 04/01/2028 |
| | | | 962,474 | | | | | | 0.2 | | |
| 1,725,000 (1)(2) | | | Cumulus Media New Holdings, Inc., 6.750%, 07/01/2026 |
| | | | 1,851,139 | | | | | | 0.3 | | |
| 1,193,000 (1) | | | Diamond Sports Group LLC / Diamond Sports Finance Co., 5.375%, 08/15/2026 |
| | | | 1,209,017 | | | | | | 0.2 | | |
| 2,599,000 (1)(2) | | | Diamond Sports Group LLC / Diamond Sports Finance Co., 6.625%, 08/15/2027 |
| | | | 2,532,336 | | | | | | 0.4 | | |
| 2,375,000 (2) | | | DISH DBS Corp., 5.875%, 11/15/2024 |
| | | | 2,431,905 | | | | | | 0.4 | | |
| 2,175,000 (2) | | | DISH DBS Corp., 5.000%-5.875%, 07/15/2022-03/15/2023 |
| | | | 2,283,455 | | | | | | 0.4 | | |
| 1,650,000 (1)(2) | | | Entercom Media Corp., 7.250%, 11/01/2024 |
| | | | 1,741,435 | | | | | | 0.3 | | |
| 1,200,000 (1) | | | Frontier Communications Corp., 8.000%, 04/01/2027 |
| | | | 1,256,220 | | | | | | 0.2 | | |
| 900,000 (1) | | | GCI LLC, 6.625%, 06/15/2024 |
| | | | 976,873 | | | | | | 0.2 | | |
| 2,125,000 (1)(2) | | | Gray Television, Inc., 5.125%, 10/15/2024 |
| | | | 2,209,118 | | | | | | 0.4 | | |
| 1,275,000 (1) | | | Gray Television, Inc., 7.000%, 05/15/2027 |
| | | | 1,419,203 | | | | | | 0.2 | | |
| 650,000 (1) | | | iHeartCommunications, Inc., 5.250%, 08/15/2027 |
| | | | 681,298 | | | | | | 0.1 | | |
| 2,125,000 (2) | | | iHeartCommunications, Inc., 8.375%, 05/01/2027 |
| | | | 2,352,056 | | | | | | 0.4 | | |
| Voya High Yield Portfolio | as of December 31, 2019 (continued) |
| Principal Amount† |
| |
Value
|
| |
Percentage
of Net Assets |
| |||||||||
| CORPORATE BONDS/NOTES: (continued) | | |||||||||||||||
| | | | Communications (continued) | | ||||||||||||
| 775,000 (1)(2) | | | Intelsat Connect Finance SA, 9.500%, 02/15/2023 |
| | | $ | 544,205 | | | | | | 0.1 | | |
| 1,650,000 (1) | | | Intelsat Jackson Holdings SA, 8.500%, 10/15/2024 |
| | | | 1,506,310 | | | | | | 0.3 | | |
| 2,250,000 (2) | | | Intelsat Luxembourg SA, 8.125%, 06/01/2023 |
| | | | 1,335,915 | | | | | | 0.2 | | |
| 2,150,000 (1)(2) | | | LCPR Senior Secured Financing DAC, 6.750%, 10/15/2027 |
| | | | 2,282,977 | | | | | | 0.4 | | |
| 2,025,000 (1) | | | MDC Partners, Inc., 6.500%, 05/01/2024 |
| | | | 1,837,687 | | | | | | 0.3 | | |
| 1,200,000 (1) | | | Midcontinent Communications / Midcontinent Finance Corp., 5.375%, 08/15/2027 |
| | | | 1,272,417 | | | | | | 0.2 | | |
| 450,000 (1)(2) | | | Netflix, Inc., 4.875%, 06/15/2030 |
| | | | 457,864 | | | | | | 0.1 | | |
| 2,450,000 | | | Netflix, Inc., 5.875%, 11/15/2028 |
| | | | 2,720,504 | | | | | | 0.4 | | |
| 2,100,000 (1)(2) | | | Nexstar Broadcasting, Inc., 5.625%, 08/01/2024 |
| | | | 2,193,628 | | | | | | 0.4 | | |
| 1,875,000 (1) | | | Nexstar Broadcasting, Inc., 5.625%, 07/15/2027 |
| | | | 1,979,344 | | | | | | 0.3 | | |
| 1,025,000 (1) | | | Altice France SA/France, 7.375%, 05/01/2026 |
| | | | 1,102,377 | | | | | | 0.2 | | |
| 1,875,000 (1)(2) | | | Plantronics, Inc., 5.500%, 05/31/2023 |
| | | | 1,837,481 | | | | | | 0.3 | | |
| 1,150,000 (1)(2) | | | Sinclair Television Group, Inc., 5.125%, 02/15/2027 |
| | | | 1,184,900 | | | | | | 0.2 | | |
| 1,002,000 (1) | | | Sirius XM Radio, Inc., 4.625%, 07/15/2024 |
| | | | 1,054,189 | | | | | | 0.2 | | |
| 2,625,000 (1) | | | Sirius XM Radio, Inc., 5.000%, 08/01/2027 |
| | | | 2,774,231 | | | | | | 0.5 | | |
| 2,300,000 | | | Sprint Communications, Inc., 6.000%, 11/15/2022 |
| | | | 2,416,219 | | | | | | 0.4 | | |
| 4,055,000 | | | Sprint Corp., 7.125%, 06/15/2024 |
| | | | 4,382,786 | | | | | | 0.7 | | |
| 1,900,000 | | | Sprint Corp., 7.625%, 03/01/2026 |
| | | | 2,098,835 | | | | | | 0.4 | | |
| 1,625,000 (1) | | | TEGNA, Inc., 5.000%, 09/15/2029 |
| | | | 1,655,469 | | | | | | 0.3 | | |
| 2,850,000 (2) | | | Telecom Italia Capital SA, 6.000%-6.375%, 11/15/2033-09/30/2034 |
| | | | 3,119,711 | | | | | | 0.5 | | |
| 1,525,000 (1) | | | Telesat Canada / Telesat LLC, 6.500%, 10/15/2027 |
| | | | 1,592,634 | | | | | | 0.3 | | |
| 2,150,000 (1) | | | Terrier Media Buyer, Inc., 8.875%, 12/15/2027 |
| | | | 2,279,000 | | | | | | 0.4 | | |
| 700,000 | | | T-Mobile USA, Inc., 5.125%, 04/15/2025 |
| | | | 725,872 | | | | | | 0.1 | | |
| 2,650,000 | | | T-Mobile USA, Inc., 6.500%, 01/15/2026 |
| | | | 2,846,259 | | | | | | 0.5 | | |
| 670,000 (1) | | | Townsquare Media, Inc., 6.500%, 04/01/2023 |
| | | | 682,003 | | | | | | 0.1 | | |
| 1,725,000 (1) | | | ViaSat, Inc., 5.625%, 09/15/2025 |
| | | | 1,780,347 | | | | | | 0.3 | | |
| Principal Amount† |
| |
Value
|
| |
Percentage
of Net Assets |
| |||||||||
| CORPORATE BONDS/NOTES: (continued) | | |||||||||||||||
| | | | Communications (continued) | | ||||||||||||
| 500,000 (1)(2) | | | ViaSat, Inc., 5.625%, 04/15/2027 |
| | | $ | 535,925 | | | | | | 0.1 | | |
| 2,550,000 (1)(2) | | | Virgin Media Secured Finance PLC, 5.500%, 05/15/2029 |
| | | | 2,704,530 | | | | | | 0.5 | | |
| 725,000 (1)(2) | | | Ziggo BV, 4.875%, 01/15/2030 |
| | | | 750,109 | | | | | | 0.1 | | |
| 15,430,000 (3) | | | Other Securities | | | | | 15,246,325 | | | | | | 2.6 | | |
| | | | | | | | | 128,468,770 | | | | | | 21.9 | | |
| | | | Consumer, Cyclical: 19.4% | | ||||||||||||
| 3,725,000 (1) | | | 1011778 BC ULC / New Red Finance, Inc., 5.000%, 10/15/2025 |
| | | | 3,853,829 | | | | | | 0.7 | | |
| 2,025,000 (1)(2) | | | Adient Global Holdings Ltd., 4.875%, 08/15/2026 |
| | | | 1,812,426 | | | | | | 0.3 | | |
| 1,575,000 (1) | | | Allison Transmission, Inc., 5.875%, 06/01/2029 |
| | | | 1,728,283 | | | | | | 0.3 | | |
| 2,725,000 (2) | | | AMC Entertainment Holdings, Inc., 5.875%, 11/15/2026 |
| | | | 2,462,235 | | | | | | 0.4 | | |
| 960,000 (1) | | | American Builders & Contractors Supply Co., Inc., 4.000%, 01/15/2028 |
| | | | 976,176 | | | | | | 0.2 | | |
| 1,250,000 (1) | | | Ashton Woods USA LLC / Ashton Woods Finance Co., 6.750%, 08/01/2025 |
| | | | 1,281,769 | | | | | | 0.2 | | |
| 2,540,000 (1)(2) | | | Caesars Resort Collection LLC / CRC Finco, Inc., 5.250%, 10/15/2025 |
| | | | 2,632,075 | | | | | | 0.4 | | |
| 1,880,000 (1)(2) | | | CCM Merger, Inc., 6.000%, 03/15/2022 |
| | | | 1,922,300 | | | | | | 0.3 | | |
| 1,600,000 | | | Cedar Fair L.P. / Canada’s Wonderland Co. / Magnum Management Corp., 5.375%, 06/01/2024 |
| | | | 1,648,664 | | | | | | 0.3 | | |
| 1,750,000 (1) | | | Cedar Fair L.P., 5.250%, 07/15/2029 |
| | | | 1,888,862 | | | | | | 0.3 | | |
| 2,300,000 | | | Century Communities, Inc., 5.875%, 07/15/2025 |
| | | | 2,401,579 | | | | | | 0.4 | | |
| 480,000 (1)(2)(4) | | | Core & Main Holdings L.P., 8.625% (PIK Rate 9.375%, Cash Rate 8.625%), 09/15/2024 |
| | | | 500,599 | | | | | | 0.1 | | |
| 1,925,000 (1)(2) | | | Core & Main L.P., 6.125%, 08/15/2025 |
| | | | 2,001,981 | | | | | | 0.3 | | |
| 2,900,000 | | | Dana, Inc., 5.500%, 12/15/2024 |
| | | | 2,989,421 | | | | | | 0.5 | | |
| 1,525,000 (1) | | | Golden Entertainment, Inc., 7.625%, 04/15/2026 |
| | | | 1,646,806 | | | | | | 0.3 | | |
| 2,900,000 (1) | | | Golden Nugget, Inc., 6.750%, 10/15/2024 |
| | | | 3,008,721 | | | | | | 0.5 | | |
| 2,675,000 | | | H&E Equipment Services, Inc., 5.625%, 09/01/2025 |
| | | | 2,809,860 | | | | | | 0.5 | | |
| 1,450,000 (1) | | | IAA, Inc., 5.500%, 06/15/2027 |
| | | | 1,543,307 | | | | | | 0.3 | | |
| Voya High Yield Portfolio | as of December 31, 2019 (continued) |
| Principal Amount† |
| |
Value
|
| |
Percentage
of Net Assets |
| |||||||||
| CORPORATE BONDS/NOTES: (continued) | | |||||||||||||||
| | | | Consumer, Cyclical (continued) | | ||||||||||||
| 1,525,000 (1) | | | Installed Building Products, Inc., 5.750%, 02/01/2028 |
| | | $ | 1,634,186 | | | | | | 0.3 | | |
| 1,200,000 (1) | | | International Game Technology PLC, 6.250%, 02/15/2022 |
| | | | 1,268,136 | | | | | | 0.2 | | |
| 1,850,000 (1) | | | International Game Technology PLC, 6.500%, 02/15/2025 |
| | | | 2,081,231 | | | | | | 0.4 | | |
| 2,925,000 | | | L Brands, Inc., 6.750%, 07/01/2036 |
| | | | 2,574,292 | | | | | | 0.4 | | |
| 3,225,000 | | | Lennar Corp., 5.250%-5.375%, 10/01/2022-06/01/2026 |
| | | | 3,506,827 | | | | | | 0.6 | | |
| 1,825,000 (1)(2) | | | Lions Gate Capital Holdings LLC, 5.875%, 11/01/2024 |
| | | | 1,857,695 | | | | | | 0.3 | | |
| 1,700,000 (1) | | | Live Nation Entertainment, Inc., 4.750%, 10/15/2027 |
| | | | 1,762,645 | | | | | | 0.3 | | |
| 2,575,000 (1) | | | Mattel, Inc., 5.875%, 12/15/2027 |
| | | | 2,718,170 | | | | | | 0.5 | | |
| 3,650,000 (2) | | | MGM Resorts International, 5.500%-6.000%, 03/15/2023-04/15/2027 |
| | | | 4,054,588 | | | | | | 0.7 | | |
| 1,675,000 (1)(2) | | | Michaels Stores, Inc., 8.000%, 07/15/2027 |
| | | | 1,602,724 | | | | | | 0.3 | | |
| 1,600,000 (1)(2) | | | Motion Bondco DAC, 6.625%, 11/15/2027 |
| | | | 1,698,000 | | | | | | 0.3 | | |
| 2,225,000 | | | Murphy Oil USA, Inc., 4.750%-5.625%, 05/01/2027-09/15/2029 |
| | | | 2,363,457 | | | | | | 0.4 | | |
| 1,850,000 (1) | | | Navistar International Corp., 6.625%, 11/01/2025 |
| | | | 1,888,545 | | | | | | 0.3 | | |
| 1,875,000 (1)(2) | | | Penn National Gaming, Inc., 5.625%, 01/15/2027 |
| | | | 1,986,848 | | | | | | 0.3 | | |
| 1,515,000 (1) | | | Performance Food Group, Inc., 5.500%, 10/15/2027 |
| | | | 1,622,982 | | | | | | 0.3 | | |
| 1,125,000 (1) | | | PetSmart, Inc., 5.875%, 06/01/2025 |
| | | | 1,148,906 | | | | | | 0.2 | | |
| 2,150,000 (1) | | | PetSmart, Inc., 7.125%, 03/15/2023 |
| | | | 2,112,375 | | | | | | 0.4 | | |
| 2,100,000 (1)(2) | | | Resideo Funding, Inc., 6.125%, 11/01/2026 |
| | | | 2,121,053 | | | | | | 0.4 | | |
| 1,450,000 (1)(2) | | | Scientific Games International, Inc., 5.000%, 10/15/2025 |
| | | | 1,522,500 | | | | | | 0.2 | | |
| 950,000 (1) | | | Scientific Games International, Inc., 7.000%, 05/15/2028 |
| | | | 1,018,257 | | | | | | 0.2 | | |
| 1,000,000 (1) | | | Scientific Games International, Inc., 8.250%, 03/15/2026 |
| | | | 1,104,374 | | | | | | 0.2 | | |
| 1,010,000 | | | Scientific Games International, Inc., 6.625%, 05/15/2021 |
| | | | 1,026,817 | | | | | | 0.2 | | |
| Principal Amount† |
| |
Value
|
| |
Percentage
of Net Assets |
| |||||||||
| CORPORATE BONDS/NOTES: (continued) | | |||||||||||||||
| | | | Consumer, Cyclical (continued) | | ||||||||||||
| 1,925,000 (1) | | | Silversea Cruise Finance Ltd., 7.250%, 02/01/2025 |
| | | $ | 2,041,299 | | | | | | 0.3 | | |
| 1,800,000 (1)(2) | | | Six Flags Entertainment Corp., 5.500%, 04/15/2027 |
| | | | 1,922,580 | | | | | | 0.3 | | |
| 1,210,000 (1) | | | Speedway Motorsports LLC / Speedway Funding II, Inc., 4.875%, 11/01/2027 |
| | | | 1,229,663 | | | | | | 0.2 | | |
| 900,000 (1) | | | Staples, Inc., 7.500%, 04/15/2026 |
| | | | 935,437 | | | | | | 0.1 | | |
| 1,625,000 (1)(2) | | | Staples, Inc., 10.750%, 04/15/2027 |
| | | | 1,652,381 | | | | | | 0.3 | | |
| 2,300,000 (1)(2) | | | Station Casinos LLC, 5.000%, 10/01/2025 |
| | | | 2,346,000 | | | | | | 0.4 | | |
| 1,150,000 (1)(2) | | | Taylor Morrison Communities, Inc., 5.750%, 01/15/2028 |
| | | | 1,256,775 | | | | | | 0.2 | | |
| 2,500,000 (1) | | | Viking Cruises Ltd., 5.875%, 09/15/2027 |
| | | | 2,676,500 | | | | | | 0.5 | | |
| 1,425,000 (1) | | | William Carter Co/The, 5.625%, 03/15/2027 |
| | | | 1,535,185 | | | | | | 0.3 | | |
| 645,000 (1) | | | WMG Acquisition Corp., 5.000%, 08/01/2023 |
| | | | 661,393 | | | | | | 0.1 | | |
| 2,150,000 (1) | | | Wolverine World Wide, Inc., 5.000%, 09/01/2026 |
| | | | 2,187,625 | | | | | | 0.4 | | |
| 14,784,000 (3) | | | Other Securities | | | | | 15,363,144 | | | | | | 2.6 | | |
| | | | | | | | | 113,591,483 | | | | | | 19.4 | | |
| | | | Consumer, Non-cyclical: 17.5% | | ||||||||||||
| 1,363,000 (1)(2) | | | Albertsons Cos, Inc. / Safeway, Inc. / New Albertsons L.P. / Albertsons LLC, 5.875%, 02/15/2028 |
| | | | 1,450,709 | | | | | | 0.3 | | |
| 2,345,000 (2) | | | Albertsons Cos, Inc. / Safeway, Inc. / New Albertsons L.P. / Albertsons LLC, 6.625%, 06/15/2024 |
| | | | 2,460,257 | | | | | | 0.4 | | |
| 1,425,000 (1) | | | AMN Healthcare, Inc., 4.625%, 10/01/2027 |
| | | | 1,432,620 | | | | | | 0.2 | | |
| 4,275,000 (1) | | | Bausch Health Americas, Inc., 8.500%, 01/31/2027 |
| | | | 4,876,279 | | | | | | 0.8 | | |
| 1,650,000 (1) | | | Bausch Health Cos, Inc., 5.000%, 01/30/2028 |
| | | | 1,697,669 | | | | | | 0.3 | | |
| 1,650,000 (1) | | | Bausch Health Cos, Inc., 5.250%, 01/30/2030 |
| | | | 1,715,175 | | | | | | 0.3 | | |
| 875,000 (1) | | | Bausch Health Cos, Inc., 5.500%, 11/01/2025 |
| | | | 916,199 | | | | | | 0.2 | | |
| 1,125,000 (1)(2) | | | Bausch Health Cos, Inc., 6.125%, 04/15/2025 |
| | | | 1,164,729 | | | | | | 0.2 | | |
| 1,225,000 (1) | | | Bausch Health Cos, Inc., 7.000%, 01/15/2028 |
| | | | 1,349,766 | | | | | | 0.2 | | |
| 1,600,000 (1)(2) | | | Cardtronics, Inc. / Cardtronics USA, Inc., 5.500%, 05/01/2025 |
| | | | 1,664,664 | | | | | | 0.3 | | |
| Voya High Yield Portfolio | as of December 31, 2019 (continued) |
| Principal Amount† |
| |
Value
|
| |
Percentage
of Net Assets |
| |||||||||
| CORPORATE BONDS/NOTES: (continued) | | |||||||||||||||
| | | | Consumer, Non-cyclical (continued) | | ||||||||||||
| 845,000 (1) | | | Catalent Pharma Solutions, Inc., 5.000%, 07/15/2027 |
| | | $ | 886,701 | | | | | | 0.1 | | |
| 1,060,000 (1) | | | Centene Corp., 4.250%, 12/15/2027 |
| | | | 1,092,436 | | | | | | 0.2 | | |
| 1,415,000 (1) | | | Centene Corp., 4.625%, 12/15/2029 |
| | | | 1,493,815 | | | | | | 0.2 | | |
| 945,000 (1) | | | Centene Corp., 4.750%, 01/15/2025 |
| | | | 983,570 | | | | | | 0.2 | | |
| 875,000 (1) | | | Centene Corp., 5.375%, 06/01/2026 |
| | | | 930,213 | | | | | | 0.2 | | |
| 2,000,000 | | | Centene Corp., 4.750%-6.125%, 02/15/2024-01/15/2025 |
| | | | 2,080,030 | | | | | | 0.3 | | |
| 1,375,000 (1) | | | Chobani LLC / Chobani Finance Corp., Inc., 7.500%, 04/15/2025 |
| | | | 1,385,299 | | | | | | 0.2 | | |
| 1,975,000 (1) | | | Cott Holdings, Inc., 5.500%, 04/01/2025 |
| | | | 2,067,993 | | | | | | 0.3 | | |
| 1,450,000 (1)(4) | | | Eagle Holding CO II LLC, 7.625% (PIK Rate 8.375%, Cash Rate 7.625%), 05/15/2022 |
| | | | 1,476,438 | | | | | | 0.2 | | |
| 1,675,000 (1)(4) | | | Eagle Holding Co. II LLC, 7.750% (PIK Rate 8.500%, Cash Rate 7.750%), 05/15/2022 |
| | | | 1,703,743 | | | | | | 0.3 | | |
| 950,000 (1)(2) | | | Endo Ltd. / Endo Finance LLC / Endo Finco, Inc., 6.000%, 02/01/2025 |
| | | | 643,330 | | | | | | 0.1 | | |
| 2,075,000 (1) | | | Garda World Security Corp., 8.750%, 05/15/2025 |
| | | | 2,163,167 | | | | | | 0.4 | | |
| 2,250,000 (1) | | | Graham Holdings Co., 5.750%, 06/01/2026 |
| | | | 2,408,282 | | | | | | 0.4 | | |
| 2,000,000 | | | HCA Healthcare, Inc., 6.250%, 02/15/2021 |
| | | | 2,089,500 | | | | | | 0.4 | | |
| 5,050,000 | | | HCA, Inc., 5.375%, 02/01/2025 |
| | | | 5,594,971 | | | | | | 0.9 | | |
| 2,264,000 | | | HCA, Inc., 5.625%-7.500%, 02/15/2022-09/01/2028 |
| | | | 2,518,751 | | | | | | 0.4 | | |
| 940,000 (1) | | | Hertz Corp./The, 6.000%, 01/15/2028 |
| | | | 941,739 | | | | | | 0.1 | | |
| 1,006,000 (1)(2) | | | Hertz Corp./The, 7.125%, 08/01/2026 |
| | | | 1,091,384 | | | | | | 0.2 | | |
| 158,000 (1) | | | Hertz Corp./The, 7.625%, 06/01/2022 |
| | | | 164,715 | | | | | | 0.0 | | |
| 1,600,000 (1)(2) | | | Hertz Corp., 5.500%, 10/15/2024 |
| | | | 1,643,336 | | | | | | 0.3 | | |
| 925,000 (1) | | | Hill-Rom Holdings, Inc., 4.375%, 09/15/2027 |
| | | | 954,228 | | | | | | 0.2 | | |
| 1,900,000 (1) | | | JBS USA LUX SA / JBS USA Finance, Inc., 5.875%, 07/15/2024 |
| | | | 1,957,475 | | | | | | 0.3 | | |
| 1,290,000 (1) | | | JBS USA LUX SA / JBS USA Finance, Inc., 6.750%, 02/15/2028 |
| | | | 1,427,850 | | | | | | 0.3 | | |
| Principal Amount† |
| |
Value
|
| |
Percentage
of Net Assets |
| |||||||||
| CORPORATE BONDS/NOTES: (continued) | | |||||||||||||||
| | | | Consumer, Non-cyclical (continued) | | ||||||||||||
| 1,575,000 (1) | | | JBS USA LUX SA / JBS USA Food Co. / JBS USA Finance, Inc., 5.500%, 01/15/2030 |
| | | $ | 1,694,621 | | | | | | 0.3 | | |
| 1,425,000 (1) | | | KeHE Distributors LLC / KeHE Finance Corp., 8.625%, 10/15/2026 |
| | | | 1,495,359 | | | | | | 0.3 | | |
| 2,675,000 (1) | | | MPH Acquisition Holdings LLC, 7.125%, 06/01/2024 |
| | | | 2,594,723 | | | | | | 0.4 | | |
| 1,575,000 (1)(2) | | | Par Pharmaceutical, Inc., 7.500%, 04/01/2027 |
| | | | 1,571,102 | | | | | | 0.3 | | |
| 1,050,000 (1) | | | Pilgrim’s Pride Corp., 5.750%, 03/15/2025 |
| | | | 1,087,501 | | | | | | 0.2 | | |
| 1,150,000 (1) | | | Pilgrim’s Pride Corp., 5.875%, 09/30/2027 |
| | | | 1,245,565 | | | | | | 0.2 | | |
| 800,000 (1)(2)(4) | | | Polaris Intermediate Corp., 8.500% (PIK Rate 9.250%, Cash Rate 8.500%), 12/01/2022 |
| | | | 746,995 | | | | | | 0.1 | | |
| 2,900,000 (1)(2) | | | Post Holdings, Inc., 5.625%, 01/15/2028 |
| | | | 3,130,115 | | | | | | 0.6 | | |
| 1,250,000 (1) | | | Post Holdings, Inc., 8.000%, 07/15/2025 |
| | | | 1,342,394 | | | | | | 0.2 | | |
| 2,225,000 (1) | | | Select Medical Corp., 6.250%, 08/15/2026 |
| | | | 2,412,690 | | | | | | 0.4 | | |
| 1,600,000 (1)(2) | | | Simmons Foods, Inc., 5.750%, 11/01/2024 |
| | | | 1,611,336 | | | | | | 0.3 | | |
| 2,750,000 (2) | | | Tenet Healthcare Corp., 6.750%, 06/15/2023 |
| | | | 3,027,186 | | | | | | 0.5 | | |
| 2,090,000 (2) | | | Tenet Healthcare Corp., 5.125%-8.125%, 04/01/2022-05/01/2025 |
| | | | 2,218,349 | | | | | | 0.4 | | |
| 5,897,000 | | | United Rentals North America, Inc., 4.625%-6.500%, 07/15/2025-01/15/2030 |
| | | | 6,259,072 | | | | | | 1.1 | | |
| 1,000,000 (1) | | | Vizient, Inc., 6.250%, 05/15/2027 |
| | | | 1,072,847 | | | | | | 0.2 | | |
| 1,675,000 (1) | | | West Street Merger Sub, Inc., 6.375%, 09/01/2025 |
| | | | 1,674,983 | | | | | | 0.3 | | |
| 12,902,000 (3) | | | Other Securities | | | | | 13,249,517 | | | | | | 2.3 | | |
| | | | | | | | | 102,861,388 | | | | | | 17.5 | | |
| | | | Energy: 8.3% | | ||||||||||||
| 920,000 (1)(2) | | | Archrock Partners L.P. / Archrock Partners Finance Corp., 6.250%, 04/01/2028 |
| | | | 949,900 | | | | | | 0.2 | | |
| 550,000 (1)(2) | | | Archrock Partners L.P. / Archrock Partners Finance Corp., 6.875%, 04/01/2027 |
| | | | 582,902 | | | | | | 0.1 | | |
| 1,730,000 (1) | | | Calfrac Holdings L.P., 8.500%, 06/15/2026 |
| | | | 713,668 | | | | | | 0.1 | | |
| 3,950,000 (1)(2) | | | California Resources Corp., 8.000%, 12/15/2022 |
| | | | 1,708,375 | | | | | | 0.3 | | |
| Voya High Yield Portfolio | as of December 31, 2019 (continued) |
| Principal Amount† |
| |
Value
|
| |
Percentage
of Net Assets |
| |||||||||
| CORPORATE BONDS/NOTES: (continued) | | |||||||||||||||
| | | | Energy (continued) | | ||||||||||||
| 857,000 (1) | | | Chesapeake Energy Corp., 11.500%, 01/01/2025 |
| | | $ | 809,865 | | | | | | 0.1 | | |
| 3,105,000 (2) | | | Crestwood Midstream Partners L.P. / Crestwood Midstream Finance Corp., 5.750%-6.250%, 04/01/2023-04/01/2025 |
| | | | 3,179,616 | | | | | | 0.5 | | |
| 800,000 (1) | | | Endeavor Energy Resources L.P. / EER Finance, Inc., 5.500%, 01/30/2026 |
| | | | 827,858 | | | | | | 0.2 | | |
| 625,000 (1) | | | Endeavor Energy Resources L.P. / EER Finance, Inc., 5.750%, 01/30/2028 |
| | | | 658,188 | | | | | | 0.1 | | |
| 2,160,000 (1) | | | Enviva Partners L.P. / Enviva Partners Finance Corp., 6.500%, 01/15/2026 |
| | | | 2,317,961 | | | | | | 0.4 | | |
| 1,400,000 (1) | | | Hess Midstream Operations L.P., 5.125%, 06/15/2028 |
| | | | 1,419,250 | | | | | | 0.2 | | |
| 2,205,000 (1) | | | Hess Midstream Operations L.P., 5.625%, 02/15/2026 |
| | | | 2,293,200 | | | | | | 0.4 | | |
| 1,800,000 (1) | | | Indigo Natural Resources LLC, 6.875%, 02/15/2026 |
| | | | 1,696,545 | | | | | | 0.3 | | |
| 2,075,000 (1) | | | Magnolia Oil & Gas Operating LLC / Magnolia Oil & Gas Finance Corp., 6.000%, 08/01/2026 |
| | | | 2,132,784 | | | | | | 0.4 | | |
| 1,795,000 (1) | | | Moss Creek Resources Holdings, Inc., 7.500%, 01/15/2026 |
| | | | 1,369,311 | | | | | | 0.2 | | |
| 1,350,000 | | | Murphy Oil Corp., 5.750%, 08/15/2025 |
| | | | 1,414,847 | | | | | | 0.2 | | |
| 770,000 (1) | | | Noble Holding International Ltd., 7.875%, 02/01/2026 |
| | | | 560,443 | | | | | | 0.1 | | |
| 2,800,000 | | | PBF Logistics L.P. / PBF Logistics Finance Corp., 6.875%, 05/15/2023 |
| | | | 2,890,972 | | | | | | 0.5 | | |
| 2,400,000 (1)(2) | | | Tallgrass Energy Partners L.P. / Tallgrass Energy Finance Corp., 5.500%, 01/15/2028 |
| | | | 2,357,574 | | | | | | 0.4 | | |
| 800,000 (1)(2) | | | Targa Resources Partners L.P. / Targa Resources Partners Finance Corp., 6.500%, 07/15/2027 |
| | | | 877,480 | | | | | | 0.1 | | |
| 1,500,000 (1)(2) | | | Targa Resources Partners L.P. / Targa Resources Partners Finance Corp., 6.875%, 01/15/2029 |
| | | | 1,667,775 | | | | | | 0.3 | | |
| 475,000 (1) | | | Targa Resources Partners L.P. / Targa Resources Partners Finance Corp., 5.500%, 03/01/2030 |
| | | | 488,656 | | | | | | 0.1 | | |
| Principal Amount† |
| |
Value
|
| |
Percentage
of Net Assets |
| |||||||||
| CORPORATE BONDS/NOTES: (continued) | | |||||||||||||||
| | | | Energy (continued) | | ||||||||||||
| 2,240,000 (1) | | | Vermilion Energy, Inc., 5.625%, 03/15/2025 |
| | | $ | 2,120,530 | | | | | | 0.4 | | |
| 1,000,000 (1) | | | Viper Energy Partners L.P., 5.375%, 11/01/2027 |
| | | | 1,041,850 | | | | | | 0.2 | | |
| 17,150,000 (3) | | | Other Securities | | | | | 14,715,664 | | | | | | 2.5 | | |
| | | | | | | | | 48,795,214 | | | | | | 8.3 | | |
| | | | Financial: 5.7% | | ||||||||||||
| 550,000 (1) | | | Alliance Data Systems Corp., 4.750%, 12/15/2024 |
| | | | 550,000 | | | | | | 0.1 | | |
| 625,000 (1) | | | Allied Universal Holdco LLC / Allied Universal Finance Corp., 6.625%, 07/15/2026 |
| | | | 672,859 | | | | | | 0.1 | | |
| 1,475,000 (1) | | | Allied Universal Holdco LLC / Allied Universal Finance Corp., 9.750%, 07/15/2027 |
| | | | 1,579,124 | | | | | | 0.3 | | |
| 2,550,000 (1) | | | ESH Hospitality, Inc., 5.250%, 05/01/2025 |
| | | | 2,641,379 | | | | | | 0.5 | | |
| 3,025,000 | | | Icahn Enterprises L.P. / Icahn Enterprises Finance Corp., 6.250%, 05/15/2026 |
| | | | 3,227,294 | | | | | | 0.5 | | |
| 1,545,000 (1) | | | LPL Holdings, Inc., 4.625%, 11/15/2027 |
| | | | 1,579,763 | | | | | | 0.3 | | |
| 2,425,000 | | | MGM Growth Properties Operating Partnership L.P. / MGP Finance Co-Issuer, Inc., 5.625%, 05/01/2024 |
| | | | 2,648,306 | | | | | | 0.5 | | |
| 3,625,000 | | | MPT Operating Partnership L.P. / MPT Finance Corp., 5.000%-5.500%, 05/01/2024-10/15/2027 |
| | | | 3,798,240 | | | | | | 0.6 | | |
| 2,300,000 (2) | | | Navient Corp., 7.250%, 09/25/2023 |
| | | | 2,604,796 | | | | | | 0.4 | | |
| 1,900,000 (1) | | | Quicken Loans, Inc., 5.250%, 01/15/2028 |
| | | | 1,970,913 | | | | | | 0.3 | | |
| 1,525,000 (1)(2) | | | Realogy Group LLC / Realogy Co-Issuer Corp., 5.250%, 12/01/2021 |
| | | | 1,543,681 | | | | | | 0.3 | | |
| 2,350,000 | | | Springleaf Finance Corp., 7.125%, 03/15/2026 |
| | | | 2,721,476 | | | | | | 0.4 | | |
| 2,615,000 (2) | | | Springleaf Finance Corp., 5.375%-6.125%, 05/15/2022-11/15/2029 |
| | | | 2,822,719 | | | | | | 0.5 | | |
| 4,620,000 (3) | | | Other Securities | | | | | 5,142,200 | | | | | | 0.9 | | |
| | | | | | | | | 33,502,750 | | | | | | 5.7 | | |
| | | | Industrial: 11.9% | | ||||||||||||
| 2,125,000 (1) | | | Advanced Disposal Services, Inc., 5.625%, 11/15/2024 |
| | | | 2,216,194 | | | | | | 0.4 | | |
| 2,325,000 | | | AECOM, 5.875%, 10/15/2024 |
| | | | 2,577,902 | | | | | | 0.4 | | |
| 1,425,000 (1) | | | Amsted Industries, Inc., 5.625%, 07/01/2027 |
| | | | 1,514,558 | | | | | | 0.3 | | |
| Voya High Yield Portfolio | as of December 31, 2019 (continued) |
| Principal Amount† |
| |
Value
|
| |
Percentage
of Net Assets |
| |||||||||
| CORPORATE BONDS/NOTES: (continued) | | |||||||||||||||
| | | | Industrial (continued) | | ||||||||||||
| 2,750,000 (1)(4) | | | ARD Finance SA, 6.500% (PIK Rate 7.250%, Cash Rate 6.500%), 06/30/2027 |
| | | $ | 2,848,450 | | | | | | 0.5 | | |
| 1,150,000 (1)(2) | | | Ardagh Packaging Finance PLC / Ardagh Holdings USA, Inc., 5.250%, 08/15/2027 |
| | | | 1,212,526 | | | | | | 0.2 | | |
| 1,850,000 (1) | | | ATS Automation Tooling Systems, Inc., 6.500%, 06/15/2023 |
| | | | 1,910,893 | | | | | | 0.3 | | |
| 1,400,000 (1)(2) | | | Berry Global, Inc., 5.625%, 07/15/2027 |
| | | | 1,505,035 | | | | | | 0.3 | | |
| 2,425,000 (1) | | | BMC East LLC, 5.500%, 10/01/2024 |
| | | | 2,529,069 | | | | | | 0.4 | | |
| 925,000 (1) | | | Bombardier, Inc., 6.000%, 10/15/2022 |
| | | | 927,035 | | | | | | 0.1 | | |
| 2,000,000 (1) | | | Bombardier, Inc., 8.750%, 12/01/2021 |
| | | | 2,195,750 | | | | | | 0.4 | | |
| 1,900,000 (1) | | | Builders FirstSource, Inc., 6.750%, 06/01/2027 |
| | | | 2,088,285 | | | | | | 0.4 | | |
| 1,700,000 (1) | | | Cascades, Inc./Cascades USA, Inc., 5.375%, 01/15/2028 |
| | | | 1,751,000 | | | | | | 0.3 | | |
| 1,260,000 (1) | | | Clean Harbors, Inc., 4.875%, 07/15/2027 |
| | | | 1,328,481 | | | | | | 0.2 | | |
| 585,000 (1) | | | Clean Harbors, Inc., 5.125%, 07/15/2029 |
| | | | 629,137 | | | | | | 0.1 | | |
| 1,600,000 (1) | | | F-Brasile SpA / F-Brasile US LLC, 7.375%, 08/15/2026 |
| | | | 1,696,000 | | | | | | 0.3 | | |
| 2,145,000 (1) | | | FXI Holdings, Inc., 7.875%, 11/01/2024 |
| | | | 2,064,541 | | | | | | 0.4 | | |
| 1,700,000 (1) | | | GFL Environmental, Inc., 8.500%, 05/01/2027 |
| | | | 1,873,145 | | | | | | 0.3 | | |
| 465,000 (1) | | | GFL Environmental, Inc., 7.000%, 06/01/2026 |
| | | | 492,550 | | | | | | 0.1 | | |
| 1,275,000 (1) | | | Granite Holdings US Acquisition Co., 11.000%, 10/01/2027 |
| | | | 1,294,568 | | | | | | 0.2 | | |
| 2,325,000 (1)(2) | | | Itron, Inc., 5.000%, 01/15/2026 |
| | | | 2,415,902 | | | | | | 0.4 | | |
| 2,425,000 (1)(2) | | | James Hardie International Finance DAC, 4.750%, 01/15/2025 |
| | | | 2,523,006 | | | | | | 0.4 | | |
| 1,900,000 (1) | | | Koppers, Inc., 6.000%, 02/15/2025 |
| | | | 1,994,981 | | | | | | 0.3 | | |
| 1,070,000 (1) | | | Masonite International Corp., 5.375%, 02/01/2028 |
| | | | 1,132,167 | | | | | | 0.2 | | |
| 1,050,000 (1) | | | Masonite International Corp., 5.750%, 09/15/2026 |
| | | | 1,118,615 | | | | | | 0.2 | | |
| 2,300,000 (1)(2) | | | Mauser Packaging Solutions Holding Co., 7.250%, 04/15/2025 |
| | | | 2,276,977 | | | | | | 0.4 | | |
| Principal Amount† |
| |
Value
|
| |
Percentage
of Net Assets |
| |||||||||
| CORPORATE BONDS/NOTES: (continued) | | |||||||||||||||
| | | | Industrial (continued) | | ||||||||||||
| 1,850,000 (1) | | | Norbord, Inc., 5.750%, 07/15/2027 |
| | | $ | 1,924,643 | | | | | | 0.3 | | |
| 650,000 (1)(2) | | | Owens-Brockway Glass Container, Inc., 5.875%, 08/15/2023 |
| | | | 695,230 | | | | | | 0.1 | | |
| 1,800,000 (1)(2) | | | Owens-Brockway Glass Container, Inc., 6.375%, 08/15/2025 |
| | | | 1,971,000 | | | | | | 0.4 | | |
| 1,775,000 (1) | | | PGT Escrow Issuer, Inc., 6.750%, 08/01/2026 |
| | | | 1,906,523 | | | | | | 0.3 | | |
| 1,370,000 (1) | | | Reynolds Group Issuer, Inc. / Reynolds Group Issuer LLC / Reynolds Group Issuer Lu, 5.125%, 07/15/2023 |
| | | | 1,405,394 | | | | | | 0.2 | | |
| 487,000 (1) | | | Reynolds Group Issuer, Inc. / Reynolds Group Issuer LLC / Reynolds Group Issuer Lu, 7.000%, 07/15/2024 |
| | | | 504,349 | | | | | | 0.1 | | |
| 1,375,000 (1) | | | Sealed Air Corp., 5.500%, 09/15/2025 |
| | | | 1,516,508 | | | | | | 0.3 | | |
| 2,050,000 (1) | | | SSL Robotics LLC, 9.750%, 12/31/2023 |
| | | | 2,234,500 | | | | | | 0.4 | | |
| 3,275,000 (1) | | | Standard Industries, Inc./NJ, 6.000%, 10/15/2025 |
| | | | 3,450,999 | | | | | | 0.6 | | |
| 1,825,000 (1)(2) | | | Stevens Holding Co., Inc., 6.125%, 10/01/2026 |
| | | | 1,999,009 | | | | | | 0.3 | | |
| 750,000 (1) | | | Summit Materials LLC / Summit Materials Finance Corp., 5.125%, 06/01/2025 |
| | | | 772,811 | | | | | | 0.1 | | |
| 1,475,000 (1) | | | Summit Materials LLC / Summit Materials Finance Corp., 6.500%, 03/15/2027 |
| | | | 1,589,825 | | | | | | 0.3 | | |
| 200,000 (1)(5) | | | syncreon Group BV / syncreon Global Finance US, Inc., 8.625%, 11/01/2021 |
| | | | 22,000 | | | | | | 0.0 | | |
| 1,575,000 (1) | | | TransDigm, Inc., 5.500%, 11/15/2027 |
| | | | 1,595,601 | | | | | | 0.3 | | |
| 3,550,000 (2) | | | TransDigm, Inc., 6.375%-6.500%, 05/15/2025-06/15/2026 |
| | | | 3,729,455 | | | | | | 0.6 | | |
| 506,000 (1)(2) | | | Zekelman Industries, Inc., 9.875%, 06/15/2023 |
| | | | 532,249 | | | | | | 0.1 | | |
| 96,911 | | | Other Securities | | | | | 97,153 | | | | | | 0.0 | | |
| | | | | | | | | 70,064,016 | | | | | | 11.9 | | |
| | | | Technology: 4.0% | | ||||||||||||
| 2,400,000 (1) | | | Ascend Learning LLC, 6.875%, 08/01/2025 |
| | | | 2,526,996 | | | | | | 0.4 | | |
| 2,950,000 (2) | | | CDW LLC / CDW Finance Corp., 5.000%-5.500%, 12/01/2024-09/01/2025 |
| | | | 3,225,401 | | | | | | 0.6 | | |
| Voya High Yield Portfolio | as of December 31, 2019 (continued) |
| Principal Amount† |
| |
Value
|
| |
Percentage
of Net Assets |
| |||||||||
| CORPORATE BONDS/NOTES: (continued) | | |||||||||||||||
| | | | Technology (continued) | | ||||||||||||
| 2,775,000 (1)(2) | | | Change Healthcare Holdings LLC / Change Healthcare Finance, Inc., 5.750%, 03/01/2025 |
| | | $ | 2,858,222 | | | | | | 0.5 | | |
| 430,000 (1) | | | Dell International LLC / EMC Corp., 5.875%, 06/15/2021 |
| | | | 437,258 | | | | | | 0.1 | | |
| 650,000 (1)(2) | | | Dell International LLC / EMC Corp., 7.125%, 06/15/2024 |
| | | | 686,563 | | | | | | 0.1 | | |
| 340,000 (1) | | | MSCI, Inc., 5.250%, 11/15/2024 |
| | | | 350,018 | | | | | | 0.1 | | |
| 865,000 (1) | | | MSCI, Inc., 5.750%, 08/15/2025 |
| | | | 909,323 | | | | | | 0.1 | | |
| 1,350,000 (1) | | | MTS Systems Corp., 5.750%, 08/15/2027 |
| | | | 1,414,594 | | | | | | 0.2 | | |
| 1,780,000 (1) | | | Open Text Corp., 5.625%, 01/15/2023 |
| | | | 1,814,861 | | | | | | 0.3 | | |
| 535,000 (1) | | | Open Text Corp., 5.875%, 06/01/2026 |
| | | | 573,440 | | | | | | 0.1 | | |
| 1,630,000 (1) | | | RP Crown Parent LLC, 7.375%, 10/15/2024 |
| | | | 1,697,914 | | | | | | 0.3 | | |
| 2,525,000 (1) | | | Tempo Acquisition LLC / Tempo Acquisition Finance Corp., 6.750%, 06/01/2025 |
| | | | 2,613,350 | | | | | | 0.5 | | |
| 2,500,000 (1)(2) | | | Veritas US, Inc. / Veritas Bermuda Ltd.., 10.500%, 02/01/2024 |
| | | | 2,319,787 | | | | | | 0.4 | | |
| 1,950,000 | | | Other Securities | | | | | 1,999,559 | | | | | | 0.3 | | |
| | | | | | | | | 23,427,286 | | | | | | 4.0 | | |
| | | | Utilities: 2.3% | | ||||||||||||
| 960,000 (1) | | | Clearway Energy Operating LLC, 4.750%, 03/15/2028 |
| | | | 974,400 | | | | | | 0.2 | | |
| 1,975,000 (1) | | | Drax Finco PLC, 6.625%, 11/01/2025 |
| | | | 2,102,555 | | | | | | 0.4 | | |
| 1,950,000 (1)(2) | | | LBC Tank Terminals Holding Netherlands BV, 6.875%, 05/15/2023 |
| | | | 1,977,622 | | | | | | 0.3 | | |
| 2,790,000 (2) | | | NRG Energy, Inc., 5.750%-6.625%, 01/15/2027-01/15/2028 |
| | | | 3,032,312 | | | | | | 0.5 | | |
| 1,350,000 (1) | | | Vistra Operations Co. LLC, 5.500%, 09/01/2026 |
| | | | 1,434,135 | | | | | | 0.2 | | |
| 1,675,000 (1) | | | Vistra Operations Co. LLC, 5.625%, 02/15/2027 |
| | | | 1,768,130 | | | | | | 0.3 | | |
| 2,300,000 (3) | | | Other Securities | | | | | 2,366,125 | | | | | | 0.4 | | |
| | | | | | | | | 13,655,279 | | | | | | 2.3 | | |
| | | | Total Corporate Bonds/Notes (Cost $543,012,244) |
| | |
|
560,375,521
|
| | | |
|
95.4
|
| |
| BANK LOANS: 1.0% | | |||||||||||||||
| | | | Consumer, Non-cyclical: 0.2% | | ||||||||||||
| 1,475,000 | | | Bellring Brands LLC - TL B 1L, 6.780%, (US0001M + 5.000%), 10/10/2024 |
| | |
|
1,496,203
|
| | | |
|
0.2
|
| |
| Principal Amount† |
| |
Value
|
| |
Percentage
of Net Assets |
| |||||||||
| BANK LOANS: (continued) | | |||||||||||||||
| | | | Containers & Glass Products: 0.2% | | ||||||||||||
| 1,066,773 | | | Reynolds Group Holdings Inc. USD 2017 Term Loan, 4.549%, (US0001M + 2.750%), 02/05/2023 |
| | |
$
|
1,071,607
|
| | | |
|
0.2
|
| |
| | | | | | ||||||||||||
| | | | Electronics/Electrical: 0.3% | | ||||||||||||
| 1,575,000 | | | Rackspace Hosting, Inc. 2017 Incremental 1st Lien Term Loan, 4.902%, (US0003M + 3.000%), 11/03/2023 |
| | |
|
1,543,500
|
| | | |
|
0.3
|
| |
| | | | | | ||||||||||||
| | | | Health Care: 0.3% | | ||||||||||||
| 826,427 | | | Bausch Health Companies, Inc. 2018 Term Loan B, 4.740%, (US0001M + 3.000%), 06/02/2025 |
| | | | 832,497 | | | | | | 0.1 | | |
| 1,300,000 | | | Envision Healthcare Corporation 2018 1st Lien Term Loan, 5.549%, (US0001M + 3.750%), 10/10/2025 |
| | | | 1,113,667 | | | | | | 0.2 | | |
| | | | | | | | | 1,946,164 | | | | | | 0.3 | | |
| | | | Total Bank Loans (Cost $5,912,413) |
| | |
|
6,057,474
|
| | | |
|
1.0
|
| |
| CONVERTIBLE BONDS/NOTES: 0.2% | | |||||||||||||||
| | | | Communications: 0.2% | | ||||||||||||
| 875,000 | | | Other Securities | | | |
|
843,850
|
| | | |
|
0.2
|
| |
| | | | | | ||||||||||||
| | | | Financial: 0.0% | | ||||||||||||
| 499,200 (1)(5) | | | Lehman Brothers Holdings, Inc., 8.160%, 05/30/2009 |
| | |
|
1,647
|
| | | |
|
0.0
|
| |
| | | | Total Convertible Bonds/Notes (Cost $1,310,044) |
| | |
|
845,497
|
| | | |
|
0.2
|
| |
| | ||||||||||||||||
|
Shares
|
| |
Value
|
| |
Percentage
of Net Assets |
| |||||||||
| COMMON STOCK: 0.1% | | |||||||||||||||
| | | | Consumer Discretionary: —% | | ||||||||||||
| 1,476 (1)(6)(7) | | | Perseus Holding Corp. | | | |
|
—
|
| | | |
|
—
|
| |
| | | | | | ||||||||||||
| | | | Consumer Staples: 0.1% | | ||||||||||||
| 24,842 (8)(9) | | | Other Securities | | | |
|
819,786
|
| | | |
|
0.1
|
| |
| | | | | | ||||||||||||
| | | | Energy: 0.0% | | ||||||||||||
| 424,443 (8)(9) | | | Other Securities | | | |
|
5,107
|
| | | |
|
0.0
|
| |
| | | | | | ||||||||||||
| | | | Health Care: 0.0% | | ||||||||||||
| 106 (3)(8) | | | Other Securities | | | |
|
395
|
| | | |
|
0.0
|
| |
| | | | Total Common Stock (Cost $768,541) |
| | |
|
825,288
|
| | | |
|
0.1
|
| |
| | ||||||||||||||||
| Voya High Yield Portfolio | as of December 31, 2019 (continued) |
|
Shares
|
| |
Value
|
| |
Percentage
of Net Assets |
| |||||||||
| PREFERRED STOCK: —% | | |||||||||||||||
| | | | Consumer Discretionary: —% | | ||||||||||||
| 775 (1)(6)(7) | | | Perseus Holding Corp. | | | |
$
|
—
|
| | | |
|
—
|
| |
| | | | Total Preferred Stock (Cost $—) |
| | |
|
—
|
| | | |
|
—
|
| |
| WARRANTS: —% | | |||||||||||||||
| | | | Energy: —% | | ||||||||||||
| 674 (8)(9) | | | Other Securities | | | |
|
—
|
| | | |
|
—
|
| |
| | | | | | ||||||||||||
| | | | Health Care: —% | | ||||||||||||
| 252 (8)(9) | | | Other Securities | | | |
|
—
|
| | | |
|
—
|
| |
| | | | Total Warrants (Cost $325) |
| | |
|
—
|
| | | |
|
—
|
| |
| OTHER(10): —% | | |||||||||||||||
| | | | Communications: —% | | ||||||||||||
| 1,445,000 (6)(11) | | | Millicom International Cellular S.A. (Escrow) |
| | |
|
—
|
| | | |
|
—
|
| |
| | | | | | ||||||||||||
| | | | Energy: —% | | ||||||||||||
| 2,000 (6)(11) | | | Green Field Energy Services, Inc. (Escrow) |
| | |
|
—
|
| | | |
|
—
|
| |
| | | | Total Other (Cost $—) |
| | |
|
—
|
| | | |
|
—
|
| |
| | | | Total Long-Term Investments (Cost $551,003,567) |
| | |
|
568,103,780
|
| | | |
|
96.7
|
| |
| | ||||||||||||||||
| Principal Amount† |
| |
Value
|
| |
Percentage
of Net Assets |
| |||||||||
| SHORT-TERM INVESTMENTS: 21.1% | | |||||||||||||||
| | | | Commercial Paper: 2.5% | | ||||||||||||
| 297,000 | | | American Express Company, 2.100%, 04/06/2020 |
| | | | 295,356 | | | | | | 0.1 | | |
| 400,000 (12) | | | Australia & New Zealand Banking, 1.830%, 03/13/2020 |
| | | | 398,510 | | | | | | 0.1 | | |
| 1,350,000 (12) | | | Banco Santander S.A., 1.950%, 02/05/2020 |
| | | | 1,347,573 | | | | | | 0.2 | | |
| 600,000 (12) | | | Banco Santander S.A., 1.950%, 02/06/2020 |
| | | | 598,891 | | | | | | 0.1 | | |
| 625,000 (12) | | | DBS Bank Ltd., 1.860%, 02/28/2020 |
| | | | 623,148 | | | | | | 0.1 | | |
| 950,000 (12) | | | Flex Co. LLC, 1.910%, 01/31/2020 |
| | | | 948,528 | | | | | | 0.2 | | |
| 1,205,000 | | | General Electric Co., 1.780%, 01/02/2020 |
| | | | 1,204,883 | | | | | | 0.2 | | |
| 1,749,000 | | | General Electric Co., 2.130%, 02/12/2020 |
| | | | 1,744,629 | | | | | | 0.3 | | |
| 300,000 (12) | | | Le Mouvement Des Caisses Desjardins, 1.850%, 02/10/2020 |
| | | | 299,412 | | | | | | 0.1 | | |
| 1,325,000 (12) | | | Nederlandse Waterschapsbank, 1.870%, 02/12/2020 |
| | | | 1,322,268 | | | | | | 0.2 | | |
| 1,353,000 (12) | | | Societe Generale, 1.970%, 01/09/2020 |
| | | | 1,352,391 | | | | | | 0.2 | | |
| Principal Amount† |
| |
Value
|
| |
Percentage
of Net Assets |
| |||||||||
| SHORT-TERM INVESTMENTS: (continued) | | |||||||||||||||
| | | | Commercial Paper (continued) | | ||||||||||||
| 1,175,000 (12) | | | Starbird Funding Corp., 1.910%, 02/20/2020 |
| | | $ | 1,171,920 | | | | | | 0.2 | | |
| 1,878,000 | | | Tyson Foods Inc., 2.000%, 01/21/2020 |
| | | | 1,875,837 | | | | | | 0.3 | | |
| 1,075,000 (12) | | | United Overseas Bnk Group, 1.900%, 01/24/2020 |
| | | | 1,073,842 | | | | | | 0.2 | | |
| | | | Total Commercial Paper (Cost $14,256,953) |
| | |
|
14,257,188
|
| | | |
|
2.5
|
| |
| | | | | | ||||||||||||
| | | | Floating Rate Notes: 4.7% | | ||||||||||||
| 1,275,000 (12) | | | Australia & New Zealand Banking Group Ltd., 1.920%, 04/09/2020 |
| | | | 1,275,369 | | | | | | 0.2 | | |
| 1,275,000 (12) | | | Bank of America Corp., 1.910%, 05/07/2020 |
| | | | 1,275,000 | | | | | | 0.2 | | |
| 900,000 (12) | | | Bank of Nova Scotia, 1.940%, 05/08/2020 |
| | | | 899,933 | | | | | | 0.2 | | |
| 1,275,000 (12) | | | Bedford Row Funding, 1.960%, 05/18/2020 |
| | | | 1,275,215 | | | | | | 0.2 | | |
| 325,000 (12) | | | BNP Paribas, 1.950%, 05/14/2020 |
| | | | 325,024 | | | | | | 0.1 | | |
| 1,300,000 (12) | | | Commonwealth Bank of Australia, 1.920%, 03/16/2020 |
| | | | 1,300,017 | | | | | | 0.2 | | |
| 1,200,000 (12) | | | Coöperatieve Rabobank U.A., 1.980%, 04/20/2020 |
| | | | 1,200,336 | | | | | | 0.2 | | |
| 2,125,000 (12) | | | Crédit Industriel et Commercial, 1.990%, 04/24/2020 |
| | | | 2,125,162 | | | | | | 0.4 | | |
| 1,275,000 (12) | | | Credit Suisse Group AG, 1.890%, 04/17/2020 |
| | | | 1,275,571 | | | | | | 0.2 | | |
| 1,375,000 (12) | | | DNB ASA, 1.930%, 02/14/2020 |
| | | | 1,375,197 | | | | | | 0.2 | | |
| 1,125,000 (12) | | | Mitsubishi UFJ Financial Group, Inc., 1.930%, 01/16/2020 |
| | | | 1,125,133 | | | | | | 0.2 | | |
| 1,175,000 (12) | | | Mitsubishi UFJ Financial Group, Inc., 1.970%, 03/18/2020 |
| | | | 1,175,224 | | | | | | 0.2 | | |
| 450,000 (12) | | | Mitsubishi UFJ Financial Group, Inc., 1.980%, 03/12/2020 |
| | | | 450,115 | | | | | | 0.1 | | |
| 1,250,000 (12) | | | Mizuho Financial Group Inc., 1.960%, 05/05/2020 |
| | | | 1,250,052 | | | | | | 0.2 | | |
| 1,025,000 (12) | | | Mizuho Financial Group Inc., 1.970%, 05/06/2020 |
| | | | 1,025,051 | | | | | | 0.2 | | |
| 450,000 (12) | | | Royal Bank Of Canada, 1.860%, 04/29/2020 |
| | | | 450,028 | | | | | | 0.1 | | |
| 325,000 (12) | | | Skandinaviska Enskilda Banken AB, 1.890%, 03/09/2020 |
| | | | 325,072 | | | | | | 0.1 | | |
| 1,375,000 (12) | | | Skandinaviska Enskilda Banken AB, 1.950%, 05/11/2020 |
| | | | 1,375,044 | | | | | | 0.2 | | |
| 325,000 (12) | | | Sumitomo Mitsui Trust Holdings, Inc., 1.750%, 03/11/2020 |
| | | | 325,095 | | | | | | 0.0 | | |
| Voya High Yield Portfolio | as of December 31, 2019 (continued) |
| Principal Amount† |
| |
Value
|
| |
Percentage
of Net Assets |
| |||||||||
| SHORT-TERM INVESTMENTS: (continued) | | |||||||||||||||
| | | | Floating Rate Notes (continued) | | ||||||||||||
| 1,125,000 (12) | | | Sumitomo Mitsui Trust Holdings, Inc., 1.920%, 02/12/2020 |
| | | $ | 1,125,187 | | | | | | 0.2 | | |
| 675,000 (12) | | | Svenska Handelsbanken AB, 1.930%, 01/23/2020 |
| | | | 675,081 | | | | | | 0.1 | | |
| 1,300,000 (12) | | | The Norinchukin Bank, 2.050%, 04/24/2020 |
| | | | 1,300,467 | | | | | | 0.2 | | |
| 350,000 (12) | | | The Sumitomo Mitsui Financial Group, 1.880%, 02/03/2020 |
| | | | 350,013 | | | | | | 0.1 | | |
| 1,350,000 (12) | | | The Sumitomo Mitsui Financial Group, 1.970%, 05/12/2020 |
| | | | 1,349,772 | | | | | | 0.2 | | |
| 325,000 (12) | | | The Sumitomo Mitsui Financial Group, 2.010%, 05/01/2020 |
| | | | 325,394 | | | | | | 0.0 | | |
| 1,500,000 (12) | | | Toronto-Dominion Bank, 1.850%, 02/13/2020 |
| | | | 1,500,043 | | | | | | 0.3 | | |
| 900,000 (12) | | | Westpac Banking Corp, 1.830%, 02/10/2020 |
| | | | 900,071 | | | | | | 0.2 | | |
| | | | Total Floating Rate Notes (Cost $27,353,666) |
| | |
|
27,353,666
|
| | | |
|
4.7
|
| |
| | | | | | ||||||||||||
| | | | Repurchase Agreements: 11.2% | | ||||||||||||
| 27,639,621 (12) | | | Bank of Nova Scotia, Repurchase Agreement dated 12/31/19, 1.57%, due 01/02/20 (Repurchase Amount $27,641,999, collateralized by various U.S. Government Agency Obligations, 2.500%- 6.500%, Market Value plus accrued interest $28,194,872, due 09/01/24-11/01/49) |
| | | | 27,639,621 | | | | | | 4.7 | | |
| 2,180,404 (12) | | | Citadel Securities LLC, Repurchase Agreement dated 12/31/19, 1.60%, due 01/02/20 (Repurchase Amount $2,180,595, collateralized by various U.S. Government Securities, 0.000%-8.500%, Market Value plus accrued interest $2,224,210, due 01/15/20-11/15/48) |
| | | | 2,180,404 | | | | | | 0.4 | | |
| 27,639,621 (12) | | | RBC Dominion Securities Inc., Repurchase Agreement dated 12/31/19, 1.57%, due 01/02/20 (Repurchase Amount $27,641,999, collateralized by various U.S. Government/ U.S. Government Agency Obligations, 0.000%- 6.500%, Market Value plus accrued interest $28,192,415, due 06/30/21-12/01/49) |
| | | | 27,639,621 | | | | | | 4.7 | | |
| Principal Amount† |
| |
Value
|
| |
Percentage
of Net Assets |
| |||||||||
| SHORT-TERM INVESTMENTS: (continued) | | |||||||||||||||
| | | | Repurchase Agreements (continued) | | ||||||||||||
| 8,447,747 (12) | | | State of Wisconsin Investment Board, Repurchase Agreement dated 12/31/19, 1.75%, due 01/02/20 (Repurchase Amount $8,448,557, collateralized by various U.S. Government Securities, 0.125%-3.875%, Market Value plus accrued interest $8,616,934, due 04/15/21-02/15/47) |
| | | $ | 8,447,747 | | | | | | 1.4 | | |
| | | | Total Repurchase Agreements (Cost $65,907,393) |
| | |
|
65,907,393
|
| | | |
|
11.2
|
| |
| | | | | | ||||||||||||
| | | | Certificates of Deposit: 1.0% | | ||||||||||||
| 400,000 (12) | | | Deutscher Sparkassen-und Giroverband, 1.860%, 02/13/2020 |
| | | | 400,113 | | | | | | 0.1 | | |
| 1,350,000 (12) | | | Dz Bank Ag Deutsche Zentral- Genossenschaftsbank, 1.830%, 02/13/2020 |
| | | | 1,349,891 | | | | | | 0.2 | | |
| 325,000 (12) | | | Dz Bank Ag Deutsche Zentral- Genossenschaftsbank, 1.870%, 03/12/2020 |
| | | | 324,972 | | | | | | 0.1 | | |
| 1,075,000 (12) | | | Landesbank Baden-Wurttemberg, 1.830%, 01/14/2020 |
| | | | 1,075,043 | | | | | | 0.2 | | |
| 1,325,000 (12) | | | Landesbank Baden-Wurttemberg, 1.830%, 01/16/2020 |
| | | | 1,325,046 | | | | | | 0.2 | | |
| 300,000 (12) | | | Landesbank Baden-Wurttemberg, 2.180%, 01/09/2020 |
| | | | 300,038 | | | | | | 0.0 | | |
| 1,275,000 (12) | | | The Norinchukin Bank, 1.900%, 03/05/2020 |
| | | | 1,275,107 | | | | | | 0.2 | | |
| | | | Total Certificates of Deposit (Cost $6,050,210) |
| | |
|
6,050,210
|
| | | |
|
1.0
|
| |
| | ||||||||||||||||
|
Shares
|
| |
Value
|
| |
Percentage
of Net Assets |
| |||||||||
| SHORT-TERM INVESTMENTS: (continued) | | |||||||||||||||
| | | | Mutual Funds(12): 1.7% | | ||||||||||||
| 3,490,000 (12) | | | Fidelity Investments Money Market Government Portfolio - Institutional Class, 1.520% |
| | | | 3,490,000 | | | | | | 0.6 | | |
| 3,754,000 (12)(13) | | | Goldman Sachs Financial Square Government Fund - Institutional Shares, 1.500% |
| | | | 3,754,000 | | | | | | 0.6 | | |
| Voya High Yield Portfolio | as of December 31, 2019 (continued) |
|
Shares
|
| |
Value
|
| |
Percentage
of Net Assets |
| |||||||||
| SHORT-TERM INVESTMENTS: (continued) | | |||||||||||||||
| | | | Mutual Funds(12) (continued) | | ||||||||||||
| 3,008,000 (12)(13) | | | Morgan Stanley Institutional Liquidity Funds - Government Portfolio (Institutional Share Class), 1.510% |
| | | $ | 3,008,000 | | | | | | 0.5 | | |
| | | | Total Mutual Funds (Cost $10,252,000) |
| | |
|
10,252,000
|
| | | |
|
1.7
|
| |
| | | | Total Short-Term Investments (Cost $123,820,222) |
| | |
|
123,820,457
|
| | | |
|
21.1
|
| |
| | | | Total Investments in Securities (Cost $674,823,789) |
| | | $ | 691,924,237 | | | | | | 117.8 | | |
| | | | Liabilities in Excess of Other Assets |
| | | | (104,619,860) | | | | | | (17.8) | | |
| | | | Net Assets | | | | $ | 587,304,377 | | | | | | 100.0 | | |
| | ||||||||||||||||
US0001M 1-month LIBOR
US0003M 3-month LIBOR
| | | |
Quoted Prices
in Active Markets for Identical Investments (Level 1) |
| |
Significant
Other Observable Inputs (Level 2) |
| |
Significant
Unobservable Inputs (Level 3) |
| |
Fair Value
at December 31, 2019 |
| ||||||||||||
| Asset Table | | | | | | | | | | | | | | | | | | | | | | | | | |
| Investments, at fair value | | | | | | | | | | | | | | | | | | | | | | | | | |
| Common Stock | | | | | | | | | | | | | | | | | | | | | | | | | |
|
Consumer Discretionary
|
| | | $ | — | | | | | $ | — | | | | | $ | — | | | | | $ | — | | |
|
Consumer Staples
|
| | | | — | | | | | | — | | | | | | 819,786 | | | | | | 819,786 | | |
|
Energy
|
| | | | 13 | | | | | | — | | | | | | 5,094 | | | | | | 5,107 | | |
|
Health Care
|
| | | | 395 | | | | | | — | | | | | | — | | | | | | 395 | | |
| Total Common Stock | | | | | 408 | | | | | | — | | | | | | 824,880 | | | | | | 825,288 | | |
| Preferred Stock | | | | | — | | | | | | — | | | | | | — | | | | | | — | | |
| Warrants | | | | | — | | | | | | — | | | | | | — | | | | | | — | | |
| Corporate Bonds/Notes | | | | | — | | | | | | 560,375,521 | | | | | | — | | | | | | 560,375,521 | | |
| Bank Loans | | | | | — | | | | | | 6,057,474 | | | | | | — | | | | | | 6,057,474 | | |
| Convertible Bonds/Notes | | | | | — | | | | | | 845,497 | | | | | | — | | | | | | 845,497 | | |
| Other | | | | | — | | | | | | — | | | | | | — | | | | | | — | | |
| Short-Term Investments | | | | | 10,252,000 | | | | | | 113,568,457 | | | | | | — | | | | | | 123,820,457 | | |
| Total Investments, at fair value | | | | $ | 10,252,408 | | | | | $ | 680,846,949 | | | | | $ | 824,880 | | | | | $ | 691,924,237 | | |
| Voya High Yield Portfolio | as of December 31, 2019 (continued) |
|
Security
|
| |
Acquisition Date
|
| |
Acquisition Cost
|
| |
Fair Value
|
| |||||||||
| Green Field Energy Services, Inc. (Escrow) | | | | | 8/25/2019 | | | | | $ | — | | | | | $ | — | | |
| Millicom International Cellular S.A. (Escrow) | | | | | 8/9/2017 | | | | | | — | | | | | | — | | |
| | | | | | | | | | | $ | — | | | | | $ | — | | |
| | Cost for federal income tax purposes was $675,165,321. | | | |||||
| | Net unrealized appreciation consisted of: | | | |||||
| |
Gross Unrealized Appreciation
|
| | | $ | 24,752,186 | | |
| |
Gross Unrealized Depreciation
|
| | | | (7,993,270) | | |
| |
Net Unrealized Appreciation
|
| | | $ | 16,758,916 | | |
| Voya Large Cap Growth Portfolio | as of December 31, 2019 |
|
Shares
|
| |
Value
|
| |
Percentage
of Net Assets |
| |||||||||
| COMMON STOCK: 99.4% | | |||||||||||||||
| | | | Communication Services: 11.4% | | ||||||||||||
| 109,400 (1) | | | Alphabet, Inc. - Class A |
| | | $ | 146,529,266 | | | | | | 2.5 | | |
|
2,801,672 (1)(2)
|
| | Altice USA, Inc. | | | | | 76,597,712 | | | | | | 1.3 | | |
| 2,678,702 | | | Comcast Corp. – Class A |
| | | | 120,461,229 | | | | | | 2.0 | | |
| 1,589,372 (1) | | | Facebook, Inc. - Class A |
| | | | 326,218,603 | | | | | | 5.6 | | |
| | | | | | | | | 669,806,810 | | | | | | 11.4 | | |
| | | | Consumer Discretionary: 13.9% | | ||||||||||||
| 206,842 (1) | | | Amazon.com, Inc. | | | | | 382,210,921 | | | | | | 6.5 | | |
| 327,833 (1) | | | Burlington Stores, Inc. | | | | | 74,755,759 | | | | | | 1.3 | | |
| 194,183 | | | Domino’s Pizza, Inc. | | | | | 57,047,082 | | | | | | 1.0 | | |
| 857,088 | | | Hilton Worldwide Holdings, Inc. |
| | | | 95,059,630 | | | | | | 1.6 | | |
| 318,622 (1) | | | O’Reilly Automotive, Inc. | | | | | 139,639,278 | | | | | | 2.4 | | |
| 538,358 | | | Ross Stores, Inc. | | | | | 62,675,638 | | | | | | 1.1 | | |
| | | | | | | | | 811,388,308 | | | | | | 13.9 | | |
| | | | Consumer Staples: 4.7% | | ||||||||||||
| 565,106 | | | Church & Dwight Co., Inc. |
| | | | 39,749,556 | | | | | | 0.7 | | |
| 374,380 | | | Constellation Brands, Inc. |
| | | | 71,038,605 | | | | | | 1.2 | | |
| 1,090,965 | | | Mondelez International, Inc. |
| | | | 60,090,352 | | | | | | 1.0 | | |
| 1,235,170 | | | Philip Morris International, Inc. |
| | | | 105,100,616 | | | | | | 1.8 | | |
| | | | | | | | | 275,979,129 | | | | | | 4.7 | | |
| | | | Financials: 3.0% | | ||||||||||||
| 663,134 | | | Intercontinental Exchange, Inc. |
| | | | 61,373,052 | | | | | | 1.0 | | |
| 710,001 | | | Progressive Corp. | | | | | 51,396,972 | | | | | | 0.9 | | |
| 233,593 | | | S&P Global, Inc. | | | | | 63,782,569 | | | | | | 1.1 | | |
| | | | | | | | | 176,552,593 | | | | | | 3.0 | | |
| | | | Health Care: 14.9% | | ||||||||||||
| 1,029,066 | | | AbbVie, Inc. | | | | | 91,113,504 | | | | | | 1.6 | | |
| 1,218,215 | | |
Baxter International, Inc.
|
| | | | 101,867,138 | | | | | | 1.7 | | |
| 2,475,252 (1) | | | Boston Scientific Corp. | | | | | 111,930,895 | | | | | | 1.9 | | |
| 354,261 (1) | | | DexCom, Inc. | | | | | 77,491,051 | | | | | | 1.3 | | |
| 688,266 | | | Eli Lilly & Co. | | | | | 90,458,800 | | | | | | 1.6 | | |
| 357,063 | | | Humana, Inc. | | | | | 130,870,731 | | | | | | 2.2 | | |
| 1,896,047 | | | Merck & Co., Inc. | | | | | 172,445,475 | | | | | | 3.0 | | |
| 428,281 (1) | | | Vertex Pharmaceuticals, Inc. |
| | | | 93,772,125 | | | | | | 1.6 | | |
| | | | | | | | | 869,949,719 | | | | | | 14.9 | | |
| | | | Industrials: 9.8% | | ||||||||||||
| 913,958 | | | Ametek, Inc. | | | | | 91,158,171 | | | | | | 1.6 | | |
| 346,781 | | | Boeing Co. | | | | | 112,967,379 | | | | | | 1.9 | | |
| 1,535,846 | | | CSX Corp. | | | | | 111,133,817 | | | | | | 1.9 | | |
| 925,754 | | | Delta Air Lines, Inc. | | | | | 54,138,094 | | | | | | 0.9 | | |
| 621,020 | | | Ingersoll-Rand PLC - Class A |
| | | | 82,545,978 | | | | | | 1.4 | | |
|
Shares
|
| |
Value
|
| |
Percentage
of Net Assets |
| |||||||||
| COMMON STOCK: (continued) | | |||||||||||||||
| | | | Industrials (continued) | | ||||||||||||
| 327,173 | | | L3Harris Technologies, Inc. |
| | | $ | 64,737,721 | | | | | | 1.1 | | |
| 163,083 | | | Roper Technologies, Inc. |
| | | | 57,768,891 | | | | | | 1.0 | | |
| | | | | | | | | 574,450,051 | | | | | | 9.8 | | |
| | | | Information Technology: 37.9% | | ||||||||||||
| 1,769,554 (1) | | | Advanced Micro Devices, Inc. |
| | | | 81,151,746 | | | | | | 1.4 | | |
| 1,175,625 | | | Apple, Inc. | | | | | 345,222,281 | | | | | | 5.9 | | |
| 357,876 | | | Broadcom, Inc. | | | | | 113,095,974 | | | | | | 1.9 | | |
| 464,789 | | | CDW Corp. | | | | | 66,390,461 | | | | | | 1.1 | | |
| 653,095 | | | Fidelity National Information Services, Inc. |
| | | | 90,838,984 | | | | | | 1.6 | | |
| 1,196,928 (1) | | | Fiserv, Inc. | | | | | 138,400,785 | | | | | | 2.4 | | |
| 1,036,765 (1) | | | GoDaddy, Inc. | | | | | 70,417,079 | | | | | | 1.2 | | |
| 653,993 | | | Intuit, Inc. | | | | | 171,300,386 | | | | | | 2.9 | | |
| 404,312 (2) | | | Lam Research Corp. | | | | | 118,220,829 | | | | | | 2.0 | | |
| 2,331,313 | | | Microsoft Corp. | | | | | 367,648,060 | | | | | | 6.3 | | |
| 604,519 | | | Motorola Solutions, Inc. | | | | | 97,412,192 | | | | | | 1.7 | | |
| 744,771 | | | NXP Semiconductor NV - NXPI - US |
| | | | 94,779,557 | | | | | | 1.6 | | |
| 832,697 (1) | | | Salesforce.com, Inc. | | | | | 135,429,840 | | | | | | 2.3 | | |
| 504,641 (1) | | | Synopsys, Inc. | | | | | 70,246,027 | | | | | | 1.2 | | |
| 1,381,651 (1) | | | Visa, Inc. - Class A | | | | | 259,612,223 | | | | | | 4.4 | | |
| | | | | | | | | 2,220,166,424 | | | | | | 37.9 | | |
| | | | Materials: 1.4% | | ||||||||||||
| 501,674 (1)(2) | | | Berry Global Group, Inc. |
| | | | 23,824,498 | | | | | | 0.4 | | |
| 318,834 (1) | | | Crown Holdings, Inc. | | | | | 23,128,218 | | | | | | 0.4 | | |
| 282,767 | | | Other Securities | | | | | 32,500,864 | | | | | | 0.6 | | |
| | | | | | | | | 79,453,580 | | | | | | 1.4 | | |
| | | | Real Estate: 2.4% | | ||||||||||||
| 610,754 | | | American Tower Corp. | | | |
|
140,363,484
|
| | | |
|
2.4
|
| |
| | | | Total Common Stock | | | | ||||||||||
| | | | (Cost $4,626,656,984) | | | |
|
5,818,110,098
|
| | | |
|
99.4
|
| |
| | ||||||||||||||||
| Principal Amount† |
| |
Value
|
| |
Percentage
of Net Assets |
| |||||||||
| SHORT-TERM INVESTMENTS: 1.5% | | |||||||||||||||
| | | | Commercial Paper: 0.1% | | ||||||||||||
| 325,000 (3) | | | Australia & New Zealand Banking, 1.830%, 03/13/2020 |
| | | | 323,789 | | | | | | 0.0 | | |
| 525,000 (3) | | | Banco Santander S.A., 1.950%, 02/05/2020 |
| | | | 524,056 | | | | | | 0.0 | | |
| 450,000 (3) | | | Banco Santander S.A., 2.110%, 01/09/2020 |
| | | | 449,822 | | | | | | 0.0 | | |
| Voya Large Cap Growth Portfolio | as of December 31, 2019 (continued) |
| Principal Amount† |
| |
Value
|
| |
Percentage
of Net Assets |
| |||||||||
| SHORT-TERM INVESTMENTS: (continued) | | |||||||||||||||
| | | | Commercial Paper (continued) | | ||||||||||||
| 650,000 (3) | | | DBS Bank Ltd., 1.820%, 02/18/2020 |
| | | $ | 648,418 | | | | | | 0.0 | | |
| 475,000 (3) | | | Flex Co. LLC, 1.910%, 01/31/2020 |
| | | | 474,264 | | | | | | 0.0 | | |
| 350,000 (3) | | | Le Mouvement Des Caisses Desjardins, 1.850%, 02/10/2020 |
| | | | 349,314 | | | | | | 0.0 | | |
| 325,000 (3) | | | Le Mouvement Des Caisses Desjardins, 1.860%, 02/14/2020 |
| | | | 324,297 | | | | | | 0.0 | | |
| 675,000 (3) | | | Nederlandse Waterschapsbank, 1.870%, 02/12/2020 |
| | | | 673,608 | | | | | | 0.0 | | |
| 550,000 (3) | | | United Overseas Bnk Group, 1.900%, 01/24/2020 |
| | | | 549,408 | | | | | | 0.1 | | |
| 500,000 (3) | | | United Overseas Bnk Group, 2.080%, 01/16/2020 |
| | | | 499,650 | | | | | | 0.0 | | |
| | | | Total Commercial Paper (Cost $4,816,626) |
| | |
|
4,816,626
|
| | | |
|
0.1
|
| |
| | | | | | ||||||||||||
| | | | Floating Rate Notes: 0.2% | | ||||||||||||
| 625,000 (3) | | | Australia & New Zealand Banking Group Ltd., 1.920%, 04/09/2020 |
| | | | 625,181 | | | | | | 0.0 | | |
| 575,000 (3) | | | Commonwealth Bank of Australia, 1.920%, 01/24/2020 |
| | | | 575,073 | | | | | | 0.0 | | |
| 600,000 (3) | | | Coöperatieve Rabobank U.A., 1.980%, 04/20/2020 |
| | | | 600,168 | | | | | | 0.0 | | |
| 650,000 (3) | | | Crédit Industriel et Commercial, 1.950%, 04/09/2020 |
| | | | 650,109 | | | | | | 0.0 | | |
| 925,000 (3) | | | Credit Suisse Group AG, 1.720%, 01/16/2020 |
| | | | 925,069 | | | | | | 0.1 | | |
| 475,000 (3) | | | DNB ASA, 1.930%, 02/14/2020 |
| | | | 475,068 | | | | | | 0.0 | | |
| 875,000 (3) | | | Mitsubishi UFJ Financial Group, Inc., 1.930%, 01/16/2020 |
| | | | 875,103 | | | | | | 0.0 | | |
| 625,000 (3) | | | Mizuho Financial Group Inc., 1.960%, 05/05/2020 |
| | | | 625,026 | | | | | | 0.0 | | |
| 800,000 (3) | | | Natixis S.A., 2.030%, 01/24/2020 |
| | | | 800,048 | | | | | | 0.0 | | |
| Principal Amount† |
| |
Value
|
| |
Percentage
of Net Assets |
| |||||||||
| SHORT-TERM INVESTMENTS: (continued) | | |||||||||||||||
| | | | Floating Rate Notes (continued) | | ||||||||||||
| 750,000 (3) | | | Skandinaviska Enskilda Banken AB, 1.950%, 05/11/2020 |
| | | $ | 750,024 | | | | | | 0.0 | | |
| 675,000 (3) | | | Sumitomo Mitsui Trust Holdings, Inc., 2.040%, 04/24/2020 |
| | | | 674,996 | | | | | | 0.0 | | |
| 625,000 (3) | | | The Sumitomo Mitsui Financial Group, 1.840%, 01/10/2020 |
| | | | 625,045 | | | | | | 0.0 | | |
| 550,000 (3) | | | Toronto-Dominion Bank, 1.850%, 02/13/2020 |
| | | | 550,016 | | | | | | 0.0 | | |
| 925,000 (3) | | | Toyota Motor Corp., 1.980%, 03/13/2020 |
| | | | 925,328 | | | | | | 0.1 | | |
| | | | Total Floating Rate Notes (Cost $9,676,254) |
| | |
|
9,676,254
|
| | | |
|
0.2
|
| |
| | | | | | ||||||||||||
| | | | Repurchase Agreements: 0.3% | | ||||||||||||
| 7,892,807 (3) | | | Cantor Fitzgerald Securities, Repurchase Agreement dated 12/31/19, 1.58%, due 01/02/20 (Repurchase Amount $7,893,490, collateralized by various U.S. Government/U.S. Government Agency Obligations, 0.000%-8.500%, Market Value plus accrued interest $8,050,663, due 01/25/20-10/15/60) |
| | | | 7,892,807 | | | | | | 0.1 | | |
| 7,892,807 (3) | | | Millennium Fixed Income Ltd., Repurchase Agreement dated 12/31/19, 1.75%, due 01/02/20 (Repurchase Amount $7,893,564, collateralized by various U.S. Government Securities, 0.125%-2.250%, Market Value plus accrued interest $8,050,664, due 04/15/20-03/31/21) |
| | | | 7,892,807 | | | | | | 0.1 | | |
| Voya Large Cap Growth Portfolio | as of December 31, 2019 (continued) |
| Principal Amount† |
| |
Value
|
| |
Percentage
of Net Assets |
| |||||||||
| SHORT-TERM INVESTMENTS: (continued) | | |||||||||||||||
| | | | Repurchase Agreements (continued) | | ||||||||||||
| 693,994 (3) | | | RBC Dominion Securities Inc., Repurchase Agreement dated 12/31/19, 1.57%, due 01/02/20 (Repurchase Amount $694,054, collateralized by various U.S. Government/U.S. Government Agency Obligations, 0.000%-6.500%, Market Value plus accrued interest $707,874, due 06/30/21-12/01/49) |
| | | $ | 693,994 | | | | | | 0.0 | | |
| 2,423,022 (3) | | | State of Wisconsin Investment Board, Repurchase Agreement dated 12/31/19, 1.75%, due 01/02/20 (Repurchase Amount $2,423,254, collateralized by various U.S. Government Securities, 0.125%-3.875%, Market Value plus accrued interest $2,471,549, due 04/15/21-02/15/47) |
| | | | 2,423,022 | | | | | | 0.1 | | |
| | | | Total Repurchase Agreements (Cost $18,902,630) |
| | |
|
18,902,630
|
| | | |
|
0.3
|
| |
| | | | | | ||||||||||||
| | | | Certificates of Deposit: 0.0% | | ||||||||||||
| 500,000 (3) | | | Deutscher Sparkassen-und Giroverband, 1.860%, 02/13/2020 (Cost $500,141) |
| | |
|
500,141
|
| | | |
|
0.0
|
| |
|
Shares
|
| |
Value
|
| |
Percentage
of Net Assets |
| |||||||||
| SHORT-TERM INVESTMENTS: (continued) | | |||||||||||||||
| | | | Mutual Funds: 0.9% | | ||||||||||||
| 53,637,000 (4) | | | Goldman Sachs Financial Square Government Fund - Institutional Shares, 1.500% (Cost $53,637,000) |
| | |
$
|
53,637,000
|
| | | |
|
0.9
|
| |
| | | | Total Short-Term Investments (Cost $87,532,651) |
| | |
|
87,532,651
|
| | | |
|
1.5
|
| |
| | | | Total Investments in Securities (Cost $4,714,189,635) |
| | | $ | 5,905,642,749 | | | | | | 100.9 | | |
| | | | Liabilities in Excess of Other Assets |
| | | | (53,559,001) | | | | | | (0.9) | | |
| | | | Net Assets | | | | $ | 5,852,083,748 | | | | | | 100.0 | | |
| Voya Large Cap Growth Portfolio | as of December 31, 2019 (continued) |
| | | |
Quoted Prices
in Active Markets for Identical Investments (Level 1) |
| |
Significant
Other Observable Inputs (Level 2) |
| |
Significant
Unobservable Inputs (Level 3) |
| |
Fair Value
at December 31, 2019 |
| ||||||||||||
| Asset Table | | | | | | | | | | | | | | | | | | | | | | | | | |
| Investments, at fair value | | | | | | | | | | | | | | | | | | | | | | | | | |
| Common Stock* | | | | $ | 5,818,110,098 | | | | | $ | — | | | | | $ | — | | | | | $ | 5,818,110,098 | | |
| Short-Term Investments | | | | | 53,637,000 | | | | | | 33,895,651 | | | | | | — | | | | | | 87,532,651 | | |
| Total Investments, at fair value | | | | $ | 5,871,747,098 | | | | | $ | 33,895,651 | | | | | $ | — | | | | | $ | 5,905,642,749 | | |
| | Cost for federal income tax purposes was $4,722,252,160. | | | | | | | |
| | Net unrealized appreciation consisted of: | | | | | | | |
| |
Gross Unrealized Appreciation
|
| | | $ | 1,216,409,294 | | |
| |
Gross Unrealized Depreciation
|
| | | | (33,018,705) | | |
| |
Net Unrealized Appreciation
|
| | | $ | 1,183,390,589 | | |
| Voya Large Cap Value Portfolio | as of December 31, 2019 |
|
Shares
|
| |
Value
|
| |
Percentage
of Net Assets |
| |||||||||
| COMMON STOCK: 99.5% | | |||||||||||||||
| | | | Communication Services: 8.2% | | ||||||||||||
| 1,048,120 | | | AT&T, Inc. | | | | $ | 40,960,530 | | | | | | 3.8 | | |
| 380,167 | | | Comcast Corp. – Class A | | | | | 17,096,110 | | | | | | 1.6 | | |
| 215,342 | | | Walt Disney Co. | | | | | 31,144,913 | | | | | | 2.8 | | |
| | | | | | | | | 89,201,553 | | | | | | 8.2 | | |
| | | | Consumer Discretionary: 5.6% | | ||||||||||||
| 141,401 | | | Hasbro, Inc. | | | | | 14,933,360 | | | | | | 1.4 | | |
| 438,681 | | |
MGM Resorts International
|
| | | | 14,594,917 | | | | | | 1.3 | | |
| 129,151 | | | Ralph Lauren Corp. | | | | | 15,139,080 | | | | | | 1.4 | | |
| 263,437 | | | TJX Cos., Inc. | | | | | 16,085,463 | | | | | | 1.5 | | |
| | | | | | | | | 60,752,820 | | | | | | 5.6 | | |
| | | | Consumer Staples: 8.9% | | ||||||||||||
| 65,776 | | | Constellation Brands, Inc. | | | | | 12,480,996 | | | | | | 1.1 | | |
| 228,522 | | | Kellogg Co. | | | | | 15,804,581 | | | | | | 1.5 | | |
| 379,415 (1) | | | Keurig Dr Pepper, Inc. | | | | | 10,984,064 | | | | | | 1.0 | | |
| 310,063 | | | Philip Morris International, Inc. |
| | | | 26,383,261 | | | | | | 2.4 | | |
| 206,732 | | | Procter & Gamble Co. | | | | | 25,820,827 | | | | | | 2.4 | | |
| 93,422 | | | Other Securities | | | | | 5,170,908 | | | | | | 0.5 | | |
| | | | | | | | | 96,644,637 | | | | | | 8.9 | | |
| | | | Energy: 8.5% | | ||||||||||||
| 365,976 | | | BP PLC ADR | | | | | 13,811,934 | | | | | | 1.3 | | |
| 192,541 | | | Chevron Corp. | | | | | 23,203,116 | | | | | | 2.2 | | |
| 269,839 | | | ConocoPhillips | | | | | 17,547,630 | | | | | | 1.6 | | |
| 157,595 | | | EOG Resources, Inc. | | | | | 13,200,157 | | | | | | 1.2 | | |
| 414,392 | | | Other Securities | | | | | 24,279,989 | | | | | | 2.2 | | |
| | | | | | | | | 92,042,826 | | | | | | 8.5 | | |
| | | | Financials: 23.6% | | ||||||||||||
| 360,721 | | | American International Group, Inc. |
| | | | 18,515,809 | | | | | | 1.7 | | |
| 243,684 (1) | | | Apollo Global Management, Inc. |
| | | | 11,626,164 | | | | | | 1.1 | | |
| 1,147,381 | | | Bank of America Corp. | | | | | 40,410,759 | | | | | | 3.7 | | |
| 133,436 | | |
Discover Financial Services
|
| | | | 11,318,041 | | | | | | 1.1 | | |
| 109,624 | | |
Goldman Sachs Group, Inc.
|
| | | | 25,205,846 | | | | | | 2.3 | | |
| 300,839 | | | Hartford Financial Services Group, Inc. |
| | | | 18,281,986 | | | | | | 1.7 | | |
| 241,616 | | | Intercontinental Exchange, Inc. |
| | | | 22,361,561 | | | | | | 2.1 | | |
| 295,763 | | | JPMorgan Chase & Co. | | | | | 41,229,362 | | | | | | 3.8 | | |
| 262,384 | | | Morgan Stanley | | | | | 13,413,070 | | | | | | 1.2 | | |
| 106,062 | | | Northern Trust Corp. | | | | | 11,268,027 | | | | | | 1.0 | | |
| 255,828 | | | Truist Financial Corp. | | | | | 14,408,233 | | | | | | 1.3 | | |
| 475,899 | | | US Bancorp | | | | | 28,216,052 | | | | | | 2.6 | | |
| | | | | | | | | 256,254,910 | | | | | | 23.6 | | |
| | | | Health Care: 13.7% | | ||||||||||||
| 74,043 | | | Becton Dickinson & Co. | | | | | 20,137,475 | | | | | | 1.9 | | |
| 219,062 | | | Bristol-Myers Squibb Co. | | | | | 14,061,590 | | | | | | 1.3 | | |
| 165,545 | | | Gilead Sciences, Inc. | | | | | 10,757,114 | | | | | | 1.0 | | |
|
Shares
|
| |
Value
|
| |
Percentage
of Net Assets |
| |||||||||
| COMMON STOCK: (continued) | | |||||||||||||||
| | | | Health Care (continued) | | ||||||||||||
| 273,063 | | | Johnson & Johnson | | | | $ | 39,831,700 | | | | | | 3.7 | | |
| 203,245 | | | Medtronic PLC | | | | | 23,058,145 | | | | | | 2.1 | | |
| 164,919 | | | Novartis AG ADR | | | | | 15,616,180 | | | | | | 1.4 | | |
| 118,201 | | | Zimmer Biomet Holdings, Inc. |
| | | | 17,692,325 | | | | | | 1.6 | | |
| 135,333 (2) | | | Other Securities | | | | | 7,655,788 | | | | | | 0.7 | | |
| | | | | | | | | 148,810,317 | | | | | | 13.7 | | |
| | | | Industrials: 9.5% | | ||||||||||||
| 87,359 | | | Cummins, Inc. | | | | | 15,633,766 | | | | | | 1.4 | | |
| 36,928 | | | Lockheed Martin Corp. | | | | | 14,379,025 | | | | | | 1.3 | | |
| 98,129 | | | Norfolk Southern Corp. | | | | | 19,049,783 | | | | | | 1.7 | | |
| 60,873 | | | Old Dominion Freight Line | | | | | 11,552,478 | | | | | | 1.1 | | |
| 57,245 | | | Roper Technologies, Inc. | | | | | 20,277,896 | | | | | | 1.9 | | |
| 223,754 | | | Timken Co. | | | | | 12,599,588 | | | | | | 1.2 | | |
| 98,114 | | | Other Securities | | | | | 9,286,490 | | | | | | 0.9 | | |
| | | | | | | | | 102,779,026 | | | | | | 9.5 | | |
| | | | Information Technology: 6.3% | | ||||||||||||
| 33,379 (3) | | | Adobe, Inc. | | | | | 11,008,728 | | | | | | 1.0 | | |
| 134,039 | | | Analog Devices, Inc. | | | | | 15,929,195 | | | | | | 1.5 | | |
| 217,979 (3) | | | Micron Technology, Inc. | | | | | 11,722,911 | | | | | | 1.1 | | |
| 85,122 | | | Motorola Solutions, Inc. | | | | | 13,716,559 | | | | | | 1.3 | | |
| 118,527 | | | Other Securities | | | | | 15,660,245 | | | | | | 1.4 | | |
| | | | | | | | | 68,037,638 | | | | | | 6.3 | | |
| | | | Materials: 4.0% | | ||||||||||||
| 80,442 | | | Air Products & Chemicals, Inc. |
| | | | 18,903,065 | | | | | | 1.7 | | |
| 101,806 | | | Celanese Corp. - Series A | | | | | 12,534,355 | | | | | | 1.1 | | |
| 229,532 (4) | | | Other Securities | | | | | 12,559,630 | | | | | | 1.2 | | |
| | | | | | | | | 43,997,050 | | | | | | 4.0 | | |
| | | | Real Estate: 5.0% | | ||||||||||||
| 86,594 | | | Crown Castle International Corp. |
| | | | 12,309,337 | | | | | | 1.1 | | |
| 291,622 | | |
Highwoods Properties, Inc.
|
| | | | 14,263,232 | | | | | | 1.3 | | |
| 95,252 | | | Mid-America Apartment Communities, Inc. |
| | | | 12,559,929 | | | | | | 1.2 | | |
| 549,961 (4) | | | Other Securities | | | | | 15,644,762 | | | | | | 1.4 | | |
| | | | | | | | | 54,777,260 | | | | | | 5.0 | | |
| | | | Utilities: 6.2% | | ||||||||||||
| 131,584 | | | American Electric Power Co., Inc. |
| | | | 12,436,004 | | | | | | 1.2 | | |
| 103,147 | | | Entergy Corp. | | | | | 12,357,011 | | | | | | 1.1 | | |
| 301,851 | | | Exelon Corp. | | | | | 13,761,387 | | | | | | 1.3 | | |
| 77,116 | | | NextEra Energy, Inc. | | | | | 18,674,410 | | | | | | 1.7 | | |
| 595,269 (2)(5) | | | Other Securities | | | | | 10,052,955 | | | | | | 0.9 | | |
| | | | | | | | | 67,281,767 | | | | | | 6.2 | | |
| | | | Total Common Stock (Cost $960,843,177) |
| | |
|
1,080,579,804
|
| | | |
|
99.5
|
| |
| | ||||||||||||||||
| Voya Large Cap Value Portfolio | as of December 31, 2019 (continued) |
|
Shares
|
| |
Value
|
| |
Percentage
of Net Assets |
| |||||||||
| OTHER(6): —% | | |||||||||||||||
| | | | Communications: —% | | ||||||||||||
| 32,517 (7)(8) | | | Tribune Co. (Escrow) | | | |
$
|
—
|
| | | |
|
—
|
| |
| | | | Energy: —% | | ||||||||||||
| 1,685,000 (7)(8) | | | Samson Investment Co. (Escrow) |
| | |
|
—
|
| | | |
|
—
|
| |
| | | | Total Other (Cost $30,842) |
| | |
|
—
|
| | | |
|
—
|
| |
| | ||||||||||||||||
| Principal Amount† |
| |
Value
|
| |
Percentage
of Net Assets |
| |||||||||
| CORPORATE BONDS/NOTES: —% | | |||||||||||||||
| | | | Financial: —% | | ||||||||||||
| 1,216,000 (5)(9) | | | Other Securities | | | |
|
—
|
| | | |
|
—
|
| |
| | | | Total Corporate Bonds/Notes (Cost $787,908) |
| | |
|
—
|
| | | |
|
—
|
| |
| | | | Total Long-Term Investments (Cost $961,661,927) |
| | |
|
1,080,579,804
|
| | | |
|
99.5
|
| |
| | | | | | ||||||||||||
| SHORT-TERM INVESTMENTS: 3.3% | | |||||||||||||||
| | | | Commercial Paper: 0.2% | | ||||||||||||
| 300,000 (10) | | | DBS Bank Ltd., 1.710%, 01/07/2020 |
| | | | 299,905 | | | | | | 0.1 | | |
| 300,000 (10) | | | DBS Bank Ltd., 1.820%, 02/18/2020 |
| | | | 299,270 | | | | | | 0.0 | | |
| 275,000 (10) | | | Le Mouvement Des Caisses Desjardins, 1.860%, 02/14/2020 |
| | | | 274,405 | | | | | | 0.0 | | |
| 275,000 (10) | | | LMA Americas LLC, 1.800%, 01/27/2020 |
| | | | 274,597 | | | | | | 0.0 | | |
| 325,000 (10) | | | Matchpoint Finance PLC, 1.850%, 02/03/2020 |
| | | | 324,449 | | | | | | 0.1 | | |
| 200,000 (10) | | | Mitsubishi UFJ Trust and Banking Corp., 1.910%, 02/04/2020 |
| | | | 199,631 | | | | | | 0.0 | | |
| | | | Total Commercial Paper (Cost $1,672,257) |
| | |
|
1,672,257
|
| | | |
|
0.2
|
| |
| | | | | | ||||||||||||
| | | | Floating Rate Notes: 0.7% | | ||||||||||||
| 300,000 (10) | | | Australia & New Zealand Banking Group Ltd., 1.920%, 04/09/2020 |
| | | | 300,087 | | | | | | 0.1 | | |
| 300,000 (10) | | | Australia & New Zealand Banking Group Ltd., 1.940%, 05/20/2020 |
| | | | 299,987 | | | | | | 0.0 | | |
| 300,000 (10) | | | Bank of America Corp., 1.910%, 05/07/2020 |
| | | | 300,000 | | | | | | 0.0 | | |
| 900,000 (10) | | | Bank of Nova Scotia, 1.940%, 05/08/2020 |
| | | | 899,933 | | | | | | 0.1 | | |
| Principal Amount† |
| |
Value
|
| |
Percentage
of Net Assets |
| |||||||||
| SHORT-TERM INVESTMENTS: (continued) | | |||||||||||||||
| | | | Floating Rate Notes (continued) | | ||||||||||||
| 325,000 (10) | | | Commonwealth Bank of Australia, 1.940%, 06/10/2020 |
| | | $ | 324,999 | | | | | | 0.0 | | |
| 250,000 (10) | | | Crédit Industriel et Commercial, 1.950%, 04/09/2020 |
| | | | 250,042 | | | | | | 0.0 | | |
| 300,000 (10) | | | Credit Suisse Group AG, 1.720%, 01/16/2020 |
| | | | 300,022 | | | | | | 0.0 | | |
| 325,000 (10) | | | Credit Suisse Group AG, 1.750%, 01/30/2020 |
| | | | 325,035 | | | | | | 0.1 | | |
| 300,000 (10) | | | HSBC Holdings PLC, 1.890%, 02/05/2020 |
| | | | 300,050 | | | | | | 0.0 | | |
| 325,000 (10) | | | Lloyds Bank PLC, 1.900%, 02/07/2020 |
| | | | 325,054 | | | | | | 0.1 | | |
| 300,000 (10) | | | Lloyds Bank PLC, 1.960%, 01/24/2020 |
| | | | 300,044 | | | | | | 0.0 | | |
| 300,000 (10) | | | Mitsubishi UFJ Financial Group, Inc., 1.960%, 01/23/2020 |
| | | | 300,044 | | | | | | 0.0 | | |
| 250,000 (10) | | | Mizuho Financial Group Inc., 1.850%, 01/06/2020 |
| | | | 250,013 | | | | | | 0.0 | | |
| 300,000 (10) | | | Mizuho Financial Group Inc., 1.890%, 02/05/2020 |
| | | | 300,050 | | | | | | 0.0 | | |
| 325,000 (10) | | | Mizuho Financial Group Inc., 1.980%, 02/27/2020 |
| | | | 325,059 | | | | | | 0.1 | | |
| 250,000 (10) | | | Natixis S.A., 2.030%, 01/24/2020 |
| | | | 250,015 | | | | | | 0.0 | | |
| 600,000 (10) | | | Skandinaviska Enskilda Banken AB, 1.950%, 05/11/2020 |
| | | | 600,020 | | | | | | 0.1 | | |
| 300,000 (10) | | | Starbird Funding Corp., 2.070%, 04/24/2020 |
| | | | 300,120 | | | | | | 0.0 | | |
| 250,000 (10) | | | Sumitomo Mitsui Trust Holdings, Inc., 1.980%, 05/07/2020 |
| | | | 249,997 | | | | | | 0.0 | | |
| 300,000 (10) | | | Svenska Handelsbanken AB, 1.930%, 01/23/2020 |
| | | | 300,036 | | | | | | 0.0 | | |
| 250,000 (10) | | | The Sumitomo Mitsui Financial Group, 1.840%, 01/10/2020 |
| | | | 250,018 | | | | | | 0.0 | | |
| 300,000 (10) | | | The Sumitomo Mitsui Financial Group, 1.880%, 02/03/2020 |
| | | | 300,011 | | | | | | 0.1 | | |
| 275,000 (10) | | | The Sumitomo Mitsui Financial Group, 1.960%, 01/22/2020 |
| | | | 275,019 | | | | | | 0.0 | | |
| 325,000 (10) | | | Toronto-Dominion Bank, 1.850%, 02/13/2020 |
| | | | 325,009 | | | | | | 0.0 | | |
| | | | Total Floating Rate Notes (Cost $7,950,664) |
| | |
|
7,950,664
|
| | | |
|
0.7
|
| |
| | ||||||||||||||||
| Voya Large Cap Value Portfolio | as of December 31, 2019 (continued) |
| Principal Amount† |
| |
Value
|
| |
Percentage
of Net Assets |
| |||||||||
| SHORT-TERM INVESTMENTS: (continued) | | |||||||||||||||
| | | | Repurchase Agreements: 1.9% | | ||||||||||||
|
7,263,147 (10)
|
| | Cantor Fitzgerald Securities, Repurchase Agreement dated 12/31/19, 1.58%, due 01/02/20 (Repurchase Amount $7,263,776, collateralized by various U.S. Government/U.S. Government Agency Obligations, 0.000%-8.500%, Market Value plus accrued interest $7,408,410, due 01/25/20-10/15/60) |
| | | $ | 7,263,147 | | | | | | 0.7 | | |
|
7,263,147 (10)
|
| | Millennium Fixed Income Ltd., Repurchase Agreement dated 12/31/19, 1.75%, due 01/02/20 (Repurchase Amount $7,263,843, collateralized by various U.S. Government Securities, 0.125%-2.250%, Market Value plus accrued interest $7,408,411, due 04/15/20-03/31/21) |
| | | | 7,263,147 | | | | | | 0.7 | | |
|
2,951,909 (10)
|
| | RBC Dominion Securities Inc., Repurchase Agreement dated 12/31/19, 1.57%, due 01/02/20 (Repurchase Amount $2,952,163, collateralized by various U.S. Government/U.S. Government Agency Obligations, 0.000%-6.500%, Market Value plus accrued interest $3,010,947, due 06/30/21-12/01/49) |
| | | | 2,951,909 | | | | | | 0.3 | | |
|
2,576,916 (10)
|
| | State of Wisconsin Investment Board, Repurchase Agreement dated 12/31/19, 1.75%, due 01/02/20 (Repurchase Amount $2,577,163, collateralized by various U.S. Government Securities, 0.125%-3.875%, Market Value plus accrued interest $2,628,525, due 04/15/21-02/15/47) |
| | | | 2,576,916 | | | | | | 0.2 | | |
| | | | Total Repurchase Agreements (Cost $20,055,119) |
| | |
|
20,055,119
|
| | | |
|
1.9
|
| |
| | ||||||||||||||||
| Principal Amount† |
| |
Value
|
| |
Percentage
of Net Assets |
| |||||||||
| SHORT-TERM INVESTMENTS: (continued) | | |||||||||||||||
| | | | Certificates of Deposit: 0.1% | | ||||||||||||
| 990,000 (10) | | | Dz Bank Ag Deutsche Zentral- Genossenschaftsbank, 1.870%, 03/12/2020 |
| | | $ | 989,914 | | | | | | 0.1 | | |
| 275,000 (10) | | | Landesbank Baden-Wurttemberg, 1.830%, 01/16/2020 |
| | | | 275,010 | | | | | | 0.0 | | |
| 250,000 (10) | | | The Norinchukin Bank, 1.900%, 03/05/2020 |
| | | | 250,021 | | | | | | 0.0 | | |
| | | | Total Certificates of Deposit (Cost $1,514,945) |
| | |
|
1,514,945
|
| | | |
|
0.1
|
| |
| | ||||||||||||||||
|
Shares
|
| |
Value
|
| |
Percentage
of Net Assets |
| |||||||||
| | | | Mutual Funds: 0.4% | | ||||||||||||
|
4,774,000 (11)
|
| | Goldman Sachs Financial Square Government Fund - Institutional Shares, 1.500% (Cost $4,774,000) |
| | |
|
4,774,000
|
| | | |
|
0.4
|
| |
| | | | Total Short-Term Investments (Cost $35,966,985) |
| | |
|
35,966,985
|
| | | |
|
3.3
|
| |
| | | | Total Investments in Securities (Cost $997,628,912) |
| | | $ | 1,116,546,789 | | | | | | 102.8 | | |
| | | | Liabilities in Excess of Other Assets |
| | | | (30,100,266) | | | | | | (2.8) | | |
| | | | Net Assets | | | | $ | 1,086,446,523 | | | | | | 100.0 | | |
| Voya Large Cap Value Portfolio | as of December 31, 2019 (continued) |
| | | |
Quoted Prices
in Active Markets for Identical Investments (Level 1) |
| |
Significant
Other Observable Inputs (Level 2) |
| |
Significant
Unobservable Inputs (Level 3) |
| |
Fair Value
at December 31, 2019 |
| ||||||||||||
| Asset Table | | | | | | | | | | | | | | | | | | | | | | | | | |
| Investments, at fair value | | | | | | | | | | | | | | | | | | | | | | | | | |
| Common Stock | | | | | | | | | | | | | | | | | | | | | | | | | |
|
Communication Services
|
| | | $ | 89,201,553 | | | | | $ | — | | | | | $ | — | | | | | $ | 89,201,553 | | |
|
Consumer Discretionary
|
| | | | 60,752,820 | | | | | | — | | | | | | — | | | | | | 60,752,820 | | |
|
Consumer Staples
|
| | | | 96,644,637 | | | | | | — | | | | | | — | | | | | | 96,644,637 | | |
|
Energy
|
| | | | 92,042,826 | | | | | | — | | | | | | — | | | | | | 92,042,826 | | |
|
Financials
|
| | | | 256,254,910 | | | | | | — | | | | | | — | | | | | | 256,254,910 | | |
|
Health Care
|
| | | | 148,810,317 | | | | | | — | | | | | | — | | | | | | 148,810,317 | | |
|
Industrials
|
| | | | 102,779,026 | | | | | | — | | | | | | — | | | | | | 102,779,026 | | |
|
Information Technology
|
| | | | 68,037,638 | | | | | | — | | | | | | — | | | | | | 68,037,638 | | |
|
Materials
|
| | | | 43,997,050 | | | | | | — | | | | | | — | | | | | | 43,997,050 | | |
|
Real Estate
|
| | | | 54,777,260 | | | | | | — | | | | | | — | | | | | | 54,777,260 | | |
|
Utilities
|
| | | | 67,281,767 | | | | | | — | | | | | | — | | | | | | 67,281,767 | | |
| Total Common Stock | | | | | 1,080,579,804 | | | | | | — | | | | | | — | | | | | | 1,080,579,804 | | |
| Corporate Bonds/Notes | | | | | — | | | | | | — | | | | | | — | | | | | | — | | |
| Other | | | | | — | | | | | | — | | | | | | — | | | | | | — | | |
| Short-Term Investments | | | | | 4,774,000 | | | | | | 31,192,985 | | | | | | — | | | | | | 35,966,985 | | |
| Total Investments, at fair value | | | | $ | 1,085,353,804 | | | | | $ | 31,192,985 | | | | | $ | — | | | | | $ | 1,116,546,789 | | |
|
Security
|
| |
Acquisition Date
|
| |
Acquisition Cost
|
| |
Fair Value
|
| |||||||||
| Samson Investment Co. (Escrow) | | | | | 6/28/2017 | | | | | $ | 30,842 | | | | | $ | — | | |
| Tribune Co. (Escrow) | | | | | 8/16/2015 | | | | | | — | | | | | | — | | |
| | | | | | | | | | | $ | 30,842 | | | | | $ | — | | |
| | Cost for federal income tax purposes was $999,662,570. | | | | | | | |
| | Net unrealized appreciation consisted of: | | | |||||
| |
Gross Unrealized Appreciation
|
| | | $ | 124,487,531 | | |
| |
Gross Unrealized Depreciation
|
| | | | (7,474,774) | | |
| |
Net Unrealized Appreciation
|
| | | $ | 117,012,757 | | |
| Voya Limited Maturity Bond Portfolio | as of December 31, 2019 |
| Principal Amount† |
| |
Value
|
| |
Percentage
of Net Assets |
| |||||||||
| CORPORATE BONDS/NOTES: 43.7% | | |||||||||||||||
| | | | Basic Materials: 0.8% | | ||||||||||||
| 600,000 (1) | | | Anglo American Capital PLC, 4.125%, 04/15/2021 |
| | | $ | 612,062 | | | | | | 0.2 | | |
| 350,000 (1) | | | Georgia-Pacific LLC, 5.400%, 11/01/2020 |
| | | | 359,744 | | | | | | 0.1 | | |
| 1,272,000 | | | Other Securities | | | | | 1,307,108 | | | | | | 0.5 | | |
| | | | | | | | | 2,278,914 | | | | | | 0.8 | | |
| | | | Communications: 3.1% | | ||||||||||||
| 1,560,000 | | | AT&T, Inc., 2.800%, 02/17/2021 |
| | | | 1,574,125 | | | | | | 0.6 | | |
| 896,000 | | | AT&T, Inc., 3.600%-4.050%, 02/17/2023-12/15/2023 |
| | | | 944,608 | | | | | | 0.3 | | |
| 1,053,000 | | | Comcast Corp., 1.625%-3.450%, 10/01/2021-01/15/2022 |
| | | | 1,073,128 | | | | | | 0.4 | | |
| 360,000 (1) | | | Fox Corp., 4.030%, 01/25/2024 |
| | | | 383,790 | | | | | | 0.1 | | |
| 185,000 (1) | | | Sky Ltd., 3.125%, 11/26/2022 |
| | | | 190,157 | | | | | | 0.0 | | |
| 4,798,000 | | | Other Securities | | | | | 4,891,648 | | | | | | 1.7 | | |
| | | | | | | | | 9,057,456 | | | | | | 3.1 | | |
| | | | Consumer, Cyclical: 2.5% | | ||||||||||||
| 400,000 (1) | | | BMW US Capital LLC, 3.400%, 08/13/2021 |
| | | | 409,117 | | | | | | 0.1 | | |
| 540,000 (1) | | | Daimler Finance North America LLC, 2.300%, 01/06/2020 |
| | | | 539,991 | | | | | | 0.2 | | |
| 460,000 (1) | | | Daimler Finance North America LLC, 3.400%, 02/22/2022 |
| | | | 471,294 | | | | | | 0.2 | | |
| 530,000 (1) | | | Nissan Motor Acceptance Corp., 2.150%, 09/28/2020 |
| | | | 529,000 | | | | | | 0.2 | | |
| 330,000 (1) | | | Toyota Industries Corp., 3.110%, 03/12/2022 |
| | | | 336,022 | | | | | | 0.1 | | |
| 4,874,937 | | | Other Securities | | | | | 4,979,454 | | | | | | 1.7 | | |
| | | | | | | | | 7,264,878 | | | | | | 2.5 | | |
| | | | Consumer, Non-cyclical: 6.8% | | ||||||||||||
| 680,000 (1) | | | AbbVie, Inc., 2.150%, 11/19/2021 |
| | | | 681,563 | | | | | | 0.2 | | |
| 340,000 (1) | | | AbbVie, Inc., 2.300%, 11/21/2022 |
| | | | 341,850 | | | | | | 0.1 | | |
| 248,000 | | | AbbVie, Inc., 2.900%-3.375%, 11/14/2021-11/06/2022 |
| | | | 253,567 | | | | | | 0.1 | | |
| 1,030,000 | | | Anthem, Inc., 2.500%, 11/21/2020 |
| | | | 1,034,744 | | | | | | 0.4 | | |
| 990,000 | | | Becton Dickinson and Co., 2.404%, 06/05/2020 |
| | | | 991,128 | | | | | | 0.3 | | |
| Principal Amount† |
| |
Value
|
| |
Percentage
of Net Assets |
| |||||||||
| CORPORATE BONDS/NOTES: (continued) | | |||||||||||||||
| | | | Consumer, Non-cyclical (continued) | | ||||||||||||
| 405,000 (1) | | | Bristol-Myers Squibb Co., 2.250%, 08/15/2021 |
| | | $ | 407,499 | | | | | | 0.2 | | |
| 355,000 (1) | | | Bristol-Myers Squibb Co., 2.600%, 05/16/2022 |
| | | | 360,862 | | | | | | 0.1 | | |
| 1,047,000 | | | CVS Health Corp., 3.350%, 03/09/2021 |
| | | | 1,064,413 | | | | | | 0.4 | | |
| 350,000 | | | CVS Health Corp., 3.700%, 03/09/2023 |
| | | | 364,572 | | | | | | 0.1 | | |
| 900,000 | | | General Mills, Inc., 3.150%, 12/15/2021 |
| | | | 920,178 | | | | | | 0.3 | | |
| 560,000 (1) | | | Imperial Brands Finance PLC, 2.950%, 07/21/2020 |
| | | | 561,632 | | | | | | 0.2 | | |
| 993,000 | | | Keurig Dr Pepper, Inc., 3.551%-4.057%, 05/25/2021-05/25/2023 |
| | | | 1,023,549 | | | | | | 0.4 | | |
| 440,000 (1) | | | Mondelez International Holdings Netherlands BV, 2.125%, 09/19/2022 |
| | | | 440,150 | | | | | | 0.2 | | |
| 150,000 (1) | | | Mylan, Inc., 3.125%, 01/15/2023 |
| | | | 152,220 | | | | | | 0.1 | | |
| 882,000 | | | Shire Acquisitions Investments Ireland DAC, 2.400%, 09/23/2021 |
| | | | 887,012 | | | | | | 0.3 | | |
| 334,000 (1) | | | Takeda Pharmaceutical Co. Ltd., 2.450%, 01/18/2022 |
| | | | 335,896 | | | | | | 0.1 | | |
| 9,479,000 | | | Other Securities | | | | | 9,638,248 | | | | | | 3.3 | | |
| | | | | | | | | 19,459,083 | | | | | | 6.8 | | |
| | | | Energy: 3.4% | | ||||||||||||
| 210,000 (1) | | | BG Energy Capital PLC, 4.000%, 10/15/2021 |
| | | | 216,919 | | | | | | 0.1 | | |
| 1,129,000 | | | BP Capital Markets America, Inc., 3.216%-4.742%, 03/11/2021-11/28/2023 |
| | | | 1,171,503 | | | | | | 0.4 | | |
| 880,000 | | | Energy Transfer Partners L.P. / Regency Energy Finance Corp., 5.875%, 03/01/2022 |
| | | | 933,903 | | | | | | 0.3 | | |
| 1,320,000 | | | Enterprise Products Operating LLC, 2.800%-5.200%, 09/01/2020-04/15/2021 |
| | | | 1,337,762 | | | | | | 0.5 | | |
| 470,000 (1) | | | Schlumberger Finance Canada Ltd., 2.200%, 11/20/2020 |
| | | | 470,778 | | | | | | 0.1 | | |
| 1,186,000 | | | Shell International Finance BV, 1.750%, 09/12/2021 |
| | | | 1,185,178 | | | | | | 0.4 | | |
| Voya Limited Maturity Bond Portfolio | as of December 31, 2019 (continued) |
| Principal Amount† |
| |
Value
|
| |
Percentage
of Net Assets |
| |||||||||
| CORPORATE BONDS/NOTES: (continued) | | |||||||||||||||
| | | | Energy (continued) | | ||||||||||||
| 4,480,000 | | | Other Securities | | | | $ | 4,589,037 | | | | | | 1.6 | | |
| | | | | | | | | 9,905,080 | | | | | | 3.4 | | |
| | | | Financial: 17.5% | | ||||||||||||
| 340,000 (1) | | | ABN AMRO Bank NV, 2.450%, 06/04/2020 |
| | | | 340,628 | | | | | | 0.1 | | |
| 390,000 (1) | | | ABN AMRO Bank NV, 3.400%, 08/27/2021 |
| | | | 398,870 | | | | | | 0.2 | | |
| 1,000,000 | | | American Express Co., 3.375%, 05/17/2021 |
| | | | 1,019,144 | | | | | | 0.4 | | |
| 1,000,000 | | | American International Group, Inc., 3.300%, 03/01/2021 |
| | | | 1,014,599 | | | | | | 0.3 | | |
| 420,000 (1) | | | ANZ New Zealand Int’l Ltd./London, 2.200%, 07/17/2020 |
| | | | 420,642 | | | | | | 0.1 | | |
| 620,000 (1) | | | Athene Global Funding, 2.750%, 04/20/2020 |
| | | | 621,324 | | | | | | 0.2 | | |
| 593,000 (2) | | | Bank of America Corp., 2.369%, 07/21/2021 |
| | | | 594,344 | | | | | | 0.2 | | |
| 916,000 (2) | | | Bank of America Corp., 3.004%, 12/20/2023 |
| | | | 938,526 | | | | | | 0.3 | | |
| 355,000 (1) | | | Banque Federative du Credit Mutuel SA, 2.125%, 11/21/2022 |
| | | | 355,445 | | | | | | 0.1 | | |
| 450,000 (1) | | | Banque Federative du Credit Mutuel SA, 2.200%, 07/20/2020 |
| | | | 450,444 | | | | | | 0.2 | | |
| 250,000 (1) | | | BPCE SA, 2.750%, 01/11/2023 |
| | | | 254,077 | | | | | | 0.1 | | |
| 1,000,000 | | | Citibank NA, 3.400%, 07/23/2021 |
| | | | 1,021,570 | | | | | | 0.4 | | |
| 1,262,000 (2) | | | Citigroup, Inc., 2.312%-2.900%, 12/08/2021-11/04/2022 |
| | | | 1,273,762 | | | | | | 0.4 | | |
| 460,000 (1) | | | Commonwealth Bank of Australia, 2.250%, 03/10/2020 |
| | | | 460,272 | | | | | | 0.2 | | |
| 950,000 | | | Credit Suisse Group Funding Guernsey Ltd., 3.125%, 12/10/2020 |
| | | | 958,622 | | | | | | 0.3 | | |
| 355,000 (1) | | | Danske Bank A/S, 2.000%, 09/08/2021 |
| | | | 353,519 | | | | | | 0.1 | | |
| 425,000 (1) | | | Danske Bank A/S, 2.800%, 03/10/2021 |
| | | | 428,049 | | | | | | 0.1 | | |
| 455,000 (1)(2) | | | Danske Bank A/S, 3.001%, 09/20/2022 |
| | | | 458,624 | | | | | | 0.2 | | |
| 355,000 (1) | | | DNB Bank ASA, 2.150%, 12/02/2022 |
| | | | 356,589 | | | | | | 0.1 | | |
| Principal Amount† |
| |
Value
|
| |
Percentage
of Net Assets |
| |||||||||
| CORPORATE BONDS/NOTES: (continued) | | |||||||||||||||
| | | | Financial (continued) | | ||||||||||||
| 260,000 (1) | | | Federation des Caisses Desjardins du Quebec, 2.250%, 10/30/2020 |
| | | $ | 260,641 | | | | | | 0.1 | | |
| 445,000 (1) | | | HSBC Bank PLC, 4.125%, 08/12/2020 |
| | | | 450,746 | | | | | | 0.2 | | |
| 727,000 | | | HSBC Holdings PLC, 3.400%, 03/08/2021 |
| | | | 738,547 | | | | | | 0.3 | | |
| 134,000 | | | HSBC USA, Inc., 5.000%, 09/27/2020 |
| | | | 136,820 | | | | | | 0.0 | | |
| 1,480,000 (2) | | | JPMorgan Chase Bank NA, 2.604%, 02/01/2021 |
| | | | 1,480,788 | | | | | | 0.5 | | |
| 1,211,000 | | | JPMorgan Chase & Co., 2.550%-4.500%, 03/01/2021-01/25/2023 |
| | | | 1,245,007 | | | | | | 0.4 | | |
| 2,853,000 | | | Kreditanstalt fuer Wiederaufbau, 4.000%, 01/27/2020 |
| | | | 2,856,966 | | | | | | 1.0 | | |
| 465,000 (1) | | | Lloyds Bank PLC, 6.500%, 09/14/2020 |
| | | | 477,838 | | | | | | 0.2 | | |
| 1,040,000 | | | Mitsubishi UFJ Financial Group, Inc., 2.190%-2.623%, 09/13/2021-07/18/2022 |
| | | | 1,045,196 | | | | | | 0.4 | | |
| 320,000 (1) | | | Mizuho Financial Group, Inc., 2.632%, 04/12/2021 |
| | | | 322,701 | | | | | | 0.1 | | |
| 860,000 | | | Morgan Stanley, 2.750%, 05/19/2022 |
| | | | 875,757 | | | | | | 0.3 | | |
| 1,566,000 | | | Morgan Stanley, 5.500%, 07/28/2021 |
| | | | 1,650,016 | | | | | | 0.6 | | |
| 330,000 (1) | | | Nationwide Building Society, 2.350%, 01/21/2020 |
| | | | 330,040 | | | | | | 0.1 | | |
| 380,000 (1) | | | Nationwide Financial Services, Inc., 5.375%, 03/25/2021 |
| | | | 394,731 | | | | | | 0.1 | | |
| 345,000 (1) | | | Nordea Bank ABP, 4.875%, 05/13/2021 |
| | | | 357,735 | | | | | | 0.1 | | |
| 540,000 (1) | | | Protective Life Global Funding, 2.161%, 09/25/2020 |
| | | | 540,854 | | | | | | 0.2 | | |
| 225,000 | | | Royal Bank of Canada, 2.703%, (US0003M + 0.660%), 10/05/2023 |
| | | | 226,836 | | | | | | 0.1 | | |
| 1,305,000 | | | Skandinaviska Enskilda Banken AB, 1.875%-2.300%, 03/11/2020-09/13/2021 |
| | | | 1,303,779 | | | | | | 0.4 | | |
| Voya Limited Maturity Bond Portfolio | as of December 31, 2019 (continued) |
| Principal Amount† |
| |
Value
|
| |
Percentage
of Net Assets |
| |||||||||
| CORPORATE BONDS/NOTES: (continued) | | |||||||||||||||
| | | | Financial (continued) | | ||||||||||||
| 730,000 | | | Sumitomo Mitsui Banking Corp., 2.514%, 01/17/2020 |
| | | $ | 730,135 | | | | | | 0.3 | | |
| 594,000 | | | Sumitomo Mitsui Financial Group, Inc., 2.934%, 03/09/2021 |
| | | | 600,935 | | | | | | 0.2 | | |
| 525,000 (1) | | | Swiss Re Treasury US Corp., 2.875%, 12/06/2022 |
| | | | 533,760 | | | | | | 0.2 | | |
| 1,063,000 (1) | | | UBS AG/London, 2.200%, 06/08/2020 |
| | | | 1,064,434 | | | | | | 0.4 | | |
| 860,000 (1) | | | UBS Group AG, 2.950%, 09/24/2020 |
| | | | 866,104 | | | | | | 0.3 | | |
| 340,000 | | | US Bank NA/Cincinnati OH, 2.185%, (US0003M + 0.290%), 05/21/2021 |
| | | | 340,308 | | | | | | 0.1 | | |
| 205,000 (2) | | | Wells Fargo & Co., 2.406%, 10/30/2025 |
| | | | 205,139 | | | | | | 0.1 | | |
| 1,410,000 (2) | | | Wells Fargo Bank NA, 3.325%, 07/23/2021 |
| | | | 1,421,178 | | | | | | 0.5 | | |
| 880,000 | | | Wells Fargo Bank NA, 3.625%, 10/22/2021 |
| | | | 905,875 | | | | | | 0.3 | | |
| 16,729,000 | | | Other Securities | | | | | 17,155,524 | | | | | | 6.0 | | |
| | | | | | | | | 50,237,440 | | | | | | 17.5 | | |
| | | | Industrial: 2.6% | | ||||||||||||
| 1,640,000 | | | Caterpillar Financial Services Corp., 2.650%-3.650%, 05/17/2021-05/17/2024 |
| | | | 1,692,083 | | | | | | 0.6 | | |
| 348,000 (1) | | | Penske Truck Leasing Co. Lp / PTL Finance Corp., 3.650%, 07/29/2021 |
| | | | 356,036 | | | | | | 0.1 | | |
| 523,000 (1) | | | Rolls-Royce PLC, 2.375%, 10/14/2020 |
| | | | 525,038 | | | | | | 0.2 | | |
| 300,000 (1) | | | Siemens Financieringsmaatschappij NV, 2.200%, 03/16/2020 |
| | | | 300,118 | | | | | | 0.1 | | |
| 410,000 (1) | | | SMBC Aviation Capital Finance DAC, 4.125%, 07/15/2023 |
| | | | 431,402 | | | | | | 0.1 | | |
| 950,000 | | | United Parcel Service, Inc., 2.050%, 04/01/2021 |
| | | | 952,581 | | | | | | 0.3 | | |
| 3,265,000 | | | Other Securities | | | | | 3,336,566 | | | | | | 1.2 | | |
| | | | | | | | | 7,593,824 | | | | | | 2.6 | | |
| | | | Technology: 2.6% | | ||||||||||||
| 1,000,000 | | | Apple, Inc., 1.800%, 09/11/2024 |
| | | | 993,569 | | | | | | 0.4 | | |
| 352,000 (1) | | | Dell International LLC / EMC Corp., 4.420%, 06/15/2021 |
| | | | 362,253 | | | | | | 0.1 | | |
| Principal Amount† |
| |
Value
|
| |
Percentage
of Net Assets |
| |||||||||
| CORPORATE BONDS/NOTES: (continued) | | |||||||||||||||
| | | | Technology (continued) | | ||||||||||||
| 875,000 | | | salesforce.com, Inc., 3.250%, 04/11/2023 |
| | | $ | 910,148 | | | | | | 0.3 | | |
| 5,127,000 | | | Other Securities | | | | | 5,179,052 | | | | | | 1.8 | | |
| | | | | | | | | 7,445,022 | | | | | | 2.6 | | |
| | | | Utilities: 4.4% | | ||||||||||||
| 1,245,000 (2) | | | Dominion Energy, Inc., 2.579%-2.715%, 07/01/2020-08/15/2021 |
| | | | 1,250,625 | | | | | | 0.4 | | |
| 1,125,000 | | | Duke Energy Corp., 1.800%, 09/01/2021 |
| | | | 1,123,983 | | | | | | 0.4 | | |
| 385,000 | | | Duke Energy Ohio, Inc., 3.800%, 09/01/2023 |
| | | | 407,024 | | | | | | 0.2 | | |
| 290,000 | | | Duke Energy Progress LLC, 3.375%, 09/01/2023 |
| | | | 303,009 | | | | | | 0.1 | | |
| 268,000 (1) | | | Electricite de France SA, 2.350%, 10/13/2020 |
| | | | 268,542 | | | | | | 0.1 | | |
| 325,000 (1) | | | Niagara Mohawk Power Corp., 2.721%, 11/28/2022 |
| | | | 330,386 | | | | | | 0.1 | | |
| 8,859,000 | | | Other Securities | | | | | 9,005,360 | | | | | | 3.1 | | |
| | | | | | | | | 12,688,929 | | | | | | 4.4 | | |
| | | | Total Corporate Bonds/Notes (Cost $124,481,582) |
| | |
|
125,930,626
|
| | | |
|
43.7
|
| |
| COLLATERALIZED MORTGAGE OBLIGATIONS: 5.5% | | |||||||||||||||
| 1,793,295 | | | Fannie Mae REMICS 2006-43-FJ, 2.202%, (US0001M + 0.410%), 06/25/2036 |
| | | | 1,791,010 | | | | | | 0.6 | | |
| 1,250,621 | | | Fannie Mae REMICS 2007-14 PF, 1.982%, (US0001M + 0.190%), 03/25/2037 |
| | | | 1,237,525 | | | | | | 0.4 | | |
| 501,207 | | | Fannie Mae REMICS 2010-123 FL, 2.222%, (US0001M + 0.430%), 11/25/2040 |
| | | | 499,630 | | | | | | 0.2 | | |
| 2,018,458 | | | Fannie Mae REMICS 2011-51 FM, 2.442%, (US0001M + 0.650%), 06/25/2041 |
| | | | 2,025,410 | | | | | | 0.7 | | |
| 184,974 | | | Fannie Mae REMICS 2011-96 FN, 2.292%, (US0001M + 0.500%), 10/25/2041 |
| | | | 185,450 | | | | | | 0.1 | | |
| 1,541,057 | | | Fannie Mae REMICS 2010-136 FG, 2.292%, (US0001M + 0.500%), 12/25/2030 |
| | | | 1,543,759 | | | | | | 0.5 | | |
| Voya Limited Maturity Bond Portfolio | as of December 31, 2019 (continued) |
| Principal Amount† |
| |
Value
|
| |
Percentage
of Net Assets |
| |||||||||
| COLLATERALIZED MORTGAGE OBLIGATIONS: (continued) | | |||||||||||||||
| 2,577,160 | | | Fannie Mae REMICS 2011-68 F, 2.062%, (US0001M + 0.270%), 07/25/2031 |
| | | $ | 2,575,523 | | | | | | 0.9 | | |
| 197,130 (1)(2) | | | Flagstar Mortgage Trust 2017-2 A3, 3.500%, 10/25/2047 |
| | | | 199,394 | | | | | | 0.1 | | |
| 2,727,540 | | | Ginnie Mae Series 2012-H31 FD, 2.114%, (US0001M + 0.340%), 12/20/2062 |
| | | | 2,713,831 | | | | | | 0.9 | | |
| 749,217 | | | Ginnie Mae Series 2016-H08 FT, 2.494%, (US0001M + 0.720%), 02/20/2066 |
| | | | 751,427 | | | | | | 0.3 | | |
| 286,566 (1)(2) | | | GS Mortgage-Backed Securities Corp. Trust 2019-PJ3 A1, 3.500%, 03/25/2050 |
| | | | 290,921 | | | | | | 0.1 | | |
| 417,964 (1)(2) | | | Sequoia Mortgage Trust 2014-3 B3, 3.936%, 10/25/2044 |
| | | | 431,421 | | | | | | 0.1 | | |
| 437,037 (1)(2) | | | Sequoia Mortgage Trust 2014-4 B3, 3.864%, 11/25/2044 |
| | | | 448,981 | | | | | | 0.2 | | |
| 531,181 (1)(2) | | | Sequoia Mortgage Trust 2018-CH1 A19, 4.000%, 02/25/2048 |
| | | | 539,046 | | | | | | 0.2 | | |
| 765,323 | | | Other Securities | | | | | 770,232 | | | | | | 0.2 | | |
| | | | Total Collateralized Mortgage Obligations (Cost $15,985,138) |
| | |
|
16,003,560
|
| | | |
|
5.5
|
| |
| U.S. TREASURY OBLIGATIONS: 20.2% | | |||||||||||||||
| | | | U.S. Treasury Notes: 20.2% | | ||||||||||||
| 7,540,800 | | | 1.625%,12/31/2021 | | | | | 7,548,409 | | | | | | 2.6 | | |
| 22,431,000 | | | 1.625%,12/15/2022 | | | | | 22,441,651 | | | | | | 7.8 | | |
| 26,276,000 | | | 2.125%,01/31/2021 | | | | | 26,413,646 | | | | | | 9.2 | | |
| 1,653,900 (3) | | | 1.500%-1.750%, 10/31/2024-12/31/2026 |
| | | | 1,651,017 | | | | | | 0.6 | | |
| | | | Total U.S. Treasury Obligations (Cost $58,026,787) |
| | |
|
58,054,723
|
| | | |
|
20.2
|
| |
| COMMERCIAL MORTGAGE-BACKED SECURITIES: 11.1% | | |||||||||||||||
| 350,000 (1) | | | Austin Fairmont Hotel Trust 2019-FAIR C, 3.190%, (US0001M + 1.450%), 09/15/2032 |
| | | | 350,644 | | | | | | 0.1 | | |
| 830,000 (1) | | | BFLD 2019-DPLO A, 2.830%, (US0001M + 1.090%), 10/15/2034 |
| | | | 829,448 | | | | | | 0.3 | | |
| Principal Amount† |
| |
Value
|
| |
Percentage
of Net Assets |
| |||||||||
| COMMERCIAL MORTGAGE-BACKED SECURITIES: (continued) |
| |||||||||||||||
| 1,840,000 (1) | | | BX Commercial Mortgage Trust 2019-XL D, 3.190%, (US0001M + 1.450%), 10/15/2036 |
| | | $ | 1,844,640 | | | | | | 0.6 | | |
| 200,000 (2) | | | Citigroup Commercial Mortgage Trust 2013-GC17 C, 5.110%, 11/10/2046 |
| | | | 213,853 | | | | | | 0.1 | | |
| 521,000 (1)(2) | | | Citigroup Commercial Mortgage Trust 2014-GC19, 5.092%, 03/10/2047 |
| | | | 558,793 | | | | | | 0.2 | | |
| 360,000 | | | Citigroup Commercial Mortgage Trust 2015-GC27 AAB, 2.944%, 02/10/2048 |
| | | | 366,181 | | | | | | 0.1 | | |
| 672,131 | | | Citigroup/Deutsche Bank Commercial Mortgage Trust 2006-CD3 AM, 5.648%, 10/15/2048 |
| | | | 688,738 | | | | | | 0.2 | | |
| 710,000 (1) | | | CLNY Trust 2019-IKPR A, 2.869%, (US0001M + 1.227%), 11/15/2038 |
| | | | 703,766 | | | | | | 0.2 | | |
| 1,690,000 (1) | | | Credit Suisse Mortgage Capital Certificates 2019-ICE4 B, 2.970%, (US0001M + 1.230%), 05/15/2036 |
| | | | 1,692,894 | | | | | | 0.6 | | |
| 320,000 (1) | | | CSWF 2018-TOP C, 3.190%, (US0001M + 1.450%), 08/15/2035 |
| | | | 320,135 | | | | | | 0.1 | | |
| 1,490,000 (1)(2) | | | DBRR 2011-LC2 A4B Trust, 4.537%, 07/12/2044 |
| | | | 1,521,111 | | | | | | 0.5 | | |
| 780,000 (1)(2) | | | DBUBS 2011-LC1A E, 5.702%, 11/10/2046 |
| | | | 796,532 | | | | | | 0.3 | | |
| 730,000 (1)(2) | | | DBUBS 2011-LC2A D, 5.530%, 07/10/2044 |
| | | | 750,567 | | | | | | 0.3 | | |
| 102,897 (2) | | | Ginnie Mae 2011-53 B, 3.934%, 05/16/2051 |
| | | | 104,895 | | | | | | 0.0 | | |
| 713,926 | | | Ginnie Mae 2014-168 DA, 2.400%, 06/16/2046 |
| | | | 711,743 | | | | | | 0.2 | | |
| 180,379 | | | Ginnie Mae 2014-54 AC, 2.874%, 02/16/2049 |
| | | | 181,231 | | | | | | 0.1 | | |
| 629,801 | | | Ginnie Mae 2015-183 AC, 2.350%, 07/16/2056 |
| | | | 627,760 | | | | | | 0.2 | | |
| 142,762 (2) | | | Ginnie Mae 2015-21 AF, 2.077%, 07/16/2048 |
| | | | 141,640 | | | | | | 0.1 | | |
| 362,579 | | | Ginnie Mae 2015-81 AC, 2.400%, 01/16/2056 |
| | | | 361,584 | | | | | | 0.1 | | |
| Voya Limited Maturity Bond Portfolio | as of December 31, 2019 (continued) |
| Principal Amount† |
| |
Value
|
| |
Percentage
of Net Assets |
| |||||||||
| COMMERCIAL MORTGAGE-BACKED SECURITIES: (continued) |
| |||||||||||||||
| 439,245 | | | Ginnie Mae 2016-110 AB, 2.000%, 05/16/2049 |
| | | $ | 433,131 | | | | | | 0.2 | | |
| 179,906 | | | Ginnie Mae 2016-86 AB, 2.500%, 09/16/2056 |
| | | | 179,834 | | | | | | 0.1 | | |
| 600,777 | | | Ginnie Mae 2017-51 AB, 2.350%, 04/16/2057 |
| | | | 598,049 | | | | | | 0.2 | | |
| 243,514 | | | Ginnie Mae 2017-69 AB, 2.350%, 05/16/2053 |
| | | | 242,382 | | | | | | 0.1 | | |
| 370,365 | | | Ginnie Mae 2017-70 A, 2.500%, 10/16/2057 |
| | | | 369,637 | | | | | | 0.1 | | |
| 878,753 | | | Ginnie Mae 2017-86 AB, 2.300%, 11/16/2051 |
| | | | 874,667 | | | | | | 0.3 | | |
| 858,015 | | | Ginnie Mae 2017-89 A, 2.500%, 08/16/2057 |
| | | | 856,324 | | | | | | 0.3 | | |
| 1,000,000 (1) | | | Great Wolf Trust 2019-WOLF A, 2.756%, (US0001M + 1.034%), 12/15/2029 |
| | | | 997,186 | | | | | | 0.4 | | |
| 530,000 (1) | | | GS Mortgage Securities Corp. Trust 2017-GPTX B, 3.104%, 05/10/2034 |
| | | | 527,387 | | | | | | 0.2 | | |
| 1,420,000 (1) | | | GS Mortgage Securities Corp. Trust 2019-70P C, 3.240%, (US0001M + 1.500%), 10/15/2036 |
| | | | 1,421,974 | | | | | | 0.5 | | |
| 1,320,000 (1)(2) | | | GS Mortgage Securities Trust 2011-GC3 D, 5.636%, 03/10/2044 |
| | | | 1,363,977 | | | | | | 0.4 | | |
| 760,000 (1)(2) | | | GS Mortgage Securities Trust 2012-GC6 C, 5.651%, 01/10/2045 |
| | | | 796,874 | | | | | | 0.3 | | |
| 977,000 (1)(2) | | | JP Morgan Chase Commercial Mortgage Securities Trust 2010-C2 C, 5.600%, 11/15/2043 |
| | | | 989,306 | | | | | | 0.3 | | |
| 2,710,000 (1)(2) | | | JP Morgan Chase Commercial Mortgage Securities Trust 2011-C5 B, 5.418%, 08/15/2046 |
| | | | 2,820,305 | | | | | | 1.0 | | |
| 700,000 (2) | | | JP Morgan Chase Commercial Mortgage Securities Trust 2013-C10 B, 3.674%, 12/15/2047 |
| | | | 721,432 | | | | | | 0.3 | | |
| 4,526 | | | JPMBB Commercial Mortgage Securities Trust 2 2014-C19 A2, 3.046%, 04/15/2047 |
| | | | 4,547 | | | | | | 0.0 | | |
| Principal Amount† |
| |
Value
|
| |
Percentage
of Net Assets |
| |||||||||
| COMMERCIAL MORTGAGE-BACKED SECURITIES: (continued) |
| |||||||||||||||
| 455,281 | | | Morgan Stanley Bank of America Merrill Lynch Trust 2014-C14 A3, 3.669%, 02/15/2047 |
| | | $ | 459,610 | | | | | | 0.2 | | |
| 1,210,000 (1)(2) | | | Morgan Stanley Capital I Trust 2011-C1 D, 5.375%, 09/15/2047 |
| | | | 1,240,281 | | | | | | 0.4 | | |
| 1,220,000 | | | Morgan Stanley Capital I Trust 2019-H6 A2, 3.228%, 06/15/2052 |
| | | | 1,263,762 | | | | | | 0.5 | | |
| 620,000 (1) | | | Morgan Stanley Capital I, Inc. 2019-BPR A, 3.140%, (US0001M + 1.400%), 05/15/2036 |
| | | | 619,541 | | | | | | 0.2 | | |
| 490,000 (1)(2) | | | Wells Fargo Commercial Mortgage Trust 2010-C1 B, 5.276%, 11/15/2043 |
| | | | 497,433 | | | | | | 0.2 | | |
| 1,780,175 | | | Other Securities | | | | | 1,810,565 | | | | | | 0.6 | | |
| | | | Total Commercial Mortgage-Backed Securities (Cost $32,027,670) |
| | |
|
31,854,359
|
| | | |
|
11.1
|
| |
| ASSET-BACKED SECURITIES: 17.1% | | |||||||||||||||
| | | | Automobile Asset-Backed Securities: 7.6% | | ||||||||||||
| 750,000 | | | CarMax Auto Owner Trust 2017-1 A4, 2.270%, 09/15/2022 |
| | | | 752,120 | | | | | | 0.3 | | |
| 750,000 | | | CarMax Auto Owner Trust 2017-3 A4, 2.220%, 11/15/2022 |
| | | | 751,792 | | | | | | 0.3 | | |
| 150,000 | | | Carmax Auto Owner Trust 2019-3 A4, 2.300%, 04/15/2025 |
| | | | 150,542 | | | | | | 0.0 | | |
| 800,000 | | | Carmax Auto Owner Trust 2019-4 A4, 2.130%, 07/15/2025 |
| | | | 801,475 | | | | | | 0.3 | | |
| 300,000 | | | GM Financial Automobile Leasing Trust 2018-1 A4, 2.680%, 12/20/2021 |
| | | | 300,847 | | | | | | 0.1 | | |
| 650,000 | | | GM Financial Automobile Leasing Trust 2018-1 B, 2.870%, 12/20/2021 |
| | | | 652,066 | | | | | | 0.2 | | |
| 400,000 | | | GM Financial Automobile Leasing Trust 2018-3 A4, 3.300%, 07/20/2022 |
| | | | 405,204 | | | | | | 0.1 | | |
| 450,000 | | | GM Financial Automobile Leasing Trust 2019-4 A4, 1.760%, 01/16/2025 |
| | | | 445,862 | | | | | | 0.2 | | |
| Voya Limited Maturity Bond Portfolio | as of December 31, 2019 (continued) |
| Principal Amount† |
| |
Value
|
| |
Percentage
of Net Assets |
| |||||||||
| ASSET-BACKED SECURITIES: (continued) | | |||||||||||||||
| | | | Automobile Asset-Backed Securities (continued) |
| ||||||||||||
| 500,000 | | | GM Financial Consumer Automobile Receivables Trust 2019-3 A3, 2.180%, 04/16/2024 |
| | | $ | 502,365 | | | | | | 0.2 | | |
| 650,000 | | | Honda Auto Receivables 2018-4 A4 Owner Trust, 3.300%, 07/15/2025 |
| | | | 669,253 | | | | | | 0.2 | | |
| 550,000 | | | Honda Auto Receivables 2019-3 A3 Owner Trust, 1.780%, 08/15/2023 |
| | | | 548,816 | | | | | | 0.2 | | |
| 250,000 (1) | | | Hyundai Auto Lease Securitization Trust 2019-B A4, 2.030%, 06/15/2023 |
| | | | 249,645 | | | | | | 0.1 | | |
| 950,000 | | | Hyundai Auto Receivables Trust 2017-B A4, 1.960%, 02/15/2023 |
| | | | 949,727 | | | | | | 0.3 | | |
| 646,260 | | | Mercedes-Benz Auto Lease Trust 2019-A A2, 3.010%, 02/16/2021 |
| | | | 647,513 | | | | | | 0.2 | | |
| 400,000 | | | Mercedes-Benz Auto Lease Trust 2019-A A4, 3.250%, 10/15/2024 |
| | | | 406,358 | | | | | | 0.1 | | |
| 450,000 | | | Mercedes-Benz Auto Receivables Trust 2018-1 A4, 3.150%, 10/15/2024 |
| | | | 460,850 | | | | | | 0.2 | | |
| 650,000 | | | Nissan Auto Receivables 2017-C A4 Owner Trust, 2.280%, 02/15/2024 |
| | | | 651,962 | | | | | | 0.2 | | |
| 500,000 | | | Nissan Auto Receivables 2018-C A4 Owner Trust, 3.270%, 06/16/2025 |
| | | | 516,282 | | | | | | 0.2 | | |
| 1,149,009 (1) | | | OSCAR US Funding Trust VII LLC 2017-2A A3, 2.450%, 12/10/2021 |
| | | | 1,150,557 | | | | | | 0.4 | | |
| 850,000 | | | Santander Drive Auto Receivables Trust 2019-2 B, 2.790%, 01/16/2024 |
| | | | 858,081 | | | | | | 0.3 | | |
| 1,100,000 | | | Santander Drive Auto Receivables Trust 2019-3 A3, 2.160%, 11/15/2022 |
| | | | 1,101,749 | | | | | | 0.4 | | |
| 650,000 (1) | | | Santander Retail Auto Lease Trust 2017-A A4, 2.370%, 01/20/2022 |
| | | | 650,803 | | | | | | 0.2 | | |
| 91,077 (1) | | | Santander Retail Auto Lease Trust 2019-A A2, 2.720%, 01/20/2022 |
| | | | 91,683 | | | | | | 0.0 | | |
| 500,000 (1) | | | Santander Retail Auto Lease Trust 2019-B A3, 2.300%, 01/20/2023 |
| | | | 501,787 | | | | | | 0.2 | | |
| Principal Amount† |
| |
Value
|
| |
Percentage
of Net Assets |
| |||||||||
| ASSET-BACKED SECURITIES: (continued) | | |||||||||||||||
| | | | Automobile Asset-Backed Securities (continued) |
| ||||||||||||
| 500,000 (1) | | | Santander Retail Auto Lease Trust 2019-B A4, 2.380%, 08/21/2023 |
| | | $ | 502,222 | | | | | | 0.2 | | |
| 1,300,000 (1) | | | Santander Retail Auto Lease Trust 2019-C A4, 1.930%, 11/20/2023 |
| | | | 1,291,971 | | | | | | 0.5 | | |
| 865,850 (1) | | | Tesla Auto Lease Trust 2018-B A, 3.710%, 08/20/2021 |
| | | | 877,253 | | | | | | 0.3 | | |
| 650,000 | | | Toyota Auto Receivables 2017-C A4 Owner Trust, 1.980%, 12/15/2022 |
| | | | 650,535 | | | | | | 0.2 | | |
| 950,000 | | | Toyota Auto Receivables 2019-C A4 Owner Trust, 1.880%, 11/15/2024 |
| | | | 947,622 | | | | | | 0.4 | | |
| 3,200,000 | | | Other Securities | | | | | 3,243,085 | | | | | | 1.1 | | |
| | | | | | | | | 21,730,027 | | | | | | 7.6 | | |
| | | | Credit Card Asset-Backed Securities: 0.9% | | ||||||||||||
| 1,000,000 | | | BA Credit Card Trust 2019-A1 A1, 1.740%, 01/15/2025 |
| | | | 997,067 | | | | | | 0.4 | | |
| 1,550,000 (1) | | | Evergreen Credit Card Trust Series 2018-1 A, 2.950%, 03/15/2023 |
| | | | 1,569,238 | | | | | | 0.5 | | |
| | | | | | | | | 2,566,305 | | | | | | 0.9 | | |
| | | | Other Asset-Backed Securities: 8.3% | | ||||||||||||
| 500,000 (1) | | | Allegany Park CLO Ltd. 2019-1A A, 3.238%, (US0003M + 1.330%), 01/20/2033 |
| | | | 500,000 | | | | | | 0.2 | | |
| 840,000 (1) | | | Apidos Clo XXV 2016-25A A1R, 3.136%, (US0003M + 1.170%), 10/20/2031 |
| | | | 836,718 | | | | | | 0.3 | | |
| 560,000 (1) | | | Arbor Realty Commercial Real Estate Notes 2019-FL2 A Ltd., 2.971%, (US0001M + 1.200%), 06/15/2034 |
| | | | 559,824 | | | | | | 0.2 | | |
| 700,000 (1) | | | ARES XLVI CLO Ltd. 2017-46A A2, 3.231%, (US0003M + 1.230%), 01/15/2030 |
| | | | 685,368 | | | | | | 0.2 | | |
| 250,000 (1) | | | Babson CLO Ltd. 2017-1A A2, 3.353%, (US0003M + 1.350%), 07/18/2029 |
| | | | 247,087 | | | | | | 0.1 | | |
| Voya Limited Maturity Bond Portfolio | as of December 31, 2019 (continued) |
| Principal Amount† |
| |
Value
|
| |
Percentage
of Net Assets |
| |||||||||
| ASSET-BACKED SECURITIES: (continued) | | |||||||||||||||
| | | | Other Asset-Backed Securities (continued) | | ||||||||||||
| 250,000 (1) | | | Bain Capital Credit CLO 2017-1A A2, 3.316%, (US0003M + 1.350%), 07/20/2030 |
| | | $ | 248,324 | | | | | | 0.1 | | |
| 580,000 (1) | | | Benefit Street Partners CLO II Ltd. 2013-IIA A1R, 3.251%, (US0003M + 1.250%), 07/15/2029 |
| | | | 579,980 | | | | | | 0.2 | | |
| 250,000 (1) | | | Carbone CLO Ltd. 2017-1A A1, 3.106%, (US0003M + 1.140%), 01/20/2031 |
| | | | 249,352 | | | | | | 0.1 | | |
| 500,000 (1) | | | Carlyle Global Market Strategies CLO 2014-2RA A1 Ltd., 2.960%, (US0003M + 1.050%), 05/15/2031 |
| | | | 497,720 | | | | | | 0.2 | | |
| 620,000 (1) | | | Cedar Funding VIII Clo Ltd. 2017-8A A1, 3.252%, (US0003M + 1.250%), 10/17/2030 |
| | | | 620,002 | | | | | | 0.2 | | |
| 750,000 (1) | | | CIFC Funding 2013-2A A1LR, 3.213%, (US0003M + 1.210%), 10/18/2030 |
| | | | 749,999 | | | | | | 0.3 | | |
| 600,000 (1) | | | CIFC Funding 2017-4 A1, 3.186%, (US0003M + 1.250%), 10/24/2030 |
| | | | 601,892 | | | | | | 0.2 | | |
| 600,000 (1) | | | CIFC Funding 2018-4A A1 Ltd., 3.152%, (US0003M + 1.150%), 10/17/2031 |
| | | | 596,206 | | | | | | 0.2 | | |
| 600,000 (1) | | | Clear Creek CLO Ltd. 2015-1A AR, 3.166%, (US0003M + 1.200%), 10/20/2030 |
| | | | 598,535 | | | | | | 0.2 | | |
| 250,000 (1) | | | Deer Creek Clo Ltd. 2017-1A A, 3.146%, (US0003M + 1.180%), 10/20/2030 |
| | | | 249,794 | | | | | | 0.1 | | |
| 680,000 (1) | | | Dewolf Park Clo Ltd. 2017-1A A, 3.211%, (US0003M + 1.210%), 10/15/2030 |
| | | | 679,997 | | | | | | 0.2 | | |
| 250,000 (1) | | | Dryden 55 CLO Ltd. 2018-55A A1, 3.021%, (US0003M + 1.020%), 04/15/2031 |
| | | | 248,689 | | | | | | 0.1 | | |
| 1,120,000 (1) | | | Dryden Senior Loan Fund 2017-47A A2, 3.351%, (US0003M + 1.350%), 04/15/2028 |
| | | | 1,110,719 | | | | | | 0.4 | | |
| Principal Amount† |
| |
Value
|
| |
Percentage
of Net Assets |
| |||||||||
| ASSET-BACKED SECURITIES: (continued) | | |||||||||||||||
| | | | Other Asset-Backed Securities (continued) | | ||||||||||||
| 480,000 (1) | | | Dryden XXVIII Senior Loan Fund 2013-28A A1LR, 3.110%, (US0003M + 1.200%), 08/15/2030 |
| | | $ | 480,005 | | | | | | 0.1 | | |
| 300,000 (1) | | | Eaton Vance Clo 2015-1A A2R Ltd., 3.216%, (US0003M + 1.250%), 01/20/2030 |
| | | | 300,002 | | | | | | 0.1 | | |
| 750,000 (1) | | | Galaxy XIX CLO Ltd. 2015-19A A1R, 3.156%, (US0003M + 1.220%), 07/24/2030 |
| | | | 748,826 | | | | | | 0.2 | | |
| 500,000 (1) | | | Galaxy XV CLO Ltd. 2013-15A AR, 3.201%, (US0003M + 1.200%), 10/15/2030 |
| | | | 499,205 | | | | | | 0.2 | | |
| 300,000 (1) | | | Goldentree Loan Management US Clo 2 Ltd. 2017-2A A, 3.116%, (US0003M + 1.150%), 11/28/2030 |
| | | | 299,689 | | | | | | 0.1 | | |
| 431,651 (1) | | | JGWPT XXXIII LLC 2014-3A A, 3.500%, 06/15/2077 |
| | | | 444,161 | | | | | | 0.2 | | |
| 600,000 (1) | | | LCM 26A A2 Ltd., 3.216%, (US0003M + 1.250%), 01/20/2031 |
| | | | 589,938 | | | | | | 0.2 | | |
| 250,000 (1) | | | LCM XXIV Ltd. 24A A, 3.276%, (US0003M + 1.310%), 03/20/2030 |
| | | | 250,019 | | | | | | 0.1 | | |
| 480,000 (1) | | | LoanCore 2019-CRE2 A Issuer Ltd., 2.870%, (US0001M + 1.130%), 05/09/2036 |
| | | | 479,999 | | | | | | 0.2 | | |
| 400,000 (1) | | | Octagon Investment Partners 33 Ltd. 2017-1A A1, 3.156%, (US0003M + 1.190%), 01/20/2031 |
| | | | 398,770 | | | | | | 0.1 | | |
| 500,000 (1) | | | Octagon Investment Partners Ltd. 2017-1A A2, 3.351%, (US0003M + 1.350%), 07/15/2029 |
| | | | 494,738 | | | | | | 0.2 | | |
| 500,000 (1) | | | Octagon Investment Partners XIV Ltd. 2012-1A A1BR, 3.376%, (US0003M + 1.375%), 07/15/2029 |
| | | | 491,812 | | | | | | 0.2 | | |
| Voya Limited Maturity Bond Portfolio | as of December 31, 2019 (continued) |
| Principal Amount† |
| |
Value
|
| |
Percentage
of Net Assets |
| |||||||||
| ASSET-BACKED SECURITIES: (continued) | | |||||||||||||||
| | | | Other Asset-Backed Securities (continued) | | ||||||||||||
| 400,000 (1) | | | Octagon Investment Partners XV Ltd. 2013-1A A2R, 3.316%, (US0003M + 1.350%), 07/19/2030 |
| | | $ | 393,304 | | | | | | 0.1 | | |
| 500,000 (1) | | | Palmer Square CLO 2013-2A AARR Ltd., 3.202%, (US0003M + 1.200%), 10/17/2031 |
| | | | 497,122 | | | | | | 0.2 | | |
| 700,000 (1) | | | Palmer Square CLO 2015-2A A1AR Ltd., 3.236%, (US0003M + 1.270%), 07/20/2030 |
| | | | 700,209 | | | | | | 0.2 | | |
| 275,000 (1) | | | Palmer Square CLO 2015-2A A1BR Ltd., 3.316%, (US0003M + 1.350%), 07/20/2030 |
| | | | 274,998 | | | | | | 0.1 | | |
| 537,789 (1) | | | SoFi Consumer Loan Program 2019-2 A Trust, 3.010%, 04/25/2028 |
| | | | 541,895 | | | | | | 0.2 | | |
| 471,867 (1) | | | SoFi Consumer Loan Program 2019-3 A Trust, 2.900%, 05/25/2028 |
| | | | 474,891 | | | | | | 0.1 | | |
| 400,000 (1) | | | TCI-Flatiron Clo 2017-1A A Ltd., 3.104%, (US0003M + 1.200%), 11/18/2030 |
| | | | 399,012 | | | | | | 0.1 | | |
| 500,000 (1) | | | TCI-Symphony CLO 2017-1A A Ltd., 3.231%, (US0003M + 1.230%), 07/15/2030 |
| | | | 499,417 | | | | | | 0.2 | | |
| 600,000 (1) | | | THL Credit Wind River 2013-2A AR CLO Ltd., 3.233%, (US0003M + 1.230%), 10/18/2030 |
| | | | 597,770 | | | | | | 0.2 | | |
| 570,000 (1) | | | THL Credit Wind River 2017-2A A CLO Ltd., 3.196%, (US0003M + 1.230%), 07/20/2030 |
| | | | 570,122 | | | | | | 0.2 | | |
| 600,000 (1) | | | THL Credit Wind River 2018-2 A A2Clo Ltd., 3.451%, (US0003M + 1.450%), 07/15/2030 |
| | | | 595,117 | | | | | | 0.2 | | |
| 600,000 (1) | | | THL Credit Wind River 2019-2A A2 Clo Ltd., 3.501%, (US0003M + 1.650%), 01/15/2033 |
| | | | 599,966 | | | | | | 0.2 | | |
| Principal Amount† |
| |
Value
|
| |
Percentage
of Net Assets |
| |||||||||
| ASSET-BACKED SECURITIES: (continued) | | |||||||||||||||
| | | | Other Asset-Backed Securities (continued) | | ||||||||||||
| 800,000 (1) | | | Trafigura Securitisation Finance PLC 2018-1A A2, 3.730%, 03/15/2022 |
| | | $ | 816,476 | | | | | | 0.3 | | |
| 250,000 (1) | | | Venture 34 CLO Ltd. 2018-34A A, 3.231%, (US0003M + 1.230%), 10/15/2031 |
| | | | 247,799 | | | | | | 0.1 | | |
| 450,000 (1) | | | Volvo Financial Equipment LLC Series 2017-1A A4, 2.210%, 11/15/2021 |
| | | | 450,538 | | | | | | 0.2 | | |
| 1,000,000 | | | Other Securities | | | | | 1,010,966 | | | | | | 0.3 | | |
| | | | | | | | | 24,006,972 | | | | | | 8.3 | | |
| | | | Student Loan Asset-Backed Securities: 0.3% |
| ||||||||||||
| 850,000 (1) | | | Navient Private Education Refi Loan Trust 2019-FA A2, 2.600%, 08/15/2068 |
| | |
|
849,113
|
| | | |
|
0.3
|
| |
| | | | Total Asset-Backed Securities (Cost $49,030,182) |
| | |
|
49,152,417
|
| | | |
|
17.1
|
| |
| SUPRANATIONAL BONDS: 0.1% | | |||||||||||||||
| 179,000 | | | Other Securities | | | |
|
179,024
|
| | | |
|
0.1
|
| |
| | | | Total Supranational Bonds (Cost $178,474) |
| | |
|
179,024
|
| | | |
|
0.1
|
| |
| U.S. GOVERNMENT AGENCY OBLIGATIONS: 0.0% | | |||||||||||||||
| | | | Federal Home Loan Mortgage Corporation: 0.0% |
| ||||||||||||
| 3 | | | 4.625%, (H15T1Y + 1.997)%, 07/01/2024 |
| | |
|
3
|
| | | |
|
0.0
|
| |
| | | | | | ||||||||||||
| | | | Uniform Mortgage-Backed Securities : 0.0% | | ||||||||||||
| 65,211 | | | Other Securities | | | |
|
71,079
|
| | | |
|
0.0
|
| |
| | | | Total U.S. Government Agency Obligations (Cost $66,352) |
| | |
|
71,082
|
| | | |
|
0.0
|
| |
| | | | Total Long-Term Investments (Cost $279,796,185) |
| | |
|
281,245,791
|
| | | |
|
97.7
|
| |
| | ||||||||||||||||
| Voya Limited Maturity Bond Portfolio | as of December 31, 2019 (continued) |
| Principal Amount† |
| |
Value
|
| |
Percentage
of Net Assets |
| |||||||||
| SHORT-TERM INVESTMENTS: 1.8% | | |||||||||||||||
| | | | Repurchase Agreements: 0.0% | | ||||||||||||
| 3,127 (4) | | | Millennium Fixed Income Ltd., Repurchase Agreement dated 12/31/19, 1.75%, due 01/02/20 (Repurchase Amount $3,127, collateralized by various U.S. Government Securities, 0.125%-2.250%, Market Value plus accrued interest $3,190, due 04/15/20-03/31/21) (Cost $5,075) |
| | |
$
|
5,075
|
| | | |
|
0.0
|
| |
| | | | | | ||||||||||||
| | | | Mutual Funds: 1.8% | | ||||||||||||
| 5,219,000 (5) | | | Goldman Sachs Financial Square Government Fund - Institutional Shares, 1.500% (Cost $5,219,000) |
| | |
|
5,219,000
|
| | | |
|
1.8
|
| |
| | | | Total Short-Term Investments (Cost $5,224,075) |
| | |
|
5,224,075
|
| | | |
|
1.8
|
| |
| | | | Total Investments in Securities (Cost $285,020,260) |
| | | $ | 286,469,866 | | | | | | 99.5 | | |
| | | | Assets in Excess of Other Liabilities |
| | | | 1,357,940 | | | | | | 0.5 | | |
| | | | Net Assets | | | | $ | 287,827,806 | | | | | | 100.0 | | |
| | ||||||||||||||||
| | | |
Quoted Prices
in Active Markets for Identical Investments (Level 1) |
| |
Significant
Other Observable Inputs (Level 2) |
| |
Significant
Unobservable Inputs (Level 3) |
| |
Fair Value
at December 31, 2019 |
| ||||||||||||
| Asset Table | | | | | | | | | | | | | | | | | | | | | | | | | |
| Investments, at fair value | | | | | | | | | | | | | | | | | | | | | | | | | |
| Corporate Bonds/Notes | | | | $ | — | | | | | $ | 125,930,626 | | | | | $ | — | | | | | $ | 125,930,626 | | |
| Collateralized Mortgage Obligations | | | | | — | | | | | | 16,003,560 | | | | | | — | | | | | | 16,003,560 | | |
| Asset-Backed Securities | | | | | — | | | | | | 49,152,417 | | | | | | — | | | | | | 49,152,417 | | |
| Commercial Mortgage-Backed Securities | | | | | — | | | | | | 31,854,359 | | | | | | — | | | | | | 31,854,359 | | |
| Supranational Bonds | | | | | — | | | | | | 179,024 | | | | | | — | | | | | | 179,024 | | |
| U.S. Government Agency Obligations | | | | | — | | | | | | 71,082 | | | | | | — | | | | | | 71,082 | | |
| U.S. Treasury Obligations | | | | | — | | | | | | 58,054,723 | | | | | | — | | | | | | 58,054,723 | | |
| Short-Term Investments | | | | | 5,219,000 | | | | | | 5,075 | | | | | | — | | | | | | 5,224,075 | | |
| Total Investments, at fair value | | | | $ | 5,219,000 | | | | | $ | 281,250,866 | | | | | $ | — | | | | | $ | 286,469,866 | | |
| Voya Limited Maturity Bond Portfolio | as of December 31, 2019 (continued) |
| | | |
Quoted Prices
in Active Markets for Identical Investments (Level 1) |
| |
Significant
Other Observable Inputs (Level 2) |
| |
Significant
Unobservable Inputs (Level 3) |
| |
Fair Value
at December 31, 2019 |
| ||||||||||||
| Other Financial Instruments+ | | | | | | | | | | | | | | | | | | | | | | | | | |
| Futures | | | | | 42,572 | | | | | | — | | | | | | — | | | | | | 42,572 | | |
| Total Assets | | | | $ | 5,261,572 | | | | | $ | 281,250,866 | | | | | $ | — | | | | | $ | 286,512,438 | | |
| Liabilities Table | | | | | | | | | | | | | | | | | | | | | | | | | |
| Other Financial Instruments+ | | | | | | | | | | | | | | | | | | | | | | | | | |
| Futures | | | | $ | (37,777) | | | | | $ | — | | | | | $ | — | | | | | $ | (37,777) | | |
| Total Liabilities | | | | $ | (37,777) | | | | | $ | — | | | | | $ | — | | | | | $ | (37,777) | | |
|
Description
|
| |
Number
of Contracts |
| |
Expiration
Date |
| |
Notional
Value |
| |
Unrealized
Appreciation/ (Depreciation) |
| ||||||||||||
| Long Contracts: | | | | | | | | | | | | | | | | | | | | | | | | | |
| U.S. Treasury 2-Year Note | | | | | 409 | | | | | | 03/31/20 | | | | | $ | 88,139,500 | | | | | $ | (37,777) | | |
| | | | | | | | | | | | | | | | | $ | 88,139,500 | | | | | $ | (37,777) | | |
| Short Contracts: | | | | | | | | | | | | | | | | | | | | | | | | | |
| U.S. Treasury 10-Year Note | | | | | (10) | | | | | | 03/20/20 | | | | | | (1,284,219) | | | | | | 6,404 | | |
| U.S. Treasury 5-Year Note | | | | | (124) | | | | | | 03/31/20 | | | | | | (14,707,562) | | | | | | 36,168 | | |
| | | | | | | | | | | | | | | | | $ | (15,991,781) | | | | | $ | 42,572 | | |
|
Derivatives not accounted for as hedging instruments
|
| |
Location on Statement
of Assets and Liabilities |
| |
Fair Value
|
| |||
| Asset Derivatives | | | | | | | | | | |
| Interest rate contracts | | |
Net Assets — Unrealized appreciation*
|
| | | $ | 42,572 | | |
|
Total Asset Derivatives
|
| | | | | | $ | 42,572 | | |
| Liability Derivatives | | | | | | | | | | |
| Interest rate contracts | | |
Net Assets — Unrealized depreciation*
|
| | | $ | 37,777 | | |
|
Total Liability Derivatives
|
| | | | | | $ | 37,777 | | |
|
Amount of Realized Gain or (Loss) on Derivatives Recognized in Income
|
| ||||||||||||||||||||||||
|
Derivatives not accounted for as hedging instruments
|
| |
Investments*
|
| |
Futures
|
| |
Swaps
|
| |
Total
|
| ||||||||||||
| Credit contracts | | | | $ | — | | | | | $ | — | | | | | $ | (108) | | | | | $ | (108) | | |
| Interest rate contracts | | | | | (6,738) | | | | | | 67,840 | | | | | | (54,431) | | | | | | 6,671 | | |
|
Total
|
| | | $ | (6,738) | | | | | $ | 67,840 | | | | | $ | (54,539) | | | | | $ | 6,563 | | |
| Voya Limited Maturity Bond Portfolio | as of December 31, 2019 (continued) |
|
Change in Unrealized Appreciation or (Depreciation) on Derivatives Recognized in Income
|
| ||||||||||||||||||||||||
|
Derivatives not accounted for as hedging instruments
|
| |
Investments*
|
| |
Futures
|
| |
Swaps
|
| |
Total
|
| ||||||||||||
| Credit contracts | | | | $ | — | | | | | $ | — | | | | | $ | — | | | | | $ | — | | |
| Interest rate contracts | | | | | — | | | | | | (196,576) | | | | | | — | | | | | | (196,576) | | |
|
Total
|
| | | $ | — | | | | | $ | (196,576) | | | | | $ | — | | | | | $ | (196,576) | | |
| | Cost for federal income tax purposes was $285,026,864. | | | |||||
| | Net unrealized appreciation consisted of: | | | |||||
| |
Gross Unrealized Appreciation
|
| | | $ | 1,832,323 | | |
| |
Gross Unrealized Depreciation
|
| | | | (384,526) | | |
| |
Net Unrealized Appreciation
|
| | | $ | 1,447,797 | | |
| Voya U.S. Stock Index Portfolio | as of December 31, 2019 |
|
Shares
|
| |
Value
|
| |
Percentage
of Net Assets |
| |||||||||
| COMMON STOCK: 98.7% | | |||||||||||||||
| | | | Communication Services: 10.3% | | ||||||||||||
| 77,320 (1) | | | Alphabet, Inc. - Class A | | | | $ | 103,561,635 | | | | | | 1.5 | | |
| 77,129 (1) | | | Alphabet, Inc. - Class C | | | | | 103,123,016 | | | | | | 1.5 | | |
| 1,885,071 | | | AT&T, Inc. | | | | | 73,668,575 | | | | | | 1.1 | | |
| 1,171,507 | | | Comcast Corp. – Class A | | | | | 52,682,670 | | | | | | 0.8 | | |
| 620,994 (1) | | | Facebook, Inc. - Class A | | | | | 127,459,018 | | | | | | 1.8 | | |
| 113,092 (1) | | | Netflix, Inc. | | | | | 36,593,178 | | | | | | 0.5 | | |
| 1,067,248 | | | Verizon Communications, Inc. |
| | | | 65,529,027 | | | | | | 0.9 | | |
| 465,113 | | | Walt Disney Co. | | | | | 67,269,293 | | | | | | 1.0 | | |
| 1,664,693 (2)(3) | | | Other Securities | | | | | 87,560,748 | | | | | | 1.2 | | |
| | | | | | | | | 717,447,160 | | | | | | 10.3 | | |
| | | | Consumer Discretionary: 9.6% | | ||||||||||||
| 107,471 (1) | | | Amazon.com, Inc. | | | | | 198,589,213 | | | | | | 2.8 | | |
| 281,493 | | | Home Depot, Inc. | | | | | 61,472,441 | | | | | | 0.9 | | |
| 194,337 | | | McDonald’s Corp. | | | | | 38,402,934 | | | | | | 0.5 | | |
| 321,773 | | | Nike, Inc. | | | | | 32,598,823 | | | | | | 0.5 | | |
| 5,140,113 (2)(3) | | | Other Securities | | | | | 342,945,655 | | | | | | 4.9 | | |
| | | | | | | | | 674,009,066 | | | | | | 9.6 | | |
| | | | Consumer Staples: 7.1% | | ||||||||||||
| 995,060 | | | Coca-Cola Co. | | | | | 55,076,571 | | | | | | 0.8 | | |
| 114,003 | | | Costco Wholesale Corp. | | | | | 33,507,762 | | | | | | 0.5 | | |
| 359,837 | | | PepsiCo, Inc. | | | | | 49,178,923 | | | | | | 0.7 | | |
| 401,497 | | | Philip Morris International, Inc. |
| | | | 34,163,379 | | | | | | 0.5 | | |
| 643,265 | | | Procter & Gamble Co. | | | | | 80,343,798 | | | | | | 1.1 | | |
| 366,070 | | | Walmart, Inc. | | | | | 43,503,759 | | | | | | 0.6 | | |
| 3,137,622 (2)(3) | | | Other Securities | | | | | 201,438,637 | | | | | | 2.9 | | |
| | | | | | | | | 497,212,829 | | | | | | 7.1 | | |
| | | | Energy: 4.3% | | ||||||||||||
| 487,961 | | | Chevron Corp. | | | | | 58,804,180 | | | | | | 0.8 | | |
| 1,091,846 | | | Exxon Mobil Corp. | | | | | 76,189,014 | | | | | | 1.1 | | |
| 3,858,412 (2) | | | Other Securities | | | | | 165,099,916 | | | | | | 2.4 | | |
| | | | | | | | | 300,093,110 | | | | | | 4.3 | | |
| | | | Financials: 12.8% | | ||||||||||||
| 2,089,087 | | | Bank of America Corp. | | | | | 73,577,644 | | | | | | 1.1 | | |
| 504,760 (1) | | | Berkshire Hathaway, Inc. – Class B |
| | | | 114,328,140 | | | | | | 1.6 | | |
| 563,378 | | | Citigroup, Inc. | | | | | 45,008,269 | | | | | | 0.6 | | |
| 809,377 | | | JPMorgan Chase & Co. | | | | | 112,827,154 | | | | | | 1.6 | | |
| 993,170 | | | Wells Fargo & Co. | | | | | 53,432,546 | | | | | | 0.8 | | |
| 6,451,623 (2)(3) | | | Other Securities | | | | | 495,416,509 | | | | | | 7.1 | | |
| | | | | | | | | 894,590,262 | | | | | | 12.8 | | |
|
Shares
|
| |
Value
|
| |
Percentage
of Net Assets |
| |||||||||
| COMMON STOCK: (continued) | | |||||||||||||||
| | | | Health Care: 14.0% | | ||||||||||||
| 456,081 | | | Abbott Laboratories | | | | $ | 39,615,196 | | | | | | 0.6 | | |
| 381,613 | | | AbbVie, Inc. | | | | | 33,788,015 | | | | | | 0.5 | | |
| 153,331 | | | Amgen, Inc. | | | | | 36,963,504 | | | | | | 0.5 | | |
| 604,922 | | | Bristol-Myers Squibb Co. | | | | | 38,829,943 | | | | | | 0.6 | | |
| 679,160 | | | Johnson & Johnson | | | | | 99,069,069 | | | | | | 1.4 | | |
| 345,888 | | | Medtronic PLC | | | | | 39,240,994 | | | | | | 0.6 | | |
| 656,997 | | | Merck & Co., Inc. | | | | | 59,753,877 | | | | | | 0.8 | | |
| 1,428,092 | | | Pfizer, Inc. | | | | | 55,952,645 | | | | | | 0.8 | | |
| 103,477 | | | Thermo Fisher Scientific, Inc. |
| | | | 33,616,573 | | | | | | 0.5 | | |
| 244,483 | | | UnitedHealth Group, Inc. | | | | | 71,873,112 | | | | | | 1.0 | | |
| 3,709,699 (2)(3) | | | Other Securities | | | | | 472,202,027 | | | | | | 6.7 | | |
| | | | | | | | | 980,904,955 | | | | | | 14.0 | | |
| | | | Industrials: 8.9% | | ||||||||||||
| 137,968 | | | Boeing Co. | | | | | 44,944,456 | | | | | | 0.6 | | |
| 184,387 | | |
Honeywell International, Inc.
|
| | | | 32,636,499 | | | | | | 0.5 | | |
| 179,140 | | | Union Pacific Corp. | | | | | 32,386,721 | | | | | | 0.5 | | |
| 209,361 | | | United Technologies Corp. | | | | | 31,353,903 | | | | | | 0.4 | | |
| 6,433,984 (2)(3) | | | Other Securities | | | | | 483,709,657 | | | | | | 6.9 | | |
| | | | | | | | | 625,031,236 | | | | | | 8.9 | | |
| | | | Information Technology: 22.9% | | ||||||||||||
| 163,768 | | | Accenture PLC | | | | | 34,484,628 | | | | | | 0.5 | | |
| 124,918 (1) | | | Adobe, Inc. | | | | | 41,199,206 | | | | | | 0.6 | | |
| 1,077,799 | | | Apple, Inc. | | | | | 316,495,676 | | | | | | 4.5 | | |
| 102,319 | | | Broadcom, Inc. | | | | | 32,334,850 | | | | | | 0.5 | | |
| 1,094,725 | | | Cisco Systems, Inc. | | | | | 52,503,011 | | | | | | 0.7 | | |
| 1,122,527 | | | Intel Corp. | | | | | 67,183,241 | | | | | | 1.0 | | |
| 229,081 | | | Mastercard, Inc. - Class A | | | | | 68,401,296 | | | | | | 1.0 | | |
| 1,968,630 | | | Microsoft Corp. | | | | | 310,452,951 | | | | | | 4.4 | | |
| 157,928 | | | Nvidia Corp. | | | | | 37,160,458 | | | | | | 0.5 | | |
| 303,003 (1) | | | PayPal Holdings, Inc. | | | | | 32,775,834 | | | | | | 0.5 | | |
| 228,892 (1) | | | Salesforce.com, Inc. | | | | | 37,226,995 | | | | | | 0.5 | | |
| 441,744 | | | Visa, Inc. - Class A | | | | | 83,003,698 | | | | | | 1.2 | | |
| 5,834,466 (2)(3) | | | Other Securities | | | | | 488,850,639 | | | | | | 7.0 | | |
| | | | | | | | | 1,602,072,483 | | | | | | 22.9 | | |
| | | | Materials: 2.6% | | ||||||||||||
| 2,752,971 (2) | | | Other Securities | | | |
|
183,214,481
|
| | | |
|
2.6
|
| |
| | | | Real Estate: 2.9% | | ||||||||||||
| 2,269,971 (2)(3) | | | Other Securities | | | |
|
201,791,053
|
| | | |
|
2.9
|
| |
| | | | Utilities: 3.3% | | ||||||||||||
| 3,103,653 (2) | | | Other Securities | | | |
|
229,027,792
|
| | | |
|
3.3
|
| |
| | | | Total Common Stock (Cost $4,268,478,242) |
| | |
|
6,905,394,427
|
| | | |
|
98.7
|
| |
| | ||||||||||||||||
| Voya U.S. Stock Index Portfolio | as of December 31, 2019 (continued) |
| Principal Amount† |
| |
Value
|
| |
Percentage
of Net Assets |
| |||||||||
| SHORT-TERM INVESTMENTS: 2.4% | | |||||||||||||||
| | | | Commercial Paper: 0.1% | | ||||||||||||
| 825,000 (4) | | | Banco Santander S.A., 1.950%, 02/05/2020 |
| | | $ | 823,517 | | | | | | 0.0 | | |
| 950,000 (4) | | | DBS Bank Ltd., 1.710%, 01/07/2020 |
| | | | 949,701 | | | | | | 0.1 | | |
| 950,000 (4) | | | DBS Bank Ltd., 1.820%, 02/18/2020 |
| | | | 947,688 | | | | | | 0.0 | | |
| 800,000 (4) | | | LMA Americas LLC, 1.810%, 01/23/2020 |
| | | | 798,962 | | | | | | 0.0 | | |
| 900,000 (4) | | | LMA Americas LLC, 2.000%, 01/31/2020 |
| | | | 898,529 | | | | | | 0.0 | | |
| 975,000 (4) | | | Matchpoint Finance PLC, 1.850%, 02/03/2020 |
| | | | 973,347 | | | | | | 0.0 | | |
| 675,000 (4) | | | Nederlandse Waterschapsbank, 1.870%, 02/12/2020 |
| | | | 673,608 | | | | | | 0.0 | | |
| 200,000 (4) | | | Oversea-Chinese Banking Corp., Ltd., 1.900%, 02/11/2020 |
| | | | 199,569 | | | | | | 0.0 | | |
| 250,000 (4) | | | Sheffield Receivables Company LLC, 2.000%, 03/16/2020 |
| | | | 249,021 | | | | | | 0.0 | | |
| 1,276,000 (4) | | | Societe Generale, 1.970%, 01/09/2020 |
| | | | 1,275,426 | | | | | | 0.0 | | |
| | | | Total Commercial Paper (Cost $7,789,368) |
| | |
|
7,789,368
|
| | | |
|
0.1
|
| |
| | | | | | ||||||||||||
| | | | Floating Rate Notes: 0.2% | | ||||||||||||
| 950,000 (4) | | | Australia & New Zealand Banking Group Ltd., 1.940%, 05/20/2020 |
| | | | 949,958 | | | | | | 0.0 | | |
| 825,000 (4) | | | Bank of America Corp., 1.910%, 05/07/2020 |
| | | | 825,000 | | | | | | 0.0 | | |
| 675,000 (4) | | | Bedford Row Funding, 1.960%, 05/18/2020 |
| | | | 675,114 | | | | | | 0.0 | | |
| 950,000 (4) | | | BNP Paribas, 1.950%, 05/14/2020 |
| | | | 950,071 | | | | | | 0.0 | | |
| 1,175,000 (4) | | | Commonwealth Bank of Australia, 1.920%, 01/24/2020 |
| | | | 1,175,150 | | | | | | 0.1 | | |
| 850,000 (4) | | | Commonwealth Bank of Australia, 1.940%, 06/10/2020 |
| | | | 849,998 | | | | | | 0.0 | | |
| 600,000 (4) | | | Coöperatieve Rabobank U.A., 1.980%, 04/20/2020 |
| | | | 600,168 | | | | | | 0.0 | | |
| 1,150,000 (4) | | | Credit Suisse Group AG, 1.890%, 04/17/2020 |
| | | | 1,150,515 | | | | | | 0.0 | | |
| 850,000 (4) | | | Mitsubishi UFJ Financial Group, Inc., 1.970%, 03/18/2020 |
| | | | 850,162 | | | | | | 0.0 | | |
| Principal Amount† |
| |
Value
|
| |
Percentage
of Net Assets |
| |||||||||
| SHORT-TERM INVESTMENTS: (continued) | | |||||||||||||||
| | | | Floating Rate Notes (continued) | | ||||||||||||
| 900,000 (4) | | | Mitsubishi UFJ Financial Group, Inc., 1.980%, 05/26/2020 |
| | | $ | 900,069 | | | | | | 0.0 | | |
| 500,000 (4) | | | Mizuho Financial Group Inc., 1.970%, 05/06/2020 |
| | | | 500,025 | | | | | | 0.0 | | |
| 1,275,000 (4) | | | Mizuho Financial Group Inc., 2.010%, 05/22/2020 |
| | | | 1,275,060 | | | | | | 0.1 | | |
| 925,000 (4) | | | National Bank Of Canada, 1.990%, 05/01/2020 |
| | | | 925,119 | | | | | | 0.0 | | |
| 275,000 (4) | | | Royal Bank Of Canada, 1.860%, 04/29/2020 |
| | | | 275,017 | | | | | | 0.0 | | |
| 925,000 (4) | | | Skandinaviska Enskilda Banken AB, 1.950%, 05/11/2020 |
| | | | 925,030 | | | | | | 0.0 | | |
| 1,375,000 (4) | | | The Sumitomo Mitsui Financial Group, 1.960%, 01/22/2020 |
| | | | 1,375,097 | | | | | | 0.0 | | |
| 400,000 (4) | | | The Sumitomo Mitsui Financial Group, 1.970%, 05/12/2020 |
| | | | 399,933 | | | | | | 0.0 | | |
| 350,000 (4) | | | Toronto-Dominion Bank, 1.850%, 02/13/2020 |
| | | | 350,010 | | | | | | 0.0 | | |
| 500,000 (4) | | | Toyota Motor Corp., 2.020%, 01/10/2020 |
| | | | 500,025 | | | | | | 0.0 | | |
| 600,000 (4) | | | Westpac Banking Corp, 1.830%, 02/10/2020 |
| | | | 600,048 | | | | | | 0.0 | | |
| | | | Total Floating Rate Notes (Cost $16,051,569) |
| | |
|
16,051,569
|
| | | |
|
0.2
|
| |
| | | | | | ||||||||||||
| | | | Repurchase Agreements: 0.7% | | ||||||||||||
| 18,664,895 (4) | | | Bank of Nova Scotia, Repurchase Agreement dated 12/31/19, 1.57%, due 01/02/20 (Repurchase Amount $18,666,501, collateralized by various U.S. Government Agency Obligations, 2.500%-6.500%, Market Value plus accrued interest $19,039,853, due 09/01/24-11/01/49) |
| | | | 18,664,895 | | | | | | 0.3 | | |
| Voya U.S. Stock Index Portfolio | as of December 31, 2019 (continued) |
| Principal Amount† |
| |
Value
|
| |
Percentage
of Net Assets |
| |||||||||
| SHORT-TERM INVESTMENTS: (continued) | | |||||||||||||||
| | | | Repurchase Agreements (continued) | | ||||||||||||
| 3,093,978 (4) | | | Citadel Securities LLC, Repurchase Agreement dated 12/31/19, 1.60%, due 01/02/20 (Repurchase Amount $3,094,249, collateralized by various U.S. Government Securities, 0.000%-8.500%, Market Value plus accrued interest $3,156,138, due 01/15/20-11/15/48) |
| | | $ | 3,093,978 | | | | | | 0.0 | | |
| 18,664,895 (4) | | | Citigroup, Inc., Repurchase Agreement dated 12/31/19, 1.57%, due 01/02/20 (Repurchase Amount $18,666,501, collateralized by various U.S. Government/ U.S. Government Agency Obligations, 0.000%-9.000%, Market Value plus accrued interest $19,038,193, due 02/13/20-09/20/69) |
| | | | 18,664,895 | | | | | | 0.3 | | |
| 5,948,105 (4) | | | State of Wisconsin Investment Board, Repurchase Agreement dated 12/31/19, 1.75%, due 01/02/20 (Repurchase Amount $5,948,675, collateralized by various U.S. Government Securities, 0.125%-3.875%, Market Value plus accrued interest $6,067,231, due 04/15/21-02/15/47) |
| | | | 5,948,105 | | | | | | 0.1 | | |
| | | | Total Repurchase Agreements (Cost $46,371,873) |
| | |
|
46,371,873
|
| | | |
|
0.7
|
| |
| | | | | | ||||||||||||
| | | | Certificates of Deposit: 0.1% | | ||||||||||||
| 1,025,000 (4) | | | Deutscher Sparkassen- und Giroverband, 1.860%, 02/20/2020 |
| | | | 1,025,327 | | | | | | 0.0 | | |
| 400,000 (4) | | | Dz Bank Ag Deutsche Zentral- Genossenschaftsbank, 1.830%, 02/13/2020 |
| | | | 399,968 | | | | | | 0.0 | | |
| 400,000 (4) | | | Landesbank Baden-Wurttemberg, 1.830%, 01/14/2020 |
| | | | 400,016 | | | | | | 0.0 | | |
| Principal Amount† |
| |
Value
|
| |
Percentage
of Net Assets |
| |||||||||
| SHORT-TERM INVESTMENTS: (continued) | | |||||||||||||||
| | | | Certificates of Deposit (continued) | | ||||||||||||
| 900,000 (4) | | | Landesbank Baden-Wurttemberg, 1.830%, 01/16/2020 |
| | | $ | 900,032 | | | | | | 0.1 | | |
| 975,000 (4) | | | The Norinchukin Bank, 1.900%, 03/05/2020 |
| | | | 975,082 | | | | | | 0.0 | | |
| 875,000 (4) | | | Toronto-Dominion Bank, 1.850%, 03/18/2020 |
| | | | 875,132 | | | | | | 0.0 | | |
| | | | Total Certificates of Deposit (Cost $4,575,557) |
| | |
|
4,575,557
|
| | | |
|
0.1
|
| |
| | ||||||||||||||||
|
Shares
|
| |
Value
|
| |
Percentage
of Net Assets |
| |||||||||
| | | | Mutual Funds (4): 1.3% | | ||||||||||||
| 1,940,000 (4) | | | Fidelity Investments Money Market Government Portfolio - Institutional Class, 1.520% |
| | | | 1,940,000 | | | | | | 0.0 | | |
| 89,372,000 (4)(5) | | | Goldman Sachs Financial Square Government Fund - Institutional Shares, 1.500% |
| | | | 89,372,000 | | | | | | 1.3 | | |
| 2,300,000 (4)(5) | | | Invesco Short-Term Investments Trust Government & Agency Portfolio - Institutional Class, 1.510% |
| | | | 2,300,000 | | | | | | 0.0 | | |
| | | | Total Mutual Funds (Cost $93,612,000) |
| | |
|
93,612,000
|
| | | |
|
1.3
|
| |
| | | | Total Short-Term Investments (Cost $168,400,367) |
| | |
|
168,400,367
|
| | | |
|
2.4
|
| |
| | | | Total Investments in Securities (Cost $4,436,878,609) |
| | | $ | 7,073,794,794 | | | | | | 101.1 | | |
| | | | Liabilities in Excess of Other Assets |
| | | | (77,737,403) | | | | | | (1.1) | | |
| | | | Net Assets | | | | $ | 6,996,057,391 | | | | | | 100.0 | | |
| Voya U.S. Stock Index Portfolio | as of December 31, 2019 (continued) |
| | | |
Quoted Prices
in Active Markets for Identical Investments (Level 1) |
| |
Significant
Other Observable Inputs (Level 2) |
| |
Significant
Unobservable Inputs (Level 3) |
| |
Fair Value
at December 31, 2019 |
| ||||||||||||
| Asset Table | | | | | | | | | | | | | | | | | | | | | | | | | |
| Investments, at fair value | | | | | | | | | | | | | | | | | | | | | | | | | |
| Common Stock* | | | | $ | 6,905,394,427 | | | | | $ | — | | | | | $ | — | | | | | $ | 6,905,394,427 | | |
| Short-Term Investments | | | | | 93,612,000 | | | | | | 74,788,367 | | | | | | — | | | | | | 168,400,367 | | |
| Total Investments, at fair value | | | | $ | 6,999,006,427 | | | | | $ | 74,788,367 | | | | | $ | — | | | | | $ | 7,073,794,794 | | |
| Other Financial Instruments+ | | | | | | | | | | | | | | | | | | | | | | | | | |
| Futures | | | | | 1,587,850 | | | | | | — | | | | | | — | | | | | | 1,587,850 | | |
| Total Assets | | | | $ | 7,000,594,277 | | | | | $ | 74,788,367 | | | | | $ | — | | | | | $ | 7,075,382,644 | | |
|
Description
|
| |
Number
of Contracts |
| |
Expiration
Date |
| |
Notional
Value |
| |
Unrealized
Appreciation/ (Depreciation) |
| ||||||||||||
| Long Contracts: | | | | | | | | | | | | | | | | | | | | | | | | | |
| S&P 500® E-Mini | | | | | 617 | | | | | | 03/20/20 | | | | | $ | 99,679,435 | | | | | $ | 1,587,850 | | |
| | | | | | | | | | | | | | | | | $ | 99,679,435 | | | | | $ | 1,587,850 | | |
|
Derivatives not accounted for as hedging instruments
|
| |
Location on Statement
of Assets and Liabilities |
| |
Fair Value
|
| |||
| Asset Derivatives | | | | | | | | | | |
| Equity contracts | | |
Net Assets — Unrealized appreciation*
|
| | | $ | 1,587,850 | | |
|
Total Asset Derivatives
|
| | | | | | $ | 1,587,850 | | |
| | | |
Amount of Realized Gain or (Loss)
on Derivatives Recognized in Income |
| |||
|
Derivatives not accounted for as hedging instruments
|
| |
Futures
|
| |||
| Equity contracts | | | | $ | 13,816,430 | | |
|
Total
|
| | | $ | 13,816,430 | | |
| | |||||||
| Voya U.S. Stock Index Portfolio | as of December 31, 2019 (continued) |
| | | |
Change in Unrealized Appreciation or (Depreciation)
on Derivatives Recognized in Income |
| |||
|
Derivatives not accounted for as hedging instruments
|
| |
Futures
|
| |||
| Equity contracts | | | | $ | 4,136,798 | | |
|
Total
|
| | | $ | 4,136,798 | | |
| | Cost for federal income tax purposes was $4,459,031,288. | | | |||||
| | Net unrealized appreciation consisted of: | | | |||||
| |
Gross Unrealized Appreciation
|
| | | $ | 2,770,425,217 | | |
| |
Gross Unrealized Depreciation
|
| | | | (154,073,861) | | |
| |
Net Unrealized Appreciation
|
| | | $ | 2,616,351,356 | | |
| VY® Clarion Real Estate Portfolio | as of December 31, 2019 |
|
Shares
|
| |
Value
|
| |
Percentage
of Net Assets |
| |||||||||
| COMMON STOCK: 98.8% | | |||||||||||||||
| | | | Diversified REITs: 5.9% | | ||||||||||||
| 204,920 | | | STORE Capital Corp. | | | | $ | 7,631,221 | | | | | | 2.3 | | |
| 1,295,226 | | | VEREIT, Inc. | | | | | 11,967,888 | | | | | | 3.6 | | |
| | | | | | | | | 19,599,109 | | | | | | 5.9 | | |
| | | | | | ||||||||||||
| | | | Health Care REITs: 10.5% | | ||||||||||||
| 356,989 (1) | | | Healthcare Trust of America, Inc. |
| | | | 10,809,627 | | | | | | 3.2 | | |
| 400,303 | | |
Healthpeak Properties, Inc.
|
| | | | 13,798,444 | | | | | | 4.1 | | |
| 252,097 | | | Medical Properties Trust, Inc. |
| | | | 5,321,768 | | | | | | 1.6 | | |
| 64,574 | | | Welltower, Inc. | | | | | 5,280,862 | | | | | | 1.6 | | |
| | | | | | | | | 35,210,701 | | | | | | 10.5 | | |
| | | | | | ||||||||||||
| | | | Hotel & Resort REITs: 5.9% | | ||||||||||||
| 429,034 | | |
Host Hotels & Resorts, Inc.
|
| | | | 7,958,581 | | | | | | 2.4 | | |
| 191,663 | | | MGM Growth Properties LLC |
| | | | 5,935,803 | | | | | | 1.8 | | |
| 25,596 | | | Ryman Hospitality Properties |
| | | | 2,218,149 | | | | | | 0.6 | | |
| 258,783 | | | Sunstone Hotel Investors, Inc. |
| | | | 3,602,259 | | | | | | 1.1 | | |
| | | | | | | | | 19,714,792 | | | | | | 5.9 | | |
| | | | | | ||||||||||||
| | | | Industrial REITs: 12.1% | | ||||||||||||
| 60,554 | | | Americold Realty Trust | | | | | 2,123,023 | | | | | | 0.6 | | |
| 273,685 | | | Duke Realty Corp. | | | | | 9,488,659 | | | | | | 2.9 | | |
| 271,020 | | | ProLogis, Inc. | | | | | 24,158,723 | | | | | | 7.2 | | |
| 148,187 | | | STAG Industrial, Inc. | | | | | 4,678,264 | | | | | | 1.4 | | |
| | | | | | | | | 40,448,669 | | | | | | 12.1 | | |
| | | | | | ||||||||||||
| | | | IT Consulting & Other Services: 0.8% | | ||||||||||||
| 30,157 (2) | | | InterXion Holding NV | | | |
|
2,527,458
|
| | | |
|
0.8
|
| |
| | | | | | ||||||||||||
| | | | Office REITs: 14.7% | | ||||||||||||
| 65,527 | | | Alexandria Real Estate Equities, Inc. |
| | | | 10,587,853 | | | | | | 3.2 | | |
| 280,275 | | | Brandywine Realty Trust | | | | | 4,414,331 | | | | | | 1.3 | | |
| 217,644 | | | Columbia Property Trust, Inc. |
| | | | 4,550,936 | | | | | | 1.3 | | |
| 188,244 | | | Cousins Properties, Inc. | | | | | 7,755,653 | | | | | | 2.3 | | |
| 263,396 | | | Hudson Pacific Properties, Inc. |
| | | | 9,916,859 | | | | | | 3.0 | | |
| 252,028 | | | Piedmont Office Realty Trust, Inc. |
| | | | 5,605,103 | | | | | | 1.7 | | |
| 96,460 | | | Vornado Realty Trust | | | | | 6,414,590 | | | | | | 1.9 | | |
| | | | | | | | | 49,245,325 | | | | | | 14.7 | | |
|
Shares
|
| |
Value
|
| |
Percentage
of Net Assets |
| |||||||||
| COMMON STOCK: (continued) | | |||||||||||||||
| | | | Residential REITs: 18.4% | | ||||||||||||
| 142,308 | | | American Campus Communities, Inc. |
| | | $ | 6,692,745 | | | | | | 2.0 | | |
| 89,269 | | | Camden Property Trust | | | | | 9,471,441 | | | | | | 2.8 | | |
| 224,591 | | | Equity Residential | | | | | 18,173,904 | | | | | | 5.4 | | |
| 177,910 | | | Front Yard Residential Corp. |
| | | | 2,195,409 | | | | | | 0.7 | | |
| 420,451 | | | Invitation Homes, Inc. | | | | | 12,600,916 | | | | | | 3.8 | | |
| 51,985 | | | Mid-America Apartment Communities, Inc. |
| | | | 6,854,742 | | | | | | 2.1 | | |
| 35,696 | | | Sun Communities, Inc. | | | | | 5,357,970 | | | | | | 1.6 | | |
| | | | | | | | | 61,347,127 | | | | | | 18.4 | | |
| | | | | | ||||||||||||
| | | | Retail REITs: 11.4% | | ||||||||||||
| 389,068 | | | Brixmor Property Group, Inc. |
| | | | 8,407,760 | | | | | | 2.5 | | |
| 40,011 | | | Regency Centers Corp. | | | | | 2,524,294 | | | | | | 0.8 | | |
| 330,871 | | | Retail Properties of America, Inc. |
| | | | 4,433,671 | | | | | | 1.3 | | |
| 80,583 | | |
Simon Property Group, Inc.
|
| | | | 12,003,644 | | | | | | 3.6 | | |
| 62,628 | | | Spirit Realty Capital, Inc. | | | | | 3,080,045 | | | | | | 0.9 | | |
| 117,715 | | | Taubman Centers, Inc. | | | | | 3,659,759 | | | | | | 1.1 | | |
| 214,000 | | | Urban Edge Properties | | | | | 4,104,520 | | | | | | 1.2 | | |
| | | | | | | | | 38,213,693 | | | | | | 11.4 | | |
| | | | | | ||||||||||||
| | | | Specialized REITs: 19.1% | | ||||||||||||
| 42,046 | | | Crown Castle International Corp. |
| | | | 5,976,839 | | | | | | 1.8 | | |
| 323,239 | | | CubeSmart | | | | | 10,175,564 | | | | | | 3.1 | | |
| 90,538 | | | CyrusOne, Inc. | | | | | 5,923,901 | | | | | | 1.8 | | |
| 30,771 | | | Equinix, Inc. | | | | | 17,961,033 | | | | | | 5.4 | | |
| 25,566 | | | Extra Space Storage, Inc. | | | | | 2,700,281 | | | | | | 0.8 | | |
| 46,300 | | | Life Storage, Inc. | | | | | 5,013,364 | | | | | | 1.5 | | |
| 94,022 | | | QTS Realty Trust, Inc. | | | | | 5,102,574 | | | | | | 1.5 | | |
| 423,308 | | | VICI Properties, Inc. | | | | | 10,815,519 | | | | | | 3.2 | | |
| | | | | | | | | 63,669,075 | | | | | | 19.1 | | |
| | | | Total Common Stock (Cost $293,950,748) |
| | |
|
329,975,949
|
| | | |
|
98.8
|
| |
| | ||||||||||||||||
| VY® Clarion Real Estate Portfolio | as of December 31, 2019 (continued) |
| Principal Amount† |
| |
Value
|
| |
Percentage
of Net Assets |
| |||||||||
| SHORT-TERM INVESTMENTS: 2.2% | | |||||||||||||||
| | | | Repurchase Agreements: 1.7% | | ||||||||||||
| 1,280,279 (3) | | | Bank of Montreal, Repurchase Agreement dated 12/31/19, 1.57%, due 01/02/20 (Repurchase Amount $1,280,389, collateralized by various U.S. Government Agency Obligations, 2.500%-5.000%, Market Value plus accrued interest $1,305,885, due 04/20/49-12/01/49) |
| | | $ | 1,280,279 | | | | | | 0.4 | | |
| 379,314 (3) | | | Citadel Securities LLC, Repurchase Agreement dated 12/31/19, 1.60%, due 01/02/20 (Repurchase Amount $379,347, collateralized by various U.S. Government Securities, 0.000%-8.500%, Market Value plus accrued interest $386,935, due 01/15/20-11/15/48) |
| | | | 379,314 | | | | | | 0.1 | | |
| 1,280,279 (3) | | | Citigroup, Inc., Repurchase Agreement dated 12/31/19, 1.57%, due 01/02/20 (Repurchase Amount $1,280,389, collateralized by various U.S. Government/U.S. Government Agency Obligations, 0.000%-9.000%, Market Value plus accrued interest $1,305,885, due 02/13/20-09/20/69) |
| | | | 1,280,279 | | | | | | 0.4 | | |
| 1,280,279 (3) | | | HSBC Securities USA, Repurchase Agreement dated 12/31/19, 1.57%, due 01/02/20 (Repurchase Amount $1,280,389, collateralized by various U.S. Government Agency Obligations, 3.000%-4.000%, Market Value plus accrued interest $1,305,885, due 07/20/47-06/20/48) |
| | | | 1,280,279 | | | | | | 0.4 | | |
| Principal Amount† |
| |
Value
|
| |
Percentage
of Net Assets |
| |||||||||
| SHORT-TERM INVESTMENTS: (continued) | | |||||||||||||||
| | | | Repurchase Agreements | | ||||||||||||
| 1,280,279 (3) | | | Jefferies LLC, Repurchase Agreement dated 12/31/19, 1.58%, due 01/02/20 (Repurchase Amount $1,280,390, collateralized by various U.S. Government Securities, 0.000%-2.875%, Market Value plus accrued interest $1,305,885, due 01/28/20-05/15/27) |
| | | $ | 1,280,279 | | | | | | 0.4 | | |
| | | | Total Repurchase Agreements (Cost $5,500,430) |
| | |
|
5,500,430
|
| | | |
|
1.7
|
| |
| | ||||||||||||||||
|
Shares
|
| |
Value
|
| |
Percentage
of Net Assets |
| |||||||||
| | | | Mutual Funds: 0.5% | | ||||||||||||
| 1,762,979 (4) | | | BlackRock Liquidity Funds, FedFund, Institutional Class, 1.520% (Cost $1,762,979) |
| | |
|
1,762,979
|
| | | |
|
0.5
|
| |
| | | | Total Short-Term Investments (Cost $7,263,409) |
| | |
|
7,263,409
|
| | | |
|
2.2
|
| |
| | | | Total Investments in Securities (Cost $301,214,157) |
| | | $ | 337,239,358 | | | | | | 101.0 | | |
| | | | Liabilities in Excess of Other Assets |
| | | | (3,214,013) | | | | | | (1.0) | | |
| | | | Net Assets | | | | $ | 334,025,345 | | | | | | 100.0 | | |
| VY® Clarion Real Estate Portfolio | as of December 31, 2019 (continued) |
| | | |
Quoted Prices
in Active Markets for Identical Investments (Level 1) |
| |
Significant
Other Observable Inputs (Level 2) |
| |
Significant
Unobservable Inputs (Level 3) |
| |
Fair Value
at December 31, 2019 |
| ||||||||||||
| Asset Table | | | | | | | | | | | | | | | | | | | | | | | | | |
| Investments, at fair value | | | | | | | | | | | | | | | | | | | | | | | | | |
| Common Stock* | | | | $ | 329,975,949 | | | | | $ | — | | | | | $ | — | | | | | $ | 329,975,949 | | |
| Short-Term Investments | | | | | 1,762,979 | | | | | | 5,500,430 | | | | | | — | | | | | | 7,263,409 | | |
| Total Investments, at fair value | | | | $ | 331,738,928 | | | | | $ | 5,500,430 | | | | | $ | — | | | | | $ | 337,239,358 | | |
| | Cost for federal income tax purposes was $305,827,143. | | | | | | | |
| | Net unrealized appreciation consisted of: | | | |||||
| |
Gross Unrealized Appreciation
|
| | | $ | 40,842,678 | | |
| |
Gross Unrealized Depreciation
|
| | | | (9,430,463) | | |
| |
Net Unrealized Appreciation
|
| | | $ | 31,412,215 | | |
| VY® JPMorgan Small Cap | SUMMARY PORTFOLIO OF INVESTMENTS |
| Core Equity Portfolio | as of December 31, 2019 |
|
Shares
|
| |
Value
|
| |
Percentage
of Net Assets |
| |||||||||
| COMMON STOCK: 96.6% | | |||||||||||||||
| | | | Communication Services: 2.2% | | ||||||||||||
| 101,970 | | | Cinemark Holdings, Inc. | | | | $ | 3,451,685 | | | | | | 0.7 | | |
| 467,342 (1) | | | Other Securities | | | | | 8,367,338 | | | | | | 1.5 | | |
| | | | | | | | | 11,819,023 | | | | | | 2.2 | | |
| | | | Consumer Discretionary: 9.6% | | ||||||||||||
| 76,137 | | | Brunswick Corp. | | | | | 4,566,697 | | | | | | 0.8 | | |
| 17,650 (2) | | | Deckers Outdoor Corp. | | | | | 2,980,379 | | | | | | 0.5 | | |
| 36,913 | | | LCI Industries | | | | | 3,954,490 | | | | | | 0.7 | | |
| 34,918 | | | Pool Corp. | | | | | 7,415,885 | | | | | | 1.4 | | |
| 95,600 | | | Rent-A-Center, Inc. | | | | | 2,757,104 | | | | | | 0.5 | | |
| 1,249,243 (1)(3) | | | Other Securities | | | | | 31,157,734 | | | | | | 5.7 | | |
| | | | | | | | | 52,832,289 | | | | | | 9.6 | | |
| | | | Consumer Staples: 3.3% | | ||||||||||||
| 178,961 (2) | | | Performance Food Group Co. |
| | | | 9,212,912 | | | | | | 1.7 | | |
| 341,870 (1) | | | Other Securities | | | | | 8,993,035 | | | | | | 1.6 | | |
| | | | | | | | | 18,205,947 | | | | | | 3.3 | | |
| | | | Energy: 2.2% | | ||||||||||||
| 1,557,898 (1)(3) | | | Other Securities | | | |
|
12,281,539
|
| | | |
|
2.2
|
| |
| | | | | | ||||||||||||
| | | | Financials: 17.7% | | ||||||||||||
| 80,009 | | | BankUnited, Inc. | | | | | 2,925,129 | | | | | | 0.5 | | |
| 51,520 (4) | | | Commerce Bancshares, Inc. |
| | | | 3,500,269 | | | | | | 0.6 | | |
| 52,900 | | | Essent Group Ltd. | | | | | 2,750,271 | | | | | | 0.5 | | |
| 122,706 | | | First Hawaiian, Inc. | | | | | 3,540,068 | | | | | | 0.7 | | |
| 306,204 | | | First Horizon National Corp. |
| | | | 5,070,738 | | | | | | 0.9 | | |
| 108,113 (2) | | | Focus Financial Partners, Inc. |
| | | | 3,186,090 | | | | | | 0.6 | | |
| 52,007 | | | Iberiabank Corp. | | | | | 3,891,684 | | | | | | 0.7 | | |
| 35,103 | | |
Kinsale Capital Group, Inc.
|
| | | | 3,568,571 | | | | | | 0.7 | | |
| 72,262 | | | Lazard Ltd. | | | | | 2,887,589 | | | | | | 0.5 | | |
| 37,544 | | | RLI Corp. | | | | | 3,379,711 | | | | | | 0.6 | | |
| 64,068 | | |
Western Alliance Bancorp.
|
| | | | 3,651,876 | | | | | | 0.7 | | |
| 63,842 | | | Wintrust Financial Corp. | | | | | 4,526,398 | | | | | | 0.8 | | |
| 1,965,066 (1)(3) | | | Other Securities | | | | | 53,920,308 | | | | | | 9.9 | | |
| | | | | | | | | 96,798,702 | | | | | | 17.7 | | |
| | | | Health Care: 14.3% | | ||||||||||||
| 89,934 (2) | | | Catalent, Inc. | | | | | 5,063,284 | | | | | | 0.9 | | |
| 72,116 | | | Encompass Health Corp. | | | | | 4,995,475 | | | | | | 0.9 | | |
| 40,533 (2) | | | Molina Healthcare, Inc. | | | | | 5,499,923 | | | | | | 1.0 | | |
| 72,800 (2) | | | Tenet Healthcare Corp. | | | | | 2,768,584 | | | | | | 0.5 | | |
| 28,996 | | | West Pharmaceutical Services, Inc. |
| | | | 4,358,969 | | | | | | 0.8 | | |
| 2,821,945 (1)(3) | | | Other Securities | | | | | 55,983,676 | | | | | | 10.2 | | |
| | | | | | | | | 78,669,911 | | | | | | 14.3 | | |
| | | | Industrials: 20.0% | | ||||||||||||
| 76,295 | | | Altra Industrial Motion Corp. |
| | | | 2,762,642 | | | | | | 0.5 | | |
| 52,663 | | | Applied Industrial Technologies, Inc. |
| | | | 3,512,096 | | | | | | 0.6 | | |
|
Shares
|
| |
Value
|
| |
Percentage
of Net Assets |
| |||||||||
| COMMON STOCK: (continued) | | |||||||||||||||
| | | | Industrials (continued) | | ||||||||||||
| 66,497 | | | Brady Corp. | | | | $ | 3,807,618 | | | | | | 0.7 | | |
| 32,800 | | | EMCOR Group, Inc. | | | | | 2,830,640 | | | | | | 0.5 | | |
| 47,510 | | | Fortune Brands Home & Security, Inc. |
| | | | 3,104,303 | | | | | | 0.6 | | |
| 35,399 (2) | | | Generac Holdings, Inc. | | | | | 3,560,785 | | | | | | 0.6 | | |
| 69,712 (2) | | | IAA, Inc. | | | | | 3,280,647 | | | | | | 0.6 | | |
| 78,577 | | | Knight-Swift Transportation Holdings, Inc. |
| | | | 2,816,200 | | | | | | 0.5 | | |
| 45,618 | | | Lincoln Electric Holdings, Inc. |
| | | | 4,412,629 | | | | | | 0.8 | | |
| 34,194 | | | MSA Safety, Inc. | | | | | 4,320,754 | | | | | | 0.8 | | |
| 24,545 (2) | | | RBC Bearings, Inc. | | | | | 3,886,455 | | | | | | 0.7 | | |
| 95,723 | | | Toro Co. | | | | | 7,626,251 | | | | | | 1.4 | | |
| 192,946 (2) | | | Willscot Corp. | | | | | 3,567,572 | | | | | | 0.7 | | |
| 32,645 | | | Woodward, Inc. | | | | | 3,866,474 | | | | | | 0.7 | | |
| 2,103,931 (1)(3) | | | Other Securities | | | | | 56,186,253 | | | | | | 10.3 | | |
| | | | | | | | | 109,541,319 | | | | | | 20.0 | | |
| | | | Information Technology: 12.2% | | ||||||||||||
| 23,058 (2) | | | Aspen Technology, Inc. | | | | | 2,788,404 | | | | | | 0.5 | | |
| 26,726 | | | Cabot Microelectronics Corp. |
| | | | 3,857,096 | | | | | | 0.7 | | |
| 64,859 (2) | | | Cornerstone OnDemand, Inc. |
| | | | 3,797,494 | | | | | | 0.7 | | |
| 41,912 (2) | | | Q2 Holdings, Inc. | | | | | 3,398,225 | | | | | | 0.6 | | |
| 1,996,276 (1)(3) | | | Other Securities | | | | | 52,912,674 | | | | | | 9.7 | | |
| | | | | | | | | 66,753,893 | | | | | | 12.2 | | |
| | | | Materials: 5.4% | | ||||||||||||
| 57,533 | | | Aptargroup, Inc. | | | | | 6,651,965 | | | | | | 1.2 | | |
| 20,029 | | | Quaker Chemical Corp. | | | | | 3,295,171 | | | | | | 0.6 | | |
| 731,887 (1) | | | Other Securities | | | | | 19,695,863 | | | | | | 3.6 | | |
| | | | | | | | | 29,642,999 | | | | | | 5.4 | | |
| | | | Real Estate: 6.8% | | ||||||||||||
| 95,131 | | | CubeSmart | | | | | 2,994,724 | | | | | | 0.6 | | |
| 154,611 (2) | | |
Cushman & Wakefield PLC
|
| | | | 3,160,249 | | | | | | 0.6 | | |
| 38,478 | | |
EastGroup Properties, Inc.
|
| | | | 5,104,876 | | | | | | 0.9 | | |
| 71,003 | | | National Retail Properties, Inc. |
| | | | 3,807,181 | | | | | | 0.7 | | |
| 1,027,302 (3) | | | Other Securities | | | | | 21,976,787 | | | | | | 4.0 | | |
| | | | | | | | | 37,043,817 | | | | | | 6.8 | | |
| | | | Utilities: 2.9% | | ||||||||||||
| 53,512 | | | NorthWestern Corp. | | | | | 3,835,205 | | | | | | 0.7 | | |
| 96,991 | | | Portland General Electric Co. |
| | | | 5,411,128 | | | | | | 1.0 | | |
| 316,544 (1) | | | Other Securities | | | | | 6,642,823 | | | | | | 1.2 | | |
| | | | | | | | | 15,889,156 | | | | | | 2.9 | | |
| | | | Total Common Stock (Cost $444,089,002) |
| | |
|
529,478,595
|
| | | |
|
96.6
|
| |
| | ||||||||||||||||
| VY® JPMorgan Small Cap | SUMMARY PORTFOLIO OF INVESTMENTS |
| Core Equity Portfolio | as of December 31, 2019 (continued) |
| Principal Amount† |
| |
Value
|
| |
Percentage
of Net Assets |
| |||||||||
| SHORT-TERM INVESTMENTS: 6.5% | | |||||||||||||||
| | | | Repurchase Agreements: 2.8% | | ||||||||||||
| 3,813,206 (5) | | | Cantor Fitzgerald Securities, Repurchase Agreement dated 12/31/19, 1.58%, due 01/02/20 (Repurchase Amount $3,813,536, collateralized by various U.S. Government/U.S. Government Agency Obligations, 0.000%-8.500%, Market Value plus accrued interest $3,889,470, due 01/25/20-10/15/60) |
| | | $ | 3,813,206 | | | | | | 0.7 | | |
| 3,552,930 (5) | | | Citadel Securities LLC, Repurchase Agreement dated 12/31/19, 1.60%, due 01/02/20 (Repurchase Amount $3,553,241, collateralized by various U.S. Government Securities, 0.000%-8.500%, Market Value plus accrued interest $3,624,311, due 01/15/20-11/15/48) |
| | | | 3,552,930 | | | | | | 0.7 | | |
| 3,813,206 (5) | | | Citigroup, Inc., Repurchase Agreement dated 12/31/19, 1.57%, due 01/02/20 (Repurchase Amount $3,813,534, collateralized by various U.S. Government/U.S. Government Agency Obligations, 0.000%-9.000%, Market Value plus accrued interest $3,889,470, due 02/13/20-09/20/69) |
| | | | 3,813,206 | | | | | | 0.7 | | |
| 3,813,206 (5) | | | RBC Dominion Securities Inc., Repurchase Agreement dated 12/31/19, 1.57%, due 01/02/20 (Repurchase Amount $3,813,534, collateralized by various U.S. Government/U.S. Government Agency Obligations, 0.000%-6.500%, Market Value plus accrued interest $3,889,470, due 06/30/21-12/01/49) |
| | | | 3,813,206 | | | | | | 0.7 | | |
| Principal Amount† |
| |
Value
|
| |
Percentage
of Net Assets |
| |||||||||
| SHORT-TERM INVESTMENTS: (continued) | | |||||||||||||||
| | | | Repurchase Agreements (continued) | | ||||||||||||
| | | | Total Repurchase Agreements (Cost $14,992,548) |
| | |
$
|
14,992,548
|
| | | |
|
2.8
|
| |
| | ||||||||||||||||
|
Shares
|
| |
Value
|
| |
Percentage
of Net Assets |
| |||||||||
| | | | Mutual Funds: 3.7% | | ||||||||||||
| 19,015,743 (6) | | | BlackRock Liquidity Funds, FedFund, Institutional Class, 1.520% |
| | | | 19,015,743 | | | | | | 3.5 | | |
| 130,000 (5)(6) | | | Goldman Sachs Financial Square Government Fund - Institutional Shares, 1.500% |
| | | | 130,000 | | | | | | 0.0 | | |
| 640,000 (5)(6) | | | Invesco Short-Term Investments Trust Government & Agency Portfolio - Institutional Class, 1.510% |
| | | | 640,000 | | | | | | 0.1 | | |
| 620,000 (5)(6) | | | Morgan Stanley Institutional Liquidity Funds - Government Portfolio (Institutional Share Class), 1.510% |
| | | | 620,000 | | | | | | 0.1 | | |
| | | | Total Mutual Funds (Cost $20,405,743) |
| | |
|
20,405,743
|
| | | |
|
3.7
|
| |
| | | | Total Short-Term Investments (Cost $35,398,291) |
| | |
|
35,398,291
|
| | | |
|
6.5
|
| |
| | | | Total Investments in Securities (Cost $479,487,293) |
| | | $ | 564,876,886 | | | | | | 103.1 | | |
| | | | Liabilities in Excess of Other Assets |
| | | | (16,902,036) | | | | | | (3.1) | | |
| | | | Net Assets | | | | $ | 547,974,850 | | | | | | 100.0 | | |
| VY® JPMorgan Small Cap | SUMMARY PORTFOLIO OF INVESTMENTS |
| Core Equity Portfolio | as of December 31, 2019 (continued) |
| | | |
Quoted Prices
in Active Markets for Identical Investments (Level 1) |
| |
Significant
Other Observable Inputs (Level 2) |
| |
Significant
Unobservable Inputs (Level 3) |
| |
Fair Value
at December 31, 2019 |
| ||||||||||||
| Asset Table | | | | | | | | | | | | | | | | | | | | | | | | | |
| Investments, at fair value | | | | | | | | | | | | | | | | | | | | | | | | | |
| Common Stock* | | | | $ | 529,478,595 | | | | | $ | — | | | | | $ | — | | | | | $ | 529,478,595 | | |
| Short-Term Investments | | | | | 20,405,743 | | | | | | 14,992,548 | | | | | | — | | | | | | 35,398,291 | | |
| Total Investments, at fair value | | | | $ | 549,884,338 | | | | | $ | 14,992,548 | | | | | $ | — | | | | | $ | 564,876,886 | | |
| Other Financial Instruments+ | | | | | | | | | | | | | | | | | | | | | | | | | |
| Futures | | | | | 92,816 | | | | | | — | | | | | | — | | | | | | 92,816 | | |
| Total Assets | | | | $ | 549,977,154 | | | | | $ | 14,992,548 | | | | | $ | — | | | | | $ | 564,969,702 | | |
|
Description
|
| |
Number
of Contracts |
| |
Expiration
Date |
| |
Notional
Value |
| |
Unrealized
Appreciation/ (Depreciation) |
| ||||||||||||
| Long Contracts: | | | | | | | | | | | | | | | | | | | | | | | | | |
| E-mini Russell 2000® Index | | | | | 123 | | | | | | 03/20/20 | | | | | $ | 10,274,190 | | | | | $ | 92,816 | | |
| | | | | | | | | | | | | | | | | $ | 10,274,190 | | | | | $ | 92,816 | | |
|
Derivatives not accounted for as hedging instruments
|
| |
Location on Statement
of Assets and Liabilities |
| |
Fair Value
|
| |||
| Asset Derivatives | | | | | | | | | | |
| Equity contracts | | |
Net Assets — Unrealized appreciation*
|
| | | $ | 92,816 | | |
|
Total Asset Derivatives
|
| | | | | | $ | 92,816 | | |
| | | |
Amount of Realized Gain or (Loss)
on Derivatives Recognized in Income |
| |||
|
Derivatives not accounted for as hedging instruments
|
| |
Futures
|
| |||
| Equity contracts | | | | $ | 971,535 | | |
|
Total
|
| | | $ | 971,535 | | |
| | |||||||
| | | |
Change in Unrealized Appreciation or (Depreciation)
on Derivatives Recognized in Income |
| |||
|
Derivatives not accounted for as hedging instruments
|
| |
Futures
|
| |||
| Equity contracts | | | | $ | 480,781 | | |
|
Total
|
| | | $ | 480,781 | | |
| VY® JPMorgan Small Cap | SUMMARY PORTFOLIO OF INVESTMENTS |
| Core Equity Portfolio | as of December 31, 2019 (continued) |
| | Cost for federal income tax purposes was $483,273,163. | | ||||||
| | Net unrealized appreciation consisted of: | | ||||||
| |
Gross Unrealized Appreciation
|
| | | $ | 109,207,385 | | |
| |
Gross Unrealized Depreciation
|
| | | | (27,510,847) | | |
| |
Net Unrealized Appreciation
|
| | | $ | 81,696,538 | | |
|
Portfolio Name
|
| |
Type
|
| |
Per Share
Amount |
| |||
| Voya Balanced Income Portfolio | | |||||||||
|
Class ADV
|
| |
NII
|
| | | $ | 0.4969 | | |
|
Class I
|
| |
NII
|
| | | $ | 0.5656 | | |
|
Class S
|
| |
NII
|
| | | $ | 0.5331 | | |
|
Class S2
|
| |
NII
|
| | | $ | 0.5166 | | |
|
All Classes
|
| |
LTCG
|
| | | $ | 0.6712 | | |
| Voya High Yield Portfolio | | |||||||||
|
Class ADV
|
| |
NII
|
| | | $ | 0.4766 | | |
|
Class I
|
| |
NII
|
| | | $ | 0.5351 | | |
|
Class S
|
| |
NII
|
| | | $ | 0.5106 | | |
|
Class S2
|
| |
NII
|
| | | $ | 0.4967 | | |
| Voya Large Cap Growth Portfolio | | |||||||||
|
Class ADV
|
| |
NII
|
| | | $ | 0.0167 | | |
|
Class I
|
| |
NII
|
| | | $ | 0.1398 | | |
|
Class R6
|
| |
NII
|
| | | $ | 0.1400 | | |
|
Class S
|
| |
NII
|
| | | $ | 0.0845 | | |
|
Class S2
|
| |
NII
|
| | | $ | 0.0544 | | |
|
All Classes
|
| |
STCG
|
| | | $ | 0.2540 | | |
|
All Classes
|
| |
LTCG
|
| | | $ | 3.0980 | | |
| Voya Large Cap Value Portfolio | | |||||||||
|
Class ADV
|
| |
NII
|
| | | $ | 0.1786 | | |
|
Class I
|
| |
NII
|
| | | $ | 0.2497 | | |
|
Class R6
|
| |
NII
|
| | | $ | 0.2489 | | |
|
Class S
|
| |
NII
|
| | | $ | 0.2191 | | |
|
Class S2
|
| |
NII
|
| | | $ | 0.1972 | | |
|
All Classes
|
| |
LTCG
|
| | | $ | 0.8519 | | |
|
Portfolio Name
|
| |
Type
|
| |
Per Share
Amount |
| |||
| Voya Limited Maturity Bond Portfolio | | |||||||||
|
Class ADV
|
| |
NII
|
| | | $ | 0.1225 | | |
|
Class I
|
| |
NII
|
| | | $ | 0.1852 | | |
|
Class S
|
| |
NII
|
| | | $ | 0.1614 | | |
| Voya U.S. Stock Index Portfolio | | |||||||||
|
Class ADV
|
| |
NII
|
| | | $ | 0.1732 | | |
|
Class I
|
| |
NII
|
| | | $ | 0.2566 | | |
|
Class P2
|
| |
NII
|
| | | $ | 0.2566 | | |
|
Class S
|
| |
NII
|
| | | $ | 0.2489 | | |
|
Class S2
|
| |
NII
|
| | | $ | 0.1894 | | |
|
All Classes
|
| |
LTCG
|
| | | $ | 0.9024 | | |
| VY® Clarion Real Estate Portfolio | | |||||||||
|
Class ADV
|
| |
NII
|
| | | $ | 0.6325 | | |
|
Class I
|
| |
NII
|
| | | $ | 0.8540 | | |
|
Class S
|
| |
NII
|
| | | $ | 0.7574 | | |
|
Class S2
|
| |
NII
|
| | | $ | 0.6983 | | |
|
All Classes
|
| |
LTCG
|
| | | $ | 0.1758 | | |
| VY® JPMorgan Small Cap Core Equity Portfolio | | |||||||||
|
Class ADV
|
| |
NII
|
| | | $ | 0.0271 | | |
|
Class I
|
| |
NII
|
| | | $ | 0.2222 | | |
|
Class R6
|
| |
NII
|
| | | $ | 0.2222 | | |
|
Class S
|
| |
NII
|
| | | $ | 0.1264 | | |
|
Class S2
|
| |
NII
|
| | | $ | 0.0671 | | |
|
All Classes
|
| |
STCG
|
| | | $ | 0.2842 | | |
|
All Classes
|
| |
LTCG
|
| | | $ | 4.2653 | | |
|
All Classes
|
| |
ROC
|
| | | $ | 0.2253 | | |
| |
Voya Balanced Income Portfolio
|
| | | | 25.36% | | |
| |
Voya Large Cap Growth Portfolio
|
| | | | 78.58% | | |
| |
Voya Large Cap Value Portfolio
|
| | | | 100.00% | | |
| |
Voya U.S. Stock Index Portfolio
|
| | | | 93.84% | | |
| |
VY® JPMorgan Small Cap Core Equity Portfolio
|
| | | | 83.08% | | |
| |
Voya Balanced Income Portfolio
|
| | | $ | 22,330,665 | | |
| |
Voya Large Cap Growth Portfolio
|
| | | $ | 861,560,330 | | |
| |
Voya Large Cap Value Portfolio
|
| | | $ | 75,474,848 | | |
| |
Voya U.S. Stock Index Portfolio
|
| | | $ | 350,050,354 | | |
| |
VY® Clarion Real Estate Portfolio
|
| | | $ | 1,619,442 | | |
| |
VY® JPMorgan Small Cap Core Equity Portfolio
|
| | | $ | 175,897,372 | | |
| |
Name, Address and Age
|
| |
Position(s)
Held with the Trust |
| |
Term of Office and
Length of Time Served(1) |
| |
Principal
Occupation(s) – During the Past 5 Years |
| |
Number of
Funds in Fund Complex Overseen by Trustee(2) |
| |
Other Board Positions
Held by Trustee |
|
| | Independent Trustees*: | | | | | | | | | | | | | | | | |
| | Colleen D. Baldwin 7337 East Doubletree Ranch Rd. Suite 100 Scottsdale, Arizona 85258 Age: 59 |
| | Trustee Chairperson |
| |
November 2007 –
Present January 2020 –
Present |
| | President, Glantuam Partners, LLC, a business consulting firm (January 2009 – Present). | | |
146
|
| | Dentaquest (February 2014 – Present); RSR Partners, Inc. (2016 – Present). | |
| | John V. Boyer 7337 East Doubletree Ranch Rd. Suite 100 Scottsdale, Arizona 85258 Age: 66 |
| | Trustee | | | January 2005 – Present |
| | Retired. Formerly, President and Chief Executive Officer, Bechtler Arts Foundation, an arts and education foundation (January 2008 – December 2019). | | |
146
|
| | None. | |
| | Patricia W. Chadwick 7337 East Doubletree Ranch Rd. Suite 100 Scottsdale, Arizona 85258 Age: 71 |
| | Trustee | | | January 2006 – Present |
| | Consultant and President, Ravengate Partners LLC, a consulting firm that provides advice regarding financial markets and the global economy (January 2000 – Present). | | |
146
|
| | Wisconsin Energy Corporation (June 2006 – Present); The Royce Fund (22 funds) (December 2009 – Present); and AMICA Mutual Insurance Company (1992 – Present). | |
| | Martin J. Gavin 7337 East Doubletree Ranch Rd. Suite 100 Scottsdale, AZ 85258 Age: 69 |
| | Trustee | | | August 2015 – Present |
| | Retired. Formerly, President and Chief Executive Officer, Connecticut Children’s Medical Center (May 2006 – November 2015). | | |
146
|
| | None. | |
| | Joseph E. Obermeyer 7337 East Doubletree Ranch Rd. Suite 100 Scottsdale, Arizona 85258 Age: 62 |
| | Trustee | | | May 2013 – Present |
| | President, Obermeyer & Associates, Inc., a provider of financial and economic consulting services (November 1999 – Present). | | |
146
|
| | None. | |
| | Sheryl K. Pressler 7337 East Doubletree Ranch Rd. Suite 100 Scottsdale, Arizona 85258 Age: 69 |
| | Trustee | | | January 2006 – Present |
| | Consultant (May 2001 – Present). | | |
146
|
| | None. | |
| | Christopher P. Sullivan 7337 East Doubletree Ranch Rd. Suite 100 Scottsdale, Arizona 85258 Age: 66 |
| | Trustee | | | October 2015 – Present |
| | Retired. | | |
146
|
| | None. | |
| |
Name, Address and Age
|
| |
Position(s)
Held with the Trust |
| |
Term of Office and
Length of Time Served(1) |
| |
Principal
Occupation(s) – During the Past 5 Years |
| |
Number of
Funds in Fund Complex Overseen by Trustee(2) |
| |
Other Board Positions
Held by Trustee |
|
| | Trustee who is an “interested person”: | | |||||||||||||||
| | Dina Santoro 230 Park Avenue New York, New York 10169 Age: 46 |
| | Trustee | | | July 2018 – Present | | | President, Voya Investments, LLC and Voya Capital, LLC (March 2018 – Present); Senior Vice President, Voya Investments Distributor, LLC (April 2018 – Present); Senior Managing Director, Head of Product and Marketing Strategy, Voya Investment Management (September 2017 – Present). Formerly, Managing Director, Quantitative Management Associates, LLC (January 2004 – August 2017). | | |
146
|
| | Voya Investments, LLC, Voya Capital, LLC, and Voya Funds Services, LLC (March 2018 – Present); Voya Investments Distributor, LLC (April 2018 – Present). | |
|
Name, Address and Age
|
| |
Position(s) Held
With the Trust |
| |
Term of Office and
Length of Time Served(1) |
| |
Principal Occupation(s) – During the Past 5 Years
|
|
| Michael Bell One Orange Way Windsor, Connecticut 06095 Age: 51 |
| | Chief Executive Officer | | | March 2018 – Present | | | Chief Executive Officer and Director, Voya Investments, LLC, Voya Capital, LLC, and Voya Funds Services, LLC (March 2018 – Present); Senior Vice President and Chief Financial Officer, Voya Investments Distributor, LLC (September 2019 – Present); Chief Financial Officer, Voya Investment Management (September 2014 – Present). Formerly, Senior Vice President, Chief Financial Officer and Treasurer, Voya Investments, LLC (November 2015 – March 2018). | |
| Dina Santoro 230 Park Avenue New York, New York 10169 Age: 46 |
| | President | | | March 2018 – Present | | | President and Director, Voya Investments, LLC and Voya Capital, LLC (March 2018 – Present); Director, Voya Funds Services, LLC (March 2018 – Present); Director and Senior Vice President, Voya Investments Distributor, LLC (April 2018 – Present); Senior Managing Director, Head of Product and Marketing Strategy, Voya Investment Management (September 2017 – Present). Formerly, Managing Director, Quantitative Management Associates, LLC (January 2004 – August 2017). | |
| Stanley D. Vyner 230 Park Avenue New York, New York 10169 Age: 69 |
| |
Executive Vice President
Chief Investment Risk Officer
|
| | March 2003 – Present September 2009 – Present |
| | Executive Vice President, Voya Investments, LLC (July 2000 – Present) and Chief Investment Risk Officer, Voya Investments, LLC (January 2003 – Present). | |
| James M. Fink 5780 Powers Ferry Road NW Atlanta, Georgia 30327 Age: 61 |
| | Executive Vice President | | | March 2018 – Present | | | Managing Director, Voya Investments, LLC, Voya Capital, LLC, and Voya Funds Services, LLC (March 2018 – Present); Senior Vice President, Voya Investments Distributor, LLC (April 2018 – Present); Chief Administrative Officer, Voya Investment Management (September 2017 – Present). Formerly, Managing Director, Operations, Voya Investment Management (March 1999 – September 2017). | |
| Kevin M. Gleason 7337 East Doubletree Ranch Rd. Suite 100 Scottsdale, Arizona 85258 Age: 53 |
| | Chief Compliance Officer | | | February 2012 – Present | | | Senior Vice President, Voya Investment Management and Chief Compliance Officer, Voya Family of Funds (February 2012 – Present). | |
| Todd Modic 7337 East Doubletree Ranch Rd. Suite 100 Scottsdale, Arizona 85258 Age: 52 |
| | Senior Vice President, Chief/Principal Financial Officer and Assistant Secretary | | | March 2005 – Present | | | President, Voya Funds Services, LLC (March 2018 – Present) and Senior Vice President, Voya Investments, LLC (April 2005 – Present). | |
| Kimberly A. Anderson 7337 East Doubletree Ranch Rd. Suite 100 Scottsdale, Arizona 85258 Age: 55 |
| |
Senior Vice President
|
| | November 2003 – Present | | | Senior Vice President, Voya Investments, LLC (September 2003 – Present). | |
| Robert Terris 5780 Powers Ferry Road NW Atlanta, Georgia 30327 Age: 49 |
| |
Senior Vice President
|
| | May 2006 – Present | | | Senior Vice President, Voya Investments Distributor, LLC (April 2018 – Present); Senior Vice President, Head of Division Operations, Voya Investments, LLC (October 2015 – Present) and Voya Funds Services, LLC (March 2006 – Present). | |
| Fred Bedoya 7337 East Doubletree Ranch Rd. Suite 100 Scottsdale, Arizona 85258 Age: 47 |
| | Vice President and Treasurer | | | September 2012 – Present | | | Vice President, Voya Investments, LLC (October 2015 – Present) and Voya Funds Services, LLC (July 2012 – Present). | |
|
Name, Address and Age
|
| |
Position(s) Held
With the Trust |
| |
Term of Office and
Length of Time Served(1) |
| |
Principal Occupation(s) – During the Past 5 Years
|
|
| Maria M. Anderson 7337 East Doubletree Ranch Rd. Suite 100 Scottsdale, Arizona 85258 Age: 61 |
| | Vice President | | | September 2004 – Present | | | Vice President, Voya Investments, LLC (October 2015 – Present) and Voya Funds Services, LLC (September 2004 – Present). | |
| Sara M. Donaldson 7337 East Doubletree Ranch Rd. Suite 100 Scottsdale, Arizona 85258 Age: 60 |
| | Vice President | | | September 2014 – Present | | | Vice President, Voya Investments, LLC (October 2015 – Present). Formerly, Vice President, Voya Funds Services, LLC (April 2014 – October 2015). | |
| Micheline S. Faver 7337 East Doubletree Ranch Rd. Suite 100 Scottsdale, Arizona 85258 Age: 42 |
| | Vice President | | | September 2016 – Present | | | Vice President, Head of Fund Compliance and Chief Compliance Officer, Voya Investments, LLC (June 2016 – Present). Formerly, Vice President, Mutual Fund Compliance (March 2014 – June 2016). | |
| Robyn L. Ichilov 7337 East Doubletree Ranch Rd. Suite 100 Scottsdale, Arizona 85258 Age: 52 |
| | Vice President | | | November 1999 – Present | | | Vice President, Voya Funds Services, LLC (November 1995 – Present) and Voya Investments, LLC (August 1997 – Present). | |
| Jason Kadavy 7337 East Doubletree Ranch Rd. Suite 100 Scottsdale, Arizona 85258 Age: 43 |
| | Vice President | | | September 2012 – Present | | | Vice President, Voya Investments, LLC (October 2015 – Present) and Voya Funds Services, LLC (July 2007 – Present). | |
| Andrew K. Schlueter 7337 East Doubletree Ranch Rd. Suite 100 Scottsdale, Arizona 85258 Age: 43 |
| | Vice President | | | March 2018 – Present | | | Vice President, Voya Investments Distributor, LLC (April 2018 – Present); Vice President, Voya Investments, LLC and Voya Funds Services, LLC (March 2018 – Present); Vice President, Head of Mutual Fund Operations, Voya Investment Management (February 2018 – Present). Formerly, Vice President, Voya Investment Management (March 2014 – February 2018). | |
| Craig Wheeler 7337 East Doubletree Ranch Rd. Suite 100 Scottsdale, Arizona 85258 Age: 50 |
| | Vice President | | | May 2013 – Present | | | Vice President – Director of Tax, Voya Investments, LLC (October 2015 – Present). Formerly, Vice President – Director of Tax, Voya Funds Services, LLC (March 2013 – October 2015). | |
| Monia Piacenti One Orange Way Windsor, Connecticut 06095 Age: 43 |
| | Anti-Money Laundering Officer | | | June 2018 – Present | | | Anti-Money Laundering Officer, Voya Investments Distributor, LLC, Voya Investment Management and Voya Investment Management Trust Co. (June 2018 – Present); Compliance Consultant, Voya Financial, Inc. (January 2019 – Present). Formerly, Senior Compliance Officer, Voya Investment Management (December 2009 – December 2018). | |
| Theresa K. Kelety 7337 East Doubletree Ranch Rd. Suite 100 Scottsdale, Arizona 85258 Age: 57 |
| | Secretary | | | January 2020 – Present | | | Vice President and Senior Counsel, Voya Investment Management – Mutual Fund Legal Department (March 2010 – Present). | |
| Paul A. Caldarelli 7337 East Doubletree Ranch Rd. Suite 100 Scottsdale, Arizona 85258 Age: 68 |
| | Assistant Secretary | | | June 2010 – Present | | | Vice President and Senior Counsel, Voya Investment Management – Mutual Fund Legal Department (March 2010 – Present). | |
|
Name, Address and Age
|
| |
Position(s) Held
With the Trust |
| |
Term of Office and
Length of Time Served(1) |
| |
Principal Occupation(s) – During the Past 5 Years
|
|
| Joanne F. Osberg 7337 East Doubletree Ranch Rd. Suite 100 Scottsdale, Arizona 85258 Age: 38 |
| | Assistant Secretary | | | January 2020 – Present | | | Vice President and Counsel, Voya Investment Management – Mutual Fund Legal Department (January 2013 – Present). | |
Voya Investments, LLC
7337 East Doubletree Ranch Road, Suite 100
Scottsdale, Arizona 85258
Voya Investments Distributor, LLC
7337 East Doubletree Ranch Road, Suite 100
Scottsdale, Arizona 85258
BNY Mellon Investment Servicing (U.S.) Inc.
301 Bellevue Parkway
Wilmington, Delaware 19809
KPMG LLP
Two Financial Center
60 South Street
Boston, Massachusetts 02111
The Bank of New York Mellon
225 Liberty Street
New York, New York 10286
Ropes & Gray LLP
Prudential Tower
800 Boylston Street
Boston, Massachusetts 02199
Annual Report
December 31, 2019
| Voya Investors Trust |
| n VY® | BlackRock Inflation Protected
Bond Portfolio Classes ADV, I and S |
| Voya Variable Insurance Trust |
| n VY® | BrandywineGLOBAL — Bond Portfolio (formerly known as VY® Goldman Sachs Bond Portfolio) |
|
Beginning on January 1, 2021, as permitted by regulations
adopted by the U.S. Securities and Exchange Commission, paper copies of each Portfolio’s annual and semi-annual shareholder reports, like this
annual report, will no longer be sent by mail, unless you specifically request paper copies of the reports. Instead, the reports will be made available
on a website and you will be notified by mail each time a report is posted and provided with a website link to access the report. |
|
This report is submitted for general information to shareholders of the Voya mutual funds. It is not authorized for distribution to prospective shareholders unless accompanied or preceded by a prospectus which includes details regarding the funds’ investment objectives, risks, charges, expenses and other information. This information should be read carefully. |
| INVESTMENT
MANAGEMENT voyainvestments.com |
|
| 1 | ||||||
| 2 | ||||||
| 4 | ||||||
| 10 | ||||||
| 11 | ||||||
| 12 | ||||||
| 14 | ||||||
| 15 | ||||||
| 16 | ||||||
| 17 | ||||||
| 32 | ||||||
| 50 | ||||||
| 51 | ||||||
| 55 |
PROXY VOTING INFORMATION
A description of the policies and procedures that the Portfolios use to determine how to vote proxies related to portfolio securities is
available: (1) without charge, upon request, by calling Shareholder Services toll-free at (800) 992-0180; (2) on the Portfolios’ website at
www.voyainvestments.com; and (3) on the U.S. Securities and Exchange Commission’s (“SEC’s”) website at www.sec.gov. Information
regarding how the Portfolios voted proxies related to portfolio securities during the most recent 12-month period ended June 30 is available without
charge on the Portfolios’ website at www.voyainvestments.com and on the SEC’s website at www.sec.gov.
QUARTERLY PORTFOLIO HOLDINGS
The Portfolios file their complete schedule of portfolio holdings with the SEC for the first and third quarters of each fiscal year on Form
N-Q or Form N-PORT, available for filings after March 31, 2019. This report contains a summary portfolio of investments for one of the Portfolios. The
Portfolios’ Form N-Q or Form N-PORT is available on the SEC’s website at www.sec.gov. The Portfolios’ complete schedule of portfolio
holdings, as filed on Form N-Q or Form N-PORT, are available: on www.voyainvestments.com and without charge upon request from the Portfolio by calling
Shareholder Services toll-free at (800) 992-0180.

President
Voya Family of Funds
January 21, 2020
BENCHMARK DESCRIPTIONS
| Index | Description |
|---|---|
Bloomberg Barclays
U.S. Aggregate Bond Index |
An
index of publicly issued investment grade U.S. government, mortgage-backed, asset-backed and corporate debt securities. |
Bloomberg Barclays
Long-Term U.S. Treasury Index |
This
index measures the performance of U.S. Treasury bills with long-term maturity. The credit level for this index is investment grade. The rebalance
scheme is monthly. |
Bloomberg Barclays
U.S. Treasury Inflation Protected Securities Index |
A
market index comprised of all U.S. Treasury Inflation Linked Securities. |
MSCI Europe ex
U.K.® Index |
A free
float-adjusted market capitalization index that is designed to measure developed market equity performance in Europe, excluding the
UK. |
MSCI Japan®
Index |
A free
float-adjusted market capitalization index that is designed to measure developed market equity performance in Japan. |
MSCI U.K.®
Index |
A free
float-adjusted market capitalization index that is designed to measure developed market equity performance in the UK. |
MSCI World
IndexSM |
An
index that measures the performance of over 1,600 securities listed on exchanges in the U.S., Europe, Canada, Australia, New Zealand and the Far
East. |
S&P 500®
Index |
An
index that measures the performance of securities of approximately 500 large-capitalization companies whose securities are traded on major U.S. stock
markets. |
| VY® BLACKROCK
INFLATION PROTECTED BOND PORTFOLIO |
PORTFOLIO MANAGERS’ REPORT |
Investment Type Allocation as of December 31, 2019 (as a percentage of net assets) |
|||
U.S.
Treasury Obligations |
50.3 | % | |
Corporate
Bonds/Notes |
25.7 | % | |
U.S.
Government Agency Obligations |
8.8 | % | |
Sovereign
Bonds |
7.2 | % | |
Commercial Mortgage-Backed Securities |
1.9 | % | |
Asset-Backed Securities |
1.4 | % | |
Purchased
Options |
0.5 | % | |
Assets in
Excess of Other Liabilities* |
4.2 | % | |
Net
Assets |
100.0 | % | |
* Includes short-term investments. Portfolio holdings are subject to change daily. | |||
Top Ten Holdings as of December 31, 2019 (as a percentage of net assets) |
|||
United
States Treasury Inflation Indexed Bonds, 0.875%, 01/15/29 |
4.9 | % | |
United
States Treasury Inflation Indexed Bonds, 0.375%, 01/15/27 |
4.2 | % | |
United
States Treasury Inflation Indexed Bonds, 0.375%, 07/15/27 |
3.9 | % | |
United
States Treasury Inflation Indexed Bonds, 0.500%, 01/15/28 |
3.2 | % | |
United
States Treasury Inflation Indexed Bonds, 0.750%, 07/15/28 |
3.1 | % | |
United
States Treasury Inflation Indexed Bonds, 0.625%, 01/15/26 |
3.0 | % | |
Fannie
Mae, 2.625%, 09/06/24 |
2.7 | % | |
United
States Treasury Inflation Indexed Bonds, 0.125%, 07/15/26 |
2.6 | % | |
Italy
Buoni Poliennali Del Tesoro, 1.300%, 05/15/28 |
2.4 | % | |
United
States Treasury Inflation Indexed Bonds, 0.750%, 02/15/45 |
2.2 | % | |
Portfolio holdings are subject to change daily. | |||
| PORTFOLIO MANAGERS’ REPORT | VY® BLACKROCK
INFLATION PROTECTED BOND PORTFOLIO |
| VY® BLACKROCK
INFLATION PROTECTED BOND PORTFOLIO |
PORTFOLIO MANAGERS’ REPORT |
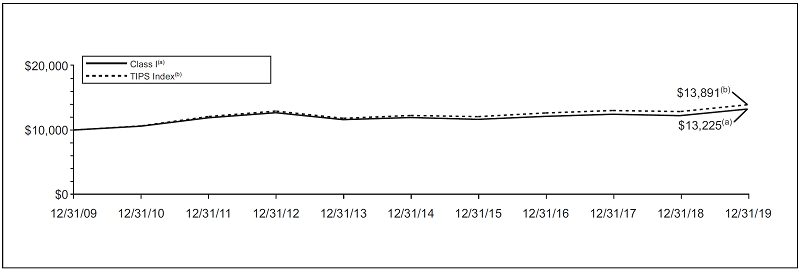
| Average Annual Total Returns for the Periods Ended December 31, 2019 | ||||||||||||||
|---|---|---|---|---|---|---|---|---|---|---|---|---|---|---|
| 1 Year | 5 Year | 10 Year | ||||||||||||
Class
ADV |
7.53 | % | 1.46 | % | 2.18 | % | ||||||||
Class
I |
8.21 | % | 2.07 | % | 2.81 | % | ||||||||
Class
S |
8.01 | % | 1.81 | % | 2.56 | % | ||||||||
TIPS
Index |
8.43 | % | 2.62 | % | 3.36 | % | ||||||||
| PORTFOLIO MANAGERS’ REPORT | VY® BRANDYWINEGLOBAL — BOND PORTFOLIO |
Investment Type Allocation
as of December 31, 2019 (as a percentage of net assets) |
|||
U.S.
Treasury Obligations |
48.9 | % | |
Corporate
Bonds/Notes |
32.8 | % | |
U.S.
Government Agency Obligations |
16.9 | % | |
Municipal
Bonds |
0.0 | % | |
Assets in
Excess of Other Liabilities* |
1.4 | % | |
Net
Assets |
100.0 | % | |
* Includes short-term investments. Portfolio holdings are subject to change daily. | |||
Top Ten Holdings as of December 31, 2019 (as a percentage of net assets) |
|||
United
States Treasury Floating Rate Note, 1.746%, 07/31/21 |
27.7 | % | |
United
States Treasury Floating Rate Note, 1.665%, 04/30/21 |
13.5 | % | |
Fannie
Mae, 1.500%, 07/30/20 |
11.5 | % | |
Federal
Home Loan Banks, 1.875%, 07/07/21 |
5.4 | % | |
Hewlett
Packard Enterprise Co., 6.350%, 10/15/45 |
4.9 | % | |
Anheuser-Busch InBev Worldwide, Inc., 5.450%, 01/23/39 |
4.6 | % | |
United
States Treasury Bond, 2.875%, 05/15/49 |
3.9 | % | |
United
States Treasury Floating Rate Note, 1.826%, 10/31/21 |
3.8 | % | |
Micron
Technology, Inc., 5.327%, 02/06/29 |
3.4 | % | |
Dell
International LLC / EMC Corp., 5.300%, 10/01/29 |
3.3 | % | |
Portfolio holdings are subject to change daily. | |||
| VY® BRANDYWINEGLOBAL — BOND PORTFOLIO |
PORTFOLIO MANAGERS’ REPORT |
* |
Effective August 9, 2019, Goldman Sachs was removed as the sub-adviser of the Portfolio and replaced with Brandywine. In conjunction with the sub-adviser change, David F. Hoffman, John P. McIntyre, Anujeet Sareen, and Stephen S. Smith were added as portfolio managers to the Portfolio and Michael Swell and Ashish Shad were removed as portfolio managers to the Portfolio. Effective August 9, 2019, the Portfolio’s name changed to “VY® BrandywineGLOBAL — Bond Portfolio. |
** |
Beginning July 26, 2019, through the close of business on August 23, 2019, the Portfolio was in a transition period and may have held a large portion of the Portfolio’s assets in temporary investments. |
| PORTFOLIO MANAGERS’ REPORT | VY® BRANDYWINEGLOBAL — BOND PORTFOLIO |
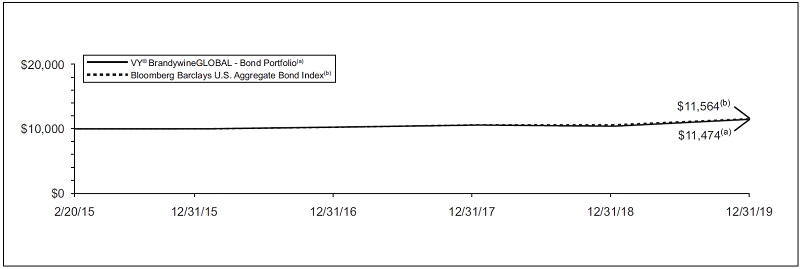
| Average Annual Total Returns for the Periods Ended December 31, 2019 | |||||||||||
|---|---|---|---|---|---|---|---|---|---|---|---|
| 1 Year | Since Inception February 20, 2015 |
||||||||||
VY®
BrandywineGLOBAL — Bond Portfolio |
10.12 | % | 2.87 | % | |||||||
Bloomberg
Barclays U.S. Aggregate Bond Index |
8.72 | % | 3.04 | % | |||||||
SHAREHOLDER EXPENSE EXAMPLES (UNAUDITED)
| Actual Portfolio Return | Hypothetical (5% return before expenses) | |||||||||||||||||||||||||||||||||
|---|---|---|---|---|---|---|---|---|---|---|---|---|---|---|---|---|---|---|---|---|---|---|---|---|---|---|---|---|---|---|---|---|---|---|
| Beginning Account Value July 1, 2019 |
Ending Account Value December 31, 2019 |
Annualized Expense Ratio |
Expenses Paid During the Period Ended December 31, 2019* |
Beginning Account Value July 1, 2019 |
Ending Account Value December 31, 2019 |
Annualized Expense Ratio |
Expenses Paid During the Period Ended December 31, 2019* |
|||||||||||||||||||||||||||
VY® BlackRock Inflation Protected Bond Portfolio |
||||||||||||||||||||||||||||||||||
Class
ADV |
$ | 1,000.00 | $ | 1,018.30 | 1.16 | % | $ | 5.90 | $ | 1,000.00 | $ | 1,019.36 | 1.16 | % | $ | 5.90 | ||||||||||||||||||
Class
I |
1,000.00 | 1,021.70 | 0.56 | 2.85 | 1,000.00 | 1,022.38 | 0.56 | 2.85 | ||||||||||||||||||||||||||
Class
S |
1,000.00 | 1,020.60 | 0.81 | 4.13 | 1,000.00 | 1,021.12 | 0.81 | 4.13 | ||||||||||||||||||||||||||
VY® BrandywineGLOBAL — Bond Portfolio |
||||||||||||||||||||||||||||||||||
| $ | 1,000.00 | $ | 1,026.30 | 0.58 | % | $ | 2.96 | $ | 1,000.00 | $ | 1,022.28 | 0.58 | % | $ | 2.96 | |||||||||||||||||||
* |
Expenses are equal to each Portfolio’s respective annualized expense ratios multiplied by the average account value over the period, multiplied by 184/365 to reflect the most recent fiscal half-year. |
Voya Investors Trust and Voya Variable Insurance Trust:
February 21, 2020
| VY® BlackRock Inflation Protected Bond Portfolio |
VY® BrandywineGLOBAL — Bond Portfolio |
|||||||||
|---|---|---|---|---|---|---|---|---|---|---|
ASSETS: |
||||||||||
Investments in
securities at fair value* |
$ | 266,333,739 | $ | 180,212,402 | ||||||
Short-term
investments at fair value** |
1,677,355 | 2,050,563 | ||||||||
Cash |
574,997 | — | ||||||||
Cash collateral
for futures |
5,375 | — | ||||||||
Cash pledged for
centrally cleared swaps (Note 2) |
3,143,490 | — | ||||||||
Cash pledged as
collateral for OTC derivatives (Note 2) |
160,000 | — | ||||||||
Foreign
currencies at value*** |
5,067,700 | — | ||||||||
Receivables: |
||||||||||
Investment
securities sold |
605,341 | — | ||||||||
Fund shares
sold |
1,193,429 | 39,456 | ||||||||
Dividends |
5,140 | 3,733 | ||||||||
Interest |
1,231,719 | 1,192,566 | ||||||||
Unrealized
appreciation on forward foreign currency contracts |
61,470 | — | ||||||||
Unrealized
appreciation on OTC swap agreements |
1,366,271 | — | ||||||||
Variation margin
receivable on centrally cleared swaps |
50,729 | — | ||||||||
Prepaid
expenses |
1,885 | 1,328 | ||||||||
Other
assets |
19,679 | 5,045 | ||||||||
Total
assets |
281,498,319 | 183,505,093 | ||||||||
LIABILITIES: |
||||||||||
Payable for
investment securities purchased |
4,142 | — | ||||||||
Payable for fund
shares redeemed |
147,242 | 274,761 | ||||||||
Payable for
foreign cash collateral for futures**** |
33,682 | — | ||||||||
Unrealized
depreciation on forward foreign currency contracts |
318,897 | — | ||||||||
Cash received as
collateral for OTC derivatives (Note 2) |
1,350,000 | — | ||||||||
Payable for
investment management fees |
117,070 | 238,283 | ||||||||
Payable for
distribution and shareholder service fees |
53,311 | — | ||||||||
Payable to
trustees under the deferred compensation plan (Note 6) |
19,679 | 5,045 | ||||||||
Payable for
trustee fees |
1,386 | 900 | ||||||||
Other accrued
expenses and liabilities |
50,988 | 94,095 | ||||||||
Written options,
at fair valueˆ |
1,444,151 | — | ||||||||
Total
liabilities |
3,540,548 | 613,084 | ||||||||
NET
ASSETS |
$ | 277,957,771 | $ | 182,892,009 | ||||||
NET ASSETS
WERE COMPRISED OF: |
||||||||||
Paid-in
capital |
$ | 348,848,416 | $ | 174,641,243 | ||||||
Total
distributable earnings (loss) |
(70,890,645 | ) | 8,250,766 | |||||||
NET
ASSETS |
$ | 277,957,771 | $ | 182,892,009 | ||||||
| * | Cost of
investments in securities |
$ | 257,431,946 | $ | 179,710,919 | |||||
| ** | Cost of
short-term investments |
$ | 1,677,355 | $ | 2,049,245 | |||||
| *** | Cost of
foreign currencies |
$ | 5,009,476 | $ | — | |||||
| **** | Cost of
payable for foreign cash collateral for futures |
$ | 33,682 | $ | — | |||||
| ˆ | Premiums
received on written options |
$ | 1,910,301 | $ | — | |||||
| VY® BlackRock Inflation Protected Bond Portfolio |
VY® BrandywineGLOBAL — Bond Portfolio |
|||||||
|---|---|---|---|---|---|---|---|---|
Class
ADV |
||||||||
Net
assets |
$ | 44,884,972 | n/a | |||||
Shares
authorized |
unlimited | n/a | ||||||
Par
value |
$ | 0.001 | n/a | |||||
Shares
outstanding |
4,763,300 | n/a | ||||||
Net asset value
and redemption price per share |
$ | 9.42 | n/a | |||||
Class
I |
||||||||
Net
assets |
$ | 88,759,302 | n/a | |||||
Shares
authorized |
unlimited | n/a | ||||||
Par
value |
$ | 0.001 | n/a | |||||
Shares
outstanding |
9,078,058 | n/a | ||||||
Net asset value
and redemption price per share |
$ | 9.78 | n/a | |||||
Class
S |
||||||||
Net
assets |
$ | 144,313,497 | n/a | |||||
Shares
authorized |
unlimited | n/a | ||||||
Par
value |
$ | 0.001 | n/a | |||||
Shares
outstanding |
14,880,941 | n/a | ||||||
Net asset value
and redemption price per share |
$ | 9.70 | n/a | |||||
Portfolio(1) |
||||||||
Net
assets |
n/a | $ | 182,892,009 | |||||
Shares
authorized |
n/a | unlimited | ||||||
Par
value |
n/a | $ | 0.001 | |||||
Shares
outstanding |
n/a | 17,396,207 | ||||||
Net asset value
and redemption price per share |
n/a | $ | 10.51 | |||||
(1) Portfolio does not have a share class designation. |
| VY® BlackRock Inflation Protected Bond Portfolio |
VY® BrandywineGLOBAL — Bond Portfolio |
|||||||||
|---|---|---|---|---|---|---|---|---|---|---|
INVESTMENT
INCOME: |
||||||||||
Dividends |
$ | 47,282 | $ | 288,161 | ||||||
Interest, net of
foreign taxes withheld* |
6,689,138 | 5,216,824 | ||||||||
Securities
lending income, net |
— | 1,516 | ||||||||
Total
investment income |
6,736,420 | 5,506,501 | ||||||||
EXPENSES: |
||||||||||
Investment
management fees |
1,485,779 | 899,399 | ||||||||
Distribution and
shareholder service fees: |
||||||||||
Class
ADV |
268,408 | — | ||||||||
Class
S |
378,086 | — | ||||||||
Transfer agent
fees |
423 | 990 | ||||||||
Shareholder
reporting expense |
14,600 | 11,690 | ||||||||
Professional
fees |
56,830 | 76,290 | ||||||||
Custody and
accounting expense |
82,017 | 87,110 | ||||||||
Trustee
fees |
11,086 | 7,195 | ||||||||
Miscellaneous
expense |
11,480 | 12,210 | ||||||||
Interest
expense |
248 | 1,859 | ||||||||
Total
expenses |
2,308,957 | 1,096,743 | ||||||||
Waived and
reimbursed fees |
(110,863 | ) | (46,992 | ) | ||||||
Net
expenses |
2,198,094 | 1,049,751 | ||||||||
Net investment
income |
4,538,326 | 4,456,750 | ||||||||
REALIZED AND
UNREALIZED GAIN (LOSS): |
||||||||||
Net realized
gain (loss) on: |
||||||||||
Investments |
4,054,114 | 6,500,893 | ||||||||
Forward
foreign currency contracts |
1,085,534 | 302,357 | ||||||||
Foreign
currency related transactions |
201,323 | 348 | ||||||||
Futures |
(709,522 | ) | 2,916,088 | |||||||
Swaps |
(1,652,067 | ) | 675,838 | |||||||
Written
options |
(3,731 | ) | — | |||||||
Net realized
gain |
2,975,651 | 10,395,524 | ||||||||
Net change in
unrealized appreciation (depreciation) on: |
||||||||||
Investments |
12,790,292 | 3,252,455 | ||||||||
Forward
foreign currency contracts |
(259,851 | ) | 80,065 | |||||||
Foreign
currency related transactions |
57,810 | 9,146 | ||||||||
Futures |
(452,826 | ) | (587,337 | ) | ||||||
Swaps |
788,552 | (102,887 | ) | |||||||
Written
options |
522,522 | — | ||||||||
Sales
commitments |
— | 63,263 | ||||||||
Net change in
unrealized appreciation (depreciation) |
13,446,499 | 2,714,705 | ||||||||
Net realized and
unrealized gain |
16,422,150 | 13,110,229 | ||||||||
Increase in
net assets resulting from operations |
$ | 20,960,476 | $ | 17,566,979 | ||||||
| * | Foreign taxes withheld | $ | 263 | $ | 148 | |||||
| VY® BlackRock Inflation Protected Bond Portfolio |
VY® BrandywineGLOBAL — Bond Portfolio |
|||||||||||||||
|---|---|---|---|---|---|---|---|---|---|---|---|---|---|---|---|---|
| Year Ended December 31, 2019 |
Year Ended December 31, 2018 |
Year Ended December 31, 2019 |
Year Ended December 31, 2018 |
|||||||||||||
FROM
OPERATIONS: |
||||||||||||||||
Net investment
income |
$ | 4,538,326 | $ | 7,281,137 | $ | 4,456,750 | $ | 5,521,745 | ||||||||
Net realized
gain (loss) |
2,975,651 | (2,607,768 | ) | 10,395,524 | (7,273,128 | ) | ||||||||||
Net change in
unrealized appreciation (depreciation) |
13,446,499 | (12,801,084 | ) | 2,714,705 | (1,982,360 | ) | ||||||||||
Increase
(decrease) in net assets resulting from operations |
20,960,476 | (8,127,715 | ) | 17,566,979 | (3,733,743 | ) | ||||||||||
FROM
DISTRIBUTIONS TO SHAREHOLDERS: |
||||||||||||||||
Total
distributions (excluding return of capital): |
(3,417,729 | ) | (4,674,679 | ) | ||||||||||||
Class
ADV |
(858,621 | ) | (773,589 | ) | — | — | ||||||||||
Class
I |
(1,810,500 | ) | (4,466,157 | ) | — | — | ||||||||||
Class
S |
(3,314,035 | ) | (3,312,376 | ) | — | — | ||||||||||
Total
distributions |
(5,983,156 | ) | (8,552,122 | ) | (3,417,729 | ) | (4,674,679 | ) | ||||||||
FROM CAPITAL
SHARE TRANSACTIONS: |
||||||||||||||||
Net proceeds
from sale of shares |
68,026,433 | 58,568,404 | 43,513,332 | 48,161,227 | ||||||||||||
Reinvestment of
distributions |
5,983,156 | 8,552,121 | 3,417,729 | 4,674,679 | ||||||||||||
| 74,009,589 | 67,120,525 | 46,931,061 | 52,835,906 | |||||||||||||
Cost of shares
redeemed |
(49,588,217 | ) | (246,003,242 | ) | (72,346,903 | ) | (65,220,660 | ) | ||||||||
Net increase
(decrease) in net assets resulting from capital share transactions |
24,421,372 | (178,882,717 | ) | (25,415,842 | ) | (12,384,754 | ) | |||||||||
Net increase
(decrease) in net assets |
39,398,692 | (195,562,554 | ) | (11,266,592 | ) | (20,793,176 | ) | |||||||||
NET
ASSETS: |
||||||||||||||||
Beginning of
year or period |
238,559,079 | 434,121,633 | 194,158,601 | 214,951,777 | ||||||||||||
End of year or
period |
$ | 277,957,771 | $ | 238,559,079 | $ | 182,892,009 | $ | 194,158,601 | ||||||||
| Income
(loss) from investment operations |
Less distributions | Ratios
to average net assets |
Supplemental data | |||||||||||||||||||||||||||||||||||||||||||||||||||||||||||||||||
|---|---|---|---|---|---|---|---|---|---|---|---|---|---|---|---|---|---|---|---|---|---|---|---|---|---|---|---|---|---|---|---|---|---|---|---|---|---|---|---|---|---|---|---|---|---|---|---|---|---|---|---|---|---|---|---|---|---|---|---|---|---|---|---|---|---|---|---|---|
| Net
asset value, beginning of year or period |
Net investment income (loss) | Net
realized and unrealized gain (loss) |
Total
from investment operations |
From net investment income | From net realized gains | From return of capital | Total distributions | Payment by affiliate | Net
asset value, end of year or period |
Total Return(1) | Expenses
before reductions/ additions(2)(3)(4) |
Expenses
net of fee waivers and/or recoupments if any(2)(3)(4) |
Expense net of all reductions/ additions(2)(3)(4) |
Net
investment income (loss)(2)(3) |
Net
assets, end of year or period |
Portfolio turnover rate | ||||||||||||||||||||||||||||||||||||||||||||||||||||
| Year or period ended | ($) | ($) | ($) | ($) | ($) | ($) | ($) | ($) | ($) | ($) | (%) | (%) | (%) | (%) | (%) | ($000’s) | (%) | |||||||||||||||||||||||||||||||||||||||||||||||||||
VY®
BlackRock Inflation Protected Bond Portfolio
|
||||||||||||||||||||||||||||||||||||||||||||||||||||||||||||||||||||
| Class ADV | ||||||||||||||||||||||||||||||||||||||||||||||||||||||||||||||||||||
| 12-31-19 | 8.93 | 0.11 | 0.56 | 0.67 | 0.18 | — | — | 0.18 | — | 9.42 | 7.53 | 1.20 | 1.16 | 1.16 | 1.23 | 44,885 | 72 | |||||||||||||||||||||||||||||||||||||||||||||||||||
| 12-31-18 | 9.30 | 0.14 | (0.36 | ) | (0.22 | ) | 0.15 | — | — | 0.15 | — | 8.93 | (2.39 | ) | 1.18 | 1.14 | 1.14 | 1.47 | 44,035 | 63 | ||||||||||||||||||||||||||||||||||||||||||||||||
| 12-31-17 | 9.17 | 0.09 | 0.11 | 0.20 | 0.07 | — | — | 0.07 | — | 9.30 | 2.16 | 1.17 | 1.13 | 1.13 | 0.94 | 49,769 | 101 | |||||||||||||||||||||||||||||||||||||||||||||||||||
| 12-31-16 | 8.88 | 0.05 | 0.24 | 0.29 | — | — | — | — | — | 9.17 | 3.27 | 1.21 | 1.12 | 1.12 | 0.53 | 52,110 | 73 | |||||||||||||||||||||||||||||||||||||||||||||||||||
| 12-31-15 | 9.24 | (0.05 | ) | (0.22 | ) | (0.27 | ) | 0.09 | — | 0.00 | * | 0.09 | — | 8.88 | (2.89 | ) | 1.30 | 1.11 | 1.11 | (0.52 | ) | 54,750 | 470 | |||||||||||||||||||||||||||||||||||||||||||||
Class
I |
||||||||||||||||||||||||||||||||||||||||||||||||||||||||||||||||||||
| 12-31-19 | 9.26 | 0.18 | 0.57 | 0.75 | 0.23 | — | — | 0.23 | — | 9.78 | 8.21 | 0.60 | 0.56 | 0.56 | 1.98 | 88,759 | 72 | |||||||||||||||||||||||||||||||||||||||||||||||||||
| 12-31-18 | 9.66 | 0.20 | • | (0.37 | ) | (0.17 | ) | 0.23 | — | — | 0.23 | — | 9.26 | (1.75 | ) | 0.58 | 0.54 | 0.54 | 2.14 | 40,731 | 63 | |||||||||||||||||||||||||||||||||||||||||||||||
| 12-31-17 | 9.55 | 0.15 | 0.11 | 0.26 | 0.15 | — | — | 0.15 | — | 9.66 | 2.72 | 0.57 | 0.53 | 0.53 | 1.55 | 223,463 | 101 | |||||||||||||||||||||||||||||||||||||||||||||||||||
| 12-31-16 | 9.19 | 0.11 | 0.25 | 0.36 | — | — | — | — | — | 9.55 | 3.92 | 0.56 | 0.52 | 0.52 | 1.15 | 311,949 | 73 | |||||||||||||||||||||||||||||||||||||||||||||||||||
| 12-31-15 | 9.54 | 0.01 | • | (0.23 | ) | (0.22 | ) | 0.08 | — | 0.05 | 0.13 | — | 9.19 | (2.35 | ) | 0.55 | 0.51 | 0.51 | 0.16 | 311,110 | 470 | |||||||||||||||||||||||||||||||||||||||||||||||
Class
S |
||||||||||||||||||||||||||||||||||||||||||||||||||||||||||||||||||||
| 12-31-19 | 9.18 | 0.15 | 0.58 | 0.73 | 0.21 | — | — | 0.21 | — | 9.70 | 8.01 | 0.85 | 0.81 | 0.81 | 1.57 | 144,313 | 72 | |||||||||||||||||||||||||||||||||||||||||||||||||||
| 12-31-18 | 9.57 | 0.17 | (0.36 | ) | (0.19 | ) | 0.20 | — | — | 0.20 | — | 9.18 | (2.04 | ) | 0.83 | 0.79 | 0.79 | 1.83 | 153,793 | 63 | ||||||||||||||||||||||||||||||||||||||||||||||||
| 12-31-17 | 9.45 | 0.13 | 0.10 | 0.23 | 0.11 | — | — | 0.11 | — | 9.57 | 2.48 | 0.82 | 0.78 | 0.78 | 1.29 | 160,890 | 101 | |||||||||||||||||||||||||||||||||||||||||||||||||||
| 12-31-16 | 9.12 | 0.09 | 0.24 | 0.33 | — | — | — | — | — | 9.45 | 3.62 | 0.81 | 0.77 | 0.77 | 0.89 | 190,284 | 73 | |||||||||||||||||||||||||||||||||||||||||||||||||||
| 12-31-15 | 9.48 | (0.02 | ) | (0.22 | ) | (0.24 | ) | 0.09 | — | 0.03 | 0.12 | — | 9.12 | (2.61 | ) | 0.80 | 0.76 | 0.76 | (0.19 | ) | 202,274 | 470 | ||||||||||||||||||||||||||||||||||||||||||||||
VY®
BrandywineGLOBAL- Bond Portfolio
|
||||||||||||||||||||||||||||||||||||||||||||||||||||||||||||||||||||
| 12-31-19 | 9.73 | 0.25 | • | 0.73 | 0.98 | 0.20 | — | — | 0.20 | — | 10.51 | 10.12 | 0.61 | 0.58 | 0.58 | 2.48 | 182,892 | 449 | ||||||||||||||||||||||||||||||||||||||||||||||||||
| 12-31-18 | 10.12 | 0.26 | • | (0.43 | ) | (0.17 | ) | 0.22 | — | — | 0.22 | — | 9.73 | (1.65 | ) | 0.71 | 0.58 | 0.58 | 2.61 | 194,159 | 457 | |||||||||||||||||||||||||||||||||||||||||||||||
| 12-31-17 | 10.06 | 0.22 | • | 0.07 | 0.29 | 0.23 | — | — | 0.23 | — | 10.12 | 2.93 | 0.69 | 0.58 | 0.58 | 2.16 | 214,952 | 345 | ||||||||||||||||||||||||||||||||||||||||||||||||||
| 12-31-16 | 10.02 | 0.20 | • | 0.08 | 0.28 | 0.24 | — | — | 0.24 | — | 10.06 | 2.70 | 0.66 | 0.58 | 0.58 | 2.00 | 226,846 | 490 | ||||||||||||||||||||||||||||||||||||||||||||||||||
| 02-20-15(5)– 12-31-15 |
10.00 | 0.15 | • | (0.13 | ) | 0.02 | — | — | — | — | — | 10.02 | 0.20 | 0.61 | 0.58 | 0.58 | 1.77 | 187,767 | 507 | |||||||||||||||||||||||||||||||||||||||||||||||||
(1) |
Total return is calculated assuming reinvestment of all dividends, capital gain distributions and return of capital distributions, if any, at net asset value and does not reflect the effect of insurance contract charges. Total return for periods less than one year is not annualized. |
(2) |
Annualized for periods less than one year. |
(3) |
Ratios reflect operating expenses of a Portfolio. Expenses before reductions/additions do not reflect amounts reimbursed or recouped by the Investment Adviser and/or Distributor or reductions from brokerage service arrangements or other expense offset arrangements and do not represent the amount paid by a Portfolio during periods when reimbursements or reductions occur. Expenses net of fee waivers reflect expenses after reimbursement by the Investment Adviser and/or Distributor or recoupment of |
| previously reimbursed fees by the Investment Adviser, but prior to reductions from brokerage service arrangements or other expense offset arrangements. Expenses net of all reductions/additions represent the net expenses paid by a Portfolio. Net investment income (loss) is net of all such additions or reductions. | ||
(4) |
Ratios do not include fees and expenses charged under the variable annuity contract or variable life insurance policy. |
(5) |
Commencement of operations. |
• |
Calculated using average number of shares outstanding throughout the year or period. |
* |
Amount is less than $0.005 or 0.005% or more than $(0.005) or (0.005)%. |
(1) |
Market value of investment securities, other assets and liabilities — at the exchange rates prevailing at Market Close. |
(2) |
Purchases and sales of investment securities, income and expenses — at the rates of exchange prevailing on the respective dates of such transactions. |
| Purchased | Sold | |||||||
|---|---|---|---|---|---|---|---|---|
BlackRock
Inflation Protected Bond |
61,032,104 | $ | 31,684,256 | |||||
Bond
Portfolio |
117,300,788 | 40,297,585 | ||||||
| Purchased | Sold | |||||||
|---|---|---|---|---|---|---|---|---|
BlackRock
Inflation Protected Bond |
$ | 75,267,578 | $ | 39,706,211 | ||||
Bond
Portfolio |
74,691,587 | 78,533,544 | ||||||
| Purchased | Written | |||||||
|---|---|---|---|---|---|---|---|---|
Inflation rate
Caps |
$ | 17,213,000 | $ | 13,289,000 | ||||
Inflation rate
Floors |
7,743,333 | 15,480,000 | ||||||
| Purchases | Sales | |||||||
|---|---|---|---|---|---|---|---|---|
BlackRock
Inflation Protected Bond |
$ | 91,173,079 | $ | 73,746,666 | ||||
Bond
Portfolio |
89,955,856 | 156,043,505 | ||||||
| Purchases | Sales | |||||||
|---|---|---|---|---|---|---|---|---|
BlackRock
Inflation Protected Bond |
$ | 114,114,068 | $ | 119,799,464 | ||||
Bond
Portfolio |
696,278,128 | 684,534,183 | ||||||
| Portfolio | Fee | |
|---|---|---|
BlackRock
Inflation Protected Bond(1) |
0.55%
on the first $200 million; 0.50% on the next $800 million; and 0.40% thereafter |
|
Bond
Portfolio |
0.50%
on the first $750 million; and 0.48% thereafter |
(1) |
The Investment Adviser has contractually agreed to waive 0.04% of the management fee. Any fees waived or reimbursed are not eligible for recoupment. Termination or modification of this obligation requires approval by the Board. |
| Portfolio | Sub-Adviser | |
|---|---|---|
BlackRock
Inflation Protected Bond |
BlackRock Financial Management, Inc. |
|
Bond
Portfolio(1) |
Brandywine Global Investment Management, LLC |
(1) |
Effective August 9, 2019, Goldman Sachs Asset Management, L.P. was removed as sub-adviser and Brandywine Global Investment Management, LLC was added as sub-adviser to Bond Portfolio. |
| Subsidiary/Affiliated Investment Company |
Portfolio | Percentage | ||||
|---|---|---|---|---|---|---|
Voya
Institutional Trust Company |
BlackRock Inflation Protected Bond |
17.57 | % | |||
Voya Solution
2025 Portfolio |
Bond
Portfolio |
26.76 | ||||
Voya Solution
Income Portfolio |
Bond
Portfolio |
18.74 | ||||
| Portfolio | Maximum Operating Expense Limit (as a percentage of net assets) |
|
|---|---|---|
BlackRock
Inflation Protected Bond |
Class
ADV: 1.23% Class I: 0.63% Class S: 0.88% |
|
Bond
Portfolio |
0.58% |
| December 31, | ||||||||||||||||
|---|---|---|---|---|---|---|---|---|---|---|---|---|---|---|---|---|
| Portfolio | 2020 | 2021 | 2022 | Total | ||||||||||||
Bond
Portfolio |
$ | 237,612 | $ | 271,640 | $ | 46,992 | $ | 556,244 | ||||||||
| Portfolio | Days Utilized |
Approximate Average Daily Balance For Days Utilized |
Approximate Weighted Average Interest Rate For Days Utilized |
|||||||||
|---|---|---|---|---|---|---|---|---|---|---|---|---|
BlackRock
Inflation Protected Bond |
3 | $ | 869,000 | 3.21 | % | |||||||
Bond
Portfolio |
3 | 6,672,333 | 3.39 | |||||||||
| Shares sold |
Shares issued in merger |
Reinvestment of distributions |
Shares redeemed |
Net increase (decrease) in shares outstanding |
Shares sold |
Proceeds from shares issued in merger |
Reinvestment of distributions |
Shares redeemed |
Net increase (decrease) |
|||||||||||||||||||||||||||||||||
|---|---|---|---|---|---|---|---|---|---|---|---|---|---|---|---|---|---|---|---|---|---|---|---|---|---|---|---|---|---|---|---|---|---|---|---|---|---|---|---|---|---|---|
| Year or period ended | # | # | # | # | # | ($) | ($) | ($) | ($) | ($) | ||||||||||||||||||||||||||||||||
BlackRock Inflation Protected Bond
|
||||||||||||||||||||||||||||||||||||||||||
| Class ADV | ||||||||||||||||||||||||||||||||||||||||||
12/31/2019 |
318,553 | — | 93,232 | (580,639 | ) | (168,854 | ) | 2,939,064 | — | 858,621 | (5,353,509 | ) | (1,555,824 | ) | ||||||||||||||||||||||||||||
| 12/31/2018 | 399,640 | — | 84,970 | (905,095 | ) | (420,485 | ) | 3,658,118 | — | 773,589 | (8,190,985 | ) | (3,759,278 | ) | ||||||||||||||||||||||||||||
Class I |
||||||||||||||||||||||||||||||||||||||||||
12/31/2019 |
6,137,405 | — | 188,348 | (1,647,916 | ) | 4,677,837 | 57,920,215 | — | 1,810,500 | (15,943,201 | ) | 43,787,514 | ||||||||||||||||||||||||||||||
| 12/31/2018 | 3,938,283 | — | 472,040 | (23,139,542 | ) | (18,729,219 | ) | 37,370,077 | — | 4,466,156 | (216,557,877 | ) | (174,721,644 | ) | ||||||||||||||||||||||||||||
Class S |
||||||||||||||||||||||||||||||||||||||||||
12/31/2019 |
761,622 | — | 349,295 | (2,978,878 | ) | (1,867,961 | ) | 7,167,154 | — | 3,314,035 | (28,291,507 | ) | (17,810,318 | ) | ||||||||||||||||||||||||||||
| 12/31/2018 | 1,863,249 | — | 354,034 | (2,274,717 | ) | (57,434 | ) | 17,540,209 | — | 3,312,376 | (21,254,380 | ) | (401,795 | ) | ||||||||||||||||||||||||||||
Bond Portfolio |
||||||||||||||||||||||||||||||||||||||||||
12/31/2019 |
4,249,162 | — | 335,400 | (7,133,760 | ) | (2,549,198 | ) | 43,513,332 | — | 3,417,729 | (72,346,903 | ) | (25,415,842 | ) | ||||||||||||||||||||||||||||
| 12/31/2018 | 4,887,669 | — | 479,946 | (6,668,313 | ) | (1,300,698 | ) | 48,161,227 | — | 4,674,679 | (65,220,660 | ) | (12,384,754 | ) | ||||||||||||||||||||||||||||
| Year Ended December 31, 2019 |
Year Ended December 31, 2018 |
|||||||
|---|---|---|---|---|---|---|---|---|
| Ordinary Income |
Ordinary Income |
|||||||
BlackRock
Inflation Protected Bond |
$ | 5,983,156 | $ | 8,552,122 | ||||
Bond
Portfolio |
3,417,729 | 4,674,679 | ||||||
| Undistributed Ordinary |
Unrealized Appreciation/ |
Capital Loss Carryforwards | ||||||||||||||||||||
|---|---|---|---|---|---|---|---|---|---|---|---|---|---|---|---|---|---|---|---|---|---|---|
| Income | (Depreciation) | Amount | Character | Expiration | ||||||||||||||||||
BlackRock
Inflation Protected Bond |
$ | 134,792 | $ | 9,043,513 | $ | (10,120,169 | ) | Short-term | None | |||||||||||||
| (69,934,908 | ) | Long-term | None | |||||||||||||||||||
| $ | (80,055,077 | ) | ||||||||||||||||||||
Bond
Portfolio |
7,773,325 | 480,552 | $ | — | — | — | ||||||||||||||||
| Per Share Amount |
Payable Date |
Record Date |
||||||
|---|---|---|---|---|---|---|---|---|
BlackRock Inflation Protected Bond
|
||||||||
Class
ADV |
$ | 0.0077 | February 3,
2020 |
January 30,
2020 |
||||
Class
I |
$ | 0.0123 | February 3,
2020 |
January 30,
2020 |
||||
Class
S |
$ | 0.0103 | February 3,
2020 |
January 30,
2020 |
||||
VY® BLACKROCK
INFLATION |
SUMMARY PORTFOLIO OF INVESTMENTS AS OF DECEMBER 31, 2019 |
| Principal Amount† |
Value | Percentage of Net Assets |
||||||||||||
|---|---|---|---|---|---|---|---|---|---|---|---|---|---|---|
CORPORATE BONDS/NOTES: 25.7%
|
||||||||||||||
Basic Materials: 0.1%
|
||||||||||||||
200,000 |
Other Securities |
$ | 226,977 | 0.1 | ||||||||||
Communications: 1.3%
|
||||||||||||||
1,000,000 |
Alibaba Group Holding Ltd., 3.125%, 11/28/2021 |
1,020,054 | 0.4 | |||||||||||
2,600,000 |
NBCUniversal Media LLC, 4.375%, 04/01/2021 |
2,681,633 | 0.9 | |||||||||||
| 3,701,687 | 1.3 | |||||||||||||
Consumer, Cyclical: 0.3%
|
||||||||||||||
200,000 |
(1) |
BMW US
Capital LLC, 3.450%, 04/12/2023 |
207,515 | 0.1 | ||||||||||
700,000 |
(1) |
Daimler Finance North America LLC, 3.100%, 05/04/2020 |
702,350 | 0.2 | ||||||||||
| 909,865 | 0.3 | |||||||||||||
Consumer, Non-cyclical: 0.4%
|
||||||||||||||
1,000,000 |
UnitedHealth Group, Inc., 2.875%, 12/15/2021 |
1,020,001 | 0.4 | |||||||||||
Energy: 1.3%
|
||||||||||||||
1,550,000 |
BP
Capital Markets PLC, 3.561%, 11/01/2021 |
1,598,355 | 0.6 | |||||||||||
995,000 |
(1) |
Schlumberger Finance Canada Ltd., 2.200%, 11/20/2020 |
996,646 | 0.3 | ||||||||||
1,000,000 |
(1) |
Schlumberger Finance Canada Ltd., 2.650%, 11/20/2022 |
1,016,859 | 0.4 | ||||||||||
| 3,611,860 | 1.3 | |||||||||||||
Financial: 19.4%
|
||||||||||||||
1,885,000 |
(1) |
AIA
Group Ltd., 2.428%, (US0003M + 0.520%), 09/20/2021 |
1,886,616 | 0.7 | ||||||||||
1,750,000 |
American Express Co., 3.700%, 11/05/2021 |
1,803,359 | 0.6 | |||||||||||
585,000 |
(1) |
ANZ
New Zealand Int’l Ltd./London, 2.200%, 07/17/2020 |
585,894 | 0.2 | ||||||||||
2,000,000 |
(2) |
Bank
of America Corp., 2.738%, 01/23/2022 |
2,015,242 | 0.7 | ||||||||||
2,000,000 |
(2) |
Bank
of America Corp., 2.816%, 07/21/2023 |
2,033,101 | 0.7 | ||||||||||
1,250,000 |
(2) |
Bank
of New York Mellon Corp./The, 2.661%, 05/16/2023 |
1,269,246 | 0.5 | ||||||||||
1,500,000 |
Bank
of Nova Scotia/The, 3.125%, 04/20/2021 |
1,523,811 | 0.5 | |||||||||||
760,000 |
(1) |
Banque
Federative du Credit Mutuel SA, 2.125%, 11/21/2022 |
760,954 | 0.3 | ||||||||||
1,500,000 |
Truist
Financial Corp., 2.150%, 02/01/2021 |
1,504,322 | 0.5 | |||||||||||
1,665,000 |
BNP
Paribas SA, 5.000%, 01/15/2021 |
1,717,908 | 0.6 | |||||||||||
1,335,000 |
Cooperatieve Rabobank UA/NY, 3.125%, 04/26/2021 |
1,356,059 | 0.5 | |||||||||||
2,465,000 |
Credit
Suisse AG/New York NY, 2.100%–3.000%, 10/29/2021–11/12/2021 |
2,491,884 | 0.9 | |||||||||||
| Principal Amount† |
Value | Percentage of Net Assets |
||||||||||||
|---|---|---|---|---|---|---|---|---|---|---|---|---|---|---|
CORPORATE BONDS/NOTES: (continued)
|
||||||||||||||
Financial: (continued)
|
||||||||||||||
1,000,000 |
(1) |
DNB
Bank ASA, 2.375%, 06/02/2021 |
$ | 1,006,694 | 0.4 | |||||||||
1,880,000 |
Fifth
Third Bank/Cincinnati OH, 2.875%–3.350%, 07/26/2021–10/01/2021 |
1,917,843 | 0.7 | |||||||||||
1,100,000 |
Goldman Sachs Group, Inc./The, 2.625%, 04/25/2021 |
1,109,636 | 0.4 | |||||||||||
2,610,000 |
HSBC
Holdings PLC, 2.950%, 05/25/2021 |
2,643,215 | 1.0 | |||||||||||
1,000,000 |
(2) |
JPMorgan Chase Bank NA, 2.604%, 02/01/2021 |
1,000,532 | 0.4 | ||||||||||
2,500,000 |
JPMorgan Chase & Co., 2.400%–4.500%, 06/07/2021–09/23/2022 |
2,587,736 | 0.9 | |||||||||||
800,000 |
KeyBank NA/Cleveland OH, 3.350%, 06/15/2021 |
817,345 | 0.3 | |||||||||||
1,250,000 |
Lloyds
Bank PLC, 3.300%, 05/07/2021 |
1,270,377 | 0.5 | |||||||||||
1,000,000 |
(1) |
Metropolitan Life Global Funding I, 3.375%, 01/11/2022 |
1,028,043 | 0.4 | ||||||||||
2,000,000 |
Mitsubishi UFJ Financial Group, Inc., 3.218%, 03/07/2022 |
2,048,972 | 0.7 | |||||||||||
1,015,000 |
Mitsubishi UFJ Financial Group, Inc., 2.190%–3.535%, 07/26/2021–09/13/2021 |
1,022,397 | 0.4 | |||||||||||
4,000,000 |
Morgan
Stanley, 2.500%, 04/21/2021 |
4,031,258 | 1.5 | |||||||||||
1,500,000 |
National Australia Bank Ltd./New York, 2.500%, 01/12/2021 |
1,509,622 | 0.5 | |||||||||||
1,130,000 |
Santander UK PLC, 2.125%, 11/03/2020 |
1,131,444 | 0.4 | |||||||||||
1,520,000 |
(1) |
Skandinaviska Enskilda Banken AB, 2.200%, 12/12/2022 |
1,524,005 | 0.5 | ||||||||||
1,800,000 |
Sumitomo Mitsui Financial Group, Inc., 2.846%–2.934%, 03/09/2021–01/11/2022 |
1,824,126 | 0.7 | |||||||||||
1,485,000 |
Svenska Handelsbanken AB, 2.450%–3.350%, 03/30/2021–05/24/2021 |
1,498,322 | 0.5 | |||||||||||
295,000 |
(1) |
UBS
AG/London, 2.200%, 06/08/2020 |
295,398 | 0.1 | ||||||||||
2,100,000 |
Wells
Fargo & Co., 3.500%, 03/08/2022 |
2,169,117 | 0.8 | |||||||||||
1,740,000 |
Wells
Fargo Bank NA, 2.600%, 01/15/2021 |
1,752,571 | 0.6 | |||||||||||
700,000 |
Wells Fargo Bank NA, 3.625%, 10/22/2021 |
720,582 | 0.3 | |||||||||||
1,995,000 |
Other Securities |
2,026,469 | 0.7 | |||||||||||
| 53,884,100 | 19.4 | |||||||||||||
Industrial: 0.9%
|
||||||||||||||
1,000,000 |
Boeing
Co/The, 2.700%, 05/01/2022 |
1,015,547 | 0.4 | |||||||||||
1,500,000 |
Caterpillar Financial Services Corp., 1.900%, 09/06/2022 |
1,502,840 | 0.5 | |||||||||||
| 2,518,387 | 0.9 | |||||||||||||
VY® BLACKROCK
INFLATION |
SUMMARY PORTFOLIO OF INVESTMENTS AS OF DECEMBER 31, 2019 (CONTINUED) |
| Principal Amount† |
Value | Percentage of Net Assets | ||||||||||||
|---|---|---|---|---|---|---|---|---|---|---|---|---|---|---|
CORPORATE BONDS/NOTES: (continued)
|
||||||||||||||
Technology: 1.7%
|
||||||||||||||
1,000,000 |
International Business Machines Corp., 1.875%, 08/01/2022 |
$ | 999,465 | 0.4 | ||||||||||
2,275,000 |
International Business Machines Corp., 2.850%, 05/13/2022 |
2,324,920 | 0.8 | |||||||||||
1,000,000 |
Oracle Corp., 2.500%, 05/15/2022 |
1,012,996 | 0.3 | |||||||||||
460,000 |
Other Securities |
465,569 | 0.2 | |||||||||||
| 4,802,950 | 1.7 | |||||||||||||
Utilities: 0.3%
|
||||||||||||||
785,000 |
Wisconsin Public Service Corp., 3.350%, 11/21/2021 |
806,757 | 0.3 | |||||||||||
Total
Corporate Bonds/Notes |
||||||||||||||
(Cost
$70,637,579) |
71,482,584 | 25.7 | ||||||||||||
U.S. TREASURY OBLIGATIONS: 50.3%
|
||||||||||||||
Treasury Inflation Indexed Protected Securities: 50.3%
|
||||||||||||||
7,048,250 |
0.125%,07/15/2026 |
7,072,205 | 2.6 | |||||||||||
5,789,933 |
0.250%,07/15/2029 |
5,848,237 | 2.1 | |||||||||||
11,435,147 |
0.375%,01/15/2027 |
11,611,673 | 4.2 | |||||||||||
10,709,665 |
0.375%,07/15/2027 |
10,927,254 | 3.9 | |||||||||||
8,573,109 |
(3) |
0.500%,01/15/2028 |
8,797,250 | 3.2 | ||||||||||
3,314,275 |
0.625%,01/15/2024 |
3,384,925 | 1.2 | |||||||||||
8,025,942 |
0.625%,01/15/2026 |
8,273,713 | 3.0 | |||||||||||
4,925,052 |
0.625%,02/15/2043 |
4,984,740 | 1.8 | |||||||||||
8,227,391 |
0.750%,07/15/2028 |
8,658,083 | 3.1 | |||||||||||
4,629,287 |
0.750%,02/15/2042 |
4,811,726 | 1.7 | |||||||||||
5,983,354 |
(3) |
0.750%,02/15/2045 |
6,210,393 | 2.2 | ||||||||||
12,828,317 |
0.875%,01/15/2029 |
13,626,843 | 4.9 | |||||||||||
1,743,057 |
0.875%,02/15/2047 |
1,869,538 | 0.7 | |||||||||||
4,653,939 |
1.000%,02/15/2046 |
5,122,442 | 1.8 | |||||||||||
4,163,924 |
1.000%,02/15/2048 |
4,611,749 | 1.7 | |||||||||||
3,185,679 |
1.000%,02/15/2049 |
3,543,308 | 1.3 | |||||||||||
3,008,972 |
1.375%,02/15/2044 |
3,551,186 | 1.3 | |||||||||||
2,756,530 |
1.750%,01/15/2028 |
3,097,495 | 1.1 | |||||||||||
3,850,902 |
2.000%,01/15/2026 |
4,281,370 | 1.5 | |||||||||||
1,870,868 |
2.125%,02/15/2040 |
2,446,834 | 0.9 | |||||||||||
2,767,455 |
2.125%,02/15/2041 |
3,647,514 | 1.3 | |||||||||||
4,405,132 |
2.375%,01/15/2027 |
5,085,839 | 1.8 | |||||||||||
2,121,575 |
2.500%,01/15/2029 |
2,557,627 | 0.9 | |||||||||||
1,841,297 |
3.375%,04/15/2032 |
2,528,918 | 0.9 | |||||||||||
2,768,958 |
0.250%–3.875%, 04/15/2023–04/15/2029 |
3,320,157 | 1.2 | |||||||||||
Total
U.S. Treasury Obligations |
||||||||||||||
(Cost
$133,896,640) |
139,871,019 | 50.3 | ||||||||||||
U.S. GOVERNMENT AGENCY OBLIGATIONS(4): 8.8%
|
||||||||||||||
Federal Home Loan Bank: 2.6%
|
||||||||||||||
5,255,000 |
2.875%, 09/13/2024 |
5,527,594 | 2.0 | |||||||||||
1,515,000 |
3.250%, 11/16/2028 |
1,655,816 | 0.6 | |||||||||||
| 7,183,410 | 2.6 | |||||||||||||
Federal Home Loan Mortgage Corporation: 1.0%
|
||||||||||||||
2,805,000 |
2.375%, 01/13/2022 |
2,847,664 | 1.0 | |||||||||||
| Principal Amount† |
Value | Percentage of Net Assets |
||||||||||||
|---|---|---|---|---|---|---|---|---|---|---|---|---|---|---|
U.S. GOVERNMENT AGENCY OBLIGATIONS(4): (continued)
|
||||||||||||||
Federal National Mortgage Association: 4.4%(4)
|
||||||||||||||
4,830,000 |
1.875%, 09/24/2026 |
$ | 4,818,982 | 1.7 | ||||||||||
7,120,000 |
2.625%, 09/06/2024 |
7,408,881 | 2.7 | |||||||||||
| 12,227,863 | 4.4 | |||||||||||||
Other U.S. Agency Obligations: 0.8%
|
||||||||||||||
2,190,000 |
2.875%, 12/21/2023 |
2,292,582 | 0.8 | |||||||||||
Total
U.S. Government Agency Obligations |
||||||||||||||
(Cost
$23,578,052) |
24,551,519 | 8.8 | ||||||||||||
SOVEREIGN BONDS: 7.2% |
||||||||||||||
2,500,000 |
Israel
Government AID Bond, 5.500%, 04/26/2024 |
2,879,968 | 1.0 | |||||||||||
| EUR | 5,505,719 | (1) | Italy
Buoni Poliennali Del Tesoro, 1.300%, 05/15/2028 |
6,629,219 | 2.4 | |||||||||
| JPY | 351,821,040 | Japanese Government CPI Linked Bond, 0.100%, 03/10/2028 |
3,331,866 | 1.2 | ||||||||||
| JPY | 569,970,800 | Japanese Government CPI Linked Bond, 0.100%, 03/10/2029 |
5,397,818 | 1.9 | ||||||||||
| NZD | 2,055,000 | New Zealand Government Inflation Linked Bond, 2.500%, 09/20/2035 |
1,846,836 | 0.7 | ||||||||||
| EUR | 605,900 | Other Securities |
2,558 | 0.0 | ||||||||||
Total
Sovereign Bonds |
||||||||||||||
(Cost
$19,255,460) |
20,088,265 | 7.2 | ||||||||||||
COMMERCIAL MORTGAGE-BACKED SECURITIES: 1.9% |
||||||||||||||
1,000,000 |
BENCHMARK 2018-B3 A5 Mortgage Trust, 4.025%, 04/10/2051 |
1,104,556 | 0.4 | |||||||||||
375,000 |
Freddie Mac Multifamily Structured Pass Through Certificates K071 A2, 3.286%, 11/25/2027 |
399,135 | 0.2 | |||||||||||
700,000 |
(1) |
GS
Mortgage Securities Corp. Trust 2016-RENT A, 3.203%, 02/10/2029 |
704,037 | 0.2 | ||||||||||
1,000,000 |
GS Mortgage Securities Trust 2017-GS7 A4, 3.430%, 08/10/2050 |
1,059,804 | 0.4 | |||||||||||
1,916,000 |
Other Securities |
2,006,371 | 0.7 | |||||||||||
Total
Commercial Mortgage-Backed Securities |
||||||||||||||
(Cost
$5,037,494) |
5,273,903 | 1.9 | ||||||||||||
ASSET-BACKED SECURITIES: 1.4%
|
||||||||||||||
Auto Floor Plan Asset-Backed Securities: 0.6%
|
||||||||||||||
850,000 |
Ford
Credit Floorplan Master Owner Trust 2017-1 A1, 2.070%, 05/15/2022 |
850,189 | 0.3 | |||||||||||
750,000 |
Ford Credit Floorplan Master Owner Trust A 2018-1 A1, 2.950%, 05/15/2023 |
757,948 | 0.3 | |||||||||||
| 1,608,137 | 0.6 | |||||||||||||
VY® BLACKROCK
INFLATION |
SUMMARY PORTFOLIO OF INVESTMENTS AS OF DECEMBER 31, 2019 (CONTINUED) |
| Principal Amount† |
Value | Percentage of Net Assets |
||||||||||||
|---|---|---|---|---|---|---|---|---|---|---|---|---|---|---|
ASSET-BACKED SECURITIES: (continued)
|
||||||||||||||
Credit Card Asset-Backed Securities: 0.2% |
||||||||||||||
| 625,000 | Other Securities | $ | 623,750 | 0.2 | ||||||||||
Student Loan Asset-Backed Securities: 0.6%
|
||||||||||||||
260,000 |
(1) |
Navient Student Loan Trust 2019-BA A2A, 3.390%, 12/15/2059 |
267,152 | 0.1 | ||||||||||
421,836 |
(1) |
SoFi
Professional Loan Program 2015-B A1 LLC, 2.842%, (US0001M + 1.050%), 04/25/2035 |
423,808 | 0.2 | ||||||||||
800,000 |
(1) |
Sofi Professional Loan Program 2018-C A2FX Trust, 3.590%, 01/25/2048 |
819,137 | 0.3 | ||||||||||
| 1,510,097 | 0.6 | |||||||||||||
Total
Asset-Backed Securities |
||||||||||||||
(Cost
$3,704,450) |
3,741,984 | 1.4 | ||||||||||||
| Value | Percentage of Net Assets |
|||||||||||||
|---|---|---|---|---|---|---|---|---|---|---|---|---|---|---|
PURCHASED OPTIONS(5): 0.5%
|
||||||||||||||
Total
Purchased Options |
||||||||||||||
(Cost
$1,322,271) |
1,324,465 | 0.5 | ||||||||||||
Total
Long-Term Investments |
||||||||||||||
(Cost
$257,431,946) |
266,333,739 | 95.8 | ||||||||||||
| Shares | Value | Percentage of Net Assets |
||||||||||||
SHORT-TERM INVESTMENTS: 0.6%
|
||||||||||||||
Mutual Funds: 0.6%
|
||||||||||||||
1,677,355 |
(6) |
BlackRock Liquidity Funds, FedFund, Institutional Class, 1.520% (Cost $1,677,355) |
1,677,355 | 0.6 | ||||||||||
Total
Short-Term Investments |
||||||||||||||
(Cost
$1,677,355) |
1,677,355 | 0.6 | ||||||||||||
Total Investments in Securities (Cost $259,109,301) |
$ | 268,011,094 | 96.4 | |||||||||||
Assets in Excess of Other Liabilities |
9,946,677 | 3.6 | ||||||||||||
Net
Assets |
$ | 277,957,771 | 100.0 | |||||||||||
| “Other Securities” represents issues not identified as
the top 50 holdings in terms of market value and issues or issuers not exceeding 1% of net assets individually or in aggregate respectively as of
December 31, 2019. The following footnotes apply to either the individual securities noted or one or more of the securities aggregated and listed as a single line item. |
† |
Unless otherwise indicated, principal amount is shown in USD. | |
(1) |
Securities with purchases pursuant to Rule 144A or section 4(a)(2), under the Securities Act of 1933 and may not be resold subject to that rule except to qualified institutional buyers. | |
(2) |
Variable rate security. Rate shown is the rate in effect as of December 31, 2019. | |
(3) |
All or a portion of this security has been pledged as collateral in connection with open futures contracts. Please refer to Note 2 for additional details. | |
(4) |
The Federal Housing Finance Agency (“FHFA”) placed the Federal Home Loan Mortgage Corporation and Federal National Mortgage Association into conservatorship with FHFA as the conservator. As such, the FHFA oversees the continuing affairs of these companies. | |
(5) |
The tables within the Portfolio of Investments detail open purchased options which are non-income producing securities. | |
(6) |
Rate shown is the 7-day yield as of December 31, 2019. |
Currency Abbreviations:
EUR |
EU Euro | |
JPY |
Japanese Yen | |
NZD |
New Zealand Dollar |
Reference Rate Abbreviations:
US0001M |
1-month LIBOR | |
US0003M |
3-month LIBOR |
VY® BLACKROCK
INFLATION |
SUMMARY PORTFOLIO OF INVESTMENTS AS OF DECEMBER 31, 2019 (CONTINUED) |
| Quoted Prices in Active Markets for Identical Investments (Level 1) |
Significant Other Observable Inputs (Level 2) |
Significant Unobservable Inputs (Level 3) |
Fair Value at December 31, 2019 |
|||||||||||||||||
|---|---|---|---|---|---|---|---|---|---|---|---|---|---|---|---|---|---|---|---|---|
Asset
Table |
||||||||||||||||||||
Investments,
at fair value |
||||||||||||||||||||
Purchased
Options |
$ | 130,043 | $ | 1,194,422 | $ | — | $ | 1,324,465 | ||||||||||||
Corporate
Bonds/Notes |
— | 71,482,584 | — | 71,482,584 | ||||||||||||||||
Commercial
Mortgage-Backed Securities |
— | 5,273,903 | — | 5,273,903 | ||||||||||||||||
Asset-Backed
Securities |
— | 3,741,984 | — | 3,741,984 | ||||||||||||||||
U.S. Government
Agency Obligations |
— | 24,551,519 | — | 24,551,519 | ||||||||||||||||
Sovereign
Bonds |
— | 20,088,265 | — | 20,088,265 | ||||||||||||||||
U.S. Treasury
Obligations |
— | 139,871,019 | — | 139,871,019 | ||||||||||||||||
Short-Term
Investments |
1,677,355 | — | — | 1,677,355 | ||||||||||||||||
Total
Investments, at fair value |
$ | 1,807,398 | $ | 266,203,696 | $ | — | $ | 268,011,094 | ||||||||||||
Other
Financial Instruments+ |
||||||||||||||||||||
Centrally
Cleared Swaps |
— | 1,414,166 | — | 1,414,166 | ||||||||||||||||
Forward Foreign
Currency Contracts |
— | 61,470 | — | 61,470 | ||||||||||||||||
Futures |
223,642 | — | — | 223,642 | ||||||||||||||||
OTC
Swaps |
— | 1,366,271 | — | 1,366,271 | ||||||||||||||||
Total
Assets |
$ | 2,031,040 | $ | 269,045,603 | $ | — | $ | 271,076,643 | ||||||||||||
Liabilities
Table |
||||||||||||||||||||
Other
Financial Instruments+ |
||||||||||||||||||||
Centrally
Cleared Swaps |
$ | — | $ | (2,373,007 | ) | $ | — | $ | (2,373,007 | ) | ||||||||||
Forward Foreign
Currency Contracts |
— | (318,897 | ) | — | (318,897 | ) | ||||||||||||||
Futures |
(384,644 | ) | — | — | (384,644 | ) | ||||||||||||||
Written
Options |
(92,369 | ) | (1,351,782 | ) | — | (1,444,151 | ) | |||||||||||||
Total
Liabilities |
$ | (477,013 | ) | $ | (4,043,686 | ) | $ | — | $ | (4,520,699 | ) | |||||||||
ˆ |
See Note 2, “Significant Accounting Policies” in the Notes to Financial Statements for additional information. | |
+ |
Other Financial Instruments may include open forward foreign currency contracts, futures, centrally cleared swaps, OTC swaps and written options. Forward foreign currency contracts, futures and centrally cleared swaps are valued at the unrealized gain (loss) on the instrument. OTC swaps and written options are valued at the fair value of the instrument. |
| Currency Purchased | Currency Sold | Counterparty | Settlement Date | Unrealized Appreciation (Depreciation) |
|||||||||
|---|---|---|---|---|---|---|---|---|---|---|---|---|---|
USD |
40,044 | GBP | 30,000 |
Bank of America
N.A. |
02/05/20 |
$ | 267 | ||||||
USD |
415,000 | CAD | 546,440 |
Bank of America
N.A. |
03/18/20 |
(5,920 | ) | ||||||
USD |
8,217,435 | JPY | 895,898,000 |
Barclays Bank
PLC |
02/05/20 |
(43,315 | ) | ||||||
USD |
464,230 | GBP | 358,245 |
Citibank
N.A. |
02/05/20 |
(10,763 | ) | ||||||
GBP |
285,642 | USD | 370,357 |
Deutsche Bank
AG |
02/05/20 |
8,372 | |||||||
USD |
422,098 | EUR | 381,074 |
Deutsche Bank
AG |
02/05/20 |
(6,254 | ) | ||||||
USD |
88,982 | JPY | 9,654,572 |
JPMorgan Chase
Bank N.A. |
02/05/20 |
(39 | ) | ||||||
USD |
167,161 | EUR | 148,612 |
JPMorgan Chase
Bank N.A. |
02/05/20 |
112 | |||||||
USD |
2,786,485 | JPY | 302,315,000 |
Morgan Stanley & Co. International PLC |
01/06/20 |
3,674 | |||||||
CAD |
372,393 | AUD | 410,000 |
Morgan Stanley & Co. International PLC |
03/18/20 |
(1,403 | ) | ||||||
CAD |
3,883,424 | USD | 2,950,000 |
Morgan Stanley & Co. International PLC |
03/18/20 |
41,380 | |||||||
EUR |
260,000 | USD | 291,572 |
Morgan Stanley & Co. International PLC |
03/18/20 |
1,448 | |||||||
EUR |
379,122 | USD | 420,134 |
NatWest Markets
PLC |
02/05/20 |
6,024 | |||||||
USD |
7,911,562 | EUR | 7,157,000 |
NatWest Markets
PLC |
02/05/20 |
(133,366 | ) | ||||||
GBP |
33,997 | USD | 44,884 |
The Bank of
Montreal |
02/05/20 |
193 | |||||||
USD |
54,838 | CAD | 73,000 |
UBS
AG |
02/05/20 |
(1,388 | ) | ||||||
USD |
2,550,087 | NZD | 3,959,000 |
Westpac Banking
Corp. |
02/05/20 |
(116,449 | ) | ||||||
| $ | (257,427 | ) | |||||||||||
VY® BLACKROCK
INFLATION |
SUMMARY PORTFOLIO OF INVESTMENTS AS OF DECEMBER 31, 2019 (CONTINUED) |
| Description | Number of Contracts |
Expiration Date |
Notional Value |
Unrealized Appreciation/ (Depreciation) |
|||||||||||||||
|---|---|---|---|---|---|---|---|---|---|---|---|---|---|---|---|---|---|---|---|
Long
Contracts: |
|||||||||||||||||||
Canada 10-Year
Bond |
68 | 03/20/20 | $ | 7,199,292 | $ | (120,771 | ) | ||||||||||||
Euro-Schatz |
106 | 03/06/20 | 13,305,586 | (9,019 | ) | ||||||||||||||
U.S. Treasury
10-Year Note |
30 | 03/20/20 | 3,852,656 | (1,137 | ) | ||||||||||||||
U.S. Treasury
2-Year Note |
126 | 03/31/20 | 27,153,000 | (726 | ) | ||||||||||||||
U.S. Treasury
5-Year Note |
412 | 03/31/20 | 48,867,063 | (214,090 | ) | ||||||||||||||
U.S. Treasury
Ultra Long Bond |
8 | 03/20/20 | 1,453,250 | (20,699 | ) | ||||||||||||||
| $ | 101,830,847 | $ | (366,442 | ) | |||||||||||||||
Short
Contracts: |
|||||||||||||||||||
Euro-Bund |
(27 | ) | 03/06/20 | (5,163,466 | ) | 58,530 | |||||||||||||
Japan 10-Year
Bond (TSE) |
(3 | ) | 03/13/20 | (4,201,739 | ) | (5,593 | ) | ||||||||||||
Long-Term
Euro-BTP |
(41 | ) | 03/06/20 | (6,551,722 | ) | (12,609 | ) | ||||||||||||
U.S. Treasury
Ultra 10-Year Note |
(126 | ) | 03/20/20 | (17,728,594 | ) | 165,112 | |||||||||||||
| $ | (33,645,521 | ) | $ | 205,440 | |||||||||||||||
| Pay/Receive Floating Rate |
Floating Rate Index | Floating Rate Index Payment Frequency |
Fixed Rate |
Fixed Rate Payment Frequency |
Maturity Date |
Notional Amount | Fair Value |
Unrealized Appreciation/ (Depreciation) |
|||||||||||||
|---|---|---|---|---|---|---|---|---|---|---|---|---|---|---|---|---|---|---|---|---|---|
Pay |
3-month CAD-CDOR |
Semi-Annual |
1.926 |
% | Semi-Annual |
10/18/21 | CAD | 9,350,000 | $ | (9,850 | ) | $ | (9,972 | ) | |||||||
Pay |
6-month EUR-EURIBOR |
Semi-Annual |
(0.436 |
) | Annual |
10/06/23 | EUR | 310,000 | (2,287 | ) | (2,267 | ) | |||||||||
Pay |
3-month NZD-BBR-FRA |
Quarterly |
1.273 |
Semi-Annual |
08/15/29 | NZD | 1,885,000 | (55,966 | ) | (54,177 | ) | ||||||||||
Pay |
3-month USD-LIBOR |
Quarterly |
3.289 |
Semi-Annual |
10/08/20 | USD | 2,590,000 | 29,527 | 29,487 | ||||||||||||
Pay |
3-month USD-LIBOR |
Quarterly |
1.528 |
Semi-Annual |
11/22/20 | USD | 2,760,000 | (5,997 | ) | (6,040 | ) | ||||||||||
Pay |
3-month USD-LIBOR |
Quarterly |
2.526 |
Semi-Annual |
02/07/22 | USD | 20,030,000 | 335,774 | 351,156 | ||||||||||||
Pay |
3-month USD-LIBOR |
Quarterly |
2.033 |
Semi-Annual |
03/30/22 | USD | 660,000 | 5,002 | 4,991 | ||||||||||||
Pay |
3-month USD-LIBOR |
Quarterly |
2.250 |
Semi-Annual |
04/27/22 | USD | 5,370,000 | 64,074 | 63,985 | ||||||||||||
Pay |
3-month USD-LIBOR |
Quarterly |
1.713 |
Semi-Annual |
07/13/22 | USD | 9,250,000 | 7,172 | 7,027 | ||||||||||||
Pay |
3-month USD-LIBOR |
Quarterly |
3.208 |
Semi-Annual |
10/29/24 | USD | 1,030,000 | 71,287 | 71,287 | ||||||||||||
Pay |
3-month USD-LIBOR |
Quarterly |
3.090 |
Semi-Annual |
11/29/24 | USD | 4,210,000 | 272,302 | 272,226 | ||||||||||||
Pay |
3-month USD-LIBOR |
Quarterly |
1.846 |
Semi-Annual |
08/15/29 | USD | 970,000 | (3,026 | ) | (3,046 | ) | ||||||||||
Pay |
3-month USD-LIBOR |
Quarterly |
1.857 |
Semi-Annual |
08/15/29 | USD | 970,000 | (2,138 | ) | (2,158 | ) | ||||||||||
Pay |
3-month USD-LIBOR |
Quarterly |
2.447 |
Semi-Annual |
05/18/31 | USD | 210,000 | 9,047 | 9,043 | ||||||||||||
Pay |
3-month USD-LIBOR |
Quarterly |
2.102 |
Semi-Annual |
06/22/31 | USD | 100,000 | 1,139 | 1,137 | ||||||||||||
Pay |
3-month USD-LIBOR |
Quarterly |
1.929 |
Semi-Annual |
12/01/56 | USD | 25,000 | (1,222 | ) | (1,223 | ) | ||||||||||
Receive |
6-month EUR-EURIBOR |
Semi-Annual |
(0.450 |
) | Annual |
12/16/21 | EUR | 1,200,000 | 4,054 | 3,997 | |||||||||||
Receive |
6-month EUR-EURIBOR |
Semi-Annual |
(0.290 |
) | Annual |
07/26/23 | EUR | 1,640,000 | 5,759 | 5,603 | |||||||||||
Receive |
6-month EUR-EURIBOR |
Semi-Annual |
(0.300 |
) | Annual |
07/27/23 | EUR | 3,100,000 | 11,561 | 11,262 | |||||||||||
Receive |
6-month EUR-EURIBOR |
Semi-Annual |
(0.167 |
) | Annual |
12/13/23 | EUR | 1,170,000 | 2,162 | 2,129 | |||||||||||
Receive |
6-month EUR-EURIBOR |
Semi-Annual |
(0.110 |
) | Annual |
12/27/23 | EUR | 300,000 | 207 | 201 | |||||||||||
Receive |
6-month EUR-EURIBOR |
Semi-Annual |
(0.056 |
) | Annual |
01/03/24 | EUR | 615,000 | (291 | ) | (304 | ) | |||||||||
Receive |
6-month EUR-EURIBOR |
Semi-Annual |
(0.050 |
) | Annual |
01/03/24 | EUR | 615,000 | (382 | ) | (395 | ) | |||||||||
Receive |
6-month EUR-EURIBOR |
Semi-Annual |
(0.173 |
) | Annual |
11/11/24 | EUR | 260,000 | 744 | 744 | |||||||||||
Receive |
6-month EUR-EURIBOR |
Semi-Annual |
(0.175 |
) | Annual |
03/18/25 | EUR | 60,000 | 301 | 298 | |||||||||||
Receive |
6-month JPY-LIBOR |
Semi-Annual |
0.336 |
Semi-Annual |
02/08/34 | JPY | 860,000 | (116 | ) | (121 | ) | ||||||||||
Receive |
6-month JPY-LIBOR |
Semi-Annual |
0.295 |
Semi-Annual |
06/17/39 | JPY | 5,440,000 | 457 | 394 | ||||||||||||
Receive |
6-month JPY-LIBOR |
Semi-Annual |
0.167 |
Semi-Annual |
08/08/39 | JPY | 3,930,000 | 1,250 | 1,222 | ||||||||||||
Receive |
6-month JPY-LIBOR |
Semi-Annual |
0.715 |
Semi-Annual |
03/21/44 | JPY | 3,980,000 | (1,648 | ) | (1,705 | ) | ||||||||||
Receive |
6-month JPY-LIBOR |
Semi-Annual |
0.201 |
Semi-Annual |
08/28/44 | JPY | 1,960,000 | 1,044 | 1,036 | ||||||||||||
Receive |
3-month NZD-BBR-FRA |
Quarterly |
2.545 |
Semi-Annual |
03/20/29 | NZD | 2,100,000 | (99,092 | ) | (98,156 | ) | ||||||||||
Receive |
3-month NZD-BBR-FRA |
Quarterly |
2.576 |
Semi-Annual |
03/20/29 | NZD | 472,700 | (23,161 | ) | (22,977 | ) | ||||||||||
Receive |
3-month NZD-BBR-FRA |
Quarterly |
2.588 |
Semi-Annual |
03/20/29 | NZD | 252,300 | (12,539 | ) | (12,445 | ) | ||||||||||
Receive |
3-month NZD-BBR-FRA |
Quarterly |
2.800 |
Semi-Annual |
03/20/29 | NZD | 1,401,160 | (86,981 | ) | (85,978 | ) | ||||||||||
Receive |
3-month USD-LIBOR |
Quarterly |
1.560 |
Semi-Annual |
03/27/21 | USD | 5,280,000 | 6,592 | 6,509 | ||||||||||||
Receive |
3-month USD-LIBOR |
Quarterly |
1.560 |
Semi-Annual |
03/30/21 | USD | 1,340,000 | 1,638 | 1,617 | ||||||||||||
Receive |
3-month USD-LIBOR |
Quarterly |
1.770 |
Semi-Annual |
06/15/21 | USD | 5,780,000 | (6,823 | ) | (6,823 | ) | ||||||||||
Receive |
3-month USD-LIBOR |
Quarterly |
2.561 |
Semi-Annual |
08/02/21 | USD | 4,240,000 | (56,784 | ) | (56,855 | ) | ||||||||||
Receive |
3-month USD-LIBOR |
Quarterly |
2.000 |
Semi-Annual |
09/25/21 | USD | 1,000,000 | (5,190 | ) | (5,207 | ) | ||||||||||
VY® BLACKROCK
INFLATION |
SUMMARY PORTFOLIO OF INVESTMENTS AS OF DECEMBER 31, 2019 (CONTINUED) |
| Pay/Receive Floating Rate |
Floating Rate Index | Floating Rate Index Payment Frequency |
Fixed Rate |
Fixed Rate Payment Frequency |
Maturity Date |
Notional Amount | Fair Value |
Unrealized Appreciation/ (Depreciation) |
|||||||||||||
|---|---|---|---|---|---|---|---|---|---|---|---|---|---|---|---|---|---|---|---|---|---|
Receive |
3-month USD-LIBOR |
Quarterly |
1.670 |
% | Semi-Annual |
09/30/21 | USD | 1,450,000 | $ | 711 | $ | 686 | |||||||||
Receive |
3-month USD-LIBOR |
Quarterly |
1.624 |
Semi-Annual |
10/22/21 | USD | 7,105,000 | 8,534 | 8,412 | ||||||||||||
Receive |
3-month USD-LIBOR |
Quarterly |
3.295 |
Semi-Annual |
11/12/21 | USD | 2,540,000 | (74,695 | ) | (74,738 | ) | ||||||||||
Receive |
1-day Overnight Fed Funds Effective Rate |
Annual |
1.305 |
Annual |
12/15/21 | USD | 15,330,000 | 29,733 | 30,407 | ||||||||||||
Receive |
1-day Overnight Fed Funds Effective Rate |
Annual |
1.411 |
Annual |
12/15/21 | USD | 6,780,000 | 977 | 864 | ||||||||||||
Receive |
3-month USD-LIBOR |
Quarterly |
1.870 |
Semi-Annual |
06/03/22 | USD | 5,710,000 | (13,743 | ) | (13,833 | ) | ||||||||||
Receive |
3-month USD-LIBOR |
Quarterly |
1.741 |
Semi-Annual |
07/14/22 | USD | 4,410,000 | (9,008 | ) | (9,082 | ) | ||||||||||
Receive |
3-month USD-LIBOR |
Quarterly |
1.455 |
Semi-Annual |
12/01/22 | USD | 1,180,000 | 4,119 | 4,099 | ||||||||||||
Receive |
3-month USD-LIBOR |
Quarterly |
1.619 |
Semi-Annual |
12/21/22 | USD | 900,000 | 305 | 290 | ||||||||||||
Receive |
3-month USD-LIBOR |
Quarterly |
1.653 |
Semi-Annual |
12/22/22 | USD | 675,000 | (208 | ) | (220 | ) | ||||||||||
Receive |
3-month USD-LIBOR |
Quarterly |
1.658 |
Semi-Annual |
12/22/22 | USD | 675,000 | (274 | ) | (285 | ) | ||||||||||
Receive |
3-month USD-LIBOR |
Quarterly |
2.521 |
Semi-Annual |
02/09/23 | USD | 10,050,000 | (171,012 | ) | (171,539 | ) | ||||||||||
Receive |
3-month USD-LIBOR |
Quarterly |
2.430 |
Semi-Annual |
03/15/23 | USD | 3,200,000 | (48,552 | ) | (48,529 | ) | ||||||||||
Receive |
3-month USD-LIBOR |
Quarterly |
1.771 |
Semi-Annual |
07/12/23 | USD | 9,400,000 | (5,923 | ) | (6,071 | ) | ||||||||||
Receive |
3-month USD-LIBOR |
Quarterly |
1.546 |
Semi-Annual |
10/26/23 | USD | 750,000 | 2,090 | 2,078 | ||||||||||||
Receive |
3-month USD-LIBOR |
Quarterly |
1.587 |
Semi-Annual |
11/01/23 | USD | 730,000 | 1,479 | 1,467 | ||||||||||||
Receive |
3-month USD-LIBOR |
Quarterly |
1.605 |
Semi-Annual |
11/01/23 | USD | 720,000 | 1,218 | 1,206 | ||||||||||||
Receive |
3-month USD-LIBOR |
Quarterly |
2.572 |
Semi-Annual |
02/07/25 | USD | 2,610,000 | (106,149 | ) | (109,199 | ) | ||||||||||
Receive |
3-month USD-LIBOR |
Quarterly |
2.161 |
Semi-Annual |
03/31/25 | USD | 190,000 | (4,002 | ) | (4,006 | ) | ||||||||||
Receive |
3-month USD-LIBOR |
Quarterly |
2.312 |
Semi-Annual |
04/03/25 | USD | 800,000 | (22,606 | ) | (22,621 | ) | ||||||||||
Receive |
3-month USD-LIBOR |
Quarterly |
2.350 |
Semi-Annual |
04/27/25 | USD | 1,440,000 | (43,224 | ) | (43,250 | ) | ||||||||||
Receive |
3-month USD-LIBOR |
Quarterly |
1.755 |
Semi-Annual |
11/15/26 | USD | 1,250,000 | 2,207 | 2,183 | ||||||||||||
Receive |
3-month USD-LIBOR |
Quarterly |
1.832 |
Semi-Annual |
05/15/29 | USD | 260,000 | 987 | 982 | ||||||||||||
Receive |
3-month USD-LIBOR |
Quarterly |
1.670 |
Semi-Annual |
08/15/29 | USD | 2,860,000 | 52,544 | 51,710 | ||||||||||||
Receive |
3-month USD-LIBOR |
Quarterly |
1.765 |
Semi-Annual |
08/15/29 | USD | 970,000 | 9,881 | 9,861 | ||||||||||||
Receive |
3-month USD-LIBOR |
Quarterly |
2.300 |
Semi-Annual |
11/05/29 | USD | 400,000 | (14,813 | ) | (14,822 | ) | ||||||||||
Receive |
3-month USD-LIBOR |
Quarterly |
1.893 |
Semi-Annual |
12/23/29 | USD | 330,000 | 99 | 92 | ||||||||||||
Receive |
3-month USD-LIBOR |
Quarterly |
1.904 |
Semi-Annual |
12/30/29 | USD | 110,000 | (64 | ) | (66 | ) | ||||||||||
Receive |
3-month USD-LIBOR |
Quarterly |
2.357 |
Semi-Annual |
03/29/30 | USD | 1,020,000 | (42,496 | ) | (42,517 | ) | ||||||||||
Receive |
3-month USD-LIBOR |
Quarterly |
2.554 |
Semi-Annual |
05/06/30 | USD | 200,000 | (11,849 | ) | (11,853 | ) | ||||||||||
Receive |
3-month USD-LIBOR |
Quarterly |
2.325 |
Semi-Annual |
06/24/34 | USD | 70,000 | (1,023 | ) | (1,024 | ) | ||||||||||
Receive |
3-month USD-LIBOR |
Quarterly |
1.645 |
Semi-Annual |
08/22/34 | USD | 300,000 | 13,106 | 13,100 | ||||||||||||
Receive |
3-month USD-LIBOR |
Quarterly |
1.907 |
Semi-Annual |
10/21/34 | USD | 320,000 | 7,052 | 7,046 | ||||||||||||
Receive |
3-month USD-LIBOR |
Quarterly |
1.921 |
Semi-Annual |
10/22/34 | USD | 300,000 | 6,257 | 6,251 | ||||||||||||
Receive |
3-month USD-LIBOR |
Quarterly |
1.976 |
Semi-Annual |
10/23/34 | USD | 145,000 | 2,351 | 2,348 | ||||||||||||
Receive |
3-month USD-LIBOR |
Quarterly |
1.982 |
Semi-Annual |
10/23/34 | USD | 145,000 | 2,284 | 2,281 | ||||||||||||
Receive |
3-month USD-LIBOR |
Quarterly |
1.998 |
Semi-Annual |
11/07/34 | USD | 320,000 | 4,638 | 4,631 | ||||||||||||
Receive |
3-month USD-LIBOR |
Quarterly |
2.111 |
Semi-Annual |
11/12/34 | USD | 330,000 | 1,667 | 1,660 | ||||||||||||
Receive |
3-month USD-LIBOR |
Quarterly |
2.098 |
Semi-Annual |
10/23/39 | USD | 180,000 | 2,454 | 2,450 | ||||||||||||
Receive |
3-month USD-LIBOR |
Quarterly |
2.110 |
Semi-Annual |
11/15/44 | USD | 390,000 | 3,600 | 3,592 | ||||||||||||
Receive |
3-month USD-LIBOR |
Quarterly |
2.378 |
Semi-Annual |
07/05/49 | USD | 140,000 | (1,835 | ) | (1,838 | ) | ||||||||||
Receive |
3-month USD-LIBOR |
Quarterly |
1.709 |
Semi-Annual |
08/16/49 | USD | 130,000 | 3,739 | 3,736 | ||||||||||||
Receive |
3-month USD-LIBOR |
Quarterly |
1.667 |
Semi-Annual |
08/17/49 | USD | 100,000 | 3,142 | 3,140 | ||||||||||||
Receive |
3-month USD-LIBOR |
Quarterly |
2.370 |
Semi-Annual |
06/15/50 | USD | 370,000 | (23,037 | ) | (23,047 | ) | ||||||||||
| $ | 28,261 | $ | 41,534 | ||||||||||||||||||
| Pay/Receive Floating Rate |
Floating Rate Index |
Floating Rate Index Payment Frequency |
Fixed Rate |
Fixed Rate Payment Frequency |
Maturity Date |
Notional Amount | Fair Value |
Unrealized Appreciation/ (Depreciation) |
|||||||||||||
|---|---|---|---|---|---|---|---|---|---|---|---|---|---|---|---|---|---|---|---|---|---|
Pay |
Eurostat Eurozone HICP ex Tobacco NSA (CPTFEMU) |
At Termination
Date |
1.390 |
% | At Termination
Date |
06/15/49 | EUR | 235,000 | $ | (14,593 | ) | $ | (13,687 | ) | |||||||
Pay |
Eurostat Eurozone HICP ex Tobacco NSA (CPTFEMU) |
At Termination
Date |
1.395 |
At Termination
Date |
08/15/49 | EUR | 285,000 | (16,050 | ) | (16,104 | ) | ||||||||||
Pay |
Eurostat Eurozone HICP ex Tobacco NSA (CPTFEMU) |
At Termination
Date |
1.427 |
At Termination
Date |
11/15/49 | EUR | 305,000 | (14,201 | ) | (15,658 | ) | ||||||||||
Pay |
U.K. RPI All Items Monthly |
At Termination
Date |
3.385 |
At Termination
Date |
08/15/28 | GBP | 465,000 | 4,683 | 5,512 | ||||||||||||
VY® BLACKROCK
INFLATION |
SUMMARY PORTFOLIO OF INVESTMENTS AS OF DECEMBER 31, 2019 (CONTINUED) |
| Pay/Receive Floating Rate |
Floating Rate Index |
Floating Rate Index Payment Frequency |
Fixed Rate |
Fixed Rate Payment Frequency |
Maturity Date |
Notional Amount | Fair Value |
Unrealized Appreciation/ (Depreciation) |
|||||||||||||
|---|---|---|---|---|---|---|---|---|---|---|---|---|---|---|---|---|---|---|---|---|---|
Pay |
U.K. RPI All Items Monthly |
At Termination
Date |
3.400 |
% | At Termination
Date |
08/15/28 | GBP | 3,160,000 | $ | 39,771 | $ | 45,368 | |||||||||
Pay |
U.K. RPI All Items Monthly |
At Termination
Date |
3.505 |
At Termination
Date |
10/15/28 | GBP | 1,470,000 | 52,462 | 54,272 | ||||||||||||
Pay |
U.K. RPI All Items Monthly |
At Termination
Date |
3.490 |
At Termination
Date |
03/15/29 | GBP | 1,590,000 | 28,298 | 29,567 | ||||||||||||
Pay |
U.K. RPI All Items Monthly |
At Termination
Date |
3.360 |
At Termination
Date |
10/15/39 | GBP | 2,025,000 | 35,808 | 40,401 | ||||||||||||
Pay |
U.K. RPI All Items Monthly |
At Termination
Date |
3.270 |
At Termination
Date |
10/15/44 | GBP | 1,560,000 | 20,053 | 17,218 | ||||||||||||
Pay |
U.S. CPI Urban Consumers NSA (CPURNSA) |
At Termination
Date |
1.750 |
At Termination
Date |
08/22/29 | USD | 1,350,000 | (29,928 | ) | (29,983 | ) | ||||||||||
Pay |
U.S. CPI Urban Consumers NSA (CPURNSA) |
At Termination
Date |
1.857 |
At Termination
Date |
11/25/29 | USD | 1,330,000 | (18,527 | ) | (18,581 | ) | ||||||||||
Receive |
Eurostat Eurozone HICP ex Tobacco NSA (CPTFEMU) |
At Termination
Date |
1.296 |
At Termination
Date |
01/15/29 | EUR | 975,000 | (18,628 | ) | (18,706 | ) | ||||||||||
Receive |
Eurostat Eurozone HICP ex Tobacco NSA (CPTFEMU) |
At Termination
Date |
1.290 |
At Termination
Date |
03/15/29 | EUR | 2,230,000 | (34,646 | ) | (34,758 | ) | ||||||||||
Receive |
Eurostat Eurozone HICP ex Tobacco NSA (CPTFEMU) |
At Termination
Date |
1.053 |
At Termination
Date |
08/15/29 | EUR | 1,110,000 | 16,824 | 16,775 | ||||||||||||
Receive |
Eurostat Eurozone HICP ex Tobacco NSA (CPTFEMU) |
At Termination
Date |
1.088 |
At Termination
Date |
11/15/29 | EUR | 1,115,000 | 14,811 | 15,436 | ||||||||||||
Receive |
U.K. RPI All Items Monthly |
At Termination
Date |
3.456 |
At Termination
Date |
11/15/29 | GBP | 415,000 | (3,346 | ) | (3,543 | ) | ||||||||||
Receive |
U.K. RPI All Items Monthly |
At Termination
Date |
3.458 |
At Termination
Date |
12/15/29 | GBP | 815,000 | (2,405 | ) | (2,408 | ) | ||||||||||
Receive |
U.K. RPI All Items Monthly |
At Termination
Date |
3.420 |
At Termination
Date |
10/15/34 | GBP | 2,025,000 | (41,530 | ) | (48,495 | ) | ||||||||||
Receive |
U.K. RPI All Items Monthly |
At Termination
Date |
3.160 |
At Termination
Date |
10/15/49 | GBP | 1,560,000 | (14,904 | ) | 1,533 | |||||||||||
Receive |
U.S. CPI Urban Consumers NSA (CPURNSA) |
At Termination
Date |
2.299 |
At Termination
Date |
09/28/21 | USD | 7,100,000 | (113,620 | ) | (113,857 | ) | ||||||||||
Receive |
U.S. CPI Urban Consumers NSA (CPURNSA) |
At Termination
Date |
2.205 |
At Termination
Date |
03/21/22 | USD | 5,100,000 | (73,149 | ) | (73,333 | ) | ||||||||||
Receive |
U.S. CPI Urban Consumers NSA (CPURNSA) |
At Termination
Date |
1.890 |
At Termination
Date |
06/29/22 | USD | 6,700,000 | 23,792 | 23,550 | ||||||||||||
Receive |
U.S. CPI Urban Consumers NSA (CPURNSA) |
At Termination
Date |
2.260 |
At Termination
Date |
05/03/23 | USD | 9,000,000 | (208,677 | ) | (209,001 | ) | ||||||||||
Receive |
U.S. CPI Urban Consumers NSA (CPURNSA) |
At Termination
Date |
2.211 |
At Termination
Date |
10/26/23 | USD | 2,500,000 | (49,687 | ) | (49,777 | ) | ||||||||||
Receive |
U.S. CPI Urban Consumers NSA (CPURNSA) |
At Termination
Date |
1.957 |
At Termination
Date |
02/06/24 | USD | 12,000,000 | (67,852 | ) | (68,285 | ) | ||||||||||
Receive |
U.S. CPI Urban Consumers NSA (CPURNSA) |
At Termination
Date |
1.991 |
At Termination
Date |
03/04/24 | USD | 3,000,000 | (16,075 | ) | (16,183 | ) | ||||||||||
Receive |
U.S. CPI Urban Consumers NSA (CPURNSA) |
At Termination
Date |
2.248 |
At Termination
Date |
03/21/24 | USD | 4,900,000 | (118,025 | ) | (118,212 | ) | ||||||||||
Receive |
U.S. CPI Urban Consumers NSA (CPURNSA) |
At Termination
Date |
2.023 |
At Termination
Date |
05/02/24 | USD | 3,500,000 | (22,768 | ) | (22,895 | ) | ||||||||||
Receive |
U.S. CPI Urban Consumers NSA (CPURNSA) |
At Termination
Date |
1.829 |
At Termination
Date |
07/31/24 | USD | 2,700,000 | 335 | 237 | ||||||||||||
VY® BLACKROCK
INFLATION |
SUMMARY PORTFOLIO OF INVESTMENTS AS OF DECEMBER 31, 2019 (CONTINUED) |
| Pay/Receive Floating Rate |
Floating Rate Index |
Floating Rate Index Payment Frequency |
Fixed Rate |
Fixed Rate Payment Frequency |
Maturity Date |
Notional Amount | Fair Value |
Unrealized Appreciation/ (Depreciation) | |||||||||||||
|---|---|---|---|---|---|---|---|---|---|---|---|---|---|---|---|---|---|---|---|---|---|
Receive |
U.S. CPI Urban Consumers NSA (CPURNSA) |
At Termination
Date |
1.706 |
% | At Termination
Date |
08/12/24 | USD | 1,300,000 | $ | 8,841 | $ | 8,794 | |||||||||
Receive |
U.S. CPI Urban Consumers NSA (CPURNSA) |
At Termination
Date |
2.351 |
At Termination
Date |
09/28/24 | USD | 7,400,000 | (236,058 | ) | (236,340 | ) | ||||||||||
Receive |
U.S. CPI Urban Consumers NSA (CPURNSA) |
At Termination
Date |
1.908 |
At Termination
Date |
05/24/25 | USD | 4,500,000 | (3,655 | ) | (3,827 | ) | ||||||||||
Receive |
U.S. CPI Urban Consumers NSA (CPURNSA) |
At Termination
Date |
2.361 |
At Termination
Date |
09/28/25 | USD | 6,150,000 | (224,982 | ) | (225,216 | ) | ||||||||||
Receive |
U.S. CPI Urban Consumers NSA (CPURNSA) |
At Termination
Date |
2.098 |
At Termination
Date |
11/29/25 | USD | 1,600,000 | (25,856 | ) | (25,917 | ) | ||||||||||
Receive |
U.S. CPI Urban Consumers NSA (CPURNSA) |
At Termination
Date |
1.853 |
At Termination
Date |
06/28/26 | USD | 450,000 | 770 | 753 | ||||||||||||
Receive |
U.S. CPI Urban Consumers NSA (CPURNSA) |
At Termination
Date |
2.249 |
At Termination
Date |
10/30/28 | USD | 1,195,000 | (39,803 | ) | (39,852 | ) | ||||||||||
Receive |
U.S. CPI Urban Consumers NSA (CPURNSA) |
At Termination
Date |
1.746 |
At Termination
Date |
09/06/29 | USD | 4,100,000 | 94,341 | 94,174 | ||||||||||||
Receive |
U.S. CPI Urban Consumers NSA (CPURNSA) |
At Termination
Date |
1.786 |
At Termination
Date |
08/22/49 | USD | 430,000 | 28,807 | 28,783 | ||||||||||||
Receive |
U.S. CPI Urban Consumers NSA (CPURNSA) |
At Termination
Date |
1.948 |
At Termination
Date |
11/25/49 | USD | 425,000 | 8,949 | 8,925 | ||||||||||||
Receive |
U.S. CPI Urban Consumers NSA (CPURNSA) |
At Termination
Date |
1.960 |
At Termination
Date |
12/12/49 | USD | 775,000 | 12,989 | 12,945 | ||||||||||||
| $ | (1,017,431 | ) | $ | (1,000,375 | ) | ||||||||||||||||
| Counterparty | Pay/Receive Floating Rate |
Floating Rate Index |
Floating Rate Index Payment Frequency |
Fixed Rate |
Fixed Rate Payment Frequency |
Maturity Date |
Notional Amount | Fair Value |
Upfront Payments Paid/ (Received) |
Unrealized Appreciation/ (Depreciation) |
||||||||||||||||
|---|---|---|---|---|---|---|---|---|---|---|---|---|---|---|---|---|---|---|---|---|---|---|---|---|---|---|
Barclays
Bank PLC |
Receive |
U.S. CPI Urban Consumers NSA (CPURNSA) |
At Termination
Date |
1.437% |
At Termination
Date |
01/15/21 | USD | 22,000,000 | $ | 588,091 | $ | — | $ | 588,091 | ||||||||||||
Citibank
N.A. |
Receive |
U.S. CPI Urban Consumers NSA (CPURNSA) |
At Termination
Date |
1.515 |
At Termination
Date |
01/15/22 | USD | 16,000,000 | 400,515 | — | 400,515 | |||||||||||||||
Citibank
N.A. |
Receive |
U.S. CPI Urban Consumers NSA (CPURNSA) |
At Termination
Date |
1.560 |
At Termination
Date |
01/15/23 | USD | 10,250,000 | 258,105 | — | 258,105 | |||||||||||||||
Citibank
N.A. |
Receive |
U.S. CPI Urban
Consumers NSA (CPURNSA) |
At Termination
Date |
1.660 |
At Termination
Date |
09/22/23 | USD | 5,500,000 | 119,560 | — | 119,560 | |||||||||||||||
| $ | 1,366,271 | $ | — | $ | 1,366,271 | |||||||||||||||||||||
| Description | Put/Call | Expiration Date |
Exercise Price |
Number of Contracts |
Notional Amount | Cost | Fair Value |
||||||||||||||
|---|---|---|---|---|---|---|---|---|---|---|---|---|---|---|---|---|---|---|---|---|---|
90-Day
Eurodollar |
Call |
03/16/20 |
97.75 |
USD | 85 |
20,881,313 |
$ | 15,450 | $ | 109,437 | |||||||||||
90-Day
Eurodollar |
Call |
01/10/20 |
99.00 |
USD | 35 |
8,591,013 |
5,726 | 219 | |||||||||||||
90-Day
Eurodollar |
Call |
12/13/21 |
99.75 |
USD | 106 |
26,074,675 |
18,723 | 6,625 | |||||||||||||
Euro-Bund |
Put |
02/21/20 |
171.00 |
EUR | 8 |
1,363,920 |
6,740 | 13,012 | |||||||||||||
U.S.
Treasury 10-Year Note |
Put |
01/24/20 |
127.50 |
USD | 4 |
513,688 |
1,256 | 750 | |||||||||||||
| $ | 47,895 | $ | 130,043 | ||||||||||||||||||
VY® BLACKROCK
INFLATION |
SUMMARY PORTFOLIO OF INVESTMENTS AS OF DECEMBER 31, 2019 (CONTINUED) |
| Description | Put/Call | Expiration Date |
Exercise Price |
Number of Contracts |
Notional Amount | Premiums Received |
Fair Value |
||||||||||||||
|---|---|---|---|---|---|---|---|---|---|---|---|---|---|---|---|---|---|---|---|---|---|
90-Day
Eurodollar |
Call |
03/16/20 |
97.88 |
USD | 85 |
USD | 20,881,313 |
$ | 12,306 | $ | (82,875 | ) | |||||||||
90-Day
Eurodollar |
Call |
01/10/20 |
99.38 |
USD | 35 |
USD | 8,591,013 |
1,681 | (219 | ) | |||||||||||
90-Day
Eurodollar |
Call |
12/13/21 |
99.38 |
USD | 53 |
USD | 13,037,337 |
23,101 | (9,275 | ) | |||||||||||
| $ | 37,088 | $ | (92,369 | ) | |||||||||||||||||
| Description | Counterparty | Expiration Date |
Exercise Price |
Notional Amount | Cost | Fair Value |
|||||||||
|---|---|---|---|---|---|---|---|---|---|---|---|---|---|---|---|
Call GBP
vs. Put USD |
Citibank N.A. |
05/01/20 |
1.350 |
GBP | 2,145,000 |
$47,424 |
$ | 31,078 | |||||||
$47,424 |
$ | 31,078 | |||||||||||||
| Description | Counterparty | Expiration Date |
Exercise Price |
Notional Amount | Premiums Received |
Fair Value |
||||||||||
|---|---|---|---|---|---|---|---|---|---|---|---|---|---|---|---|---|
Call GBP
vs. Put USD |
Deutsche Bank AG |
05/01/20 |
1.350 |
GBP | 2,145,000 |
$ | 27,379 |
$ | (31,078 | ) | ||||||
| $ | 27,379 |
$ | (31,078 | ) | ||||||||||||
| Description | Counterparty | Pay/ Receive Exercise Rate |
Exercise Rate |
Floating Rate Index |
Expiration Date |
Notional Amount | Cost | Fair Value |
|||||||||||||
|---|---|---|---|---|---|---|---|---|---|---|---|---|---|---|---|---|---|---|---|---|---|
Call on
10-Year Interest Rate Swap(1) |
Barclays Bank PLC |
Receive |
2.950 |
% | 3-month
USD-LIBOR |
03/12/24 |
USD | 870,000 | $ | 39,215 | $ | 76,532 | |||||||||
Call on
10-Year Interest Rate Swap(1) |
Barclays Bank PLC |
Receive |
2.978 |
% | 3-month
USD-LIBOR |
03/07/24 |
USD | 874,500 | 40,205 | 78,504 | |||||||||||
Call on
10-Year Interest Rate Swap(1) |
Barclays Bank PLC |
Receive |
3.052 |
% | 3-month
USD-LIBOR |
01/10/29 |
USD | 220,000 | 12,430 | 20,237 | |||||||||||
Call on
10-Year Interest Rate Swap(1) |
Barclays Bank PLC |
Receive |
3.083 |
% | 3-month
USD-LIBOR |
01/29/29 |
USD | 220,000 | 12,496 | 20,611 | |||||||||||
Call on
10-Year Interest Rate Swap(1) |
Barclays Bank PLC |
Receive |
3.088 |
% | 3-month
USD-LIBOR |
12/06/38 |
USD | 570,000 | 26,505 | 53,192 | |||||||||||
Call on
10-Year Interest Rate Swap(1) |
Citibank N.A. |
Receive |
1.460 |
% | 3-month
USD-LIBOR |
08/16/21 |
USD | 980,000 | 35,072 | 12,305 | |||||||||||
Call on
10-Year Interest Rate Swap(1) |
Citibank N.A. |
Receive |
1.724 |
% | 3-month
USD-LIBOR |
05/19/20 |
USD | 1,180,000 | 20,031 | 9,417 | |||||||||||
Call on
10-Year Interest Rate Swap(1) |
Citibank N.A. |
Receive |
2.824 |
% | 3-month
USD-LIBOR |
01/31/39 |
USD | 120,000 | 6,149 | 9,871 | |||||||||||
Call on
10-Year Interest Rate Swap(1) |
Citibank N.A. |
Receive |
2.978 |
% | 3-month
USD-LIBOR |
01/31/29 |
USD | 100,000 | 5,780 | 8,807 | |||||||||||
Call on
10-Year Interest Rate Swap(1) |
Citibank N.A. |
Receive |
2.985 |
% | 3-month
USD-LIBOR |
04/27/38 |
USD | 10,000 | 493 | 891 | |||||||||||
Call on
10-Year Interest Rate Swap(1) |
JPMorgan Chase Bank N.A. |
Receive |
2.860 |
% | 3-month
USD-LIBOR |
02/22/39 |
USD | 232,500 | 11,503 | 19,461 | |||||||||||
Call on
10-Year Interest Rate Swap(1) |
JPMorgan Chase Bank N.A. |
Receive |
2.985 |
% | 3-month
USD-LIBOR |
04/27/38 |
USD | 200,000 | 9,400 | 17,822 | |||||||||||
Call on
10-Year Interest Rate Swap(1) |
Morgan Stanley & Co. International PLC |
Receive |
3.037 |
% | 3-month
USD-LIBOR |
01/11/29 |
USD | 220,000 | 12,523 | 20,057 | |||||||||||
Call on
1-Year Interest Rate Swap(1) |
JPMorgan Chase Bank N.A. |
Receive |
1.772 |
% | 3-month
USD-LIBOR |
11/05/24 |
USD | 5,250,000 | 28,403 | 24,537 | |||||||||||
Call on
1-Year Interest Rate Swap(1) |
JPMorgan Chase Bank N.A. |
Receive |
2.100 |
% | 3-month
USD-LIBOR |
05/13/20 |
USD | 10,355,000 | 25,111 | 44,575 | |||||||||||
Call on
20-Year interest Rate Swap(2) |
JPMorgan Chase Bank N.A. |
Receive |
0.780 |
% | 6-month
JPY-LIBOR |
04/16/21 |
JPY | 18,900,000 | 5,916 | 14,549 | |||||||||||
Call on
20-Year Interest Rate Swap(2) |
Goldman Sachs International |
Receive |
0.780 |
% | 6-month
JPY-LIBOR |
04/16/21 |
JPY | 1,670,000 | 500 | 1,310 | |||||||||||
Call on
2-Year Interest Rate Swap(1) |
Barclays Bank PLC |
Receive |
1.200 |
% | 3-month
USD-LIBOR |
09/23/20 |
USD | 9,490,000 | 29,894 | 11,722 | |||||||||||
Call on
2-Year Interest Rate Swap(1) |
Barclays Bank PLC |
Receive |
1.500 |
% | 3-month
USD-LIBOR |
06/01/20 |
USD | 6,990,000 | 21,001 | 11,180 | |||||||||||
Call on
2-Year Interest Rate Swap(1) |
JPMorgan Chase Bank N.A. |
Receive |
1.250 |
% | 3-month
USD-LIBOR |
08/10/20 |
USD | 9,640,000 | 45,983 | 10,639 | |||||||||||
Call on
2-Year Interest Rate Swap(1) |
JPMorgan Chase Bank N.A. |
Receive |
2.476 |
% | 3-month
USD-LIBOR |
01/31/20 |
USD | 10,500,000 | 49,792 | 165,916 | |||||||||||
VY® BLACKROCK
INFLATION |
SUMMARY PORTFOLIO OF INVESTMENTS AS OF DECEMBER 31, 2019 (CONTINUED) |
| Description | Counterparty | Pay/ Receive Exercise Rate |
Exercise Rate |
Floating Rate Index |
Expiration Date |
Notional Amount | Cost | Fair Value | |||||||||||||
|---|---|---|---|---|---|---|---|---|---|---|---|---|---|---|---|---|---|---|---|---|---|
Call on
30-Year Interest Rate Swap(1) |
Barclays Bank PLC |
Receive |
1.600% |
3-month
USD-LIBOR |
06/11/20 |
USD | 775,000 | $ | 33,302 | $ | 5,621 | ||||||||||
Call on
5-Year Interest Rate Swap(1) |
Barclays Bank PLC |
Receive |
2.520% |
3-month
USD-LIBOR |
01/31/20 |
USD | 1,350,000 | 15,357 | 51,074 | ||||||||||||
Call on
5-Year Interest Rate Swap(1) |
Citibank N.A. |
Receive |
2.521% |
3-month
USD-LIBOR |
02/26/20 |
USD | 2,390,000 | 26,290 | 90,562 | ||||||||||||
Put on
10-Year Interest Rate Swap(3) |
Barclays Bank PLC |
Pay |
1.100% |
6-month
JPY-LIBOR |
06/29/22 |
JPY | 692,890,000 | 94,254 | 4,834 | ||||||||||||
Put on
10-Year Interest Rate Swap(4) |
Barclays Bank PLC |
Pay |
2.250% |
3-month
USD-LIBOR |
08/08/22 |
USD | 960,000 | 22,728 | 26,599 | ||||||||||||
Put on
10-Year Interest Rate Swap(4) |
Barclays Bank PLC |
Pay |
2.950% |
3-month
USD-LIBOR |
03/12/24 |
USD | 870,000 | 39,215 | 15,807 | ||||||||||||
Put on
10-Year Interest Rate Swap(4) |
Barclays Bank PLC |
Pay |
2.978% |
3-month
USD-LIBOR |
03/07/24 |
USD | 874,500 | 40,205 | 15,344 | ||||||||||||
Put on
10-Year Interest Rate Swap(4) |
Barclays Bank PLC |
Pay |
3.052% |
3-month
USD-LIBOR |
01/10/29 |
USD | 220,000 | 12,430 | 6,794 | ||||||||||||
Put on
10-Year Interest Rate Swap(4) |
Barclays Bank PLC |
Pay |
3.083% |
3-month
USD-LIBOR |
01/29/29 |
USD | 220,000 | 12,496 | 6,654 | ||||||||||||
Put on
10-Year Interest Rate Swap(4) |
Barclays Bank PLC |
Pay |
3.088% |
3-month
USD-LIBOR |
12/06/38 |
USD | 570,000 | 26,505 | 20,286 | ||||||||||||
Put on
10-Year Interest Rate Swap(4) |
Citibank N.A. |
Pay |
1.460% |
3-month
USD-LIBOR |
08/16/21 |
USD | 980,000 | 35,072 | 58,214 | ||||||||||||
Put on
10-Year Interest Rate Swap(4) |
Citibank N.A. |
Pay |
1.724% |
3-month
USD-LIBOR |
05/19/20 |
USD | 1,180,000 | 20,031 | 29,227 | ||||||||||||
Put on
10-Year Interest Rate Swap(4) |
Citibank N.A. |
Pay |
2.350% |
3-month
USD-LIBOR |
07/13/20 |
USD | 2,900,000 | 10,856 | 12,511 | ||||||||||||
Put on
10-Year Interest Rate Swap(4) |
Citibank N.A. |
Pay |
2.824% |
3-month
USD-LIBOR |
01/31/39 |
USD | 120,000 | 6,025 | 4,948 | ||||||||||||
Put on
10-Year Interest Rate Swap(4) |
Citibank N.A. |
Pay |
2.978% |
3-month
USD-LIBOR |
01/31/29 |
USD | 100,000 | 5,778 | 3,282 | ||||||||||||
Put on
10-Year Interest Rate Swap(4) |
Citibank N.A. |
Pay |
2.985% |
3-month
USD-LIBOR |
04/27/38 |
USD | 10,000 | 461 | 379 | ||||||||||||
Put on
10-Year Interest Rate Swap(4) |
JPMorgan Chase Bank N.A. |
Pay |
2.250% |
3-month
USD-LIBOR |
08/02/22 |
USD | 950,000 | 25,650 | 26,194 | ||||||||||||
Put on
10-Year Interest Rate Swap(4) |
JPMorgan Chase Bank N.A. |
Pay |
2.860% |
3-month
USD-LIBOR |
02/22/39 |
USD | 232,500 | 11,503 | 9,392 | ||||||||||||
Put on
10-Year Interest Rate Swap(4) |
JPMorgan Chase Bank N.A. |
Pay |
2.985% |
3-month
USD-LIBOR |
04/27/38 |
USD | 200,000 | 9,400 | 7,577 | ||||||||||||
Put on
10-Year Interest Rate Swap(4) |
Morgan Stanley & Co. International PLC |
Pay |
2.500% |
3-month
USD-LIBOR |
06/13/24 |
USD | 930,000 | 41,811 | 29,280 | ||||||||||||
Put on
10-Year Interest Rate Swap(4) |
Morgan Stanley & Co. International PLC |
Pay |
2.500% |
3-month
USD-LIBOR |
06/20/24 |
USD | 930,000 | 37,600 | 29,374 | ||||||||||||
Put on
10-Year Interest Rate Swap(4) |
Morgan Stanley & Co. International PLC |
Pay |
3.037% |
3-month
USD-LIBOR |
01/11/29 |
USD | 220,000 | 12,523 | 6,878 | ||||||||||||
Put on
1-Year Interest Rate Swap(4) |
JPMorgan Chase Bank N.A. |
Pay |
1.772% |
3-month
USD-LIBOR |
11/05/24 |
USD | 5,250,000 | 28,403 | 31,071 | ||||||||||||
Put on
1-Year Interest Rate Swap(4) |
JPMorgan Chase Bank N.A. |
Pay |
2.100% |
3-month
USD-LIBOR |
05/13/20 |
USD | 10,355,000 | 25,111 | 162 | ||||||||||||
Put on
20-Year interest Rate Swap(3) |
JPMorgan Chase Bank N.A. |
Pay |
0.780% |
6-month
JPY-LIBOR |
04/16/21 |
JPY | 18,900,000 | 5,916 | 653 | ||||||||||||
Put on
20-Year interest Rate Swap(3) |
JPMorgan Chase Bank N.A. |
Pay |
0.780% |
6-month
JPY-LIBOR |
04/16/21 |
JPY | 3,300,000 | 521 | 75 | ||||||||||||
Put on
20-Year interest Rate Swap(3) |
JPMorgan Chase Bank N.A. |
Pay |
0.780% |
6-month
JPY-LIBOR |
04/16/21 |
JPY | 3,300,000 | 521 | 75 | ||||||||||||
Put on
20-Year Interest Rate Swap(3) |
Goldman Sachs International |
Pay |
0.780% |
6-month
JPY-LIBOR |
04/16/21 |
JPY | 1,670,000 | 500 | 56 | ||||||||||||
Put on
2-Year interest Rate Swap(4) |
JPMorgan Chase Bank N.A. |
Pay |
2.476% |
3-month
USD-LIBOR |
01/31/20 |
USD | 7,000,000 | 33,936 | — | ||||||||||||
Put on
30-Year Interest Rate Swap(4) |
Barclays Bank PLC |
Pay |
2.850% |
3-month
USD-LIBOR |
05/09/22 |
USD | 1,170,000 | 67,934 | 27,986 | ||||||||||||
Put on
30-Year Interest Rate Swap(4) |
Barclays Bank PLC |
Pay |
3.800% |
3-month
USD-LIBOR |
06/07/21 |
USD | 830,000 | 32,380 | 1,946 | ||||||||||||
Put on
5-Year interest Rate Swap(4) |
Barclays Bank PLC |
Pay |
2.520% |
3-month
USD-LIBOR |
01/31/20 |
USD | 1,350,000 | 16,770 | — | ||||||||||||
Put on
5-Year interest Rate Swap(4) |
Citibank N.A. |
Pay |
2.521% |
3-month
USD-LIBOR |
02/26/20 |
USD | 2,390,000 | 26,290 | 26 | ||||||||||||
| $ | 1,216,176 | $ | 1,155,016 | ||||||||||||||||||
VY® BLACKROCK
INFLATION |
SUMMARY PORTFOLIO OF INVESTMENTS AS OF DECEMBER 31, 2019 (CONTINUED) |
| Description | Counterparty | Pay/ Receive Exercise Rate |
Exercise Rate |
Floating Rate Index |
Expiration Date |
Notional Amount | Premiums Received |
Fair Value |
|||||||||||||
|---|---|---|---|---|---|---|---|---|---|---|---|---|---|---|---|---|---|---|---|---|---|
Call on
10-Year interest Rate Swap(4) |
Barclays Bank PLC |
Pay |
2.788% |
3-month
USD-LIBOR |
03/08/21 |
USD | 1,312,000 | $ | 39,114 | $ | (105,151 | ) | |||||||||
Call on
10-Year interest Rate Swap(4) |
Barclays Bank PLC |
Pay |
3.050% |
3-month
USD-LIBOR |
03/12/29 |
USD | 700,000 | 37,135 | (64,305 | ) | |||||||||||
Call on
10-Year Interest Rate Swap(4) |
Barclays Bank PLC |
Pay |
1.250% |
3-month
USD-LIBOR |
08/19/20 |
USD | 1,230,000 | 21,341 | (3,957 | ) | |||||||||||
Call on
10-Year Interest Rate Swap(4) |
Barclays Bank PLC |
Pay |
1.605% |
3-month
USD-LIBOR |
08/13/20 |
USD | 980,000 | 24,071 | (7,919 | ) | |||||||||||
Call on
10-Year Interest Rate Swap(4) |
Barclays Bank PLC |
Pay |
1.612% |
3-month
USD-LIBOR |
09/14/20 |
USD | 590,000 | 14,676 | (5,448 | ) | |||||||||||
Call on
10-Year Interest Rate Swap(4) |
Barclays Bank PLC |
Pay |
1.624% |
3-month
USD-LIBOR |
11/02/20 |
USD | 600,000 | 14,640 | (6,542 | ) | |||||||||||
Call on
10-Year Interest Rate Swap(4) |
Barclays Bank PLC |
Pay |
1.637% |
3-month
USD-LIBOR |
11/02/20 |
USD | 590,000 | 14,219 | (6,623 | ) | |||||||||||
Call on
10-Year Interest Rate Swap(4) |
Barclays Bank PLC |
Pay |
1.763% |
3-month
USD-LIBOR |
09/16/20 |
USD | 1,180,000 | 29,677 | (15,858 | ) | |||||||||||
Call on
10-Year Interest Rate Swap(4) |
Barclays Bank PLC |
Pay |
2.200% |
3-month
USD-LIBOR |
06/11/20 |
USD | 1,230,000 | 26,829 | (40,090 | ) | |||||||||||
Call on
10-Year Interest Rate Swap(4) |
Citibank N.A. |
Pay |
1.420% |
3-month
USD-LIBOR |
08/17/20 |
USD | 980,000 | 25,480 | (4,894 | ) | |||||||||||
Call on
10-Year Interest Rate Swap(4) |
JPMorgan Chase Bank N.A. |
Pay |
1.200% |
3-month
USD-LIBOR |
08/17/20 |
USD | 1,230,000 | 22,878 | (3,425 | ) | |||||||||||
Call on
10-Year Interest Rate Swap(4) |
Morgan Stanley & Co. International PLC |
Pay |
2.007% |
3-month
USD-LIBOR |
07/06/20 |
USD | 615,000 | 13,422 | (13,053 | ) | |||||||||||
Call on
1-Year Interest Rate Swap(4) |
Barclays Bank PLC |
Pay |
1.760% |
3-month
USD-LIBOR |
06/10/20 |
USD | 11,440,000 | 32,747 | (18,274 | ) | |||||||||||
Call on
1-Year Interest Rate Swap(4) |
JPMorgan Chase Bank N.A. |
Pay |
1.325% |
3-month
USD-LIBOR |
08/05/20 |
USD | 950,000 | 2,855 | (439 | ) | |||||||||||
Call on
1-Year Interest Rate Swap(4) |
JPMorgan Chase Bank N.A. |
Pay |
1.582% |
3-month
USD-LIBOR |
11/05/20 |
USD | 5,250,000 | 12,416 | (8,749 | ) | |||||||||||
Call on
2-Year interest Rate Swap(4) |
Citibank N.A. |
Pay |
2.460% |
3-month
USD-LIBOR |
02/26/20 |
USD | 5,780,000 | 25,475 | (90,566 | ) | |||||||||||
Call on
2-Year interest Rate Swap(4) |
Deutsche Bank AG |
Pay |
2.400% |
3-month
USD-LIBOR |
02/24/20 |
USD | 2,590,000 | 6,128 | (37,605 | ) | |||||||||||
Call on
2-Year interest Rate Swap(4) |
Deutsche Bank AG |
Pay |
2.878% |
3-month
USD-LIBOR |
04/14/20 |
USD | 260,000 | 1,420 | (6,298 | ) | |||||||||||
Call on
2-Year interest Rate Swap(4) |
Deutsche Bank AG |
Pay |
2.888% |
3-month
USD-LIBOR |
04/14/20 |
USD | 270,000 | 1,496 | (6,593 | ) | |||||||||||
Call on
2-Year interest Rate Swap(4) |
Deutsche Bank AG |
Pay |
2.938% |
3-month
USD-LIBOR |
04/17/20 |
USD | 260,000 | 1,543 | (6,587 | ) | |||||||||||
Call on
2-Year interest Rate Swap(4) |
JPMorgan Chase Bank N.A. |
Pay |
2.436% |
3-month
USD-LIBOR |
02/01/21 |
USD | 3,300,000 | 24,629 | (52,663 | ) | |||||||||||
Call on
2-Year Interest Rate Swap(4) |
Barclays Bank PLC |
Pay |
0.700% |
3-month
USD-LIBOR |
09/23/20 |
USD | 18,970,000 | 20,867 | (6,838 | ) | |||||||||||
Call on
2-Year Interest Rate Swap(4) |
Barclays Bank PLC |
Pay |
1.000% |
3-month
USD-LIBOR |
06/01/20 |
USD | 13,980,000 | 19,149 | (3,525 | ) | |||||||||||
Call on
2-Year Interest Rate Swap(4) |
Citibank N.A. |
Pay |
1.530% |
3-month
USD-LIBOR |
12/14/20 |
USD | 2,815,000 | 13,512 | (9,845 | ) | |||||||||||
Call on
2-Year Interest Rate Swap(4) |
Goldman Sachs International |
Pay |
1.535% |
3-month
USD-LIBOR |
12/11/20 |
USD | 2,815,000 | 13,442 | (9,882 | ) | |||||||||||
Call on
2-Year Interest Rate Swap(4) |
JPMorgan Chase Bank N.A. |
Pay |
0.750% |
3-month
USD-LIBOR |
08/10/20 |
USD | 19,270,000 | 36,618 | (5,127 | ) | |||||||||||
Call on
30-Year Interest Rate Swap(4) |
Barclays Bank PLC |
Pay |
1.910% |
3-month
USD-LIBOR |
11/27/26 |
USD | 190,000 | 24,653 | (17,154 | ) | |||||||||||
Call on
5-Year Interest Rate Swap |
Barclays Bank PLC |
Pay |
-0.035% |
6-month
EUR-EURIBOR |
09/13/22 |
EUR | 600,000 | 9,338 | (5,784 | ) | |||||||||||
Call on
5-Year Interest Rate Swap |
Barclays Bank PLC |
Pay |
-0.138% |
6-month
EUR-EURIBOR |
09/12/22 |
EUR | 600,000 | 9,029 | (4,599 | ) | |||||||||||
Put on
10-Year interest Rate Swap(1) |
Barclays Bank PLC |
Receive |
1.624% |
3-month
USD-LIBOR |
11/02/20 |
USD | 600,000 | 14,640 | (23,319 | ) | |||||||||||
Put on
10-Year interest Rate Swap(1) |
Barclays Bank PLC |
Receive |
1.637% |
3-month
USD-LIBOR |
11/02/20 |
USD | 590,000 | 14,219 | (22,423 | ) | |||||||||||
Put on
10-Year interest Rate Swap(1) |
Barclays Bank PLC |
Receive |
2.788% |
3-month
USD-LIBOR |
03/08/21 |
USD | 1,312,000 | 39,114 | (6,301 | ) | |||||||||||
Put on
10-Year interest Rate Swap(1) |
Barclays Bank PLC |
Receive |
3.050% |
3-month
USD-LIBOR |
03/12/29 |
USD | 700,000 | 37,135 | (21,869 | ) | |||||||||||
Put on
10-Year interest Rate Swap(1) |
Barclays Bank PLC |
Receive |
3.870% |
3-month
USD-LIBOR |
06/07/21 |
USD | 1,770,000 | 34,676 | (1,645 | ) | |||||||||||
VY® BLACKROCK
INFLATION |
SUMMARY PORTFOLIO OF INVESTMENTS AS OF DECEMBER 31, 2019 (CONTINUED) |
| Description | Counterparty | Pay/ Receive Exercise Rate |
Exercise Rate |
Floating
Rate Index |
Expiration Date |
Notional Amount | Premiums Received |
Fair Value | |||||||||||||
|---|---|---|---|---|---|---|---|---|---|---|---|---|---|---|---|---|---|---|---|---|---|
Put on
10-Year Interest Rate Swap(1) |
Barclays Bank PLC |
Receive |
1.605% |
3-month
USD-LIBOR |
08/13/20 |
USD | 980,000 | $ | 24,071 | $ | (36,067 | ) | |||||||||
Put on
10-Year Interest Rate Swap(1) |
Barclays Bank PLC |
Receive |
1.612% |
3-month
USD-LIBOR |
09/14/20 |
USD | 590,000 | 14,676 | (22,206 | ) | |||||||||||
Put on
10-Year Interest Rate Swap(1) |
Barclays Bank PLC |
Receive |
1.650% |
3-month
USD-LIBOR |
08/19/20 |
USD | 1,230,000 | 21,341 | (41,778 | ) | |||||||||||
Put on
10-Year Interest Rate Swap(1) |
Barclays Bank PLC |
Receive |
1.750% |
3-month
USD-LIBOR |
08/07/20 |
USD | 460,000 | 7,671 | (12,469 | ) | |||||||||||
Put on
10-Year Interest Rate Swap(1) |
Barclays Bank PLC |
Receive |
1.763% |
3-month
USD-LIBOR |
09/16/20 |
USD | 1,180,000 | 29,677 | (33,239 | ) | |||||||||||
Put on
10-Year Interest Rate Swap(1) |
Barclays Bank PLC |
Receive |
2.000% |
3-month
USD-LIBOR |
08/03/20 |
USD | 510,000 | 7,599 | (7,324 | ) | |||||||||||
Put on
10-Year Interest Rate Swap(1) |
Barclays Bank PLC |
Receive |
2.200% |
3-month
USD-LIBOR |
06/11/20 |
USD | 1,230,000 | 26,829 | (7,231 | ) | |||||||||||
Put on
10-Year Interest Rate Swap(1) |
Barclays Bank PLC |
Receive |
2.350% |
3-month
USD-LIBOR |
07/10/20 |
USD | 670,000 | 7,102 | (2,829 | ) | |||||||||||
Put on
10-Year Interest Rate Swap(1) |
Barclays Bank PLC |
Receive |
2.750% |
3-month
USD-LIBOR |
05/09/22 |
USD | 2,550,000 | 73,975 | (30,472 | ) | |||||||||||
Put on
10-Year Interest Rate Swap(1) |
Barclays Bank PLC |
Receive |
2.750% |
3-month
USD-LIBOR |
08/08/22 |
USD | 960,000 | 11,568 | (13,027 | ) | |||||||||||
Put on
10-Year Interest Rate Swap(1) |
Barclays Bank PLC |
Receive |
3.250% |
3-month
USD-LIBOR |
08/08/22 |
USD | 960,000 | 5,712 | (5,924 | ) | |||||||||||
Put on
10-Year Interest Rate Swap(1) |
Citibank N.A. |
Receive |
1.420% |
3-month
USD-LIBOR |
08/17/20 |
USD | 980,000 | 25,480 | (49,564 | ) | |||||||||||
Put on
10-Year Interest Rate Swap(1) |
Citibank N.A. |
Receive |
1.950% |
3-month
USD-LIBOR |
07/13/20 |
USD | 970,000 | 10,406 | (14,965 | ) | |||||||||||
Put on
10-Year Interest Rate Swap(1) |
Citibank N.A. |
Receive |
2.300% |
3-month
USD-LIBOR |
06/15/20 |
USD | 930,000 | 14,155 | (3,930 | ) | |||||||||||
Put on
10-Year Interest Rate Swap(1) |
Goldman Sachs International |
Receive |
2.300% |
3-month
USD-LIBOR |
07/27/20 |
USD | 940,000 | 11,515 | (5,252 | ) | |||||||||||
Put on
10-Year Interest Rate Swap(1) |
Goldman Sachs International |
Receive |
2.350% |
3-month
USD-LIBOR |
07/10/20 |
USD | 670,000 | 6,767 | (2,829 | ) | |||||||||||
Put on
10-Year Interest Rate Swap(1) |
JPMorgan Chase Bank N.A. |
Receive |
1.600% |
3-month
USD-LIBOR |
08/17/20 |
USD | 1,230,000 | 22,878 | (45,852 | ) | |||||||||||
Put on
10-Year Interest Rate Swap(1) |
JPMorgan Chase Bank N.A. |
Receive |
2.750% |
3-month
USD-LIBOR |
08/02/22 |
USD | 950,000 | 13,015 | (12,792 | ) | |||||||||||
Put on
10-Year Interest Rate Swap(1) |
JPMorgan Chase Bank N.A. |
Receive |
3.250% |
3-month
USD-LIBOR |
08/02/22 |
USD | 950,000 | 6,222 | (5,798 | ) | |||||||||||
Put on
10-Year Interest Rate Swap(1) |
Morgan Stanley & Co. International PLC |
Receive |
2.007% |
3-month
USD-LIBOR |
07/06/20 |
USD | 615,000 | 13,422 | (7,835 | ) | |||||||||||
Put on
10-Year Interest Rate Swap(1) |
Morgan Stanley & Co. International PLC |
Receive |
2.250% |
3-month
USD-LIBOR |
08/20/24 |
USD | 980,000 | 29,054 | (40,636 | ) | |||||||||||
Put on
10-Year Interest Rate Swap(1) |
Morgan Stanley & Co. International PLC |
Receive |
3.000% |
3-month
USD-LIBOR |
06/13/24 |
USD | 930,000 | 25,539 | (16,980 | ) | |||||||||||
Put on
10-Year Interest Rate Swap(1) |
Morgan Stanley & Co. International PLC |
Receive |
3.000% |
3-month
USD-LIBOR |
06/20/24 |
USD | 930,000 | 22,714 | (17,056 | ) | |||||||||||
Put on
10-Year Interest Rate Swap(1) |
Morgan Stanley & Co. International PLC |
Receive |
3.500% |
3-month
USD-LIBOR |
06/13/24 |
USD | 930,000 | 15,565 | (9,454 | ) | |||||||||||
Put on
10-Year Interest Rate Swap(1) |
Morgan Stanley & Co. International PLC |
Receive |
3.500% |
3-month
USD-LIBOR |
06/20/24 |
USD | 930,000 | 13,630 | (9,509 | ) | |||||||||||
Put on
1-Year Interest Rate Swap(1) |
Barclays Bank PLC |
Receive |
1.760% |
3-month
USD-LIBOR |
06/10/20 |
USD | 11,440,000 | 32,747 | (6,724 | ) | |||||||||||
Put on
1-Year Interest Rate Swap(1) |
Barclays Bank PLC |
Receive |
2.150% |
3-month
USD-LIBOR |
05/28/21 |
USD | 14,860,000 | 41,682 | (11,271 | ) | |||||||||||
Put on
1-Year Interest Rate Swap(1) |
Citibank N.A. |
Receive |
2.350% |
3-month
USD-LIBOR |
05/17/21 |
USD | 10,930,000 | 21,669 | (4,664 | ) | |||||||||||
Put on
1-Year Interest Rate Swap(1) |
Goldman Sachs International |
Receive |
2.320% |
3-month
USD-LIBOR |
04/06/20 |
USD | 11,505,000 | 24,448 | (2 | ) | |||||||||||
Put on
1-Year Interest Rate Swap(1) |
Goldman Sachs International |
Receive |
2.350% |
3-month
USD-LIBOR |
04/06/20 |
USD | 11,505,000 | 24,506 | (1 | ) | |||||||||||
Put on
1-Year Interest Rate Swap(1) |
JPMorgan Chase Bank N.A. |
Receive |
1.325% |
3-month
USD-LIBOR |
08/05/20 |
USD | 950,000 | 2,855 | (3,346 | ) | |||||||||||
Put on
1-Year Interest Rate Swap(1) |
JPMorgan Chase Bank N.A. |
Receive |
1.582% |
3-month
USD-LIBOR |
11/05/20 |
USD | 5,250,000 | 12,416 | (10,220 | ) | |||||||||||
Put on
1-Year Interest Rate Swap(1) |
Morgan Stanley & Co. International PLC |
Receive |
2.400% |
3-month
USD-LIBOR |
06/01/21 |
USD | 18,400,000 | 33,304 | (7,410 | ) | |||||||||||
Put on
2-Year interest Rate Swap(5) |
Barclays Bank PLC |
Receive |
0.000% |
6-month
EUR-EURIBOR |
06/14/21 |
EUR | 1,040,000 | 2,873 | (1,569 | ) | |||||||||||
Put on
2-Year interest Rate Swap(5) |
Barclays Bank PLC |
Receive |
0.000% |
6-month
EUR-EURIBOR |
06/14/21 |
EUR | 1,010,000 | 2,747 | (1,219 | ) | |||||||||||
VY® BLACKROCK
INFLATION |
SUMMARY PORTFOLIO OF INVESTMENTS AS OF DECEMBER 31, 2019 (CONTINUED) |
| Description | Counterparty | Pay/ Receive Exercise Rate |
Exercise Rate |
Floating
Rate Index |
Expiration Date |
Notional Amount | Premiums Received |
Fair Value | |||||||||||||
|---|---|---|---|---|---|---|---|---|---|---|---|---|---|---|---|---|---|---|---|---|---|
Put on
2-Year interest Rate Swap(5) |
Barclays Bank PLC |
Receive |
0.000% |
6-month
EUR-EURIBOR |
06/25/21 |
EUR | 1,140,000 | $ | 2,605 | $ | (1,808 | ) | |||||||||
Put on
2-Year interest Rate Swap(5) |
Barclays Bank PLC |
Receive |
0.050% |
6-month
EUR-EURIBOR |
06/10/21 |
EUR | 2,310,000 | 5,817 | (2,752 | ) | |||||||||||
Put on
2-Year interest Rate Swap(5) |
Barclays Bank PLC |
Receive |
0.100% |
6-month
EUR-EURIBOR |
03/29/21 |
EUR | 4,470,000 | 15,550 | (2,744 | ) | |||||||||||
Put on
2-Year interest Rate Swap(5) |
Barclays Bank PLC |
Receive |
0.110% |
6-month
EUR-EURIBOR |
05/17/21 |
EUR | 2,262,400 | 7,485 | (1,797 | ) | |||||||||||
Put on
2-Year interest Rate Swap(5) |
Barclays Bank PLC |
Receive |
0.120% |
6-month
EUR-EURIBOR |
04/08/21 |
EUR | 6,960,000 | 26,460 | (3,196 | ) | |||||||||||
Put on
2-Year interest Rate Swap(5) |
Barclays Bank PLC |
Receive |
0.200% |
6-month
EUR-EURIBOR |
01/23/20 |
EUR | 2,210,000 | 2,591 | — | ||||||||||||
Put on
2-Year interest Rate Swap(5) |
Barclays Bank PLC |
Receive |
0.200% |
6-month
EUR-EURIBOR |
01/31/20 |
EUR | 1,200,000 | 1,075 | — | ||||||||||||
Put on
2-Year interest Rate Swap(5) |
Barclays Bank PLC |
Receive |
0.550% |
6-month
EUR-EURIBOR |
12/21/20 |
EUR | 1,790,000 | 6,492 | (34 | ) | |||||||||||
Put on
2-Year interest Rate Swap(5) |
Citibank N.A. |
Receive |
0.000% |
6-month
EUR-EURIBOR |
06/21/21 |
EUR | 1,220,000 | 2,973 | (1,522 | ) | |||||||||||
Put on
2-Year interest Rate Swap(5) |
Citibank N.A. |
Receive |
0.100% |
6-month
EUR-EURIBOR |
04/12/21 |
EUR | 3,490,000 | 11,641 | (2,342 | ) | |||||||||||
Put on
2-Year interest Rate Swap(5) |
Goldman Sachs International |
Receive |
0.000% |
6-month
EUR-EURIBOR |
06/18/21 |
EUR | 1,040,000 | 2,410 | (1,601 | ) | |||||||||||
Put on
2-Year interest Rate Swap(5) |
Goldman Sachs International |
Receive |
0.160% |
6-month
EUR-EURIBOR |
04/12/21 |
EUR | 3,490,000 | 11,750 | (1,736 | ) | |||||||||||
Put on
2-Year interest Rate Swap(5) |
JPMorgan Chase Bank N.A. |
Receive |
0.600% |
6-month
EUR-EURIBOR |
12/14/20 |
EUR | 3,790,000 | 14,342 | (51 | ) | |||||||||||
Put on
2-Year interest Rate Swap(5) |
Morgan Stanley & Co. International PLC |
Receive |
0.080% |
6-month
EUR-EURIBOR |
05/31/21 |
EUR | 1,490,000 | 4,347 | (1,165 | ) | |||||||||||
Put on
2-Year interest Rate Swap(5) |
Morgan Stanley & Co. International PLC |
Receive |
0.150% |
6-month
EUR-EURIBOR |
04/19/21 |
EUR | 3,460,000 | 12,434 | (1,899 | ) | |||||||||||
Put on
2-Year interest Rate Swap(1) |
Barclays Bank PLC |
Receive |
2.000% |
3-month
USD-LIBOR |
11/27/20 |
USD | 5,720,000 | 7,751 | (8,642 | ) | |||||||||||
Put on
2-Year interest Rate Swap(1) |
Citibank N.A. |
Receive |
1.530% |
3-month
USD-LIBOR |
12/14/20 |
USD | 2,815,000 | 13,512 | (15,688 | ) | |||||||||||
Put on
2-Year interest Rate Swap(1) |
Citibank N.A. |
Receive |
2.460% |
3-month
USD-LIBOR |
02/26/20 |
USD | 5,780,000 | 25,475 | — | ||||||||||||
Put on
2-Year interest Rate Swap(1) |
Citibank N.A. |
Receive |
3.250% |
3-month
USD-LIBOR |
12/29/20 |
USD | 3,130,000 | 11,424 | (195 | ) | |||||||||||
Put on
2-Year interest Rate Swap(1) |
Deutsche Bank AG |
Receive |
2.878% |
3-month
USD-LIBOR |
04/14/20 |
USD | 6,260,000 | 45,307 | (1 | ) | |||||||||||
Put on
2-Year interest Rate Swap(1) |
Deutsche Bank AG |
Receive |
2.888% |
3-month
USD-LIBOR |
04/14/20 |
USD | 270,000 | 2,205 | — | ||||||||||||
Put on
2-Year interest Rate Swap(1) |
Deutsche Bank AG |
Receive |
2.900% |
3-month
USD-LIBOR |
05/29/20 |
USD | 3,410,000 | 25,063 | (2 | ) | |||||||||||
Put on
2-Year interest Rate Swap(1) |
Deutsche Bank AG |
Receive |
2.938% |
3-month
USD-LIBOR |
04/17/20 |
USD | 260,000 | 1,985 | — | ||||||||||||
Put on
2-Year interest Rate Swap(1) |
Deutsche Bank AG |
Receive |
3.400% |
3-month
USD-LIBOR |
02/24/20 |
USD | 2,590,000 | 9,454 | — | ||||||||||||
Put on
2-Year interest Rate Swap(1) |
Goldman Sachs International |
Receive |
2.800% |
3-month
USD-LIBOR |
01/03/20 |
USD | 1,910,000 | 4,450 | — | ||||||||||||
Put on
2-Year interest Rate Swap(1) |
Goldman Sachs International |
Receive |
2.878% |
3-month
USD-LIBOR |
04/14/20 |
USD | 260,000 | 2,150 | — | ||||||||||||
Put on
2-Year interest Rate Swap(1) |
Goldman Sachs International |
Receive |
2.888% |
3-month
USD-LIBOR |
04/14/20 |
USD | 6,270,000 | 45,301 | — | ||||||||||||
Put on
2-Year interest Rate Swap(1) |
Goldman Sachs International |
Receive |
3.150% |
3-month
USD-LIBOR |
05/05/20 |
USD | 2,100,000 | 11,602 | — | ||||||||||||
Put on
2-Year interest Rate Swap(1) |
Goldman Sachs International |
Receive |
3.350% |
3-month
USD-LIBOR |
05/29/20 |
USD | 2,890,000 | 10,512 | — | ||||||||||||
Put on
2-Year interest Rate Swap(1) |
Goldman Sachs International |
Receive |
3.450% |
3-month
USD-LIBOR |
06/08/20 |
USD | 2,870,000 | 11,882 | — | ||||||||||||
Put on
2-Year interest Rate Swap(1) |
Goldman Sachs International |
Receive |
3.500% |
3-month
USD-LIBOR |
06/15/20 |
USD | 1,820,000 | 6,779 | — | ||||||||||||
Put on
2-Year interest Rate Swap(1) |
JPMorgan Chase Bank N.A. |
Receive |
2.436% |
3-month
USD-LIBOR |
02/01/21 |
USD | 3,300,000 | 26,341 | (2,020 | ) | |||||||||||
Put on
2-Year Interest Rate Swap(5) |
Barclays Bank PLC |
Receive |
0.000% |
6-month
EUR-EURIBOR |
07/01/21 |
EUR | 1,210,000 | 2,499 | (1,967 | ) | |||||||||||
Put on
2-Year Interest Rate Swap(5) |
Barclays Bank PLC |
Receive |
0.000% |
6-month
EUR-EURIBOR |
07/19/21 |
EUR | 1,240,000 | 2,269 | (2,163 | ) | |||||||||||
Put on
2-Year Interest Rate Swap(5) |
Barclays Bank PLC |
Receive |
-0.050% |
6-month
EUR-EURIBOR |
07/02/21 |
EUR | 1,180,000 | 2,489 | (2,375 | ) | |||||||||||
VY® BLACKROCK
INFLATION |
SUMMARY PORTFOLIO OF INVESTMENTS AS OF DECEMBER 31, 2019 (CONTINUED) |
| Description | Counterparty | Pay/ Receive Exercise Rate |
Exercise Rate |
Floating Rate Index |
Expiration Date |
Notional Amount | Premiums Received |
Fair Value | |||||||||||||
|---|---|---|---|---|---|---|---|---|---|---|---|---|---|---|---|---|---|---|---|---|---|
Put on
2-Year Interest Rate Swap(5) |
Barclays Bank PLC |
Receive |
–0.150% |
6-month
EUR-EURIBOR |
08/09/21 |
EUR | 1,570,000 | $ | 2,128 | $ | (5,192 | ) | |||||||||
Put on
2-Year Interest Rate Swap(5) |
Barclays Bank PLC |
Receive |
–0.150% |
6-month
EUR-EURIBOR |
08/09/21 |
EUR | 2,780,000 | 3,847 | (9,193 | ) | |||||||||||
Put on
2-Year Interest Rate Swap(5) |
Barclays Bank PLC |
Receive |
–0.250% |
6-month
EUR-EURIBOR |
09/03/21 |
EUR | 5,030,000 | 8,276 | (20,919 | ) | |||||||||||
Put on
2-Year Interest Rate Swap(1) |
Barclays Bank PLC |
Receive |
3.500% |
3-month
USD-LIBOR |
08/24/20 |
USD | 3,560,000 | 12,015 | (4 | ) | |||||||||||
Put on
2-Year Interest Rate Swap(1) |
Goldman Sachs International |
Receive |
1.535% |
3-month
USD-LIBOR |
12/11/20 |
USD | 2,815,000 | 13,442 | (15,449 | ) | |||||||||||
Put on
30-Year Interest Rate Swap(1) |
Barclays Bank PLC |
Receive |
1.910% |
3-month
USD-LIBOR |
11/27/26 |
USD | 190,000 | 24,653 | (26,899 | ) | |||||||||||
Put on
30-Year Interest Rate Swap(1) |
Barclays Bank PLC |
Receive |
2.850% |
3-month
USD-LIBOR |
06/11/20 |
USD | 930,000 | 12,490 | (1,997 | ) | |||||||||||
Put on
5-Year Interest Rate Swap(5) |
Barclays Bank PLC |
Receive |
0.000% |
6-month
EUR-EURIBOR |
07/27/20 |
EUR | 1,740,000 | 4,896 | (5,590 | ) | |||||||||||
Put on
5-Year Interest Rate Swap(5) |
Barclays Bank PLC |
Receive |
-0.035% |
6-month
EUR-EURIBOR |
09/13/22 |
EUR | 600,000 | 9,338 | (12,946 | ) | |||||||||||
Put on
5-Year Interest Rate Swap(5) |
Barclays Bank PLC |
Receive |
-0.138% |
6-month
EUR-EURIBOR |
09/12/22 |
EUR | 600,000 | 9,029 | (15,154 | ) | |||||||||||
| $ | 1,834,949 | $ | (1,313,837 | ) | |||||||||||||||||
| Description | Counterparty | Exercise Rate | Pay/Receive Exercise Rate |
Expiration Date |
Notional Amount |
Cost | Fair Value | ||||||||||||
|---|---|---|---|---|---|---|---|---|---|---|---|---|---|---|---|---|---|---|---|
Put
Option-Max [0, Exercise Rate)- 5-Year Constant Maturity Swap] |
Goldman Sachs
International |
0.350% | Receive | 07/08/20 | USD | 4,670,000 | $ | 3,853 | $ | 2,951 | |||||||||
Put
Option-Max [0, Exercise Rate)- 5-Year Constant Maturity Swap] |
Goldman Sachs
International |
0.400% | Receive | 06/29/20 | USD | 4,630,000 | 3,704 | 4,001 | |||||||||||
| $ | 7,557 | $ | 6,952 | ||||||||||||||||
At December 31, 2019, the following over-the-counter purchased interest rate caps were outstanding for VY® BlackRock Inflation Protected Bond Portfolio:
| Description | Counterparty | Exercise Rate | Pay/Receive Exercise Rate |
Expiration Date |
Notional Amount |
Cost | Fair Value | ||||||||||||
|---|---|---|---|---|---|---|---|---|---|---|---|---|---|---|---|---|---|---|---|
Call Option-Max [0, 5-Year Constant Maturity Swap)-Exercise Rate] |
Morgan Stanley & Co. International PLC |
0.370% | Pay | 02/12/20 | USD | 4,410,000 | $ | 3,219 | $ | 1,376 | |||||||||
| $ | 3,219 | $ | 1,376 | ||||||||||||||||
| Description | Counterparty | Exercise Rate | Pay/Receive Exercise Rate |
Expiration Date |
Notional Amount |
Premiums Received |
Fair Value | ||||||||||||
|---|---|---|---|---|---|---|---|---|---|---|---|---|---|---|---|---|---|---|---|
Call Option-Max [0, 5-Year Constant Maturity Swap)-Exercise Rate] |
Morgan Stanley & Co. International PLC |
0.470% | Pay | 02/12/20 | USD | 4,410,000 | $ | 1,590 | $ | (212 | ) | ||||||||
| $ | 1,590 | $ | (212 | ) | |||||||||||||||
| VY® BLACKROCK INFLATION | SUMMARY PORTFOLIO OF INVESTMENTS |
| PROTECTED BOND PORTFOLIO | AS OF DECEMBER 31, 2019 (CONTINUED) |
| Description | Counterparty | Exercise Rate | Pay/Receive Exercise Rate |
Expiration Date |
Notional Amount |
Premiums Received |
Fair Value | |||||||||||
|---|---|---|---|---|---|---|---|---|---|---|---|---|---|---|---|---|---|---|
Put
Option-Max [0, Exercise Rate)- 5-Year Constant Maturity Swap] |
Goldman Sachs
International |
0.250% | Receive | 07/08/20 | USD 9,330,000 | $ | 4,665 | $ | (2,715 | ) | ||||||||
Put
Option-Max [0, Exercise Rate)- 5-Year Constant Maturity Swap] |
Goldman Sachs
International |
0.300% | Receive | 06/29/20 | USD 9,260,000 | 4,630 | (3,940 | ) | ||||||||||
| $ | 9,295 | $ | (6,655 | ) | ||||||||||||||
(1) |
Portfolio receives the exercise rate semi-annually and pays the floating rate index quarterly. |
(2) |
Portfolio receives the exercise rate semi-annually and pays the floating rate index semi-annually. |
(3) |
Portfolio pays the exercise rate semi-annually and receives the floating rate index semi-annually. |
(4) |
Portfolio pays the exercise rate semi-annually and receives the floating rate index quarterly. |
(5) |
Portfolio receives the exercise rate annually and pays the floating rate index semi-annually. |
Currency Abbreviations
AUD — Australian Dollar
CAD — Canadian Dollar
EUR — EU Euro
GBP — British Pound
JPY — Japanese Yen
NZD — New Zealand Dollar
USD — United States Dollar
| Derivatives not accounted for as hedging instruments |
Location on Statement of Assets and Liabilities |
Fair Value | |||||||
|---|---|---|---|---|---|---|---|---|---|
Asset
Derivatives |
|||||||||
Foreign exchange
contracts |
Investments
in securities at value* |
$ | 31,078 | ||||||
Interest rate
contracts |
Investments
in securities at value* |
1,293,387 | |||||||
Foreign exchange
contracts |
Unrealized
appreciation on forward foreign currency contracts |
61,470 | |||||||
Interest rate
contracts |
Net Assets
— Unrealized appreciation** |
223,642 | |||||||
Interest rate
contracts |
Net Assets
— Unrealized appreciation*** |
1,414,166 | |||||||
Interest rate
contracts |
Unrealized
appreciation on OTC swap agreements |
1,366,271 | |||||||
Total Asset
Derivatives |
$ | 4,390,014 | |||||||
Liability
Derivatives |
|||||||||
Foreign exchange
contracts |
Unrealized
depreciation on forward foreign currency contracts |
$ | 318,897 | ||||||
Interest rate
contracts |
Net Assets
— Unrealized depreciation** |
384,644 | |||||||
Interest rate
contracts |
Net Assets
— Unrealized depreciation*** |
2,373,007 | |||||||
Foreign exchange
contracts |
Written
options, at fair value |
31,078 | |||||||
Interest rate
contracts |
Written
options, at fair value |
1,413,073 | |||||||
Total Liability
Derivatives |
$ | 4,520,699 | |||||||
* |
Includes purchased options. |
** |
Includes cumulative appreciation/depreciation of futures contracts as reported in the table within the Portfolio of Investments. |
*** |
Includes cumulative appreciation/depreciation of centrally cleared swaps as reported in the table within the Portfolio of Investments. Only current day’s variation margin receivable/payable is shown on the Statement of Assets and Liabiliites. |
| VY® BLACKROCK INFLATION | SUMMARY PORTFOLIO OF INVESTMENTS |
| PROTECTED BOND PORTFOLIO | AS OF DECEMBER 31, 2019 (CONTINUED) |
| Amount of Realized Gain or (Loss) on Derivatives Recognized in Income | ||||||||||||||||||||||
|---|---|---|---|---|---|---|---|---|---|---|---|---|---|---|---|---|---|---|---|---|---|---|
| Derivatives not
accounted for as hedging instruments |
Investments* | Forward
foreign currency contracts |
Futures | Swaps | Written options |
Total | ||||||||||||||||
Foreign exchange
contracts |
$ | (16,487 | ) | $ | 1,085,534 | $ | — | $ | — | $ | — |
$ | 1,069,047 |
|||||||||
Interest rate
contracts |
51,972 | — | (709,522 | ) | (1,652,067 | ) | (3,731 |
) | (2,313,348 |
) | ||||||||||||
Total |
$ | 35,485 | $ | 1,085,534 | $ | (709,522 | ) | $ | (1,652,067 | ) | $ | (3,731 |
) | $ | (1,244,301 |
) | ||||||
| Change in Unrealized Appreciation or (Depreciation) on Derivatives Recognized in Income | ||||||||||||||||||||||
|---|---|---|---|---|---|---|---|---|---|---|---|---|---|---|---|---|---|---|---|---|---|---|
| Derivatives not
accounted for as hedging instruments |
Investments* | Forward
foreign currency contracts |
Futures | Swaps | Written options |
Total | ||||||||||||||||
Foreign exchange
contracts |
$ | (16,346 | ) | $ | (259,851 | ) | $ | — | $ | — | $ | (3,699 |
) | $ | (279,896 |
) | ||||||
Interest rate
contracts |
(117,826 | ) | — | (452,826 | ) | 788,552 | 526,221 |
744,121 |
||||||||||||||
Total |
$ | (134,172 | ) | $ | (259,851 | ) | $ | (452,826 | ) | $ | 788,552 | $ | 522,522 |
$ | 464,225 |
|||||||
* |
Amounts recognized for purchased options are included in net realized gain (loss) on investments and net change in unrealized appreciation or depreciation on investments. |
| Bank of America N.A. |
Barclays Bank PLC |
Citibank N.A. |
Deutsche Bank AG |
Goldman Sachs International |
JPMorgan Chase Bank N.A. |
Morgan Stanley & Co. International PLC |
NatWest Markets |
The Bank of Montreal |
UBS AG |
Westpac Banking Corp. |
Totals | ||||||||||||||||||||||||||||||||||
|---|---|---|---|---|---|---|---|---|---|---|---|---|---|---|---|---|---|---|---|---|---|---|---|---|---|---|---|---|---|---|---|---|---|---|---|---|---|---|---|---|---|---|---|---|---|
Assets: |
|||||||||||||||||||||||||||||||||||||||||||||
Purchased
options |
$ | — | $ | 454,923 | $ | 271,518 | $ | — | $ | 8,318 | $ | 372,698 | $ | 86,965 | $ | — | $ | — | $ | — |
$ | — |
$ | 1,194,422 |
|||||||||||||||||||||
Forward foreign
currency contracts |
267 | — | — | 8,372 | — | 112 | 46,502 | 6,024 | 193 | — |
— |
61,470 |
|||||||||||||||||||||||||||||||||
OTC
Inflation-linked swaps |
— | 588,091 | 778,180 | — | — | — | — | — | — | — |
— |
1,366,271 |
|||||||||||||||||||||||||||||||||
Total
Assets |
$ | 267 | $ | 1,043,014 | $ | 1,049,698 | $ | 8,372 | $ | 8,318 | $ | 372,810 | $ | 133,467 | $ | 6,024 | $ | 193 | $ | — |
$ | — |
$ | 2,622,163 |
|||||||||||||||||||||
Liabilities: |
|||||||||||||||||||||||||||||||||||||||||||||
Forward foreign
currency contracts |
$ | 5,920 | $ | 43,315 | $ | 10,763 | $ | 6,254 | $ | — | $ | 39 | $ | 1,403 | $ | 133,366 | $ | — | $ | 1,388 |
$ | 116,449 |
318,897 |
||||||||||||||||||||||
Written
options |
— | 746,345 | 198,175 | 88,164 | 43,407 | 150,482 | 125,209 | — | — | — |
— |
1,351,782 |
|||||||||||||||||||||||||||||||||
Total
Liabilities |
$ | 5,920 | $ | 789,660 | $ | 208,938 | $ | 94,418 | $ | 43,407 | $ | 150,521 | $ | 126,612 | $ | 133,366 | $ | — | $ | 1,388 |
$ | 116,449 |
$ | 1,670,679 |
|||||||||||||||||||||
Net OTC
derivative instruments by counterparty, at fair value |
$ | (5,653 | ) | $ | 253,354 | $ | 840,760 | $ | (86,046 | ) | $ | (35,089 | ) | $ | 222,289 | $ | 6,855 | $ | (127,342 | ) | $ | 193 | $ | (1,388 |
) | $ | (116,449 |
) | 951,484 |
||||||||||||||||
Total
collateral pledged by the Portfolio/(Received from counterparty) |
$ | — | $ | (253,354 | ) | $ | (820,000 | ) | $ | 80,000 | $ | 35,089 | $ | (222,289 | ) | $ | — | $ | — | $ | — | $ | — |
$ | — |
$ | (1,180,554 |
) | |||||||||||||||||
Net
Exposure(1)(2) |
$ | (5,653 | ) | $ | — | $ | 20,760 | $ | (6,046 | ) | $ | — | $ | — | $ | 6,855 | $ | (127,342 | ) | $ | 193 | $ | (1,388 |
) | $ | (116,449 |
) | $ | (229,070 |
) | |||||||||||||||
(1) |
Positive net exposure represents amounts due from each respective counterparty. Negative exposure represents amounts due from the Portfolio. Please refer to Note 2 for additional details regarding counterparty credit risk and credit related contingent features. |
(2) |
At December 31, 2019, the Portfolio had pledged $40,000 and $40,000, respectively, in cash collateral to Goldman Sachs International and Morgan Stanley & Co. International PLC, respectively. In addition, the Portfolio had received $300,000 and $230,000 in cash collateral from Barclays Bank PLC and JPMorgan Chase Bank N.A., respectively. Excess cash collateral is not shown for financial reporting purposes. |
Cost
for federal income tax purposes was $262,528,332. |
||||||
Net unrealized
appreciation consisted of: |
||||||
Gross
Unrealized Appreciation |
$ | 13,286,783 | ||||
Gross
Unrealized Depreciation |
(4,243,270 | ) | ||||
Net Unrealized
Appreciation |
$ | 9,043,513 |
| VY® BRANDYWINEGLOBAL — | PORTFOLIO OF INVESTMENTS |
| BOND PORTFOLIO | AS OF DECEMBER 31, 2019 |
| Principal Amount† |
Value | Percentage of Net Assets |
||||||||||||
|---|---|---|---|---|---|---|---|---|---|---|---|---|---|---|
CORPORATE BONDS/NOTES: 32.8%
|
||||||||||||||
Basic Materials: 1.1%
|
||||||||||||||
1,940,000 |
Steel Dynamics, Inc., 3.450%, 04/15/2030 |
$ | 1,964,235 | 1.1 | ||||||||||
Communications: 2.1%
|
||||||||||||||
3,740,000 |
(1) |
NBCUniversal Enterprise, Inc., 2.309%, (US0003M + 0.400%), 04/01/2021 |
3,750,249 | 2.1 | ||||||||||
Consumer, Non-cyclical: 6.4%
|
||||||||||||||
6,715,000 |
Anheuser-Busch InBev Worldwide, Inc., 5.450%, 01/23/2039 |
8,444,775 | 4.6 | |||||||||||
2,510,000 |
(1) |
Bristol-Myers Squibb Co., 3.400%, 07/26/2029 |
2,684,558 | 1.4 | ||||||||||
460,000 |
(1) |
Bristol-Myers Squibb Co., 3.875%, 08/15/2025 |
497,629 | 0.3 | ||||||||||
150,000 |
(1) |
Bristol-Myers Squibb Co., 3.900%, 02/20/2028 |
165,312 | 0.1 | ||||||||||
| 11,792,274 | 6.4 | |||||||||||||
Energy: 4.7%
|
||||||||||||||
510,000 |
Petroleos Mexicanos, 6.750%, 09/21/2047 |
512,711 | 0.3 | |||||||||||
2,835,000 |
(1) |
Petroleos Mexicanos, 7.690%, 01/23/2050 |
3,103,687 | 1.7 | ||||||||||
4,610,000 |
(1) |
Saudi Arabian Oil Co., 4.375%, 04/16/2049 |
5,033,478 | 2.7 | ||||||||||
| 8,649,876 | 4.7 | |||||||||||||
Financial: 4.2%
|
||||||||||||||
2,890,000 |
Canadian Imperial Bank of Commerce, 2.341%, (SOFRRATE + 0.800%), 03/17/2023 |
2,900,777 | 1.6 | |||||||||||
4,815,000 |
Wells Fargo & Co., 2.961%, (US0003M + 1.025%), 07/26/2021 |
4,872,275 | 2.6 | |||||||||||
| 7,773,052 | 4.2 | |||||||||||||
Technology: 14.3%
|
||||||||||||||
5,295,000 |
(1) |
Dell
International LLC / EMC Corp., 5.300%, 10/01/2029 |
5,967,500 | 3.3 | ||||||||||
7,390,000 |
Hewlett Packard Enterprise Co., 6.350%, 10/15/2045 |
8,889,060 | 4.9 | |||||||||||
4,365,000 |
International Business Machines Corp., 4.250%, 05/15/2049 |
4,988,539 | 2.7 | |||||||||||
5,430,000 |
Micron Technology, Inc., 5.327%, 02/06/2029 |
6,230,056 | 3.4 | |||||||||||
| 26,075,155 | 14.3 | |||||||||||||
Total
Corporate Bonds/Notes (Cost $59,048,013) |
60,004,841 | 32.8 | ||||||||||||
MUNICIPAL BONDS: 0.0%
|
||||||||||||||
| Minnesota: 0.0% | ||||||||||||||
63,472 |
Northstar Education Finance, Inc., 2.036%, (US0003M + 0.100%), 04/28/2030 |
63,348 | 0.0 | |||||||||||
Total
Municipal Bonds (Cost $62,517) |
63,348 | 0.0 | ||||||||||||
| Principal Amount† |
Value | Percentage of Net Assets |
||||||||||||
|---|---|---|---|---|---|---|---|---|---|---|---|---|---|---|
U.S. TREASURY OBLIGATIONS: 48.9%
|
||||||||||||||
U.S. Treasury Bonds: 3.9%
|
||||||||||||||
6,410,000 |
2.875%, 05/15/2049 |
$ | 7,059,312 | 3.9 | ||||||||||
U.S. Treasury Floating Rate Notes: 45.0%
|
||||||||||||||
24,700,000 |
1.665%, (USBMMY3M + 0.139%), 04/30/2021 |
24,689,723 | 13.5 | |||||||||||
50,700,000 |
1.746%, (USBMMY3M + 0.220%), 07/31/2021 |
50,729,686 | 27.7 | |||||||||||
6,830,000 |
1.826%, (USBMMY3M + 0.300%), 10/31/2021 |
6,842,721 | 3.8 | |||||||||||
| 82,262,130 | 45.0 | |||||||||||||
Total
U.S. Treasury Obligations (Cost $89,806,201) |
89,321,442 | 48.9 | ||||||||||||
U.S. GOVERNMENT AGENCY OBLIGATIONS: 16.9%
|
||||||||||||||
Federal Home Loan Bank: 5.4%
|
||||||||||||||
9,800,000 |
1.875%,07/07/2021 |
9,841,144 | 5.4 | |||||||||||
Federal National Mortgage Association: 11.5%(2)
|
||||||||||||||
21,000,000 |
1.500%,07/30/2020 |
20,981,627 | 11.5 | |||||||||||
Total
U.S. Government Agency Obligations (Cost $30,794,188) |
30,822,771 | 16.9 | ||||||||||||
Total
Long-Term Investments (Cost $179,710,919) |
180,212,402 | 98.6 | ||||||||||||
SHORT-TERM INVESTMENTS: 1.1%
|
||||||||||||||
Commercial Paper: 0.7%
|
||||||||||||||
1,300,000 |
VW Credit, Inc., 2.200%, 03/30/2020 (Cost $1,291,694) |
1,293,012 | 0.7 | |||||||||||
| Shares | Value | Percentage of Net Assets |
||||||||||||
Mutual Funds: 0.4%
|
||||||||||||||
757,551 |
(3) |
BlackRock Liquidity Funds, FedFund, Institutional Class, 1.520% (Cost $757,551) |
757,551 | 0.4 | ||||||||||
Total
Short-Term Investments (Cost $2,049,245) |
2,050,563 | 1.1 | ||||||||||||
Total Investments in Securities (Cost $181,760,164) |
$ | 182,262,965 | 99.7 | |||||||||||
Assets in Excess of Other Liabilities |
629,044 | 0.3 | ||||||||||||
Net
Assets |
$ | 182,892,009 | 100.0 | |||||||||||
† |
Unless otherwise indicated, principal amount is shown in USD. |
(1) |
Securities with purchases pursuant to Rule 144A or section 4(a)(2), under the Securities Act of 1933 and may not be resold subject to that rule except to qualified institutional buyers. |
(2) |
The Federal Housing Finance Agency (“FHFA”) placed the Federal Home Loan Mortgage Corporation and Federal National Mortgage Association into conservatorship with FHFA as the conservator. As such, the FHFA oversees the continuing affairs of these companies. |
(3) |
Rate shown is the 7-day yield as of December 31, 2019. |
| VY® BRANDYWINEGLOBAL — | PORTFOLIO OF INVESTMENTS |
| BOND PORTFOLIO | AS OF DECEMBER 31, 2019 (CONTINUED) |
Reference Rate Abbreviations:
SOFRRATE |
Secured Overnight Financing Rate |
US0003M |
3-month LIBOR |
USBMMY3M |
U.S. Treasury 3-month Bill Money Market Yield |
| Quoted Prices in Active Markets for Identical Investments (Level 1) |
Significant Other Observable Inputs (Level 2) |
Significant Unobservable Inputs (Level 3) |
Fair Value at December 31, 2019 |
||||||||||||||||||
|---|---|---|---|---|---|---|---|---|---|---|---|---|---|---|---|---|---|---|---|---|---|
Asset
Table |
|||||||||||||||||||||
Investments,
at fair value |
|||||||||||||||||||||
Corporate
Bonds/Notes |
$ | — | $ | 60,004,841 | $ | — | $ | 60,004,841 | |||||||||||||
Municipal
Bonds |
— | 63,348 | — | 63,348 | |||||||||||||||||
U.S. Government
Agency Obligations |
— | 30,822,771 | — | 30,822,771 | |||||||||||||||||
U.S. Treasury
Obligations |
— | 89,321,442 | — | 89,321,442 | |||||||||||||||||
Short-Term
Investments |
757,551 | 1,293,012 | — | 2,050,563 | |||||||||||||||||
Total
Investments, at fair value |
$ | 757,551 | $ | 181,505,414 | $ | — | $ | 182,262,965 | |||||||||||||
ˆ |
See Note 2, “Significant Accounting Policies” in the Notes to Financial Statements for additional information. |
| Amount of Realized Gain or (Loss) on Derivatives Recognized in Income | ||||||||||||||||||
|---|---|---|---|---|---|---|---|---|---|---|---|---|---|---|---|---|---|---|
| Derivatives not accounted for as hedging instruments |
Forward foreign currency contracts |
Futures | Swaps | Total | ||||||||||||||
Credit
contracts |
$ | — | $ | — | $ | (150,634 | ) | $ | (150,634 | ) | ||||||||
Foreign exchange
contracts |
302,357 | — | — | 302,357 | ||||||||||||||
Interest rate
contracts |
— | 2,916,088 | 826,472 | 3,742,560 | ||||||||||||||
Total |
$ | 302,357 | $ | 2,916,088 | $ | 675,838 | $ | 3,894,283 | ||||||||||
| Change in Unrealized Appreciation or (Depreciation) on Derivatives Recognized in Income |
||||||||||||||||||
|---|---|---|---|---|---|---|---|---|---|---|---|---|---|---|---|---|---|---|
| Derivatives not accounted for as hedging instruments |
Forward foreign currency contracts |
Futures | Swaps | Total | ||||||||||||||
Credit
contracts |
$ | — | $ | — | $ | 215,702 | $ | 215,702 | ||||||||||
Foreign exchange
contracts |
80,065 | — | — | 80,065 | ||||||||||||||
Interest rate
contracts |
— | (587,337 | ) | (318,589 | ) | (905,926 | ) | |||||||||||
Total |
$ | 80,065 | $ | (587,337 | ) | $ | (102,887 | ) | $ | (610,159 | ) | |||||||
Cost
for federal income tax purposes was $181,782,413. |
||||||
Net unrealized
appreciation consisted of: |
||||||
Gross
Unrealized Appreciation |
$ | 1,342,341 | ||||
Gross
Unrealized Depreciation |
(861,789 | ) | ||||
Net Unrealized
Appreciation |
$ | 480,552 |
| Portfolio Name | Type | Per Share Amount | ||||||||
|---|---|---|---|---|---|---|---|---|---|---|
VY®
BlackRock Inflation Protected Bond Portfolio |
||||||||||
Class
ADV |
NII |
$0.1768 | ||||||||
Class
I |
NII |
$0.2326 | ||||||||
Class
S |
NII |
$0.2085 | ||||||||
VY®
BrandywineGLOBAL — Bond Portfolio |
NII |
$0.1984 | ||||||||
| Name, Address and Age | Position(s) Held with the Trust |
Term of Office and Length of Time Served(1) |
Principal Occupation(s) — During the Past 5 Years |
Number of funds in Fund Complex Overseen by Trustee(2) |
Other Board Positions Held by Trustee |
|||||
|---|---|---|---|---|---|---|---|---|---|---|
Independent Trustees*:
|
||||||||||
Colleen D.
Baldwin 7337 East Doubletree Ranch Rd. Suite 100 Scottsdale, Arizona 85258 Age: 59 |
Trustee Chairperson |
November
2007–Present January 2020–Present |
President, Glantuam Partners, LLC, a business consulting firm (January 2009–Present). |
146 |
Dentaquest (February 2014–Present); RSR Partners, Inc. (2016–Present). |
|||||
John V. Boyer 7337 East Doubletree Ranch Rd. Suite 100 Scottsdale, Arizona 85258 Age: 66 |
Trustee |
January
2005–Present |
Retired. Formerly, President and Chief Executive Officer, Bechtler Arts Foundation, an arts and education foundation (January
2008–December 2019). |
146 |
None. |
|||||
Patricia W.
Chadwick 7337 East Doubletree Ranch Rd. Suite 100 Scottsdale, Arizona 85258 Age: 71 |
Trustee |
January
2006–Present |
Consultant and President, Ravengate Partners LLC, a consulting firm that provides advice regarding financial markets and the global economy
(January 2000–Present). |
146 |
Wisconsin Energy Corporation (June 2006–Present); The Royce Fund (22 funds) (December 2009–Present); and AMICA Mutual Insurance
Company (1992–Present). |
|||||
Martin J.
Gavin 7337 East Doubletree Ranch Rd. Suite 100 Scottsdale, AZ 85258 Age: 69 |
Trustee |
August
2015–Present |
Retired. Formerly, President and Chief Executive Officer, Connecticut Children’s Medical Center (May 2006–November
2015). |
146 |
None. |
|||||
Joseph E.
Obermeyer 7337 East Doubletree Ranch Rd. Suite 100 Scottsdale, Arizona 85258 Age: 62 |
Trustee |
May
2013–Present |
President, Obermeyer & Associates, Inc., a provider of financial and economic consulting services (November
1999–Present). |
146 |
None. |
|||||
Sheryl K.
Pressler 7337 East Doubletree Ranch Rd. Suite 100 Scottsdale, Arizona 85258 Age: 69 |
Trustee |
January
2006–Present |
Consultant (May 2001–Present). |
146 |
None. |
|||||
Christopher P.
Sullivan 7337 East Doubletree Ranch Rd. Suite 100 Scottsdale, Arizona 85258 Age: 66 |
Trustee |
October
2015–Present |
Retired. |
146 |
None. |
|||||
| Name, Address and Age | Position(s) Held with the Trust |
Term of Office and Length of Time Served(1) |
Principal Occupation(s) — During the Past 5 Years |
Number of funds in Fund Complex Overseen by Trustee(2) |
Other Board Positions Held by Trustee | |||||
|---|---|---|---|---|---|---|---|---|---|---|
Trustee who is an “interested person”:
|
||||||||||
Dina Santoro 230 Park Avenue New York, New York 10169 Age: 46 |
Trustee |
July
2018–Present |
President, Voya Investments, LLC and Voya Capital, LLC (March 2018–Present); Senior Vice President, Voya Investments Distributor, LLC
(April 2018–Present); Senior Managing Director, Head of Product and Marketing Strategy, Voya Investment Management (September 2017–Present).
Formerly, Managing Director, Quantitative Management Associates, LLC (January 2004–August 2017). |
146 |
Voya
Investments, LLC, Voya Capital, LLC, and Voya Funds Services, LLC (March 2018–Present); Voya Investments Distributor, LLC (April
2018–Present). | |||||
(1) |
Trustees serve until their successors are duly elected and qualified. The tenure of each Trustee who is not an “interested person” as defined in the 1940 Act, of each Portfolio (“Independent Trustee”) is subject to the Board’s retirement policy which states that each duly elected or appointed Independent Trustee shall retire from and cease to be a member of the Board of Trustees at the close of business on December 31 of the calendar year in which the Independent Trustee attains the age of 75. A majority vote of the Board’s other Independent Trustees may extend the retirement date of an Independent Trustee if the retirement would trigger a requirement to hold a meeting of shareholders of the Trust under applicable law, whether for the purposes of appointing a successor to the Independent Trustee or otherwise comply under applicable law, in which case the extension would apply until such time as the shareholder meeting can be held or is no longer required (as determined by a vote of a majority of the other Independent Trustees). |
(2) |
For the purposes of this table, “Fund Complex” means the Voya family of funds including the following investment companies: Voya Asia Pacific High Dividend Equity Income Fund; Voya Balanced Portfolio, Inc.; Voya Emerging Markets High Dividend Equity Fund; Voya Equity Trust; Voya Funds Trust; Voya Global Advantage and Premium Opportunity Fund; Voya Global Equity Dividend and Premium Opportunity Fund; Voya Government Money Market Portfolio; Voya Infrastructure, Industrials and Materials Fund; Voya Intermediate Bond Portfolio; Voya International High Dividend Equity Income Fund; Voya Investors Trust; Voya Mutual Funds; Voya Natural Resources Equity Income Fund; Voya Partners, Inc.; Voya Prime Rate Trust; Voya Senior Income Fund; Voya Separate Portfolios Trust; Voya Strategic Allocation Portfolios, Inc.; Voya Variable Funds; Voya Variable Insurance Trust; Voya Variable Portfolios, Inc.; and Voya Variable Products Trust. The number of funds in the Fund Complex is as of January 31, 2020. |
* |
Effective December 31, 2019, Russell H. Jones and Roger B. Vincent each retired as a Trustee of the Board. |
| Name, Address and Age | Position(s) Held With the Trust |
Term of Office and Length of Time Served(1) |
Principal Occupation(s) — During the Past 5 Years |
|||
|---|---|---|---|---|---|---|
Michael Bell One Orange Way Windsor, Connecticut 06095 Age: 51 |
Chief Executive
Officer |
March
2018–Present |
Chief
Executive Officer and Director, Voya Investments, LLC, Voya Capital, LLC, and Voya Funds Services, LLC (March 2018–Present); Senior Vice President
and Chief Financial Officer, Voya Investments Distributor, LLC (September 2019–Present); Chief Financial Officer, Voya Investment Management
(September 2014–Present). Formerly, Senior Vice President, Chief Financial Officer and Treasurer, Voya Investments, LLC (November 2015–March
2018). |
|||
Dina Santoro 230 Park Avenue New York, New York 10169 Age: 46 |
President |
March
2018–Present |
President and Director, Voya Investments, LLC and Voya Capital, LLC (March 2018–Present); Director, Voya Funds Services, LLC (March
2018–Present); Director and Senior Vice President, Voya Investments Distributor, LLC (April 2018–Present); Senior Managing Director, Head of
Product and Marketing Strategy, Voya Investment Management (September 2017–Present). Formerly, Managing Director, Quantitative Management
Associates, LLC (January 2004–August 2017). |
|||
Stanley D.
Vyner 230 Park Avenue New York, New York 10169 Age: 69 |
Executive Vice
President Chief Investment Risk Officer |
VIT: March
2003–Present VVIT: October 2000–Present September 2009–Present |
Executive Vice President, Voya Investments, LLC (July 2000–Present) and Chief Investment Risk Officer, Voya Investments, LLC (January
2003–Present). |
|||
James M. Fink 5780 Powers Ferry Road NW Atlanta, Georgia 30327 Age: 61 |
Executive Vice
President |
March
2018–Present |
Managing Director, Voya Investments, LLC, Voya Capital, LLC, and Voya Funds Services, LLC (March 2018–Present); Senior Vice President,
Voya Investments Distributor, LLC (April 2018–Present); Chief Administrative Officer, Voya Investment Management (September 2017–Present).
Formerly, Managing Director, Operations, Voya Investment Management (March 1999–September 2017). |
|||
Kevin M.
Gleason 7337 East Doubletree Ranch Rd. Suite 100 Scottsdale, Arizona 85258 Age: 53 |
Chief Compliance
Officer |
February
2012–Present |
Senior
Vice President, Voya Investment Management and Chief Compliance Officer, Voya Family of Funds (February 2012–Present). |
|||
Todd Modic 7337 East Doubletree Ranch Rd. Suite 100 Scottsdale, Arizona 85258 Age: 52 |
Senior Vice
President, Chief/Principal Financial Officer and Assistant Secretary |
March
2005–Present |
President, Voya Funds Services, LLC (March 2018–Present) and Senior Vice President, Voya Investments, LLC (April
2005–Present). |
|||
Kimberly A.
Anderson 7337 East Doubletree Ranch Rd. Suite 100 Scottsdale, Arizona 85258 Age: 55 |
Senior Vice
President |
November
2003–Present |
Senior
Vice President, Voya Investments, LLC (September 2003–Present). |
|||
Robert Terris 5780 Powers Ferry Road NW Atlanta, Georgia 30327 Age: 49 |
Senior Vice
President |
May
2006–Present |
Senior
Vice President, Voya Investments Distributor, LLC (April 2018–Present); Senior Vice President, Head of Division Operations, Voya Investments, LLC
(October 2015–Present) and Voya Funds Services, LLC (March 2006–Present). |
|||
Fred Bedoya 7337 East Doubletree Ranch Rd. Suite 100 Scottsdale, Arizona 85258 Age: 47 |
Vice President and
Treasurer |
September
2012–Present |
Vice
President, Voya Investments, LLC (October 2015–Present) and Voya Funds Services, LLC (July 2012–Present). |
|||
Maria M.
Anderson 7337 East Doubletree Ranch Rd. Suite 100 Scottsdale, Arizona 85258 Age: 61 |
Vice
President |
September
2004–Present |
Vice
President, Voya Investments, LLC (October 2015–Present) and Voya Funds Services, LLC (September 2004–Present). |
| Name, Address and Age | Position(s) Held With the Trust |
Term of Office and Length of Time Served(1) |
Principal Occupation(s) — During the Past 5 Years | |||
|---|---|---|---|---|---|---|
Sara M. Donaldson 7337 East Doubletree Ranch Rd. Suite 100 Scottsdale, Arizona 85258 Age: 60 |
Vice
President |
September
2014–Present |
Vice
President, Voya Investments, LLC (October 2015–Present). Formerly, Vice President, Voya Funds Services, LLC (April 2014–October
2015). |
|||
Micheline S.
Faver 7337 East Doubletree Ranch Rd. Suite 100 Scottsdale, Arizona 85258 Age: 42 |
Vice
President |
September
2016–Present |
Vice
President, Head of Fund Compliance and Chief Compliance Officer, Voya Investments, LLC (June 2016–Present). Formerly, Vice President, Mutual Fund
Compliance (March 2014–June 2016). |
|||
Robyn L.
Ichilov 7337 East Doubletree Ranch Rd. Suite 100 Scottsdale, Arizona 85258 Age: 52 |
Vice
President |
VIT: November
1999–Present VVIT: October 2000–Present |
Vice
President, Voya Funds Services, LLC (November 1995–Present) and Voya Investments, LLC (August 1997–Present). |
|||
Jason Kadavy 7337 East Doubletree Ranch Rd. Suite 100 Scottsdale, Arizona 85258 Age: 43 |
Vice
President |
September
2012–Present |
Vice
President, Voya Investments, LLC (October 2015–Present) and Voya Funds Services, LLC (July 2007–Present). |
|||
Andrew K.
Schlueter 7337 East Doubletree Ranch Rd. Suite 100 Scottsdale, Arizona 85258 Age: 43 |
Vice
President |
March
2018–Present |
Vice
President, Voya Investments Distributor, LLC (April 2018–Present); Vice President, Voya Investments, LLC and Voya Funds Services, LLC (March
2018–Present); Vice President, Head of Mutual Fund Operations, Voya Investment Management (February 2018–Present). Formerly, Vice President,
Voya Investment Management (March 2014–February 2018). |
|||
Craig Wheeler 7337 East Doubletree Ranch Rd. Suite 100 Scottsdale, Arizona 85258 Age: 50 |
Vice
President |
May
2013–Present |
Vice
President — Director of Tax, Voya Investments, LLC (October 2015–Present). Formerly, Vice President — Director of Tax, Voya Funds
Services, LLC (March 2013–October 2015). |
|||
Monia Piacenti One Orange Way Windsor, Connecticut 06095 Age: 43 |
Anti-Money
Laundering Officer |
June
2018–Present |
Anti-Money Laundering Officer, Voya Investments Distributor, LLC, Voya Investment Management and Voya Investment Management Trust Co. (June
2018–Present); Compliance Consultant, Voya Financial, Inc. (January 2019–Present). Formerly, Senior Compliance Officer, Voya Investment
Management (December 2009–December 2018). |
|||
Theresa K.
Kelety 7337 East Doubletree Ranch Rd. Suite 100 Scottsdale, Arizona 85258 Age: 57 |
Secretary |
January
2020–Present |
Vice
President and Senior Counsel, Voya Investment Management — Mutual Fund Legal Department (March 2010–Present). |
|||
Paul A.
Caldarelli 7337 East Doubletree Ranch Rd. Suite 100 Scottsdale, Arizona 85258 Age: 68 |
Assistant
Secretary |
June
2010–Present |
Vice
President and Senior Counsel, Voya Investment Management — Mutual Fund Legal Department (March 2010–Present). |
|||
Joanne F.
Osberg 7337 East Doubletree Ranch Rd. Suite 100 Scottsdale, Arizona 85258 Age: 38 |
Assistant
Secretary |
January
2020–Present |
Vice
President and Counsel, Voya Investment Management — Mutual Fund Legal Department (January 2013–Present). |
(1) |
The Officers hold office until the next annual meeting of the Board of Trustees and until their successors shall have been elected and qualified. |
Voya Investments, LLC
7337 East Doubletree Ranch Road, Suite 100
Scottsdale, Arizona 85258
Voya Investments Distributor, LLC
7337 East Doubletree Ranch Road, Suite 100
Scottsdale, Arizona 85258
BNY Mellon Investment Servicing (U.S.) Inc.
301 Bellevue Parkway
Wilmington, Delaware 19809
KPMG LLP
Two Financial Center
60 South Street
Boston, Massachusetts 02111
The Bank of New York Mellon
225 Liberty Street
New York, New York 10286
Ropes & Gray LLP
Prudential Tower
800 Boylston Street
Boston, Massachusetts 02199
| RETIREMENT | INVESTMENTS | INSURANCE | |
| voyainvestments.com | VPAR-VIT3AIS (1219-022020) |
Annual Report
December 31, 2019
Classes ADV, I and S
Voya Investors Trust
| n | Voya Global Perspectives® Portfolio |
|
Beginning on January 1, 2021, as permitted by regulations
adopted by the U.S. Securities and Exchange Commission, paper copies of each Portfolio’s annual and semi-annual shareholder reports, like this
annual report, will no longer be sent by mail, unless you specifically request paper copies of the reports. Instead, the reports will be made available
on a website and you will be notified by mail each time a report is posted and provided with a website link to access the report. If you already elected to receive shareholder reports electronically, you will not be affected by this change and you need not take any action. You may elect to receive shareholder reports and other communications from your insurance carrier electronically by contacting them directly. You may elect to receive all future reports in paper free of charge. If you received this document in the mail, please follow the instructions provided to elect to continue receiving paper copies of your shareholder reports. You can inform us that you wish to continue receiving paper copies by calling 1-800-283-3427. Your election to receive reports in paper will apply to all the funds in which you invest. |
|
This report is submitted for general information to
shareholders of the Voya mutual funds. It is not authorized for distribution to prospective shareholders unless accompanied or preceded by a prospectus
which includes details regarding the fund’s investment objectives, risks, charges, expenses and other information. This information should be read
carefully. |
| INVESTMENT
MANAGEMENT voyainvestments.com |
|
| 1 | ||||||
| 2 | ||||||
| 4 | ||||||
| 6 | ||||||
| 7 | ||||||
| 8 | ||||||
| 9 | ||||||
| 10 | ||||||
| 11 | ||||||
| 12 | ||||||
| 19 | ||||||
| 21 | ||||||
| 22 | ||||||
| 26 |
PROXY VOTING INFORMATION
QUARTERLY PORTFOLIO HOLDINGS

New season, last year’s plot
Dear Shareholder,
The financial markets delivered strong performance in 2019, and at this juncture, in our view, the outlook for 2020 seems upbeat. Thanks to supportive central bank policies around the world, global economic growth is reaccelerating; manufacturing activity, a key metric for setting market expectations, appears to be strengthening. Recent progress in the trade negotiations between China and the U.S. also helps brighten the outlook as 2020 gets underway.
So expect smooth sailing, right? Maybe. Barely into the first week of the new year, the world faced the prospect of escalating conflict in the Middle East, though tensions appear to have eased since then. Markets initially pulled back in response to heightened uncertainty but regrouped quickly. Follow-on events, if they occur, may not impact markets that much: during 2019, investors generally did well by downplaying geopolitical concerns, and we could see the same behavior in 2020.
Sincerely,

Dina Santoro
President
Voya Family of Funds
January 21, 2020
The views expressed in the President’s Letter reflect those of the President as of the date of the letter. Any such views are subject to change at any time based upon market or other conditions and the Voya mutual funds disclaim any responsibility to update such views. These views may not be relied on as investment advice and because investment decisions for a Voya mutual fund are based on numerous factors, may not be relied on as an indication of investment intent on behalf of any Voya mutual fund. Reference to specific company securities should not be construed as recommendations or investment advice.
| Index | Description | |
|---|---|---|
Bloomberg Barclays
High Yield Bond — 2% Issuer Constrained Composite Index |
An
index that includes all fixed-income securities having a maximum quality rating of Ba1, a minimum amount outstanding of $150 million, and at least one
year to maturity. |
|
Bloomberg Barclays
U.S. 20+ Year Treasury Bond Index |
Measures the performance of public obligations of the U.S. Treasury that have a remaining maturity of 20 or more years. The index includes all
publicly-issued U.S. Treasury securities that have a remaining maturity of greater than or equal to 20 years, are rated investment grade and have $250
million or more of outstanding face value. |
|
Bloomberg Barclays
U.S. Aggregate Bond Index |
An
index of publicly issued investment grade U.S. government, mortgage-backed, asset-backed and corporate debt securities. |
|
Bloomberg Barclays
U.S. Corporate Investment Grade Bond Index |
An
index consisting of publicly issued, fixed rate, nonconvertible, investment grade debt securities. |
|
Bloomberg Barclays
Global Aggregate Index |
Provides a broad-based measure of the global investment-grade fixed-rate debt markets. |
|
Bloomberg Barclays
Long-Term U.S. Treasury Index |
This
index measures the performance of U.S. Treasury bills with long-term maturity. The credit level for this index is investment grade. The rebalance
scheme is monthly. |
|
FTSE ERPA Nareit
Developed Index |
The
index is designed to track the performance of listed real estate companies and real-estate investment trusts (REITs) worldwide. Relevant activities are
defined as the ownership, disposal and development of income-producing real estate. Constituents are classified into distinct property sectors based on
gross invested book assets, as disclosed in the latest published financial statement. Index constituents are free-float adjusted, liquidity, size and
revenue screened. |
|
MSCI
Europe, Australasia and Far East® (“MSCI EAFE”) Index |
An
index that measures the performance of securities listed on exchanges in Europe, Australasia and the Far East. It includes the reinvestment of
dividends net of withholding taxes, but does not reflect fees, brokerage commissions or other expenses of investing. |
|
MSCI Emerging
Markets IndexSM |
An
index that measures the performance of securities listed on exchanges in developing nations throughout the world. It includes the reinvestment of
dividends and distributions net of withholding taxes, but does not reflect fees, brokerage commissions or other expenses of
investing. |
|
MSCI
Europe ex UK® Index |
A free
float-adjusted market capitalization index that is designed to measure developed market equity performance in Europe, excluding the
UK. |
|
MSCI
Japan® Index |
A free
float-adjusted market capitalization index that is designed to measure developed market equity performance in Japan. |
|
MSCI
U.K.® Index |
A free
float-adjusted market capitalization index that is designed to measure developed market equity performance in the UK. |
|
MSCI World
IndexSM |
An
index that measures the performance of over 1,600 securities listed on exchanges in the U.S., Europe, Canada, Australia, New Zealand and the Far
East. |
|
S&P
500® Index |
An
index that measures the performance of securities of approximately 500 large-capitalization companies whose securities are traded on major U.S. stock
markets. |
|
S&P
MidCap 400® Index |
An
index that measures the performance of the mid-size company segment of the U.S. market. |
|
S&P
SmallCap 600® Index |
An
index used to measure stock market performance composed of companies with a weighted average market value of approximately $630
million. |
|
S&P
Target Risk® Growth Index* |
Seeks
to measure the performance of an asset allocation strategy targeted to a growth focused risk profile. |
* |
Total return and gross index returns are presented. Index returns include the reinvestment of dividends and distributions. Gross index returns reflect the addition of an amount estimated by the index sponsor to approximate the fees incurred by index components. |
| VOYA GLOBAL PERSPECTIVES® PORTFOLIO | PORTFOLIO MANAGERS’ REPORT |
|
Target Allocations | |||
U.S.
Large Cap Equities |
10 | % | |
U.S.
Mid Cap Equities |
10 | % | |
U.S.
Small Cap Equities |
10 | % | |
Global
Real Estate |
10 | % | |
International Equities |
10 | % | |
Emerging Market Equities |
10 | % | |
U.S.
Investment Grade Bonds |
10 | % | |
U.S.
Government Bonds |
10 | % | |
Global
Bonds |
10 | % | |
U.S.
High Yield Bonds |
10 | % | |
Cash |
0 | % | |
Portfolio holdings are subject to change daily. | |||
* |
Effective October 31, 2019, Karyn Cavanugh, CFA, was removed as a portfolio manager for the Portfolio |
| ** | Effective January 7, 2020, the Fund moved to defensive allocations. |
| (1) | The Composite Index is composed of several indices that we believe provide an internal reference benchmark against which the actual performance of the Portfolio can be compared. As of December 31, 2019, the index allocation is approximately: 10% of the Bloomberg Barclays Global Aggregate Index, 10% of the Bloomberg Barclays High Yield Bond — 2% Issuer Constrained Composite Index, 10% of the Bloomberg Barclays U.S. Corporate Investment Grade Bond Index, 10% of the Bloomberg Barclays U.S. 20+ Year Treasury Bond Index, 10% of the FTSE ERPA Nareit Developed Index, 10% of the MSCI EAFE® Index, 10% of the MSCI Emerging Markets Index, 10% of the S&P 500® Index, 10% of the S&P MidCap 400® Index, 10% of the S&P SmallCap 600® Index. |
| PORTFOLIO MANAGERS’ REPORT | VOYA GLOBAL PERSPECTIVES® PORTFOLIO |
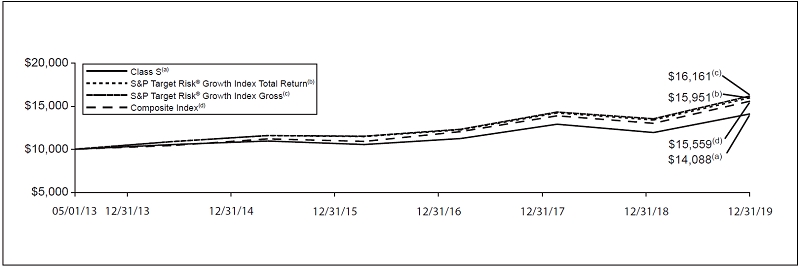
| Average Annual Total Returns for the Periods Ended December 31, 2019 | |||||||||||||
|---|---|---|---|---|---|---|---|---|---|---|---|---|---|
| 1 Year | 5 Year | Since Inception of Classes ADV, I and S May 1, 2013 |
|||||||||||
Class
ADV |
17.97 | % | 5.11 | % | 5.18 | % | |||||||
Class
I |
18.33 | % | 5.44 | % | 5.55 | % | |||||||
Class
S |
18.08 | % | 5.16 | % | 5.27 | % | |||||||
S&P Target Risk® Growth Index Total Return |
19.20 | % | 6.63 | % | 7.26 | % | |||||||
S&P Target Risk® Growth Index Gross |
19.50 | % | 6.90 | % | 7.53 | % | |||||||
Composite Index |
19.72 | % | 6.80 | % | 6.86 | % | |||||||
| Actual Portfolio Return | Hypothetical (5% return before expenses) | |||||||||||||||||||||||||||||||
|---|---|---|---|---|---|---|---|---|---|---|---|---|---|---|---|---|---|---|---|---|---|---|---|---|---|---|---|---|---|---|---|---|
| Beginning Account Value July 1, 2019 |
Ending Account Value December 31, 2019 |
Annualized Expense Ratio* |
Expenses Paid During the Period Ended December 31, 2019** |
Beginning Account Value July 1, 2019 |
Ending Account Value December 31, 2019 |
Annualized Expense Ratio* |
Expenses Paid During the Period Ended December 31, 2019** |
|||||||||||||||||||||||||
Class
ADV |
$1,000.00 | $1,051.00 | 0.48 | % | $2.48 | $1,000.00 | $1,022.79 | 0.48 | % | $2.45 | ||||||||||||||||||||||
Class
I |
1,000.00 | 1,052.40 | 0.18 | 0.93 | 1,000.00 | 1,024.30 | 0.18 | 0.92 | ||||||||||||||||||||||||
Class S |
1,000.00 | 1,051.20 | 0.43 | 2.22 | 1,000.00 | 1,023.04 | 0.43 | 2.19 | ||||||||||||||||||||||||
* |
The annualized expense ratios do not include expenses of underlying funds. | |
** |
Expenses are equal to the Portfolio’s respective annualized expense ratios multiplied by the average account value over the period, multiplied by 184/365 to reflect the most recent fiscal half-year. |
Voya Investors Trust:
February 26, 2020
ASSETS: |
||||||
Investments in
affiliated underlying funds at fair value* |
$ | 103,633,960 | ||||
Cash |
32,330 | |||||
Receivables: |
||||||
Fund shares
sold |
90,104 | |||||
Prepaid
expenses |
774 | |||||
Reimbursement
due from manager |
7,877 | |||||
Other
assets |
5,251 | |||||
Total
assets |
103,770,296 | |||||
LIABILITIES: |
||||||
Payable for
investments in affiliated underlying funds purchased |
90,017 | |||||
Payable for fund
shares redeemed |
69 | |||||
Payable for
investment management fees |
17,519 | |||||
Payable for
distribution and shareholder service fees |
24,205 | |||||
Payable to
trustees under the deferred compensation plan (Note 6) |
5,251 | |||||
Payable for
trustee fees |
527 | |||||
Other accrued
expenses and liabilities |
32,429 | |||||
Total
liabilities |
170,017 | |||||
NET
ASSETS |
$ | 103,600,279 | ||||
NET ASSETS
WERE COMPRISED OF: |
||||||
Paid-in
capital |
$ | 94,031,728 | ||||
Total
distributable earnings |
9,568,551 | |||||
NET
ASSETS |
$ | 103,600,279 | ||||
* Cost of investments in affiliated underlying funds |
$ | 97,992,341 | ||||
Class
ADV |
||||||
Net
assets |
$ | 95,445,908 | ||||
Shares
authorized |
unlimited | |||||
Par
value |
$ | 0.001 | ||||
Shares
outstanding |
8,542,295 | |||||
Net asset value
and redemption price per share |
$ | 11.17 | ||||
Class
I |
||||||
Net
assets |
$ | 8,089,794 | ||||
Shares
authorized |
unlimited | |||||
Par
value |
$ | 0.001 | ||||
Shares
outstanding |
718,244 | |||||
Net asset value
and redemption price per share |
$ | 11.26 | ||||
Class
S |
||||||
Net
assets |
$ | 64,577 | ||||
Shares
authorized |
unlimited | |||||
Par
value |
$ | 0.001 | ||||
Shares
outstanding |
5,776 | |||||
Net asset value
and redemption price per share |
$ | 11.18 | ||||
STATEMENT OF OPERATIONS FOR THE YEAR ENDED DECEMBER 31, 2019
INVESTMENT
INCOME: |
||||||
Dividends from
affiliated underlying funds |
$ | 2,687,580 | ||||
Total
investment income |
2,687,580 | |||||
EXPENSES: |
||||||
Investment
management fees |
210,802 | |||||
Distribution and
shareholder service fees: |
||||||
Class
ADV |
584,598 | |||||
Class
S |
152 | |||||
Transfer agent
fees |
390 | |||||
Shareholder
reporting expense |
15,243 | |||||
Professional
fees |
32,096 | |||||
Custody and
accounting expense |
16,202 | |||||
Trustee
fees |
4,216 | |||||
Miscellaneous
expense |
10,411 | |||||
Total
expenses |
874,110 | |||||
Waived and
reimbursed fees |
(389,380 | ) | ||||
Net
expenses |
484,730 | |||||
Net investment
income |
2,202,850 | |||||
REALIZED AND
UNREALIZED GAIN (LOSS): |
||||||
Net realized
gain (loss) on: |
||||||
Investments |
1,412 | |||||
Sale of
affiliated underlying funds |
472,195 | |||||
Capital gain
distributions from affiliated underlying funds |
3,566,386 | |||||
Net realized
gain |
4,039,993 | |||||
Net change in
unrealized appreciation (depreciation) on: |
||||||
Affiliated
underlying funds |
11,208,477 | |||||
Net change in
unrealized appreciation (depreciation) |
11,208,477 | |||||
Net realized and
unrealized gain |
15,248,470 | |||||
Increase in
net assets resulting from operations |
$ | 17,451,320 |
| Year Ended December 31, 2019 |
Year Ended December 31, 2018 |
||||||||||
|---|---|---|---|---|---|---|---|---|---|---|---|
FROM
OPERATIONS: |
|||||||||||
Net investment
income |
$ | 2,202,850 | $ | 2,563,902 | |||||||
Net realized
gain |
4,039,993 | 6,202,424 | |||||||||
Net change in
unrealized appreciation (depreciation) |
11,208,477 | (17,233,979 | ) | ||||||||
Increase
(decrease) in net assets resulting from operations |
17,451,320 | (8,467,653 | ) | ||||||||
FROM
DISTRIBUTIONS TO SHAREHOLDERS: |
|||||||||||
Total
distributions (excluding return of capital): |
|||||||||||
Class
ADV |
(7,252,542 | ) | (4,138,503 | ) | |||||||
Class
I |
(593,230 | ) | (396,139 | ) | |||||||
Class
S |
(4,546 | ) | (2,218 | ) | |||||||
Total
distributions |
(7,850,318 | ) | (4,536,860 | ) | |||||||
FROM CAPITAL
SHARE TRANSACTIONS: |
|||||||||||
Net proceeds
from sale of shares |
3,178,856 | 4,539,484 | |||||||||
Reinvestment of
distributions |
7,850,318 | 4,536,860 | |||||||||
| 11,029,174 | 9,076,344 | ||||||||||
Cost of shares
redeemed |
(19,820,159 | ) | (24,352,660 | ) | |||||||
Net decrease in
net assets resulting from capital share transactions |
(8,790,985 | ) | (15,276,316 | ) | |||||||
Net increase
(decrease) in net assets |
810,017 | (28,280,829 | ) | ||||||||
NET
ASSETS: |
|||||||||||
Beginning of
year or period |
102,790,262 | 131,071,091 | |||||||||
End of year or
period |
$ | 103,600,279 | $ | 102,790,262 | |||||||
| Income (loss) from investment operations |
Less distributions | Ratios to average net assets |
Supplemental Data |
|||||||||||||||||||||||||||||||||||||||||||||||||||||||||||||||||
|---|---|---|---|---|---|---|---|---|---|---|---|---|---|---|---|---|---|---|---|---|---|---|---|---|---|---|---|---|---|---|---|---|---|---|---|---|---|---|---|---|---|---|---|---|---|---|---|---|---|---|---|---|---|---|---|---|---|---|---|---|---|---|---|---|---|---|---|---|
| Net asset value, beginning of year or period |
Net investment income (loss) |
Net realized and unrealized gain (loss) |
Total from investment operations |
From net investment income |
From net realized gains |
From return of capital |
Total distributions |
Payment by affiliate |
Net asset value, end of year or period |
Total Return(1) |
Expenses before reductions/ additions(2)(3)(4) |
Expenses net of fee waivers and/or recoupments if any(2)(3)(4) |
Expenses net of all reductions/ additions(2)(3)(4) |
Net investment income (loss)(2)(3) |
Net assets, end of year or period |
Portfolio turnover rate |
||||||||||||||||||||||||||||||||||||||||||||||||||||
| Year or period ended | ($) | ($) | ($) | ($) | ($) | ($) | ($) | ($) | ($) | ($) | (%) | (%) | (%) | (%) | (%) | ($000’s) | (%) | |||||||||||||||||||||||||||||||||||||||||||||||||||
Class ADV |
||||||||||||||||||||||||||||||||||||||||||||||||||||||||||||||||||||
12-31-19 |
10.21 | 0.23 | • | 1.57 | 1.80 | 0.37 | 0.47 | — | 0.84 | — | 11.17 | 17.97 | 0.87 | 0.48 | 0.48 | 2.07 | 95,446 | 13 | ||||||||||||||||||||||||||||||||||||||||||||||||||
12-31-18 |
11.46 | 0.23 | • | (1.06 | ) | (0.83 | ) | 0.29 | 0.13 | — | 0.42 | — | 10.21 | (7.50 | ) | 0.87 | 0.48 | 0.48 | 2.10 | 94,684 | 16 | |||||||||||||||||||||||||||||||||||||||||||||||
12-31-17 |
10.26 | 0.23 | • | 1.25 | 1.48 | 0.28 | — | — | 0.28 | — | 11.46 | 14.60 | 0.86 | 0.48 | 0.48 | 2.11 | 122,258 | 13 | ||||||||||||||||||||||||||||||||||||||||||||||||||
12-31-16 |
9.87 | 0.23 | • | 0.41 | 0.64 | 0.25 | — | — | 0.25 | — | 10.26 | 6.49 | 0.89 | 0.52 | 0.52 | 2.25 | 139,474 | 52 | ||||||||||||||||||||||||||||||||||||||||||||||||||
12-31-15 |
10.91 | 0.21 | • | (0.57 | ) | (0.36 | ) | 0.26 | 0.42 | — | 0.68 | — | 9.87 | (3.68 | ) | 0.98 | 0.48 | 0.48 | 1.99 | 154,227 | 42 | |||||||||||||||||||||||||||||||||||||||||||||||
Class I |
||||||||||||||||||||||||||||||||||||||||||||||||||||||||||||||||||||
12-31-19 |
10.29 | 0.26 | • | 1.59 | 1.85 | 0.41 | 0.47 | — | 0.88 | — | 11.26 | 18.33 | 0.27 | 0.18 | 0.18 | 2.33 | 8,090 | 13 | ||||||||||||||||||||||||||||||||||||||||||||||||||
12-31-18 |
11.55 | 0.28 | • | (1.08 | ) | (0.80 | ) | 0.33 | 0.13 | — | 0.46 | — | 10.29 | (7.21 | ) | 0.27 | 0.18 | 0.18 | 2.48 | 8,051 | 16 | |||||||||||||||||||||||||||||||||||||||||||||||
12-31-17 |
10.34 | 0.25 | • | 1.28 | 1.53 | 0.32 | — | — | 0.32 | — | 11.55 | 14.98 | 0.26 | 0.18 | 0.18 | 2.29 | 8,755 | 13 | ||||||||||||||||||||||||||||||||||||||||||||||||||
12-31-16 |
9.95 | 0.25 | • | 0.43 | 0.68 | 0.29 | — | — | 0.29 | — | 10.34 | 6.81 | 0.24 | 0.22 | 0.22 | 2.41 | 14,747 | 52 | ||||||||||||||||||||||||||||||||||||||||||||||||||
12-31-15 |
10.99 | 0.25 | • | (0.57 | ) | (0.32 | ) | 0.30 | 0.42 | — | 0.72 | — | 9.95 | (3.35 | ) | 0.23 | 0.18 | 0.18 | 2.36 | 2,994 | 42 | |||||||||||||||||||||||||||||||||||||||||||||||
Class S |
||||||||||||||||||||||||||||||||||||||||||||||||||||||||||||||||||||
12-31-19 |
10.22 | 0.23 | 1.58 | 1.81 | 0.38 | 0.47 | — | 0.85 | — | 11.18 | 18.08 | 0.52 | 0.43 | 0.43 | 2.10 | 65 | 13 | |||||||||||||||||||||||||||||||||||||||||||||||||||
12-31-18 |
11.48 | 0.23 | (1.06 | ) | (0.83 | ) | 0.30 | 0.13 | — | 0.43 | — | 10.22 | (7.47 | ) | 0.52 | 0.43 | 0.43 | 2.13 | 55 | 16 | ||||||||||||||||||||||||||||||||||||||||||||||||
12-31-17 |
10.28 | 0.23 | 1.27 | 1.50 | 0.30 | — | — | 0.30 | — | 11.48 | 14.71 | 0.51 | 0.43 | 0.43 | 2.14 | 58 | 13 | |||||||||||||||||||||||||||||||||||||||||||||||||||
12-31-16 |
9.90 | 0.23 | 0.42 | 0.65 | 0.27 | — | — | 0.27 | — | 10.28 | 6.55 | 0.49 | 0.47 | 0.47 | 2.28 | 50 | 52 | |||||||||||||||||||||||||||||||||||||||||||||||||||
12-31-15 |
10.95 | 0.22 | • | (0.58 | ) | (0.36 | ) | 0.27 | 0.42 | — | 0.69 | — | 9.90 | (3.70 | ) | 0.48 | 0.43 | 0.43 | 2.03 | 47 | 42 | |||||||||||||||||||||||||||||||||||||||||||||||
(1) |
Total return is calculated assuming reinvestment of all dividends, capital gain distributions and return of capital distributions, if any, at net asset value and does not reflect the effect of insurance contract charges. Total return for periods less than one year is not annualized. | |
(2) |
Annualized for periods less than one year. | |
(3) |
Ratios reflect operating expenses of a Portfolio. Expenses before reductions/additions do not reflect amounts reimbursed or recouped by the Investment Adviser and/or Distributor or reductions from brokerage service arrangements or other expense offset arrangements and do not represent the amount paid by a Portfolio during periods when reimbursements or reductions occur. |
| Expenses net of fee waivers reflect expenses after reimbursement by the Investment Adviser and/or Distributor or recoupment of previously reimbursed fees by the Investment Adviser, but prior to reductions from brokerage service arrangements or other expense offset arrangements. Expenses net of all reductions/additions represent the net expenses paid by a Portfolio. Net investment income (loss) is net of all such additions or reductions. | ||
(4) |
Ratios do not include expenses of underlying funds and do not include fees and expenses charged under the variable annuity contract or variable life insurance policy. | |
• |
Calculated using average number of shares outstanding throughout the year or period. |
(1) |
Market value of investment securities, other assets and liabilities — at the exchange rates prevailing at Market Close. |
(2) |
Purchases and sales of investment securities, income and expenses — at the rates of exchange prevailing on the respective dates of such transactions. |
| Purchases | Sales | |
|---|---|---|
$13,153,674 |
$27,595,503 |
| Class ADV(1,2) | Class I(1,2) | Class S(1,2) | ||||||||
|---|---|---|---|---|---|---|---|---|---|---|
| 1.55% | 0.95% | 1.20% | ||||||||
(1) |
The operating expense limits shown take into account the operating expenses incurred at the Underlying Fund level. The amount of fees and expenses of an Underlying Fund borne by the Portfolio will vary based on the Portfolio’s allocation of assets to, and the net expenses of, a particular Underlying Fund. | |
(2) |
Pursuant to a side letter through May 1, 2020, the total expense limits including the operating expenses incurred at the Underlying Fund level are 1.09%, 0.83% and 1.08% for Class ADV, Class I, and Class S shares respectively. Termination or modification of this obligation requires approval by the Board. |
| December 31, | |||||||||||||||
|---|---|---|---|---|---|---|---|---|---|---|---|---|---|---|---|
| 2020 | 2021 | 2022 | Total | ||||||||||||
| $108,606 | $ | 102,272 | $ | 97,079 | $ | 307,957 | |||||||||
| Shares sold |
Shares issued in merger |
Reinvestment of distributions |
Shares redeemed |
Net increase (decrease) in shares outstanding |
Shares sold |
Proceeds from shares issued in merger |
Reinvestment of distributions |
Shares redeemed |
Net increase (decrease) |
|||||||||||||||||||||
|---|---|---|---|---|---|---|---|---|---|---|---|---|---|---|---|---|---|---|---|---|---|---|---|---|---|---|---|---|---|---|
| Year or period ended |
# | # | # | # | # | ($) | ($) | ($) | ($) | ($) | ||||||||||||||||||||
Class
ADV |
||||||||||||||||||||||||||||||
12/31/2019 |
197,096 | — | 676,543 | (1,604,598 | ) | (730,959 | ) | 2,170,458 | — | 7,252,542 | (17,490,257 | ) | (8,067,257 | ) | ||||||||||||||||
12/31/2018 |
148,056 | — | 374,186 | (1,920,791 | ) | (1,398,549 | ) | 1,678,572 | — | 4,138,503 | (21,406,712 | ) | (15,589,637 | ) | ||||||||||||||||
Class
I |
||||||||||||||||||||||||||||||
12/31/2019 |
92,317 | — | 54,979 | (211,343 | ) | (64,047 | ) | 1,008,165 | — | 593,230 | (2,329,337 | ) | (727,942 | ) | ||||||||||||||||
12/31/2018 |
250,754 | — | 35,592 | (262,050 | ) | 24,296 | 2,859,543 | — | 396,139 | (2,945,690 | ) | 309,992 | ||||||||||||||||||
Class
S |
||||||||||||||||||||||||||||||
12/31/2019 |
21 | — | 424 | (51 | ) | 394 | 233 | — | 4,546 | (565 | ) | 4,214 | ||||||||||||||||||
12/31/2018 |
125 | — | 200 | (23 | ) | 302 | 1,369 | — | 2,218 | (258 | ) | 3,329 |
| Year Ended December 31, 2019 |
Year Ended December 31, 2018 |
|||||||
|---|---|---|---|---|---|---|---|---|
| Ordinary Income |
Long-term Capital Gains |
Ordinary Income |
Long-term Capital Gains |
|||||
$3,458,637 |
$4,391,681 |
$3,212,809 |
$1,324,051 |
|||||
| Undistributed Ordinary Income |
Undistributed Long-term Capital Gains |
Unrealized Appreciation/ (Depreciation) |
||
|---|---|---|---|---|
| $ 3,099,291 | $3,228,921 | $3,245,320 |
(continued)
| VOYA GLOBAL PERSPECTIVES® PORTFOLIO | PORTFOLIO OF INVESTMENTS AS OF DECEMBER 31, 2019 |
| Shares | Value | Percentage of Net Assets |
||||||||
|---|---|---|---|---|---|---|---|---|---|---|
MUTUAL FUNDS: 100.0%
|
||||||||||
| Affiliated Investment Companies: 100.0% | ||||||||||
| 893,739 | Voya
Emerging Markets Index Portfolio — Class I |
$ | 10,939,364 | 10.6 | ||||||
| 1,035,213 | Voya
Global Bond Fund — Class R6 |
9,969,103 | 9.6 | |||||||
| 1,173,975 | Voya
GNMA Income Fund — Class I |
9,943,567 | 9.6 | |||||||
| 1,019,837 | Voya
High Yield Portfolio — Class I |
10,137,183 | 9.8 | |||||||
| 372,952 | Voya
Index Plus LargeCap Portfolio — Class I |
10,729,830 | 10.3 | |||||||
| 1,001,324 | Voya
International Index Portfolio — Class I |
10,624,045 | 10.2 | |||||||
| 757,535 | Voya
MidCap Opportunities Portfolio — Class I |
10,544,892 | 10.2 | |||||||
| Shares | Value | Percentage of Net Assets |
||||||||
|---|---|---|---|---|---|---|---|---|---|---|
MUTUAL FUNDS: (continued)
|
||||||||||
| Affiliated Investment Companies: (continued) | ||||||||||
| 628,397 | Voya
Small Company Portfolio — Class I |
$ | 10,707,882 | 10.3 | ||||||
| 908,597 | Voya
U.S. Bond Index Portfolio — Class I |
9,903,706 | 9.6 | |||||||
| 773,027 | VY®
Clarion Global Real Estate Portfolio — Class I |
10,134,388 | 9.8 | |||||||
Total Mutual Funds (Cost $97,992,341) |
103,633,960 | 100.0 | ||||||||
Liabilities in Excess of Other Assets |
(33,681 | ) | — | |||||||
Net
Assets |
$ | 103,600,279 | 100.0 | |||||||
| Quoted Prices in Active Markets for Identical Investments (Level 1) |
Significant Other Observable Inputs (Level 2) |
Significant Unobservable Inputs (Level 3) |
Fair Value at December 31, 2019 |
|||||||||||||||||
|---|---|---|---|---|---|---|---|---|---|---|---|---|---|---|---|---|---|---|---|---|
Asset
Table |
||||||||||||||||||||
Investments,
at fair value |
||||||||||||||||||||
Mutual
Funds |
$ | 103,633,960 | $ | — | $ | — | $ | 103,633,960 | ||||||||||||
Total
Investments, at fair value |
$ | 103,633,960 | $ | — | $ | — | $ | 103,633,960 | ||||||||||||
| Issuer | Beginning Fair Value at 12/31/18 |
Purchases at Cost |
Sales at Cost |
Change in Unrealized Appreciation/ (Depreciation) |
Ending Fair Value at 12/31/19 |
Investment Income |
Realized Gains/ (Losses) |
Net Capital Gain Distributions |
||||||||||||||||||||||||
|---|---|---|---|---|---|---|---|---|---|---|---|---|---|---|---|---|---|---|---|---|---|---|---|---|---|---|---|---|---|---|---|---|
Voya
Emerging Markets Index Portfolio — Class I |
$ | 10,253,346 | $ | 1,343,339 | $ | (1,820,938 | ) | $ | 1,163,617 | $ | 10,939,364 | $ | 249,274 | $ | 352,092 | $ | — | |||||||||||||||
Voya Global
Bond Fund — Class R6 |
10,287,608 | 1,479,156 | (2,005,528 | ) | 207,867 | 9,969,103 | 434,977 | 114,721 | — | |||||||||||||||||||||||
Voya GNMA
Income Fund — Class I |
10,260,307 | 1,561,388 | (2,164,363 | ) | 286,235 | 9,943,567 | 310,288 | (19,675 | ) | — | ||||||||||||||||||||||
Voya High
Yield Portfolio — Class I |
10,280,117 | 1,059,175 | (2,098,910 | ) | 896,801 | 10,137,183 | 576,762 | 31,119 | — | |||||||||||||||||||||||
Voya Index
Plus LargeCap Portfolio — Class I |
10,314,679 | 1,329,460 | (2,371,440 | ) | 1,457,131 | 10,729,830 | 166,222 | 268,907 | 915,116 | |||||||||||||||||||||||
Voya
International Index Portfolio — Class I |
10,256,499 | 664,016 | (1,805,289 | ) | 1,508,819 | 10,624,045 | 328,084 | 214,565 | — | |||||||||||||||||||||||
Voya MidCap
Opportunities Portfolio — Class I |
10,337,372 | 1,486,466 | (2,516,930 | ) | 1,237,984 | 10,544,892 | 28,034 | 254,345 | 1,233,879 | |||||||||||||||||||||||
Voya Small
Company Portfolio — Class I |
10,313,036 | 2,243,236 | (3,798,032 | ) | 1,949,642 | 10,707,882 | 42,124 | (883,675 | ) | 1,417,391 | ||||||||||||||||||||||
Voya U.S.
Bond Index Portfolio — Class I |
10,264,985 | 1,315,564 | (2,274,148 | ) | 597,305 | 9,903,706 | 252,478 | (6,376 | ) | — | ||||||||||||||||||||||
| VOYA GLOBAL PERSPECTIVES® PORTFOLIO | PORTFOLIO OF INVESTMENTS AS OF DECEMBER 31, 2019 (CONTINUED) |
| Issuer | Beginning Fair Value at 12/31/18 |
Purchases at Cost |
Sales at Cost |
Change in Unrealized Appreciation/ (Depreciation) |
Ending Fair Value at 12/31/19 |
Investment Income |
Realized Gains/ (Losses) |
Net Capital Gain Distributions | ||||||||||||||||||||||||
|---|---|---|---|---|---|---|---|---|---|---|---|---|---|---|---|---|---|---|---|---|---|---|---|---|---|---|---|---|---|---|---|---|
VY®
Clarion Global Real Estate Portfolio — Class I |
$ | 10,260,782 | $ | 671,875 | $ | (2,701,345 | ) | $ | 1,903,076 | $ | 10,134,388 | $ | 299,337 | $ | 146,171 | $ | — | |||||||||||||||
| $ | 102,828,731 | $ | 13,153,674 | $ | (23,556,922 | ) | $ | 11,208,477 | $ | 103,633,960 | $ | 2,687,580 | $ | 472,195 | $ | 3,566,386 | ||||||||||||||||
Cost for federal income tax purposes was $100,388,640. |
|||
Net unrealized
appreciation consisted of: |
|||
Gross
Unrealized Appreciation |
$ | 6,778,110 | |
Gross
Unrealized Depreciation |
(3,532,790 | ) | |
Net Unrealized
Appreciation |
$ | 3,245,320 |
| Portfolio Name | Type | Per Share Amount | ||||||
|---|---|---|---|---|---|---|---|---|
Voya Global
Perspectives® Portfolio |
||||||||
Class
ADV |
NII |
$0.3682 |
||||||
Class
I |
NII |
$0.4069 |
||||||
Class
S |
NII |
$0.3798 |
||||||
All
Classes |
LTCG |
$0.4711 | ||||||
NII — Net investment income
LTCG — Long-term capital gain
Of the ordinary distributions made during the year ended December 31, 2019, 10.96% qualifies for the dividends received deduction (DRD) available to corporate shareholders.
| Creditable Foreign Taxes Paid |
Per Share Amount |
Portion of Ordinary Income Distribution Derived from Foreign Sourced Income* |
||
|---|---|---|---|---|
$36,848 |
$0.0040 |
14.95% |
* |
The Portfolio listed above did not derive any income from ineligible foreign sources as defined under Section 901(j) of the Internal Revenue Code. |
| Name, Address and Age | Position(s) Held with the Trust |
Term of Office and Length of Time Served(1) |
Principal Occupation(s) — During the Past 5 Years |
Number of funds in Fund Complex Overseen by Trustee(2) |
Other Board Positions Held by Trustee |
|||||
|---|---|---|---|---|---|---|---|---|---|---|
Independent Trustees*: |
||||||||||
Colleen D.
Baldwin 7337 East Doubletree Ranch Rd. Suite 100 Scottsdale, Arizona 85258 Age: 59 |
Trustee Chairperson |
November 2007–Present January 2020–Present |
President, Glantuam Partners, LLC, a business consulting firm (January 2009–Present). |
146 |
Dentaquest (February 2014–Present); RSR Partners, Inc. (2016–Present). |
|||||
John V.
Boyer 7337 East Doubletree Ranch Rd. Suite 100 Scottsdale, Arizona 85258 Age: 66 |
Trustee |
January 2005–Present |
Retired. Formerly, President and Chief Executive Officer, Bechtler Arts Foundation, an arts and education foundation (January
2008–December 2019). |
146 |
None. |
|||||
Patricia W.
Chadwick 7337 East Doubletree Ranch Rd. Suite 100 Scottsdale, Arizona 85258 Age: 71 |
Trustee |
January 2006–Present |
Consultant and President, Ravengate Partners LLC, a consulting firm that provides advice regarding financial markets and the global economy
(January 2000–Present). |
146 |
Wisconsin Energy Corporation (June 2006–Present); The Royce Fund (22 funds) (December 2009–Present); and AMICA Mutual Insurance
Company (1992–Present). |
|||||
Martin J.
Gavin 7337 East Doubletree Ranch Rd. Suite 100 Scottsdale, AZ 85258 Age: 69 |
Trustee |
August 2015–Present |
Retired. Formerly, President and Chief Executive Officer, Connecticut Children’s Medical Center (May 2006–November
2015). |
146 |
None. |
|||||
Joseph E.
Obermeyer 7337 East Doubletree Ranch Rd. Suite 100 Scottsdale, Arizona 85258 Age: 62 |
Trustee |
May 2013–Present |
President, Obermeyer & Associates, Inc., a provider of financial and economic consulting services (November
1999–Present). |
146 |
None. |
|||||
Sheryl K.
Pressler 7337 East Doubletree Ranch Rd. Suite 100 Scottsdale, Arizona 85258 Age: 69 |
Trustee |
January 2006–Present |
Consultant (May 2001–Present). |
146 |
None. |
|||||
Christopher
P. Sullivan 7337 East Doubletree Ranch Rd. Suite 100 Scottsdale, Arizona 85258 Age: 66 |
Trustee |
October 2015–Present |
Retired. |
146 |
None. |
| Name, Address and Age | Position(s) Held with the Trust |
Term of Office and Length of Time Served(1) |
Principal Occupation(s) — During the Past 5 Years |
Number of funds in Fund Complex Overseen by Trustee(2) |
Other Board Positions Held by Trustee | |||||
|---|---|---|---|---|---|---|---|---|---|---|
Trustee who is an “interested person”:
|
||||||||||
Dina
Santoro 230 Park Avenue New York, New York 10169 Age: 46 |
Trustee |
July 2018–Present |
President, Voya Investments, LLC and Voya Capital, LLC (March 2018–Present); Senior Vice President, Voya Investments Distributor, LLC
(April 2018–Present); Senior Managing Director, Head of Product and Marketing Strategy, Voya Investment Management (September 2017–Present).
Formerly, Managing Director, Quantitative Management Associates, LLC (January 2004–August 2017). |
146 |
Voya
Investments, LLC, Voya Capital, LLC, and Voya Funds Services, LLC (March 2018–Present); Voya Investments Distributor, LLC (April
2018–Present). | |||||
(1) |
Trustees serve until their successors are duly elected and qualified. The tenure of each Trustee who is not an “interested person” as defined in the 1940 Act, of each Portfolio (“Independent Trustee”) is subject to the Board’s retirement policy which states that each duly elected or appointed Independent Trustee shall retire from and cease to be a member of the Board of Trustees at the close of business on December 31 of the calendar year in which the Independent Trustee attains the age of 75. A majority vote of the Board’s other Independent Trustees may extend the retirement date of an Independent Trustee if the retirement would trigger a requirement to hold a meeting of shareholders of the Trust under applicable law, whether for the purposes of appointing a successor to the Independent Trustee or otherwise comply under applicable law, in which case the extension would apply until such time as the shareholder meeting can be held or is no longer required (as determined by a vote of a majority of the other Independent Trustees). | |
(2) |
For the purposes of this table, “Fund Complex” means the Voya family of funds including the following investment companies: Voya Asia Pacific High Dividend Equity Income Fund; Voya Balanced Portfolio, Inc.; Voya Emerging Markets High Dividend Equity Fund; Voya Equity Trust; Voya Funds Trust; Voya Global Advantage and Premium Opportunity Fund; Voya Global Equity Dividend and Premium Opportunity Fund; Voya Government Money Market Portfolio; Voya Infrastructure, Industrials and Materials Fund; Voya Intermediate Bond Portfolio; Voya International High Dividend Equity Income Fund; Voya Investors Trust; Voya Mutual Funds; Voya Natural Resources Equity Income Fund; Voya Partners, Inc.; Voya Prime Rate Trust; Voya Senior Income Fund; Voya Separate Portfolios Trust; Voya Strategic Allocation Portfolios, Inc.; Voya Variable Funds; Voya Variable Insurance Trust; Voya Variable Portfolios, Inc.; and Voya Variable Products Trust. The number of funds in the Fund Complex is as of January 31, 2020. | |
* |
Effective December 31, 2019, Russell H. Jones and Roger B. Vincent each retired as a Trustee of the Board. |
| Name, Address and Age | Position(s) Held With the Trust |
Term of Office and Length of Time Served(1) |
Principal Occupation(s) — During the Past 5 Years |
|||
|---|---|---|---|---|---|---|
Michael Bell One Orange Way Windsor, Connecticut 06095 Age: 51 |
Chief Executive
Officer |
March
2018–Present |
Chief
Executive Officer and Director, Voya Investments, LLC, Voya Capital, LLC, and Voya Funds Services, LLC (March 2018–Present); Senior Vice President
and Chief Financial Officer, Voya Investments Distributor, LLC (September 2019–Present); Chief Financial Officer, Voya Investment Management
(September 2014–Present). Formerly, Senior Vice President, Chief Financial Officer and Treasurer, Voya Investments, LLC (November 2015–March
2018). |
|||
Dina Santoro 230 Park Avenue New York, New York 10169 Age: 46 |
President |
March
2018–Present |
President and Director, Voya Investments, LLC and Voya Capital, LLC (March 2018–Present); Director, Voya Funds Services, LLC (March
2018–Present); Director and Senior Vice President, Voya Investments Distributor, LLC (April 2018–Present); Senior Managing Director, Head of
Product and Marketing Strategy, Voya Investment Management (September 2017–Present). Formerly, Managing Director, Quantitative Management
Associates, LLC (January 2004–August 2017). |
|||
Stanley D.
Vyner 230 Park Avenue New York, New York 10169 Age: 69 |
Executive Vice
President Chief Investment Risk Officer |
March
2003–Present September 2009–Present |
Executive Vice President, Voya Investments, LLC (July 2000–Present) and Chief Investment Risk Officer, Voya Investments, LLC (January
2003–Present). |
|||
James M. Fink 5780 Powers Ferry Road NW Atlanta, Georgia 30327 Age: 61 |
Executive Vice
President |
March
2018–Present |
Managing Director, Voya Investments, LLC, Voya Capital, LLC, and Voya Funds Services, LLC (March 2018–Present); Senior Vice President,
Voya Investments Distributor, LLC (April 2018–Present); Chief Administrative Officer, Voya Investment Management (September 2017–Present).
Formerly, Managing Director, Operations, Voya Investment Management (March 1999–September 2017). |
|||
Kevin M.
Gleason 7337 East Doubletree Ranch Rd. Suite 100 Scottsdale, Arizona 85258 Age: 53 |
Chief Compliance
Officer |
February
2012–Present |
Senior
Vice President, Voya Investment Management and Chief Compliance Officer, Voya Family of Funds (February 2012–Present). |
|||
Todd Modic 7337 East Doubletree Ranch Rd. Suite 100 Scottsdale, Arizona 85258 Age: 52 |
Senior Vice
President, Chief/Principal Financial Officer and Assistant Secretary |
March
2005–Present |
President, Voya Funds Services, LLC (March 2018–Present) and Senior Vice President, Voya Investments, LLC (April
2005–Present). |
|||
Kimberly A.
Anderson 7337 East Doubletree Ranch Rd. Suite 100 Scottsdale, Arizona 85258 Age: 55 |
Senior Vice
President |
November
2003–Present |
Senior
Vice President, Voya Investments, LLC (September 2003–Present). |
|||
Robert Terris 5780 Powers Ferry Road NW Atlanta, Georgia 30327 Age: 49 |
Senior Vice
President |
May
2006–Present |
Senior
Vice President, Voya Investments Distributor, LLC (April 2018–Present); Senior Vice President, Head of Division Operations, Voya Investments, LLC
(October 2015–Present) and Voya Funds Services, LLC (March 2006–Present). |
|||
Fred Bedoya 7337 East Doubletree Ranch Rd. Suite 100 Scottsdale, Arizona 85258 Age: 47 |
Vice President and
Treasurer |
September
2012–Present |
Vice
President, Voya Investments, LLC (October 2015–Present) and Voya Funds Services, LLC (July 2012–Present). |
|||
Maria M.
Anderson 7337 East Doubletree Ranch Rd. Suite 100 Scottsdale, Arizona 85258 Age: 61 |
Vice
President |
September
2004–Present |
Vice
President, Voya Investments, LLC (October 2015–Present) and Voya Funds Services, LLC (September 2004–Present). |
| Name, Address and Age | Position(s) Held With the Trust |
Term of Office and Length of Time Served(1) |
Principal Occupation(s) — During the Past 5 Years | |||
|---|---|---|---|---|---|---|
Sara M. Donaldson 7337 East Doubletree Ranch Rd. Suite 100 Scottsdale, Arizona 85258 Age: 60 |
Vice
President |
September
2014–Present |
Vice
President, Voya Investments, LLC (October 2015–Present). Formerly, Vice President, Voya Funds Services, LLC (April 2014–October
2015). |
|||
Micheline S.
Faver 7337 East Doubletree Ranch Rd. Suite 100 Scottsdale, Arizona 85258 Age: 42 |
Vice
President |
September
2016–Present |
Vice
President, Head of Fund Compliance and Chief Compliance Officer, Voya Investments, LLC (June 2016–Present). Formerly, Vice President, Mutual Fund
Compliance (March 2014–June 2016). |
|||
Robyn L.
Ichilov 7337 East Doubletree Ranch Rd. Suite 100 Scottsdale, Arizona 85258 Age: 52 |
Vice
President |
November
1999–Present |
Vice
President, Voya Funds Services, LLC (November 1995–Present) and Voya Investments, LLC (August 1997–Present). |
|||
Jason Kadavy 7337 East Doubletree Ranch Rd. Suite 100 Scottsdale, Arizona 85258 Age: 43 |
Vice
President |
September
2012–Present |
Vice
President, Voya Investments, LLC (October 2015–Present) and Voya Funds Services, LLC (July 2007–Present). |
|||
Andrew K.
Schlueter 7337 East Doubletree Ranch Rd. Suite 100 Scottsdale, Arizona 85258 Age: 43 |
Vice
President |
March
2018–Present |
Vice
President, Voya Investments Distributor, LLC (April 2018–Present); Vice President, Voya Investments, LLC and Voya Funds Services, LLC (March
2018–Present); Vice President, Head of Mutual Fund Operations, Voya Investment Management (February 2018–Present). Formerly, Vice President,
Voya Investment Management (March 2014–February 2018). |
|||
Craig Wheeler 7337 East Doubletree Ranch Rd. Suite 100 Scottsdale, Arizona 85258 Age: 50 |
Vice
President |
May
2013–Present |
Vice
President — Director of Tax, Voya Investments, LLC (October 2015–Present). Formerly, Vice President — Director of Tax, Voya Funds
Services, LLC (March 2013–October 2015). |
|||
Monia Piacenti One Orange Way Windsor, Connecticut 06095 Age: 43 |
Anti-Money
Laundering Officer |
June
2018–Present |
Anti-Money Laundering Officer, Voya Investments Distributor, LLC, Voya Investment Management and Voya Investment Management Trust Co. (June
2018–Present); Compliance Consultant, Voya Financial, Inc. (January 2019–Present). Formerly, Senior Compliance Officer, Voya Investment
Management (December 2009–December 2018). |
|||
Theresa K.
Kelety 7337 East Doubletree Ranch Rd. Suite 100 Scottsdale, Arizona 85258 Age: 57 |
Secretary |
January
2020–Present |
Vice
President and Senior Counsel, Voya Investment Management — Mutual Fund Legal Department (March 2010–Present). |
|||
Paul A.
Caldarelli 7337 East Doubletree Ranch Rd. Suite 100 Scottsdale, Arizona 85258 Age: 68 |
Assistant
Secretary |
June
2010–Present |
Vice
President and Senior Counsel, Voya Investment Management — Mutual Fund Legal Department (March 2010–Present). |
|||
Joanne F.
Osberg 7337 East Doubletree Ranch Rd. Suite 100 Scottsdale, Arizona 85258 Age: 38 |
Assistant
Secretary |
January
2020–Present |
Vice
President and Counsel, Voya Investment Management — Mutual Fund Legal Department (January 2013–Present). |
(1) |
The Officers hold office until the next annual meeting of the Board of Trustees and until their successors shall have been elected and qualified. |
Voya Investments, LLC
7337 East Doubletree Ranch Road, Suite 100
Scottsdale, Arizona 85258
Voya Investments Distributor, LLC
7337 East Doubletree Ranch Road, Suite 100
Scottsdale, Arizona 85258
BNY Mellon Investment Servicing (U.S.) Inc.
301 Bellevue Parkway
Wilmington, Delaware 19809
KPMG LLP
Two Financial Center
60 South Street
Boston, Massachusetts 02111
The Bank of New York Mellon
225 Liberty Street
New York, New York 10286
Ropes & Gray LLP
Prudential Tower
800 Boylston Street
Boston, Massachusetts 02199
| RETIREMENT | INVESTMENTS | INSURANCE | |
| voyainvestments.com | VPAR-VITFOFAIS (1219-021420) |
Annual Report
December 31, 2019
Classes ADV and I
| Voya Investors Trust |
| n | Voya Retirement Conservative Portfolio |
| n | Voya Retirement Growth Portfolio |
| n | Voya Retirement Moderate Portfolio |
| n | Voya Retirement Moderate Growth Portfolio |
Beginning on January 1, 2021, as permitted by regulations
adopted by the U.S. Securities and Exchange Commission, paper copies of each Portfolio’s annual and semi-annual shareholder reports, like this
annual report, will no longer be sent by mail, unless you specifically request paper copies of the reports. Instead, the reports will be made available
on a website and you will be notified by mail each time a report is posted and provided with a website link to access the report. If you already elected to receive shareholder reports electronically, you will not be affected by this change and you need not take any action. You may elect to receive shareholder reports and other communications from your insurance carrier electronically by contacting them directly. You may elect to receive all future reports in paper free of charge. If you received this document in the mail, please follow the instructions provided to elect to continue receiving paper copies of your shareholder reports. You can inform us that you wish to continue receiving paper copies by calling 1-800-283-3427. Your election to receive reports in paper will apply to all the funds in which you invest. |
This report is submitted for general information to
shareholders of the Voya mutual funds. It is not authorized for distribution to prospective shareholders unless accompanied or preceded by a prospectus
which includes details regarding the funds’ investment objectives, risks, charges, expenses and other information. This information should be read
carefully. |
| INVESTMENT
MANAGEMENT voyainvestments.com |
|
| 1 | |||
| 2 | |||
| 4 | |||
| 10 | |||
| 11 | |||
| 12 | |||
| 13 | |||
| 14 | |||
| 16 | |||
| 18 | |||
| 25 | |||
| 33 | |||
| 34 | |||
| 38 |
A description of the policies and procedures that the Portfolios use to determine how to vote proxies related to portfolio securities is available: (1) without charge, upon request, by calling Shareholder Services toll-free at (800) 992-0180; (2) on the Portfolios’ website at www.voyainvestments.com; and (3) on the U.S. Securities and Exchange Commission’s (“SEC’s”) website at www.sec.gov. Information regarding how the Portfolios voted proxies related to portfolio securities during the most recent 12-month period ended June 30 is available without charge on the Portfolios’ website at www.voyainvestments.com and on the SEC’s website at www.sec.gov.
The Portfolios file their complete schedule of portfolio holdings with the SEC for the first and third quarters of each fiscal year on Form N-Q or Form N-PORT, available for filings after March 31, 2019. The Portfolios’ Form N-Q or Form N-PORT is available on the SEC’s website at www.sec.gov. The Portfolios’ complete schedule of portfolio holdings, as filed on Form N-Q or Form N-PORT, are available: on www.voyainvestments.com and without charge upon request from the Portfolio by calling Shareholder Services toll-free at (800) 992-0180.
President
Voya Family of Funds
January 21, 2020
| Index | Description | |
Bloomberg Barclays
U.S. Aggregate Bond Index |
An
index of publicly issued investment grade U.S. government, mortgage-backed, asset-backed and corporate debt securities. |
|
Bloomberg Barclays
Long-Term U.S. Treasury Index |
This
index measures the performance of U.S. Treasury bills with long-term maturity. The credit level for this index is investment grade. The rebalance
scheme is monthly. |
|
MSCI Europe,
Australasia and Far East® (“MSCI EAFE”) Index |
An
index that measures the performance of securities listed on exchanges in Europe, Australasia and the Far East. It includes the reinvestment of
dividends net of withholding taxes, but does not reflect fees, brokerage commissions or other expenses of investing. |
|
MSCI Europe ex
UK® Index |
A free
float-adjusted market capitalization index that is designed to measure developed market equity performance in Europe, excluding the
UK. |
|
MSCI Japan®
Index |
A free
float-adjusted market capitalization index that is designed to measure developed market equity performance in Japan. |
|
MSCI U.K.®
Index |
A free
float-adjusted market capitalization index that is designed to measure developed market equity performance in the UK. |
|
MSCI World
IndexSM |
An
index that measures the performance of over 1,600 securities listed on exchanges in the U.S., Europe, Canada, Australia, New Zealand and the Far
East. |
|
Russell 3000®
Index |
An
index that measures the performance of the largest 3000 U.S. companies representing approximately 98% of the investable U.S. equity
market. |
|
S&P 500®
Index |
An
index that measures the performance of securities of approximately 500 large-capitalization companies whose securities are traded on major U.S. stock
markets. |
|
S&P Target
Risk® Aggressive Index* |
Seeks
to emphasize exposure to equity securities, maximizing opportunities for long-term capital accumulation. It may include small allocations in
fixed-income securities to enhance portfolio efficiency. |
|
S&P Target
Risk® Conservative Index* |
Seeks
to emphasize exposure to fixed income securities in order to produce a current income stream and avoid excessive volatility of returns. Equity
securities are included to protect long-term purchasing power. |
|
S&P Target
Risk® Growth Index* |
Seeks
to measure the performance of an asset allocation strategy targeted to a growth focused risk profile. |
|
S&P Target
Risk® Moderate Index* |
Seeks
to measure the performance of an asset allocation strategy targeted to a moderate risk profile. |
* |
Total return and gross index returns are presented. Index returns include the reinvestment of dividends and distributions. Gross index returns reflect the addition of an amount estimated by the index sponsor to approximate the fees incurred by index components. |
| VOYA RETIREMENT PORTFOLIOS | PORTFOLIO MANAGERS’ REPORT |
* |
Each Portfolio’s relative performance versus its respective benchmarks can be found on page 5. | |
(1) |
The investment objective of each Portfolio is described in the Portfolios’ prospectuses, each dated May 1, 2019. |
| PORTFOLIO MANAGERS’ REPORT | VOYA RETIREMENT PORTFOLIOS |
Total Returns for the Period Ended December 31, 2019 |
|||||
|---|---|---|---|---|---|
| 1 Year | |||||
Voya Retirement
Conservative Portfolio, Class I |
13.81 | % | |||
S&P Target
Risk® Conservative Index Total Return |
13.99 | % | |||
Voya Retirement
Growth Portfolio, Class I |
22.09 | % | |||
S&P Target
Risk Aggressive® Index Total Return |
22.79 | % | |||
Russell
3000® Index |
31.02 | % | |||
MSCI EAFE®
Index |
22.01 | % | |||
Bloomberg
Barclays U.S. Aggregate Bond (“BCAB”) Index |
8.72 | % | |||
Voya Retirement
Moderate Portfolio, Class I |
17.56 | % | |||
S&P Target
Risk® Moderate Index Total Return |
15.71 | % | |||
Russell
3000® Index |
31.02 | % | |||
MSCI EAFE®
Index |
22.01 | % | |||
BCAB
Index |
8.72 | % | |||
Voya Retirement
Moderate Growth Portfolio, Class I |
20.40 | % | |||
S&P Target
Risk® Growth Index Total Return |
19.20 | % | |||
Russell
3000® Index |
31.02 | % | |||
MSCI EAFE®
Index |
22.01 | % | |||
BCAB
Index |
8.72 | % | |||
Target Allocations as of 12/31/19 (as a percentage of net assets)(1) |
||||||||||||||||||
|---|---|---|---|---|---|---|---|---|---|---|---|---|---|---|---|---|---|---|
| Sub Asset Class | Conservative | Growth | Moderate | Moderate Growth |
||||||||||||||
U.S. Large
Blend |
20.0 | % | 43.0 | % | 33.0 | % | 43.0 | % | ||||||||||
U.S. Mid Cap
Blend |
3.0 | % | 8.0 | % | 4.0 | % | 5.0 | % | ||||||||||
U.S. Small
Cap |
0.0 | % | 5.0 | % | 2.0 | % | 3.0 | % | ||||||||||
International |
4.0 | % | 13.0 | % | 7.0 | % | 9.0 | % | ||||||||||
Emerging
Markets |
3.0 | % | 6.0 | % | 4.0 | % | 5.0 | % | ||||||||||
Core Fixed
Income |
61.0 | % | 21.0 | % | 41.0 | % | 29.0 | % | ||||||||||
TIPS |
9.0 | % | 4.0 | % | 9.0 | % | 6.0 | % | ||||||||||
Total
Equity |
30.0 | % | 75.0 | % | 50.0 | % | 65.0 | % | ||||||||||
Total Fixed
Income |
70.0 | % | 25.0 | % | 50.0 | % | 35.0 | % | ||||||||||
| 100.0 | % | 100.0 | % | 100.0 | % | 100.0 | % | |||||||||||
(1) |
As these are target allocations, the actual allocations of each Portfolio’s assets may deviate from the percentages shown. Although the Retirement Portfolios expect to be fully invested at all times, they may maintain liquidity reserves to meet redemption requests. |
| VOYA RETIREMENT CONSERVATIVE PORTFOLIO | PORTFOLIO MANAGERS’ REPORT |

| Average Annual Total Returns for the Periods Ended December 31, 2019 | ||||||||||||||
|---|---|---|---|---|---|---|---|---|---|---|---|---|---|---|
| 1 Year | 5 Year | 10 Year | ||||||||||||
Class
ADV |
13.61 | % | 4.33 | % | 5.28 | % | ||||||||
Class
I |
13.81 | % | 4.50 | % | 5.50 | % | ||||||||
S&P Target
Risk® Conservative Index Total Return |
13.99 | % | 4.84 | % | 5.31 | % | ||||||||
S&P Target
Risk® Conservative Index Gross |
14.27 | % | 5.10 | % | 5.57 | % | ||||||||
| PORTFOLIO MANAGERS’ REPORT | VOYA RETIREMENT GROWTH PORTFOLIO |

| Average Annual Total Returns for the Periods Ended December 31, 2019 | ||||||||||||||
|---|---|---|---|---|---|---|---|---|---|---|---|---|---|---|
| 1 Year | 5 Year | 10 Year | ||||||||||||
Class
ADV |
21.55 | % | 6.64 | % | 7.94 | % | ||||||||
Class
I |
22.09 | % | 7.10 | % | 8.41 | % | ||||||||
S&P Target
Risk Aggressive® Index Total Return |
22.79 | % | 7.79 | % | 9.64 | % | ||||||||
S&P Target
Risk Aggressive® Index Gross |
23.09 | % | 8.06 | % | 9.92 | % | ||||||||
Russell
3000® Index |
31.02 | % | 11.24 | % | 13.42 | % | ||||||||
MSCI
EAFE® Index |
22.01 | % | 5.67 | % | 5.50 | % | ||||||||
BCAB
Index |
8.72 | % | 3.05 | % | 3.75 | % | ||||||||
| VOYA RETIREMENT MODERATE PORTFOLIO | PORTFOLIO MANAGERS’ REPORT |
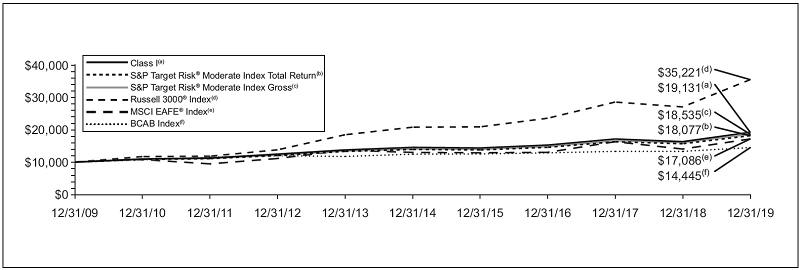
| Average Annual Total Returns for the Periods Ended December 31, 2019 | ||||||||||||||
|---|---|---|---|---|---|---|---|---|---|---|---|---|---|---|
| 1 Year | 5 Year | 10 Year | ||||||||||||
Class
ADV |
17.14 | % | 5.30 | % | 6.34 | % | ||||||||
Class
I |
17.56 | % | 5.66 | % | 6.70 | % | ||||||||
S&P Target
Risk® Moderate Index Total Return |
15.71 | % | 5.44 | % | 6.10 | % | ||||||||
S&P Target
Risk® Moderate Index Gross |
16.00 | % | 5.70 | % | 6.36 | % | ||||||||
Russell
3000® Index |
31.02 | % | 11.24 | % | 13.42 | % | ||||||||
MSCI
EAFE® Index |
22.01 | % | 5.67 | % | 5.50 | % | ||||||||
BCAB
Index |
8.72 | % | 3.05 | % | 3.75 | % | ||||||||
| PORTFOLIO MANAGERS’ REPORT | VOYA RETIREMENT MODERATE GROWTH PORTFOLIO |
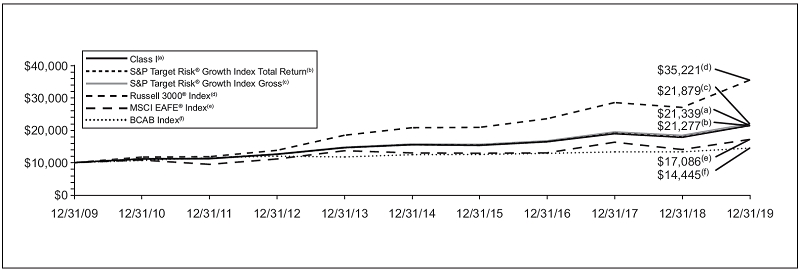
| Average Annual Total Returns for the Periods Ended December 31, 2019 | ||||||||||||||
|---|---|---|---|---|---|---|---|---|---|---|---|---|---|---|
| 1 Year | 5 Year | 10 Year | ||||||||||||
Class
ADV |
20.02 | % | 6.25 | % | 7.46 | % | ||||||||
Class
I |
20.40 | % | 6.66 | % | 7.87 | % | ||||||||
S&P Target
Risk® Growth Index Total Return |
19.20 | % | 6.63 | % | 7.87 | % | ||||||||
S&P Target
Risk® Growth Index Gross |
19.50 | % | 6.90 | % | 8.14 | % | ||||||||
Russell
3000® Index |
31.02 | % | 11.24 | % | 13.42 | % | ||||||||
MSCI
EAFE® Index |
22.01 | % | 5.67 | % | 5.50 | % | ||||||||
BCAB
Index |
8.72 | % | 3.05 | % | 3.75 | % | ||||||||
| Actual Portfolio Return | Hypothetical (5% return before expenses) | |||||||||||||||||||||||||||||||||
|---|---|---|---|---|---|---|---|---|---|---|---|---|---|---|---|---|---|---|---|---|---|---|---|---|---|---|---|---|---|---|---|---|---|---|
| Beginning Account Value July 1, 2019 |
Ending Account Value December 31, 2019 |
Annualized Expense Ratio* |
Expenses
Paid During the Period Ended December 31, 2019** |
Beginning Account Value July 1, 2019 |
Ending Account Value December 31, 2019 |
Annualized Expense Ratio* |
Expenses
Paid During the Period Ended December 31, 2019** |
|||||||||||||||||||||||||||
Voya Retirement Conservative Portfolio |
||||||||||||||||||||||||||||||||||
Class
ADV |
$ | 1,000.00 | $ | 1,042.40 | 0.53 | % | $ | 2.73 | $ | 1,000.00 | $ | 1,022.53 | 0.53 | % | $ | 2.70 | ||||||||||||||||||
Class
I |
1,000.00 | 1,043.30 | 0.28 | 1.44 | $ | 1,000.00 | 1,023.79 | 0.28 | 1.43 | |||||||||||||||||||||||||
Voya Retirement Growth Portfolio |
||||||||||||||||||||||||||||||||||
Class
ADV |
$ | 1,000.00 | $ | 1,070.50 | 0.68 | % | $ | 3.55 | $ | 1,000.00 | $ | 1,021.78 | 0.68 | % | $ | 3.47 | ||||||||||||||||||
Class
I |
1,000.00 | 1,072.80 | 0.26 | 1.36 | 1,000.00 | 1,023.89 | 0.26 | 1.33 | ||||||||||||||||||||||||||
Voya Retirement Moderate Portfolio |
||||||||||||||||||||||||||||||||||
Class
ADV |
$ | 1,000.00 | $ | 1,055.90 | 0.61 | % | $ | 3.16 | $ | 1,000.00 | $ | 1,022.13 | 0.61 | % | $ | 3.11 | ||||||||||||||||||
Class
I |
1,000.00 | 1,057.40 | 0.27 | 1.40 | 1,000.00 | 1,023.84 | 0.27 | 1.38 | ||||||||||||||||||||||||||
Voya Retirement Moderate Growth Portfolio |
||||||||||||||||||||||||||||||||||
Class
ADV |
$ | 1,000.00 | $ | 1,066.10 | 0.65 | % | $ | 3.39 | $ | 1,000.00 | $ | 1,021.93 | 0.65 | % | $ | 3.31 | ||||||||||||||||||
Class
I |
1,000.00 | 1,068.70 | 0.26 | 1.36 | 1,000.00 | 1,023.89 | 0.26 | 1.33 | ||||||||||||||||||||||||||
* |
The annualized expense ratios do not include expenses of the underlying funds. | |
** |
Expenses are equal to each Portfolios’ respective annualized expense ratios multiplied by the average account value over the period, multiplied by 184/365 to reflect the most recent fiscal half-year. |
Voya Investors Trust:
February 26, 2020
| Voya Retirement Conservative Portfolio |
Voya Retirement Growth Portfolio |
Voya Retirement Moderate Portfolio |
Voya Retirement Moderate Growth Portfolio |
||||||||||||||||||
|---|---|---|---|---|---|---|---|---|---|---|---|---|---|---|---|---|---|---|---|---|---|
ASSETS: |
|||||||||||||||||||||
Investments in
affiliated underlying funds at fair value* |
$ | 386,415,195 | $ | 2,497,652,385 | $ | 936,891,643 | $ | 1,683,679,759 | |||||||||||||
Investments in
unaffiliated underlying funds at fair value** |
37,908,178 | 103,634,316 | 92,031,112 | 106,739,056 | |||||||||||||||||
Cash |
826,016 | 2,346,759 | 1,920,001 | 1,026,992 | |||||||||||||||||
Receivables: |
|||||||||||||||||||||
Investments in
affiliated underlying funds sold |
— | 2,669,179 | 288,471 | 1,914,678 | |||||||||||||||||
Fund shares
sold |
1,360,969 | 125,498 | 30,741 | 5,830 | |||||||||||||||||
Interest |
497 | 1,186 | 1,164 | 1,440 | |||||||||||||||||
Prepaid
expenses |
2,978 | 18,622 | 7,206 | 12,759 | |||||||||||||||||
Other
assets |
16,976 | 155,502 | 57,453 | 103,919 | |||||||||||||||||
Total
assets |
426,530,809 | 2,606,603,447 | 1,031,227,791 | 1,793,484,433 | |||||||||||||||||
LIABILITIES: |
|||||||||||||||||||||
Payable for
investments in affiliated underlying funds purchased |
1,350,710 | — | — | — | |||||||||||||||||
Payable for fund
shares redeemed |
10,193 | 2,794,677 | 319,213 | 614,449 | |||||||||||||||||
Payable for
investment management fees |
131,959 | 553,835 | 271,144 | 383,780 | |||||||||||||||||
Payable for
distribution and shareholder service fees |
90,354 | 921,458 | 291,646 | 583,794 | |||||||||||||||||
Payable to
trustees under the deferred compensation plan (Note 6) |
16,976 | 155,502 | 57,453 | 103,919 | |||||||||||||||||
Payable for
trustee fees |
2,094 | 13,024 | 5,118 | 8,977 | |||||||||||||||||
Other accrued
expenses and liabilities |
49,499 | 276,905 | 114,644 | 209,476 | |||||||||||||||||
Total
liabilities |
1,651,785 | 4,715,401 | 1,059,218 | 1,904,395 | |||||||||||||||||
NET
ASSETS |
$ | 424,879,024 | $ | 2,601,888,046 | $ | 1,030,168,573 | $ | 1,791,580,038 | |||||||||||||
NET ASSETS
WERE COMPRISED OF: |
|||||||||||||||||||||
Paid-in
capital |
$ | 349,382,124 | $ | 2,254,488,547 | $ | 922,913,932 | $ | 1,570,469,600 | |||||||||||||
Total
distributable earnings |
75,496,900 | 347,399,499 | 107,254,641 | 221,110,438 | |||||||||||||||||
NET
ASSETS |
$ | 424,879,024 | $ | 2,601,888,046 | $ | 1,030,168,573 | $ | 1,791,580,038 | |||||||||||||
| * | Cost of investments in affiliated underlying funds |
$ | 327,602,735 | $ | 2,285,295,759 | $ | 874,751,639 | $ | 1,554,400,215 | ||||||||||||
| ** | Cost of investments in unaffiliated underlying funds |
$ | 35,780,067 | $ | 103,127,551 | $ | 88,583,315 | $ | 106,208,370 | ||||||||||||
Class
ADV |
|||||||||||||||||||||
Net
assets |
$ | 424,756,012 | $ | 2,553,927,291 | $ | 1,008,727,310 | $ | 1,769,059,786 | |||||||||||||
Shares
authorized |
unlimited | unlimited | unlimited | unlimited | |||||||||||||||||
Par
value |
$ | 0.001 | $ | 0.001 | $ | 0.001 | $ | 0.001 | |||||||||||||
Shares
outstanding |
45,645,220 | 196,470,613 | 87,325,351 | 146,231,171 | |||||||||||||||||
Net asset value
and redemption price per share |
$ | 9.31 | $ | 13.00 | $ | 11.55 | $ | 12.10 | |||||||||||||
Class
I |
|||||||||||||||||||||
Net
assets |
$ | 123,012 | $ | 47,960,755 | $ | 21,441,263 | $ | 22,520,252 | |||||||||||||
Shares
authorized |
unlimited | unlimited | unlimited | unlimited | |||||||||||||||||
Par
value |
$ | 0.001 | $ | 0.001 | $ | 0.001 | $ | 0.001 | |||||||||||||
Shares
outstanding |
13,014 | 3,667,374 | 1,832,941 | 1,876,848 | |||||||||||||||||
Net asset value
and redemption price per share |
$ | 9.45 | $ | 13.08 | $ | 11.70 | $ | 12.00 | |||||||||||||
| Voya Retirement Conservative Portfolio |
Voya Retirement Growth Portfolio |
Voya Retirement Moderate Portfolio |
Voya Retirement Moderate Growth Portfolio |
|||||||||||||||||
INVESTMENT
INCOME: |
||||||||||||||||||||
Dividends from
affiliated underlying funds |
$ | 9,041,767 | $ | 69,307,907 | $ | 24,567,115 | $ | 45,539,120 | ||||||||||||
Dividends from
unaffiliated underlying funds |
829,932 | 1,701,490 | 1,744,289 | 1,756,852 | ||||||||||||||||
Interest |
1,168 | 1,186 | 1,164 | 1,440 | ||||||||||||||||
Total
investment income |
9,872,867 | 71,010,583 | 26,312,568 | 47,297,412 | ||||||||||||||||
EXPENSES: |
||||||||||||||||||||
Investment
management fees |
1,093,818 | 6,313,734 | 2,586,242 | 4,370,128 | ||||||||||||||||
Distribution and
shareholder service fees: |
||||||||||||||||||||
Class
ADV |
2,093,827 | 12,784,223 | 5,021,476 | 8,868,846 | ||||||||||||||||
Transfer agent
fees |
518 | 2,036 | 1,154 | 1,920 | ||||||||||||||||
Shareholder
reporting expense |
11,214 | 46,043 | 13,425 | 21,540 | ||||||||||||||||
Professional
fees |
21,111 | 100,318 | 39,130 | 75,519 | ||||||||||||||||
Custody and
accounting expense |
29,392 | 133,786 | 44,042 | 84,506 | ||||||||||||||||
Trustee
fees |
16,754 | 104,196 | 40,947 | 71,817 | ||||||||||||||||
Miscellaneous
expense |
18,077 | 83,294 | 32,624 | 59,135 | ||||||||||||||||
Interest
expense |
256 | 571 | 593 | 217 | ||||||||||||||||
Total
expenses |
3,284,967 | 19,568,201 | 7,779,633 | 13,553,628 | ||||||||||||||||
Waived and
reimbursed fees |
(1,038,537 | ) | (1,920,163 | ) | (1,593,804 | ) | (1,961,769 | ) | ||||||||||||
Net
expenses |
2,246,430 | 17,648,038 | 6,185,829 | 11,591,859 | ||||||||||||||||
Net investment
income |
7,626,437 | 53,362,545 | 20,126,739 | 35,705,553 | ||||||||||||||||
REALIZED AND
UNREALIZED GAIN (LOSS): |
||||||||||||||||||||
Net realized
gain (loss) on: |
||||||||||||||||||||
Sale of
affiliated underlying funds |
2,301,189 | (7,089,670 | ) | 4,699,626 | 10,340,599 | |||||||||||||||
Sale of
unaffiliated underlying funds |
915,338 | 67,181 | 323,019 | 62,150 | ||||||||||||||||
Capital gain
distributions from affiliated underlying funds |
7,604,013 | 140,591,273 | 35,341,781 | 82,348,370 | ||||||||||||||||
Net realized
gain |
10,820,540 | 133,568,784 | 40,364,426 | 92,751,119 | ||||||||||||||||
Net change in
unrealized appreciation (depreciation) on: |
||||||||||||||||||||
Affiliated
underlying funds |
32,370,496 | 318,737,427 | 96,941,759 | 196,383,593 | ||||||||||||||||
Unaffiliated
underlying funds |
2,313,384 | 506,765 | 3,660,424 | 530,686 | ||||||||||||||||
Net change in
unrealized appreciation (depreciation) |
34,683,880 | 319,244,192 | 100,602,183 | 196,914,279 | ||||||||||||||||
Net realized and
unrealized gain |
45,504,420 | 452,812,976 | 140,966,609 | 289,665,398 | ||||||||||||||||
Increase in
net assets resulting from operations |
$ | 53,130,857 | $ | 506,175,521 | $ | 161,093,348 | $ | 325,370,951 | ||||||||||||
| Voya Retirement Conservative Portfolio |
Voya Retirement Growth Portfolio |
||||||||||||||||
|---|---|---|---|---|---|---|---|---|---|---|---|---|---|---|---|---|---|
| Year Ended December 31, 2019 |
Year Ended December 31, 2018 |
Year Ended December 31, 2019 |
Year Ended December 31, 2018 |
||||||||||||||
FROM
OPERATIONS: |
|||||||||||||||||
Net investment
income |
$ | 7,626,437 | $ | 7,505,307 | $ | 53,362,545 | $ | 43,002,792 | |||||||||
Net realized
gain |
10,820,540 | 13,347,703 | 133,568,784 | 181,985,576 | |||||||||||||
Net change in
unrealized appreciation (depreciation) |
34,683,880 | (32,610,206 | ) | 319,244,192 | (426,487,656 | ) | |||||||||||
Increase
(decrease) in net assets resulting from operations |
53,130,857 | (11,757,196 | ) | 506,175,521 | (201,499,288 | ) | |||||||||||
FROM
DISTRIBUTIONS TO SHAREHOLDERS: |
|||||||||||||||||
Total
distributions (excluding return of capital): |
|||||||||||||||||
Class
ADV |
(18,553,699 | ) | (20,314,882 | ) | (232,360,607 | ) | (266,303,828 | ) | |||||||||
Class
I |
(3,535 | ) | (1,539 | ) | (4,625,627 | ) | (4,792,936 | ) | |||||||||
Total
distributions |
(18,557,234 | ) | (20,316,421 | ) | (236,986,234 | ) | (271,096,764 | ) | |||||||||
FROM CAPITAL
SHARE TRANSACTIONS: |
|||||||||||||||||
Net proceeds
from sale of shares |
31,957,062 | 25,539,384 | 12,832,178 | 8,309,931 | |||||||||||||
Reinvestment of
distributions |
18,557,191 | 20,316,376 | 236,986,234 | 271,096,764 | |||||||||||||
| 50,514,253 | 45,855,760 | 249,818,412 | 279,406,695 | ||||||||||||||
Cost of shares
redeemed |
(60,509,716 | ) | (70,207,985 | ) | (410,938,244 | ) | (380,257,285 | ) | |||||||||
Net decrease in
net assets resulting from capital share transactions |
(9,995,463 | ) | (24,352,225 | ) | (161,119,832 | ) | (100,850,590 | ) | |||||||||
Net increase
(decrease) in net assets |
24,578,160 | (56,425,842 | ) | 108,069,455 | (573,446,642 | ) | |||||||||||
NET
ASSETS: |
|||||||||||||||||
Beginning of
year or period |
400,300,864 | 456,726,706 | 2,493,818,591 | 3,067,265,233 | |||||||||||||
End of year or
period |
$ | 424,879,024 | $ | 400,300,864 | $ | 2,601,888,046 | $ | 2,493,818,591 | |||||||||
| Voya Retirement Moderate Portfolio |
Voya Retirement Moderate Growth Portfolio |
||||||||||||||||
|---|---|---|---|---|---|---|---|---|---|---|---|---|---|---|---|---|---|
| Year Ended December 31, 2019 |
Year Ended December 31, 2018 |
Year Ended December 31, 2019 |
Year Ended December 31, 2018 |
||||||||||||||
FROM
OPERATIONS: |
|||||||||||||||||
Net investment
income |
$ | 20,126,739 | $ | 18,650,450 | $ | 35,705,553 | $ | 31,044,007 | |||||||||
Net realized
gain |
40,364,426 | 42,705,709 | 92,751,119 | 105,276,461 | |||||||||||||
Net change in
unrealized appreciation (depreciation) |
100,602,183 | (114,401,197 | ) | 196,914,279 | (253,136,299 | ) | |||||||||||
Increase
(decrease) in net assets resulting from operations |
161,093,348 | (53,045,038 | ) | 325,370,951 | (116,815,831 | ) | |||||||||||
FROM
DISTRIBUTIONS TO SHAREHOLDERS: |
|||||||||||||||||
Total
distributions (excluding return of capital): |
|||||||||||||||||
Class
ADV |
(62,980,933 | ) | (66,693,112 | ) | (146,075,017 | ) | (169,238,894 | ) | |||||||||
Class
I |
(1,264,979 | ) | (1,252,742 | ) | (1,883,900 | ) | (2,141,323 | ) | |||||||||
Total
distributions |
(64,245,912 | ) | (67,945,854 | ) | (147,958,917 | ) | (171,380,217 | ) | |||||||||
FROM CAPITAL
SHARE TRANSACTIONS: |
|||||||||||||||||
Net proceeds
from sale of shares |
24,874,534 | 14,449,278 | 17,828,813 | 10,671,117 | |||||||||||||
Reinvestment of
distributions |
64,245,912 | 67,945,854 | 147,958,917 | 171,380,217 | |||||||||||||
| 89,120,446 | 82,395,132 | 165,787,730 | 182,051,334 | ||||||||||||||
Cost of shares
redeemed |
(145,338,094 | ) | (162,130,311 | ) | (287,935,946 | ) | (292,994,805 | ) | |||||||||
Net decrease in
net assets resulting from capital share transactions |
(56,217,648 | ) | (79,735,179 | ) | (122,148,216 | ) | (110,943,471 | ) | |||||||||
Net increase
(decrease) in net assets |
40,629,788 | (200,726,071 | ) | 55,263,818 | (399,139,519 | ) | |||||||||||
NET
ASSETS: |
|||||||||||||||||
Beginning of
year or period |
989,538,785 | 1,190,264,856 | 1,736,316,220 | 2,135,455,739 | |||||||||||||
End of year or
period |
$ | 1,030,168,573 | $ | 989,538,785 | $ | 1,791,580,038 | $ | 1,736,316,220 | |||||||||
| Income (loss) from investment operations |
Less distributions | Ratios to average net assets |
Supplemental data |
|||||||||||||||||||||||||||||||||||||||||||||||||||||||||||||||||
|---|---|---|---|---|---|---|---|---|---|---|---|---|---|---|---|---|---|---|---|---|---|---|---|---|---|---|---|---|---|---|---|---|---|---|---|---|---|---|---|---|---|---|---|---|---|---|---|---|---|---|---|---|---|---|---|---|---|---|---|---|---|---|---|---|---|---|---|---|
| Net asset value, beginning of year or period |
Net investment income (loss) | Net realized and unrealized gain (loss) |
Total from investment operations |
From net investment income | From net realized gains | From return of capital | Total distributions | Payment by affiliate | Net asset value, end of year or period |
Total Return(1) |
Expenses before reductions/ additions(2)(3)(4) |
Expenses net of fee waivers and/or recoupments if any(2)(3)(4) |
Expenses net of all reductions/ additions (2)(3)(4) |
Net investment income (loss)(2)(3) |
Net assets, end of year or period |
Portfolio turnover rate | ||||||||||||||||||||||||||||||||||||||||||||||||||||
| Year or period ended | ($) | ($) | ($) | ($) | ($) | ($) | ($) | ($) | ($) | ($) | (%) | (%) | (%) | (%) | (%) | ($000’s) | (%) | |||||||||||||||||||||||||||||||||||||||||||||||||||
Voya Retirement Conservative Portfolio
|
||||||||||||||||||||||||||||||||||||||||||||||||||||||||||||||||||||
Class ADV |
||||||||||||||||||||||||||||||||||||||||||||||||||||||||||||||||||||
12-31-19 |
8.57 | 0.17 | 0.98 | 1.15 | 0.17 | 0.24 | — | 0.41 | — | 9.31 | 13.61 | 0.78 | 0.53 | 0.53 | 1.82 | 424,756 | 24 | |||||||||||||||||||||||||||||||||||||||||||||||||||
12-31-18 |
9.24 | 0.17 | (0.41 | ) | (0.24 | ) | 0.17 | 0.26 | — | 0.43 | — | 8.57 | (2.74 | ) | 0.77 | 0.52 | 0.52 | 1.74 | 400,267 | 33 | ||||||||||||||||||||||||||||||||||||||||||||||||
12-31-17 |
8.89 | 0.14 | • | 0.54 | 0.68 | 0.13 | 0.20 | — | 0.33 | — | 9.24 | 7.76 | 0.76 | 0.51 | 0.51 | 1.57 | 456,710 | 15 | ||||||||||||||||||||||||||||||||||||||||||||||||||
12-31-16 |
8.81 | 0.09 | 0.32 | 0.41 | 0.13 | 0.20 | — | 0.33 | — | 8.89 | 4.68 | 0.76 | 0.51 | 0.51 | 1.17 | 507,585 | 23 | |||||||||||||||||||||||||||||||||||||||||||||||||||
12-31-15 |
9.36 | 0.13 | (0.20 | ) | (0.07 | ) | 0.14 | 0.34 | — | 0.48 | — | 8.81 | (0.80 | ) | 0.76 | 0.51 | 0.51 | 1.37 | 486,347 | 21 | ||||||||||||||||||||||||||||||||||||||||||||||||
Class I |
||||||||||||||||||||||||||||||||||||||||||||||||||||||||||||||||||||
12-31-19 |
8.70 | 0.21 | • | 0.98 | 1.19 | 0.20 | 0.24 | — | 0.44 | — | 9.45 | 13.81 | 0.28 | 0.28 | 0.28 | 2.31 | 123 | 24 | ||||||||||||||||||||||||||||||||||||||||||||||||||
12-31-18 |
9.38 | 0.19 | • | (0.41 | ) | (0.22 | ) | 0.20 | 0.26 | — | 0.46 | — | 8.70 | (2.54 | ) | 0.27 | 0.27 | 0.27 | 2.11 | 34 | 33 | |||||||||||||||||||||||||||||||||||||||||||||||
12-31-17 |
9.04 | 0.31 | • | 0.39 | 0.70 | 0.16 | 0.20 | — | 0.36 | — | 9.38 | 7.81 | 0.26 | 0.26 | 0.26 | 3.44 | 17 | 15 | ||||||||||||||||||||||||||||||||||||||||||||||||||
12-31-16 |
8.97 | 0.14 | 0.29 | 0.43 | 0.16 | 0.20 | — | 0.36 | — | 9.04 | 4.73 | 0.26 | 0.26 | 0.26 | 1.52 | 1 | 23 | |||||||||||||||||||||||||||||||||||||||||||||||||||
12-31-15 |
9.52 | 0.16 | (0.20 | ) | (0.04 | ) | 0.17 | 0.34 | — | 0.51 | — | 8.97 | (0.50 | ) | 0.26 | 0.26 | 0.26 | 1.72 | 1 | 21 | ||||||||||||||||||||||||||||||||||||||||||||||||
Voya Retirement Growth Portfolio
|
||||||||||||||||||||||||||||||||||||||||||||||||||||||||||||||||||||
Class ADV |
||||||||||||||||||||||||||||||||||||||||||||||||||||||||||||||||||||
12-31-19 |
11.74 | 0.26 | • | 2.20 | 2.46 | 0.24 | 0.96 | — | 1.20 | — | 13.00 | 21.55 | 0.76 | 0.68 | 0.68 | 2.04 | 2,553,927 | 40 | ||||||||||||||||||||||||||||||||||||||||||||||||||
12-31-18 |
13.99 | 0.20 | • | (1.13 | ) | (0.93 | ) | 0.23 | 1.09 | — | 1.32 | — | 11.74 | (7.47 | ) | 0.76 | 0.68 | 0.68 | 1.49 | 2,449,356 | 20 | |||||||||||||||||||||||||||||||||||||||||||||||
12-31-17 |
13.10 | 0.19 | • | 1.91 | 2.10 | 0.25 | 0.96 | — | 1.21 | — | 13.99 | 16.66 | 0.76 | 0.68 | 0.68 | 1.37 | 3,018,225 | 11 | ||||||||||||||||||||||||||||||||||||||||||||||||||
12-31-16 |
13.14 | 0.19 | • | 0.76 | 0.95 | 0.30 | 0.69 | — | 0.99 | — | 13.10 | 7.31 | 0.76 | 0.68 | 0.68 | 1.45 | 3,275,638 | 17 | ||||||||||||||||||||||||||||||||||||||||||||||||||
12-31-15 |
13.63 | 0.22 | • | (0.49 | ) | (0.27 | ) | 0.22 | — | — | 0.22 | — | 13.14 | (2.03 | ) | 0.76 | 0.68 | 0.68 | 1.59 | 3,611,216 | 16 | |||||||||||||||||||||||||||||||||||||||||||||||
Class I |
||||||||||||||||||||||||||||||||||||||||||||||||||||||||||||||||||||
12-31-19 |
11.81 | 0.31 | • | 2.22 | 2.53 | 0.30 | 0.96 | — | 1.26 | — | 13.08 | 22.09 | 0.26 | 0.26 | 0.26 | 2.48 | 47,961 | 40 | ||||||||||||||||||||||||||||||||||||||||||||||||||
12-31-18 |
14.07 | 0.26 | (1.13 | ) | (0.87 | ) | 0.30 | 1.09 | — | 1.39 | — | 11.81 | (7.05 | ) | 0.26 | 0.26 | 0.26 | 1.94 | 44,463 | 20 | ||||||||||||||||||||||||||||||||||||||||||||||||
12-31-17 |
13.18 | 0.25 | • | 1.91 | 2.16 | 0.31 | 0.96 | — | 1.27 | — | 14.07 | 17.11 | 0.26 | 0.26 | 0.26 | 1.84 | 49,040 | 11 | ||||||||||||||||||||||||||||||||||||||||||||||||||
12-31-16 |
13.22 | 0.25 | 0.76 | 1.01 | 0.36 | 0.69 | — | 1.05 | — | 13.18 | 7.80 | 0.26 | 0.26 | 0.26 | 1.93 | 47,460 | 17 | |||||||||||||||||||||||||||||||||||||||||||||||||||
12-31-15 |
13.72 | 0.28 | (0.49 | ) | (0.21 | ) | 0.29 | — | — | 0.29 | — | 13.22 | (1.62 | ) | 0.26 | 0.26 | 0.26 | 2.03 | 47,401 | 16 | ||||||||||||||||||||||||||||||||||||||||||||||||
Voya Retirement Moderate Portfolio
|
||||||||||||||||||||||||||||||||||||||||||||||||||||||||||||||||||||
Class ADV |
||||||||||||||||||||||||||||||||||||||||||||||||||||||||||||||||||||
12-31-19 |
10.51 | 0.22 | • | 1.54 | 1.76 | 0.22 | 0.50 | — | 0.72 | — | 11.55 | 17.14 | 0.77 | 0.61 | 0.61 | 1.96 | 1,008,727 | 31 | ||||||||||||||||||||||||||||||||||||||||||||||||||
12-31-18 |
11.79 | 0.19 | • | (0.75 | ) | (0.56 | ) | 0.21 | 0.51 | — | 0.72 | — | 10.51 | (5.07 | ) | 0.77 | 0.61 | 0.61 | 1.68 | 972,232 | 27 | |||||||||||||||||||||||||||||||||||||||||||||||
12-31-17 |
11.35 | 0.17 | • | 1.14 | 1.31 | 0.20 | 0.67 | — | 0.87 | — | 11.79 | 11.82 | 0.76 | 0.60 | 0.60 | 1.50 | 1,170,685 | 12 | ||||||||||||||||||||||||||||||||||||||||||||||||||
12-31-16 |
11.49 | 0.15 | • | 0.51 | 0.66 | 0.23 | 0.57 | — | 0.80 | — | 11.35 | 5.78 | 0.76 | 0.60 | 0.60 | 1.34 | 1,257,324 | 15 | ||||||||||||||||||||||||||||||||||||||||||||||||||
12-31-15 |
12.68 | 0.18 | • | (0.35 | ) | (0.17 | ) | 0.11 | 0.91 | — | 1.02 | — | 11.49 | (1.57 | ) | 0.76 | 0.60 | 0.60 | 1.47 | 1,387,932 | 18 | |||||||||||||||||||||||||||||||||||||||||||||||
Class I |
||||||||||||||||||||||||||||||||||||||||||||||||||||||||||||||||||||
12-31-19 |
10.64 | 0.25 | 1.58 | 1.83 | 0.27 | 0.50 | — | 0.77 | — | 11.70 | 17.56 | 0.27 | 0.27 | 0.27 | 2.35 | 21,441 | 31 | |||||||||||||||||||||||||||||||||||||||||||||||||||
12-31-18 |
11.93 | 0.24 | (0.76 | ) | (0.52 | ) | 0.26 | 0.51 | — | 0.77 | — | 10.64 | (4.73 | ) | 0.27 | 0.27 | 0.27 | 2.03 | 17,307 | 27 | ||||||||||||||||||||||||||||||||||||||||||||||||
12-31-17 |
11.48 | 0.22 | 1.14 | 1.36 | 0.24 | 0.67 | — | 0.91 | — | 11.93 | 12.21 | 0.26 | 0.26 | 0.26 | 1.86 | 19,580 | 12 | |||||||||||||||||||||||||||||||||||||||||||||||||||
12-31-16 |
11.62 | 0.20 | • | 0.51 | 0.71 | 0.28 | 0.57 | — | 0.85 | — | 11.48 | 6.12 | 0.26 | 0.26 | 0.26 | 1.68 | 17,956 | 15 | ||||||||||||||||||||||||||||||||||||||||||||||||||
12-31-15 |
12.82 | 0.23 | (0.36 | ) | (0.13 | ) | 0.16 | 0.91 | — | 1.07 | — | 11.62 | (1.24 | ) | 0.26 | 0.26 | 0.26 | 1.81 | 19,000 | 18 | ||||||||||||||||||||||||||||||||||||||||||||||||
| Income (loss) from investment operations |
Less distributions | Ratios to average net assets |
Supplemental data |
|||||||||||||||||||||||||||||||||||||||||||||||||||||||||||||||||
|---|---|---|---|---|---|---|---|---|---|---|---|---|---|---|---|---|---|---|---|---|---|---|---|---|---|---|---|---|---|---|---|---|---|---|---|---|---|---|---|---|---|---|---|---|---|---|---|---|---|---|---|---|---|---|---|---|---|---|---|---|---|---|---|---|---|---|---|---|
| Net asset value, beginning of year or period |
Net investment income (loss) | Net realized and unrealized gain (loss) |
Total from investment operations |
From net investment income | From net realized gains | From return of capital | Total distributions | Payment by affiliate | Net asset value, end of year or period |
Total Return(1) |
Expenses before reductions/ additions(2)(3)(4) |
Expenses net of fee waivers and/or recoupments if any(2)(3)(4) |
Expenses net of all reductions/ additions (2)(3)(4) |
Net investment income (loss)(2)(3) |
Net assets, end of year or period |
Portfolio turnover rate | ||||||||||||||||||||||||||||||||||||||||||||||||||||
| Year or period ended | ($) | ($) | ($) | ($) | ($) | ($) | ($) | ($) | ($) | ($) | (%) | (%) | (%) | (%) | (%) | ($000’s) | (%) | |||||||||||||||||||||||||||||||||||||||||||||||||||
Voya Retirement Moderate Growth Portfolio
|
||||||||||||||||||||||||||||||||||||||||||||||||||||||||||||||||||||
Class ADV |
||||||||||||||||||||||||||||||||||||||||||||||||||||||||||||||||||||
12-31-19 |
10.97 | 0.23 | • | 1.91 | 2.14 | 0.23 | 0.78 | — | 1.01 | — | 12.10 | 20.02 | 0.76 | 0.65 | 0.65 | 1.98 | 1,769,060 | 39 | ||||||||||||||||||||||||||||||||||||||||||||||||||
12-31-18 |
12.80 | 0.19 | • | (0.91 | ) | (0.72 | ) | 0.22 | 0.89 | — | 1.11 | — | 10.97 | (6.30 | ) | 0.76 | 0.65 | 0.65 | 1.56 | 1,716,501 | 22 | |||||||||||||||||||||||||||||||||||||||||||||||
12-31-17 |
12.23 | 0.18 | • | 1.53 | 1.71 | 0.23 | 0.91 | — | 1.14 | — | 12.80 | 14.56 | 0.76 | 0.65 | 0.65 | 1.42 | 2,111,439 | 10 | ||||||||||||||||||||||||||||||||||||||||||||||||||
12-31-16 |
12.76 | 0.18 | • | 0.67 | 0.85 | 0.28 | 1.10 | — | 1.38 | — | 12.23 | 6.81 | 0.76 | 0.65 | 0.65 | 1.46 | 2,275,963 | 16 | ||||||||||||||||||||||||||||||||||||||||||||||||||
12-31-15 |
13.54 | 0.21 | • | (0.40 | ) | (0.19 | ) | 0.22 | 0.37 | — | 0.59 | — | 12.76 | (1.59 | ) | 0.76 | 0.65 | 0.65 | 1.56 | 2,521,814 | 16 | |||||||||||||||||||||||||||||||||||||||||||||||
Class I |
||||||||||||||||||||||||||||||||||||||||||||||||||||||||||||||||||||
12-31-19 |
10.90 | 0.29 | 1.87 | 2.16 | 0.28 | 0.78 | — | 1.06 | — | 12.00 | 20.40 | 0.26 | 0.26 | 0.26 | 2.41 | 22,520 | 39 | |||||||||||||||||||||||||||||||||||||||||||||||||||
12-31-18 |
12.73 | 0.24 | • | (0.90 | ) | (0.66 | ) | 0.28 | 0.89 | — | 1.17 | — | 10.90 | (5.90 | ) | 0.26 | 0.26 | 0.26 | 1.97 | 19,816 | 22 | |||||||||||||||||||||||||||||||||||||||||||||||
12-31-17 |
12.17 | 0.24 | 1.52 | 1.76 | 0.29 | 0.91 | — | 1.20 | — | 12.73 | 15.05 | 0.26 | 0.26 | 0.26 | 1.84 | 24,017 | 10 | |||||||||||||||||||||||||||||||||||||||||||||||||||
12-31-16 |
12.71 | 0.24 | 0.66 | 0.90 | 0.34 | 1.10 | — | 1.44 | — | 12.17 | 7.25 | 0.26 | 0.26 | 0.26 | 1.86 | 22,088 | 16 | |||||||||||||||||||||||||||||||||||||||||||||||||||
12-31-15 |
13.50 | 0.26 | • | (0.40 | ) | (0.14 | ) | 0.28 | 0.37 | — | 0.65 | — | 12.71 | (1.24 | ) | 0.26 | 0.26 | 0.26 | 1.95 | 21,862 | 16 | |||||||||||||||||||||||||||||||||||||||||||||||
(1) |
Total return is calculated assuming reinvestment of all dividends, capital gain distributions and return of capital distributions, if any, at net asset value and does not reflect the effect of insurance contract charges. Total return for periods less than one year is not annualized. |
(2) |
Annualized for periods less than one year. |
(3) |
Ratios reflect operating expenses of a Portfolio. Expenses before reductions/additions do not reflect amounts reimbursed or recouped by the Investment Adviser and/or Distributor or reductions from brokerage service arrangements or other expense offset arrangements and do not represent the amount paid by a Portfolio during periods when reimbursements or reductions occur. |
| Expenses net of fee waivers reflect expenses after reimbursement by the Investment Adviser and/or Distributor or recoupment of previously reimbursed fees by the Investment Adviser, but prior to reductions from brokerage service arrangements or other expense offset arrangements. Expenses net of all reductions/additions represent the net expenses paid by a Portfolio. Net investment income (loss) is net of all such additions or reductions. | ||
(4) |
Ratios do not include expenses of underlying funds and do not include fees and expenses charged under the variable annuity contract or variable life insurance policy. |
• |
Calculated using average number of shares outstanding throughout the year or period. |
| Purchases | Sales | |||||||
|---|---|---|---|---|---|---|---|---|
Conservative |
$ | 99,992,854 | $ | 121,621,854 | ||||
Growth |
1,053,950,170 | 1,401,065,634 | ||||||
Moderate |
321,811,360 | 423,939,542 | ||||||
Moderate
Growth |
710,342,022 | 947,120,196 | ||||||
| Subsidiary | Portfolio | Percentage | ||||||
|---|---|---|---|---|---|---|---|---|
Voya
Institutional Trust Company |
Conservative |
21.31 | % | |||||
Moderate |
8.22 | |||||||
| Portfolio(1) | Class ADV | Class I | ||||
|---|---|---|---|---|---|---|
Conservative |
0.92% |
0.67% |
||||
Growth |
1.07% |
0.82% |
||||
Moderate |
1.00% |
0.75% |
||||
Moderate
Growth |
1.04% |
0.79% |
(1) |
The operating expense limits take into account the operating expenses incurred at the Underlying Fund level. The amount of fees and expenses of an Underlying Fund borne by each Portfolio will vary based on each Portfolio’s allocation of assets to, and the net expenses of, a particular Underlying Fund. |
| Portfolio | Accrued Expense |
Amount | ||||||
|---|---|---|---|---|---|---|---|---|
Growth |
Custody |
$ | 123,452 | |||||
Moderate |
Custody |
51,840 | ||||||
Audit |
11,308 | |||||||
Moderate
Growth |
Custody |
88,341 | ||||||
| Portfolio | Days Utilized |
Approximate Average Daily Balance For Days Utilized |
Approximate Weighted Average Interest Rate For Days Utilized |
|||||||||||
|---|---|---|---|---|---|---|---|---|---|---|---|---|---|---|
Conservative |
2 | $ | 1,378,000 | 3.39 | % | |||||||||
Moderate |
3 | 2,129,000 | 3.39 | |||||||||||
Moderate
Growth |
1 | 1,423,000 | 3.40 | |||||||||||
| Shares sold |
Shares issued in merger |
Reinvestment of distributions |
Shares redeemed |
Net increase (decrease) in shares outstanding |
Shares sold |
Proceeds from shares issued in merger |
Reinvestment of distributions |
Shares redeemed |
Net increase (decrease) |
|||||||||||||||||||||||||||||||||
|---|---|---|---|---|---|---|---|---|---|---|---|---|---|---|---|---|---|---|---|---|---|---|---|---|---|---|---|---|---|---|---|---|---|---|---|---|---|---|---|---|---|---|
| Year or period ended | # | # | # | # | # | ($) | ($) | ($) | ($) | ($) | ||||||||||||||||||||||||||||||||
| Conservative | ||||||||||||||||||||||||||||||||||||||||||
Class ADV |
||||||||||||||||||||||||||||||||||||||||||
12/31/2019 |
3,536,081 | — | 2,070,725 | (6,686,497 | ) | (1,079,691 | ) | 31,837,511 | — | 18,553,699 | (60,469,570 |
) | (10,078,360 |
) | ||||||||||||||||||||||||||||
12/31/2018 |
2,841,914 | — | 2,298,064 | (7,821,481 | ) | (2,681,503 | ) | 25,517,975 | — | 20,314,882 | (70,204,573 |
) | (24,371,716 |
) | ||||||||||||||||||||||||||||
Class I |
||||||||||||||||||||||||||||||||||||||||||
12/31/2019 |
12,992 | — | 384 | (4,275 | ) | 9,101 | 119,551 | — | 3,492 | (40,146 |
) | 82,897 |
||||||||||||||||||||||||||||||
12/31/2018 |
2,338 | — | 167 | (386 | ) | 2,119 | 21,409 | — | 1,494 | (3,412 |
) | 19,491 |
||||||||||||||||||||||||||||||
Growth |
||||||||||||||||||||||||||||||||||||||||||
Class ADV |
||||||||||||||||||||||||||||||||||||||||||
12/31/2019 |
863,657 | — | 18,906,477 | (31,986,663 | ) | (12,216,529 | ) | 10,699,562 | — | 232,360,607 | (402,854,268 |
) | (159,794,099 |
) | ||||||||||||||||||||||||||||
12/31/2018 |
453,203 | — | 20,675,763 | (28,248,002 | ) | (7,119,036 | ) | 6,059,810 | — | 266,303,828 | (376,782,863 |
) | (104,419,225 |
) | ||||||||||||||||||||||||||||
Class I |
||||||||||||||||||||||||||||||||||||||||||
12/31/2019 |
167,795 | — | 374,848 | (640,968 | ) | (98,325 | ) | 2,132,616 | — | 4,625,627 | (8,083,976 |
) | (1,325,733 |
) | ||||||||||||||||||||||||||||
12/31/2018 |
170,333 | — | 370,683 | (260,600 | ) | 280,416 | 2,250,121 | — | 4,792,936 | (3,474,422 |
) | 3,568,635 |
||||||||||||||||||||||||||||||
Moderate |
||||||||||||||||||||||||||||||||||||||||||
Class ADV |
||||||||||||||||||||||||||||||||||||||||||
12/31/2019 |
1,921,994 | — | 5,709,967 | (12,776,626 | ) | (5,144,665 | ) | 21,377,716 | — | 62,980,933 | (142,891,944 |
) | (58,533,295 |
) | ||||||||||||||||||||||||||||
12/31/2018 |
1,135,735 | — | 5,981,445 | (13,952,186 | ) | (6,835,006 | ) | 12,809,304 | — | 66,693,112 | (159,101,417 |
) | (79,599,001 |
) | ||||||||||||||||||||||||||||
Class I |
||||||||||||||||||||||||||||||||||||||||||
12/31/2019 |
308,962 | — | 113,451 | (215,680 | ) | 206,733 | 3,496,818 | — | 1,264,979 | (2,446,150 |
) | 2,315,647 |
||||||||||||||||||||||||||||||
12/31/2018 |
145,008 | — | 111,157 | (271,268 | ) | (15,103 | ) | 1,639,974 | — | 1,252,742 | (3,028,894 |
) | (136,178 |
) | ||||||||||||||||||||||||||||
Moderate Growth |
||||||||||||||||||||||||||||||||||||||||||
Class ADV |
||||||||||||||||||||||||||||||||||||||||||
12/31/2019 |
1,344,775 | — | 12,735,398 | (24,267,390 | ) | (10,187,217 | ) | 15,703,112 | — | 146,075,017 | (284,531,681 |
) | (122,753,552 |
) | ||||||||||||||||||||||||||||
12/31/2018 |
791,749 | — | 14,269,721 | (23,572,373 | ) | (8,510,903 | ) | 9,798,257 | — | 169,238,894 | (289,159,538 |
) | (110,122,387 |
) | ||||||||||||||||||||||||||||
Class I |
||||||||||||||||||||||||||||||||||||||||||
12/31/2019 |
183,304 | — | 165,836 | (290,771 | ) | 58,369 | 2,125,701 | — | 1,883,900 | (3,404,265 |
) | 605,336 |
||||||||||||||||||||||||||||||
12/31/2018 |
71,549 | — | 182,240 | (322,173 | ) | (68,384 | ) | 872,860 | — | 2,141,323 | (3,835,267 |
) | (821,084 |
) | ||||||||||||||||||||||||||||
| Year Ended December 31, 2019 | Year Ended December 31, 2018 | ||||||||||||||||||
|---|---|---|---|---|---|---|---|---|---|---|---|---|---|---|---|---|---|---|---|
| Ordinary Income |
Long-term Capital Gains |
Ordinary Income |
Long-term Capital Gains |
||||||||||||||||
Conservative |
$ | 7,825,835 | $ | 10,731,399 | $ | 8,436,851 | $ | 11,879,570 | |||||||||||
Growth |
47,827,676 | 189,158,558 | 47,951,500 | 223,145,264 | |||||||||||||||
Moderate |
19,898,150 | 44,347,762 | 20,043,021 | 47,902,833 | |||||||||||||||
Moderate
Growth |
33,939,686 | 114,019,231 | 34,349,570 | 137,030,647 | |||||||||||||||
| Undistributed Ordinary Income |
Undistributed Long-term Capital Gains |
Unrealized Appreciation/ (Depreciation) |
||||||||||||
|---|---|---|---|---|---|---|---|---|---|---|---|---|---|---|
Conservative |
$ | 9,995,366 | $ | 8,004,494 | $ | 57,510,468 |
||||||||
Growth |
56,092,200 | 100,096,833 | 191,356,987 |
|||||||||||
Moderate |
21,825,297 | 31,922,444 | 53,555,216 |
|||||||||||
Moderate
Growth |
37,871,828 | 71,904,054 | 111,422,671 |
|||||||||||
PRONOUNCEMENTS (continued)
| VOYA RETIREMENT
CONSERVATIVE PORTFOLIO |
PORTFOLIO OF INVESTMENTS
AS OF DECEMBER 31, 2019 |
| Shares | Value | Percentage of Net Assets |
||||||||||||
|---|---|---|---|---|---|---|---|---|---|---|---|---|---|---|
EXCHANGE-TRADED FUNDS: 8.9%
|
||||||||||||||
| 669,401 | Schwab U.S. TIPS ETF |
$ | 37,908,178 | 8.9 | ||||||||||
Total Exchange-Traded Funds (Cost $35,780,067) |
37,908,178 | 8.9 | ||||||||||||
MUTUAL FUNDS: 91.0%
|
||||||||||||||
Affiliated Investment Companies: 91.0% |
||||||||||||||
| 1,088,760 | Voya
Emerging Markets Index Portfolio — Class I |
13,326,416 | 3.1 | |||||||||||
| 1,623,413 | Voya
International Index Portfolio — Class I |
17,224,417 | 4.1 | |||||||||||
| 945,505 | Voya
RussellTM Mid Cap Index Portfolio — Class I |
12,906,139 | 3.1 | |||||||||||
| Shares | Value | Percentage of Net Assets |
||||||||||||
|---|---|---|---|---|---|---|---|---|---|---|---|---|---|---|
MUTUAL FUNDS: (continued)
|
||||||||||||||
Affiliated Investment Companies: (continued) |
||||||||||||||
| 23,504,850 | Voya
U.S. Bond Index Portfolio — Class I |
$ | 256,202,871 | 60.3 | ||||||||||
| 5,106,260 | Voya U.S. Stock Index Portfolio — Class I |
86,755,352 | 20.4 | |||||||||||
Total Mutual Funds (Cost $327,602,735) |
386,415,195 | 91.0 | ||||||||||||
Total Investments in Securities (Cost $363,382,802) |
$ | 424,323,373 | 99.9 | |||||||||||
Assets in Excess of Other Liabilities |
555,651 | 0.1 | ||||||||||||
Net
Assets |
$ | 424,879,024 | 100.0 | |||||||||||
| Quoted Prices in Active Markets for Identical Investments (Level 1) |
Significant Other Observable Inputs (Level 2) |
Significant Unobservable Inputs (Level 3) |
Fair Value at December 31, 2019 |
||||||||||||||||||
|---|---|---|---|---|---|---|---|---|---|---|---|---|---|---|---|---|---|---|---|---|---|
Asset
Table |
|||||||||||||||||||||
Investments,
at fair value |
|||||||||||||||||||||
Exchange-Traded
Funds |
$ | 37,908,178 | $ | — | $ | — | $ | 37,908,178 | |||||||||||||
Mutual
Funds |
386,415,195 | — | — | 386,415,195 | |||||||||||||||||
Total
Investments, at fair value |
$ | 424,323,373 | $ | — | $ | — | $ | 424,323,373 | |||||||||||||
ˆ |
See Note 2, “Significant Accounting Policies” in the Notes to Financial Statements for additional information. |
| Issuer | Beginning Fair Value at 12/31/2018 |
Purchases at Cost |
Sales at Cost |
Change in Unrealized Appreciation/ (Depreciation) |
Ending Fair Value at 12/31/2019 |
Investment Income |
Realized Gains/ (Losses) |
Net Capital Gain Distributions |
||||||||||||||||||||||||||||||||
|---|---|---|---|---|---|---|---|---|---|---|---|---|---|---|---|---|---|---|---|---|---|---|---|---|---|---|---|---|---|---|---|---|---|---|---|---|---|---|---|---|
Voya
Australia Index Portfolio — Class I |
$ | 1,992,187 | $ | 237,383 | $ | (2,276,598 | ) | $ | 47,028 | $ | — | $ | 152,300 | $ | 132,554 | $ | — | |||||||||||||||||||||||
Voya
Emerging Markets Index Portfolio — Class I |
7,971,688 | 6,203,968 | (2,585,951 | ) | 1,736,711 | 13,326,416 | 192,270 | (192,598 | ) | — | ||||||||||||||||||||||||||||||
Voya
Euro STOXX 50® Index Portfolio — Class I |
7,981,842 | 907,059 | (8,567,642 | ) | (321,259 | ) | — | 514,097 | 1,035,764 | 17,274 | ||||||||||||||||||||||||||||||
Voya
FTSE 100 Index® Portfolio — Class I |
4,985,947 | 1,072,661 | (6,705,229 | ) | 646,621 | — | 506,431 | (830,571 | ) | 160,769 | ||||||||||||||||||||||||||||||
Voya
International Index Portfolio — Class I |
— | 16,774,327 | (818,872 | ) | 1,268,962 | 17,224,417 | — | 24,578 | — | |||||||||||||||||||||||||||||||
Voya
Japan TOPIX Index® Portfolio — Class I |
4,977,422 | 1,356,875 | (6,178,569 | ) | (155,728 | ) | — | 234,621 | (260,250 | ) | 661,819 | |||||||||||||||||||||||||||||
Voya
RussellTM Mid Cap Index Portfolio — Class I |
12,026,667 | 3,624,164 | (3,534,735 | ) | 790,043 | 12,906,139 | 189,247 | 271,748 | 2,116,472 | |||||||||||||||||||||||||||||||
Voya U.S.
Bond Index Portfolio — Class I |
227,380,364 | 55,562,761 | (40,087,227 | ) | 13,346,973 | 256,202,871 | 5,957,167 | (20,380 | ) | — | ||||||||||||||||||||||||||||||
| VOYA RETIREMENT
CONSERVATIVE PORTFOLIO |
PORTFOLIO OF INVESTMENTS
AS OF DECEMBER 31, 2019 (CONTINUED) |
| Issuer | Beginning Fair Value at 12/31/2018 |
Purchases at Cost |
Sales at Cost |
Change in Unrealized Appreciation/ (Depreciation) |
Ending Fair Value at 12/31/2019 |
Investment Income |
Realized Gains/ (Losses) |
Net Capital Gain Distributions | ||||||||||||||||||||||||||||||||
|---|---|---|---|---|---|---|---|---|---|---|---|---|---|---|---|---|---|---|---|---|---|---|---|---|---|---|---|---|---|---|---|---|---|---|---|---|---|---|---|---|
Voya U.S.
Stock Index Portfolio — Class I |
$ | 81,375,233 | $ | 12,618,016 | $ | (22,249,042 | ) | $ | 15,011,145 | $ | 86,755,352 | $ | 1,295,634 | $ | 2,140,344 | $ | 4,647,679 | |||||||||||||||||||||||
| $ | 348,691,350 | $ | 98,357,214 | $ | (93,003,865 | ) | $ | 32,370,496 | $ | 386,415,195 | $ | 9,041,767 | $ | 2,301,189 | $ | 7,604,013 | ||||||||||||||||||||||||
| Cost for federal income tax purposes was $366,812,905. | ||||||
Net unrealized
appreciation consisted of: |
||||||
Gross
Unrealized Appreciation |
$ | 57,510,468 | ||||
Gross
Unrealized Depreciation |
— | |||||
Net Unrealized
Appreciation |
$ | 57,510,468 |
| VOYA RETIREMENT
GROWTH PORTFOLIO |
PORTFOLIO OF INVESTMENTS
AS OF DECEMBER 31, 2019 |
| Shares | Value | Percentage of Net Assets |
||||||||||||
|---|---|---|---|---|---|---|---|---|---|---|---|---|---|---|
EXCHANGE-TRADED FUNDS: 4.0%
|
||||||||||||||
| 1,830,025 | Schwab U.S. TIPS ETF |
$ | 103,634,316 | 4.0 | ||||||||||
Total Exchange-Traded Funds (Cost $103,127,551) |
103,634,316 | 4.0 | ||||||||||||
MUTUAL FUNDS: 96.0%
|
||||||||||||||
Affiliated Investment Companies: 96.0% |
||||||||||||||
| 13,174,742 | Voya
Emerging Markets Index Portfolio — Class I |
161,258,839 | 6.2 | |||||||||||
| 31,902,970 | Voya
International Index Portfolio — Class I |
338,490,510 | 13.0 | |||||||||||
| 15,243,093 | Voya
RussellTM Mid Cap Index Portfolio — Class I |
208,068,220 | 8.0 | |||||||||||
| 9,151,166 | Voya
RussellTM Small Cap Index Portfolio — Class I |
130,861,677 | 5.0 | |||||||||||
| Shares | Value | Percentage of Net Assets |
||||||||||||
|---|---|---|---|---|---|---|---|---|---|---|---|---|---|---|
MUTUAL FUNDS: (continued)
|
||||||||||||||
Affiliated Investment Companies: (continued) |
||||||||||||||
| 48,725,387 | Voya
U.S. Bond Index Portfolio — Class I |
$ | 531,106,717 | 20.4 | ||||||||||
| 66,384,133 | Voya U.S. Stock Index Portfolio — Class I |
1,127,866,422 | 43.4 | |||||||||||
Total Mutual Funds (Cost $2,285,295,759) |
2,497,652,385 | 96.0 | ||||||||||||
Total Investments in Securities (Cost $2,388,423,310) |
$ | 2,601,286,701 | 100.0 | |||||||||||
Assets in Excess of Other Liabilities |
601,345 | 0.0 | ||||||||||||
Net
Assets |
$ | 2,601,888,046 | 100.0 | |||||||||||
| Quoted Prices in Active Markets for Identical Investments (Level 1) |
Significant Other Observable Inputs (Level 2) |
Significant Unobservable Inputs (Level 3) |
Fair Value at December 31, 2019 |
|||||||||||||||||
Asset
Table |
||||||||||||||||||||
Investments,
at fair value |
||||||||||||||||||||
Exchange-Traded
Funds |
$ | 103,634,316 | $ | — | $ | — | $ | 103,634,316 | ||||||||||||
Mutual
Funds |
2,497,652,385 | — | — | 2,497,652,385 | ||||||||||||||||
Total
Investments, at fair value |
$ | 2,601,286,701 | $ | — | $ | — | $ | 2,601,286,701 | ||||||||||||
ˆ |
See Note 2, “Significant Accounting Policies” in the Notes to Financial Statements for additional information. |
| Issuer | Beginning Fair Value at 12/31/2018 |
Purchases at Cost |
Sales at Cost |
Change in Unrealized Appreciation/ (Depreciation) |
Ending Fair Value at 12/31/2019 |
Investment Income |
Realized Gains/ (Losses) |
Net Capital Gain Distributions |
|||||||||||||||||||||||||||||||
|---|---|---|---|---|---|---|---|---|---|---|---|---|---|---|---|---|---|---|---|---|---|---|---|---|---|---|---|---|---|---|---|---|---|---|---|---|---|---|---|
Voya
Australia Index Portfolio — Class I |
$ | 49,481,579 | $ | 4,181,646 | $ | (57,221,516 | ) | $ | 3,558,291 | $ | — | $ | 4,139,390 | $ | 566,939 | $ | — | ||||||||||||||||||||||
Voya
Emerging Markets Index Portfolio — Class I |
198,002,353 | 31,211,547 | (79,006,599 | ) | 11,051,538 | 161,258,839 | 4,885,048 | 15,618,974 | — | ||||||||||||||||||||||||||||||
Voya
Euro STOXX 50® Index Portfolio — Class I |
179,675,732 | 12,083,507 | (204,468,243 | ) | 12,709,004 | — | 9,047,950 | 6,519,461 | 397,752 | ||||||||||||||||||||||||||||||
Voya
FTSE 100 Index® Portfolio — Class I |
111,460,367 | 15,834,001 | (151,707,087 | ) | 24,412,719 | — | 9,228,041 | (26,024,761 | ) | 3,676,432 | |||||||||||||||||||||||||||||
Voya Hang
Seng Index Portfolio — Class I |
12,471,301 | 4,032,170 | (17,598,749 | ) | 1,095,278 | — | 705,863 | (3,904,467 | ) | 2,721,391 | |||||||||||||||||||||||||||||
Voya
International Index Portfolio — Class I |
— | 334,268,512 | (20,416,379 | ) | 24,638,377 | 338,490,510 | — | 1,101,240 | — | ||||||||||||||||||||||||||||||
Voya
Japan TOPIX Index® Portfolio — Class I |
117,444,474 | 25,018,988 | (150,706,721 | ) | 8,243,259 | — | 4,602,459 | (15,810,811 | ) | 13,587,373 | |||||||||||||||||||||||||||||
Voya
RussellTM Mid Cap Index Portfolio — Class I |
248,982,632 | 52,012,553 | (125,864,302 | ) | 32,937,337 | 208,068,220 | 3,998,725 | (16,762,454 | ) | 44,805,352 | |||||||||||||||||||||||||||||
| VOYA RETIREMENT
GROWTH PORTFOLIO |
PORTFOLIO OF INVESTMENTS
AS OF DECEMBER 31, 2019 (CONTINUED) |
| Issuer | Beginning Fair Value at 12/31/2018 |
Purchases at Cost |
Sales at Cost |
Change in Unrealized Appreciation/ (Depreciation) |
Ending Fair Value at 12/31/2019 |
Investment Income |
Realized Gains/ (Losses) |
Net Capital Gain Distributions | |||||||||||||||||||||||||||||||
|---|---|---|---|---|---|---|---|---|---|---|---|---|---|---|---|---|---|---|---|---|---|---|---|---|---|---|---|---|---|---|---|---|---|---|---|---|---|---|---|
Voya
RussellTM Small Cap Index Portfolio — Class I |
$ | 124,268,952 | $ | 27,614,381 | $ | (33,782,314 | ) | $ | 12,760,658 | $ | 130,861,677 | $ | 1,413,744 | $ | 2,420,441 | $ | 13,475,555 | ||||||||||||||||||||||
Voya U.S.
Bond Index Portfolio — Class I |
619,470,485 | 105,140,375 | (226,020,677 | ) | 32,516,534 | 531,106,717 | 14,304,153 | 2,705,259 | — | ||||||||||||||||||||||||||||||
Voya U.S.
Stock Index Portfolio — Class I |
834,331,314 | 334,766,116 | (196,045,440 | ) | 154,814,432 | 1,127,866,422 | 16,982,534 | 26,480,510 | 61,927,417 | ||||||||||||||||||||||||||||||
| $ | 2,495,589,189 | $ | 946,163,796 | $ | (1,262,838,027 | ) | $ | 318,737,427 | $ | 2,497,652,385 | $ | 69,307,907 | $ | (7,089,670 | ) | $ | 140,591,273 | ||||||||||||||||||||||
| Cost for federal income tax purposes was $2,409,929,714. | ||||||
Net unrealized
appreciation consisted of: |
||||||
Gross
Unrealized Appreciation |
$ | 191,356,987 | ||||
Gross
Unrealized Depreciation |
— | |||||
Net Unrealized
Appreciation |
$ | 191,356,987 |
| VOYA RETIREMENT
MODERATE PORTFOLIO |
PORTFOLIO OF INVESTMENTS
AS OF DECEMBER 31, 2019 |
| Shares | Value | Percentage of Net Assets |
|||||||||
|---|---|---|---|---|---|---|---|---|---|---|---|
EXCHANGE-TRADED FUNDS: 8.9%
|
|||||||||||
| 1,625,130 | Schwab U.S. TIPS ETF |
$ | 92,031,112 | 8.9 | |||||||
Total Exchange-Traded Funds (Cost $88,583,315) |
92,031,112 | 8.9 | |||||||||
MUTUAL FUNDS: 91.0%
|
|||||||||||
Affiliated Investment Companies: 91.0% |
|||||||||||
| 3,499,798 | Voya Emerging Markets
Index Portfolio — Class I |
42,837,528 | 4.2 | ||||||||
| 6,847,247 | Voya
International Index Portfolio — Class I |
72,649,288 | 7.1 | ||||||||
| 3,038,211 | Voya
RussellTM Mid Cap Index Portfolio — Class I |
41,471,573 | 4.0 | ||||||||
| 1,459,016 | Voya
RussellTM Small Cap Index Portfolio — Class I |
20,863,928 | 2.0 | ||||||||
| Shares | Value | Percentage of Net Assets |
|||||||||
|---|---|---|---|---|---|---|---|---|---|---|---|
MUTUAL FUNDS: (continued)
|
|||||||||||
Affiliated Investment Companies: (continued) |
|||||||||||
| 37,986,908 | Voya
U.S. Bond Index Portfolio — Class I |
$ | 414,057,294 | 40.2 | |||||||
| 20,306,771 | Voya U.S. Stock Index Portfolio — Class I |
345,012,032 | 33.5 | ||||||||
Total Mutual Funds |
|||||||||||
(Cost $874,751,639) |
936,891,643 | 91.0 | |||||||||
Total Investments in Securities (Cost $963,334,954) |
$ | 1,028,922,755 | 99.9 | ||||||||
Assets in Excess of Other Liabilities |
1,245,818 | 0.1 | |||||||||
Net
Assets |
$ | 1,030,168,573 | 100.0 | ||||||||
| Quoted Prices in Active Markets for Identical Investments (Level 1) |
Significant Other Observable Inputs (Level 2) |
Significant Unobservable Inputs (Level 3) |
Fair Value at December 31, 2019 |
|||||||||||||||||
Asset
Table |
||||||||||||||||||||
Investments,
at fair value |
||||||||||||||||||||
Exchange-Traded
Funds |
$ | 92,031,112 | $ | — | $ | — | $ | 92,031,112 | ||||||||||||
Mutual
Funds |
936,891,643 | — | — | 936,891,643 | ||||||||||||||||
Total
Investments, at fair value |
$ | 1,028,922,755 | $ | — | $ | — | $ | 1,028,922,755 | ||||||||||||
ˆ |
See Note 2, “Significant Accounting Policies” in the Notes to Financial Statements for additional information. |
| Issuer | Beginning Fair Value at 12/31/2018 |
Purchases at Cost |
Sales at Cost |
Change in Unrealized Appreciation/ (Depreciation) |
Ending Fair Value at 12/31/2019 |
Investment Income |
Realized Gains/ (Losses) |
Net Capital Gain Distributions |
|||||||||||||||||||||||||||||||
|---|---|---|---|---|---|---|---|---|---|---|---|---|---|---|---|---|---|---|---|---|---|---|---|---|---|---|---|---|---|---|---|---|---|---|---|---|---|---|---|
Voya
Australia Index Portfolio — Class I |
$ | 12,296,337 | $ | 1,100,203 | $ | (14,345,702 | ) | $ | 949,162 | $ | — | $ | 1,000,023 | $ | 104,793 | $ | — | ||||||||||||||||||||||
Voya
Emerging Markets Index Portfolio — Class I |
49,203,837 | 8,460,363 | (17,505,966 | ) | 2,679,294 | 42,837,528 | 1,190,086 | 4,133,215 | — | ||||||||||||||||||||||||||||||
Voya
Euro STOXX 50® Index Portfolio — Class I |
44,340,615 | 2,519,580 | (49,217,592 | ) | 2,357,397 | — | 2,141,950 | 2,466,899 | 96,234 | ||||||||||||||||||||||||||||||
Voya
FTSE 100 Index® Portfolio — Class I |
29,544,153 | 4,415,392 | (39,673,102 | ) | 5,713,557 | — | 2,316,742 | (5,818,862 | ) | 955,330 | |||||||||||||||||||||||||||||
Voya Hang
Seng Index Portfolio — Class I |
2,478,931 | 721,109 | (3,467,047 | ) | 267,007 | — | 91,345 | (669,386 | ) | 460,665 | |||||||||||||||||||||||||||||
Voya
International Index Portfolio — Class I |
— | 71,576,500 | (4,219,877 | ) | 5,292,665 | 72,649,288 | — | 209,543 | — | ||||||||||||||||||||||||||||||
Voya
Japan TOPIX Index® Portfolio — Class I |
29,492,908 | 6,131,619 | (37,717,498 | ) | 2,092,971 | — | 1,121,773 | (3,955,054 | ) | 3,319,639 | |||||||||||||||||||||||||||||
Voya
RussellTM Mid Cap Index Portfolio — Class I |
49,492,264 | 11,753,736 | (24,002,233 | ) | 4,227,806 | 41,471,573 | 779,441 | (842,662 | ) | 8,732,335 | |||||||||||||||||||||||||||||
| VOYA RETIREMENT
MODERATE PORTFOLIO |
PORTFOLIO
OF INVESTMENTS as of December 31, 2019 (continued) |
| Issuer | Beginning Fair Value at 12/31/2018 |
Purchases at Cost |
Sales at Cost |
Change in Unrealized Appreciation/ (Depreciation) |
Ending Fair Value at 12/31/2019 |
Investment Income |
Realized Gains/ (Losses) |
Net Capital Gain Distributions | |||||||||||||||||||||||||||||||
|---|---|---|---|---|---|---|---|---|---|---|---|---|---|---|---|---|---|---|---|---|---|---|---|---|---|---|---|---|---|---|---|---|---|---|---|---|---|---|---|
Voya
RussellTM Small Cap Index Portfolio — Class I |
$ | 29,643,384 | $ | 6,793,995 | $ | (18,217,196 | ) | $ | 2,643,745 | $ | 20,863,928 | $ | 329,490 | $ | 339,082 | $ | 3,151,970 | ||||||||||||||||||||||
Voya U.S.
Bond Index Portfolio — Class I |
433,423,330 | 63,110,992 | (105,854,263 | ) | 23,377,235 | 414,057,294 | 10,420,142 | 1,283,494 | — | ||||||||||||||||||||||||||||||
Voya U.S.
Stock Index Portfolio — Class I |
251,208,625 | 110,162,048 | (63,699,561 | ) | 47,340,920 | 345,012,032 | 5,176,123 | 7,448,566 | 18,625,607 | ||||||||||||||||||||||||||||||
| $ | 931,124,384 | $ | 286,745,537 | $ | (377,920,037 | ) | $ | 96,941,759 | $ | 936,891,643 | $ | 24,567,115 | $ | 4,699,626 | $ | 35,341,781 | |||||||||||||||||||||||
| Cost for federal income tax purposes was $975,367,539. | ||||||
Net unrealized
appreciation consisted of: |
||||||
Gross
Unrealized Appreciation |
$ | 53,866,885 | ||||
Gross
Unrealized Depreciation |
(311,669 | ) | ||||
Net Unrealized
Appreciation |
$ | 53,555,216 |
| VOYA RETIREMENT
MODERATE
GROWTH PORTFOLIO |
PORTFOLIO OF INVESTMENTS
AS OF DECEMBER 31, 2019 |
| Shares | Value | Percentage of Net Assets |
|||||||||
|---|---|---|---|---|---|---|---|---|---|---|---|
EXCHANGE-TRADED FUNDS: 5.9%
|
|||||||||||
| 1,884,850 | Schwab U.S. TIPS ETF |
$ | 106,739,056 | 5.9 | |||||||
Total Exchange-Traded Funds |
|||||||||||
(Cost $106,208,370) |
106,739,056 | 5.9 | |||||||||
MUTUAL FUNDS: 94.0%
|
|||||||||||
Affiliated Investment Companies: 94.0%
|
|||||||||||
| 7,577,283 | Voya
Emerging Markets Index Portfolio — Class I |
92,745,944 | 5.2 | ||||||||
| 15,245,728 | Voya
International Index Portfolio — Class I |
161,757,171 | 9.0 | ||||||||
| 6,576,360 | Voya
RussellTM Mid Cap Index Portfolio — Class I |
89,767,314 | 5.0 | ||||||||
| 3,789,987 | Voya
RussellTM Small Cap Index Portfolio — Class I |
54,196,817 | 3.0 | ||||||||
| Shares | Value | Percentage of Net Assets |
|||||||||
|---|---|---|---|---|---|---|---|---|---|---|---|
MUTUAL FUNDS: (continued)
|
|||||||||||
Affiliated Investment Companies: (continued) |
|||||||||||
| 46,485,799 | Voya
U.S. Bond Index Portfolio — Class I |
$ | 506,695,208 | 28.3 | |||||||
| 45,822,090 | Voya U.S. Stock Index Portfolio — Class I |
778,517,305 | 43.5 | ||||||||
Total Mutual Funds |
|||||||||||
(Cost $1,554,400,215) |
1,683,679,759 | 94.0 | |||||||||
Total Investments in Securities (Cost $1,660,608,585) |
$ | 1,790,418,815 | 99.9 | ||||||||
Assets in Excess of Other Liabilities |
1,161,223 | 0.1 | |||||||||
Net
Assets |
$ | 1,791,580,038 | 100.0 | ||||||||
| Quoted Prices in Active Markets for Identical Investments (Level 1) |
Significant Other Observable Inputs (Level 2) |
Significant Unobservable Inputs (Level 3) |
Fair Value at December 31, 2019 |
|||||||||||||||||
|---|---|---|---|---|---|---|---|---|---|---|---|---|---|---|---|---|---|---|---|---|
Asset
Table |
||||||||||||||||||||
Investments,
at fair value |
||||||||||||||||||||
Exchange-Traded
Funds |
$ | 106,739,056 | $ | — | $ | — | $ | 106,739,056 | ||||||||||||
Mutual
Funds |
1,683,679,759 | — | — | 1,683,679,759 | ||||||||||||||||
Total
Investments, at fair value |
$ | 1,790,418,815 | $ | — | $ | — | $ | 1,790,418,815 | ||||||||||||
ˆ |
See Note 2, “Significant Accounting Policies” in the Notes to Financial Statements for additional information. |
| Issuer | Beginning Fair Value at 12/31/2018 |
Purchases at Cost |
Sales at Cost |
Change in Unrealized Appreciation/ (Depreciation) |
Ending Fair Value at 12/31/2019 |
Investment Income |
Realized Gains/ (Losses) |
Net Capital Gain Distributions |
|||||||||||||||||||||||||||||||
|---|---|---|---|---|---|---|---|---|---|---|---|---|---|---|---|---|---|---|---|---|---|---|---|---|---|---|---|---|---|---|---|---|---|---|---|---|---|---|---|
Voya
Australia Index Portfolio — Class I |
$ | 30,157,385 | $ | 2,522,988 | $ | (34,781,059 | ) | $ | 2,100,686 | $ | — | $ | 2,401,112 | $ | 614,465 | $ | — | ||||||||||||||||||||||
Voya
Emerging Markets Index Portfolio — Class I |
120,675,523 | 19,465,179 | (51,247,855 | ) | 3,853,097 | 92,745,944 | 2,939,094 | 12,052,771 | — | ||||||||||||||||||||||||||||||
Voya
Euro STOXX 50® Index Portfolio — Class I |
94,940,229 | 6,164,064 | (106,545,065 | ) | 5,440,772 | — | 4,612,817 | 4,918,127 | 207,495 | ||||||||||||||||||||||||||||||
Voya
FTSE 100 Index® Portfolio — Class I |
64,695,971 | 8,640,609 | (86,921,232 | ) | 13,584,652 | — | 4,614,248 | (13,455,469 | ) | 2,106,616 | |||||||||||||||||||||||||||||
Voya Hang
Seng Index Portfolio — Class I |
4,343,073 | 6,048,781 | (10,841,722 | ) | 449,868 | — | 325,328 | (1,960,201 | ) | 1,060,330 | |||||||||||||||||||||||||||||
Voya
International Index Portfolio — Class I |
— | 158,429,033 | (8,474,869 | ) | 11,803,007 | 161,757,171 | — | 425,578 | — | ||||||||||||||||||||||||||||||
Voya
Japan TOPIX Index® Portfolio — Class I |
64,582,429 | 13,446,995 | (82,284,023 | ) | 4,254,599 | — | 2,515,021 | (8,450,141 | ) | 7,413,163 | |||||||||||||||||||||||||||||
Voya
RussellTM Mid Cap Index Portfolio — Class I |
121,391,291 | 26,426,563 | (68,981,139 | ) | 10,930,599 | 89,767,314 | 1,923,606 | (3,648,675 | ) | 21,566,549 | |||||||||||||||||||||||||||||
| VOYA RETIREMENT
MODERATE
GROWTH PORTFOLIO |
PORTFOLIO OF INVESTMENTS
AS OF DECEMBER 31, 2019 (CONTINUED) |
| Issuer | Beginning Fair Value at 12/31/2018 |
Purchases at Cost |
Sales at Cost |
Change in Unrealized Appreciation/ (Depreciation) |
Ending Fair Value at 12/31/2019 |
Investment Income |
Realized Gains/ (Losses) |
Net Capital Gain Distributions | ||||||||||||||||||||||||||||||||
|---|---|---|---|---|---|---|---|---|---|---|---|---|---|---|---|---|---|---|---|---|---|---|---|---|---|---|---|---|---|---|---|---|---|---|---|---|---|---|---|---|
Voya
RussellTM Small Cap Index Portfolio — Class I |
$ | 69,243,522 | $ | 15,142,932 | $ | (36,889,991 | ) | $ | 6,700,354 | $ | 54,196,817 | $ | 775,528 | $ | 542,260 | $ | 7,412,787 | |||||||||||||||||||||||
Voya U.S.
Bond Index Portfolio — Class I |
604,068,266 | 92,849,550 | (221,099,948 | ) | 30,877,340 | 506,695,208 | 13,723,264 | 3,023,122 | — | |||||||||||||||||||||||||||||||
Voya U.S.
Stock Index Portfolio — Class I |
563,433,903 | 250,686,760 | (141,991,977 | ) | 106,388,619 | 778,517,305 | 11,709,102 | 16,278,764 | 42,581,428 | |||||||||||||||||||||||||||||||
| $ | 1,737,531,592 | $ | 599,823,454 | $ | (850,058,880 | ) | $ | 196,383,593 | $ | 1,683,679,759 | $ | 45,539,120 | $ | 10,340,599 | $ | 82,348,370 | ||||||||||||||||||||||||
| Cost for federal income tax purposes was $1,678,996,144. |
Net unrealized
appreciation consisted of: |
||||||
Gross
Unrealized Appreciation |
$ | 111,739,158 | ||||
Gross
Unrealized Depreciation |
(316,487 | ) | ||||
Net Unrealized
Appreciation |
$ | 111,422,671 |
| Portfolio Name | Type | Per Share Amount | ||||||||
|---|---|---|---|---|---|---|---|---|---|---|
Voya Retirement
Conservative Portfolio |
||||||||||
Class
ADV |
NII |
$ | 0.1713 | |||||||
Class
I |
NII |
$ | 0.1953 | |||||||
All
Classes |
STCG |
$ | 0.0016 | |||||||
All
Classes |
LTCG |
$ | 0.2371 | |||||||
Voya Retirement
Growth Portfolio |
||||||||||
Class
ADV |
NII |
$ | 0.2414 | |||||||
Class
I |
NII |
$ | 0.3035 | |||||||
All
Classes |
LTCG |
$ | 0.9593 | |||||||
| Portfolio Name | Type | Per Share Amount | ||||||||
|---|---|---|---|---|---|---|---|---|---|---|
Voya Retirement
Moderate Portfolio |
||||||||||
Class
ADV |
NII |
$ | 0.2248 | |||||||
Class
I |
NII |
$ | 0.2677 | |||||||
All
Classes |
LTCG |
$ | 0.5028 | |||||||
Voya Retirement
Moderate Growth Portfolio |
||||||||||
Class
ADV |
NII |
$ | 0.2313 | |||||||
Class
I |
NII |
$ | 0.2843 | |||||||
All
Classes |
LTCG |
$ | 0.7792 | |||||||
NII — Net investment income
STCG — Short-term capital gain
LTCG — Long-term capital gain
Voya
Retirement Conservative Portfolio |
23.90% |
|||||||
Voya
Retirement Growth Portfolio |
46.11% |
|||||||
Voya
Retirement Moderate Portfolio |
31.96% |
|||||||
Voya
Retirement Moderate Growth Portfolio |
42.95% |
Voya
Retirement Conservative Portfolio |
$ | 10,731,399 |
||
Voya
Retirement Growth Portfolio |
$ | 189,158,558 |
||
Voya
Retirement Moderate Portfolio |
$ | 44,347,762 |
||
Voya
Retirement Moderate Growth Portfolio |
$ | 114,019,231 |
| Creditable Foreign Taxes Paid |
Per Share Amount |
Portion of Ordinary Income Distribution Derived from Foreign Sourced Income* |
||||||||||
|---|---|---|---|---|---|---|---|---|---|---|---|---|
Voya Retirement
Conservative Portfolio |
$ | 35,060 | $ | 0.0008 | 6.28% |
|||||||
Voya Retirement
Growth Portfolio |
$ | 425,967 | $ | 0.0021 | 21.29% |
|||||||
Voya Retirement
Moderate Portfolio |
$ | 113,074 | $ | 0.0013 | 13.26% |
|||||||
Voya Retirement
Moderate Growth Portfolio |
$ | 244,999 | $ | 0.0017 | 17.25% |
|||||||
* |
None of the Portfolios listed above derived any income from ineligible foreign sources as defined under Section 901(j) of the Internal Revenue Code. |
| Name, Address and Age | Position(s) Held with the Trust |
Term of Office and Length of Time Served(1) |
Principal Occupation(s) — During the Past 5 Years |
Number of funds in Fund Complex Overseen by Trustee(2) |
Other Board Positions Held by Trustee |
|||||
|---|---|---|---|---|---|---|---|---|---|---|
Independent Trustees*:
|
||||||||||
Colleen D.
Baldwin 7337 East Doubletree Ranch Rd. Suite 100 Scottsdale, Arizona 85258 Age: 59 |
Trustee Chairperson |
November 2007–Present January 2020–Present |
President, Glantuam Partners, LLC, a business consulting firm (January 2009–Present). |
146 |
Dentaquest (February 2014–Present); RSR Partners, Inc. (2016–Present). |
|||||
John V.
Boyer 7337 East Doubletree Ranch Rd. Suite 100 Scottsdale, Arizona 85258 Age: 66 |
Trustee |
January 2005–Present |
Retired. Formerly, President and Chief Executive Officer, Bechtler Arts Foundation, an arts and education foundation (January
2008–December 2019). |
146 |
None. |
|||||
Patricia W.
Chadwick 7337 East Doubletree Ranch Rd. Suite 100 Scottsdale, Arizona 85258 Age: 71 |
Trustee |
January 2006–Present |
Consultant and President, Ravengate Partners LLC, a consulting firm that provides advice regarding financial markets and the global economy
(January 2000–Present). |
146 |
Wisconsin Energy Corporation (June 2006–Present); The Royce Fund (22 funds) (December 2009–Present); and AMICA Mutual Insurance Company (1992–Present). |
|||||
Martin J.
Gavin 7337 East Doubletree Ranch Rd. Suite 100 Scottsdale, AZ 85258 Age: 69 |
Trustee |
August 2015–Present |
Retired. Formerly, President and Chief Executive Officer, Connecticut Children’s Medical Center (May 2006–November
2015). |
146 |
None. |
|||||
Joseph E.
Obermeyer 7337 East Doubletree Ranch Rd. Suite 100 Scottsdale, Arizona 85258 Age: 62 |
Trustee |
May 2013–Present |
President, Obermeyer & Associates, Inc., a provider of financial and economic consulting services (November
1999–Present). |
146 |
None. |
|||||
Sheryl K.
Pressler 7337 East Doubletree Ranch Rd. Suite 100 Scottsdale, Arizona 85258 Age: 69 |
Trustee |
January 2006–Present |
Consultant (May 2001–Present). |
146 |
None. |
|||||
Christopher
P. Sullivan 7337 East Doubletree Ranch Rd. Suite 100 Scottsdale, Arizona 85258 Age: 66 |
Trustee |
October 2015–Present |
Retired. |
146 |
None. |
|||||
| Name, Address and Age | Position(s) Held with the Trust |
Term of Office and Length of Time Served(1) |
Principal Occupation(s) — During the Past 5 Years |
Number of funds in Fund Complex Overseen by Trustee(2) |
Other Board Positions Held by Trustee | |||||
|---|---|---|---|---|---|---|---|---|---|---|
Trustee who is an “interested person”: |
||||||||||
Dina
Santoro 230 Park Avenue New York, New York 10169 Age: 46 |
Trustee |
July 2018–Present |
President, Voya Investments, LLC and Voya Capital, LLC (March 2018–Present); Senior Vice President, Voya Investments Distributor, LLC
(April 2018–Present); Senior Managing Director, Head of Product and Marketing Strategy, Voya Investment Management (September 2017–Present).
Formerly, Managing Director, Quantitative Management Associates, LLC (January 2004–August 2017). |
146 |
Voya
Investments, LLC, Voya Capital, LLC, and Voya Funds Services, LLC (March 2018–Present); Voya Investments Distributor, LLC (April
2018–Present). |
|||||
(1) |
Trustees serve until their successors are duly elected and qualified. The tenure of each Trustee who is not an “interested person” as defined in the 1940 Act, of each Portfolio (“Independent Trustee”) is subject to the Board’s retirement policy which states that each duly elected or appointed Independent Trustee shall retire from and cease to be a member of the Board of Trustees at the close of business on December 31 of the calendar year in which the Independent Trustee attains the age of 75. A majority vote of the Board’s other Independent Trustees may extend the retirement date of an Independent Trustee if the retirement would trigger a requirement to hold a meeting of shareholders of the Trust under applicable law, whether for the purposes of appointing a successor to the Independent Trustee or otherwise comply under applicable law, in which case the extension would apply until such time as the shareholder meeting can be held or is no longer required (as determined by a vote of a majority of the other Independent Trustees). | |
(2) |
For the purposes of this table, “Fund Complex” means the Voya family of funds including the following investment companies: Voya Asia Pacific High Dividend Equity Income Fund; Voya Balanced Portfolio, Inc.; Voya Emerging Markets High Dividend Equity Fund; Voya Equity Trust; Voya Funds Trust; Voya Global Advantage and Premium Opportunity Fund; Voya Global Equity Dividend and Premium Opportunity Fund; Voya Government Money Market Portfolio; Voya Infrastructure, Industrials and Materials Fund; Voya Intermediate Bond Portfolio; Voya International High Dividend Equity Income Fund; Voya Investors Trust; Voya Mutual Funds; Voya Natural Resources Equity Income Fund; Voya Partners, Inc.; Voya Prime Rate Trust; Voya Senior Income Fund; Voya Separate Portfolios Trust; Voya Strategic Allocation Portfolios, Inc.; Voya Variable Funds; Voya Variable Insurance Trust; Voya Variable Portfolios, Inc.; and Voya Variable Products Trust. The number of funds in the Fund Complex is as of January 31, 2020. | |
* |
Effective December 31, 2019, Russell H. Jones and Roger B. Vincent each retired as a Trustee of the Board. |
| Name, Address and Age | Position(s) Held With the Trust |
Term of Office and Length of Time Served(1) |
Principal Occupation(s) — During the Past 5 Years |
|||
|---|---|---|---|---|---|---|
Michael Bell One Orange Way Windsor, Connecticut 06095 Age: 51 |
Chief Executive
Officer |
March
2018–Present |
Chief
Executive Officer and Director, Voya Investments, LLC, Voya Capital, LLC, and Voya Funds Services, LLC (March 2018–Present); Senior Vice President
and Chief Financial Officer, Voya Investments Distributor, LLC (September 2019–Present); Chief Financial Officer, Voya Investment Management
(September 2014–Present). Formerly, Senior Vice President, Chief Financial Officer and Treasurer, Voya Investments, LLC (November 2015–March
2018). |
|||
Dina Santoro 230 Park Avenue New York, New York 10169 Age: 46 |
President |
March
2018–Present |
President and Director, Voya Investments, LLC and Voya Capital, LLC (March 2018–Present); Director, Voya Funds Services, LLC (March
2018–Present); Director and Senior Vice President, Voya Investments Distributor, LLC (April 2018–Present); Senior Managing Director, Head of
Product and Marketing Strategy, Voya Investment Management (September 2017–Present). Formerly, Managing Director, Quantitative Management
Associates, LLC (January 2004–August 2017). |
|||
Stanley D.
Vyner 230 Park Avenue New York, New York 10169 Age: 69 |
Executive Vice
President Chief Investment Risk Officer |
March
2003–Present September 2009–Present |
Executive Vice President, Voya Investments, LLC (July 2000–Present) and Chief Investment Risk Officer, Voya Investments, LLC (January
2003–Present). |
|||
James M. Fink 5780 Powers Ferry Road NW Atlanta, Georgia 30327 Age: 61 |
Executive Vice
President |
March
2018–Present |
Managing Director, Voya Investments, LLC, Voya Capital, LLC, and Voya Funds Services, LLC (March 2018–Present); Senior Vice President,
Voya Investments Distributor, LLC (April 2018–Present); Chief Administrative Officer, Voya Investment Management (September 2017–Present).
Formerly, Managing Director, Operations, Voya Investment Management (March 1999–September 2017). |
|||
Kevin M.
Gleason 7337 East Doubletree Ranch Rd. Suite 100 Scottsdale, Arizona 85258 Age: 53 |
Chief Compliance
Officer |
February
2012–Present |
Senior
Vice President, Voya Investment Management and Chief Compliance Officer, Voya Family of Funds (February 2012–Present). |
|||
Todd Modic 7337 East Doubletree Ranch Rd. Suite 100 Scottsdale, Arizona 85258 Age: 52 |
Senior Vice
President, Chief/Principal Financial Officer and Assistant Secretary |
March
2005–Present |
President, Voya Funds Services, LLC (March 2018–Present) and Senior Vice President, Voya Investments, LLC (April
2005–Present). |
|||
Kimberly A.
Anderson 7337 East Doubletree Ranch Rd. Suite 100 Scottsdale, Arizona 85258 Age: 55 |
Senior Vice
President |
November
2003–Present |
Senior
Vice President, Voya Investments, LLC (September 2003–Present). |
|||
Robert Terris 5780 Powers Ferry Road NW Atlanta, Georgia 30327 Age: 49 |
Senior Vice
President |
May
2006–Present |
Senior
Vice President, Voya Investments Distributor, LLC (April 2018–Present); Senior Vice President, Head of Division Operations, Voya Investments, LLC
(October 2015–Present) and Voya Funds Services, LLC (March 2006–Present). |
|||
Fred Bedoya 7337 East Doubletree Ranch Rd. Suite 100 Scottsdale, Arizona 85258 Age: 47 |
Vice President and
Treasurer |
September
2012–Present |
Vice
President, Voya Investments, LLC (October 2015–Present) and Voya Funds Services, LLC (July 2012–Present). |
|||
Maria M.
Anderson 7337 East Doubletree Ranch Rd. Suite 100 Scottsdale, Arizona 85258 Age: 61 |
Vice
President |
September
2004–Present |
Vice
President, Voya Investments, LLC (October 2015–Present) and Voya Funds Services, LLC (September 2004–Present). |
| Name, Address and Age | Position(s) Held With the Trust |
Term of Office and Length of Time Served(1) |
Principal Occupation(s) — During the Past 5 Years | |||
|---|---|---|---|---|---|---|
Sara M. Donaldson 7337 East Doubletree Ranch Rd. Suite 100 Scottsdale, Arizona 85258 Age: 60 |
Vice
President |
September
2014–Present |
Vice
President, Voya Investments, LLC (October 2015–Present). Formerly, Vice President, Voya Funds Services, LLC (April 2014–October
2015). |
|||
Micheline S.
Faver 7337 East Doubletree Ranch Rd. Suite 100 Scottsdale, Arizona 85258 Age: 42 |
Vice
President |
September
2016–Present |
Vice
President, Head of Fund Compliance and Chief Compliance Officer, Voya Investments, LLC (June 2016–Present). Formerly, Vice President, Mutual Fund
Compliance (March 2014–June 2016). |
|||
Robyn L.
Ichilov 7337 East Doubletree Ranch Rd. Suite 100 Scottsdale, Arizona 85258 Age: 52 |
Vice
President |
November
1999–Present |
Vice
President, Voya Funds Services, LLC (November 1995–Present) and Voya Investments, LLC (August 1997–Present). |
|||
Jason Kadavy 7337 East Doubletree Ranch Rd. Suite 100 Scottsdale, Arizona 85258 Age: 43 |
Vice
President |
September
2012–Present |
Vice
President, Voya Investments, LLC (October 2015–Present) and Voya Funds Services, LLC (July 2007–Present). |
|||
Andrew K.
Schlueter 7337 East Doubletree Ranch Rd. Suite 100 Scottsdale, Arizona 85258 Age: 43 |
Vice
President |
March
2018–Present |
Vice
President, Voya Investments Distributor, LLC (April 2018–Present); Vice President, Voya Investments, LLC and Voya Funds Services, LLC (March
2018–Present); Vice President, Head of Mutual Fund Operations, Voya Investment Management (February 2018–Present). Formerly, Vice President,
Voya Investment Management (March 2014–February 2018). |
|||
Craig Wheeler 7337 East Doubletree Ranch Rd. Suite 100 Scottsdale, Arizona 85258 Age: 50 |
Vice
President |
May
2013–Present |
Vice
President — Director of Tax, Voya Investments, LLC (October 2015–Present). Formerly, Vice President — Director of Tax, Voya Funds
Services, LLC (March 2013–October 2015). |
|||
Monia Piacenti One Orange Way Windsor, Connecticut 06095 Age: 43 |
Anti-Money
Laundering Officer |
June
2018–Present |
Anti-Money Laundering Officer, Voya Investments Distributor, LLC, Voya Investment Management and Voya Investment Management Trust Co. (June
2018–Present); Compliance Consultant, Voya Financial, Inc. (January 2019–Present). Formerly, Senior Compliance Officer, Voya Investment
Management (December 2009–December 2018). |
|||
Theresa K.
Kelety 7337 East Doubletree Ranch Rd. Suite 100 Scottsdale, Arizona 85258 Age: 57 |
Secretary |
January
2020–Present |
Vice
President and Senior Counsel, Voya Investment Management — Mutual Fund Legal Department (March 2010–Present). |
|||
Paul A.
Caldarelli 7337 East Doubletree Ranch Rd. Suite 100 Scottsdale, Arizona 85258 Age: 68 |
Assistant
Secretary |
June
2010–Present |
Vice
President and Senior Counsel, Voya Investment Management — Mutual Fund Legal Department (March 2010–Present). |
|||
Joanne F.
Osberg 7337 East Doubletree Ranch Rd. Suite 100 Scottsdale, Arizona 85258 Age: 38 |
Assistant
Secretary |
January
2020–Present |
Vice
President and Counsel, Voya Investment Management — Mutual Fund Legal Department (January 2013–Present). |
(1) |
The Officers hold office until the next annual meeting of the Board of Trustees and until their successors shall have been elected and qualified. |