UNITED STATES
SECURITIES AND EXCHANGE COMMISSION
Washington, D.C. 20549
SECURITIES AND EXCHANGE COMMISSION
Washington, D.C. 20549
FORM N-CSR
CERTIFIED SHAREHOLDER REPORT OF REGISTERED
MANAGEMENT INVESTMENT COMPANIES
Investment Company Act file number 811-05549
Reynolds Funds, Inc.
(Exact name of registrant as specified in charter)
(Exact name of registrant as specified in charter)
c/o U.S. Bancorp Fund Services, LLC
615 E. Michigan Street
Milwaukee, WI 53202
(Address of principal executive offices) (Zip code)
(Address of principal executive offices) (Zip code)
Frederick L. Reynolds
Reynolds Capital Management, LLC
7652 Las Vegas Blvd. S. #1
Las Vegas, NV 89123
(Name and address of agent for service)
(Name and address of agent for service)
(415) 265-7167
Registrant's telephone number, including area code
Date of fiscal year end: September 30, 2018
Date of reporting period: September 30, 2018
Item 1. Reports to Stockholders.
ANNUAL REPORT
September 30, 2018
A No-Load Mutual Fund
1-800-773-9665
www.reynoldsfunds.com

November 27, 2018
Dear Fellow Shareholders:
Reynolds Blue Chip Growth Fund’s 30th Anniversary
The Reynolds Blue Chip Growth Fund (the “Fund” or “Blue Chip Fund”) celebrated its 30th Anniversary this summer. It began operations on August 12, 1988.
Performance Highlights (September 30, 2018)(1)
The annualized average total returns of the Reynolds Blue Chip Growth Fund and S&P 500 Index for the 1-year, 5-year, and 10-year periods through September 30, 2018 were:
|
Average Annual Total Returns
|
|||||
|
1 Year
|
5 Year
|
10 Year
|
|||
|
Reynolds Blue Chip Growth Fund
|
28.88%
|
10.63%
|
14.16%
|
||
|
The Standard & Poor’s 500 Index(2)
|
17.91%
|
13.95%
|
11.97%
|
||
The Reynolds Blue Chip Growth Fund appreciated +21.23% and the S&P 500 appreciated 10.56% in the nine months ended September 30, 2018
|
(1)
|
Performance data quoted represents past performance; past performance does not guarantee future results. The investment return and principal value of an investment will fluctuate so that an investor’s shares, when redeemed, may be worth more or less than their original cost. Current performance of the Fund may be lower or higher than the performance quoted. Returns do not reflect the deduction of taxes that a shareholder would pay on Fund distributions or the redemption of Fund shares. Performance data current to the most recent month-end may be obtained by visiting www.reynoldsfunds.com or by calling 1-800-773-9665.
|
|
|
(2)
|
The Standard & Poor’s 500 Index (“S&P”) is a capitalization-weighted index, representing the aggregate market value of the common equity of 500 stocks primarily traded on the New York Stock Exchange. Returns shown include the reinvestment of all dividends. Past performance is not predictive of future performance. The table does not reflect the deduction of taxes that a shareholder would pay on fund distributions or the redemption of fund shares. Investment return and principal value will fluctuate, so that your shares, when redeemed, may be worth more or less than the original cost.
|
____________
As stated in the Prospectus dated January 31, 2018 the expense ratio of the Fund is 1.98%.
____________
Web Site
Our website is www.reynoldsfunds.com. At our website you can access current information about your investment holdings. You must first request a personal identification number (PIN) by calling our shareholder service representatives at 1-800-773-9665. You will be able to view your account list, account detail (including balances), transaction history, distributions, and the current Reynolds Blue Chip Growth Fund net asset value. Additional information available (PIN not needed) includes quarterly updates of the returns of the Blue Chip Fund, top ten holdings, industry percentages, and news articles regarding the Fund. Detailed statistics and graphs of past performances from Morningstar are also available via a link on the Fund’s website.
Investment Strategy
We believe that many stocks are currently selling at attractive valuations based on historical valuation measures. One of these valuation measures is a company’s price earnings ratio (the “PE ratio”) relative to inflation, interest rates and the economic outlook. Another valuation measure is a company’s PE ratio relative to its forecasted earnings growth rate (the “PEG ratio”). Many stocks of high quality companies are currently selling at PE ratios and PEG ratios below their average historical ranges relative to inflation, interest rates and the economic outlook.
The U.S. Economy
The U.S. economic recovery that started in mid-2009 has continued in 2018. The economic recovery has been affected by a number of factors that are continuing to alter the pace and composition of growth. The U.S. economy in 2018 has been affected by lower than normal interest rates, strong business and consumer confidence and spending, low unemployment, and good U.S. economic growth. Unemployment was 4.4% in 2017, 4.9% in 2016, and 5.3% in 2015. Currently, unemployment is 3.7%. Unemployment is estimated to average
1
3.9% in 2018 and 3.6% in 2019. U.S. Gross Domestic Product (GDP) increased 2.2% in 2017, 1.5% in 2016, and 2.9% in 2015. GDP increased at an inflation-adjusted annual rate of 3.5% in the quarter ended September 30, 2018 and is forecasted to increase at an inflation-adjusted annual rate of 2.5% in the quarter ended December 31, 2018. GDP is forecasted to increase 2.9% for the year ended December 31, 2018 and to increase 2.7% for the year ended December 31, 2019.
U.S. inflation numbers have been helped in the last few years by global competition and technology improvements which have lowered production costs. Inflation, as measured by the Consumer Price Index, increased 2.5% in 2017, 1.3% in 2016, and 0.1% in 2015. U.S. inflation increased 2.6% in the quarter ended September 30, 2018 and is estimated to increase 2.4% in the quarter ended December 31, 2018. Inflation is estimated to increase 2.5% for the year ended December 31, 2018 and to increase 2.7% for the year ended December 31, 2019.
We believe there are some current and potential economic and investment negatives at the present time: (1) worldwide economic growth next year may be somewhat softer than expected; (2) some central banks are reducing stimulatory measures; (3) tariffs could increase inflation and could slow economic growth; (4) rising interest rates could negatively affect economic growth; (5) there is a widening disparity between higher and lower income levels; (6) productivity growth remains somewhat lower than ideal; (7) Great Britain leaving the European Union (“Brexit”) continues to cause uncertainty; and (8) problems with the Middle East.
We believe some current and potential U.S. economic and investment positives are: (1) small business confidence and spending is good; (2) monetary policy, financial conditions and fiscal stimulus including increased infrastructure spending are supportive of growth; (3) the U.S. economy has grown in the last thirty six quarters and growth should continue in 2019; (4) manufacturing and services orders and industrial production are good; (5) the rise in residential property values has added to net worth and households have strengthened their balance sheets; (6) the labor market continues to tighten and unemployment is forecasted to be 3.6% in 2019; (7) consumer confidence and spending are strong; (8) there has been an increase in the willingness of companies to commit capital as evidenced by the increase in capital spending and in merger and acquisition activity; (9) businesses have been able to use the credit markets to strengthen their balance sheets; (10) the regulatory environment for business has been improving; (11) many companies are repurchasing their shares; (12) lower taxes are helping; (13) current valuations of many stocks are reasonable taking into consideration inflation, interest rates and the economy; and (14) the U.S. economy currently has better fundamentals than the economies of most other industrialized countries.
The World Economy
The global economic recovery that started in mid-2009 has continued in 2018. The world economy is forecasted to increase 3.8% in 2018 and 3.6% in 2019 after increasing 3.8% in 2017, 2.7% in 2016, and 2.8% in 2015.
The Eurozone’s GDP is forecasted to increase 1.9% in 2018 and to increase 1.9% in 2019, after increasing 2.5% in 2017, 1.7% in 2016, and 1.5% in 2015. The United Kingdom’s GDP is forecasted to increase 1.2% in 2018 and to increase 1.6% in 2019 after increasing 1.8% in 2017, 1.8% in 2016, and 2.3% in 2015.
Among larger industrialized economies, Canada’s GDP is forecasted to increase 2.2% in 2018 and to increase 2.2% in 2019 after increasing 3.0% in 2017, 1.4% in 2016, and 1.9% in 2015. Japan’s GDP is forecasted to increase 1.2% in 2018 and to increase 1.1% in 2019 after increasing 1.7% in 2017, 1.0% in 2016, and 1.5% in 2015.
China currently has the second strongest growth among “developing economies.” It is also currently the world’s second fastest growing major economy. China’s population is approximately 18.5% of the world’s total population of approximately 7.7 billion. In 2010, China overtook Japan and became the world’s second largest economy after the U.S. Many economists believe that China has a particularly good long-term outlook. Near term, however, there have been cross currents in China’s economic outlook and growth has been slowing, although economic growth is at a high rate. China’s GDP is forecasted to increase 6.6% in 2018 and to increase 6.1% in 2019, after increasing 6.9% in 2017, 6.7% in 2016, and 6.9% in 2015.
India’s population is approximately 17.7% of the world’s population. India currently has the fastest growth among “developing economies” and it currently is the world’s fastest growing major economy. India’s GDP is forecasted to increase 7.7% in 2018 and 7.5% in 2019 after increasing 7.1% in 2017, 7.9% in 2016, and 7.2% in 2015.
Mexico’s GDP is forecasted to increase 2.2% in 2018. Mexico’s GDP is forecasted to increase 2.4% in 2019.
Opportunistic Investing in Companies of Various Sizes and Diversified Among Various Industries
The Reynolds Blue Chip Growth Fund usually invests in companies of various sizes as classified by their market capitalizations. A company’s market capitalization is calculated by taking the number of shares the company has outstanding multiplied by its current market price. Other considerations in selecting companies for the Fund include revenue growth rates, product innovations, financial strength, management’s
2
knowledge and experience, plus the overall economic and geopolitical environments and interest rates. The Fund’s investments are diversified among various industries.
The long-term strategy of the Reynolds Blue Chip Growth Fund is to emphasize investment in worldwide “Blue Chip” growth companies. These companies are defined as companies with a minimum market capitalization of U.S. $1 billion. In the long-term, these companies build value as their earnings grow. This growth in value should ultimately be recognized in higher stock prices for these companies.
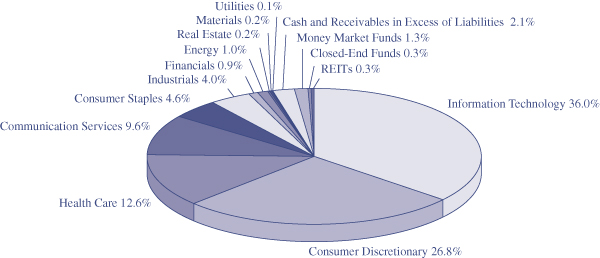
Industry Sectors(1)(2) as of September 30, 2018
|
(1)
|
The Global Industry Classification Standard (“GICS®”) was developed by and/or is the exclusive property of MSCI, Inc. and Standard & Poor’s Financial Services LLC. GICS® is a service mark of MSCI and S&P and has been licensed for use by U.S. Bancorp Fund Services, LLC.
|
|
(2)
|
For presentation purposes within the Fund’s shareholder letter, the Fund has grouped some of the industry categories by sector. For purposes of categorizing securities for compliance with section 8(b)(1) of the Investment Company Act of 1940, as amended, the Fund uses more specific industry classifications for financial reporting within its Schedule of Investments.
|
Low Long-Term Interest Rates are a Positive for Stock Valuations
Long-term U.S. interest rates are at lower than normal levels relative to inflation and the economy. Low long-term interest rates usually result in higher stock valuations for many reasons including:
|
(1)
|
Long-term borrowing costs of corporations are lower resulting in higher business confidence and profits.
|
|
|
(2)
|
Long-term borrowing costs of individuals are lower which increases consumer confidence and spending.
|
|
|
(3)
|
A company’s stock is usually valued by placing a present value on that company’s future stream of earnings and dividends. The present value is higher when interest and inflation rates are low.
|
Linked Money Market Fund
The First American Treasury Obligations Fund is a money market fund offered by an affiliate of our transfer agent, U.S. Bancorp Fund Services, LLC, doing business as U.S. Bank Global Fund Services (“Fund Services”). The First American Treasury Obligations Fund is offered as a money market alternative to our shareholders. The First American Treasury Obligations Fund offers many free shareholder conveniences including automatic investment and withdrawal plans and check writing access to your funds and is linked to your holdings in the Reynolds Blue Chip Growth Fund. The First American Treasury Obligations Fund is also included on your quarterly statements.
Information about the Reynolds Blue Chip Growth Fund and the First American Treasury Obligations Fund are available on our website – Reynoldsfunds.com: You can access current information about your investment holdings via our website, reynoldsfunds.com. You will be able to view your account list, account detail (including balances), transaction history, distributions, and the current Reynolds Blue Chip Growth Fund net asset value. Additional information available (PIN not needed) includes quarterly updates of the returns of the Blue Chip Fund, top ten holdings, industry percentages, and news articles regarding the Fund. Detailed statistics and graphs of past performances from Morningstar are also available via a link on the Fund’s website.
For automatic current daily net asset values: Call 1-800-773-9665 (1-800-7REYNOLDS) twenty-four hours a day, seven days a week and press “any key” then “1”. The updated current net asset value for the Blue Chip Fund is usually available each business day after 5 P.M. (PST).
3
For the Reynolds Blue Chip Growth Fund shareholders to automatically access their current account information: Call 1-800-773-9665 (twenty-four hours a day, seven days a week), press “any key” then “2” and enter your 16 digit account number which appears at the top right of your statement.
To speak to a Fund representative regarding the current daily net asset value, current account information and any other questions: Call 1-800-773-9665 and press “0” from 6 A.M. to 5 P.M. (PST).
Shareholder statement frequency: Consolidated statements summarizing the Blue Chip Fund and First American Treasury Obligations Fund accounts held by a shareholder are sent quarterly. In addition, individual Blue Chip Fund statements are sent whenever a transaction occurs. These transactions are: (1) statements sent for the Blue Chip Fund or First American Treasury Obligations Fund when a shareholder purchases or redeems shares; (2) Blue Chip Fund statements sent if, and when, any ordinary income or capital gains are distributed.
Tax reporting: Individual 1099 forms, which summarize any dividend income and any long- or short-term capital gains, are sent annually to shareholders each January. The percentage of income earned from various government securities, if any, for the Blue Chip Fund and the First American Treasury Obligations Fund are also reported in January.
Minimum investment: $1,000 for regular and retirement accounts ($100 for additional investments for all accounts – except for the Automatic Investment Plan, which is $50 for regular and retirement plan accounts).
Retirement plans: All types are offered including Traditional IRA, Roth IRA, Coverdell Education Savings Account, SIMPLE IRA Plan, and SEP IRA.
Automatic Investment Plan: There is no charge to automatically debit your checking account to invest in the Blue Chip Fund or the First American Treasury Obligations Fund ($50 minimum for either of these Funds) at periodic intervals to make automatic purchases in either of these Funds. This is useful for dollar cost averaging for the Blue Chip Fund.
Systematic Withdrawal Plan: For shareholders with a $10,000 minimum starting balance, there is no charge to automatically redeem shares ($100 minimum) in the Blue Chip Fund or the First American Treasury Obligations Fund as often as monthly and send a check to you or transfer funds to your bank account.
Free Check Writing: Free check writing ($100 minimum) is offered for accounts invested in the First American Treasury Obligations Fund.
Exchanges or regular redemptions between the Blue Chip Fund and the First American Treasury Obligations Fund: As often as desired – no charge.
NASDAQ symbols: Reynolds Blue Chip Growth Fund – RBCGX and First American Treasury Obligations Fund – FATXX.
Portfolio Manager: Frederick Reynolds is the portfolio manager of the Reynolds Blue Chip Growth Fund. He has been the portfolio manager of the Fund since its inception in 1988.
The Reynolds Blue Chip Growth Fund and the First American Treasury Obligations Fund are No-Load: No front-end sales commissions or deferred sales charges (“loads”) are charged. Some mutual funds impose these marketing charges that are ultimately paid by the shareholder. These marketing charges are either: (1) a front-end fee or “load” in which up to 5% of a shareholder’s assets are deducted from the original investment (some funds even charge a fee when a shareholder reinvests capital gains or dividends); or (2) a back-end penalty fee or “load” which is typically deducted from a shareholder’s account if a shareholder redeems within five years of the original investment. These fees reduce a shareholder’s return. The Reynolds Blue Chip Growth Fund and the First American Treasury Obligations Fund are No-Load as they do not have these extra charges.
We appreciate your continued confidence in the Reynolds Blue Chip Growth Fund and would like to welcome our new shareholders. We look forward to strong results in the future.
Sincerely,

Frederick L. Reynolds
President
4
This report is not authorized for use as an offer of sale or a solicitation of an offer to buy shares of the Reynolds Blue Chip Growth Fund unless accompanied or preceded by the Fund’s current prospectus.
Investors in the Fund may lose money. There are risks associated with investments in the types of securities in which the Fund invests. These risks include:
Market Risk – The prices of the stocks in which the Fund invests may decline for a number of reasons. These reasons include factors that are specific to one or more stocks in which the Fund invests as well as factors that affect the equity securities markets generally. The price declines may be steep, sudden and/or prolonged.
Growth Investing Risk – The investment adviser may be wrong in its assessment of a company’s potential for growth and the growth stocks the Fund holds may not grow as the investment adviser anticipates. Finally, there are periods when investing in growth stocks falls out of favor with investors and these stocks may underperform.
Smaller and Medium Capitalization Companies Risk – The Fund invests in smaller companies, which involve additional risks such as limited liquidity and greater volatility.
Foreign Securities Risk – The Fund invests in foreign securities which involve greater volatility and political, economic and currency risks and different accounting methods.
Additional risks associated with investing in the Fund are as follows: Technology Companies Risk, Consumer Discretionary Companies Risk, and Portfolio Turnover Risk. For details regarding these risks, please refer to the Fund’s Prospectus or Summary Prospectus dated January 31, 2018.
For additional information about the Directors and Officers or for a description of the policies and procedures that the Fund uses to determine how to vote proxies relating to portfolio securities, please call (800) 773-9665 and request a Statement of Additional Information. One will be mailed to you free of charge. The Statement of Additional Information is also available on the website of the Securities and Exchange Commission (the “Commission”) at http://www.sec.gov. Information on how the Fund voted proxies relating to portfolio securities is available on the Fund’s website at http://www.reynoldsfunds.com and on the website of the Commission no later than August 31 for the prior 12 months ending June 30. The Fund files its complete schedule of portfolio holdings with the Commission for the first and third quarters of each fiscal year on Form N-Q. The Fund’s Form N-Q is available on the Commission’s website. The Fund’s Forms N-Q may be reviewed and copied at the Commission’s Public Reference Room in Washington, D.C., and information on the operation of the Public Reference Room may be obtained by calling 1-800-SEC-0330.
Distributed by Rafferty Capital Markets, LLC
5
Reynolds Blue Chip Growth Fund
MANAGEMENT’S DISCUSSION OF FUND PERFORMANCE
(Unaudited)
The Reynolds Blue Chip Growth Fund significantly outperformed the Standard & Poor’s 500 Index (the Blue Chip Fund’s benchmark) during the twelve months ended September 30, 2018 (the Fund’s fiscal year). Some of the Blue Chip Fund’s strongest industry performers during this period were: (1) Health, (2) Internet, (3) Retail, and (4) Technology. In addition, good individual stock selection was an important contributor to the Blue Chip Fund’s performance. Examples were: (1) Adobe, (2) Alibaba, (3) Amazon, (4) Apple, (5) Baidu, (6) Boeing, (7) Costco, (8) Home Depot, (9) Microsoft, (10) Netflix, (11) Nvidia, and (12) Salesforce.com.
Some industries that were held in the Reynolds Blue Chip Growth Fund that underperformed the Standard & Poor’s 500 Index during the twelve months ended September 30, 2018 were: (1) Energy, (2) Financials, and (3) Home Building. Some of the Fund’s individual holdings that underperformed the benchmark were: (1) American Airlines, (2) Citigroup, (3) Facebook, (4) Goldman Sachs, (5) Tesla, and (6) Zillow.
COMPARISON OF CHANGE IN VALUE OF $10,000 INVESTMENT IN
REYNOLDS BLUE CHIP GROWTH FUND AND S&P 500 INDEX(1)
|
AVERAGE ANNUAL TOTAL RETURN
|
|||
|
1-YEAR
|
5-YEAR
|
10-YEAR
|
|
|
Reynolds Blue Chip Growth Fund
|
28.88%
|
10.63%
|
14.16%
|
|
S&P 500 Index
|
17.91%
|
13.95%
|
11.97%
|
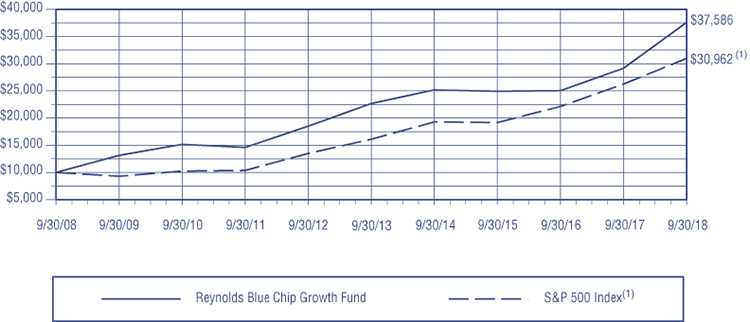
Past performance does not predict future performance. The graph and the table do not reflect the deduction of taxes that a shareholder would pay on Fund distributions or the redemption of Fund shares.
|
(1)
|
The S&P 500 is the Standard & Poor’s Composite Index of 500 stocks, a widely recognized unmanaged index of common stock prices and includes the reinvestment of all dividends. Investors cannot invest directly in an index or benchmark.
|
6
Reynolds Blue Chip Growth Fund
EXPENSE EXAMPLE
(Unaudited)
As a shareholder of Reynolds Blue Chip Growth Fund, you incur two types of costs: (1) transaction costs, including redemption fees, and (2) ongoing costs, including management fees, and other fund specific expenses. The expense example is intended to help the shareholder understand ongoing costs (in dollars) of investing in a fund and to compare these costs with the ongoing costs of investing in other mutual funds. The example is based on an investment of $1,000 invested at the beginning of the period and held for the most recent six-month period.
The Actual Expenses comparison provides information about actual account values and actual expenses. A shareholder may use the information in this line, together with the amount invested, to estimate the expenses paid over the period. A shareholder may divide his/her account value by $1,000 (e.g., an $8,600 account value divided by $1,000 = 8.6), then multiply the result by the number in the first line under the heading entitled “Expenses Paid During Period” to estimate the expenses paid on his/her account during this period.
The Hypothetical Example for Comparison Purposes provides information about hypothetical account values and hypothetical expenses based on the Fund’s actual expense ratio and an assumed rate of return of 5% per year before expenses, which is not the Fund’s actual return. The hypothetical account values and expenses may not be used to estimate the actual ending account balance or expenses paid for the period. A shareholder may use this information to compare the ongoing costs of investing in the Fund and other funds. To do so, a shareholder would compare this 5% hypothetical example with the 5% hypothetical examples that appear in the shareholder reports of other funds.
The expenses shown in the table are meant to highlight your ongoing costs only and do not reflect any transactional costs, such as sales charges (loads), redemptions fees, or exchange fees. Therefore, the Hypothetical Example for Comparison Purposes is useful in comparing ongoing costs only, and will not help to determine the relevant total costs of owning different funds. In addition, if these transactional costs were included, shareholder costs would have been higher.
|
Annualized Net
|
Beginning
|
Ending
|
Expenses Paid
|
|
|
Expense Ratio
|
Account Value
|
Account Value
|
During Period
|
|
|
9/30/18
|
4/1/18
|
9/30/18
|
4/1/18-9/30/18(1)
|
|
|
Actual Expenses(2)
|
1.93%
|
$1,000.00
|
$1,167.20
|
$10.49
|
|
Hypothetical Example for Comparison Purposes
|
||||
|
(5% return before expenses)
|
1.93%
|
$1,000.00
|
$1,015.42
|
$ 9.75
|
|
(1)
|
Expenses are equal to the Fund’s annualized net expense ratio, multiplied by the average account value over the period, multiplied by 183/365 to reflect the one-half year period.
|
|
(2)
|
Based on the actual returns of 16.72% for the six month-period ended September 30, 2018.
|
7
Reynolds Blue Chip Growth Fund
STATEMENT OF ASSETS AND LIABILITIES
September 30, 2018
|
ASSETS:
|
||||
|
Investments in securities, at value (cost $54,674,102)
|
$
|
77,691,299
|
||
|
Receivable from investments sold
|
4,660,145
|
|||
|
Prepaid expenses
|
40,912
|
|||
|
Dividends and interest receivable
|
18,286
|
|||
|
Receivable from shareholders for purchases
|
5,877
|
|||
|
Total assets
|
82,416,519
|
|||
|
LIABILITIES:
|
||||
|
Payable for investments purchased
|
2,978,652
|
|||
|
Payable to shareholders for redemptions
|
78,408
|
|||
|
Payable to adviser for management fees
|
64,688
|
|||
|
Payable for distribution fees
|
12,474
|
|||
|
Other liabilities
|
88,229
|
|||
|
Total liabilities
|
3,222,451
|
|||
|
NET ASSETS
|
$
|
79,194,068
|
||
|
NET ASSETS CONSIST OF:
|
||||
|
Capital Stock, $0.01 par value; 40,000,000 shares authorized; 1,158,717 shares outstanding
|
$
|
46,985,120
|
||
|
Distributable earnings
|
32,208,948
|
|||
|
Net assets
|
$
|
79,194,068
|
||
|
CALCULATION OF NET ASSET VALUE PER SHARE:
|
||||
|
Net asset value, offering and redemption price per share ($79,194,068 ÷ 1,158,717 shares outstanding)
|
$
|
68.35
|
||
SCHEDULE OF INVESTMENTS
September 30, 2018
|
Shares
|
Value
|
|||||||
|
LONG-TERM INVESTMENTS — 96.8% (a)
|
||||||||
|
COMMON STOCKS — 96.5% (a)
|
||||||||
|
Aerospace & Defense — 0.7%
|
||||||||
|
Axon Enterprise, Inc.*
|
1,700
|
$
|
116,331
|
|||||
|
The Boeing Company
|
350
|
130,165
|
||||||
|
General Dynamics Corporation
|
200
|
40,944
|
||||||
|
Lockheed Martin Corporation
|
150
|
51,894
|
||||||
|
Teledyne Technologies, Inc.*
|
500
|
123,340
|
||||||
|
United Technologies Corporation
|
900
|
125,829
|
||||||
|
588,503
|
||||||||
|
Air Freight & Logistics — 0.5%
|
||||||||
|
C.H. Robinson Worldwide, Inc.
|
200
|
19,584
|
||||||
|
Expeditors International of Washington, Inc.
|
1,800
|
132,354
|
||||||
|
FedEx Corporation
|
600
|
144,474
|
||||||
|
United Parcel Service, Inc., Class B
|
600
|
70,050
|
||||||
|
366,462
|
||||||||
|
Airlines — 0.7%
|
||||||||
|
Alaska Air Group, Inc.
|
700
|
48,202
|
||||||
|
Allegiant Travel Company
|
200
|
25,360
|
||||||
|
Delta Air Lines, Inc.
|
2,800
|
161,924
|
||||||
|
Southwest Airlines Company
|
3,000
|
187,350
|
||||||
|
Spirit Airlines, Inc.*
|
1,400
|
65,758
|
||||||
|
United Continental Holdings, Inc.*
|
500
|
44,530
|
||||||
|
533,124
|
||||||||
The accompanying notes are an integral part of these financial statements.
8
Reynolds Blue Chip Growth Fund
SCHEDULE OF INVESTMENTS (Continued)
September 30, 2018
|
Shares
|
Value
|
|||||||
|
LONG-TERM INVESTMENTS — 96.8% (a) (Continued)
|
||||||||
|
COMMON STOCKS — 96.5% (a) (Continued)
|
||||||||
|
Automobiles — 0.1%
|
||||||||
|
Tesla, Inc.*
|
200
|
$
|
52,954
|
|||||
|
Banks — 0.1%
|
||||||||
|
Fifth Third Bancorp
|
1,400
|
39,088
|
||||||
|
Beverages — 0.2%
|
||||||||
|
Constellation Brands, Inc., Class A
|
200
|
43,124
|
||||||
|
PepsiCo, Inc.
|
1,100
|
122,980
|
||||||
|
166,104
|
||||||||
|
Biotechnology — 3.8%
|
||||||||
|
AbbVie, Inc.
|
300
|
28,374
|
||||||
|
ACADIA Pharmaceuticals, Inc.*
|
1,800
|
37,368
|
||||||
|
Alexion Pharmaceuticals, Inc.*
|
600
|
83,406
|
||||||
|
Amarin Corp plc — ADR*
|
5,000
|
81,350
|
||||||
|
Amgen, Inc.
|
800
|
165,832
|
||||||
|
BeiGene, Ltd. — ADR*
|
1,800
|
309,996
|
||||||
|
Bluebird Bio, Inc.*
|
300
|
43,800
|
||||||
|
Celgene Corporation*
|
2,900
|
259,521
|
||||||
|
Exact Sciences Corporation*
|
500
|
39,460
|
||||||
|
Gilead Sciences, Inc.
|
1,000
|
77,210
|
||||||
|
Intercept Pharmaceuticals, Inc.*
|
2,700
|
341,172
|
||||||
|
Ligand Pharmaceuticals, Inc.*
|
800
|
219,592
|
||||||
|
Loxo Oncology, Inc.*
|
500
|
85,415
|
||||||
|
Neurocrine Biosciences, Inc.*
|
1,400
|
172,130
|
||||||
|
PTC Therapeutics, Inc.*
|
1,900
|
89,300
|
||||||
|
Sarepta Therapeutics, Inc.*
|
1,500
|
242,265
|
||||||
|
Seattle Genetics, Inc.*
|
4,000
|
308,480
|
||||||
|
United Therapeutics Corporation*
|
400
|
51,152
|
||||||
|
Vertex Pharmaceuticals, Inc.*
|
1,900
|
366,206
|
||||||
|
3,002,029
|
||||||||
|
Building Products — 0.1%
|
||||||||
|
Armstrong World Industries, Inc.*
|
700
|
48,720
|
||||||
|
Capital Markets — 0.6%
|
||||||||
|
The Blackstone Group L.P.
|
7,800
|
297,024
|
||||||
|
CME Group, Inc.
|
300
|
51,063
|
||||||
|
FactSet Research Systems, Inc.
|
300
|
67,113
|
||||||
|
T. Rowe Price Group, Inc.
|
400
|
43,672
|
||||||
|
Virtus Investment Partners, Inc.
|
400
|
45,500
|
||||||
|
504,372
|
||||||||
|
Chemicals — 0.2%
|
||||||||
|
Balchem Corporation
|
600
|
67,254
|
||||||
|
CF Industries Holdings, Inc.
|
800
|
43,552
|
||||||
|
International Flavors & Fragrances, Inc.
|
300
|
41,736
|
||||||
|
The Scotts Miracle-Gro Company
|
400
|
31,492
|
||||||
|
184,034
|
||||||||
|
Commercial Services & Supplies — 0.4%
|
||||||||
|
Copart, Inc.*
|
2,000
|
103,060
|
||||||
|
Waste Connections, Inc.
|
2,900
|
231,333
|
||||||
|
334,393
|
||||||||
|
Communications Equipment — 3.3%
|
||||||||
|
Ciena Corporation*
|
1,400
|
43,736
|
||||||
|
Cisco Systems, Inc.
|
8,000
|
389,200
|
||||||
|
F5 Networks, Inc.*
|
5,600
|
1,116,752
|
||||||
|
Motorola Solutions, Inc.
|
2,800
|
364,392
|
||||||
|
Palo Alto Networks, Inc.*
|
2,100
|
473,046
|
||||||
|
Ubiquiti Networks, Inc.
|
2,200
|
217,492
|
||||||
|
2,604,618
|
||||||||
|
Construction & Engineering — 0.0%
|
||||||||
|
Jacobs Engineering Group, Inc.
|
400
|
30,600
|
||||||
|
Consumer Finance — 0.4%
|
||||||||
|
American Express Company
|
2,600
|
276,874
|
||||||
|
Discover Financial Services
|
500
|
38,225
|
||||||
|
315,099
|
||||||||
|
Consumer Services — Diversified — 0.2%
|
||||||||
|
New Oriental Education &
|
||||||||
|
Technology Group, Inc. — SP-ADR*
|
1,000
|
74,010
|
||||||
|
TAL Education Group — ADR*
|
1,400
|
35,994
|
||||||
|
Weight Watchers International, Inc.*
|
500
|
35,995
|
||||||
|
145,999
|
||||||||
|
Electronic Equipment,
|
||||||||
|
Instruments & Components — 0.7%
|
||||||||
|
Cognex Corporation
|
4,100
|
228,862
|
||||||
|
Zebra Technologies Corporation, Class A*
|
1,700
|
300,611
|
||||||
|
529,473
|
||||||||
|
Energy Equipment & Services — 0.3%
|
||||||||
|
Core Laboratories N.V.
|
1,100
|
127,413
|
||||||
|
Diamond Offshore Drilling, Inc.*
|
1,200
|
24,000
|
||||||
|
Helmerich & Payne, Inc.
|
600
|
41,262
|
||||||
|
Transocean, Ltd.*
|
1,800
|
25,110
|
||||||
|
217,785
|
||||||||
|
Entertainment — 3.7%
|
||||||||
|
Activision Blizzard, Inc.
|
1,500
|
124,785
|
||||||
|
Electronic Arts, Inc.*
|
1,300
|
156,637
|
||||||
|
iQIYI, Inc. — ADR*
|
2,300
|
62,261
|
||||||
|
Live Nation Entertainment, Inc.*
|
3,900
|
212,433
|
||||||
|
NetEase, Inc. — ADR
|
200
|
45,650
|
||||||
|
Netflix, Inc.*
|
5,650
|
2,113,835
|
||||||
|
Spotify Technology S.A.*
|
400
|
72,332
|
||||||
|
Take-Two Interactive Software, Inc.*
|
300
|
41,397
|
||||||
|
The Walt Disney Company
|
800
|
93,552
|
||||||
|
2,922,882
|
||||||||
The accompanying notes are an integral part of these financial statements.
9
Reynolds Blue Chip Growth Fund
SCHEDULE OF INVESTMENTS (Continued)
September 30, 2018
|
Shares
|
Value
|
|||||||
|
LONG-TERM INVESTMENTS — 96.8% (a) (Continued)
|
||||||||
|
COMMON STOCKS — 96.5% (a) (Continued)
|
||||||||
|
Financial Services — Diversified — 0.1%
|
||||||||
|
Berkshire Hathaway, Inc., Class B*
|
200
|
$
|
42,822
|
|||||
|
Food & Staples Retailing — 3.7%
|
||||||||
|
Casey’s General Stores, Inc.
|
600
|
77,466
|
||||||
|
Costco Wholesale Corporation
|
10,500
|
2,466,240
|
||||||
|
PriceSmart, Inc.
|
900
|
72,855
|
||||||
|
Walgreens Boots Alliance, Inc.
|
500
|
36,450
|
||||||
|
Walmart, Inc.
|
2,600
|
244,166
|
||||||
|
2,897,177
|
||||||||
|
Food Products — 0.3%
|
||||||||
|
The Hershey Company
|
800
|
81,600
|
||||||
|
Hormel Foods Corporation
|
900
|
35,460
|
||||||
|
J & J Snack Foods Corporation
|
300
|
45,267
|
||||||
|
McCormick & Company, Inc.,
|
||||||||
|
Non Voting Shares
|
300
|
39,525
|
||||||
|
The JM Smucker Company
|
400
|
41,044
|
||||||
|
242,896
|
||||||||
|
Health Care Equipment & Supplies — 3.2%
|
||||||||
|
Abbott Laboratories
|
5,000
|
366,800
|
||||||
|
ABIOMED, Inc.*
|
100
|
44,975
|
||||||
|
Align Technology, Inc.*
|
500
|
195,610
|
||||||
|
Baxter International, Inc.
|
600
|
46,254
|
||||||
|
Boston Scientific Corporation*
|
3,500
|
134,750
|
||||||
|
DexCom, Inc.*
|
300
|
42,912
|
||||||
|
Edwards Lifesciences Corporation*
|
2,900
|
504,890
|
||||||
|
IDEXX Laboratories, Inc.*
|
700
|
174,762
|
||||||
|
Intuitive Surgical, Inc.*
|
900
|
516,600
|
||||||
|
Koninklijke Philips N.V.
|
1,800
|
81,918
|
||||||
|
Medtronic plc
|
2,900
|
285,273
|
||||||
|
Novocure Ltd.*
|
700
|
36,680
|
||||||
|
Tandem Diabetes Care, Inc.*
|
400
|
17,136
|
||||||
|
Varian Medical Systems, Inc.*
|
600
|
67,158
|
||||||
|
2,515,718
|
||||||||
|
Health Care Providers & Services — 1.9%
|
||||||||
|
Addus HomeCare Corporation*
|
600
|
42,090
|
||||||
|
Amedisys, Inc.*
|
3,100
|
387,376
|
||||||
|
Anthem, Inc.
|
400
|
109,620
|
||||||
|
Centene Corporation*
|
1,373
|
198,783
|
||||||
|
DaVita, Inc.*
|
300
|
21,489
|
||||||
|
Encompass Health Corporation
|
2,100
|
163,695
|
||||||
|
Express Scripts Holding Company*
|
2,100
|
199,521
|
||||||
|
HCA Healthcare, Inc.
|
300
|
41,736
|
||||||
|
Henry Schein, Inc.*
|
1,400
|
119,042
|
||||||
|
Humana, Inc.
|
200
|
67,704
|
||||||
|
Laboratory Corporation of America Holdings*
|
400
|
69,472
|
||||||
|
UnitedHealth Group, Inc.
|
300
|
79,812
|
||||||
|
1,500,340
|
||||||||
|
Health Care Technology — 0.8%
|
||||||||
|
athenahealth, Inc.*
|
200
|
26,720
|
||||||
|
Cerner Corporation*
|
1,100
|
70,851
|
||||||
|
Teladoc Health, Inc.*
|
3,100
|
267,685
|
||||||
|
Veeva Systems, Inc., Class A*
|
2,400
|
261,288
|
||||||
|
626,544
|
||||||||
|
Hotels, Restaurants & Leisure — 3.0%
|
||||||||
|
BJ’s Restaurants, Inc.
|
3,500
|
252,700
|
||||||
|
Carnival Corporation
|
700
|
44,639
|
||||||
|
Darden Restaurants, Inc.
|
2,000
|
222,380
|
||||||
|
Dine Brands Global, Inc.
|
900
|
73,179
|
||||||
|
Hilton Worldwide Holdings, Inc.
|
1,000
|
80,780
|
||||||
|
Marriott International, Inc., Class A
|
3,380
|
446,261
|
||||||
|
Marriott Vacations Worldwide Corporation
|
300
|
33,525
|
||||||
|
MGM Resorts International
|
1,500
|
41,865
|
||||||
|
Norwegian Cruise Line Holdings, Ltd.*
|
900
|
51,687
|
||||||
|
Papa John’s International, Inc.
|
3,000
|
153,840
|
||||||
|
Planet Fitness, Inc., Class A*
|
800
|
43,224
|
||||||
|
Royal Caribbean Cruises, Ltd.
|
300
|
38,982
|
||||||
|
Shake Shack, Inc., Class A*
|
1,300
|
81,913
|
||||||
|
Starbucks Corporation
|
5,600
|
318,304
|
||||||
|
Yum! Brands, Inc.
|
5,700
|
518,187
|
||||||
|
2,401,466
|
||||||||
|
Household Durables — 0.5%
|
||||||||
|
iRobot Corporation*
|
700
|
76,944
|
||||||
|
Roku, Inc.*
|
3,200
|
233,696
|
||||||
|
Sony Corporation — SP-ADR
|
1,900
|
115,235
|
||||||
|
425,875
|
||||||||
|
Household Products — 0.4%
|
||||||||
|
The Clorox Company
|
900
|
135,369
|
||||||
|
Kimberly-Clark Corporation
|
700
|
79,548
|
||||||
|
The Procter & Gamble Company
|
1,000
|
83,230
|
||||||
|
298,147
|
||||||||
|
Industrial Conglomerates — 0.2%
|
||||||||
|
3M Company
|
200
|
42,142
|
||||||
|
Honeywell International, Inc.
|
800
|
133,120
|
||||||
|
175,262
|
||||||||
|
Insurance — 0.2%
|
||||||||
|
Aon plc
|
900
|
138,402
|
||||||
|
Assurant, Inc.
|
400
|
43,180
|
||||||
|
181,582
|
||||||||
The accompanying notes are an integral part of these financial statements.
10
Reynolds Blue Chip Growth Fund
SCHEDULE OF INVESTMENTS (Continued)
September 30, 2018
|
Shares
|
Value
|
|||||||
|
LONG-TERM INVESTMENTS — 96.8% (a) (Continued)
|
||||||||
|
COMMON STOCKS — 96.5% (a) (Continued)
|
||||||||
|
Interactive Media & Services — 5.5%
|
||||||||
|
Alphabet, Inc., Class A*
|
1,500
|
$
|
1,810,620
|
|||||
|
Alphabet, Inc., Class C*
|
1,000
|
1,193,470
|
||||||
|
Facebook, Inc., Class A*
|
3,400
|
559,164
|
||||||
|
IAC/InterActiveCorp*
|
200
|
43,344
|
||||||
|
Match Group, Inc.*
|
2,200
|
127,402
|
||||||
|
SINA Corporation*
|
500
|
34,740
|
||||||
|
TripAdvisor, Inc.*
|
5,500
|
280,885
|
||||||
|
Twitter, Inc.*
|
1,200
|
34,152
|
||||||
|
YY, Inc. — ADR*
|
500
|
37,460
|
||||||
|
Zillow Group, Inc., Class C*
|
4,900
|
216,825
|
||||||
|
4,338,062
|
||||||||
|
Internet & Direct Marketing Retail — 16.8%
|
||||||||
|
Amazon.com, Inc.*
|
5,350
|
10,716,050
|
||||||
|
Booking Holdings, Inc.*
|
300
|
595,200
|
||||||
|
Ctrip.com International, Ltd. — ADR*
|
1,800
|
66,906
|
||||||
|
Etsy, Inc.*
|
4,900
|
251,762
|
||||||
|
Expedia Group, Inc.
|
4,905
|
640,004
|
||||||
|
GrubHub, Inc.*
|
2,000
|
277,240
|
||||||
|
JD.com, Inc. — ADR*
|
2,400
|
62,616
|
||||||
|
Overstock.com, Inc.*
|
2,400
|
66,480
|
||||||
|
Stitch Fix, Inc., Class A*
|
5,200
|
227,604
|
||||||
|
Wayfair, Inc., Class A*
|
2,800
|
413,476
|
||||||
|
13,317,338
|
||||||||
|
IT Services — 10.0%
|
||||||||
|
21Vianet Group, Inc. — ADR*
|
700
|
7,070
|
||||||
|
Automatic Data Processing, Inc.
|
2,900
|
436,914
|
||||||
|
DXC Technology Company
|
2,600
|
243,152
|
||||||
|
EPAM Systems, Inc.*
|
200
|
27,540
|
||||||
|
Euronet Worldwide, Inc.*
|
800
|
80,176
|
||||||
|
Fiserv, Inc.*
|
2,300
|
189,474
|
||||||
|
Gartner, Inc.*
|
1,900
|
301,150
|
||||||
|
Global Payments, Inc.
|
2,000
|
254,800
|
||||||
|
Jack Henry & Associates, Inc.
|
1,700
|
272,136
|
||||||
|
ManTech International Corporation, Class A
|
900
|
56,970
|
||||||
|
MasterCard, Inc., Class A
|
4,200
|
934,962
|
||||||
|
Paychex, Inc.
|
3,800
|
279,870
|
||||||
|
PayPal Holdings, Inc.*
|
11,900
|
1,045,296
|
||||||
|
Perspecta, Inc.
|
450
|
11,574
|
||||||
|
Shopify, Inc., Class A*
|
600
|
98,676
|
||||||
|
Square, Inc., Class A*
|
12,600
|
1,247,526
|
||||||
|
Twilio, Inc., Class A*
|
4,700
|
405,516
|
||||||
|
VeriSign, Inc.*
|
5,800
|
928,696
|
||||||
|
Visa, Inc., Class A
|
5,200
|
780,468
|
||||||
|
WEX, Inc.*
|
400
|
80,304
|
||||||
|
Wix.com, Ltd.*
|
900
|
107,730
|
||||||
|
Worldpay, Inc., Class A*
|
1,600
|
162,032
|
||||||
|
7,952,032
|
||||||||
|
Leisure Products — 0.0%
|
||||||||
|
Hasbro, Inc.
|
400
|
42,048
|
||||||
|
Life Sciences Tools & Services — 1.2%
|
||||||||
|
Bio-Techne Corporation
|
1,200
|
244,932
|
||||||
|
ICON plc*
|
1,400
|
215,250
|
||||||
|
Illumina, Inc.*
|
400
|
146,824
|
||||||
|
QIAGEN NV*
|
800
|
30,304
|
||||||
|
Thermo Fisher Scientific, Inc.
|
1,200
|
292,896
|
||||||
|
930,206
|
||||||||
|
Machinery — 0.5%
|
||||||||
|
Allison Transmission Holdings, Inc.
|
500
|
26,005
|
||||||
|
Flowserve Corporation
|
1,700
|
92,973
|
||||||
|
Ingersoll-Rand plc
|
1,200
|
122,760
|
||||||
|
PACCAR, Inc.
|
500
|
34,095
|
||||||
|
Parker-Hannifin Corporation
|
200
|
36,786
|
||||||
|
The Toro Company
|
1,800
|
107,946
|
||||||
|
420,565
|
||||||||
|
Media — 0.4%
|
||||||||
|
Comcast Corporation, Class A
|
2,100
|
74,361
|
||||||
|
Discovery, Inc., Class A*
|
600
|
19,200
|
||||||
|
Sirius XM Holdings, Inc.
|
29,400
|
185,808
|
||||||
|
279,369
|
||||||||
|
Multiline Retail — 0.7%
|
||||||||
|
Dillard’s, Inc., Class A
|
1,200
|
91,608
|
||||||
|
Dollar Tree, Inc.*
|
300
|
24,465
|
||||||
|
Kohl’s Corporation
|
600
|
44,730
|
||||||
|
Nordstrom, Inc.
|
3,100
|
185,411
|
||||||
|
Target Corporation
|
2,700
|
238,167
|
||||||
|
584,381
|
||||||||
|
Multi-Utilities — 0.1%
|
||||||||
|
Dominion Energy, Inc.
|
600
|
42,168
|
||||||
|
Oil, Gas & Consumable Fuels — 0.7%
|
||||||||
|
Anadarko Petroleum Corporation
|
600
|
40,446
|
||||||
|
Apache Corporation
|
700
|
33,369
|
||||||
|
Cameco Corporation
|
1,000
|
11,400
|
||||||
|
Carrizo Oil & Gas, Inc.*
|
1,400
|
35,280
|
||||||
|
CNOOC, Ltd. — SP-ADR
|
200
|
39,508
|
||||||
|
ConocoPhillips
|
600
|
46,440
|
||||||
|
Devon Energy Corporation
|
800
|
31,952
|
||||||
|
EOG Resources, Inc.
|
700
|
89,299
|
||||||
|
Hess Corporation
|
1,100
|
78,738
|
||||||
|
Noble Energy, Inc.
|
1,000
|
31,190
|
||||||
|
Pioneer Natural Resources Company
|
700
|
121,933
|
||||||
|
559,555
|
||||||||
The accompanying notes are an integral part of these financial statements.
11
Reynolds Blue Chip Growth Fund
SCHEDULE OF INVESTMENTS (Continued)
September 30, 2018
|
Shares
|
Value
|
|||||||
|
LONG-TERM INVESTMENTS — 96.8% (a) (Continued)
|
||||||||
|
COMMON STOCKS — 96.5% (a) (Continued)
|
||||||||
|
Personal Products — 0.0%
|
||||||||
|
Herbalife Nutrition, Ltd.*
|
600
|
$
|
32,730
|
|||||
|
Pharmaceuticals — 1.7%
|
||||||||
|
Canopy Growth Corporation*
|
2,600
|
126,464
|
||||||
|
Cronos Group, Inc.*
|
2,400
|
26,688
|
||||||
|
Eli Lilly and Company
|
3,300
|
354,123
|
||||||
|
Endocyte, Inc.*
|
600
|
10,656
|
||||||
|
GW Pharmaceuticals plc — ADR*
|
300
|
51,822
|
||||||
|
Jazz Pharmaceuticals plc*
|
200
|
33,626
|
||||||
|
Johnson & Johnson
|
1,200
|
165,804
|
||||||
|
Merck & Company, Inc.
|
2,000
|
141,880
|
||||||
|
Nektar Therapeutics*
|
500
|
30,480
|
||||||
|
Pfizer, Inc.
|
3,300
|
145,431
|
||||||
|
Shire plc — ADR
|
400
|
72,508
|
||||||
|
Tilray, Inc., Class 2*
|
1,450
|
208,249
|
||||||
|
1,367,731
|
||||||||
|
Professional Services — 0.6%
|
||||||||
|
Verisk Analytics, Inc.*
|
3,600
|
433,980
|
||||||
|
REITs — 0.3%
|
||||||||
|
Boston Properties, Inc.
|
300
|
36,927
|
||||||
|
Extra Space Storage, Inc.
|
200
|
17,328
|
||||||
|
Simon Property Group, Inc.
|
600
|
106,050
|
||||||
|
STORE Capital Corporation
|
1,400
|
38,906
|
||||||
|
Uniti Group, Inc.
|
1,500
|
30,225
|
||||||
|
229,436
|
||||||||
|
Road & Rail — 0.2%
|
||||||||
|
CSX Corporation
|
500
|
37,025
|
||||||
|
Landstar System, Inc.
|
500
|
61,000
|
||||||
|
Old Dominion Freight Line, Inc.
|
300
|
48,378
|
||||||
|
146,403
|
||||||||
|
Semiconductors & Semiconductor
|
||||||||
|
Equipment — 3.9%
|
||||||||
|
Advanced Micro Devices, Inc.*
|
27,900
|
861,831
|
||||||
|
Analog Devices, Inc.
|
557
|
51,500
|
||||||
|
ASML Holding N.V.
|
200
|
37,604
|
||||||
|
Brooks Automation, Inc.
|
900
|
31,527
|
||||||
|
Integrated Device Technology, Inc.*
|
1,900
|
89,319
|
||||||
|
Maxim Integrated Products, Inc.
|
800
|
45,112
|
||||||
|
Microchip Technology, Inc.
|
1,000
|
78,910
|
||||||
|
NVIDIA Corporation
|
6,350
|
1,784,477
|
||||||
|
Universal Display Corporation
|
900
|
106,110
|
||||||
|
3,086,390
|
||||||||
|
Software — 14.3%
|
||||||||
|
Adobe Systems, Inc.*
|
4,500
|
1,214,775
|
||||||
|
Altair Engineering, Inc., Class A*
|
600
|
26,070
|
||||||
|
ANSYS, Inc.*
|
500
|
93,340
|
||||||
|
Aspen Technology, Inc.*
|
3,700
|
421,467
|
||||||
|
Autodesk, Inc.*
|
2,100
|
327,831
|
||||||
|
Bottomline Technologies (DE), Inc.*
|
2,800
|
203,588
|
||||||
|
Box, Inc., Class A*
|
2,500
|
59,775
|
||||||
|
Check Point Software Technologies, Ltd.*
|
800
|
94,136
|
||||||
|
Citrix Systems, Inc.*
|
2,400
|
266,784
|
||||||
|
CyberArk Software, Ltd.*
|
1,100
|
87,824
|
||||||
|
DocuSign, Inc.*
|
1,200
|
63,084
|
||||||
|
Dropbox, Inc., Class A*
|
1,600
|
42,928
|
||||||
|
Fair Isaac Corporation*
|
1,200
|
274,260
|
||||||
|
Fortinet, Inc.*
|
14,700
|
1,356,369
|
||||||
|
Intuit, Inc.
|
1,400
|
318,360
|
||||||
|
Microsoft Corporation
|
8,500
|
972,145
|
||||||
|
NICE, Ltd. — SP-ADR*
|
700
|
80,129
|
||||||
|
Paycom Software, Inc.*
|
4,500
|
699,345
|
||||||
|
Paylocity Holding Corporation*
|
2,300
|
184,736
|
||||||
|
PTC, Inc.*
|
1,100
|
116,809
|
||||||
|
Red Hat, Inc.*
|
600
|
81,768
|
||||||
|
Salesforce.com, Inc.*
|
12,700
|
2,019,681
|
||||||
|
ServiceNow, Inc.*
|
400
|
78,252
|
||||||
|
Splunk, Inc.*
|
2,100
|
253,911
|
||||||
|
Tableau Software, Inc., Class A*
|
800
|
89,392
|
||||||
|
The Trade Desk, Inc., Class A*
|
2,000
|
301,820
|
||||||
|
The Ultimate Software Group, Inc.*
|
1,450
|
467,176
|
||||||
|
Varonis Systems, Inc.*
|
500
|
36,625
|
||||||
|
VMware, Inc., Class A*
|
4,500
|
702,270
|
||||||
|
Workday, Inc., Class A*
|
2,600
|
379,548
|
||||||
|
Zscaler, Inc.*
|
600
|
24,468
|
||||||
|
11,338,666
|
||||||||
|
Specialty Retail — 4.5%
|
||||||||
|
AutoZone, Inc.*
|
200
|
155,140
|
||||||
|
Best Buy Company, Inc.
|
6,600
|
523,776
|
||||||
|
CarMax, Inc.*
|
1,000
|
74,670
|
||||||
|
Five Below, Inc.*
|
3,400
|
442,204
|
||||||
|
Lowe’s Companies, Inc.
|
6,700
|
769,294
|
||||||
|
O’Reilly Automotive, Inc.*
|
200
|
69,464
|
||||||
|
Ross Stores, Inc.
|
5,400
|
535,140
|
||||||
|
The Home Depot, Inc.
|
3,500
|
725,025
|
||||||
|
The TJX Companies, Inc.
|
1,300
|
145,626
|
||||||
|
Tiffany & Company
|
300
|
38,691
|
||||||
|
Ulta Beauty, Inc.*
|
300
|
84,636
|
||||||
|
3,563,666
|
||||||||
|
Technology Hardware, Storage
|
||||||||
|
& Peripherals — 3.7%
|
||||||||
|
Apple, Inc.
|
8,600
|
1,941,364
|
||||||
|
HP, Inc.
|
2,900
|
74,733
|
||||||
The accompanying notes are an integral part of these financial statements.
12
Reynolds Blue Chip Growth Fund
SCHEDULE OF INVESTMENTS (Continued)
September 30, 2018
|
Shares
|
Value
|
|||||||
|
LONG-TERM INVESTMENTS — 96.8% (a) (Continued)
|
||||||||
|
COMMON STOCKS — 96.5% (a) (Continued)
|
||||||||
|
Technology Hardware, Storage
|
||||||||
|
& Peripherals — 3.7% (Continued)
|
||||||||
|
NetApp, Inc.
|
9,900
|
$
|
850,311
|
|||||
|
Seagate Technology plc
|
900
|
42,615
|
||||||
|
2,909,023
|
||||||||
|
Telecommunication Services —
|
||||||||
|
Diversified — 0.1%
|
||||||||
|
Verizon Communications, Inc.
|
1,600
|
85,424
|
||||||
|
Textiles, Apparel & Luxury Goods — 0.9%
|
||||||||
|
Deckers Outdoor Corporation*
|
400
|
47,432
|
||||||
|
Fossil Group, Inc.*
|
2,700
|
62,856
|
||||||
|
Hanesbrands, Inc.
|
1,500
|
27,645
|
||||||
|
lululemon Athletica, Inc.*
|
2,000
|
324,980
|
||||||
|
NIKE, Inc., Class B
|
2,000
|
169,440
|
||||||
|
Ralph Lauren Corporation
|
300
|
41,265
|
||||||
|
673,618
|
||||||||
|
Trading Companies & Distributors — 0.1%
|
||||||||
|
HD Supply Holdings, Inc.*
|
1,000
|
42,790
|
||||||
|
United Rentals, Inc.*
|
400
|
65,440
|
||||||
|
108,230
|
||||||||
|
Wireless Telecommunication Services — 0.0%
|
||||||||
|
T-Mobile US, Inc.*
|
600
|
42,108
|
||||||
|
TOTAL COMMON STOCKS
|
||||||||
|
(cost $53,335,593)
|
76,377,197
|
|||||||
|
CLOSED-END FUNDS — 0.3% (a)
|
||||||||
|
Altaba, Inc.*
|
3,700
|
252,044
|
||||||
|
TOTAL CLOSED-END FUNDS
|
||||||||
|
(cost $276,451)
|
252,044
|
|||||||
|
SHORT-TERM INVESTMENTS — 1.3% (a)
|
||||||||
|
MONEY MARKET FUNDS — 1.3%
|
||||||||
|
First American Government Obligations Fund,
|
||||||||
|
Institutional Share Class, 1.98%^
|
1,062,058
|
1,062,058
|
||||||
|
TOTAL MONEY MARKET FUNDS
|
||||||||
|
(cost $1,062,058)
|
1,062,058
|
|||||||
|
TOTAL INVESTMENTS — 98.1%
|
||||||||
|
(cost $54,674,102)
|
77,691,299
|
|||||||
|
Cash and receivables, less liabilities — 1.9% (a)
|
1,502,769
|
|||||||
|
TOTAL NET ASSETS — 100.0%
|
$
|
79,194,068
|
||||||
|
^
|
Rate shown in the 7-day effective yield September 30, 2018.
|
|
|
*
|
Non-income producing security.
|
|
|
(a)
|
Percentages for the various classifications relate to net assets.
|
ADR – Unsponsored American Depositary Receipt
N.V. – Dutch Public Limited Liability Company
plc – Public Limited Company
REITs – Real Estate Investment Trusts
S.A. – Société Anonyme
SP-ADR – Sponsored American Depositary Receipt
The Global Industry Classification Standard (“GICS®”) was developed by and/or is the exclusive property of MSCI, Inc. and Standard & Poor’s Financial Services LLC (“S&P”). GICS® is a service mark of MSCI & S&P and has been licensed for use by Fund Services. For presentation purposes, the Fund has grouped some of the industry categories. For purposes of categorizing securities for compliance with Section 8(b)(1) of the Investment Company Act of 1940, the Fund uses more specific industry classifications.
The accompanying notes are an integral part of these financial statements.
13
Reynolds Blue Chip Growth Fund
STATEMENT OF OPERATIONS
For the Year Ended September 30, 2018
|
INVESTMENT INCOME:
|
||||
|
Dividends (net of foreign withholding tax of $1,252)
|
$
|
417,454
|
||
|
Interest
|
23,623
|
|||
|
Total investment income
|
441,077
|
|||
|
EXPENSES:
|
||||
|
Management fees
|
739,234
|
|||
|
Distribution fees
|
104,287
|
|||
|
Transfer agent fees
|
95,004
|
|||
|
Custodian fees
|
87,472
|
|||
|
Administrative services
|
82,364
|
|||
|
Professional fees
|
56,007
|
|||
|
Shareholder servicing fees
|
55,670
|
|||
|
Insurance expense
|
54,889
|
|||
|
Accounting services
|
51,084
|
|||
|
Registration fees
|
30,368
|
|||
|
Board of Directors fees
|
28,000
|
|||
|
Chief Compliance Officer fees
|
25,500
|
|||
|
Printing and postage expense
|
17,298
|
|||
|
Other expenses
|
18,811
|
|||
|
Total expenses
|
1,445,988
|
|||
|
NET INVESTMENT LOSS
|
(1,004,911
|
)
|
||
|
NET REALIZED GAIN ON INVESTMENTS
|
12,873,152
|
|||
|
NET CHANGE IN UNREALIZED APPRECIATION ON INVESTMENTS
|
6,803,634
|
|||
|
NET GAIN ON INVESTMENTS
|
19,676,786
|
|||
|
NET INCREASE IN NET ASSETS RESULTING FROM OPERATIONS
|
$
|
18,671,875
|
||
STATEMENTS OF CHANGES IN NET ASSETS
For the Years Ended September 30, 2018 and 2017
|
2018
|
2017
|
|||||||
|
OPERATIONS:
|
||||||||
|
Net investment loss
|
$
|
(1,004,911
|
)
|
$
|
(624,708
|
)
|
||
|
Net realized gain on investments
|
12,873,152
|
8,162,852
|
||||||
|
Net change in unrealized appreciation on investments
|
6,803,634
|
3,194,285
|
||||||
|
Net increase in net assets resulting from operations
|
18,671,875
|
10,732,429
|
||||||
|
DISTRIBUTIONS TO SHAREHOLDERS:
|
||||||||
|
Distributions(1)
|
(5,374,980
|
)
|
(6,090,037
|
)
|
||||
|
FUND SHARE ACTIVITIES:
|
||||||||
|
Proceeds from shares issued (61,094 and 46,615 shares, respectively)
|
3,747,615
|
2,494,317
|
||||||
|
Net asset value of shares issued in distributions reinvested (92,258 and 119,480 shares, respectively)
|
5,236,557
|
5,884,416
|
||||||
|
Cost of shares redeemed (206,881 and 453,557 shares, respectively)
|
(12,581,269
|
)
|
(23,988,143
|
)
|
||||
|
Net decrease in net assets derived from Fund share activities
|
(3,597,097
|
)
|
(15,609,410
|
)
|
||||
|
TOTAL INCREASE (DECREASE) IN NET ASSETS
|
9,699,798
|
(10,967,018
|
)
|
|||||
|
NET ASSETS AT THE BEGINNING OF THE YEAR
|
69,494,270
|
80,461,288
|
||||||
|
NET ASSETS AT THE END OF THE YEAR(1)
|
$
|
79,194,068
|
$
|
69,494,270
|
||||
|
(1)
|
2017 net capital gain distributions and accumulated net investment loss were $6,090,037 and $(9,543), respectively.
|
The accompanying notes are an integral part of these financial statements.
14
Reynolds Blue Chip Growth Fund
FINANCIAL HIGHLIGHTS
(Selected data for each share of the Fund outstanding throughout each year)
|
Year Ended September 30,
|
||||||||||||||||||||
|
2018
|
2017
|
2016
|
2015
|
2014
|
||||||||||||||||
|
PER SHARE OPERATING PERFORMANCE:
|
||||||||||||||||||||
|
Net asset value, beginning of year
|
$
|
57.33
|
$
|
53.65
|
$
|
56.84
|
$
|
75.86
|
$
|
71.45
|
||||||||||
|
Income from investment operations:
|
||||||||||||||||||||
|
Net investment loss(1)
|
(0.84
|
)
|
(0.46
|
)
|
(0.49
|
)
|
(0.49
|
)
|
(0.49
|
)
|
||||||||||
|
Net realized and unrealized gains on investments
|
16.46
|
8.57
|
0.94
|
0.40
|
8.28
|
|||||||||||||||
|
Total from investment operations
|
15.62
|
8.11
|
0.45
|
(0.09
|
)
|
7.79
|
||||||||||||||
|
Less distributions:
|
||||||||||||||||||||
|
Distributions from net capital gains
|
(4.60
|
)
|
(4.43
|
)
|
(3.64
|
)
|
(18.93
|
)
|
(3.38
|
)
|
||||||||||
|
Total from distributions
|
(4.60
|
)
|
(4.43
|
)
|
(3.64
|
)
|
(18.93
|
)
|
(3.38
|
)
|
||||||||||
|
Net asset value, end of year
|
$
|
68.35
|
$
|
57.33
|
$
|
53.65
|
$
|
56.84
|
$
|
75.86
|
||||||||||
|
TOTAL RETURN
|
28.88
|
%
|
16.44
|
%
|
0.48
|
%
|
(1.00
|
%)
|
11.01
|
%
|
||||||||||
|
RATIOS/SUPPLEMENTAL DATA:
|
||||||||||||||||||||
|
Net assets, end of year (in 000’s)
|
$
|
79,194
|
$
|
69,494
|
$
|
80,461
|
$
|
114,340
|
$
|
162,930
|
||||||||||
|
Ratio of expenses to average net assets
|
1.96
|
%
|
1.97
|
%
|
1.86
|
%
|
1.71
|
%
|
1.59
|
%
|
||||||||||
|
Ratio of net investment loss to average net assets
|
(1.36
|
%)
|
(0.87
|
%)
|
(0.90
|
%)
|
(0.77
|
%)
|
(0.65
|
%)
|
||||||||||
|
Portfolio turnover rate
|
476
|
%
|
343
|
%
|
491
|
%
|
272
|
%
|
102
|
%
|
||||||||||
|
(1)
|
Amount calculated based on average shares outstanding throughout the year.
|
The accompanying notes are an integral part of these financial statements.
NOTES TO FINANCIAL STATEMENTS
September 30, 2018
|
(1)
|
Summary of Significant Accounting Policies —
|
|
The following is a summary of significant accounting policies of the Reynolds Funds, Inc. (the “Company”), which is registered as a diversified, open-end management investment company under the Investment Company Act of 1940 (the “Act”), as amended. This Company consists of one fund: the Reynolds Blue Chip Growth Fund (the “Fund”). The Company was incorporated under the laws of Maryland on April 28, 1988. The Fund is an investment company and accordingly follows the investment company accounting and reporting guidance of the Financial Accounting Standards Board (“FASB”) Accounting Standards Codification Topic 946 Financial Services – Investment Companies.
|
|
|
The investment objective of the Fund is to produce long-term growth of capital by investing in a diversified portfolio of common stocks issued by well-established growth companies commonly referred to as “blue chip” companies, as defined in the prospectus.
|
|
|
The following is a summary of the Fund’s pricing procedures. It is intended to be a general discussion and may not necessarily reflect all pricing procedures followed by the Fund.
|
|
|
(a) Each security, excluding short-term investments and closed-end funds, is valued at the last sale price reported by the principal security exchange on which the issue is traded (other than The Nasdaq OMX Group, Inc., referred to as “Nasdaq”), or if no sale is reported, the latest bid price. Securities which are traded on Nasdaq (including closed-end funds) under one of its three listing tiers, Nasdaq Global Market, Nasdaq Global Select Market and Nasdaq Capital Market, are valued at
|
15
Reynolds Blue Chip Growth Fund
NOTES TO FINANCIAL STATEMENTS (Continued)
September 30, 2018
|
(1)
|
Summary of Significant Accounting Policies — (Continued)
|
|
the Nasdaq Official Closing Price, or if no sale is reported, the latest bid price. Short-term investments with maturities of 60 days or less may be valued on an amortized cost basis to the extent it is equivalent to fair value, which involves valuing an instrument at its cost and thereafter assuming a constant amortization to maturity of any discount or premium, regardless of the impact of fluctuating rates on the fair value of the instrument. Amortized cost will not be used if its use would be inappropriate due to credit or other impairments of the issuer. Money market funds are valued at their net asset value per share. Securities for which quotations are not readily available are valued at fair value as determined by the investment adviser under the supervision of the Board of Directors. The fair value of a security is the amount which the Fund might receive upon a current sale. The fair value of a security may differ from the last quoted price and the Fund may not be able to sell a security at the fair value. Market quotations may not be available, for example, if trading in particular securities was halted during the day and not resumed prior to the close of trading on the New York Stock Exchange.
|
|
|
Under accounting principles generally accepted in the United States of America (“GAAP”), fair value is defined as the price that would be received to sell an asset or paid to transfer a liability (i.e., the “exit price”) in an orderly transaction between market participants at the measurement date.
|
|
|
In determining fair value, the Fund uses various valuation approaches. GAAP establishes a fair value hierarchy for inputs used in measuring fair value that maximizes the use of observable inputs and minimizes the use of unobservable inputs by generally requiring that the most observable inputs be used when available. Observable inputs are those that market participants would use in pricing the asset or liability based on market data obtained from sources independent of the Fund. Unobservable inputs reflect the Fund’s assumptions about the inputs market participants would use in pricing the asset or liability developed based on the best information available in the circumstances. The inputs or methodologies used for valuing securities are not necessarily an indication of the risks associated with investing in those securities.
|
|
|
The fair value hierarchy is categorized into three levels based on the inputs as follows:
|
|
Level 1—
|
Valuations based on unadjusted quoted prices in active markets for identical assets that the Fund has the ability to access.
|
|
|
Level 2—
|
Valuations based on quoted prices for similar securities or in markets that are not active or for which all significant inputs are observable, either directly or indirectly.
|
|
|
Level 3—
|
Valuations based on inputs that are unobservable and significant to the overall fair value measurement.
|
|
The following table summarizes the Fund’s investments as of September 30, 2018, based on the inputs used to value them:
|
|
Valuation Inputs
|
Investments in Securities
|
||||||
|
Level 1—
|
Common Stock*
|
$
|
76,377,197
|
||||
|
Closed-End Funds
|
252,044
|
||||||
|
Money Market Funds
|
1,062,058
|
||||||
|
Total Level 1
|
77,691,299
|
||||||
|
Level 2—
|
None
|
—
|
|||||
|
Level 3—
|
None
|
—
|
|||||
|
Total
|
$
|
77,691,299
|
|||||
|
* Please refer to the Schedule of Investments to view common stocks segregated by industry type.
|
|
|
It is the Fund’s policy to recognize transfers between levels at the end of the reporting period. For the year ended September 30, 2018, there were no transfers between levels. The Fund did not invest in any Level 3 securities during the year.
|
|
|
(b) Investment transactions are accounted for on a trade date basis for financial reporting purposes. Net realized gains and losses on sales of securities are computed on the highest amortized cost basis.
|
16
Reynolds Blue Chip Growth Fund
NOTES TO FINANCIAL STATEMENTS (Continued)
September 30, 2018
|
(1)
|
Summary of Significant Accounting Policies — (Continued)
|
|
(c) The Fund records dividend income on the ex-dividend date and interest income on an accrual basis. Withholding taxes on foreign dividends have been provided for in accordance with the Fund’s understanding of the applicable country’s tax rules and regulations.
|
|
|
(d) GAAP requires that certain components of net assets relating to permanent differences be reclassified between financial and tax reporting. These reclassifications have no effect on net assets or net asset value per share. The primary reason for this adjustment is because of equalization. For the year ended September 30, 2018, the following table shows the reclassifications made:
|
|
Distributable Earnings
|
Capital Stock
|
|
|
$(742,588)
|
$742,588
|
|
(e) The preparation of financial statements in conformity with GAAP requires management to make estimates and assumptions that affect the reported amounts of assets and liabilities and disclosure of contingent assets and liabilities at the date of the financial statements and the reported amounts of revenues and expenses during the reporting period. Actual results could differ from these estimates.
|
|
|
(f) No provision has been made for Federal income taxes since the Fund has elected to be taxed as a “regulated investment company” and intends to distribute substantially all net investment company taxable income and net capital gains to shareholders and otherwise comply with the provisions of the Internal Revenue Code applicable to regulated investment companies. The Fund may utilize earnings and profits distributed to shareholders on redemption of shares as part of the dividends paid deduction.
|
|
|
(g) The Fund has reviewed all open tax years and major jurisdictions, which include Federal and the state of Maryland, and concluded that there are no significant uncertain tax positions that would require recognition in the financial statements as of and for the year ended September 30, 2018. Open tax years are those that are open for exam by taxing authorities and, as of September 30, 2018, open Federal tax years include the tax years ended September 30, 2015 through 2018. The Fund recognizes interest and penalties, if any, related to unrecognized tax benefits as income tax expense in the Fund’s Statement of Operations. During the year ended September 30, 2018, the Fund did not incur any interest or penalties. The Fund has no examinations in progress and is also not aware of any tax positions for which it is reasonably possible that the total amounts of unrecognized tax benefits will significantly change in the next twelve months.
|
|
|
(h) The Fund’s cash is held in accounts with balances which may exceed the amount of related federal insurance. The Fund has not experienced any loss in such accounts and believes it is not exposed to significant credit risk.
|
|
|
(2)
|
Investment Advisory Agreement and Transactions With Related Parties —
|
|
The Fund has an advisory agreement with Reynolds Capital Management, LLC (“RCM”), to serve as investment adviser. The sole owner of RCM is Mr. Frederick L. Reynolds. Mr. Reynolds is also an officer and interested director of the Fund. Under the terms of the agreement, the Fund will pay RCM a monthly management fee at the annual rate of 1.00% of the daily net assets.
|
|
|
The agreement further stipulates that RCM will reimburse the Fund for all expenses exceeding 2.00% of its daily average net assets (excluding interest, taxes, brokerage commissions and extraordinary items). The Fund is not obligated to reimburse RCM for any expenses reimbursed in previous fiscal years. No such reimbursements were required for the year ended September 30, 2018.
|
|
|
The Fund has adopted a Service and Distribution Plan (the “Plan”) pursuant to Rule 12b-1 under the Act. The Plan provides that the Fund may incur certain costs which may not exceed a maximum amount equal to 0.25% per annum of the Fund’s average daily net assets. Payments made pursuant to the Plan may only be used to pay distribution expenses incurred in the current year, and may be less than the maximum amount allowed by the Plan.
|
17
Reynolds Blue Chip Growth Fund
NOTES TO FINANCIAL STATEMENTS (Continued)
September 30, 2018
|
(2)
|
Investment Advisory Agreement and Transactions With Related Parties — (Continued)
|
|
Under the Fund’s organizational documents, each director, officer, employee or other agent of the Fund (including the Fund’s investment manager) is indemnified, to the extent permitted by the Act, against certain liabilities that may arise out of performance of their duties to the Fund. Additionally, in the normal course of business, the Fund enters into contracts that contain a variety of indemnification clauses. The Fund’s maximum exposure under these arrangements is unknown as this would involve future claims that may be made against the Fund that have not yet occurred. However, the Fund has not had prior claims or losses pursuant to these contracts and believes the risk of loss to be remote.
|
|
|
(3)
|
Distributions to Shareholders —
|
|
Net investment income and net realized gains, if any, for the Fund are distributed to shareholders at least annually and are recorded on the ex-dividend date. Please see Note 5 for more information.
|
|
|
(4)
|
Investment Transactions —
|
|
For the year ended September 30, 2018, purchases and proceeds of sales of investment securities (excluding short-term securities) were $342,187,647 and $351,927,229, respectively. There were no purchases or sales of U.S. Government securities.
|
|
|
(5)
|
Income Tax Information —
|
|
The following information for the Fund is presented on an income tax basis as of September 30, 2018:
|
|
Tax cost of investments
|
$
|
56,008,993
|
|||
|
Gross tax unrealized appreciation
|
$
|
23,407,745
|
|||
|
Gross tax unrealized depreciation
|
(1,725,439
|
)
|
|||
|
Net unrealized appreciation
|
21,682,306
|
||||
|
Distributable ordinary income
|
4,352,817
|
||||
|
Distributable long term capital gains
|
6,173,825
|
||||
|
Other accumulated gain
|
—
|
||||
|
Total distributable earnings
|
$
|
32,208,948
|
|
The difference between the cost amount for financial statement and federal income tax purposes is due primarily to timing differences in recognizing certain gains and losses in security transactions.
|
|
|
The tax components of dividends paid during the years ended September 30, 2018 and 2017:
|
|
September 30, 2018
|
September 30, 2017
|
||||
|
Ordinary Income
|
Long-Term Capital
|
Ordinary Income
|
Long-Term Capital
|
||
|
Distributions
|
Gains Distributions
|
Distributions
|
Gains Distributions
|
||
|
$1,755,353
|
$3,619,627
|
$—
|
$6,090,037
|
||
|
The Fund designated as long-term capital gain dividend, pursuant to Internal Revenue Code Section 852(b)(3), the amount necessary to reduce the earnings and profits of the Fund related to net capital gain to zero for the tax year ended September 30, 2018.
|
|
|
As of September 30, 2018, the Fund did not have a post-October capital loss, late year ordinary loss or a capital loss carryforward.
|
18
Reynolds Blue Chip Growth Fund
NOTES TO FINANCIAL STATEMENTS (Continued)
September 30, 2018
|
(6)
|
Subsequent Events —
|
|
Management has evaluated events and transactions after September 30, 2018 through the date that the financial statements were issued, and has determined that no additional disclosure in the financial statements is required.
|
19
Reynolds Blue Chip Growth Fund
REPORT OF INDEPENDENT REGISTERED PUBLIC ACCOUNTING FIRM
To the Shareholders and Board of Directors of
Reynolds Funds, Inc.
Opinion on the Financial Statements
We have audited the accompanying statement of assets and liabilities, including the schedule of investments, of Reynolds Funds, Inc. comprising Reynolds Blue Chip Growth Fund (the “Fund”) as of September 30, 2018, and the related statement of operations for the year then ended, the statements of changes in net assets for each of the two years in the period then ended, including the related notes, and the financial highlights for each of the five years in the period then ended (collectively referred to as the “financial statements”). In our opinion, the financial statements present fairly, in all material respects, the financial position of the Fund as of September 30, 2018, the results of its operations for the year then ended, the changes in its net assets for each of the two years in the period then ended, and the financial highlights for each of the five years in the period then ended, in conformity with accounting principles generally accepted in the United States of America.
Basis for Opinion
These financial statements are the responsibility of the Fund’s management. Our responsibility is to express an opinion on the Fund’s financial statements based on our audits. We are a public accounting firm registered with the Public Company Accounting Oversight Board (United States) (“PCAOB”) and are required to be independent with respect to the Fund in accordance with the U.S. federal securities laws and the applicable rules and regulations of the Securities and Exchange Commission and the PCAOB.
We conducted our audits in accordance with the standards of the PCAOB. Those standards require that we plan and perform the audit to obtain reasonable assurance about whether the financial statements are free of material misstatement, whether due to error or fraud.
Our audits included performing procedures to assess the risks of material misstatement of the financial statements, whether due to error or fraud, and performing procedures that respond to those risks. Such procedures included examining, on a test basis, evidence regarding the amounts and disclosures in the financial statements. Our procedures included confirmation of securities owned as of September 30, 2018, by correspondence with the custodian and brokers. Our audits also included evaluating the accounting principles used and significant estimates made by management, as well as evaluating the overall presentation of the financial statements. We believe that our audits provide a reasonable basis for our opinion.
We have served as the Fund’s auditor since 2009.

COHEN & COMPANY, LTD.
Milwaukee, Wisconsin
November 27, 2018
20
Reynolds Blue Chip Growth Fund
DIRECTORS AND OFFICERS
(Unaudited)
|
Term of
|
|
# of Funds
|
Other
|
||
|
|
Position(s)
|
Office and
|
in Complex
|
Directorships
|
|
|
Name, Age
|
Held with
|
Length of
|
Principal Occupation(s)
|
Overseen
|
Held by Director
|
|
and Address
|
the Fund
|
Time Served
|
During Past Five Years
|
by Director
|
or Officer
|
|
Non-Interested Directors:
|
|||||
|
Thomas F. Gilbertson, 75
|
Director
|
Indefinite term
|
Mr. Gilbertson is an entrepreneur that
|
1
|
None
|
|
c/o Reynolds Capital
|
since March
|
previously owned and operated
|
|||
|
Management, LLC
|
2015
|
restaurants in Naples, Florida.
|
|||
|
7652 Las Vegas
|
|||||
|
Boulevard #1
|
|||||
|
Las Vegas, NV 89123
|
|||||
|
Robert E. Stauder, 88
|
Director
|
Indefinite term
|
Mr. Stauder is retired. He was a principal of
|
1
|
None
|
|
c/o Reynolds Capital
|
since 1988
|
Robinson Mills + Williams, an architectural
|
|||
|
Management, LLC
|
and interior design firm, from 1991 until 1996.
|
||||
|
7652 Las Vegas
|
|||||
|
Boulevard #1
|
|||||
|
Las Vegas, NV 89123
|
|||||
|
Interested Director:
|
|||||
|
Frederick L. Reynolds,* 76
|
Director,
|
Indefinite term
|
Mr. Reynolds is the sole owner of
|
1
|
None
|
|
Reynolds Capital
|
since 1988
|
the Adviser, which business commenced in 1985.
|
|||
|
Management, LLC
|
|||||
|
7652 Las Vegas
|
President
|
One year term
|
|||
|
Boulevard #1
|
and
|
since 1988
|
|||
|
Las Vegas, NV 89123
|
Treasurer
|
||||
|
Other Officer:
|
|||||
|
Chad Bitterman, 46
|
Chief
|
At discretion
|
Mr. Bitterman has been a Compliance Officer
|
N/A
|
None
|
|
Northern Lights
|
Compliance
|
of Board
|
for Northern Lights Compliance Services, LLC
|
||
|
Compliance Services, LLC
|
Officer
|
since 2016
|
since 2010.
|
||
|
17605 Wright Street
|
|||||
|
Omaha, NE 68130
|
__________
|
*
|
Mr. Reynolds is the only interested director of the Company as that term is defined in the Investment Company Act of 1940. Mr. Reynolds is an interested director of the Company by reason of his being an officer of the Company and the sole owner of the investment adviser.
|
For additional information about the Directors and Officers or for a description of the policies and procedures that the Fund uses to determine how to vote proxies relating to portfolio securities, please call (800) 773-9665 and request a Statement of Additional Information. One will be mailed to you free of charge. The Statement of Additional Information is also available on the website of the Securities and Exchange Commission (the “Commission”) at http://www.sec.gov. Information on how the Fund voted proxies relating to portfolio securities is available on the Fund’s website at http://www.reynoldsfunds.com and on the website of the Commission no later than August 31 for the prior 12 months ending June 30. The Fund files its complete schedule of portfolio holdings with the Commission for the first and third quarters of each fiscal year on Form N-Q. The Fund’s Form N-Q is available on the Commission’s website. The Fund’s Forms N-Q may be reviewed and copied at the Commission’s Public Reference Room in Washington, D.C., and information on the operation of the Public Reference Room may be obtained by calling 1-800-SEC-0330.
21
Reynolds Blue Chip Growth Fund
PRIVACY POLICY
(Unaudited)
We collect the following nonpublic personal information about you:
• Information we receive from you on or in applications or other forms, correspondence or conversations.
• Information about your transactions with us, our affiliates, or others.
We do not disclose any nonpublic personal information about our current or former shareholders to anyone, except as permitted by law. For example, we are permitted by law to disclose all of the information we collect, as described above, to our transfer agent to process your transactions. Furthermore, we restrict access to your nonpublic personal information to those persons who require such information to provide products or services to you. We maintain physical, electronic and procedural safeguards that comply with federal standards to guard your nonpublic personal information.
In the event that you hold shares of the Fund through a financial intermediary, including, but not limited to, a broker-dealer, bank or trust company, the privacy policy of your financial intermediary may govern how your nonpublic personal information would be shared with nonaffiliated third parties.
HOUSEHOLDING
(Unaudited)
In an effort to decrease costs, the Fund intends to reduce the number of duplicate prospectuses and annual and semi-annual reports you receive by sending only one copy of each to those addresses shared by two or more accounts and to shareholders the Fund reasonably believes are from the same family or household. Once implemented, if you would like to discontinue householding for your accounts, please call toll-free at 1-800-773-9665 to request individual copies of these documents. Once the Fund receives notice to stop householding, the Fund will begin sending individual copies 30 days after receiving your request. This policy does not apply to account statements.
QUALIFIED DIVIDEND INCOME/DIVIDEND RECEIVED DEDUCTION
(Unaudited)
The Fund designated 36.03% of dividends declared and paid during the year ended September 30, 2018 from net investment income as qualified dividend income under the Jobs Growth and Tax Relief Reconciliation Act of 2003.
Corporate shareholders may be eligible for a dividend received deduction for certain ordinary income distributions paid by the Fund. The Fund designated 36.05% of dividends declared and paid during the year ended September 30, 2018 from net investment income as qualifying for the dividends received deduction. The deduction is a pass through of dividends paid by domestic corporations (i.e. only equities) subject to taxation.
The percentage of taxable ordinary income distributions that are designated as short-term capital gain distributions under Internal Revenue Section 871(k)(2)(c) for the Fund was 100%.
22
(This Page Intentionally Left Blank.)
REYNOLDS BLUE CHIP GROWTH FUND
c/o U.S. BANCORP FUND SERVICES, LLC
615 East Michigan Street
Milwaukee, Wisconsin 53202
www.reynoldsfunds.com
Board of Directors
THOMAS F. GILBERTSON
FREDERICK L. REYNOLDS
ROBERT E. STAUDER
Investment Adviser
REYNOLDS CAPITAL MANAGEMENT, LLC
7652 Las Vegas Boulevard S. #1
Las Vegas, Nevada 89123
Transfer Agent,
Dividend Disbursing Agent,
Administrator and Accountant
U.S. BANCORP FUND SERVICES, LLC
615 East Michigan Street
Milwaukee, Wisconsin 53202
1-800-773-9665
or 1-800-7REYNOLDS
Custodian
U.S. BANK, N.A.
1555 North RiverCenter Drive, Suite 302
Milwaukee, Wisconsin 53212
Independent Registered Public Accounting Firm
COHEN & COMPANY, LTD.
342 North Water Street, Suite 830
Milwaukee, Wisconsin 53202
Legal Counsel
FOLEY & LARDNER LLP
777 East Wisconsin Avenue
Milwaukee, Wisconsin 53202
Distributor
RAFFERTY CAPITAL MARKETS, LLC
1010 Franklin Avenue
Garden City, New York 11530
Item 2. Code of Ethics.
The registrant has adopted a code of ethics that applies to the registrant’s principal executive officer and principal financial officer. The registrant has not made any amendments to its code of ethics during the period covered by this report. The registrant has not granted any waivers from any provisions of the code of ethics during the period covered by this report.
File: A copy of the registrant’s Code of Ethics is filed herewith.
Item 3. Audit Committee Financial Expert.
The registrant’s board of directors has determined that it does not have an audit committee financial expert serving on its audit committee. At this time, the registrant believes that the experience provided by each member of the audit committee together offers the registrant adequate oversight for the registrant’s level of financial complexity.
Item 4. Principal Accountant Fees and Services.
The registrant has engaged its principal accountant to perform audit services, audit-related services, tax services and other services during the past two fiscal years. “Audit services” refer to performing an audit of the registrant's annual financial statements or services that are normally provided by the accountant in connection with statutory and regulatory filings or engagements for those fiscal years. “Audit-related services” refer to the assurance and related services by the principal accountant that are reasonably related to the performance of the audit. “Tax services” refer to professional services rendered by the principal accountant for tax compliance, tax advice, and tax planning. The following table details the aggregate fees billed or expected to be billed for each of the last two fiscal years for audit fees, audit-related fees, tax fees and other fees by the principal accountant.
|
FYE 9/30/2018
|
FYE 9/30/2017
|
|
|
Audit Fees
|
15,500
|
15,500
|
|
Audit-Related Fees
|
0
|
0
|
|
Tax Fees
|
4,000
|
4,000
|
|
All Other Fees
|
0
|
0
|
The audit committee has adopted pre-approval policies and procedures that require the audit committee to pre‑approve all audit and non‑audit services of the registrant, including services provided to any entity affiliated with the registrant.
The percentage of fees billed by Cohen Fund Audit Services, Ltd. applicable to non-audit services pursuant to waiver of pre-approval requirement were as follows:
|
FYE 9/30/2018
|
FYE 9/30/2017
|
|
|
Audit-Related Fees
|
0%
|
0%
|
|
Tax Fees
|
0%
|
0%
|
|
All Other Fees
|
0%
|
0%
|
All of the principal accountant’s hours spent on auditing the registrant’s financial statements were attributed to work performed by full‑time permanent employees of the principal accountant. (If more than 50 percent of the accountant’s hours were spent to audit the registrant's financial statements for the most recent fiscal year, state how many hours were attributed to work performed by persons other than the principal accountant's full-time, permanent employees.)
The following table indicates the non-audit fees billed or expected to be billed by the registrant’s accountant for services to the registrant and to the registrant’s investment adviser (and any other controlling entity, etc.—not sub-adviser) for the last two years. The audit committee of the board of trustees/directors has considered whether the provision of non-audit services that were rendered to the registrant's investment adviser is compatible with maintaining the principal accountant's independence and has concluded that the provision of such non-audit services by the accountant has not compromised the accountant’s independence.
|
Non-Audit Related Fees
|
FYE 9/30/2018
|
FYE 9/30/2017
|
|
Registrant
|
0
|
0
|
|
Registrant’s Investment Adviser
|
0
|
0
|
Item 5. Audit Committee of Listed Registrants.
Not applicable to registrants who are not listed issuers (as defined in Rule 10A-3 under the Securities Exchange Act of 1934).
Item 6. Investments.
(a) Schedule of Investments is included as part of the report to shareholders filed under Item 1 of this Form.
Item 7. Disclosure of Proxy Voting Policies and Procedures for Closed-End Management Investment Companies.
Not applicable to open-end investment companies.
Item 8. Portfolio Managers of Closed-End Management Investment Companies.
Not applicable to open-end investment companies.
Item 9. Purchases of Equity Securities by Closed‑End Management Investment Company and Affiliated Purchasers.
Not applicable to open-end investment companies.
Item 10. Submission of Matters to a Vote of Security Holders.
Not Applicable.
Item 11. Controls and Procedures.
|
(a)
|
The Registrant’s President and Treasurer have reviewed the Registrant's disclosure controls and procedures (as defined in Rule 30a-3(c) under the Investment Company Act of 1940 (the “Act”)) as of a date within 90 days of the filing of this report, as required by Rule 30a-3(b) under the Act and Rules 13a-15(b) or 15d‑15(b) under the Securities Exchange Act of 1934. Based on their review, such officers have concluded that the disclosure controls and procedures are effective in ensuring that information required to be disclosed in this report is appropriately recorded, processed, summarized and reported and made known to them by others within the Registrant and by the Registrant’s service provider.
|
|
(b)
|
There were no changes in the Registrant's internal control over financial reporting (as defined in Rule 30a-3(d) under the Act) that occurred during the second fiscal quarter of the period covered by this report that has materially affected, or is reasonably likely to materially affect, the Registrant's internal control over financial reporting.
|
Item 12. Exhibits.
|
(a)
|
(1) Any code of ethics or amendment thereto, that is the subject of the disclosure required by Item 2, to the extent that the registrant intends to satisfy Item 2 requirements through filing an exhibit. Filed herewith.
|
(2) A separate certification for each principal executive and principal financial officer pursuant to Section 302 of the Sarbanes-Oxley Act of 2002. Filed herewith.
(3) Any written solicitation to purchase securities under Rule 23c‑1 under the Act sent or given during the period covered by the report by or on behalf of the registrant to 10 or more persons. Not applicable to open-end investment companies.
|
(b)
|
Certifications pursuant to Section 906 of the Sarbanes‑Oxley Act of 2002. Furnished herewith.
|
SIGNATURES
Pursuant to the requirements of the Securities Exchange Act of 1934 and the Investment Company Act of 1940, the registrant has duly caused this report to be signed on its behalf by the undersigned, thereunto duly authorized.
(Registrant) Reynolds Funds, Inc.
By (Signature and Title)* /s/Frederick L. Reynolds
Frederick L. Reynolds, President and Treasurer
Date November 30, 2018
Pursuant to the requirements of the Securities Exchange Act of 1934 and the Investment Company Act of 1940, this report has been signed below by the following persons on behalf of the registrant and in the capacities and on the dates indicated.
By (Signature and Title)* /s/Frederick L. Reynolds
Frederick L. Reynolds, President and Treasurer
Date November 30, 2018
* Print the name and title of each signing officer under his or her signature.