000083125912/312021Q3false00008312592021-01-012021-09-30xbrli:shares00008312592021-10-29iso4217:USD00008312592021-09-3000008312592020-12-3100008312592021-07-012021-09-3000008312592020-07-012020-09-3000008312592020-01-012020-09-30iso4217:USDxbrli:shares0000831259fcx:CerroVerdeRoyaltyDisputeMember2021-01-012021-09-300000831259fcx:CerroVerdeRoyaltyDisputeMember2020-01-012020-09-300000831259fcx:NorthAmericaCopperMinesSegmentMember2021-01-012021-09-300000831259fcx:NorthAmericaCopperMinesSegmentMember2020-01-012020-09-300000831259fcx:SouthAmericaMinesSegmentMember2021-01-012021-09-300000831259fcx:SouthAmericaMinesSegmentMember2020-01-012020-09-300000831259fcx:GrasbergSegmentMember2021-01-012021-09-300000831259fcx:GrasbergSegmentMember2020-01-012020-09-300000831259fcx:CorporateOtherAndEliminationsIndonesiaSmelterMember2021-01-012021-09-300000831259fcx:CorporateOtherAndEliminationsIndonesiaSmelterMember2020-01-012020-09-300000831259fcx:MolybdenumMember2021-01-012021-09-300000831259fcx:MolybdenumMember2020-01-012020-09-300000831259us-gaap:AllOtherSegmentsMember2021-01-012021-09-300000831259us-gaap:AllOtherSegmentsMember2020-01-012020-09-300000831259fcx:FreeportCobaltMember2021-01-012021-09-3000008312592019-12-3100008312592020-09-300000831259us-gaap:CommonStockMember2021-06-300000831259us-gaap:AdditionalPaidInCapitalMember2021-06-300000831259us-gaap:RetainedEarningsMember2021-06-300000831259us-gaap:AccumulatedOtherComprehensiveIncomeMember2021-06-300000831259us-gaap:TreasuryStockMember2021-06-300000831259us-gaap:ParentMember2021-06-300000831259us-gaap:NoncontrollingInterestMember2021-06-3000008312592021-06-300000831259us-gaap:AdditionalPaidInCapitalMember2021-07-012021-09-300000831259us-gaap:ParentMember2021-07-012021-09-300000831259us-gaap:NoncontrollingInterestMember2021-07-012021-09-300000831259us-gaap:RetainedEarningsMember2021-07-012021-09-300000831259us-gaap:AccumulatedOtherComprehensiveIncomeMember2021-07-012021-09-300000831259us-gaap:CommonStockMember2021-09-300000831259us-gaap:AdditionalPaidInCapitalMember2021-09-300000831259us-gaap:RetainedEarningsMember2021-09-300000831259us-gaap:AccumulatedOtherComprehensiveIncomeMember2021-09-300000831259us-gaap:TreasuryStockMember2021-09-300000831259us-gaap:ParentMember2021-09-300000831259us-gaap:NoncontrollingInterestMember2021-09-300000831259us-gaap:CommonStockMember2020-06-300000831259us-gaap:AdditionalPaidInCapitalMember2020-06-300000831259us-gaap:RetainedEarningsMember2020-06-300000831259us-gaap:AccumulatedOtherComprehensiveIncomeMember2020-06-300000831259us-gaap:TreasuryStockMember2020-06-300000831259us-gaap:ParentMember2020-06-300000831259us-gaap:NoncontrollingInterestMember2020-06-3000008312592020-06-300000831259us-gaap:AdditionalPaidInCapitalMember2020-07-012020-09-300000831259us-gaap:ParentMember2020-07-012020-09-300000831259us-gaap:NoncontrollingInterestMember2020-07-012020-09-300000831259us-gaap:RetainedEarningsMember2020-07-012020-09-300000831259us-gaap:AccumulatedOtherComprehensiveIncomeMember2020-07-012020-09-300000831259us-gaap:CommonStockMember2020-09-300000831259us-gaap:AdditionalPaidInCapitalMember2020-09-300000831259us-gaap:RetainedEarningsMember2020-09-300000831259us-gaap:AccumulatedOtherComprehensiveIncomeMember2020-09-300000831259us-gaap:TreasuryStockMember2020-09-300000831259us-gaap:ParentMember2020-09-300000831259us-gaap:NoncontrollingInterestMember2020-09-300000831259us-gaap:CommonStockMember2020-12-310000831259us-gaap:AdditionalPaidInCapitalMember2020-12-310000831259us-gaap:RetainedEarningsMember2020-12-310000831259us-gaap:AccumulatedOtherComprehensiveIncomeMember2020-12-310000831259us-gaap:TreasuryStockMember2020-12-310000831259us-gaap:ParentMember2020-12-310000831259us-gaap:NoncontrollingInterestMember2020-12-310000831259us-gaap:CommonStockMember2021-01-012021-09-300000831259us-gaap:AdditionalPaidInCapitalMember2021-01-012021-09-300000831259us-gaap:ParentMember2021-01-012021-09-300000831259us-gaap:TreasuryStockMember2021-01-012021-09-300000831259us-gaap:NoncontrollingInterestMember2021-01-012021-09-300000831259us-gaap:RetainedEarningsMember2021-01-012021-09-300000831259us-gaap:AccumulatedOtherComprehensiveIncomeMember2021-01-012021-09-300000831259us-gaap:CommonStockMember2019-12-310000831259us-gaap:AdditionalPaidInCapitalMember2019-12-310000831259us-gaap:RetainedEarningsMember2019-12-310000831259us-gaap:AccumulatedOtherComprehensiveIncomeMember2019-12-310000831259us-gaap:TreasuryStockMember2019-12-310000831259us-gaap:ParentMember2019-12-310000831259us-gaap:NoncontrollingInterestMember2019-12-310000831259us-gaap:AdditionalPaidInCapitalMember2020-01-012020-09-300000831259us-gaap:ParentMember2020-01-012020-09-300000831259us-gaap:TreasuryStockMember2020-01-012020-09-300000831259us-gaap:NoncontrollingInterestMember2020-01-012020-09-300000831259us-gaap:RetainedEarningsMember2020-01-012020-09-300000831259us-gaap:AccumulatedOtherComprehensiveIncomeMember2020-01-012020-09-30xbrli:pure0000831259fcx:PTSmeltingMember2021-05-010000831259fcx:PTSmeltingMember2021-04-300000831259fcx:PTSmeltingMember2021-04-302021-04-300000831259fcx:PTSmeltingMember2021-04-300000831259fcx:KobolttiChemicalsHoldingsLimitedMember2021-09-010000831259fcx:FreeportCobaltMember2021-09-010000831259fcx:FreeportCobaltMember2021-09-012021-09-010000831259fcx:JervoisMember2021-09-010000831259fcx:JervoisMember2021-09-012021-09-010000831259fcx:FreeportCobaltMember2021-07-012021-09-300000831259fcx:NetIncomeAttributableToCommonStockMemberfcx:FreeportCobaltMember2021-07-012021-09-300000831259fcx:CopperMember2020-01-012020-09-300000831259fcx:MolybdenumMember2020-01-012020-09-30fcx:pounds00008312592021-07-012021-07-010000831259us-gaap:DomesticCountryMemberfcx:TimokLowerZoneMember2020-01-012020-09-300000831259us-gaap:ForeignCountryMember2021-01-012021-09-300000831259fcx:NetIncomeAttributableToCommonStockMemberus-gaap:ForeignCountryMember2021-01-012021-09-300000831259us-gaap:ForeignCountryMember2020-01-012020-09-300000831259fcx:NetIncomeAttributableToCommonStockMemberus-gaap:ForeignCountryMember2020-01-012020-09-300000831259fcx:AccruedInterestAndPenaltiesMember2021-07-012021-09-3000008312592021-03-012021-03-3100008312592020-10-012020-10-3100008312592020-07-012020-07-310000831259us-gaap:SeniorNotesMemberfcx:FcxMember2021-09-300000831259us-gaap:SeniorNotesMemberfcx:FcxMember2020-12-310000831259us-gaap:SubordinatedDebtMemberfcx:FreeportMcmoranCorporationMember2021-09-300000831259us-gaap:SubordinatedDebtMemberfcx:FreeportMcmoranCorporationMember2020-12-310000831259fcx:CerroVerdeMemberus-gaap:LineOfCreditMember2021-09-300000831259fcx:CerroVerdeMemberus-gaap:LineOfCreditMember2020-12-310000831259fcx:PTFITermLoanMemberus-gaap:LineOfCreditMember2021-09-300000831259fcx:PTFITermLoanMemberus-gaap:LineOfCreditMember2020-12-310000831259fcx:OtherDebtMember2021-09-300000831259fcx:OtherDebtMember2020-12-310000831259fcx:A355SeniorNotesDueMarch2022Memberfcx:CerroVerdeMemberus-gaap:LineOfCreditMember2021-09-300000831259fcx:CerroVerdeMemberfcx:A355SeniorNotesDueJune2022Memberus-gaap:LineOfCreditMember2021-09-300000831259us-gaap:RevolvingCreditFacilityMemberus-gaap:LineOfCreditMember2021-09-300000831259us-gaap:LetterOfCreditMemberus-gaap:LineOfCreditMember2021-09-300000831259fcx:Maturing2024Memberus-gaap:LineOfCreditMemberus-gaap:RevolvingCreditFacilityMember2021-09-300000831259fcx:Maturing2023Memberus-gaap:LineOfCreditMemberus-gaap:RevolvingCreditFacilityMember2021-09-3000008312592021-03-012021-06-300000831259srt:ScenarioForecastMember2021-07-012024-04-300000831259srt:ScenarioForecastMember2021-03-012024-04-300000831259fcx:UnsecuredCreditFacilityMemberus-gaap:LineOfCreditMember2021-07-310000831259fcx:PTFITermLoanMemberus-gaap:LineOfCreditMember2021-07-310000831259us-gaap:RevolvingCreditFacilityMemberus-gaap:LineOfCreditMember2021-07-310000831259fcx:PTFITermLoanMember2021-07-310000831259us-gaap:LondonInterbankOfferedRateLIBORMembersrt:MinimumMemberus-gaap:LineOfCreditMemberus-gaap:RevolvingCreditFacilityMember2021-07-012021-07-310000831259us-gaap:LondonInterbankOfferedRateLIBORMembersrt:MaximumMemberus-gaap:LineOfCreditMemberus-gaap:RevolvingCreditFacilityMember2021-07-012021-07-310000831259us-gaap:SeniorNotesMemberfcx:A355SeniorNotesDue2022Member2021-09-300000831259us-gaap:SeniorNotesMembersrt:ScenarioForecastMemberfcx:A355SeniorNotesDue2022Member2021-01-012021-12-310000831259us-gaap:SeniorNotesMemberfcx:A400SeniorNotesDue2021Member2020-09-300000831259us-gaap:SeniorNotesMemberfcx:A355SeniorNotesDue2022Member2020-09-300000831259us-gaap:SeniorNotesMemberfcx:SeniorNotesDue20233.875Member2020-09-300000831259us-gaap:SeniorNotesMemberfcx:SeniorNotesdue20244point55percentMember2020-09-300000831259us-gaap:SeniorNotesMember2020-07-012020-09-300000831259us-gaap:SeniorNotesMember2020-01-012020-09-300000831259fcx:CerroVerdeMember2021-01-012021-09-300000831259fcx:CerroVerdeMemberus-gaap:LineOfCreditMember2021-09-300000831259us-gaap:PropertyPlantAndEquipmentMember2021-07-012021-09-300000831259us-gaap:PropertyPlantAndEquipmentMember2020-07-012020-09-300000831259us-gaap:PropertyPlantAndEquipmentMember2021-01-012021-09-300000831259us-gaap:PropertyPlantAndEquipmentMember2020-01-012020-09-300000831259srt:MinimumMember2021-02-280000831259srt:MaximumMember2021-02-280000831259us-gaap:SubsequentEventMember2021-11-0100008312592021-09-222021-09-22utr:lb0000831259us-gaap:ForwardContractsMemberus-gaap:DesignatedAsHedgingInstrumentMember2020-04-012020-04-30iso4217:USDfcx:lb0000831259us-gaap:ForwardContractsMember2020-09-300000831259srt:NorthAmericaMember2020-05-012020-06-300000831259us-gaap:ForwardContractsMember2020-01-012020-06-300000831259us-gaap:CommodityContractMemberus-gaap:DesignatedAsHedgingInstrumentMember2021-01-012021-09-30iso4217:USDutr:lb0000831259us-gaap:CommodityContractMemberus-gaap:DesignatedAsHedgingInstrumentMember2021-09-300000831259us-gaap:CommodityContractMember2021-07-012021-09-300000831259us-gaap:CommodityContractMember2020-07-012020-09-300000831259us-gaap:CommodityContractMember2021-01-012021-09-300000831259us-gaap:CommodityContractMember2020-01-012020-09-300000831259us-gaap:EmbeddedDerivativeFinancialInstrumentsMemberus-gaap:ShortMemberfcx:CopperMemberus-gaap:NondesignatedMember2021-01-012021-09-300000831259us-gaap:EmbeddedDerivativeFinancialInstrumentsMemberus-gaap:ShortMemberfcx:CopperMemberus-gaap:NondesignatedMember2021-09-30utr:oz0000831259us-gaap:EmbeddedDerivativeFinancialInstrumentsMemberus-gaap:ShortMemberus-gaap:GoldMemberus-gaap:NondesignatedMember2021-01-012021-09-30iso4217:USDfcx:oz0000831259us-gaap:EmbeddedDerivativeFinancialInstrumentsMemberus-gaap:ShortMemberus-gaap:GoldMemberus-gaap:NondesignatedMember2021-09-300000831259us-gaap:EmbeddedDerivativeFinancialInstrumentsMemberus-gaap:LongMemberfcx:CopperMemberus-gaap:NondesignatedMember2021-01-012021-09-300000831259us-gaap:EmbeddedDerivativeFinancialInstrumentsMemberus-gaap:LongMemberfcx:CopperMemberus-gaap:NondesignatedMember2021-09-300000831259us-gaap:NondesignatedMemberus-gaap:ForwardContractsMember2021-01-012021-09-300000831259us-gaap:NondesignatedMemberus-gaap:ForwardContractsMember2021-09-300000831259us-gaap:SalesMemberfcx:CopperMemberus-gaap:NondesignatedMember2021-07-012021-09-300000831259us-gaap:SalesMemberfcx:CopperMemberus-gaap:NondesignatedMember2020-07-012020-09-300000831259us-gaap:SalesMemberfcx:CopperMemberus-gaap:NondesignatedMember2021-01-012021-09-300000831259us-gaap:SalesMemberfcx:CopperMemberus-gaap:NondesignatedMember2020-01-012020-09-300000831259us-gaap:SalesMemberfcx:GoldandotherMemberus-gaap:NondesignatedMember2021-07-012021-09-300000831259us-gaap:SalesMemberfcx:GoldandotherMemberus-gaap:NondesignatedMember2020-07-012020-09-300000831259us-gaap:SalesMemberfcx:GoldandotherMemberus-gaap:NondesignatedMember2021-01-012021-09-300000831259us-gaap:SalesMemberfcx:GoldandotherMemberus-gaap:NondesignatedMember2020-01-012020-09-300000831259us-gaap:CostOfSalesMemberus-gaap:NondesignatedMemberus-gaap:ForwardContractsMember2021-07-012021-09-300000831259us-gaap:CostOfSalesMemberus-gaap:NondesignatedMemberus-gaap:ForwardContractsMember2020-07-012020-09-300000831259us-gaap:CostOfSalesMemberus-gaap:NondesignatedMemberus-gaap:ForwardContractsMember2021-01-012021-09-300000831259us-gaap:CostOfSalesMemberus-gaap:NondesignatedMemberus-gaap:ForwardContractsMember2020-01-012020-09-300000831259us-gaap:CommodityContractMemberus-gaap:DesignatedAsHedgingInstrumentMember2020-12-310000831259us-gaap:EmbeddedDerivativeFinancialInstrumentsMemberus-gaap:NondesignatedMember2021-09-300000831259us-gaap:EmbeddedDerivativeFinancialInstrumentsMemberus-gaap:NondesignatedMember2020-12-310000831259us-gaap:CommodityContractMemberus-gaap:NondesignatedMemberus-gaap:ForwardContractsMember2021-09-300000831259us-gaap:CommodityContractMemberus-gaap:NondesignatedMemberus-gaap:ForwardContractsMember2020-12-310000831259us-gaap:FutureMemberfcx:FmcsCopperFuturesAndSwapContractsMemberus-gaap:NondesignatedMember2021-09-300000831259us-gaap:FutureMemberfcx:FmcsCopperFuturesAndSwapContractsMemberus-gaap:NondesignatedMember2020-12-310000831259us-gaap:EmbeddedDerivativeFinancialInstrumentsMember2021-09-300000831259us-gaap:EmbeddedDerivativeFinancialInstrumentsMember2020-12-310000831259us-gaap:CommodityContractMember2021-09-300000831259us-gaap:CommodityContractMember2020-12-310000831259fcx:NetAccountsReceivableMember2021-09-300000831259fcx:NetAccountsReceivableMember2020-12-310000831259us-gaap:OtherCurrentAssetsMember2021-09-300000831259us-gaap:OtherCurrentAssetsMember2020-12-310000831259us-gaap:AccountsPayableAndAccruedLiabilitiesMember2021-09-300000831259us-gaap:AccountsPayableAndAccruedLiabilitiesMember2020-12-310000831259us-gaap:OtherLiabilitiesMember2021-09-300000831259us-gaap:OtherLiabilitiesMember2020-12-310000831259us-gaap:BankTimeDepositsMember2021-09-300000831259us-gaap:BankTimeDepositsMember2020-12-310000831259us-gaap:CarryingReportedAmountFairValueDisclosureMemberus-gaap:EquitySecuritiesMember2021-09-300000831259us-gaap:EstimateOfFairValueFairValueDisclosureMemberus-gaap:EquitySecuritiesMember2021-09-300000831259us-gaap:FairValueInputsLevel1Memberus-gaap:EquitySecuritiesMember2021-09-300000831259us-gaap:FairValueInputsLevel2Memberus-gaap:EquitySecuritiesMember2021-09-300000831259us-gaap:EquitySecuritiesMemberus-gaap:FairValueInputsLevel3Member2021-09-300000831259us-gaap:CarryingReportedAmountFairValueDisclosureMemberus-gaap:FixedIncomeSecuritiesMember2021-09-300000831259us-gaap:EstimateOfFairValueFairValueDisclosureMemberus-gaap:FixedIncomeSecuritiesMember2021-09-300000831259us-gaap:FixedIncomeSecuritiesMemberus-gaap:FairValueMeasuredAtNetAssetValuePerShareMember2021-09-300000831259us-gaap:FairValueInputsLevel1Memberus-gaap:FixedIncomeSecuritiesMember2021-09-300000831259us-gaap:FairValueInputsLevel2Memberus-gaap:FixedIncomeSecuritiesMember2021-09-300000831259us-gaap:FixedIncomeSecuritiesMemberus-gaap:FairValueInputsLevel3Member2021-09-300000831259us-gaap:CarryingReportedAmountFairValueDisclosureMember2021-09-300000831259us-gaap:EstimateOfFairValueFairValueDisclosureMember2021-09-300000831259us-gaap:FairValueMeasuredAtNetAssetValuePerShareMember2021-09-300000831259us-gaap:FairValueInputsLevel1Member2021-09-300000831259us-gaap:FairValueInputsLevel2Member2021-09-300000831259us-gaap:FairValueInputsLevel3Member2021-09-300000831259us-gaap:CarryingReportedAmountFairValueDisclosureMemberus-gaap:USGovernmentDebtSecuritiesMember2021-09-300000831259us-gaap:EstimateOfFairValueFairValueDisclosureMemberus-gaap:USGovernmentDebtSecuritiesMember2021-09-300000831259us-gaap:FairValueMeasuredAtNetAssetValuePerShareMemberus-gaap:USGovernmentDebtSecuritiesMember2021-09-300000831259us-gaap:FairValueInputsLevel1Memberus-gaap:USGovernmentDebtSecuritiesMember2021-09-300000831259us-gaap:FairValueInputsLevel2Memberus-gaap:USGovernmentDebtSecuritiesMember2021-09-300000831259us-gaap:FairValueInputsLevel3Memberus-gaap:USGovernmentDebtSecuritiesMember2021-09-300000831259us-gaap:CorporateDebtSecuritiesMemberus-gaap:CarryingReportedAmountFairValueDisclosureMember2021-09-300000831259us-gaap:CorporateDebtSecuritiesMemberus-gaap:EstimateOfFairValueFairValueDisclosureMember2021-09-300000831259us-gaap:CorporateDebtSecuritiesMemberus-gaap:FairValueMeasuredAtNetAssetValuePerShareMember2021-09-300000831259us-gaap:FairValueInputsLevel1Memberus-gaap:CorporateDebtSecuritiesMember2021-09-300000831259us-gaap:CorporateDebtSecuritiesMemberus-gaap:FairValueInputsLevel2Member2021-09-300000831259us-gaap:CorporateDebtSecuritiesMemberus-gaap:FairValueInputsLevel3Member2021-09-300000831259us-gaap:CarryingReportedAmountFairValueDisclosureMemberus-gaap:MortgageBackedSecuritiesIssuedByUSGovernmentSponsoredEnterprisesMember2021-09-300000831259us-gaap:EstimateOfFairValueFairValueDisclosureMemberus-gaap:MortgageBackedSecuritiesIssuedByUSGovernmentSponsoredEnterprisesMember2021-09-300000831259us-gaap:FairValueMeasuredAtNetAssetValuePerShareMemberus-gaap:MortgageBackedSecuritiesIssuedByUSGovernmentSponsoredEnterprisesMember2021-09-300000831259us-gaap:FairValueInputsLevel1Memberus-gaap:MortgageBackedSecuritiesIssuedByUSGovernmentSponsoredEnterprisesMember2021-09-300000831259us-gaap:FairValueInputsLevel2Memberus-gaap:MortgageBackedSecuritiesIssuedByUSGovernmentSponsoredEnterprisesMember2021-09-300000831259us-gaap:FairValueInputsLevel3Memberus-gaap:MortgageBackedSecuritiesIssuedByUSGovernmentSponsoredEnterprisesMember2021-09-300000831259us-gaap:CarryingReportedAmountFairValueDisclosureMemberus-gaap:AssetBackedSecuritiesMember2021-09-300000831259us-gaap:EstimateOfFairValueFairValueDisclosureMemberus-gaap:AssetBackedSecuritiesMember2021-09-300000831259us-gaap:AssetBackedSecuritiesMemberus-gaap:FairValueMeasuredAtNetAssetValuePerShareMember2021-09-300000831259us-gaap:FairValueInputsLevel1Memberus-gaap:AssetBackedSecuritiesMember2021-09-300000831259us-gaap:FairValueInputsLevel2Memberus-gaap:AssetBackedSecuritiesMember2021-09-300000831259us-gaap:AssetBackedSecuritiesMemberus-gaap:FairValueInputsLevel3Member2021-09-300000831259us-gaap:CarryingReportedAmountFairValueDisclosureMemberus-gaap:MoneyMarketFundsMember2021-09-300000831259us-gaap:EstimateOfFairValueFairValueDisclosureMemberus-gaap:MoneyMarketFundsMember2021-09-300000831259us-gaap:MoneyMarketFundsMemberus-gaap:FairValueMeasuredAtNetAssetValuePerShareMember2021-09-300000831259us-gaap:FairValueInputsLevel1Memberus-gaap:MoneyMarketFundsMember2021-09-300000831259us-gaap:FairValueInputsLevel2Memberus-gaap:MoneyMarketFundsMember2021-09-300000831259us-gaap:MoneyMarketFundsMemberus-gaap:FairValueInputsLevel3Member2021-09-300000831259us-gaap:CarryingReportedAmountFairValueDisclosureMemberus-gaap:MortgageBackedSecuritiesMember2021-09-300000831259us-gaap:EstimateOfFairValueFairValueDisclosureMemberus-gaap:MortgageBackedSecuritiesMember2021-09-300000831259us-gaap:MortgageBackedSecuritiesMemberus-gaap:FairValueMeasuredAtNetAssetValuePerShareMember2021-09-300000831259us-gaap:FairValueInputsLevel1Memberus-gaap:MortgageBackedSecuritiesMember2021-09-300000831259us-gaap:FairValueInputsLevel2Memberus-gaap:MortgageBackedSecuritiesMember2021-09-300000831259us-gaap:MortgageBackedSecuritiesMemberus-gaap:FairValueInputsLevel3Member2021-09-300000831259us-gaap:CarryingReportedAmountFairValueDisclosureMemberus-gaap:MunicipalBondsMember2021-09-300000831259us-gaap:EstimateOfFairValueFairValueDisclosureMemberus-gaap:MunicipalBondsMember2021-09-300000831259us-gaap:MunicipalBondsMemberus-gaap:FairValueMeasuredAtNetAssetValuePerShareMember2021-09-300000831259us-gaap:FairValueInputsLevel1Memberus-gaap:MunicipalBondsMember2021-09-300000831259us-gaap:FairValueInputsLevel2Memberus-gaap:MunicipalBondsMember2021-09-300000831259us-gaap:MunicipalBondsMemberus-gaap:FairValueInputsLevel3Member2021-09-300000831259us-gaap:EmbeddedDerivativeFinancialInstrumentsMemberus-gaap:CarryingReportedAmountFairValueDisclosureMember2021-09-300000831259us-gaap:EmbeddedDerivativeFinancialInstrumentsMemberus-gaap:EstimateOfFairValueFairValueDisclosureMember2021-09-300000831259us-gaap:EmbeddedDerivativeFinancialInstrumentsMemberus-gaap:FairValueMeasuredAtNetAssetValuePerShareMember2021-09-300000831259us-gaap:FairValueInputsLevel1Memberus-gaap:EmbeddedDerivativeFinancialInstrumentsMember2021-09-300000831259us-gaap:EmbeddedDerivativeFinancialInstrumentsMemberus-gaap:FairValueInputsLevel2Member2021-09-300000831259us-gaap:EmbeddedDerivativeFinancialInstrumentsMemberus-gaap:FairValueInputsLevel3Member2021-09-300000831259us-gaap:CarryingReportedAmountFairValueDisclosureMemberus-gaap:ForwardContractsMember2021-09-300000831259us-gaap:EstimateOfFairValueFairValueDisclosureMemberus-gaap:ForwardContractsMember2021-09-300000831259us-gaap:ForwardContractsMemberus-gaap:FairValueMeasurementsRecurringMemberus-gaap:EstimateOfFairValueFairValueDisclosureMember2021-09-300000831259us-gaap:FairValueInputsLevel1Memberus-gaap:ForwardContractsMember2021-09-300000831259us-gaap:FairValueInputsLevel2Memberus-gaap:ForwardContractsMember2021-09-300000831259us-gaap:CarryingReportedAmountFairValueDisclosureMemberus-gaap:FutureMember2021-09-300000831259us-gaap:EstimateOfFairValueFairValueDisclosureMemberus-gaap:FutureMember2021-09-300000831259us-gaap:CommodityContractMemberus-gaap:FairValueMeasuredAtNetAssetValuePerShareMember2021-09-300000831259us-gaap:FairValueInputsLevel1Memberus-gaap:FutureMember2021-09-300000831259us-gaap:FairValueInputsLevel2Memberus-gaap:FutureMember2021-09-300000831259us-gaap:FutureMemberus-gaap:FairValueInputsLevel3Member2021-09-300000831259us-gaap:CommodityContractMemberus-gaap:CarryingReportedAmountFairValueDisclosureMemberfcx:FuturesAndSwapsMember2021-09-300000831259us-gaap:CommodityContractMemberus-gaap:EstimateOfFairValueFairValueDisclosureMemberfcx:FuturesAndSwapsMember2021-09-300000831259us-gaap:CommodityContractMemberfcx:FuturesAndSwapsMemberus-gaap:FairValueMeasuredAtNetAssetValuePerShareMember2021-09-300000831259us-gaap:FairValueInputsLevel1Memberus-gaap:CommodityContractMemberfcx:FuturesAndSwapsMember2021-09-300000831259us-gaap:CommodityContractMemberus-gaap:FairValueInputsLevel2Memberfcx:FuturesAndSwapsMember2021-09-300000831259us-gaap:CommodityContractMemberfcx:FuturesAndSwapsMemberus-gaap:FairValueInputsLevel3Member2021-09-300000831259us-gaap:CommodityContractMemberus-gaap:CarryingReportedAmountFairValueDisclosureMemberus-gaap:ForwardContractsMember2021-09-300000831259us-gaap:CommodityContractMemberus-gaap:EstimateOfFairValueFairValueDisclosureMemberus-gaap:ForwardContractsMember2021-09-300000831259us-gaap:CommodityContractMemberus-gaap:ForwardContractsMemberus-gaap:FairValueMeasuredAtNetAssetValuePerShareMember2021-09-300000831259us-gaap:FairValueInputsLevel1Memberus-gaap:CommodityContractMemberus-gaap:ForwardContractsMember2021-09-300000831259us-gaap:CommodityContractMemberus-gaap:FairValueInputsLevel2Memberus-gaap:ForwardContractsMember2021-09-300000831259us-gaap:CommodityContractMemberus-gaap:ForwardContractsMemberus-gaap:FairValueInputsLevel3Member2021-09-300000831259us-gaap:CarryingReportedAmountFairValueDisclosureMemberus-gaap:FixedIncomeSecuritiesMember2020-12-310000831259us-gaap:EstimateOfFairValueFairValueDisclosureMemberus-gaap:FixedIncomeSecuritiesMember2020-12-310000831259us-gaap:FixedIncomeSecuritiesMemberus-gaap:FairValueMeasuredAtNetAssetValuePerShareMember2020-12-310000831259us-gaap:FairValueInputsLevel1Memberus-gaap:FixedIncomeSecuritiesMember2020-12-310000831259us-gaap:FairValueInputsLevel2Memberus-gaap:FixedIncomeSecuritiesMember2020-12-310000831259us-gaap:FixedIncomeSecuritiesMemberus-gaap:FairValueInputsLevel3Member2020-12-310000831259us-gaap:CarryingReportedAmountFairValueDisclosureMemberus-gaap:EquitySecuritiesMember2020-12-310000831259us-gaap:EstimateOfFairValueFairValueDisclosureMemberus-gaap:EquitySecuritiesMember2020-12-310000831259us-gaap:EquitySecuritiesMemberus-gaap:FairValueMeasuredAtNetAssetValuePerShareMember2020-12-310000831259us-gaap:FairValueInputsLevel1Memberus-gaap:EquitySecuritiesMember2020-12-310000831259us-gaap:FairValueInputsLevel2Memberus-gaap:EquitySecuritiesMember2020-12-310000831259us-gaap:EquitySecuritiesMemberus-gaap:FairValueInputsLevel3Member2020-12-310000831259us-gaap:CarryingReportedAmountFairValueDisclosureMember2020-12-310000831259us-gaap:EstimateOfFairValueFairValueDisclosureMember2020-12-310000831259us-gaap:FairValueMeasuredAtNetAssetValuePerShareMember2020-12-310000831259us-gaap:FairValueInputsLevel1Member2020-12-310000831259us-gaap:FairValueInputsLevel2Member2020-12-310000831259us-gaap:FairValueInputsLevel3Member2020-12-310000831259us-gaap:CarryingReportedAmountFairValueDisclosureMemberus-gaap:USGovernmentDebtSecuritiesMember2020-12-310000831259us-gaap:EstimateOfFairValueFairValueDisclosureMemberus-gaap:USGovernmentDebtSecuritiesMember2020-12-310000831259us-gaap:FairValueMeasuredAtNetAssetValuePerShareMemberus-gaap:USGovernmentDebtSecuritiesMember2020-12-310000831259us-gaap:FairValueInputsLevel1Memberus-gaap:USGovernmentDebtSecuritiesMember2020-12-310000831259us-gaap:FairValueInputsLevel2Memberus-gaap:USGovernmentDebtSecuritiesMember2020-12-310000831259us-gaap:FairValueInputsLevel3Memberus-gaap:USGovernmentDebtSecuritiesMember2020-12-310000831259us-gaap:CorporateDebtSecuritiesMemberus-gaap:CarryingReportedAmountFairValueDisclosureMember2020-12-310000831259us-gaap:CorporateDebtSecuritiesMemberus-gaap:EstimateOfFairValueFairValueDisclosureMember2020-12-310000831259us-gaap:CorporateDebtSecuritiesMemberus-gaap:FairValueMeasuredAtNetAssetValuePerShareMember2020-12-310000831259us-gaap:FairValueInputsLevel1Memberus-gaap:CorporateDebtSecuritiesMember2020-12-310000831259us-gaap:CorporateDebtSecuritiesMemberus-gaap:FairValueInputsLevel2Member2020-12-310000831259us-gaap:CorporateDebtSecuritiesMemberus-gaap:FairValueInputsLevel3Member2020-12-310000831259us-gaap:CarryingReportedAmountFairValueDisclosureMemberus-gaap:MortgageBackedSecuritiesIssuedByUSGovernmentSponsoredEnterprisesMember2020-12-310000831259us-gaap:EstimateOfFairValueFairValueDisclosureMemberus-gaap:MortgageBackedSecuritiesIssuedByUSGovernmentSponsoredEnterprisesMember2020-12-310000831259us-gaap:FairValueMeasuredAtNetAssetValuePerShareMemberus-gaap:MortgageBackedSecuritiesIssuedByUSGovernmentSponsoredEnterprisesMember2020-12-310000831259us-gaap:FairValueInputsLevel1Memberus-gaap:MortgageBackedSecuritiesIssuedByUSGovernmentSponsoredEnterprisesMember2020-12-310000831259us-gaap:FairValueInputsLevel2Memberus-gaap:MortgageBackedSecuritiesIssuedByUSGovernmentSponsoredEnterprisesMember2020-12-310000831259us-gaap:FairValueInputsLevel3Memberus-gaap:MortgageBackedSecuritiesIssuedByUSGovernmentSponsoredEnterprisesMember2020-12-310000831259us-gaap:CarryingReportedAmountFairValueDisclosureMemberus-gaap:AssetBackedSecuritiesMember2020-12-310000831259us-gaap:EstimateOfFairValueFairValueDisclosureMemberus-gaap:AssetBackedSecuritiesMember2020-12-310000831259us-gaap:AssetBackedSecuritiesMemberus-gaap:FairValueMeasuredAtNetAssetValuePerShareMember2020-12-310000831259us-gaap:FairValueInputsLevel1Memberus-gaap:AssetBackedSecuritiesMember2020-12-310000831259us-gaap:FairValueInputsLevel2Memberus-gaap:AssetBackedSecuritiesMember2020-12-310000831259us-gaap:AssetBackedSecuritiesMemberus-gaap:FairValueInputsLevel3Member2020-12-310000831259us-gaap:CarryingReportedAmountFairValueDisclosureMemberus-gaap:MoneyMarketFundsMember2020-12-310000831259us-gaap:EstimateOfFairValueFairValueDisclosureMemberus-gaap:MoneyMarketFundsMember2020-12-310000831259us-gaap:MoneyMarketFundsMemberus-gaap:FairValueMeasuredAtNetAssetValuePerShareMember2020-12-310000831259us-gaap:FairValueInputsLevel1Memberus-gaap:MoneyMarketFundsMember2020-12-310000831259us-gaap:FairValueInputsLevel2Memberus-gaap:MoneyMarketFundsMember2020-12-310000831259us-gaap:MoneyMarketFundsMemberus-gaap:FairValueInputsLevel3Member2020-12-310000831259us-gaap:CarryingReportedAmountFairValueDisclosureMemberus-gaap:MortgageBackedSecuritiesMember2020-12-310000831259us-gaap:EstimateOfFairValueFairValueDisclosureMemberus-gaap:MortgageBackedSecuritiesMember2020-12-310000831259us-gaap:MortgageBackedSecuritiesMemberus-gaap:FairValueMeasuredAtNetAssetValuePerShareMember2020-12-310000831259us-gaap:FairValueInputsLevel1Memberus-gaap:MortgageBackedSecuritiesMember2020-12-310000831259us-gaap:FairValueInputsLevel2Memberus-gaap:MortgageBackedSecuritiesMember2020-12-310000831259us-gaap:MortgageBackedSecuritiesMemberus-gaap:FairValueInputsLevel3Member2020-12-310000831259us-gaap:CarryingReportedAmountFairValueDisclosureMemberus-gaap:MunicipalBondsMember2020-12-310000831259us-gaap:EstimateOfFairValueFairValueDisclosureMemberus-gaap:MunicipalBondsMember2020-12-310000831259us-gaap:MunicipalBondsMemberus-gaap:FairValueMeasuredAtNetAssetValuePerShareMember2020-12-310000831259us-gaap:FairValueInputsLevel1Memberus-gaap:MunicipalBondsMember2020-12-310000831259us-gaap:FairValueInputsLevel2Memberus-gaap:MunicipalBondsMember2020-12-310000831259us-gaap:MunicipalBondsMemberus-gaap:FairValueInputsLevel3Member2020-12-310000831259us-gaap:EmbeddedDerivativeFinancialInstrumentsMemberus-gaap:CarryingReportedAmountFairValueDisclosureMember2020-12-310000831259us-gaap:EmbeddedDerivativeFinancialInstrumentsMemberus-gaap:EstimateOfFairValueFairValueDisclosureMember2020-12-310000831259us-gaap:EmbeddedDerivativeFinancialInstrumentsMemberus-gaap:FairValueMeasuredAtNetAssetValuePerShareMember2020-12-310000831259us-gaap:FairValueInputsLevel1Memberus-gaap:EmbeddedDerivativeFinancialInstrumentsMember2020-12-310000831259us-gaap:EmbeddedDerivativeFinancialInstrumentsMemberus-gaap:FairValueInputsLevel2Member2020-12-310000831259us-gaap:EmbeddedDerivativeFinancialInstrumentsMemberus-gaap:FairValueInputsLevel3Member2020-12-310000831259us-gaap:CommodityContractMemberus-gaap:CarryingReportedAmountFairValueDisclosureMember2020-12-310000831259us-gaap:CommodityContractMemberus-gaap:EstimateOfFairValueFairValueDisclosureMember2020-12-310000831259us-gaap:CommodityContractMemberus-gaap:FairValueMeasuredAtNetAssetValuePerShareMember2020-12-310000831259us-gaap:FairValueInputsLevel1Memberus-gaap:CommodityContractMember2020-12-310000831259us-gaap:CommodityContractMemberus-gaap:FairValueInputsLevel2Member2020-12-310000831259us-gaap:CommodityContractMemberus-gaap:FairValueInputsLevel3Member2020-12-310000831259us-gaap:CarryingReportedAmountFairValueDisclosureMemberus-gaap:BankTimeDepositsMember2021-09-300000831259us-gaap:CarryingReportedAmountFairValueDisclosureMemberus-gaap:BankTimeDepositsMember2020-12-310000831259fcx:DeepwaterGulfofMexicoInterestsMemberfcx:FreeportMcMoRanOilGasMember2016-12-310000831259fcx:DeepwaterGulfofMexicoInterestsMemberfcx:FreeportMcMoRanOilGasMember2021-09-300000831259fcx:DeepwaterGulfofMexicoInterestsMemberfcx:FreeportMcMoRanOilGasMember2020-12-310000831259fcx:GulfofMexicoContingentConsiderationMember2020-12-310000831259fcx:GulfofMexicoContingentConsiderationMember2021-01-012021-09-300000831259fcx:GulfofMexicoContingentConsiderationMember2021-09-30fcx:case0000831259fcx:LouisianaParishesCoastalErosionCasesMemberus-gaap:SettledLitigationMemberfcx:FCXAffiliatesMember2019-12-310000831259fcx:LouisianaParishesCoastalErosionCasesMemberus-gaap:SettledLitigationMemberfcx:FCXAffiliatesMember2019-09-012019-09-300000831259fcx:LouisianaParishesCoastalErosionCasesMemberus-gaap:SettledLitigationMemberfcx:FCXAffiliatesMember2019-01-012019-09-300000831259fcx:CerroVerdeRoyaltyDisputeMember2021-07-012021-09-300000831259fcx:PtFreeportIndonesiaMemberfcx:PTSmeltingMember2020-03-302020-09-300000831259fcx:PtFreeportIndonesiaMemberfcx:PTSmeltingMember2021-01-012021-09-3000008312592021-07-012021-07-31fcx:segment0000831259fcx:CopperInConcentratesMember2021-07-012021-09-300000831259fcx:CopperInConcentratesMember2020-07-012020-09-300000831259fcx:CopperInConcentratesMember2021-01-012021-09-300000831259fcx:CopperInConcentratesMember2020-01-012020-09-300000831259fcx:CopperCathodeMember2021-07-012021-09-300000831259fcx:CopperCathodeMember2020-07-012020-09-300000831259fcx:CopperCathodeMember2021-01-012021-09-300000831259fcx:CopperCathodeMember2020-01-012020-09-300000831259fcx:RefinedCopperProductsMember2021-07-012021-09-300000831259fcx:RefinedCopperProductsMember2020-07-012020-09-300000831259fcx:RefinedCopperProductsMember2021-01-012021-09-300000831259fcx:RefinedCopperProductsMember2020-01-012020-09-300000831259fcx:PurchasedCopperMember2021-07-012021-09-300000831259fcx:PurchasedCopperMember2020-07-012020-09-300000831259fcx:PurchasedCopperMember2021-01-012021-09-300000831259fcx:PurchasedCopperMember2020-01-012020-09-300000831259us-gaap:GoldMember2021-07-012021-09-300000831259us-gaap:GoldMember2020-07-012020-09-300000831259us-gaap:GoldMember2021-01-012021-09-300000831259us-gaap:GoldMember2020-01-012020-09-300000831259fcx:MolybdenumMember2021-07-012021-09-300000831259fcx:MolybdenumMember2020-07-012020-09-300000831259fcx:MolybdenumMember2021-01-012021-09-300000831259fcx:MolybdenumMember2020-01-012020-09-300000831259fcx:OtherProductsOrServicesMember2021-07-012021-09-300000831259fcx:OtherProductsOrServicesMember2020-07-012020-09-300000831259fcx:OtherProductsOrServicesMember2021-01-012021-09-300000831259fcx:OtherProductsOrServicesMember2020-01-012020-09-300000831259us-gaap:SalesMemberus-gaap:NondesignatedMember2021-07-012021-09-300000831259us-gaap:SalesMemberus-gaap:NondesignatedMember2020-07-012020-09-300000831259us-gaap:SalesMemberus-gaap:NondesignatedMember2021-01-012021-09-300000831259us-gaap:SalesMemberus-gaap:NondesignatedMember2020-01-012020-09-300000831259us-gaap:OperatingSegmentsMembersrt:NorthAmericaMemberfcx:MorenciMember2021-07-012021-09-300000831259us-gaap:OperatingSegmentsMembersrt:NorthAmericaMemberfcx:OtherIndividuallyImmaterialOperatingSegmentsMember2021-07-012021-09-300000831259us-gaap:OperatingSegmentsMembersrt:NorthAmericaMember2021-07-012021-09-300000831259us-gaap:OperatingSegmentsMemberfcx:CerroVerdeMembersrt:SouthAmericaMember2021-07-012021-09-300000831259us-gaap:OperatingSegmentsMembersrt:SouthAmericaMemberfcx:OtherIndividuallyImmaterialOperatingSegmentsMember2021-07-012021-09-300000831259us-gaap:OperatingSegmentsMembersrt:SouthAmericaMember2021-07-012021-09-300000831259us-gaap:OperatingSegmentsMembercountry:IDfcx:GrasbergSegmentMember2021-07-012021-09-300000831259us-gaap:OperatingSegmentsMemberfcx:MolybdenumMember2021-07-012021-09-300000831259us-gaap:OperatingSegmentsMemberfcx:RodAndRefiningSegmentMember2021-07-012021-09-300000831259us-gaap:OperatingSegmentsMemberfcx:AtlanticCopperSmeltingAndRefiningSegmentMember2021-07-012021-09-300000831259fcx:CorporateAndEliminationsMember2021-07-012021-09-300000831259us-gaap:IntersegmentEliminationMembersrt:NorthAmericaMemberfcx:MorenciMember2021-07-012021-09-300000831259us-gaap:IntersegmentEliminationMembersrt:NorthAmericaMemberfcx:OtherIndividuallyImmaterialOperatingSegmentsMember2021-07-012021-09-300000831259us-gaap:IntersegmentEliminationMembersrt:NorthAmericaMember2021-07-012021-09-300000831259us-gaap:IntersegmentEliminationMemberfcx:CerroVerdeMembersrt:SouthAmericaMember2021-07-012021-09-300000831259us-gaap:IntersegmentEliminationMembersrt:SouthAmericaMemberfcx:OtherIndividuallyImmaterialOperatingSegmentsMember2021-07-012021-09-300000831259us-gaap:IntersegmentEliminationMembersrt:SouthAmericaMember2021-07-012021-09-300000831259us-gaap:IntersegmentEliminationMembercountry:IDfcx:GrasbergSegmentMember2021-07-012021-09-300000831259us-gaap:IntersegmentEliminationMemberfcx:MolybdenumMember2021-07-012021-09-300000831259us-gaap:IntersegmentEliminationMemberfcx:RodAndRefiningSegmentMember2021-07-012021-09-300000831259us-gaap:IntersegmentEliminationMemberfcx:AtlanticCopperSmeltingAndRefiningSegmentMember2021-07-012021-09-300000831259us-gaap:IntersegmentEliminationMemberfcx:CorporateAndEliminationsMember2021-07-012021-09-300000831259us-gaap:IntersegmentEliminationMember2021-07-012021-09-300000831259us-gaap:OperatingSegmentsMembersrt:NorthAmericaMemberfcx:MorenciMember2021-09-300000831259us-gaap:OperatingSegmentsMembersrt:NorthAmericaMemberfcx:OtherIndividuallyImmaterialOperatingSegmentsMember2021-09-300000831259us-gaap:OperatingSegmentsMembersrt:NorthAmericaMember2021-09-300000831259us-gaap:OperatingSegmentsMemberfcx:CerroVerdeMembersrt:SouthAmericaMember2021-09-300000831259us-gaap:OperatingSegmentsMembersrt:SouthAmericaMemberfcx:OtherIndividuallyImmaterialOperatingSegmentsMember2021-09-300000831259us-gaap:OperatingSegmentsMembersrt:SouthAmericaMember2021-09-300000831259us-gaap:OperatingSegmentsMembercountry:IDfcx:GrasbergSegmentMember2021-09-300000831259us-gaap:OperatingSegmentsMemberfcx:MolybdenumMember2021-09-300000831259us-gaap:OperatingSegmentsMemberfcx:RodAndRefiningSegmentMember2021-09-300000831259us-gaap:OperatingSegmentsMemberfcx:AtlanticCopperSmeltingAndRefiningSegmentMember2021-09-300000831259fcx:CorporateAndEliminationsMember2021-09-300000831259us-gaap:OperatingSegmentsMembersrt:NorthAmericaMemberfcx:MorenciMember2020-07-012020-09-300000831259us-gaap:OperatingSegmentsMembersrt:NorthAmericaMemberfcx:OtherIndividuallyImmaterialOperatingSegmentsMember2020-07-012020-09-300000831259us-gaap:OperatingSegmentsMembersrt:NorthAmericaMember2020-07-012020-09-300000831259us-gaap:OperatingSegmentsMemberfcx:CerroVerdeMembersrt:SouthAmericaMember2020-07-012020-09-300000831259us-gaap:OperatingSegmentsMembersrt:SouthAmericaMemberfcx:OtherIndividuallyImmaterialOperatingSegmentsMember2020-07-012020-09-300000831259us-gaap:OperatingSegmentsMembersrt:SouthAmericaMember2020-07-012020-09-300000831259us-gaap:OperatingSegmentsMembercountry:IDfcx:GrasbergSegmentMember2020-07-012020-09-300000831259us-gaap:OperatingSegmentsMemberfcx:MolybdenumMember2020-07-012020-09-300000831259us-gaap:OperatingSegmentsMemberfcx:RodAndRefiningSegmentMember2020-07-012020-09-300000831259us-gaap:OperatingSegmentsMemberfcx:AtlanticCopperSmeltingAndRefiningSegmentMember2020-07-012020-09-300000831259fcx:CorporateAndEliminationsMember2020-07-012020-09-300000831259us-gaap:IntersegmentEliminationMembersrt:NorthAmericaMemberfcx:MorenciMember2020-07-012020-09-300000831259us-gaap:IntersegmentEliminationMembersrt:NorthAmericaMemberfcx:OtherIndividuallyImmaterialOperatingSegmentsMember2020-07-012020-09-300000831259us-gaap:IntersegmentEliminationMembersrt:NorthAmericaMember2020-07-012020-09-300000831259us-gaap:IntersegmentEliminationMemberfcx:CerroVerdeMembersrt:SouthAmericaMember2020-07-012020-09-300000831259us-gaap:IntersegmentEliminationMembersrt:SouthAmericaMemberfcx:OtherIndividuallyImmaterialOperatingSegmentsMember2020-07-012020-09-300000831259us-gaap:IntersegmentEliminationMembersrt:SouthAmericaMember2020-07-012020-09-300000831259us-gaap:IntersegmentEliminationMembercountry:IDfcx:GrasbergSegmentMember2020-07-012020-09-300000831259us-gaap:IntersegmentEliminationMemberfcx:MolybdenumMember2020-07-012020-09-300000831259us-gaap:IntersegmentEliminationMemberfcx:RodAndRefiningSegmentMember2020-07-012020-09-300000831259us-gaap:IntersegmentEliminationMemberfcx:AtlanticCopperSmeltingAndRefiningSegmentMember2020-07-012020-09-300000831259us-gaap:IntersegmentEliminationMemberfcx:CorporateAndEliminationsMember2020-07-012020-09-300000831259us-gaap:IntersegmentEliminationMember2020-07-012020-09-300000831259us-gaap:OperatingSegmentsMembersrt:NorthAmericaMemberfcx:OtherMinesNorthAmericaCopperMinesSegmentMember2020-07-012020-09-300000831259us-gaap:OperatingSegmentsMembersrt:NorthAmericaMemberfcx:MorenciMember2020-09-300000831259us-gaap:OperatingSegmentsMembersrt:NorthAmericaMemberfcx:OtherIndividuallyImmaterialOperatingSegmentsMember2020-09-300000831259us-gaap:OperatingSegmentsMembersrt:NorthAmericaMember2020-09-300000831259us-gaap:OperatingSegmentsMemberfcx:CerroVerdeMembersrt:SouthAmericaMember2020-09-300000831259us-gaap:OperatingSegmentsMembersrt:SouthAmericaMemberfcx:OtherIndividuallyImmaterialOperatingSegmentsMember2020-09-300000831259us-gaap:OperatingSegmentsMembersrt:SouthAmericaMember2020-09-300000831259us-gaap:OperatingSegmentsMembercountry:IDfcx:GrasbergSegmentMember2020-09-300000831259us-gaap:OperatingSegmentsMemberfcx:MolybdenumMember2020-09-300000831259us-gaap:OperatingSegmentsMemberfcx:RodAndRefiningSegmentMember2020-09-300000831259us-gaap:OperatingSegmentsMemberfcx:AtlanticCopperSmeltingAndRefiningSegmentMember2020-09-300000831259fcx:CorporateAndEliminationsMember2020-09-300000831259srt:AffiliatedEntityMemberfcx:PTSmeltingMember2021-07-012021-09-300000831259srt:AffiliatedEntityMemberfcx:PTSmeltingMember2020-07-012020-09-300000831259us-gaap:ForeignCountryMember2021-07-012021-09-300000831259fcx:CorporateAndEliminationsMemberfcx:CorporateOtherAndEliminationsIndonesiaSmelterMember2021-07-012021-09-300000831259fcx:CorporateAndEliminationsMemberfcx:CorporateOtherAndEliminationsIndonesiaSmelterMember2020-07-012020-09-300000831259us-gaap:OperatingSegmentsMembersrt:NorthAmericaMemberfcx:MorenciMember2021-01-012021-09-300000831259us-gaap:OperatingSegmentsMembersrt:NorthAmericaMemberfcx:OtherIndividuallyImmaterialOperatingSegmentsMember2021-01-012021-09-300000831259us-gaap:OperatingSegmentsMembersrt:NorthAmericaMember2021-01-012021-09-300000831259us-gaap:OperatingSegmentsMemberfcx:CerroVerdeMembersrt:SouthAmericaMember2021-01-012021-09-300000831259us-gaap:OperatingSegmentsMembersrt:SouthAmericaMemberfcx:OtherIndividuallyImmaterialOperatingSegmentsMember2021-01-012021-09-300000831259us-gaap:OperatingSegmentsMembersrt:SouthAmericaMember2021-01-012021-09-300000831259us-gaap:OperatingSegmentsMembercountry:IDfcx:GrasbergSegmentMember2021-01-012021-09-300000831259us-gaap:OperatingSegmentsMemberfcx:MolybdenumMember2021-01-012021-09-300000831259us-gaap:OperatingSegmentsMemberfcx:RodAndRefiningSegmentMember2021-01-012021-09-300000831259us-gaap:OperatingSegmentsMemberfcx:AtlanticCopperSmeltingAndRefiningSegmentMember2021-01-012021-09-300000831259fcx:CorporateAndEliminationsMember2021-01-012021-09-300000831259us-gaap:IntersegmentEliminationMembersrt:NorthAmericaMemberfcx:MorenciMember2021-01-012021-09-300000831259us-gaap:IntersegmentEliminationMembersrt:NorthAmericaMemberfcx:OtherIndividuallyImmaterialOperatingSegmentsMember2021-01-012021-09-300000831259us-gaap:IntersegmentEliminationMembersrt:NorthAmericaMember2021-01-012021-09-300000831259us-gaap:IntersegmentEliminationMemberfcx:CerroVerdeMembersrt:SouthAmericaMember2021-01-012021-09-300000831259us-gaap:IntersegmentEliminationMembersrt:SouthAmericaMemberfcx:OtherIndividuallyImmaterialOperatingSegmentsMember2021-01-012021-09-300000831259us-gaap:IntersegmentEliminationMembersrt:SouthAmericaMember2021-01-012021-09-300000831259us-gaap:IntersegmentEliminationMembercountry:IDfcx:GrasbergSegmentMember2021-01-012021-09-300000831259us-gaap:IntersegmentEliminationMemberfcx:MolybdenumMember2021-01-012021-09-300000831259us-gaap:IntersegmentEliminationMemberfcx:RodAndRefiningSegmentMember2021-01-012021-09-300000831259us-gaap:IntersegmentEliminationMemberfcx:AtlanticCopperSmeltingAndRefiningSegmentMember2021-01-012021-09-300000831259us-gaap:IntersegmentEliminationMemberfcx:CorporateAndEliminationsMember2021-01-012021-09-300000831259us-gaap:IntersegmentEliminationMember2021-01-012021-09-300000831259us-gaap:OperatingSegmentsMembersrt:NorthAmericaMemberfcx:MorenciMember2020-01-012020-09-300000831259us-gaap:OperatingSegmentsMembersrt:NorthAmericaMemberfcx:OtherIndividuallyImmaterialOperatingSegmentsMember2020-01-012020-09-300000831259us-gaap:OperatingSegmentsMembersrt:NorthAmericaMember2020-01-012020-09-300000831259us-gaap:OperatingSegmentsMemberfcx:CerroVerdeMembersrt:SouthAmericaMember2020-01-012020-09-300000831259us-gaap:OperatingSegmentsMembersrt:SouthAmericaMemberfcx:OtherIndividuallyImmaterialOperatingSegmentsMember2020-01-012020-09-300000831259us-gaap:OperatingSegmentsMembersrt:SouthAmericaMember2020-01-012020-09-300000831259us-gaap:OperatingSegmentsMembercountry:IDfcx:GrasbergSegmentMember2020-01-012020-09-300000831259us-gaap:OperatingSegmentsMemberfcx:MolybdenumMember2020-01-012020-09-300000831259us-gaap:OperatingSegmentsMemberfcx:RodAndRefiningSegmentMember2020-01-012020-09-300000831259us-gaap:OperatingSegmentsMemberfcx:AtlanticCopperSmeltingAndRefiningSegmentMember2020-01-012020-09-300000831259fcx:CorporateAndEliminationsMember2020-01-012020-09-300000831259us-gaap:IntersegmentEliminationMembersrt:NorthAmericaMemberfcx:MorenciMember2020-01-012020-09-300000831259us-gaap:IntersegmentEliminationMembersrt:NorthAmericaMemberfcx:OtherIndividuallyImmaterialOperatingSegmentsMember2020-01-012020-09-300000831259us-gaap:IntersegmentEliminationMembersrt:NorthAmericaMember2020-01-012020-09-300000831259us-gaap:IntersegmentEliminationMemberfcx:CerroVerdeMembersrt:SouthAmericaMember2020-01-012020-09-300000831259us-gaap:IntersegmentEliminationMembersrt:SouthAmericaMemberfcx:OtherIndividuallyImmaterialOperatingSegmentsMember2020-01-012020-09-300000831259us-gaap:IntersegmentEliminationMembersrt:SouthAmericaMember2020-01-012020-09-300000831259us-gaap:IntersegmentEliminationMembercountry:IDfcx:GrasbergSegmentMember2020-01-012020-09-300000831259us-gaap:IntersegmentEliminationMemberfcx:MolybdenumMember2020-01-012020-09-300000831259us-gaap:IntersegmentEliminationMemberfcx:RodAndRefiningSegmentMember2020-01-012020-09-300000831259us-gaap:IntersegmentEliminationMemberfcx:AtlanticCopperSmeltingAndRefiningSegmentMember2020-01-012020-09-300000831259us-gaap:IntersegmentEliminationMemberfcx:CorporateAndEliminationsMember2020-01-012020-09-300000831259us-gaap:IntersegmentEliminationMember2020-01-012020-09-300000831259us-gaap:OperatingSegmentsMembersrt:NorthAmericaMemberfcx:OtherMinesNorthAmericaCopperMinesSegmentMember2020-01-012020-09-300000831259srt:AffiliatedEntityMemberfcx:PTSmeltingMember2021-01-012021-09-300000831259srt:AffiliatedEntityMemberfcx:PTSmeltingMember2020-01-012020-09-300000831259fcx:CerroVerdeMember2021-01-012021-09-300000831259fcx:MiamiSmelterMemberfcx:CorporateAndEliminationsMember2020-01-012020-09-300000831259fcx:FreeportCobaltMemberfcx:CorporateAndEliminationsMember2021-01-012021-09-300000831259fcx:CorporateAndEliminationsMemberfcx:CorporateOtherAndEliminationsIndonesiaSmelterMember2021-01-012021-09-300000831259fcx:CorporateAndEliminationsMemberfcx:CorporateOtherAndEliminationsIndonesiaSmelterMember2020-01-012020-09-30
United States
SECURITIES AND EXCHANGE COMMISSION
Washington, D.C. 20549
FORM 10-Q
(Mark one)
| | | | | |
| ☒ | QUARTERLY REPORT PURSUANT TO SECTION 13 OR 15(d) OF THE SECURITIES EXCHANGE ACT OF 1934 |
For the quarterly period ended September 30, 2021
OR
| | | | | |
| ☐ | TRANSITION REPORT PURSUANT TO SECTION 13 OR 15(d) OF THE SECURITIES EXCHANGE ACT OF 1934 |
For the transition period from to
Commission file number: 001-11307-01
Freeport-McMoRan Inc.
(Exact name of registrant as specified in its charter)
| | | | | | | | |
| Delaware | | 74-2480931 |
| (State or other jurisdiction of | | (I.R.S. Employer Identification No.) |
| incorporation or organization) | | |
| | | | | | | | | | | | | | | | | | | | |
| 333 North Central Avenue | | | | |
| Phoenix | | AZ | | | | 85004-2189 |
| (Address of principal executive offices) | | | | (Zip Code) |
(602) 366-8100
(Registrant’s telephone number, including area code)
Securities registered pursuant to Section 12(b) of the Act:
| | | | | | | | |
| Title of each class | Trading Symbol(s) | Name of each exchange on which registered |
| Common Stock, par value $0.10 per share | FCX | The New York Stock Exchange |
Indicate by check mark whether the registrant (1) has filed all reports required to be filed by Section 13 or 15(d) of the Securities Exchange Act of 1934 during the preceding 12 months (or for such shorter period that the registrant was required to file such reports), and (2) has been subject to such filing requirements for the past 90 days. ☑ Yes ☐ No
Indicate by check mark whether the registrant has submitted electronically every Interactive Data File required to be submitted pursuant to Rule 405 of Regulation S-T (§ 232.405 of this chapter) during the preceding 12 months (or for such shorter period that the registrant was required to submit such files). ☑ Yes ☐ No
Indicate by check mark whether the registrant is a large accelerated filer, an accelerated filer, a non-accelerated filer, or a smaller reporting company, or an emerging growth company. See the definitions of “large accelerated filer,” “accelerated filer,” “smaller reporting company,” and “emerging growth company” in Rule 12b-2 of the Exchange Act.
| | | | | | | | | | | |
| Large accelerated filer | ☑ | Accelerated filer | ☐ |
Non-accelerated filer | ☐ | Smaller reporting company | ☐ |
| | Emerging growth company | ☐ |
If an emerging growth company, indicate by check mark if the registrant has elected not to use the extended transition period for complying with any new or revised financial accounting standards provided pursuant to Section 13(a) of the Exchange Act. ☐
Indicate by check mark whether the registrant is a shell company (as defined in Rule 12b-2 of the Exchange Act). ☐ Yes ☑ No
On October 29, 2021, there were issued and outstanding 1,468,473,516 shares of the registrant’s common stock, par value $0.10 per share.
Freeport-McMoRan Inc.
TABLE OF CONTENTS
Part I.FINANCIAL INFORMATION
Item 1.Financial Statements.
Freeport-McMoRan Inc.
CONSOLIDATED BALANCE SHEETS (Unaudited)
| | | | | | | | | | | |
| September 30,
2021 | | December 31,
2020 |
| | (In millions) |
| ASSETS | | | |
| Current assets: | | | |
| Cash and cash equivalents | $ | 7,672 | | | $ | 3,657 | |
| Trade accounts receivable | 931 | | | 892 | |
| Income and other tax receivables | 591 | | | 520 | |
| | | |
| Inventories: | | | |
| Materials and supplies, net | 1,617 | | | 1,594 | |
| Mill and leach stockpiles | 1,086 | | | 1,014 | |
| Product | 1,417 | | | 1,285 | |
| Other current assets | 477 | | | 341 | |
| | | |
| Total current assets | 13,791 | | | 9,303 | |
| Property, plant, equipment and mine development costs, net | 30,102 | | | 29,818 | |
| | | |
| | | |
| Long-term mill and leach stockpiles | 1,450 | | | 1,463 | |
| | | |
| Other assets | 1,574 | | | 1,560 | |
| | | |
| Total assets | $ | 46,917 | | | $ | 42,144 | |
| | | |
| LIABILITIES AND EQUITY | | | |
| Current liabilities: | | | |
| Accounts payable and accrued liabilities | $ | 2,949 | | | $ | 2,708 | |
| Accrued income taxes | 1,237 | | | 324 | |
| Current portion of debt | 897 | | | 34 | |
| Current portion of environmental and asset retirement obligations | 329 | | | 351 | |
| Dividends payable | 111 | | | — | |
| | | |
| Total current liabilities | 5,523 | | | 3,417 | |
| Long-term debt, less current portion | 8,768 | | | 9,677 | |
| Deferred income taxes | 4,500 | | | 4,408 | |
| Environmental and asset retirement obligations, less current portion | 3,688 | | | 3,705 | |
| Other liabilities | 1,907 | | | 2,269 | |
| | | |
| Total liabilities | 24,386 | | | 23,476 | |
| | | |
| | | |
| | | |
| Equity: | | | |
| Stockholders’ equity: | | | |
| Common stock | 160 | | | 159 | |
| Capital in excess of par value | 26,023 | | | 26,037 | |
| Accumulated deficit | (8,481) | | | (11,681) | |
| Accumulated other comprehensive loss | (572) | | | (583) | |
| Common stock held in treasury | (3,777) | | | (3,758) | |
| Total stockholders’ equity | 13,353 | | | 10,174 | |
| Noncontrolling interests | 9,178 | | | 8,494 | |
| Total equity | 22,531 | | | 18,668 | |
| Total liabilities and equity | $ | 46,917 | | | $ | 42,144 | |
The accompanying notes are an integral part of these consolidated financial statements.
Freeport-McMoRan Inc.
CONSOLIDATED STATEMENTS OF OPERATIONS (Unaudited)
| | | | | | | | | | | | | | | | | | | | | | | |
| Three Months Ended | | Nine Months Ended |
| September 30, | | September 30, |
| | 2021 | | 2020 | | 2021 | | 2020 |
| (In millions, except per share amounts) |
| Revenues | $ | 6,083 | | | $ | 3,851 | | | $ | 16,681 | | | $ | 9,703 | |
| Cost of sales: | | | | | | | |
| Production and delivery | 3,009 | | | 2,465 | | | 8,862 | | | 7,404 | |
| Depreciation, depletion and amortization | 528 | | | 394 | | | 1,430 | | | 1,093 | |
| | | | | | | |
| Metals inventory adjustments | 14 | | | 9 | | | 15 | | | 92 | |
| Total cost of sales | 3,551 | | | 2,868 | | | 10,307 | | | 8,589 | |
| Selling, general and administrative expenses | 102 | | | 72 | | | 289 | | | 273 | |
| Mining exploration and research expenses | 15 | | | 8 | | | 36 | | | 42 | |
Environmental obligations and shutdown costs | 13 | | | 21 | | | 51 | | | 58 | |
| Net (gain) loss on sales of assets | (60) | | | 2 | | | (63) | | | 13 | |
| Total costs and expenses | 3,621 | | | 2,971 | | | 10,620 | | | 8,975 | |
| Operating income | 2,462 | | | 880 | | | 6,061 | | | 728 | |
| Interest expense, net | (138) | | | (120) | | | (431) | | | (362) | |
Net loss on early extinguishment of debt | — | | | (59) | | | — | | | (100) | |
| Other income, net | 36 | | | 22 | | | 56 | | | 62 | |
| Income before income taxes and equity in affiliated companies’ net (losses) earnings | 2,360 | | | 723 | | | 5,686 | | | 328 | |
| Provision for income taxes | (628) | | | (297) | | | (1,674) | | | (333) | |
| Equity in affiliated companies’ net (losses) earnings | (9) | | | 6 | | | (5) | | | 12 | |
| | | | | | | |
| | | | | | | |
| Net income | 1,723 | | | 432 | | | 4,007 | | | 7 | |
| | | | | | | |
| Net income attributable to noncontrolling interests | (324) | | | (103) | | | (807) | | | (116) | |
| | | | | | | |
| | | | | | | |
| Net income (loss) attributable to common stockholders | $ | 1,399 | | | $ | 329 | | | $ | 3,200 | | | $ | (109) | |
| | | | | | | |
| | | | | | | |
| Net income (loss) per share attributable to common stockholders: | | | | | | | |
Basic | $ | 0.95 | | | $ | 0.22 | | | $ | 2.18 | | | $ | (0.08) | |
Diluted | $ | 0.94 | | | $ | 0.22 | | | $ | 2.16 | | | $ | (0.08) | |
| | | | | | | |
| | | | | | | |
| | | | | | | |
| | | | | | | |
| Weighted-average common shares outstanding: | | | | | | | |
Basic | 1,469 | | | 1,453 | | | 1,466 | | | 1,453 | |
Diluted | 1,484 | | | 1,461 | | | 1,481 | | | 1,453 | |
| | | | | | | |
| Dividends declared per share of common stock | $ | 0.075 | | | $ | — | | | $ | 0.225 | | | $ | — | |
The accompanying notes are an integral part of these consolidated financial statements.
Freeport-McMoRan Inc.
CONSOLIDATED STATEMENTS OF COMPREHENSIVE INCOME (LOSS) (Unaudited)
| | | | | | | | | | | | | | | | | | | | | | | |
| Three Months Ended | | Nine Months Ended |
| September 30, | | September 30, |
| 2021 | | 2020 | | 2021 | | 2020 |
| (In millions) |
| Net income | $ | 1,723 | | | $ | 432 | | | $ | 4,007 | | | $ | 7 | |
| | | | | | | |
| Other comprehensive income (loss), net of taxes: | | | | | | | |
| | | | | | | |
| Defined benefit plans: | | | | | | | |
| Actuarial losses arising during the period | — | | | (89) | | | (1) | | | (89) | |
| Amortization of unrecognized amounts included in net periodic benefit costs | 4 | | | 14 | | | 12 | | | 38 | |
| Foreign exchange losses | — | | | (1) | | | (1) | | | (2) | |
| | | | | | | |
| | | | | | | |
| Other comprehensive income (loss) | 4 | | | (76) | | | 10 | | | (53) | |
| | | | | | | |
| Total comprehensive income (loss) | 1,727 | | | 356 | | | 4,017 | | | (46) | |
| Total comprehensive income attributable to noncontrolling interests | (324) | | | (103) | | | (806) | | | (115) | |
| | | | | | | |
Total comprehensive income (loss) attributable to common stockholders | $ | 1,403 | | | $ | 253 | | | $ | 3,211 | | | $ | (161) | |
The accompanying notes are an integral part of these consolidated financial statements.
Freeport-McMoRan Inc.
CONSOLIDATED STATEMENTS OF CASH FLOWS (Unaudited)
| | | | | | | | | | | | | | |
| Nine Months Ended | |
| September 30, | |
| | 2021 | | 2020 | |
| | (In millions) | |
| Cash flow from operating activities: | | | | |
| Net income | $ | 4,007 | | | $ | 7 | | |
| Adjustments to reconcile net income to net cash provided by operating activities: | | | | |
| Depreciation, depletion and amortization | 1,430 | | | 1,093 | | |
| | | | |
| | | | |
| Metals inventory adjustments | 15 | | | 92 | | |
| | | | |
| Net (gain) loss on sales of assets | (63) | | | 13 | | |
| Stock-based compensation | 79 | | | 60 | | |
| Net charges for environmental and asset retirement obligations, including accretion | 131 | | | 166 | | |
| Payments for environmental and asset retirement obligations | (184) | | | (162) | | |
| Net charges for defined pension and postretirement plans | 3 | | | 59 | | |
| Pension plan contributions | (75) | | | (30) | | |
| Net loss on early extinguishment of debt | — | | | 100 | | |
| Deferred income taxes | 96 | | | 119 | | |
| | | | |
| | | | |
| | | | |
| | | | |
| | | | |
| | | | |
| | | | |
Charges for Cerro Verde royalty dispute | 11 | | | 26 | | |
| Payments for Cerro Verde royalty dispute | (421) | | | (119) | | |
| Other, net | 39 | | | (53) | | |
Changes in working capital and other: | | | | |
| Accounts receivable | (218) | | | 132 | | |
| Inventories | (310) | | | 59 | | |
| Other current assets | (77) | | | (17) | | |
| Accounts payable and accrued liabilities | 123 | | | 40 | | |
| Accrued income taxes and timing of other tax payments | 849 | | | 105 | | |
| Net cash provided by operating activities | 5,435 | | | 1,690 | | |
| | | | |
| Cash flow from investing activities: | | | | |
| Capital expenditures: | | | | |
| North America copper mines | (211) | | | (398) | | |
| South America | (94) | | | (156) | | |
| Indonesia mining | (904) | | | (865) | | |
| Indonesia smelter development | (79) | | | (94) | | |
| Molybdenum mines | (4) | | | (14) | | |
| | | | |
| Other | (52) | | | (46) | | |
| Proceeds from sale of Freeport Cobalt | 150 | | | — | | |
| | | | |
| Proceeds from sales of other assets | 21 | | | 146 | | |
| Acquisition of minority interest in PT Smelting | (33) | | | — | | |
| Other, net | (25) | | | (6) | | |
| Net cash used in investing activities | (1,231) | | | (1,433) | | |
| | | | |
| Cash flow from financing activities: | | | | |
| Proceeds from debt | 633 | | | 3,236 | | |
| Repayments of debt | (672) | | | (3,105) | | |
| | | | |
| | | | |
| Cash dividends and distributions paid: | | | | |
| Common stock | (220) | | | (73) | | |
| Noncontrolling interests | (187) | | | — | | |
| Contributions from noncontrolling interests | 135 | | | 115 | | |
| Proceeds from exercised stock options | 189 | | | 3 | | |
| Payments for withholding of employee taxes related to stock-based awards | (19) | | | (5) | | |
| Debt financing costs and other, net | (47) | | | (51) | | |
| Net cash (used in) provided by financing activities | (188) | | | 120 | | |
| | | | |
| Net increase in cash, cash equivalents, restricted cash and restricted cash equivalents | 4,016 | | | 377 | | |
| | | | |
| Cash, cash equivalents, restricted cash and restricted cash equivalents at beginning of year | 3,903 | | | 2,278 | | |
| Cash, cash equivalents, restricted cash and restricted cash equivalents at end of period | $ | 7,919 | | | $ | 2,655 | | |
The accompanying notes are an integral part of these consolidated financial statements.
Freeport-McMoRan Inc.
CONSOLIDATED STATEMENTS OF EQUITY (Unaudited)
THREE MONTHS ENDED SEPTEMBER 30
| | | | | | | | | | | | | | | | | | | | | | | | | | | | | | | | | | | | | | | | | | | | | | | | | | | | | | | | | | | |
| | Stockholders’ Equity | | | | |
| Common Stock | | | | Accum-ulated Deficit | | Accumu-
lated
Other Compre-
hensive
Loss | | Common Stock
Held in Treasury | | Total
Stock-holders’ Equity | | | | |
| Number
of
Shares | | At Par
Value | | Capital in
Excess of
Par Value | | | | Number
of
Shares | | At
Cost | | | Non-
controlling
Interests | | Total
Equity |
| | | | | | | | | |
| | (In millions) |
| Balance at June 30, 2021 | 1,601 | | | $ | 160 | | | $ | 26,084 | | | $ | (9,880) | | | $ | (576) | | | 133 | | | $ | (3,777) | | | $ | 12,011 | | | $ | 8,924 | | | $ | 20,935 | |
| | | | | | | | | | | | | | | | | | | |
| | | | | | | | | | | | | | | | | | | |
| | | | | | | | | | | | | | | | | | | |
| | | | | | | | | | | | | | | | | | | |
| | | | | | | | | | | | | | | | | | | |
| Exercised and issued stock-based awards | — | | | — | | | 6 | | | — | | | — | | | — | | | — | | | 6 | | | — | | | 6 | |
| Stock-based compensation, including the tender of shares | — | | | — | | | 21 | | | — | | | — | | | — | | | — | | | 21 | | | — | | | 21 | |
| | | | | | | | | | | | | | | | | | | |
| | | | | | | | | | | | | | | | | | | |
| | | | | | | | | | | | | | | | | | | |
| Dividends | — | | | — | | | (111) | | | — | | | — | | | — | | | — | | | (111) | | | (94) | | | (205) | |
| | | | | | | | | | | | | | | | | | | |
| | | | | | | | | | | | | | | | | | | |
| | | | | | | | | | | | | | | | | | | |
| Contributions from noncontrolling interests | — | | | — | | | 23 | | | — | | | — | | | — | | | — | | | 23 | | | 24 | | | 47 | |
| | | | | | | | | | | | | | | | | | | |
| | | | | | | | | | | | | | | | | | | |
| | | | | | | | | | | | | | | | | | | |
| Net income attributable to common stockholders | — | | | — | | | — | | | 1,399 | | | — | | | — | | | — | | | 1,399 | | | — | | | 1,399 | |
Net income attributable to noncontrolling interests | — | | | — | | | — | | | — | | | — | | | — | | | — | | | — | | | 324 | | | 324 | |
| Other comprehensive income | — | | | — | | | — | | | — | | | 4 | | | — | | | — | | | 4 | | | — | | | 4 | |
| Balance at September 30, 2021 | 1,601 | | | $ | 160 | | | $ | 26,023 | | | $ | (8,481) | | | $ | (572) | | | 133 | | | $ | (3,777) | | | $ | 13,353 | | | $ | 9,178 | | | $ | 22,531 | |
| | | | | | | | | | | | | | | | | | | | | | | | | | | | | | | | | | | | | | | | | | | | | | | | | | | | | | | | | | | |
| | Stockholders’ Equity | | | | |
| Common Stock | | | | Accum-ulated Deficit | | Accumu-
lated
Other Compre-
hensive
Loss | | Common Stock
Held in Treasury | | Total
Stock-holders’ Equity | | | | |
| Number
of
Shares | | At Par
Value | | Capital in
Excess of
Par Value | | | | Number
of
Shares | | At
Cost | | | Non-
controlling
Interests | | Total
Equity |
| | | | | | | | | |
| | (In millions) |
| Balance at June 30, 2020 | 1,583 | | | $ | 158 | | | $ | 25,905 | | | $ | (12,718) | | | $ | (652) | | | 131 | | | $ | (3,739) | | | $ | 8,954 | | | $ | 8,201 | | | $ | 17,155 | |
| | | | | | | | | | | | | | | | | | | |
| | | | | | | | | | | | | | | | | | | |
| | | | | | | | | | | | | | | | | | | |
| | | | | | | | | | | | | | | | | | | |
| | | | | | | | | | | | | | | | | | | |
| Exercised and issued stock-based awards | 1 | | | — | | | 1 | | | — | | | — | | | — | | | — | | | 1 | | | — | | | 1 | |
| Stock-based compensation, including the tender of shares | — | | | — | | | 8 | | | — | | | — | | | — | | | — | | | 8 | | | — | | | 8 | |
| | | | | | | | | | | | | | | | | | | |
| | | | | | | | | | | | | | | | | | | |
| | | | | | | | | | | | | | | | | | | |
| | | | | | | | | | | | | | | | | | | |
| | | | | | | | | | | | | | | | | | | |
| | | | | | | | | | | | | | | | | | | |
| Change in ownership interests | — | | | — | | | — | | | — | | | — | | | — | | | — | | | — | | | 1 | | | 1 | |
| Contributions from noncontrolling interests | — | | | — | | | 20 | | | — | | | — | | | — | | | — | | | 20 | | | 21 | | | 41 | |
| | | | | | | | | | | | | | | | | | | |
| | | | | | | | | | | | | | | | | | | |
| Net income attributable to common stockholders | — | | | — | | | — | | | 329 | | | — | | | — | | | — | | | 329 | | | — | | | 329 | |
| Net income attributable to noncontrolling interests | — | | | — | | | — | | | — | | | — | | | — | | | — | | | — | | | 103 | | | 103 | |
| Other comprehensive loss | — | | | — | | | — | | | — | | | (76) | | | — | | | — | | | (76) | | | — | | | (76) | |
| Balance at September 30, 2020 | 1,584 | | | $ | 158 | | | $ | 25,934 | | | $ | (12,389) | | | $ | (728) | | | 131 | | | $ | (3,739) | | | $ | 9,236 | | | $ | 8,326 | | | $ | 17,562 | |
The accompanying notes are an integral part of these consolidated financial statements.
Freeport-McMoRan Inc.
CONSOLIDATED STATEMENTS OF EQUITY (Unaudited)
NINE MONTHS ENDED SEPTEMBER 30
| | | | | | | | | | | | | | | | | | | | | | | | | | | | | | | | | | | | | | | | | | | | | | | | | | | | | | | | | | | |
| | | | | | | | | | | | | | | | | | | |
| | Stockholders’ Equity | | | | |
| Common Stock | | | | Accum-ulated Deficit | | Accumu-
lated
Other Compre-
hensive
Loss | | Common Stock
Held in Treasury | | Total
Stock-holders’ Equity | | | | |
| Number
of
Shares | | At Par
Value | | Capital in
Excess of
Par Value | | | | Number
of
Shares | | At
Cost | | | Non-
controlling
Interests | | Total
Equity |
| | | | | | | | | |
| | (In millions) |
| Balance at December 31, 2020 | 1,590 | | | $ | 159 | | | $ | 26,037 | | | $ | (11,681) | | | $ | (583) | | | 132 | | | $ | (3,758) | | | $ | 10,174 | | | $ | 8,494 | | | $ | 18,668 | |
| | | | | | | | | | | | | | | | | | | |
| | | | | | | | | | | | | | | | | | | |
| | | | | | | | | | | | | | | | | | | |
| Exercised and issued stock-based awards | 11 | | | 1 | | | 189 | | | — | | | — | | | — | | | — | | | 190 | | | — | | | 190 | |
| Stock-based compensation, including the tender of shares | — | | | — | | | 64 | | | — | | | — | | | 1 | | | (19) | | | 45 | | | (4) | | | 41 | |
| | | | | | | | | | | | | | | | | | | |
| | | | | | | | | | | | | | | | | | | |
| Dividends | — | | | — | | | (333) | | | — | | | — | | | — | | | — | | | (333) | | | (187) | | | (520) | |
| | | | | | | | | | | | | | | | | | | |
Contributions from noncontrolling interests | — | | | — | | | 66 | | | — | | | — | | | — | | | — | | | 66 | | | 69 | | | 135 | |
| Net income attributable to common stockholders | — | | | — | | | — | | | 3,200 | | | — | | | — | | | — | | | 3,200 | | | — | | | 3,200 | |
Net income attributable to noncontrolling interests | — | | | — | | | — | | | — | | | — | | | — | | | — | | | — | | | 807 | | | 807 | |
| Other comprehensive income (loss) | — | | | — | | | — | | | — | | | 11 | | | — | | | — | | | 11 | | | (1) | | | 10 | |
| Balance at September 30, 2021 | 1,601 | | | $ | 160 | | | $ | 26,023 | | | $ | (8,481) | | | $ | (572) | | | 133 | | | $ | (3,777) | | | $ | 13,353 | | | $ | 9,178 | | | $ | 22,531 | |
| | | | | | | | | | | | | | | | | | | | | | | | | | | | | | | | | | | | | | | | | | | | | | | | | | | | | | | | | | | |
| | | | | | | | | | | | | | | | | | | |
| | Stockholders’ Equity | | | | |
| Common Stock | | | | Accum-ulated Deficit | | Accumu-
lated
Other Compre-
hensive
Loss | | Common Stock
Held in Treasury | | Total
Stock-holders’ Equity | | | | |
| Number
of
Shares | | At Par
Value | | Capital in
Excess of
Par Value | | | | Number
of
Shares | | At
Cost | | | Non-
controlling
Interests | | Total
Equity |
| | | | | | | | | |
| | (In millions) |
| Balance at December 31, 2019 | 1,582 | | | $ | 158 | | | $ | 25,830 | | | $ | (12,280) | | | $ | (676) | | | 131 | | | $ | (3,734) | | | $ | 9,298 | | | $ | 8,150 | | | $ | 17,448 | |
| | | | | | | | | | | | | | | | | | | |
| | | | | | | | | | | | | | | | | | | |
| | | | | | | | | | | | | | | | | | | |
| | | | | | | | | | | | | | | | | | | |
| | | | | | | | | | | | | | | | | | | |
| Exercised and issued stock-based awards | 2 | | | — | | | 2 | | | — | | | — | | | — | | | — | | | 2 | | | — | | | 2 | |
| Stock-based compensation, including the tender of shares | — | | | — | | | 46 | | | — | | | — | | | — | | | (5) | | | 41 | | | 1 | | | 42 | |
| | | | | | | | | | | | | | | | | | | |
| | | | | | | | | | | | | | | | | | | |
| | | | | | | | | | | | | | | | | | | |
| | | | | | | | | | | | | | | | | | | |
| | | | | | | | | | | | | | | | | | | |
| | | | | | | | | | | | | | | | | | | |
| Change in ownership interests | — | | | — | | | — | | | — | | | — | | | — | | | — | | | — | | | 1 | | | 1 | |
| Contributions from noncontrolling interests | — | | | — | | | 56 | | | — | | | — | | | — | | | — | | | 56 | | | 59 | | | 115 | |
| | | | | | | | | | | | | | | | | | | |
| Net loss attributable to common stockholders | — | | | — | | | — | | | (109) | | | — | | | — | | | — | | | (109) | | | — | | | (109) | |
Net income attributable to noncontrolling interests | — | | | — | | | — | | | — | | | — | | | — | | | — | | | — | | | 116 | | | 116 | |
| Other comprehensive loss | — | | | — | | | — | | | — | | | (52) | | | — | | | — | | | (52) | | | (1) | | | (53) | |
| Balance at September 30, 2020 | 1,584 | | | $ | 158 | | | $ | 25,934 | | | $ | (12,389) | | | $ | (728) | | | 131 | | | $ | (3,739) | | | $ | 9,236 | | | $ | 8,326 | | | $ | 17,562 | |
Freeport-McMoRan Inc.
NOTES TO CONSOLIDATED FINANCIAL STATEMENTS (Unaudited)
NOTE 1. GENERAL INFORMATION
The accompanying unaudited consolidated financial statements have been prepared in accordance with the instructions to Form 10-Q and do not include all information and disclosures required by generally accepted accounting principles in the United States (U.S.). Therefore, this information should be read in conjunction with Freeport-McMoRan Inc.’s (FCX) consolidated financial statements and notes contained in its annual report on Form 10-K for the year ended December 31, 2020 (2020 Form 10-K). The information furnished herein reflects all adjustments that are, in the opinion of management, necessary for a fair statement of the results for the interim periods reported. All such adjustments are, in the opinion of management, of a normal recurring nature. Operating results for the nine-month period ended September 30, 2021, are not necessarily indicative of the results that may be expected for the year ending December 31, 2021.
Trade Accounts Receivable Agreements. In first-quarter 2021, PT Freeport Indonesia (PT-FI) entered into agreements to sell certain trade accounts receivables to unrelated third-party financial institutions. The agreements were entered into in the normal course of business to fund the working capital for the additional quantity of copper to be supplied by PT-FI to PT Smelting (PT-FI’s 39.5 percent owned copper smelter and refinery in Gresik, Indonesia - see “Acquisition of Minority Interest in PT Smelting” below for further discussion). The balances sold under the agreements were excluded from trade accounts receivable on the consolidated balance sheet at September 30, 2021. Receivables are considered sold when (i) they are transferred beyond the reach of PT-FI and its creditors, (ii) the purchaser has the right to pledge or exchange the receivables, and (iii) PT-FI has no continuing involvement in the transferred receivables. In addition, PT-FI provides no other forms of continued financial support to the purchaser of the receivables once the receivables are sold.
Gross amounts sold under these arrangements totaled $131 million in third-quarter 2021 and $319 million for the nine-month period ended September 30, 2021. Discounts on the sold receivables totaled less than $1 million in third-quarter 2021 and $1 million for the nine-month period ended September 30, 2021.
Acquisition of Minority Interest in PT Smelting. On April 30, 2021, PT-FI acquired 14.5 percent of the outstanding common stock of PT Smelting for $33 million, increasing its ownership interest from 25 percent to 39.5 percent. The remaining shares of PT Smelting continue to be owned by Mitsubishi Materials Corporation. PT-FI has continued to account for its investment in PT Smelting using the equity method since it does not have control over PT Smelting.
Sale of Freeport Cobalt. On September 1, 2021, FCX’s 56-percent-owned subsidiary, Koboltti Chemicals Holdings Limited (KCHL), completed the sale of its remaining cobalt business based in Kokkola, Finland (Freeport Cobalt) to Jervois Global Limited (Jervois) for $208 million (subject to post-closing adjustments), consisting of cash consideration of $173 million and 7 percent of Jervois shares (valued at $35 million). At closing, Freeport Cobalt’s assets included cash of approximately $20 million and other net assets of $125 million. FCX recorded a gain of $60 million ($34 million to net income attributable to common stock) in third-quarter 2021. In addition, KCHL will have the right to receive contingent consideration of up to $40 million based on the future performance of Freeport Cobalt. Any gain related to the contingent consideration will be recognized when received.
The operating results of Freeport Cobalt are not significant to FCX’s financial statements for the year ended December 31, 2020, or the three- and nine-month periods ended September 30, 2021.
Subsequent Events. FCX evaluated events after September 30, 2021, and through the date the consolidated financial statements were issued, and took into account events and transactions occurring during this period requiring recognition or disclosure in these consolidated financial statements.
NOTE 2. EARNINGS PER SHARE
FCX calculates its basic net income per share of common stock under the two-class method and calculates its diluted net income (loss) per share of common stock using the more dilutive of the two-class method or the treasury-stock method. Basic net income (loss) per share of common stock was computed by dividing net income (loss) attributable to common stockholders (after deducting accumulated dividends and undistributed earnings to participating securities) by the weighted-average shares of common stock outstanding during the period. Diluted net income (loss) per share of common stock was calculated by including the basic weighted-average shares of common stock outstanding adjusted for the effects of all potential dilutive shares of common stock.
Reconciliations of net income and weighted-average shares of common stock outstanding for purposes of calculating basic and diluted net income (loss) per share follow (in millions, except per share amounts):
| | | | | | | | | | | | | | | | | | | | | | | | | | |
| Three Months Ended | | Nine Months Ended | |
| September 30, | | September 30, | |
| | 2021 | | 2020 | | 2021 | | 2020 | |
| Net income | $ | 1,723 | | | $ | 432 | | | $ | 4,007 | | | $ | 7 | | |
| Net income attributable to noncontrolling interests | (324) | | | (103) | | | (807) | | | (116) | | |
| | | | | | | | |
| Undistributed earnings allocated to participating securities | (4) | | | (3) | | | (6) | | | (3) | | |
| | | | | | | | |
| | | | | | | | |
| | | | | | | | |
| | | | | | | | |
| | | | | | | | |
| | | | | | | | |
| | | | | | | | |
| Net income (loss) attributable to common stockholders | $ | 1,395 | | | $ | 326 | | | $ | 3,194 | | | $ | (112) | | |
| | | | | | | | |
| | | | | | | | |
Basic weighted-average shares of common stock outstanding | 1,469 | | | 1,453 | | | 1,466 | | | 1,453 | | |
| Add shares issuable upon exercise or vesting of dilutive stock options and restricted stock units (RSUs) | 15 | | | 8 | | a | 15 | | | — | | a |
Diluted weighted-average shares of common stock outstanding | 1,484 | | | 1,461 | | | 1,481 | | | 1,453 | | |
| | | | | | | | |
| | | | | | | | |
| | | | | | | | |
| | | | | | | | |
| Basic net income (loss) per share attributable to common stockholders | $ | 0.95 | | | $ | 0.22 | | | $ | 2.18 | | | $ | (0.08) | | |
| | | | | | | | |
| | | | | | | | |
| | | | | | | | |
| Diluted net income (loss) per share attributable to common stockholders | $ | 0.94 | | | $ | 0.22 | | | $ | 2.16 | | | $ | (0.08) | | |
a.Excludes approximately 2 million shares in third-quarter 2020 and 13 million shares for the first nine months of 2020 associated with outstanding stock options with exercise prices less than the average market price of FCX’s common stock and RSUs that were anti-dilutive.
Outstanding stock options with exercise prices greater than the average market price of FCX’s common stock during the period are excluded from the computation of diluted net income (loss) per share of common stock. Stock options for 4 million shares of common stock in third-quarter 2021, 28 million shares of common stock in third-quarter 2020, 6 million shares of common stock for the first nine months of 2021 and 35 million shares of common stock the first nine months of 2020 were excluded.
NOTE 3. INVENTORIES, INCLUDING LONG-TERM MILL AND LEACH STOCKPILES
The components of inventories follow (in millions):
| | | | | | | | | | | | | | |
| September 30, 2021 | | December 31, 2020 | |
| Current inventories: | | | | |
Total materials and supplies, neta | $ | 1,617 | | | $ | 1,594 | | |
| | | | |
| Mill stockpiles | $ | 209 | | | $ | 205 | | |
| Leach stockpiles | 877 | | | 809 | | |
| Total current mill and leach stockpiles | $ | 1,086 | | | $ | 1,014 | | |
| | | | |
| Raw materials (primarily concentrate) | $ | 437 | | | $ | 366 | | |
| Work-in-process | 184 | | | 174 | | |
| Finished goods | 796 | | | 745 | | |
| Total product | $ | 1,417 | | | $ | 1,285 | | |
| | | | |
| Long-term inventories: | | | | |
| Mill stockpiles | $ | 223 | | | $ | 223 | | |
| Leach stockpiles | 1,227 | | | 1,240 | | |
Total long-term mill and leach stockpilesb | $ | 1,450 | | | $ | 1,463 | | |
a.Materials and supplies inventory was net of obsolescence reserves totaling $37 million at September 30, 2021, and $32 million at December 31, 2020.
b.Estimated metals in stockpiles not expected to be recovered within the next 12 months.
FCX recorded charges for metals inventory adjustments totaling $15 million for the first nine months of 2021 primarily related to a leach stockpile adjustment. Net realizable value inventory adjustments to decrease metals inventory carrying values totaled $92 million for the first nine months of 2020 associated with lower market prices for copper ($58 million) and molybdenum ($34 million). Refer to Note 9 for metals inventory adjustments by business segment.
Morenci Stockpile Recoveries. In accordance with FCX's policy, processes and recovery rates for mill and leach stockpiles are monitored regularly, and recovery rate estimates are adjusted periodically as additional information becomes available and as related technology changes. Adjustments to recovery rates will typically result in a future impact to the value of the material removed from the stockpiles at a revised weighted-average cost per pound of recoverable copper.
Expected copper recovery rates for leach stockpiles are determined using small-scale laboratory tests, small- to large-scale column testing (which simulates the production process), historical trends and other factors, including mineralogy of the ore and rock type. Total copper recovery in leach stockpiles can vary significantly from a low percentage to more than 90 percent depending on several variables, including processing methodology, processing variables, mineralogy and particle size of the rock. For newly placed material on active stockpiles, as much as 80 percent of the total copper recovery may occur during the first year, and the remaining copper may be recovered over many years.
Over the last three years, FCX's Morenci mine has experienced improved recoveries and following an analysis of column testing results to date, Morenci concluded it had sufficient evidence to increase its estimated recovery rate for certain of its leach stockpiles effective July 1, 2021. As a result of the revised recovery rate, Morenci increased its estimated recoverable copper in leach stockpiles, net to its joint venture interest, by 191 million pounds. The effect of this change in estimate reduced site production and delivery costs and increased net income by $52 million ($0.04 per share) in the third quarter and first nine months of 2021.
NOTE 4. INCOME TAXES
Geographic sources of FCX’s (provision for) benefit from income taxes follow (in millions):
| | | | | | | | | | | | | | |
| Nine Months Ended | |
| September 30, | |
| | 2021 | | 2020 | |
| U.S. operations | $ | (7) | |
| $ | 56 | | a |
| International operations | (1,667) | | b | (389) | | c |
| Total | $ | (1,674) | | | $ | (333) | |
|
a.Includes a tax credit of $53 million associated with the reversal of a year-end 2019 tax charge related to the sale of FCX’s interest in the lower zone of the Timok exploration project in Serbia.
b.Includes net tax benefits totaling $83 million ($66 million net of noncontrolling interest), consisting of $69 million associated with the release of a portion of the valuation allowances recorded against PT Rio Tinto Indonesia (PT RTI), PT-FI’s wholly owned subsidiary, net operating losses (NOLs) and $24 million primarily associated with the reversal of a tax reserve related to the treatment of prior year contractor support costs; partly offset by a tax charge of $10 million associated with the audit of PT-FI's 2019 tax returns.
c.Includes a tax charge of $21 million ($17 million net of noncontrolling interests) associated with establishing a tax reserve related to the treatment of prior year contractor support costs.
FCX’s consolidated effective income tax rate was 29 percent for the first nine months of 2021 and 102 percent for the first nine months of 2020. Because FCX's U.S. jurisdiction generated pre-tax losses for the first nine months of 2020 that did not result in a realized tax benefit, applicable accounting rules required FCX to adjust its 2020 estimated annual effective tax rate to exclude the impact of U.S. pre-tax losses. Variations in the relative proportions of jurisdictional income result in fluctuations to FCX’s consolidated effective income tax rate.
As discussed in Note 8, Cerro Verde paid the balance of its royalty dispute liabilities during third-quarter 2021, which resulted in a $252 million reduction of unrecognized tax benefits (including a $137 million reduction of accrued interest and penalties), but did not have an impact on FCX’s provision for income taxes for the third quarter or nine months ended September 30, 2021.
In connection with the negative impacts of the COVID-19 pandemic on the global economy, governments throughout the world announced measures that are intended to provide tax and other financial relief. Such measures include the American Rescue Plan Act of 2021, enacted on March 11, 2021, and the Coronavirus Aid, Relief, and Economic Security Act (CARES Act), enacted on March 27, 2020. None of these measures resulted in material impacts to FCX’s provision for income taxes for the nine months ended September 30, 2021 and 2020. However, certain provisions of the CARES Act provided FCX with the opportunity to accelerate collections of tax refunds, primarily those associated with the U.S. alternative minimum tax. FCX collected U.S. alternative minimum tax credit refunds of $23 million in March 2021, $24 million in October 2020 and $221 million in July 2020. FCX continues to evaluate income tax accounting considerations of COVID-19 measures as they develop, including any impact on its measurement of existing deferred tax assets and deferred tax liabilities. FCX will recognize any impact from COVID-19 related changes to tax laws in the period in which the new legislation is enacted.
As previously disclosed in our 2020 Form 10-K, PT-FI received unfavorable Indonesia Tax Court decisions in 2018 with respect to its appeal of capitalized mine development costs on its 2012 and 2014 corporate income tax returns. PT-FI appealed those decisions to the Indonesia Supreme Court. On October 31, 2019, the Indonesia Supreme Court communicated an unfavorable ruling regarding the treatment of mine development costs on PT-FI’s 2014 tax return. During the fourth quarter of 2019, PT-FI met with the Indonesia Tax Office and developed a framework for resolution of the disputed matters and progress of the framework for resolution continued in 2020 and through the nine months ended September 30, 2021.
During October 2021, PT-FI participated in discussions with the Indonesian tax office regarding progress on the framework for resolution of disputes arising from the audits of tax years 2012 through 2016. As a result of these discussions and the revised positions taken by both the Indonesian tax office and PT-FI, FCX believes it can no longer conclude a resolution of all of the disputed tax items at a more-likely-than-not threshold. Because of these recent events, FCX continues to evaluate its uncertain tax positions and may record a material tax charge during fourth-quarter 2021. This tax charge may be offset by a tax benefit related to the additional release of valuation allowance associated with PT Rio Tinto net operating loss carryforwards that PT-FI may deem realizable. PT-FI will
continue to engage with the Indonesian tax office in pursuit of certain aspects of the original framework for resolution.
NOTE 5. DEBT AND FINANCIAL POLICY
The components of debt follow (in millions):
| | | | | | | | | | | | | | |
| | | September 30,
2021 | | December 31, 2020 |
| | | | |
| | | | |
| | | | |
| Senior notes and debentures: | | | | |
| Issued by FCX | | $ | 8,790 | | | $ | 8,783 | |
| Issued by Freeport Minerals Corporation | | 355 | | | 356 | |
| | | | |
| Cerro Verde Term Loan | | 325 | | | 523 | |
| PT-FI Term Loan | | 146 | | | — | |
| Other | | 49 | | | 49 | |
| Total debt | | 9,665 | | | 9,711 | |
| Less current portion of debt | | (897) | | a | (34) | |
| Long-term debt | | $ | 8,768 | | | $ | 9,677 | |
a.Includes $524 million for the 3.55% Senior Notes, which will be redeemed on December 1, 2021, and $325 million for the Cerro Verde Term Loan due June 2022.
Revolving Credit Facility. At September 30, 2021, FCX had no borrowings outstanding and $8 million in letters of credit issued under its revolving credit facility, resulting in availability of approximately $3.5 billion, of which approximately $1.5 billion could be used for additional letters of credit. Availability under FCX’s revolving credit facility consists of $3.28 billion maturing April 2024 and $220 million maturing April 2023.
In March 2021, FCX delivered a Covenant Reversion Notice (as defined in the third amendment to the revolving credit facility dated June 3, 2020), which provided notification of its election to end the Covenant Increase Period (as defined in the third amendment to the revolving credit facility dated June 3, 2020). As a result, the leverage ratio limit reverted to 5.25x and stepped down to 3.75x beginning with the quarter ending September 30, 2021, and the interest expense coverage ratio minimum reverted to 2.25x. Additionally, following FCX’s election to end the Covenant Increase Period, the additional limits on priority debt and liens, and the provisions related to minimum liquidity and restricted payments (which included restrictions on the payment of common stock dividends) are no longer applicable. At September 30, 2021, FCX was in compliance with its revolving credit facility covenants.
PT-FI Credit Facility. In July 2021, PT-FI entered into a $1.0 billion, five-year, unsecured credit facility (consisting of a $667 million term loan and a $333 million revolving credit facility) to fund project costs in connection with the PT Smelting expansion and construction of a precious metals refinery (PMR), and for PT-FI’s general corporate purposes. The term loan allows for borrowings up to $667 million within the first three years, and then the loan amortizes in four installments, with 15 percent of the outstanding balance due in January 2025, 15 percent due in July 2025, 35 percent due in January 2026 and the remaining 35 percent due in July 2026. The $333 million revolving credit facility is available for drawings until June 2026. Amounts drawn under the credit facility bear interest at the London Inter-bank Offered Rate plus a margin of 1.875% or 2.125%, as defined by the agreement.
PT-FI’s credit facility contains customary affirmative covenants and representations and also contains standard covenants that, among other things, restrict, subject to certain exceptions, the ability of PT-FI to incur additional indebtedness; create liens on assets; enter into sale and leaseback transactions; sell assets; and modify or amend the shareholders agreement or related governance structure. The credit facility also contains financial ratios governing maximum total leverage and minimum interest expense coverage and certain environmental and social compliance requirements.
As of September 30, 2021, $158 million ($146 million net of debt issuance costs) was drawn under the PT-FI Term Loan and no amounts were drawn under the revolving credit facility.
Senior Notes. On October 21, 2021, FCX called for redemption all of its outstanding $524 million principal amount of 3.55% Senior Notes due 2022. The notes will be redeemed on December 1, 2021, at a redemption price equal to 100 percent of the principal amount of the notes outstanding, plus accrued and unpaid interest to, but not including, the redemption date. Annual interest costs associated with the 3.55% Senior Notes approximate $19 million. FCX has no other senior note maturities until March 2023.
As further discussed in the 2020 Form 10-K, in the first nine months of 2020, FCX redeemed in full or purchased a portion of its 4.00% Senior Notes due 2021, 3.55% Senior Notes due 2022, 3.875% Senior Notes due 2023 and 4.55% Senior Notes due 2024. As a result of these transactions, FCX recorded a loss on early extinguishment of debt of $59 million in third-quarter 2020 and $100 million for the nine months ended September 30, 2020.
Cerro Verde Term Loan. In September 2021, Cerro Verde prepaid $200 million on its term loan. The $325 million balance of the loan is due June 2022.
Interest Expense, Net. Consolidated interest costs (before capitalization) totaled $157 million in third-quarter 2021, $160 million in third-quarter 2020, $482 million for the first nine months of 2021 and $490 million for the first nine months of 2020. Capitalized interest added to property, plant, equipment and mine development costs, net, totaled $19 million in third-quarter 2021, $40 million in third-quarter 2020, $51 million for the first nine months of 2021 and $128 million for the first nine months of 2020. The decrease in capitalized interest for the 2021 periods results from assets placed in service as PT-FI’s underground mining operations continue to ramp up.
Financial Policy. In February 2021, FCX’s Board of Directors (Board) adopted a financial policy for the allocation of cash flows aligned with FCX’s strategic objectives of maintaining a strong balance sheet and increasing cash returns to shareholders while advancing opportunities for future growth. The policy includes a base dividend and a performance-based payout framework, whereby up to 50 percent of available cash flows generated after planned capital spending and distributions to noncontrolling interests would be allocated to shareholder returns and the balance to debt reduction and investments in value enhancing growth projects, subject to FCX maintaining its net debt at a level not to exceed the net debt target of $3 billion to $4 billion (excluding project debt for additional smelting capacity in Indonesia).
In February 2021, the Board reinstated a cash dividend on FCX’s common stock (base dividend), and on November 1, 2021, the Board approved (i) a new share repurchase program authorizing repurchases of up to $3.0 billion of FCX common stock, and (ii) a variable cash dividend on FCX’s common stock for 2022.
The timing and amount of any share repurchases will be at the discretion of management and will depend on a variety of factors. The share repurchase program may be modified, increased, suspended or terminated at any time at the Board’s discretion. The declaration and payment of dividends (base or variable) is also at the discretion of the Board and will depend on FCX's financial results, cash requirements, business prospects, global economic conditions and other factors deemed relevant by the Board.
On September 22, 2021, FCX declared a quarterly cash dividend (base dividend) of $0.075 per share
on its common stock, which was paid on November 1, 2021, to common stockholders of record as of October 15, 2021.
NOTE 6. FINANCIAL INSTRUMENTS
FCX does not purchase, hold or sell derivative financial instruments unless there is an existing asset or obligation, or it anticipates a future activity that is likely to occur and will result in exposure to market risks, which FCX intends to offset or mitigate. FCX does not enter into any derivative financial instruments for speculative purposes but has entered into derivative financial instruments in limited instances to achieve specific objectives. These objectives principally relate to managing risks associated with commodity price changes, foreign currency exchange rates and interest rates.
Commodity Contracts. From time to time, FCX has entered into derivative contracts to hedge the market risk associated with fluctuations in the prices of commodities it purchases and sells. Derivative financial instruments used by FCX to manage its risks do not contain credit risk-related contingent provisions.
In April 2020, FCX entered into forward sales contracts for 150 million pounds of copper for settlement in May and June of 2020. The forward sales provided for fixed pricing of $2.34 per pound of copper on approximately 60 percent of North America's sales volumes for May and June 2020. These contracts resulted in hedging losses totaling $24 million in second-quarter 2020 and for the six months ended June 30, 2020. There were no remaining forward sales contracts as of June 30, 2020.
A discussion of FCX’s other derivative contracts and programs follows:
Derivatives Designated as Hedging Instruments – Fair Value Hedges
Copper Futures and Swap Contracts. Some of FCX’s U.S. copper rod and cathode customers request a fixed market price instead of the Commodity Exchange Inc. (COMEX) average copper price in the month of shipment. FCX hedges this price exposure in a manner that allows it to receive the COMEX average price in the month of shipment while the customers pay the fixed price they requested. FCX accomplishes this by entering into copper futures or swap contracts. Hedging gains or losses from these copper futures and swap contracts are recorded in revenues. FCX did not have any significant gains or losses resulting from hedge ineffectiveness during the nine-month periods ended September 30, 2021 and 2020. At September 30, 2021, FCX held copper futures and swap contracts that qualified for hedge accounting for 84 million pounds at an average contract price of $4.23 per pound, with maturities through May 2023.
A summary of gains (losses) recognized in revenues for derivative financial instruments related to commodity contracts that are designated and qualify as fair value hedge transactions, including the unrealized (losses) gains on the related hedged item follows (in millions):
| | | | | | | | | | | | | | | | | | | | | | | |
| | Three Months Ended | | Nine Months Ended |
| September 30, | | September 30, |
| | 2021 | | 2020 | | 2021 | | 2020 |
| Copper futures and swap contracts: | | | | | | | |
| Unrealized (losses) gains: | | | | | | | |
| Derivative financial instruments | $ | (20) | | | $ | 1 | | | $ | (28) | | | $ | 8 | |
| Hedged item – firm sales commitments | 20 | | | (1) | | | 28 | | | (8) | |
| | | | | | | |
| Realized gains (losses): | | | | | | | |
| Matured derivative financial instruments | 5 | | | 15 | | | 57 | | | (1) | |
Derivatives Not Designated as Hedging Instruments
Embedded Derivatives. Certain FCX concentrate, copper cathode and gold sales contracts provide for provisional pricing primarily based on the London Metal Exchange (LME) copper price or the COMEX copper price and the London Bullion Market Association (London) gold price at the time of shipment as specified in the contract. FCX receives market prices based on prices in the specified future month, which results in price fluctuations recorded in revenues until the date of settlement. FCX records revenues and invoices customers at the time of shipment based on then-current LME or COMEX copper prices and the London gold prices as specified in the contracts, which results in an embedded derivative (i.e., a pricing mechanism that is finalized after the time of delivery) that is required to be bifurcated from the host contract. The host contract is the sale of the metals contained in the concentrate or cathode at the then-current LME or COMEX copper price, and the London gold price. FCX applies the normal purchases and normal sales scope exception in accordance with derivatives and hedge accounting guidance to the host contract in its concentrate or cathode sales agreements since these contracts do not allow for net settlement and always result in physical delivery. The embedded derivative does not qualify for hedge accounting and is adjusted to fair value through earnings each period, using the period-end LME or COMEX copper forward prices and the adjusted London gold prices, until the date of final pricing. Similarly, FCX purchases copper under contracts that provide for provisional pricing. Mark-to-market price fluctuations from these embedded derivatives are recorded through the settlement date and are reflected in revenues for sales contracts and in inventory for purchase contracts.
A summary of FCX’s embedded derivatives at September 30, 2021, follows:
| | | | | | | | | | | | | | | | | | | | | | | |
| Open Positions | | Average Price
Per Unit | | Maturities Through |
| | | Contract | | Market | |
| Embedded derivatives in provisional sales contracts: | | | | | | | |
| Copper (millions of pounds) | 548 | | | $ | 4.28 | | | $ | 4.05 | | | February 2022 |
| Gold (thousands of ounces) | 196 | | | 1,790 | | | 1,738 | | | January 2022 |
| Embedded derivatives in provisional purchase contracts: | | | | | | | |
| Copper (millions of pounds) | 116 | | | 4.31 | | | 4.05 | | | February 2022 |
| | | | | | | |
Copper Forward Contracts. Atlantic Copper, FCX’s wholly owned smelting and refining unit in Spain, enters into copper forward contracts designed to hedge its copper price risk whenever its physical purchases and sales pricing periods do not match. These economic hedge transactions are intended to hedge against changes in copper prices, with the mark-to-market hedging gains or losses recorded in production and delivery costs. At September 30, 2021, Atlantic Copper held net copper forward purchase contracts for 9 million pounds at an average contract price of $4.23 per pound, with maturities through November 2021.
Summary of (Losses) Gains. A summary of the realized and unrealized (losses) gains recognized in operating income for commodity contracts that do not qualify as hedge transactions, including embedded derivatives, follows (in millions):
| | | | | | | | | | | | | | | | | | | | | | | |
| | Three Months Ended | | Nine Months Ended |
| September 30, | | September 30, |
| | 2021 | | 2020 | | 2021 | | 2020 |
Embedded derivatives in provisional sales contracts:a | | | | | | | |
| Copper | $ | (102) | | | $ | 94 | | | $ | 223 | | | $ | 18 | |
| Gold and other metals | (9) | | | 15 | | | (22) | | | 39 | |
Copper forward contractsb | 1 | | | (7) | | | (12) | | | 12 | |
| | | | | | | |
| | | | | | | |
a.Amounts recorded in revenues.
b.Amounts recorded in cost of sales as production and delivery costs.
Unsettled Derivative Financial Instruments
A summary of the fair values of unsettled commodity derivative financial instruments follows (in millions):
| | | | | | | | | | | | | | |
| | September 30,
2021 | | December 31, 2020 |
| Commodity Derivative Assets: | | | | |
Derivatives designated as hedging instruments: | | | | |
| Copper futures and swap contracts | | $ | 2 | | | $ | 15 | |
Derivatives not designated as hedging instruments: | | | | |
| Embedded derivatives in provisional sales/purchase contracts | | 30 | | | 169 | |
| Copper forward contracts | | 5 | | | — | |
| Total derivative assets | | $ | 37 | | | $ | 184 | |
| | | | |
| Commodity Derivative Liabilities: | | | | |
Derivatives designated as hedging instruments: | | | | |
| Copper futures and swap contracts | | $ | 14 | | | $ | — | |
Derivatives not designated as hedging instruments: | | | | |
| Embedded derivatives in provisional sales/purchase contracts | | 134 | | | 21 | |
| | | | |
| | | | |
| Copper forward contracts | | 4 | | | — | |
| Total derivative liabilities | | $ | 152 | | | $ | 21 | |
FCX’s commodity contracts have netting arrangements with counterparties with which the right of offset exists, and it is FCX’s policy to generally offset balances by contract on its balance sheet. FCX’s embedded derivatives on provisional sales/purchase contracts are netted with the corresponding outstanding receivable/payable balances.
A summary of these unsettled commodity contracts that are offset in the balance sheets follows (in millions):
| | | | | | | | | | | | | | | | | | | | | | | | | | |
| | Assets | | Liabilities |
| | September 30,
2021 | | December 31, 2020 | | September 30,
2021 | | December 31, 2020 |
| | | | | | | | |
| Gross amounts recognized: | | | | | | | | |
| Embedded derivatives in provisional | | | | | | | | |
| sales/purchase contracts | | $ | 30 | | | $ | 169 | | | $ | 134 | | | $ | 21 | |
| | | | | | | | |
| Copper derivatives | | 7 | | | 15 | | | 18 | | | — | |
| | 37 | | | 184 | | | 152 | | | 21 | |
| | | | | | | | |
| Less gross amounts of offset: | | | | | | | | |
| Embedded derivatives in provisional | | | | | | | | |
| sales/purchase contracts | | — | | | 1 | | | — | | | 1 | |
| | | | | | | | |
| Copper derivatives | | 4 | | | — | | | 4 | | | — | |
| | 4 | | | 1 | | | 4 | | | 1 | |
| | | | | | | | |
| Net amounts presented in balance sheet: | | | | | | | | |
| Embedded derivatives in provisional | | | | | | | | |
| sales/purchase contracts | | 30 | | | 168 | | | 134 | | | 20 | |
| | | | | | | | |
| Copper derivatives | | 3 | | | 15 | | | 14 | | | — | |
| | $ | 33 | | | $ | 183 | | | $ | 148 | | | $ | 20 | |
| | | | | | | | |
| Balance sheet classification: | | | | | | | | |
| Trade accounts receivable | | $ | 3 | | | $ | 168 | | | $ | 101 | | | $ | — | |
| Other current assets | | 4 | | | 15 | | | — | | | — | |
| | | | | | | | |
| | | | | | | | |
| Accounts payable and accrued liabilities | | 26 | | | — | | | 45 | | | 20 | |
| Other liabilities | | — | | | — | | | 2 | | | — | |
| | $ | 33 | | | $ | 183 | | | $ | 148 | | | $ | 20 | |
Credit Risk. FCX is exposed to credit loss when financial institutions with which it has entered into derivative transactions (commodity, foreign exchange and interest rate swaps) are unable to pay. To minimize the risk of such losses, FCX uses counterparties that meet certain credit requirements and periodically reviews the creditworthiness of these counterparties. As of September 30, 2021, the maximum amount of credit exposure associated with derivative transactions was $37 million.
Other Financial Instruments. Other financial instruments include cash and cash equivalents, restricted cash, restricted cash equivalents, accounts receivable, investment securities, legally restricted funds, accounts payable and accrued liabilities, dividends payable and debt. The carrying value for cash and cash equivalents (which included time deposits of $0.2 billion at September 30, 2021, and $0.3 billion at December 31, 2020), restricted cash, restricted cash equivalents, accounts receivable, accounts payable and accrued liabilities, and dividends payable approximates fair value because of their short-term nature and generally negligible credit losses (refer to Note 7 for the fair values of investment securities, legally restricted funds and debt).
In addition, as of September 30, 2021, FCX has contingent consideration assets related to the sales of certain oil and gas properties (refer to Note 7 for the related fair values).
Cash, Cash Equivalents, Restricted Cash and Restricted Cash Equivalents. The following table provides a reconciliation of total cash, cash equivalents, restricted cash and restricted cash equivalents presented in the consolidated statements of cash flows (in millions):
| | | | | | | | | | | | | | |
| | September 30,
2021 | | December 31, 2020 |
| Balance sheet components: | | | | |
| Cash and cash equivalents | | $ | 7,672 | | | $ | 3,657 | |
| Restricted cash and restricted cash equivalents included in: | | | | |
| Other current assets | | 114 | | | 97 | |
| Other assets | | 133 | | | 149 | |
| Total cash, cash equivalents, restricted cash and restricted cash equivalents presented in the consolidated statements of cash flows | | $ | 7,919 | | | $ | 3,903 | |
NOTE 7. FAIR VALUE MEASUREMENT
Fair value accounting guidance includes a hierarchy that prioritizes the inputs to valuation techniques used to measure fair value. The hierarchy gives the highest priority to unadjusted quoted prices in active markets for identical assets or liabilities (Level 1) and the lowest priority to unobservable inputs (Level 3). FCX did not have any significant transfers in or out of Level 3 during third-quarter 2021.
FCX’s financial instruments are recorded on the consolidated balance sheets at fair value except for contingent consideration associated with the sale of the Deepwater Gulf of Mexico (GOM) oil and gas properties (which was recorded under the loss recovery approach) and debt. A summary of the carrying amount and fair value of FCX’s financial instruments (including those measured at net asset value (NAV) as a practical expedient), other than cash and cash equivalents, restricted cash, restricted cash equivalents, accounts receivable, accounts payable and accrued liabilities, and dividends payable (refer to Note 6) follows (in millions):
| | | | | | | | | | | | | | | | | | | | | | | | | | | | | | | | | | | |
| At September 30, 2021 |
| | Carrying | | Fair Value |
| | Amount | | Total | | NAV | | Level 1 | | Level 2 | | Level 3 |
| Assets | | | | | | | | | | | |
Investment securities:a,b | | | | | | | | | | | |
| Equity securities | $ | 52 | | | $ | 52 | | | $ | — | | | $ | 52 | | | $ | — | | | $ | — | |
| U.S. core fixed income fund | 29 | | | 29 | | | 29 | | | — | | | — | | | — | |
| | | | | | | | | | | |
| Total | 81 | | | 81 | | | 29 | | | 52 | | | — | | | — | |
| | | | | | | | | | | |
Legally restricted funds:a | | | | | | | | | | | |
| U.S. core fixed income fund | 64 | | | 64 | | | 64 | | | — | | | — | | | — | |
| Government bonds and notes | 53 | | | 53 | | | — | | | — | | | 53 | | | — | |
| Corporate bonds | 42 | | | 42 | | | — | | | — | | | 42 | | | — | |
| Government mortgage-backed securities | 24 | | | 24 | | | — | | | — | | | 24 | | | — | |
| Asset-backed securities | 14 | | | 14 | | | — | | | — | | | 14 | | | — | |
| Money market funds | 8 | | | 8 | | | — | | | 8 | | | — | | | — | |
| Collateralized mortgage-backed securities | 4 | | | 4 | | | — | | | — | | | 4 | | | — | |
| Municipal bonds | 1 | | | 1 | | | — | | | — | | | 1 | | | — | |
| Total | 210 | | | 210 | | | 64 | | | 8 | | | 138 | | | — | |
| | | | | | | | | | | |
| Derivatives: | | | | | | | | | | | |
Embedded derivatives in provisional sales/purchase contracts in a gross asset positionc | 30 | | | 30 | | | — | | | — | | | 30 | | | — | |
| | | | | | | | | | | |
Copper forward contractsc | 5 | | | 5 | | | — | | | 2 | | | 3 | | | — | |
Copper futures and swap contractsc | 2 | | | 2 | | | — | | | — | | | 2 | | | — | |
| | | | | | | | | | | |
| | | | | | | | | | | |
| | | | | | | | | | | |
| Total | 37 | | | 37 | | | — | | | 2 | | | 35 | | | — | |
| | | | | | | | | | | |
| Contingent consideration for the sale of the | | | | | | | | | | | |
Deepwater GOM oil and gas propertiesa | 94 | | | 85 | | | — | | | — | | | — | | | 85 | |
| | | | | | | | | | | |
| | | | | | | | | | | |
| | | | | | | | | | | |
| Liabilities | | | | | | | | | | | |
Derivatives:c | | | | | | | | | | | |
| Embedded derivatives in provisional sales/purchase contracts in a gross liability position | 134 | | | 134 | | | — | | | — | | | 134 | | | — | |
| | | | | | | | | | | |
| | | | | | | | | | | |
Copper futures and swap contractsc | 14 | | | 14 | | | — | | | 14 | | | — | | | — | |
| Copper forward contracts | 4 | | | 4 | | | — | | | 1 | | | 3 | | | — | |
| | | | | | | | | | | |
| Total | 152 | | | 152 | | | — | | | 15 | | | 137 | | | — | |
| | | | | | | | | | | |
| | | | | | | | | | | |
| | | | | | | | | | | |
| | | | | | | | | | | |
Long-term debt, including current portiond | 9,665 | | | 10,791 | | | — | | | — | | | 10,791 | | | — | |
| | | | | | | | | | | |
| | | | | | | | | | | |
| | | | | | | | | | | | | | | | | | | | | | | | | | | | | | | | | | | |
| At December 31, 2020 |
| | Carrying | | Fair Value |
| | Amount | | Total | | NAV | | Level 1 | | Level 2 | | Level 3 |
| Assets | | | | | | | | | | | |
Investment securities:a,b | | | | | | | | | | | |
| U.S. core fixed income fund | $ | 29 | | | $ | 29 | | | $ | 29 | | | $ | — | | | $ | — | | | $ | — | |
| | | | | | | | | | | |
| Equity securities | 7 | | | 7 | | | — | | | 7 | | | — | | | — | |
| Total | 36 | | | 36 | | | 29 | | | 7 | | | — | | | — | |
| | | | | | | | | | | |
Legally restricted funds:a | | | | | | | | | | | |
| U.S. core fixed income fund | 65 | | | 65 | | | 65 | | | — | | | — | | | — | |
| Government bonds and notes | 49 | | | 49 | | | — | | | — | | | 49 | | | — | |
| Corporate bonds | 43 | | | 43 | | | — | | | — | | | 43 | | | — | |
| Government mortgage-backed securities | 30 | | | 30 | | | — | | | — | | | 30 | | | — | |
| Asset-backed securities | 16 | | | 16 | | | — | | | — | | | 16 | | | — | |
| Money market funds | 5 | | | 5 | | | — | | | 5 | | | — | | | — | |
| Collateralized mortgage-backed securities | 4 | | | 4 | | | — | | | — | | | 4 | | | — | |
| Municipal bonds | 1 | | | 1 | | | — | | | — | | | 1 | | | — | |
| Total | 213 | | | 213 | | | 65 | | | 5 | | | 143 | | | — | |
| | | | | | | | | | | |
| Derivatives: | | | | | | | | | | | |
Embedded derivatives in provisional sales/purchase contracts in a gross asset positionc | 169 | | | 169 | | | — | | | — | | | 169 | | | — | |
Copper futures and swap contractsc | 15 | | | 15 | | | — | | | 13 | | | 2 | | | — | |
| | | | | | | | | | | |
| | | | | | | | | | | |
| | | | | | | | | | | |
| Total | 184 | | | 184 | | | — | | | 13 | | | 171 | | | — | |
| | | | | | | | | | | |
| Contingent consideration for the sale of the | | | | | | | | | | | |
Deepwater GOM oil and gas propertiesa | 108 | | | 88 | | | — | | | — | | | — | | | 88 | |
| | | | | | | | | | | |
| | | | | | | | | | | |
| | | | | | | | | | | |
| Liabilities | | | | | | | | | | | |
Derivatives:c | | | | | | | | | | | |
| Embedded derivatives in provisional sales/purchase contracts in a gross liability position | 21 | | | 21 | | | — | | | — | | | 21 | | | — | |
| | | | | | | | | | | |
| | | | | | | | | | | |
| | | | | | | | | | | |
| | | | | | | | | | | |
| | | | | | | | | | | |
| | | | | | | | | | | |
| | | | | | | | | | | |
| | | | | | | | | | | |
| | | | | | | | | | | |
Long-term debt, including current portiond | 9,711 | | | 10,994 | | | — | | | — | | | 10,994 | | | — | |
| | | | | | | | | | | |
| | | | | | | | | | | |
a.Current portion included in other current assets and long-term portion included in other assets.
b.Excludes time deposits (which approximated fair value) included in (i) other current assets of $114 million at September 30, 2021, and $97 million at December 31, 2020, and (ii) other assets of $132 million at September 30, 2021, and $148 million at December 31, 2020, primarily associated with an assurance bond to support PT-FI’s commitment for additional domestic smelter development in Indonesia and PT-FI’s closure and reclamation guarantees.
c.Refer to Note 6 for further discussion and balance sheet classifications.
d.Recorded at cost except for debt assumed in acquisitions, which are recorded at fair value at the respective acquisition dates.
Valuation Techniques. The U.S. core fixed income fund is valued at NAV. The fund strategy seeks total return consisting of income and capital appreciation primarily by investing in a broad range of investment-grade debt securities, including U.S. government obligations, corporate bonds, mortgage-backed securities, asset-backed securities and money market instruments. There are no restrictions on redemptions (which are usually within one business day of notice).
Equity securities are valued at the closing price reported on the active market on which the individual securities are traded and, as such, are classified within Level 1 of the fair value hierarchy.
Fixed income securities (government securities, corporate bonds, asset-backed securities, collateralized mortgage-backed securities and municipal bonds) are valued using a bid-evaluation price or a mid-evaluation price. These evaluations are based on quoted prices, if available, or models that use observable inputs and, as such, are classified within Level 2 of the fair value hierarchy.
Money market funds are classified within Level 1 of the fair value hierarchy because they are valued using quoted market prices in active markets.
FCX’s embedded derivatives on provisional copper concentrate, copper cathode and gold purchases and sales are valued using quoted monthly LME or COMEX copper forward prices and the adjusted London gold prices at each reporting date based on the month of maturity (refer to Note 6 for further discussion); however, FCX’s contracts themselves are not traded on an exchange. As a result, these derivatives are classified within Level 2 of the fair value hierarchy.
FCX’s derivative financial instruments for copper futures and swap contracts and copper forward contracts that are traded on the respective exchanges are classified within Level 1 of the fair value hierarchy because they are valued using quoted monthly COMEX or LME prices at each reporting date based on the month of maturity (refer to Note 6 for further discussion). Certain of these contracts are traded on the over-the-counter market and are classified within Level 2 of the fair value hierarchy based on COMEX and LME forward prices.
In December 2016, FCX’s sale of its Deepwater GOM oil and gas properties included up to $150 million in contingent consideration that was recorded at the total amount under the loss recovery approach. The contingent consideration is being received over time as cash flows are realized from a third-party production handling agreement for an offshore platform, with the related payments commencing in third-quarter 2018. The contingent consideration included in (i) other current assets totaled $20 million at September 30, 2021, and $12 million at December 31, 2020, and (ii) other assets totaled $74 million at September 30, 2021, and $96 million at December 31, 2020. The fair value of this contingent consideration was calculated based on a discounted cash flow model using inputs that include third-party estimates for reserves, production rates and production timing, and discount rates. Because significant inputs are not observable in the market, the contingent consideration is classified within Level 3 of the fair value hierarchy.
Long-term debt, including current portion, is primarily valued using available market quotes and, as such, is classified within Level 2 of the fair value hierarchy.
The techniques described above may produce a fair value that may not be indicative of net realizable value or reflective of future fair values. Furthermore, while FCX believes its valuation techniques are appropriate and consistent with other market participants, the use of different techniques or assumptions to determine fair value of certain financial instruments could result in a different fair value measurement at the reporting date. There have been no changes in the techniques used at September 30, 2021, as compared with those techniques used at December 31, 2020.
A summary of the changes in the fair value of FCX’s Level 3 instrument, contingent consideration for the sale of the Deepwater GOM oil and gas properties, during the first nine months of 2021 follows (in millions):
| | | | | | | | | | | | |
| | | | | | |
| Fair value at January 1, 2021 | $ | 88 | | | | | | |
| Net unrealized gain related to assets still held at the end of the period | 12 | | | | | | |
Settlements | (15) | | | | | | |
| Fair value at September 30, 2021 | $ | 85 | | | | | | |
NOTE 8. CONTINGENCIES AND COMMITMENTS
Environmental
Newtown Creek. From the 1930s until 1964, Phelps Dodge Refining Corporation (PDRC), an indirect wholly owned subsidiary of FCX, operated a copper smelter, and from the 1930s until 1984 operated a copper refinery, on the banks of Newtown Creek (the creek), which is a 3.5-mile-long waterway that forms part of the boundary between Brooklyn and Queens in New York City. Heavy industrialization along the banks of the creek and discharges from the City of New York’s sewer system over more than a century resulted in significant environmental contamination of the waterway. In 2010, U.S. Environmental Protection Agency (EPA) notified PDRC, four other companies and the City of New York that EPA considers them to be potentially responsible parties (PRPs) under the Comprehensive Environmental Response, Compensation, and Liability Act of 1980. The notified parties began working with EPA to identify other PRPs. In 2010, EPA designated the creek as a Superfund site, and in 2011, PDRC and five other parties (the Newtown Creek Group, NCG) entered an Administrative Order on Consent (AOC) to perform a remedial investigation/feasibility study (RI/FS) to assess the nature and extent of environmental contamination in the creek and identify potential remedial options. The parties’ RI/FS work under the AOC and their efforts to identify other PRPs are ongoing. The final draft RI, which addressed all remaining EPA comments, was submitted in October 2021 and NCG expects EPA’s formal acceptance after their review. NCG expects to submit the draft FS in late 2025
and currently expects EPA to select a creek-wide remedy in 2026, with the actual remediation construction starting several years later. In July 2019, the NCG entered into an AOC to conduct a Focused Feasibility Study (FFS) of the first two miles of the creek to support an evaluation of an interim remedy for that section of the creek. In July 2021, EPA terminated the FFS, which effectively incorporates remediation of the lower creek with the site-wide remedy. FCX’s environmental liability balance for the creek was $313 million at September 30, 2021. The final costs of fulfilling this remedial obligation and the allocation of costs among PRPs are uncertain and subject to change based on the results of the RI/FS, the remedy ultimately selected by EPA and related allocation determinations. Changes to the overall cost of this remedial obligation and the portion ultimately allocated to PDRC could be material to FCX.
Litigation
There were no significant updates to previously reported legal proceedings included in Note 12 of FCX’s 2020 Form 10-K, other than the matters discussed below.
Asbestos and Talc Claims. As previously disclosed, since approximately 1990, various FCX affiliates have been named as defendants in a large number of lawsuits alleging personal injury from, among other things, exposure to asbestos or talc allegedly contained in industrial products, and more recently alleging the presence of asbestos contamination in talc-based cosmetic and personal care products. Cyprus Amax Minerals Company (CAMC), an indirect wholly owned subsidiary of FCX, and Cyprus Mines Corporation (Cyprus Mines), a wholly owned subsidiary of CAMC, are among the targets of such lawsuits. Cyprus Mines and subsidiaries were engaged in talc mining and processing from 1964 until 1992 when Cyprus Mines exited its talc business. On February 13, 2019, Imerys Talc America (Imerys), the current owner of the talc business assets and liabilities previously owned by Cyprus Mines, filed for Chapter 11 bankruptcy protection. On December 22, 2020, Imerys filed an amended bankruptcy plan disclosing a global settlement with Cyprus Mines and CAMC, which provides a framework for a full and comprehensive resolution of all current and future potential liabilities arising out of the Cyprus Mines talc business, including claims against FCX, its affiliates, Cyprus Mines and CAMC. The hearing to consider confirmation of the Imerys bankruptcy plan previously scheduled to be held in November 2021 has been cancelled following a recent decision by the bankruptcy judge to invalidate a substantial number of votes in favor of the plan. Consistent with the global settlement agreement, Cyprus Mines commenced its own bankruptcy process on February 11, 2021, and talc-related litigation against both Cyprus Mines and Cyprus Amax Minerals Company is stayed through 2021. The global settlement is subject to, among other things, votes by claimants in both the Imerys and Cyprus Mines bankruptcy cases as well as bankruptcy court approvals in both cases, and there can be no assurance that the global settlement will be successfully implemented. FCX has a $130 million liability balance at September 30, 2021, associated with the proposed settlement.
Louisiana Parishes Coastal Erosion Cases. As discussed in Note 12 of FCX's 2020 Form 10-K, certain FCX affiliates were named as defendants, along with numerous co-defendants, in 13 cases out of a total of 42 cases filed in Louisiana state courts by six south Louisiana parishes (Cameron, Jefferson, Plaquemines, St. Bernard, St. John the Baptist and Vermilion), alleging that certain oil and gas exploration and production operations and sulphur mining and production operations in coastal Louisiana contaminated and damaged coastal wetlands and caused significant land loss along the Louisiana coast.
In 2019, affiliates of FCX reached an agreement in principle to settle all 13 cases. The maximum out-of-pocket settlement payment will be $23.5 million with the initial payment of $15 million to be paid upon execution of the settlement agreement.
The settlement agreement must be executed by all parties, including authorized representatives of the six south Louisiana parishes originally plaintiffs in the suit and certain other non-plaintiff Louisiana parishes and the state of Louisiana. The agreement in principle does not include any admission of liability by FCX or its affiliates. FCX recorded a charge in 2019 for the initial payment of $15 million, which will be paid upon execution of the settlement agreement. The settlement agreement has been executed by the FCX affiliates, the state of Louisiana and 8 of the 12 Louisiana parishes. FCX is continuing its efforts to finalize the settlement.
Other Matters
PT-FI and PT Smelting Export Licenses. In March 2021, PT-FI received a one-year extension of its export license through March 15, 2022. In July 2021, PT Smelting received a six-month extension of its anodes slimes export license, which currently expires December 30, 2021.
Cerro Verde Royalty Dispute. SUNAT (National Superintendency of Customs and Administration), the Peru national tax authority, assessed mining royalties on ore processed by the Cerro Verde concentrator for the period December 2006 to December 2013. Cerro Verde contested each of these assessments because it believes that its 1998 stability agreement exempts from royalties all minerals extracted from its mining concession, irrespective of the method used for processing such minerals. Since 2014, Cerro Verde has been paying the disputed assessments for the period from December 2006 through December 2013 under installment payment programs provided under Peru law. In third-quarter 2021, Cerro Verde paid the balance of its royalty dispute liabilities (payments totaled $356 million in third-quarter 2021 and $421 million for the first nine months of 2021) and is proceeding with international arbitration as previously disclosed in FCX’s 2020 Form 10-K.
Development Progress of Greenfield Smelter at East Java. On January 7, 2021, the Indonesia government levied an administrative fine of $149 million for the period from March 30, 2020, through September 30, 2020 (additional fines could be levied on exports after September 30, 2020), on PT-FI for failing to achieve physical development progress on the greenfield smelter as of July 31, 2020. PT-FI responded to the Indonesia government objecting to the fine because of events outside of its control that caused a delay in development progress for the greenfield smelter at East Java. PT-FI believes that its communications regarding these delays during 2020 with the Indonesia government were not properly considered before the administrative fine was levied. In June 2021, the Indonesia government issued a ministerial decree for the calculation of an administrative fine for lack of smelter development in light of the COVID-19 pandemic. PT-FI is continuing to discuss this matter with the Indonesia government as well as provide additional documentation to support its position on the cause of delays in development progress on the greenfield smelter. During the first nine months of 2021, PT-FI recorded charges totaling $16 million for a potential settlement of the administrative fine which is expected to include a revised construction schedule for the greenfield smelter. No additional fine is expected for the construction period after July 2020 based on the revised schedule. The final settlement could differ from the amounts recorded.
Chiyoda Contract. In July 2021, PT-FI awarded a construction contract to Chiyoda for the construction of a new greenfield smelter in Gresik, Indonesia with an estimated contract cost of $2.8 billion.
NOTE 9. BUSINESS SEGMENTS
FCX has organized its mining operations into four primary divisions – North America copper mines, South America mining, Indonesia mining and Molybdenum mines – and operating segments that meet certain thresholds are reportable segments. Separately disclosed in the following tables are FCX’s reportable segments, which include the Morenci, Cerro Verde and Grasberg (Indonesia Mining) copper mines, the Rod & Refining operations and Atlantic Copper Smelting & Refining.
Intersegment sales between FCX’s business segments are based on terms similar to arms-length transactions with third parties at the time of the sale. Intersegment sales may not be reflective of the actual prices ultimately realized because of a variety of factors, including additional processing, timing of sales to unaffiliated customers and transportation premiums.
FCX defers recognizing profits on sales from its mines to other segments, including Atlantic Copper Smelting & Refining, and on 39.5 percent of PT-FI’s sales to PT Smelting, until final sales to third parties occur. Quarterly variations in ore grades, the timing of intercompany shipments and changes in product prices result in variability in FCX’s net deferred profits and quarterly earnings.
FCX allocates certain operating costs, expenses and capital expenditures to its operating divisions and individual segments. However, not all costs and expenses applicable to an operation are allocated. U.S. federal and state income taxes are recorded and managed at the corporate level (included in Corporate, Other & Eliminations), whereas foreign income taxes are recorded and managed at the applicable country level. In addition, most mining exploration and research activities are managed on a consolidated basis, and those costs, along with some selling, general and administrative costs, are not allocated to the operating divisions or individual segments. Accordingly, the following Financial Information by Business Segment reflects management determinations that may not be indicative of what the actual financial performance of each operating division or segment would be if it was an independent entity.
Product Revenues. FCX’s revenues attributable to the products it sold for the third quarters and first nine months of 2021 and 2020 follow (in millions):
| | | | | | | | | | | | | | | | | | | | | | | | | | |
| Three Months Ended | | Nine Months Ended | |
| September 30, | | September 30, | |
| | 2021 | | 2020 | | 2021 | | 2020 | |
| Copper: | | | | | | | | |
| Concentrate | $ | 2,531 | | | $ | 1,185 | | | $ | 6,316 | | | $ | 2,783 | | |
| Cathode | 1,463 | | | 1,085 | | | 4,232 | | | 3,046 | | |
| Rod and other refined copper products | 1,048 | | | 634 | | | 2,565 | | | 1,479 | | |
Purchased coppera | 124 | | | 167 | | | 652 | | | 568 | | |
| Gold | 741 | | | 497 | | | 1,856 | | | 1,108 | | |
| Molybdenum | 372 | | | 189 | | | 904 | | | 626 | | |
Otherb | 210 | | | 159 | | | 666 | | | 431 | | |
| Adjustments to revenues: | | | | | | | | |
| Treatment charges | (126) | | | (95) | | | (324) | | | (250) | | |
Royalty expensec | (97) | | | (56) | | | (242) | | | (102) | | |
Export dutiesd | (72) | | | (23) | | | (145) | | | (43) | | |
| Revenues from contracts with customers | 6,194 | | | 3,742 | | | 16,480 | | | 9,646 | | |
Embedded derivativese | (111) | | | 109 | | | 201 | | | 57 | | |
| Total consolidated revenues | $ | 6,083 | | | $ | 3,851 | | | $ | 16,681 | | | $ | 9,703 | | |
a.FCX purchases copper cathode primarily for processing by its Rod & Refining operations.
b.Primarily includes revenues associated with cobalt and silver.
c.Reflects royalties on sales from PT-FI and Cerro Verde that will vary with the volume of metal sold and prices.
d.Reflects PT-FI export duties.
e.Refer to Note 6 for discussion of embedded derivatives related to FCX’s provisionally priced concentrate and cathode sales contracts.
Financial Information by Business Segment
| | | | | | | | | | | | | | | | | | | | | | | | | | | | | | | | | | | | | | | | | | | | | | | | | | | | | | | | | | | | | | | | | | | | | | | | | | | | | | | | | |
| | | | | | | | | | | | | | | | | | | | | | | | | | | | | | | | | |
| (In millions) | | | | | | | |
| | | | | | | | | | | | | | | | | | | | | | | |
| | | | | | | | | | | | | | | | | | | | | | | | Atlantic | | | | | | | | Corporate, | | |
| North America Copper Mines | | South America Mining | | | | | | | | | | Copper | | | | | | | | Other | | |
| | | | | | | | | Cerro | | | | | | Indonesia | | | | Molybdenum | | Rod & | | Smelting | | | | | | | | & Elimi- | | FCX |
| Morenci | | | | Other | | Total | | Verde | | Other | | Total | | Mining | | | | Mines | | Refining | | & Refining | | | | | | | | nations | | Total |
| Three Months Ended September 30, 2021 | | | | | | | | | | | | | | | | | | | | | | | | | | | | | | | | | |
| Revenues: | | | | | | | | | | | | | | | | | | | | | | | | | | | | | | | | | |
| Unaffiliated customers | $ | 16 | | | | | $ | 64 | | | $ | 80 | | | $ | 979 | | | $ | 149 | | | $ | 1,128 | | | $ | 1,961 | | a | | | $ | — | | | $ | 1,697 | | | $ | 783 | | | | | | | | | $ | 434 | | b | $ | 6,083 | |
| Intersegment | 711 | | | | | 1,020 | | | 1,731 | | | 95 | | | — | | | 95 | | | 81 | | | | | 151 | | | 7 | | | — | | | | | | | | | (2,065) | | | — | |
| Production and delivery | 312 | | | | | 592 | | | 904 | | | 533 | | | 97 | | | 630 | | | 569 | | | | | 70 | | | 1,701 | | | 765 | | | | | | | | | (1,630) | | | 3,009 | |
Depreciation, depletion and amortization | 40 | | | | | 54 | | | 94 | | | 101 | | | 10 | | | 111 | | | 280 | | | | | 19 | | | 1 | | | 7 | | | | | | | | | 16 | | | 528 | |
| | | | | | | | | | | | | | | | | | | | | | | | | | | | | | | | | |
Metals inventory adjustments | 13 | | | | | — | | | 13 | | | — | | | — | | | — | | | — | | | | | — | | | — | | | — | | | | | | | | | 1 | | | 14 | |
Selling, general and administrative expenses | — | | | | | 1 | | | 1 | | | 2 | | | — | | | 2 | | | 28 | | | | | — | | | — | | | 5 | | | | | | | | | 66 | | | 102 | |
| Mining exploration and research expenses | — | | | | | 1 | | | 1 | | | — | | | — | | | — | | | — | | | | | — | | | — | | | — | | | | | | | | | 14 | | | 15 | |
Environmental obligations and shutdown costs | (1) | | | | | (1) | | | (2) | | | — | | | — | | | — | | | — | | | | | — | | | — | | | — | | | | | | | | | 15 | | | 13 | |
| Net gain on sales of assets | — | | | | | — | | | — | | | — | | | — | | | — | | | — | | | | | — | | | — | | | — | | | | | | | | | (60) | | c | (60) | |
| Operating income (loss) | 363 | | | | | 437 | | | 800 | | | 438 | | | 42 | | | 480 | | | 1,165 | | | | | 62 | | | 2 | | | 6 | | | | | | | | | (53) | | | 2,462 | |
| | | | | | | | | | | | | | | | | | | | | | | | | | | | | | | | | |
| Interest expense, net | — | | | | | 1 | | | 1 | | | 6 | | | — | | | 6 | | | 1 | | | | | — | | | — | | | 1 | | | | | | | | | 129 | | | 138 | |
| Provision for (benefit from) income taxes | — | | | | | — | | | — | | | 197 | | | 24 | | | 221 | | | 382 | | d | | | — | | | — | | | (1) | | | | | | | | | 26 | | | 628 | |
| Total assets at September 30, 2021 | 2,586 | | | | | 5,244 | | | 7,830 | | | 8,554 | | | 1,843 | | | 10,397 | | | 18,592 | | | | | 1,726 | | | 278 | | | 1,067 | | | | | | | | | 7,027 | | | 46,917 | |
| Capital expenditures | 42 | | | | | 74 | | | 116 | | | 41 | | | 6 | | | 47 | | | 328 | | | | | 1 | | | 1 | | | 5 | | | | | | | | | 43 | | e | 541 | |
| | | | | | | | | | | | | | | | | | | | | | | | | | | | | | | | | |
| Three Months Ended September 30, 2020 | | | | | | | | | | | | | | | | | | | | | | | | | | | | | | | | | |
| Revenues: | | | | | | | | | | | | | | | | | | | | | | | | | | | | | | | | | |
| Unaffiliated customers | $ | 4 | | | | | $ | 12 | | | $ | 16 | | | $ | 632 | | | $ | 108 | | | $ | 740 | | | $ | 1,023 | | a | | | $ | — | | | $ | 1,270 | | | $ | 536 | | | | | | | | | $ | 266 | | b | $ | 3,851 | |
| Intersegment | 584 | | | | | 637 | | | 1,221 | |
| 66 | | | — | | | 66 | | | 3 | | | | | 42 | | | 8 | | | 3 | | | | | | | | | (1,343) | | | — | |
| Production and delivery | 308 | | | | | 460 | | | 768 | | | 394 | | | 83 | | | 477 | | | 409 | | | | | 51 | | | 1,272 | | | 522 | | | | | | | | | (1,034) | | | 2,465 | |
Depreciation, depletion and amortization | 42 | | | | | 49 | | | 91 | | | 92 | | | 13 | | | 105 | | | 150 | | | | | 13 | | | 6 | | | 8 | | | | | | | | | 21 | | | 394 | |
| | | | | | | | | | | | | | | | | | | | | | | | | | | | | | | | | |
Metals inventory adjustments | — | | | | | (4) | | | (4) | | | — | | | — | | | — | | | — | | | | | 3 | | | 2 | | | — | | | | | | | | | 8 | | | 9 | |
Selling, general and administrative expenses | 1 | | | | | — | | | 1 | | | 2 | | | — | | | 2 | | | 25 | | | | | — | | | — | | | 5 | | | | | | | | | 39 | | | 72 | |
| Mining exploration and research expenses | — | | | | | — | | | — | | | — | | | — | | | — | | | — | | | | | — | | | — | | | — | | | | | | | | | 8 | | | 8 | |
Environmental obligations and shutdown costs | — | | | | | (3) | | | (3) | | | — | | | — | | | — | | | — | | | | | — | | | — | | | — | | | | | | | | | 24 | | | 21 | |
| Net loss on sales of assets | — | | | | | — | | | — | | | — | | | — | | | — | | | — | | | | | — | | | — | | | — | | | | | | | | | 2 | | | 2 | |
| Operating income (loss) | 237 | | | | | 147 | | | 384 | | | 210 | | | 12 | | | 222 | | | 442 | | | | | (25) | | | (2) | | | 4 | | | | | | | | | (145) | | | 880 | |
| | | | | | | | | | | | | | | | | | | | | | | | | | | | | | | | | |
| Interest expense, net | — | | | | | — | | | — | | | 21 | | | — | | | 21 | | | — | | | | | — | | | — | | | — | | | | | | | | | 99 | | | 120 | |
| Provision for (benefit from) income taxes | — | | | | | — | | | — | | | 105 | | | 4 | | | 109 | | | 211 | | | | | — | | | — | | | — | | | | | | | | | (23) | | | 297 | |
| Total assets at September 30, 2020 | 2,654 | | | | | 5,137 | | | 7,791 | | | 8,569 | | | 1,640 | | | 10,209 | | | 16,858 | | | | | 1,770 | | | 251 | | | 877 | | | | | | | | | 3,343 | | | 41,099 | |
| Capital expenditures | 21 | | | | | 45 | | | 66 | | | 26 | | | 5 | | | 31 | | | 297 | | | | | 3 | | | 1 | | | 6 | | | | | | | | | 32 | | e | 436 | |
a.Includes PT-FI's sales to PT Smelting totaling $795 million in third-quarter 2021 and $506 million in third-quarter 2020.
b.Includes revenues from FCX's molybdenum sales company, which includes sales of molybdenum produced by the Molybdenum mines and by certain of the North America and South America copper mines.
c.Represents the gain on the sale of FCX’s remaining cobalt business located in Kokkola, Finland (Freeport Cobalt).
d.Includes net tax benefits of $69 million associated with the release of a portion of the valuation allowances recorded against PT RTI NOLs.
e.Includes capital expenditures for the new greenfield smelter and precious metals refinery (collectively, the Indonesia smelter project) of $31 million in third-quarter 2021 and $27 million in third-quarter 2020.
| | | | | | | | | | | | | | | | | | | | | | | | | | | | | | | | | | | | | | | | | | | | | | | | | | | | | | | | | | | | | | | | | | | | | | | | | | | | | | | | | |
| (In millions) | | | | | | | | | | | | | | | | | | | | | |
| | | | | | | | | | | | | | | | | | | | | | | | | Atlantic | | Corporate, | | | | | | |
| North America Copper Mines | | South America Mining | | | | | | | | | | Copper | | Other | | | | | | |
| | | | | | | | | Cerro | | | | | | | | Indonesia | | | | Molybdenum | | Rod & | | Smelting | | & Elimi- | | FCX | | | | |
| Morenci | | | | Other | | Total | | Verde | | | | Other | | Total | | Mining | | | | Mines | | Refining | | & Refining | | nations | | Total | | | | |
| Nine months ended September 30, 2021 | | | | | | | | | | | | | | | | | | | | | | | | | | | | | | | |
| Revenues: | | | | | | | | | | | | | | | | | | | | | | | | | | | | | | | | | |
| Unaffiliated customers | $ | 77 | | | | | $ | 147 | | | $ | 224 | | | $ | 2,721 | | | | | $ | 512 | | | $ | 3,233 | | | $ | 5,097 | | a | | | $ | — | | | $ | 4,695 | | | $ | 2,264 | | | $ | 1,168 | | b | $ | 16,681 | | | | | |
| Intersegment | 1,996 | | | | | 2,783 | | | 4,779 | | | 260 | | | | | — | | | 260 | | | 189 | | | | | 310 | | | 20 | | | — | | | (5,558) | | | — | | | | | |
| Production and delivery | 932 | | | | | 1,646 | | | 2,578 | | | 1,463 | | c | | | 306 | | | 1,769 | | | 1,552 | | | | | 183 | | | 4,708 | | | 2,213 | | | (4,141) | | d | 8,862 | | | | | |
| Depreciation, depletion and amortization | 114 | | | | | 161 | | | 275 | | | 272 | | | | | 34 | | | 306 | | | 726 | | | | | 51 | | | 3 | | | 22 | | | 47 | | | 1,430 | | | | | |
| Metals inventory adjustments | 13 | | | | | — | | | 13 | | | — | | | | | — | | | — | | | — | | | | | 1 | | | — | | | — | | | 1 | | | 15 | | | | | |
| Selling, general and administrative expenses | 1 | | | | | 2 | | | 3 | | | 6 | | | | | — | | | 6 | | | 81 | | | | | — | | | — | | | 17 | | | 182 | | | 289 | | | | | |
| Mining exploration and research expenses | — | | | | | 1 | | | 1 | | | — | | | | | — | | | — | | | — | | | | | — | | | — | | | — | | | 35 | | | 36 | | | | | |
| Environmental obligations and shutdown costs | — | | | | | (1) | | | (1) | | | — | | | | | — | | | — | | | — | | | | | — | | | — | | | — | | | 52 | | | 51 | | | | | |
| | | | | | | | | | | | | | | | | | | | | | | | | | | | | | | | | |
| Net gain on sales of assets | — | | | | | — | | | — | | | — | | | | | — | | | — | | | — | | | | | — | | | — | | | — | | | (63) | | e | (63) | | | | | |
| Operating income (loss) | 1,013 | | | | | 1,121 | | | 2,134 | | | 1,240 | | | | | 172 | | | 1,412 | | | 2,927 | | | | | 75 | | | 4 | | | 12 | | | (503) | | | 6,061 | | | | | |
| | | | | | | | | | | | | | | | | | | | | | | | | | | | | | | | | |
| Interest expense, net | — | | | | | 1 | | | 1 | | | 31 | | | | | — | | | 31 | | | 8 | | | | | — | | | — | | | 4 | | | 387 | | | 431 | | | | | |
| Provision for (benefit from) income taxes | — | | | | | — | | | — | | | 515 | | | | | 62 | | | 577 | | | 1,101 | | f | | | — | | | — | | | (1) | | | (3) | | | 1,674 | | | | | |
| | | | | | | | | | | | | | | | | | | | | | | | | | | | | | | | | |
| Capital expenditures | 74 | | | | | 137 | | | 211 | | | 84 | | | | | 10 | | | 94 | | | 904 | | | | | 4 | | | 2 | | | 18 | | | 111 | | g | 1,344 | | | | | |
| | | | | | | | | | | | | | | | | | | | | | | | | | | | | | | | | |
| Nine months ended September 30, 2020 | | | | | | | | | | | | | | | | | | | | | | | | | | | | | | | |
| Revenues: | | | | | | | | | | | | | | | | | | | | | | | | | | | | | | | | | |
| Unaffiliated customers | $ | 26 | | | | | $ | 35 | | | $ | 61 | | | $ | 1,479 | | | | | $ | 312 | | | $ | 1,791 | | | $ | 2,151 | | a | | | $ | — | | | $ | 3,491 | | | $ | 1,429 | | | $ | 780 | | b | $ | 9,703 | | | | | |
| Intersegment | 1,473 | | | | | 1,676 | | | 3,149 | |
| 156 | | | | | — | | | 156 | | | 38 | | | | | 171 | | | 24 | | | 16 | | | (3,554) | | | — | | | | | |
| Production and delivery | 1,005 | | | | | 1,410 | | | 2,415 | | | 1,152 | | | | | 297 | | | 1,449 | | | 1,130 | | | | | 178 | | | 3,529 | | | 1,379 | | | (2,676) | | | 7,404 | | | | | |
| Depreciation, depletion and amortization | 129 | | | | | 143 | | | 272 | | | 273 | | | | | 42 | | | 315 | | | 375 | | | | | 44 | | | 14 | | | 22 | | | 51 | | | 1,093 | | | | | |
| | | | | | | | | | | | | | | | | | | | | | | | | | | | | | | | | |
| Metals inventory adjustments | 4 | | | | | 48 | | | 52 | | | — | | | | | 3 | | | 3 | | | — | | | | | 8 | | | 3 | | | — | | | 26 | | | 92 | | | | | |
| Selling, general and administrative expenses | 2 | | | | | 1 | | | 3 | | | 5 | | | | | — | | | 5 | | | 81 | | | | | — | | | — | | | 15 | | | 169 | | | 273 | | | | | |
| Mining exploration and research expenses | — | | | | | 2 | | | 2 | | | — | | | | | — | | | — | | | — | | | | | — | | | — | | | — | | | 40 | | | 42 | | | | | |
| Environmental obligations and shutdown costs | — | | | | | (3) | | | (3) | | | — | | | | | — | | | — | | | — | | | | | — | | | 1 | | | — | | | 60 | | | 58 | | | | | |
| | | | | | | | | | | | | | | | | | | | | | | | | | | | | | | | | |
| Net loss on sales of assets | — | | | | | — | | | — | | | — | | | | | — | | | — | | | — | | | | | — | | | — | | | — | | | 13 | | | 13 | | | | | |
| Operating income (loss) | 359 | | | | | 110 | | | 469 | | | 205 | | | | | (30) | | | 175 | | | 603 | | | | | (59) | | | (32) | | | 29 | | | (457) | | | 728 | | | | | |
| | | | | | | | | | | | | | | | | | | | | | | | | | | | | | | | | |
| Interest expense, net | 2 | | | | | — | | | 2 | | | 69 | | | | | — | | | 69 | | | 2 | | | | | — | | | — | | | 4 | | | 285 | | | 362 | | | | | |
| Provision for (benefit from) income taxes | — | | | | | — | | | — | | | 82 | | | | | (6) | | | 76 | | | 302 | | | | | — | | | — | | | 1 | | | (46) | | | 333 | | | | | |
| | | | | | | | | | | | | | | | | | | | | | | | | | | | | | | | | |
| Capital expenditures | 92 | | | | | 306 | | | 398 | | | 116 | | | | | 40 | | | 156 | | | 865 | | | | | 14 | | | 5 | | | 17 | | | 118 | | g | 1,573 | | | | | |
a.Includes PT-FI's sales to PT Smelting totaling $2.3 billion for the first nine months of 2021 and $1.3 billion for the first nine months of 2020.
b.Includes revenues from FCX's molybdenum sales company, which includes sales of molybdenum produced by the Molybdenum mines and by certain of the North America and South America copper mines.
c.Includes nonrecurring charges totaling $74 million associated with labor-related charges at Cerro Verde for agreements reached with approximately 65 percent of its hourly employees.
d.Includes charges associated with the major maintenance turnaround at the Miami smelter totaling $87 million.
e.Includes a $60 million gain on the sale of Freeport Cobalt.
f.Includes net tax benefits of $69 million associated with the release of a portion of the valuation allowances recorded against PT RTI NOLs.
g.Includes capital expenditures for the Indonesia smelter project of $79 million for the first nine months of 2021 and $94 million for the first nine months of 2020.
REPORT OF INDEPENDENT REGISTERED PUBLIC ACCOUNTING FIRM
To the Board of Directors and Stockholders of
Freeport-McMoRan Inc.
Results of Review of Interim Financial Statements
We have reviewed the accompanying consolidated balance sheet of Freeport-McMoRan Inc. (the Company) as of September 30, 2021, the related consolidated statements of operations, comprehensive income (loss), and equity for the three- and nine-month periods ended September 30, 2021 and 2020, the related consolidated statements of cash flows for the nine-month periods ended September 30, 2021 and 2020, and the related notes (collectively referred to as the “consolidated interim financial statements”). Based on our reviews, we are not aware of any material modifications that should be made to the consolidated interim financial statements for them to be in conformity with U.S. generally accepted accounting principles.
We have previously audited, in accordance with the standards of the Public Company Accounting Oversight Board (United States) (PCAOB), the consolidated balance sheet of the Company as of December 31, 2020, the related consolidated statements of operations, comprehensive income (loss), cash flows and equity for the year then ended, and the related notes (not presented herein); and in our report dated February 16, 2021, we expressed an unqualified audit opinion on those consolidated financial statements. In our opinion, the information set forth in the accompanying consolidated balance sheet as of December 31, 2020, is fairly stated, in all material respects, in relation to the consolidated balance sheet from which it has been derived.
Basis for Review Results
These financial statements are the responsibility of the Company's management. We are a public accounting firm registered with the PCAOB and are required to be independent with respect to the Company in accordance with the U.S. federal securities laws and the applicable rules and regulations of the Securities and Exchange Commission and the PCAOB. We conducted our review in accordance with the standards of the PCAOB. A review of interim financial statements consists principally of applying analytical procedures and making inquiries of persons responsible for financial and accounting matters. It is substantially less in scope than an audit conducted in accordance with the standards of the PCAOB, the objective of which is the expression of an opinion regarding the financial statements taken as a whole. Accordingly, we do not express such an opinion.
/s/ Ernst & Young LLP
Phoenix, Arizona
November 5, 2021
Item 2.Management’s Discussion and Analysis of Financial Condition and Results of Operations.
In Management’s Discussion and Analysis of Financial Condition and Results of Operations (MD&A), “we,” “us” and “our” refer to Freeport-McMoRan Inc. (FCX) and its consolidated subsidiaries. You should read this discussion in conjunction with our consolidated financial statements, the related MD&A and the discussion of our Business and Properties in our annual report on Form 10-K for the year ended December 31, 2020 (2020 Form 10-K), filed with the United States (U.S.) Securities and Exchange Commission (SEC). The results of operations reported and summarized below are not necessarily indicative of future operating results (refer to “Cautionary Statement” for further discussion). References to “Notes” are Notes included in our Notes to Consolidated Financial Statements (Unaudited). Throughout MD&A, all references to income or losses per share are on a diluted basis.
OVERVIEW
We are a leading international mining company with headquarters in Phoenix, Arizona. We operate large, long-lived, geographically diverse assets with significant proven and probable reserves of copper, gold and molybdenum. We are one of the world’s largest publicly traded copper producers. Our portfolio of assets includes the Grasberg minerals district in Indonesia, one of the world’s largest copper and gold deposits; and significant mining operations in North America and South America, including the large-scale Morenci minerals district in Arizona and the Cerro Verde operation in Peru.
We continue to monitor the impact of the COVID-19 pandemic on our business and maintain our vigilant operating protocols to contain and mitigate the risk of spread of COVID-19 at each of our operating sites. To date, our protocols have been effective in mitigating and preventing a major outbreak of COVID-19 at our operating sites. We will continue to monitor, assess and update our COVID-19 response and to provide assistance to employees in obtaining vaccinations.
Our results for the first nine months of 2021 reflect strong operating and financial performance, and cash flow generation. We believe we are well positioned to make investments in our business while providing shareholders with cash returns consistent with our financial policy. Refer to Note 5 and “Capital Resources and Liquidity” for further discussion of our financial policy. We continue to execute our operating plans in a safe, efficient and responsible manner and remain focused on building long-term value through solid management of our portfolio of long-lived and high-quality copper assets.
As further discussed in “Operations,” highlights for our mining operations during the first nine months of 2021 include:
•Continued success with the ramp-up of underground mining at PT Freeport Indonesia (PT-FI); on track to reach annualized metal production targets by year-end 2021.
•Strong performance from Cerro Verde's concentrator facilities with milling rates averaging 381,500 metric tons of ore per day and rates are targeted to average approximately 400,000 metric tons of ore per day in 2022.
•Current operations at the Lone Star copper leach project, which was successfully completed in the second half of 2020, are exceeding the initial design capacity of 200 million pounds of copper annually by approximately 25 percent.
We are advancing climate initiatives and recently published our updated Climate Report in September 2021, which details the work underway across our global business to reduce greenhouse gas (GHG) emissions, improve energy efficiency, advance the use of renewable energy and enhance our resilience to future climate-related risks.
Net income (loss) attributable to common stock totaled $1.4 billion in third-quarter 2021, $0.3 billion in third-quarter 2020, $3.2 billion for the first nine months of 2021 and $(0.1) billion for the first nine months of 2020. Results for the 2021 periods, compared with the 2020 periods, reflect higher copper prices and copper and gold sales volumes, partly offset by a higher provision for income taxes. The first nine months of 2020 also reflect charges directly associated with the COVID-19 pandemic and revised operating plans, including employee separation costs, totaling $178 million, losses on early extinguishment of debt totaling $100 million and metals inventory adjustments totaling $90 million. Refer to “Consolidated Results” for further discussion.
At September 30, 2021, we had consolidated debt of $9.7 billion and consolidated cash and cash equivalents of $7.7 billion, resulting in net debt of $2.0 billion. This represents a reduction in net debt of $4.1 billion from year-end 2020. Refer to “Net Debt” for reconciliations of debt and cash and cash equivalents to net debt.
At September 30, 2021, we had no borrowings and $3.5 billion available under our revolving credit facility. In September 2021, we prepaid $200 million of the Cerro Verde Term Loan and in October 2021, we announced that in December 2021 we expect to redeem our outstanding $524 million principal amount of our 3.55% Senior Notes due 2022. We have no other senior note maturities until March 2023.
In July 2021, PT-FI entered into a $1.0 billion, five-year, unsecured bank credit facility to advance projects associated with its obligation for additional domestic smelter capacity and a precious metals refinery (PMR) in Indonesia. As of September 30, 2021, $158 million ($146 million net of debt issuance costs) was drawn under this facility. Refer to Note 5 and “Capital Resources and Liquidity” for further discussion.
OUTLOOK
We continue to view the long-term outlook for our business positively, supported by limitations on supplies of copper and the requirements for copper in the world’s economy. Our financial results vary as a result of fluctuations in market prices primarily for copper, gold and, to a lesser extent, molybdenum, as well as other factors. World market prices for these commodities have fluctuated historically and are affected by numerous factors beyond our control. Refer to “Markets” below and “Risk Factors” in Part I, Item 1A. of our 2020 Form 10-K for further discussion. Because we cannot control the prices of our products, the key measures that management focuses on in operating our business are sales volumes, unit net cash costs, operating cash flows and capital expenditures.
Consolidated Sales Volumes
Following are our projected consolidated sales volumes for the year 2021:
| | | | | | | | | | | |
Copper (millions of recoverable pounds): | | | | | |
| North America copper mines | 1,455 | | | | | |
| South America mining | 1,030 | | | | | |
| Indonesia mining | 1,327 | | | | | |
| Total | 3,812 | | | | | |
| | | | | |
Gold (millions of recoverable ounces) | 1.3 | | | | | |
| | | | | |
Molybdenum (millions of recoverable pounds) | 85 | | a | | | |
| | | | | |
a.Projected molybdenum sales include 28 million pounds produced by our Molybdenum mines and 57 million pounds produced by our North America and South America copper mines.
Consolidated sales volumes in fourth-quarter 2021 are expected to approximate 1.025 billion pounds of copper, 375 thousand ounces of gold and 22 million pounds of molybdenum. Projected sales volumes are dependent on operational performance (including from underground mining at PT-FI), weather-related conditions, timing of shipments, and other factors detailed in the “Cautionary Statement” below.
For other important factors that could cause results to differ materially from projections, refer to “Risk Factors” contained in Part I, Item 1A. of our 2020 Form 10-K.
Consolidated Unit Net Cash Costs
Assuming average prices of $1,800 per ounce of gold and $19.00 per pound of molybdenum in fourth-quarter 2021 and achievement of current sales volume and cost estimates, consolidated unit net cash costs (net of by-product credits) for our copper mines are expected to average $1.33 per pound of copper for the year 2021 (including $1.26 per pound of copper in fourth-quarter 2021). The impact of price changes during fourth-quarter 2021 on consolidated unit net cash costs for the year 2021 would approximate $0.015 per pound of copper for each $100 per ounce change in the average price of gold and $0.01 per pound of copper for each $2 per pound change in the average price of molybdenum. Quarterly unit net cash costs vary with fluctuations in sales volumes and realized prices, primarily for gold and molybdenum.
Consolidated Operating Cash Flows
Our consolidated operating cash flows vary with sales volumes; prices realized from copper, gold and molybdenum sales; production costs; income taxes; other working capital changes; and other factors. Based on current sales volume and cost estimates, and assuming average prices of $4.50 per pound for copper, $1,800 per ounce for gold, and $19.00 per pound for molybdenum in fourth-quarter 2021, our consolidated operating cash flows are estimated to approximate $7.5 billion for the year 2021. Estimated consolidated operating cash flows for the year 2021 also reflect an estimated income tax provision of $2.5 billion (refer to “Consolidated Results – Income Taxes” for further discussion of our projected income tax rate for the year 2021). The impact of price changes during fourth-quarter 2021 on operating cash flows would approximate $100 million for each $0.10 per pound change in the average price of copper, $25 million for each $100 per ounce change in the average price of gold and $15 million for each $2 per pound change in the average price of molybdenum.
Consolidated Capital Expenditures
Consolidated capital expenditures for the year 2021 are expected to approximate $2.3 billion ($2.0 billion excluding capital expenditures for the new greenfield smelter and PMR (collectively, the Indonesia smelter project). Consolidated capital expenditures for the year 2021 are expected to include $1.3 billion for major mining projects, primarily associated with underground development activities in the Grasberg minerals district.
All costs associated with the Indonesia smelter project will be shared 49 percent by FCX and 51 percent by PT Indonesia Asahan Aluminium (Persero) (PT Inalum, also known as MIND ID), and will be largely offset by a phase-out of the 5 percent export duty currently paid to the Indonesia government as well as the tax deductibility of smelter costs by PT-FI. Current capital expenditures for the Indonesia smelter project are being funded through PT-FI's $1.0 billion unsecured bank credit facility, with additional debt financing being evaluated.
MARKETS
World prices for copper, gold and molybdenum can fluctuate significantly. During the period from January 2011 through September 2021, the London Metal Exchange (LME) copper settlement price varied from a low of $1.96 per pound in 2016 to a record high of $4.86 per pound in 2021; the London Bullion Market Association (London) PM gold price fluctuated from a low of $1,049 per ounce in 2015 to a record high of $2,067 per ounce in 2020; and the Metals Week Molybdenum Dealer Oxide weekly average price ranged from a low of $4.46 per pound in 2015 to a high of $20.01 per pound in 2021. Copper, gold and molybdenum prices are affected by numerous factors beyond our control as described further in “Risk Factors” contained in Part I, Item 1A. of our 2020 Form 10-K.
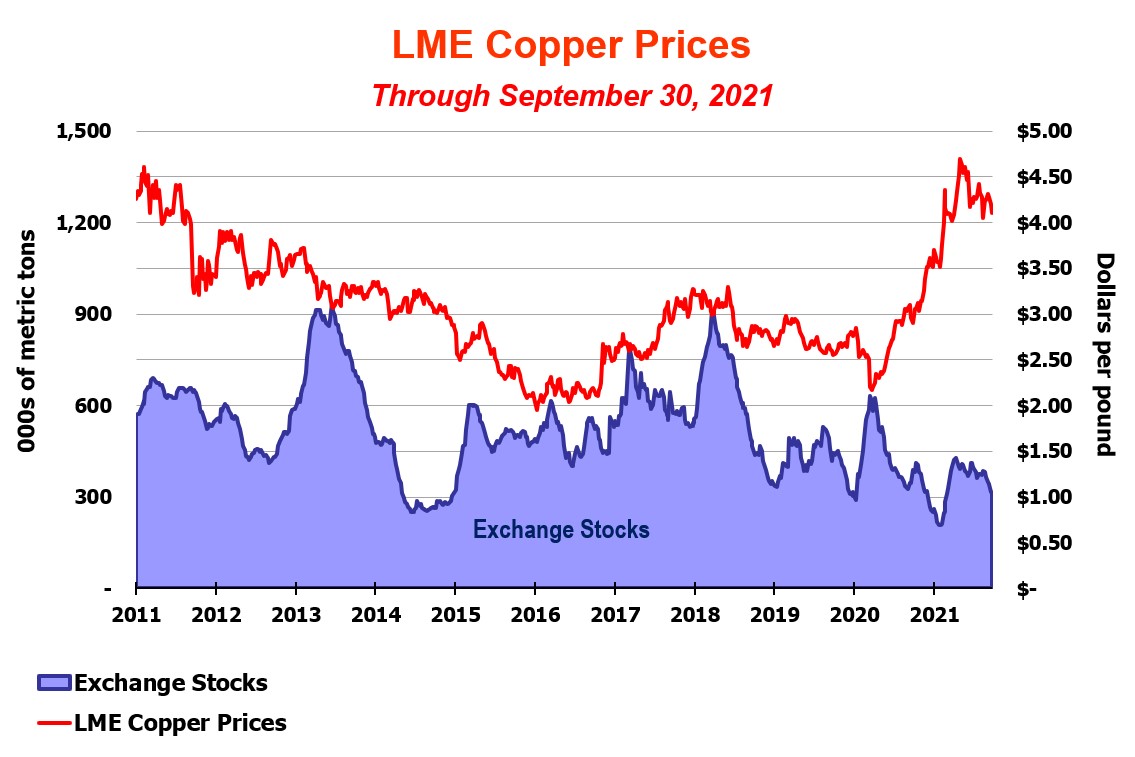
This graph presents LME copper settlement prices and the combined reported stocks of copper at the LME, Commodity Exchange Inc., and the Shanghai Futures Exchange from January 2011 through September 2021. During third-quarter 2021, LME copper settlement prices ranged from a low of $3.98 per pound to a high of $4.44 per pound, averaged $4.25 per pound and settled at $4.10 per pound on September 30, 2021. Copper prices were volatile during the quarter as a result of a strong U.S. dollar and prospects for slowing economic growth globally, and particularly in China, partly offset by falling exchange inventories and a positive long-term outlook supported by forecasts for a continued global economic recovery and copper’s prominent role in the clean energy transition. The LME copper settlement price was $4.52 per pound on October 29, 2021.
We believe expectations for longer-term copper demand growth remain in place. We expect future demand to be supported by the global transition to renewable energy and other carbon-reduction initiatives, and continued urbanization in developing countries. The historically low inventories; limited number of approved, large-scale projects scheduled; the long lead times required to permit and build new mines; and declining ore grades at existing operations highlight the supply challenges for copper.
This graph presents London PM gold prices from January 2011 through September 2021. During third-quarter 2021, London PM gold prices ranged from a low of $1,723 per ounce to a high of $1,829 per ounce, averaged $1,790 per ounce, and closed at $1,743 per ounce on September 30, 2021. While the global economic recovery has put downward pressure on gold prices, many analysts expect gold prices to remain supported by the effects of elevated debt levels associated with large pandemic-related stimulus efforts and historically low U.S. interest rates. The London PM gold price was $1,769 per ounce on October 29, 2021.
This graph presents the Metals Week Molybdenum Dealer Oxide weekly average price from January 2011 through September 2021. During third-quarter 2021, the weekly average price of molybdenum ranged from a low of $17.84 per pound to a high of $20.01 per pound, averaged $19.09 per pound, and was $18.45 per pound on September 30, 2021. Molybdenum prices have reacted to supply constraints and increased demand, as mines in both Chile and Peru reported lower production, and logistics challenges continued globally. The Metals Week Molybdenum Dealer Oxide weekly average price was $19.34 per pound on October 29, 2021.
CONSOLIDATED RESULTS
| | | | | | | | | | | | | | | | | | | | | | | | | | |
| Three Months Ended September 30, | | Nine Months Ended September 30, | |
| | 2021 | | 2020 | | 2021 | | 2020 | |
SUMMARY FINANCIAL DATA | (in millions, except per share amounts) | |
Revenuesa,b | $ | 6,083 | | | $ | 3,851 | | | $ | 16,681 | | | $ | 9,703 | | |
Operating incomea | $ | 2,462 | | | $ | 880 | | | $ | 6,061 | | | $ | 728 | | |
| | | | | | | | |
| | | | | | | | |
Net income (loss) attributable to common stockc | $ | 1,399 | | d | $ | 329 | | e | $ | 3,200 | | d | $ | (109) | | e |
Diluted net income (loss) per share of common stock | $ | 0.94 | | | $ | 0.22 | | | $ | 2.16 | | | $ | (0.08) | | |
| | | | | | | | |
| | | | | | | | |
| | | | | | | | |
| | | | | | | | |
Diluted weighted-average common shares outstanding | 1,484 | | | 1,461 | | | 1,481 | | | 1,453 | | |
| | | | | | | | |
Operating cash flowsf | $ | 1,965 | | | $ | 1,237 | | | $ | 5,435 | | | $ | 1,690 | | |
Capital expenditures | $ | 541 | | | $ | 436 | | | $ | 1,344 | | | $ | 1,573 | | |
| At September 30: | | | | | | | | |
Cash and cash equivalents | $ | 7,672 | | | $ | 2,403 | | | $ | 7,672 | | | $ | 2,403 | | |
Total debt, including current portion | $ | 9,665 | | | $ | 10,030 | | | $ | 9,665 | | | $ | 10,030 | | |
| | | | | | | | |
a.Refer to Note 9 for a summary of revenues and operating income by operating division.
b.Includes (unfavorable) favorable adjustments to prior period provisionally priced concentrate and cathode copper sales totaling $(9) million ($(3) million to net income attributable to common stock or less than $0.01 per share) in third-quarter 2021, $71 million ($28 million to net income attributable to common stock or $0.02 per share) in third-quarter 2020, $169 million ($65 million to net income attributable to common stock or $0.05 per share) for the first nine months of 2021 and $(102) million ($(42) million to net loss attributable to common stock or $(0.03) per share) for the first nine months of 2020 (refer to Note 6 for further discussion).
c.We defer recognizing profits on intercompany sales until final sales to third parties occur. Refer to “Operations – Smelting and Refining” for a summary of net impacts from changes in these deferrals.
d.Includes net credits (charges) totaling $79 million ($0.05 per share) in third-quarter 2021 and $(16) million ($(0.01) per share) for the first nine months of 2021. Net credits in third-quarter 2021 were primarily associated with the release of valuation allowances at PT-FI and a gain on sale of our remaining cobalt business in Kokkola, Finland (Freeport Cobalt), partly offset by metals inventory adjustments. The first nine months of 2021 also included net charges primarily associated with nonrecurring labor-related charges at Cerro Verde and contested matters at PT-FI (including historical tax audits and an administrative fine levied by the Indonesia government).
e.Includes net charges totaling $101 million ($0.07 per share) in third-quarter 2020 and $347 million ($0.24 per share) for the first nine months of 2020, primarily associated with the COVID-19 pandemic and revised operating plans (including employee separation costs), net losses on early extinguishment of debt and metals inventory adjustments.
f.Working capital and other sources totaled $180 million in third-quarter 2021, $178 million in third-quarter 2020, $367 million for the first nine months of 2021 and $319 million for the first nine months of 2020.
| | | | | | | | | | | | | | | | | | | | | | | | | | |
| Three Months Ended September 30, | | Nine Months Ended September 30, | |
| 2021 | | 2020 | | 2021 | | 2020 | |
| SUMMARY OPERATING DATA | | | | | | |
Copper (millions of recoverable pounds) | | | | | | | | |
| Production | 987 | | | 844 | | | 2,810 | | | 2,342 | | |
| Sales, excluding purchases | 1,033 | | | 848 | | | 2,787 | | | 2,336 | | |
| Average realized price per pound | $ | 4.20 | | | $ | 3.01 | |
| $ | 4.22 | | | $ | 2.73 | | |
Site production and delivery costs per pounda | $ | 1.88 | | | $ | 1.77 | | b | $ | 1.92 | | c | $ | 1.92 | | b |
Unit net cash costs per pounda | $ | 1.24 | | | $ | 1.32 | | | $ | 1.36 | | | $ | 1.55 | | |
Gold (thousands of recoverable ounces) | | | | | | | | |
| Production | 374 | | | 237 | | | 976 | | | 584 | | |
Sales, excluding purchases | 402 | | | 234 | | | 965 | | | 562 | | |
| Average realized price per ounce | $ | 1,757 | | | $ | 1,902 | | | $ | 1,780 | | | $ | 1,810 | | |
Molybdenum (millions of recoverable pounds) | | | | | | | | |
| Production | 23 | | | 19 | | | 63 | | | 57 | | |
Sales, excluding purchases | 20 | | | 20 | | | 63 | | | 59 | | |
| Average realized price per pound | $ | 18.61 | | | $ | 9.23 | | | $ | 14.36 | | | $ | 10.30 | | |
| | | | | | | | |
| | | | | | | | |
| | | | | | | | |
| | | | | | | | |
| | | | | | | | |
| | | | | | | | |
| | | | | | | | |
| | | | | | | | |
| | | | | | | | |
| | | | | | | | |
| | | | | | | | |
| | | | | | | | |
a.Reflects per pound weighted-average production and delivery costs and unit net cash costs (net of by-product credits) for all copper mines, before net noncash and other costs. For reconciliations of per pound unit costs by operating division to production and delivery costs applicable to sales reported in our consolidated financial statements, refer to “Product Revenues and Production Costs.”
b.Excludes charges totaling $0.04 per pound of copper in third-quarter 2020 and $0.09 per pound of copper for the first nine months of 2020, primarily associated with idle facility and contract cancellations costs related to the COVID-19 pandemic and employee separation costs associated with the April 2020 revised operating plans.
c.Includes $0.03 per pound of copper associated with nonrecurring labor-related costs at Cerro Verde for agreements reached with approximately 65 percent of its hourly employees. Refer to “Operations – South America Mining” for further discussion.
Revenues
Consolidated revenues totaled $6.1 billion in third-quarter 2021, $3.9 billion in third-quarter 2020, $16.7 billion for the first nine months of 2021 and $9.7 billion for the first nine months of 2020. Revenues from our mining operations primarily include the sale of copper concentrate, copper cathode, copper rod, gold in concentrate and molybdenum. Refer to Note 9 for a summary of product revenues.
Following is a summary of changes in our consolidated revenues between periods (in millions):
| | | | | | | | | | | | | | |
| Three Months Ended September 30 | | Nine Months Ended September 30 | |
| | | | |
| Consolidated revenues - 2020 period | $ | 3,851 | | | $ | 9,703 | | |
| Higher sales volumes: | | | | |
| Copper | 554 | | | 1,231 | | |
| Gold | 319 | | | 730 | | |
| Molybdenum | 1 | | | 38 | | |
| | | | |
| Higher (lower) average realized prices: | | | | |
| Copper | 1,229 | | | 4,152 | | |
| Gold | (58) | | | (29) | | |
| Molybdenum | 186 | | | 254 | | |
| Adjustments for prior period provisionally priced copper sales | (80) | | | 271 | | |
| Higher Atlantic Copper revenues | 244 | | | 819 | | |
| (Lower) higher revenues from purchased copper | (43) | | | 84 | | |
| | | | |
| Higher treatment charges | (31) | | | (74) | | |
| Higher royalties and export duties | (90) | | | (242) | | |
| Other, including intercompany eliminations | 1 | | | (256) | | |
| Consolidated revenues - 2021 period | $ | 6,083 | | | $ | 16,681 | | |
| | | | |
| | | | |
Sales Volumes. Consolidated copper and gold sales volumes increased in the 2021 periods, compared to the 2020 periods, primarily reflecting the ramp-up of underground mining at PT-FI. Refer to “Operations” for further discussion of sales volumes at our mining operations.
Realized Prices. Our consolidated revenues can vary significantly as a result of fluctuations in the market prices of copper, gold and molybdenum. Average realized prices for third-quarter 2021, compared with third-quarter 2020, were 40 percent higher for copper, 8 percent lower for gold and 102 percent higher for molybdenum and average realized prices for the first nine months of 2021, compared with the first nine months of 2020, were 55 percent higher for copper, 2 percent lower for gold and 39 percent higher for molybdenum.
Average realized copper prices include net (unfavorable) favorable adjustments to current period provisionally priced copper sales totaling $(93) million in third-quarter 2021, $23 million in third-quarter 2020, $54 million for the first nine months of 2021 and $120 million for the first nine months of 2020. As discussed in Note 6, substantially all of our copper concentrate and cathode sales contracts provide final copper pricing in a specified future month (generally one to four months from the shipment date) based primarily on quoted LME monthly average copper prices. We record revenues and invoice customers at the time of shipment based on then-current LME prices, which results in an embedded derivative on provisionally priced concentrate and cathode sales that is adjusted to fair value through earnings each period, using the period-end forward prices, until final pricing on the date of settlement. To the extent final prices are higher or lower than what was recorded on a provisional basis, an increase or decrease to revenues is recorded each reporting period until the date of final pricing. Accordingly, in times of rising copper prices, our revenues benefit from adjustments to the final pricing of provisionally priced sales pursuant to contracts entered into in prior periods; in times of falling copper prices, the opposite occurs.
Prior Period Provisionally Priced Copper Sales. Net (unfavorable) favorable adjustments to prior periods’ provisionally priced copper sales (i.e., provisionally priced sales at June 30, 2021 and 2020, and December 31,
2020 and 2019) recorded in consolidated revenues totaled $(9) million in third-quarter 2021, $71 million in third-quarter 2020, $169 million for the first nine months of 2021 and $(102) million for the first nine months of 2020. Refer to Notes 6 and 9 for a summary of total adjustments to prior period and current period provisionally priced sales.
At September 30, 2021, we had provisionally priced copper sales totaling 313 million pounds of copper (net of intercompany sales and noncontrolling interests) recorded at an average of $4.05 per pound, subject to final pricing over the next several months. We estimate that each $0.05 change in the price realized from the September 30, 2021, provisional price recorded would have an approximate $10 million effect on our 2021 net income attributable to common stock. The LME copper price settled at $4.52 per pound on October 29, 2021.
Atlantic Copper Revenues. Atlantic Copper revenues totaled $783 million in third-quarter 2021 and $2.3 billion for the first nine months of 2021, compared with $539 million in third-quarter 2020 and $1.4 billion for the first nine months of 2020. Higher revenues in the 2021 periods, compared with the 2020 periods, primarily reflect higher copper prices.
Purchased Copper. We purchase copper cathode primarily for processing by our Rod & Refining operations. The volumes of copper purchases vary depending on cathode production from our operations and totaled 28 million pounds in third-quarter 2021, 56 million pounds in third-quarter 2020, 149 million pounds for the first nine months of 2021 and 215 million pounds for the first nine months of 2020. The decrease in revenues associated with purchased copper in third-quarter 2021, compared to third-quarter 2020, primarily reflects lower volumes. The increase in revenues associated with purchased copper for the first nine months of 2021, compared to the first nine months of 2020 periods, reflects higher prices, partly offset by lower volumes.
Treatment Charges. Revenues from our concentrate sales are recorded net of treatment charges (i.e., fees paid to smelters that are generally negotiated annually), which will vary with the sales volumes and the price of copper.
Royalties and Export Duties. Royalties are primarily on PT-FI sales and vary with the volume of metal sold and the prices of copper and gold. PT-FI will continue to pay export duties until development progress for new domestic smelting with an annual capacity of 2 million metric tons of concentrate exceeds 50 percent. Refer to “Operations – Indonesia Mining” for further discussion of the current progress on a greenfield smelter in Indonesia and to Note 9 for a summary of royalty expense and export duties.
Production and Delivery Costs
Consolidated production and delivery costs totaled $3.0 billion in third-quarter 2021, $2.5 billion in third-quarter 2020, $8.9 billion for the first nine months of 2021 and $7.4 billion for the first nine months of 2020. Higher consolidated production and delivery costs in the 2021 periods primarily reflect higher sales volumes, higher milling and mining costs associated with the return to pre-COVID-19 operating rates and higher maintenance and input costs. The first nine months of 2021 also include nonrecurring labor-related charges at Cerro Verde totaling $74 million for agreements reached with approximately 65 percent of its hourly employees. The first nine months of 2020 also include charges totaling $202 million associated with the COVID-19 pandemic and revised operating plans.
Site Production and Delivery Costs Per Pound. Site production and delivery costs for our copper mining operations primarily include labor, energy and commodity-based inputs, such as sulphuric acid, reagents, liners, tires and explosives. Consolidated site production and delivery costs (before net noncash and other costs) for our copper mines averaged $1.88 per pound of copper in third-quarter 2021, $1.77 per pound of copper in third-quarter 2020, $1.92 per pound of copper for both the first nine months of 2021 and 2020.
Consolidated site production and delivery costs per pound in the third quarter and first nine months of 2021 were higher, compared with the third quarter and first nine months of 2020, primarily reflecting higher mining and milling costs associated with the return to pre-COVID-19 operating rates and higher maintenance and input costs, partly offset by higher sales volumes and lower leach unit production costs associated with higher recoveries. Consolidated site production and delivery costs per pound for the first nine months of 2021 included nonrecurring labor-related charges at Cerro Verde for agreements reached with approximately 65 percent of its hourly employees and the first nine months of 2020 excluded charges associated with the COVID-19 pandemic and the April 2020 revised operating plans. Refer to “Operations – Unit Net Cash Costs” for further discussion of unit net cash costs associated with our operating divisions and to “Product Revenues and Production Costs” for reconciliations of per pound costs by operating division to production and delivery costs applicable to sales reported in our consolidated financial statements.
Depreciation, Depletion and Amortization
Depreciation will vary under the unit-of-production (UOP) method as a result of changes in sales volumes and the related UOP rates at our mining operations. Consolidated depreciation, depletion and amortization (DD&A) totaled $528 million in third-quarter 2021, $394 million in third-quarter 2020, $1.4 billion for the first nine months of 2021 and $1.1 billion for the first nine months of 2020. Higher DD&A in the 2021 periods is primarily related to assets placed in service and higher sales volumes associated with the ramp-up of underground mining at PT-FI.
Metals Inventory Adjustments
Charges for metals inventory adjustments totaled $14 million in third-quarter 2021, $9 million in third-quarter 2020, $15 million for the first nine months of 2021 and $92 million for the first nine months of 2020. Metals inventory adjustments in the 2021 periods were primarily related to a leach stockpile adjustment. Metals inventory adjustments in the 2020 periods were related to volatility in copper and molybdenum prices associated with the COVID-19 pandemic.
Net (Gain) Loss on Sale of Assets
Net (gain) loss on sales of assets totaled $(60) million in third-quarter 2021, $2 million in third-quarter 2020, $(63) million for the first nine months of 2021 and $13 million for the first nine months of 2020. The gain on sales of assets in the 2021 periods primarily reflects the sale of Freeport Cobalt. Refer to Note 1 for further discussion.
Interest Expense, Net
Consolidated interest costs (before capitalization) totaled $157 million in third-quarter 2021, $160 million in third-quarter 2020, $482 million for the first nine months of 2021 and $490 million for the first nine months of 2020.
Capitalized interest varies with the level of qualifying assets associated with our development projects and average interest rates on our borrowings, and totaled $19 million in third-quarter 2021, $40 million in third-quarter 2020, $51 million for the first nine months of 2021 and $128 million for the first nine months of 2020. The decrease in capitalized interest in the 2021 periods, compared with the 2020 periods, is primarily related to significant assets at PT-FI’s underground mines being placed in service. Refer to “Capital Resources and Liquidity - Investing Activities” for discussion of capital expenditures associated with our major development projects.
Income Taxes
Following is a summary of the approximate amounts used in the calculation of our consolidated income tax provision (in millions, except percentages):
| | | | | | | | | | | | | | | | | | | | | | | | | | | | | | | | | | | | | | |
| Nine Months Ended September 30, | |
| 2021 | | 2020 | |
| Income (Loss)a | | Effective
Tax Rate | | Income Tax (Provision) Benefit | | Income (Loss)a | | Effective
Tax Rate | | Income Tax (Provision) Benefit | |
U.S.b | $ | 1,324 | | | 1 | % | | $ | (7) | | c | $ | (535) | | | 10 | % | | $ | 56 | | d |
| South America | 1,425 | | | 40 | % | | (576) | | | 149 | | | 51 | % | | (76) | | |
| Indonesia | 2,940 | | | 37 | % | | (1,101) | | e | 619 | | | 49 | % | | (302) | | f |
| | | | | | | | | | | | |
| | | | | | | | | | | | |
| Eliminations and other | (3) | | | N/A | | 19 | | | 95 | | | N/A | | (28) | | |
Rate adjustmentg | — | | | N/A | | (9) | | | — | | | N/A | | 17 | | |
| | | | | | | | | | | | |
| | | | | | | | | | | | |
| Consolidated FCX | $ | 5,686 | | | 29 | % | h | $ | (1,674) | | | $ | 328 | | | 102 | % | h,i | $ | (333) | | |
| | | | | | | | | | | | |
a.Represents income (loss) before income taxes and equity in affiliated companies’ net (losses) earnings.
b.In addition to our North America mining operations, the U.S. jurisdiction reflects corporate-level expenses, which include interest expense associated with senior notes, general and administrative expenses, and environmental obligations and shutdown costs.
c.Includes valuation allowance release on prior year unbenefited net operating losses (NOLs).
d.Includes tax credits of $53 million associated with the reversal of a year-end 2019 tax charge related to the sale of our interest in the lower zone of the Timok exploration project in Serbia and $6 million associated with the removal of a valuation allowance on deferred tax assets.
e.Includes net tax benefits totaling $83 million ($66 million net of noncontrolling interest), consisting of $69 million associated with the release of a portion of the valuation allowances recorded against PT Rio Tinto Indonesia (PT-FI’s wholly owned subsidiary) NOLs and $24 million primarily associated with the reversal of a tax reserve related to the treatment of prior year contractor support costs; partly offset by a tax charge of $10 million associated with the audit of PT-FI's 2019 tax returns.
f.Includes tax charges totaling $29 million ($24 million net of noncontrolling interest), consisting of $21 million associated with establishing a tax reserve related to the treatment of prior year contractor support costs and $8 million associated with an unfavorable 2012 Indonesia Supreme Court ruling.
g.In accordance with applicable accounting rules, we adjust our interim provision for income taxes equal to our consolidated tax rate.
h.Our consolidated effective income tax rate is a function of the combined effective tax rates for the jurisdictions in which we operate.
i.Our U.S. jurisdiction generated net losses in the first nine months of 2020 that did not result in a realized tax benefit; applicable accounting rules required us to adjust our estimated annual effective tax rate to exclude the impact of U.S. net losses.
Assuming achievement of current sales volume and cost estimates and average fourth-quarter 2021 prices of $4.50 per pound for copper, $1,800 per ounce for gold and $19.00 per pound for molybdenum, we estimate our consolidated effective tax rate for the year 2021 would approximate 30 percent. Changes in projected sales volumes and average prices during 2021 would incur tax impacts at estimated effective rates of 40 percent for Peru, 38 percent for Indonesia and 0 percent for the U.S.
The net 0 percent U.S. estimated effective tax rate for the year 2021 includes approximately $190 million of valuation allowance reversal related to an expected $900 million use of U.S. federal NOLs during 2021.
OPERATIONS
Responsible Production
2020 Climate Report. In September 2021, we published our updated Climate Report, which details the work underway across our global business to reduce GHG emissions, improve energy efficiency, advance the use of renewable energy and enhance our resilience to future climate-related risks. The updated Climate Report reflects our continued progress towards alignment with the current recommendations of the Task Force on Climate-related Financial Disclosures.
The Copper Mark. We are committed to validating all of our copper producing sites with the Copper Mark. The Copper Mark is a robust assurance framework that demonstrates the copper industry's responsible production practices and contribution to the United Nations Sustainable Development Goals. Participating sites must complete an external assurance process to assess conformance with the Copper Mark’s 32 environmental, social and governance requirements, with a goal of being awarded the Copper Mark. We have six sites which have been certified, with five additional sites in progress.
North America Copper Mines
We operate seven open-pit copper mines in North America – Morenci, Bagdad, Safford (including Lone Star), Sierrita and Miami in Arizona, and Chino and Tyrone in New Mexico. In addition to copper, certain of these mines produce molybdenum concentrate, gold and silver. All of the North America mining operations are wholly owned, except for Morenci. We record our 72 percent undivided joint venture interest in Morenci using the proportionate consolidation method.
The North America copper mines include open-pit mining, sulfide ore concentrating, leaching and solution extraction/electrowinning (SX/EW) operations. A majority of the copper produced at our North America copper mines is cast into copper rod by our Rod & Refining segment. The remainder of our North America copper production is sold as copper cathode or copper concentrate, a portion of which is shipped to Atlantic Copper (our wholly owned smelter). Molybdenum concentrate, gold and silver are also produced by certain of our North America copper mines.
Operating and Development Activities. Our North America operating sites continue to achieve strong execution of operating plans. Current operations at the Lone Star copper leach project, which was completed in the second half of 2020, are exceeding the initial design capacity of 200 million pounds annually by approximately 25 percent. We continue to advance opportunities to increase Lone Star operating rates and are evaluating a potential additional incremental oxide expansion to increase volumes to over 300 million pounds of copper per year. The oxide project advances the opportunity for development of the large-scale sulfide resources at Lone Star. We are increasing exploration in the area to support metallurgical testing and mine development planning for a potential long-term investment in a concentrator.
We have substantial resources in North America, primarily associated with existing mining operations. Evaluations of project options for future growth are being advanced. In addition to Lone Star, we are reviewing and actively evaluating an additional concentrator to add new capacity at our long-lived Bagdad operation, and are utilizing data analytics and testing new applications to recover additional copper from existing leach stockpiles.
Operating Data. Following is summary consolidated operating data for the North America copper mines:
| | | | | | | | | | | | | | | | | | | | | | | | | | | | |
| Three Months Ended September 30, | | Nine Months Ended
September 30, | | | |
| | | | | | |
| | 2021 | | 2020 | | 2021 | | 2020 | | | |
| Operating Data, Net of Joint Venture Interests | | | | | | | | | | |
Copper (millions of recoverable pounds) | | | | | | | | | | |
| Production | 377 | | | 369 | | | 1,090 | | | 1,083 | | | | |
| Sales, excluding purchases | 375 | | | 379 | | | 1,072 | | | 1,102 | | | | |
| Average realized price per pound | $ | 4.34 | | | $ | 3.01 | | | $ | 4.24 | | | $ | 2.67 | |
| | |
| | | | | | | | | | |
Molybdenum (millions of recoverable pounds) | | | | | | | | | | |
Productiona | 9 | | | 7 | | | 26 | | | 24 | | | | |
| | | | | | | | | | |
| 100% Operating Data | | | | | | | | | | |
| Leach operations | | | | | | | | | | |
| Leach ore placed in stockpiles (metric tons per day) | 579,100 | | | 692,000 | | | 656,900 | | | 708,100 | | | | |
| Average copper ore grade (percent) | 0.30 | | | 0.26 | | | 0.29 | | | 0.27 | | | | |
| Copper production (millions of recoverable pounds) | 270 | | | 286 | | | 797 | | | 786 | | | | |
| | | | | | | | | | |
| Mill operations | | | | | | | | | | |
| Ore milled (metric tons per day) | 274,300 | | | 255,200 | | | 269,000 | | | 291,500 | | | | |
| Average ore grade (percent): | | | | | | | | | | |
| Copper | 0.39 | | | 0.36 | | | 0.38 | | | 0.35 | | | | |
| Molybdenum | 0.03 | | | 0.03 | | | 0.03 | | | 0.02 | | | | |
| Copper recovery rate (percent) | 81.6 | | | 84.4 | | | 80.9 | | | 85.4 | | | | |
| Copper production (millions of recoverable pounds) | 170 | | | 155 | | | 476 | | | 509 | | | | |
| | | | | | | | | | |
a.Refer to “Consolidated Results” for our consolidated molybdenum sales volumes, which include sales of molybdenum produced at the North America copper mines.
Our consolidated copper sales volumes from North America totaled 375 million pounds in third-quarter 2021, 379 million pounds in third-quarter 2020, and 1.1 billion pounds for both the first nine months of 2021 and 2020. North America copper sales are estimated to approximate 1.46 billion pounds for the year 2021, compared with 1.4 billion pounds for the year 2020.
Unit Net Cash Costs. Unit net cash costs per pound of copper is a measure intended to provide investors with information about the cash-generating capacity of our mining operations expressed on a basis relating to the primary metal product for our respective operations. We use this measure for the same purpose and for monitoring operating performance by our mining operations. This information differs from measures of performance determined in accordance with U.S. generally accepted accounting principles (GAAP) and should not be considered in isolation or as a substitute for measures of performance determined in accordance with U.S. GAAP. This measure is presented by other metals mining companies, although our measure may not be comparable to similarly titled measures reported by other companies.
Gross Profit per Pound of Copper and Molybdenum
The following table summarizes unit net cash costs and gross profit per pound at our North America copper mines. Refer to “Product Revenues and Production Costs” for an explanation of the “by-product” and “co-product” methods and a reconciliation of unit net cash costs per pound to production and delivery costs applicable to sales reported in our consolidated financial statements.
| | | | | | | | | | | | | | | | | | | | | | | | | | | | | | | | | | | | | | |
| Three Months Ended September 30, | |
| | 2021 | | 2020 | |
| | By- Product Method | | Co-Product Method | | By- Product Method | | Co-Product Method | |
| | Copper | | Molyb- denuma | | | Copper | | Molyb-
denuma | |
| Revenues, excluding adjustments | $ | 4.34 | | | $ | 4.34 | | | $ | 16.69 | | | $ | 3.01 | | | $ | 3.01 | | | $ | 7.72 | | |
| | | | | | | | | | | | |
Site production and delivery, before net noncash and other costs shown below | 2.12 | | | 1.93 | | | 8.97 | | | 1.76 | | | 1.67 | | | 5.52 | | |
| By-product credits | (0.39) | | | — | | | — | | | (0.18) | | | — | | | — | | |
| Treatment charges | 0.09 | | | 0.09 | | | — | | | 0.09 | | | 0.08 | | | — | | |
| Unit net cash costs | 1.82 | | | 2.02 | | | 8.97 | | | 1.67 | | | 1.75 | | | 5.52 | | |
| DD&A | 0.25 | | | 0.23 | | | 0.73 | | | 0.24 | | | 0.23 | | | 0.43 | | |
| Metals inventory adjustments | 0.03 | | | 0.03 | | | — | | | (0.01) | | | (0.01) | | | — | | |
| Noncash and other costs, net | 0.08 | |
| 0.08 | | | 0.23 | | | 0.10 | | b | 0.09 | | | 0.06 | | |
| Total unit costs | 2.18 | | | 2.36 | | | 9.93 | | | 2.00 | | | 2.06 | | | 6.01 | | |
Revenue adjustments, primarily for pricing on prior period open sales | (0.02) | | | (0.02) | | | — | | | — | | | — | | | — | | |
| Gross profit per pound | $ | 2.14 | | | $ | 1.96 | | | $ | 6.76 | | | $ | 1.01 | | | $ | 0.95 | | | $ | 1.71 | | |
| | | | | | | | | | | | |
| Copper sales (millions of recoverable pounds) | 375 | | | 375 | | | | | 378 | | | 378 | | | | |
Molybdenum sales (millions of recoverable pounds)a | | | | | 9 | | | | | | | 7 | | |
| | | | | | | | | | | | | | | | | | | | | | | | | | | | | | | | | | | | | | |
| Nine months ended September 30, | |
| | 2021 | | 2020 | |
| | By- Product Method | | Co-Product Method | | By- Product Method | | Co-Product Method | |
| | Copper | | Molyb- denuma | | | Copper | | Molyb-
denuma | |
| Revenues, excluding adjustments | $ | 4.24 | | | $ | 4.24 | | | $ | 13.09 | | | $ | 2.67 | | | $ | 2.67 | | | $ | 8.57 | | |
| | | | | | | | | | | | |
Site production and delivery, before net noncash and other costs shown below | 2.11 | | | 1.95 | | | 7.54 | | | 1.91 | | | 1.78 | | | 7.05 | | |
| By-product credits | (0.32) | | | — | | | — | | | (0.19) | | | — | | | — | | |
| Treatment charges | 0.09 | | | 0.09 | | | — | | | 0.10 | | | 0.10 | | | — | | |
| Unit net cash costs | 1.88 | | | 2.04 | | | 7.54 | | | 1.82 | | | 1.88 | | | 7.05 | | |
| DD&A | 0.26 | | | 0.24 | | | 0.59 | | | 0.25 | | | 0.23 | | | 0.57 | | |
| Metals inventory adjustments | 0.01 | | | 0.01 | | | — | | | 0.05 | | | 0.04 | | | — | | |
| Noncash and other costs, net | 0.10 | | | 0.09 | | | 0.12 | | | 0.10 | | b | 0.10 | | | 0.12 | | |
| Total unit costs | 2.25 | | | 2.38 | | | 8.25 | | | 2.22 | | | 2.25 | | | 7.74 | | |
Revenue adjustments, primarily for pricing on prior period open sales | 0.01 | | | 0.01 | | | — | | | (0.01) | | | (0.01) | | | — | | |
| Gross profit per pound | $ | 2.00 | | | $ | 1.87 | | | $ | 4.84 | | | $ | 0.44 | | | $ | 0.41 | | | $ | 0.83 | | |
| | | | | | | | | | | | |
| Copper sales (millions of recoverable pounds) | 1,072 | | | 1,072 | | | | | 1,100 | | | 1,100 | | | | |
Molybdenum sales (millions of recoverable pounds)a | | | | | 26 | | | | | | | 24 | | |
a.Reflects sales of molybdenum produced by certain of the North America copper mines to our molybdenum sales company at market-based pricing.
b.Includes charges totaling $0.03 per pound of copper for both third-quarter 2020 and the first nine months of 2020, primarily associated with the April 2020 revised operating plans (including employee separation costs) and the COVID-19 pandemic.
Our North America copper mines have varying cost structures because of differences in ore grades and characteristics, processing costs, by-product credits and other factors. Average unit net cash costs (net of by-product credits) for the North America copper mines of $1.82 per pound of copper in third-quarter 2021 and $1.88 per pound of copper for first nine months of 2021 were higher than unit net cash costs of $1.67 per pound in third-quarter 2020 and $1.82 per pound for the first nine months of 2020, primarily reflecting higher mining and milling costs associated with the return to pre-COVID-19 operating rates and higher maintenance and input costs, partly offset by higher by-product credits and lower leach unit production costs associated with higher recoveries.
Because certain assets are depreciated on a straight-line basis, North America’s average unit depreciation rate may vary with asset additions and the level of copper production and sales.
Average unit net cash costs (net of by-product credits) for our North America copper mines are expected to approximate $1.85 per pound of copper for the year 2021, based on achievement of current sales volume and cost estimates and assuming an average molybdenum price of $19.00 per pound in fourth-quarter 2021. North America’s average unit net cash costs for the year 2021 would change by approximately $0.01 per pound for each $2 per pound change in the average price of molybdenum in fourth-quarter 2021.
South America Mining
We operate two copper mines in South America – Cerro Verde in Peru (in which we own a 53.56 percent interest) and El Abra in Chile (in which we own a 51 percent interest), which are consolidated in our financial statements.
South America mining includes open-pit mining, sulfide ore concentrating, leaching and SX/EW operations. Production from our South America mines is sold as copper concentrate or cathode under long-term contracts. Our South America mines also sell a portion of their copper concentrate production to Atlantic Copper. In addition to copper, the Cerro Verde mine produces molybdenum concentrate and silver.
Cerro Verde Labor Agreement. Cerro Verde's collective labor agreement (CLA) expired on August 31, 2021, and as of September 30, 2021, approximately 65 percent of its hourly employees have signed new CLAs. Cerro Verde incurred nonrecurring charges for the first nine months of 2021 totaling $74 million associated with these agreements. Negotiations for new CLAs for Cerro Verde's remaining hourly employees are ongoing and may result in additional charges.
Operating and Development Activities. Milling rates at Cerro Verde's concentrator facilities averaged 381,500 metric tons of ore per day for the first nine months of 2021. Subject to ongoing monitoring of COVID-19 protocols, Cerro Verde is targeting milling rates to average approximately 400,000 metric tons of ore per day in 2022.
El Abra is increasing operating rates to pre-COVID-19 pandemic levels. Stacking rates at El Abra averaged 93,100 metric tons per day in third-quarter 2021, approximately 25 percent higher than third-quarter 2020. Increased stacking rates are expected to result in incremental annual production of approximately 70 million pounds of copper beginning in mid-2022, compared with 2020 levels. A new leach pad is under construction to accommodate planned stacking rates for the next several years.
We continue to evaluate a large-scale expansion at El Abra to process additional sulfide material and to achieve higher copper recoveries. El Abra's large sulfide resource could potentially support a major mill project similar to facilities constructed at Cerro Verde in 2015. Technical and economic studies continue to be evaluated to determine the optimal scope and timing for the sulfide project, and we are engaging stakeholders and preparing data required for submission of a robust permit application. We are monitoring potential changes in government regulatory and fiscal matters in Chile and will defer major investment decisions pending clarity on these matters.
Operating Data. Following is summary consolidated operating data for South America mining:
| | | | | | | | | | | | | | | | | | | | | | | | | | |
| Three Months Ended September 30, | | Nine months ended September 30, | |
| | | | |
| | 2021 | | 2020 | | 2021 | | 2020 | |
Copper (millions of recoverable pounds) | | | | | | | | |
| Production | 260 | | | 253 | | | 764 | | | 716 | | |
| Sales | 280 | | | 250 | | | 769 | | | 716 | | |
| Average realized price per pound | $ | 4.12 | | | $ | 3.02 | | | $ | 4.21 | | | $ | 2.79 | | |
| | | | | | | | |
| | | | | | | | |
| | | | | | | | |
| | | | | | | | |
| | | | | | | | |
| | | | | | | | |
Molybdenum (millions of recoverable pounds) | | | | | | | | |
Productiona | 5 | | | 6 | | | 14 | | | 14 | | |
| | | | | | | | |
| Leach operations | | | | | | | | |
| Leach ore placed in stockpiles (metric tons per day) | 171,600 | | | 172,400 | | | 171,900 | | | 165,600 | | |
| Average copper ore grade (percent) | 0.30 | | | 0.35 | | | 0.33 | | | 0.35 | | |
| Copper production (millions of recoverable pounds) | 62 | | | 55 | | | 188 | | | 180 | | |
| | | | | | | | |
| Mill operations | | | | | | | | |
| Ore milled (metric tons per day) | 380,300 | | | 351,000 | | | 381,500 | | | 317,600 | | b |
| Average ore grade (percent): | | | | | | | | |
| Copper | 0.31 | | | 0.33 | | | 0.30 | | | 0.35 | | |
| Molybdenum | 0.01 | | | 0.01 | | | 0.01 | | | 0.01 | | |
| | | | | | | | |
| Copper recovery rate (percent) | 86.1 | | | 88.4 | | | 86.3 | | | 83.5 | | |
| Copper production (millions of recoverable pounds) | 199 | | | 198 | | | 576 | | | 536 | | |
a.Refer to “Consolidated Results” for our consolidated molybdenum sales volumes, which include sales of molybdenum produced at Cerro Verde.
b.Cerro Verde mill operations were negatively impacted by COVID-19 restrictions.
Our consolidated copper sales volumes from South America totaled 280 million pounds in third-quarter 2021, 250 million pounds in third-quarter 2020, 769 million pounds for the first nine months of 2021 and 716 million pounds for the first nine months of 2020. Higher copper sales volumes in third-quarter 2021, compared with third-quarter 2020, primarily reflect timing of shipments. Higher copper sales volumes for the first nine months of 2021, compared with the first nine months of 2020, primarily reflect continued progress to return to pre-COVID-19 operating rates.
Copper sales from South America mining are expected to approximate 1.0 billion pounds for the year 2021, slightly higher than the year 2020.
Unit Net Cash Costs. Unit net cash costs per pound of copper is a measure intended to provide investors with information about the cash-generating capacity of our mining operations expressed on a basis relating to the primary metal product for our respective operations. We use this measure for the same purpose and for monitoring operating performance by our mining operations. This information differs from measures of performance determined in accordance with U.S. GAAP and should not be considered in isolation or as a substitute for measures of performance determined in accordance with U.S. GAAP. This measure is presented by other metals mining companies, although our measure may not be comparable to similarly titled measures reported by other companies.
Gross Profit per Pound of Copper
The following table summarizes unit net cash costs and gross profit per pound of copper at our South America mining operations. Unit net cash costs per pound of copper are reflected under the by-product and co-product methods as the South America mining operations also had sales of molybdenum and silver. Refer to “Product Revenues and Production Costs” for an explanation of the “by-product” and “co-product” methods and a reconciliation of unit net cash costs per pound to production and delivery costs applicable to sales reported in our consolidated financial statements.
| | | | | | | | | | | | | | | | | | | | | | | | | | |
| Three Months Ended September 30, | |
| | 2021 | | 2020 | |
| By-Product
Method | | Co-Product
Method | | By-Product
Method | | Co-Product
Method | |
| Revenues, excluding adjustments | $ | 4.12 | | | $ | 4.12 | | | $ | 3.02 | | | $ | 3.02 | | |
| | | | | | | | |
| Site production and delivery, before net noncash and other costs shown below | 2.14 | | a | 1.96 | | | 1.84 | | | 1.73 | | |
| By-product credits | (0.38) | | | — | | | (0.17) | | | — | | |
| Treatment charges | 0.13 | | | 0.13 | | | 0.15 | | | 0.15 | | |
| Royalty on metals | 0.01 | | | 0.01 | | | 0.01 | | | 0.01 | | |
| Unit net cash costs | 1.90 | | | 2.10 | | | 1.83 | | | 1.89 | | |
| DD&A | 0.40 | | | 0.36 | | | 0.42 | | | 0.39 | | |
| | | | | | | | |
| Noncash and other costs, net | 0.07 | | | 0.06 | | | 0.04 | | b | 0.04 | | |
| Total unit costs | 2.37 | | | 2.52 | | | 2.29 | | | 2.32 | | |
| Revenue adjustments, primarily for pricing on prior period open sales | (0.03) | | | (0.03) | | | 0.16 | | | 0.16 | | |
| Gross profit per pound | $ | 1.72 | | | $ | 1.57 | | | $ | 0.89 | | | $ | 0.86 | | |
| | | | | | | | |
| Copper sales (millions of recoverable pounds) | 280 | | | 280 | | | 250 | | | 250 | | |
| | | | | | | | | | | | | | | | | | | | | | | | | | |
| Nine months ended September 30, | |
| | 2021 | | 2020 | |
| By-Product
Method | | Co-Product
Method | | By-Product
Method | | Co-Product
Method | |
| Revenues, excluding adjustments | $ | 4.21 | | | $ | 4.21 | | | $ | 2.79 | | | $ | 2.79 | | |
| | | | | | | | |
| Site production and delivery, before net noncash and other costs shown below | 2.20 | | a | 2.04 | | | 1.83 | | | 1.72 | | |
| By-product credits | (0.31) | | | — | | | (0.15) | | | — | | |
| Treatment charges | 0.13 | | | 0.13 | | | 0.15 | | | 0.15 | | |
| Royalty on metals | 0.01 | | | 0.01 | | | 0.01 | | | 0.01 | | |
| Unit net cash costs | 2.03 | | | 2.18 | | | 1.84 | | | 1.88 | | |
| DD&A | 0.40 | | | 0.36 | | | 0.44 | | | 0.41 | | |
| | | | | | | | |
| Noncash and other costs, net | 0.07 | | | 0.06 | | | 0.16 | | b | 0.15 | | |
| Total unit costs | 2.50 | | | 2.60 | | | 2.44 | | | 2.44 | | |
| Revenue adjustments, primarily for pricing on prior period open sales | 0.13 | | | 0.13 | | | (0.10) | | | (0.10) | | |
| Gross profit per pound | $ | 1.84 | | | $ | 1.74 | | | $ | 0.25 | | | $ | 0.25 | | |
| | | | | | | | |
| Copper sales (millions of recoverable pounds) | 769 | | | 769 | | | 716 | | | 716 | | |
a.Includes $0.02 per pound of copper in third-quarter 2021 and $0.10 per pound of copper for the first nine months of 2021 associated with nonrecurring labor-related charges at Cerro Verde for agreements reached with approximately 65 percent of its hourly employees.
b.Third-quarter 2020 includes charges totaling $0.02 per pound of copper, primarily associated with the COVID-19 pandemic (including health and safety costs). The first nine months of 2020 includes charges totaling $0.13 per pound of copper, primarily associated with idle facility (Cerro Verde) and contract cancellation costs related to the COVID-19 pandemic, and employee separation costs associated with the April 2020 revised operating plans.
Our South America mines have varying cost structures because of differences in ore grades and characteristics, processing costs, by-product credits and other factors. Average unit net cash costs (net of by-product credits) for the South America copper mines were $1.90 per pound of copper in third-quarter 2021, $1.83 per pound of copper in third-quarter 2020, $2.03 per pound of copper for the first nine months of 2021 and $1.84 per pound of copper for the first nine months of 2020. Higher unit net cash costs in the 2021 periods, compared with the 2020 periods, primarily reflect increased milling activities, profit-sharing costs and higher maintenance and input costs, partly offset by higher sales volumes and by-product credits. The first nine months of 2021 also included nonrecurring labor-related charges at Cerro Verde ($0.10 per pound of copper) for new CLAs as discussed above.
Revenues from Cerro Verde’s concentrate sales are recorded net of treatment charges, which will vary with Cerro Verde’s sales volumes and the price of copper.
Because certain assets are depreciated on a straight-line basis, South America’s unit depreciation rate may vary with asset additions and the level of copper production and sales.
Revenue adjustments primarily result from changes in prices on provisionally priced copper sales recognized in prior periods. Refer to “Consolidated Results – Revenues” for further discussion of adjustments to prior period provisionally priced copper sales.
Average unit net cash costs (net of by-product credits) for South America mining are expected to approximate $2.04 per pound of copper for the year 2021, based on current sales volume and cost estimates and assuming an average price of $19.00 per pound of molybdenum in fourth-quarter 2021.
Indonesia Mining
PT-FI operates one of the world’s largest copper and gold mines at the Grasberg minerals district in Papua, Indonesia. PT-FI produces copper concentrate that contains significant quantities of gold and silver. We have a 48.76 percent interest in PT-FI and manage its mining operations. As further discussed in Note 2 of our 2020 Form 10-K, under the terms of the shareholders agreement, our economic interest in PT-FI approximates 81 percent through 2022. PT-FI’s results are consolidated in our financial statements.
PT-FI continues to operate with heightened protocols and travel restrictions designed to protect the health and safety of its workforce and the surrounding community during the COVID-19 pandemic. These measures have proven effective and have enabled PT-FI to operate reliably throughout the pandemic.
Substantially all of PT-FI’s copper concentrate is sold under long-term contracts. During the first nine months of 2021, 44 percent of PT-FI’s concentrate production was sold to PT Smelting (PT-FI’s 39.5-percent owned copper smelter and refinery in Gresik, Indonesia).
Operating and Development Activities. The ramp-up of underground production at the Grasberg minerals district in Indonesia continues to advance on schedule. Third-quarter 2021 highlights include:
•Production approximated 90 percent of the projected ultimate annualized level and is expected to reach 100 percent by year-end 2021.
•A total of 27 new drawbells were constructed at the Grasberg Block Cave and Deep Mill Level Zone (DMLZ) underground mines, bringing cumulative open drawbells to 490.
•Combined average production from the Grasberg Block Cave and DMLZ underground mines approximated 136,200 metric tons of ore per day and PT-FI's milling rates averaged 157,400 metric tons of ore per day.
PT-FI’s milling rates averaged over 177,000 metric tons of ore per day for the month of September 2021. PT-FI expects milling rates to average approximately 175,000 metric tons of ore per day in fourth-quarter 2021 and to continue at that rate until additional milling facilities are installed as currently planned in 2023, which PT-FI expects will result in mill capacity of approximately 240,000 metric tons of ore per day.
PT-FI expects to generate average annual production of 1.55 billion pounds of copper and 1.6 million ounces of gold for the next several years at an attractive unit net cash cost, providing significant margins and cash flows. For the year 2021, PT-FI production is expected to approximate 1.3 billion pounds of copper and 1.3 million ounces of gold, nearly double 2020 levels.
PT-FI's estimated annual capital spending on underground mine development projects is expected to average approximately $0.9 billion per year for 2021 and 2022, net of scheduled contributions from PT Inalum. In accordance with applicable accounting guidance, aggregate costs (before scheduled contributions from PT Inalum), which are expected to average $1.1 billion per year for 2021 and 2022, will be reflected as an investing activity in our cash flow statement, and contributions from PT Inalum will be reflected as a financing activity.
Kucing Liar. PT-FI is planning to commence long-term mine development activities for its Kucing Liar deposit to produce approximately 6 billion pounds of copper and 6 million ounces of gold over the life of the project. Refer to our 2020 Form 10-K for further discussion of Kucing Liar. Similar to PT-FI's experience with large-scale, block-cave mines, pre-production development activities will occur over an approximate 10-year timeframe. At full operating rates, annual production from Kucing Liar is expected to exceed 500 million pounds of copper and 500,000 ounces of gold, providing PT-FI with sustained long-term, large-scale and low-cost production. Capital investments for Kucing Liar over the next 10 years are expected to average approximately $400 million per year. Kucing Liar will benefit from substantial shared infrastructure and PT-FI's experience and long-term success in block-cave mining.
Indonesia Smelter. As discussed in Note 13 of our 2020 Form 10-K, PT-FI committed to construct additional domestic smelting capacity totaling 2 million metric tons of concentrate per year. During 2020, PT-FI notified the Indonesia government of schedule delays for construction of the greenfield smelter resulting from the COVID-19 pandemic and continues to review with the government a revised schedule for the project.
To fulfill its obligation for additional domestic smelter capacity in Indonesia, PT-FI is planning the following:
•Construction of a new greenfield smelter in Gresik, Indonesia with a capacity to process approximately 1.7 million metric tons of concentrate per year. In July 2021, PT-FI awarded a construction contract to Chiyoda with an estimated cost of $2.8 billion. The smelter construction is expected to be completed as soon as feasible in 2024, which is subject to, among other things, pandemic-related disruptions.
•Expansion of annual capacity at PT Smelting by 300,000 metric tons of concentrate, a 30 percent increase. PT-FI is advancing agreements with the majority owner of PT Smelting to implement the expansion plans with a target completion date of year-end 2023. PT-FI would fund the cost of the expansion, estimated to approximate $250 million, and increase its ownership in PT Smelting to a majority ownership interest.
•Construction of a PMR to process gold and silver from the new greenfield smelter and PT Smelting at an estimated cost of $250 million.
All costs of smelter development in Indonesia will be shared 49 percent by FCX and 51 percent by PT Inalum, and will be largely offset by a phase-out of the 5 percent export duty currently paid to the Indonesia government as well as the tax deductibility of smelter costs by PT-FI.
In July 2021, PT-FI entered into a $1.0 billion, five-year, unsecured bank credit facility to advance these projects. As of September 30, 2021, $158 million ($146 million net of debt issuance costs) was drawn under this facility. Additional debt financing is being evaluated to fund the projects. Refer to Note 5 and “Capital Resources and Liquidity” for further discussion of the credit facility. Capital expenditures for the Indonesia smelter project totaled $0.1 billion for the first nine months of 2021, and are expected to approximate $0.3 billion for the year 2021.
Operating Data. Following is summary consolidated operating data for Indonesia mining:
| | | | | | | | | | | | | | | | | | | | | | | | | | |
| Three Months Ended September 30, | | Nine months ended September 30, | |
| | | | |
| | 2021 | | 2020 | | 2021 | | 2020 | |
Copper (millions of recoverable pounds) | | | | | | | | |
| Production | 350 | | | 222 | | | 956 | | | 543 | | |
| Sales | 378 | | | 219 | | | 946 | | | 518 | | |
| Average realized price per pound | $ | 4.11 | | | $ | 3.00 | | | $ | 4.21 | | | $ | 2.79 | | |
| | | | | | | | |
Gold (thousands of recoverable ounces) | | | | | | | | |
| Production | 371 | | | 236 | | | 968 | | | 577 | | |
| Sales | 399 | | | 230 | | | 957 | | | 549 | | |
| Average realized price per ounce | $ | 1,757 | | | $ | 1,902 | | | $ | 1,780 | | | $ | 1,810 | | |
| | | | | | | | |
| Ore extracted and milled (metric tons per day): | | | | | | | | |
Grasberg Block Cave underground minea | 76,500 | | | 30,800 | | | 64,300 | | | 25,700 | | |
DMLZ underground minea | 59,700 | | | 29,100 | | | 53,500 | | | 25,100 | | |
Deep Ore Zone underground mineb | 2,700 | | | 20,700 | | | 10,600 | | | 20,900 | | |
| Big Gossan underground mine | 7,400 | | | 7,100 | | | 7,500 | | | 6,600 | | |
| | | | | | | | |
| Other | 11,100 | | | (400) | | | 5,700 | | | 2,200 | | |
| Total | 157,400 | | | 87,300 | |
| 141,600 | | | 80,500 | | |
| Average ore grades: | | | | | | | | |
| Copper (percent) | 1.30 | | | 1.45 | | | 1.32 | | | 1.30 | | |
| Gold (grams per metric ton) | 1.05 | | | 1.20 | | | 1.04 | | | 1.08 | | |
| Recovery rates (percent): | | | | | | | | |
| Copper | 90.1 | | | 92.3 | | | 90.0 | | | 92.0 | | |
| Gold | 78.6 | | | 79.3 | | | 77.8 | | | 78.2 | | |
a.Includes ore from development activities that result in metal production.
b.Expected to cease production by December 31, 2021.
Our consolidated copper and gold sales from PT-FI totaled 378 million pounds and 399 thousand ounces in third-quarter 2021 and 946 million pounds and 957 thousand ounces for the first nine months of 2021, compared with copper and gold sales of 219 million pounds and 230 thousand ounces in third-quarter 2020 and 518 million pounds and 549 thousand ounces for the first nine months of 2020. The increase in sales volumes for the 2021 periods primarily reflects the ramp-up of underground mining at PT-FI and the timing of shipments.
Consolidated sales volumes from PT-FI are expected to approximate 1.3 billion pounds of copper and 1.3 million ounces of gold for the year 2021, compared with 0.8 billion pounds of copper and 0.8 million ounces of gold for the year 2020.
Unit Net Cash Costs. Unit net cash costs per pound of copper is a measure intended to provide investors with information about the cash-generating capacity of our mining operations expressed on a basis relating to the primary metal product for our respective operations. We use this measure for the same purpose and for monitoring operating performance by our mining operations. This information differs from measures of performance determined in accordance with U.S. GAAP and should not be considered in isolation or as a substitute for measures of performance determined in accordance with U.S. GAAP. This measure is presented by other metals mining companies, although our measure may not be comparable to similarly titled measures reported by other companies.
Gross Profit per Pound of Copper and per Ounce of Gold
The following table summarizes the unit net cash costs and gross profit per pound of copper and per ounce of gold at our Indonesia mining operations. Refer to “Product Revenues and Production Costs” for an explanation of “by-product” and “co-product” methods and a reconciliation of unit net cash costs per pound to production and delivery costs applicable to sales reported in our consolidated financial statements.
| | | | | | | | | | | | | | | | | | | | | | | | | | | | | | | | | | | |
| Three Months Ended September 30, |
| | 2021 | | 2020 |
| | By-Product Method | | Co-Product Method | | By-Product Method | | Co-Product Method |
| | | Copper | | Gold | | | Copper | | Gold |
| Revenues, excluding adjustments | $ | 4.11 | | | $ | 4.11 | | | $ | 1,757 | | | $ | 3.00 | | | $ | 3.00 | | | $ | 1,902 | |
| | | | | | | | | | | |
| Site production and delivery, before net noncash and other costs shown below | 1.46 | | | 0.99 | | | 424 | | | 1.71 | | | 1.01 | | | 639 | |
| Gold and silver credits | (1.97) | | | — | | | — | | | (2.16) | | | — | | | — | |
| Treatment charges | 0.24 | | | 0.16 | | | 69 | | | 0.26 | | | 0.16 | | | 98 | |
| Export duties | 0.19 | | | 0.13 | | | 54 | | | 0.11 | | | 0.06 | | | 40 | |
| Royalty on metals | 0.25 | | | 0.18 | | | 63 | | | 0.21 | | | 0.12 | | | 79 | |
| Unit net cash costs | 0.17 | | | 1.46 | | | 610 | | | 0.13 | | | 1.35 | | | 856 | |
| DD&A | 0.74 | | | 0.50 | | | 215 | | | 0.68 | | | 0.40 | | | 256 | |
| Noncash and other costs, net | — | |
| — | | | — | | | 0.11 | | a | 0.06 | | | 40 | |
| Total unit costs | 0.91 | | | 1.96 | | | 825 | | | 0.92 | | | 1.81 | | | 1,152 | |
| Revenue adjustments, primarily for pricing on prior period open sales | — | | | — | | | 16 | | | 0.13 | | | 0.13 | | | 49 | |
| PT Smelting intercompany loss | (0.04) | | | (0.03) | | | (12) | | | (0.08) | | | (0.05) | | | (31) | |
| Gross profit per pound/ounce | $ | 3.16 | | | $ | 2.12 | | | $ | 936 | | | $ | 2.13 | | | $ | 1.27 | | | $ | 768 | |
| | | | | | | | | | | |
| Copper sales (millions of recoverable pounds) | 378 | | | 378 | | | | | 219 | | | 219 | | | |
| Gold sales (thousands of recoverable ounces) | | | | | 399 | | | | | | | 230 | |
| | | | | | | | | | | | | | | | | | | | | | | | | | | | | | | | | | | |
| Nine Months Ended September 30, |
| | 2021 | | 2020 |
| | By-Product Method | | Co-Product Method | | By-Product Method | | Co-Product Method |
| | | Copper | | Gold | | | Copper | | Gold |
| Revenues, excluding adjustments | $ | 4.21 | | | $ | 4.21 | | | $ | 1,780 | | | $ | 2.79 | | | $ | 2.79 | | | $ | 1,810 | |
| | | | | | | | | | | |
| Site production and delivery, before net noncash and other costs shown below | 1.49 | | | 1.03 | | | 434 | | | 2.05 | | | 1.19 | | | 773 | |
| Gold and silver credits | (1.91) | | | — | | | — | | | (2.02) | | | — | | | — | |
| Treatment charges | 0.24 | | | 0.17 | | | 70 | | | 0.28 | | | 0.16 | | | 104 | |
| Export duties | 0.15 | | | 0.10 | | | 45 | | | 0.08 | | | 0.05 | | | 31 | |
| Royalty on metals | 0.26 | | | 0.18 | | | 66 | | | 0.18 | | | 0.10 | | | 68 | |
| Unit net cash costs | 0.23 | | | 1.48 | | | 615 | | | 0.57 | | | 1.50 | | | 976 | |
| DD&A | 0.76 | | | 0.52 | | | 222 | | | 0.72 | | | 0.42 | | | 273 | |
| Noncash and other costs, net | 0.01 | | b | 0.01 | | | 1 | | | 0.11 | | a | 0.07 | | | 41 | |
| Total unit costs | 1.00 | | | 2.01 | | | 838 | | | 1.40 | | | 1.99 | | | 1,290 | |
| Revenue adjustments, primarily for pricing on prior period open sales | 0.08 | | | 0.08 | | | (5) | | | (0.03) | | | (0.03) | | | 8 | |
| PT Smelting intercompany loss | (0.11) | | | (0.08) | | | (33) | | | (0.04) | | | (0.02) | | | (13) | |
| Gross profit per pound/ounce | $ | 3.18 | | | $ | 2.20 | | | $ | 904 | | | $ | 1.32 | | | $ | 0.75 | | | $ | 515 | |
| | | | | | | | | | | |
| Copper sales (millions of recoverable pounds) | 946 | | | 946 | | | | | 518 | | | 518 | | | |
| Gold sales (thousands of recoverable ounces) | | | | | 957 | | | | | | | 549 | |
a.Includes COVID-19 related costs (including one-time incremental employee benefits and health and safety costs) totaling $0.05 per pound of copper in third-quarter 2020 and $0.03 per pound of copper for the first nine months of 2020.
b.Includes credits of $0.03 per pound of copper associated with adjustments to prior year treatment and refining charges and charges of $0.02 per pound of copper associated with a potential settlement of an administrative fine levied by the Indonesia government.
Because of the fixed nature of a large portion of PT-FI's costs, unit net cash costs depend on copper and gold volumes. PT-FI’s unit net cash costs (net of gold and silver credits) of $0.17 per pound of copper in third-quarter 2021 were higher than $0.13 per pound in third-quarter, primarily reflecting lower by-product credits and higher export duties and royalties associated with higher copper prices, partly offset by higher volumes. PT-FI’s unit net cash costs (net of gold and silver credits) of $0.23 per pound for the first nine months of 2021, were lower than $0.57 per pound for the first nine months of 2020, primarily reflecting higher sales volumes, partly offset by higher mining costs associated with the ramp-up of underground mining and higher export duties and royalties.
Treatment charges vary with the volume of metals sold and the price of copper, and royalties vary with the volume of metals sold and the prices of copper and gold.
PT-FI’s export duties totaled $71 million in third-quarter 2021, $24 million in third-quarter 2020, $145 million for the first nine months of 2021 and $43 million for the first nine months of 2020. PT-FI will continue to pay export duties until development progress for additional domestic smelting capacity of 2 million metric tons of concentrate per year exceeds 50 percent. PT-FI’s royalties totaled $94 million in third-quarter 2021, $45 million in third-quarter 2020, $234 million for the first nine months of 2021 and $92 million for the first nine months of 2020. The increase in export duties and royalties for the 2021 periods, compared with the 2020 periods, primarily reflect higher sales volumes and copper prices.
Because certain assets are depreciated on a straight-line basis, PT-FI’s unit depreciation rate may vary with asset additions and the level of copper production and sales. DD&A per pound of copper under the by-product method was $0.74 per pound in third-quarter 2021 and $0.76 per pound for the first nine months of 2021, compared with $0.68 per pound in third-quarter 2020 and $0.72 per pound for the first nine months of 2020. The increase in the rate per pound of copper for the 2021 periods, compared with the 2020 periods, primarily reflects the significant underground development assets placed into service.
Revenue adjustments primarily result from changes in prices on provisionally priced copper sales recognized in prior periods.
PT Smelting intercompany loss represents the change in the deferral of PT-FI’s profit on sales to PT Smelting (25 percent prior to April 30, 2021, and 39.5 percent thereafter). Refer to “Smelting and Refining” below for further discussion.
Assuming an average gold price of $1,800 per ounce in fourth-quarter 2021 and achievement of current sales volume and cost estimates, unit net cash costs (net of gold and silver credits) for PT-FI are expected to approximate $0.22 per pound of copper for the year 2021. The impact of prices changes during fourth-quarter 2021 on PT-FI's unit net cash costs for the year 2021 would approximate $0.04 per pound of copper for each $100 per ounce change in the average price of gold.
PT-FI’s projected sales volumes and unit net cash costs for the year 2021 are dependent on a number of factors, including continued progress of the ramp-up of underground mining, operational performance, timing of shipments and other factors detailed in the “Cautionary Statement” below.
Molybdenum Mines
We operate two wholly owned molybdenum mines in Colorado – the Henderson underground mine and the Climax open-pit mine. The Henderson and Climax mines produce high-purity, chemical-grade molybdenum concentrate, which is typically further processed into value-added molybdenum chemical products. The majority of the molybdenum concentrate produced at the Henderson and Climax mines, as well as from our North America and South America copper mines, is processed at our own conversion facilities.
Operating and Development Activities. Production from the Molybdenum mines of 9 million pounds of molybdenum in third-quarter 2021 and 23 million pounds for the first nine months of 2021, was higher than production of 6 million pounds of molybdenum in third-quarter 2020 and 19 million pounds for the first nine months of 2020, primarily reflecting higher milling rates at the Climax mine as it returns to pre-COVID-19 levels. FCX may increase rates at the Climax mine if necessary to satisfy increasing requirements for molybdenum. Refer to “Consolidated Results” for our consolidated molybdenum operating data, which includes sales of molybdenum produced at our Molybdenum mines and from our North America and South America copper mines. Refer to “Outlook” for projected consolidated molybdenum sales volumes.
Unit Net Cash Costs Per Pound of Molybdenum. Unit net cash costs per pound of molybdenum is a measure intended to provide investors with information about the cash-generating capacity of our mining operations expressed on a basis relating to the primary metal product for our respective operations. We use this measure for the same purpose and for monitoring operating performance by our mining operations. This information differs from measures of performance determined in accordance with U.S. GAAP and should not be considered in isolation or as a substitute for measures of performance determined in accordance with U.S. GAAP. This measure is presented by other metals mining companies, although our measure may not be comparable to similarly titled measures reported by other companies.
Average unit net cash costs for our Molybdenum mines of $8.54 per pound of molybdenum for both the third quarter and first nine months of 2021 were lower than average unit net cash costs of $9.72 per pound in third-quarter 2020 and $9.58 per pound for the first nine months of 2020, primarily reflecting higher volumes. Based on current sales volume and cost estimates, average unit net cash costs for the Molybdenum mines are expected to approximate $9.10 per pound of molybdenum for the year 2021.
Refer to “Product Revenues and Production Costs” for a reconciliation of unit net cash costs per pound to production and delivery costs applicable to sales reported in our consolidated financial statements.
Smelting and Refining
We wholly own and operate a smelter in Arizona (Miami smelter), a refinery in Texas (El Paso refinery) and a smelter and refinery in Spain (Atlantic Copper). PT-FI has a 39.5 percent ownership interest in PT Smelting. Treatment charges for smelting and refining copper concentrate consist of a base rate per pound of copper and per ounce of gold and are generally fixed. Treatment charges represent a cost to our mining operations and income to Atlantic Copper and PT Smelting. Thus, higher treatment charges benefit our smelter operations and adversely affect our mining operations. Our North America copper mines are less significantly affected by changes in treatment charges because these operations are largely integrated with our Miami smelter and El Paso refinery. Through this form of downstream integration, we are assured placement of a significant portion of our concentrate production.
Our Miami smelter processes concentrate produced by our U.S. mines and also provides acid for copper leaching operations. During the first nine months of 2021, we incurred charges totaling $87 million associated with a major maintenance turnaround at our Miami smelter, which were higher than original estimates as a result of extended downtime to address additional required maintenance work, the COVID-19 pandemic and weather events. The next major maintenance turnaround is scheduled for the first half of 2024.
Atlantic Copper smelts and refines copper concentrate and markets refined copper and precious metals in slimes. During the first nine months of 2021, Atlantic Copper’s concentrate purchases included 33 percent from our copper mining operations and 67 percent from third parties.
PT-FI’s contract with PT Smelting provides for PT-FI to supply 100 percent of the copper concentrate requirements (subject to a minimum or maximum treatment charge rate) necessary for PT Smelting to produce 205,000 metric tons of copper annually on a priority basis. PT-FI may also sell copper concentrate to PT Smelting at market rates for quantities in excess of 205,000 metric tons of copper annually. During the first nine months of 2021, PT-FI supplied the substantial majority of PT Smelting’s concentrate requirements. In July 2021, PT Smelting received a six-month extension of its anodes slimes export license, which currently expires December 30, 2021.
We defer recognizing profits on sales from our mining operations to Atlantic Copper and on PT-FI’s sales to PT Smelting (on 25 percent through April 30, 2021, and on 39.5 percent thereafter) until final sales to third parties occur. Changes in these deferrals attributable to variability in intercompany volumes resulted in net additions (reductions) to operating income totaling $41 million ($48 million to net income attributable to common stock) in third-quarter 2021, $(21) million ($(21) million to net income attributable to common stock) in third-quarter 2020, $(144) million ($(97) million to net income attributable to common stock) for the first nine months of 2021 and $(27) million ($(20) million to net loss attributable to common stock) for the first nine months of 2020. Our net deferred profits on our inventories at Atlantic Copper and PT Smelting to be recognized in future periods’ net income attributable to common stock totaled $156 million at September 30, 2021. Quarterly variations in ore grades, the timing of intercompany shipments and changes in product prices will result in variability in our net deferred profits and quarterly earnings. Based on current estimates, in fourth-quarter 2021, we do not expect a significant change in our net deferred profits on intercompany copper sales but project a net deferral of profits on intercompany molybdenum sales of approximately $40 million ($30 million to net income attributable to common stock).
CAPITAL RESOURCES AND LIQUIDITY
Our consolidated operating cash flows vary with sales volumes; prices realized from copper, gold and molybdenum sales; production costs; income taxes; other working capital changes; and other factors.
We generated significant cash flows during the first nine months of 2021, reflecting strong operating and financial performance. With a favorable market outlook and a focus on executing our operating plans, we expect further increases in sales volumes and cash flows in 2022 and we believe we are well positioned to provide cash returns to shareholders consistent with our financial policy.
We believe that we have a high-quality portfolio of long-lived copper assets positioned to generate long-term value. The ramp-up of underground mining at PT-FI continues to be successful and is advancing on schedule, with production rates expected to reach the projected ultimate annualized levels by year-end 2021. With the success of the Grasberg Block Cave and DMLZ underground projects, PT-FI is planning to commence long-term mine development activities for its Kucing Liar deposit. We are also evaluating organic growth opportunities for expansion of certain of our operations in North America and South America, including at Bagdad, Lone Star and El Abra, the timing of which will be dependent on, among other things, market conditions.
Based on current sales volume, cost and metal price estimates discussed in “Outlook”, our projected consolidated operating cash flows of $7.5 billion for the year 2021 significantly exceed our expected consolidated capital expenditures of $2.3 billion (which include $0.3 billion of capital expenditures for the Indonesia smelter project) and other cash requirements for the year, including debt repayments, common stock dividends and noncontrolling interest distributions. We believe that our cash generating capability and financial condition, together with availability under our revolving credit facility, will be adequate to meet our operating, investing and financing needs. Expenditures for the Indonesia smelter project are currently being funded by PT-FI’s new $1.0 billion unsecured bank credit facility and additional debt financing for this project is being evaluated. Refer to “Outlook” for further discussion of projected operating cash flows and capital expenditures for 2021 and to “Debt” below and Note 5 for further discussion of PT-FI’s credit facility.
At September 30, 2021, we had $11.2 billion in liquidity, comprised of $7.7 billion in consolidated cash and $3.5 billion of availability under our revolving credit facility.
Financial Policy. In February 2021, our Board of Directors (Board) adopted a financial policy for the allocation of cash flows aligned with our strategic objectives of maintaining a strong balance sheet and increasing cash returns to shareholders while advancing opportunities for future growth. The policy includes a base dividend and a performance-based payout framework whereby up to 50 percent of available cash flows generated after planned capital spending and distributions to noncontrolling interests would be allocated to shareholder returns and the balance to debt reduction and investments in value enhancing growth projects, subject to maintaining the net debt target described below.
In February 2021, the Board reinstated a cash dividend on our common stock (base dividend) at an annual rate of $0.30 per share, and on November 1, 2021, the Board approved (i) a new share repurchase program authorizing repurchases of up to $3.0 billion of our common stock and (ii) a variable cash dividend on common stock for 2022 at an annual rate of $0.30 per share. The combined annual rate of the base dividend and the variable dividend is expected to total $0.60 per share. The Board intends to declare quarterly dividends for 2022 of $0.15 per share (including the $0.075 variable component), with the initial quarterly dividend expected to be paid on February 1, 2022. Based on current shares outstanding totaling 1.47 billion, the total common stock dividend (base and variable) for 2022 currently expected to be paid approximates $0.9 billion. Refer to “Cautionary Statement.”
Our performance-based payout framework is designed to maintain net debt at a level not to exceed the range of $3 billion to $4 billion (excluding project debt for additional smelting capacity in Indonesia). The Board will review the structure and the amount of the performance-based payout framework at least annually.
Cash
Following is a summary of the U.S. and international components of consolidated cash and cash equivalents available to the parent company, net of noncontrolling interests’ share, taxes and other costs at September 30, 2021 (in billions):
| | | | | | | | | |
| Cash at domestic companies | $ | 5.0 | | | |
| Cash at international operations | 2.7 | | | |
| Total consolidated cash and cash equivalents | 7.7 | | | |
| Noncontrolling interests’ share | (0.9) | | | |
| Cash, net of noncontrolling interests’ share | 6.8 | | | |
| Withholding taxes | (0.1) | |
| |
| Net cash available | $ | 6.7 | | | |
Cash held at our international operations is generally used to support our foreign operations’ capital expenditures, operating expenses, debt repayment, working capital and other tax payments, or other cash needs. Management believes that sufficient liquidity is available in the U.S. from cash balances and availability from our revolving credit facility. We have not elected to permanently reinvest earnings from our foreign subsidiaries, and we have recorded deferred tax liabilities for foreign earnings that are available to be repatriated to the U.S. From time to time, our foreign subsidiaries distribute earnings to the U.S. through dividends that are subject to applicable withholding taxes and noncontrolling interests’ share.
Debt
At September 30, 2021, our consolidated debt totaled $9.7 billion, with a weighted-average interest rate of 4.6 percent. We had no borrowings outstanding and $8 million in letters of credit issued under our revolving credit facility, resulting in availability of approximately $3.5 billion.
In September 2021, Cerro Verde elected to prepay $200 million on its term loan, reducing the outstanding balance to $325 million, which matures in June 2022.
In July 2021, PT-FI entered into a $1.0 billion, five-year, unsecured bank credit facility (consisting of a $667 million term loan and a $333 million revolving credit facility). Amounts may be drawn under the term loan within the first three years, and then the loan amortizes in four installments. The revolving credit facility is available for drawings until June 2026. The facility matures in July 2026 and amounts drawn bear interest at the London Interbank Offered Rate plus a margin of 1.875% or 2.125%, as defined by the agreement. As of September 30, 2021, $158 million ($146 million net of debt issuance costs) was drawn under the PT-FI Term Loan and no amounts were drawn under the revolving credit facility.
On October 21, 2021, we called for redemption on December 1, 2021, all of our outstanding $524 million principal amount of our 3.55% Senior Notes due 2022. We have no other senior note maturities until March 2023.
Refer to Note 5 for further discussion of the above items, and refer to Note 8 of our 2020 Form 10-K for additional information regarding our debt arrangements.
Operating Activities
We reported consolidated cash provided by operating activities of $5.4 billion (including $0.4 billion of working capital and other sources) for the first nine months of 2021 and $1.7 billion (including $0.3 billion from working capital and other sources) for the first nine months of 2020. Higher operating cash flows for the first nine months of 2021, compared with the first nine months of 2020, primarily reflect higher copper prices and copper and gold sales volumes.
In third-quarter 2021, Cerro Verde paid the balance of its royalty dispute liabilities (payments totaled $356 million in third-quarter 2021 and $421 million for the first nine months of 2021). Refer to Note 8 for further discussion.
Investing Activities
Capital Expenditures. Capital expenditures, including capitalized interest, totaled $1.3 billion for the first nine months of 2021, including approximately $0.9 billion for major mining projects primarily associated with underground development activities in the Grasberg minerals district and $0.1 billion for the Indonesia smelter project. Capital expenditures for the Indonesia smelter project are currently being funded by PT-FI's $1.0 billion unsecured bank credit facility and additional debt financing for this project is being evaluated. Refer to “Outlook” for further discussion of projected capital expenditures for the year 2021.
Capital expenditures, including capitalized interest, totaled $1.6 billion for the first nine months of 2020, including approximately $1.0 billion for major mining projects primarily associated with underground development activities in the Grasberg minerals district and the Lone Star copper leach project.
Proceeds from Sale of Freeport Cobalt. On September 1, 2021, we completed the sale of Freeport Cobalt to Jervois Global Limited (Jervois) for $208 million, including net cash proceeds of $150 million and shares of Jervois. Refer to Note 1 for further discussion.
Proceeds from Sales of Other Assets. Proceeds from sales of other assets totaled $21 million for the first nine months of 2021 and $146 million for the first nine months of 2020. Proceeds from sales of other assets for the first nine months of 2020 are primarily associated with the contingent consideration of $60 million from the 2016 sale of TF Holdings Limited, the collection of $45 million related to the 2019 sale of the Timok exploration assets in Serbia, and $31 million associated with the sale of royalty assets.
Acquisition of Minority Interest in PT Smelting. On April 30, 2021, PT-FI acquired 14.5 percent of the outstanding common stock of PT Smelting for $33 million, increasing its ownership interest from 25 percent to 39.5 percent.
Financing Activities
Debt Transactions. Net repayments of debt totaled $39 million for the first nine months of 2021, primarily associated with Cerro Verde’s election to prepay $200 million on its term loan at the end of September 2021, partly offset by borrowings of $158 million under the PT-FI credit facility.
Net proceeds from debt totaled $131 million for the first nine months of 2020, primarily reflecting the issuance of $2.8 billion of new senior notes in July 2020 and March 2020, partly offset by the use of proceeds to purchase and redeem senior notes maturing in 2021, 2022, 2023 and 2024.
Refer to Note 5 for further discussion.
Cash Dividends and Distributions Paid. We paid cash dividends on our common stock totaling $220 million for the first nine months of 2021 and $73 million for the first nine months of 2020.
On September 22, 2021, we declared a quarterly cash dividend of $0.075 per share on our common stock, which was paid on November 1, 2021, to shareholders of record as of October 15, 2021. Refer to “Cautionary Statement” and the discussion above regarding our financial policy.
Cash dividends and distributions paid to noncontrolling interests at PT-FI and Cerro Verde totaled $187 million for the first nine months of 2021. There were no cash dividends or distributions to noncontrolling interests paid during the first nine months of 2020. Cash dividends and distributions to noncontrolling interests vary based on the operating results and cash requirements of our consolidated subsidiaries.
Contributions from Noncontrolling Interests. We received equity contributions totaling $135 million for the first nine months of 2021 and $115 million for the first nine months of 2020 from PT Inalum for their share of capital spending on PT-FI underground mine development projects and development of increased smelter capacity in Indonesia.
Stock-based awards. Following an increase in our stock price during 2021, proceeds from exercised stock options totaled $189 million and payments for related employee taxes totaled $19 million for the first nine months of 2021. See Note 10 in our 2020 Form 10-K for a discussion of stock-based awards.
CONTRACTUAL OBLIGATIONS
In July 2021, PT-FI awarded a contract to Chiyoda for the construction of a new greenfield smelter in Gresik, Indonesia, with an estimated contract cost of $2.8 billion. The smelter construction is expected to be completed as soon as feasible in 2024, which is subject to, among other things, potential pandemic-related disruptions.
Besides PT-FI’s $1.0 billion credit facility and the Chiyoda contract, there have been no other material changes in our contractual obligations since December 31, 2020.
CONTINGENCIES
Environmental and Asset Retirement Obligations
Our current and historical operating activities are subject to stringent laws and regulations governing the protection of the environment. We perform a comprehensive annual review of our environmental and asset retirement obligations and also review changes in facts and circumstances associated with these obligations at least quarterly.
There have been no material changes to our environmental and asset retirement obligations since December 31, 2020. Refer to Note 8 for updates associated with our Newtown Creek environmental obligation. Updated cost assumptions, including increases and decreases to cost estimates, changes in the anticipated scope and timing of remediation activities, and settlement of environmental matters may result in additional revisions to certain of our environmental obligations. We are planning a detailed review in fourth-quarter 2021 of our asset retirement obligations in Indonesia, specifically around our historical overburden stockpiles related to previous open-pit mining operations. Potential adjustments could be significant. Refer to Note 12 in our 2020 Form 10-K, for further information regarding our environmental and asset retirement obligations.
Litigation and Other Contingencies
There have been no material changes to our contingencies associated with legal proceedings, environmental and other matters since December 31, 2020. Refer to Note 12 and “Legal Proceedings” contained in Part I, Item 3. of our 2020 Form 10-K, as updated by Note 8, for further information regarding legal proceedings, environmental and other matters.
NEW ACCOUNTING STANDARDS
There were no significant updates to previously reported accounting standards included in Note 1 of our 2020 Form 10-K.
NET DEBT
Net debt, which we define as consolidated debt less consolidated cash and cash equivalents, is intended to provide investors with information related to the performance-based payout framework in our financial policy, which requires achievement of a net debt target in the range of $3 billion to $4 billion (excluding project debt for additional smelting capacity in Indonesia). This information differs from consolidated debt determined in accordance with U.S. GAAP and should not be considered in isolation or as a substitute for consolidated debt determined in accordance with U.S. GAAP. Our net debt follows, which may not be comparable to similarly titled measures reported by other companies (in millions):
| | | | | | | | | | | | | | |
| September 30, 2021 | | December 31, 2020 | |
| Current portion of debt | $ | 897 | | | $ | 34 | | |
| Long-term debt, less current portion | 8,768 | | | 9,677 | | |
| Consolidated debt | 9,665 | | a | 9,711 | | |
| Less: consolidated cash and cash equivalents | 7,672 | | | 3,657 | | |
| Net debt | $ | 1,993 | | | $ | 6,054 | | |
a.Includes $146 million, net of debt issuance costs, for the PT-FI Term Loan (refer to Note 5).
PRODUCT REVENUES AND PRODUCTION COSTS
Unit net cash costs per pound of copper and molybdenum are measures intended to provide investors with information about the cash-generating capacity of our mining operations expressed on a basis relating to the primary metal product for the respective operations. We use this measure for the same purpose and for monitoring operating performance by our mining operations. This information differs from measures of performance determined in accordance with U.S. GAAP and should not be considered in isolation or as a substitute for measures of performance determined in accordance with U.S. GAAP. These measures are presented by other metals mining companies, although our measures may not be comparable to similarly titled measures reported by other companies.
We present gross profit per pound of copper in the following tables using both a “by-product” method and a “co-product” method. We use the by-product method in our presentation of gross profit per pound of copper because (i) the majority of our revenues are copper revenues, (ii) we mine ore, which contains copper, gold, molybdenum and other metals, (iii) it is not possible to specifically assign all of our costs to revenues from the copper, gold, molybdenum and other metals we produce and (iv) it is the method used by our management and Board to monitor our mining operations and to compare mining operations in certain industry publications. In the co-product method presentations, shared costs are allocated to the different products based on their relative revenue values, which will vary to the extent our metals sales volumes and realized prices change.
We show revenue adjustments for prior period open sales as a separate line item. Because these adjustments do not result from current period sales, these amounts have been reflected separately from revenues on current period sales. Noncash and other costs, which are removed from site production and delivery costs in the calculation of unit net cash costs, consist of items such as stock-based compensation costs, long-lived asset impairments, idle facility costs, restructuring and/or unusual charges. As discussed above, gold, molybdenum and other metal revenues at copper mines are reflected as credits against site production and delivery costs in the by-product method. The following schedules are presentations under both the by-product and co-product methods together with reconciliations to amounts reported in our consolidated financial statements.
North America Copper Mines Product Revenues, Production Costs and Unit Net Cash Costs
| | | | | | | | | | | | | | | | | | | | | | | | | | | | | | | | | | | |
|
|
| | | | | | | | | | | |
| | | | | | | | | | | |
| | | | | | | | | | | |
| Three Months Ended September 30, 2021 | | | | | |
| (In millions) | | By-Product | | Co-Product Method | |
| | Method | | Copper | | Molybdenuma | | Otherb | | Total | |
| Revenues, excluding adjustments | | $ | 1,627 | | | $ | 1,627 | | | $ | 152 | | | $ | 27 | | | $ | 1,806 | | |
Site production and delivery, before net noncash
and other costs shown below | | 795 | | | 724 | | | 82 | | | 20 | | | 826 | | |
| By-product credits | | (148) | | | — | | | — | | | — | | | — | | |
| Treatment charges | | 35 | | | 33 | | | — | | | 2 | | | 35 | | |
| Net cash costs | | 682 | | | 757 | | | 82 | | | 22 | | | 861 | | |
| DD&A | | 94 | | | 85 | | | 7 | | | 2 | | | 94 | | |
| Metals inventory adjustments | | 13 | | | 13 | | | — | | | — | | | 13 | | |
| Noncash and other costs, net | | 30 | |
| 28 | | | 2 | | | — | | | 30 | | |
| Total costs | | 819 | | | 883 | | | 91 | | | 24 | | | 998 | | |
Other revenue adjustments, primarily for pricing
on prior period open sales | | (7) | | | (7) | | | — | | | — | | | (7) | | |
| Gross profit | | $ | 801 | | | $ | 737 | | | $ | 61 | | | $ | 3 | | | $ | 801 | | |
| | | | | | | | | | | |
| Copper sales (millions of recoverable pounds) | | 375 | | | 375 | | | | | | | | |
Molybdenum sales (millions of recoverable pounds)a | | | | | | 9 | | | | | | |
| | | | | | | | | | | |
| Gross profit per pound of copper/molybdenum: | | | | | | |
| | | | | | | | | | | |
| Revenues, excluding adjustments | | $ | 4.34 | | | $ | 4.34 | | | $ | 16.69 | | | | | | |
Site production and delivery, before net noncash
and other costs shown below | | 2.12 | | | 1.93 | | | 8.97 | | | | | | |
| By-product credits | | (0.39) | | | — | | | — | | | | | | |
| Treatment charges | | 0.09 | | | 0.09 | | | — | | | | | | |
| Unit net cash costs | | 1.82 | | | 2.02 | | | 8.97 | | | | | | |
| DD&A | | 0.25 | | | 0.23 | | | 0.73 | | | | | | |
| Metals inventory adjustments | | 0.03 | | | 0.03 | | | — | | | | | | |
| Noncash and other costs, net | | 0.08 | |
| 0.08 | | | 0.23 | | | | | | |
| Total unit costs | | 2.18 | | | 2.36 | | | 9.93 | | | | | | |
Other revenue adjustments, primarily for pricing
on prior period open sales | | (0.02) | | | (0.02) | | | — | | | | | | |
| Gross profit per pound | | $ | 2.14 | | | $ | 1.96 | | | $ | 6.76 | | | | | | |
| | | | | | | | | | | |
| Reconciliation to Amounts Reported | | | | | | | | | | | |
| | | | | | | | | | | |
| | Revenues | | Production and Delivery | | DD&A | | Metals Inventory Adjustments | | | |
| Totals presented above | | $ | 1,806 | | | $ | 826 | | | $ | 94 | | | $ | 13 | | | | |
| Treatment charges | | (4) | | | 31 | | | — | | | — | | | | |
| Noncash and other costs, net | | — | | | 30 | | | — | | | — | | | | |
Other revenue adjustments, primarily for pricing
on prior period open sales | | (7) | | | — | | | — | | | — | | | | |
| Eliminations and other | | 16 | | | 17 | | | — | | | — | | | | |
| North America copper mines | | 1,811 | | | 904 | | | 94 | | | 13 | | | | |
Other miningc | | 5,903 | | | 3,735 | | | 418 | | | — | | | | |
| | | | | | | | | | | |
| | | | | | | | | | | |
| Corporate, other & eliminations | | (1,631) | | | (1,630) | | | 16 | | | 1 | | | | |
| As reported in our consolidated financial statements | | $ | 6,083 | | | $ | 3,009 | | | $ | 528 | | | $ | 14 | | | | |
| | | | | | | | | | | |
a.Reflects sales of molybdenum produced by certain of the North America copper mines to our molybdenum sales company at market-based pricing.
b.Includes gold and silver product revenues and production costs.
c.Represents the combined total for our other segments, as presented in Note 9.
North America Copper Mines Product Revenues, Production Costs and Unit Net Cash Costs
| | | | | | | | | | | | | | | | | | | | | | | | | | | | | | | | | | | |
| | | | | | | | | | | |
| Three Months Ended September 30, 2020 | | | | | |
| (In millions) | | By-Product | | Co-Product Method | |
| | Method | | Copper | | Molybdenuma | | Otherb | | Total | |
| Revenues, excluding adjustments | | $ | 1,138 | | | $ | 1,138 | | | $ | 63 | | | $ | 30 | | | $ | 1,231 | | |
Site production and delivery, before net noncash
and other costs shown below | | 667 | | | 630 | | | 45 | | | 16 | | | 691 | | |
| By-product credits | | (69) | | | — | | | — | | | — | | | — | | |
| Treatment charges | | 33 | | | 32 | | | — | | | 1 | | | 33 | | |
Net cash costs | | 631 | | | 662 | | | 45 | | | 17 | | | 724 | | |
| DD&A | | 92 | | | 85 | | | 4 | | | 3 | | | 92 | | |
| Metals inventory adjustments | | (4) | | | (4) | | | — | | | — | | | (4) | | |
| Noncash and other costs, net | | 37 | | c | 35 | | | — | | | 2 | | | 37 | | |
Total costs | | 756 | | | 778 | | | 49 | | | 22 | | | 849 | | |
Other revenue adjustments, primarily for pricing
on prior period open sales | | 1 | | | 1 | | | — | | | — | | | 1 | | |
| Gross profit | | $ | 383 | | | $ | 361 | | | $ | 14 | | | $ | 8 | | | $ | 383 | | |
| | | | | | | | | | | |
| Copper sales (millions of recoverable pounds) | | 378 | | | 378 | | | | | | | | |
Molybdenum sales (millions of recoverable pounds)a | | | | | 7 | | | | | | |
| | | | | | | | | | | |
| Gross profit per pound of copper/molybdenum: | | | | | | |
| | | | | | | | | | | |
| Revenues, excluding adjustments | | $ | 3.01 | | | $ | 3.01 | | | $ | 7.72 | | | | | | |
Site production and delivery, before net noncash
and other costs shown below | | 1.76 | | | 1.67 | | | 5.52 | | | | | | |
| By-product credits | | (0.18) | | | — | | | — | | | | | | |
| Treatment charges | | 0.09 | | | 0.08 | | | — | | | | | | |
Unit net cash costs | | 1.67 | | | 1.75 | | | 5.52 | | | | | | |
| DD&A | | 0.24 | | | 0.23 | | | 0.43 | | | | | | |
| Metals inventory adjustments | | (0.01) | | | (0.01) | | | — | | | | | | |
| Noncash and other costs, net | | 0.10 | | c | 0.09 | | | 0.06 | | | | | | |
Total unit costs | | 2.00 | | | 2.06 | | | 6.01 | | | | | | |
Other revenue adjustments, primarily for pricing
on prior period open sales | | — | | | — | | | — | | | | | | |
| Gross profit per pound | | $ | 1.01 | | | $ | 0.95 | | | $ | 1.71 | | | | | | |
| | | | | | | | | | | |
| Reconciliation to Amounts Reported | | | | | | | | | | | |
| | Revenues | | Production and Delivery | | DD&A | | Metals Inventory Adjustments | | | |
| Totals presented above | | $ | 1,231 | | | $ | 691 | | | $ | 92 | | | $ | (4) | | | | |
| Treatment charges | | (4) | | | 29 | | | — | | | — | | | | |
| Noncash and other costs, net | | — | | | 37 | | | — | | | — | | | | |
Other revenue adjustments, primarily for pricing
on prior period open sales | | 1 | | | — | | | — | | | — | | | | |
| Eliminations and other | | 9 | | | 11 | | | (1) | | | — | | | | |
| North America copper mines | | 1,237 | | | 768 | | | 91 | | | (4) | | | | |
Other miningd | | 3,691 | | | 2,731 | | | 282 | | | 5 | | | | |
| | | | | | | | | | | |
| | | | | | | | | | | |
| Corporate, other & eliminations | | (1,077) | | | (1,034) | | | 21 | | | 8 | | | | |
| As reported in our consolidated financial statements | | $ | 3,851 | | | $ | 2,465 | | | $ | 394 | | | $ | 9 | | | | |
| | | | | | | | | | | |
a.Reflects sales of molybdenum produced by certain of the North America copper mines to our molybdenum sales company at market-based pricing.
b.Includes gold and silver product revenues and production costs.
c.Includes charges totaling $10 million ($0.03 per pound of copper) primarily associated with the April 2020 revised operating plans (including employee separation costs) and the COVID-19 pandemic (including health and safety costs).
d.Represents the combined total for our other segments, as presented in Note 9.
North America Copper Mines Product Revenues, Production Costs and Unit Net Cash Costs
| | | | | | | | | | | | | | | | | | | | | | | | | | | | | | | | | | | |
| | | | | |
| Nine months ended September 30, 2021 | | | | | |
| (In millions) | | By-Product | | Co-Product Method | |
| | Method | | Copper | | Molybdenuma | | Otherb | | Total | |
| Revenues, excluding adjustments | | $ | 4,538 | | | $ | 4,538 | | | 337 | | | 93 | | | 4,968 | | |
Site production and delivery, before net noncash
and other costs shown below | | 2,254 | | | 2,093 | | | 194 | | | 60 | | | 2,347 | | |
| By-product credits | | (337) | | | — | | | — | | | — | | | — | | |
| Treatment charges | | 98 | | | 93 | | | — | | | 5 | | | 98 | | |
| Net cash costs | | 2,015 | | | 2,186 | | | 194 | | | 65 | | | 2,445 | | |
| DD&A | | 275 | | | 254 | | | 15 | | | 6 | | | 275 | | |
| Metals inventory adjustments | | 13 | | | 13 | | | — | | | — | | | 13 | | |
| Noncash and other costs, net | | 103 | | | 99 | | | 3 | | | 1 | | | 103 | | |
| Total costs | | 2,406 | | | 2,552 | | | 212 | | | 72 | | | 2,836 | | |
Other revenue adjustments, primarily for pricing
on prior period open sales | | 7 | | | 7 | | | — | | | — | | | 7 | | |
| Gross profit | | $ | 2,139 | | | $ | 1,993 | | | $ | 125 | | | $ | 21 | | | $ | 2,139 | | |
| | | | | | | | | | | |
| Copper sales (millions of recoverable pounds) | | 1,072 | | | 1,072 | | | | | | | | |
Molybdenum sales (millions of recoverable pounds)a | | | | | | 26 | | | | | | |
| | | | | | | | | | | |
| Gross profit per pound of copper/molybdenum: | | | | | | | |
| | | | | | | | | | | |
| Revenues, excluding adjustments | | $ | 4.24 | | | $ | 4.24 | | | $ | 13.09 | | | | | | |
Site production and delivery, before net noncash
and other costs shown below | | 2.11 | | | 1.95 | | | 7.54 | | | | | | |
| By-product credits | | (0.32) | | | — | | | — | | | | | | |
| Treatment charges | | 0.09 | | | 0.09 | | | — | | | | | | |
| Unit net cash costs | | 1.88 | | | 2.04 | | | 7.54 | | | | | | |
| DD&A | | 0.26 | | | 0.24 | | | 0.59 | | | | | | |
| Metals inventory adjustments | | 0.01 | | | 0.01 | | | — | | | | | | |
| Noncash and other costs, net | | 0.10 | | | 0.09 | | | 0.12 | | | | | | |
| Total unit costs | | 2.25 | | | 2.38 | | | 8.25 | | | | | | |
Other revenue adjustments, primarily for pricing
on prior period open sales | | 0.01 | | | 0.01 | | | — | | | | | | |
| Gross profit per pound | | $ | 2.00 | | | $ | 1.87 | | | $ | 4.84 | | | | | | |
| | | | | | | | | | | |
| Reconciliation to Amounts Reported | | | | | | | | | |
| | | | | | | | Metals | | | |
| | | | Production | | | | Inventory | | | |
| | Revenues | | and Delivery | | DD&A | | Adjustments | | | |
| Totals presented above | | $ | 4,968 | | | $ | 2,347 | | | $ | 275 | | | $ | 13 | | | | |
| Treatment charges | | (21) | | | 77 | | | — | | | — | | | | |
| Noncash and other costs, net | | — | | | 103 | | | — | | | — | | | | |
Other revenue adjustments, primarily for pricing
on prior period open sales | | 7 | | | — | | | — | | | — | | | | |
| Eliminations and other | | 49 | | | 51 | | | — | | | — | | | | |
| North America copper mines | | 5,003 | | | 2,578 | | | 275 | | | 13 | | | | |
Other miningc | | 16,068 | | | 10,425 | | | 1,108 | | | 1 | | | | |
| | | | | | | | | | | |
| | | | | | | | | | | |
| Corporate, other & eliminations | | (4,390) | | | (4,141) | | | 47 | | | 1 | | | | |
| As reported in our consolidated financial statements | | $ | 16,681 | | | $ | 8,862 | | | $ | 1,430 | | | $ | 15 | | | | |
| | | | | | | | | | | |
a.Reflects sales of molybdenum produced by certain of the North America copper mines to our molybdenum sales company at market-based pricing.
b.Includes gold and silver product revenues and production costs.
c.Represents the combined total for our other segments, as presented in Note 9.
North America Copper Mines Product Revenues, Production Costs and Unit Net Cash Costs
| | | | | | | | | | | | | | | | | | | | | | | | | | | | | | | | | | | |
| | | | | |
| Nine months ended September 30, 2020 | | | | | |
| (In millions) | | By-Product | | Co-Product Method | |
| | Method | | Copper | | Molybdenuma | | Otherb | | Total | |
| Revenues, excluding adjustments | | $ | 2,939 | |
| $ | 2,939 | | | 210 | | | 73 | | | 3,222 | | |
Site production and delivery, before net noncash
and other costs shown below | | 2,106 | | | 1,963 | | | 173 | | | 44 | | | 2,180 | | |
| By-product credits | | (209) | | | — | | | — | | | — | | | — | | |
| Treatment charges | | 109 | | | 105 | | | — | | | 4 | | | 109 | | |
| Net cash costs | | 2,006 | | | 2,068 | | | 173 | | | 48 | | | 2,289 | | |
| DD&A | | 272 | | | 251 | | | 14 | | | 7 | | | 272 | | |
| Metals inventory adjustments | | 52 | | | 49 | | | — | | | 3 | | | 52 | | |
| Noncash and other costs, net | | 107 | | c | 101 | | | 3 | | | 3 | | | 107 | | |
| Total costs | | 2,437 | | | 2,469 | | | 190 | | | 61 | | | 2,720 | | |
Other revenue adjustments, primarily for pricing
on prior period open sales | | (22) | | | (22) | | | — | | | — | | | (22) | | |
| Gross profit | | $ | 480 | | | $ | 448 | | | $ | 20 | | | $ | 12 | | | $ | 480 | | |
| | | | | | | | | | | |
| Copper sales (millions of recoverable pounds) | | 1,100 | | | 1,100 | | | | | | | | |
Molybdenum sales (millions of recoverable pounds)a | | | | | | 24 | | | | | | |
| | | | | | | | | | | |
| Gross profit per pound of copper/molybdenum: | | | | | | | |
| | | | | | | | | | | |
| Revenues, excluding adjustments | | $ | 2.67 | |
| $ | 2.67 | | | $ | 8.57 | | | | | | |
Site production and delivery, before net noncash
and other costs shown below | | 1.91 | | | 1.78 | | | 7.05 | | | | | | |
| By-product credits | | (0.19) | | | — | | | — | | | | | | |
| Treatment charges | | 0.10 | | | 0.10 | | | — | | | | | | |
| Unit net cash costs | | 1.82 | | | 1.88 | | | 7.05 | | | | | | |
| DD&A | | 0.25 | | | 0.23 | | | 0.57 | | | | | | |
| Metals inventory adjustments | | 0.05 | | | 0.04 | | | — | | | | | | |
| Noncash and other costs, net | | 0.10 | | c | 0.10 | | | 0.12 | | | | | | |
| Total unit costs | | 2.22 | | | 2.25 | | | 7.74 | | | | | | |
Other revenue adjustments, primarily for pricing
on prior period open sales | | (0.01) | | | (0.01) | | | — | | | | | | |
| Gross profit per pound | | $ | 0.44 | | | $ | 0.41 | | | $ | 0.83 | | | | | | |
| | | | | | | | | | | |
| Reconciliation to Amounts Reported | | | | | | | | | |
| | | | | | | | Metals | | | |
| | | | Production | | | | Inventory | | | |
| | Revenues | | and Delivery | | DD&A | | Adjustments | | | |
| Totals presented above | | $ | 3,222 | | | $ | 2,180 | | | $ | 272 | | | $ | 52 | | | | |
| Treatment charges | | (14) | | | 95 | | | — | | | — | | | | |
| Noncash and other costs, net | | — | | | 107 | | | — | | | — | | | | |
Other revenue adjustments, primarily for pricing
on prior period open sales | | (22) | | | — | | | — | | | — | | | | |
| Eliminations and other | | 24 | | | 33 | | | — | | | — | | | | |
| North America copper mines | | 3,210 | | | 2,415 | | | 272 | | | 52 | | | | |
Other miningd | | 9,267 | | | 7,665 | | | 770 | | | 14 | | | | |
| | | | | | | | | | | |
| | | | | | | | | | | |
| Corporate, other & eliminations | | (2,774) | | | (2,676) | | | 51 | | | 26 | | | | |
| As reported in our consolidated financial statements | | $ | 9,703 | | | $ | 7,404 | | | $ | 1,093 | | | $ | 92 | | | | |
| | | | | | | | | | | |
a.Reflects sales of molybdenum produced by certain of the North America copper mines to our molybdenum sales company at market-based pricing.
b.Includes gold and silver product revenues and production costs.
c.Includes charges totaling $32 million ($0.03 per pound of copper) primarily associated with the April 2020 revised operating plans (including employee separation costs) and the COVID-19 pandemic (including health and safety costs).
d.Represents the combined total for our other segments, as presented in Note 9.
South America Mining Product Revenues, Production Costs and Unit Net Cash Costs
| | | | | | | | | | | | | | | | | | | | | | | | | | | | | |
| |
| |
| |
| | | | | |
| Three Months Ended September 30, 2021 | | | | | |
| (In millions) | | By-Product | | Co-Product Method | |
| | Method | | Copper | | Othera | | Total | |
| Revenues, excluding adjustments | | $ | 1,153 | | | $ | 1,153 | | | $ | 120 | | | $ | 1,273 | | |
Site production and delivery, before net noncash
and other costs shown below | | 597 | | b | 546 | | | 64 | | | 610 | | |
| By-product credits | | (107) | | | — | | | — | | | — | | |
| Treatment charges | | 38 | | | 38 | | | — | | | 38 | | |
| Royalty on metals | | 3 | | | 2 | | | 1 | | | 3 | | |
| Net cash costs | | 531 | | | 586 | | | 65 | | | 651 | | |
| DD&A | | 112 | | | 101 | | | 11 | | | 112 | | |
| | | | | | | | | |
| Noncash and other costs, net | | 20 | |
| 19 | | | 1 | | | 20 | | |
| Total costs | | 663 | | | 706 | | | 77 | | | 783 | | |
Other revenue adjustments, primarily for pricing
on prior period open sales | | (8) | | | (8) | | | — | | | (8) | | |
| Gross profit | | $ | 482 | | | $ | 439 | | | $ | 43 | | | $ | 482 | | |
| | | | | | | | | |
| Copper sales (millions of recoverable pounds) | | 280 | | | 280 | | | | | | |
| | | | | | | | | |
| Gross profit per pound of copper: | | | | | |
| | | | | | | | | |
| Revenues, excluding adjustments | | $ | 4.12 | | | $ | 4.12 | | | | | | |
Site production and delivery, before net noncash
and other costs shown below | | 2.14 | | b | 1.96 | | | | | | |
| By-product credits | | (0.38) | | | — | | | | | | |
| Treatment charges | | 0.13 | | | 0.13 | | | | | | |
| Royalty on metals | | 0.01 | | | 0.01 | | | | | | |
| Unit net cash costs | | 1.90 | | | 2.10 | | | | | | |
| DD&A | | 0.40 | | | 0.36 | | | | | | |
| | | | | | | | | |
| Noncash and other costs, net | | 0.07 | |
| 0.06 | | | | | | |
| Total unit costs | | 2.37 | | | 2.52 | | | | | | |
Other revenue adjustments, primarily for pricing
on prior period open sales | | (0.03) | | | (0.03) | | | | | | |
| Gross profit per pound | | $ | 1.72 | | | $ | 1.57 | | | | | | |
| | | | | | | | | |
| Reconciliation to Amounts Reported | | | | | | | | | |
| | | | Production | | | | | |
| | Revenues | | and Delivery | | DD&A | | | |
| Totals presented above | | $ | 1,273 | | | $ | 610 | | | $ | 112 | | | | |
| Treatment charges | | (38) | | | — | | | — | | | | |
| Royalty on metals | | (3) | | | — | | | — | | | | |
| Noncash and other costs, net | | — | | | 20 | | | — | | | | |
Other revenue adjustments, primarily for pricing
on prior period open sales | | (8) | | | — | | | — | | | | |
| Eliminations and other | | (1) | | | — | | | (1) | | | | |
| South America mining | | 1,223 | | | 630 | | | 111 | | | | |
Other miningc | | 6,491 | | | 4,009 | | | 401 | | | | |
| | | | | | | | | |
| | | | | | | | | |
| Corporate, other & eliminations | | (1,631) | | | (1,630) | | | 16 | | | | |
| As reported in our consolidated financial statements | | $ | 6,083 | | | $ | 3,009 | | | $ | 528 | | | | |
| | | | | | | | | |
a.Includes silver sales of 1.0 million ounces ($24.34 per ounce average realized price). Also reflects sales of molybdenum produced by Cerro Verde to our molybdenum sales company at market-based pricing.
b.Includes nonrecurring charges totaling $5 million ($0.02 per pound of copper) associated with labor related charges at Cerro Verde.
c.Represents the combined total for our other segments, as presented in Note 9.
South America Mining Product Revenues, Production Costs and Unit Net Cash Costs
| | | | | | | | | | | | | | | | | | | | | | | | | | | | | |
|
|
|
| | | | | |
| | | | | |
| Three Months Ended September 30, 2020 | | | | | |
| (In millions) | | By-Product | | Co-Product Method | |
| | Method | | Copper | | Othera | | Total | |
| Revenues, excluding adjustments | | $ | 754 | | | $ | 754 | | | $ | 53 | | | $ | 807 | | |
Site production and delivery, before net noncash
and other costs shown below | | 459 | | | 432 | | | 38 | | | 470 | | |
| By-product credits | | (42) | | | — | | | — | | | — | | |
| Treatment charges | | 40 | | | 40 | | | — | | | 40 | | |
| Royalty on metals | | 1 | | | 1 | | | — | | | 1 | | |
| Net cash costs | | 458 | | | 473 | | | 38 | | | 511 | | |
| DD&A | | 105 | | | 98 | | | 7 | | | 105 | | |
| | | | | | | | | |
| Noncash and other costs, net | | 9 | | b | 8 | | | 1 | | | 9 | | |
| Total costs | | 572 | | | 579 | | | 46 | | | 625 | | |
Other revenue adjustments, primarily for pricing
on prior period open sales | | 41 | | | 41 | | | — | | | 41 | | |
| Gross profit | | $ | 223 | | | $ | 216 | | | $ | 7 | | | $ | 223 | | |
| | | | | | | | | |
| Copper sales (millions of recoverable pounds) | | 250 | | | 250 | | | | | | |
| | | | | | | | | |
| Gross profit per pound of copper: | | | | | |
| | | | | | | | | |
| Revenues, excluding adjustments | | $ | 3.02 | | | $ | 3.02 | | | | | | |
Site production and delivery, before net noncash
and other costs shown below | | 1.84 | | | 1.73 | | | | | | |
| By-product credits | | (0.17) | | | — | | | | | | |
| Treatment charges | | 0.15 | | | 0.15 | | | | | | |
| Royalty on metals | | 0.01 | | | 0.01 | | | | | | |
| Unit net cash costs | | 1.83 | | | 1.89 | | | | | | |
| DD&A | | 0.42 | | | 0.39 | | | | | | |
| | | | | | | | | |
| Noncash and other costs, net | | 0.04 | | b | 0.04 | | | | | | |
| Total unit costs | | 2.29 | | | 2.32 | | | | | | |
Other revenue adjustments, primarily for pricing
on prior period open sales | | 0.16 | | | 0.16 | | | | | | |
| Gross profit per pound | | $ | 0.89 | | | $ | 0.86 | | | | | | |
| | | | | | | | | |
| Reconciliation to Amounts Reported | | | | | | | | | |
| | | | Production | | | | | |
| | Revenues | | and Delivery | | DD&A | | | |
| Totals presented above | | $ | 807 | | | $ | 470 | | | $ | 105 | | | | |
| Treatment charges | | (40) | | | — | | | — | | | | |
| Royalty on metals | | (1) | | | — | | | — | | | | |
| Noncash and other costs, net | | — | | | 9 | | | — | | | | |
Other revenue adjustments, primarily for pricing
on prior period open sales | | 41 | | | — | | | — | | | | |
| Eliminations and other | | (1) | | | (2) | | | — | | | | |
| South America mining | | 806 | | | 477 | | | 105 | | | | |
Other miningc | | 4,122 | | | 3,022 | | | 268 | | | | |
| | | | | | | | | |
| | | | | | | | | |
| Corporate, other & eliminations | | (1,077) | | | (1,034) | | | 21 | | | | |
| As reported in our consolidated financial statements | | $ | 3,851 | | | $ | 2,465 | | | $ | 394 | | | | |
| | | | | | | | | |
a.Includes silver sales of 0.9 million ounces ($24.84 per ounce average realized price). Also reflects sales of molybdenum produced by Cerro Verde to our molybdenum sales company at market-based pricing.
b.Includes charges totaling $5 million ($0.02 per pound of copper), primarily associated with the COVID-19 pandemic (including health and safety costs).
c.Represents the combined total for our other segments, as presented in Note 9.
South America Mining Product Revenues, Production Costs and Unit Net Cash Costs
| | | | | | | | | | | | | | | | | | | | | | | | | | | | | |
| | | | | |
| Nine months ended September 30, 2021 | | | | | |
| (In millions) | | By-Product | | Co-Product Method | |
| | Method | | Copper | | Othera | | Total | |
| Revenues, excluding adjustments | | $ | 3,238 | | | $ | 3,238 | | | $ | 267 | | | $ | 3,505 | | |
Site production and delivery, before net noncash
and other costs shown below | | 1,690 | | b | 1,568 | | | 155 | | | 1,723 | | |
| By-product credits | | (234) | | | — | | | — | | | — | | |
| Treatment charges | | 101 | | | 101 | | | — | | | 101 | | |
| Royalty on metals | | 8 | | | 7 | | | 1 | | | 8 | | |
| Net cash costs | | 1,565 | | | 1,676 | | | 156 | | | 1,832 | | |
| DD&A | | 306 | | | 282 | | | 24 | | | 306 | | |
| | | | | | | | | |
| Noncash and other costs, net | | 49 | | | 45 | | | 4 | | | 49 | | |
| Total costs | | 1,920 | | | 2,003 | | | 184 | | | 2,187 | | |
Other revenue adjustments, primarily for pricing
on prior period open sales | | 98 | | | 98 | | | — | | | 98 | | |
| Gross profit | | $ | 1,416 | | | $ | 1,333 | | | $ | 83 | | | $ | 1,416 | | |
| | | | | | | | | |
| Copper sales (millions of recoverable pounds) | | 769 | | | 769 | | | | | | |
| | | | | | | | | |
| Gross profit per pound of copper: | | | | | |
| | | | | | | | | |
| Revenues, excluding adjustments | | $ | 4.21 | | | $ | 4.21 | | | | | | |
Site production and delivery, before net noncash
and other costs shown below | | 2.20 | | b | 2.04 | | | | | | |
| By-product credits | | (0.31) | | | — | | | | | | |
| Treatment charges | | 0.13 | | | 0.13 | | | | | | |
| Royalty on metals | | 0.01 | | | 0.01 | | | | | | |
| Unit net cash costs | | 2.03 | | | 2.18 | | | | | | |
| DD&A | | 0.40 | | | 0.36 | | | | | | |
| | | | | | | | | |
| Noncash and other costs, net | | 0.07 | | | 0.06 | | | | | | |
| Total unit costs | | 2.50 | | | 2.60 | | | | | | |
Other revenue adjustments, primarily for pricing
on prior period open sales | | 0.13 | | | 0.13 | | | | | | |
| Gross profit per pound | | $ | 1.84 | | | $ | 1.74 | | | | | | |
| | | | | | | | | |
| Reconciliation to Amounts Reported | | | | | | | | | |
| | | | | | | | | |
| | | | Production | | | | | |
| | Revenues | | and Delivery | | DD&A | | | |
| Totals presented above | | $ | 3,505 | | | $ | 1,723 | | | $ | 306 | | | | |
| Treatment charges | | (101) | | | — | | | — | | | | |
| Royalty on metals | | (8) | | | — | | | — | | | | |
| Noncash and other costs, net | | — | | | 49 | | | — | | | | |
Other revenue adjustments, primarily for pricing
on prior period open sales | | 98 | | | — | | | — | | | | |
| Eliminations and other | | (1) | | | (3) | | | — | | | | |
| South America mining | | 3,493 | | | 1,769 | | | 306 | | | | |
Other miningc | | 17,578 | | | 11,234 | | | 1,077 | | | | |
| | | | | | | | | |
| | | | | | | | | |
| Corporate, other & eliminations | | (4,390) | | | (4,141) | | | 47 | | | | |
| As reported in our consolidated financial statements | | $ | 16,681 | | | $ | 8,862 | | | $ | 1,430 | | | | |
| | | | | | | | | |
a.Includes silver sales of 2.7 million ounces ($25.81 per ounce average realized price). Also reflects sales of molybdenum produced by Cerro Verde to FCX's molybdenum sales company at market-based pricing.
b.Includes nonrecurring charges totaling $74 million ($0.10 per pound of copper) associated with labor related charges at Cerro Verde for agreements reached with approximately 65 percent of its hourly employees.
c.Represents the combined total for our other segments, as presented in Note 9.
South America Mining Product Revenues, Production Costs and Unit Net Cash Costs
| | | | | | | | | | | | | | | | | | | | | | | | | | | | | |
| | | | | |
| Nine months ended September 30, 2020 | | | | | |
| (In millions) | | By-Product | | Co-Product Method | |
| | Method | | Copper | | Othera | | Total | |
| Revenues, excluding adjustments | | $ | 1,994 | | | $ | 1,994 | | | $ | 139 | | | $ | 2,133 | | |
Site production and delivery, before net noncash
and other costs shown below | | 1,313 | | | 1,231 | | | 111 | | | 1,342 | | |
| By-product credits | | (110) | | | — | | | — | | | — | | |
| Treatment charges | | 111 | | | 111 | | | — | | | 111 | | |
| Royalty on metals | | 4 | | | 4 | | | — | | | 4 | | |
| Net cash costs | | 1,318 | | | 1,346 | | | 111 | | | 1,457 | | |
| DD&A | | 316 | | | 294 | | | 22 | | | 316 | | |
| Metals inventory adjustments | | 3 | | | 3 | | | — | | | 3 | | |
| Noncash and other costs, net | | 109 | | b | 103 | | | 6 | | | 109 | | |
| Total costs | | 1,746 | | | 1,746 | | | 139 | | | 1,885 | | |
Other revenue adjustments, primarily for pricing
on prior period open sales | | (70) | | | (70) | | | — | | | (70) | | |
| Gross profit | | $ | 178 | | | $ | 178 | | | $ | — | | | $ | 178 | | |
| | | | | | | | | |
| Copper sales (millions of recoverable pounds) | | 716 | | | 716 | | | | | | |
| | | | | | | | | |
| Gross profit per pound of copper: | | | | | |
| | | | | | | | | |
| Revenues, excluding adjustments | | $ | 2.79 | | | $ | 2.79 | | | | | | |
Site production and delivery, before net noncash
and other costs shown below | | 1.83 | | | 1.72 | | | | | | |
| By-product credits | | (0.15) | | | — | | | | | | |
| Treatment charges | | 0.15 | | | 0.15 | | | | | | |
| Royalty on metals | | 0.01 | | | 0.01 | | | | | | |
| Unit net cash costs | | 1.84 | | | 1.88 | | | | | | |
| DD&A | | 0.44 | | | 0.41 | | | | | | |
| Metals inventory adjustments | | — | | | — | | | | | | |
| Noncash and other costs, net | | 0.16 | | b | 0.15 | | | | | | |
| Total unit costs | | 2.44 | | | 2.44 | | | | | | |
Other revenue adjustments, primarily for pricing
on prior period open sales | | (0.10) | | | (0.10) | | | | | | |
| Gross profit per pound | | $ | 0.25 | | | $ | 0.25 | | | | | | |
| | | | | | | | | |
| Reconciliation to Amounts Reported | | | | | | | | | |
| | | | | | | | Metals | |
| | | | Production | | | | Inventory | |
| | Revenues | | and Delivery | | DD&A | | Adjustments | |
| Totals presented above | | $ | 2,133 | | | $ | 1,342 | | | $ | 316 | | | $ | 3 | | |
| Treatment charges | | (111) | | | — | | | — | | | — | | |
| Royalty on metals | | (4) | | | — | | | — | | | — | | |
| Noncash and other costs, net | | — | | | 109 | | | — | | | — | | |
Other revenue adjustments, primarily for pricing
on prior period open sales | | (70) | | | — | | | — | | | — | | |
| Eliminations and other | | (1) | | | (2) | | | (1) | | | — | | |
| South America mining | | 1,947 | | | 1,449 | | | 315 | | | 3 | | |
Other miningc | | 10,530 | | | 8,631 | | | 727 | | | 63 | | |
| | | | | | | | | |
| | | | | | | | | |
| Corporate, other & eliminations | | (2,774) | | | (2,676) | | | 51 | | | 26 | | |
| As reported in our consolidated financial statements | | $ | 9,703 | | | $ | 7,404 | | | $ | 1,093 | | | $ | 92 | | |
| | | | | | | | | |
a.Includes silver sales of 2.5 million ounces ($19.58 per ounce average realized price). Also reflects sales of molybdenum produced by Cerro Verde to FCX's molybdenum sales company at market-based pricing.
b.Includes charges totaling $91 million ($0.13 per pound of copper) primarily associated with idle facility (Cerro Verde) and contract cancellation costs related to the COVID-19 pandemic and employee separation costs associated with the April 2020 revised operating plans.
c.Represents the combined total for our other segments, as presented in Note 9.
Indonesia Mining Product Revenues, Production Costs and Unit Net Cash Costs
| | | | | | | | | | | | | | | | | | | | | | | | | | | | | | | | | | | |
| | | | | | | | | | | |
| |
| |
| |
| Three Months Ended September 30, 2021 | | | | | |
| (In millions) | | By-Product | | Co-Product Method | |
| | Method | | Copper | | Gold | | Silvera | | Total | |
| Revenues, excluding adjustments | | $ | 1,555 | | | $ | 1,555 | | | $ | 701 | | | $ | 37 | | | $ | 2,293 | | |
Site production and delivery, before net noncash
and other costs shown below | | 553 | | | 375 | | | 169 | | | 9 | | | 553 | | |
| Gold and silver credits | | (744) | | | — | | | — | | | — | | | — | | |
| Treatment charges | | 90 | | | 61 | | | 27 | | | 2 | | | 90 | | |
| Export duties | | 71 | | | 48 | | | 22 | | | 1 | | | 71 | | |
| Royalty on metals | | 94 | | | 67 | | | 25 | | | 2 | | | 94 | | |
| Net cash costs | | 64 | | | 551 | | | 243 | | | 14 | | | 808 | | |
| DD&A | | 280 | | | 190 | | | 86 | | | 4 | | | 280 | | |
| | | | | | | | | | | |
| | | | | | | | | | | |
| Total costs | | 344 | | | 741 | | | 329 | | | 18 | | | 1,088 | | |
Other revenue adjustments, primarily for pricing
on prior period open sales | | (2) | | | (2) | | | 6 | | | — | | | 4 | | |
| PT Smelting intercompany loss | | (16) | | | (11) | | | (5) | | | — | | | (16) | | |
| Gross profit | | $ | 1,193 | | | $ | 801 | | | $ | 373 | | | $ | 19 | | | $ | 1,193 | | |
| | | | | | | | | | | |
| Copper sales (millions of recoverable pounds) | | 378 | | | 378 | | | | | | | | |
| Gold sales (thousands of recoverable ounces) | | | | | | 399 | | | | | | |
| | | | | | | | | | | |
| Gross profit per pound of copper/per ounce of gold: | | | | | | | |
| | | | | | | | | | | |
| Revenues, excluding adjustments | | $ | 4.11 | | | $ | 4.11 | | | $ | 1,757 | | | | | | |
Site production and delivery, before net noncash
and other costs shown below | | 1.46 | | | 0.99 | | | 424 | | | | | | |
| Gold and silver credits | | (1.97) | | | — | | | — | | | | | | |
| Treatment charges | | 0.24 | | | 0.16 | | | 69 | | | | | | |
| Export duties | | 0.19 | | | 0.13 | | | 54 | | | | | | |
| Royalty on metals | | 0.25 | | | 0.18 | | | 63 | | | | | | |
| Unit net cash costs | | 0.17 | | | 1.46 | | | 610 | | | | | | |
| DD&A | | 0.74 | | | 0.50 | | | 215 | | | | | | |
| | | | | | | | | | | |
| | | | | | | | | | | |
| Total unit costs | | 0.91 | | | 1.96 | | | 825 | | | | | | |
Other revenue adjustments, primarily for pricing
on prior period open sales | | — | | | — | | | 16 | | | | | | |
| PT Smelting intercompany loss | | (0.04) | | | (0.03) | | | (12) | | | | | | |
| Gross profit per pound/ounce | | $ | 3.16 | | | $ | 2.12 | | | $ | 936 | | | | | | |
| | | | | | | | | | | |
| Reconciliation to Amounts Reported | | | | | | | | | | | |
| | | | Production | | | | | | | |
| | Revenues | | and Delivery | | DD&A | | | | | |
| Totals presented above | | $ | 2,293 | | | $ | 553 | | | $ | 280 | | | | | | |
| Treatment charges | | (90) | | | — | | | — | | | | | | |
| Export duties | | (71) | | | — | | | — | | | | | | |
| Royalty on metals | | (94) | | | — | | | — | | | | | | |
| | | | | | | | | | | |
Other revenue adjustments, primarily for pricing
on prior period open sales | | 4 | | | — | | | — | | | | | | |
| PT Smelting intercompany loss | | — | | | 16 | | | — | | | | | | |
| Indonesia mining | | 2,042 | | | 569 | | | 280 | | | | | | |
Other miningb | | 5,672 | | | 4,070 | | | 232 | | | | | | |
| | | | | | | | | | | |
| | | | | | | | | | | |
| Corporate, other & eliminations | | (1,631) | | | (1,630) | | | 16 | | | | | | |
| As reported in our consolidated financial statements | | $ | 6,083 | | | $ | 3,009 | | | $ | 528 | | | | | | |
| | | | | | | | | | | |
a.Includes silver sales of 1.7 million ounces ($22.22 per ounce average realized price).
b.Represents the combined total for our other segments, as presented in Note 9.
Indonesia Mining Product Revenues, Production Costs and Unit Net Cash Costs
| | | | | | | | | | | | | | | | | | | | | | | | | | | | | | | | | | | |
| | | | | | | | | | | |
|
|
|
| Three Months Ended September 30, 2020 | | | | | |
| (In millions) | | By-Product | | Co-Product Method | |
| | Method | | Copper | | Gold | | Silvera | | Total | |
| Revenues, excluding adjustments | | $ | 659 | | | $ | 659 | | | $ | 437 | | | $ | 24 | | | $ | 1,120 | | |
Site production and delivery, before net noncash
and other costs shown below | | 376 | | | 221 | | | 147 | | | 8 | | | 376 | | |
| Gold and silver credits | | (474) | | | — | | | — | | | — | | | — | | |
| Treatment charges | | 58 | | | 34 | | | 23 | | | 1 | | | 58 | | |
| Export duties | | 24 | | | 14 | | | 9 | | | 1 | | | 24 | | |
| Royalty on metals | | 45 | | | 26 | | | 18 | | | 1 | | | 45 | | |
| Net cash costs | | 29 | | | 295 | | | 197 | | | 11 | | | 503 | | |
| DD&A | | 150 | | | 88 | | | 59 | | | 3 | | | 150 | | |
| Noncash and other costs, net | | 24 | | b | 14 | | | 9 | | | 1 | | | 24 | | |
| Total costs | | 203 | | | 397 | | | 265 | | | 15 | | | 677 | | |
Other revenue adjustments, primarily for pricing
on prior period open sales | | 28 | | | 28 | | | 11 | | | 2 | | | 41 | | |
| PT Smelting intercompany loss | | (17) | | | (10) | | | (7) | | | — | | | (17) | | |
| Gross profit | | $ | 467 | | | $ | 280 | | | $ | 176 | | | $ | 11 | | | $ | 467 | | |
| | | | | | | | | | | |
| Copper sales (millions of recoverable pounds) | | 219 | | | 219 | | | | | | | | |
| Gold sales (thousands of recoverable ounces) | | | | | | 230 | | | | | | |
| | | | | | | | | | | |
| Gross profit per pound of copper/per ounce of gold: | | | | | | | |
| | | | | | | | | | | |
| Revenues, excluding adjustments | | $ | 3.00 | | | $ | 3.00 | | | $ | 1,902 | | | | | | |
Site production and delivery, before net noncash
and other costs shown below | | 1.71 | | | 1.01 | | | 639 | | | | | | |
| Gold and silver credits | | (2.16) | | | — | | | — | | | | | | |
| Treatment charges | | 0.26 | | | 0.16 | | | 98 | | | | | | |
| Export duties | | 0.11 | | | 0.06 | | | 40 | | | | | | |
| Royalty on metals | | 0.21 | | | 0.12 | | | 79 | | | | | | |
| Unit net cash costs | | 0.13 | | | 1.35 | | | 856 | | | | | | |
| DD&A | | 0.68 | | | 0.40 | | | 256 | | | | | | |
| Noncash and other costs, net | | 0.11 | | b | 0.06 | | | 40 | | | | | | |
| Total unit costs | | 0.92 | | | 1.81 | | | 1,152 | | | | | | |
Other revenue adjustments, primarily for pricing
on prior period open sales | | 0.13 | | | 0.13 | | | 49 | | | | | | |
| PT Smelting intercompany loss | | (0.08) | | | (0.05) | | | (31) | | | | | | |
| Gross profit per pound/ounce | | $ | 2.13 | | | $ | 1.27 | | | $ | 768 | | | | | | |
| | | | | | | | | | | |
| Reconciliation to Amounts Reported | | | | | | | | | | | |
| | | | Production | | | | | | | |
| | Revenues | | and Delivery | | DD&A | | | | | |
| Totals presented above | | $ | 1,120 | | | $ | 376 | | | $ | 150 | | | | | | |
| Treatment charges | | (58) | | | — | | | — | | | | | | |
| Export duties | | (24) | | | — | | | — | | | | | | |
| Royalty on metals | | (53) | | | (8) | | | — | | | | | | |
| Noncash and other costs, net | | — | | | 24 | | | — | | | | | | |
Other revenue adjustments, primarily for pricing
on prior period open sales | | 41 | | | — | | | — | | | | | | |
| PT Smelting intercompany loss | | — | | | 17 | | | — | | | | | | |
| Indonesia mining | | 1,026 | | | 409 | | | 150 | | | | | | |
Other miningc | | 3,902 | | | 3,090 | | | 223 | | | | | | |
| | | | | | | | | | | |
| | | | | | | | | | | |
| Corporate, other & eliminations | | (1,077) | | | (1,034) | | | 21 | | | | | | |
| As reported in our consolidated financial statements | | $ | 3,851 | | | $ | 2,465 | | | $ | 394 | | | | | | |
| | | | | | | | | | | |
a.Includes silver sales of 1.0 million ounces ($24.29 per ounce average realized price).
b.Includes COVID-19 related costs (including one-time incremental employee benefits and health and safety costs) totaling $10 million ($0.05 per pound of copper).
c.Represents the combined total for our other segments, as presented in Note 9.
Indonesia Mining Product Revenues, Production Costs and Unit Net Cash Costs
| | | | | | | | | | | | | | | | | | | | | | | | | | | | | | | | |
| | | | |
| Nine months ended September 30, 2021 | | | | |
| (In millions) | | By-Product | | Co-Product Method |
| | Method | | Copper | | Gold | | Silvera | | Total |
| Revenues, excluding adjustments | | $ | 3,989 | | | $ | 3,989 | | | $ | 1,703 | | | $ | 104 | | | $ | 5,796 | |
Site production and delivery, before net noncash
and other costs shown below | | 1,412 | | | 972 | | | 415 | | | 25 | | | 1,412 | |
| Gold and silver credits | | (1,803) | | | — | | | — | | | — | | | — | |
| Treatment charges | | 229 | | | 158 | | | 67 | | | 4 | | | 229 | |
| Export duties | | 145 | | | 99 | | | 43 | | | 3 | | | 145 | |
| Royalty on metals | | 234 | | | 167 | | | 63 | | | 4 | | | 234 | |
| Net cash costs | | 217 | | | 1,396 | | | 588 | | | 36 | | | 2,020 | |
| DD&A | | 726 | | | 499 | | | 213 | | | 14 | | | 726 | |
| | | | | | | | | | |
| Noncash and other costs, net | | 3 | | b | 2 | | | 1 | | | — | | | 3 | |
| Total costs | | 946 | | | 1,897 | | | 802 | | | 50 | | | 2,749 | |
Other revenue adjustments, primarily for pricing
on prior period open sales | | 71 | | | 71 | | | (4) | | | — | | | 67 | |
| PT Smelting intercompany loss | | (106) | | | (73) | | | (31) | | | (2) | | | (106) | |
| Gross profit | | $ | 3,008 | | | $ | 2,090 | | | $ | 866 | | | $ | 52 | | | $ | 3,008 | |
| | | | | | | | | | |
| Copper sales (millions of recoverable pounds) | | 946 | | | 946 | | | | | | | |
| Gold sales (thousands of recoverable ounces) | | | | | | 957 | | | | | |
| | | | | | | | | | |
| Gross profit per pound of copper/per ounce of gold: | | | | | | |
| | | | | | | | | | |
| Revenues, excluding adjustments | | $ | 4.21 | | | $ | 4.21 | | | $ | 1,780 | | | | | |
Site production and delivery, before net noncash
and other costs shown below | | 1.49 | | | 1.03 | | | 434 | | | | | |
| Gold and silver credits | | (1.91) | | | — | | | — | | | | | |
| Treatment charges | | 0.24 | | | 0.17 | | | 70 | | | | | |
| Export duties | | 0.15 | | | 0.10 | | | 45 | | | | | |
| Royalty on metals | | 0.26 | | | 0.18 | | | 66 | | | | | |
| Unit net cash costs | | 0.23 | | | 1.48 | | | 615 | | | | | |
| DD&A | | 0.76 | | | 0.52 | | | 222 | | | | | |
| | | | | | | | | | |
| Noncash and other costs, net | | 0.01 | | b | 0.01 | | | 1 | | | | | |
| Total unit costs | | 1.00 | | | 2.01 | | | 838 | | | | | |
Other revenue adjustments, primarily for pricing
on prior period open sales | | 0.08 | | | 0.08 | | | (5) | | | | | |
| PT Smelting intercompany loss | | (0.11) | | | (0.08) | | | (33) | | | | | |
| Gross profit per pound/ounce | | $ | 3.18 | | | $ | 2.20 | | | $ | 904 | | | | | |
| | | | | | | | | | |
| Reconciliation to Amounts Reported | | | | | | | | | | |
| | | | Production | | | | | | |
| | Revenues | | and Delivery | | DD&A | | | | |
| Totals presented above | | $ | 5,796 | | | $ | 1,412 | | | $ | 726 | | | | | |
| Treatment charges | | (229) | | | — | | | — | | | | | |
| Export duties | | (145) | | | — | | | — | | | | | |
| Royalty on metals | | (234) | | | — | | | — | | | | | |
| Noncash and other costs, net | | 31 | | | 34 | | | — | | | | | |
Other revenue adjustments, primarily for pricing
on prior period open sales | | 67 | | | — | | | — | | | | | |
| PT Smelting intercompany loss | | — | | | 106 | | | — | | | | | |
| Indonesia mining | | 5,286 | | | 1,552 | | | 726 | | | | | |
Other miningc | | 15,785 | | | 11,451 | | | 657 | | | | | |
| | | | | | | | | | |
| | | | | | | | | | |
| Corporate, other & eliminations | | (4,390) | | | (4,141) | | | 47 | | | | | |
| As reported in our consolidated financial statements | | $ | 16,681 | | | $ | 8,862 | | | $ | 1,430 | | | | | |
| | | | | | | | | | |
a.Includes silver sales of 4.3 million ounces ($24.50 per ounce average realized price).
b.Includes credits of $31 million ($0.03 per pound of copper) associated with adjustments to prior year treatment and refining charges and charges of $16 million ($0.02 per pound of copper) associated with a potential settlement of an administrative fine levied by the Indonesia government.
c.Represents the combined total for our other segments, as presented in Note 9.
Indonesia Mining Product Revenues, Production Costs and Unit Net Cash Costs
| | | | | | | | | | | | | | | | | | | | | | | | | | | | | | | | | | | |
| | | | | |
| Nine months ended September 30, 2020 | | | | | |
| (In millions) | | By-Product | | Co-Product Method | |
| | Method | | Copper | | Gold | | Silvera | | Total | |
| Revenues, excluding adjustments | | $ | 1,447 | | | $ | 1,447 | | | $ | 994 | | | $ | 48 | | | $ | 2,489 | | |
Site production and delivery, before net noncash
and other costs shown below | | 1,062 | | | 617 | | | 424 | | | 21 | | | 1,062 | | |
| Gold and silver credits | | (1,046) | | | — | | | — | | | — | | | — | | |
| Treatment charges | | 143 | | | 83 | | | 57 | | | 3 | | | 143 | | |
| Export duties | | 43 | | | 25 | | | 17 | | | 1 | | | 43 | | |
| Royalty on metals | | 92 | | | 53 | | | 38 | | | 1 | | | 92 | | |
| Net cash costs | | 294 | | | 778 | | | 536 | | | 26 | | | 1,340 | | |
| DD&A | | 375 | | | 218 | | | 150 | | | 7 | | | 375 | | |
| | | | | | | | | | | |
| Noncash and other costs, net | | 56 | | b | 33 | | | 22 | | | 1 | | | 56 | | |
| Total costs | | 725 | | | 1,029 | | | 708 | | | 34 | | | 1,771 | | |
Other revenue adjustments, primarily for pricing
on prior period open sales | | (20) | | | (20) | | | 4 | | | — | | | (16) | | |
| PT Smelting intercompany loss | | (18) | | | (11) | | | (7) | | | — | | | (18) | | |
| Gross profit | | $ | 684 | | | $ | 387 | | | $ | 283 | | | $ | 14 | | | $ | 684 | | |
| | | | | | | | | | | |
| Copper sales (millions of recoverable pounds) | | 518 | | | 518 | | | | | | | | |
| Gold sales (thousands of recoverable ounces) | | | | | | 549 | | | | | | |
| | | | | | | | | | | |
| Gross profit per pound of copper/per ounce of gold: | | | | | | | |
| | | | | | | | | | | |
| Revenues, excluding adjustments | | $ | 2.79 | | | $ | 2.79 | | | $ | 1,810 | | | | | | |
Site production and delivery, before net noncash
and other costs shown below | | 2.05 | | | 1.19 | | | 773 | | | | | | |
| Gold and silver credits | | (2.02) | | | — | | | — | | | | | | |
| Treatment charges | | 0.28 | | | 0.16 | | | 104 | | | | | | |
| Export duties | | 0.08 | | | 0.05 | | | 31 | | | | | | |
| Royalty on metals | | 0.18 | | | 0.10 | | | 68 | | | | | | |
| Unit net cash costs | | 0.57 | | | 1.50 | | | 976 | | | | | | |
| DD&A | | 0.72 | | | 0.42 | | | 273 | | | | | | |
| | | | | | | | | | | |
| Noncash and other costs, net | | 0.11 | | b | 0.07 | | | 41 | | | | | | |
| Total unit costs | | 1.40 | | | 1.99 | | | 1,290 | | | | | | |
Other revenue adjustments, primarily for pricing
on prior period open sales | | (0.03) | | | (0.03) | | | 8 | | | | | | |
| PT Smelting intercompany loss | | (0.04) | | | (0.02) | | | (13) | | | | | | |
| Gross profit per pound/ounce | | $ | 1.32 | | | $ | 0.75 | | | $ | 515 | | | | | | |
| | | | | | | | | | | |
| Reconciliation to Amounts Reported | | | | | | | | | | | |
| | | | Production | | | | | | | |
| | Revenues | | and Delivery | | DD&A | | | | | |
| Totals presented above | | $ | 2,489 | | | $ | 1,062 | | | $ | 375 | | | | | | |
| Treatment charges | | (143) | | | — | | | — | | | | | | |
| Export duties | | (43) | | | — | | | — | | | | | | |
| Royalty on metals | | (98) | | | (6) | | | — | | | | | | |
| Noncash and other costs, net | | — | | | 56 | | | — | | | | | | |
Other revenue adjustments, primarily for pricing
on prior period open sales | | (16) | | | — | | | — | | | | | | |
| PT Smelting intercompany loss | | — | | | 18 | | | — | | | | | | |
| Indonesia mining | | 2,189 | | | 1,130 | | | 375 | | | | | | |
Other miningc | | 10,288 | | | 8,950 | | | 667 | | | | | | |
| | | | | | | | | | | |
| | | | | | | | | | | |
| Corporate, other & eliminations | | (2,774) | | | (2,676) | | | 51 | | | | | | |
| As reported in our consolidated financial statements | | $ | 9,703 | | | $ | 7,404 | | | $ | 1,093 | | | | | | |
| | | | | | | | | | | |
a.Includes silver sales of 2.3 million ounces ($20.73 per ounce average realized price).
b.Includes COVID-19 related costs (including one-time incremental employee benefits and health and safety costs) of $14 million ($0.03 per pound of copper).
c.Represents the combined total for our segments, as presented in Note 9.
Molybdenum Mines Product Revenues, Production Costs and Unit Net Cash Costs
| | | | | | | | | | | | | | | | | | | | | | | | | | |
| | | | | | | | |
|
|
|
|
| | | | | | | | |
| Three Months Ended September 30, | | | |
| (In millions) | 2021 | | 2020 | | | | | |
| | | | | | | | |
Revenues, excluding adjustmentsa | $ | 158 | | | $ | 47 | | | | | | |
Site production and delivery, before net noncash
and other costs shown below | 67 | | | 47 | | | | | | |
| Treatment charges and other | 7 | | | 5 | | | | | | |
| Net cash costs | 74 | | | 52 | | | | | | |
| DD&A | 19 | | | 13 | | | | | | |
| Metals inventory adjustments | — | | | 3 | | | | | | |
| Noncash and other costs, net | 3 | |
| 4 | | | | | | |
| Total costs | 96 | | | 72 | | | | | | |
| Gross profit (loss) | $ | 62 | | | $ | (25) | | | | | | |
| | | | | | | | |
Molybdenum sales (millions of recoverable pounds)a | 9 | | | 6 | | | | | | |
| | | | | | | | |
| Gross profit (loss) per pound of molybdenum: | | | |
| | | | | | | | |
Revenues, excluding adjustmentsa | $ | 18.13 | | | $ | 8.83 | | | | | | |
Site production and delivery, before net noncash
and other costs shown below | 7.70 | | | 8.88 | | | | | | |
| Treatment charges and other | 0.84 | | | 0.84 | | | | | | |
| Unit net cash costs | 8.54 | | | 9.72 | | | | | | |
| DD&A | 2.14 | | | 2.38 | | | | | | |
| Metals inventory adjustments | — | | | 0.67 | | | | | | |
| Noncash and other costs, net | 0.30 | |
| 0.54 | | | | | | |
| Total unit costs | 10.98 | | | 13.31 | | | | | | |
| Gross profit (loss) per pound | $ | 7.15 | | | $ | (4.48) | | | | | | |
| | | | | | | | |
| Reconciliation to Amounts Reported | | | | | | | | |
| | | | | | | Metals | |
| | | Production | | | | Inventory | |
| Three Months Ended September 30, 2021 | Revenues | | and Delivery | | DD&A | | Adjustments | |
| Totals presented above | $ | 158 | | | $ | 67 | | | $ | 19 | | | $ | — | | |
| Treatment charges and other | (7) | | | — | | | — | | | — | | |
| Noncash and other costs, net | — | | | 3 | | | — | | | — | | |
| Molybdenum mines | 151 | | | 70 | | | 19 | | | — | | |
Other miningb | 7,563 | | | 4,569 | | | 493 | | | 13 | | |
| | | | | | | | |
| | | | | | | | |
| Corporate, other & eliminations | (1,631) | | | (1,630) | | | 16 | | | 1 | | |
| As reported in our consolidated financial statements | $ | 6,083 | | | $ | 3,009 | | | $ | 528 | | | $ | 14 | | |
| | | | | | | | |
| Three Months Ended September 30, 2020 | | | | | | | | |
| Totals presented above | $ | 47 | | | $ | 47 | | | $ | 13 | | | $ | 3 | | |
| Treatment charges and other | (5) | | | — | | | — | | | — | | |
| Noncash and other costs, net | — | | | 4 | | | — | | | — | | |
| | | | | | | | |
| | | | | | | | |
| Molybdenum mines | 42 | | | 51 | | | 13 | | | 3 | | |
Other miningb | 4,886 | | | 3,448 | | | 360 | | | (2) | | |
| | | | | | | | |
| | | | | | | | |
| Corporate, other & eliminations | (1,077) | | | (1,034) | | | 21 | | | 8 | | |
| As reported in our consolidated financial statements | $ | 3,851 | | | $ | 2,465 | | | $ | 394 | | | $ | 9 | | |
| | | | | | | | |
a.Reflects sales of the Molybdenum mines’ production to our molybdenum sales company at market-based pricing. On a consolidated basis, realizations are based on the actual contract terms for sales to third parties; as a result, our consolidated average realized price per pound of molybdenum will differ from the amounts reported in this table.
b.Represents the combined total for our other segments, as presented in Note 9. Also includes amounts associated with our molybdenum sales company, which includes sales of molybdenum produced by the Molybdenum mines and by certain of the North America and South America copper mines.
Molybdenum Mines Product Revenues, Production Costs and Unit Net Cash Costs
| | | | | | | | | | | | | | | | | | | | | | | | | | |
| | | | | | | | |
| | Nine months ended September 30, | | |
| (In millions) | | 2021 | | 2020 | | | | |
| | | | | | | | |
Revenues, excluding adjustmentsa | | $ | 329 | | | $ | 187 | | | | | |
Site production and delivery, before net noncash
and other costs shown below | | 175 | | | 164 | | | | | |
| Treatment charges and other | | 19 | | | 16 | | | | | |
| Net cash costs | | 194 | | | 180 | | | | | |
| DD&A | | 51 | | | 44 | | | | | |
| Metals inventory adjustments | | 1 | | | 8 | | | | | |
| Noncash and other costs, net | | 8 | | | 14 | | b | | | |
| Total costs | | 254 | | | 246 | | | | | |
| Gross profit (loss) | | $ | 75 | | | $ | (59) | | | | | |
| | | | | | | | |
Molybdenum sales (millions of recoverable pounds)a | | 23 | | | 19 | | | | | |
| | | | | | | | |
| Gross profit (loss) per pound of molybdenum: | | |
| | | | | | | | |
Revenues, excluding adjustmentsa | | $ | 14.41 | | | $ | 9.92 | | | | | |
Site production and delivery, before net noncash
and other costs shown below | | 7.69 | | | 8.73 | | | | | |
| Treatment charges and other | | 0.85 | | | 0.85 | | | | | |
| Unit net cash costs | | 8.54 | | | 9.58 | | | | | |
| DD&A | | 2.21 | | | 2.31 | | | | | |
| Metals inventory adjustments | | 0.04 | | | 0.44 | | | | | |
| Noncash and other costs, net | | 0.34 | | | 0.72 | | b | | | |
| Total unit costs | | 11.13 | | | 13.05 | | | | | |
| Gross profit (loss) per pound | | $ | 3.28 | | | $ | (3.13) | | | | | |
| | | | | | | | |
| Reconciliation to Amounts Reported | | | | | | | | |
| | | | | | | | Metals |
| | | | Production | | | | Inventory |
| Nine months ended September 30, 2021 | | Revenues | | and Delivery | | DD&A | | Adjustments |
| Totals presented above | | $ | 329 | | | $ | 175 | | | $ | 51 | | | $ | 1 | |
| Treatment charges and other | | (19) | | | — | | | — | | | — | |
| Noncash and other costs, net | | — | | | 8 | | | — | | | — | |
| Molybdenum mines | | 310 | | | 183 | | | 51 | | | 1 | |
Other miningc | | 20,761 | | | 12,820 | | | 1,332 | | | 13 | |
| | | | | | | | |
| | | | | | | | |
| Corporate, other & eliminations | | (4,390) | | | (4,141) | | | 47 | | | 1 | |
| As reported in our consolidated financial statements | | $ | 16,681 | | | $ | 8,862 | | | $ | 1,430 | | | $ | 15 | |
| | | | | | | | |
| Nine months ended September 30, 2020 | | | | | | | | |
| Totals presented above | | $ | 187 | | | $ | 164 | | | $ | 44 | | | $ | 8 | |
| Treatment charges and other | | (16) | | | — | | | — | | | — | |
| Noncash and other costs, net | | — | | | 14 | | | — | | | — | |
| | | | | | | | |
| | | | | | | | |
| Molybdenum mines | | 171 | | | 178 | | | 44 | | | 8 | |
Other miningc | | 12,306 | | | 9,902 | | | 998 | | | 58 | |
| | | | | | | | |
| | | | | | | | |
| Corporate, other & eliminations | | (2,774) | | | (2,676) | | | 51 | | | 26 | |
| As reported in our consolidated financial statements | | $ | 9,703 | | | $ | 7,404 | | | $ | 1,093 | | | $ | 92 | |
| | | | | | | | |
a.Reflects sales of the Molybdenum mines’ production to our molybdenum sales company at market-based pricing. On a consolidated basis, realizations are based on the actual contract terms for sales to third parties; as a result, our consolidated average realized price per pound of molybdenum will differ from the amounts reported in this table.
b.Includes charges totaling $7 million ($0.36 per pound of molybdenum) primarily associated with contract cancellation costs related to the COVID-19 pandemic and employee separation costs associated with April 2020 revised operating plans.
c.Represents the combined total for our other segments, as presented in Note 9. Also includes amounts associated with our molybdenum sales company, which includes sales of molybdenum produced by the Molybdenum mines and by certain of the North America and South America copper mines.
GUARANTOR SUMMARIZED FINANCIAL INFORMATION
All of the senior notes issued by FCX are fully and unconditionally guaranteed on a senior basis jointly and severally by Freeport-McMoRan Oil & Gas LLC (FM O&G LLC), as guarantor, which is a 100-percent-owned subsidiary of FCX Oil & Gas LLC (FM O&G) and FCX. The guarantee is an unsecured obligation of the guarantor and ranks equal in right of payment with all existing and future indebtedness of FM O&G LLC, including indebtedness under our revolving credit facility. The guarantee ranks senior in right of payment with all of FM O&G LLC’s future subordinated obligations and is effectively subordinated in right of payment to any debt of FM O&G LLC’s subsidiaries. The indentures provide that FM O&G LLC’s guarantee obligations may be released or terminated upon: (i) the sale of all or substantially all of the equity interests or assets of FM O&G LLC to a third party that is not our subsidiary or our affiliate; (ii) FM O&G LLC no longer having any obligations under any FM O&G senior notes or any refinancing thereof and no longer being a co-borrower or guarantor of any of our obligations under the revolving credit facility or any other senior debt or, in each case, any refinancing thereof; or (iii) the discharge of our obligations under the indentures in accordance with their terms.
The following summarized financial data includes information regarding FCX, as issuer, FM O&G LLC, as guarantor, and all our other non-guarantor subsidiaries at September 30, 2021, and December 31, 2020, and for the nine months ended September 30, 2021.
| | | | | | | | | | | | | | | | | | | | | | | | | | | | | | | | |
| | FCX | | FM O&G LLC | | Non-guarantor | | | | Consolidated |
| | Issuer | | Guarantor | | Subsidiaries | | Eliminations | | FCX |
| As of September 30, 2021 | | | | | | | | | | |
| Current assets | | $ | 151 | | | $ | 745 | | | $ | 13,815 | | | $ | (920) | | | $ | 13,791 | |
| Noncurrent assets | | 432 | | | 6 | | | 33,078 | | | (390) | | | 33,126 | |
| Current liabilities | | 717 | | | 39 | | | 5,635 | | | (868) | | | 5,523 | |
| Noncurrent liabilities | | 9,050 | | | 11,405 | | | 13,975 | | | (15,567) | | | 18,863 | |
| | | | | | | | | | |
| As of December 31, 2020 | | | | | | | | | | |
| Current assets | | $ | 65 | | | $ | 697 | | | $ | 9,287 | | | $ | (746) | | | $ | 9,303 | |
| Noncurrent assets | | 785 | | | 6 | | | 32,806 | | | (756) | | | 32,841 | |
| Current liabilities | | 187 | | | 31 | | | 3,964 | | | (765) | | | 3,417 | |
| Noncurrent liabilities | | 9,433 | | | 11,208 | | | 15,075 | | | (15,657) | | | 20,059 | |
| | | | | | | | | | |
| Nine Months Ended September 30, 2021 | | | | | | | | | | |
| Revenues | | $ | — | | | $ | 41 | | | $ | 16,640 | | | $ | — | | | $ | 16,681 | |
| Operating (loss) income | | (33) | | | 10 | | | 6,069 | | | 15 | | | 6,061 | |
| Net income (loss) | | 3,200 | | a | (133) | | a | 4,262 | | | (3,322) | | | 4,007 | |
a.Net income (loss) equals net income (loss) attributable to common stockholders because net income attributable to noncontrolling interests is zero for issuer and guarantor.
CAUTIONARY STATEMENT
Our discussion and analysis contains forward-looking statements in which we discuss our potential future performance. Forward-looking statements are all statements other than statements of historical facts, such as plans, projections, or expectations relating to ore grades and milling rates; business outlook; production and sales volumes; unit net cash costs; cash flows; capital expenditures; liquidity; operating costs; operating plans; the implementation of our financial policy; PT-FI's ramp-up of underground mining activities and future cash flows through 2022; PT-FI's development, financing, construction and completion of new domestic smelting capacity in Indonesia in accordance with the terms of the special mining license (IUPK); expectations regarding negotiations with hourly employees at Cerro Verde including completion of new CLAs; our commitments to deliver responsibly produced copper, including plans to implement and validate all of our operating sites under specific frameworks; execution of our energy and climate strategies and the underlying assumptions and estimated impacts on our business related thereto; improvements in operating procedures and technology; exploration efforts and results; development and production activities, rates and costs; tax rates; export quotas and duties; the impact of copper, gold and molybdenum price changes; the impact of deferred intercompany profits on earnings; mineralization and reserve estimates; execution of the settlement agreements associated with the Louisiana coastal erosion cases and talc-related litigation; descriptions of our objectives, strategies, plans, goals or targets and future returns to shareholders, including dividend payments (base or variable) and share repurchases. The words “anticipates,” “may,” “can,” “plans,” “believes,” “estimates,” “expects,” “projects,” "targets," “intends,” “likely,” “will,” “should,” “could,” “to be,” ”potential," “assumptions,” “guidance,” “future” and any similar expressions are intended to identify those assertions as forward-looking statements. The timing and amount of any share repurchases will be at the discretion of management and will depend on a variety of factors including, but not limited to, our operating performance, cash flow and financial position, the market price of the shares and general economic and market conditions. The share repurchase program may be modified, increased, suspended or terminated at any time at the Board’s discretion. The declaration and payment of dividends (base or variable) is also at the discretion of the Board and will depend on our financial results, cash requirements, business prospects, global economic conditions and other factors deemed relevant by the Board.
We caution readers that forward-looking statements are not guarantees of future performance and actual results may differ materially from those anticipated, expected, projected or assumed in the forward-looking statements. Important factors that can cause our actual results to differ materially from those anticipated in the forward-looking statements include, but are not limited to, changes in our credit rating; changes in our cash requirements, financial position, financing plans or investment plans; ability to continue to maintain our net debt at a level not to exceed the net debt target in our financial policy; changes in general market, economic, tax, regulatory or industry conditions; the duration and scope of and uncertainties associated with the COVID-19 pandemic (including new and emerging strains and variants of COVID-19), and the impact thereof on commodity prices, our business and any related actions taken by governments and businesses; our ability to contain and mitigate the risk of spread or major outbreak of COVID-19 at our operating sites, including at PT-FI’s remote operating site in Papua; supply of and demand for, and prices of, copper, gold and molybdenum; mine sequencing; changes in mine plans or operational modifications, delays, deferrals or cancellations; production rates; timing of shipments; results of feasibility studies; potential inventory adjustments; potential impairment of long-lived mining assets; the potential effects of violence in Indonesia generally and in the province of Papua; the Indonesia government's extension of PT-FI's export license after March 15, 2022; risks associated with underground mining; satisfaction of requirements in accordance with PT-FI's IUPK to extend mining rights from 2031 through 2041; the Indonesia government's approval of a deferred schedule for completion of new domestic smelting capacity in Indonesia; expected results from improvements in operating procedures and technology, including innovation initiatives; industry risks; regulatory changes; political and social risks; labor relations, including labor-related work stoppages and costs; weather- and climate-related risks; environmental risks; litigation results and completion of settlement agreements; cybersecurity incidents; changes in general market, economic and industry conditions; financial condition of our customers, suppliers, vendors, partners and affiliates; reductions in liquidity and access to capital; our ability to comply with our responsible production commitments under specific frameworks and any changes to such frameworks; our ability to consummate the redemption of senior notes and other factors described in more detail under the heading “Risk Factors” contained in Part I, Item 1A. of our 2020 Form 10-K.
Investors are cautioned that many of the assumptions upon which our forward-looking statements are based are likely to change after the date the forward-looking statements are made, including for example commodity prices, which we cannot control, and production volumes and costs or technological solutions and innovation, some aspects of which we may not be able to control. Further, we may make changes to our business plans that could affect our results. We caution investors that we undertake no obligation to update any forward-looking statements, which speak only as of the date made, notwithstanding any changes in our assumptions, changes in business plans, actual experience or other changes.
This report on Form 10-Q also contains financial measures such as net debt and unit net cash costs per pound of copper and molybdenum, which are not recognized under U.S. GAAP. Refer to “Operations – Unit Net Cash Costs” for further discussion of unit net cash costs associated with our operating divisions, and to “Product Revenues and Production Costs” for reconciliations of per pound costs by operating division to production and delivery costs applicable to sales reported in our consolidated financial statements. Refer to “Net Debt” for reconciliations of debt and consolidated cash and cash equivalents to net debt.
Item 3.Quantitative and Qualitative Disclosures About Market Risk.
There have been no material changes in our market risks during the nine-month period ended September 30, 2021.
For additional information on market risks, refer to “Disclosures About Market Risks” included in Part II, Items 7. and 7A. of our 2020 Form 10-K. For projected sensitivities of our operating cash flow to changes in commodity prices, refer to “Outlook” in Part I, Item 2. of this quarterly report on Form 10-Q; for projected sensitivities of our provisionally priced copper sales to changes in commodity prices refer to “Consolidated Results – Revenues” in Part I, Item 2. of this quarterly report on Form 10-Q.
Item 4.Controls and Procedures.
(a)Evaluation of disclosure controls and procedures. Our chief executive officer and chief financial officer, with the participation of management, have evaluated the effectiveness of our “disclosure controls and procedures” (as defined in Rules 13a-15(e) and 15d-15(e) under the Securities Exchange Act of 1934) as of the end of the period covered by this quarterly report on Form 10-Q. Based on their evaluation, they have concluded that our disclosure controls and procedures were effective as of September 30, 2021.
(b)Changes in internal control over financial reporting. There has been no change in our internal control over financial reporting that occurred during the quarter ended September 30, 2021, that has materially affected, or is reasonably likely to materially affect, our internal control over financial reporting.
Part II.OTHER INFORMATION
Item 1.Legal Proceedings.
We are involved in numerous legal proceedings that arise in the ordinary course of our business or are associated with environmental issues. We are also involved periodically in reviews, inquiries, investigations and other proceedings initiated by or involving government agencies, some of which may result in adverse judgments, settlements, fines, penalties, injunctions or other relief.
Management does not believe, based on currently available information, that the outcome of any legal proceeding reported in Part I, Item 3. “Legal Proceedings” and Note 12 of our 2020 Form 10-K, and Note 8 herein, will have a material adverse effect on our financial condition; although individual or cumulative outcomes could be material to our operating results for a particular period, depending on the nature and magnitude of the outcome and the operating results for the period.
There have been no material changes to legal proceedings previously disclosed in Part I, Item 3. “Legal Proceedings” and Note 12 of our 2020 Form 10-K. Refer to Note 8 for updates to our talc and asbestos claims.
Item 1A. Risk Factors.
There have been no material changes to our risk factors previously disclosed in Part I, Item 1A. “Risk Factors” of our 2020 Form 10-K.
Item 2.Unregistered Sales of Equity Securities and Use of Proceeds.
There were no unregistered sales of equity securities during the three months ended September 30, 2021.
There were no shares of common stock purchased by us during the three months ended September 30, 2021. On November 1, 2021, our Board approved a new share repurchase program, which does not have an expiration date, authorizing repurchases of up to $3.0 billion of our common stock. This new share repurchase program supersedes and replaces the share repurchase program previously authorized by our Board in July 2008.
Item 4.Mine Safety Disclosures.
The safety and health of all employees is our highest priority. Management believes that safety and health considerations are integral to, and compatible with, all other functions in the organization and that proper safety and health management will enhance production and reduce costs. Our approach towards the safety and health of our workforce is to continuously improve performance through implementing robust management systems and providing adequate training, safety incentive and occupational health programs. The information concerning mine safety violations or other regulatory matters required by Section 1503(a) of the Dodd-Frank Wall Street Reform and Consumer Protection Act and Item 104 of Regulation S-K is included in Exhibit 95.1 to this quarterly report on Form 10-Q.
Item 5. Other Information.
Appointment of New Independent Director
On November 1, 2021, our Board increased the size of the Board from nine to ten directors and appointed Ryan M. Lance to serve as a director of FCX, effective immediately, and as a member of the Corporate Responsibility Committee, effective November 2, 2021. Mr. Lance will serve as a director until our 2022 annual meeting of stockholders and until his successor is duly elected and qualified.
The Board affirmatively determined that Mr. Lance has no material relationship with us and is independent in accordance with the director independence standards established under our Corporate Governance Guidelines, which comply with the New York Stock Exchange corporate governance rules, and other applicable laws, rules and regulations. There is no arrangement or understanding between Mr. Lance and any other person pursuant to which he was appointed as a director. There are no transactions in which Mr. Lance has an interest requiring disclosure under Item 404(a) of Regulation S-K.
Our Board is now comprised of ten members, including nine independent directors.
Mr. Lance will be compensated in accordance with our non-management director compensation program, which is described in our definitive proxy statement on Schedule 14A filed with the U.S. Securities and Exchange Commission on April 22, 2021 (the 2021 Proxy Statement) under the heading “Director Compensation.” On November 1, 2021, Mr. Lance received a pro-rata equity award of 2,500 restricted stock units (RSUs), which will vest on the first anniversary of the grant date, or November 1, 2022.
Appointment of Chief Financial Officer
On November 2, 2021, we announced the appointment of Maree Robertson as Senior Vice President and Chief Financial Officer, effective as of March 1, 2022 (the Effective Date). In this role, Ms. Robertson will assume responsibility for our accounting, finance and tax functions, including financial reporting, operational accounting, internal controls, financial planning and analysis, treasury and risk management. Ms. Robertson will report to Kathleen L. Quirk. Ms. Quirk has served as Chief Financial Officer since 2003 and was appointed to an expanded role of President in February 2021. Ms. Quirk will continue to serve as President.
Ms. Robertson, age 46, served as Chief Financial Officer, Energy and Minerals of Rio Tinto Group, a multinational metals and mining company, since September 2019. Prior to joining Rio Tinto, Ms. Robertson had a 17-year career at BHP Group, a multinational natural resources company, serving in a broad range of international finance functions, including Vice President, Finance, Petroleum USA; Head of Finance, Conventional and Potash, Petroleum USA; Vice President, Finance, Potash Canada; and Vice President, Finance, Minera Escondida Ltda. Ms. Robertson joined BHP in 2002 after four years in the PricewaterhouseCoopers natural resource audit practice. Ms. Robertson holds a Bachelor of Commerce from the University of Melbourne.
As of the Effective Date, Ms. Robertson will be paid an annual base salary of $625,000. She will be eligible to participate in our Annual Incentive Plan with a target to be set at 125 percent of her base salary for 2022. Ms. Robertson will also be eligible to receive long-term incentive awards with a grant date value equal to 300 percent of her base salary granted in a form determined by the Compensation Committee, which may include performance share units, stock options and RSUs. The Compensation Committee will have discretion each year to set these amounts.
Upon the Effective Date, Ms. Robertson will receive sign-on incentives as compensation for certain incentives received from her former employer expected to be forfeited upon joining us as follows: (1) a one-time grant of RSUs that will vest ratably over three years with a grant date value of $1.25 million, with the number of RSUs to be determined based on the 20-day trailing average stock price from the Effective Date, and (2) a one-time cash payment of $625,000 subject to repayment or partial repayment if she resigns at any time within two years following the Effective Date. In addition, Ms. Robertson will be eligible to participate in our Executive Change in Control Severance Plan. Severance benefits under the plan include: (1) a lump sum cash payment equal to two times the sum of Ms. Robertson’s base salary plus her average bonus, (2) a prorated bonus for the year of termination calculated based on her average bonus and the number of days worked during the year of termination, and (3) 18 months of health benefit continuation.
There are no family relationships between Ms. Robertson and any director, executive officer, or person nominated or chosen by us to become a director or executive officer of FCX. Ms. Robertson is not a party to any transaction required to be disclosed pursuant to Item 404(a) of Regulation S-K.
For additional information regarding our executive compensation program and our Executive Change in Control Severance Plan, see our 2021 Proxy Statement.
Item 6.Exhibits.
| | | | | | | | | | | | | | | | | |
| | | Filed | |
| Exhibit | | with this | Incorporated by Reference |
| Number | Exhibit Title | Form 10-Q | Form | File No. | Date Filed |
| PT-FI Divestment Agreement dated as of September 27, 2018 among FCX, International Support LLC, PT Freeport Indonesia, PT Indocopper Investama and PT Indonesia Asahan Aluminium (Persero). | | 10-Q | 001-11307-01 | 11/9/2018 |
| Supplemental and Amendment Agreement to the PT-FI Divestment Agreement, dated December 21, 2018, among FCX, PT Freeport Indonesia, PT Indonesia Papua Metal Dan Mineral (f/k/a PT Indocopper Investama), PT Indonesia Asahan Aluminium (Persero) and International Support LLC. | | 10-K | 001-11307-01 | 2/15/2019 |
| Amended and Restated Certificate of Incorporation of FCX, effective as of June 8, 2016. | | 8-K | 001-11307-01 | 6/9/2016 |
| Amended and Restated By-Laws of FCX, effective as of June 3, 2020. | | 8-K | 001-11307-01 | 6/3/2020 |
| Letter from Ernst & Young LLP regarding unaudited interim financial statements. | X | | | |
| List of Guarantor Subsidiaries | | 10-K | 001-11307-01 | 2/16/2021 |
| Certification of Principal Executive Officer pursuant to Rule 13a-14(a)/15d – 14(a). | X | | | |
| Certification of Principal Financial Officer pursuant to Rule 13a-14(a)/15d – 14(a). | X | | | |
| Certification of Principal Executive Officer pursuant to 18 U.S.C. Section 1350. | X | | | |
| Certification of Principal Financial Officer pursuant to 18 U.S.C Section 1350. | X | | | |
| Mine Safety and Health Administration Safety Data. | X | | | |
| 101.INS | XBRL Instance Document- the XBRL Instance Document does not appear in the Interactive Data File because its XBRL tags are embedded within the Inline XBRL document. | X | | | |
| 101.SCH | Inline XBRL Taxonomy Extension Schema. | X | | | |
| 101.CAL | Inline XBRL Taxonomy Extension Calculation Linkbase. | X | | | |
| 101.DEF | Inline XBRL Taxonomy Extension Definition Linkbase. | X | | | |
| 101.LAB | Inline XBRL Taxonomy Extension Label Linkbase. | X | | | |
| 101.PRE | Inline XBRL Taxonomy Extension Presentation Linkbase. | X | | | |
| 104 | The cover page from this Quarterly Report on Form 10-Q, formatted in Inline XBRL. | X | | | |
* The registrant agrees to furnish supplementally to the Securities and Exchange Commission (SEC) a copy of any omitted schedule or exhibit upon the request of the SEC in accordance with Item 601(a)(5) of Regulation S-K.
SIGNATURE
Pursuant to the requirements of the Securities Exchange Act of 1934, the registrant has duly caused this report to be signed on its behalf by the undersigned thereunto duly authorized.
| | | | | | | | |
| Freeport-McMoRan Inc. |
| | |
| By: | /s/ C. Donald Whitmire, Jr. |
| | C. Donald Whitmire, Jr. |
| | Vice President and |
| | Controller - Financial Reporting |
| | (authorized signatory |
| | and Principal Accounting Officer) |
Date: November 5, 2021