UNITED STATES
SECURITIES AND EXCHANGE COMMISSION
WASHINGTON, D.C. 20549
FORM
CURRENT REPORT
Pursuant to Section 13 or 15(d) of the Securities Exchange Act of 1934
Date of Report (Date of earliest event reported)
(Exact name of registrant as specified in its charter)
(State or other jurisdiction | (Commission | (IRS Employer |
(Address of principal executive offices) |
|
(
(Registrant's telephone number,
including area code)
Check the appropriate box below if the Form 8-K filing is intended to simultaneously satisfy the filing obligation of the registrant under any of the following provisions:
Indicate by check mark whether the registrant is an emerging growth company as defined in Rule 405 of the Securities Act of 1933 (§230.405 of this chapter) or Rule 12b-2 of the Securities Exchange Act of 1934 (§240.12b-2 of this chapter). Emerging growth company
If an emerging growth company, indicate by check mark if the registrant has elected not to use the extended transition period for complying with any new or revised financial accounting standards provided pursuant to Section 13(a) of the Exchange Act. ◻
CITIGROUP INC.
Current Report on Form 8-K
Item 2.02 Results of Operations and Financial Condition.
On April 15, 2020, Citigroup Inc. announced its results for the quarter ended March 31, 2020. A copy of the related press release, filed as Exhibit 99.1 to this Form 8-K, is incorporated herein by reference in its entirety and shall be deemed to be “filed” for purposes of the Securities Exchange Act of 1934, as amended (the Act).
In addition, a copy of the Citigroup Inc. Quarterly Financial Data Supplement for the quarter ended March 31, 2020 is being furnished as Exhibit 99.2 to this Form 8-K and shall not be deemed to be “filed” for purposes of Section 18 of the Act or otherwise subject to the liabilities of that section.
Item 9.01 Financial Statements and Exhibits.
(d) Exhibits.
Exhibit Number | ||
99.1 | ||
99.2 | Citigroup Inc. Quarterly Financial Data Supplement for the quarter ended March 31, 2020. | |
99.3 | ||
104.1 | See the cover page of this Current Report on Form 8-K, formatted in Inline XBRL. |
SIGNATURE
Pursuant to the requirements of the Securities Exchange Act of 1934, the registrant has duly caused this report to be signed on its behalf by the undersigned hereunto duly authorized.
CITIGROUP INC. | ||
Dated: April 15, 2020 | ||
By: | /s/ Jeffrey R. Walsh | |
Jeffrey R. Walsh | ||
Interim Controller and Chief Accounting Officer | ||
(Principal Accounting Officer) |
X(J2OG?P?X[O_ M,L)S<:RNI+:ZA>&>-MKQN,%34-<1].FFKH****!A
M1110 4444 %:WA[Q'?\ AK4EO+&3&<"6)ONR+Z$?U[5DT4XR<7=&=6E"K!TZ
MBNGNCZ7\,^*M.\4V)GLWQ+&!YT#?>C)'ZCW]JW*^6M)U:]T34HK^PF,4\9Z]
MF'<$=P:^@?!_C"S\5Z=O3$5[$!Y]OGE?]H>JFO9PV*57W9;GYMGF0RP+]M1U
MI_BO7R\_Z?24445V'S84444 %%%% !1110 4444 %%%% !1110 4444 %%%%
M !1110 4444 %%%% !1110 4444 %%%% !1110 4444 %%%% !1110 4444
M%%%% !1110 4444 %%%% !1110 4444 %%%% !1110 4444 %%%% !1110 4
M444 %%%% !1110 4444 %%%% !1110 4444 %%%% !1110 4444 %%%% !11
M10 4444 %%%% !1110 4444 %-=TCC:21@J*"69C@ #N:=7B_P 2?'CW\\NA
MZ7+BS0[;B9&_UQ_NC_9'?U/MUQK5HTH\S/1RS+:N85U2I[=7V7];%?X@_$%M
M;=]*TJ0KIJG$D@X,Y_\ B?YUYY117A5*DJDN:1^JX+!4<'15&BK)?CYL****
M@ZPHHHH **** "BBNS\(?#O4?$A2ZN"UGIIY\XCYI!GD(/ZGCZU<*
;]W;]_.?N\=>G%=?)\-X[.^\1P:
MEKT-I#HDEL)+C[,\BNDQX;"\A@".,$9.,@?-5JW\&+I&HZQ##>6&HVLGAF74
M[:XN+(DM&<8*J6'ER<'#9; [9.!/M:?0?)/J<-I^LZII'F?V;J5Y9>;CS/LT
M[1[\9QG:1G&3^=0W=Y=:A=/=7MS-?F'P(Z\)\3/F'QC_R/&O\ _82N
M/_1C5B5M^,?^1XU__L)7'_HQJQ*[H?"CFE\3"BBBJ)"BBB@ HHHH **** "O
M3?@7_P CW]>$G_ *''7F5>F_ O_D>[C_KPD_\ 0XZQQ/\ "D:T?XB/&7
M_(C^(/\ L&W'_HMJ^0J^O?&7_(C^(/\ L&W'_HMJ^0JY
Exhibit 99.1
For Immediate Release Citigroup Inc. (NYSE: C) April 15, 2020 |
||
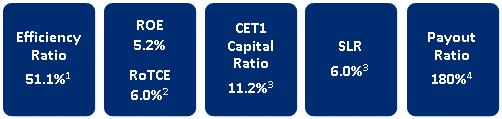
FIRST QUARTER 2020 RESULTS AND KEY METRICS |
CEO COMMENTARY |
|
NET INCOME OF $2.5 BILLION ($1.05 PER SHARE) REVENUES OF $20.7 BILLION RETURNED $4.0 BILLION OF CAPITAL TO COMMON SHAREHOLDERS REPURCHASED 41 MILLION COMMON SHARES5 BOOK VALUE PER SHARE OF $83.75 TANGIBLE BOOK VALUE PER SHARE OF $71.526
New York, April 15, 2020 – Citigroup Inc. today reported net income for the first quarter 2020 of $2.5 billion, or $1.05 per diluted share, on revenues of $20.7 billion. This compared to net income of $4.7 billion, or $1.87 per diluted share, on revenues of $18.6 billion for the first quarter 2019.
Revenues increased 12% from the prior-year period, primarily reflecting higher revenues in Fixed Income Markets and Equity Markets, and the benefit of mark-to-market gains on loan hedges in the corporate lending portfolio, all in the Institutional Clients Group (ICG). Net income declined 46% from the prior-year period, driven by higher loan loss reserves, reflecting the impact of changes in Citi’s economic outlook on estimated lifetime losses under the new Current Expected Credit Loss standard (CECL). Earnings per share of $1.05 decreased 44% from the prior-year period, as the decline in net income was partially offset by a 10% reduction in average diluted shares outstanding.
Percentage comparisons throughout this press release are calculated for the first quarter 2020 versus the first quarter 2019, unless otherwise specified. |
|
Michael Corbat, Citi CEO, said, “Our earnings for the first quarter were significantly impacted by the COVID-19 pandemic. We managed our expenses with discipline and had good revenue performance as the economic shocks caused by the pandemic weren’t felt until late in the quarter. However, the deteriorating economic outlook and the transition to the new Current Expected Credit Loss standard (CECL) caused us to build significant loan loss reserves. “COVID-19 is a public health crisis with severe economic ramifi-cations. All of the work we have done in recent years has put us in a very strong position from a capital, liquidity and balance sheet pers-pective. While no one knows the severity or longevity of the virus’ impact on the global economy, we have the resources we need to serve our clients without jeopard-izing our safety and soundness. “I want to thank our 200,000 people around the world who have had to work differently but have brought their same dedication and pride to their jobs each and every day. They have supported our clients, our communities and each other and I could not be prouder of them,” Mr. Corbat concluded.
|
1
Citigroup |
|
1Q'20 |
|
|
4Q'19 |
|
1Q'19 |
|
QoQ% |
|
YoY% |
||
Global Consumer Banking |
|
|
8,174 |
|
|
8,459 |
|
|
8,090 |
|
(3)% |
|
1% |
Institutional Clients Group |
|
|
12,484 |
|
|
9,377 |
|
|
10,018 |
|
33% |
|
25% |
Corporate / Other |
|
|
73 |
|
|
542 |
|
|
468 |
|
(87)% |
|
(84)% |
Total Revenues |
|
$ |
20,731 |
|
$ |
18,378 |
|
$ |
18,576 |
|
13% |
|
12% |
|
|
|
|
|
|
|
|
|
|
|
|
|
|
Expenses |
|
$ |
10,594 |
|
$ |
10,454 |
|
$ |
10,584 |
|
1% |
|
- |
|
|
|
|
|
|
|
|
|
|
|
|
|
|
Net Credit Losses |
|
|
2,108 |
|
|
1,944 |
|
|
1,948 |
|
8% |
|
8% |
Credit Reserve Build / (Release)(a) |
|
|
4,893 |
|
|
253 |
|
|
20 |
|
NM |
|
NM |
Other Provisions(b) |
|
|
26 |
|
|
25 |
|
|
12 |
|
4% |
|
NM |
Total Cost of Credit |
|
$ |
7,027 |
|
$ |
2,222 |
|
$ |
1,980 |
|
NM |
|
NM |
|
|
|
|
|
|
|
|
|
|
|
|
|
|
Income from Continuing Operations Before Taxes |
|
$ |
3,110 |
|
$ |
5,702 |
|
$ |
6,012 |
|
(45)% |
|
(48)% |
Provision for Income Taxes |
|
|
576 |
|
|
703 |
|
|
1,275 |
|
(18)% |
|
(55)% |
Income from Continuing Operations |
|
$ |
2,534 |
|
$ |
4,999 |
|
$ |
4,737 |
|
(49)% |
|
(47)% |
Net Income (Loss) from Discontinued Operations |
|
|
(18) |
|
|
(4) |
|
|
(2) |
|
NM |
|
NM |
Non-Controlling Interest |
|
|
(6) |
|
|
16 |
|
|
25 |
|
NM |
|
NM |
Citigroup Net Income |
|
$ |
2,522 |
|
$ |
4,979 |
|
$ |
4,710 |
|
(49)% |
|
(46)% |
|
|
|
|
|
|
|
|
|
|
|
|
|
|
Revenues |
|
|
|
|
|
|
|
|
|
|
|
|
|
North America |
|
|
10,171 |
|
|
8,567 |
|
|
8,269 |
|
19% |
|
23% |
EMEA |
|
|
3,470 |
|
|
2,738 |
|
|
3,170 |
|
27% |
|
9% |
Latin America |
|
|
2,617 |
|
|
2,674 |
|
|
2,540 |
|
(2)% |
|
3% |
Asia |
|
|
4,400 |
|
|
3,857 |
|
|
4,129 |
|
14% |
|
7% |
Corporate / Other |
|
|
73 |
|
|
542 |
|
|
468 |
|
(87)% |
|
(84)% |
|
|
|
|
|
|
|
|
|
|
|
|
|
|
EOP Assets ($B) |
|
|
2,220 |
|
|
1,951 |
|
|
1,958 |
|
14% |
|
13% |
EOP Loans ($B) |
|
|
721 |
|
|
699 |
|
|
682 |
|
3% |
|
6% |
EOP Deposits ($B) |
|
|
1,185 |
|
|
1,071 |
|
|
1,030 |
|
11% |
|
15% |
|
|
|
|
|
|
|
|
|
|
|
|
|
|
Common Equity Tier 1 Capital Ratio(3) |
|
|
11.2% |
|
|
11.8% |
|
|
11.9% |
|
|
|
|
Supplementary Leverage Ratio(3) |
|
|
6.0% |
|
|
6.2% |
|
|
6.4% |
|
|
|
|
Return on Average Common Equity |
|
|
5.2% |
|
|
10.6% |
|
|
10.2% |
|
|
|
|
Book Value per Share |
|
$ |
83.75 |
|
$ |
82.90 |
|
$ |
77.09 |
|
1% |
|
9% |
Tangible Book Value per Share |
|
$ |
71.52 |
|
$ |
70.39 |
|
$ |
65.55 |
|
2% |
|
9% |
|
|
|
|
|
|
|
|
|
|
|
|
|
|
Note: Please refer to the Appendices and Footnotes at the end of this press release for additional information.
(a) Includes provision for unfunded lending commitments.
(b) Includes provisions for benefits and claims, HTM debt securities and other assets.
Citigroup
Citigroup revenues of $20.7 billion in the first quarter 2020 increased 12%, primarily reflecting the higher revenues in Fixed Income and Equity Markets, as well as the benefit of mark-to-market gains on loan hedges in Corporate Lending.
Citigroup operating expenses of $10.6 billion in the first quarter 2020 were largely unchanged, as continued investments in the franchise, higher compensation and volume-related expenses were offset by productivity savings and the wind-down of legacy assets.
Citigroup cost of credit of $7.0 billion in the first quarter 2020 compared to $2.0 billion in the prior-year period, reflecting the loan loss reserve builds related to the impact of changes in Citi’s economic outlook on estimated lifetime losses under the CECL standard.
Citigroup net income of $2.5 billion in the first quarter 2020 declined 46%, driven by the higher cost of credit, partially offset by the higher revenues and a lower effective tax rate. Citigroup’s effective tax rate was 19% in the current quarter compared to 21% in the first quarter 2019, reflecting a small benefit associated with stock-based incentive compensation.
2
Citigroup’s allowance for loan losses was $20.8 billion at quarter end, or 2.91% of total loans, compared to $12.3 billion, or 1.82% of total loans, at the end of the prior-year period. Total non-accrual assets grew 12% from the prior-year period to $4.2 billion. Consumer non-accrual loans declined 13% to $1.7 billion and corporate non-accrual loans grew 43% to $2.5 billion.
Citigroup’s end-of-period loans were $721 billion as of quarter end, up 6% from the prior-year period. Excluding the impact of foreign exchange translation7, end-of-period loans grew 8%, driven by 9% aggregate growth in ICG and Global Consumer Banking (GCB), partially offset by the continued wind-down of legacy assets in Corporate / Other.
Citigroup’s end-of-period deposits were $1.2 trillion as of quarter end, an increase of 15% from the prior-year period. In constant dollars, Citigroup’s end-of-period deposits increased 17%, driven by 8% growth in GCB and 21% growth in ICG.
Citigroup’s book value per share of $83.75 and tangible book value per share of $71.52 each increased 9% versus the prior-year period, driven by the net income and the reduced share count. At quarter end, Citigroup’s CET1 Capital ratio was 11.2%, down from the prior quarter, primarily driven by growth in risk-weighted assets. Citigroup’s SLR for the first quarter 2020 was 6.0%, a decrease from the prior quarter. During the quarter, Citigroup repurchased 41 million common shares and returned a total of $4.0 billion to common shareholders in the form of common share repurchases and dividends.
Global Consumer Banking |
|
1Q'20 |
|
4Q'19 |
|
1Q'19 |
|
QoQ% |
|
YoY% |
|||
North America |
|
|
5,224 |
|
|
5,253 |
|
|
5,000 |
|
(1)% |
|
4% |
Latin America |
|
|
1,199 |
|
|
1,377 |
|
|
1,272 |
|
(13)% |
|
(6)% |
Asia(a) |
|
|
1,751 |
|
|
1,829 |
|
|
1,818 |
|
(4)% |
|
(4)% |
Total Revenues |
|
$ |
8,174 |
|
$ |
8,459 |
|
$ |
8,090 |
|
(3)% |
|
1% |
|
|
|
|
|
|
|
|
|
|
|
|
|
|
Expenses |
|
$ |
4,368 |
|
$ |
4,373 |
|
$ |
4,416 |
|
- |
|
(1)% |
|
|
|
|
|
|
|
|
|
|
|
|
|
|
Net Credit Losses |
|
|
1,983 |
|
|
1,842 |
|
|
1,868 |
|
8% |
|
6% |
Credit Reserve Build / (Release)(b) |
|
|
2,828 |
|
|
122 |
|
|
93 |
|
NM |
|
NM |
Other Provisions(c) |
|
|
20 |
|
|
25 |
|
|
12 |
|
(20)% |
|
67% |
Total Cost of Credit |
|
$ |
4,831 |
|
$ |
1,989 |
|
$ |
1,973 |
|
NM |
|
NM |
|
|
|
|
|
|
|
|
|
|
|
|
|
|
Net Income (Loss) |
|
$ |
(754) |
|
$ |
1,575 |
|
$ |
1,320 |
|
NM |
|
NM |
|
|
|
|
|
|
|
|
|
|
|
|
|
|
Retail Banking |
|
|
3,046 |
|
|
3,124 |
|
|
3,106 |
|
(2)% |
|
(2)% |
Cards |
|
|
5,128 |
|
|
5,335 |
|
|
4,984 |
|
(4)% |
|
3% |
Total Revenues |
|
$ |
8,174 |
|
$ |
8,459 |
|
$ |
8,090 |
|
(3)% |
|
1% |
|
|
|
|
|
|
|
|
|
|
|
|
|
|
Key Indicators ($B) |
|
|
|
|
|
|
|
|
|
|
|
|
|
Retail Banking Average Loans |
|
|
123 |
|
|
123 |
|
|
118 |
|
- |
|
4% |
Retail Banking Average Deposits |
|
|
290 |
|
|
283 |
|
|
272 |
|
3% |
|
7% |
Investment AUMs |
|
|
145 |
|
|
175 |
|
|
160 |
|
(17)% |
|
(10)% |
Cards Average Loans |
|
|
167 |
|
|
168 |
|
|
163 |
|
- |
|
3% |
Cards Purchase Sales |
|
|
128 |
|
|
152 |
|
|
128 |
|
(16)% |
|
- |
Note: Please refer to the Appendices and Footnotes at the end of this press release for additional information.
(a) Asia GCB includes the results of operations of GCB activities in certain EMEA countries for all periods presented.
(b) Includes provision for unfunded lending commitments.
(c) Includes provisions for benefits and claims, HTM debt securities and other assets.
3
Global Consumer Banking
GCB revenues of $8.2 billion increased 1% on a reported basis and 2% in constant dollars, as growth in North America GCB was partially offset by lower revenues in Asia GCB, reflecting the early impact of the COVID-19 pandemic on customer behavior.
North America GCB revenues of $5.2 billion increased 4%. Citi-Branded Cards revenues of $2.3 billion increased 7%, reflecting volume growth as well as spread expansion. Retail Banking revenues of $1.1 billion were largely unchanged, as deposit growth and higher mortgage revenues were offset by lower deposit spreads. Citi Retail Services revenues of $1.7 billion increased 4%, reflecting a reduction in partner payments and higher average loans.
Latin America GCB revenues of $1.2 billion declined 6% on a reported basis and were largely unchanged in constant dollars. Excluding the impact of a residual gain in the prior-year period on the sale of an asset management business, revenues increased 3% in constant dollars, driven by deposit growth and improved spreads in cards.
Asia GCB revenues of $1.8 billion declined 4% on a reported basis and 1% in constant dollars as growth in investment and FX revenues was more than offset by lower revenues in cards, reflecting lower sales volumes due to COVID-19.
GCB operating expenses of $4.4 billion decreased 1% versus the prior year. In constant dollars, expenses were largely unchanged, as efficiency savings were offset by continued investments in the franchise and volume-driven growth.
GCB cost of credit of $4.8 billion increased significantly on a reported basis and in constant dollars. The increase reflects larger loan loss reserve builds related to the impact of changes in Citi’s economic outlook on estimated lifetime losses under the CECL standard.
GCB net loss of $(0.8) billion compared to income of $1.3 billion in the prior-year period, in reported and constant dollars, driven by the higher cost of credit, partially offset by the higher revenues and the lower expenses.
4
Institutional Clients Group |
|
1Q'20 |
|
4Q'19 |
|
1Q'19 |
|
QoQ% |
|
YoY% |
|||
Treasury & Trade Solutions |
|
|
2,423 |
|
|
2,608 |
|
|
2,539 |
|
(7)% |
|
(5)% |
Investment Banking |
|
|
1,350 |
|
|
1,351 |
|
|
1,354 |
|
- |
|
- |
Private Bank(a) |
|
|
949 |
|
|
847 |
|
|
880 |
|
12% |
|
8% |
Corporate Lending(a) |
|
|
448 |
|
|
732 |
|
|
749 |
|
(39)% |
|
(40)% |
Total Banking |
|
|
5,170 |
|
|
5,538 |
|
|
5,522 |
|
(7)% |
|
(6)% |
Fixed Income Markets |
|
|
4,790 |
|
|
2,898 |
|
|
3,452 |
|
65% |
|
39% |
Equity Markets |
|
|
1,169 |
|
|
516 |
|
|
842 |
|
NM |
|
39% |
Securities Services |
|
|
645 |
|
|
647 |
|
|
638 |
|
- |
|
1% |
Other |
|
|
(106) |
|
|
(129) |
|
|
(205) |
|
18% |
|
48% |
Total Markets & Securities Services |
|
|
6,498 |
|
|
3,932 |
|
|
4,727 |
|
65% |
|
37% |
Product Revenues(a) |
|
$ |
11,668 |
|
$ |
9,470 |
|
$ |
10,249 |
|
23% |
|
14% |
Gain / (Loss) on Loan Hedges |
|
|
816 |
|
|
(93) |
|
|
(231) |
|
NM |
|
NM |
Total Revenues |
|
$ |
12,484 |
|
$ |
9,377 |
|
$ |
10,018 |
|
33% |
|
25% |
|
|
|
|
|
|
|
|
|
|
|
|
|
|
Expenses |
|
$ |
5,810 |
|
$ |
5,446 |
|
$ |
5,619 |
|
7% |
|
3% |
|
|
|
|
|
|
|
|
|
|
|
|
|
|
Net Credit Losses |
|
|
127 |
|
|
115 |
|
|
78 |
|
10% |
|
63% |
Credit Reserve Build / (Release)(b) |
|
|
1,869 |
|
|
131 |
|
|
(46) |
|
NM |
|
NM |
Other Provisions(c) |
|
|
8 |
|
|
- |
|
|
- |
|
NM |
|
NM |
Total Cost of Credit |
|
$ |
2,004 |
|
$ |
246 |
|
$ |
32 |
|
NM |
|
NM |
|
|
|
|
|
|
|
|
|
|
|
|
|
|
Net Income |
|
$ |
3,627 |
|
$ |
2,867 |
|
$ |
3,401 |
|
27% |
|
7% |
|
|
|
|
|
|
|
|
|
|
|
|
|
|
Revenues |
|
|
|
|
|
|
|
|
|
|
|
|
|
North America |
|
|
4,947 |
|
|
3,314 |
|
|
3,269 |
|
49% |
|
51% |
EMEA |
|
|
3,470 |
|
|
2,738 |
|
|
3,170 |
|
27% |
|
9% |
Latin America |
|
|
1,418 |
|
|
1,297 |
|
|
1,268 |
|
9% |
|
12% |
Asia |
|
|
2,649 |
|
|
2,028 |
|
|
2,311 |
|
31% |
|
15% |
Note: Please refer to the Appendices and Footnotes at the end of this press release for additional information.
(a) Excludes gain / (loss) on credit derivatives as well as the mark-to-market on loans at fair value. For additional information, please refer to Footnote 8.
(b) Includes provision for unfunded lending commitments.
(c) Includes provisions for benefits and claims, HTM debt securities and other assets.
Institutional Clients Group
ICG revenues of $12.5 billion increased 25%, as strong performance in Fixed Income and Equity Markets, and mark-to-market gains on loan hedges, were partially offset by lower revenues in Corporate Lending and Treasury and Trade Solutions.
Banking revenues of $6.0 billion increased 13% versus the prior year (including gain / (loss) on loan hedges)8. Treasury and Trade Solutions revenues of $2.4 billion declined 5% on a reported basis and 2% in constant dollars, as strong client engagement and growth in deposits were more than offset by the impact of lower rates. Investment Banking revenues of $1.4 billion were largely unchanged, as growth in advisory and equity underwriting were offset by a decline in debt underwriting. Advisory revenues increased 2% to $386 million, equity underwriting revenues increased 5% to $180 million and debt underwriting revenues declined 2% to $784 million. Private Bank revenues of $949 million increased 8% (excluding gain / (loss) on loan hedges), driven by higher lending and deposit volumes, as well as increased capital markets activity partially offset by lower deposit spreads. Corporate Lending revenues of $448 million declined 40% (excluding gain / (loss) on loan hedges), primarily reflecting an adjustment to the residual value of a lease financing, as well as other marks on the portfolio.
Markets and Securities Services revenues of $6.5 billion increased 37%. Fixed Income Markets revenues of $4.8 billion increased 39%, reflecting strength in rates and currencies and commodities. Equity Markets revenues of $1.2 billion increased 39%, with strong performance in derivatives, including an increase in client activity, due to higher volatility. Securities Services revenues of $645 million increased 1% on a reported basis and 5% in constant dollars, reflecting higher client activity and deposit volumes partially offset by lower spreads.
5
ICG net income of $3.6 billion increased 7%, as the revenue growth was partially offset by higher cost of credit and expenses. ICG operating expenses increased 3% to $5.8 billion, as efficiency savings were more than offset by higher compensation costs, continued investments, and volume-driven growth. ICG cost of credit included net credit losses of $127 million, compared to $78 million in the prior-year period, and a net loan loss reserve build of $1.9 billion compared to a release of $46 million in the prior-year period, reflecting loan loss reserve builds related to the impact of changes in Citi’s economic outlook on estimated lifetime losses under the CECL standard.
Corporate / Other |
|
1Q'20 |
|
4Q'19 |
|
1Q'19 |
|
QoQ% |
|
YoY% |
|||
Revenues |
|
$ |
73 |
|
$ |
542 |
|
$ |
468 |
|
(87)% |
|
(84)% |
|
|
|
|
|
|
|
|
|
|
|
|
|
|
Expenses |
|
$ |
416 |
|
$ |
635 |
|
$ |
549 |
|
(34)% |
|
(24)% |
|
|
|
|
|
|
|
|
|
|
|
|
|
|
Net Credit Losses |
|
|
(2) |
|
|
(13) |
|
|
2 |
|
85% |
|
NM |
Credit Reserve Build / (Release)(a) |
|
|
196 |
|
|
- |
|
|
(27) |
|
NM |
|
NM |
Other Provisions(b) |
|
|
(2) |
|
|
- |
|
|
- |
|
NM |
|
NM |
Total Cost of Credit |
|
$ |
192 |
|
$ |
(13) |
|
$ |
(25) |
|
NM |
|
NM |
|
|
|
|
|
|
|
|
|
|
|
|
|
|
Income (Loss) from Continuing Operations before Taxes |
|
$ |
(535) |
|
$ |
(80) |
|
$ |
(56) |
|
NM |
|
NM |
|
|
|
|
|
|
|
|
|
|
|
|
|
|
Income Taxes (Benefits) |
|
|
(198) |
|
|
(623) |
|
|
(61) |
|
68% |
|
NM |
|
|
|
|
|
|
|
|
|
|
|
|
|
|
Net Income |
|
$ |
(351) |
|
$ |
537 |
|
$ |
(11) |
|
NM |
|
NM |
(a) Includes provision for unfunded lending commitments.
(b) Includes provisions for benefits and claims, HTM debt securities and other assets.
Corporate / Other
Corporate / Other revenues of $73 million declined 84%, reflecting the wind-down of legacy assets, the impact of lower rates and marks on legacy securities.
Corporate / Other expenses of $416 million declined 24%, driven by the wind-down of legacy assets, partially offset by higher infrastructure costs as well as incremental costs associated with COVID-19, including special compensation awarded to 75,000 employees most directly impacted by the pandemic.
Corporate / Other loss from continuing operations before taxes of $(535) million compared to $(56) million in the prior-year period driven by higher cost of credit, reflecting loan loss reserves on Citi’s residual legacy portfolio under the CECL standard, and the lower revenues, partially offset by the decrease in expenses.
6
Citigroup will host a conference call today at 10:00 AM (ET). A live webcast of the presentation, as well as financial results and presentation materials, will be available at https://www.citigroup.com/citi/investor. Dial-in numbers for the conference call are as follows: (866) 516-9582 in the U.S. and Canada; (973) 409-9210 outside of the U.S. and Canada. The conference code for both numbers is 3653669.
Additional financial, statistical and business-related information, as well as business and segment trends, is included in a Quarterly Financial Data Supplement. Both this earnings release and Citigroup’s First Quarter 2020 Quarterly Financial Data Supplement are available on Citigroup’s website at www.citigroup.com.
Citigroup, the leading global bank, has approximately 200 million customer accounts and does business in more than 160 countries and jurisdictions. Citigroup provides consumers, corporations, governments and institutions with a broad range of financial products and services, including consumer banking and credit, corporate and investment banking, securities brokerage, transaction services, and wealth management.
Additional information may be found at www.citigroup.com | Twitter: @Citi | YouTube: www.youtube.com/citi | Blog: http://blog.citigroup.com | Facebook: www.facebook.com/citi | LinkedIn: www.linkedin.com/company/citi
Certain statements in this release are “forward-looking statements” within the meaning of the rules and regulations of the U.S. Securities and Exchange Commission (SEC). These statements are based on management’s current expectations and are subject to uncertainty and changes in circumstances. These statements are not guarantees of future results or occurrences. Actual results and capital and other financial condition may differ materially from those included in these statements due to a variety of factors. These factors include, among others, macroeconomic and other challenges and uncertainties resulting from the COVID-19 pandemic, such as the extent and duration of the impact on public health, the U.S. and global economies, financial markets and consumer and corporate customers and clients, including economic activity, employment levels and market liquidity, as well as the various actions taken in response to the challenges and uncertainties by governments, central banks and others, including Citi, and the precautionary statements included in this release. These factors also consist of those contained in Citigroup’s filings with the SEC, including without limitation the “Risk Factors” section of Citigroup’s 2019 Form 10- K. Any forward-looking statements made by or on behalf of Citigroup speak only as to the date they are made, and Citi does not undertake to update forward-looking statements to reflect the impact of circumstances or events that arise after the date the forward-looking statements were made.
Contacts: |
|
|
|
|
Press: Jennifer Lowney |
(212) 793-3141 |
Investors: |
Elizabeth Lynn |
(212) 559-2718 |
|
|
Fixed Income Investors: |
Thomas Rogers |
(212) 559-5091 |
7
Appendix A
Citigroup |
|
1Q'20 |
|
Net Income |
|
$ |
2,522 |
Less: Preferred Dividends |
|
|
291 |
Net Income to Common Shareholders |
|
$ |
2,231 |
|
|
|
|
Common Share Repurchases |
|
|
2,925 |
Common Dividends |
|
|
1,081 |
Total Capital Returned to Common Shareholders |
|
$ |
4,006 |
|
|
|
|
Payout Ratio |
|
|
180% |
|
|
|
|
Average TCE |
|
$ |
148,852 |
|
|
|
|
RoTCE |
|
|
6.0% |
8
Appendix B
Citigroup |
|
1Q'20 |
|
1Q'19 |
||
Reported EOP Loans |
|
$ |
721 |
|
$ |
682 |
Impact of FX Translation |
|
|
- |
|
|
(15) |
EOP Loans in Constant Dollars |
|
$ |
721 |
|
$ |
668 |
|
|
|
|
|
|
|
Reported EOP Deposits |
|
$ |
1,185 |
|
$ |
1,030 |
Impact of FX Translation |
|
|
- |
|
|
(21) |
EOP Deposits in Constant Dollars |
|
$ |
1,185 |
|
$ |
1,009 |
Note: Totals may not sum due to rounding. |
|
|
|
|
|
|
|
|
|
|
|
|
|
Global Consumer Banking |
|
1Q'20 |
|
1Q'19 |
||
Reported Revenues |
|
$ |
8,174 |
|
$ |
8,090 |
Impact of FX Translation |
|
|
- |
|
|
(115) |
Revenues in Constant Dollars |
|
$ |
8,174 |
|
$ |
7,975 |
|
|
|
|
|
|
|
Reported Expenses |
|
$ |
4,368 |
|
$ |
4,416 |
Impact of FX Translation |
|
|
- |
|
|
(66) |
Expenses in Constant Dollars |
|
$ |
4,368 |
|
$ |
4,350 |
|
|
|
|
|
|
|
Reported Cost of Credit |
|
$ |
4,831 |
|
$ |
1,973 |
Impact of FX Translation |
|
|
- |
|
|
(26) |
Cost of Credit in Constant Dollars |
|
$ |
4,831 |
|
$ |
1,947 |
|
|
|
|
|
|
|
Reported Net Income |
|
$ |
(754) |
|
$ |
1,320 |
Impact of FX Translation |
|
|
- |
|
|
(15) |
Net Income in Constant Dollars |
|
$ |
(754) |
|
$ |
1,305 |
Note: Totals may not sum due to rounding. |
|
|
|
|
|
|
|
|
|
|
|
|
|
Latin America Consumer Banking |
|
1Q'20 |
|
1Q'19 |
||
Reported Revenues |
|
$ |
1,199 |
|
$ |
1,272 |
Impact of FX Translation |
|
|
- |
|
|
(74) |
Revenues in Constant Dollars |
|
$ |
1,199 |
|
$ |
1,198 |
Note: Totals may not sum due to rounding. |
|
|
|
|
|
|
|
|
|
|
|
|
|
Asia Consumer Banking(1) |
|
1Q'20 |
|
1Q'19 |
||
Reported Revenues |
|
$ |
1,751 |
|
$ |
1,818 |
Impact of FX Translation |
|
|
- |
|
|
(41) |
Revenues in Constant Dollars |
|
$ |
1,751 |
|
$ |
1,777 |
Note: Totals may not sum due to rounding. |
|
|
|
|
|
|
(1) Asia GCB includes the results of operations in EMEA GCB for all periods presented. |
|
|
|
|
|
|
|
|
|
|
|
|
|
Treasury and Trade Solutions |
|
1Q'20 |
|
1Q'19 |
||
Reported Revenues |
|
$ |
2,423 |
|
$ |
2,539 |
Impact of FX Translation |
|
|
- |
|
|
(67) |
Revenues in Constant Dollars |
|
$ |
2,423 |
|
$ |
2,472 |
Note: Totals may not sum due to rounding. |
|
|
|
|
|
|
|
|
|
|
|
|
|
Securities Services |
|
1Q'20 |
|
1Q'19 |
||
Reported Revenues |
|
$ |
645 |
|
$ |
638 |
Impact of FX Translation |
|
|
- |
|
|
(22) |
Revenues in Constant Dollars |
|
$ |
645 |
|
$ |
616 |
Note: Totals may not sum due to rounding.
9
Appendix C
($ in millions) |
|
1Q'20(1) |
|
4Q'19 |
|
1Q'19 |
|||
|
|
|
|
|
|
|
|
|
|
|
|
|
|
|
|
|
|
|
|
Citigroup Common Stockholders' Equity(2) |
|
$ |
174,503 |
|
$ |
175,414 |
|
$ |
178,427 |
Add: Qualifying noncontrolling interests |
|
|
138 |
|
|
154 |
|
|
144 |
Regulatory Capital Adjustments and Deductions: |
|
|
|
|
|
|
|
|
|
Add: CECL transition and 25% provision deferral(3) |
|
|
4,316 |
|
|
- |
|
|
- |
Less: |
|
|
|
|
|
|
|
|
|
Accumulated net unrealized gains (losses) on cash flow hedges, net of tax(4) |
|
|
2,020 |
|
|
123 |
|
|
(442) |
Cumulative unrealized net gain (loss) related to changes in fair value of financial |
|
|
2,838 |
|
|
(679) |
|
|
(67) |
Intangible Assets: |
|
|
|
|
|
|
|
|
|
Goodwill, net of related deferred tax liabilities (DTLs)(6) |
|
|
20,123 |
|
|
21,066 |
|
|
21,768 |
Identifiable intangible assets other than mortgage servicing rights (MSRs), |
|
|
3,953 |
|
|
4,087 |
|
|
4,390 |
Defined benefit pension plan net assets |
|
|
1,052 |
|
|
803 |
|
|
811 |
Deferred tax assets (DTAs) arising from net operating loss, foreign tax credit |
|
|
12,259 |
|
|
12,370 |
|
|
11,756 |
|
|
|
|
|
|
|
|
|
|
Common Equity Tier 1 Capital (CET1)(3) |
|
$ |
136,712 |
|
$ |
137,798 |
|
$ |
140,355 |
|
|
|
|
|
|
|
|
|
|
Risk-Weighted Assets (RWA)(3)(7) |
|
$ |
1,224,218 |
|
$ |
1,166,523 |
|
$ |
1,178,628 |
|
|
|
|
|
|
|
|
|
|
Common Equity Tier 1 Capital Ratio (CET1 / RWA) |
|
|
11.2% |
|
|
11.8% |
|
|
11.9% |
Note: Citi’s reportable CET1 Capital ratios were derived under the U.S. Basel III Advanced Approaches framework as of March 31, 2020, and the U.S. Basel III Standardized Approach framework for all prior periods presented. This reflects the lower of the CET1 Capital ratios under both the Standardized Approach and the Advanced Approaches under the Collins Amendment.
(1) |
Preliminary. |
(2) |
Excludes issuance costs related to outstanding preferred stock in accordance with Federal Reserve Board regulatory reporting requirements. |
(3) |
Please refer to Footnote 3 at the end of this press release for additional information. |
(4) |
Common Equity Tier 1 Capital is adjusted for accumulated net unrealized gains (losses) on cash flow hedges included in accumulated other comprehensive income that relate to the hedging of items not recognized at fair value on the balance sheet. |
(5) |
The cumulative impact of changes in Citigroup’s own creditworthiness in valuing liabilities for which the fair value option has been elected, and own-credit valuation adjustments on derivatives, are excluded from Common Equity Tier 1 Capital, in accordance with the U.S. Basel III rules. |
(6) |
Includes goodwill “embedded” in the valuation of significant common stock investments in unconsolidated financial institutions. |
(7) |
RWA excludes assets acquired pursuant to a non-recourse loan provided under the Money Market Mutual Fund Liquidity Facility, as permitted by the US banking agencies’ March 2020 interim final rule. |
Appendix D
($ in millions) |
|
1Q'20(1) |
|
4Q'19 |
|
1Q'19 |
|||
|
|
|
|
|
|
|
|
|
|
Common Equity Tier 1 Capital (CET1)(2) |
|
$ |
136,712 |
|
$ |
137,798 |
|
$ |
140,355 |
|
|
|
|
|
|
|
|
|
|
Additional Tier 1 Capital (AT1)(3) |
|
|
17,600 |
|
|
18,007 |
|
|
18,002 |
|
|
|
|
|
|
|
|
|
|
Total Tier 1 Capital (T1C) (CET1 + AT1) |
|
$ |
154,312 |
|
$ |
155,805 |
|
$ |
158,357 |
|
|
|
|
|
|
|
|
|
|
Total Leverage Exposure (TLE)(2)(4) |
|
$ |
2,586,513 |
|
$ |
2,507,891 |
|
$ |
2,463,603 |
|
|
|
|
|
|
|
|
|
|
Supplementary Leverage Ratio (T1C / TLE) |
|
|
6.0% |
|
|
6.2% |
|
|
6.4% |
(1) Preliminary.
(2) Please refer to Footnote 3 at the end of this press release for additional information.
(3) Additional Tier 1 Capital primarily includes qualifying noncumulative perpetual preferred stock and qualifying trust preferred securities.
(4) TLE excludes assets acquired pursuant to a non-recourse loan provided under the Money Market Mutual Fund Liquidity Facility, as permitted by the US banking agencies’ March 2020 interim final rule.
Appendix E
($ and shares in millions, except per share amounts) |
|
1Q'20(1) |
|
4Q'19 |
|
1Q'19 |
|||
|
|
|
|
|
|
|
|
|
|
Common Stockholders' Equity |
|
$ |
174,351 |
|
$ |
175,262 |
|
$ |
178,272 |
Less: |
|
|
|
|
|
|
|
|
|
Goodwill |
|
|
21,264 |
|
|
22,126 |
|
|
22,037 |
Intangible Assets (other than MSRs) |
|
|
4,193 |
|
|
4,327 |
|
|
4,645 |
Tangible Common Equity (TCE) |
|
$ |
148,894 |
|
$ |
148,809 |
|
$ |
151,590 |
|
|
|
|
|
|
|
|
|
|
Common Shares Outstanding (CSO) |
|
|
2,082 |
|
|
2,114 |
|
|
2,313 |
|
|
|
|
|
|
|
|
|
|
Tangible Book Value Per Share (TCE / CSO) |
|
$ |
71.52 |
|
$ |
70.39 |
|
$ |
65.55 |
(1) Preliminary.
10
1 Citigroup’s total expenses divided by total revenues.
2 Preliminary. Citigroup’s return on average tangible common equity (RoTCE) is a non-GAAP financial measure. RoTCE represents annualized net income available to common shareholders as a percentage of average tangible common equity (TCE). For the components of the calculation, see Appendix A.
3 Ratios as of March 31, 2020 are preliminary. Commencing January 1, 2020, Citigroup’s Common Equity Tier 1 (CET1) Capital ratio and Supplementary Leverage Ratio (SLR) reflect certain deferrals based on the modified regulatory capital transition provision related to the Current Expected Credit Loss (CECL) methodology. Excluding the deferrals based on the modified CECL transition provision, Citigroup’s CET1 Capital ratio and SLR as of March 31, 2020 would be 10.8% and 5.8%, respectively, on a fully reflected basis.
Citigroup has elected to apply the modified transition provision related to the impact of the CECL accounting standard on regulatory capital, as provided by the US banking agencies’ March 2020 interim final rule. Under the modified CECL transition provision, the allowance for credit losses (after-tax) upon the January 1, 2020 CECL adoption date has been deferred and will phase in to regulatory capital at 25% per year commencing January 1, 2022. For the ongoing impact of CECL, Citigroup is allowed to adjust the allowance for credit losses in an amount equal to 25% of the change in the allowance for credit losses (pre-tax) recognized through earnings for each period between January 1, 2020 and December 31, 2021. The cumulative adjustments to the allowance for credit losses between January 1, 2020 and December 31, 2021 will also phase in to regulatory capital at 25% per year commencing January 1, 2022, along with the deferred impacts related to the January 1, 2020 CECL adoption date. The corresponding adjustments on average on-balance sheet assets are also reflected in Total Leverage Exposure. Additionally, the increase in deferred tax assets (DTA) arising from temporary differences upon the January 1, 2020 adoption date has been deducted from risk-weighted assets (RWA) and will phase in to RWA at 25% per year commencing January 1, 2022.
For the composition of Citigroup’s CET1 Capital and ratio, see Appendix C. For the composition of Citigroup’s SLR, see Appendix D.
4 Citigroup’s payout ratio is the sum of common dividends and common share repurchases divided by net income available to common shareholders. For the components of the calculation, see Appendix A.
5 On March 15, 2020, Citigroup announced it had joined other major U.S. banks in suspending stock repurchases to support clients in light of the COVID-19 pandemic, in an announcement made by the Financial Services Forum. Through March 13, 2020, Citigroup had returned approximately $57.4 billion in capital over the past three Comprehensive Capital Analysis and Review (CCAR) cycles, and had been approved to return roughly $62.3 billion in capital over the three-year period. Citigroup stated there was no change to its dividend policy.
6 Citigroup’s tangible book value per share is a non-GAAP financial measure. For a reconciliation of this measure to reported results, see Appendix E.
7 Results of operations excluding the impact of foreign exchange translation (constant dollar basis) are non-GAAP financial measures. For a reconciliation of these measures to reported results, see Appendix B.
8 Credit derivatives are used to economically hedge a portion of the private bank and corporate loan portfolio that includes both accrual loans and loans at fair value. Gains / (losses) on loan hedges includes the mark-to-market on the credit derivatives and the mark-to-market on the loans in the portfolio that are at fair value. In the first quarter 2020, gains / (losses) on loan hedges included $754 million related to Corporate Lending and $62 million related to the Private Bank, compared to losses of $231 million related to Corporate Lending in the prior-year period. The fixed premium costs of these hedges are netted against the Private Bank and Corporate Lending revenues to reflect the cost of credit protection. Citigroup’s results of operations excluding the impact of gains / (losses) on loan hedges are non-GAAP financial measures.
11
Exhibit 99.2
CITIGROUP -- QUARTERLY FINANCIAL DATA SUPPLEMENT |
|
1Q20 |
|
|
|
|
|
|
|
|
|
|
|
Page |
|
Citigroup Consolidated |
|
|
|
Financial Summary |
|
1 |
|
Consolidated Statement of Income |
|
2 |
|
Consolidated Balance Sheet |
|
3 |
|
Segment Detail |
|
|
|
Net Revenues |
|
4 |
|
Income and Regional Average Assets and ROA |
|
5 |
|
|
|
|
|
Global Consumer Banking (GCB) |
|
6 |
|
Retail Banking and Cards Key Indicators |
|
7 |
|
North America |
|
8 - 10 |
|
Latin America(1) |
|
11 - 12 |
|
Asia(2) |
|
13 - 14 |
|
Institutional Clients Group (ICG) |
|
15 |
|
Revenues by Business |
|
16 |
|
|
|
|
|
Corporate / Other |
|
17 |
|
|
|
|
|
Citigroup Supplemental Detail |
|
|
|
Average Balances and Interest Rates |
|
18 |
|
Deposits |
|
19 |
|
Loans (EOP) |
|
20 |
|
Consumer Loan Delinquencies and Ratios |
|
|
|
90+ Days |
|
21 |
|
30-89 Days |
|
22 |
|
Allowance for Credit Losses on Loans and Unfunded Lending Commitments |
|
23 - 24 |
|
Components of Provision for Loan Losses |
|
25 |
|
Non-Accrual Assets |
|
26 |
|
|
|
|
|
CET1 Capital and Supplementary Leverage Ratios, Tangible Common Equity, |
|
27 |
|
Book Value Per Share and Tangible Book Value Per Share |
|
|
|
|
|
|
|
|
|
|
|
(1) |
Latin America GCB consists of Citi's consumer banking operations in Mexico. |
(2) |
Asia GCB includes the results of operations of GCB activities in certain EMEA countries for all periods presented. |
CITIGROUP -- FINANCIAL SUMMARY
(In millions of dollars, except per share amounts, and as otherwise noted)
1Q |
2Q |
3Q |
4Q |
1Q |
1Q20 Increase/ |
||||||||||||||
2019 |
2019 |
2019 |
2019 |
2020 |
4Q19 |
1Q19 |
|||||||||||||
Total Revenues, Net of Interest Expense |
$ |
18,576 |
$ |
18,758 |
$ |
18,574 |
$ |
18,378 |
$ |
20,731 |
13% |
12% |
|||||||
Total Operating Expenses |
10,584 | 10,500 | 10,464 | 10,454 | 10,594 |
1% |
- |
||||||||||||
Net Credit Losses (NCLs) |
1,948 | 1,963 | 1,913 | 1,944 | 2,108 |
8% |
8% |
||||||||||||
Credit Reserve Build / (Release) for Loans |
(4) | 126 | 149 | 179 | 4,336 |
NM |
NM |
||||||||||||
Provision / (Release) for Unfunded Lending Commitments |
24 | (15) | 9 | 74 | 557 |
NM |
NM |
||||||||||||
Provisions for Benefits and Claims, HTM Debt Securities and Other Assets |
12 | 19 | 17 | 25 | 26 |
4% |
NM |
||||||||||||
Provisions for Credit Losses and for Benefits and Claims |
$ |
1,980 |
$ |
2,093 |
$ |
2,088 |
$ |
2,222 |
$ |
7,027 |
NM |
NM |
|||||||
Income from Continuing Operations before Income Taxes |
$ |
6,012 |
$ |
6,165 |
$ |
6,022 |
$ |
5,702 |
$ |
3,110 |
(45%) |
(48%) |
|||||||
Income Taxes(1)(2) |
1,275 | 1,373 | 1,079 | 703 | 576 |
(18%) |
(55%) |
||||||||||||
Income from Continuing Operations |
$ |
4,737 |
$ |
4,792 |
$ |
4,943 |
$ |
4,999 |
$ |
2,534 |
(49%) |
(47%) |
|||||||
Income (Loss) from Discontinued Operations, net of Taxes |
(2) | 17 | (15) | (4) | (18) |
NM |
NM |
||||||||||||
Net Income before Noncontrolling Interests |
$ |
4,735 |
$ |
4,809 |
$ |
4,928 |
$ |
4,995 |
$ |
2,516 |
(50%) |
(47%) |
|||||||
Net Income (Loss) Attributable to Noncontrolling Interests |
25 | 10 | 15 | 16 | (6) |
NM |
NM |
||||||||||||
Citigroup's Net Income |
$ |
4,710 |
$ |
4,799 |
$ |
4,913 |
$ |
4,979 |
$ |
2,522 |
(49%) |
(46%) |
|||||||
Diluted Earnings Per Share: |
|||||||||||||||||||
Income from Continuing Operations |
$ |
1.87 |
$ |
1.94 |
$ |
2.08 |
$ |
2.15 |
$ |
1.06 |
(51%) |
(43%) |
|||||||
Citigroup's Net Income |
$ |
1.87 |
$ |
1.95 |
$ |
2.07 |
$ |
2.15 |
$ |
1.05 |
(51%) |
(44%) |
|||||||
Shares (in millions): |
|||||||||||||||||||
Average Basic |
2,340.4 | 2,286.1 | 2,220.8 | 2,149.4 | 2,097.9 |
(2%) |
(10%) |
||||||||||||
Average Diluted |
2,342.4 | 2,289.0 | 2,237.1 | 2,166.8 | 2,113.7 |
(2%) |
(10%) |
||||||||||||
Common Shares Outstanding, at period end |
2,312.5 | 2,259.1 | 2,183.2 | 2,114.1 | 2,081.8 |
(2%) |
(10%) |
||||||||||||
Preferred Dividends |
$ |
262 |
$ |
296 |
$ |
254 |
$ |
296 |
$ |
291 |
(2%) |
11% |
|||||||
Income Allocated to Unrestricted Common Shareholders - Basic |
|||||||||||||||||||
Income from Continuing Operations |
$ |
4,391 |
$ |
4,436 |
$ |
4,647 |
$ |
4,653 |
$ |
2,228 |
(52%) |
(49%) |
|||||||
Citigroup's Net Income |
$ |
4,389 |
$ |
4,453 |
$ |
4,632 |
$ |
4,649 |
$ |
2,210 |
(52%) |
(50%) |
|||||||
Income Allocated to Unrestricted Common Shareholders - Diluted |
|||||||||||||||||||
Income from Continuing Operations |
$ |
4,391 |
$ |
4,436 |
$ |
4,656 |
$ |
4,661 |
$ |
2,235 |
(52%) |
(49%) |
|||||||
Citigroup's Net Income |
$ |
4,389 |
$ |
4,453 |
$ |
4,641 |
$ |
4,657 |
$ |
2,217 |
(52%) |
(49%) |
|||||||
Regulatory Capital Ratios and Performance Metrics: |
|||||||||||||||||||
Common Equity Tier 1 (CET1) Capital Ratio(3)(4)(5) |
11.91 |
% |
11.89 |
% |
11.58 |
% |
11.81 |
% |
11.2 |
% |
|||||||||
Tier 1 Capital Ratio(3)(4)(5) |
13.44 |
% |
13.40 |
% |
13.20 |
% |
13.36 |
% |
12.6 |
% |
|||||||||
Total Capital Ratio(3)(4)(5) |
16.41 |
% |
16.33 |
% |
16.07 |
% |
15.97 |
% |
15.1 |
% |
|||||||||
Supplementary Leverage Ratio (SLR)(4)(5)(6) |
6.43 |
% |
6.36 |
% |
6.27 |
% |
6.21 |
% |
6.0 |
% |
|||||||||
Return on Average Assets |
0.98 |
% |
0.97 |
% |
0.97 |
% |
0.99 |
% |
0.49 |
% |
|||||||||
Return on Average Common Equity |
10.2 |
% |
10.1 |
% |
10.4 |
% |
10.6 |
% |
5.2 |
% |
|||||||||
Efficiency Ratio (Total Operating Expenses/Total Revenues, net) |
57.0 |
% |
56.0 |
% |
56.3 |
% |
56.9 |
% |
51.1 |
% |
|||||||||
Balance Sheet Data (in billions of dollars, except per share amounts)(4): |
|||||||||||||||||||
Total Assets |
$ |
1,958.4 |
$ |
1,988.2 |
$ |
2,014.8 |
$ |
1,951.2 |
$ |
2,219.8 |
14% |
13% |
|||||||
Total Average Assets |
1,939.4 | 1,979.1 | 2,000.1 | 1,996.6 | 2,079.7 |
4% |
7% |
||||||||||||
Total Deposits |
1,030.4 | 1,045.6 | 1,087.8 | 1,070.6 | 1,184.9 |
11% |
15% |
||||||||||||
Citigroup's Stockholders' Equity |
196.3 | 197.4 | 196.4 | 193.2 | 192.3 |
- |
(2%) |
||||||||||||
Book Value Per Share |
77.09 | 79.40 | 81.02 | 82.90 | 83.75 |
1% |
9% |
||||||||||||
Tangible Book Value Per Share(7) |
65.55 | 67.64 | 69.03 | 70.39 | 71.52 |
2% |
9% |
||||||||||||
Direct Staff (in thousands) |
203 | 200 | 199 | 200 | 201 |
1% |
(1%) |
(1) |
4Q19 includes discrete tax items of roughly $540 million, including an approximate $430 million benefit of a reduction in Citi’s valuation allowance related to its Deferred Tax Assets (DTAs). |
(2) |
3Q19 includes discrete tax items of roughly $230 million, including an approximate $180 million benefit of a reduction in Citi’s valuation allowance related to its DTAs. |
(3) |
Citi's reportable CET1 Capital and Tier 1 Capital ratios were derived under the U.S. Basel III Advanced Approaches framework as of March 31, 2020, and the U.S. Basel III Standardized Approach framework for all prior periods presented, whereas Citi's reportable Total Capital ratios were derived under the U.S. Basel III Advanced Approaches framework for all periods presented. The reportable ratios represent the lower of each of the three risk-based capital ratios (CET1 Capital, Tier 1 Capital and Total Capital) under both the Standardized Approach and the Advanced Approaches under the Collins Amendment. For the composition of Citi's CET1 Capital and ratio, see page 27. |
(4) |
March 31, 2020 is preliminary. |
(5) |
See footnote 4 on page 27 |
(6) |
For the composition of Citi's SLR, see page 27. |
(7) |
Tangible book value per share is a non-GAAP financial measure. For a reconciliation of this measure to reported results, see page 27. |
Note: Ratios and variance percentages are calculated based on the displayed amounts. Due to averaging and roundings, quarterly earnings per share may not sum to the YTD totals.
NM Not meaningful.
Reclassified to conform to the current period's presentation.
Page 1
CITIGROUP CONSOLIDATED STATEMENT OF INCOME
(In millions of dollars)
|
|
1Q |
|
2Q |
|
3Q |
|
4Q |
|
1Q |
|
1Q20 Increase/ |
|||||||
|
|
2019 |
|
2019 |
|
2019 |
|
2019 |
|
2020 |
|
4Q19 |
|
1Q19 |
|||||
|
|
|
|
|
|
|
|
|
|
|
|
|
|
|
|
||||
Revenues |
|
|
|
|
|
|
|
|
|
|
|
|
|
|
|
|
|
|
|
Interest revenue |
|
$ |
19,076 |
|
$ |
19,712 |
|
$ |
19,177 |
|
$ |
18,545 |
|
$ |
17,139 |
|
(8%) |
|
(10%) |
Interest expense |
|
|
7,317 |
|
|
7,762 |
|
|
7,536 |
|
|
6,548 |
|
|
5,647 |
|
(14%) |
|
(23%) |
Net interest revenue |
|
|
11,759 |
|
|
11,950 |
|
|
11,641 |
|
|
11,997 |
|
|
11,492 |
|
(4%) |
|
(2%) |
|
|
|
|
|
|
|
|
|
|
|
|
|
|
|
|
|
|
|
|
Commissions and fees |
|
|
2,926 |
|
|
2,881 |
|
|
2,906 |
|
|
3,033 |
|
|
3,021 |
|
- |
|
3% |
Principal transactions |
|
|
2,804 |
|
|
1,874 |
|
|
2,802 |
|
|
1,412 |
|
|
5,261 |
|
NM |
|
88% |
Administrative and other fiduciary fees |
|
|
839 |
|
|
869 |
|
|
880 |
|
|
823 |
|
|
854 |
|
4% |
|
2% |
Realized gains (losses) on investments |
|
|
130 |
|
|
468 |
|
|
361 |
|
|
515 |
|
|
432 |
|
(16%) |
|
NM |
Other-than-temporary impairment losses on investments and other assets |
|
|
(8) |
|
|
(5) |
|
|
(14) |
|
|
(5) |
|
|
(55) |
|
NM |
|
NM |
Other revenue |
|
|
126 |
|
|
721 |
|
|
(2) |
|
|
603 |
|
|
(274) |
|
NM |
|
NM |
Total non-interest revenues |
|
|
6,817 |
|
|
6,808 |
|
|
6,933 |
|
|
6,381 |
|
|
9,239 |
|
45% |
|
36% |
Total revenues, net of interest expense |
|
|
18,576 |
|
|
18,758 |
|
|
18,574 |
|
|
18,378 |
|
|
20,731 |
|
13% |
|
12% |
|
|
|
|
|
|
|
|
|
|
|
|
|
|
|
|
|
|
|
|
|
|
|
|
|
|
|
|
|
|
|
|
|
|
|
|
|
|
|
|
Provisions for Credit Losses and for Benefits and Claims |
|
|
|
|
|
|
|
|
|
|
|
|
|
|
|
|
|
|
|
|
|
|
|
|
|
|
|
|
|
|
|
|
|
|
|
|
|
|
|
Net credit losses |
|
|
1,948 |
|
|
1,963 |
|
|
1,913 |
|
|
1,944 |
|
|
2,108 |
|
8% |
|
8% |
Credit reserve build / (release) for loans |
|
|
(4) |
|
|
126 |
|
|
149 |
|
|
179 |
|
|
4,336 |
|
NM |
|
NM |
Provision for loan losses |
|
|
1,944 |
|
|
2,089 |
|
|
2,062 |
|
|
2,123 |
|
|
6,444 |
|
NM |
|
NM |
Provision for Held-to-maturity (HTM) debt securities |
|
|
- |
|
|
- |
|
|
- |
|
|
- |
|
|
6 |
|
NM |
|
NM |
Provision for Other assets |
|
|
- |
|
|
- |
|
|
- |
|
|
- |
|
|
(4) |
|
NM |
|
NM |
Provision for policyholder benefits and claims |
|
|
12 |
|
|
19 |
|
|
17 |
|
|
25 |
|
|
24 |
|
(4%) |
|
100% |
Provision for unfunded lending commitments |
|
|
24 |
|
|
(15) |
|
|
9 |
|
|
74 |
|
|
557 |
|
NM |
|
NM |
Total provisions for credit losses and for benefits and claims |
|
|
1,980 |
|
|
2,093 |
|
|
2,088 |
|
|
2,222 |
|
|
7,027 |
|
NM |
|
NM |
|
|
|
|
|
|
|
|
|
|
|
|
|
|
|
|
|
|
|
|
Operating Expenses |
|
|
|
|
|
|
|
|
|
|
|
|
|
|
|
|
|
|
|
Compensation and benefits |
|
|
5,658 |
|
|
5,381 |
|
|
5,329 |
|
|
5,065 |
|
|
5,654 |
|
12% |
|
- |
Premises and equipment |
|
|
564 |
|
|
569 |
|
|
580 |
|
|
615 |
|
|
565 |
|
(8%) |
|
- |
Technology / communication expense |
|
|
1,720 |
|
|
1,724 |
|
|
1,783 |
|
|
1,850 |
|
|
1,723 |
|
(7%) |
|
- |
Advertising and marketing expense |
|
|
359 |
|
|
434 |
|
|
378 |
|
|
345 |
|
|
328 |
|
(5%) |
|
(9%) |
Other operating |
|
|
2,283 |
|
|
2,392 |
|
|
2,394 |
|
|
2,579 |
|
|
2,324 |
|
(10%) |
|
2% |
Total operating expenses |
|
|
10,584 |
|
|
10,500 |
|
|
10,464 |
|
|
10,454 |
|
|
10,594 |
|
1% |
|
- |
|
|
|
|
|
|
|
|
|
|
|
|
|
|
|
|
|
|
|
|
Income from Continuing Operations before |
|
|
|
|
|
|
|
|
|
|
|
|
|
|
|
|
|
|
|
Income Taxes |
|
|
6,012 |
|
|
6,165 |
|
|
6,022 |
|
|
5,702 |
|
|
3,110 |
|
(45%) |
|
(48%) |
Provision for income taxes (1)(2) |
|
|
1,275 |
|
|
1,373 |
|
|
1,079 |
|
|
703 |
|
|
576 |
|
(18%) |
|
(55%) |
|
|
|
|
|
|
|
|
|
|
|
|
|
|
|
|
|
|
|
|
Income (Loss) from Continuing Operations |
|
|
4,737 |
|
|
4,792 |
|
|
4,943 |
|
|
4,999 |
|
|
2,534 |
|
(49%) |
|
(47%) |
Discontinued Operations |
|
|
|
|
|
|
|
|
|
|
|
|
|
|
|
|
|
|
|
Income (Loss) from Discontinued Operations |
|
|
(2) |
|
|
(10) |
|
|
(15) |
|
|
(4) |
|
|
(18) |
|
NM |
|
NM |
Provision (benefits) for income taxes |
|
|
- |
|
|
(27) |
|
|
- |
|
|
- |
|
|
- |
|
- |
|
- |
Income (Loss) from Discontinued Operations, net of taxes |
|
|
(2) |
|
|
17 |
|
|
(15) |
|
|
(4) |
|
|
(18) |
|
NM |
|
NM |
|
|
|
|
|
|
|
|
|
|
|
|
|
|
|
|
|
|
|
|
Net Income before Noncontrolling Interests |
|
|
4,735 |
|
|
4,809 |
|
|
4,928 |
|
|
4,995 |
|
|
2,516 |
|
(50%) |
|
(47%) |
|
|
|
|
|
|
|
|
|
|
|
|
|
|
|
|
|
|
|
|
Net Income (Loss) attributable to noncontrolling interests |
|
|
25 |
|
|
10 |
|
|
15 |
|
|
16 |
|
|
(6) |
|
NM |
|
NM |
Citigroup's Net Income |
|
$ |
4,710 |
|
$ |
4,799 |
|
$ |
4,913 |
|
$ |
4,979 |
|
$ |
2,522 |
|
(49%) |
|
(46%) |
(1) |
4Q19 includes discrete tax items of roughly $540 million, including an approximate $430 million benefit of a reduction in Citi’s valuation allowance related to its Deferred Tax Assets (DTAs). |
(2) |
3Q19 includes discrete tax items of roughly $230 million, including an approximate $180 million benefit of a reduction in Citi’s valuation allowance related to its DTAs. |
NM Not meaningful.
Reclassified to conform to the current period's presentation.
Page 2
CITIGROUP CONSOLIDATED BALANCE SHEET
(In millions of dollars)
|
|
|
|
|
|
|
|
|
|
|
|
|
1Q20 Increase/ |
|||||||||
|
|
March 31, |
|
June 30, |
|
September 30, |
|
December 31, |
March 31, |
|
(Decrease) from |
|||||||||||
|
|
2019 |
|
2019 |
|
2019 |
|
2019 |
|
2020 (1) |
|
4Q19 |
|
1Q19 |
||||||||
Assets |
||||||||||||||||||||||
Cash and due from banks (including segregated cash and other deposits) |
|
$ |
24,448 |
|
$ |
24,997 |
|
$ |
24,086 |
|
$ |
23,967 |
|
$ |
23,755 |
|
(1%) |
|
(3%) |
|||
Deposits with banks |
|
|
181,445 |
|
|
178,246 |
|
|
196,357 |
|
|
169,952 |
|
|
262,165 |
|
54% |
|
44% |
|||
Securities borrowed and purchased under agreements to resell |
|
|
264,495 |
|
|
259,769 |
|
|
261,125 |
|
|
251,322 |
|
|
262,536 |
|
4% |
|
(1%) |
|||
Brokerage receivables |
|
|
44,500 |
|
|
50,027 |
|
|
54,215 |
|
|
39,857 |
|
|
68,555 |
|
72% |
|
54% |
|||
Trading account assets |
|
|
286,511 |
|
|
306,831 |
|
|
306,824 |
|
|
276,140 |
|
|
365,000 |
|
32% |
|
27% |
|||
Investments |
|
|
|
|
|
|
|
|
|
|
|
|
|
|
|
|
|
|
|
|||
Available-for-sale and non-marketable equity securities |
|
|
275,132 |
|
|
273,435 |
|
|
275,425 |
|
|
280,265 |
|
|
308,219 |
|
10% |
|
12% |
|||
Held-to-maturity debt securities |
|
|
66,842 |
|
|
68,693 |
|
|
75,841 |
|
|
80,775 |
|
|
82,315 |
|
2% |
|
23% |
|||
Equity securities |
|
|
7,307 |
|
|
7,574 |
|
|
7,117 |
|
|
7,523 |
|
|
8,349 |
|
11% |
|
14% |
|||
Total investments |
|
|
349,281 |
|
|
349,702 |
|
|
358,383 |
|
|
368,563 |
|
|
398,883 |
|
8% |
|
14% |
|||
Loans, net of unearned income |
|
|
|
|
|
|
|
|
|
|
|
|
|
|
|
|
|
|
|
|||
Consumer |
|
|
290,968 |
|
|
296,505 |
|
|
297,400 |
|
|
309,548 |
|
|
288,430 |
|
(7%) |
|
(1%) |
|||
Corporate |
|
|
391,378 |
|
|
392,165 |
|
|
394,343 |
|
|
389,935 |
|
|
432,590 |
|
11% |
|
11% |
|||
Loans, net of unearned income |
|
|
682,346 |
|
|
688,670 |
|
|
691,743 |
|
|
699,483 |
|
|
721,020 |
|
3% |
|
6% |
|||
Allowance for loan losses |
|
|
(12,329) |
|
|
(12,466) |
|
|
(12,530) |
|
|
(12,783) |
|
|
(20,841) |
|
(63%) |
|
(69%) |
|||
Total loans, net |
|
|
670,017 |
|
|
676,204 |
|
|
679,213 |
|
|
686,700 |
|
|
700,179 |
|
2% |
|
5% |
|||
Goodwill |
|
|
22,037 |
|
|
22,065 |
|
|
21,822 |
|
|
22,126 |
|
|
21,264 |
|
(4%) |
|
(4%) |
|||
Intangible assets (including MSRs) |
|
|
5,196 |
|
|
5,026 |
|
|
4,844 |
|
|
4,822 |
|
|
4,560 |
|
(5%) |
|
(12%) |
|||
Other assets |
|
|
110,483 |
|
|
115,359 |
|
|
107,933 |
|
|
107,709 |
|
|
112,873 |
|
5% |
|
2% |
|||
Total assets |
|
$ |
1,958,413 |
|
$ |
1,988,226 |
|
$ |
2,014,802 |
|
$ |
1,951,158 |
|
$ |
2,219,770 |
|
14% |
|
13% |
|||
|
|
|
|
|
|
|
|
|
|
|
|
|
|
|
|
|
|
|
|
|||
Liabilities |
|
|
|
|
|
|
|
|
|
|
|
|
|
|
|
|
|
|
|
|||
Non-interest-bearing deposits in U.S. offices |
|
$ |
101,354 |
|
$ |
95,659 |
|
$ |
99,731 |
|
$ |
98,811 |
|
$ |
113,371 |
|
15% |
|
12% |
|||
Interest-bearing deposits in U.S. offices |
|
|
373,339 |
|
|
382,738 |
|
|
407,872 |
|
|
401,418 |
|
|
462,327 |
|
15% |
|
24% |
|||
Total U.S. deposits |
|
|
474,693 |
|
|
478,397 |
|
|
507,603 |
|
|
500,229 |
|
|
575,698 |
|
15% |
|
21% |
|||
Non-interest-bearing deposits in offices outside the U.S. |
|
|
80,594 |
|
|
82,750 |
|
|
82,723 |
|
|
85,692 |
|
|
85,439 |
|
- |
|
6% |
|||
Interest-bearing deposits in offices outside the U.S. |
|
|
475,068 |
|
|
484,460 |
|
|
497,443 |
|
|
484,669 |
|
|
523,774 |
|
8% |
|
10% |
|||
Total international deposits |
|
|
555,662 |
|
|
567,210 |
|
|
580,166 |
|
|
570,361 |
|
|
609,213 |
|
7% |
|
10% |
|||
|
|
|
|
|
|
|
|
|
|
|
|
|
|
|
|
|
|
|
|
|||
Total deposits |
|
|
1,030,355 |
|
|
1,045,607 |
|
|
1,087,769 |
|
|
1,070,590 |
|
|
1,184,911 |
|
11% |
|
15% |
|||
Securities loaned and sold under agreements to resell |
|
|
190,372 |
|
|
181,133 |
|
|
195,047 |
|
|
166,339 |
|
|
222,324 |
|
34% |
|
17% |
|||
Brokerage payables |
|
|
62,656 |
|
|
69,839 |
|
|
63,342 |
|
|
48,601 |
|
|
74,368 |
|
53% |
|
19% |
|||
Trading account liabilities |
|
|
136,392 |
|
|
136,294 |
|
|
135,596 |
|
|
119,894 |
|
|
163,995 |
|
37% |
|
20% |
|||
Short-term borrowings |
|
|
39,322 |
|
|
42,442 |
|
|
35,230 |
|
|
45,049 |
|
|
54,951 |
|
22% |
|
40% |
|||
Long-term debt |
|
|
243,566 |
|
|
252,189 |
|
|
242,238 |
|
|
248,760 |
|
|
266,098 |
|
7% |
|
9% |
|||
Other liabilities(2) |
|
|
58,735 |
|
|
62,612 |
|
|
58,510 |
|
|
57,979 |
|
|
60,141 |
|
4% |
|
2% |
|||
Total liabilities |
|
$ |
1,761,398 |
|
$ |
1,790,116 |
|
$ |
1,817,732 |
|
$ |
1,757,212 |
|
$ |
2,026,788 |
|
15% |
|
15% |
|||
|
|
|
|
|
|
|
|
|
|
|
|
|
|
|
|
|
|
|
|
|||
Equity |
|
|
|
|
|
|
|
|
|
|
|
|
|
|
|
|
|
|
|
|||
Stockholders' equity |
||||||||||||||||||||||
Preferred stock |
|
$ |
17,980 |
|
$ |
17,980 |
|
$ |
19,480 |
|
$ |
17,980 |
|
$ |
17,980 |
|
- |
|
- |
|||
Common stock |
|
|
31 |
|
|
31 |
|
|
31 |
|
|
31 |
|
|
31 |
|
- |
|
- |
|||
Additional paid-in capital |
|
|
107,551 |
|
|
107,657 |
|
|
107,741 |
|
|
107,840 |
|
|
107,550 |
|
- |
|
- |
|||
Retained earnings |
|
|
154,859 |
|
|
158,321 |
|
|
161,797 |
|
|
165,369 |
|
|
163,438 |
|
(1%) |
|
6% |
|||
Treasury stock |
|
|
(47,861) |
|
|
(51,427) |
|
|
(56,541) |
|
|
(61,660) |
|
|
(64,147) |
|
(4%) |
|
(34%) |
|||
Accumulated other comprehensive income (loss) |
|
|
(36,308) |
|
|
(35,203) |
|
|
(36,135) |
|
|
(36,318) |
|
|
(32,521) |
|
10% |
|
10% |
|||
Total common equity |
|
$ |
178,272 |
|
$ |
179,379 |
|
$ |
176,893 |
|
$ |
175,262 |
|
$ |
174,351 |
|
(1%) |
|
(2%) |
|||
|
|
|
|
|
|
|
|
|
|
|
|
|
|
|
|
|
|
|
|
|||
Total Citigroup stockholders' equity |
|
$ |
196,252 |
|
$ |
197,359 |
|
$ |
196,373 |
|
$ |
193,242 |
|
$ |
192,331 |
|
- |
|
(2%) |
|||
Noncontrolling interests |
|
|
763 |
|
|
751 |
|
|
697 |
|
|
704 |
|
|
651 |
|
(8%) |
|
(15%) |
|||
Total equity |
|
|
197,015 |
|
|
198,110 |
|
|
197,070 |
|
|
193,946 |
|
|
192,982 |
|
- |
|
(2%) |
|||
Total liabilities and equity |
|
$ |
1,958,413 |
|
$ |
1,988,226 |
|
$ |
2,014,802 |
|
$ |
1,951,158 |
|
$ |
2,219,770 |
|
14% |
|
13% |
(1) |
Preliminary. |
(2) |
Includes allowance for credit losses for unfunded lending commitments. See page 23 for amounts by period. |
NM Not meaningful.
Reclassified to conform to the current period's presentation.
Page 3
SEGMENT DETAIL
NET REVENUES
(In millions of dollars)
|
|
|
|
|
|
|
|
|
|
|
|
|
1Q20 Increase/ |
|
||||||
|
|
1Q |
|
2Q |
|
3Q |
|
4Q |
|
1Q |
|
(Decrease) from |
|
|||||||
|
|
2019 |
|
2019 |
|
2019 |
|
2019 |
|
2020 |
|
4Q19 |
|
1Q19 |
|
|||||
Global Consumer Banking |
||||||||||||||||||||
North America |
|
$ |
5,000 |
|
$ |
4,966 |
|
$ |
5,179 |
|
$ |
5,253 |
|
$ |
5,224 |
|
(1%) |
|
4% |
|
Latin America |
|
|
1,272 |
|
|
1,320 |
|
|
1,269 |
|
|
1,377 |
|
|
1,199 |
|
(13%) |
|
(6%) |
|
Asia(1) |
|
|
1,818 |
|
|
1,847 |
|
|
1,841 |
|
|
1,829 |
|
|
1,751 |
|
(4%) |
|
(4%) |
|
Total |
|
|
8,090 |
|
|
8,133 |
|
|
8,289 |
|
|
8,459 |
|
|
8,174 |
|
(3%) |
|
1% |
|
|
|
|
|
|
|
|
|
|
|
|
|
|
|
|
|
|
|
|
|
|
Institutional Clients Group |
|
|
|
|
|
|
|
|
|
|
|
|
|
|
|
|
|
|
|
|
North America |
|
|
3,269 |
|
|
3,632 |
|
|
3,244 |
|
|
3,314 |
|
|
4,947 |
|
49% |
|
51% |
|
EMEA |
|
|
3,170 |
|
|
2,960 |
|
|
3,138 |
|
|
2,738 |
|
|
3,470 |
|
27% |
|
9% |
|
Latin America |
|
|
1,268 |
|
|
1,307 |
|
|
1,294 |
|
|
1,297 |
|
|
1,418 |
|
9% |
|
12% |
|
Asia |
|
|
2,311 |
|
|
2,156 |
|
|
2,175 |
|
|
2,028 |
|
|
2,649 |
|
31% |
|
15% |
|
Total |
|
|
10,018 |
|
|
10,055 |
|
|
9,851 |
|
|
9,377 |
|
|
12,484 |
|
33% |
|
25% |
|
|
|
|
|
|
|
|
|
|
|
|
|
|
|
|
|
|
|
|
|
|
Corporate / Other |
|
|
468 |
|
|
570 |
|
|
434 |
|
|
542 |
|
|
73 |
|
(87%) |
|
(84%) |
|
|
|
|
|
|
|
|
|
|
|
|
|
|
|
|
|
|
|
|
|
|
Total Citigroup - Net Revenues |
|
$ |
18,576 |
|
$ |
18,758 |
|
$ |
18,574 |
|
$ |
18,378 |
|
$ |
20,731 |
|
13% |
|
12% |
|
(1) |
Asia GCB includes the results of operations of GCB activities in certain EMEA countries for all periods presented. |
NM Not meaningful.
Reclassified to conform to the current period's presentation.
Page 4
SEGMENT DETAIL
INCOME
(In millions of dollars)
|
|
|
|
|
|
|
|
|
|
|
|
1Q20 Increase/ |
|
|||||||
|
|
1Q |
|
2Q |
|
3Q |
|
4Q |
|
1Q |
|
(Decrease) from |
|
|||||||
|
|
2019 |
|
2019 |
|
2019 |
|
2019 |
|
2020 |
|
4Q19 |
|
1Q19 |
|
|||||
Income (Loss) from Continuing Operations |
|
|
|
|
|
|
|
|
|
|
|
|
|
|
|
|
|
|
|
|
|
|
|
|
|
|
|
|
|
|
|
|
|
|
|
|
|
|
|
|
|
Global Consumer Banking |
|
|
|
|
|
|
|
|
|
|
|
|
|
|
|
|
|
|
|
|
North America |
|
$ |
707 |
|
$ |
663 |
|
$ |
884 |
|
$ |
970 |
|
$ |
(910) |
|
NM |
|
NM |
|
Latin America |
|
|
216 |
|
|
234 |
|
|
217 |
|
|
234 |
|
|
(36) |
|
NM |
|
NM |
|
Asia (1) |
|
|
397 |
|
|
404 |
|
|
402 |
|
|
374 |
|
|
191 |
|
(49%) |
|
(52%) |
|
Total |
|
|
1,320 |
|
|
1,301 |
|
|
1,503 |
|
|
1,578 |
|
|
(755) |
|
NM |
|
NM |
|
|
|
|
|
|
|
|
|
|
|
|
|
|
|
|
|
|
|
|
|
|
Institutional Clients Group |
|
|
|
|
|
|
|
|
|
|
|
|
|
|
|
|
|
|
|
|
|
|
|
|
|
|
|
|
|
|
|
|
|
|
|
|
|
|
|
|
|
North America |
|
|
748 |
|
|
1,050 |
|
|
818 |
|
|
895 |
|
|
896 |
|
- |
|
20% |
|
EMEA |
|
|
1,125 |
|
|
1,005 |
|
|
1,060 |
|
|
677 |
|
|
1,035 |
|
53% |
|
(8%) |
|
Latin America |
|
|
540 |
|
|
519 |
|
|
487 |
|
|
565 |
|
|
526 |
|
(7%) |
|
(3%) |
|
|
|
|
|
|
|
|
|
|
|
|
|
|
|
|
|
|
|
|
|
|
Asia |
|
|
999 |
|
|
851 |
|
|
864 |
|
|
741 |
|
|
1,169 |
|
58% |
|
17% |
|
Total |
|
|
3,412 |
|
|
3,425 |
|
|
3,229 |
|
|
2,878 |
|
|
3,626 |
|
26% |
|
6% |
|
|
|
|
|
|
|
|
|
|
|
|
|
|
|
|
|
|
|
|
|
|
|
|
|
|
|
|
|
|
|
|
|
|
|
|
|
|
|
|
|
|
|
Corporate / Other |
|
|
5 |
|
|
66 |
|
|
211 |
|
|
543 |
|
|
(337) |
|
NM |
|
NM |
|
|
|
|
|
|
|
|
|
|
|
|
|
|
|
|
|
|
|
|
|
|
Income From Continuing Operations |
|
$ |
4,737 |
|
$ |
4,792 |
|
$ |
4,943 |
|
$ |
4,999 |
|
$ |
2,534 |
|
(49%) |
|
(47%) |
|
|
|
|
|
|
|
|
|
|
|
|
|
|
|
|
|
|
|
|
|
|
Discontinued Operations |
|
|
(2) |
|
|
17 |
|
|
(15) |
|
|
(4) |
|
|
(18) |
|
NM |
|
NM |
|
|
|
|
|
|
|
|
|
|
|
|
|
|
|
|
|
|
|
|
|
|
Net Income Attributable to Noncontrolling Interests |
|
|
25 |
|
|
10 |
|
|
15 |
|
|
16 |
|
|
(6) |
|
NM |
|
NM |
|
|
|
|
|
|
|
|
|
|
|
|
|
|
|
|
|
|
|
|
|
|
Total Citigroup - Net Income |
|
$ |
4,710 |
|
$ |
4,799 |
|
$ |
4,913 |
|
$ |
4,979 |
|
$ |
2,522 |
|
(49%) |
|
(46%) |
|
|
|
|
|
|
|
|
|
|
|
|
|
|
|
|
|
|
|
|
|
|
Average Assets (in billions) |
|
|
|
|
|
|
|
|
|
|
|
|
|
|
|
|
|
|
|
|
North America |
|
$ |
999 |
|
$ |
1,028 |
|
$ |
1,054 |
|
$ |
1,053 |
|
$ |
1,113 |
|
6% |
|
11% |
|
EMEA(1) |
|
|
363 |
|
|
370 |
|
|
363 |
|
|
357 |
|
|
378 |
|
6% |
|
4% |
|
Latin America |
|
|
126 |
|
|
128 |
|
|
130 |
|
|
133 |
|
|
129 |
|
(3%) |
|
2% |
|
Asia(1) |
|
|
352 |
|
|
355 |
|
|
356 |
|
|
359 |
|
|
366 |
|
2% |
|
4% |
|
Corporate / Other |
|
|
99 |
|
|
98 |
|
|
97 |
|
|
95 |
|
|
94 |
|
(1%) |
|
(5%) |
|
Total |
|
$ |
1,939 |
|
$ |
1,979 |
|
$ |
2,000 |
|
$ |
1,997 |
|
$ |
2,080 |
|
4% |
|
7% |
|
|
|
|
|
|
|
|
|
|
|
|
|
|
|
|
|
|
|
|
|
|
Return on Average Assets (ROA) on Net Income (Loss) |
|
|
|
|
|
|
|
|
|
|
|
|
|
|
|
|
|
|
|
|
North America |
|
|
0.59% |
|
|
0.67% |
|
|
0.64% |
|
|
0.70% |
|
|
0.00% |
|
|
|
|
|
EMEA(1) |
|
|
1.24% |
|
|
1.08% |
|
|
1.14% |
|
|
0.74% |
|
|
1.09% |
|
|
|
|
|
Latin America |
|
|
2.43% |
|
|
2.36% |
|
|
2.15% |
|
|
2.38% |
|
|
1.53% |
|
|
|
|
|
Asia(1) |
|
|
1.61% |
|
|
1.42% |
|
|
1.41% |
|
|
1.22% |
|
|
1.50% |
|
|
|
|
|
Corporate / Other |
|
|
(0.05%) |
|
|
0.34% |
|
|
0.78% |
|
|
2.24% |
|
|
(1.50%) |
|
|
|
|
|
Total |
|
|
0.98% |
|
|
0.97% |
|
|
0.97% |
|
|
0.99% |
|
|
0.49% |
|
|
|
|
|
(1) |
Asia GCB includes the results of operations of GCB activities in certain EMEA countries for all periods presented. |
NM Not meaningful.
Reclassified to conform to the current period's presentation.
Page 5
GLOBAL CONSUMER BANKING
Page 1
(In millions of dollars, except as otherwise noted)
|
|
|
|
|
|
|
|
|
|
|
|
1Q20 Increase/ |
|||||||
|
|
1Q |
|
2Q |
|
3Q |
|
4Q |
|
1Q |
|
(Decrease) from |
|||||||
|
|
2019 |
|
2019 |
|
2019 |
|
2019 |
|
2020 |
|
4Q19 |
|
1Q19 |
|||||
Net Interest Revenue |
|
$ |
6,940 |
|
$ |
6,957 |
|
$ |
7,127 |
|
$ |
7,181 |
|
$ |
7,072 |
|
(2%) |
|
2% |
Non-Interest Revenue |
|
|
1,150 |
|
|
1,176 |
|
|
1,162 |
|
|
1,278 |
|
|
1,102 |
|
(14%) |
|
(4%) |
Total Revenues, Net of Interest Expense |
|
|
8,090 |
|
|
8,133 |
|
|
8,289 |
|
|
8,459 |
|
|
8,174 |
|
(3%) |
|
1% |
Total Operating Expenses |
|
|
4,416 |
|
|
4,471 |
|
|
4,368 |
|
|
4,373 |
|
|
4,368 |
|
- |
|
(1%) |
Net Credit Losses |
|
|
1,868 |
|
|
1,870 |
|
|
1,802 |
|
|
1,842 |
|
|
1,983 |
|
8% |
|
6% |
Credit Reserve Build / (Release) for Loans |
|
|
96 |
|
|
94 |
|
|
129 |
|
|
120 |
|
|
2,829 |
|
NM |
|
NM |
Provision for Unfunded Lending Commitments |
|
|
(3) |
|
|
- |
|
|
2 |
|
|
2 |
|
|
(1) |
|
NM |
|
67% |
Provisions for Benefits and Claims, HTM Debt Securities and Other Assets |
|
|
12 |
|
|
19 |
|
|
17 |
|
|
25 |
|
|
20 |
|
(20%) |
|
67% |
Provisions for Credit Losses and for Benefits and Claims (LLR & PBC) |
|
|
1,973 |
|
|
1,983 |
|
|
1,950 |
|
|
1,989 |
|
|
4,831 |
|
NM |
|
NM |
Income (Loss) from Continuing Operations before Taxes |
|
|
1,701 |
|
|
1,679 |
|
|
1,971 |
|
|
2,097 |
|
|
(1,025) |
|
NM |
|
NM |
Income Taxes (Benefits) |
|
|
381 |
|
|
378 |
|
|
468 |
|
|
519 |
|
|
(270) |
|
NM |
|
NM |
Income (Loss) from Continuing Operations |
|
|
1,320 |
|
|
1,301 |
|
|
1,503 |
|
|
1,578 |
|
|
(755) |
|
NM |
|
NM |
Noncontrolling Interests |
|
|
- |
|
|
1 |
|
|
2 |
|
|
3 |
|
|
(1) |
|
NM |
|
(100%) |
Net Income (Loss) |
|
$ |
1,320 |
|
$ |
1,300 |
|
$ |
1,501 |
|
$ |
1,575 |
|
$ |
(754) |
|
NM |
|
NM |
EOP Assets (in billions) |
|
$ |
379 |
|
$ |
390 |
|
$ |
394 |
|
$ |
407 |
|
$ |
403 |
|
(1%) |
|
6% |
Average Assets (in billions) |
|
$ |
380 |
|
$ |
384 |
|
$ |
392 |
|
$ |
399 |
|
$ |
406 |
|
2% |
|
7% |
Return on Average Assets (ROA) |
|
|
1.41% |
|
|
1.36% |
|
|
1.52% |
|
|
1.57% |
|
|
(0.75%) |
|
|
|
|
Efficiency Ratio |
|
|
55% |
|
|
55% |
|
|
53% |
|
|
52% |
|
|
53% |
|
|
|
|
|
|
|
|
|
|
|
|
|
|
|
|
|
|
|
|
|
|
|
|
Net Credit Losses as a % of Average Loans |
|
|
2.70% |
|
|
2.68% |
|
|
2.52% |
|
|
2.51% |
|
|
2.75% |
|
|
|
|
|
|
|
|
|
|
|
|
|
|
|
|
|
|
|
|
|
|
|
|
Revenue by Business |
|
|
|
|
|
|
|
|
|
|
|
|
|
|
|
|
|
|
|
Retail Banking |
|
$ |
3,106 |
|
$ |
3,202 |
|
$ |
3,117 |
|
$ |
3,124 |
|
$ |
3,046 |
|
(2%) |
|
(2%) |
Cards (1) |
|
|
4,984 |
|
|
4,931 |
|
|
5,172 |
|
|
5,335 |
|
|
5,128 |
|
(4%) |
|
3% |
Total |
|
$ |
8,090 |
|
$ |
8,133 |
|
$ |
8,289 |
|
$ |
8,459 |
|
$ |
8,174 |
|
(3%) |
|
1% |
|
|
|
|
|
|
|
|
|
|
|
|
|
|
|
|
|
|
|
|
Net Credit Losses by Business |
|
|
|
|
|
|
|
|
|
|
|
|
|
|
|
|
|
|
|
Retail Banking |
|
$ |
233 |
|
$ |
225 |
|
$ |
225 |
|
$ |
227 |
|
$ |
235 |
|
4% |
|
1% |
Cards (1) |
|
|
1,635 |
|
|
1,645 |
|
|
1,577 |
|
|
1,615 |
|
|
1,748 |
|
8% |
|
7% |
Total |
|
$ |
1,868 |
|
$ |
1,870 |
|
$ |
1,802 |
|
$ |
1,842 |
|
$ |
1,983 |
|
8% |
|
6% |
|
|
|
|
|
|
|
|
|
|
|
|
|
|
|
|
|
|
|
|
Income from Continuing Operations by Business |
|
|
|
|
|
|
|
|
|
|
|
|
|
|
|
|
|
|
|
Retail Banking |
|
$ |
409 |
|
$ |
517 |
|
$ |
492 |
|
$ |
424 |
|
$ |
120 |
|
(72%) |
|
(71%) |
Cards (1) |
|
|
911 |
|
|
784 |
|
|
1,011 |
|
|
1,154 |
|
|
(875) |
|
NM |
|
NM |
Total |
|
$ |
1,320 |
|
$ |
1,301 |
|
$ |
1,503 |
|
$ |
1,578 |
|
$ |
(755) |
|
NM |
|
NM |
|
|
|
|
|
|
|
|
|
|
|
|
|
|
|
|
|
|
|
|
Foreign Currency (FX) Translation Impact |
|
|
|
|
|
|
|
|
|
|
|
|
|
|
|
|
|
|
|
|
$ |
8,090 |
|
$ |
8,133 |
|
$ |
8,289 |
|
$ |
8,459 |
|
$ |
8,174 |
|
(3%) |
|
1% |
|
Impact of FX Translation (2) |
|
|
(115) |
|
|
(104) |
|
|
(72) |
|
|
(120) |
|
|
- |
|
|
|
|
Total Revenues - Ex-FX (2) |
|
$ |
7,975 |
|
$ |
8,029 |
|
$ |
8,217 |
|
$ |
8,339 |
|
$ |
8,174 |
|
(2%) |
|
2% |
|
|
|
|
|
|
|
|
|
|
|
|
|
|
|
|
|
|
|
|
Total Operating Expenses – as Reported |
|
$ |
4,416 |
|
$ |
4,471 |
|
$ |
4,368 |
|
$ |
4,373 |
|
$ |
4,368 |
|
- |
|
(1%) |
Impact of FX Translation (2) |
|
|
(66) |
|
|
(56) |
|
|
(38) |
|
|
(67) |
|
|
- |
|
|
|
|
Total Operating Expenses - Ex-FX (2) |
|
$ |
4,350 |
|
$ |
4,415 |
|
$ |
4,330 |
|
$ |
4,306 |
|
$ |
4,368 |
|
1% |
|
- |
|
|
|
|
|
|
|
|
|
|
|
|
|
|
|
|
|
|
|
|
Total Provisions for LLR & PBC - as Reported |
|
$ |
1,973 |
|
$ |
1,983 |
|
$ |
1,950 |
|
$ |
1,989 |
|
$ |
4,831 |
|
NM |
|
NM |
Impact of FX Translation (2) |
|
|
(26) |
|
|
(25) |
|
|
(16) |
|
|
(22) |
|
|
- |
|
|
|
|
Total Provisions for LLR & PBC - Ex-FX (2) |
$ |
1,947 |
$ |
1,958 |
$ |
1,934 |
$ |
1,967 |
$ |
4,831 |
NM |
NM |
|||||||
|
|
|
|
|
|
|
|
|
|
|
|
|
|
|
|
|
|
|
|
Net Income (Loss) – as Reported |
|
$ |
1,320 |
|
$ |
1,300 |
|
$ |
1,501 |
|
$ |
1,575 |
|
$ |
(754) |
|
NM |
|
NM |
Impact of FX Translation (2) |
|
|
(15) |
|
|
(16) |
|
|
(12) |
|
|
(21) |
|
|
- |
|
|
|
|
Total Net Income (Loss) - Ex-FX (2) |
|
$ |
1,305 |
|
$ |
1,284 |
|
$ |
1,489 |
|
$ |
1,554 |
|
$ |
(754) |
|
NM |
|
NM |
(1) |
Includes both Citi-Branded Cards and Citi Retail Services. |
(2) |
Reflects the impact of foreign currency (FX) translation into U.S. dollars at the 1Q20 average exchange rates for all periods presented. |
Citigroup's results of operations excluding the impact of FX translation are non-GAAP financial measures.
NM Not meaningful.
Reclassified to conform to the current period's presentation.
Page 6
GLOBAL CONSUMER BANKING
Page 2
|
|
|
|
|
|
|
|
|
|
|
|
1Q20 Increase/ |
|||||||
|
|
1Q |
|
2Q |
|
3Q |
|
4Q |
|
1Q |
|
(Decrease) from |
|||||||
|
|
2019 |
|
2019 |
|
2019 |
|
2019 |
|
2020 |
|
4Q19 |
|
1Q19 |
|||||
Retail Banking Key Indicators (in billions of dollars, except as otherwise noted) |
|
|
|
|
|
|
|
|
|
|
|
|
|
|
|
|
|
|
|
Branches (actual) |
|
|
2,404 |
|
|
2,399 |
|
|
2,394 |
|
|
2,348 |
|
|
2,333 |
|
(1%) |
|
(3%) |
Accounts (in millions) |
|
|
54.9 |
|
|
55.5 |
|
|
55.8 |
|
|
55.9 |
|
|
55.9 |
|
- |
|
2% |
Average Deposits |
|
$ |
271.7 |
|
$ |
275.2 |
|
$ |
276.8 |
|
$ |
282.6 |
|
$ |
290.1 |
|
3% |
|
7% |
Investment Sales |
|
$ |
21.1 |
|
$ |
22.8 |
|
$ |
23.9 |
|
$ |
22.7 |
|
$ |
29.6 |
|
30% |
|
40% |
Investment Assets under Management (AUMs) |
|
$ |
160.1 |
|
$ |
164.3 |
|
$ |
165.6 |
|
$ |
174.8 |
|
$ |
144.6 |
|
(17%) |
|
(10%) |
Average Loans |
|
$ |
117.9 |
|
$ |
118.1 |
|
$ |
119.5 |
|
$ |
123.0 |
|
$ |
123.1 |
|
- |
|
4% |
EOP Loans: |
|
|
|
|
|
|
|
|
|
|
|
|
|
|
|
|
|
|
|
Mortgages |
|
$ |
80.8 |
|
$ |
81.9 |
|
$ |
83.0 |
|
$ |
85.1 |
|
$ |
83.3 |
|
(2%) |
|
3% |
Personal, Small Business and Other |
|
|
37.3 |
|
|
37.8 |
|
|
37.6 |
|
|
39.7 |
|
|
36.9 |
|
(7%) |
|
(1%) |
EOP Loans |
|
$ |
118.1 |
|
$ |
119.7 |
|
$ |
120.6 |
|
$ |
124.8 |
|
$ |
120.2 |
|
(4%) |
|
2% |
|
|
|
|
|
|
|
|
|
|
|
|
|
|
|
|
|
|
|
|
Total Net Interest Revenue (in millions)(1) |
|
$ |
2,097 |
|
$ |
2,119 |
|
$ |
2,069 |
|
$ |
2,048 |
|
$ |
1,981 |
|
(3%) |
|
(6%) |
As a % of Average Loans |
|
|
7.21% |
|
|
7.20% |
|
|
6.87% |
|
|
6.61% |
|
|
6.47% |
|
|
|
|
|
|
|
|
|
|
|
|
|
|
|
|
|
|
|
|
|
|
|
|
Net Credit Losses (in millions) |
|
$ |
233 |
|
$ |
225 |
|
$ |
225 |
|
$ |
227 |
|
$ |
235 |
|
4% |
|
1% |
As a % of Average Loans |
|
|
0.80% |
|
|
0.76% |
|
|
0.75% |
|
|
0.73% |
|
|
0.77% |
|
|
|
|
Loans 90+ Days Past Due (in millions)(2) |
|
$ |
394 |
|
$ |
416 |
|
$ |
392 |
|
$ |
438 |
|
$ |
429 |
|
(2%) |
|
9% |
As a % of EOP Loans |
|
|
0.34% |
|
|
0.35% |
|
|
0.33% |
|
|
0.35% |
|
|
0.36% |
|
|
|
|
Loans 30-89 Days Past Due (in millions)(2) |
|
$ |
744 |
|
$ |
831 |
|
$ |
803 |
|
$ |
816 |
|
$ |
794 |
|
(3%) |
|
7% |
As a % of EOP Loans |
|
|
0.63% |
|
|
0.70% |
|
|
0.67% |
|
|
0.66% |
|
|
0.66% |
|
|
|
|
|
|
|
|
|
|
|
|
|
|
|
|
|
|
|
|
|
|
|
|
Cards Key Indicators (in millions of dollars, except as otherwise noted) |
|
|
|
|
|
|
|
|
|
|
|
|
|
|
|
|
|
|
|
EOP Open Accounts (in millions) |
|
|
140.1 |
|
|
139.5 |
|
|
138.2 |
|
|
138.3 |
|
|
137.3 |
|
(1%) |
|
(2%) |
Purchase Sales (in billions) |
|
$ |
128.0 |
|
$ |
142.0 |
|
$ |
141.8 |
|
$ |
152.0 |
|
$ |
127.6 |
|
(16%) |
|
- |
|
|
|
|
|
|
|
|
|
|
|
|
|
|
|
|
|
|
|
|
Average Loans (in billions)(3) |
|
$ |
162.7 |
|
$ |
162.0 |
|
$ |
164.6 |
|
$ |
168.0 |
|
$ |
167.2 |
|
- |
|
3% |
EOP Loans (in billions)(3) |
|
$ |
160.3 |
|
$ |
165.1 |
|
$ |
165.8 |
|
$ |
175.1 |
|
$ |
159.1 |
|
(9%) |
|
(1%) |
Average Yield(4) |
|
|
13.95% |
|
|
13.87% |
|
|
13.87% |
|
|
13.62% |
|
|
13.59% |
|
|
|
|
Total Net Interest Revenue(5) |
|
$ |
4,843 |
|
$ |
4,838 |
|
$ |
5,058 |
|
$ |
5,133 |
|
$ |
5,091 |
|
(1%) |
|
5% |
As a % of Average Loans(5) |
|
|
12.07% |
|
|
11.98% |
|
|
12.19% |
|
|
12.12% |
|
|
12.25% |
|
|
|
|
Net Credit Losses |
|
$ |
1,635 |
|
$ |
1,645 |
|
$ |
1,577 |
|
$ |
1,615 |
|
$ |
1,748 |
|
8% |
|
7% |
As a % of Average Loans |
|
|
4.08% |
|
|
4.07% |
|
|
3.80% |
|
|
3.81% |
|
|
4.20% |
|
|
|
|
Net Credit Margin(6) |
|
$ |
3,350 |
|
$ |
3,286 |
|
$ |
3,598 |
|
$ |
3,722 |
|
$ |
3,378 |
|
(9%) |
|
1% |
As a % of Average Loans(6) |
|
|
8.35% |
|
|
8.14% |
|
|
8.67% |
|
|
8.79% |
|
|
8.13% |
|
|
|
|
Loans 90+ Days Past Due |
|
$ |
2,111 |
|
$ |
2,010 |
|
$ |
2,078 |
|
$ |
2,299 |
|
$ |
2,174 |
|
(5%) |
|
3% |
As a % of EOP Loans |
|
|
1.32% |
|
|
1.22% |
|
|
1.25% |
|
|
1.31% |
|
|
1.37% |
|
|
|
|
Loans 30-89 Days Past Due |
|
$ |
2,007 |
|
$ |
1,952 |
|
$ |
2,153 |
|
$ |
2,185 |
|
$ |
2,076 |
|
(5%) |
|
3% |
As a % of EOP Loans |
|
|
1.25% |
|
|
1.18% |
|
|
1.30% |
|
|
1.25% |
|
|
1.30% |
|
|
|
|
|
|
|
|
|
|
|
|
|
|
|
|
|
|
|
|
|
|
|
|
(1) |
Also includes net interest revenue related to the average deposit balances in excess of the average loan portfolio. |
(2) |
The Loans 90+ Days Past Due and 30-89 Days Past Due and related ratios exclude U.S. mortgage loans that are guaranteed by U.S. government-sponsored agencies. See footnote 2 on page 9. |
(3) |
Average loans, EOP loans and the related consumer delinquency amounts and ratios include interest and fees receivables balances. |
(4) |
Average yield is gross interest revenue earned on loans divided by average loans. |
(5) |
Net interest revenue includes certain fees that are recorded as interest revenue. |
(6) |
Net credit margin is total revenues, net of interest expense, less net credit losses and policy benefits and claims. |
Reclassified to conform to the current period's presentation.
Page 7
GLOBAL CONSUMER BANKING
NORTH AMERICA
Page 1
(In millions of dollars, except as otherwise noted)
|
|
|
|
|
|
|
|
|
|
|
|
1Q20 Increase/ |
|||||||
|
|
1Q |
|
2Q |
|
3Q |
|
4Q |
|
1Q |
|
(Decrease) from |
|||||||
|
|
2019 |
|
2019 |
|
2019 |
|
2019 |
|
2020 |
|
4Q19 |
|
1Q19 |
|||||
|
|
|
|
|
|
|
|
|
|
|
|
|
|
|
|
|
|
|
|
Net Interest Revenue |
|
$ |
4,897 |
|
$ |
4,869 |
|
$ |
5,041 |
|
$ |
5,062 |
|
$ |
5,036 |
|
(1%) |
|
3% |
Non-Interest Revenue |
|
|
103 |
|
|
97 |
|
|
138 |
|
|
191 |
|
|
188 |
|
(2%) |
|
83% |
Total Revenues, Net of Interest Expense (1) |
|
|
5,000 |
|
|
4,966 |
|
|
5,179 |
|
|
5,253 |
|
|
5,224 |
|
(1%) |
|
4% |
Total Operating Expenses |
|
|
2,572 |
|
|
2,621 |
|
|
2,511 |
|
|
2,450 |
|
|
2,536 |
|
4% |
|
(1%) |
Net Credit Losses |
|
|
1,408 |
|
|
1,417 |
|
|
1,350 |
|
|
1,408 |
|
|
1,526 |
|
8% |
|
8% |
Credit Reserve Build / (Release) |
|
|
118 |
|
|
81 |
|
|
161 |
|
|
109 |
|
|
2,362 |
|
NM |
|
NM |
Provision for Unfunded Lending Commitments |
|
|
(3) |
|
|
- |
|
|
2 |
|
|
2 |
|
|
(1) |
|
NM |
|
67% |
Provisions for Benefits and Claims, HTM Debt Securities and Other Assets |
|
|
6 |
|
|
6 |
|
|
4 |
|
|
3 |
|
|
5 |
|
67% |
|
(17%) |
Provisions for Loan Losses and for Benefits and Claims |
|
|
1,529 |
|
|
1,504 |
|
|
1,517 |
|
|
1,522 |
|
|
3,892 |
|
NM |
|
NM |
Income (Loss) from Continuing Operations before Taxes |
|
|
899 |
|
|
841 |
|
|
1,151 |
|
|
1,281 |
|
|
(1,204) |
|
NM |
|
NM |
Income Taxes (Benefits) |
|
|
192 |
|
|
178 |
|
|
267 |
|
|
311 |
|
|
(294) |
|
NM |
|
NM |
Income (Loss) from Continuing Operations |
|
|
707 |
|
|
663 |
|
|
884 |
|
|
970 |
|
|
(910) |
|
NM |
|
NM |
Noncontrolling Interests |
|
|
- |
|
|
- |
|
|
- |
|
|
- |
|
|
- |
|
- |
|
- |
Net Income (Loss) |
|
$ |
707 |
|
$ |
663 |
|
$ |
884 |
|
$ |
970 |
|
$ |
(910) |
|
NM |
|
NM |
Average Assets (in billions) |
|
$ |
226 |
|
$ |
229 |
|
$ |
235 |
|
$ |
237 |
|
$ |
246 |
|
4% |
|
9% |
Return on Average Assets |
|
|
1.27% |
|
|
1.16% |
|
|
1.49% |
|
|
1.62% |
|
|
(1.49%) |
|
|
|
|
Efficiency Ratio |
|
|
51% |
|
|
53% |
|
|
48% |
|
|
47% |
|
|
49% |
|
|
|
|
|
|
|
|
|
|
|
|
|
|
|
|
|
|
|
|
|
|
|
|
Net Credit Losses as a % of Average Loans |
|
|
3.08% |
|
|
3.07% |
|
|
2.84% |
|
|
2.90% |
|
|
3.18% |
|
|
|
|
|
|
|
|
|
|
|
|
|
|
|
|
|
|
|
|
|
|
|
|
Revenue by Business |
|
|
|
|
|
|
|
|
|
|
|
|
|
|
|
|
|
|
|
Retail Banking |
|
$ |
1,131 |
|
$ |
1,159 |
|
$ |
1,131 |
|
$ |
1,108 |
|
$ |
1,130 |
|
2% |
|
- |
Citi-Branded Cards |
|
|
2,195 |
|
|
2,197 |
|
|
2,334 |
|
|
2,439 |
|
|
2,347 |
|
(4%) |
|
7% |
Citi Retail Services |
|
|
1,674 |
|
|
1,610 |
|
|
1,714 |
|
|
1,706 |
|
|
1,747 |
|
2% |
|
4% |
Total |
|
$ |
5,000 |
|
$ |
4,966 |
|
$ |
5,179 |
|
$ |
5,253 |
|
$ |
5,224 |
|
(1%) |
|
4% |
|
|
|
|
|
|
|
|
|
|
|
|
|
|
|
|
|
|
|
|
Net Credit Losses by Business |
|
|
|
|
|
|
|
|
|
|
|
|
|
|
|
|
|
|
|
Retail Banking |
|
$ |
39 |
|
$ |
40 |
|
$ |
40 |
|
$ |
42 |
|
$ |
37 |
|
(12%) |
|
(5%) |
Citi-Branded Cards |
|
|
706 |
|
|
723 |
|
|
712 |
|
|
723 |
|
|
795 |
|
10% |
|
13% |
Citi Retail Services |
|
|
663 |
|
|
654 |
|
|
598 |
|
|
643 |
|
|
694 |
|
8% |
|
5% |
Total |
|
$ |
1,408 |
|
$ |
1,417 |
|
$ |
1,350 |
|
$ |
1,408 |
|
$ |
1,526 |
|
8% |
|
8% |
|
|
|
|
|
|
|
|
|
|
|
|
|
|
|
|
|
|
|
|
Income from Continuing Operations by Business |
|
|
|
|
|
|
|
|
|
|
|
|
|
|
|
|
|
|
|
Retail Banking |
|
$ |
21 |
|
$ |
56 |
|
$ |
67 |
|
$ |
52 |
|
$ |
(73) |
|
NM |
|
NM |
Citi-Branded Cards |
|
|
382 |
|
|
364 |
|
|
441 |
|
|
555 |
|
|
(529) |
|
NM |
|
NM |
Citi Retail Services |
|
|
304 |
|
|
243 |
|
|
376 |
|
|
363 |
|
|
(308) |
|
NM |
|
NM |
Total |
|
$ |
707 |
|
$ |
663 |
|
$ |
884 |
|
$ |
970 |
|
$ |
(910) |
|
NM |
|
NM |
(1) |
1Q18 includes an approximate $150 million gain on the sale of the Hilton Card portfolio. |
NM Not meaningful.
Reclassified to conform to the current period's presentation.
Page 8
GLOBAL CONSUMER BANKING
NORTH AMERICA
Page 2
|
|
|
|
|
|
|
|
|
|
|
|
1Q20 Increase/ |
|||||||
|
|
1Q |
|
2Q |
|
3Q |
|
4Q |
|
1Q |
|
(Decrease) from |
|||||||
|
|
2019 |
|
2019 |
|
2019 |
|
2019 |
|
2020 |
|
4Q19 |
|
1Q19 |
|||||
|
|
|
|
|
|
|
|
|
|
|
|
|
|
|
|||||
Retail Banking Key Indicators (in billions of dollars, except as otherwise noted) |
|
|
|
|
|
|
|
|
|
|
|
|
|
|
|
|
|
|
|
|
|
|
|
|
|
|
|
|
|
|
|
|
|
|
|
|
|
|
|
Branches (actual) |
|
|
689 |
|
|
688 |
|
|
687 |
|
|
687 |
|
|
686 |
|
- |
|
- |
Accounts (in millions) |
|
|
9.0 |
|
|
9.1 |
|
|
9.1 |
|
|
9.1 |
|
|
9.1 |
|
- |
|
1% |
Average Deposits |
|
$ |
149.6 |
|
$ |
151.6 |
|
$ |
153.6 |
|
$ |
156.2 |
|
$ |
161.3 |
|
3% |
|
8% |
Investment Sales |
|
$ |
8.8 |
|
$ |
9.6 |
|
$ |
9.6 |
|
$ |
9.8 |
|
$ |
12.4 |
|
27% |
|
41% |
Investment AUMs |
|
$ |
65.9 |
|
$ |
68.2 |
|
$ |
68.5 |
|
$ |
72.2 |
|
$ |
62.0 |
|
(14%) |
|
(6%) |
|
|
|
|
|
|
|
|
|
|
|
|
|
|
|
|
|
|
|
|
Average Loans |
|
$ |
47.6 |
|
$ |
47.8 |
|
$ |
48.6 |
|
$ |
49.8 |
|
$ |
50.5 |
|
1% |
|
6% |
|
|
|
|
|
|
|
|
|
|
|
|
|
|
|
|
|
|
|
|
EOP Loans: |
|
|
|
|
|
|
|
|
|
|
|
|
|
|
|
|
|
|
|
Mortgages |
|
$ |
44.7 |
|
$ |
45.3 |
|
$ |
46.3 |
|
$ |
47.5 |
|
$ |
47.9 |
|
1% |
|
7% |
Personal, Small Business and Other |
|
|
3.0 |
|
|
2.9 |
|
|
2.8 |
|
|
2.8 |
|
|
2.9 |
|
4% |
|
(3%) |
Total EOP Loans |
|
$ |
47.7 |
|
$ |
48.2 |
|
$ |
49.1 |
|
$ |
50.3 |
|
$ |
50.8 |
|
1% |
|
6% |
|
|
|
|
|
|
|
|
|
|
|
|
|
|
|
|
|
|
|
|
Mortgage Originations (1) |
|
$ |
2.0 |
|
$ |
3.9 |
|
$ |
5.0 |
|
$ |
6.0 |
|
$ |
4.1 |
|
(32%) |
|
NM |
|
|
|
|
|
|
|
|
|
|
|
|
|
|
|
|
|
|
|
|
Third Party Mortgage Servicing Portfolio (EOP) |
|
$ |
44.9 |
|
$ |
44.5 |
|
$ |
44.2 |
|
$ |
43.8 |
|
$ |
43.9 |
|
- |
|
(2%) |
|
|
|
|
|
|
|
|
|
|
|
|
|
|
|
|
|
|
|
|
Net Servicing and Gain/(Loss) on Sale (in millions) |
|
$ |
31.8 |
|
$ |
31.3 |
|
$ |
32.9 |
|
$ |
38.2 |
|
$ |
86.3 |
|
NM |
|
NM |
|
|
|
|
|
|
|
|
|
|
|
|
|
|
|
|
|
|
|
|
Saleable Mortgage Rate Locks |
|
$ |
1.1 |
|
$ |
1.5 |
|
$ |
1.9 |
|
$ |
2.0 |
|
$ |
2.9 |
|
45% |
|
NM |
|
|
|
|
|
|
|
|
|
|
|
|
|
|
|
|
|
|
|
|
Net Interest Revenue on Loans (in millions) |
|
$ |
180 |
|
$ |
175 |
|
$ |
171 |
|
$ |
178 |
|
$ |
184 |
|
3% |
|
2% |
As a % of Avg. Loans |
|
|
1.53% |
|
|
1.47% |
|
|
1.40% |
|
|
1.42% |
|
|
1.47% |
|
|
|
|
|
|
|
|
|
|
|
|
|
|
|
|
|
|
|
|
|
|
|
|
Net Credit Losses (in millions) |
|
$ |
39 |
|
$ |
40 |
|
$ |
40 |
|
$ |
42 |
|
$ |
37 |
|
(12%) |
|
(5%) |
As a % of Avg. Loans |
|
|
0.33% |
|
|
0.34% |
|
|
0.33% |
|
|
0.33% |
|
|
0.29% |
|
|
|
|
|
|
|
|
|
|
|
|
|
|
|
|
|
|
|
|
|
|
|
|
Loans 90+ Days Past Due (in millions) (2) |
|
$ |
132 |
|
$ |
133 |
|
$ |
125 |
|
$ |
146 |
|
$ |
161 |
|
10% |
|
22% |
As a % of EOP Loans |
|
|
0.28% |
|
|
0.28% |
|
|
0.26% |
|
|
0.29% |
|
|
0.32% |
|
|
|
|
Loans 30-89 Days Past Due (in millions) (2) |
|
$ |
263 |
|
$ |
341 |
|
$ |
313 |
|
$ |
334 |
|
$ |
298 |
|
(11%) |
|
13% |
As a % of EOP Loans |
|
|
0.56% |
|
|
0.72% |
|
|
0.65% |
|
|
0.67% |
|
|
0.59% |
|
|
|
|
(1) |
Originations of residential first mortgages. |
(2) |
The Loans 90+ Days Past Due and 30-89 Days Past Due and related ratios exclude U.S. mortgage loans that are guaranteed by U.S. government-sponsored agencies since the potential loss predominantly resides with the U.S. agencies. |
The amounts excluded for Loans 90+ Days Past Due and (EOP Loans) were $173 million and ($0.6 billion), $162 million and ($0.6 billion), and $150 million and ($0.6 billion), $135 million and ($0.5 billion), and $124 million and ($0.5 billion) as of March 31, 2019, June 30, 2019, September 30, 2019, December 31, 2019 and March 31, 2020, respectively.
The amounts excluded for Loans 30-89 Days Past Due and (EOP Loans) were $78 million and ($0.6 billion), $89 million and ($0.6 billion), $78 million and ($0.6 billion), $72 million and ($0.5 billion), and $64 million and ($0.5 billion) as of March 31, 2019, June 30, 2019, September 30, 2019, December 31, 2019 and March 31, 2020, respectively.
NM Not meaningful.
Reclassified to conform to the current period's presentation.
Page 9
GLOBAL CONSUMER BANKING
NORTH AMERICA
Page 3
|
|
|
|
|
|
|
|
|
|
|
|
1Q20 Increase/ |
|||||||
|
|
1Q |
|
2Q |
|
3Q |
|
4Q |
|
1Q |
|
(Decrease) from |
|||||||
|
|
2019 |
|
2019 |
|
2019 |
|
2019 |
|
2020 |
|
4Q19 |
|
1Q19 |
|||||
|
|
|
|
|
|
|
|
|
|
|
|
|
|
|
|
||||
Citi-Branded Cards Key Indicators (in millions of dollars, except as otherwise noted) (1) |
|
|
|
|
|
|
|
|
|
|
|
|
|
|
|
|
|
|
|
EOP Open Accounts (in millions) |
|
|
34.8 |
|
|
34.8 |
|
|
34.7 |
|
|
34.9 |
|
|
35.0 |
|
- |
|
1% |
Purchase Sales (in billions) |
|
$ |
83.6 |
|
$ |
93.2 |
|
$ |
93.5 |
|
$ |
98.1 |
|
$ |
85.8 |
|
(13%) |
|
3% |
Average Loans (in billions) (1) |
|
$ |
87.7 |
|
$ |
88.4 |
|
$ |
90.5 |
|
$ |
92.4 |
|
$ |
92.3 |
|
- |
|
5% |
EOP Loans (in billions) (1) |
|
$ |
87.0 |
|
$ |
90.6 |
|
$ |
91.5 |
|
$ |
96.3 |
|
$ |
88.4 |
|
(8%) |
|
2% |
Average Yield (2) |
|
|
11.24% |
|
|
11.13% |
|
|
11.19% |
|
|
10.96% |
|
|
10.86% |
|
(1%) |
|
(3%) |
|
|
|
|
|
|
|
|
|
|
|
|
|
|
|
|
|
|
|
|
Total Net Interest Revenue (3) |
|
$ |
1,972 |
|
$ |
1,974 |
|
$ |
2,084 |
|
$ |
2,144 |
|
$ |
2,142 |
|
- |
|
9% |
As a % of Avg. Loans (3) |
|
|
9.12% |
|
|
8.96% |
|
|
9.14% |
|
|
9.21% |
|
|
9.33% |
|
|
|
|
Net Credit Losses |
|
$ |
706 |
|
$ |
723 |
|
$ |
712 |
|
$ |
723 |
|
$ |
795 |
|
10% |
|
13% |
As a % of Average Loans |
|
|
3.26% |
|
|
3.28% |
|
|
3.12% |
|
|
3.10% |
|
|
3.46% |
|
|
|
|
Net Credit Margin (4) |
|
$ |
1,487 |
|
$ |
1,470 |
|
$ |
1,621 |
|
$ |
1,715 |
|
$ |
1,550 |
|
(10%) |
|
4% |
As a % of Avg. Loans (4) |
|
|
6.88% |
|
|
6.67% |
|
|
7.11% |
|
|
7.36% |
|
|
6.75% |
|
|
|
|
Loans 90+ Days Past Due |
|
$ |
828 |
|
$ |
799 |
|
$ |
807 |
|
$ |
915 |
|
$ |
891 |
|
(3%) |
|
8% |
As a % of EOP Loans |
|
|
0.95% |
|
|
0.88% |
|
|
0.88% |
|
|
0.95% |
|
|
1.01% |
|
|
|
|
Loans 30-89 Days Past Due |
|
$ |
731 |
|
$ |
705 |
|
$ |
800 |
|
$ |
814 |
|
$ |
770 |
|
(5%) |
|
5% |
As a % of EOP Loans |
|
|
0.84% |
|
|
0.78% |
|
|
0.87% |
|
|
0.85% |
|
|
0.87% |
|
|
|
|
|
|
|
|
|
|
|
|
|
|
|
|
|
|
|
|
|
|
|
|
|
|
|
|
|
|
|
|
|
|
|
|
|
|
|
|
|
|
|
|
Citi Retail Services Key Indicators (in millions of dollars, except as otherwise noted) (1) |
|
|
|
|
|
|
|
|
|
|
|
|
|
|
|
|
|
|
|
EOP Open Accounts |
|
|
84.6 |
|
|
84.1 |
|
|
83.0 |
|
|
82.9 |
|
|
81.9 |
|
(1%) |
|
(3%) |
Purchase Sales (in billions) |
|
$ |
18.6 |
|
$ |
22.5 |
|
$ |
21.7 |
|
$ |
25.1 |
|
$ |
18.0 |
|
(28%) |
|
(3%) |
Average Loans (in billions) (1) |
|
$ |
50.2 |
|
$ |
49.1 |
|
$ |
49.7 |
|
$ |
50.5 |
|
$ |
50.5 |
|
- |
|
1% |
EOP Loans (in billions) (1) |
|
$ |
48.9 |
|
$ |
49.6 |
|
$ |
50.0 |
|
$ |
52.9 |
|
$ |
48.9 |
|
(8%) |
|
- |
Average Yield (2) |
|
|
18.17% |
|
|
18.10% |
|
|
18.08% |
|
|
17.66% |
|
|
17.78% |
|
1% |
|
(2%) |
|
|
|
|
|
|
|
|
|
|
|
|
|
|
|
|
|
|
|
|
Total Net Interest Revenue (3) |
|
$ |
2,078 |
|
$ |
2,036 |
|
$ |
2,136 |
|
$ |
2,121 |
|
$ |
2,119 |
|
- |
|
2% |
As a % of Avg. Loans (3) |
|
|
16.79% |
|
|
16.63% |
|
|
17.05% |
|
|
16.66% |
|
|
16.88% |
|
|
|
|
Net Credit Losses |
|
$ |
663 |
|
$ |
654 |
|
$ |
598 |
|
$ |
643 |
|
$ |
694 |
|
8% |
|
5% |
As a % of Average Loans |
|
|
5.36% |
|
|
5.34% |
|
|
4.77% |
|
|
5.05% |
|
|
5.53% |
|
|
|
|
Net Credit Margin (4) |
|
$ |
1,007 |
|
$ |
953 |
|
$ |
1,113 |
|
$ |
1,061 |
|
$ |
1,048 |
|
(1%) |
|
4% |
As a % of Avg. Loans (4) |
|
|
8.14% |
|
|
7.79% |
|
|
8.88% |
|
|
8.34% |
|
|
8.35% |
|
|
|
|
Loans 90+ Days Past Due |
|
$ |
918 |
|
$ |
840 |
|
$ |
923 |
|
$ |
1,012 |
|
$ |
958 |
|
(5%) |
|
4% |
As a % of EOP Loans |
|
|
1.88% |
|
|
1.69% |
|
|
1.85% |
|
|
1.91% |
|
|
1.96% |
|
|
|
|
Loans 30-89 Days Past Due |
|
$ |
859 |
|
$ |
831 |
|
$ |
943 |
|
$ |
945 |
|
$ |
903 |
|
(4%) |
|
5% |
As a % of EOP Loans |
|
|
1.76% |
|
|
1.68% |
|
|
1.89% |
|
|
1.79% |
|
|
1.85% |
|
|
|
|
(1) |
Average loans, EOP loans and the related consumer delinquency amounts and ratios include interest and fees receivables balances. |
(2) |
Average yield is calculated as gross interest revenue earned on loans divided by average loans. |
(3) |
Net interest revenue includes certain fees that are recorded as interest revenue. |
(4) |
Net credit margin represents total revenues, net of interest expense, less net credit losses and policy benefits and claims. |
Reclassified to conform to the current period's presentation.
Page 10
GLOBAL CONSUMER BANKING
LATIN AMERICA (1)
Page 1
(In millions of dollars, except as otherwise noted)
|
|
|
|
|
|
|
|
|
|
|
1Q20 Increase/ |
|
||||||||
|
|
1Q |
|
2Q |
|
3Q |
|
4Q |
|
1Q |
|
(Decrease) from |
|
|||||||
|
|
2019 |
|
2019 |
|
2019 |
|
2019 |
|
2020 |
|
4Q19 |
|
1Q19 |
|
|||||
|
|
|
|
|
|
|
|
|
|
|
|
|
|
|
|
|
||||
Net Interest Revenue |
|
$ |
877 |
|
$ |
918 |
|
$ |
913 |
|
$ |
931 |
|
$ |
887 |
|
(5%) |
|
1% |
|
Non-Interest Revenue (2) |
|
|
395 |
|
|
402 |
|
|
356 |
|
|
446 |
|
|
312 |
|
(30%) |
|
(21%) |
|
Total Revenues, Net of Interest Expense |
|
|
1,272 |
|
|
1,320 |
|
|
1,269 |
|
|
1,377 |
|
|
1,199 |
|
(13%) |
|
(6%) |
|
Total Operating Expenses |
|
|
673 |
|
|
704 |
|
|
724 |
|
|
782 |
|
|
699 |
|
(11%) |
|
4% |
|
Net Credit Losses |
|
|
296 |
|
|
279 |
|
|
275 |
|
|
259 |
|
|
277 |
|
7% |
|
(6%) |
|
Credit Reserve Build / (Release) |
|
|
(2) |
|
|
3 |
|
|
(34) |
|
|
(5) |
|
|
265 |
|
NM |
|
NM |
|
Provision for Unfunded Lending Commitments |
|
|
- |
|
|
- |
|
|
- |
|
|
- |
|
|
- |
|
- |
|
- |
|
Provisions for Benefits and Claims, HTM Debt Securities and Other Assets |
|
|
6 |
|
|
13 |
|
|
13 |
|
|
22 |
|
|
15 |
|
(32%) |
|
NM |
|
Provisions for Credit Losses and for Benefits and Claims (LLR & PBC) |
|
|
300 |
|
|
295 |
|
|
254 |
|
|
276 |
|
|
557 |
|
NM |
|
86% |
|
Income (Loss) from Continuing Operations before Taxes |
|
|
299 |
|
|
321 |
|
|
291 |
|
|
319 |
|
|
(57) |
|
NM |
|
NM |
|
Income Taxes (Benefits) |
|
|
83 |
|
|
87 |
|
|
74 |
|
|
85 |
|
|
(21) |
|
NM |
|
NM |
|
Income (Loss) from Continuing Operations |
|
|
216 |
|
|
234 |
|
|
217 |
|
|
234 |
|
|
(36) |
|
NM |
|
NM |
|
Noncontrolling Interests |
|
|
- |
|
|
- |
|
|
- |
|
|
- |
|
|
- |
|
- |
|
- |
|
Net Income (Loss) |
|
$ |
216 |
|
$ |
234 |
|
$ |
217 |
|
$ |
234 |
|
$ |
(36) |
|
NM |
|
NM |
|
Average Assets (in billions) |
|
$ |
33 |
|
$ |
34 |
|
$ |
35 |
|
$ |
37 |
|
$ |
35 |
|
(5%) |
|
6% |
|
Return on Average Assets |
|
|
2.65% |
|
|
2.76% |
|
|
2.46% |
|
|
2.51% |
|
|
(0.41%) |
|
|
|
|
|
Efficiency Ratio |
|
|
53% |
|
|
53% |
|
|
57% |
|
|
57% |
|
|
58% |
|
|
|
|
|
|
|
|
|
|
|
|
|
|
|
|
|
|
|
|
|
|
|
|
|
|
Net Credit Losses as a % of Average Loans |
|
|
6.98% |
|
|
6.54% |
|
|
6.42% |
|
|
5.91% |
|
|
6.67% |
|
|
|
|
|
|
|
|
|
|
|
|
|
|
|
|
|
|
|
|
|
|
|
|
|
|
Revenue by Business |
|
|
|
|
|
|
|
|
|
|
|
|
|
|
|
|
|
|
|
|
Retail Banking |
|
$ |
899 |
|
$ |
903 |
|
$ |
851 |
|
$ |
932 |
|
$ |
783 |
|
(16%) |
|
(13%) |
|
Citi-Branded Cards |
|
|
373 |
|
|
417 |
|
|
418 |
|
|
445 |
|
|
416 |
|
(7%) |
|
12% |
|
Total |
|
$ |
1,272 |
|
$ |
1,320 |
|
$ |
1,269 |
|
$ |
1,377 |
|
$ |
1,199 |
|
(13%) |
|
(6%) |
|
|
|
|
|
|
|
|
|
|
|
|
|
|
|
|
|
|
|
|
|
|
Net Credit Losses by Business |
|
|
|
|
|
|
|
|
|
|
|
|
|
|
|
|
|
|
|
|
Retail Banking |
|
$ |
136 |
|
$ |
123 |
|
$ |
119 |
|
$ |
116 |
|
$ |
130 |
|
12% |
|
(4%) |
|
Citi-Branded Cards |
|
|
160 |
|
|
156 |
|
|
156 |
|
|
143 |
|
|
147 |
|
3% |
|
(8%) |
|
Total |
|
$ |
296 |
|
$ |
279 |
|
$ |
275 |
|
$ |
259 |
|
$ |
277 |
|
7% |
|
(6%) |
|
|
|
|
|
|
|
|
|
|
|
|
|
|
|
|
|
|
|
|
|
|
Income from Continuing Operations by Business |
|
|
|
|
|
|
|
|
|
|
|
|
|
|
|
|
|
|
|
|
Retail Banking |
|
$ |
161 |
|
$ |
164 |
|
$ |
134 |
|
$ |
141 |
|
$ |
(23) |
|
NM |
|
NM |
|
Citi-Branded Cards |
|
|
55 |
|
|
70 |
|
|
83 |
|
|
93 |
|
|
(13) |
|
NM |
|
NM |
|
Total |
|
$ |
216 |
|
$ |
234 |
|
$ |
217 |
|
$ |
234 |
|
$ |
(36) |
|
NM |
|
NM |
|
|
|
|
|
|
|
|
|
|
|
|
|
|
|
|
|
|
|
|
|
|
FX Translation Impact |
|
|
|
|
|
|
|
|
|
|
|
|
|
|
|
|
|
|
|
|
Total Revenue - as Reported |
|
$ |
1,272 |
|
$ |
1,320 |
|
$ |
1,269 |
|
$ |
1,377 |
|
$ |
1,199 |
|
(13%) |
|
(6%) |
|
Impact of FX Translation (3) |
|
|
(74) |
|
|
(73) |
|
|
(54) |
|
|
(84) |
|
|
- |
|
|
|
|
|
Total Revenues - Ex-FX (3) |
|
$ |
1,198 |
|
$ |
1,247 |
|
$ |
1,215 |
|
$ |
1,293 |
|
$ |
1,199 |
|
(7%) |
|
- |
|
|
|
|
|
|
|
|
|
|
|
|
|
|
|
|
|
|
|
|
|
|
Total Operating Expenses - as Reported |
|
$ |
673 |
|
$ |
704 |
|
$ |
724 |
|
$ |
782 |
|
$ |
699 |
|
(11%) |
|
4% |
|
Impact of FX Translation (3) |
|
|
(36) |
|
|
(37) |
|
|
(30) |
|
|
(45) |
|
|
- |
|
|
|
|
|
Total Operating Expenses - Ex-FX (3) |
|
$ |
637 |
|
$ |
667 |
|
$ |
694 |
|
$ |
737 |
|
$ |
699 |
|
(5%) |
|
10% |
|
|
|
|
|
|
|
|
|
|
|
|
|
|
|
|
|
|
|
|
|
|
Total Provisions for LLR & PBC - as Reported |
|
$ |
300 |
|
$ |
295 |
|
$ |
254 |
|
$ |
276 |
|
$ |
557 |
|
NM |
|
86% |
|
Impact of FX Translation (3) |
|
|
(19) |
|
|
(20) |
|
|
(12) |
|
|
(18) |
|
|
- |
|
|
|
|
|
Total Provisions for LLR & PBC - Ex-FX (3) |
|
$ |
281 |
|
$ |
275 |
|
$ |
242 |
|
$ |
258 |
|
$ |
557 |
|
NM |
|
98% |
|
|
|
|
|
|
|
|
|
|
|
|
|
|
|
|
|
|
|
|
|
|
Net Income (Loss) - as Reported |
|
$ |
216 |
|
$ |
234 |
|
$ |
217 |
|
$ |
234 |
|
$ |
(36) |
|
NM |
|
NM |
|
Impact of FX Translation (3) |
|
|
(12) |
|
|
(12) |
|
|
(8) |
|
|
(14) |
|
|
- |
|
|
|
|
|
Total Net Income (Loss) - Ex-FX (3) |
|
$ |
204 |
|
$ |
222 |
|
$ |
209 |
|
$ |
220 |
|
$ |
(36) |
|
NM |
|
NM |
|
(1)Latin America GCB consists of Citi's consumer banking operations in Mexico.
(2)3Q18 includes an approximate $250 million gain on the sale of an asset management business.
(3)Reflects the impact of foreign currency (FX) translation into U.S. dollars at the 1Q20 average exchange rates for all periods presented.
Citigroup's results of operations excluding the impact of FX translation are non-GAAP financial measures.
NM Not meaningful.
Reclassified to conform to the current period's presentation.
Page 11
GLOBAL CONSUMER BANKING
LATIN AMERICA
Page 2
|
|
|
|
|
|
|
|
|
|
|
|
|
|
|
|
1Q20 Increase/ |
||||
|
|
1Q |
|
2Q |
|
3Q |
|
4Q |
|
1Q |
|
(Decrease) from |
||||||||
|
|
2019 |
|
2019 |
|
2019 |
|
2019 |
|
2020 |
|
4Q19 |
|
1Q19 |
||||||
|
|
|
|
|
|
|
|
|
|
|
|
|
|
|
|
|
|
|
|
|
Retail Banking Key Indicators (in billions of dollars, except as otherwise noted) |
|
|
|
|
|
|
|
|
|
|
|
|
|
|
|
|
|
|
|
|
Branches (actual) |
|
|
1,464 |
|
|
1,459 |
|
|
1,458 |
|
|
1,419 |
|
|
1,411 |
|
(1%) |
|
(4%) |
|
Accounts (in millions) |
|
|
30.0 |
|
|
30.3 |
|
|
30.3 |
|
|
30.1 |
|
|
29.9 |
|
(1%) |
|
- |
|
Average Deposits |
|
$ |
22.7 |
|
$ |
22.8 |
|
$ |
22.5 |
|
$ |
23.0 |
|
$ |
22.9 |
|
- |
|
1% |
|
Investment Sales |
|
$ |
3.4 |
|
$ |
3.4 |
|
$ |
3.4 |
|
$ |
3.7 |
|
$ |
3.7 |
|
- |
|
9% |
|
Investment AUMs |
|
$ |
30.2 |
|
$ |
30.7 |
|
$ |
31.7 |
|
$ |
33.7 |
|
$ |
26.6 |
|
(21%) |
|
(12%) |
|
Average Loans |
|
$ |
11.5 |
|
$ |
11.5 |
|
$ |
11.4 |
|
$ |
11.6 |
|
$ |
11.1 |
|
(4%) |
|
(3%) |
|
EOP Loans: |
|
|
|
|
|
|
|
|
|
|
|
|
|
|
|
|
|
|
|
|
Mortgages |
|
$ |
4.1 |
|
$ |
4.2 |
|
$ |
4.2 |
|
$ |
4.4 |
|
$ |
3.5 |
|
(20%) |
|
(15%) |
|
Personal, Small Business and Other |
|
|
7.2 |
|
|
7.2 |
|
|
7.0 |
|
|
7.3 |
|
|
5.7 |
|
(22%) |
|
(21%) |
|
Total EOP Loans |
|
$ |
11.3 |
|
$ |
11.4 |
|
$ |
11.2 |
|
$ |
11.7 |
|
$ |
9.2 |
|
(21%) |
|
(19%) |
|
|
|
|
|
|
|
|
|
|
|
|
|
|
|
|
|
|
|
|
|
|
Total Net Interest Revenue (in millions)(1) |
|
$ |
574 |
|
$ |
578 |
|
$ |
572 |
|
$ |
578 |
|
$ |
548 |
|
(5%) |
|
(5%) |
|
As a % of Average Loans (1) |
|
|
20.24% |
|
|
20.16% |
|
|
19.91% |
|
|
19.77% |
|
|
19.86% |
|
|
|
|
|
Net Credit Losses (in millions) |
|
$ |
136 |
|
$ |
123 |
|
$ |
119 |
|
$ |
116 |
|
$ |
130 |
|
12% |
|
(4%) |
|
As a % of Average Loans |
|
|
4.80% |
|
|
4.29% |
|
|
4.14% |
|
|
3.97% |
|
|
4.71% |
|
|
|
|
|
Loans 90+ Days Past Due (in millions) |
|
$ |
95 |
|
$ |
108 |
|
$ |
97 |
|
$ |
106 |
|
$ |
90 |
|
(15%) |
|
(5%) |
|
As a % of EOP Loans |
|
|
0.84% |
|
|
0.95% |
|
|
0.87% |
|
|
0.91% |
|
|
0.98% |
|
|
|
|
|
Loans 30-89 Days Past Due (in millions) |
|
$ |
185 |
|
$ |
191 |
|
$ |
191 |
|
$ |
180 |
|
$ |
140 |
|
(22%) |
|
(24%) |
|
As a % of EOP Loans |
|
|
1.64% |
|
|
1.68% |
|
|
1.71% |
|
|
1.54% |
|
|
1.52% |
|
|
|
|
|
|
|
|
|
|
|
|
|
|
|
|
|
|
|
|
|
|
|
|
|
|
Citi-Branded Cards Key Indicators (in billions of dollars, except as otherwise noted) |
|
|
|
|
|
|
|
|
|
|
|
|
|
|
|
|
|
|
|
|
EOP Open Accounts (in millions) |
|
|
5.5 |
|
|
5.4 |
|
|
5.3 |
|
|
5.3 |
|
|
5.2 |
|
(2%) |
|
(5%) |
|
Purchase Sales |
|
$ |
4.4 |
|
$ |
4.7 |
|
$ |
4.7 |
|
$ |
5.4 |
|
$ |
4.0 |
|
(26%) |
|
(9%) |
|
Average Loans (2) |
|
$ |
5.7 |
|
$ |
5.6 |
|
$ |
5.6 |
|
$ |
5.8 |
|
$ |
5.6 |
|
(3%) |
|
(2%) |
|
EOP Loans (2) |
|
$ |
5.6 |
|
$ |
5.7 |
|
$ |
5.5 |
|
$ |
6.0 |
|
$ |
4.5 |
|
(25%) |
|
(20%) |
|
Average Yield (3) |
|
|
23.68% |
|
|
25.21% |
|
|
24.97% |
|
|
24.91% |
|
|
25.03% |
|
- |
|
6% |
|
|
|
|
|
|
|
|
|
|
|
|
|
|
|
|
|
|
|
|
|
|
Total Net Interest Revenue (in millions) (4) |
|
$ |
303 |
|
$ |
340 |
|
$ |
341 |
|
$ |
353 |
|
$ |
339 |
|
(4%) |
|
12% |
|
As a % of Average Loans (4) |
|
|
21.56% |
|
|
24.35% |
|
|
24.16% |
|
|
24.15% |
|
|
24.35% |
|
|
|
|
|
Net Credit Losses (in millions) |
|
$ |
160 |
|
$ |
156 |
|
$ |
156 |
|
$ |
143 |
|
$ |
147 |
|
3% |
|
(8%) |
|
As a % of Average Loans |
|
|
11.38% |
|
|
11.17% |
|
|
11.05% |
|
|
9.78% |
|
|
10.56% |
|
|
|
|
|
Net Credit Margin (in millions) (5) |
|
$ |
220 |
|
$ |
268 |
|
$ |
269 |
|
$ |
307 |
|
$ |
274 |
|
(11%) |
|
25% |
|
As a % of Average Loans (5) |
|
|
15.65% |
|
|
19.20% |
|
|
19.06% |
|
|
21.00% |
|
|
19.68% |
|
|
|
|
|
Loans 90+ Days Past Due (in millions) |
|
$ |
165 |
|
$ |
169 |
|
$ |
152 |
|
$ |
165 |
|
$ |
121 |
|
(27%) |
|
(27%) |
|
As a % of EOP Loans |
|
|
2.95% |
|
|
2.96% |
|
|
2.76% |
|
|
2.75% |
|
|
2.69% |
|
|
|
|
|
Loans 30-89 Days Past Due (in millions) |
|
$ |
161 |
|
$ |
159 |
|
$ |
161 |
|
$ |
159 |
|
$ |
132 |
|
(17%) |
|
(18%) |
|
As a % of EOP Loans |
|
|
2.88% |
|
|
2.79% |
|
|
2.93% |
|
|
2.65% |
|
|
2.93% |
|
|
|
|
(1) |
Also includes net interest revenue related to the region's average deposit balances in excess of the average loan portfolio. |
(2) |
Average loans, EOP loans and the related consumer delinquency amounts and ratios include interest and fees receivables balances. |
(3) |
Average yield is gross interest revenue earned on loans divided by average loans. |
(4) |
Net interest revenue includes certain fees that are recorded as interest revenue. |
(5) |
Net credit margin is total revenues, net of interest expense, less net credit losses and policy benefits and claims. |
NM Not meaningful.
Reclassified to conform to the current period's presentation.
Page 12
GLOBAL CONSUMER BANKING
ASIA (1)
PAGE 1
(In millions of dollars, except as otherwise noted)
|
|
|
|
|
|
|
|
|
|
|
|
1Q20 Increase/ |
|||||||
|
|
1Q |
|
2Q |
|
3Q |
|
4Q |
|
1Q |
|
(Decrease) from |
|||||||
|
|
2019 |
|
2019 |
|
2019 |
|
2019 |
|
2020 |
|
4Q19 |
|
1Q19 |
|||||
|
|
|
|
|
|
|
|
|
|
|
|
|
|
|
|||||
Net Interest Revenue |
|
$ |
1,166 |
|
$ |
1,170 |
|
$ |
1,173 |
|
$ |
1,188 |
|
$ |
1,149 |
|
(3%) |
|
(1%) |
Non-Interest Revenue |
|
|
652 |
|
|
677 |
|
|
668 |
|
|
641 |
|
|
602 |
|
(6%) |
|
(8%) |
Total Revenues, Net of Interest Expense |
|
|
1,818 |
|
|
1,847 |
|
|
1,841 |
|
|
1,829 |
|
|
1,751 |
|
(4%) |
|
(4%) |
Total Operating Expenses |
|
|
1,171 |
|
|
1,146 |
|
|
1,133 |
|
|
1,141 |
|
|
1,133 |
|
(1%) |
|
(3%) |
Net Credit Losses |
|
|
164 |
|
|
174 |
|
|
177 |
|
|
175 |
|
|
180 |
|
3% |
|
10% |
Credit Reserve Build / (Release) |
|
|
(20) |
|
|
10 |
|
|
2 |
|
|
16 |
|
|
202 |
|
NM |
|
NM |
Provision for Unfunded Lending Commitments |
|
|
- |
|
|
- |
|
|
- |
|
|
- |
|
|
- |
|
- |
|
- |
Provisions for Benefits and Claims, HTM Debt Securities and Other Assets |
|
|
- |
|
|
- |
|
|
- |
|
|
- |
|
|
- |
|
- |
|
- |
Provisions for Credit Losses and for Benefits and Claims (LLR & PBC) |
|
|
144 |
|
|
184 |
|
|
179 |
|
|
191 |
|
|
382 |
|
100% |
|
NM |
Income from Continuing Operations before Taxes |
|
|
503 |
|
|
517 |
|
|
529 |
|
|
497 |
|
|
236 |
|
(53%) |
|
(53%) |
Income Taxes |
|
|
106 |
|
|
113 |
|
|
127 |
|
|
123 |
|
|
45 |
|
(63%) |
|
(58%) |
Income from Continuing Operations |
|
|
397 |
|
|
404 |
|
|
402 |
|
|
374 |
|
|
191 |
|
(49%) |
|
(52%) |
Noncontrolling Interests |
|
|
- |
|
|
1 |
|
|
2 |
|
|
3 |
|
|
(1) |
|
NM |
|
(100%) |
Net Income |
|
$ |
397 |
|
$ |
403 |
|
$ |
400 |
|
$ |
371 |
|
$ |
192 |
|
(48%) |
|
(52%) |
Average Assets (in billions) |
|
$ |
121 |
|
$ |
121 |
|
$ |
122 |
|
$ |
125 |
|
$ |
125 |
|
- |
|
3% |
Return on Average Assets |
|
|
1.33% |
|
|
1.34% |
|
|
1.30% |
|
|
1.18% |
|
|
0.62% |
|
|
|
|
Efficiency Ratio |
|
|
64% |
|
|
62% |
|
|
62% |
|
|
62% |
|
|
65% |
|
|
|
|
|
|
|
|
|
|
|
|
|
|
|
|
|
|
|
|
|
|
|
|
Net Credit Losses as a % of Average Loans |
|
|
0.85% |
|
|
0.90% |
|
|
0.90% |
|
|
0.86% |
|
|
0.90% |
|
|
|
|
|
|
|
|
|
|
|
|
|
|
|
|
|
|
|
|
|
|
|
|
Revenue by Business |
|
|
|
|
|
|
|
|
|
|
|
|
|
|
|
|
|
|
|
Retail Banking |
|
$ |
1,076 |
|
$ |
1,140 |
|
$ |
1,135 |
|
$ |
1,084 |
|
$ |
1,133 |
|
5% |
|
5% |
Citi-Branded Cards |
|
|
742 |
|
|
707 |
|
|
706 |
|
|
745 |
|
|
618 |
|
(17%) |
|
(17%) |
Total |
|
$ |
1,818 |
|
$ |
1,847 |
|
$ |
1,841 |
|
$ |
1,829 |
|
$ |
1,751 |
|
(4%) |
|
(4%) |
|
|
|
|
|
|
|
|
|
|
|
|
|
|
|
|
|
|
|
|
Net Credit Losses by Business |
|
|
|
|
|
|
|
|
|
|
|
|
|
|
|
|
|
|
|
Retail Banking |
|
$ |
58 |
|
$ |
62 |
|
$ |
66 |
|
$ |
69 |
|
$ |
68 |
|
(1%) |
|
17% |
Citi-Branded Cards |
|
|
106 |
|
|
112 |
|
|
111 |
|
|
106 |
|
|
112 |
|
6% |
|
6% |
Total |
|
$ |
164 |
|
$ |
174 |
|
$ |
177 |
|
$ |
175 |
|
$ |
180 |
|
3% |
|
10% |
|
|
|
|
|
|
|
|
|
|
|
|
|
|
|
|
|
|
|
|
Income from Continuing Operations by Business |
|
|
|
|
|
|
|
|
|
|
|
|
|
|
|
|
|
|
|
Retail Banking |
|
$ |
227 |
|
$ |
297 |
|
$ |
291 |
|
$ |
231 |
|
$ |
216 |
|
(6%) |
|
(5%) |
Citi-Branded Cards |
|
|
170 |
|
|
107 |
|
|
111 |
|
|
143 |
|
|
(25) |
|
NM |
|
NM |
Total |
|
$ |
397 |
|
$ |
404 |
|
$ |
402 |
|
$ |
374 |
|
$ |
191 |
|
(49%) |
|
(52%) |
|
|
|
|
|
|
|
|
|
|
|
|
|
|
|
|
|
|
|
|
FX Translation Impact |
|
|
|
|
|
|
|
|
|
|
|
|
|
|
|
|
|
|
|
Total Revenue - as Reported |
|
$ |
1,818 |
|
$ |
1,847 |
|
$ |
1,841 |
|
$ |
1,829 |
|
$ |
1,751 |
|
(4%) |
|
(4%) |
Impact of FX Translation (2) |
|
|
(41) |
|
|
(31) |
|
|
(18) |
|
|
(36) |
|
|
- |
|
|
|
|
Total Revenues - Ex-FX (2) |
|
$ |
1,777 |
|
$ |
1,816 |
|
$ |
1,823 |
|
$ |
1,793 |
|
$ |
1,751 |
|
(2%) |
|
(1%) |
|
|
|
|
|
|
|
|
|
|
|
|
|
|
|
|
|
|
|
|
Total Operating Expenses - as Reported |
|
$ |
1,171 |
|
$ |
1,146 |
|
$ |
1,133 |
|
$ |
1,141 |
|
$ |
1,133 |
|
(1%) |
|
(3%) |
Impact of FX Translation (2) |
|
|
(30) |
|
|
(19) |
|
|
(8) |
|
|
(22) |
|
|
- |
|
|
|
|
Total Operating Expenses - Ex-FX (2) |
|
$ |
1,141 |
|
$ |
1,127 |
|
$ |
1,125 |
|
$ |
1,119 |
|
$ |
1,133 |
|
1% |
|
(1%) |
|
|
|
|
|
|
|
|
|
|
|
|
|
|
|
|
|
|
|
|
Provisions for LLR & PBC - as Reported |
|
$ |
144 |
|
$ |
184 |
|
$ |
179 |
|
$ |
191 |
|
$ |
382 |
|
100% |
|
NM |
Impact of FX Translation (2) |
|
|
(7) |
|
|
(5) |
|
|
(4) |
|
|
(4) |
|
|
- |
|
|
|
|
Total Provisions for LLR & PBC - Ex-FX (2) |
|
$ |
137 |
|
$ |
179 |
|
$ |
175 |
|
$ |
187 |
|
$ |
382 |
|
NM |
|
NM |
|
|
|
|
|
|
|
|
|
|
|
|
|
|
|
|
|
|
|
|
Net Income - as Reported |
|
$ |
397 |
|
$ |
403 |
|
$ |
400 |
|
$ |
371 |
|
$ |
192 |
|
(48%) |
|
(52%) |
Impact of FX Translation (2) |
|
|
(3) |
|
|
(4) |
|
|
(4) |
|
|
(7) |
|
|
- |
|
|
|
|
Total Net Income - Ex-FX (2) |
|
$ |
394 |
|
$ |
399 |
|
$ |
396 |
|
$ |
364 |
|
$ |
192 |
|
(47%) |
|
(51%) |
(1)Asia GCB includes the results of operations of GCB activities in certain EMEA countries for all periods presented.
(2)Reflects the impact of foreign currency (FX) translation into U.S. dollars at the 1Q20 average exchange rates for all periods presented.
Citigroup's results of operations excluding the impact of FX translation are non-GAAP financial measures.
NM Not meaningful.
Reclassified to conform to the current period's presentation.
Page 13
GLOBAL CONSUMER BANKING
ASIA (1)
PAGE 2
|
|
|
|
|
|
|
|
|
|
|
|
|
|
|
|
|
1Q20 Increase/ |
||
|
|
1Q |
|
2Q |
|
3Q |
|
4Q |
|
1Q |
|
(Decrease) from |
|||||||
|
|
2019 |
|
2019 |
|
2019 |
|
2019 |
|
2020 |
|
4Q19 |
|
1Q19 |
|||||
|
|
|
|
|
|
|
|
|
|
|
|
|
|
|
|
|
|
|
|
Retail Banking Key Indicators (in billions of dollars, except as otherwise noted) |
|
|
|
|
|
|
|
|
|
|
|
|
|
|
|
|
|
|
|
Branches (actual) |
|
|
251 |
|
|
252 |
|
|
249 |
|
|
242 |
|
|
236 |
|
(2%) |
|
(6%) |
Accounts (in millions) |
|
|
15.9 |
|
|
16.1 |
|
|
16.4 |
|
|
16.7 |
|
|
16.9 |
|
1% |
|
6% |
Average Deposits |
|
$ |
99.4 |
|
$ |
100.8 |
|
$ |
100.7 |
|
$ |
103.4 |
|
$ |
105.9 |
|
2% |
|
7% |
Investment Sales |
|
$ |
8.9 |
|
$ |
9.8 |
|
$ |
10.9 |
|
$ |
9.2 |
|
$ |
13.5 |
|
47% |
|
52% |
Investment AUMs |
|
$ |
64.0 |
|
$ |
65.4 |
|
$ |
65.4 |
|
$ |
68.9 |
|
$ |
56.0 |
|
(19%) |
|
(13%) |
Average Loans |
|
$ |
58.8 |
|
$ |
58.8 |
|
$ |
59.5 |
|
$ |
61.6 |
|
$ |
61.5 |
|
- |
|
5% |
EOP Loans: |
|
|
|
|
|
|
|
|
|
|
|
|
|
|
|
|
|
|
|
Mortgages |
|
$ |
32.0 |
|
$ |
32.4 |
|
$ |
32.5 |
|
$ |
33.2 |
|
$ |
31.9 |
|
(4%) |
|
- |
Personal, Small Business and Other |
|
|
27.1 |
|
|
27.7 |
|
|
27.8 |
|
|
29.6 |
|
|
28.3 |
|
(4%) |
|
4% |
Total EOP Loans |
|
$ |
59.1 |
|
$ |
60.1 |
|
$ |
60.3 |
|
$ |
62.8 |
|
$ |
60.2 |
|
(4%) |
|
2% |
|
|
|
|
|
|
|
|
|
|
|
|
|
|
|
|
|
|
|
|
Total Net Interest Revenue (in millions)(2) |
|
$ |
676 |
|
$ |
682 |
|
$ |
676 |
|
$ |
673 |
|
$ |
658 |
|
(2%) |
|
(3%) |
As a % of Average Loans (2) |
|
|
4.66% |
|
|
4.65% |
|
|
4.51% |
|
|
4.33% |
|
|
4.30% |
|
|
|
|
Net Credit Losses (in millions) |
|
$ |
58 |
|
$ |
62 |
|
$ |
66 |
|
$ |
69 |
|
$ |
68 |
|
(1%) |
|
17% |
As a % of Average Loans |
|
|
0.40% |
|
|
0.42% |
|
|
0.44% |
|
|
0.44% |
|
|
0.44% |
|
|
|
|
Loans 90+ Days Past Due (in millions) |
|
$ |
167 |
|
$ |
175 |
|
$ |
170 |
|
$ |
186 |
|
$ |
178 |
|
(4%) |
|
7% |
As a % of EOP Loans |
|
|
0.28% |
|
|
0.29% |
|
|
0.28% |
|
|
0.30% |
|
|
0.30% |
|
|
|
|
Loans 30-89 Days Past Due (in millions) |
|
$ |
296 |
|
$ |
299 |
|
$ |
299 |
|
$ |
302 |
|
$ |
356 |
|
18% |
|
20% |
As a % of EOP Loans |
|
|
0.50% |
|
|
0.50% |
|
|
0.50% |
|
|
0.48% |
|
|
0.59% |
|
|
|
|
|
|
|
|
|
|
|
|
|
|
|
|
|
|
|
|
|
|
|
|
Citi-Branded Cards Key Indicators (in billions of dollars, except as otherwise noted) |
|
|
|
|
|
|
|
|
|
|
|
|
|
|
|
|
|
|
|
EOP Open Accounts (in millions) |
|
|
15.2 |
|
|
15.2 |
|
|
15.2 |
|
|
15.2 |
|
|
15.2 |
|
- |
|
- |
Purchase Sales |
|
$ |
21.4 |
|
$ |
21.6 |
|
$ |
21.9 |
|
$ |
23.4 |
|
$ |
19.8 |
|
(15%) |
|
(7%) |
Average Loans (3) |
|
$ |
19.1 |
|
$ |
18.9 |
|
$ |
18.8 |
|
$ |
19.3 |
|
$ |
18.8 |
|
(3%) |
|
(2%) |
EOP Loans (3) |
|
$ |
18.8 |
|
$ |
19.2 |
|
$ |
18.8 |
|
$ |
19.9 |
|
$ |
17.3 |
|
(13%) |
|
(8%) |
Average Yield (4) |
|
|
12.42% |
|
|
12.33% |
|
|
12.39% |
|
|
12.42% |
|
|
12.37% |
|
- |
|
- |
|
|
|
|
|
|
|
|
|
|
|
|
|
|
|
|
|
|
|
|
Total Net Interest Revenue (in millions)(5) |
|
$ |
490 |
|
$ |
488 |
|
$ |
497 |
|
$ |
515 |
|
$ |
491 |
|
(5%) |
|
- |
As a % of Average Loans(6) |
|
|
10.40% |
|
|
10.36% |
|
|
10.49% |
|
|
10.59% |
|
|
10.50% |
|
|
|
|
Net Credit Losses (in millions) |
|
$ |
106 |
|
$ |
112 |
|
$ |
111 |
|
$ |
106 |
|
$ |
112 |
|
6% |
|
6% |
As a % of Average Loans |
|
|
2.25% |
|
|
2.38% |
|
|
2.34% |
|
|
2.18% |
|
|
2.40% |
|
|
|
|
Net Credit Margin (in millions)(6) |
|
$ |
636 |
|
$ |
595 |
|
$ |
595 |
|
$ |
639 |
|
$ |
506 |
|
(21%) |
|
(20%) |
As a % of Average Loans(6) |
|
|
13.50% |
|
|
12.63% |
|
|
12.56% |
|
|
13.14% |
|
|
10.83% |
|
|
|
|
Loans 90+ Days Past Due |
|
$ |
200 |
|
$ |
202 |
|
$ |
196 |
|
$ |
207 |
|
$ |
204 |
|
(1%) |
|
2% |
As a % of EOP Loans |
|
|
1.06% |
|
|
1.05% |
|
|
1.04% |
|
|
1.04% |
|
|
1.18% |
|
|
|
|
Loans 30-89 Days Past Due |
|
$ |
256 |
|
$ |
257 |
|
$ |
249 |
|
$ |
267 |
|
$ |
271 |
|
1% |
|
6% |
As a % of EOP Loans |
|
|
1.36% |
|
|
1.34% |
|
|
1.32% |
|
|
1.34% |
|
|
1.57% |
|
|
|
|
(1)Asia GCB includes the results of operations of GCB activities in certain EMEA countries for all periods presented.
(2)Also includes net interest revenue related to the region's average deposit balances in excess of the average loan portfolio.
(3)Average loans, EOP loans and the related consumer delinquency amounts and ratios include interest and fees receivables balances.
(4)Average yield is gross interest revenue earned on loans divided by average loans.
(5)Net interest revenue includes certain fees that are recorded as interest revenue.
(6)Net credit margin is total revenues, net of interest expense, less net credit losses and policy benefits and claims.
Reclassified to conform to the current period's presentation.
Page 14
INSTITUTIONAL CLIENTS GROUP
(In millions of dollars, except as otherwise noted)
|
|
|
|
|
|
|
|
|
|
|
|
1Q20 Increase/ |
|||||||
|
|
1Q |
|
2Q |
|
3Q |
|
4Q |
|
1Q |
|
(Decrease) from |
|||||||
|
|
2019 |
|
2019 |
|
2019 |
|
2019 |
|
2020 |
|
4Q19 |
|
1Q19 |
|||||
|
|
|
|
|
|
|
|
|
|
|
|
|
|
|
|||||
Commissions and Fees |
|
$ |
1,154 |
|
$ |
1,079 |
|
$ |
1,126 |
|
$ |
1,103 |
|
$ |
1,222 |
|
11% |
|
6% |
Administration and Other Fiduciary Fees |
|
|
683 |
|
|
709 |
|
|
707 |
|
|
657 |
|
|
691 |
|
5% |
|
1% |
Investment Banking |
|
|
1,113 |
|
|
1,101 |
|
|
1,045 |
|
|
1,181 |
|
|
1,231 |
|
4% |
|
11% |
Principal Transactions |
|
|
2,638 |
|
|
1,936 |
|
|
2,583 |
|
|
1,405 |
|
|
5,359 |
|
NM |
|
NM |
Other (1) |
|
|
280 |
|
|
721 |
|
|
319 |
|
|
509 |
|
|
(114) |
|
NM |
|
NM |
Total Non-Interest Revenue |
|
|
5,868 |
|
|
5,546 |
|
|
5,780 |
|
|
4,855 |
|
|
8,389 |
|
73% |
|
43% |
Net Interest Revenue (including Dividends) |
|
|
4,150 |
|
|
4,509 |
|
|
4,071 |
|
|
4,522 |
|
|
4,095 |
|
(9%) |
|
(1%) |
Total Revenues, Net of Interest Expense |
|
|
10,018 |
|
|
10,055 |
|
|
9,851 |
|
|
9,377 |
|
|
12,484 |
|
33% |
|
25% |
Total Operating Expenses |
|
|
5,619 |
|
|
5,548 |
|
|
5,611 |
|
|
5,446 |
|
|
5,810 |
|
7% |
|
3% |
Net Credit Losses |
|
|
78 |
|
|
91 |
|
|
110 |
|
|
115 |
|
|
127 |
|
10% |
|
63% |
Credit Reserve Build / (Release) |
|
|
(74) |
|
|
52 |
|
|
36 |
|
|
57 |
|
|
1,316 |
|
NM |
|
NM |
Provision for Unfunded Lending Commitments |
|
|
28 |
|
|
(11) |
|
|
7 |
|
|
74 |
|
|
553 |
|
NM |
|
NM |
Provisions for Benefits and Claims, HTM Debt Securities and Other Assets |
|
|
- |
|
|
- |
|
|
- |
|
|
- |
|
|
8 |
|
NM |
|
NM |
Provisions for Credit Losses and for Benefits and Claims |
|
|
32 |
|
|
132 |
|
|
153 |
|
|
246 |
|
|
2,004 |
|
NM |
|
NM |
Income from Continuing Operations before Taxes |
|
|
4,367 |
|
|
4,375 |
|
|
4,087 |
|
|
3,685 |
|
|
4,670 |
|
27% |
|
7% |
Income Taxes |
|
|
955 |
|
|
950 |
|
|
858 |
|
|
807 |
|
|
1,044 |
|
29% |
|
9% |
Income from Continuing Operations |
|
|
3,412 |
|
|
3,425 |
|
|
3,229 |
|
|
2,878 |
|
|
3,626 |
|
26% |
|
6% |
Noncontrolling Interests |
|
|
11 |
|
|
10 |
|
|
8 |
|
|
11 |
|
|
(1) |
|
NM |
|
NM |
Net Income |
|
$ |
3,401 |
|
$ |
3,415 |
|
$ |
3,221 |
|
$ |
2,867 |
|
$ |
3,627 |
|
27% |
|
7% |
EOP Assets (in billions) |
|
$ |
1,472 |
|
$ |
1,501 |
|
$ |
1,525 |
|
$ |
1,447 |
|
$ |
1,723 |
|
19% |
|
17% |
Average Assets (in billions) |
|
|
1,460 |
|
|
1,497 |
|
|
1,511 |
|
|
1,503 |
|
|
1,580 |
|
5% |
|
8% |
Return on Average Assets (ROA) |
|
|
0.94% |
|
|
0.91% |
|
|
0.85% |
|
|
0.76% |
|
|
0.92% |
|
|
|
|
Efficiency Ratio |
|
|
56% |
|
|
55% |
|
|
57% |
|
|
58% |
|
|
47% |
|
|
|
|
|
|
|
|
|
|
|
|
|
|
|
|
|
|
|
|
|
|
|
|
Revenue by Region |
|
|
|
|
|
|
|
|
|
|
|
|
|
|
|
|
|
|
|
North America |
|
$ |
3,269 |
|
$ |
3,632 |
|
$ |
3,244 |
|
$ |
3,314 |
|
$ |
4,947 |
|
49% |
|
51% |
EMEA |
|
|
3,170 |
|
|
2,960 |
|
|
3,138 |
|
|
2,738 |
|
|
3,470 |
|
27% |
|
9% |
Latin America |
|
|
1,268 |
|
|
1,307 |
|
|
1,294 |
|
|
1,297 |
|
|
1,418 |
|
9% |
|
12% |
Asia |
|
|
2,311 |
|
|
2,156 |
|
|
2,175 |
|
|
2,028 |
|
|
2,649 |
|
31% |
|
15% |
Total Revenues, net of Interest Expense |
|
$ |
10,018 |
|
$ |
10,055 |
|
$ |
9,851 |
|
$ |
9,377 |
|
$ |
12,484 |
|
33% |
|
25% |
|
|
|
|
|
|
|
|
|
|
|
|
|
|
|
|
|
|
|
|
Income (loss) from Continuing Operations by Region |
|
|
|
|
|
|
|
|
|
|
|
|
|
|
|
|
|
|
|
North America |
|
$ |
748 |
|
$ |
1,050 |
|
$ |
818 |
|
$ |
895 |
|
$ |
896 |
|
- |
|
20% |
EMEA |
|
|
1,125 |
|
|
1,005 |
|
|
1,060 |
|
|
677 |
|
|
1,035 |
|
53% |
|
(8%) |
Latin America |
|
|
540 |
|
|
519 |
|
|
487 |
|
|
565 |
|
|
526 |
|
(7%) |
|
(3%) |
Asia |
|
|
999 |
|
|
851 |
|
|
864 |
|
|
741 |
|
|
1,169 |
|
58% |
|
17% |
Income from Continuing Operations |
|
$ |
3,412 |
|
$ |
3,425 |
|
$ |
3,229 |
|
$ |
2,878 |
|
$ |
3,626 |
|
26% |
|
6% |
|
|
|
|
|
|
|
|
|
|
|
|
|
|
|
|
|
|
|
|
Average Loans by Region (in billions) |
|
|
|
|
|
|
|
|
|
|
|
|
|
|
|
|
|
|
|
North America |
|
$ |
185 |
|
$ |
188 |
|
$ |
189 |
|
$ |
191 |
|
$ |
196 |
|
3% |
|
6% |
EMEA |
|
|
84 |
|
|
85 |
|
|
88 |
|
|
89 |
|
|
88 |
|
(1%) |
|
5% |
Latin America |
|
|
42 |
|
|
41 |
|
|
39 |
|
|
38 |
|
|
38 |
|
- |
|
(10%) |
Asia |
|
|
74 |
|
|
73 |
|
|
73 |
|
|
73 |
|
|
73 |
|
- |
|
(1%) |
Total |
|
$ |
385 |
|
$ |
387 |
|
$ |
389 |
|
$ |
391 |
|
$ |
395 |
|
1% |
|
3% |
|
|
|
|
|
|
|
|
|
|
|
|
|
|
|
|
|
|
|
|
EOP Deposits by Region (in billions) |
|
|
|
|
|
|
|
|
|
|
|
|
|
|
|
|
|
|
|
North America |
|
$ |
349 |
|
$ |
356 |
|
$ |
393 |
|
$ |
375 |
|
$ |
444 |
|
19% |
|
28% |
EMEA |
|
|
197 |
|
|
196 |
|
|
195 |
|
|
190 |
|
|
210 |
|
11% |
|
7% |
Latin America |
|
|
34 |
|
|
34 |
|
|
34 |
|
|
36 |
|
|
36 |
|
- |
|
6% |
Asia |
|
|
159 |
|
|
166 |
|
|
173 |
|
|
167 |
|
|
188 |
|
12% |
|
18% |
Total |
|
$ |
739 |
|
$ |
752 |
|
$ |
795 |
|
$ |
768 |
|
$ |
878 |
|
14% |
|
19% |
|
|
|
|
|
|
|
|
|
|
|
|
|
|
|
|
|
|
|
|
EOP Deposits by Business (in billions) |
|
|
|
|
|
|
|
|
|
|
|
|
|
|
|
|
|
|
|
Treasury and Trade Solutions |
|
$ |
512 |
|
$ |
525 |
|
$ |
548 |
|
$ |
536 |
|
$ |
621 |
|
16% |
|
21% |
All Other ICG Businesses |
|
|
227 |
|
|
227 |
|
|
247 |
|
|
232 |
|
|
257 |
|
11% |
|
13% |
Total |
|
$ |
739 |
|
$ |
752 |
|
$ |
795 |
|
$ |
768 |
|
$ |
878 |
|
14% |
|
19% |
(1) |
2Q19 includes a $355 million gain on Citi's investment in Tradeweb. |
NM Not meaningful.
Reclassified to conform to the current period's presentation.
Page 15
INSTITUTIONAL CLIENTS GROUP
REVENUES BY BUSINESS
(In millions of dollars, except as otherwise noted)
|
|
|
|
|
|
|
|
|
|
|
|
1Q20 Increase/ |
|||||||
|
|
1Q |
|
2Q |
|
3Q |
|
4Q |
|
1Q |
|
(Decrease) from |
|||||||
|
|
2019 |
|
2019 |
|
2019 |
|
2019 |
|
2020 |
|
4Q19 |
|
1Q19 |
|||||
Revenue Details |
|
|
|
|
|
|
|
|
|
|
|
|
|
|
|||||
Investment Banking |
|
|
|
|
|
|
|
|
|
|
|
|
|
|
|||||
Advisory |
|
$ |
378 |
|
$ |
232 |
|
$ |
276 |
|
$ |
373 |
|
$ |
386 |
|
3% |
|
2% |
Equity Underwriting |
|
|
172 |
|
|
314 |
|
|
247 |
|
|
240 |
|
|
180 |
|
(25%) |
|
5% |
Debt Underwriting |
|
|
804 |
|
|
737 |
|
|
705 |
|
|
738 |
|
|
784 |
|
6% |
|
(2%) |
Total Investment Banking |
|
|
1,354 |
|
|
1,283 |
|
|
1,228 |
|
|
1,351 |
|
|
1,350 |
|
- |
|
- |
Treasury and Trade Solutions |
|
|
2,539 |
|
|
2,587 |
|
|
2,559 |
|
|
2,608 |
|
|
2,423 |
|
(7%) |
|
(5%) |
Corporate Lending - Excluding Gain/(Loss) on Loan Hedges |
|
|
749 |
|
|
725 |
|
|
715 |
|
|
732 |
|
|
448 |
|
(39%) |
|
(40%) |
Private Bank |
|
|
880 |
|
|
866 |
|
|
865 |
|
|
847 |
|
|
949 |
|
12% |
|
8% |
Total Banking Revenues (Ex-Gain/(Loss) on Loan Hedges)(1) |
|
$ |
5,522 |
|
$ |
5,461 |
|
$ |
5,367 |
|
$ |
5,538 |
|
$ |
5,170 |
|
(7%) |
|
(6%) |
|
|
|
|
|
|
|
|
|
|
|
|
|
|
|
|
|
|
|
|
Corporate Lending - Gain/(Loss) on Loan Hedges(1) |
|
|
(231) |
|
|
(75) |
|
|
(33) |
|
|
(93) |
|
|
816 |
|
NM |
|
NM |
Total Banking Revenues including G/(L) on Loan Hedges(1) |
|
$ |
5,291 |
|
$ |
5,386 |
|
$ |
5,334 |
|
$ |
5,445 |
|
$ |
5,986 |
|
10% |
|
13% |
|
|
|
|
|
|
|
|
|
|
|
|
|
|
|
|
|
|
|
|
Fixed Income Markets |
|
$ |
3,452 |
|
$ |
3,323 |
|
$ |
3,211 |
|
$ |
2,898 |
|
$ |
4,790 |
|
65% |
|
39% |
Equity Markets |
|
|
842 |
|
|
790 |
|
|
760 |
|
|
516 |
|
|
1,169 |
|
NM |
|
39% |
Securities Services |
|
|
638 |
|
|
682 |
|
|
664 |
|
|
647 |
|
|
645 |
|
- |
|
1% |
Other |
|
|
(205) |
|
|
(126) |
|
|
(118) |
|
|
(129) |
|
|
(106) |
|
18% |
|
48% |
Total Markets and Securities Services |
|
$ |
4,727 |
|
$ |
4,669 |
|
$ |
4,517 |
|
$ |
3,932 |
|
$ |
6,498 |
|
65% |
|
37% |
|
|
|
|
|
|
|
|
|
|
|
|
|
|
|
|
|
|
|
|
Total Revenues, net of Interest Expense |
|
$ |
10,018 |
|
$ |
10,055 |
|
$ |
9,851 |
|
$ |
9,377 |
|
$ |
12,484 |
|
33% |
|
25% |
|
|
|
|
|
|
|
|
|
|
|
|
|
|
|
|
|
|
|
|
Taxable-equivalent adjustments (2) |
|
$ |
104 |
|
$ |
105 |
|
$ |
122 |
|
$ |
117 |
|
$ |
86 |
|
(26%) |
|
(17%) |
|
|
|
|
|
|
|
|
|
|
|
|
|
|
|
|
|
|
|
|
Total ICG Revenues including taxable-equivalent adjustments(2) |
|
$ |
10,122 |
|
$ |
10,160 |
|
$ |
9,973 |
|
$ |
9,494 |
|
$ |
12,570 |
|
32% |
|
24% |
|
|
|
|
|
|
|
|
|
|
|
|
|
|
|
|
|
|
|
|
Commissions and Fees |
|
$ |
174 |
|
$ |
198 |
|
$ |
194 |
|
$ |
216 |
|
$ |
189 |
|
(13%) |
|
9% |
Principal Transactions (3) |
|
|
2,377 |
|
|
1,870 |
|
|
2,080 |
|
|
1,334 |
|
|
3,549 |
|
NM |
|
49% |
Other (4) |
|
|
150 |
|
|
533 |
|
|
183 |
|
|
251 |
|
|
(59) |
|
NM |
|
NM |
Total Non-Interest Revenue |
|
$ |
2,701 |
|
$ |
2,601 |
|
$ |
2,457 |
|
$ |
1,801 |
|
$ |
3,679 |
|
NM |
|
36% |
Net Interest Revenue |
|
|
751 |
|
|
722 |
|
|
754 |
|
|
1,097 |
|
|
1,111 |
|
1% |
|
48% |
Total Fixed Income Markets |
|
$ |
3,452 |
|
$ |
3,323 |
|
$ |
3,211 |
|
$ |
2,898 |
|
$ |
4,790 |
|
65% |
|
39% |
|
|
|
|
|
|
|
|
|
|
|
|
|
|
|
|
|
|
|
|
Rates and Currencies |
|
$ |
2,402 |
|
$ |
2,118 |
|
$ |
2,491 |
|
$ |
2,214 |
|
$ |
4,038 |
|
82% |
|
68% |
Spread Products / Other Fixed Income |
|
|
1,050 |
|
|
1,205 |
|
|
720 |
|
|
684 |
|
|
752 |
|
10% |
|
(28%) |
Total Fixed Income Markets |
|
$ |
3,452 |
|
$ |
3,323 |
|
$ |
3,211 |
|
$ |
2,898 |
|
$ |
4,790 |
|
65% |
|
39% |
|
|
|
|
|
|
|
|
|
|
|
|
|
|
|
|
|
|
|
|
Commissions and Fees |
|
$ |
293 |
|
$ |
274 |
|
$ |
287 |
|
$ |
267 |
|
$ |
362 |
|
36% |
|
24% |
Principal Transactions (3) |
|
|
396 |
|
|
7 |
|
|
388 |
|
|
(16) |
|
|
774 |
|
NM |
|
95% |
Other |
|
|
7 |
|
|
10 |
|
|
2 |
|
|
153 |
|
|
8 |
|
(95%) |
|
14% |
Total Non-Interest Revenue |
|
$ |
696 |
|
$ |
291 |
|
$ |
677 |
|
$ |
404 |
|
$ |
1,144 |
|
NM |
|
64% |
Net Interest Revenue |
|
|
146 |
|
|
499 |
|
|
83 |
|
|
112 |
|
|
25 |
|
(78%) |
|
(83%) |
Total Equity Markets |
|
$ |
842 |
|
$ |
790 |
|
$ |
760 |
|
$ |
516 |
|
$ |
1,169 |
|
NM |
|
39% |
(1)Credit derivatives are used to economically hedge a portion of the corporate loan portfolio that includes both accrual loans and loans at fair value. Gain/(loss) on loan hedges includes the mark-to-market on the credit derivatives partially offset by the mark-to-market on the loans in the portfolio that are at fair value. Hedges on accrual loans reflect the mark-to-market on credit derivatives used to economically hedge the corporate loan accrual portfolio. The fixed premium costs of these hedges are netted against the private bank and corporate lending revenues to reflect the cost of credit protection. Citigroup’s results of operations excluding the impact of gain/(loss) on loan hedges are non-GAAP financial measures.
(2)Primarily relates to income tax credits related to affordable housing and alternative energy investments as well as tax exempt income from municipal bond investments.
(3)Excludes principal transactions revenues of ICG businesses other than Markets, primarily treasury and trade solutions and the private bank.
(4)2Q19 includes a $355 million gain on Citi's investment in Tradeweb.
NM Not meaningful.
Reclassified to conform to the current period's presentation.
Page 16
CORPORATE / OTHER (1)
(In millions of dollars, except as otherwise noted)
|
|
|
|
|
|
|
|
|
|
|
|
1Q20 Increase/ |
|||||||
|
|
1Q |
|
2Q |
|
3Q |
|
4Q |
|
1Q |
|
(Decrease) from |
|||||||
|
|
2019 |
|
2019 |
|
2019 |
|
2019 |
|
2020 |
|
4Q19 |
|
1Q19 |
|||||
Net Interest Revenue |
|
$ |
669 |
|
$ |
484 |
|
$ |
443 |
|
$ |
294 |
|
$ |
325 |
|
11% |
|
(51%) |
Non-interest revenue |
|
|
(201) |
|
|
86 |
|
|
(9) |
|
|
248 |
|
|
(252) |
|
NM |
|
(25%) |
Total Revenues, Net of Interest Expense |
|
|
468 |
|
|
570 |
|
|
434 |
|
|
542 |
|
|
73 |
|
(87%) |
|
(84%) |
Total Operating Expenses |
|
|
549 |
|
|
481 |
|
|
485 |
|
|
635 |
|
|
416 |
|
(34%) |
|
(24%) |
Net Credit Losses |
|
|
2 |
|
|
2 |
|
|
1 |
|
|
(13) |
|
|
(2) |
|
85% |
|
NM |
Credit Reserve Build / (Release) |
|
|
(26) |
|
|
(20) |
|
|
(16) |
|
|
2 |
|
|
191 |
|
NM |
|
NM |
Provisions for Benefits and Claims, HTM Debt Securities and Other Assets |
|
|
- |
|
|
- |
|
|
- |
|
|
- |
|
|
(2) |
|
NM |
|
NM |
Provision for Unfunded Lending Commitments |
|
|
(1) |
|
|
(4) |
|
|
- |
|
|
(2) |
|
|
5 |
|
NM |
|
NM |
Total provisions for credit losses and for benefits and claims |
|
|
(25) |
|
|
(22) |
|
|
(15) |
|
|
(13) |
|
|
192 |
|
NM |
|
NM |
Income from Continuing Operations before Taxes |
|
|
(56) |
|
|
111 |
|
|
(36) |
|
|
(80) |
|
|
(535) |
|
NM |
|
NM |
Income Taxes (Benefits) (2)(3)(4) |
|
|
(61) |
|
|
45 |
|
|
(247) |
|
|
(623) |
|
|
(198) |
|
68% |
|
NM |
Income (Loss) from Continuing Operations |
|
|
5 |
|
|
66 |
|
|
211 |
|
|
543 |
|
|
(337) |
|
NM |
|
NM |
Income (Loss) from Discontinued Operations, net of taxes |
|
|
(2) |
|
|
17 |
|
|
(15) |
|
|
(4) |
|
|
(18) |
|
NM |
|
NM |
Noncontrolling Interests |
|
|
14 |
|
|
(1) |
|
|
5 |
|
|
2 |
|
|
(4) |
|
NM |
|
NM |
Net Income (Loss) |
|
$ |
(11) |
|
$ |
84 |
|
$ |
191 |
|
$ |
537 |
|
$ |
(351) |
|
NM |
|
NM |
EOP Assets (in billions) |
|
$ |
107 |
|
$ |
97 |
|
$ |
96 |
|
$ |
97 |
|
$ |
94 |
|
(3%) |
|
(12%) |
Average Assets (in billions) |
|
|
99 |
|
|
98 |
|
|
97 |
|
|
95 |
|
|
94 |
|
(1%) |
|
(5%) |
Return on Average Assets |
|
|
(0.05%) |
|
|
0.34% |
|
|
0.78% |
|
|
2.24% |
|
|
(1.50%) |
|
|
|
|
Efficiency Ratio |
|
|
117% |
|
|
84% |
|
|
112% |
|
|
117% |
|
|
570% |
|
|
|
|
|
|
|
|
|
|
|
|
|
|
|
|
|
|
|
|
|
|
|
|
|
|
|
|
|
|
|
|
|
|
|
|
|
|
|
|
|
|
|
|
Consumer - North America - Key Indicators |
|
|
|
|
|
|
|
|
|
|
|
|
|
|
|
|
|
|
|
|
|
|
|
|
|
|
|
|
|
|
|
|
|
|
|
|
|
|
|
Average Loans (in billions of dollars) |
|
$ |
13.6 |
|
$ |
12.3 |
|
$ |
11.2 |
|
$ |
10.4 |
|
$ |
9.4 |
|
(10%) |
|
(31%) |
EOP Loans (in billions of dollars) |
|
|
12.6 |
|
|
12.0 |
|
|
11.0 |
|
|
10.0 |
|
|
9.1 |
|
(9%) |
|
(28%) |
Net Interest Revenue |
|
|
104 |
|
|
81 |
|
|
75 |
|
|
77 |
|
|
74 |
|
(4%) |
|
(29%) |
As a % of Average Loans |
|
|
3.10% |
|
|
2.64% |
|
|
2.66% |
|
|
2.94% |
|
|
3.17% |
|
|
|
|
Net Credit Losses (Recoveries) |
|
$ |
1 |
|
$ |
4 |
|
$ |
1 |
|
$ |
(12) |
|
$ |
- |
|
100% |
|
(100%) |
As a % of Average Loans |
|
|
0.03% |
|
|
0.13% |
|
|
0.04% |
|
|
(0.46%) |
|
|
0.00% |
|
|
|
|
Loans 90+ Days Past Due (4) |
|
$ |
354 |
|
$ |
327 |
|
$ |
293 |
|
$ |
278 |
|
$ |
281 |
|
1% |
|
(21%) |
As a % of EOP Loans |
|
|
2.97% |
|
|
2.97% |
|
|
2.82% |
|
|
3.02% |
|
|
3.23% |
|
|
|
|
Loans 30-89 Days Past Due (4) |
|
$ |
348 |
|
$ |
334 |
|
$ |
288 |
|
$ |
295 |
|
$ |
252 |
|
(15%) |
|
(28%) |
As a % of EOP Loans |
|
|
2.92% |
|
|
3.04% |
|
|
2.77% |
|
|
3.21% |
|
|
2.90% |
|
|
|
|
(1) |
Includes certain unallocated costs of global staff functions (including finance, risk, human resources, legal and compliance), other corporate expenses and unallocated global operations and technology expenses and income taxes, as well as Corporate Treasury, certain North America legacy consumer loan portfolios, other legacy assets and discontinued operations. |
(2) |
4Q19 includes discrete tax items of roughly $540 million, including an approximate $430 million benefit of a reduction in Citi’s valuation allowance related to its Deferred Tax Assets (DTAs). |
(3) |
3Q19 includes discrete tax items of roughly $230 million, including an approximate $180 million benefit of a reduction in Citi’s valuation allowance related to its DTAs. |
(4) |
The Loans 90+ Days Past Due and 30-89 Days Past Due and related ratios exclude U.S. mortgage loans that are guaranteed by U.S. government-sponsored agencies since the potential loss predominantly resides with the U.S. agencies. |
The amounts excluded for Loans 90+ Days Past Due and (EOP Loans) for each period were $309 million and ($0.7 billion), $273 million and ($0.7 billion), $249 million and ($0.6 billion), $172 million and ($0.4 billion), and $167 million and ($0.4 billion) as of March 31, 2019, June 30, 2019, September 30, 2019, December 31, 2019, and March 31, 2020, respectively.
The amounts excluded for Loans 30-89 Days Past Due and (EOP Loans) for each period were $118 million and ($0.7 billion), $124 million and ($0.7 billion), and $110 million and ($0.6 billion), $55 million and ($0.4 billion), and $58 million and ($0.4 billion) as of March 31, 2019, June 30, 2019, September 30, 2019, December 31, 2019, and March 31, 2020, respectively.
NM Not meaningful.
Reclassified to conform to the current period's presentation.
Page 17
AVERAGE BALANCES AND INTEREST RATES (1)(2)(3)(4)(5)
Taxable Equivalent Basis
|
|
Average Volumes |
|
Interest |
|
% Average Rate (4) |
|
|
||||||||||||||||||
|
|
First |
|
Fourth |
|
First |
|
First |
|
Fourth |
|
First |
|
First |
|
Fourth |
|
First |
|
|
||||||
|
|
Quarter |
|
Quarter |
|
Quarter |
|
Quarter |
|
Quarter |
|
Quarter |
|
Quarter |
|
Quarter |
|
Quarter |
|
|
||||||
In millions of dollars, except as otherwise noted |
|
2019 |
|
2019 |
|
2020(5) |
|
2019 |
|
2019 |
|
2020(5) |
|
2019 |
|
2019 |
|
2020(5) |
|
|
||||||
Assets |
||||||||||||||||||||||||||
Deposits with Banks |
|
$ |
171,369 |
|
$ |
195,268 |
|
$ |
207,130 |
|
$ |
607 |
|
$ |
603 |
|
$ |
527 |
|
1.44 |
% |
1.23 |
% |
1.02 |
% |
|
Securities Borrowed and Purchased under Resale Agreements(6) |
|
|
275,639 |
|
|
256,022 |
|
|
268,900 |
|
|
1,790 |
|
|
1,451 |
|
|
1,208 |
|
2.63 |
% |
2.25 |
% |
1.81 |
% |
|
Trading Account Assets(7) |
|
|
220,577 |
|
|
243,597 |
|
|
252,458 |
|
|
1,692 |
|
|
1,957 |
|
|
1,594 |
|
3.11 |
% |
3.19 |
% |
2.54 |
% |
|
Investments |
|
|
351,008 |
|
|
367,733 |
|
|
381,335 |
|
|
2,578 |
|
|
2,421 |
|
|
2,305 |
|
2.98 |
% |
2.61 |
% |
2.43 |
% |
|
Total Loans (net of Unearned Income)(8) |
|
|
679,209 |
|
|
692,631 |
|
|
694,675 |
|
|
11,990 |
|
|
11,828 |
|
|
11,268 |
|
7.16 |
% |
6.78 |
% |
6.52 |
% |
|
Other Interest-Earning Assets |
|
|
66,925 |
|
|
58,609 |
|
|
68,737 |
|
|
483 |
|
|
333 |
|
|
283 |
|
2.93 |
% |
2.25 |
% |
1.66 |
% |
|
Total Average Interest-Earning Assets |
|
$ |
1,764,727 |
|
$ |
1,813,860 |
|
$ |
1,873,235 |
|
$ |
19,140 |
|
$ |
18,593 |
|
$ |
17,185 |
|
4.40 |
% |
4.07 |
% |
3.69 |
% |
|
|
|
|
|
|
|
|
|
|
|
|
|
|
|
|
|
|
|
|
|
|
|
|
|
|
|
|
Liabilities |
|
|
|
|
|
|
|
|
|
|
|
|
|
|
|
|
|
|
|
|
|
|
|
|
|
|
Deposits (Excluding Deposit Insurance and FDIC Assessment) |
|
$ |
839,389 |
|
$ |
911,039 |
|
$ |
934,451 |
|
$ |
2,834 |
|
$ |
2,753 |
|
$ |
2,389 |
|
1.37 |
% |
1.20 |
% |
1.03 |
% |
|
Deposit Insurance and FDIC Assessment |
|
|
- |
|
|
- |
|
|
- |
|
|
193 |
|
|
200 |
|
|
225 |
|
|
|
|
|
|
|
|
Total Deposits |
|
|
839,389 |
|
|
911,039 |
|
|
934,451 |
|
|
3,027 |
|
|
2,953 |
|
|
2,614 |
|
1.46 |
% |
1.29 |
% |
1.13 |
% |
|
Securities Loaned and Sold under Repurchase Agreements(6) |
|
|
183,937 |
|
|
188,153 |
|
|
198,510 |
|
|
1,589 |
|
|
1,320 |
|
|
1,085 |
|
3.50 |
% |
2.78 |
% |
2.20 |
% |
|
Trading Account Liabilities(7) |
|
|
95,290 |
|
|
78,920 |
|
|
84,500 |
|
|
327 |
|
|
316 |
|
|
239 |
|
1.39 |
% |
1.59 |
% |
1.14 |
% |
|
Short-Term Borrowings |
|
|
99,180 |
|
|
97,079 |
|
|
106,560 |
|
|
652 |
|
|
489 |
|
|
384 |
|
2.67 |
% |
2.00 |
% |
1.45 |
% |
|
Long-Term Debt(9) |
|
|
196,963 |
|
|
197,972 |
|
|
202,192 |
|
|
1,722 |
|
|
1,470 |
|
|
1,325 |
|
3.55 |
% |
2.95 |
% |
2.64 |
% |
|
Total Average Interest-Bearing Liabilities |
|
$ |
1,414,759 |
|
$ |
1,473,163 |
|
$ |
1,526,213 |
|
$ |
7,317 |
|
$ |
6,548 |
|
$ |
5,647 |
|
2.10 |
% |
1.76 |
% |
1.49 |
% |
|
|
|
|
|
|
|
|
|
|
|
|
|
|
|
|
|
|
|
|
|
|
|
|
|
|
|
|
Total Average Interest-Bearing Liabilities (Excluding Deposit Insurance and FDIC Assessment) |
|
$ |
1,414,759 |
|
$ |
1,473,163 |
|
$ |
1,526,213 |
|
$ |
7,124 |
|
$ |
6,348 |
|
$ |
5,422 |
|
2.04 |
% |
1.71 |
% |
1.43 |
% |
|
|
|
|
|
|
|
|
|
|
|
|
|
|
|
|
|
|
|
|
|
|
|
|
|
|
|
|
Net Interest Revenue as a % of Average Interest-Earning Assets (NIM) |
|
|
|
|
|
|
|
|
|
|
$ |
11,823 |
|
$ |
12,045 |
|
$ |
11,538 |
|
2.72 |
% |
2.63 |
% |
2.48 |
% |
|
|
|
|
|
|
|
|
|
|
|
|
|
|
|
|
|
|
|
|
|
|
|
|
|
|
|
|
NIR as a % of Average Interest-Earning Assets (NIM) (excluding deposit insurance and FDIC Assessment) |
|
|
|
|
|
|
|
|
|
|
$ |
12,016 |
|
$ |
12,245 |
|
$ |
11,763 |
|
2.76 |
% |
2.68 |
% |
2.53 |
% |
|
|
|
|
|
|
|
|
|
|
|
|
|
|
|
|
|
|
|
|
|
|
|
|
|
|
|
|
1Q20 Increase (Decrease) from: |
|
|
|
|
|
|
|
|
|
|
|
|
|
|
|
|
|
|
|
(24) |
bps |
(15) |
bps |
|
|
|
|
|
|
|
|
|
|
|
|
|
|
|
|
|
|
|
|
|
|
|
|
|
|
|
|
|
|
1Q20 Increase (Decrease) (Excluding Deposit Insurance and FDIC Assessment) from: |
|
|
|
|
|
|
|
|
|
|
|
|
|
|
|
|
|
|
|
(23) |
bps |
(15) |
bps |
|
|
|
(1)Interest Revenue includes the taxable equivalent adjustments (based on the U.S. federal statutory tax rate of 21%) of $64 million for 1Q19, $48 million for 4Q19 and $46 million for 1Q20.
(2)Citigroup average balances and interest rates include both domestic and international operations.
(3)Monthly averages have been used by certain subsidiaries where daily averages are unavailable.
(4)Average rate percentage is calculated as annualized interest over average volumes.
(5)First quarter of 2020 is preliminary.
(6)Average volumes of securities borrowed or purchased under agreements to resell and securities loaned or sold under agreements to repurchase are reported net pursuant to FIN 41; the related interest excludes the impact of ASU 2013-01 (Topic 210).
(7)Interest expense on trading account liabilities of ICG is reported as a reduction of interest revenue. Interest revenue and interest expense on cash collateral positions are reported in trading account assets and trading account liabilities, respectively.
(8)Nonperforming loans are included in the average loan balances.
(9)Excludes hybrid financial instruments with changes in fair value recorded in Principal transactions.
Reclassified to conform to the current period's presentation.
Page 18
DEPOSITS
(In billions of dollars)
|
|
|
|
|
|
|
|
|
|
|
|
1Q20 Increase/ |
|||||||
|
|
1Q |
|
2Q |
|
3Q |
|
4Q |
|
1Q |
|
(Decrease) from |
|||||||
|
|
2019 |
|
2019 |
|
2019 |
|
2019 |
|
2020 |
|
4Q19 |
|
1Q19 |
|||||
Global Consumer Banking |
|
|
|
|
|
|
|
|
|
|
|
|
|
|
|||||
North America |
|
$ |
154.1 |
|
$ |
153.0 |
|
$ |
155.8 |
|
$ |
160.5 |
|
$ |
166.4 |
|
4% |
|
8% |
Latin America |
|
|
22.5 |
|
|
22.9 |
|
|
21.8 |
|
|
23.8 |
|
|
19.8 |
|
(17%) |
|
(12%) |
Asia (1) |
|
|
101.8 |
|
|
102.7 |
|
|
102.3 |
|
|
106.7 |
|
|
107.8 |
|
1% |
|
6% |
Total |
|
|
278.4 |
|
|
278.6 |
|
|
279.9 |
|
|
291.0 |
|
|
294.0 |
|
1% |
|
6% |
|
|
|
|
|
|
|
|
|
|
|
|
|
|
|
|
|
|
|
|
ICG |
|
|
|
|
|
|
|
|
|
|
|
|
|
|
|
|
|
|
|
North America |
|
|
348.5 |
|
|
355.9 |
|
|
393.2 |
|
|
374.2 |
|
|
444.6 |
|
19% |
|
28% |
EMEA |
|
|
196.7 |
|
|
195.9 |
|
|
194.7 |
|
|
189.9 |
|
|
210.0 |
|
11% |
|
7% |
Latin America |
|
|
34.1 |
|
|
34.0 |
|
|
34.3 |
|
|
36.2 |
|
|
36.1 |
|
- |
|
6% |
Asia |
|
|
159.3 |
|
|
166.2 |
|
|
172.7 |
|
|
167.4 |
|
|
187.6 |
|
12% |
|
18% |
Total |
|
|
738.6 |
|
|
752.0 |
|
|
794.9 |
|
|
767.7 |
|
|
878.3 |
|
14% |
|
19% |
|
|
|
|
|
|
|
|
|
|
|
|
|
|
|
|
|
|
|
|
Corporate/Other |
|
|
13.4 |
|
|
15.0 |
|
|
13.0 |
|
|
11.9 |
|
|
12.6 |
|
6% |
|
(6%) |
|
|
|
|
|
|
|
|
|
|
|
|
|
|
|
|
|
|
|
|
Total Deposits - EOP |
|
$ |
1,030.4 |
|
$ |
1,045.6 |
|
$ |
1,087.8 |
|
$ |
1,070.6 |
|
$ |
1,184.9 |
|
11% |
|
15% |
|
|
|
|
|
|
|
|
|
|
|
|
|
|
|
|
|
|
|
|
Total Deposits - Average |
|
$ |
1,017.1 |
|
$ |
1,039.9 |
|
$ |
1,066.3 |
|
$ |
1,089.5 |
|
$ |
1,114.5 |
|
2% |
|
10% |
|
|
|
|
|
|
|
|
|
|
|
|
|
|
|
|
|
|
|
|
Foreign Currency (FX) Translation Impact |
|
|
|
|
|
|
|
|
|
|
|
|
|
|
|
|
|
|
|
Total EOP Deposits - as Reported |
|
$ |
1,030.4 |
|
$ |
1,045.6 |
|
$ |
1,087.8 |
|
$ |
1,070.6 |
|
$ |
1,184.9 |
|
11% |
|
15% |
Impact of FX Translation (2) |
|
|
(21.3) |
|
|
(22.3) |
|
|
(12.7) |
|
|
(22.8) |
|
|
- |
|
|
|
|
Total EOP Deposits - Ex-FX (2) |
|
$ |
1,009.1 |
|
$ |
1,023.3 |
|
$ |
1,075.1 |
|
$ |
1,047.8 |
|
$ |
1,184.9 |
|
13% |
|
17% |
(1) |
Asia GCB includes deposits of certain EMEA countries for all periods presented. |
(2) |
Reflects the impact of FX translation into U.S. dollars at the first quarter of 2020 exchange rates for all periods presented. |
Citigroup's results of operations excluding the impact of FX translation are non-GAAP financial measures.
Reclassified to conform to the current period's presentation.
Page 19
EOP LOANS
(In billions of dollars)
|
|
|
|
|
|
|
|
|
|
|
|
|
|
|
|
|
1Q20 Increase/ |
||
|
|
1Q |
|
2Q |
|
3Q |
|
4Q |
|
1Q |
|
(Decrease) from |
|||||||
|
|
2019 |
|
2019 |
|
2019 |
|
2019 |
|
2020 |
|
4Q19 |
|
1Q19 |
|||||
Global Consumer Banking |
|
|
|
|
|
|
|
|
|
|
|
|
|
|
|
|
|
|
|
|
|
|
|
|
|
|
|
|
|
|
|
|
|
|
|
|
|
|
|
North America |
|
|
|
|
|
|
|
|
|
|
|
|
|
|
|
|
|
|
|
Credit Cards |
|
$ |
135.9 |
|
$ |
140.2 |
|
$ |
141.5 |
|
$ |
149.2 |
|
$ |
137.3 |
|
(8%) |
|
1% |
Retail Banking |
|
|
47.7 |
|
|
48.2 |
|
|
49.1 |
|
|
50.3 |
|
|
50.8 |
|
1% |
|
6% |
Total |
|
|
183.6 |
|
|
188.4 |
|
|
190.6 |
|
|
199.5 |
|
|
188.1 |
|
(6%) |
|
2% |
|
|
|
|
|
|
|
|
|
|
|
|
|
|
|
|
|
|
|
|
Latin America |
|
|
|
|
|
|
|
|
|
|
|
|
|
|
|
|
|
|
|
Credit Cards |
|
|
5.6 |
|
|
5.7 |
|
|
5.5 |
|
|
6.0 |
|
|
4.5 |
|
(25%) |
|
(20%) |
Retail Banking |
|
|
11.3 |
|
|
11.4 |
|
|
11.2 |
|
|
11.7 |
|
|
9.2 |
|
(21%) |
|
(19%) |
Total |
|
|
16.9 |
|
|
17.1 |
|
|
16.7 |
|
|
17.7 |
|
|
13.7 |
|
(23%) |
|
(19%) |
|
|
|
|
|
|
|
|
|
|
|
|
|
|
|
|
|
|
|
|
Asia (1) |
|
|
|
|
|
|
|
|
|
|
|
|
|
|
|
|
|
|
|
Credit Cards |
|
|
18.8 |
|
|
19.2 |
|
|
18.8 |
|
|
19.9 |
|
|
17.3 |
|
(13%) |
|
(8%) |
Retail Banking |
|
|
59.1 |
|
|
60.1 |
|
|
60.3 |
|
|
62.8 |
|
|
60.2 |
|
(4%) |
|
2% |
Total |
|
|
77.9 |
|
|
79.3 |
|
|
79.1 |
|
|
82.7 |
|
|
77.5 |
|
(6%) |
|
(1%) |
|
|
|
|
|
|
|
|
|
|
|
|
|
|
|
|
|
|
|
|
Total GCB Consumer Loans |
|
|
|
|
|
|
|
|
|
|
|
|
|
|
|
|
|
|
|
Credit Cards |
|
|
160.3 |
|
|
165.1 |
|
|
165.8 |
|
|
175.1 |
|
|
159.1 |
|
(9%) |
|
(1%) |
Retail Banking |
|
|
118.1 |
|
|
119.7 |
|
|
120.6 |
|
|
124.8 |
|
|
120.2 |
|
(4%) |
|
2% |
Total GCB |
|
|
278.4 |
|
|
284.8 |
|
|
286.4 |
|
|
299.9 |
|
|
279.3 |
|
(7%) |
|
- |
|
|
|
|
|
|
|
|
|
|
|
|
|
|
|
|
|
|
|
|
|
|
|
|
|
|
|
|
|
|
|
|
|
|
|
|
|
|
|
|
Total Corporate/Other - Consumer |
|
|
12.6 |
|
|
11.7 |
|
|
11.0 |
|
|
9.6 |
|
|
9.1 |
|
(5%) |
|
(28%) |
Total Consumer Loans |
|
$ |
291.0 |
|
$ |
296.5 |
|
$ |
297.4 |
|
$ |
309.5 |
|
$ |
288.4 |
|
(7%) |
|
(1%) |
|
|
|
|
|
|
|
|
|
|
|
|
|
|
|
|
|
|
|
|
Corporate Loans - by Region |
|
|
|
|
|
|
|
|
|
|
|
|
|
|
|
|
|
|
|
North America |
|
$ |
190.5 |
|
$ |
191.4 |
|
$ |
190.9 |
|
$ |
190.9 |
|
$ |
223.5 |
|
17% |
|
17% |
EMEA |
|
|
86.0 |
|
|
87.8 |
|
|
91.9 |
|
|
87.4 |
|
|
93.8 |
|
7% |
|
9% |
Latin America |
|
|
41.2 |
|
|
40.2 |
|
|
38.1 |
|
|
39.1 |
|
|
41.3 |
|
6% |
|
- |
Asia |
|
|
73.7 |
|
|
72.8 |
|
|
73.4 |
|
|
72.5 |
|
|
74.0 |
|
2% |
|
- |
Total Corporate Loans |
|
|
391.4 |
|
|
392.2 |
|
|
394.3 |
|
|
389.9 |
|
|
432.6 |
|
11% |
|
11% |
|
|
|
|
|
|
|
|
|
|
|
|
|
|
|
|
|
|
|
|
Corporate Loans - by Product |
|
|
|
|
|
|
|
|
|
|
|
|
|
|
|
|
|
|
|
Corporate Lending |
|
|
162.0 |
|
|
159.6 |
|
|
156.9 |
|
|
152.6 |
|
|
192.2 |
|
26% |
|
19% |
Private Bank |
|
|
99.6 |
|
|
102.6 |
|
|
105.3 |
|
|
109.0 |
|
|
112.0 |
|
3% |
|
12% |
Treasury and Trade Solutions |
|
|
77.5 |
|
|
77.2 |
|
|
76.7 |
|
|
74.7 |
|
|
75.5 |
|
1% |
|
(3%) |
Markets and Securities Services |
|
|
52.3 |
|
|
52.8 |
|
|
55.4 |
|
|
53.6 |
|
|
52.9 |
|
(1%) |
|
1% |
Total Corporate Loans |
|
|
391.4 |
|
|
392.2 |
|
|
394.3 |
|
|
389.9 |
|
|
432.6 |
|
11% |
|
11% |
|
|
|
|
|
|
|
|
|
|
|
|
|
|
|
|
|
|
|
|
Total Loans |
|
$ |
682.3 |
|
$ |
688.7 |
|
$ |
691.7 |
|
$ |
699.5 |
|
$ |
721.0 |
|
3% |
|
6% |
|
|
|
|
|
|
|
|
|
|
|
|
|
|
|
|
|
|
|
|
Foreign Currency (FX) Translation Impact |
|
|
|
|
|
|
|
|
|
|
|
|
|
|
|
|
|
|
|
Total EOP Loans - as Reported |
|
$ |
682.3 |
|
$ |
688.7 |
|
$ |
691.7 |
|
$ |
699.5 |
|
$ |
721.0 |
|
3% |
|
6% |
Impact of FX Translation (2) |
|
|
(14.6) |
|
|
(14.8) |
|
|
(8.8) |
|
|
(15.5) |
|
|
- |
|
|
|
|
Total EOP Loans - Ex-FX (2) |
|
$ |
667.7 |
|
$ |
673.9 |
|
$ |
682.9 |
|
$ |
684.0 |
|
$ |
721.0 |
|
5% |
|
8% |
(1) |
Asia GCB includes loans of certain EMEA countries for all periods presented. |
(2) |
Reflects the impact of FX translation into U.S. dollars at the first quarter of 2020 exchange rates for all periods presented. |
Citigroup's results of operations excluding the impact of FX translation are non-GAAP financial measures.
Reclassified to conform to the current period's presentation.
Page 20
SUPPLEMENTAL DETAIL
CONSUMER LOANS 90+ DAYS DELINQUENCIES AND RATIOS
BUSINESS VIEW
(In millions of dollars, except EOP loan amounts in billions of dollars)
|
|
Loans 90+ Days Past Due (1) |
|
EOP Loans |
||||||||||||||
|
|
|
1Q |
|
|
2Q |
|
|
3Q |
|
|
4Q |
|
|
1Q |
|
1Q |
|
|
|
|
2019 |
|
|
2019 |
|
|
2019 |
|
|
2019 |
|
|
2020 |
|
2020 |
|
Global Consumer Banking(2) |
|
|
|
|
|
|
|
|
|
|
|
|
|
|
|
|
|
|
Total |
|
$ |
2,505 |
|
$ |
2,426 |
|
$ |
2,470 |
|
$ |
2,737 |
|
$ |
2,603 |
|
$ |
279.3 |
Ratio |
|
|
0.90% |
|
|
0.85% |
|
|
0.86% |
|
|
0.91% |
|
|
0.93% |
|
|
|
|
|
|
|
|
|
|
|
|
|
|
|
|
|
|
|
|
|
|
Retail Banking(2) |
|
|
|
|
|
|
|
|
|
|
|
|
|
|
|
|
|
|
Total |
|
$ |
394 |
|
$ |
416 |
|
$ |
392 |
|
$ |
438 |
|
$ |
429 |
|
$ |
120.2 |
Ratio |
|
|
0.34% |
|
|
0.35% |
|
|
0.33% |
|
|
0.35% |
|
|
0.36% |
|
|
|
North America(2) |
|
$ |
132 |
|
$ |
133 |
|
$ |
125 |
|
$ |
146 |
|
$ |
161 |
|
$ |
50.8 |
Ratio |
|
|
0.28% |
|
|
0.28% |
|
|
0.26% |
|
|
0.29% |
|
|
0.32% |
|
|
|
Latin America |
|
$ |
95 |
|
$ |
108 |
|
$ |
97 |
|
$ |
106 |
|
$ |
90 |
|
$ |
9.2 |
Ratio |
|
|
0.84% |
|
|
0.95% |
|
|
0.87% |
|
|
0.91% |
|
|
0.98% |
|
|
|
Asia(3) |
|
$ |
167 |
|
$ |
175 |
|
$ |
170 |
|
$ |
186 |
|
$ |
178 |
|
$ |
60.2 |
Ratio |
|
|
0.28% |
|
|
0.29% |
|
|
0.28% |
|
|
0.30% |
|
|
0.30% |
|
|
|
|
|
|
|
|
|
|
|
|
|
|
|
|
|
|
|
|
|
|
Cards |
|
|
|
|
|
|
|
|
|
|
|
|
|
|
|
|
|
|
Total |
|
$ |
2,111 |
|
$ |
2,010 |
|
$ |
2,078 |
|
$ |
2,299 |
|
$ |
2,174 |
|
$ |
159.1 |
Ratio |
|
|
1.32% |
|
|
1.22% |
|
|
1.25% |
|
|
1.31% |
|
|
1.37% |
|
|
|
North America - Citi-Branded |
|
$ |
828 |
|
$ |
799 |
|
$ |
807 |
|
$ |
915 |
|
$ |
891 |
|
$ |
88.4 |
Ratio |
|
|
0.95% |
|
|
0.88% |
|
|
0.88% |
|
|
0.95% |
|
|
1.01% |
|
|
|
North America - Retail Services |
|
$ |
918 |
|
$ |
840 |
|
$ |
923 |
|
$ |
1,012 |
|
$ |
958 |
|
$ |
48.9 |
Ratio |
|
|
1.88% |
|
|
1.69% |
|
|
1.85% |
|
|
1.91% |
|
|
1.96% |
|
|
|
Latin America |
|
$ |
165 |
|
$ |
169 |
|
$ |
152 |
|
$ |
165 |
|
$ |
121 |
|
$ |
4.5 |
Ratio |
|
|
2.95% |
|
|
2.96% |
|
|
2.76% |
|
|
2.75% |
|
|
2.69% |
|
|
|
Asia(3) |
|
$ |
200 |
|
$ |
202 |
|
$ |
196 |
|
$ |
207 |
|
$ |
204 |
|
$ |
17.3 |
Ratio |
|
|
1.06% |
|
|
1.05% |
|
|
1.04% |
|
|
1.04% |
|
|
1.18% |
|
|
|
|
|
|
|
|
|
|
|
|
|
|
|
|
|
|
|
|
|
|
Corporate/Other - Consumer(2) |
|
$ |
354 |
|
$ |
327 |
|
$ |
293 |
|
$ |
278 |
|
$ |
281 |
|
$ |
9.1 |
Ratio |
|
|
2.97% |
|
|
2.97% |
|
|
2.82% |
|
|
3.02% |
|
|
3.23% |
|
|
|
|
|
|
|
|
|
|
|
|
|
|
|
|
|
|
|
|
|
|
Total Citigroup(2) |
|
$ |
2,859 |
|
$ |
2,753 |
|
$ |
2,763 |
|
$ |
3,015 |
|
$ |
2,884 |
|
$ |
288.4 |
Ratio |
|
|
0.99% |
|
|
0.93% |
|
|
0.93% |
|
|
0.98% |
|
|
1.00% |
|
|
|
(1) |
The ratio of 90+ Days Past Due is calculated based on end-of-period loans, net of unearned income. |
(2) |
The 90+ Days Past Due and related ratios for North America Retail Banking and Corporate/Other North America exclude U.S. mortgage loans that are guaranteed by U.S. government-sponsored agencies since the potential loss predominantly resides with the U.S. agencies. See footnote 2 on page 9 and footnote 1 on page 17. |
(3) |
Asia includes delinquency amounts, ratios and loans of certain EMEA countries for all periods presented. |
Reclassified to conform to the current period's presentation.
Page 21
SUPPLEMENTAL DETAIL
CONSUMER LOANS 30-89 DAYS DELINQUENCIES AND RATIOS
BUSINESS VIEW
(In millions of dollars, except EOP loan amounts in billions of dollars)
|
|
Loans 30-89 Days Past Due (1) |
|
EOP Loans |
|
||||||||||||||
|
|
1Q |
|
2Q |
|
3Q |
|
4Q |
|
1Q |
|
1Q |
|
||||||
|
|
2019 |
|
2019 |
|
2019 |
|
2019 |
|
2020 |
|
2020 |
|
||||||
|
|
|
|
|
|
|
|
|
|
|
|
|
|
||||||
Global Consumer Banking(2) |
|
|
|
|
|
|
|
|
|
|
|
|
|
|
|
|
|
|
|
Total |
|
$ |
2,751 |
|
$ |
2,783 |
|
$ |
2,956 |
|
$ |
3,001 |
|
$ |
2,870 |
|
$ |
279.3 |
|
Ratio |
|
|
0.99% |
|
|
0.98% |
|
|
1.03% |
|
|
1.00% |
|
|
1.03% |
|
|
|
|
|
|
|
|
|
|
|
|
|
|
|
|
|
|
|
|
|
|
|
|
Retail Banking(2) |
|
|
|
|
|
|
|
|
|
|
|
|
|
|
|
|
|
|
|
Total |
|
$ |
744 |
|
$ |
831 |
|
$ |
803 |
|
$ |
816 |
|
$ |
794 |
|
$ |
120.2 |
|
Ratio |
|
|
0.63% |
|
|
0.70% |
|
|
0.67% |
|
|
0.66% |
|
|
0.66% |
|
|
|
|
North America(2) |
|
$ |
263 |
|
$ |
341 |
|
$ |
313 |
|
$ |
334 |
|
$ |
298 |
|
$ |
50.8 |
|
Ratio |
|
|
0.56% |
|
|
0.72% |
|
|
0.65% |
|
|
0.67% |
|
|
0.59% |
|
|
|
|
Latin America |
|
$ |
185 |
|
$ |
191 |
|
$ |
191 |
|
$ |
180 |
|
$ |
140 |
|
$ |
9.2 |
|
Ratio |
|
|
1.64% |
|
|
1.68% |
|
|
1.71% |
|
|
1.54% |
|
|
1.52% |
|
|
|
|
Asia (3) |
|
$ |
296 |
|
$ |
299 |
|
$ |
299 |
|
$ |
302 |
|
$ |
356 |
|
$ |
60.2 |
|
Ratio |
|
|
0.50% |
|
|
0.50% |
|
|
0.50% |
|
|
0.48% |
|
|
0.59% |
|
|
|
|
|
|
|
|
|
|
|
|
|
|
|
|
|
|
|
|
|
|
|
|
Cards |
|
|
|
|
|
|
|
|
|
|
|
|
|
|
|
|
|
|
|
Total |
|
$ |
2,007 |
|
$ |
1,952 |
|
$ |
2,153 |
|
$ |
2,185 |
|
$ |
2,076 |
|
$ |
159.1 |
|
Ratio |
|
|
1.25% |
|
|
1.18% |
|
|
1.30% |
|
|
1.25% |
|
|
1.30% |
|
|
|
|
North America - Citi-Branded |
|
$ |
731 |
|
$ |
705 |
|
$ |
800 |
|
$ |
814 |
|
$ |
770 |
|
$ |
88.4 |
|
Ratio |
|
|
0.84% |
|
|
0.78% |
|
|
0.87% |
|
|
0.85% |
|
|
0.87% |
|
|
|
|
North America - Retail Services |
|
$ |
859 |
|
$ |
831 |
|
$ |
943 |
|
$ |
945 |
|
$ |
903 |
|
$ |
48.9 |
|
Ratio |
|
|
1.76% |
|
|
1.68% |
|
|
1.89% |
|
|
1.79% |
|
|
1.85% |
|
|
|
|
Latin America |
|
$ |
161 |
|
$ |
159 |
|
$ |
161 |
|
$ |
159 |
|
$ |
132 |
|
$ |
4.5 |
|
Ratio |
|
|
2.88% |
|
|
2.79% |
|
|
2.93% |
|
|
2.65% |
|
|
2.93% |
|
|
|
|
Asia (3) |
|
$ |
256 |
|
$ |
257 |
|
$ |
249 |
|
$ |
267 |
|
$ |
271 |
|
$ |
17.3 |
|
Ratio |
|
|
1.36% |
|
|
1.34% |
|
|
1.32% |
|
|
1.34% |
|
|
1.57% |
|
|
|
|
|
|
|
|
|
|
|
|
|
|
|
|
|
|
|
|
|
|
|
|
Corporate/Other - Consumer(2) |
|
$ |
348 |
|
$ |
334 |
|
$ |
288 |
|
$ |
295 |
|
$ |
252 |
|
$ |
9.1 |
|
Ratio |
|
|
2.92% |
|
|
3.04% |
|
|
2.77% |
|
|
3.21% |
|
|
2.90% |
|
|
|
|
|
|
|
|
|
|
|
|
|
|
|
|
|
|
|
|
|
|
|
|
Total Citigroup(2) |
|
$ |
3,099 |
|
$ |
3,117 |
|
$ |
3,244 |
|
$ |
3,296 |
|
$ |
3,122 |
|
$ |
288.4 |
|
Ratio |
|
|
1.07% |
|
|
1.05% |
|
|
1.10% |
|
|
1.07% |
|
|
1.09% |
|
|
|
|
|
|
|
|
|
|
|
|
|
|
|
|
|
|
|
|
|
|
|
|
(1) |
The ratio of 30-89 Days Past Due is calculated based on end-of-period loans, net of unearned income. |
(2) |
The 30-89 Days Past Due and related ratios for North America Retail Banking and Corporate/Other North America exclude U.S. mortgage loans that are guaranteed by U.S. government-sponsored agencies since the potential loss predominantly resides with the U.S. agencies. See footnote 2 on page 9 and footnote 1 on page 17. |
(3) |
Asia includes delinquency amounts, ratios and loans of certain EMEA countries for all periods presented. |
Reclassified to conform to the current period's presentation.
Page 22
ALLOWANCE FOR CREDIT LOSSES ON LOANS AND UNFUNDED LENDING COMMITMENTS Page 1
(In millions of dollars)
|
|
|
|
|
|
|
|
|
|
|
|
1Q20 Increase/ |
|
|||||||
|
|
1Q |
|
2Q |
|
3Q |
|
4Q |
|
1Q |
|
(Decrease) from |
|
|||||||
|
|
2019 |
|
2019 |
|
2019 |
|
2019 |
|
2020 |
|
4Q19 |
|
1Q19 |
|
|||||
|
|
|
|
|
|
|
|
|
|
|
|
|
|
|
|
|||||
Total Citigroup |
|
|
|
|
|
|
|
|
|
|
|
|
|
|
|
|
|
|
|
|
Allowance for Loan Losses at Beginning of Period(1) |
|
$ |
12,315 |
|
$ |
12,329 |
|
$ |
12,466 |
|
$ |
12,530 |
|
$ |
12,783 |
|
|
|
|
|
Adjustment to Opening Balance for CECL Adoption(1) |
|
|
- |
|
|
- |
|
|
- |
|
|
- |
|
|
4,201 |
|
NM |
|
NM |
|
Adjusted Balance, Beginning of Period |
|
|
12,315 |
|
|
12,329 |
|
|
12,466 |
|
|
12,530 |
|
|
16,984 |
|
36% |
|
38% |
|
|
|
|
|
|
|
|
|
|
|
|
|
|
|
|
|
|
|
|
|
|
Gross Credit (Losses) |
|
|
(2,345) |
|
|
(2,354) |
|
|
(2,281) |
|
|
(2,361) |
|
|
(2,479) |
|
(5%) |
|
(6%) |
|
Gross Recoveries |
|
|
397 |
|
|
391 |
|
|
368 |
|
|
417 |
|
|
371 |
|
(11%) |
|
(7%) |
|
Net Credit (Losses) / Recoveries (NCLs) |
|
|
(1,948) |
|
|
(1,963) |
|
|
(1,913) |
|
|
(1,944) |
|
|
(2,108) |
|
8% |
|
8% |
|
NCLs |
|
|
1,948 |
|
|
1,963 |
|
|
1,913 |
|
|
1,944 |
|
|
2,108 |
|
8% |
|
8% |
|
Net Reserve Builds / (Releases) |
|
|
67 |
|
|
53 |
|
|
132 |
|
|
112 |
|
|
4,112 |
|
NM |
|
NM |
|
Net Specific Reserve Builds / (Releases) |
|
|
(71) |
|
|
73 |
|
|
17 |
|
|
67 |
|
|
224 |
|
NM |
|
NM |
|
Provision for Loan Losses |
|
|
1,944 |
|
|
2,089 |
|
|
2,062 |
|
|
2,123 |
|
|
6,444 |
|
NM |
|
NM |
|
Other(2)(3)(4)(5)(6)(7) |
|
|
18 |
|
|
11 |
|
|
(85) |
|
|
74 |
|
|
(479) |
|
NM |
|
NM |
|
Allowance for Loan Losses at End of Period(1) (a) |
|
$ |
12,329 |
|
$ |
12,466 |
|
$ |
12,530 |
|
$ |
12,783 |
|
$ |
20,841 |
|
|
|
|
|
|
|
|
|
|
|
|
|
|
|
|
|
|
|
|
|
|
|
|
|
|
Allowance for Unfunded Lending Commitments(8) (a) |
|
$ |
1,391 |
|
$ |
1,376 |
|
$ |
1,385 |
|
$ |
1,456 |
|
$ |
1,813 |
|
|
|
|
|
|
|
|
|
|
|
|
|
|
|
|
|
|
|
|
|
|
|
|
|
|
Provision (Release) for Unfunded Lending Commitments |
|
$ |
24 |
|
$ |
(15) |
|
$ |
9 |
|
$ |
74 |
|
$ |
557 |
|
|
|
|
|
|
|
|
|
|
|
|
|
|
|
|
|
|
|
|
|
|
|
|
|
|
Total Allowance for Loans, Leases and Unfunded Lending Commitments [Sum of (a)] |
|
$ |
13,720 |
|
$ |
13,842 |
|
$ |
13,915 |
|
$ |
14,239 |
|
$ |
22,654 |
|
|
|
|
|
|
|
|
|
|
|
|
|
|
|
|
|
|
|
|
|
|
|
|
|
|
Total Allowance for Loan Losses as a Percentage of Total Loans(9) |
|
|
1.82 |
% |
|
1.82 |
% |
|
1.82 |
% |
|
1.84 |
% |
|
2.91 |
% |
|
|
|
|
|
|
|
|
|
|
|
|
|
|
|
|
|
|
|
|
|
|
|
|
|
Consumer |
|
|
|
|
|
|
|
|
|
|
|
|
|
|
|
|
|
|
|
|
Allowance for Loan Losses at Beginning of Period(1) |
|
$ |
9,504 |
|
$ |
9,598 |
|
$ |
9,679 |
|
$ |
9,727 |
|
$ |
9,897 |
|
|
|
|
|
Adjustment to Opening Balance for CECL Adoption(1) |
|
|
- |
|
|
- |
|
|
- |
|
|
- |
|
|
4,922 |
|
NM |
|
NM |
|
Adjusted Balance, Beginning of Period |
|
|
9,504 |
|
|
9,598 |
|
|
9,679 |
|
|
9,727 |
|
|
14,819 |
|
52% |
|
56% |
|
|
|
|
|
|
|
|
|
|
|
|
|
|
|
|
|
|
|
|
|
|
Net Credit Losses (NCLs) |
|
|
(1,869) |
|
|
(1,874) |
|
|
(1,803) |
|
|
(1,830) |
|
|
(1,981) |
|
8% |
|
6% |
|
NCLs |
|
|
1,869 |
|
|
1,874 |
|
|
1,803 |
|
|
1,830 |
|
|
1,981 |
|
8% |
|
6% |
|
Net Reserve Builds / (Releases) |
|
|
63 |
|
|
3 |
|
|
95 |
|
|
107 |
|
|
2,844 |
|
NM |
|
NM |
|
Net Specific Reserve Builds / (Releases) |
|
|
8 |
|
|
70 |
|
|
18 |
|
|
11 |
|
|
176 |
|
NM |
|
NM |
|
Provision for Loan Losses |
|
|
1,940 |
|
|
1,947 |
|
|
1,916 |
|
|
1,948 |
|
|
5,001 |
|
NM |
|
NM |
|
Other(2)(3)(4)(5)(6)(7) |
|
|
23 |
|
|
8 |
|
|
(65) |
|
|
52 |
|
|
(449) |
|
NM |
|
NM |
|
Allowance for Loan Losses at End of Period(1) (b) |
|
$ |
9,598 |
|
$ |
9,679 |
|
$ |
9,727 |
|
$ |
9,897 |
|
$ |
17,390 |
|
|
|
|
|
|
|
|
|
|
|
|
|
|
|
|
|
|
|
|
|
|
|
|
|
|
Consumer Allowance for Unfunded Lending Commitments(8) (b) |
|
$ |
- |
|
$ |
- |
|
$ |
2 |
|
$ |
4 |
|
$ |
- |
|
|
|
|
|
|
|
|
|
|
|
|
|
|
|
|
|
|
|
|
|
|
|
|
|
|
Provision (Release) for Unfunded Lending Commitments |
|
$ |
(3) |
|
$ |
- |
|
$ |
2 |
|
$ |
2 |
|
$ |
(1) |
|
|
|
|
|
|
|
|
|
|
|
|
|
|
|
|
|
|
|
|
|
|
|
|
|
|
Total Allowance for Loans, Leases and Unfunded Lending Commitments [Sum of (b)] |
|
$ |
9,598 |
|
$ |
9,679 |
|
$ |
9,729 |
|
$ |
9,901 |
|
$ |
17,390 |
|
|
|
|
|
|
|
|
|
|
|
|
|
|
|
|
|
|
|
|
|
|
|
|
|
|
Consumer Allowance for Loan Losses as a Percentage of Total Consumer Loans |
|
|
3.30 |
% |
|
3.26 |
% |
|
3.27 |
% |
|
3.20 |
% |
|
6.03 |
% |
|
|
|
|
|
|
|
|
|
|
|
|
|
|
|
|
|
|
|
|
|
|
|
|
|
Corporate |
|
|
|
|
|
|
|
|
|
|
|
|
|
|
|
|
|
|
|
|
Allowance for Loan Losses at Beginning of Period(1) |
|
$ |
2,811 |
|
$ |
2,731 |
|
$ |
2,787 |
|
$ |
2,803 |
|
$ |
2,886 |
|
|
|
|
|
Adjustment to Opening Balance for CECL Adoption(1) |
|
|
- |
|
|
- |
|
|
- |
|
|
- |
|
|
(721) |
|
NM |
|
NM |
|
Adjusted Balance, Beginning of Period |
|
|
2,811 |
|
|
2,731 |
|
|
2,787 |
|
|
2,803 |
|
|
2,165 |
|
(23%) |
|
(23%) |
|
|
|
|
|
|
|
|
|
|
|
|
|
|
|
|
|
|
|
|
|
|
Net Credit (Losses) / Recoveries (NCLs) |
|
|
(79) |
|
|
(89) |
|
|
(110) |
|
|
(114) |
|
|
(127) |
|
11% |
|
61% |
|
NCLs |
|
|
79 |
|
|
89 |
|
|
110 |
|
|
114 |
|
|
127 |
|
11% |
|
61% |
|
Net Reserve Builds / (Releases) |
|
|
4 |
|
|
50 |
|
|
37 |
|
|
5 |
|
|
1,268 |
|
NM |
|
NM |
|
Net Specific Reserve Builds / (Releases) |
|
|
(79) |
|
|
3 |
|
|
(1) |
|
|
56 |
|
|
48 |
|
(14%) |
|
NM |
|
Provision for Loan Losses |
|
|
4 |
|
|
142 |
|
|
146 |
|
|
175 |
|
|
1,443 |
|
NM |
|
NM |
|
Other(2) |
|
|
(5) |
|
|
3 |
|
|
(20) |
|
|
22 |
|
|
(30) |
|
|
|
|
|
Allowance for Loan Losses at End of Period(1) (c) |
|
$ |
2,731 |
|
$ |
2,787 |
|
$ |
2,803 |
|
$ |
2,886 |
|
$ |
3,451 |
|
|
|
|
|
|
|
|
|
|
|
|
|
|
|
|
|
|
|
|
|
|
|
|
|
|
Corporate Allowance for Unfunded Lending Commitments(8) (c) |
|
$ |
1,391 |
|
$ |
1,376 |
|
$ |
1,383 |
|
$ |
1,452 |
|
$ |
1,813 |
|
|
|
|
|
|
|
|
|
|
|
|
|
|
|
|
|
|
|
|
|
|
|
|
|
|
Provision (Release) for Unfunded Lending Commitments |
|
$ |
27 |
|
$ |
(15) |
|
$ |
7 |
|
$ |
72 |
|
$ |
558 |
|
|
|
|
|
|
|
|
|
|
|
|
|
|
|
|
|
|
|
|
|
|
|
|
|
|
Total Allowance for Loans, Leases and Unfunded Lending Commitments [Sum of (c)] |
|
$ |
4,122 |
|
$ |
4,163 |
|
$ |
4,186 |
|
$ |
4,338 |
|
$ |
5,264 |
|
|
|
|
|
|
|
|
|
|
|
|
|
|
|
|
|
|
|
|
|
|
|
|
|
|
Corporate Allowance for Loan Losses as a Percentage of Total Corporate Loans(9) |
|
|
0.70 |
% |
|
0.72 |
% |
|
0.72 |
% |
|
0.75 |
% |
|
0.81 |
% |
|
|
|
|
|
|
|
|
|
|
|
|
|
|
|
|
|
|
|
|
|
|
|
|
|
Footnotes to these tables are on the following page (page 24). |
|
|
|
|
|
|
|
|
|
|
|
|
|
|
|
|
|
|
|
|
Page 23
ALLOWANCE FOR CREDIT LOSSES ON LOANS AND UNFUNDED LENDING COMMITMENTS
Page 2
The following footnotes relate to the tables on the prior page (page 23).
(1) |
On January 1, 2020, Citi adopted Accounting Standards Update (ASC) 326, Financial Instruments – Credit Losses (CECL). The ASU introduces a new credit loss methodology requiring earlier recognition of credit losses while also providing additional transparency about credit risk. On January 1, 2020, Citi recorded a $4.2 billion, or an approximate 29%, pretax increase in the Allowance for credit losses, along with a $3.1 billion after-tax decrease in Retained earnings and a deferred tax asset increase of $1.1 billion. This transition impact reflects (i) a $4.9 billion build to the Allowance for credit losses for Citi’s consumer exposures, primarily driven by the impact on credit card receivables of longer estimated tenors under the CECL lifetime expected credit loss methodology compared to shorter estimated tenors under the probable loss methodology under prior U.S. GAAP, net of recoveries; and (ii) a release of $0.8 billion of reserves related to Citi’s corporate net loan loss exposures, largely due to more precise contractual maturities that result in shorter remaining tenors, incorporation of recoveries and use of more specific historical loss data based on an increase in portfolio segmentation across industries and geographies.Attribution of the allowance is made for analytical purposes only, and the entire allowance is available to absorb losses in the portfolios. The balances on page 23 do not include approximately $0.1 billion of allowance for HTM debt securities and other assets at March 31, 2020. |
(2) |
Includes all adjustments to the allowance for credit losses, such as changes in the allowance from acquisitions, dispositions, securitizations, foreign currency translation (FX translation), purchase accounting adjustments, etc. |
(3) |
1Q19 Consumer includes an increase of approximately $26 million related to FX translation. |
(4) |
2Q19 Consumer includes an increase of approximately $13 million related to FX translation. |
(5) |
3Q19 Consumer includes a decrease of approximately $65 million related to FX translation. |
(6) |
4Q19 Consumer includes a reduction of approximately $33 million related to the sale or transfers to HFS of various loan portfolios. In addition, the fourth quarter includes an increase of approximately $86 million related to FX translation. |
(7) |
1Q20 Consumer includes a decrease of approximately $456 million related to FX translation. The Corporate Allowance is predominantly sourced in U.S. dollars. |
(8) |
Represents additional credit reserves recorded as other liabilities on the Consolidated Balance Sheet. |
(9) |
March 31, 2019, June 30, 2019, September 30, 2019, December 31, 2019 and March 31, 2020 exclude $3.9 billion, $3.8 billion, $3.8 billion, $4.1 billion and $4.0 billion, respectively, of loans which are carried at fair value. |
NM Not meaningful.
Reclassified to conform to the current period's presentation.
Page 24
COMPONENTS OF PROVISION FOR LOAN LOSSES
(In millions of dollars)
|
|
|
|
|
|
|
|
|
|
|
|
1Q20 Increase/ |
|||||||
|
|
1Q |
|
2Q |
|
3Q |
|
4Q |
|
1Q |
|
(Decrease) from |
|||||||
|
|
2019 |
|
2019 |
|
2019 |
|
2019 |
|
2020 |
|
4Q19 |
|
1Q19 |
|||||
|
|
|
|
|
|
|
|
|
|
|
|
|
|
|
|||||
Global Consumer Banking |
|
|
|
|
|
|
|
|
|
|
|
|
|
|
|
|
|
|
|
Net Credit Losses |
|
$ |
1,868 |
|
$ |
1,870 |
|
$ |
1,802 |
|
$ |
1,842 |
|
$ |
1,983 |
|
8% |
|
6% |
Credit Reserve Build / (Release) |
|
|
96 |
|
|
94 |
|
|
129 |
|
|
120 |
|
|
2,829 |
|
NM |
|
NM |
North America |
|
|
|
|
|
|
|
|
|
|
|
|
|
|
|
|
|
|
|
Net Credit Losses |
|
|
1,408 |
|
|
1,417 |
|
|
1,350 |
|
|
1,408 |
|
|
1,526 |
|
8% |
|
8% |
Credit Reserve Build / (Release) |
|
|
118 |
|
|
81 |
|
|
161 |
|
|
109 |
|
|
2,362 |
|
NM |
|
NM |
Retail Banking |
|
|
|
|
|
|
|
|
|
|
|
|
|
|
|
|
|
|
|
Net Credit Losses |
|
|
39 |
|
|
40 |
|
|
40 |
|
|
42 |
|
|
37 |
|
(12%) |
|
(5%) |
Credit Reserve Build / (Release) |
|
|
(3) |
|
|
(4) |
|
|
(1) |
|
|
(2) |
|
|
178 |
|
NM |
|
NM |
Citi-Branded Cards |
|
|
|
|
|
|
|
|
|
|
|
|
|
|
|
|
|
|
|
Net Credit Losses |
|
|
706 |
|
|
723 |
|
|
712 |
|
|
723 |
|
|
795 |
|
10% |
|
13% |
Credit Reserve Build / (Release) |
|
|
76 |
|
|
64 |
|
|
141 |
|
|
115 |
|
|
1,294 |
|
NM |
|
NM |
Citi Retail Services |
|
|
|
|
|
|
|
|
|
|
|
|
|
|
|
|
|
|
|
Net Credit Losses |
|
|
663 |
|
|
654 |
|
|
598 |
|
|
643 |
|
|
694 |
|
8% |
|
5% |
Credit Reserve Build / (Release) |
|
|
45 |
|
|
21 |
|
|
21 |
|
|
(4) |
|
|
890 |
|
NM |
|
NM |
Latin America |
|
|
|
|
|
|
|
|
|
|
|
|
|
|
|
|
|
|
|
Net Credit Losses |
|
|
296 |
|
|
279 |
|
|
275 |
|
|
259 |
|
|
277 |
|
7% |
|
(6%) |
Credit Reserve Build / (Release) |
|
|
(2) |
|
|
3 |
|
|
(34) |
|
|
(5) |
|
|
265 |
|
NM |
|
NM |
Retail Banking |
|
|
|
|
|
|
|
|
|
|
|
|
|
|
|
|
|
|
|
Net Credit Losses |
|
|
136 |
|
|
123 |
|
|
119 |
|
|
116 |
|
|
130 |
|
12% |
|
(4%) |
Credit Reserve Build / (Release) |
|
|
1 |
|
|
(14) |
|
|
(28) |
|
|
(22) |
|
|
122 |
|
NM |
|
NM |
Citi-Branded Cards |
|
|
|
|
|
|
|
|
|
|
|
|
|
|
|
|
|
|
|
Net Credit Losses |
|
|
160 |
|
|
156 |
|
|
156 |
|
|
143 |
|
|
147 |
|
3% |
|
(8%) |
Credit Reserve Build / (Release) |
|
|
(3) |
|
|
17 |
|
|
(6) |
|
|
17 |
|
|
143 |
|
NM |
|
NM |
Asia (1) |
|
|
|
|
|
|
|
|
|
|
|
|
|
|
|
|
|
|
|
Net Credit Losses |
|
|
164 |
|
|
174 |
|
|
177 |
|
|
175 |
|
|
180 |
|
3% |
|
10% |
Credit Reserve Build / (Release) |
|
|
(20) |
|
|
10 |
|
|
2 |
|
|
16 |
|
|
202 |
|
NM |
|
NM |
Retail Banking |
|
|
|
|
|
|
|
|
|
|
|
|
|
|
|
|
|
|
|
Net Credit Losses |
|
|
58 |
|
|
62 |
|
|
66 |
|
|
69 |
|
|
68 |
|
(1%) |
|
17% |
Credit Reserve Build / (Release) |
|
|
4 |
|
|
3 |
|
|
5 |
|
|
7 |
|
|
107 |
|
NM |
|
NM |
Citi-Branded Cards |
|
|
|
|
|
|
|
|
|
|
|
|
|
|
|
|
|
|
|
Net Credit Losses |
|
|
106 |
|
|
112 |
|
|
111 |
|
|
106 |
|
|
112 |
|
6% |
|
6% |
Credit Reserve Build / (Release) |
|
|
(24) |
|
|
7 |
|
|
(3) |
|
|
9 |
|
|
95 |
|
NM |
|
NM |
|
|
|
|
|
|
|
|
|
|
|
|
|
|
|
|
|
|
|
|
Institutional Clients Group (ICG) |
|
|
|
|
|
|
|
|
|
|
|
|
|
|
|
|
|
|
|
Net Credit Losses |
|
|
78 |
|
|
91 |
|
|
110 |
|
|
115 |
|
|
127 |
|
10% |
|
63% |
Credit Reserve Build / (Release) |
|
|
(74) |
|
|
52 |
|
|
36 |
|
|
57 |
|
|
1,316 |
|
NM |
|
NM |
|
|
|
|
|
|
|
|
|
|
|
|
|
|
|
|
|
|
|
|
Corporate / Other |
|
|
|
|
|
|
|
|
|
|
|
|
|
|
|
|
|
|
|
Net Credit Losses |
|
|
2 |
|
|
2 |
|
|
1 |
|
|
(13) |
|
|
(2) |
|
85% |
|
NM |
Credit Reserve Build / (Release) |
|
|
(26) |
|
|
(20) |
|
|
(16) |
|
|
2 |
|
|
191 |
|
NM |
|
NM |
|
|
|
|
|
|
|
|
|
|
|
|
|
|
|
|
|
|
|
|
Total Provision for Loan Losses |
|
$ |
1,944 |
|
$ |
2,089 |
|
$ |
2,062 |
|
$ |
2,123 |
|
$ |
6,444 |
|
NM |
|
NM |
(1) |
Asia GCB includes NCLs and credit reserve builds (releases) for certain EMEA countries for all periods presented. |
NM Not meaningful.
Reclassified to conform to the current period's presentation.
Page 25
NON-ACCRUAL ASSETS
(In millions of dollars)
1Q20 Increase/ |
|||||||||||||||||||
1Q |
2Q |
3Q |
4Q |
1Q |
(Decrease) from |
||||||||||||||
2019 |
2019 |
2019 |
2019 |
2020 |
4Q19 |
1Q19 |
|||||||||||||
Non-Accrual Loans(1) |
|||||||||||||||||||
Corporate Non-Accrual Loans by Region |
|||||||||||||||||||
North America |
$ |
1,061 |
$ |
913 |
$ |
1,056 |
$ |
1,214 |
$ |
1,138 |
(6%) |
7% |
|||||||
EMEA |
317 | 321 | 307 | 430 | 720 |
67% |
NM |
||||||||||||
Latin America |
305 | 353 | 399 | 473 | 447 |
(5%) |
47% |
||||||||||||
Asia |
49 | 80 | 84 | 71 | 179 |
NM |
NM |
||||||||||||
Total |
$ |
1,732 |
$ |
1,667 |
$ |
1,846 |
$ |
2,188 |
$ |
2,484 |
14% |
43% |
|||||||
Consumer Non-Accrual Loans by Region(2) |
|||||||||||||||||||
North America |
$ |
1,090 |
$ |
1,082 |
$ |
1,013 |
$ |
905 |
$ |
926 |
2% |
(15%) |
|||||||
Latin America |
614 | 629 | 595 | 632 | 489 |
(23%) |
(20%) |
||||||||||||
Asia(3) |
251 | 260 | 258 | 279 | 284 |
2% |
13% |
||||||||||||
Total |
$ |
1,955 |
$ |
1,971 |
$ |
1,866 |
$ |
1,816 |
$ |
1,699 |
(6%) |
(13%) |
|||||||
Other Real Estate Owned (OREO)(4) |
|||||||||||||||||||
Institutional Clients Group |
$ |
31 |
$ |
34 |
$ |
20 |
$ |
18 |
$ |
19 |
6% |
(39%) |
|||||||
Global Consumer Banking |
18 | 11 | 10 | 6 | 4 |
(33%) |
(78%) |
||||||||||||
Corporate/Other |
49 | 37 | 42 | 37 | 27 |
(27%) |
(45%) |
||||||||||||
Total |
$ |
98 |
$ |
82 |
$ |
72 |
$ |
61 |
$ |
50 |
(18%) |
(49%) |
|||||||
OREO by Region |
|||||||||||||||||||
North America |
$ |
63 |
$ |
47 |
$ |
51 |
$ |
39 |
$ |
35 |
(10%) |
(44%) |
|||||||
EMEA |
1 | 1 | 1 | 1 | 1 |
- |
- |
||||||||||||
Latin America |
13 | 14 | 14 | 14 | 6 |
(57%) |
(54%) |
||||||||||||
Asia |
21 | 20 | 6 | 7 | 8 |
14% |
(62%) |
||||||||||||
Total |
$ |
98 |
$ |
82 |
$ |
72 |
$ |
61 |
$ |
50 |
(18%) |
(49%) |
|||||||
Non-Accrual Assets (NAA)(5) |
|||||||||||||||||||
Corporate Non-Accrual Loans |
$ |
1,732 |
$ |
1,667 |
$ |
1,846 |
$ |
2,188 |
$ |
2,484 |
14% |
43% |
|||||||
Consumer Non-Accrual Loans |
1,955 | 1,971 | 1,866 | 1,816 | 1,699 |
(6%) |
(13%) |
||||||||||||
Non-Accrual Loans (NAL) |
3,687 | 3,638 | 3,712 | 4,004 | 4,183 |
4% |
13% |
||||||||||||
OREO |
98 | 82 | 72 | 61 | 50 |
(18%) |
(49%) |
||||||||||||
Non-Accrual Assets (NAA) |
$ |
3,785 |
$ |
3,720 |
$ |
3,784 |
$ |
4,065 |
$ |
4,233 |
4% |
12% |
|||||||
NAL as a % of Total Loans |
0.54% | 0.53% | 0.54% | 0.57% | 0.58% | ||||||||||||||
NAA as a % of Total Assets |
0.19% | 0.19% | 0.19% | 0.21% | 0.19% | ||||||||||||||
Allowance for Loan Losses as a % of NAL |
334% | 343% | 338% | 319% | 498% |
(1) |
Corporate loans are placed on non-accrual status based upon a review by Citigroup's risk officers. Corporate non-accrual loans may still be current on interest payments. With limited exceptions, the following practices are applied for Consumer loans: consumer loans, excluding credit cards and mortgages, are placed on non-accrual status at 90 days past due, and are charged off at 120 days past due; residential mortgage loans are placed on non-accrual status at 90 days past due and written down to net realizable value at 180 days past due. Consistent with industry conventions, Citigroup generally accrues interest on credit card loans until such loans are charged off, which typically occurs at 180 days contractual delinquency. As such, the non-accrual loan disclosures do not include credit card loans. |
(2) |
For 4Q19 and prior, excludes Statement of Position (SOP) 03-3 purchased distressed loans. For 1Q20, non-accrual loans include purchased credit default loans. |
(3) |
Asia GCB includes balances for certain EMEA countries for all periods presented. |
(4) |
Represents the carrying value of all property acquired by foreclosure or other legal proceedings when Citigroup has taken possession of the collateral. Also includes former premises and property for use that is no longer contemplated. |
(5) |
There is no industry-wide definition of non-accrual assets. As such, analysis against the industry is not always comparable. |
NM Not meaningful.
Reclassified to conform to the current period's presentation.
Page 26
CET1 CAPITAL AND SUPPLEMENTARY LEVERAGE RATIOS, TANGIBLE COMMON EQUITY, BOOK VALUE PER
SHARE AND TANGIBLE BOOK VALUE PER SHARE
(In millions of dollars or shares, except per share amounts and ratios)
|
|
March 31, |
|
June 30, |
|
September 30, |
|
December 31, |
|
March 31, |
|||||
Common Equity Tier 1 Capital Ratio and Components(1) |
|
2019 |
|
2019 |
|
2019 |
|
2019 |
|
2020(2) |
|||||
Citigroup Common Stockholders' Equity(3) |
|
$ |
178,427 |
|
$ |
179,534 |
|
$ |
177,052 |
|
$ |
175,414 |
|
$ |
174,503 |
Add: Qualifying noncontrolling interests |
|
|
144 |
|
|
154 |
|
|
145 |
|
|
154 |
|
|
138 |
Regulatory Capital Adjustments and Deductions: |
|
|
|
|
|
|
|
|
|
|
|
|
|
|
|
Add: |
|
|
|
|
|
|
|
|
|
|
|
|
|
|
|
CECL transition and 25% provision deferral(4) |
|
|
- |
|
|
- |
|
|
- |
|
|
- |
|
|
4,316 |
Less: |
|
|
|
|
|
|
|
|
|
|
|
|
|
|
|
Accumulated net unrealized gains (losses) on cash flow hedges, net of tax(5) |
|
|
(442) |
|
|
75 |
|
|
328 |
|
|
123 |
|
|
2,020 |
Cumulative unrealized net gain (loss) related to changes in fair value of financial |
|
|
|
|
|
|
|
|
|
|
|
|
|
|
|
liabilities attributable to own creditworthiness, net of tax(6) |
|
|
(67) |
|
|
(85) |
|
|
181 |
|
|
(679) |
|
|
2,838 |
Intangible Assets: |
|
|
|
|
|
|
|
|
|
|
|
|
|
|
|
Goodwill, net of related deferred tax liabilities (DTLs)(7) |
|
|
21,768 |
|
|
21,793 |
|
|
21,498 |
|
|
21,066 |
|
|
20,123 |
Identifiable intangible assets other than mortgage servicing rights |
|
|
|
|
|
|
|
|
|
|
|
|
|
|
|
(MSRs), net of related DTLs |
|
|
4,390 |
|
|
4,264 |
|
|
4,132 |
|
|
4,087 |
|
|
3,953 |
Defined benefit pension plan net assets |
|
|
811 |
|
|
969 |
|
|
990 |
|
|
803 |
|
|
1,052 |
Deferred tax assets (DTAs) arising from net operating loss, foreign tax credit |
|
|
|
|
|
|
|
|
|
|
|
|
|
|
|
and general business credit carry-forwards |
|
|
11,756 |
|
|
11,547 |
|
|
11,487 |
|
|
12,370 |
|
|
12,259 |
Common Equity Tier 1 Capital (CET1) |
|
$ |
140,355 |
|
$ |
141,125 |
|
$ |
138,581 |
|
$ |
137,798 |
|
$ |
136,712 |
Risk-Weighted Assets (RWA)(4)(9) |
|
$ |
1,178,628 |
|
$ |
1,187,328 |
|
$ |
1,197,050 |
|
$ |
1,166,523 |
|
$ |
1,224,218 |
Common Equity Tier 1 Capital Ratio (CET1/RWA) |
|
|
11.91% |
|
|
11.89% |
|
|
11.58% |
|
|
11.81% |
|
|
11.2% |
|
|
|
|
|
|
|
|
|
|
|
|
|
|
|
|
Supplementary Leverage Ratio and Components |
|
|
|
|
|
|
|
|
|
|
|
|
|
|
|
Common Equity Tier 1 Capital (CET1)(4) |
|
$ |
140,355 |
|
$ |
141,125 |
|
$ |
138,581 |
|
$ |
137,798 |
|
$ |
136,712 |
Additional Tier 1 Capital (AT1)(8) |
|
|
18,002 |
|
|
17,981 |
|
|
19,452 |
|
|
18,007 |
|
|
17,600 |
Total Tier 1 Capital (T1C) (CET1 + AT1) |
|
$ |
158,357 |
|
$ |
159,106 |
|
$ |
158,033 |
|
$ |
155,805 |
|
$ |
154,312 |
Total Leverage Exposure (TLE)(4)(9) |
|
$ |
2,463,603 |
|
$ |
2,499,787 |
|
$ |
2,520,352 |
|
$ |
2,507,891 |
|
$ |
2,586,513 |
Supplementary Leverage Ratio (T1C/TLE) |
|
|
6.43% |
|
|
6.36% |
|
|
6.27% |
|
|
6.21% |
|
|
6.0% |
|
|
|
|
|
|
|
|
|
|
|
|
|
|
|
|
Tangible Common Equity, Book Value Per Share and Tangible Book Value Per Share |
|
|
|
|
|
|
|
|
|
|
|
|
|
|
|
Common Stockholders' Equity |
|
$ |
178,272 |
|
$ |
179,379 |
|
$ |
176,893 |
|
$ |
175,262 |
|
$ |
174,351 |
Less: |
|
|
|
|
|
|
|
|
|
|
|
|
|
|
|
Goodwill |
|
|
22,037 |
|
|
22,065 |
|
|
21,822 |
|
|
22,126 |
|
|
21,264 |
Intangible assets (other than MSRs) |
|
|
4,645 |
|
|
4,518 |
|
|
4,372 |
|
|
4,327 |
|
|
4,193 |
Tangible Common Equity (TCE) |
|
$ |
151,590 |
|
$ |
152,796 |
|
$ |
150,699 |
|
$ |
148,809 |
|
$ |
148,894 |
Common Shares Outstanding (CSO) |
|
|
2,312.5 |
|
|
2,259.1 |
|
|
2,183.2 |
|
|
2,114.1 |
|
|
2,081.8 |
Book Value Per Share (Common Equity/CSO) |
|
$ |
77.09 |
|
$ |
79.40 |
|
$ |
81.02 |
|
$ |
82.90 |
|
$ |
83.75 |
Tangible Book Value Per Share (TCE/CSO) |
|
$ |
65.55 |
|
$ |
67.64 |
|
$ |
69.03 |
|
$ |
70.39 |
|
$ |
71.52 |
(1) |
See footnote 3 on page 1. |
(2) |
Preliminary. |
(3) |
Excludes issuance costs related to outstanding preferred stock in accordance with Federal Reserve Board regulatory reporting requirements. |
(4) |
Citi has elected to apply the modified transition provision related to the impact of the CECL accounting standard on regulatory capital, as provided by the U.S. banking agencies’ March 2020 interim final rule. Under the modified CECL transition provision, the allowance for credit losses (after-tax) upon the January 1, 2020 CECL adoption date have been deferred and will phase-in to regulatory capital at 25% per year commencing January 1, 2022. For the ongoing impact of CECL, Citi is allowed to adjust the allowance for credit losses in an amount equal to 25% of the change in the allowance for credit losses (pre-tax) recognized through earnings for each period between January 1, 2020 and December 31, 2021. The cumulative adjustments to the allowance for credit losses between January 1, 2020 and December 31, 2021 will also phase-in to regulatory capital at 25% per year commencing January 1, 2022, along with the deferred impacts related to the January 1, 2020 CECL adoption date. The corresponding adjustments on average on-balance sheet assets are also reflected in Total Leverage Exposure. Additionally, the increase in DTAs arising from temporary differences upon the January 1, 2020 CECL adoption date has been deducted from RWA and will phase-in to RWA at 25% per year commencing January 1, 2022. |
(5) |
Common Equity Tier 1 Capital is adjusted for accumulated net unrealized gains (losses) on cash flow hedges included in accumulated other comprehensive income that relate to the hedging of items not recognized at fair value on the balance sheet. |
(6) |
The cumulative impact of changes in Citigroup’s own creditworthiness in valuing liabilities for which the fair value option has been elected, and own-credit valuation adjustments on derivatives, are excluded from Common Equity Tier 1 Capital, in accordance with the U.S. Basel III rules. |
(7) |
Includes goodwill “embedded” in the valuation of significant common stock investments in unconsolidated financial institutions. |
(8) |
Additional Tier 1 Capital primarily includes qualifying noncumulative perpetual preferred stock and qualifying trust preferred securities. |
(9) |
RWA and TLE exclude assets acquired pursuant to a non-recourse loan provided under the Money Market Mutual Fund Liquidity Facility, as permitted by the U.S. banking agencies’ March 2020 interim final rule. |
Reclassified to conform to the current period's presentation.
Page 27
Exhibit 99.3
Citigroup Inc. securities registered pursuant to Section 12(b) of the Securities Exchange Act of 1934:
Title of each class | Ticker Symbol(s) | Title for iXBRL | Name of each exchange on |
|
|
| |
Common Stock, par value $.01 per share | |||
|
| ||
Depositary Shares, each representing 1/1,000th interest in a share of 7.125% Fixed/Floating Rate Noncumulative Preferred Stock, Series J | |||
|
| ||
Depositary Shares, each representing 1/1,000th interest in a share of 6.875% Fixed/Floating Rate Noncumulative Preferred Stock, Series K | |||
|
| ||
Depositary Shares, each representing 1/1,000th interest in a share of 6.300% Noncumulative Preferred Stock, Series S | |||
|
| ||
7.625% Trust Preferred Securities of Citigroup Capital III (and registrant’s guaranty with respect thereto) | |||
|
| ||
7.875% Fixed Rate / Floating Rate Trust Preferred Securities (TruPS®) of Citigroup Capital XIII (and registrant’s guaranty with respect thereto) | |||
|
| ||
6.829% Fixed Rate / Floating Rate Enhanced Trust Preferred Securities (Enhanced TruPS®) of Citigroup Capital XVIII (and registrant’s guaranty with respect thereto) | |||
|
| ||
C-Tracks Exchange-Traded Notes Based on the Performance of the Miller/Howard MLP Fundamental Index Due September 28, 2023 | |||
|
| ||
C-Tracks Exchange-Traded Notes Miller/Howard Strategic Dividend Reinvestor Due September 16, 2024 | |||
|
| ||
C-Tracks Exchange-Traded Notes on the Miller/Howard MLP Fundamental Index, Series B, Due July 13, 2026 of Citigroup Global Markets Holdings Inc. (“CGMHI”) (and registrant’s guaranty with respect thereto) | |||
|
| ||
Exchange-Traded Notes Based on the Performance of the VelocityShares® Daily 4X Long USD vs. JPY Index due December 15, 2032 of CGMHI (and registrant’s guaranty with respect thereto) | |||
Exchange-Traded Notes Based on the Performance of the VelocityShares® Daily 4X Long USD vs. GBP Index due December |
15, 2032 of CGMHI (and registrant’s guaranty with respect thereto) | |||
|
| ||
Exchange-Traded Notes Based on the Performance of the VelocityShares® Daily 4X Long USD vs. EUR Index due December 15, 2032 of CGMHI (and registrant’s guaranty with respect thereto) | |||
|
| ||
Exchange-Traded Notes Based on the Performance of the VelocityShares® Daily 4X Long USD vs. CHF Index due December 15, 2032 of CGMHI (and registrant’s guaranty with respect thereto) | |||
|
| ||
Exchange-Traded Notes Based on the Performance of the VelocityShares® Daily 4X Long USD vs. AUD Index due December 15, 2032 of CGMHI (and registrant’s guaranty with respect thereto) | |||
|
| ||
Exchange-Traded Notes Based on the Performance of the VelocityShares® Daily 4X Long JPY vs. USD Index due December 15, 2032 of CGMHI (and registrant’s guaranty with respect thereto) | |||
|
| ||
Exchange-Traded Notes Based on the Performance of the VelocityShares® Daily 4X Long EUR vs. USD Index due December 15, 2032 of CGMHI (and registrant’s guaranty with respect thereto)
| |||
Exchange-Traded Notes Based on the Performance of the VelocityShares® Daily 4X Long GBP vs. USD Index due December 15, 2032 of CGMHI (and registrant’s guaranty with respect thereto)
| |||
Exchange-Traded Notes Based on the Performance of the VelocityShares® Daily 4X Long CHF vs. USD Index due December 15, 2032 of CGMHI (and registrant’s guaranty with respect thereto) | |||
|
| ||
Exchange-Traded Notes Based on the Performance of the VelocityShares® Daily 4X Long AUD vs. USD Index due December 15, 2032 of CGMHI (and registrant’s guaranty with respect thereto) | |||
|
| ||
VelocityShares® Long LIBOR ETNs due August 16, 2032 of CGMHI (and registrant’s guaranty with respect thereto) | |||
|
| ||
VelocityShares® Short LIBOR ETNs due August 16, 2032 of CGMHI (and registrant’s guaranty with respect thereto) | |||
Medium-Term Senior Notes, Series N, Callable Step-Up Coupon Notes Due March |
Q;R;6;_R4##:U" MWK4EUXZP8#'7UFG?^"U&UDH7YU6 II J&%DK3S=1;2 ML)461M9*'#V[YQA'F]6F8=(L($V8)C7>X2H.D^8 :7/3@,:3]PR'27.2(F$: MTA#3'";-2=)\(#.0);*:-(=) _+.I( UH JN"2?,*TH FD";L,6E>01K2L%N.2?.2M,#^O\>D>35I M'I/F%:0!32!=/@H(TH GLLPA,6E"0AC3$M(!)"X TTL8#)BVH20N8M* @ M#6@"Z>*!?+:C( UH FG" 9,6%*0A#3,-DQ8D:9&T\8!)"VK2 B8M*$@#FD@N M-&+2HH(TH(GD6B(F+2I( YI(FG#$I$5)6B3M,6+2HIJTB$F+"M* )I+V%I M44$:T$32'B/Y*%5!&M!0TS!I$9!&VF/$I$4U:1&3%A6D 4TD[3%ATI*"-*") MI#TF3%I2D 8TS+2$24N2M,0^1,>D)35I"9.6%*0!32+M,6'2DH(TH$GL6C!I M24$:T%#3R,:%)"VQ&3!I24U:PJ0E!6E DT@7SYBTK" -:!)IPAF3EA6D 0TS M+6/2,B"-M/&,2 @9 M9(D4$#>1#@)1( L% *2)P !PK%VS7 H(G0 '_P>#+)H"%M7P6/#%Z M!EFJ!,5*I(. 0=;Q2;#$H&2)18 CR)N/BA$U" M.-1'3@S)G!A-Z 2)QA4.J41R)T83/$&B<8G#*A$2->$3)*(FDOB) ?F3<9W$ M)F$93CV))(-B-"$4)!H79*P2(5$31$&B<=G&*A$2-6$4*&+-A<11#,BCC(L_ M-@DA41]),2238C2A%"0R+(]N2"[%:((I2&0,N[ &ULU9E=4^)(%(:O9W]%%[/C:I4""2/@C&.5 M B*.($5@=MRMO6B3%KI,NK/='91_OZ<38( .B,HP[I4AZ9SSGB?GHQ./I53H M,?"9_)(9*!5^RN6D.R !EED>$@97[K@(L(*?HI^3H2#8DP-"5.#G['R^F LP M91D4,?IO1"H\8NI+QK+LS,FQI"?'ZJ3*W2@@3"',/%1CBJH1:K#$)N7L.*=. MCG-Z:;+\-!199!WN(SMOYQ COZ\H(ZBA2"#_65P^==T=A63Q8OG@Z]+U M;2(HUVH]5,7*N'6B\;=W[U:H/*<^0:THN"5B<85U<'1D?UQR7X?TJ50"@XX6 M#@SG%:IH7_ HW'EO%?.?&\Q=2LGE(N0BYK2/' 61("Y0_(S$"/YZAO%J;8FQ M+GY$#0_8T#OJ)N330SNT#ZS#8CE_=+3$TJGG"2+E_N0 Q0_PFAE:"N4RJ@M" MV -U!R ?#M53-BOZ%\38Y0]&9K7( [KAXOXI&U-0;<&'E+F&L-;-4R;:7"KL MH[]HF$K9RN>M0LIS!0M07:FWV):]>.J*N^"C/>!L69H='AX=@*]E"5H+B.A3 MU@?*_$$-P&\08C9:7'V'?6GH&9NH0$8(4-%@'GE$7XEQ,WC/EPLZ8*.(H-*\ MN-K.?=Q?O.IPG[J0Z:"N"8]#4.PO+FD+ X"M7@*.[>[Z,0"S3$?D30[]F\A4*P+0=8 M&/RZ5$%WX'?(LG=O]Y!#W B\&?BZ GN:@3,*;KE!H&)0&YM!M4=W@%F?I':0 MUHUCE'F5A%Q2A:$O.%HO)#'!4':"0,.7NNY!A96S]N%Y0JI0!L^$P."@#.$D M0AU,*6O9AQ^@\ST2+W?N P6GBTO17@06I*C9 IY@MEUY%QQQ8+Z#S0\63= Q_ M,9TT%1NA4\CG/ZQ)PEE#P[.8S/B>0)CX,YW%&(RSI6Q1IUU71&!_1GA2DUHU M>)I.;U3!(=5#HM%HH%V]-Q+3N?^'1/T(ZZ,1>J!*DY0A<152 U"O^-XRUYU> M._&"PS2[.^_+ME7Z_,.Z8:B2*Q2-Z5::R=LD6W)H/GU7Q+P+U]K.7GKLWS<3 M?"+O>U7KZK10['&"( 'J*ARSBY9S^;8),!/% M4S#SOJ>$TIRMDRK%TEG;.'L (\N]E],)I'][X++%%81_AB4 _C M09+6HD\UJ>\3D;O@#UAXJ'G51N<1\[">V--=1A6&JT-"V/'#E@?9Y?A5P=Q. M385T6^A9=E/-P2W&M-5S]%2X^)D,YK7 OA9RIT]=5*5#"CML2"Y"V1":%&Q! MYV.UBG&LQHO#7*PO,9]JM=KX9H3\1&CC![L&[6DG/]N/55Q&_@A9A3B^XGQ1 MU'U^"[
-S-ZKJV4%1*T^&06S:J=*M8#G MUP]@,5^V7E0TWXC/8:\\2@8?O+%24/?Q.[KBT)EZ3A4-919=MF_&>>Y! %7B MCE,J?M,NV$L#>2Y'_2GADPRQ2[YDXODKAB1SHIFN(7.B
]6WU07&@C:6M6!O"SCU,- X=1!OI LDDB:*7L@3&8Y[ MVYE2NGF],:")I,T#W4Y?U=-UFT!?VE<3G:^F;#;6WG;V WH@O W.:\A\)>8T MRML97WI*_ \H)S)_ N64J;8@)/9_U3B[[NBW1!G[/HWZ^FM/\FZ^R>:YGN_7 MSO+>U9G1*1<\.P,NU*\*>YGS5^]AGHZ[\#@N:Q%Y!%U3/Q'@4W8/1:9X7%'. M#@["SVU4=RJ-F95)_=0ZJ25D_>02:G9;T^\K<%3!OH]O?="J2'C0T_^3C$+] M#]RX9>CO&4TLM*[G?,XPZT=_.SY]&FF##8F0Y"U3G0-8GP$X\_'W![Q+S/2W MH)+!PR[-?#_+2:E._@-02P,$% @ A$./4+JA.8K7 0 ,@8 T !X M;"]S='EL97,N>&ULU55;B]4P$/XK(3_ G';9!:4MZ,*"H+*PY\'7M)VV@=Q, MI\=V?[U)T]O1!_'@@[XT,]],OOERF33K<9+PT@$@&974?4X[1/N.L;[J0/'^ MC;&@?:0Q3G'TKFM9;QWPN@^3E&3IZ?3 %!>:%ID>U)/"GE1FT)C3$V5%UAB] M(W N]*Z32=.7D&?PF1Q3Y/UBML'9^2 M])[N$^;!%RF-J\%M91*Z0D4FH0ERG&B[,**Q+ 01C?)&+7AK-)\UK#,6P]-6 M(.5+.,*OS17WV)"8\[$.QT""BM7TJU[,>%S1"?Q'MLA]H+V_B998<3'X8?"K MT;/_;3 (SPX:,<[^V&SU/3NW5D[OI6BU@KB6WQ9,;BQ89'RM0SKCQ*OG"S>E M\@ X2B[@4%1'Y+OC]@PCKK=I;&[5G/Z'FO_V/K>@P7%Y%.VO_K^\RW^BF"W= M >&%S.F7\/#*JS[9^]33(R_] W[%[^?6T/!! MXG-8\1S,Z6Y_"B]-\K!EG3>*G.[V9ZC%H-[.!?>_1/$#4$L#!!0 ( (1# MCU 6;2-_0P$ #P" / >&PO=V]R:V)O;VLN>&ULC5'+;L(P$/P5RQ_0 M!-0B%1$NI0^DJD6EXNXD&[+"C\C>0,O7=^THA=YZLG=V/#L[7IRN \N=QGFCB$N_ST+G0=6A!2"CLVF>SS*CT,KE8M3: M^.RZ< 05H;,,1F"'< J7?BR%8L(1/E59R%P*U9-[0DW@5XK@V;N^0[LOY$2* M!GV@;9R=F 8M&CQ#G:K0NM.+\WAVEI3>5MYIG5[%1GK$$\(OL@-/6/TADBH_ M%'LMY"QGP2,&+%$C?1 MZV(LXL8M9X>?(#;^N)\GX MZ+:&!BW4;SP@,,XA5!LOXI%TIK=WDWL.N]?Z@;%W^^I4TH\:X\ *A0V$LZ&8O:3RKC>LG^Z&JPLFAE MC1"'X17 ]2\43$+!&P'Q7,0*>FP?+)K=$U'AZS@>S'G10R/'1Y?,5'W])=9 MSUZ",*V'O\E$_37 ZM=E7U!+ P04 " "$0X]0"X_8 R$! !7! $P M %M#;VYT96YT7U1Y<&5S72YX;6RU5$U/PS ,_2M3KVC-X, !;;L 5Y@$?R D M;ALU7[*]T?U[W&Y#8BIB:-LEB?/L]UX2*_/W;0::=,%'6A0- BVD1[1#K=$Y8(?LBAQF6ZD81B\MP)"\G>HA"4"G6"PG%A'TO=ZP80G85_ M64M5Y0S89-9!2DK*"-I2 \#!E]1H!/O&Z&*]][O2R"\Z"+'JO/J14%[/!V\] MC!L8D$LJL[0%C$D-P&Z\/4OPT TF(4PS"HKL1HXGEE:"DNH3+WE$Z%O'@CU) M7*BO]["?"=MA/7;AWR"I83KOUO]H=)G+H%W\S&PO M=&AE;64O=&AE;64Q+GAM;%!+ 0(4 Q0 ( (1#CU#=K9/2M 8 -DS 8 M " ?@( !X;"]W;W)K &PO M &PO &PO7W)E;',O=V]R:V)O;VLN>&UL+G)E;'-02P$"% ,4 " "$0X]0 M"X_8 R$! !7! $P @ &;&@ 6T-O;G1E;G1?5'EP97-= :+GAM;%!+!08 "@ * ( " #M&P ! end
":
MZ3Q;]2GTM,L4=G)_?LE'4),R&_+2N]@+@VP#'P9<#\*A@(VE;O<>:0)J)O>-
M_GAFTK[7NK,,#FM%[YENCY[0*T*-4SG%)5V$N.7NI>XC[5]R]8HFW9HH>
MF"9-H!_^=VXY1$M-B=P6/367A!BGI<00-267X2TY/4.?V]$+]AT% I>.,@G%
M$&LS5!S0EY?>C?N0O#-MN65;:/@R/"D)G\W:0$$)VJHF)7/-VCCF7#'Y%$79
M#.UXOWSI77GNO>48Z:>>J>9M(6!*H%(6)FS;0,4TR%7-U/EY532"8E(JC[<9
M>EZY?J#;_[6F2_>%4HS;0DUID%)BQBS;0$LYX*HFJ? .U+W2?1X,L=9&1R;1
M!Q[14PB8.(R8 /@9=UZL7>9:@F8_$IZ%?%P=<_OI\=B=/7:UR99?.\M),QD;FP
MFA6A2?K1!1'WNAN!TV*X+ /;(CC5K&K-?CZ T1AN I[27/0KW2YXU]ZX;N#5WJ5
M=90NQ4:O5P787$?FSG(&.C([]BG9M1=ZZSIW=K^8V7^7N9&.&HT=\J.]M\2E
M[6K'=&RNM+,3/^!:O__#7OEIZL C\&B*2PW%8^/W?UA=X!%X!!Y9X-$"'DN#
MQ\5NS+NN+S(&TZ/,:65^PL._J]]7WLT7H 0H.;NQ,*#\0_VQ")3/?5@=.]5N
MS1V?I_]9]OCE.Y2N[LXY9YKQU86^2VD2WHB_.Z/QL;@('5>*[\I/%+RR/Z@N
M+Y<5L4T@_T?8;2#*%6R%B/DN]IOB.&%7&G;IG\@-^LK7_J99'.2T*W)JU4K_
M@">0$\@)Y,21G)KUE57OHI(3P+%KB^<(B"?%KB<@ @
MPG@H3D9T_+Y3=MIBC)E2% \[MG]V[%.R:B_T$%@XW_>VY#:W1J7;P VZH"]D
MO2 G=N14K]0M/)L0Y 1R CDQ)">[U2T[.0$ ^B=A CD3 3V?<87$-'H6\%^51"*0'O7&;2H]#"/V+ U+;YG4@L,,PQ1
M:V-FXR91JT74*B"UOH4"$BYF882(.E,JC2%S9"W&4YO'0/;B,B;IDBM+-'N0
M3< !G@S-F!*QO!#A'E43 C:F*FU20AJ$X(*B*"%*T( .CQ ,4"@9'GC^UF4
MN8@J%BG+8BU <%B?N>98;MD.E3'"[#!HTN=FP/JANF,#$5QC:!;;&"W(HZV'
MEA2 3D.\%@'@!B(V$J(MV%=% K@'''0Q'/(1B8B-8= %5)2IB S(%W?QU75L
M.P(']+G4J/%,8#_PH!X/;61G!D*DQ,>-F?>;Q,<.\;& ?+P">N2HLER*P)I3
MA(\_X+&C&L-*/EYO2L;E?'4' (3\4J9WD"0.X#S&[HI40GJ%DO=D",=AA1[(
M>C>0OJMZ3\(KP7".#;AA/2%B)K"6+@)7LX7QSG0J&,V&X._ (33\!0<>9E/H.$Q0W!<5JW6$IJ#0_Q =]$*&B/^A-4U"1"GH/@=G8T?4?SWOA7GRYD2N'(]6\^09]'JC0Q^
MHMXCO)>*6SP78YE$J^[S'N*6O/A7NE$^9:N)$="[C!@GY-HO[MEM&M3_28KA'=F6B;.OV%=W?[26Y < ]EGS; U]SSCLT#50]4
M_5M4_5Z?G\.]2LQ/=?+PMA9UONA*5'BVV5L&6IAN7GA$?03!(_7R\M58)\H+
MJU?S!:JHI"LS^&=@C]23_P=02P,$% @ A$./4*)8@1>,&P TD,! !0
M !C+3(P,C P-#$U>&5X.3DS+FAT;>U=9W.CRK;]?JON?^#YOO/..56#35">
M<$L!Y9RE+Q2AA1!1!"'TZU\W"I;'\HP\LD?(!U?-2(*FZ=Y[L?9>W=!\^>]:
M4[$5L&S9T+_^2=X3?V) %PQ1UJ6O?P[Z13SUYW^__?M?&/S;_H]A7_X'QS%Y
MG.O6,=$07 WH#B98@'. B'FR,\]@?<,T.1UK ,N2517+6;(H@=TAZ?O$?3)&
MD/=T*AVC,1S_]J3>'&?#:@P]LRM.WI//RN1W)T.E8@]D_($B* (CR0P=RY $
MEFT\.V);5UWF+<[R]]W-P,J)0UOB\1>.Z@%K)0L JQH\5BEDL!2?%$512.$4
M1W)X+"TD\;3 9P"9((028+CT]1Q5>CSR]R!9H:FUNV,:^,2QYE?[^:.8V8>
M'F:VFU?
M'.T5G<,!QX7C#]N=^Z+RVL%M(#RI'/Z^EXS5@ZS#B@&RP8-C<;H],RR-_9S+(,(
M_<&,,0,]U^A>$\.57F-[36J59A>[%QN4&T 51G\PN.P)+FLT7\QE12T\#95F
MS%>3V0(&_<'&\ESSY4^< ,^QXCFN$K3!;9!H#RY +6.\\,PVRJR$XQEO'D*P
MSCNW0SM?P>P//1K]Q0CV!2*DPCD$2O*N.
:*2EAYG3\WKKU-_5[_N 'J!GJ.=,AMX?ZH]%T'ONX\#8J6=K
M;N$[_:\UWNQ&EFO@\L(;R4A\E=?B7(V
A\[X[5[Z\_[VJP-?.?&1-L9T@]/&/@1F(P7FS_KA
M%!"8#54[S:]JC#,YUV!1HB+&JEC=E3MZBLI5YJ==YI,7"LG5 $-JNWVV S
ML!E7'X#-P&9KL)G=ML%F0!)7'W!"SRH"[R:M,XX^>-9[
X&95C!4\]9;=_[ZZU\RFVW6S_!5@S'@D
MH4S+AMM6XZ\R%I^"OAI))*QLX5.*@,$6*V77=$U20P[:S<:BM4:DOF R\U-?
MZ+A%U''K-K:,X-(AB=9BYR7ZJZ5
M"NYD*'S9,C$?5$ '1RW[\<(8(0.6.^ 7<-2$WVH;MP>M\!;%3# \SE[(,#
M,X@@8[MNP :9?1D#QZ3-E$'(:8;M$;C>8D)6#4QSR-.M!'F*1I:+_QZ/(AQ(
M7-VS$;EO:_,!2S*-5P92S",Y#F07DT;X$1