falseTRUE2022FY000082922410/020.0010.0012,400.02,400.01,147.91,180.01,147.91,180.0http://fasb.org/us-gaap/2022#ProductionAndDistributionCostshttp://fasb.org/us-gaap/2022#ProductionAndDistributionCostshttp://fasb.org/us-gaap/2022#ProductionAndDistributionCostshttp://fasb.org/us-gaap/2022#InterestExpensehttp://fasb.org/us-gaap/2022#InterestExpensehttp://fasb.org/us-gaap/2022#InterestExpensehttp://fasb.org/us-gaap/2022#InterestAndOtherIncomehttp://fasb.org/us-gaap/2022#InterestAndOtherIncomehttp://fasb.org/us-gaap/2022#InterestAndOtherIncomehttp://fasb.org/us-gaap/2022#ProductionAndDistributionCostshttp://fasb.org/us-gaap/2022#ProductionAndDistributionCostshttp://fasb.org/us-gaap/2022#ProductionAndDistributionCostshttp://fasb.org/us-gaap/2022#InterestAndOtherIncomehttp://fasb.org/us-gaap/2022#InterestAndOtherIncomehttp://fasb.org/us-gaap/2022#InterestAndOtherIncomehttp://fasb.org/us-gaap/2022#Revenueshttp://fasb.org/us-gaap/2022#Revenueshttp://fasb.org/us-gaap/2022#Revenueshttp://fasb.org/us-gaap/2022#ProductionAndDistributionCostshttp://fasb.org/us-gaap/2022#ProductionAndDistributionCostshttp://fasb.org/us-gaap/2022#ProductionAndDistributionCostshttp://fasb.org/us-gaap/2022#InterestAndOtherIncomehttp://fasb.org/us-gaap/2022#InterestAndOtherIncomehttp://fasb.org/us-gaap/2022#InterestAndOtherIncomehttp://fasb.org/us-gaap/2022#InterestExpensehttp://fasb.org/us-gaap/2022#InterestExpensehttp://fasb.org/us-gaap/2022#InterestExpensehttp://fasb.org/us-gaap/2022#InterestAndOtherIncomehttp://fasb.org/us-gaap/2022#InterestAndOtherIncomehttp://fasb.org/us-gaap/2022#InterestAndOtherIncomehttp://fasb.org/us-gaap/2022#InterestExpensehttp://fasb.org/us-gaap/2022#InterestExpensehttp://fasb.org/us-gaap/2022#InterestExpensehttp://fasb.org/us-gaap/2022#InterestAndOtherIncomehttp://fasb.org/us-gaap/2022#InterestAndOtherIncomehttp://fasb.org/us-gaap/2022#InterestAndOtherIncomehttp://fasb.org/us-gaap/2022#InterestAndOtherIncomehttp://fasb.org/us-gaap/2022#InterestExpensehttp://fasb.org/us-gaap/2022#InterestExpensehttp://fasb.org/us-gaap/2022#PrepaidExpenseAndOtherAssetsCurrenthttp://fasb.org/us-gaap/2022#PrepaidExpenseAndOtherAssetsCurrenthttp://fasb.org/us-gaap/2022#PrepaidExpenseAndOtherAssetsCurrenthttp://fasb.org/us-gaap/2022#PrepaidExpenseAndOtherAssetsCurrenthttp://fasb.org/us-gaap/2022#OtherAssetsNoncurrenthttp://fasb.org/us-gaap/2022#OtherAssetsNoncurrenthttp://fasb.org/us-gaap/2022#OtherAssetsNoncurrenthttp://fasb.org/us-gaap/2022#OtherAssetsNoncurrenthttp://fasb.org/us-gaap/2022#AccruedLiabilitiesCurrenthttp://fasb.org/us-gaap/2022#AccruedLiabilitiesCurrenthttp://fasb.org/us-gaap/2022#AccruedLiabilitiesCurrenthttp://fasb.org/us-gaap/2022#AccruedLiabilitiesCurrenthttp://fasb.org/us-gaap/2022#DeferredTaxAndOtherLiabilitiesNoncurrenthttp://fasb.org/us-gaap/2022#DeferredTaxAndOtherLiabilitiesNoncurrenthttp://fasb.org/us-gaap/2022#DeferredTaxAndOtherLiabilitiesNoncurrenthttp://fasb.org/us-gaap/2022#DeferredTaxAndOtherLiabilitiesNoncurrenthttp://fasb.org/us-gaap/2022#PrepaidExpenseAndOtherAssetsCurrenthttp://fasb.org/us-gaap/2022#PrepaidExpenseAndOtherAssetsCurrenthttp://fasb.org/us-gaap/2022#PrepaidExpenseAndOtherAssetsCurrenthttp://fasb.org/us-gaap/2022#PrepaidExpenseAndOtherAssetsCurrenthttp://fasb.org/us-gaap/2022#OtherAssetsNoncurrenthttp://fasb.org/us-gaap/2022#OtherAssetsNoncurrenthttp://fasb.org/us-gaap/2022#OtherAssetsNoncurrenthttp://fasb.org/us-gaap/2022#OtherAssetsNoncurrenthttp://fasb.org/us-gaap/2022#AccruedLiabilitiesCurrenthttp://fasb.org/us-gaap/2022#AccruedLiabilitiesCurrenthttp://fasb.org/us-gaap/2022#AccruedLiabilitiesCurrenthttp://fasb.org/us-gaap/2022#AccruedLiabilitiesCurrenthttp://fasb.org/us-gaap/2022#DeferredTaxAndOtherLiabilitiesNoncurrenthttp://fasb.org/us-gaap/2022#DeferredTaxAndOtherLiabilitiesNoncurrenthttp://fasb.org/us-gaap/2022#DeferredTaxAndOtherLiabilitiesNoncurrenthttp://fasb.org/us-gaap/2022#DeferredTaxAndOtherLiabilitiesNoncurrent00008292242021-10-042022-10-0200008292242022-04-03iso4217:USD00008292242022-11-11xbrli:shares00008292242022-10-020000829224sbux:CompanyOperatedStoresMember2021-10-042022-10-020000829224sbux:CompanyOperatedStoresMember2020-09-282021-10-030000829224sbux:CompanyOperatedStoresMember2019-09-302020-09-270000829224sbux:LicensedStoresMember2021-10-042022-10-020000829224sbux:LicensedStoresMember2020-09-282021-10-030000829224sbux:LicensedStoresMember2019-09-302020-09-270000829224us-gaap:ProductAndServiceOtherMember2021-10-042022-10-020000829224us-gaap:ProductAndServiceOtherMember2020-09-282021-10-030000829224us-gaap:ProductAndServiceOtherMember2019-09-302020-09-2700008292242020-09-282021-10-0300008292242019-09-302020-09-27iso4217:USDxbrli:shares0000829224us-gaap:AvailableforsaleSecuritiesMember2021-10-042022-10-020000829224us-gaap:AvailableforsaleSecuritiesMember2020-09-282021-10-030000829224us-gaap:AvailableforsaleSecuritiesMember2019-09-302020-09-270000829224us-gaap:CashFlowHedgingMember2021-10-042022-10-020000829224us-gaap:CashFlowHedgingMember2020-09-282021-10-030000829224us-gaap:CashFlowHedgingMember2019-09-302020-09-270000829224us-gaap:NetInvestmentHedgingMember2021-10-042022-10-020000829224us-gaap:NetInvestmentHedgingMember2020-09-282021-10-030000829224us-gaap:NetInvestmentHedgingMember2019-09-302020-09-270000829224us-gaap:AccumulatedTranslationAdjustmentMember2021-10-042022-10-020000829224us-gaap:AccumulatedTranslationAdjustmentMember2020-09-282021-10-030000829224us-gaap:AccumulatedTranslationAdjustmentMember2019-09-302020-09-270000829224us-gaap:ReclassificationOutOfAccumulatedOtherComprehensiveIncomeMember2021-10-042022-10-020000829224us-gaap:ReclassificationOutOfAccumulatedOtherComprehensiveIncomeMember2020-09-282021-10-030000829224us-gaap:ReclassificationOutOfAccumulatedOtherComprehensiveIncomeMember2019-09-302020-09-270000829224us-gaap:NoncontrollingInterestMember2021-10-042022-10-020000829224us-gaap:NoncontrollingInterestMember2020-09-282021-10-030000829224us-gaap:NoncontrollingInterestMember2019-09-302020-09-2700008292242021-10-0300008292242020-09-2700008292242019-09-290000829224us-gaap:CommonStockMember2019-09-290000829224us-gaap:AdditionalPaidInCapitalMember2019-09-290000829224us-gaap:RetainedEarningsMember2019-09-290000829224us-gaap:AccumulatedOtherComprehensiveIncomeMember2019-09-290000829224us-gaap:ParentMember2019-09-290000829224us-gaap:NoncontrollingInterestMember2019-09-290000829224us-gaap:CommonStockMember2020-09-270000829224us-gaap:AdditionalPaidInCapitalMember2020-09-270000829224us-gaap:RetainedEarningsMember2020-09-270000829224us-gaap:AccumulatedOtherComprehensiveIncomeMember2020-09-270000829224us-gaap:ParentMember2020-09-270000829224us-gaap:NoncontrollingInterestMember2020-09-270000829224us-gaap:CommonStockMember2019-09-302020-09-270000829224us-gaap:AdditionalPaidInCapitalMember2019-09-302020-09-270000829224us-gaap:RetainedEarningsMember2019-09-302020-09-270000829224us-gaap:AccumulatedOtherComprehensiveIncomeMember2019-09-302020-09-270000829224us-gaap:ParentMember2019-09-302020-09-270000829224us-gaap:CommonStockMember2021-10-030000829224us-gaap:AdditionalPaidInCapitalMember2021-10-030000829224us-gaap:RetainedEarningsMember2021-10-030000829224us-gaap:AccumulatedOtherComprehensiveIncomeMember2021-10-030000829224us-gaap:ParentMember2021-10-030000829224us-gaap:NoncontrollingInterestMember2021-10-030000829224us-gaap:CommonStockMember2020-09-282021-10-030000829224us-gaap:AdditionalPaidInCapitalMember2020-09-282021-10-030000829224us-gaap:RetainedEarningsMember2020-09-282021-10-030000829224us-gaap:AccumulatedOtherComprehensiveIncomeMember2020-09-282021-10-030000829224us-gaap:ParentMember2020-09-282021-10-030000829224us-gaap:CommonStockMember2021-10-042022-10-020000829224us-gaap:AdditionalPaidInCapitalMember2021-10-042022-10-020000829224us-gaap:RetainedEarningsMember2021-10-042022-10-020000829224us-gaap:AccumulatedOtherComprehensiveIncomeMember2021-10-042022-10-020000829224us-gaap:ParentMember2021-10-042022-10-020000829224us-gaap:CommonStockMember2022-10-020000829224us-gaap:AdditionalPaidInCapitalMember2022-10-020000829224us-gaap:RetainedEarningsMember2022-10-020000829224us-gaap:AccumulatedOtherComprehensiveIncomeMember2022-10-020000829224us-gaap:ParentMember2022-10-020000829224us-gaap:NoncontrollingInterestMember2022-10-020000829224us-gaap:FacilityClosingMember2020-09-282021-10-030000829224us-gaap:FacilityClosingMember2019-09-302020-09-270000829224sbux:LeaseTerminationMember2020-09-282021-10-030000829224sbux:LeaseTerminationMember2019-09-302020-09-270000829224srt:MinimumMemberus-gaap:EquipmentMember2021-10-042022-10-020000829224srt:MaximumMemberus-gaap:EquipmentMember2021-10-042022-10-020000829224srt:MinimumMemberus-gaap:BuildingMember2021-10-042022-10-020000829224srt:MaximumMemberus-gaap:BuildingMember2021-10-042022-10-020000829224us-gaap:LeaseholdImprovementsMember2021-10-042022-10-020000829224us-gaap:RestructuringChargesMember2021-10-042022-10-020000829224us-gaap:RestructuringChargesMember2020-09-282021-10-030000829224us-gaap:RestructuringChargesMember2019-09-302020-09-270000829224sbux:StoreOperatingExpenseDomain2021-10-042022-10-020000829224sbux:StoreOperatingExpenseDomain2020-09-282021-10-030000829224sbux:StoreOperatingExpenseDomain2019-09-302020-09-270000829224sbux:InternationalSegmentMember2019-09-302020-09-270000829224sbux:AcceleratedLeaseROUAssetAmortizationAndOtherLeaseCostsMember2020-09-282021-10-030000829224sbux:AcceleratedLeaseROUAssetAmortizationAndOtherLeaseCostsMember2019-09-302020-09-270000829224sbux:TradeNamesTrademarksandPatentsMember2019-09-302020-09-270000829224sbux:StoredValueCardsAndLoyaltyProgramBreakageInPriorYearDomainus-gaap:EntityOperatedUnitsMember2021-10-042022-10-020000829224sbux:StoredValueCardsAndLoyaltyProgramBreakageInPriorYearDomainus-gaap:EntityOperatedUnitsMember2020-09-282021-10-030000829224sbux:StoredValueCardsAndLoyaltyProgramBreakageInPriorYearDomainus-gaap:EntityOperatedUnitsMember2019-09-302020-09-270000829224us-gaap:FranchisedUnitsMembersbux:StoredValueCardsAndLoyaltyProgramBreakageInPriorYearDomain2021-10-042022-10-020000829224us-gaap:FranchisedUnitsMembersbux:StoredValueCardsAndLoyaltyProgramBreakageInPriorYearDomain2020-09-282021-10-030000829224us-gaap:FranchisedUnitsMembersbux:StoredValueCardsAndLoyaltyProgramBreakageInPriorYearDomain2019-09-302020-09-270000829224us-gaap:AccountingStandardsUpdate201613Member2020-09-280000829224sbux:KoreaJVMembersbux:KoreaJVMember2021-09-23xbrli:pure0000829224sbux:KoreaJVMembersbux:EMartIncMember2021-09-230000829224sbux:KoreaJVMembersbux:ApfinInvestmentPteLtdAnAffiliateOfGICPrivateLimitedMembersbux:KoreaJVMember2021-09-2300008292242021-06-282021-10-030000829224sbux:KoreaJVMember2021-06-282021-10-030000829224us-gaap:CashFlowHedgingMembersbux:CoffeeContractsMember2021-10-042022-10-020000829224us-gaap:CashFlowHedgingMembersbux:CoffeeContractsMember2020-09-282021-10-030000829224us-gaap:CashFlowHedgingMembersbux:CoffeeContractsMember2019-09-302020-09-270000829224us-gaap:CashFlowHedgingMemberus-gaap:CrossCurrencyInterestRateContractMember2021-10-042022-10-020000829224us-gaap:CashFlowHedgingMemberus-gaap:CrossCurrencyInterestRateContractMember2020-09-282021-10-030000829224us-gaap:CashFlowHedgingMemberus-gaap:CrossCurrencyInterestRateContractMember2019-09-302020-09-270000829224us-gaap:CashFlowHedgingMembersbux:DairyContractsMember2021-10-042022-10-020000829224us-gaap:CashFlowHedgingMembersbux:DairyContractsMember2020-09-282021-10-030000829224us-gaap:CashFlowHedgingMembersbux:DairyContractsMember2019-09-302020-09-270000829224us-gaap:CashFlowHedgingMemberus-gaap:ForeignExchangeContractMember2021-10-042022-10-020000829224us-gaap:CashFlowHedgingMemberus-gaap:ForeignExchangeContractMember2020-09-282021-10-030000829224us-gaap:CashFlowHedgingMemberus-gaap:ForeignExchangeContractMember2019-09-302020-09-270000829224us-gaap:CashFlowHedgingMemberus-gaap:InterestRateContractMember2021-10-042022-10-020000829224us-gaap:CashFlowHedgingMemberus-gaap:InterestRateContractMember2020-09-282021-10-030000829224us-gaap:CashFlowHedgingMemberus-gaap:InterestRateContractMember2019-09-302020-09-270000829224us-gaap:NetInvestmentHedgingMemberus-gaap:CrossCurrencyInterestRateContractMember2022-10-020000829224us-gaap:NetInvestmentHedgingMemberus-gaap:CrossCurrencyInterestRateContractMember2021-10-030000829224us-gaap:NetInvestmentHedgingMemberus-gaap:CrossCurrencyInterestRateContractMember2020-09-270000829224us-gaap:NetInvestmentHedgingMemberus-gaap:CrossCurrencyInterestRateContractMember2021-10-042022-10-020000829224us-gaap:ForeignExchangeContractMemberus-gaap:NetInvestmentHedgingMember2022-10-020000829224us-gaap:ForeignExchangeContractMemberus-gaap:NetInvestmentHedgingMember2021-10-030000829224us-gaap:ForeignExchangeContractMemberus-gaap:NetInvestmentHedgingMember2020-09-270000829224us-gaap:ForeignExchangeContractMemberus-gaap:NetInvestmentHedgingMember2021-10-042022-10-020000829224us-gaap:NetInvestmentHedgingMembersbux:ForeignExchangeYenDebtMember2022-10-020000829224us-gaap:NetInvestmentHedgingMembersbux:ForeignExchangeYenDebtMember2021-10-030000829224us-gaap:NetInvestmentHedgingMembersbux:ForeignExchangeYenDebtMember2020-09-270000829224us-gaap:NetInvestmentHedgingMembersbux:ForeignExchangeYenDebtMember2021-10-042022-10-020000829224sbux:CoffeeContractsMemberus-gaap:CashFlowHedgingMemberus-gaap:DesignatedAsHedgingInstrumentMember2021-10-042022-10-020000829224sbux:CoffeeContractsMemberus-gaap:CashFlowHedgingMemberus-gaap:DesignatedAsHedgingInstrumentMember2020-09-282021-10-030000829224sbux:CoffeeContractsMemberus-gaap:CashFlowHedgingMemberus-gaap:DesignatedAsHedgingInstrumentMember2019-09-302020-09-270000829224sbux:CoffeeContractsMemberus-gaap:CashFlowHedgingMemberus-gaap:DesignatedAsHedgingInstrumentMembersbux:ProductAndDistributionCostsMember2020-09-282021-10-030000829224sbux:CoffeeContractsMemberus-gaap:CashFlowHedgingMemberus-gaap:DesignatedAsHedgingInstrumentMembersbux:ProductAndDistributionCostsMember2021-10-042022-10-020000829224sbux:CoffeeContractsMemberus-gaap:CashFlowHedgingMemberus-gaap:DesignatedAsHedgingInstrumentMembersbux:ProductAndDistributionCostsMember2019-09-302020-09-270000829224us-gaap:CashFlowHedgingMemberus-gaap:DesignatedAsHedgingInstrumentMemberus-gaap:CrossCurrencyInterestRateContractMember2021-10-042022-10-020000829224us-gaap:CashFlowHedgingMemberus-gaap:DesignatedAsHedgingInstrumentMemberus-gaap:CrossCurrencyInterestRateContractMember2020-09-282021-10-030000829224us-gaap:CashFlowHedgingMemberus-gaap:DesignatedAsHedgingInstrumentMemberus-gaap:CrossCurrencyInterestRateContractMember2019-09-302020-09-270000829224us-gaap:CashFlowHedgingMemberus-gaap:DesignatedAsHedgingInstrumentMemberus-gaap:InterestExpenseMemberus-gaap:CrossCurrencyInterestRateContractMember2021-10-042022-10-020000829224us-gaap:CashFlowHedgingMemberus-gaap:DesignatedAsHedgingInstrumentMemberus-gaap:InterestExpenseMemberus-gaap:CrossCurrencyInterestRateContractMember2020-09-282021-10-030000829224us-gaap:CashFlowHedgingMemberus-gaap:DesignatedAsHedgingInstrumentMemberus-gaap:InterestExpenseMemberus-gaap:CrossCurrencyInterestRateContractMember2019-09-302020-09-270000829224us-gaap:CashFlowHedgingMemberus-gaap:DesignatedAsHedgingInstrumentMembersbux:InterestandOtherIncomeMemberus-gaap:CrossCurrencyInterestRateContractMember2021-10-042022-10-020000829224us-gaap:CashFlowHedgingMemberus-gaap:DesignatedAsHedgingInstrumentMembersbux:InterestandOtherIncomeMemberus-gaap:CrossCurrencyInterestRateContractMember2020-09-282021-10-030000829224us-gaap:CashFlowHedgingMemberus-gaap:DesignatedAsHedgingInstrumentMembersbux:InterestandOtherIncomeMemberus-gaap:CrossCurrencyInterestRateContractMember2019-09-302020-09-270000829224us-gaap:CashFlowHedgingMemberus-gaap:DesignatedAsHedgingInstrumentMembersbux:DairyContractsMember2021-10-042022-10-020000829224us-gaap:CashFlowHedgingMemberus-gaap:DesignatedAsHedgingInstrumentMembersbux:DairyContractsMember2020-09-282021-10-030000829224us-gaap:CashFlowHedgingMemberus-gaap:DesignatedAsHedgingInstrumentMembersbux:DairyContractsMember2019-09-302020-09-270000829224us-gaap:CashFlowHedgingMemberus-gaap:DesignatedAsHedgingInstrumentMembersbux:DairyContractsMembersbux:ProductAndDistributionCostsMember2021-10-042022-10-020000829224us-gaap:CashFlowHedgingMemberus-gaap:DesignatedAsHedgingInstrumentMembersbux:DairyContractsMembersbux:ProductAndDistributionCostsMember2020-09-282021-10-030000829224us-gaap:CashFlowHedgingMemberus-gaap:DesignatedAsHedgingInstrumentMembersbux:DairyContractsMembersbux:ProductAndDistributionCostsMember2019-09-302020-09-270000829224us-gaap:CashFlowHedgingMemberus-gaap:DesignatedAsHedgingInstrumentMembersbux:InterestandOtherIncomeMembersbux:DairyContractsMember2021-10-042022-10-020000829224us-gaap:CashFlowHedgingMemberus-gaap:DesignatedAsHedgingInstrumentMembersbux:InterestandOtherIncomeMembersbux:DairyContractsMember2020-09-282021-10-030000829224us-gaap:CashFlowHedgingMemberus-gaap:DesignatedAsHedgingInstrumentMembersbux:InterestandOtherIncomeMembersbux:DairyContractsMember2019-09-302020-09-270000829224us-gaap:CashFlowHedgingMemberus-gaap:ForeignExchangeContractMemberus-gaap:DesignatedAsHedgingInstrumentMember2021-10-042022-10-020000829224us-gaap:CashFlowHedgingMemberus-gaap:ForeignExchangeContractMemberus-gaap:DesignatedAsHedgingInstrumentMember2020-09-282021-10-030000829224us-gaap:CashFlowHedgingMemberus-gaap:ForeignExchangeContractMemberus-gaap:DesignatedAsHedgingInstrumentMember2019-09-302020-09-270000829224us-gaap:CashFlowHedgingMemberus-gaap:ForeignExchangeContractMemberus-gaap:DesignatedAsHedgingInstrumentMembersbux:FranchisedUnitsRevenueMember2021-10-042022-10-020000829224us-gaap:CashFlowHedgingMemberus-gaap:ForeignExchangeContractMemberus-gaap:DesignatedAsHedgingInstrumentMembersbux:FranchisedUnitsRevenueMember2020-09-282021-10-030000829224us-gaap:CashFlowHedgingMemberus-gaap:ForeignExchangeContractMemberus-gaap:DesignatedAsHedgingInstrumentMembersbux:FranchisedUnitsRevenueMember2019-09-302020-09-270000829224us-gaap:CashFlowHedgingMemberus-gaap:ForeignExchangeContractMemberus-gaap:DesignatedAsHedgingInstrumentMembersbux:ProductAndDistributionCostsMember2021-10-042022-10-020000829224us-gaap:CashFlowHedgingMemberus-gaap:ForeignExchangeContractMemberus-gaap:DesignatedAsHedgingInstrumentMembersbux:ProductAndDistributionCostsMember2020-09-282021-10-030000829224us-gaap:CashFlowHedgingMemberus-gaap:ForeignExchangeContractMemberus-gaap:DesignatedAsHedgingInstrumentMembersbux:ProductAndDistributionCostsMember2019-09-302020-09-270000829224us-gaap:CashFlowHedgingMemberus-gaap:ForeignExchangeContractMemberus-gaap:DesignatedAsHedgingInstrumentMembersbux:InterestandOtherIncomeMember2021-10-042022-10-020000829224us-gaap:CashFlowHedgingMemberus-gaap:ForeignExchangeContractMemberus-gaap:DesignatedAsHedgingInstrumentMembersbux:InterestandOtherIncomeMember2020-09-282021-10-030000829224us-gaap:CashFlowHedgingMemberus-gaap:ForeignExchangeContractMemberus-gaap:DesignatedAsHedgingInstrumentMembersbux:InterestandOtherIncomeMember2019-09-302020-09-270000829224us-gaap:CashFlowHedgingMemberus-gaap:DesignatedAsHedgingInstrumentMemberus-gaap:InterestRateContractMember2021-10-042022-10-020000829224us-gaap:CashFlowHedgingMemberus-gaap:DesignatedAsHedgingInstrumentMemberus-gaap:InterestRateContractMember2020-09-282021-10-030000829224us-gaap:CashFlowHedgingMemberus-gaap:DesignatedAsHedgingInstrumentMemberus-gaap:InterestRateContractMember2019-09-302020-09-270000829224us-gaap:CashFlowHedgingMemberus-gaap:DesignatedAsHedgingInstrumentMemberus-gaap:InterestRateContractMemberus-gaap:InterestExpenseMember2021-10-042022-10-020000829224us-gaap:CashFlowHedgingMemberus-gaap:DesignatedAsHedgingInstrumentMemberus-gaap:InterestRateContractMemberus-gaap:InterestExpenseMember2020-09-282021-10-030000829224us-gaap:CashFlowHedgingMemberus-gaap:DesignatedAsHedgingInstrumentMemberus-gaap:InterestRateContractMemberus-gaap:InterestExpenseMember2019-09-302020-09-270000829224us-gaap:CashFlowHedgingMemberus-gaap:DesignatedAsHedgingInstrumentMembersbux:InterestandOtherIncomeMemberus-gaap:InterestRateContractMember2021-10-042022-10-020000829224us-gaap:CashFlowHedgingMemberus-gaap:DesignatedAsHedgingInstrumentMembersbux:InterestandOtherIncomeMemberus-gaap:InterestRateContractMember2020-09-282021-10-030000829224us-gaap:CashFlowHedgingMemberus-gaap:DesignatedAsHedgingInstrumentMembersbux:InterestandOtherIncomeMemberus-gaap:InterestRateContractMember2019-09-302020-09-270000829224us-gaap:DesignatedAsHedgingInstrumentMemberus-gaap:NetInvestmentHedgingMemberus-gaap:CrossCurrencyInterestRateContractMember2021-10-042022-10-020000829224us-gaap:DesignatedAsHedgingInstrumentMemberus-gaap:NetInvestmentHedgingMemberus-gaap:CrossCurrencyInterestRateContractMember2020-09-282021-10-030000829224us-gaap:DesignatedAsHedgingInstrumentMemberus-gaap:NetInvestmentHedgingMemberus-gaap:CrossCurrencyInterestRateContractMember2019-09-302020-09-270000829224us-gaap:DesignatedAsHedgingInstrumentMemberus-gaap:NetInvestmentHedgingMemberus-gaap:InterestExpenseMemberus-gaap:CrossCurrencyInterestRateContractMember2019-09-302020-09-270000829224us-gaap:DesignatedAsHedgingInstrumentMemberus-gaap:NetInvestmentHedgingMemberus-gaap:InterestExpenseMemberus-gaap:CrossCurrencyInterestRateContractMember2021-10-042022-10-020000829224us-gaap:DesignatedAsHedgingInstrumentMemberus-gaap:NetInvestmentHedgingMemberus-gaap:InterestExpenseMemberus-gaap:CrossCurrencyInterestRateContractMember2020-09-282021-10-030000829224us-gaap:DesignatedAsHedgingInstrumentMembersbux:ForeignExchangeYenDebtMemberus-gaap:NetInvestmentHedgingMember2021-10-042022-10-020000829224us-gaap:DesignatedAsHedgingInstrumentMembersbux:ForeignExchangeYenDebtMemberus-gaap:NetInvestmentHedgingMember2020-09-282021-10-030000829224us-gaap:DesignatedAsHedgingInstrumentMembersbux:ForeignExchangeYenDebtMemberus-gaap:NetInvestmentHedgingMember2019-09-302020-09-270000829224sbux:DairyContractsMember2021-10-042022-10-020000829224sbux:DairyContractsMember2020-09-282021-10-030000829224sbux:DairyContractsMember2019-09-302020-09-270000829224sbux:DieselandOtherContractsMember2021-10-042022-10-020000829224sbux:DieselandOtherContractsMember2020-09-282021-10-030000829224sbux:DieselandOtherContractsMember2019-09-302020-09-270000829224sbux:CoffeeContractsMember2021-10-042022-10-020000829224sbux:CoffeeContractsMember2020-09-282021-10-030000829224sbux:CoffeeContractsMember2019-09-302020-09-270000829224us-gaap:ForeignExchangeContractMember2021-10-042022-10-020000829224us-gaap:ForeignExchangeContractMember2020-09-282021-10-030000829224us-gaap:ForeignExchangeContractMember2019-09-302020-09-270000829224us-gaap:InterestRateSwapMember2021-10-042022-10-020000829224us-gaap:InterestRateSwapMember2020-09-282021-10-030000829224us-gaap:InterestRateSwapMember2019-09-302020-09-270000829224us-gaap:LongTermDebtMember2021-10-042022-10-020000829224us-gaap:LongTermDebtMember2020-09-282021-10-030000829224us-gaap:LongTermDebtMember2019-09-302020-09-270000829224sbux:CoffeeContractsMember2022-10-020000829224sbux:CoffeeContractsMember2021-10-030000829224us-gaap:CrossCurrencyInterestRateContractMember2022-10-020000829224us-gaap:CrossCurrencyInterestRateContractMember2021-10-030000829224sbux:DairyContractsMember2022-10-020000829224sbux:DairyContractsMember2021-10-030000829224sbux:DieselandOtherContractsMember2022-10-020000829224sbux:DieselandOtherContractsMember2021-10-030000829224us-gaap:ForeignExchangeContractMember2022-10-020000829224us-gaap:ForeignExchangeContractMember2021-10-030000829224us-gaap:InterestRateContractMember2022-10-020000829224us-gaap:InterestRateContractMember2021-10-030000829224sbux:CoffeeContractsMemberus-gaap:PrepaidExpensesAndOtherCurrentAssetsMemberus-gaap:DesignatedAsHedgingInstrumentMember2022-10-020000829224sbux:CoffeeContractsMemberus-gaap:PrepaidExpensesAndOtherCurrentAssetsMemberus-gaap:DesignatedAsHedgingInstrumentMember2021-10-030000829224us-gaap:DesignatedAsHedgingInstrumentMemberus-gaap:OtherNoncurrentAssetsMemberus-gaap:CrossCurrencyInterestRateContractMember2022-10-020000829224us-gaap:DesignatedAsHedgingInstrumentMemberus-gaap:OtherNoncurrentAssetsMemberus-gaap:CrossCurrencyInterestRateContractMember2021-10-030000829224us-gaap:PrepaidExpensesAndOtherCurrentAssetsMemberus-gaap:DesignatedAsHedgingInstrumentMembersbux:DairyContractsMember2022-10-020000829224us-gaap:PrepaidExpensesAndOtherCurrentAssetsMemberus-gaap:DesignatedAsHedgingInstrumentMembersbux:DairyContractsMember2021-10-030000829224us-gaap:ForeignExchangeContractMemberus-gaap:PrepaidExpensesAndOtherCurrentAssetsMemberus-gaap:DesignatedAsHedgingInstrumentMember2022-10-020000829224us-gaap:ForeignExchangeContractMemberus-gaap:PrepaidExpensesAndOtherCurrentAssetsMemberus-gaap:DesignatedAsHedgingInstrumentMember2021-10-030000829224us-gaap:ForeignExchangeContractMemberus-gaap:DesignatedAsHedgingInstrumentMemberus-gaap:OtherNoncurrentAssetsMember2022-10-020000829224us-gaap:ForeignExchangeContractMemberus-gaap:DesignatedAsHedgingInstrumentMemberus-gaap:OtherNoncurrentAssetsMember2021-10-030000829224us-gaap:DesignatedAsHedgingInstrumentMemberus-gaap:InterestRateSwapMemberus-gaap:OtherNoncurrentAssetsMember2022-10-020000829224us-gaap:DesignatedAsHedgingInstrumentMemberus-gaap:InterestRateSwapMemberus-gaap:OtherNoncurrentAssetsMember2021-10-030000829224us-gaap:PrepaidExpensesAndOtherCurrentAssetsMemberus-gaap:NondesignatedMembersbux:DieselandOtherContractsMember2022-10-020000829224us-gaap:PrepaidExpensesAndOtherCurrentAssetsMemberus-gaap:NondesignatedMembersbux:DieselandOtherContractsMember2021-10-030000829224us-gaap:ForeignExchangeContractMemberus-gaap:PrepaidExpensesAndOtherCurrentAssetsMemberus-gaap:NondesignatedMember2022-10-020000829224us-gaap:ForeignExchangeContractMemberus-gaap:PrepaidExpensesAndOtherCurrentAssetsMemberus-gaap:NondesignatedMember2021-10-030000829224us-gaap:ForeignExchangeContractMemberus-gaap:NondesignatedMemberus-gaap:OtherNoncurrentAssetsMember2022-10-020000829224us-gaap:ForeignExchangeContractMemberus-gaap:NondesignatedMemberus-gaap:OtherNoncurrentAssetsMember2021-10-030000829224us-gaap:DesignatedAsHedgingInstrumentMemberus-gaap:OtherNoncurrentLiabilitiesMemberus-gaap:CrossCurrencyInterestRateContractMember2022-10-020000829224us-gaap:DesignatedAsHedgingInstrumentMemberus-gaap:OtherNoncurrentLiabilitiesMemberus-gaap:CrossCurrencyInterestRateContractMember2021-10-030000829224us-gaap:OtherCurrentLiabilitiesMemberus-gaap:DesignatedAsHedgingInstrumentMembersbux:DairyContractsMember2022-10-020000829224us-gaap:OtherCurrentLiabilitiesMemberus-gaap:DesignatedAsHedgingInstrumentMembersbux:DairyContractsMember2021-10-030000829224us-gaap:ForeignExchangeContractMemberus-gaap:OtherCurrentLiabilitiesMemberus-gaap:DesignatedAsHedgingInstrumentMember2022-10-020000829224us-gaap:ForeignExchangeContractMemberus-gaap:OtherCurrentLiabilitiesMemberus-gaap:DesignatedAsHedgingInstrumentMember2021-10-030000829224us-gaap:ForeignExchangeContractMemberus-gaap:DesignatedAsHedgingInstrumentMemberus-gaap:OtherNoncurrentLiabilitiesMember2022-10-020000829224us-gaap:ForeignExchangeContractMemberus-gaap:DesignatedAsHedgingInstrumentMemberus-gaap:OtherNoncurrentLiabilitiesMember2021-10-030000829224us-gaap:OtherCurrentLiabilitiesMemberus-gaap:DesignatedAsHedgingInstrumentMemberus-gaap:InterestRateContractMember2022-10-020000829224us-gaap:OtherCurrentLiabilitiesMemberus-gaap:DesignatedAsHedgingInstrumentMemberus-gaap:InterestRateContractMember2021-10-030000829224us-gaap:DesignatedAsHedgingInstrumentMemberus-gaap:OtherNoncurrentLiabilitiesMemberus-gaap:InterestRateContractMember2022-10-020000829224us-gaap:DesignatedAsHedgingInstrumentMemberus-gaap:OtherNoncurrentLiabilitiesMemberus-gaap:InterestRateContractMember2021-10-030000829224us-gaap:DesignatedAsHedgingInstrumentMemberus-gaap:OtherNoncurrentLiabilitiesMemberus-gaap:InterestRateSwapMember2022-10-020000829224us-gaap:DesignatedAsHedgingInstrumentMemberus-gaap:OtherNoncurrentLiabilitiesMemberus-gaap:InterestRateSwapMember2021-10-030000829224us-gaap:OtherCurrentLiabilitiesMemberus-gaap:NondesignatedMembersbux:DairyContractsMember2022-10-020000829224us-gaap:OtherCurrentLiabilitiesMemberus-gaap:NondesignatedMembersbux:DairyContractsMember2021-10-030000829224us-gaap:ForeignExchangeContractMemberus-gaap:OtherCurrentLiabilitiesMemberus-gaap:NondesignatedMember2022-10-020000829224us-gaap:ForeignExchangeContractMemberus-gaap:OtherCurrentLiabilitiesMemberus-gaap:NondesignatedMember2021-10-030000829224us-gaap:LongTermDebtMemberus-gaap:DesignatedAsHedgingInstrumentMemberus-gaap:InterestRateSwapMember2022-10-020000829224us-gaap:LongTermDebtMemberus-gaap:DesignatedAsHedgingInstrumentMemberus-gaap:InterestRateSwapMember2021-10-030000829224us-gaap:CashAndCashEquivalentsMember2022-10-020000829224us-gaap:FairValueInputsLevel1Memberus-gaap:CashAndCashEquivalentsMember2022-10-020000829224us-gaap:CashAndCashEquivalentsMemberus-gaap:FairValueInputsLevel2Member2022-10-020000829224us-gaap:CashAndCashEquivalentsMemberus-gaap:FairValueInputsLevel3Member2022-10-020000829224us-gaap:ShortTermInvestmentsMemberus-gaap:CorporateDebtSecuritiesMember2022-10-020000829224us-gaap:ShortTermInvestmentsMemberus-gaap:FairValueInputsLevel1Memberus-gaap:CorporateDebtSecuritiesMember2022-10-020000829224us-gaap:ShortTermInvestmentsMemberus-gaap:CorporateDebtSecuritiesMemberus-gaap:FairValueInputsLevel2Member2022-10-020000829224us-gaap:ShortTermInvestmentsMemberus-gaap:CorporateDebtSecuritiesMemberus-gaap:FairValueInputsLevel3Member2022-10-020000829224us-gaap:ShortTermInvestmentsMemberus-gaap:USTreasuryAndGovernmentMember2022-10-020000829224us-gaap:ShortTermInvestmentsMemberus-gaap:FairValueInputsLevel1Memberus-gaap:USTreasuryAndGovernmentMember2022-10-020000829224us-gaap:ShortTermInvestmentsMemberus-gaap:USTreasuryAndGovernmentMemberus-gaap:FairValueInputsLevel2Member2022-10-020000829224us-gaap:ShortTermInvestmentsMemberus-gaap:USTreasuryAndGovernmentMemberus-gaap:FairValueInputsLevel3Member2022-10-020000829224us-gaap:ShortTermInvestmentsMember2022-10-020000829224us-gaap:ShortTermInvestmentsMemberus-gaap:FairValueInputsLevel1Member2022-10-020000829224us-gaap:ShortTermInvestmentsMemberus-gaap:FairValueInputsLevel2Member2022-10-020000829224us-gaap:ShortTermInvestmentsMemberus-gaap:FairValueInputsLevel3Member2022-10-020000829224us-gaap:FairValueInputsLevel1Member2022-10-020000829224us-gaap:FairValueInputsLevel3Member2022-10-020000829224us-gaap:FairValueInputsLevel2Member2022-10-020000829224us-gaap:CorporateDebtSecuritiesMemberus-gaap:OtherLongTermInvestmentsMember2022-10-020000829224us-gaap:FairValueInputsLevel1Memberus-gaap:CorporateDebtSecuritiesMemberus-gaap:OtherLongTermInvestmentsMember2022-10-020000829224us-gaap:CorporateDebtSecuritiesMemberus-gaap:FairValueInputsLevel2Memberus-gaap:OtherLongTermInvestmentsMember2022-10-020000829224us-gaap:CorporateDebtSecuritiesMemberus-gaap:OtherLongTermInvestmentsMemberus-gaap:FairValueInputsLevel3Member2022-10-020000829224us-gaap:ForeignGovernmentDebtSecuritiesMemberus-gaap:OtherLongTermInvestmentsMember2022-10-020000829224us-gaap:FairValueInputsLevel1Memberus-gaap:ForeignGovernmentDebtSecuritiesMemberus-gaap:OtherLongTermInvestmentsMember2022-10-020000829224us-gaap:FairValueInputsLevel2Memberus-gaap:ForeignGovernmentDebtSecuritiesMemberus-gaap:OtherLongTermInvestmentsMember2022-10-020000829224us-gaap:ForeignGovernmentDebtSecuritiesMemberus-gaap:OtherLongTermInvestmentsMemberus-gaap:FairValueInputsLevel3Member2022-10-020000829224us-gaap:AssetBackedSecuritiesMemberus-gaap:OtherLongTermInvestmentsMember2022-10-020000829224us-gaap:FairValueInputsLevel1Memberus-gaap:AssetBackedSecuritiesMemberus-gaap:OtherLongTermInvestmentsMember2022-10-020000829224us-gaap:FairValueInputsLevel2Memberus-gaap:AssetBackedSecuritiesMemberus-gaap:OtherLongTermInvestmentsMember2022-10-020000829224us-gaap:AssetBackedSecuritiesMemberus-gaap:OtherLongTermInvestmentsMemberus-gaap:FairValueInputsLevel3Member2022-10-020000829224us-gaap:OtherLongTermInvestmentsMemberus-gaap:USStatesAndPoliticalSubdivisionsMember2022-10-020000829224us-gaap:FairValueInputsLevel1Memberus-gaap:OtherLongTermInvestmentsMemberus-gaap:USStatesAndPoliticalSubdivisionsMember2022-10-020000829224us-gaap:FairValueInputsLevel2Memberus-gaap:OtherLongTermInvestmentsMemberus-gaap:USStatesAndPoliticalSubdivisionsMember2022-10-020000829224us-gaap:OtherLongTermInvestmentsMemberus-gaap:FairValueInputsLevel3Memberus-gaap:USStatesAndPoliticalSubdivisionsMember2022-10-020000829224us-gaap:USTreasuryAndGovernmentMemberus-gaap:OtherLongTermInvestmentsMember2022-10-020000829224us-gaap:FairValueInputsLevel1Memberus-gaap:USTreasuryAndGovernmentMemberus-gaap:OtherLongTermInvestmentsMember2022-10-020000829224us-gaap:USTreasuryAndGovernmentMemberus-gaap:FairValueInputsLevel2Memberus-gaap:OtherLongTermInvestmentsMember2022-10-020000829224us-gaap:USTreasuryAndGovernmentMemberus-gaap:OtherLongTermInvestmentsMemberus-gaap:FairValueInputsLevel3Member2022-10-020000829224us-gaap:OtherLongTermInvestmentsMember2022-10-020000829224us-gaap:FairValueInputsLevel1Memberus-gaap:OtherLongTermInvestmentsMember2022-10-020000829224us-gaap:FairValueInputsLevel2Memberus-gaap:OtherLongTermInvestmentsMember2022-10-020000829224us-gaap:OtherLongTermInvestmentsMemberus-gaap:FairValueInputsLevel3Member2022-10-020000829224us-gaap:CashAndCashEquivalentsMember2021-10-030000829224us-gaap:FairValueInputsLevel1Memberus-gaap:CashAndCashEquivalentsMember2021-10-030000829224us-gaap:CashAndCashEquivalentsMemberus-gaap:FairValueInputsLevel2Member2021-10-030000829224us-gaap:CashAndCashEquivalentsMemberus-gaap:FairValueInputsLevel3Member2021-10-030000829224us-gaap:ShortTermInvestmentsMemberus-gaap:CommercialPaperMember2021-10-030000829224us-gaap:ShortTermInvestmentsMemberus-gaap:FairValueInputsLevel1Memberus-gaap:CommercialPaperMember2021-10-030000829224us-gaap:ShortTermInvestmentsMemberus-gaap:FairValueInputsLevel2Memberus-gaap:CommercialPaperMember2021-10-030000829224us-gaap:ShortTermInvestmentsMemberus-gaap:FairValueInputsLevel3Memberus-gaap:CommercialPaperMember2021-10-030000829224us-gaap:ShortTermInvestmentsMemberus-gaap:CorporateDebtSecuritiesMember2021-10-030000829224us-gaap:ShortTermInvestmentsMemberus-gaap:FairValueInputsLevel1Memberus-gaap:CorporateDebtSecuritiesMember2021-10-030000829224us-gaap:ShortTermInvestmentsMemberus-gaap:CorporateDebtSecuritiesMemberus-gaap:FairValueInputsLevel2Member2021-10-030000829224us-gaap:ShortTermInvestmentsMemberus-gaap:CorporateDebtSecuritiesMemberus-gaap:FairValueInputsLevel3Member2021-10-030000829224us-gaap:ShortTermInvestmentsMemberus-gaap:AssetBackedSecuritiesMember2021-10-030000829224us-gaap:ShortTermInvestmentsMemberus-gaap:FairValueInputsLevel1Memberus-gaap:AssetBackedSecuritiesMember2021-10-030000829224us-gaap:ShortTermInvestmentsMemberus-gaap:FairValueInputsLevel2Memberus-gaap:AssetBackedSecuritiesMember2021-10-030000829224us-gaap:ShortTermInvestmentsMemberus-gaap:AssetBackedSecuritiesMemberus-gaap:FairValueInputsLevel3Member2021-10-030000829224us-gaap:ShortTermInvestmentsMember2021-10-030000829224us-gaap:ShortTermInvestmentsMemberus-gaap:FairValueInputsLevel1Member2021-10-030000829224us-gaap:ShortTermInvestmentsMemberus-gaap:FairValueInputsLevel2Member2021-10-030000829224us-gaap:ShortTermInvestmentsMemberus-gaap:FairValueInputsLevel3Member2021-10-030000829224us-gaap:FairValueInputsLevel2Member2021-10-030000829224us-gaap:FairValueInputsLevel1Member2021-10-030000829224us-gaap:FairValueInputsLevel3Member2021-10-030000829224us-gaap:AuctionRateSecuritiesMemberus-gaap:OtherLongTermInvestmentsMember2021-10-030000829224us-gaap:FairValueInputsLevel1Memberus-gaap:AuctionRateSecuritiesMemberus-gaap:OtherLongTermInvestmentsMember2021-10-030000829224us-gaap:AuctionRateSecuritiesMemberus-gaap:FairValueInputsLevel2Memberus-gaap:OtherLongTermInvestmentsMember2021-10-030000829224us-gaap:AuctionRateSecuritiesMemberus-gaap:OtherLongTermInvestmentsMemberus-gaap:FairValueInputsLevel3Member2021-10-030000829224us-gaap:CorporateDebtSecuritiesMemberus-gaap:OtherLongTermInvestmentsMember2021-10-030000829224us-gaap:FairValueInputsLevel1Memberus-gaap:CorporateDebtSecuritiesMemberus-gaap:OtherLongTermInvestmentsMember2021-10-030000829224us-gaap:CorporateDebtSecuritiesMemberus-gaap:FairValueInputsLevel2Memberus-gaap:OtherLongTermInvestmentsMember2021-10-030000829224us-gaap:CorporateDebtSecuritiesMemberus-gaap:OtherLongTermInvestmentsMemberus-gaap:FairValueInputsLevel3Member2021-10-030000829224us-gaap:ForeignGovernmentDebtSecuritiesMemberus-gaap:OtherLongTermInvestmentsMember2021-10-030000829224us-gaap:FairValueInputsLevel1Memberus-gaap:ForeignGovernmentDebtSecuritiesMemberus-gaap:OtherLongTermInvestmentsMember2021-10-030000829224us-gaap:FairValueInputsLevel2Memberus-gaap:ForeignGovernmentDebtSecuritiesMemberus-gaap:OtherLongTermInvestmentsMember2021-10-030000829224us-gaap:ForeignGovernmentDebtSecuritiesMemberus-gaap:OtherLongTermInvestmentsMemberus-gaap:FairValueInputsLevel3Member2021-10-030000829224us-gaap:AssetBackedSecuritiesMemberus-gaap:OtherLongTermInvestmentsMember2021-10-030000829224us-gaap:FairValueInputsLevel1Memberus-gaap:AssetBackedSecuritiesMemberus-gaap:OtherLongTermInvestmentsMember2021-10-030000829224us-gaap:FairValueInputsLevel2Memberus-gaap:AssetBackedSecuritiesMemberus-gaap:OtherLongTermInvestmentsMember2021-10-030000829224us-gaap:AssetBackedSecuritiesMemberus-gaap:OtherLongTermInvestmentsMemberus-gaap:FairValueInputsLevel3Member2021-10-030000829224us-gaap:OtherLongTermInvestmentsMemberus-gaap:USStatesAndPoliticalSubdivisionsMember2021-10-030000829224us-gaap:FairValueInputsLevel1Memberus-gaap:OtherLongTermInvestmentsMemberus-gaap:USStatesAndPoliticalSubdivisionsMember2021-10-030000829224us-gaap:FairValueInputsLevel2Memberus-gaap:OtherLongTermInvestmentsMemberus-gaap:USStatesAndPoliticalSubdivisionsMember2021-10-030000829224us-gaap:OtherLongTermInvestmentsMemberus-gaap:FairValueInputsLevel3Memberus-gaap:USStatesAndPoliticalSubdivisionsMember2021-10-030000829224us-gaap:USTreasuryAndGovernmentMemberus-gaap:OtherLongTermInvestmentsMember2021-10-030000829224us-gaap:FairValueInputsLevel1Memberus-gaap:USTreasuryAndGovernmentMemberus-gaap:OtherLongTermInvestmentsMember2021-10-030000829224us-gaap:USTreasuryAndGovernmentMemberus-gaap:FairValueInputsLevel2Memberus-gaap:OtherLongTermInvestmentsMember2021-10-030000829224us-gaap:USTreasuryAndGovernmentMemberus-gaap:OtherLongTermInvestmentsMemberus-gaap:FairValueInputsLevel3Member2021-10-030000829224us-gaap:OtherLongTermInvestmentsMember2021-10-030000829224us-gaap:FairValueInputsLevel1Memberus-gaap:OtherLongTermInvestmentsMember2021-10-030000829224us-gaap:FairValueInputsLevel2Memberus-gaap:OtherLongTermInvestmentsMember2021-10-030000829224us-gaap:OtherLongTermInvestmentsMemberus-gaap:FairValueInputsLevel3Member2021-10-030000829224srt:MaximumMember2021-10-042022-10-020000829224us-gaap:FixedPriceContractMember2021-10-042022-10-020000829224sbux:PriceToBeFixedContractMember2021-10-042022-10-020000829224sbux:TataStarbucksLimitedIndiaMember2022-10-020000829224sbux:NorthAmericaCoffeePartnershipMember2022-10-020000829224us-gaap:LandMember2022-10-020000829224us-gaap:LandMember2021-10-030000829224us-gaap:BuildingMember2022-10-020000829224us-gaap:BuildingMember2021-10-030000829224us-gaap:LeaseholdImprovementsMember2022-10-020000829224us-gaap:LeaseholdImprovementsMember2021-10-030000829224sbux:StoreEquipmentMember2022-10-020000829224sbux:StoreEquipmentMember2021-10-030000829224sbux:RoastingEquipmentMember2022-10-020000829224sbux:RoastingEquipmentMember2021-10-030000829224us-gaap:FurnitureAndFixturesMember2022-10-020000829224us-gaap:FurnitureAndFixturesMember2021-10-030000829224us-gaap:ConstructionInProgressMember2022-10-020000829224us-gaap:ConstructionInProgressMember2021-10-030000829224sbux:TradeNamesTrademarksandPatentsMember2022-10-020000829224sbux:TradeNamesTrademarksandPatentsMember2021-10-030000829224us-gaap:ContractBasedIntangibleAssetsMember2022-10-020000829224us-gaap:ContractBasedIntangibleAssetsMember2021-10-030000829224us-gaap:TradeSecretsMember2022-10-020000829224us-gaap:TradeSecretsMember2021-10-030000829224sbux:TradeNamesTrademarksandPatentsMember2022-10-020000829224sbux:TradeNamesTrademarksandPatentsMember2021-10-030000829224us-gaap:LicensingAgreementsMember2022-10-020000829224us-gaap:LicensingAgreementsMember2021-10-030000829224us-gaap:OtherIntangibleAssetsMember2022-10-020000829224us-gaap:OtherIntangibleAssetsMember2021-10-030000829224sbux:NorthAmericaSegmentMember2020-09-270000829224sbux:InternationalSegmentMember2020-09-270000829224sbux:ChannelDevelopmentMember2020-09-270000829224us-gaap:CorporateAndOtherMember2020-09-270000829224sbux:NorthAmericaSegmentMember2020-09-282021-10-030000829224sbux:InternationalSegmentMember2020-09-282021-10-030000829224sbux:ChannelDevelopmentMember2020-09-282021-10-030000829224us-gaap:CorporateAndOtherMember2020-09-282021-10-030000829224sbux:NorthAmericaSegmentMember2021-10-030000829224sbux:InternationalSegmentMember2021-10-030000829224sbux:ChannelDevelopmentMember2021-10-030000829224us-gaap:CorporateAndOtherMember2021-10-030000829224sbux:NorthAmericaSegmentMember2021-10-042022-10-020000829224sbux:InternationalSegmentMember2021-10-042022-10-020000829224sbux:ChannelDevelopmentMember2021-10-042022-10-020000829224us-gaap:CorporateAndOtherMember2021-10-042022-10-020000829224sbux:NorthAmericaSegmentMember2022-10-020000829224sbux:InternationalSegmentMember2022-10-020000829224sbux:ChannelDevelopmentMember2022-10-020000829224us-gaap:CorporateAndOtherMember2022-10-020000829224us-gaap:LineOfCreditMembersbux:TwothousandtwentyonecreditfacilityMember2022-10-020000829224us-gaap:LineOfCreditMembersbux:TwothousandtwentyonecreditfacilityMember2026-09-162026-09-160000829224us-gaap:LineOfCreditMembersbux:TwothousandtwentyonecreditfacilityMemberus-gaap:BaseRateMember2021-10-042022-10-020000829224us-gaap:LineOfCreditMemberus-gaap:EurodollarMembersbux:TwothousandtwentyonecreditfacilityMember2021-10-042022-10-020000829224us-gaap:LineOfCreditMember2021-10-042022-10-020000829224us-gaap:LineOfCreditMember2022-10-020000829224us-gaap:CommercialPaperMember2022-10-020000829224srt:MaximumMemberus-gaap:CommercialPaperMember2021-10-042022-10-020000829224us-gaap:CommercialPaperMember2021-10-030000829224us-gaap:LineOfCreditMembersbux:A5BillionYenCreditFacilityMembercurrency:JPY2022-10-02iso4217:JPY0000829224us-gaap:LineOfCreditMembersbux:A5BillionYenCreditFacilityMember2022-12-312022-12-310000829224srt:MaximumMemberus-gaap:LineOfCreditMembersbux:A5BillionYenCreditFacilityMembersbux:TokyoInterbankOfferedRateTIBORMember2021-10-042022-10-020000829224us-gaap:LineOfCreditMembersbux:A10BillionYenCreditFacilityMembercurrency:JPY2022-10-020000829224us-gaap:LineOfCreditMembersbux:A10BillionYenCreditFacilityMember2023-03-272023-03-270000829224us-gaap:LineOfCreditMembersbux:A10BillionYenCreditFacilityMembersbux:TokyoInterbankOfferedRateTIBORMember2021-10-042022-10-020000829224sbux:A5BillionAnd10BillionYenCreditFacilityMemberus-gaap:LineOfCreditMember2022-10-020000829224sbux:A5BillionAnd10BillionYenCreditFacilityMemberus-gaap:LineOfCreditMember2021-10-030000829224sbux:OnePointThreePercentageSeniorNotesMember2022-10-020000829224us-gaap:FairValueInputsLevel2Membersbux:OnePointThreePercentageSeniorNotesMember2022-10-020000829224sbux:OnePointThreePercentageSeniorNotesMember2021-10-030000829224us-gaap:FairValueInputsLevel2Membersbux:OnePointThreePercentageSeniorNotesMember2021-10-030000829224sbux:TwoPointSevenPercentageSeniorNotesMember2022-10-020000829224sbux:TwoPointSevenPercentageSeniorNotesMemberus-gaap:FairValueInputsLevel2Member2022-10-020000829224sbux:TwoPointSevenPercentageSeniorNotesMember2021-10-030000829224sbux:TwoPointSevenPercentageSeniorNotesMemberus-gaap:FairValueInputsLevel2Member2021-10-030000829224sbux:ThreePointOnePercentageSeniorNotesMember2022-10-020000829224sbux:ThreePointOnePercentageSeniorNotesMemberus-gaap:FairValueInputsLevel2Member2022-10-020000829224sbux:ThreePointOnePercentageSeniorNotesMember2021-10-030000829224sbux:ThreePointOnePercentageSeniorNotesMemberus-gaap:FairValueInputsLevel2Member2021-10-030000829224sbux:ThreePointEightFivePercentageSeniorNotesMember2022-10-020000829224sbux:ThreePointEightFivePercentageSeniorNotesMemberus-gaap:FairValueInputsLevel2Member2022-10-020000829224sbux:ThreePointEightFivePercentageSeniorNotesMember2021-10-030000829224sbux:ThreePointEightFivePercentageSeniorNotesMemberus-gaap:FairValueInputsLevel2Member2021-10-030000829224sbux:FloatingRateSeniorNotesMember2022-10-020000829224us-gaap:FairValueInputsLevel2Membersbux:FloatingRateSeniorNotesMember2022-10-020000829224sbux:FloatingRateSeniorNotesMember2021-10-030000829224us-gaap:FairValueInputsLevel2Membersbux:FloatingRateSeniorNotesMember2021-10-030000829224sbux:PointThreeSevenTwoPercentageYenDenominatedSeniorNotesMember2022-10-020000829224sbux:PointThreeSevenTwoPercentageYenDenominatedSeniorNotesMemberus-gaap:FairValueInputsLevel2Member2022-10-020000829224sbux:PointThreeSevenTwoPercentageYenDenominatedSeniorNotesMember2021-10-030000829224sbux:PointThreeSevenTwoPercentageYenDenominatedSeniorNotesMemberus-gaap:FairValueInputsLevel2Member2021-10-030000829224sbux:ThreePointEightPercentageSeniorNotesMember2022-10-020000829224us-gaap:FairValueInputsLevel2Membersbux:ThreePointEightPercentageSeniorNotesMember2022-10-020000829224sbux:ThreePointEightPercentageSeniorNotesMember2021-10-030000829224us-gaap:FairValueInputsLevel2Membersbux:ThreePointEightPercentageSeniorNotesMember2021-10-030000829224sbux:TwoPointFourFivePercentageSeniorNotesMember2022-10-020000829224sbux:TwoPointFourFivePercentageSeniorNotesMemberus-gaap:FairValueInputsLevel2Member2022-10-020000829224sbux:TwoPointFourFivePercentageSeniorNotesMember2021-10-030000829224sbux:TwoPointFourFivePercentageSeniorNotesMemberus-gaap:FairValueInputsLevel2Member2021-10-030000829224sbux:TwoPointZeroPercentageSeniorNotesMember2022-10-020000829224us-gaap:FairValueInputsLevel2Membersbux:TwoPointZeroPercentageSeniorNotesMember2022-10-020000829224sbux:TwoPointZeroPercentageSeniorNotesMember2021-10-030000829224us-gaap:FairValueInputsLevel2Membersbux:TwoPointZeroPercentageSeniorNotesMember2021-10-030000829224sbux:ThreePointFivePercentageSeniorNotesMember2022-10-020000829224sbux:ThreePointFivePercentageSeniorNotesMemberus-gaap:FairValueInputsLevel2Member2022-10-020000829224sbux:ThreePointFivePercentageSeniorNotesMember2021-10-030000829224sbux:ThreePointFivePercentageSeniorNotesMemberus-gaap:FairValueInputsLevel2Member2021-10-030000829224sbux:FourPointZeroPercentageSeniorNotesMember2022-10-020000829224sbux:FourPointZeroPercentageSeniorNotesMemberus-gaap:FairValueInputsLevel2Member2022-10-020000829224sbux:FourPointZeroPercentageSeniorNotesMember2021-10-030000829224sbux:FourPointZeroPercentageSeniorNotesMemberus-gaap:FairValueInputsLevel2Member2021-10-030000829224sbux:ThreePointFiveFivePercentageSeniorNotesMember2022-10-020000829224sbux:ThreePointFiveFivePercentageSeniorNotesMemberus-gaap:FairValueInputsLevel2Member2022-10-020000829224sbux:ThreePointFiveFivePercentageSeniorNotesMember2021-10-030000829224sbux:ThreePointFiveFivePercentageSeniorNotesMemberus-gaap:FairValueInputsLevel2Member2021-10-030000829224sbux:TwoPointTwoFivePercentageSeniorNotesMember2022-10-020000829224sbux:TwoPointTwoFivePercentageSeniorNotesMemberus-gaap:FairValueInputsLevel2Member2022-10-020000829224sbux:TwoPointTwoFivePercentageSeniorNotesMember2021-10-030000829224sbux:TwoPointTwoFivePercentageSeniorNotesMemberus-gaap:FairValueInputsLevel2Member2021-10-030000829224sbux:TwoPointFiveFivePercentageSeniorNotesMember2022-10-020000829224us-gaap:FairValueInputsLevel2Membersbux:TwoPointFiveFivePercentageSeniorNotesMember2022-10-020000829224sbux:TwoPointFiveFivePercentageSeniorNotesMember2021-10-030000829224us-gaap:FairValueInputsLevel2Membersbux:TwoPointFiveFivePercentageSeniorNotesMember2021-10-030000829224sbux:ThreePercentageSeniorNotesMember2022-10-020000829224sbux:ThreePercentageSeniorNotesMemberus-gaap:FairValueInputsLevel2Member2022-10-020000829224sbux:ThreePercentageSeniorNotesMember2021-10-030000829224sbux:ThreePercentageSeniorNotesMemberus-gaap:FairValueInputsLevel2Member2021-10-030000829224sbux:FourPointThreePercentageSeniorNotesMember2022-10-020000829224sbux:FourPointThreePercentageSeniorNotesMemberus-gaap:FairValueInputsLevel2Member2022-10-020000829224sbux:FourPointThreePercentageSeniorNotesMember2021-10-030000829224sbux:FourPointThreePercentageSeniorNotesMemberus-gaap:FairValueInputsLevel2Member2021-10-030000829224sbux:ThreePointSevenFivePercentageSeniorNotesMember2022-10-020000829224sbux:ThreePointSevenFivePercentageSeniorNotesMemberus-gaap:FairValueInputsLevel2Member2022-10-020000829224sbux:ThreePointSevenFivePercentageSeniorNotesMember2021-10-030000829224sbux:ThreePointSevenFivePercentageSeniorNotesMemberus-gaap:FairValueInputsLevel2Member2021-10-030000829224sbux:FourPointFivePercentageSeniorNotesMember2022-10-020000829224sbux:FourPointFivePercentageSeniorNotesMemberus-gaap:FairValueInputsLevel2Member2022-10-020000829224sbux:FourPointFivePercentageSeniorNotesMember2021-10-030000829224sbux:FourPointFivePercentageSeniorNotesMemberus-gaap:FairValueInputsLevel2Member2021-10-030000829224sbux:FourPointFourFivePercentageSeniorNotesMember2022-10-020000829224us-gaap:FairValueInputsLevel2Membersbux:FourPointFourFivePercentageSeniorNotesMember2022-10-020000829224sbux:FourPointFourFivePercentageSeniorNotesMember2021-10-030000829224us-gaap:FairValueInputsLevel2Membersbux:FourPointFourFivePercentageSeniorNotesMember2021-10-030000829224sbux:ThreePointThreeFivePercentageSeniorNotesMember2022-10-020000829224us-gaap:FairValueInputsLevel2Membersbux:ThreePointThreeFivePercentageSeniorNotesMember2022-10-020000829224sbux:ThreePointThreeFivePercentageSeniorNotesMember2021-10-030000829224us-gaap:FairValueInputsLevel2Membersbux:ThreePointThreeFivePercentageSeniorNotesMember2021-10-030000829224sbux:ThreePointFivePercentageSeniorNotesDueNov2050Member2022-10-020000829224sbux:ThreePointFivePercentageSeniorNotesDueNov2050Memberus-gaap:FairValueInputsLevel2Member2022-10-020000829224sbux:ThreePointFivePercentageSeniorNotesDueNov2050Member2021-10-030000829224sbux:ThreePointFivePercentageSeniorNotesDueNov2050Memberus-gaap:FairValueInputsLevel2Member2021-10-030000829224sbux:FloatingRateSeniorNotesMember2021-10-042022-10-020000829224srt:MinimumMember2022-10-020000829224srt:MaximumMember2022-10-0200008292242018-08-2600008292242018-08-262018-08-260000829224sbux:NestleGlobalCoffeeAllianceMember2022-10-020000829224sbux:NestleGlobalCoffeeAllianceMember2021-10-030000829224sbux:RevenueRecognitionPeriodStoredValueCardsandLoyaltyProgramBreakageMember2021-10-030000829224sbux:RevenueRecognitionPeriodStoredValueCardsandLoyaltyProgramBreakageMember2021-10-042022-10-020000829224sbux:RevenueRecognitionPeriodStoredValueCardsandLoyaltyProgramBreakageMember2022-10-020000829224sbux:RevenueRecognitionPeriodStoredValueCardsandLoyaltyProgramBreakageMember2020-09-270000829224sbux:RevenueRecognitionPeriodStoredValueCardsandLoyaltyProgramBreakageMember2020-09-282021-10-030000829224sbux:StoredValueCardsAndLoyaltyProgramBreakageInPriorYearDomain2022-10-020000829224sbux:StoredValueCardsAndLoyaltyProgramBreakageInPriorYearDomain2021-10-030000829224sbux:OpenMarketMember2019-09-302020-09-270000829224sbux:OpenMarketMember2020-03-180000829224sbux:OpenMarketMember2021-10-042022-10-020000829224sbux:OpenMarketMember2022-03-1500008292242022-07-042022-10-020000829224us-gaap:AccumulatedNetUnrealizedInvestmentGainLossMember2021-10-030000829224us-gaap:AccumulatedNetGainLossFromDesignatedOrQualifyingCashFlowHedgesMember2021-10-030000829224sbux:AccumulatedNetInvestmentHedgeGainLossAttributabletoParentMember2021-10-030000829224us-gaap:AccumulatedTranslationAdjustmentMember2021-10-030000829224us-gaap:AccumulatedNetUnrealizedInvestmentGainLossMember2021-10-042022-10-020000829224us-gaap:AccumulatedNetGainLossFromDesignatedOrQualifyingCashFlowHedgesMember2021-10-042022-10-020000829224sbux:AccumulatedNetInvestmentHedgeGainLossAttributabletoParentMember2021-10-042022-10-020000829224us-gaap:AccumulatedNetUnrealizedInvestmentGainLossMember2022-10-020000829224us-gaap:AccumulatedNetGainLossFromDesignatedOrQualifyingCashFlowHedgesMember2022-10-020000829224sbux:AccumulatedNetInvestmentHedgeGainLossAttributabletoParentMember2022-10-020000829224us-gaap:AccumulatedTranslationAdjustmentMember2022-10-020000829224us-gaap:AccumulatedNetUnrealizedInvestmentGainLossMember2020-09-270000829224us-gaap:AccumulatedNetGainLossFromDesignatedOrQualifyingCashFlowHedgesMember2020-09-270000829224sbux:AccumulatedNetInvestmentHedgeGainLossAttributabletoParentMember2020-09-270000829224us-gaap:AccumulatedTranslationAdjustmentMember2020-09-270000829224us-gaap:AccumulatedNetUnrealizedInvestmentGainLossMember2020-09-282021-10-030000829224us-gaap:AccumulatedNetGainLossFromDesignatedOrQualifyingCashFlowHedgesMember2020-09-282021-10-030000829224sbux:AccumulatedNetInvestmentHedgeGainLossAttributabletoParentMember2020-09-282021-10-030000829224us-gaap:AccumulatedNetUnrealizedInvestmentGainLossMember2019-09-290000829224us-gaap:AccumulatedNetGainLossFromDesignatedOrQualifyingCashFlowHedgesMember2019-09-290000829224sbux:AccumulatedNetInvestmentHedgeGainLossAttributabletoParentMember2019-09-290000829224us-gaap:AccumulatedTranslationAdjustmentMember2019-09-290000829224us-gaap:AccumulatedNetUnrealizedInvestmentGainLossMember2019-09-302020-09-270000829224us-gaap:AccumulatedNetGainLossFromDesignatedOrQualifyingCashFlowHedgesMember2019-09-302020-09-270000829224sbux:AccumulatedNetInvestmentHedgeGainLossAttributabletoParentMember2019-09-302020-09-270000829224us-gaap:ReclassificationOutOfAccumulatedOtherComprehensiveIncomeMemberus-gaap:AccumulatedNetUnrealizedInvestmentGainLossMember2021-10-042022-10-020000829224us-gaap:ReclassificationOutOfAccumulatedOtherComprehensiveIncomeMemberus-gaap:AccumulatedNetUnrealizedInvestmentGainLossMember2020-09-282021-10-030000829224us-gaap:ReclassificationOutOfAccumulatedOtherComprehensiveIncomeMemberus-gaap:AccumulatedNetUnrealizedInvestmentGainLossMember2019-09-302020-09-270000829224us-gaap:AccumulatedNetGainLossFromDesignatedOrQualifyingCashFlowHedgesMemberus-gaap:ReclassificationOutOfAccumulatedOtherComprehensiveIncomeMember2021-10-042022-10-020000829224us-gaap:AccumulatedNetGainLossFromDesignatedOrQualifyingCashFlowHedgesMemberus-gaap:ReclassificationOutOfAccumulatedOtherComprehensiveIncomeMember2020-09-282021-10-030000829224us-gaap:AccumulatedNetGainLossFromDesignatedOrQualifyingCashFlowHedgesMemberus-gaap:ReclassificationOutOfAccumulatedOtherComprehensiveIncomeMember2019-09-302020-09-270000829224sbux:AccumulatedNetInvestmentHedgeGainLossAttributabletoParentMemberus-gaap:ReclassificationOutOfAccumulatedOtherComprehensiveIncomeMember2021-10-042022-10-020000829224sbux:AccumulatedNetInvestmentHedgeGainLossAttributabletoParentMemberus-gaap:ReclassificationOutOfAccumulatedOtherComprehensiveIncomeMember2020-09-282021-10-030000829224sbux:AccumulatedNetInvestmentHedgeGainLossAttributabletoParentMemberus-gaap:ReclassificationOutOfAccumulatedOtherComprehensiveIncomeMember2019-09-302020-09-270000829224sbux:KoreaJVMemberus-gaap:AccumulatedTranslationAdjustmentMemberus-gaap:ReclassificationOutOfAccumulatedOtherComprehensiveIncomeMember2021-10-042022-10-020000829224sbux:KoreaJVMemberus-gaap:AccumulatedTranslationAdjustmentMemberus-gaap:ReclassificationOutOfAccumulatedOtherComprehensiveIncomeMember2020-09-282021-10-030000829224sbux:KoreaJVMemberus-gaap:AccumulatedTranslationAdjustmentMemberus-gaap:ReclassificationOutOfAccumulatedOtherComprehensiveIncomeMember2019-09-302020-09-270000829224sbux:StockOptionsAndRestrictedStockUnitsMember2022-10-020000829224us-gaap:EmployeeStockMember2022-10-020000829224us-gaap:RestrictedStockUnitsRSUMember2021-10-042022-10-020000829224us-gaap:RestrictedStockUnitsRSUMember2020-09-282021-10-030000829224us-gaap:RestrictedStockUnitsRSUMember2019-09-302020-09-270000829224us-gaap:EmployeeStockOptionMember2021-10-042022-10-020000829224us-gaap:EmployeeStockOptionMember2020-09-282021-10-030000829224us-gaap:EmployeeStockOptionMember2019-09-302020-09-270000829224us-gaap:RestrictedStockUnitsRSUMember2021-10-030000829224us-gaap:RestrictedStockUnitsRSUMember2022-10-020000829224srt:MaximumMembersrt:DirectorMemberus-gaap:EmployeeStockOptionMember2021-10-042022-10-020000829224us-gaap:EmployeeStockOptionMember2022-10-020000829224srt:SubsidiariesMember2022-10-020000829224sbux:ExpirationindefiniteMember2022-10-020000829224sbux:Expirationbeginningfiscal2024Member2022-10-020000829224sbux:ExpirationBeginningFiscal2029Member2022-10-020000829224sbux:Expirationbeginningfiscal2021Domain2022-10-020000829224sbux:NorthAmericaAndInternationalSegmentMemberDomainus-gaap:OperatingSegmentsMember2021-10-042022-10-020000829224sbux:ChannelDevelopmentMemberus-gaap:OperatingSegmentsMember2021-10-042022-10-020000829224sbux:BeverageMember2021-10-042022-10-020000829224us-gaap:SalesRevenueNetMembersbux:ProductTypeMembersbux:BeverageMember2021-10-042022-10-020000829224sbux:BeverageMember2020-09-282021-10-030000829224us-gaap:SalesRevenueNetMembersbux:ProductTypeMembersbux:BeverageMember2020-09-282021-10-030000829224sbux:BeverageMember2019-09-302020-09-270000829224us-gaap:SalesRevenueNetMembersbux:ProductTypeMembersbux:BeverageMember2019-09-302020-09-270000829224sbux:FoodMember2021-10-042022-10-020000829224sbux:FoodMemberus-gaap:SalesRevenueNetMembersbux:ProductTypeMember2021-10-042022-10-020000829224sbux:FoodMember2020-09-282021-10-030000829224sbux:FoodMemberus-gaap:SalesRevenueNetMembersbux:ProductTypeMember2020-09-282021-10-030000829224sbux:FoodMember2019-09-302020-09-270000829224sbux:FoodMemberus-gaap:SalesRevenueNetMembersbux:ProductTypeMember2019-09-302020-09-270000829224sbux:OtherProductsMember2021-10-042022-10-020000829224sbux:OtherProductsMemberus-gaap:SalesRevenueNetMembersbux:ProductTypeMember2021-10-042022-10-020000829224sbux:OtherProductsMember2020-09-282021-10-030000829224sbux:OtherProductsMemberus-gaap:SalesRevenueNetMembersbux:ProductTypeMember2020-09-282021-10-030000829224sbux:OtherProductsMember2019-09-302020-09-270000829224sbux:OtherProductsMemberus-gaap:SalesRevenueNetMembersbux:ProductTypeMember2019-09-302020-09-270000829224us-gaap:SalesRevenueNetMembersbux:ProductTypeMember2021-10-042022-10-020000829224us-gaap:SalesRevenueNetMembersbux:ProductTypeMember2020-09-282021-10-030000829224us-gaap:SalesRevenueNetMembersbux:ProductTypeMember2019-09-302020-09-270000829224country:US2021-10-042022-10-020000829224country:US2020-09-282021-10-030000829224country:US2019-09-302020-09-270000829224country:CN2021-10-042022-10-020000829224country:CN2020-09-282021-10-030000829224country:CN2019-09-302020-09-270000829224us-gaap:NonUsMember2021-10-042022-10-020000829224us-gaap:NonUsMember2020-09-282021-10-030000829224us-gaap:NonUsMember2019-09-302020-09-270000829224country:US2022-10-020000829224country:US2021-10-030000829224country:US2020-09-270000829224country:CN2022-10-020000829224country:CN2021-10-030000829224country:CN2020-09-270000829224us-gaap:NonUsMember2022-10-020000829224us-gaap:NonUsMember2021-10-030000829224us-gaap:NonUsMember2020-09-270000829224sbux:JapanCanadaAndTheUKMemberDomainsbux:JapanCanadaAndTheUKMemberDomainus-gaap:SalesRevenueNetMember2021-10-042022-10-020000829224us-gaap:OperatingSegmentsMembersbux:NorthAmericaSegmentMember2021-10-042022-10-020000829224sbux:InternationalSegmentMemberus-gaap:OperatingSegmentsMember2021-10-042022-10-020000829224us-gaap:CorporateNonSegmentMember2021-10-042022-10-020000829224us-gaap:OperatingSegmentsMembersbux:NorthAmericaSegmentMember2022-10-020000829224sbux:InternationalSegmentMemberus-gaap:OperatingSegmentsMember2022-10-020000829224sbux:ChannelDevelopmentMemberus-gaap:OperatingSegmentsMember2022-10-020000829224us-gaap:CorporateNonSegmentMember2022-10-020000829224us-gaap:OperatingSegmentsMembersbux:NorthAmericaSegmentMember2020-09-282021-10-030000829224sbux:InternationalSegmentMemberus-gaap:OperatingSegmentsMember2020-09-282021-10-030000829224sbux:ChannelDevelopmentMemberus-gaap:OperatingSegmentsMember2020-09-282021-10-030000829224us-gaap:CorporateNonSegmentMember2020-09-282021-10-030000829224us-gaap:OperatingSegmentsMembersbux:NorthAmericaSegmentMember2021-10-030000829224sbux:InternationalSegmentMemberus-gaap:OperatingSegmentsMember2021-10-030000829224sbux:ChannelDevelopmentMemberus-gaap:OperatingSegmentsMember2021-10-030000829224us-gaap:CorporateNonSegmentMember2021-10-030000829224us-gaap:OperatingSegmentsMembersbux:NorthAmericaSegmentMember2019-09-302020-09-270000829224sbux:InternationalSegmentMemberus-gaap:OperatingSegmentsMember2019-09-302020-09-270000829224sbux:ChannelDevelopmentMemberus-gaap:OperatingSegmentsMember2019-09-302020-09-270000829224us-gaap:CorporateNonSegmentMember2019-09-302020-09-270000829224us-gaap:OperatingSegmentsMembersbux:NorthAmericaSegmentMember2020-09-270000829224sbux:InternationalSegmentMemberus-gaap:OperatingSegmentsMember2020-09-270000829224sbux:ChannelDevelopmentMemberus-gaap:OperatingSegmentsMember2020-09-270000829224us-gaap:CorporateNonSegmentMember2020-09-27
UNITED STATES SECURITIES AND EXCHANGE COMMISSION
Washington, DC 20549
Form 10-K
☒ ANNUAL REPORT PURSUANT TO SECTION 13 OR 15(d) OF THE SECURITIES EXCHANGE ACT OF 1934
For the Fiscal Year Ended October 2, 2022
or
☐ TRANSITION REPORT PURSUANT TO SECTION 13 OR 15(d) OF THE SECURITIES EXCHANGE ACT OF 1934
For the transition period from to .
Commission File Number: 000-20322
Starbucks Corporation
(Exact Name of Registrant as Specified in its Charter)

| | | | | |
| Washington | 91-1325671 |
| (State of Incorporation) | (IRS Employer ID) |
2401 Utah Avenue South, Seattle, Washington 98134
(206) 447-1575
(Address of principal executive office, zip code, telephone number)
Securities Registered Pursuant to Section 12(b) of the Act: | | | | | | | | |
| Title of Each Class | Trading Symbol | Name of Each Exchange on Which Registered |
| Common Stock, $0.001 par value per share | SBUX | Nasdaq Global Select Market |
Securities Registered Pursuant to Section 12(g) of the Act: None
Indicate by check mark if the registrant is a well-known seasoned issuer, as defined in Rule 405 of the Securities Act. Yes x No ¨
Indicate by check mark if the registrant is not required to file reports pursuant to Section 13 or Section 15(d) of the Act. Yes ¨ No x
Indicate by check mark whether the registrant: (1) has filed all reports required to be filed by Section 13 or 15(d) of the Securities Exchange Act of 1934 during the preceding 12 months (or for such shorter period that the registrant was required to file such reports), and (2) has been subject to such filing requirements for the past 90 days. Yes x No ¨
Indicate by check mark whether the registrant has submitted electronically every Interactive Data File required to be submitted pursuant to Rule 405 of Regulation S-T (§ 232.405 of this chapter) during the preceding 12 months (or for such shorter period that the registrant was required to submit such files). Yes x No ¨
Indicate by check mark whether the registrant is a large accelerated filer, an accelerated filer, a non-accelerated filer, a smaller reporting company, or an emerging growth company. See the definitions of “large accelerated filer,” “accelerated filer,” “smaller reporting company” and “emerging growth company” in Rule 12b-2 of the Exchange Act. | | | | | | | | | | | | | | | | | | | | | | | |
| Large accelerated filer | x | Accelerated filer | ¨
| Non-accelerated filer | ¨
| Smaller reporting company | ☐ |
| | | | | | | |
| Emerging growth company | ☐ | | | | | | |
If an emerging growth company, indicate by check mark if the registrant has elected not to use the extended transition period for complying with any new or revised financial accounting standards provided pursuant to Section 13(a) of the Exchange Act. ¨
Indicate by check mark whether the registrant has filed a report on and attestation to its management's assessment of the effectiveness of its internal control over financial reporting under Section 404(b) of the Sarbanes-Oxley Act (15 U.S.C. 7262(b)) by the registered public accounting firm that prepared or issued its audit report. x
Indicate by check mark whether the registrant is a shell company (as defined in Rule 12b-2 of the Act). Yes ☐ No x
The aggregate market value of the voting stock held by non-affiliates of the registrant as of the last business day of the registrant’s most recently completed second fiscal quarter, based upon the closing sale price of the registrant’s common stock on April 3, 2022 as reported on the Nasdaq Global Select Market was $104.8 billion. As of November 11, 2022, there were 1,147.8 million shares of the registrant’s Common Stock outstanding.
DOCUMENTS INCORPORATED BY REFERENCE
Portions of the definitive Proxy Statement for the registrant’s Annual Meeting of Shareholders to be held on March 23, 2023 have been incorporated by reference into Part III of this Annual Report on Form 10-K.
STARBUCKS CORPORATION
Form 10-K
For the Fiscal Year Ended October 2, 2022
TABLE OF CONTENTS | | | | | | | | |
| PART I |
| Item 1 | | |
| Item 1A | | |
| Item 1B | | |
| Item 2 | | |
| Item 3 | | |
| Item 4 | | |
| PART II |
| Item 5 | | |
| Item 6 | | |
| Item 7 | | |
| Item 7A | | |
| Item 8 | | |
| | |
| | |
| Item 9 | | |
| Item 9A | | |
| Item 9B | | |
| Item 9C | | |
| PART III |
| Item 10 | | |
| Item 11 | | |
| Item 12 | | |
| Item 13 | | |
| Item 14 | | |
| PART IV |
| Item 15 | | |
| Item 16 | | |
| | |
| |
CAUTIONARY NOTE REGARDING FORWARD-LOOKING STATEMENTS
This Annual Report on Form 10-K includes “forward-looking” statements within the meaning of the Private Securities Litigation Reform Act of 1995. Forward-looking statements can be identified by the fact that they do not relate strictly to historical or current facts. They often include words such as “believes,” “expects,” “anticipates,” “estimates,” “intends,” “plans,” “seeks” or words of similar meaning, or future or conditional verbs, such as “will,” “should,” “could,” “may,” “aims,” “intends,” or “projects.” A forward-looking statement is neither a prediction nor a guarantee of future events or circumstances and those future events or circumstances may not occur. You should not place undue reliance on forward-looking statements, which speak only as of the date of this Annual Report on Form 10-K. These forward-looking statements are all based on currently available operating, financial and competitive information and are subject to various risks and uncertainties. Our actual future results and trends may differ materially depending on a variety of factors, including, but not limited to, the risks and uncertainties discussed under “Risk Factors” and “Management’s Discussion and Analysis of Financial Condition and Results of Operations.” Given these risks and uncertainties, you should not rely on forward-looking statements as a prediction of actual results. Any or all of the forward-looking statements contained in this Annual Report on Form 10-K and any other public statement made by us, including by our management, may turn out to be incorrect. We are including this cautionary note to make applicable and take advantage of the safe harbor provisions of the Private Securities Litigation Reform Act of 1995 for forward-looking statements. We expressly disclaim any obligation to update or revise any forward-looking statements, whether as a result of new information, future events or otherwise, except as required by law. Given these risks and uncertainties, readers are cautioned not to place undue reliance on such forward-looking statements.
PART I
Item 1. Business
General
In this Annual Report on Form 10-K (“10-K” or “Report”) for the fiscal year ended October 2, 2022 (“fiscal 2022”), Starbucks Corporation (together with its subsidiaries) is referred to as “Starbucks,” the “Company,” “we,” “us” or “our.”
Starbucks is the premier roaster, marketer and retailer of specialty coffee in the world, operating in 83 markets. Formed in 1985, Starbucks Corporation’s common stock trades on the Nasdaq Global Select Market (“Nasdaq”) under the symbol “SBUX.” We purchase and roast high-quality coffees that we sell, along with handcrafted coffee, tea and other beverages and a variety of high-quality food items through company-operated stores. We also sell a variety of coffee and tea products and license our trademarks through other channels, such as licensed stores as well as grocery and foodservice through our Global Coffee Alliance with Nestlé S.A. (“Nestlé”). In addition to our flagship Starbucks Coffee® brand, we sell goods and services under the following brands: Teavana®, Seattle’s Best Coffee®, Ethos®, Starbucks Reserve® and Princi®.
Our primary objective is to maintain Starbucks standing as one of the most recognized and respected brands in the world. We believe the continuous investments in our brand and operations will deliver long-term targeted revenue and income growth. This includes expansion of our global store base, adding stores in both existing, developed markets such as the U.S. and in higher growth markets such as China, as well as optimizing the mix of company-operated and licensed stores around the world. In addition, by leveraging experiences gained through our stores and elsewhere, we continue to drive beverage, equipment, process and technology innovation, including in our industry-leading digital platform. We strive to regularly offer consumers new, innovative coffee and other products in a variety of forms, across new categories, diverse channels and alternative store formats.
Starbucks has always been a different kind of company – one deep with purpose, where we work together to create a positive impact in the world. With coffee at our core, we pursue ambitious goals for our partners (employees), our communities and our planet because we believe it is our role and responsibility to create a thriving business powered by thriving people for a thriving planet and communities. Starbucks work to uplift one another extends well beyond our partners to the communities where we do business around the world. We are committed to responsible and ethical sourcing led by Coffee and Farmer Equity (C.A.F.E.) Practices, the company’s third-party verification program and the cornerstone of our approach to ethical sourcing coffee, as well as a more sustainable, resilient future for our planet and for our communities.
Human Capital Management
We invest in the well-being – the mental, physical and financial health – of every partner through our practices, policies and benefits. This work is grounded in the belief that we are at our best when we create inclusive and welcoming environments, where we uplift one another with dignity, respect and kindness. And we are hard at work uplifting our communities and building environments in our stores that are welcoming and safe. We believe the strength of our workforce is one of the significant contributors to our success as a global brand that leads with purpose. Therefore, one of our core strategies is to invest in and support our partners to differentiate our brand, products and services in the competitive specialty coffee market, including the following areas of focus:
Oversight and Management
We recognize the diversity of customers, partners and communities and believe in creating an inclusive and equitable environment that represents a broad spectrum of backgrounds and cultures. Working under these principles, our Partner Resources Organization is tasked with managing employment-related matters, including recruiting and hiring, onboarding and training, compensation planning, performance management and professional development. Our Board of Directors (the “Board”) and Board committees provide oversight on certain human capital matters, including our Inclusion and Diversity programs and initiatives. As noted in its charter, our Compensation and Management Development Committee is responsible for periodically reviewing Starbucks partner resource programs and initiatives, including healthcare and other benefits, as well as our management development and succession planning practices and strategies. Our Audit and Compliance Committee works closely with the Risk Management Committee, led by Starbucks cfo and general counsel, to monitor and mitigate current and emerging labor and human capital management risks. Furthermore, our Nominating and Corporate Governance Committee, in consultation with management, including our chief partner officer and chief inclusion and diversity officer, annually evaluates the effectiveness of our social responsibility policies, goals and programs, which also include partner-related issues. These reports and recommendations to the Board and its committees are part of the broader framework that guides how Starbucks should attract, retain and develop a skilled workforce that aligns with our values and strategies.
We regularly conduct anonymous surveys to seek feedback from our partners on a variety of topics, including confidence in company leadership, competitiveness of our compensation and benefits package, career growth opportunities and recommendations on how we can remain an employer of choice. The results are shared with our partners and reviewed by
senior leadership, who analyze areas of progress or deterioration and prioritize actions and activities in response to this feedback to drive meaningful improvements in partner engagement. Our management and cross-functional teams also work closely to evaluate human capital management issues such as partner retention, workplace safety, harassment and bullying, as well as to implement measures to mitigate these risks.
Diversity, Equity and Inclusion
We are committed to creating a welcoming and inclusive environment. We believe it is our responsibility to advance racial and social equity, and we are committed to furthering that work with intention, transparency and accountability. We continue to welcome our partners, customers, civil rights and community leaders, along with our chief inclusion and diversity officer, to advise us along this journey.
Starbucks has made specific racial equity commitments based on our principles of being intentional, transparent and accountable at all levels:
•Being intentional in cultivating a culture of inclusion, with a focus on partner retention and development.
◦Expanding our mentorship program designed to foster and deepen understanding of inclusion, diversity, equity and accessibility and provide partners in corporate and retail roles, including Black, Indigenous and people of color (“BIPOC”) and lesbian, gay, bisexual, transgender, queer and/or questioning (“LGBTQ+”) partners, development opportunities and connections with senior leaders.
•Being transparent in our approach to Inclusion and Diversity goal setting and progress.
◦Publicly sharing workforce diversity data.
◦Setting annual Inclusion and Diversity goals based on retention rates and progress towards achieving BIPOC representation. Our goal is for at least 30% of all corporate roles and at least 40% of all retail and manufacturing roles to be held by BIPOC partners in the U.S. by 2025.
•Holding ourselves accountable at the highest levels of the organization.
◦Incorporating metrics focused on building inclusive and diverse teams into our executive compensation programs.
◦Joining the Board Diversity Action Alliance to act alongside other companies similarly committed to increasing racially and ethnically diverse representation on corporate boards.
◦Publicizing self-identified race/ethnicity/gender of each member of our Board.
Total Rewards
We have demonstrated a history of investing in our workforce by offering competitive salaries and wages by continuously assessing the current business environment and labor market. We have consistently made enhancements in wages in order to attract talent to support our growth strategy and to elevate the customer experience. To foster a stronger sense of ownership and align the interests of partners with shareholders, restricted stock units are provided to eligible non-executive partners under our broad-based stock incentive programs. Furthermore, we offer comprehensive, locally relevant and innovative benefits to all eligible partners. In the U.S., our largest and most mature market, these include:
•Comprehensive health insurance coverage is offered to partners working an average of 20 hours or more each week.
•100% upfront tuition coverage is offered through the Starbucks College Achievement Plan for partners to earn a first-time bachelor's degree online at Arizona State University.
•100% paid parental leave is available to new parents that welcome a child through birth, adoption or foster placement and work an average of 20 hours or more each week.
•A Partner and Family Sick Time program is provided and allows partners to accrue paid sick time based on hours worked and use that time for themselves or family members in need of care.
•Care@Work benefit provides partners with backup care benefits for children and adults at a small cost to partners, as well as free unlimited senior care planning services. This benefit includes up to 30 days of backup care services through the end of fiscal 2022, in light of the COVID-19 pandemic.
•We view mental health as a fundamental part of our humanity and provide a comprehensive suite of related programs and benefits. These include a free subscription to Headspace, an online application that enables guided mediation, and 20 free mental health therapy or coaching sessions annually with Lyra.
Outside of the U.S., we have provided other innovative benefits to help address market-specific needs, such as providing interest-free loans to our U.K. partners to help cover rental deposits, mental health services in Canada, and in China, a monthly housing subsidy for full-time Starbucks baristas and shift supervisors, as well as comprehensive health insurance coverage for parents of partners.
Role-based Support
To help our partners succeed in their roles, we emphasize continuous training and development opportunities. These include, but are not limited to, safety and security protocols, updates on new products and service offerings and deployment of technologies. Training provided through our Pour Over sessions, which are a series of inspiring talks with thought leaders to help partners understand how to bring the Starbucks Experience to life, include a wide variety of topics such as achievable goal setting, giving and receiving constructive feedback and effective engagement with customers and communities. To help further promote an inclusive culture and to better serve our customers, we encourage U.S.-based partners to enroll in the To Be Welcoming courses we created in partnership with Arizona State University to address different forms of bias and discrimination.
Pay Equity
To be an employer of choice and maintain the strength of our workforce, we consistently assess the current business environment and labor market to refine our compensation and benefits programs and other resources available to our partners.
We previously achieved and currently maintain 100 percent pay equity in the U.S. for women and men and people of all races for partners performing similar work. We have also achieved gender pay equity in China and Canada, two of our largest markets outside of the U.S., and we made a commitment to achieve gender pay equity in all company-operated markets. Further, we have formulated pay-equity principles which provide equal footing, transparency and accountability as best practices that help address known, systemic barriers to global pay equity.
As of October 2, 2022, Starbucks employed approximately 402,000 people worldwide. In the U.S., Starbucks employed approximately 258,000 people, with approximately 248,000 in company-operated stores and the remainder in corporate support, store development, roasting, manufacturing, warehousing and distribution operations. Approximately 144,000 employees were employed outside of the U.S., with approximately 140,000 in company-operated stores and the remainder in regional support operations. Some Starbucks partners in company-operated stores are represented by unions, though it is an immaterial portion of our total workforce. We believe our efforts in managing our workforce have been effective, evidenced by a strong Starbucks culture and a good relationship between the company and our partners.
Information about our Executive Officers | | | | | | | | | | | | | | |
| Name | | Age | | Position |
| Howard Schultz | | 69 | | interim chief executive officer |
| Laxman Narasimhan | | 55 | | chief executive officer-elect |
| | | | |
| | | | |
| Michael Conway | | 56 | | group president, International and Channel Development |
| Zabrina Jenkins | | 52 | | acting executive vice president and general counsel |
| Rachel Ruggeri | | 53 | | executive vice president, chief financial officer |
| | | | |
| | | | |
| | | | |
Howard Schultz is the founder of Starbucks Corporation and has served as interim chief executive officer and a member of the Starbucks Board since April 2022. Mr. Schultz previously served as chairman of the Board of Starbucks since its inception in 1985 and until June 2018, and since 2018 has held the role of founder and chairman emeritus of Starbucks. He also previously served as chief executive officer from January 2008 to April 2017 and from November 1985 to June 2000, and as president from January 2008 until March 2015 and from November 1985 to June 1994. From June 2000 to February 2005, Mr. Schultz also held the title of chief global strategist. Mr. Schultz also held leadership and director roles with Il Giornale Coffee Company and Starbucks Coffee Company, which were predecessors to Starbucks.
Laxman Narasimhan joined Starbucks as its chief executive officer-elect on October 1, 2022. Prior to joining Starbucks, Mr. Narasimhan served as Chief Executive Officer of Reckitt Benckiser Group Plc (“Reckitt”), a FTSE 12 listed British multinational consumer health, hygiene and nutrition company, since September 2019. Prior to joining Reckitt, Mr. Narasimhan held various roles at PepsiCo from 2012 to 2019. He served as PepsiCo’s Group Chief Commercial Officer until July 2019, and prior to that beginning in 2012 served as Chief Executive Officer - Latin America, Europe and Sub-Saharan Africa, Chief Executive Officer - Latin America and Chief Financial Officer of PepsiCo Americas Foods. Prior to joining PepsiCo, Mr. Narasimhan spent 19 years at McKinsey & Company, where he focused on its consumer, retail and technology practices in the U.S., Asia and India. Mr. Narasimhan currently serves on the Board of Directors of Verizon Communications, Inc., a NYSE-listed telecommunications company. Mr. Narasimhan is a trustee of the Brookings Institution and a member of the Council on Foreign Relations.
Michael Conway joined Starbucks in March 2013 and was named group president, International and Channel Development in June 2021, where he is responsible for leading Starbucks retail growth and operations in over 80 markets across Asia Pacific, Europe, Middle East and Africa, Latin America and the Caribbean and growth for the Global Channel Development business, which consists of consumer packaged goods, ready-to-drink businesses and strategic partnerships, including those with Nestlé, PepsiCo and other key business partners. Prior to this, he served as executive vice president and president, International Licensed Markets, from March 2020 to June 2021. He also served as executive vice president and president, Starbucks Canada, executive vice president and president for Starbucks Licensed Stores business for the United States and Latin America and executive vice president and president of Starbucks Global Channel Development from December 2014 to March 2020. He currently serves on the Board of Directors of McCormick & Company, Incorporated, a NYSE-listed spice and extract manufacturing company.
Zabrina Jenkins joined the Starbucks legal department in 2005 and was named acting executive vice president and general counsel in April 2022, where she leads legal and regulatory affairs, global security and ethics and compliance for the company. Prior to being named acting executive vice president, she served as senior vice president, deputy general counsel from February 2020 to April 2022. She previously held roles as senior vice president, deputy general counsel, interim chief ethics and compliance officer, lead legal advisor for Teavana and was a member of the Starbucks 2018 Philadelphia incident crisis management response team. She serves as an independent board director for Retail Opportunity Investments Corp., a Nasdaq-listed national manager of retail shopping centers, and is a member of the Board of Trustees for Central Washington University.
Rachel Ruggeri joined Starbucks in 2001 as a member of the accounting team and was named executive vice president and chief financial officer in February 2021. In this leadership role, Rachel is responsible for the global finance function for Starbucks, which includes developing and executing the financial strategies that enable the long-term growth of the Company. Prior to her promotion in 2021, she served as senior vice president of Americas with responsibility for the retail portfolio across the segment, including company-operated and licensed stores from June 2020 to January 2021. From September 2016 to June 2020, she held various leadership roles in finance both internal and external to Starbucks, including Chief Financial Officer of Continental Mills from July 2018 to May 2020 and prior to that she was senior vice president of Finance at Starbucks in support of the Americas and Global Retail from September 2016 to June 2018. She also served as vice president of Finance from December 2010 to September 2016 supporting Corporate Financial Planning & Analysis and the U.S. Retail business.
Segment Financial Information
Segment information is prepared on the same basis that our management reviews financial information for operational decision-making purposes.
We have three reportable operating segments: 1) North America, which is inclusive of the U.S. and Canada; 2) International, which is inclusive of China, Japan, Asia Pacific, Europe, Middle East, Africa, Latin America and Caribbean; and 3) Channel Development. Non-reportable operating segments and unallocated corporate expenses are reported within Corporate and Other. Revenues from our reportable operating segments as a percentage of total net revenues for fiscal 2022 were as follows: North America (72%), International (22%) and Channel Development (6%).
Our North America and International segments include both company-operated and licensed stores. Our North America segment is our most mature business and has achieved significant scale. Certain markets within our International operations are in various stages of development and may require more extensive support, relative to their current levels of revenue and operating income, than our North America operations.
Our Channel Development segment includes roasted whole bean and ground coffees, Seattle’s Best Coffee, Starbucks- and Teavana-branded single-serve products, a variety of ready-to-drink beverages, such as Frappuccino® and Starbucks Doubleshot®, foodservice products and other branded products sold worldwide outside of our company-operated and licensed stores. A large portion of our Channel Development business operates under a licensed model of the Global Coffee Alliance with Nestlé, while our global ready-to-drink businesses operate under collaborative relationships with PepsiCo, Inc., Tingyi-Ashi Beverages Holding Co., Ltd., Arla Foods amba, Nestlé and others.
Revenue Components
We generate the majority of our revenues through company-operated stores and licensed stores.
Company-operated and Licensed Store Summary as of October 2, 2022: | | | | | | | | | | | | | | | | | | | | | | | | | | | | | | | | | | | | | | |
| North America | | As a % of
Total
North America Stores | | International | | As a % of
Total
International Stores | | | | | Total | | As a % of
Total
Stores |
| Company-operated stores | 10,216 | | | 59 | % | | 8,037 | | | 44 | % | | | | | 18,253 | | | 51 | % |
| Licensed stores | 7,079 | | | 41 | % | | 10,379 | | | 56 | % | | | | | 17,458 | | | 49 | % |
| Total | 17,295 | | | 100 | % | | 18,416 | | | 100 | % | | | | | 35,711 | | | 100 | % |
The mix of company-operated versus licensed stores in a given market generally varies based on several factors, including our ability to access desirable local retail space, the complexity, profitability and expected ultimate size of the market for Starbucks and our ability to leverage the support infrastructure within a geographic region.
Company-operated Stores
Revenue from company-operated stores accounted for 82% of total net revenues during fiscal 2022. Our retail objective is to be the leading retailer and brand of coffee and tea in each of our target markets by selling the finest quality coffee, tea and related products, as well as complementary food offerings, and by providing each customer with a unique Starbucks Experience. The Starbucks Experience is built upon superior customer service, convenience and a seamless digital experience as well as safe, clean and well-maintained stores that reflect the personalities of the communities in which they operate, thereby building a high degree of customer loyalty.
Our strategy for expanding our global retail business is to increase our category share in a disciplined manner, by selectively opening additional stores in new and existing markets, as well as increasing sales in existing stores, to support our long-term strategic objective to maintain Starbucks standing as one of the most recognized and respected brands in the world. Store growth in specific existing markets will vary due to many factors, including expected financial returns, the maturity of the market, economic conditions, consumer behavior and local business environment.
Company-operated store data for the fiscal year-ended October 2, 2022: | | | | | | | | | | | | | | | | | | | | | | | | | | | | | | | | | | | |
| | Stores Open as of | | | | | | | | | | Stores Open as of |
| | Oct 3, 2021 | | Opened | | Closed | | Transfers | | Net | | Oct 2, 2022 |
| North America: | | | | | | | | | | | |
| U.S. | 8,947 | | | 437 | | | (116) | | | (3) | | | 318 | | | 9,265 | |
| Canada | 908 | | | 44 | | | (6) | | | — | | | 38 | | | 946 | |
| Siren Retail | 6 | | | — | | | (1) | | | — | | | (1) | | | 5 | |
| Total North America | 9,861 | | | 481 | | | (123) | | | (3) | | | 355 | | | 10,216 | |
| International: | | | | | | | | | | | |
| China | 5,358 | | | 724 | | | (63) | | | — | | | 661 | | | 6,019 | |
| Japan | 1,546 | | | 102 | | | (18) | | | — | | | 84 | | | 1,630 | |
| | | | | | | | | | | |
| U.K. | 298 | | | 29 | | | (6) | | | (3) | | | 20 | | | 318 | |
| All Other | 65 | | | 2 | | | (2) | | | — | | | — | | | 65 | |
| Siren Retail | 5 | | | — | | | — | | | — | | | — | | | 5 | |
| Total International | 7,272 | | | 857 | | | (89) | | | (3) | | | 765 | | | 8,037 | |
| Total company-operated | 17,133 | | | 1,338 | | | (212) | | | (6) | | | 1,120 | | | 18,253 | |
Starbucks company-operated stores are typically located in high-traffic, high-visibility locations. Our ability to vary the size and format of our stores allows us to locate them in or near a variety of settings, including downtown and suburban retail centers, office buildings, university campuses and rural and off-highway locations. We are continuing the expansion of our stores, particularly drive-thru formats that provide a higher degree of access and convenience, and alternative store formats, which are designed to provide a more streamlined customer experience in dense metropolitan areas.
In fiscal 2022, we announced our plan in the U.S. market to increase efficiency while elevating the partner and customer experience (the “Reinvention Plan”). We believe the investments in partner wages and trainings will increase retention and
productivity while the acceleration of purpose-built store concepts and innovations in technologies will provide additional convenience and connection with our customers. In our major international markets, we also continue to invest in technology and establish partnerships with third parties with relevant expertise to increase digital adoption to provide convenience and elevate the customer experience. In China, we leverage platforms such as Starbucks NowTM stores to enable a seamless integration of physical and digital customer touchpoints. Orders may be placed in advance through the Starbucks Mobile App or Starbucks DeliversTM and can be conveniently picked up by customers and delivery providers in these express retail format locations. These strategies align closely with rapidly evolving customer preferences, including higher levels of mobile ordering, more contactless pick-up experiences and reduced in-store congestion, all of which naturally allow for greater physical distancing. We announced plans to invest in a digital third place that will offer members access to new benefits, a digital community and immersive coffee experiences, giving our customers new ways to experience and connect with Starbucks. We believe our continued efforts to transform our store portfolio and elevate technology will enhance the customer experience and position Starbucks for long-term growth.
Retail sales mix by product type for company-operated stores: | | | | | | | | | | | | | | | | | |
| Fiscal Year Ended | Oct 2,
2022 | | Oct 3,
2021 | | Sep 27,
2020 |
| Beverages | 74 | % | | 74 | % | | 75 | % |
| Food | 22 | % | | 21 | % | | 20 | % |
Other(1) | 4 | % | | 5 | % | | 5 | % |
| Total | 100 | % | | 100 | % | | 100 | % |
(1)“Other” primarily consists of sales of packaged and single-serve coffees and teas, serveware and ready-to-drink beverages, among other items.
Stored Value Cards and Loyalty Program
The Starbucks Card, our branded stored value card program, is designed to provide customers with a convenient payment method, support gifting and increase the frequency of store visits by cardholders, in part through the related Starbucks® Rewards loyalty program where available, as discussed below. Stored value cards are issued to customers when they initially load them with an account balance. They can be obtained in our company-operated and most licensed stores in North America, China, Japan and many of our markets in our International segment. Stored value cards can also be obtained online, via the Starbucks® Mobile App and through other U.S. and international retailers. Customers may access their card balances by utilizing their stored value card or the Starbucks Mobile App in participating stores. In nearly all markets, including the U.S. and Canada, customers who register their Starbucks Cards are automatically enrolled in the Starbucks Rewards program. Registered members can receive various benefits depending on factors such as the number of reward points (“Stars”) earned. In addition to using their Starbucks Cards, Starbucks Rewards members can earn Stars by paying with cash, credit or debit cards, or selected mobile wallets at all company-operated stores and a majority of licensed stores in North America. Using the Mobile Order and Pay functionality of the Starbucks Mobile App, customers can also place orders in advance for pick-up at certain participating locations in several markets. Refer to Note 1, Summary of Significant Accounting Policies and Estimates, included in Item 8 of Part II of this 10-K, for further discussion of our stored value cards and loyalty program. Licensed Stores
Revenues from our licensed stores accounted for 11% of total net revenues in fiscal 2022. Licensed stores generally have a lower gross margin and a higher operating margin than company-operated stores. Under the licensed model, Starbucks receives a margin on branded products and supplies sold to the licensed store operator along with a royalty on retail sales. Licensees are responsible for operating costs and capital investments, which more than offset the lower revenues we receive under the licensed store model.
In our licensed store operations, we seek to leverage the expertise of our local partners and share our operating and store development experience. Licensees provide improved, and at times the only, access to desirable retail space. Most licensees are prominent retailers with in-depth market knowledge and access. As part of these arrangements, we sell coffee, tea, food and related products to licensees for resale to customers and receive royalties and license fees from the licensees. We also sell certain equipment, such as coffee brewers and espresso machines, to our licensees for use in their operations. Licensee employees working in licensed retail locations are required to follow our detailed store operating procedures and attend training classes similar to those given to employees in company-operated stores. In a limited number of international markets, we also use traditional franchising and include these stores in the results of operations from our other licensed stores.
Licensed store data for the fiscal year-ended October 2, 2022: | | | | | | | | | | | | | | | | | | | | | | | | | | | | | | | | | | | |
| | Stores Open as of | | | | | | | | | | Stores Open as of |
| | Oct 3, 2021 | | Opened | | Closed | | Transfers | | Net | | Oct 2, 2022 |
| North America: | | | | | | | | | | | |
| U.S. | 6,497 | | | 217 | | | (109) | | | 3 | | | 111 | | | 6,608 | |
| Canada | 468 | | | 27 | | | (24) | | | — | | | 3 | | | 471 | |
| Total North America | 6,965 | | | 244 | | | (133) | | | 3 | | | 114 | | | 7,079 | |
| International: | | | | | | | | | | | |
| Korea | 1,611 | | | 168 | | | (29) | | | — | | | 139 | | | 1,750 | |
| | | | | | | | | | | |
| Latin America | 1,437 | | | 115 | | | (3) | | | — | | | 112 | | | 1,549 | |
| U.K. | 791 | | | 74 | | | (30) | | | 3 | | | 47 | | | 838 | |
| | | | | | | | | | | |
| Turkey | 559 | | | 50 | | | (5) | | | — | | | 45 | | | 604 | |
| Taiwan | 523 | | | 30 | | | (9) | | | — | | | 21 | | | 544 | |
| Indonesia | 487 | | | 48 | | | (12) | | | — | | | 36 | | | 523 | |
| Thailand | 425 | | | 27 | | | (6) | | | — | | | 21 | | | 446 | |
| Philippines | 401 | | | 19 | | | (2) | | | — | | | 17 | | | 418 | |
| All Other | 3,501 | | | 394 | | | (188) | | | — | | | 206 | | | 3,707 | |
| Total International | 9,735 | | | 925 | | | (284) | | | 3 | | | 644 | | | 10,379 | |
| | | | | | | | | | | |
| | | | | | | | | | | |
| | | | | | | | | | | |
| Total licensed | 16,700 | | | 1,169 | | | (417) | | | 6 | | | 758 | | | 17,458 | |
Other Revenues
Other revenues primarily are recorded in our Channel Development segment and include sales of packaged coffee, tea and ready-to-drink beverages to customers outside of our company-operated and licensed stores, as well as royalties received from Nestlé under the Global Coffee Alliance and other collaborative partnerships.
Product Supply
Starbucks is committed to selling the finest whole bean coffees and coffee beverages. To help ensure compliance with our rigorous coffee standards, we generally control substantially all coffee purchasing, roasting and packaging and the global distribution of coffee used in our operations. Nestlé controls distribution of certain finished goods through the Global Coffee Alliance. We purchase green coffee beans from multiple coffee-producing regions around the world and custom roast them to our exacting standards for our many blends and single-origin coffees.
The price of coffee is subject to significant volatility. Although most coffee trades in the commodity market, high-altitude arabica coffee of the quality sought by Starbucks tends to trade on a negotiated basis at a premium above the “C” coffee commodity price. Both the premium and the commodity price depend upon the supply and demand at the time of purchase. Supply and price can be affected by multiple factors in the producing countries, including weather, water supply quality and availability throughout the coffee production chain, natural disasters, crop disease and pests, general increase in farm inputs and costs of production, inventory levels and political and economic conditions. Climate change may further exacerbate many of these factors. Price is also impacted by trading activities in the arabica coffee futures market, including hedge funds and commodity index funds. In addition, green coffee prices have been affected in the past, and may be affected in the future, by the actions of certain organizations and associations that have historically attempted to influence prices of green coffee through agreements establishing export quotas or by restricting coffee supplies.
We buy coffee using fixed-price and price-to-be-fixed purchase commitments, depending on market conditions, to secure an adequate supply of quality green coffee. We also utilize forward contracts, futures contracts and collars to hedge “C” price exposure under our price-to-be-fixed green coffee contracts and our long-term forecasted coffee demand where underlying fixed-price and price-to-be-fixed contracts are not yet available. Total purchase commitments, together with existing inventory, are expected to provide an adequate supply of green coffee through fiscal 2023.
We depend upon our relationships with coffee producers, outside trading companies and exporters for our supply of green coffee. We believe, based on relationships established with our suppliers, the risk of non-delivery on such purchase commitments is remote.
To help ensure the future supply of high-quality green coffee and to reinforce our leadership role in the coffee industry, Starbucks operates ten farmer support centers, including our China Farmer Support Center located in the Yunnan Province of
this high-growth market. Farmer support centers are staffed with agronomists and sustainability experts who work with coffee farming communities to promote best practices in coffee production designed to improve both coffee quality and yields and agronomy support to address climate change and other impacts.
In addition to coffee, we also purchase significant amounts of dairy and plant-based dairy-free alternative products, particularly fluid milk, oat milk and almond milk to support the needs of our company-operated stores. We believe, based on relationships established with our dairy and plant-based dairy-free suppliers, that the risk of non-delivery of sufficient fluid milk and plant-based dairy-free alternatives to support our stores generally is remote.
Products other than whole bean coffees and coffee beverages sold in Starbucks stores include tea and a number of ready-to-drink beverages that are purchased from several specialty suppliers, usually under long-term supply contracts. Food products, such as pastries, breakfast sandwiches and lunch items, are purchased from national, regional and local sources. We also purchase a broad range of paper and plastic products, such as cups and cutlery, from several companies to support the needs of our retail stores as well as our manufacturing and distribution operations. We are also expanding our use of reusable packaging to reduce landfill waste. We believe, based on relationships established with these suppliers and manufacturers, that the risk of non-delivery of sufficient amounts of these items generally is remote.
During fiscal 2021 and continuing into fiscal 2022, we experienced certain supply shortages and transportation delays largely attributable to impacts of the COVID-19 pandemic as well as changes in customer demand and behaviors. While we expect these shortages and delays may continue into fiscal 2023, we view them to be temporary and do not believe they will have a material impact to our long-term growth and profitability.
Competition
Our primary competitors for coffee beverage sales are specialty coffee retailers and shops. We believe that our customers choose among specialty coffee retailers and shops primarily on the basis of product quality, brand reputation, service and convenience, as well as price. We continue to experience direct competition from large competitors in the quick-service restaurant sector and the ready-to-drink coffee beverage market, in addition to both well-established and start-up companies in many international markets. We also compete with restaurants and other specialty retailers for prime retail locations and qualified personnel to operate both new and existing stores.
Our coffee and tea products sold through our Channel Development segment compete directly against specialty coffees and teas sold through grocery stores, warehouse clubs, specialty retailers, convenience stores and foodservice accounts and compete indirectly against all other coffees and teas on the market.
Trademarks, Copyrights, Patents and Domain Names
Starbucks owns and has applied to register numerous trademarks and service marks in the U.S. and in other countries throughout the world. Some of our trademarks, including Starbucks, the Starbucks logo, Starbucks Reserve and Frappuccino are of material importance. The duration of trademark registrations varies from country to country. However, trademarks are generally valid and may be renewed indefinitely as long as they are in use and/or their registrations are properly maintained.
We own numerous copyrights for items such as product packaging, promotional materials, in-store graphics and training materials. We also hold patents on certain products, systems and designs which have an average remaining useful life of approximately seven years. In addition, Starbucks has registered and maintains numerous Internet domain names, including “Starbucks.com,” “Starbucks.net” and “Starbucksreserve.com.”
Seasonality and Quarterly Results
Our business is subject to moderate seasonal fluctuations, of which our second fiscal quarter typically experiences lower revenues and operating income. The COVID-19 pandemic has had an impact on consumer behaviors and customer traffic; however, it is not yet certain that these changes will sustain and cause other than temporary changes in the seasonal fluctuations of our business. Additionally, as Starbucks Cards are issued to and loaded by customers during the holiday season, we tend to have higher cash flows from operations during the first quarter of the fiscal year. However, since revenues from Starbucks Cards are recognized upon redemption and not when cash is loaded onto the Card, the impact of seasonal fluctuations on the consolidated statements of earnings is much less pronounced. As a result of moderate seasonal fluctuations, results for any quarter are not necessarily indicative of the results that may be achieved for the full fiscal year.
Government Regulation
As a company with global operations, we are subject to the laws and regulations of the United States and the multiple foreign jurisdictions in which we operate as well as the rules, reporting obligations and interpretations of all such requirements and obligations by various governing bodies, which may differ among jurisdictions. In addition, changes to such laws, regulations, rules, reporting obligations and related compliance obligations could result in significant costs but are not expected to have a material effect on our capital expenditures, results of operations and competitive position as compared to prior periods.
Available Information
Starbucks Annual Report on Form 10-K reports, along with all other reports and amendments filed with or furnished to the Securities and Exchange Commission (the “SEC”), are publicly available free of charge on the Investor Relations section of our website at investor.starbucks.com as soon as reasonably practicable after these materials are filed with or furnished to the SEC. In addition, the SEC maintains an internet site that contains reports, proxy and information statements and other information regarding issuers that file electronically with the SEC at www.sec.gov. We also use our website as a tool to disclose important information about the company and comply with our disclosure obligations under Regulation Fair Disclosure. Our corporate governance policies, code of ethics and Board committee charters and policies are also posted on the Investor Relations section of Starbucks website. The information on our website (or any webpages referenced in this Annual Report on Form 10-K) is not part of this or any other report Starbucks files with, or furnishes to, the SEC.
Item 1A. Risk Factors
You should carefully consider the risks described below in addition to the other information set forth in this Annual Report on Form 10-K, including the Management’s Discussion and Analysis of Financial Conditions and Results of Operations section, the Quantitative and Qualitative Disclosures About Market Risk section and the consolidated financial statements and related notes. If any of the risks and uncertainties described in the cautionary factors described below actually occur or continue to occur, our business, financial condition and results of operations and the trading price of our common stock could be materially and adversely affected. The considerations and risks that follow are organized within relevant headings but may be relevant to other headings as well. Moreover, the risks below are not the only risks we face and additional risks not currently known to us or that we presently deem immaterial may emerge or become material at any time and may negatively impact our business, reputation, financial condition, results of operations or the trading price of our common stock.
Risks Related to Macroeconomic Conditions
•Our financial condition and results of operations are subject to, and may be adversely affected by, a number of macroeconomic and other factors, many of which are also largely outside our control.
Our operating results have been in the past and will continue to be subject to a number of macroeconomic and other factors, many of which are largely outside our control. Any one or more of the factors listed below or described elsewhere in this risk factors section could have a material adverse impact on our business, financial condition and/or results of operations:
•increases in real estate costs in certain domestic and international markets;
•inflationary pressures;
•disruptions to our supply chain;
•changes in governmental rules and approaches to taxation;
•fluctuations in foreign currency exchange rates;
•adverse outcomes of litigation;
•severe weather or other natural or man-made disasters affecting a large market or several closely located markets that may temporarily but significantly affect our retail business in such markets;
•changes in climate, including changes to the frequency of severe weather events, that impact the price and availability or cost of goods and services, energy and other materials throughout our supply chain; and
•especially in our largest markets, including the U.S. and China, labor discord or disruption, geopolitical events, war, terrorism (including incidents targeting us), political instability, acts of public violence, boycotts, increasing anti-American sentiment in certain markets, hostilities and social unrest and other health pandemics that lead to avoidance of public places or restrictions on public gatherings such as in our stores.
•Economic conditions in the U.S. and international markets could adversely affect our business and financial results.
As a retailer that is dependent upon consumer discretionary spending, our results of operations are sensitive to changes in or uncertainty about macroeconomic conditions. A continued economic downturn or recession, or slowing or stalled recovery therefrom, may have a material adverse effect on our business, financial condition or results of operations. Our customers may have or in the future have less money for discretionary purchases and may stop or reduce their purchases of our products or switch to Starbucks or competitors’ lower-priced products as a result of various factors, including job losses, inflation, higher taxes, reduced access to credit, changes in federal economic policy, the COVID-19 pandemic and recent international trade disputes. Due to the COVID-19 pandemic or other global health events, we may experience a reduction and increased volatility in demand for our products. Such reductions and volatility may be caused by, among other things: store closures or modified operating hours and business model, reduced customer traffic due to illness, quarantine or government or self-imposed
restrictions placed on our stores’ operations, impacts caused by precautionary measures such as those related to face coverings and vaccinations and changes in consumer spending behaviors, including those caused by social distancing, a decrease in consumer confidence in general macroeconomic conditions and a decrease in consumer discretionary spending. Decreases in customer traffic and/or average value per transaction without a corresponding decrease in costs would put downward pressure on margins and would negatively impact our financial results. There is also a risk that if negative economic conditions or uncertainty, as a result of the COVID-19 pandemic or any other public health emergency, persist for a long period of time or worsen, consumers may make long-lasting changes to their discretionary purchasing behavior, including less frequent discretionary purchases on a more permanent basis or there may be a general downturn in the restaurant industry. These and other macroeconomic factors could have an adverse effect on our sales, profitability or development plans, which could harm our results of operations and financial condition.
•Failure to meet market expectations for our financial performance and fluctuations in the stock market as a whole will likely adversely affect the market price and volatility of our stock.
Failure to meet market expectations going forward, particularly with respect to our operational and financial results, and expectations regarding the success of our Reinvention Plan and related guidance, environmental performance and shareholder returns, will likely result in a decline and/or increased volatility in the market price of our stock. In addition, price and volume fluctuations in the stock market as a whole may affect the market price of our stock in ways that may be unrelated to our financial performance.
Risks Related to COVID-19
•Our financial condition and results of operations have been and are expected to continue to be adversely affected by the COVID-19 pandemic.
The COVID-19 pandemic has had, and is continuing to have, a significant impact on our business and results of operations. At the peak of the COVID-19 outbreak, many of our company-operated and licensed stores were closed. For stores that remained open, same-store sales declined due to modified operating hours and reduced customer traffic. While nearly all of our company-operated and licensed stores have reopened, we expect that certain parts of our operations will continue to be impacted by the continuing effects of COVID-19, including resurgences and variants of the virus. Our China market experienced unprecedented COVID-19 pandemic-related restrictions in multiple cities that severely impacted customer mobility. It remains difficult to predict the full impact of the COVID-19 pandemic on the broader economy and how consumer behavior may change, and whether such change is temporary or permanent. Social distancing, telecommuting and reductions in travel may become the new normal. In addition, the COVID-19 pandemic has required and may continue to require us to make controversial decisions about precautionary measures, such as vaccinations, showing proof of vaccinations and face coverings, that could impact our results, including by impacting our brand, our employee retention and satisfaction and the willingness of customers to buy our products. All of these conditions could fundamentally impact the way we work and the services we provide, and could have continuing adverse effects on our financial performance. As a result, we may incur additional impairment charges to our inventory, store and corporate assets—and our ability to realize the benefits from deferred tax assets may become limited—any of which may have a significant or material impact on our financial results.
Prolonged volatility or significant disruption of global financial markets due in part to the COVID-19 pandemic could have a negative impact on our ability to access capital markets and other funding sources, on acceptable terms or at all and impede our ability to comply with debt covenants.
Risks Related to Our Business
If our business partners and third-party providers do not satisfactorily fulfill their responsibilities and commitments, it could damage our brand and our financial results could suffer.
Our global business strategy, including our plans for new stores, branded products and other initiatives, relies significantly on a variety of business partners, including licensee and joint venture relationships, third-party manufacturers, distributors and retailers, particularly for our entire global Channel Development business. Licensees, retailers and foodservice operators are often authorized to use our logos and provide branded food, beverage and other products directly to customers. We believe our customers expect the same quality of service regardless of whether they visit a licensed or company-operated store, so we provide training and support to, and monitor the operations of, certain of these licensees and other business partners. However, the product quality and service they deliver may still be diminished by any number of factors beyond our control, including financial constraints, adherence to sanitation protocols and guidance (including those resulting from the COVID-19 pandemic), labor shortages and other factors. We do not have direct control over our business partners and may not have visibility into their practices.
We also source our food, beverage and other products from a wide variety of domestic and international business partners, and in certain cases such products are produced or sourced by our licensees directly. And although foodservice operators are authorized to use our logos and provide branded products as part of their foodservice business, we do not monitor the quality of non-Starbucks products served in those locations. Additionally, inconsistent uses of our brand and other of our intellectual property assets, as well as failure to protect our intellectual property, can erode consumer trust and our brand value and have a material negative impact on our financial results.
•Incidents involving food or beverage-borne illnesses, tampering, adulteration, contamination or mislabeling, whether or not accurate, as well as adverse public or medical opinions about the health effects of consuming our products, could harm our business.
Instances or reports, whether true or not, of unclean water supply or food-safety issues, such as food or beverage-borne illnesses, tampering, adulteration, contamination or mislabeling, either during growing, manufacturing, packaging, storing or preparation, have in the past severely injured the reputations of companies in the food and beverage processing, grocery and quick-service restaurant sectors. Any report linking us to such instances could severely hurt our sales and could possibly lead to product liability claims, litigation (including class actions) and/or temporary store closures. Clean water is critical to the preparation of coffee, tea and other beverages, as well as ice for our cold beverages, and our ability to ensure adequate supplies of clean water and ice to our stores can be limited, particularly in some international locations. We are also continuing to incorporate more products in our food and beverage lineup that require freezing or refrigeration, which increases the risk of food safety related incidents if correct temperatures are not maintained due to mechanical malfunction or human error.
We also face risk by relying on third-party food suppliers to provide and transport ingredients and finished products to our stores. While we monitor the operations of certain of these business partners, the product quality and service they deliver may be diminished by any number of factors beyond our control and it may be difficult to detect contamination or other defects in these products. There is greater risk from those we do not monitor, or do not monitor as closely. Furthermore, due to the COVID-19 pandemic, there are stricter health regulations and guidelines and increased public concern over food safety standards and controls. Potential food safety incidents, whether at our stores or involving our business partners, could lead to wide public exposure, which could materially harm our business.
Additionally, we are evolving our product lineup to include more local or smaller suppliers for some of our products who may not have as rigorous quality and safety systems and protocols as larger or more national suppliers, especially in light of the heightened safety protocols as a result of the COVID-19 pandemic. In addition, instances of food or beverage-safety issues, even those involving solely the restaurants or stores of competitors or of suppliers or distributors (regardless of whether we use or have used those suppliers or distributors), could adversely affect our sales on a regional or global basis by resulting in negative publicity about us or the foodservice industry in general. A decrease in customer traffic as a result of food-safety concerns or negative publicity, or as a result of a temporary closure of any of our stores, product recalls, viral-contaminated food or beverage claims or other food or beverage-safety claims or litigation, could materially harm our business and results of operations.
•We may not be successful in implementing important strategic initiatives or effectively managing growth, which may have an adverse impact on our business and financial results.
There is no assurance that we will be able to implement important strategic initiatives in accordance with our expectations or that they will generate expected returns, which may result in an adverse impact on our business and financial results. These strategic initiatives, which includes our Reinvention Plan, are designed to create growth, improve our results of operations and drive long-term shareholder value, and include:
•being an employer of choice and investing in employees to deliver a superior customer experience;
•building our leadership position around coffee;
•driving convenience, brand engagement and digital relationships through our mobile, loyalty, delivery and digital capabilities both domestically and internationally;
•simplifying store administrative tasks to allow store partners to better engage with customers;
•increasing the scale of the Starbucks store footprint with disciplined global expansion and introducing flexible and unique store formats, including the accelerated development of alternative store formats (such as Starbucks Pickup stores, Starbucks Now stores and curbside pickup) especially in light of the COVID-19 pandemic;
•adjusting rapidly to changing customer preferences and behaviors in light of the COVID-19 pandemic, inflation and changing economic conditions;
•moving to a more licensed store model in some markets and a more company-operated model in certain markets;
•creating new occasions in stores across all dayparts with new product offerings, including our growing lunch food and beverage product lineup;
•continuing the global growth of our Channel Development business through our supply, distribution and licensing agreements with Nestlé and other Channel Development business partners;
•delivering continued growth in our cold beverage business;
•working to address the potential effects of climate change and the sustainability of our business; and
•reducing our operating costs, particularly general and administrative expenses.
In addition to other factors listed in this risk factors section, factors that may adversely affect the successful implementation of these initiatives, which could have a material adverse impact on our business and financial results, include the following:
•imposition of additional taxes by jurisdictions, such as on certain types of beverages or based on number of employees;
•construction cost increases associated with new store openings and remodeling of existing stores; delays in store openings for reasons beyond our control, such as potential shortages of materials and labor and delays in permits, or a lack of desirable real estate locations available for lease at reasonable rates, either of which could keep us from meeting annual store opening targets in the U.S. and internationally;
•governmental regulations or other health guidelines concerning operations of stores, including due to the COVID-19 pandemic or other public health emergencies;
•not successfully scaling our supply chain infrastructure as our product offerings increase and as we continue to expand, including our emphasis on a broad range of high-quality food offerings;
•not successfully adapting to customer or market factors affecting our supply chain as we work to address sustainability and climate change; and
•the deterioration in our credit ratings, which could limit the availability of additional financing and increase the cost of obtaining financing to fund our initiatives.
Effectively managing growth can be challenging, particularly as we expand in international markets where we must balance the need for flexibility and a degree of autonomy for local management against the need for consistency with our goals, policies and standards. If we are not successful in implementing our strategic initiatives, or, in the event we undertake large acquisitions, integrations and divestitures, we may be required to evaluate whether certain assets, including goodwill and other intangibles, have become impaired. In the event we record an impairment charge, it could have a material impact on our financial results.
•Evolving consumer preferences and tastes may adversely affect our business.
Our continued success depends on our ability to attract and retain customers. Our financial results could be adversely affected by a shift in consumer spending away from outside-the-home food and beverages (such as the disruption caused by online commerce that results in reduced foot traffic to “brick & mortar” retail stores); lack of customer acceptance of new products (including due to price increases necessary to cover the costs of new products or higher input costs), brands (such as the global expansion of the Starbucks brand) and platforms (such as features of our mobile technology, changes in our loyalty rewards programs, the Starbucks Odyssey experience and our delivery services initiatives); or customers reducing their demand for our current offerings as new products are introduced. In addition, some of our products contain caffeine, dairy products, sugar and other compounds and allergens, the health effects of which are the subject of public and regulatory scrutiny, including the suggestion of linkages to a variety of adverse health effects. Particularly in the U.S., there is increasing consumer awareness of health risks, including obesity, as well as increased consumer litigation based on alleged adverse health impacts of consumption of various food and beverage products. While we have a variety of beverage and food items, including items that are coffee-free and have reduced calories, an unfavorable report on the health effects of caffeine or other compounds present in our products, whether accurate or not, imposition of additional taxes on certain types of food and beverage components, or negative publicity or litigation arising from certain health risks could significantly reduce the demand for our beverages and food products and could materially harm our business and results of operations. Furthermore, our financial results have been and could continue to be adversely affected by the impact of the COVID-19 pandemic, which has resulted in a disruption of customer routines, changes to employer “work-from-home” policies, reduced business and recreational travel and changes in consumer behavior and the ability or willingness to spend discretionary income on our products.
Risks Related to Brand Relevance and Brand Execution
•Our success depends substantially on the value of our brands and failure to preserve their value could have a negative impact on our financial results.
We believe we have built an excellent reputation globally for the quality of our products, for delivery of a consistently positive consumer experience and for our global social and environmental impact programs. The Starbucks brand is recognized throughout most of the world, and we have received high ratings in global brand value studies. To be successful in the future, particularly outside of the U.S. where the Starbucks brand and our other brands are less well-known, we believe we must preserve, grow and leverage the value of our brands across all sales channels. Brand value is based in part on consumer perceptions on a variety of subjective qualities.
Business incidents, whether isolated or recurring and whether originating from us or our business partners, that erode consumer trust can significantly reduce brand value, potentially trigger boycotts of our stores or result in civil or criminal liability and can have a negative impact on our financial results. Such incidents include actual or perceived breaches of privacy or violations of domestic or international privacy laws, contaminated food, product recalls, store employees or other food handlers infected with communicable diseases, such as COVID-19, safety-related incidents or other potential incidents discussed in this risk factors section. The impact of such incidents may be exacerbated if they receive considerable publicity, including rapidly through social or digital media (including for malicious reasons) or result in litigation. Consumer demand for our products and our brand equity could diminish significantly if we, our employees, licensees or other business partners fail to preserve the quality of our products, act or are perceived to act in an unethical, illegal, racially-biased, unequal or socially irresponsible manner, including with respect to the sourcing, content or sale of our products, service and treatment of customers at Starbucks stores, treatment of employees or the use of customer data for general or direct marketing or other purposes. Furthermore, if we are not effective in addressing our social and environmental program goals, executing on our Reinvention Plan, or achieving relevant sustainability goals, consumer trust in our brand may suffer, and this perception could result in negative publicity or litigation. Additionally, if we fail to comply with laws and regulations, take controversial positions or actions or fail to deliver a consistently positive consumer experience in each of our markets, including by failing to invest in the right balance of wages and benefits to attract and retain employees that represent the brand well or to foster an inclusive and diverse environment, our brand value may be diminished.
The ongoing relevance of our brand may depend on the success of our social and environmental program goals as well as the success of the Reinvention Plan, which requires company-wide coordination and alignment. We are working to manage risks and costs to us, our licensees and our supply chain of any effects of climate change as well as diminishing energy and water resources. These risks include any increased public focus, including by governmental and nongovernmental organizations, on these and other environmental sustainability matters, including packaging and waste, animal health and welfare, deforestation and land use. These risks may also include any increased pressure to make commitments, set targets or establish additional goals and take actions to meet them, which could expose us to market, operational and execution costs or risks.
•We may not be successful in our marketing, promotional and advertising plans and pricing strategies.
Our continued success depends in part on our ability to adjust our marketing, promotional and advertising plans and pricing strategy to respond quickly and effectively to shifting economic and competitive conditions as well as evolving customer preferences. We operate in a complex and costly marketing, promotional and advertising environment. Our marketing, promotional and advertising programs may not be successful in reaching our customers in the way we intend. Our success depends in part on whether the allocation of our advertising, promotional and marketing resources across different channels, including digital marketing, allows us to reach our customers effectively and efficiently, and in ways that are meaningful to them. If the advertising, promotional and marketing programs or our pricing strategies are not successful, or are not as successful as those of our competitors, our sales and market share could decrease.
Finally, customers are focusing more on sustainability and the environmental impacts of operations. An inability to meet customer expectations with respect to these issues could adversely affect our financial results.
Risks Related to Cybersecurity and Data Privacy
•Failure to maintain satisfactory compliance with certain privacy and data protections laws and regulations may subject us to substantial negative financial consequences and civil or criminal penalties.
Complex local, state, national, foreign and international laws and regulations apply to the collection, use, retention, protection, disclosure, transfer and other processing of personal data. These privacy and data protection laws and regulations are quickly evolving, with new or modified laws and regulations proposed and implemented frequently and existing laws and regulations subject to new or different interpretations and enforcement. In addition, our legal and regulatory obligations in jurisdictions outside the U.S. are subject to unexpected changes, including the potential for regulatory or other governmental entities to enact new or additional laws or regulations, to issue rulings that invalidate prior laws or regulations or to increase penalties
significantly. Complying with these laws and regulations can be costly and can impede the development and offering of new products and services.
For example, Europe’s General Data Protection Regulation (“GDPR”) and the U.K. General Data Protection Regulation (which implements the GDPR into U.K. law), impose stringent data protection requirements and provide for significant penalties for noncompliance. Additionally, California enacted legislation, the California Consumer Privacy Act (“CCPA”). The CCPA requires, among other things, covered companies to provide new disclosures to California consumers and allows such consumers new abilities to opt-out of certain sales of personal data. The CCPA also provides for civil penalties for violations as well as a private right of action for data breaches that may increase data breach litigation. Further, the California Privacy Rights Act, which was passed in November 2020 and is fully effective in January 2023, significantly modifies the CCPA. Colorado, Connecticut, Utah and Virginia recently enacted similar data privacy legislation that will also take effect in 2023, and several other states and countries are considering expanding or passing privacy laws in the near term. These modifications and new laws will require us to incur additional costs and expenses in our efforts to comply.
In June 2021, the European Commission published new versions of the Standard Contractual Clauses and in March 2022, the U.K. finalized the U.K. International Data Transfer Agreement. The new requirements will require us to incur costs and expenses in order to comply and may impact the transfer of personal data throughout our organization and to third parties.
Our failure to comply with applicable laws and regulations or other obligations to which we may be subject relating to personal data, or to protect personal data from unauthorized access, use or other processing, could result in enforcement actions and regulatory investigations against us, claims for damages by customers and other affected individuals, fines, damage to our brand reputation, any of which could have a material adverse effect on our operations, financial performance and business.
•The unauthorized access, use, theft or destruction of customer or employee personal, financial or other data or of Starbucks proprietary or confidential information that is stored in our information systems or by third parties on our behalf could impact our reputation and brand and expose us to potential liability and loss of revenues.
Many of our information technology systems (whether cloud-based or hosted in proprietary servers), including those used for our point-of-sale, web and mobile platforms, online and mobile payment systems, delivery services and rewards programs and administrative functions, contain personal, financial or other information that is entrusted to us by our customers and employees. Many of our information technology systems also contain Starbucks proprietary and other confidential information related to our business, such as business plans and product development initiatives and designs, and confidential information about third parties, such as licensees and business partners. Similar to many other retail companies and because of the prominence of our brand, we are consistently subject to attempts to compromise our information technology systems from both internal and external sources. The number and frequency of these attempts varies from year to year but could be exacerbated to some extent by an increase in our digital operations, including our efforts to comply with state and local mandates in response to COVID‑19. In addition, we provide some customer and employee data, as well as Starbucks proprietary information and other confidential information important to our business, to third parties where necessary to conduct our business, including licensees and business partners. Individuals performing work for Starbucks and such third parties also may possess some of this data, including on personally-owned digital devices. To the extent we, a third party or such an individual were to experience a breach of our or their information technology systems that results in the unauthorized access, theft, use, destruction or other compromises of customers’ or employees’ data or confidential information of the Company stored in or transmitted through such systems, including through cyber-attacks or other external or internal methods, it could result in a material loss of revenues from the potential adverse impact to our reputation and brand, a decrease in our ability to retain customers or attract new ones, the imposition of potentially significant costs (including loss of data or payment for recovery of data) and liabilities, loss of business, loss of business partners and licensees and the disruption to our supply chain, business and plans. Unauthorized access, theft, use, destruction or other compromises may occur through a variety of methods, including attacks using malicious code, those taking advantage of vulnerabilities in software, hardware or other infrastructure (including systems used by our supply chain), those using techniques aimed at convincing those with access to such data or information to share passwords or otherwise allow access through deceit or otherwise and those taking advantage of inadequate account security practices.
Such security breaches also could result in a violation of applicable U.S. and international privacy, cyber and other laws or trigger U.S. state data breach notification laws, and subject us to private consumer, business partner or licensee or securities litigation and governmental investigations and proceedings, any of which could result in our exposure to material civil or criminal liability.
Significant capital investments and other expenditures could also be required to investigate security incidents, remedy cybersecurity problems, recuperate lost data, prevent future compromises and adapt systems and practices to react to the changing threat environment. These include costs associated with notifying affected individuals and other agencies, additional security technologies, trainings, personnel, experts and credit monitoring services for those whose data has been breached. These costs, which could be material, could adversely impact our results of operations in the period in which they are incurred,
including by interfering with the pursuit of other important business strategies and initiatives, and may not meaningfully limit the success of future attempts to breach our information technology systems.
Media or other reports of existing or perceived security vulnerabilities in our systems or those of our third-party business partners or service providers can also adversely impact our brand and reputation and materially impact our business. Additionally, the techniques and sophistication used to conduct cyber-attacks and compromise information technology systems, as well as the sources and targets of these attacks, change frequently and are often not recognized until such attacks are launched or have been in place for a period of time. We continue to make significant investments in technology, third-party services and personnel to develop and implement systems and processes that are designed to anticipate cyber-attacks and to prevent or minimize breaches of our information technology systems or data loss, but these security measures cannot provide assurance that we will be successful in preventing such breaches or data loss.
•We rely heavily on information technology in our operations and growth initiatives, and any material failure, inadequacy, interruption or security failure of that technology could harm our ability to effectively operate and grow our business and could adversely affect our financial results.
We rely heavily on information technology systems across our operations for numerous purposes including for administrative functions, point-of-sale processing and payment in our stores and online, management of our supply chain, Starbucks Cards, online business, delivery services, mobile technology, including mobile payments and ordering apps, reloads and loyalty functionality and various other processes and transactions, and many of these systems are interdependent on one another for their functionality. Additionally, the success of several of our initiatives to drive growth, including our ability to increase digital relationships with our customers to drive incremental traffic and spend, is highly dependent on our technology systems. Furthermore, due to the social distancing measures put in place as a result of the COVID-19 pandemic, we accelerated the transformation of our store portfolio by expanding convenience-led formats, which depend heavily on our mobile ordering capabilities. We also rely on third-party providers and platforms for some of these information technology systems and support. Additionally, our systems hardware, software and services provided by third-party service providers are not fully redundant within a market or across our markets. Although we have operational safeguards in place, they may not be effective in preventing the failure of these systems or platforms to operate effectively and be available. Such failures may be caused by various factors, including power outages, climate change-related impacts, catastrophic events, physical theft, computer and network failures, inadequate or ineffective redundancy, problems with transitioning to upgraded or replacement systems or platforms, flaws in third-party software or services, errors or improper use by our employees or third-party service providers, or a breach in the security of these systems or platforms, including through cyber-attacks such as those that result in the blockage of our or our third-party business partners’ or service providers’ systems and platforms and those discussed in more detail in this risk factors section. If our incident response, disaster recovery and business continuity plans do not resolve these issues in an effective and timely manner, they could result in an interruption in our operations and could cause material negative impacts to our product availability and sales, the efficiency of our operations and our financial results. In addition, remediation of any problems with our systems could result in significant, unplanned expenses.
Risks Related to Intellectual Property
•We may not be able to adequately protect our intellectual property or adequately ensure that we are not infringing the intellectual property of others, which could harm the value of our brand and our business.
The success of our business depends on our continued ability to use our existing trademarks and service marks in order to increase brand awareness and further develop our branded products in both domestic and international markets. We rely on a combination of trademarks, copyrights, service marks, trade secrets, patents and other intellectual property rights to protect our brand and branded products.
We have registered certain trademarks and have other trademark registrations pending in the U.S. and certain foreign jurisdictions. The trademarks that we currently use have not been registered in all of the countries outside of the U.S. in which we do business or may do business in the future and may never be registered in all of these countries. It may be costly and time consuming to protect our intellectual property, and the steps we have taken to protect our intellectual property in the U.S. and foreign countries may not be adequate. In addition, the steps we have taken may not adequately ensure that we do not infringe the intellectual property of others, and third parties may claim infringement by us in the future. Any claim of infringement, whether or not it has merit, could be time-consuming, result in costly litigation and harm our business. In addition, we cannot ensure that licensees will not take actions that hurt the value of our intellectual property.
Risks Related to Supply Chain
•Our reliance on key business partners may adversely affect our business and operations.
The growth of our business relies on the ability of our licensee partners to implement our growth platforms and product innovations as well as on the degree to which we are able to enter into, maintain, develop and negotiate appropriate terms and
conditions of, and enforce, commercial and other agreements and the performance of our business partners under such agreements. Our international licensees may face capital constraints or other factors that may limit the speed at which they are able to expand and develop in a certain market. Our Channel Development business is heavily reliant on Nestlé, which has the right to sell and distribute our packaged goods and foodservice products to retailers and operators, with few exceptions. If Nestlé fails to perform its distribution and marketing commitments under our agreements and/or fails to support, protect and grow our brand in Channel Development, our Channel Development business could be adversely impacted for a period of time, present long-term challenges to our brand, limit our ability to grow our Channel Development business and have a material adverse impact on our business and financial results. Additionally, the growth of our Channel Development business is in part dependent on the level of discretionary support provided by our retail and licensed store businesses.
There are generally a relatively small number of licensee partners operating in specific markets. If they are not able to access sufficient funds or financing, or are otherwise unable or unwilling to successfully operate and grow their businesses it could have a material adverse effect on our results in the markets. Due to the COVID-19 pandemic, our financial results have been and could continue in the future to be adversely affected by the disruption to the operations of our business partners, including licensee relationships, third-party manufacturers, distributors and retailers, through the effects of business and facilities closures, reductions in operating hours, social, economic, political or labor instability in affected areas, transportation delays, travel restrictions and changes in operating procedures, including for additional cleaning and safety protocols.
•Increases in the cost of high-quality arabica coffee beans or other commodities or decreases in the availability of high-quality arabica coffee beans or other commodities could have an adverse impact on our business and financial results.
The availability and prices of coffee beans and other commodities are subject to significant volatility. We purchase, roast and sell high-quality whole bean arabica coffee beans and related coffee products. The high-quality arabica coffee of the quality we seek tends to trade on a negotiated basis at a premium above the “C” price. This premium depends upon the supply and demand at the time of purchase and the amount of the premium can vary significantly. Increases in the “C” coffee commodity price increase the price of high-quality arabica coffee and also impact our ability to enter into fixed-price purchase commitments. We frequently enter into supply contracts whereby the quality, quantity, delivery period and other negotiated terms are agreed upon, but the date, and therefore price, at which the base “C” coffee commodity price component will be fixed has not yet been established.
The supply and price of coffee we purchase can also be affected by multiple factors in the producing countries, such as weather, water supply quality and availability throughout the coffee production chain, natural disasters, crop disease and pests, general increase in farm inputs and costs of production, inventory levels, political and economic conditions and the actions of certain organizations and associations that have historically attempted to influence prices of green coffee through agreements establishing export quotas or by restricting coffee supplies. Climate change may further exacerbate many of these factors. Speculative trading in coffee commodities can also influence coffee prices. For example, drought conditions in Brazil have and, given continued drought conditions, are predicted to continue to impact coffee prices. Because of the significance of coffee beans to our operations, combined with our ability to only partially mitigate future price risk through purchasing practices and hedging activities, increases in the cost of high-quality arabica coffee beans could have a material adverse impact on our profitability. In addition, if we are not able to purchase sufficient quantities of green coffee due to any of the above factors or due to a worldwide or regional shortage, we may not be able to fulfill the demand for our coffee, which could have a material adverse impact on our business operations and financial performance.
We also purchase significant amounts of dairy products, particularly fluid milk, to support the needs of our company-operated retail stores. Additionally, and although less significant to our operations than coffee or dairy, other commodities, including tea and those related to food and beverage inputs, such as cocoa, produce, baking ingredients, meats, eggs and energy, as well as the processing of these inputs, are important to our operations. Increases in the cost of dairy products and other commodities, or lack of availability, whether due to supply shortages, delays or interruptions in processing, or otherwise, especially in international markets, could have a material adverse impact on our profitability. Similarly, increases in the cost of, or lack of availability, whether due to supply shortages, delays or interruptions in the processing of plant-based alternatives could have a material adverse impact on our profitability.
•Interruption of our supply chain could affect our ability to produce or deliver our products and could negatively impact our business and profitability.
Any material interruption in our supply chain, such as material interruption of roasted coffee supply due to the casualty loss of any of our roasting plants, interruptions in service by our third-party logistic service providers or common carriers that ship goods within our distribution channels, trade restrictions, such as increased tariffs or quotas, embargoes or customs restrictions, pandemics, social or labor unrest, labor shortages, natural disasters or political disputes and military conflicts that cause a material disruption in our supply chain could have a negative material impact on our business and our profitability. Additionally, our food, beverage and other products are sourced from a wide variety of domestic and international business partners in our supply chain operations, and in certain cases are produced or sourced by our licensees directly. We rely on these
suppliers to provide high-quality products and to comply with applicable laws. Our ability to find qualified suppliers who meet our standards and supply products in a timely and efficient manner is a significant challenge as we increase our fresh and prepared food offerings, especially with respect to goods sourced from outside the U.S. and from countries or regions with diminished infrastructure, developing or failing economies or which are experiencing political instability or social unrest. For certain products, we may rely on one or very few suppliers. A supplier's failure to meet our standards, provide products in a timely and efficient manner or comply with applicable laws is beyond our control. These issues could have a material negative impact on our business and profitability.
Risks Related to Human Capital
•Changes in the availability of and the cost of labor could adversely affect our business.
Our business could be adversely impacted by increases in labor costs, including wages and benefits, which, in a retail business such as ours, are two of our most significant costs, both domestically and internationally, including those increases triggered by state and federal legislation and regulatory actions regarding wages, scheduling and benefits; increased healthcare and workers’ compensation insurance costs; increased wages and costs of other benefits necessary to attract and retain high-quality employees with the right skill sets and increased wages, benefits and costs related to the COVID-19 pandemic. The growth of our business can make it increasingly difficult to locate and hire sufficient numbers of employees, to maintain an effective system of internal controls for a globally dispersed enterprise and to train employees worldwide to deliver a consistently high-quality product and customer experience, which could materially harm our business and results of operations. Furthermore, we have experienced, and could continue to experience, a shortage of labor for store positions, including due to market trends and conditions such as continued concerns around COVID-19, the availability of new telecommuting employment options and other factors, which could decrease the pool of available qualified talent for key functions. Such labor shortages could be further exacerbated by expanded COVID-19 vaccination requirements. In addition, our wages and benefits programs may be insufficient to attract and retain the best talent. Starting in December 2021, Starbucks partners at company-operated stores in multiple jurisdictions across the U.S. began filing for unionization elections and a number of these stores have now successfully unionized, with potentially more to follow. While the number of partners represented by unions is not significant, if a significant portion of our employees were to become unionized, our labor costs could increase and our business could be negatively affected by other requirements and expectations that could increase our costs, change our employee culture, decrease our flexibility and disrupt our business. Additionally, our responses to any union organizing efforts could negatively impact how our brand is perceived and have adverse effects on our business, including on our financial results. These responses could also expose us to legal risk, causing us to incur costs to defend legal and regulatory actions, potential penalties and restrictions or reputational harm.
•The loss of key personnel or difficulties recruiting and retaining qualified personnel could adversely impact our business and financial results.
Much of our future success depends on the continued availability and service of senior management personnel. The loss of any of our executive officers or other key senior management personnel could harm our business. Our success also depends substantially on the contributions and abilities of our retail store employees on whom we rely to give customers a superior in-store experience and elevate our brand. Accordingly, our performance depends on our ability to recruit and retain high-quality management personnel and other employees to work in and manage our stores, both domestically and internationally. Our ability to attract and retain corporate, retail and other personnel is also acutely impacted in certain international and domestic markets where the competition for a relatively small number of qualified employees is intense or in markets where large high-tech companies are able to offer more competitive salaries and benefits. Additionally, there is intense competition for qualified technology systems developers necessary to develop and implement new technologies for our growth initiatives, including increasing our digital relationships with customers. If we are unable to recruit, retain and motivate employees sufficiently to maintain our current business and support our projected growth, our business and financial performance may be adversely affected.
Environmental, Social and Governance Risk Factors
•Our business is subject to evolving corporate governance and public disclosure regulations and expectations, including with respect to environmental, social and governance matters, that could expose us to numerous risks.
We are subject to changing rules and regulations promulgated by a number of governmental and self-regulatory organizations, including the SEC, the Nasdaq Stock Market and the Financial Accounting Standards Board. These rules and regulations continue to evolve in scope and complexity and many new requirements have been created in response to laws enacted by Congress, making compliance more difficult and uncertain. In addition, increasingly regulators, customers, investors, employees and other stakeholders are focusing on environmental, social and governance (“ESG”) matters and related disclosures. These changing rules, regulations and stakeholder expectations have resulted in, and are likely to continue to result in, increased general and administrative expenses and increased management time and attention spent complying with or meeting such regulations and expectations. For example, developing and acting on initiatives within the scope of ESG, and
collecting, measuring and reporting ESG related information and metrics can be costly, difficult and time consuming and is subject to evolving reporting standards, including the SEC’s recently proposed climate-related reporting requirements, and similar proposals by other international regulatory bodies. We may also communicate certain initiatives and goals, regarding environmental matters, diversity, responsible sourcing and social investments and other ESG related matters, in our SEC filings or in other public disclosures. These initiatives and goals within the scope of ESG could be difficult and expensive to implement, the technologies needed to implement them may not be cost effective and may not advance at a sufficient pace, and we could be criticized for the accuracy, adequacy or completeness of the disclosure. Further, statements about our ESG related initiatives and goals, and progress against those goals, may be based on standards for measuring progress that are still developing, internal controls and processes that continue to evolve, and assumptions that are subject to change in the future. In addition, we could be criticized for the scope or nature of such initiatives or goals, or for any revisions to these goals. If our ESG-related data, processes and reporting are incomplete or inaccurate, or if we fail to achieve progress with respect to our goals within the scope of ESG on a timely basis, or at all, our reputation, business, financial performance and growth could be adversely affected.
•Climate change may have an adverse impact on our business.
While we seek to mitigate our business risks associated with climate change by establishing environmental goals and standards and seeking business partners, including within our supply chain, that are committed to operating in ways that protect the environment or mitigate environmental impacts, we recognize that there are inherent climate-related risks wherever business is conducted. For example, as we noted above, the supply and price of coffee we purchase can also be affected by multiple factors in the producing countries, such as weather and water supply quality and availability, which factors may be caused by or exacerbated by climate change. We operate in 83 markets globally. While we believe this geographic diversity is likely to lessen the impact of individual climate change related events on our financial results, our properties and operations may nonetheless be vulnerable to the adverse effects of climate change, which are predicted to increase the frequency and severity of weather events and other natural cycles such as wildfires and droughts. Such events have the potential to disrupt our operations, cause store closures, disrupt the business of our third-party suppliers and impact our customers, all of which may cause us to suffer losses and additional costs to maintain or resume operations.
Risks Related to Competition
•We face intense competition in each of our channels and markets, which could lead to reduced profitability.
The specialty coffee market is intensely competitive, including with respect to product quality, innovation, service, convenience, such as delivery service and mobile ordering, and price, and we face significant and increasing competition in all of these areas in each of our channels and markets. Accordingly, we do not have leadership positions in all channels and markets. In the U.S., the ongoing focus by large competitors in the quick-service restaurant sector on selling high-quality specialty coffee beverages could lead to decreases in customer traffic to Starbucks® stores and/or average value per transaction adversely affecting our sales and results of operations. Similarly, continued competition from well-established competitors, or competition from large new entrants or well-funded smaller companies, in our domestic and international markets could hinder growth and adversely affect our sales and results of operations in those markets. Many small competitors also continue to open coffee specialty stores in many of our markets across the world, which in the aggregate may also lead to significant decreases of customer traffic to our stores in those markets. Increased competition globally in packaged coffee and tea and single-serve and ready-to-drink coffee beverage markets, including from new and large entrants to this market, could adversely affect the profitability of the Channel Development segment. In addition, not all of our competitors may seek to establish environmental or sustainability goals at a comparable level to ours, which could result in lower supply chain or operating costs for our competitors. We may incur increased costs associated with reducing carbon dioxide and other greenhouse gas emissions, reducing the use of plastic or imposing performance obligations on our suppliers that could increase financial obligations for us and our business partners and could affect our profitability. Additionally, if we are unable to respond to consumer demand for healthy beverages and foods, or our competitors respond more effectively, this could have a negative effect on our business. Furthermore, declines in general consumer demand for specialty coffee products for any reason, including due to consumer preference for other products, flattening demand for our products, changed customer daily routines or traffic to stores as a result of the COVID-19 pandemic, or changed customer spending behaviors due to challenging economic conditions, could have a negative effect on our business.
Risks Related to Operating a Global Business
We are highly dependent on the financial performance of our North America operating segment.
Our financial performance is highly dependent on our North America operating segment, which comprised approximately 72% of consolidated total net revenues in fiscal 2022. If the North America operating segment revenue trends slow or decline, especially in our U.S. market, our other segments may be unable to make up any significant shortfall and our business and financial results could be adversely affected. And because the North America segment is relatively mature and produces the
large majority of our operating cash flows, such a slowdown or decline could result in reduced cash flows for funding the expansion of our international businesses and other initiatives and for returning cash to shareholders.
•We are increasingly dependent on the success of certain international markets in order to achieve our growth targets.
Our future growth increasingly depends on the growth and sustained profitability of certain international markets. Some or all of our international market business units (“MBUs”), which we generally define by the countries in which they operate, may not be successful in their operations or in achieving expected growth, which ultimately requires achieving consistent, stable net revenues and earnings. The performance of these international operations may be adversely affected by economic downturns in one or more of the countries in which our large MBUs operate. A decline in performance of one or more of our significant international MBUs could have a material adverse impact on our consolidated results.
The International segment is a significant profit center driving our global returns, along with our North America segment. In particular, our China MBU contributes meaningfully to both consolidated and International net revenues and operating income. China is currently our fastest growing market, our second largest market overall and 100% company-owned. Due to the significance of our China market for our profit and growth, we are exposed to risks in China, including the risks mentioned elsewhere and the following:
•the effects of current U.S.-China relations, including rounds of tariff increases and retaliations and increasing restrictive regulations, potential boycotts and increasing anti-Americanism;
•escalating U.S.-China tension and increasing political sensitivities in China;
•the effects of the COVID-19 pandemic and related governmental regulations and restrictions on our operations in China, including China's “zero COVID” policy;
•entry of new competitors to the specialty coffee market in China;
•changes in economic conditions in China and potential negative effects to the growth of its middle class, wages, labor, inflation, discretionary spending and real estate and supply chain costs;
•ongoing government regulatory reform, including relating to public health, food safety, tariffs and tax, sustainability and responses to climate change, which result in regulatory uncertainty as well as potential significant increases in compliance costs; and
•food-safety related matters, including compliance with food-safety regulations and ability to ensure product quality and safety.
Additionally, some factors that will be critical to the success of our international operations overall are different than those affecting our U.S. stores and licensees. Tastes naturally vary by region, and consumers in some MBUs may not embrace our products to the same extent as consumers in the U.S. or other international markets. Occupancy costs and store operating expenses can be higher internationally than in the U.S. due to higher rents for prime store locations or costs of compliance with country-specific regulatory requirements. Because many of our international operations are in an early phase of development, operating expenses as a percentage of related revenues are often higher compared to more developed operations.
•We face risks as a global business that could adversely affect our financial performance.
We operate in 83 markets globally. Our international operations are also subject to additional inherent risks of conducting business abroad, such as:
•foreign currency exchange rate fluctuations, or requirements to transact in specific currencies;
•changes or uncertainties in economic, legal, regulatory, social and political conditions in our markets, as well as negative effects on U.S. businesses due to increasing anti-American sentiment in certain markets;
•interpretation and application of laws and regulations, including tax, tariffs, labor, merchandise, anti-bribery and privacy laws and regulations;
•restrictive actions of foreign or U.S. governmental authorities affecting trade and foreign investment, especially during periods of heightened tension between the U.S. and such foreign governmental authorities, including protective measures such as export and customs duties and tariffs, government intervention favoring local competitors and restrictions on the level of foreign ownership;
•import or other business licensing requirements;
•the enforceability of intellectual property and contract rights;
•limitations on the repatriation of funds and foreign currency exchange restrictions due to current or new U.S. and international regulations;
•in developing economies, the growth rate in the portion of the population achieving sufficient levels of disposable income may not be as fast as we forecast;
•difficulty in staffing, developing and managing foreign operations and supply chain logistics, including ensuring the consistency of product quality and service, due to governmental actions affecting supply chain logistics, distance, language and cultural differences, as well as challenges in recruiting and retaining high-quality employees in local markets;
•local laws that make it more expensive and complex to negotiate with, retain or terminate employees;
•local regulations, health guidelines and safety protocols related to the COVID-19 pandemic affecting our operations; and
•delays in store openings for reasons beyond our control, competition with locally relevant competitors or a lack of desirable real estate locations available for lease at reasonable rates, any of which could keep us from meeting annual store opening targets and, in turn, negatively impact net revenues, operating income and earnings per share.
Moreover, many of the foregoing risks are particularly acute in developing countries, which are important to our long-term growth prospects.
Risks Related to Governmental and Regulatory Changes
•Failure to comply with applicable laws and changing legal and regulatory requirements could harm our business and financial results.
Our policies and procedures are designed to comply with all applicable laws, accounting and reporting requirements, tax rules and other regulations and requirements, including those imposed by the SEC, Nasdaq and foreign countries, as well as applicable trade, labor, healthcare, food and beverage, sanitation, safety, environmental, labeling, anti-bribery and corruption and merchandise laws. Such laws and regulations are complex and often subject to differing interpretations, which can lead to unintentional or unknown instances of non-compliance. Changes in applicable environmental laws and regulations, including increased or additional regulations and associated costs to limit carbon dioxide and other greenhouse gas emissions, to discourage the use of plastic or to limit or impose additional costs on commercial water use, may result in increased compliance costs, capital expenditures, incremental investments and other financial obligations for us and our business partners, which could affect our profitability. Furthermore, due to the COVID‑19 pandemic, we are subject to additional domestic and foreign governmental regulations and health guidelines, as well as any other voluntary safety protocols.
In addition, our business is subject to complex and rapidly evolving U.S. and international laws and regulations regarding data privacy and data protection, and companies are under increased regulatory scrutiny relating to these matters. The Federal Trade Commission and many state attorneys general are also interpreting federal and state consumer protection laws to impose standards for the online collection, use, dissemination and security of data. The interpretation and application of existing laws and regulations regarding data privacy and data protection are in flux and authorities around the world are considering a number of additional legislative and regulatory proposals in this area. Current and future data privacy and data protection laws and regulations (including the GDPR and the CCPA, discussed in more detail in this risk factors section, and other applicable international and U.S. privacy laws), or new interpretations of existing laws and regulations, may limit our ability to collect and use data, require us to otherwise modify our data processing practices and policies or result in the possibility of fines, litigation or orders, which may have an adverse effect on our business and results of operations. The burdens imposed by these and other laws and regulations that may be enacted, or new interpretations of existing and future laws and regulations, may also require us to incur substantial costs in reaching compliance in a manner adverse to our business.
The complexity of the regulatory environment in which we operate and the related costs of compliance are both increasing due to additional or changing legal and regulatory requirements, our ongoing expansion into new markets and new channels and the fact that foreign laws occasionally conflict with domestic laws. In addition to potential damage to our reputation and brand, failure by us or our business partners to comply with the various applicable laws and regulations, as well as changes in laws and regulations or the manner in which they are interpreted or applied, may result in litigation, civil and criminal liability, damages, fines and penalties, increased cost of regulatory compliance and restatements of our financial statements and have an adverse impact on our business and financial results.
Item 1B. Unresolved Staff Comments
None.
Item 2.Properties
The material properties used by Starbucks in connection with its roasting, manufacturing, warehousing, distribution and corporate administrative operations, serving all segments, are as follows: | | | | | | | | | | | |
| Location | Approximate Size in Square Feet | | Purpose |
| York, PA | 1,957,000 | | | Roasting, warehousing and distribution |
| Seattle, WA | 1,145,000 | | | Corporate administrative |
| Minden, NV (Carson Valley) | 1,080,000 | | | Roasting, warehousing and distribution |
| Lebanon, TN | 680,000 | | | Warehousing and distribution |
| Kent, WA | 510,000 | | | Roasting and distribution |
| Auburn, WA | 491,000 | | | Warehousing and distribution |
| Shanghai, China | 225,000 | | | Corporate administrative |
We own most of our roasting facilities and lease the majority of our warehousing and distribution locations. As of October 2, 2022, Starbucks had 18,253 company-operated stores, almost all of which are leased. We also lease space in various locations worldwide for regional, district and other administrative offices, training facilities and storage. In addition to the locations listed above, we hold inventory at various locations managed by third-party warehouses. We believe our existing facilities, both owned and leased, are in good condition and suitable for the conduct of our business.
Item 3.Legal Proceedings
See Note 16, Commitments and Contingencies, to the consolidated financial statements included in Item 8 of Part II of this 10-K for information regarding certain legal proceedings in which we are involved. Item 4.Mine Safety Disclosures
Not applicable.
PART II
Item 5. Market for the Registrant’s Common Equity, Related Shareholder Matters and Issuer Purchases of Equity Securities
SHAREHOLDER INFORMATION
MARKET INFORMATION AND DIVIDEND POLICY
Starbucks common stock is traded on Nasdaq, under the symbol “SBUX.”
As of November 11, 2022, we had approximately 18,000 shareholders of record. This does not include persons whose stock is in nominee or “street name” accounts through brokers.
Future decisions to pay comparable cash dividends continue to be at the discretion of the Board and will be dependent on our operating performance, financial condition, capital expenditure requirements and other factors that the Board considers relevant.
ISSUER PURCHASES OF EQUITY SECURITIES
Shares under our ongoing share repurchase program may be repurchased in open market transactions, including pursuant to a trading plan adopted in accordance with Rule 10b5-1 of the Securities Exchange Act of 1934, as amended (the “Exchange Act”) or through privately negotiated transactions. The timing, manner, price and amount of repurchases will be determined at our discretion, and the share repurchase program may be suspended, terminated or modified at any time for any reason. On April, 4, 2022, we announced a temporary suspension of our share repurchase program to allow us to augment investments in our stores and partners. During the fourth fiscal quarter ended October 2, 2022, there was no share repurchase activity. As of October 2, 2022, 52.6 million shares remained available for repurchase under current authorizations. We have resumed our share repurchase program in the first quarter of fiscal 2023.
Performance Comparison Graph
The following graph depicts the total return to shareholders from October 1, 2017, through October 2, 2022, relative to the performance of the Standard & Poor’s 500 Index, the Nasdaq Composite Index and the Standard & Poor’s 500 Consumer Discretionary Sector, a peer group that includes Starbucks. All indices shown in the graph have been reset to a base of 100 as of October 1, 2017, and assume an investment of $100 on that date and the reinvestment of dividends paid since that date. The stock price performance shown in the graph is not necessarily indicative of future price performance.
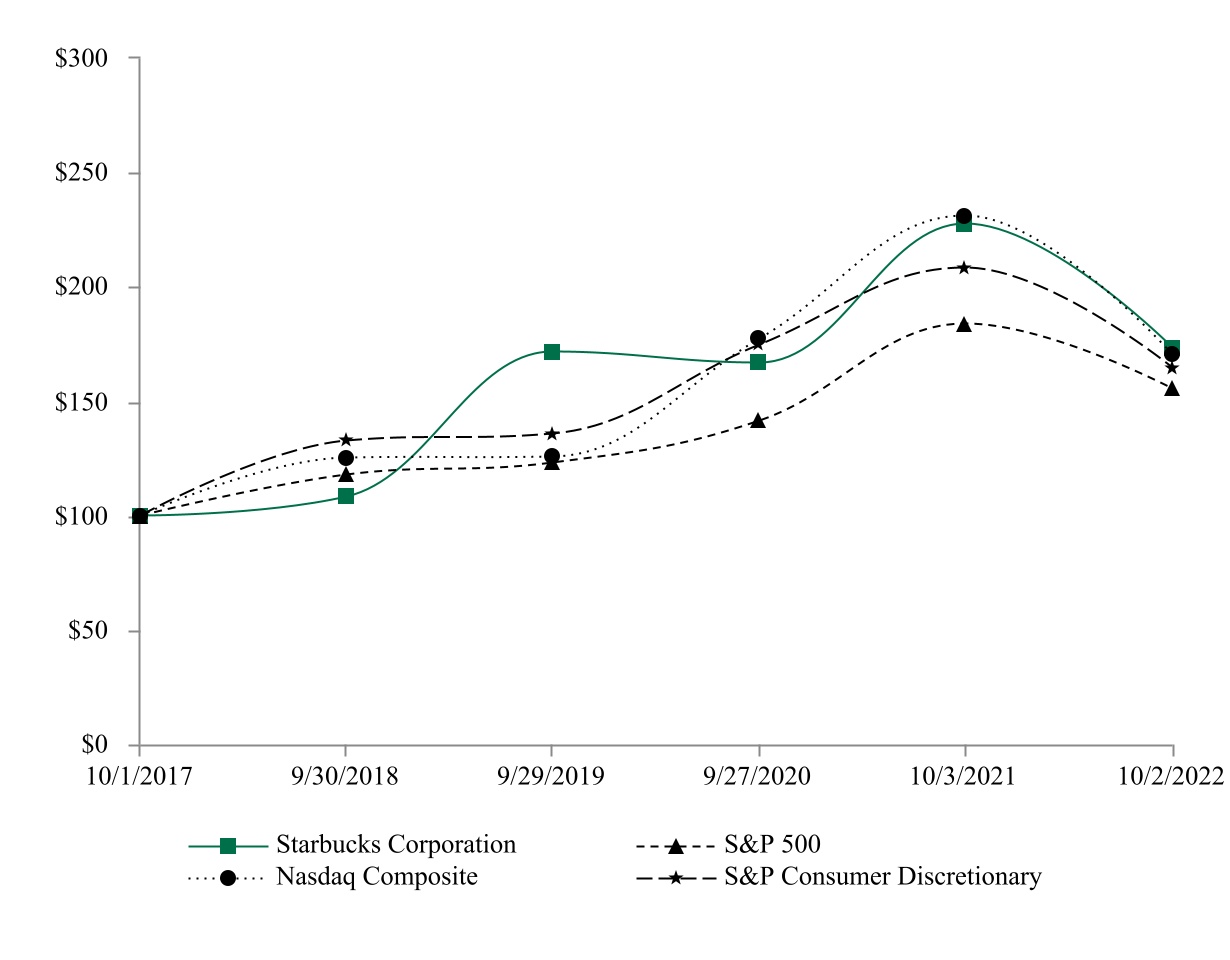
| | | | | | | | | | | | | | | | | | | | | | | | | | | | | | | | | | | |
| | Oct 1, 2017 | | Sep 30, 2018 | | Sep 29, 2019 | | Sep 27, 2020 | | Oct 3, 2021 | | Oct 2, 2022 |
| Starbucks Corporation | $ | 100.00 | | | $ | 108.29 | | | $ | 171.58 | | | $ | 167.04 | | | $ | 227.59 | | | $ | 173.61 | |
| S&P 500 | 100.00 | | | 117.91 | | | 122.93 | | | 141.55 | | | 184.02 | | | 155.55 | |
| Nasdaq Composite | 100.00 | | | 125.17 | | | 125.82 | | | 177.36 | | | 231.03 | | | 170.38 | |
| S&P Consumer Discretionary | 100.00 | | | 132.54 | | | 135.66 | | | 174.86 | | | 208.34 | | | 164.81 | |
Item 6. [Reserved]
Item 7.Management’s Discussion and Analysis of Financial Condition and Results of Operations
General
Our fiscal year ends on the Sunday closest to September 30. All references to store counts, including data for new store openings, are reported net of related store closures, unless otherwise noted. Fiscal year 2022 included 52 weeks. Fiscal year 2021 included 53 weeks, with the 53rd week falling in the fourth fiscal quarter, and fiscal year 2020 included 52 weeks; comparable store sale percentages below are calculated excluding the 53rd week.
The discussion of our financial condition and results of operations for the fiscal year ended September 27, 2020, included in Item 7. Management’s Discussion and Analysis of Financial Condition and Results of Operations (“MD&A”) can be found in the Annual Report on Form 10-K for the fiscal year ended October 3, 2021.
Overview
We have three reportable operating segments: 1) North America, which is inclusive of the U.S. and Canada; 2) International, which is inclusive of China, Japan, Asia Pacific, Europe, Middle East, Africa, Latin America and the Caribbean; and 3) Channel Development. Non-reportable operating segments and unallocated corporate expenses are reported within Corporate and Other.
Our financial results and long-term growth model will continue to be driven by new store openings, comparable store sales and margin management. We believe these key operating metrics are useful to investors because management uses these metrics to assess the growth of our business and the effectiveness of our marketing and operational strategies. Throughout this MD&A, we commonly discuss the following key operating metrics:
•New store openings and store count
•Comparable store sales
•Operating margin
Starbucks results for fiscal 2022 demonstrate the resiliency and strength of our brand. Consolidated revenues increased 11% to $32.3 billion in fiscal 2022 compared to $29.1 billion in fiscal 2021, primarily driven by strength in our U.S. business and growth in our International segment excluding China, partially offset by the impact of the extra week in fiscal 2021 ($496 million) and unfavorable foreign currency translation.
For both the North America segment and U.S. market, comparable store sales increased 12% for fiscal 2022 compared to an increase of 22% and 21% for the North America segment and the U.S. market, respectively, in fiscal 2021. Average ticket for the North America segment and the U.S. market grew 7% and 8%, respectively, primarily driven by strategic pricing and increased demand for food items in our U.S. market. The segment also experienced higher costs, primarily related to investments and growth in labor including enhanced store partner wages as well as increased spend on new partner training. Also contributing were inflationary pressures on commodities and our supply chain. In fiscal 2022, we announced our Reinvention Plan in the U.S. market to increase efficiency while elevating the partner and customer experience. We believe the investments in partner wages and training will increase retention and productivity while the acceleration of purpose-built store concepts and innovations in technologies will provide additional convenience and connection with our customers.
For the International segment, comparable store sales decreased by 9% for fiscal 2022 compared to an increase of 16% in fiscal 2021, driven by comparable store sales decline of 24% in our China market. During the third and fourth quarters of fiscal 2022, our China market experienced COVID-19 pandemic related restrictions in multiple cities that severely impacted customer mobility. Outside of China, strong growth in our major International markets, driven by product innovation and increasing digital capabilities, partially offset the unfavorability in our China market.
Revenue for our Channel Development segment increased $250 million, or 16%, when compared with fiscal 2021, driven by higher product sales to and royalty revenue from the Global Coffee Alliance and growth in our global ready-to-drink business. Operating margin decreased 520 basis points to 44.3%, primarily due to a decline in our North American Coffee Partnership joint venture income due to inflationary pressures and supply chain constraints as well as business mix shift.
Despite COVID-19 induced business interruptions, especially in our China market, we have seen the strength and resilience of our brand as well as strong customer demand across our portfolio. We expect inflationary pressures on commodities and supply chain to continue to a lesser extent in fiscal 2023, relative to the impact on our business and financial metrics, including operating margin, as compared to fiscal 2022. We anticipate that these should be offset by benefits from pricing decisions as well as from increased sales leverage and higher productivity driven by our Reinvention Plan. Absent significant and prolonged COVID-19 relapses or global economic disruptions, and based on the current trend of our business operations and our focused efforts on the Reinvention Plan, we are confident in the strength of our brand and strategy for sustainable, profitable growth over the long-term.
Financial Highlights
•Total net revenues increased 11% to $32.3 billion in fiscal 2022 compared to $29.1 billion in fiscal 2021, inclusive of $576 million attributable to the extra week in fiscal 2021.
•Consolidated operating income decreased to $4.6 billion in fiscal 2022 compared to $4.9 billion in fiscal 2021. Fiscal 2022 operating margin was 14.3% compared to 16.8% in fiscal 2021. Operating margin contraction of 250 basis points was primarily due to investments and growth in labor, including enhanced retail store partner wages (approximately 290 basis points) as well as increased spend on new partner training and support costs (approximately 80 basis points). Also contributing were inflationary pressures on commodities and our supply chain (approximately 270 basis points), sales deleverage related to COVID-19 pandemic related impacts in our China market (approximately 110 basis points), business mix shift (approximately 60 basis points) and lower government subsidies (approximately 60 basis points). These increases were partially offset by sales leverage across markets outside of China (approximately 390 basis points) and strategic pricing, primarily in North America (approximately 320 basis points).
•Diluted earnings per share (“EPS”) for fiscal 2022 decreased to $2.83, compared to EPS of $3.54 in fiscal 2021. The decrease was primarily driven by lapping the prior year $0.56 gain, net of estimated taxes, on the divestiture of our South Korea joint venture and $0.10 related to the extra week in fiscal 2021. Also contributing were investments in labor and inflationary pressures on commodities and our supply chain, partially offset by growth in comparable store sales and lower restructuring costs.
•Capital expenditures were $1.8 billion in fiscal 2022 and $1.5 billion in fiscal 2021.
•We returned $6.3 billion to our shareholders in fiscal 2022 through share repurchases and dividends. We returned $2.1 billion in fiscal 2021 through dividends. In April 2022, we announced a temporary suspension of our share repurchase program to allow us to augment investments in our stores and partners. We resumed our share repurchase program in the first quarter of fiscal 2023.
Acquisitions and Divestitures
See Note 2, Acquisitions, Divestitures and Strategic Alliance, to the consolidated financial statements included in Item 8 of Part II of this 10-K for information regarding acquisitions and divestitures. RESULTS OF OPERATIONS — FISCAL 2022 COMPARED TO FISCAL 2021
Consolidated results of operations (in millions):
Revenues | | | | | | | | | | | | | | | | | |
| Fiscal Year Ended | Oct 2,
2022 | | Oct 3,
2021 | | % Change |
| Net revenues: | | | | | |
| Company-operated stores | $ | 26,576.1 | | | $ | 24,607.0 | | | 8.0 | % |
| Licensed stores | 3,655.5 | | | 2,683.6 | | | 36.2 | |
| Other | 2,018.7 | | | 1,770.0 | | | 14.1 | |
| Total net revenues | $ | 32,250.3 | | | $ | 29,060.6 | | | 11.0 | % |
Total net revenues increased $3.2 billion, or 11%, over fiscal 2021, primarily due to higher revenues from company-operated stores ($2.0 billion). The growth in company-operated store revenue was driven by an 8% increase in comparable store sales ($1.8 billion) attributed to a 5% increase in average ticket and 2% increase in comparable transactions. Also contributing were the incremental revenues from 1,120 net new Starbucks company-operated store openings, or a 7% increase, over the past 12 months ($1.0 billion). Partially offsetting these increases was the impact of the extra week in fiscal 2021 ($496 million) and unfavorable foreign currency translation ($368 million).
Licensed stores revenue increased $972 million, primarily driven by higher product and equipment sales to and royalty revenues from our licensees ($922 million) and the conversion of our Korea market from a joint venture to a fully licensed market in the fourth quarter of fiscal 2021 ($187 million). Partially offsetting these increases were unfavorable foreign currency translation ($81 million) and the impact of the extra week in fiscal 2021 ($57 million).
Other revenues increased $249 million, primarily due to higher product sales and royalty revenue in the Global Coffee Alliance ($216 million) and growth in our ready-to-drink business ($44 million). Partially offsetting these increases was the impact of the extra week in fiscal 2021 ($23 million).
Operating Expenses | | | | | | | | | | | | | | | | | | | | | | | |
| Fiscal Year Ended | Oct 2,
2022 | | Oct 3,
2021 | | Oct 2,
2022 | | Oct 3,
2021 |
| | | | | As a % of Total Net Revenues |
| Product and distribution costs | $ | 10,317.4 | | | $ | 8,738.7 | | | 32.0 | % | | 30.1 | % |
| Store operating expenses | 13,561.8 | | | 11,930.9 | | | 42.1 | | | 41.1 | |
| Other operating expenses | 461.5 | | | 359.5 | | | 1.4 | | | 1.2 | |
| Depreciation and amortization expenses | 1,447.9 | | | 1,441.7 | | | 4.5 | | | 5.0 | |
| General and administrative expenses | 2,032.0 | | | 1,932.6 | | | 6.3 | | | 6.7 | |
| Restructuring and impairments | 46.0 | | | 170.4 | | | 0.1 | | | 0.6 | |
| | | | | | | |
| Total operating expenses | 27,866.6 | | | 24,573.8 | | | 86.4 | | | 84.6 | |
| Income from equity investees | 234.1 | | | 385.3 | | | 0.7 | | | 1.3 | |
| Operating income | $ | 4,617.8 | | | $ | 4,872.1 | | | 14.3 | % | | 16.8 | % |
| Store operating expenses as a % of related revenues | | | | | 51.0 | % | | 48.5 | % |
Product and distribution costs as a percentage of total net revenues increased 190 basis points, primarily due to higher supply chain costs due to inflationary pressures.
Store operating expenses as a percentage of total net revenues increased 100 basis points. Store operating expenses as a percentage of company-operated store revenues increased 250 basis points, primarily due to investments and growth in labor, including enhanced retail store partner wages (approximately 320 basis points) as well as increased spend on new partner training and support costs (approximately 90 basis points). Also contributing were lower temporary government subsidies (approximately 70 basis points). These increases were partially offset by sales leverage.
Other operating expenses increased $102 million, primarily due to lapping a change in estimate relating to a transaction cost accrual ($23 million), higher support costs for our growing North America and International licensed stores ($22 million), transaction costs associated with our Russia market exit ($20 million) and strategic investments in technology and other initiatives ($15 million).
Depreciation and amortization expenses as a percentage of total net revenues decreased 50 basis points, primarily due to sales leverage.
General and administrative expenses increased $99 million, primarily due to incremental investments in technology ($92 million), increased partner wages and benefits ($59 million) and higher support costs to address labor market conditions ($36 million). These increases were partially offset by lower performance-based compensation ($95 million).
Restructuring and impairment expenses decreased $124 million, primarily due to lower costs incurred related to our Reinvention Plan in the current year compared to prior year's North America store portfolio optimization, including lower accelerated lease right-of-use asset amortization costs ($84 million) and asset impairment charges ($68 million), partially offset by higher professional fees and higher severance costs ($27 million).
Income from equity investees decreased $151 million, primarily due to the conversion of our Korea market from a joint venture to a fully licensed market in the fourth quarter of fiscal 2021 ($140 million) and lower income from our North American Coffee Partnership joint venture ($18 million).
The combination of these changes resulted in an overall decrease in operating margin of 250 basis points in fiscal 2022 when compared to fiscal 2021.
Other Income and Expenses | | | | | | | | | | | | | | | | | | | | | | | |
| Fiscal Year Ended | Oct 2,
2022 | | Oct 3,
2021 | | Oct 2,
2022 | | Oct 3,
2021 |
| | | | | As a % of Total Net Revenues |
| Operating income | $ | 4,617.8 | | | $ | 4,872.1 | | | 14.3 | % | | 16.8 | % |
| Net gain resulting from divestiture of certain operations | — | | | 864.5 | | | — | | | 3.0 | |
| Interest income and other, net | 97.0 | | | 90.1 | | | 0.3 | | | 0.3 | |
| Interest expense | (482.9) | | | (469.8) | | | (1.5) | | | (1.6) | |
| Earnings before income taxes | 4,231.9 | | | 5,356.9 | | | 13.1 | | | 18.4 | |
| Income tax expense | 948.5 | | | 1,156.6 | | | 2.9 | | | 4.0 | |
| Net earnings including noncontrolling interests | 3,283.4 | | | 4,200.3 | | | 10.2 | | | 14.5 | |
| Net earnings/(loss) attributable to noncontrolling interests | 1.8 | | | 1.0 | | | 0.0 | | | 0.0 | |
| Net earnings attributable to Starbucks | $ | 3,281.6 | | | $ | 4,199.3 | | | 10.2 | % | | 14.5 | % |
| Effective tax rate including noncontrolling interests | | | | | 22.4 | % | | 21.6 | % |
Net gain resulting from divestiture of certain operations decreased $865 million due to lapping the sale of our ownership interest in our South Korea joint venture in the prior year.
Interest expense increased $13 million primarily due to additional interest incurred on long-term debt issued in February 2022.
The effective tax rate for fiscal 2022 was 22.4% compared to 21.6% for fiscal 2021. The increase was due to lapping a prior year remeasurement of deferred tax assets due to an enacted foreign corporate rate change (approximately 130 basis points) and lapping the release of income tax reserves upon expiration of statute of limitations (approximately 70 basis points), partially offset by the release of valuation allowances recorded against deferred tax assets of a certain international jurisdiction (approximately 120 basis points). See Note 14, Income Taxes, for further discussion. The Inflation Reduction Act was enacted on August 16, 2022, and includes a new 15% minimum tax on “adjusted financial statement income” beginning with the Company’s fiscal year 2024, and a new 1% excise tax on stock repurchases after December 31, 2022. While these tax law changes have no immediate effect and are not expected to have a material impact on our future financial results, we will continue to evaluate its impact as further information becomes available.
Segment Information
Results of operations by segment (in millions):
North America | | | | | | | | | | | | | | | | | | | | | | | |
| Fiscal Year Ended | Oct 2,
2022 | | Oct 3,
2021 | | Oct 2,
2022 | | Oct 3,
2021 |
| | | | | As a % of North America
Total Net Revenues |
| Net revenues: | | | | | | | |
| Company-operated stores | $ | 21,214.2 | | | $ | 18,737.3 | | | 90.8 | % | | 91.6 | % |
| Licensed stores | 2,150.5 | | | 1,702.2 | | | 9.2 | | | 8.3 | |
| Other | 6.1 | | | 8.4 | | | 0.0 | | | 0.0 | |
| Total net revenues | 23,370.8 | | | 20,447.9 | | | 100.0 | | | 100.0 | |
| Product and distribution costs | 6,677.2 | | | 5,453.8 | | | 28.6 | | | 26.7 | |
| Store operating expenses | 10,860.0 | | | 9,359.5 | | | 46.5 | | | 45.8 | |
| Other operating expenses | 202.1 | | | 166.0 | | | 0.9 | | | 0.8 | |
| Depreciation and amortization expenses | 808.4 | | | 753.9 | | | 3.5 | | | 3.7 | |
| General and administrative expenses | 303.3 | | | 300.0 | | | 1.3 | | | 1.5 | |
| Restructuring and impairments | 33.3 | | | 155.4 | | | 0.1 | | | 0.8 | |
| Total operating expenses | 18,884.3 | | | 16,188.6 | | | 80.8 | | | 79.2 | |
| | | | | | | |
| Operating income | $ | 4,486.5 | | | $ | 4,259.3 | | | 19.2 | % | | 20.8 | % |
| | | | | | | |
Revenues
North America total net revenues for fiscal 2022 increased $2.9 billion, or 14%, primarily due to a 12% increase in comparable store sales ($2.2 billion) driven by a 7% increase in average ticket and a 5% increase in transaction. Also contributing to these increases were the performance of net new company-operated store openings over the past 12 months ($628 million) and higher product and equipment sales to and royalty revenues from our licensees ($487 million), primarily due to business recovery from the impact of the COVID-19 pandemic. These increases were partially offset by the impact of the extra week in fiscal 2021 ($427 million).
Operating Margin
North America operating income for fiscal 2022 increased 5% to $4.5 billion, compared to $4.3 billion in fiscal 2021. Operating margin decreased 160 basis points to 19.2%, primarily due to investments and growth in labor, including enhanced retail store partner wages (approximately 350 basis points) as well as increased spend on new partner training and support costs (approximately 120 basis points). Also contributing were inflationary pressures on commodities and our supply chain (approximately 350 basis points). These were partially offset by strategic pricing (approximately 400 basis points) and sales leverage.
International | | | | | | | | | | | | | | | | | | | | | | | | | |
| Fiscal Year Ended | Oct 2,
2022 | | Oct 3,
2021 | | Oct 2,
2022 | | Oct 3,
2021 | | |
| | | | | As a % of International Total Net Revenues | | |
| Net revenues: | | | | | | | | | |
| Company-operated stores | $ | 5,361.9 | | | $ | 5,869.7 | | | 77.3 | % | | 84.8 | % | | |
| Licensed stores | 1,505.0 | | | 981.4 | | | 21.7 | | | 14.2 | | | |
| Other | 73.2 | | | 70.5 | | | 1.1 | | | 1.0 | | | |
| Total net revenues | 6,940.1 | | | 6,921.6 | | | 100.0 | | | 100.0 | | | |
| Product and distribution costs | 2,357.7 | | | 2,187.3 | | | 34.0 | | | 31.6 | | | |
| Store operating expenses | 2,701.8 | | | 2,571.4 | | | 38.9 | | | 37.2 | | | |
| Other operating expenses | 191.4 | | | 147.3 | | | 2.8 | | | 2.1 | | | |
| Depreciation and amortization expenses | 513.0 | | | 544.7 | | | 7.4 | | | 7.9 | | | |
| General and administrative expenses | 345.3 | | | 360.5 | | | 5.0 | | | 5.2 | | | |
| | | | | | | | | |
| Total operating expenses | 6,109.2 | | | 5,811.2 | | | 88.0 | | | 84.0 | | | |
| Income from equity investees | 2.3 | | | 135.3 | | | 0.0 | | | 2.0 | | | |
| Operating income | $ | 833.2 | | | $ | 1,245.7 | | | 12.0 | % | | 18.0 | % | | |
Revenues
International total net revenues for fiscal 2022 increased $19 million, or 0.3%, primarily due to higher product sales to and royalty revenues from our licensees ($435 million), mainly due to continuing business improvement from the COVID-19 pandemic. Additionally, there were 765 net new Starbucks company-operated stores, or a 11% increase over the past 12 months ($406 million). Also contributing to the increase was the conversion of our Korea market from a joint venture to a fully licensed market in the fourth quarter of fiscal 2021 ($187 million). These were partially offset by a 9% decline in comparable store sales ($459 million), driven by a 5% decrease in customer transactions and a 4% decrease in average ticket, primarily attributable to COVID-19 related restrictions in China and lapping the prior-year value-added-tax benefit in China, unfavorable foreign currency translation ($436 million) and the impact of the extra week in fiscal 2021 ($127 million).
Operating Margin
International operating income for fiscal 2022 decreased 33% to $833.2 million, compared to $1.2 billion in fiscal 2021. Operating margin decreased 600 basis points to 12.0%, primarily due to sales deleverage related to COVID-19 pandemic impacts in our China market (approximately 460 basis points), investments and growth in retail store partner wages and benefits (approximately 140 basis points), lower temporary government subsidies (approximately 100 basis points), higher commodity and supply chain costs due to inflationary pressures (approximately 90 basis points) and strategic initiatives (approximately 90 basis points). These decreases were partially offset by sales leverage across markets outside of China.
Channel Development | | | | | | | | | | | | | | | | | | | | | | | | | |
| Fiscal Year Ended | Oct 2,
2022 | | Oct 3,
2021 | | Oct 2,
2022 | | Oct 3,
2021 | | |
| | | | | As a % of Channel Development
Total Net Revenues | | |
| Net revenues | $ | 1,843.6 | | | $ | 1,593.6 | | | | | | | |
| Product and distribution costs | 1,194.2 | | | 1,011.2 | | | 64.8 | % | | 63.5 | % | | |
| Other operating expenses | 51.6 | | | 31.3 | | | 2.8 | | | 2.0 | | | |
| Depreciation and amortization expenses | 0.1 | | | 1.2 | | | 0.0 | | | 0.1 | | | |
| General and administrative expenses | 12.2 | | | 10.8 | | | 0.7 | | | 0.7 | | | |
| Total operating expenses | 1,258.1 | | | 1,054.5 | | | 68.2 | | | 66.2 | | | |
| Income from equity investees | 231.8 | | | 250.0 | | | 12.6 | | | 15.7 | | | |
| Operating income | $ | 817.3 | | | $ | 789.1 | | | 44.3 | % | | 49.5 | % | | |
Revenues
Channel Development total net revenues for fiscal 2022 increased $250 million, or 16%, compared to fiscal 2021, primarily due to higher Global Coffee Alliance product sales and royalty revenue ($216 million) and growth in our ready-to-drink business ($44 million). These increases were partially offset by the impact of the extra week in fiscal 2021 ($21 million).
Operating Margin
Channel Development operating income for fiscal 2022 increased 4% to $817 million, compared to $789 million in fiscal 2021. Operating margin decreased 520 basis points to 44.3%, primarily due to a decline in our North American Coffee Partnership joint venture income due to inflationary pressures and supply chain constraints (approximately 340 basis points) and business mix shift (approximately 170 basis points).
Corporate and Other | | | | | | | | | | | | | | | | | |
| Fiscal Year Ended | Oct 2,
2022 | | Oct 3,
2021 | | %
Change |
| Net revenues: | | | | | |
| | | | | |
| | | | | |
| Other | $ | 95.8 | | | $ | 97.5 | | | (1.7) | % |
| Total net revenues | 95.8 | | | 97.5 | | | (1.7) | |
| Product and distribution costs | 88.3 | | | 86.4 | | | 2.2 | |
| | | | | |
| Other operating expenses | 16.4 | | | 14.9 | | | 10.1 | |
| Depreciation and amortization expenses | 126.4 | | | 141.9 | | | (10.9) | |
| General and administrative expenses | 1,371.2 | | | 1,261.3 | | | 8.7 | |
| Restructuring and impairments | 12.7 | | | 15.0 | | | (15.3) | |
| Total operating expenses | 1,615.0 | | | 1,519.5 | | | 6.3 | |
| | | | | |
| Operating loss | $ | (1,519.2) | | | $ | (1,422.0) | | | 6.8 | % |
Corporate and Other primarily consists of our unallocated corporate expenses and Evolution Fresh. Unallocated corporate expenses include corporate administrative functions that support the operating segments but are not specifically attributable to or managed by any segment and are not included in the reported financial results of the operating segments. In the fourth quarter of fiscal 2022, we sold our Evolution Fresh brand and business.
Corporate and Other operating loss increased to $1.5 billion for fiscal 2022, or 7%, compared to $1.4 billion in fiscal 2021. This increase was primarily driven by incremental investments in technology ($84 million), increased support costs to address labor market conditions ($36 million) and increased partner wages and benefits ($31 million). These increases were partially offset by lower performance-based compensation ($62 million).
FINANCIAL CONDITION, LIQUIDITY AND CAPITAL RESOURCES
Cash and Investment Overview
Our cash and investments were $3.5 billion and $6.9 billion as of October 2, 2022 and October 3, 2021, respectively. We actively manage our cash and investments in order to internally fund operating needs, make scheduled interest and principal payments on our borrowings, make acquisitions and return cash to shareholders through common stock cash dividend payments and share repurchases. Our investment portfolio primarily includes highly liquid available-for-sale securities, including corporate debt securities, government treasury securities (domestic and foreign) and commercial paper as well as principal-protected structured deposits. As of October 2, 2022, approximately $2.7 billion of cash and short-term investments were held in foreign subsidiaries.
Borrowing capacity
Credit Facilities and Commercial Paper
Our total contractual borrowing capacity for general corporate purposes was $2.8 billion as of the end of fiscal 2022.
Revolving Lines of Credit
Our $3.0 billion unsecured 5-year revolving credit facility (the “2021 credit facility”), of which $150 million may be used for issuances of letters of credit, is currently set to mature on September 16, 2026. The 2021 credit facility is available for working capital, capital expenditures and other corporate purposes, including acquisitions and share repurchases. We have the option, subject to negotiation and agreement with the related banks, to increase the maximum commitment amount by an additional $1.0 billion. Borrowings under the credit facility will bear interest at a variable rate based on LIBOR, and, for U.S. dollar-denominated loans under certain circumstances, a Base Rate (as defined in the credit facility), in each case plus an applicable margin. The applicable margin is based on the Company’s long-term credit ratings assigned by Moody’s and Standard & Poor’s rating agencies. The 2021 credit facility contains alternative interest rate provisions specifying rate calculations to be used at such time LIBOR ceases to be available as a benchmark due to reference rate reform. The “Base Rate” of interest is the highest of (i) the Federal Funds Rate plus 0.500%, (ii) Bank of America’s prime rate, and (iii) the Eurocurrency Rate (as defined in the credit facility) plus 1.000%. As of October 2, 2022, we had no borrowings under the 2021 credit facility.
Commercial Paper
Under our commercial paper program, we may issue unsecured commercial paper notes up to a maximum aggregate amount outstanding at any time of $3.0 billion, with individual maturities that may vary but not exceed 397 days from the date of issue. Amounts outstanding under the commercial paper program are required to be backstopped by available commitments under the
2021 credit facility discussed above. The proceeds from borrowings under our commercial paper program may be used for working capital needs, capital expenditures and other corporate purposes, including, but not limited to, business expansion, payment of cash dividends on our common stock and share repurchases. As of October 2, 2022, we had $175.0 million outstanding under our commercial paper program.
Credit Facilities in Japan
Additionally, we hold Japanese yen-denominated credit facilities which are available for working capital needs and capital expenditures within our Japanese market.
•A ¥5 billion, or $34.6 million, facility is currently set to mature on December 31, 2022. Borrowings under the credit facility are subject to terms defined within the facility and will bear interest at a variable rate based on TIBOR plus an applicable margin of 0.400%.
•A ¥10 billion, or $69.2 million, facility is currently set to mature on March 27, 2023. Borrowings under the credit facility are subject to terms defined within the facility and will bear interest at a variable rate based on TIBOR plus 0.350%.
As of October 2, 2022, we had no borrowings outstanding under these credit facilities.
See Note 9, Debt, to the consolidated financial statements included in Item 8 of Part II of this 10-K for details of the components of our long-term debt. Our ability to incur new liens and conduct sale and leaseback transactions on certain material properties is subject to compliance with terms of the indentures under which the long-term notes were issued. As of October 2, 2022, we were in compliance with all applicable covenants.
Use of Cash
We expect to use our available cash and investments, including, but not limited to, additional potential future borrowings under the credit facilities, commercial paper program and the issuance of debt to support and invest in our core businesses, including investing in new ways to serve our customers and supporting our store partners, repaying maturing debts, as well as returning cash to shareholders through common stock cash dividend payments and discretionary share repurchases and investing in new business opportunities related to our core and developing businesses. Further, we may use our available cash resources to make proportionate capital contributions to our investees. We may also seek strategic acquisitions to leverage existing capabilities and further build our business. Acquisitions may include increasing our ownership interests in our investees. Any decisions to increase such ownership interests will be driven by valuation and fit with our ownership strategy.
We believe that net future cash flows generated from operations and existing cash and investments both domestically and internationally, combined with our ability to leverage our balance sheet through the issuance of debt, will be sufficient to finance capital requirements for our core businesses as well as shareholder distributions for at least the next 12 months. We are currently not aware of any trends or demands, commitments, events or uncertainties that will result in, or that are reasonably likely to result in, our liquidity increasing or decreasing in any material way that will impact our capital needs during or beyond the next 12 months.
We regularly review our cash positions and our determination of partial indefinite reinvestment of foreign earnings. In the event we determine that all or another portion of such foreign earnings are no longer indefinitely reinvested, we may be subject to additional foreign withholding taxes and U.S. state income taxes, which could be material. We currently do not anticipate the need for repatriated funds to the U.S. to satisfy domestic liquidity needs. See Note 14, Income Taxes, for further discussion. During each of the first three quarters of fiscal 2021, we declared a cash dividend to shareholders of $0.45 per share. During the fourth quarter of fiscal 2021, and for each of the first three quarters of fiscal 2022, we declared a cash dividend of $0.49 per share. Dividends are generally paid in the quarter following the declaration date. Cash returned to shareholders through dividends in fiscal 2022 and 2021 totaled $2.3 billion and $2.1 billion, respectively. During the fourth quarter of fiscal 2022, we declared a cash dividend of $0.53 per share to be paid on November 25, 2022, with an expected payout of approximately $608.3 million.
During the first quarter of fiscal 2022, we resumed our share repurchase program which had been temporarily suspended in March 2020. During the fiscal year ended October 2, 2022, we repurchased 36.3 million shares of common stock for $4.0 billion on the open market. On March 15, 2022, we announced that our Board authorized the repurchase of up to an additional 40 million shares under our ongoing share repurchase program. On April 4, 2022, we announced a temporary suspension of our share repurchase program to allow us to augment investments in our stores and partners. Repurchases pursuant to this program were last made on April 1, 2022. As of October 2, 2022, 52.6 million shares remained available for repurchase under current authorizations. We have resumed our share repurchase program in the first quarter of fiscal 2023.
Other than operating expenses, cash requirements for fiscal 2023 are expected to consist primarily of capital expenditures for investments in our new and existing stores, our supply chain and corporate facilities. Total capital expenditures for fiscal 2023 are expected to be approximately $2.5 billion.
The following table summarizes current and long-term material cash requirements as of October 2, 2022, which we expect to fund primarily with operating cash flows (in millions): | | | | | | | | | | | | | | | | | | | | | | | | | | | | | |
| | Material Cash Requirements |
| Total | | Less than 1 Year | | 1 - 3 Years | | 3 - 5 Years | | More than 5 Years |
Operating lease obligations(1) | $ | 9,863.7 | | | $ | 1,473.5 | | | $ | 2,729.2 | | | $ | 2,121.4 | | | $ | 3,539.6 | |
| | | | | | | | | |
| Debt obligations | | | | | | | | | |
| Principal payments | 15,038.4 | | | 1,000.0 | | | 3,088.4 | | | 1,000.0 | | | 9,950.0 | |
| Interest payments | 6,499.8 | | | 487.3 | | | 865.2 | | | 725.3 | | | 4,422.0 | |
Purchase obligations(2) | 1,354.5 | | | 1,030.1 | | | 324.4 | | | — | | | — | |
Other obligations(3) | 401.6 | | | 125.0 | | | 118.7 | | | 84.6 | | | 73.3 | |
| Total | $ | 33,158.0 | | | $ | 4,115.9 | | | $ | 7,125.9 | | | $ | 3,931.3 | | | $ | 17,984.9 | |
(1)Amounts include direct lease obligations, excluding any taxes, insurance and other related expenses.
(2)Purchase obligations include agreements to purchase goods or services that are enforceable and legally binding on Starbucks and that specify all significant terms. Green coffee purchase commitments comprise 99% of total purchase obligations.
(3)Other obligations include other long-term liabilities primarily consisting of long-term income taxes payable, asset retirement obligations and equity investment capital commitments.
Cash Flows
Cash provided by operating activities was $4.4 billion for fiscal 2022, compared to $6.0 billion for fiscal 2021. The change was primarily due to lower net earnings and an increase in inventory purchases and timing of income tax payments.
Cash used in investing activities totaled $2.1 billion for fiscal 2022, compared to $0.3 billion for fiscal 2021. The change was primarily driven by lapping the net proceeds from the divestiture of our ownership interest in our South Korea joint venture and an increase in spend on capital expenditures.
Cash used in financing activities for fiscal 2022 totaled $5.6 billion, compared to cash provided by financing activities of $3.7 billion for fiscal 2021. The change was primarily due to resuming our share repurchase program, partially offset by net proceeds from issuance of long-term debt.
COMMODITY PRICES, AVAILABILITY AND GENERAL RISK CONDITIONS
Commodity price risk represents Starbucks primary market risk, generated by our purchases of green coffee and dairy products, among other items. We purchase, roast and sell high-quality arabica coffee and related products and risk arises from the price volatility of green coffee. In addition to coffee, we also purchase significant amounts of dairy products to support the needs of our company-operated stores. The price and availability of these commodities directly impacts our results of operations, and we expect commodity prices, particularly coffee, to impact future results of operations. For additional details see Product Supply in Item 1, as well as Risk Factors in Item 1A of this 10-K. FINANCIAL RISK MANAGEMENT
Market risk is defined as the risk of losses due to changes in commodity prices, foreign currency exchange rates, equity security prices and interest rates. We manage our exposure to various market-based risks according to a market price risk management policy. Under this policy, market-based risks are quantified and evaluated for potential mitigation strategies, such as entering into hedging transactions. The market price risk management policy governs how hedging instruments may be used to mitigate risk. Risk limits are set annually and speculative trading activities are prohibited. We also monitor and limit the amount of associated counterparty credit risk, which we consider to be low. We use interest rate swap agreements and treasury locks to primarily hedge against changes in benchmark interest rates related to anticipated debt issuances. We also use cross-currency swaps and foreign exchange debt instruments to hedge against changes in the fair value of our fixed-rate debt and foreign exchange exposure of net investments in Japan. Excluding interest rate hedging instruments, cross currency swaps and foreign currency debt, hedging instruments generally do not have maturities in excess of three years. Refer to Note 1, Summary of Significant Accounting Policies and Estimates, and Note 3, Derivative Financial Instruments, to the consolidated financial statements included in Item 8 of Part II of this 10-K for further discussion of our hedging instruments.
The sensitivity analyses disclosed below provide only a limited, point-in-time view of the market risk of the financial instruments discussed. The actual impact of the respective underlying rates and price changes on the financial instruments may differ significantly from those shown in the sensitivity analyses.
Commodity Price Risk
We purchase commodity inputs, primarily coffee, dairy products, diesel, cocoa, sugar and other commodities, that are used in our operations and are subject to price fluctuations that impact our financial results. We use a combination of pricing features embedded within supply contracts, such as fixed-price and price-to-be-fixed contracts for coffee purchases, and financial derivatives to manage our commodity price risk exposure.
The following table summarizes the potential impact as of October 2, 2022 to Starbucks future net earnings and other comprehensive income (“OCI”) from changes in commodity prices. The information provided below relates only to the hedging instruments and does not represent the corresponding changes in the underlying hedged items (in millions): | | | | | | | | | | | | | | | | | | | | | | | |
| | Increase/(Decrease) to Net Earnings | | Increase/(Decrease) to OCI |
| | 10% Increase in Underlying Rate | | 10% Decrease in
Underlying Rate | | 10% Increase in
Underlying Rate | | 10% Decrease in
Underlying Rate |
| Commodity hedges | $ | 3.0 | | | $ | (3.0) | | | $ | 74 | | | $ | (74) | |
Foreign Currency Exchange Risk
The majority of our revenue, expense and capital purchasing activities are transacted in U.S. dollars. However, because a portion of our operations consists of activities outside of the U.S., we have transactions in other currencies, primarily the Chinese renminbi, Japanese yen, Canadian dollar, British pound, South Korean won and euro. To reduce cash flow volatility from foreign currency fluctuations, we enter into derivative instruments to hedge portions of cash flows of anticipated intercompany royalty payments, inventory purchases, intercompany borrowing and lending activities and certain other transactions in currencies other than the functional currency of the entity that enters into the arrangements, as well as the translation risk of certain balance sheet items. The volatility in the foreign exchange market may lead to significant fluctuation in foreign currency exchange rates and adversely impact our financial results in the case of weakening foreign currencies relative to the U.S. dollar.
The following table summarizes the potential impact as of October 2, 2022 to Starbucks future net earnings and other comprehensive income from changes in the fair value of these derivative financial instruments due to a change in the value of the U.S. dollar as compared to foreign exchange rates. The information provided below relates only to the hedging instruments and does not represent the corresponding changes in the underlying hedged items (in millions): | | | | | | | | | | | | | | | | | | | | | | | |
| | Increase/(Decrease) to Net Earnings | | Increase/(Decrease) to OCI |
| | 10% Increase in
Underlying Rate | | 10% Decrease in
Underlying Rate | | 10% Increase in
Underlying Rate | | 10% Decrease in
Underlying Rate |
| Foreign currency hedges | $ | 46 | | | $ | (46) | | | $ | 155 | | | $ | (155) | |
Equity Security Price Risk
We have minimal exposure to price fluctuations on equity mutual funds and equity exchange-traded funds within our marketable equity securities portfolio. Marketable equity securities are recorded at fair value and approximates a portion of our liability under our Management Deferred Compensation Plan (“MDCP”). Gains and losses from the portfolio and the change in our MDCP liability are recorded in our consolidated statements of earnings.
We performed a sensitivity analysis based on a 10% change in the underlying equity prices of our investments as of October 2, 2022 and determined that such a change would not have a significant impact on the fair value of these instruments.
Interest Rate Risk
Long-term Debt
We utilize short-term and long-term financing and may use interest rate hedges to manage our overall interest expense related to our existing fixed-rate debt, as well as to hedge the variability in cash flows due to changes in benchmark interest rates related to anticipated debt issuances. See Note 3, Derivative Financial Instruments and Note 9, Debt, to the consolidated financial statements included in Item 8 of Part II of this 10-K for further discussion of our interest rate hedge agreements and details of the components of our long-term debt, respectively, as of October 2, 2022. The following table summarizes the impact of a change in interest rates as of October 2, 2022 on the fair value of Starbucks debt (in millions): | | | | | | | | | | | | | | | | | |
| | | Change in Fair Value |
| Fair Value | | 100 Basis Point Increase in Underlying Rate | | 100 Basis Point Decrease in Underlying Rate |
| |
Long-term debt(1) | $ | 13,052 | | | $ | 1,100 | | | $ | (1,100) | |
(1)Amount disclosed is net of $28 million change in the fair value of our designated interest rate swap. Refer to Note 3, Derivative Financial Instruments, for additional information on our interest rate swap designated as a fair value hedge. Available-for-Sale Debt Securities
Our available-for-sale securities comprise a diversified portfolio consisting mainly of investment-grade debt securities. The primary objective of these investments is to preserve capital and liquidity. Available-for-sale securities are recorded on the consolidated balance sheets at fair value with unrealized gains and losses reported as a component of accumulated other comprehensive income. We do not hedge the interest rate exposure on our investments. We performed a sensitivity analysis based on a 100 basis point change in the underlying interest rate of our available-for-sale securities as of October 2, 2022 and determined that such a change would not have a significant impact on the fair value of these instruments.
CRITICAL ACCOUNTING ESTIMATES
Critical accounting estimates are those that management believes are the most important to the portrayal of our financial condition and results and require the most difficult, subjective or complex judgments, often as a result of the need to make estimates about the effect of matters that are inherently uncertain, especially in light of the current economic environment due to the COVID-19 pandemic. Judgments and uncertainties may result in materially different amounts being reported under different conditions or using different assumptions.
Our significant accounting estimates are discussed in additional detail in Note 1, Summary of Significant Accounting Policies and Estimates, to the consolidated financial statements included in Item 8 of Part II of this 10-K. We consider financial reporting and disclosure practices and accounting policies quarterly to ensure that they provide accurate and transparent information relative to the current economic and business environment. During the past five fiscal years, we have not made any material changes to the accounting methodologies used to assess the areas discussed below, unless noted otherwise. We believe that our significant accounting estimates involve a higher degree of judgment and/or complexity for the reasons discussed below:
Property, Plant and Equipment and Other Finite-Lived Assets
We evaluate property, plant and equipment, operating lease right-of-use (“ROU”) assets and other finite-lived assets for impairment when facts and circumstances indicate that the carrying values of such assets may not be recoverable. When evaluating for impairment, we first compare the carrying value of the asset to the asset’s estimated future undiscounted cash flows. If the estimated undiscounted future cash flows are less than the carrying value of the asset, we determine if we have an impairment loss by comparing the carrying value of the asset to the asset's estimated fair value and recognize an impairment charge when the asset’s carrying value exceeds its estimated fair value. The adjusted carrying amount of the asset becomes its new cost basis and is depreciated over the asset's remaining useful life.
Long-lived assets are grouped with other assets and liabilities at the lowest level for which identifiable cash flows are largely independent of the cash flows of other assets and liabilities. For company-operated store assets, the impairment test is performed at the individual store asset group level, which is inclusive of property, plant and equipment and lease ROU assets. The fair value of a store’s assets is estimated using a discounted cash flow model. For other long-lived assets, fair value is determined using an approach that is appropriate based on the relevant facts and circumstances, which may include discounted cash flows, comparable transactions or comparable company analyses.
Our impairment calculations contain uncertainties because they require management to make assumptions and to apply judgment to estimate future cash flows and asset fair values. Key assumptions used in estimating future cash flows and asset fair values include projected revenue growth and operating expenses, as well as forecasting asset useful lives and selecting an appropriate discount rate. For company-operated stores, estimates of revenue growth and operating expenses are based on internal projections and consider the store’s historical performance, the local market economics and the business environment impacting the store’s performance. The discount rate is selected based on what we believe a buyer would assume when determining a purchase price for the store. The fair value of a store’s ROU asset is estimated considering what a market participant would pay to lease the asset for its highest and best use. These estimates are subjective and our ability to realize future cash flows and asset fair values is affected by factors such as ongoing maintenance and improvement of the assets, changes in economic conditions and changes in operating performance.
In fiscal 2022, we announced our Reinvention Plan in the U.S. market to increase efficiency while elevating the partner and customer experience. As a result of the restructuring efforts in connection with the Reinvention Plan, we recorded an immaterial impairment charge on our consolidated statements of earnings during the fiscal year ended October 2, 2022. Future impairment charges attributed to our Reinvention Plan are not expected to be material.
In fiscal 2021, we substantially completed our plan to reposition our North America store portfolio, primarily in dense metropolitan markets by pursuing strategic store closures and focusing on new store formats that better cater to changing customer tastes and preferences. During fiscal year 2021, we recorded approximately $155.4 million to restructuring and impairments on our consolidated statements of earnings. These totals included $53.1 million related to disposal and impairment of company-operated store assets and $89.5 million primarily associated with accelerated amortization of ROU lease assets and other lease costs due to store closures prior to the end of contractual lease terms. As this restructuring plan was substantially completed in fiscal 2021, we did not recognize any material restructuring and impairment amounts related to this plan during the fiscal year ended October 2, 2022.
Asset impairment charges are discussed in Note 1, Summary of Significant Accounting Policies and Estimates, to the consolidated financial statements included in Item 8 of Part II of this 10-K. Goodwill and Indefinite-Lived Intangible Assets
We evaluate goodwill and indefinite-lived intangible assets for impairment annually during our third fiscal quarter, or more frequently if an event occurs or circumstances change that would indicate impairment may exist. When evaluating these assets for impairment, we may first perform a qualitative assessment to determine whether it is more likely than not that a reporting unit is impaired. If we do not perform a qualitative assessment, or if we determine that it is not more likely than not that the fair value of the reporting unit exceeds its carrying amount, we calculate the estimated fair value of the reporting unit using discounted cash flows or a combination of discounted cash flow and market approaches.
When assessing goodwill for impairment, our decision to perform a qualitative impairment assessment for an individual reporting unit is influenced by a number of factors, inclusive of the carrying value of the reporting unit’s goodwill, the significance of the excess of the reporting unit’s estimated fair value over carrying value at the last quantitative assessment date, the amount of time in between quantitative fair value assessments and the date of acquisition. If we perform a quantitative assessment of an individual reporting unit’s goodwill, our impairment calculations contain uncertainties because they require management to make assumptions and to apply judgment when estimating future cash flows and asset fair values, including projected revenue growth and operating expenses related to existing businesses, product innovation and new store concepts, as well as utilizing valuation multiples of similar publicly traded companies and selecting an appropriate discount rate. Estimates of revenue growth and operating expenses are based on internal projections considering the reporting unit’s past performance
and forecasted growth, including assumptions regarding business recovery post COVID-19, strategic initiatives, local market economics and the local business environment impacting the reporting unit’s performance. The discount rate is selected based on the estimated cost of capital for a market participant to operate the reporting unit in the region. These estimates, as well as the selection of comparable companies and valuation multiples used in the market approaches are highly subjective, and our ability to realize the future cash flows used in our fair value calculations is affected by factors such as the success of strategic initiatives, changes in economic conditions, changes in our operating performance and changes in our business strategies, including retail initiatives and international expansion. Our goodwill impairment assessments were not significantly altered as a result of the COVID-19 pandemic. We continue to believe the fair value of each of our reporting units is significantly in excess of its carrying value, and absent a sustained multi-year global decline in our business in key markets such as the U.S. and China, we do not anticipate incurring significant goodwill impairment in the next 12 months. Our fiscal 2022 annual goodwill impairment testing, which was completed in the third fiscal quarter, resulted in an estimated fair value of our reporting units where a quantitative assessment was performed, was in excess of carrying value of approximately $95 billion for the business units where a quantitative analysis on impairment was performed. When assessing indefinite-lived intangible assets for impairment, where we perform a qualitative assessment, we evaluate if changes in events or circumstances have occurred that indicate that impairment may exist. If we do not perform a qualitative impairment assessment or if changes in events and circumstances indicate that a quantitative assessment should be performed, management is required to calculate the fair value of the intangible asset group. The fair value calculation includes estimates of revenue growth, which are based on past performance and internal projections for the intangible asset group’s forecasted growth, including assumptions regarding business recovery post COVID-19, and royalty rates, which are adjusted for our particular facts and circumstances. The discount rate is selected based on the estimated cost of capital that reflects the risk profile of the related business. These estimates are highly subjective, and our ability to achieve the forecasted cash flows used in our fair value calculations is affected by factors such as the success of strategic initiatives, changes in economic conditions, changes in our operating performance and changes in our business strategies, including retail initiatives and international expansion. We do not anticipate recording significant impairment charges in the next 12 months.
Definite-lived intangible asset impairment charges are discussed in Note 8, Other Intangible Assets and Goodwill, to the consolidated financial statements included in Item 8 of Part II of this 10-K. Income Taxes
We recognize deferred tax assets and liabilities based on the differences between the financial statement carrying amounts and the respective tax bases of our assets and liabilities. Deferred tax assets and liabilities are measured using current enacted tax rates expected to apply to taxable income in the years in which we expect the temporary differences to reverse. We routinely evaluate the likelihood of realizing the benefit of our deferred tax assets and may record a valuation allowance if, based on all available evidence, we determine that some portion of the tax benefit will not be realized.
In evaluating our ability to recover our deferred tax assets within the jurisdiction from which they arise, we consider all available positive and negative evidence, including scheduled reversals of deferred tax liabilities, projected future taxable income, tax-planning strategies and results of operations. In projecting future taxable income, we consider historical results and incorporate assumptions about the amount of future state, federal and foreign pre-tax operating income adjusted for items that do not have tax consequences. Our assumptions regarding future taxable income are consistent with the plans and estimates we use to manage our underlying businesses. In evaluating the objective evidence that historical results provide, we consider three years of cumulative operating income/(loss).
In addition, our income tax returns are periodically audited by domestic and foreign tax authorities. These audits include review of our tax filing positions, such as the timing and amount of deductions taken and the allocation of income between tax jurisdictions. We evaluate our exposures associated with our various tax filing positions and recognize a tax benefit only if it is more likely than not that the tax position will be sustained upon examination by the relevant taxing authorities, including resolutions of any related appeals or litigation processes, based on the technical merits of our position. The tax benefits recognized in the financial statements from such a position are measured based on the largest benefit that has a greater than 50% likelihood of being realized upon ultimate settlement. For uncertain tax positions that do not meet this threshold, we record a related liability. We adjust our unrecognized tax benefit liability and income tax expense in the period in which the uncertain tax position is effectively settled, the statute of limitations expires for the relevant taxing authority to examine the tax position or when new information becomes available. As discussed in Note 14, Income Taxes, to the consolidated financial statements included in Item 8 of Part II of this 10-K, we do not expect a significant amount of the Company’s gross unrecognized tax benefits to be recognized by the end of fiscal 2023 for reasons such as a lapse of the statute of limitations or resolution of examinations with tax authorities. We have generated income in certain foreign jurisdictions that may be subject to additional foreign withholding taxes and U.S. state income taxes. We regularly review our plans for reinvestment or repatriation of unremitted foreign earnings. The possibility exists that foreign earnings declared as indefinitely reinvested may be repatriated as our plans are based on our estimated working and other capital needs in jurisdictions where our earnings are generated. While we do not expect to
repatriate cash to the U.S. to satisfy domestic liquidity needs, if these amounts were distributed to the U.S., in the form of dividends or otherwise, we may be subject to additional foreign withholding taxes and U.S. state income taxes, which could be material.
Our income tax expense, deferred tax assets and liabilities for unrecognized tax benefits reflect management’s best assessment of estimated current and future taxes to be paid. Deferred tax asset valuation allowances and our liabilities for unrecognized tax benefits require significant management judgment regarding applicable statutes and their related interpretation, the status of various income tax audits and our particular facts and circumstances. Although we believe that the judgments and estimates discussed herein are reasonable, actual results, including forecasted business performance, could differ, and we may be exposed to losses or gains that could be material. To the extent we prevail in matters for which a liability has been established or are required to pay amounts in excess of our established liability, our effective income tax rate in a given financial statement period could be materially affected.
RECENT ACCOUNTING PRONOUNCEMENTS
See Note 1, Summary of Significant Accounting Policies and Estimates, to the consolidated financial statements included in Item 8 of Part II of this 10-K for a detailed description of recent accounting pronouncements. Item 7A. Quantitative and Qualitative Disclosures About Market Risk
The information required by this item is incorporated by reference to the section entitled “Management’s Discussion and Analysis of Financial Condition and Results of Operations — Commodity Prices, Availability and General Risk Conditions” and “Management’s Discussion and Analysis of Financial Condition and Results of Operations — Financial Risk Management” in Item 7 of this Report.
Item 8. Financial Statements and Supplementary Data
STARBUCKS CORPORATION
CONSOLIDATED STATEMENTS OF EARNINGS
(in millions, except per share data)
| | | | | | | | | | | | | | | | | |
| Fiscal Year Ended | Oct 2,
2022 | | Oct 3,
2021 | | Sep 27,
2020 |
| Net revenues: | | | | | |
| Company-operated stores | $ | 26,576.1 | | | $ | 24,607.0 | | | $ | 19,164.6 | |
| Licensed stores | 3,655.5 | | | 2,683.6 | | | 2,327.1 | |
| Other | 2,018.7 | | | 1,770.0 | | | 2,026.3 | |
| Total net revenues | 32,250.3 | | | 29,060.6 | | | 23,518.0 | |
| Product and distribution costs | 10,317.4 | | | 8,738.7 | | | 7,694.9 | |
| Store operating expenses | 13,561.8 | | | 11,930.9 | | | 10,764.0 | |
| Other operating expenses | 461.5 | | | 359.5 | | | 430.3 | |
| Depreciation and amortization expenses | 1,447.9 | | | 1,441.7 | | | 1,431.3 | |
| General and administrative expenses | 2,032.0 | | | 1,932.6 | | | 1,679.6 | |
| Restructuring and impairments | 46.0 | | | 170.4 | | | 278.7 | |
| Total operating expenses | 27,866.6 | | | 24,573.8 | | | 22,278.8 | |
| Income from equity investees | 234.1 | | | 385.3 | | | 322.5 | |
| Operating income | 4,617.8 | | | 4,872.1 | | | 1,561.7 | |
| | | | | |
| Net gain resulting from divestiture of certain operations | — | | | 864.5 | | | — | |
| | | | | |
| Interest income and other, net | 97.0 | | | 90.1 | | | 39.7 | |
| Interest expense | (482.9) | | | (469.8) | | | (437.0) | |
| Earnings before income taxes | 4,231.9 | | | 5,356.9 | | | 1,164.4 | |
| Income tax expense | 948.5 | | | 1,156.6 | | | 239.7 | |
| Net earnings including noncontrolling interests | 3,283.4 | | | 4,200.3 | | | 924.7 | |
| Net earnings/(loss) attributable to noncontrolling interests | 1.8 | | | 1.0 | | | (3.6) | |
| Net earnings attributable to Starbucks | $ | 3,281.6 | | | $ | 4,199.3 | | | $ | 928.3 | |
| Earnings per share — basic | $ | 2.85 | | | $ | 3.57 | | | $ | 0.79 | |
| Earnings per share — diluted | $ | 2.83 | | | $ | 3.54 | | | $ | 0.79 | |
| Weighted average shares outstanding: | | | | | |
| Basic | 1,153.3 | | | 1,177.6 | | | 1,172.8 | |
| Diluted | 1,158.5 | | | 1,185.5 | | | 1,181.8 | |
See Notes to Consolidated Financial Statements.
STARBUCKS CORPORATION
CONSOLIDATED STATEMENTS OF COMPREHENSIVE INCOME
(in millions)
| | | | | | | | | | | | | | | | | |
| Fiscal Year Ended | Oct 2,
2022 | | Oct 3,
2021 | | Sep 27,
2020 |
| Net earnings including noncontrolling interests | $ | 3,283.4 | | | $ | 4,200.3 | | | $ | 924.7 | |
| Other comprehensive income/(loss), net of tax: | | | | | |
| Unrealized holding gains/(losses) on available-for-sale securities | (22.8) | | | (3.4) | | | 8.3 | |
| Tax benefit/(expense) | 5.6 | | | 0.7 | | | (1.8) | |
| Unrealized gains/(losses) on cash flow hedging instruments | 259.5 | | | 283.8 | | | (126.3) | |
| Tax (expense)/benefit | (52.8) | | | (43.6) | | | 31.3 | |
| Unrealized gains/(losses) on net investment hedging instruments | 229.0 | | | 63.1 | | | 38.7 | |
| Tax (expense) | (57.9) | | | (16.0) | | | (9.8) | |
| Translation adjustment and other | (794.7) | | | 188.2 | | | 206.9 | |
| Tax benefit | — | | | 2.2 | | | 1.5 | |
| Reclassification adjustment for net (gains)/losses realized in net earnings for available-for-sale securities, hedging instruments, translation adjustment and other | (210.5) | | | 41.8 | | | (20.1) | |
| Tax expense/(benefit) | 34.2 | | | (5.0) | | | 5.2 | |
| Other comprehensive income/(loss) | (610.4) | | | 511.8 | | | 133.9 | |
| Comprehensive income including noncontrolling interests | 2,673.0 | | | 4,712.1 | | | 1,058.6 | |
| Comprehensive income/(loss) attributable to noncontrolling interests | 1.8 | | | 1.0 | | | (3.6) | |
| Comprehensive income attributable to Starbucks | $ | 2,671.2 | | | $ | 4,711.1 | | | $ | 1,062.2 | |
See Notes to Consolidated Financial Statements.
STARBUCKS CORPORATION
CONSOLIDATED BALANCE SHEETS
(in millions, except per share data)
| | | | | | | | | | | |
| Oct 2,
2022 | | Oct 3,
2021 |
| ASSETS | | | |
| Current assets: | | | |
| Cash and cash equivalents | $ | 2,818.4 | | | $ | 6,455.7 | |
| Short-term investments | 364.5 | | | 162.2 | |
| Accounts receivable, net | 1,175.5 | | | 940.0 | |
| Inventories | 2,176.6 | | | 1,603.9 | |
| Prepaid expenses and other current assets | 483.7 | | | 594.6 | |
| Total current assets | 7,018.7 | | | 9,756.4 | |
| Long-term investments | 279.1 | | | 281.7 | |
| Equity investments | 311.2 | | | 268.5 | |
| Property, plant and equipment, net | 6,560.5 | | | 6,369.5 | |
| Operating lease, right-of-use asset | 8,015.6 | | | 8,236.0 | |
| Deferred income taxes, net | 1,799.7 | | | 1,874.8 | |
| Other long-term assets | 554.2 | | | 578.5 | |
| Other intangible assets | 155.9 | | | 349.9 | |
| Goodwill | 3,283.5 | | | 3,677.3 | |
| TOTAL ASSETS | $ | 27,978.4 | | | $ | 31,392.6 | |
| LIABILITIES AND SHAREHOLDERS' EQUITY/(DEFICIT) | | | |
| Current liabilities: | | | |
| Accounts payable | $ | 1,441.4 | | | $ | 1,211.6 | |
| Accrued liabilities | 2,137.1 | | | 2,321.2 | |
| Accrued payroll and benefits | 761.7 | | | 772.3 | |
| | | |
| Current portion of operating lease liability | 1,245.7 | | | 1,251.3 | |
| Stored value card liability and current portion of deferred revenue | 1,641.9 | | | 1,596.1 | |
| Short-term debt | 175.0 | | | — | |
| Current portion of long-term debt | 1,749.0 | | | 998.9 | |
| Total current liabilities | 9,151.8 | | | 8,151.4 | |
| Long-term debt | 13,119.9 | | | 13,616.9 | |
| Operating lease liability | 7,515.2 | | | 7,738.0 | |
| Deferred revenue | 6,279.7 | | | 6,463.0 | |
| Other long-term liabilities | 610.5 | | | 737.8 | |
| Total liabilities | 36,677.1 | | | 36,707.1 | |
| Shareholders’ deficit: | | | |
Common stock ($0.001 par value) — authorized, 2,400.0 shares; issued and outstanding, 1,147.9 and 1,180.0 shares, respectively | 1.1 | | | 1.2 | |
| Additional paid-in capital | 205.3 | | | 846.1 | |
| Retained deficit | (8,449.8) | | | (6,315.7) | |
| Accumulated other comprehensive income/(loss) | (463.2) | | | 147.2 | |
| Total shareholders’ deficit | (8,706.6) | | | (5,321.2) | |
| Noncontrolling interests | 7.9 | | | 6.7 | |
| Total deficit | (8,698.7) | | | (5,314.5) | |
TOTAL LIABILITIES AND SHAREHOLDERS’ EQUITY/(DEFICIT) | $ | 27,978.4 | | | $ | 31,392.6 | |
See Notes to Consolidated Financial Statements.
STARBUCKS CORPORATION
CONSOLIDATED STATEMENTS OF CASH FLOWS
(in millions) | | | | | | | | | | | | | | | | | |
| Fiscal Year Ended | Oct 2,
2022 | | Oct 3,
2021 | | Sep 27,
2020 |
| OPERATING ACTIVITIES: | | | | | |
| Net earnings including noncontrolling interests | $ | 3,283.4 | | | $ | 4,200.3 | | | $ | 924.7 | |
| Adjustments to reconcile net earnings to net cash provided by operating activities: | | | | | |
| Depreciation and amortization | 1,529.4 | | | 1,524.1 | | | 1,503.2 | |
| Deferred income taxes, net | (37.8) | | | (146.2) | | | (25.8) | |
| Income earned from equity method investees | (268.7) | | | (347.3) | | | (280.7) | |
| Distributions received from equity method investees | 231.2 | | | 336.0 | | | 227.7 | |
| | | | | |
| Net gain resulting from divestiture of certain operations | — | | | (864.5) | | | — | |
| | | | | |
| Stock-based compensation | 271.5 | | | 319.1 | | | 248.6 | |
| | | | | |
| Non-cash lease cost | 1,497.7 | | | 1,248.6 | | | 1,197.6 | |
| Loss on retirement and impairment of assets | 91.4 | | | 226.2 | | | 454.4 | |
| Other | (67.8) | | | (6.0) | | | 24.5 | |
| Cash provided by/(used in) changes in operating assets and liabilities: | | | | | |
| Accounts receivable | (326.1) | | | (43.0) | | | (2.7) | |
| Inventories | (641.0) | | | (49.8) | | | (10.9) | |
| | | | | |
| Income taxes payable | (149.6) | | | 286.1 | | | (1,214.6) | |
| Accounts payable | 345.5 | | | 189.9 | | | (210.8) | |
| | | | | |
| Deferred revenue | (75.8) | | | (6.1) | | | 31.0 | |
| Operating lease liability | (1,625.6) | | | (1,488.1) | | | (1,231.4) | |
| Other operating assets and liabilities | 339.6 | | | 609.8 | | | (37.0) | |
| Net cash provided by operating activities | 4,397.3 | | | 5,989.1 | | | 1,597.8 | |
| INVESTING ACTIVITIES: | | | | | |
| Purchases of investments | (377.9) | | | (432.0) | | | (443.9) | |
| Sales of investments | 72.6 | | | 143.2 | | | 186.7 | |
| Maturities and calls of investments | 67.3 | | | 345.5 | | | 73.7 | |
| | | | | |
| Additions to property, plant and equipment | (1,841.3) | | | (1,470.0) | | | (1,483.6) | |
| Net proceeds from the divestiture of certain operations | 59.3 | | | 1,175.0 | | | — | |
| Other | (126.3) | | | (81.2) | | | (44.4) | |
| Net cash used in investing activities | (2,146.3) | | | (319.5) | | | (1,711.5) | |
| FINANCING ACTIVITIES: | | | | | |
| Repayments of commercial paper | 175.0 | | | (296.5) | | | — | |
| Proceeds from issuance of short-term debt | 36.6 | | | 215.1 | | | 1,406.6 | |
| Repayments of short-term debt | (36.6) | | | (349.8) | | | (967.7) | |
| Proceeds from issuance of long-term debt | 1,498.1 | | | — | | | 4,727.6 | |
| Repayments of long-term debt | (1,000.0) | | | (1,250.0) | | | — | |
| | | | | |
| | | | | |
| Proceeds from issuance of common stock | 101.6 | | | 246.2 | | | 298.8 | |
| | | | | |
| Cash dividends paid | (2,263.3) | | | (2,119.0) | | | (1,923.5) | |
| Repurchase of common stock | (4,013.0) | | | — | | | (1,698.9) | |
| Minimum tax withholdings on share-based awards | (127.2) | | | (97.0) | | | (91.9) | |
| Other | (9.2) | | | — | | | (37.7) | |
| Net cash provided by/(used in) financing activities | (5,638.0) | | | (3,651.0) | | | 1,713.3 | |
| Effect of exchange rate changes on cash and cash equivalents | (250.3) | | | 86.2 | | | 64.7 | |
| Net increase/(decrease) in cash and cash equivalents | (3,637.3) | | | 2,104.8 | | | 1,664.3 | |
| CASH AND CASH EQUIVALENTS: | | | | | |
| Beginning of period | 6,455.7 | | | 4,350.9 | | | 2,686.6 | |
| End of period | $ | 2,818.4 | | | $ | 6,455.7 | | | $ | 4,350.9 | |
| SUPPLEMENTAL DISCLOSURE OF CASH FLOW INFORMATION: | | | | | |
| Cash paid during the period for: | | | | | |
| Interest, net of capitalized interest | $ | 474.7 | | | $ | 501.1 | | | $ | 396.9 | |
| Income taxes | $ | 1,157.6 | | | $ | 756.3 | | | $ | 1,699.1 | |
See Notes to Consolidated Financial Statements.
STARBUCKS CORPORATION
CONSOLIDATED STATEMENTS OF EQUITY
(in millions, except per share data) | | | | | | | | | | | | | | | | | | | | | | | | | | | | | | | | | | | | | | | | | | | | | | | |
| | Common Stock | | Additional Paid-in Capital | | Retained
Earnings/(Deficit) | | Accumulated
Other
Comprehensive
Income/(Loss) | | Shareholders’
Equity/(Deficit) | | Noncontrolling
Interests | | Total |
| | Shares | | Amount | |
| Balance, September 29, 2019 | 1,184.6 | | | $ | 1.2 | | | $ | 41.1 | | | $ | (5,771.2) | | | $ | (503.3) | | | $ | (6,232.2) | | | $ | 1.2 | | | $ | (6,231.0) | |
| Cumulative effect of adoption of new accounting guidance | — | | | — | | | — | | | 12.5 | | | 4.8 | | | 17.3 | | | — | | | 17.3 | |
| Net earnings/(loss) | — | | | — | | | — | | | 928.3 | | | — | | | 928.3 | | | (3.6) | | | 924.7 | |
| Other comprehensive income | — | | | — | | | — | | | — | | | 133.9 | | | 133.9 | | | — | | | 133.9 | |
| Stock-based compensation expense | — | | | — | | | 252.1 | | | — | | | — | | | 252.1 | | | — | | | 252.1 | |
| Exercise of stock options/vesting of RSUs | 8.5 | | | — | | | 169.9 | | | — | | | — | | | 169.9 | | | — | | | 169.9 | |
| Sale of common stock | 0.5 | | | — | | | 37.2 | | | — | | | — | | | 37.2 | | | — | | | 37.2 | |
| Repurchase of common stock | (20.3) | | | — | | | (126.4) | | | (1,548.6) | | | — | | | (1,675.0) | | | — | | | (1,675.0) | |
Cash dividends declared, $1.23 per share | — | | | — | | | — | | | (1,436.6) | | | — | | | (1,436.6) | | | (0.2) | | | (1,436.8) | |
| Net distributions to noncontrolling interests | — | | | — | | | — | | | — | | | — | | | — | | | 8.3 | | | 8.3 | |
| Balance, September 27, 2020 | 1,173.3 | | | $ | 1.2 | | | $ | 373.9 | | | $ | (7,815.6) | | | $ | (364.6) | | | $ | (7,805.1) | | | $ | 5.7 | | | $ | (7,799.4) | |
| Cumulative effect of adoption of new accounting guidance | — | | | — | | | — | | | (2.2) | | | — | | | (2.2) | | | — | | | (2.2) | |
| Net earnings | — | | | — | | | — | | | 4,199.3 | | | — | | | 4,199.3 | | | 1.0 | | | 4,200.3 | |
| Other comprehensive income | — | | | — | | | — | | | — | | | 511.8 | | | 511.8 | | | — | | | 511.8 | |
| Stock-based compensation expense | — | | | — | | | 322.8 | | | — | | | — | | | 322.8 | | | — | | | 322.8 | |
| Exercise of stock options/vesting of RSUs | 6.3 | | | — | | | 107.0 | | | — | | | — | | | 107.0 | | | — | | | 107.0 | |
| Sale of common stock | 0.4 | | | — | | | 42.4 | | | — | | | — | | | 42.4 | | | — | | | 42.4 | |
| | | | | | | | | | | | | | | |
Cash dividends declared, $2.29 per share | — | | | — | | | — | | | (2,697.2) | | | — | | | (2,697.2) | | | — | | | (2,697.2) | |
| | | | | | | | | | | | | | | |
| Balance, October 3, 2021 | 1,180.0 | | | $ | 1.2 | | | $ | 846.1 | | | $ | (6,315.7) | | | $ | 147.2 | | | $ | (5,321.2) | | | $ | 6.7 | | | $ | (5,314.5) | |
| | | | | | | | | | | | | | | |
| Net earnings | — | | | — | | | — | | | 3,281.6 | | | — | | | 3,281.6 | | | 1.8 | | | 3,283.4 | |
| Other comprehensive loss | — | | | — | | | — | | | — | | | (610.4) | | | (610.4) | | | — | | | (610.4) | |
| Stock-based compensation expense | — | | | — | | | 275.5 | | | — | | | — | | | 275.5 | | | — | | | 275.5 | |
| Exercise of stock options/vesting of RSUs | 3.6 | | | (0.1) | | | (72.4) | | | — | | | — | | | (72.5) | | | — | | | (72.5) | |
| Sale of common stock | 0.6 | | | — | | | 46.9 | | | — | | | — | | | 46.9 | | | — | | | 46.9 | |
| Repurchase of common stock | (36.3) | | | — | | | (890.8) | | | (3,122.2) | | | — | | | (4,013.0) | | | — | | | (4,013.0) | |
Cash dividends declared, $2.00 per share | — | | | — | | | — | | | (2,293.5) | | | — | | | (2,293.5) | | | — | | | (2,293.5) | |
| Net distributions to noncontrolling interests | — | | | — | | | — | | | — | | | — | | | — | | | (0.6) | | | (0.6) | |
| Balance, October 2, 2022 | 1,147.9 | | | $ | 1.1 | | | $ | 205.3 | | | $ | (8,449.8) | | | $ | (463.2) | | | $ | (8,706.6) | | | $ | 7.9 | | | $ | (8,698.7) | |
See Notes to Consolidated Financial Statements.
STARBUCKS CORPORATION
INDEX FOR NOTES TO CONSOLIDATED FINANCIAL STATEMENTS
| | | | | | | | |
| Note 1 | | |
| Note 2 | | |
| Note 3 | | |
| Note 4 | | |
| Note 5 | | |
| Note 6 | | |
| Note 7 | | |
| Note 8 | | |
| Note 9 | | |
| Note 10 | | |
| Note 11 | | |
| Note 12 | | |
| Note 13 | | |
| Note 14 | | |
| Note 15 | | |
| Note 16 | | |
| Note 17 | | |
| | |
| | |
STARBUCKS CORPORATION
NOTES TO CONSOLIDATED FINANCIAL STATEMENTS
Fiscal Years ended October 2, 2022, October 3, 2021 and September 27, 2020
Note 1: Summary of Significant Accounting Policies and Estimates
Description of Business
We purchase and roast high-quality coffees that we sell, along with handcrafted coffee and tea beverages and a variety of fresh and prepared food items, through our company-operated stores. We also sell a variety of coffee and tea products and license our trademarks through other channels such as licensed stores, grocery and foodservice. The grocery and foodservice business is primarily through our Global Coffee Alliance with Nestlé established in August 2018.
In this 10-K, Starbucks Corporation (together with its subsidiaries) is referred to as “Starbucks,” the “Company,” “we,” “us” or “our.”
Segment information is prepared on the same basis that our management reviews financial information for operational decision-making purposes. In the fourth quarter of fiscal 2021, certain changes were made to our management team, and our operating segment reporting structure was realigned as a result. We realigned our fully licensed Latin America and Caribbean markets from our Americas operating segment to our International operating segment. We renamed the Americas operating segment to the North America operating segment, since it is comprised of our company-operated and licensed stores in the U.S. and Canada. We also made certain other immaterial changes between our International operating segment and Corporate and Other. Certain prior period information for our North America and International operating segments and our Corporate and Other reportable segment has been reclassified to conform to the current year presentation. There was no impact on consolidated net revenues, total operating expenses, operating income or net earnings per share as a result of these changes.
We have three reportable operating segments: 1) North America, which is inclusive of the U.S. and Canada; 2) International, which is inclusive of China, Japan, Asia Pacific, Europe, Middle East and Africa, Latin America and the Caribbean; and 3) Channel Development. Non-reportable operating segments and unallocated corporate expenses are reported within Corporate and Other.
Additional details on the nature of our business and our reportable operating segments are included in Note 17, Segment Reporting. Certain prior period information on the consolidated balance sheets and consolidated statements of cash flows have been reclassified to conform to the current presentation.
Principles of Consolidation
Our consolidated financial statements reflect the financial position and operating results of Starbucks, including wholly-owned subsidiaries and investees that we control. Intercompany transactions and balances have been eliminated.
Fiscal Year End
Our fiscal year ends on the Sunday closest to September 30. Fiscal years 2022, 2021 and 2020 included 52, 53 and 52 weeks, respectively. The 53rd week in fiscal 2021 fell in the fourth fiscal quarter.
Estimates and Assumptions
Preparing financial statements in conformity with accounting principles generally accepted in the United States of America requires management to make estimates and assumptions that affect the reported amounts of assets, liabilities, revenues and expenses. Examples include, but are not limited to, estimates for inventory reserves, asset and goodwill impairments, assumptions underlying self-insurance reserves, income from unredeemed stored value cards, stock-based compensation forfeiture rates, future asset retirement obligations and the potential outcome of future tax consequences of events that have been recognized in the financial statements. Actual results and outcomes may differ from these estimates and assumptions due to risks and uncertainties, including uncertainty in the current economic environment due to the global COVID-19 pandemic.
Restructuring
In fiscal 2022, we announced our plan in the U.S. market to increase efficiency while elevating the partner and customer experience (the “Reinvention Plan”). We believe the investments in partner wages and trainings will increase retention and productivity while the acceleration of purpose-built store concepts and innovations in technologies will provide additional convenience and connection with our customers. As a result of the restructuring efforts in connection with the Reinvention Plan, we recorded $46.0 million to restructuring and impairments on our consolidated statements of earnings. Future restructuring and impairment costs attributable to our Reinvention Plan are not expected to be material.
In fiscal 2021, we substantially completed our plan to reposition our North America store portfolio, primarily in dense metropolitan markets by pursuing strategic store closures and focusing on new store formats that better cater to changing customer tastes and preferences. During fiscal years 2021 and 2020, we recorded approximately $155.4 million and $254.7 million, respectively, to restructuring and impairments on our consolidated statements of earnings. These totals included $53.1 million and $151.0 million, respectively, related to disposal and impairment of company-operated store assets and $89.5 million and $87.7 million, respectively, primarily associated with accelerated amortization of ROU lease assets and other lease costs due to store closures prior to the end of contractual lease terms. As this restructuring plan was substantially completed in fiscal 2021, we did not recognize any material restructuring and impairment amounts related to this plan during the fiscal year ended October 2, 2022.
As of October 2, 2022 and October 3, 2021, there were no material restructuring-related accrued liabilities on our consolidated balance sheets.
Cash and Cash Equivalents
We consider all highly liquid instruments with maturities of three months or less at the time of purchase, as well as credit card receivables for sales to customers in our company-operated stores that generally settle within two to five business days, to be cash equivalents. We maintain cash and cash equivalent balances with financial institutions that exceed federally-insured limits. We have not experienced any losses related to these balances, and we believe credit risk to be minimal.
Our cash management system provides for the funding of all major bank disbursement accounts on a daily basis as checks are presented for payment. Under this system, outstanding checks are in excess of the cash balances at certain banks, which creates book overdrafts. Book overdrafts are presented as a current liability in accrued liabilities on our consolidated balance sheets.
Investments
Available-for-sale Debt Securities
Our short-term and long-term investments include investment-grade debt securities, all of which are classified as available-for-sale. Available-for-sale debt securities are recorded at fair value, and unrealized holding gains and losses are recorded, net of tax, as a component of accumulated other comprehensive income. Available-for-sale securities with remaining maturities of less than one year and those identified by management at the time of purchase to be used to fund operations within one year are classified as short-term. All other available-for-sale securities are classified as long-term. We evaluate our available-for-sale securities for other-than-temporary impairment on a quarterly basis. Unrealized losses are charged against net earnings when a decline in fair value is determined to be other than temporary. We review several factors to determine whether a loss is other than temporary, such as the length and extent of the fair value decline, the financial condition and near-term prospects of the issuer and whether we have the intent to sell or will more likely than not be required to sell before the securities' anticipated recovery, which may be at maturity. Realized gains and losses are accounted for using the specific identification method. Purchases and sales are recorded on a trade date basis.
Structured Deposits
We hold short-term, principal-protected structured deposits that provide returns in the form of both fixed and variable yields; such variable yields are indexed to foreign exchange rates, equity-linked instruments or interest rate indices. The Company has elected to account for these using the fair value option with gains and losses recorded in our consolidated statements of earnings. For fiscal 2022, 2021 and 2020, resulting gains and losses were immaterial to our consolidated statements of earnings.
Marketable Equity Securities
We also have a marketable equity securities portfolio, which is comprised of marketable equity mutual funds and equity exchange-traded funds. Marketable equity securities are recorded at fair value and approximates a portion of our liability under our Management Deferred Compensation Plan (“MDCP”). Gains or losses from the portfolio and the change in our MDCP liability are recorded in our consolidated statements of earnings.
Equity Investments
Equity investments are accounted for under the equity method if we are able to exercise significant influence, but not control, over an investee. Our share of the earnings or losses as reported by the investees is classified as income from equity investees on our consolidated statements of earnings. The investments are evaluated for impairment annually and when facts and circumstances indicate that the carrying value may not be recoverable. If a decline in fair value is determined to be other-than-temporary, an impairment charge is recorded in interest income and other, net on our consolidated statements of earnings.
We account for equity investments for which we do not have significant influence and without readily determinable fair values at cost with adjustments for observable changes in price or impairments as permitted by the measurement alternative. Investments for which the measurement alternative has been elected are assessed for impairment quarterly, or if a triggering
event indicates impairment may be present. Any adjustments as a result of price changes or impairments are recorded in interest income and other, net on our consolidated statements of earnings.
Fair Value
Fair value is the price we would receive to sell an asset or pay to transfer a liability (exit price) in an orderly transaction between market participants. For assets and liabilities recorded or disclosed at fair value on a recurring basis, we determine fair value based on the following:
Level 1: The carrying value of cash and cash equivalents approximates fair value because of the short-term nature of these instruments. For equity and U.S. government treasury securities and commodity futures contracts, we use quoted prices in active markets for identical assets to determine fair value.
Level 2: When quoted prices in active markets for identical assets are not available, we determine the fair value of certain assets based upon factors such as the quoted market price of similar assets or a discounted cash flow model using readily observable market data, which may include interest rate curves and forward and spot prices for currencies and commodities, depending on the nature of the investment. The fair value of our long-term debt is estimated based on the quoted market prices for the same or similar issues or on the current rates offered to us for debt of the same remaining maturities.
Level 3: We determine the fair value of our auction rate securities using an internally-developed valuation model, using inputs that include interest rate curves, credit and liquidity spreads and effective maturity.
Assets and liabilities recognized or disclosed at fair value on a nonrecurring basis may include items such as property, plant and equipment, goodwill and other intangible assets, equity and other investments and other assets. We determine the fair value of these items using Level 3 inputs, as described in the related sections below.
Derivative Instruments
We manage our exposure to various risks within our consolidated financial statements according to a market price risk management policy. Under this policy, we may engage in transactions involving various derivative instruments to hedge interest rates, commodity prices and foreign currency-denominated revenue streams, inventory purchases, assets and liabilities and investments in certain foreign operations. In order to manage our exposure to these risks, we use various types of derivative instruments including forward contracts, commodity futures contracts, collars and swaps. Forward contracts and commodity futures contracts are agreements to buy or sell a quantity of a currency or commodity at a predetermined future date and at a predetermined rate or price. A collar is a strategy that uses a combination of a purchased call option and a sold put option with equal premiums to hedge a portion of anticipated cash flows, or to limit possible gains or losses on an underlying asset or liability to a specific range. A swap agreement is a contract between two parties to exchange cash flows based on specified underlying notional amounts, assets and/or indices. We do not enter into derivative instruments for speculative purposes.
We record all derivatives on our consolidated balance sheets at fair value and typically do not offset derivative assets and liabilities. Excluding interest rate hedging instruments, cross-currency swaps and foreign currency debt hedging instruments, we generally do not enter into derivative instruments with maturities longer than three years. However, we are allowed to net settle transactions with respective counterparties for certain derivative contracts, inclusive of interest rate swaps and foreign currency forwards, with a single, net amount payable by one party to the other. We also enter into collateral security arrangements that provide for collateral to be received or posted when the net fair value of certain financial instruments fluctuates from contractually established thresholds. As of October 2, 2022 and October 3, 2021, cash collateral held under collateral security arrangements was $74.3 million and $44.7 million, respectively, and is included in other long-term liabilities on our consolidated balance sheets. As of October 2, 2022, cash collateral pledged as part of our commodity derivative margin requirements was $75.6 million and is included in prepaid expenses and other current assets on our consolidated balance sheets. As of October 3, 2021, cash collateral pledged as part of our commodity derivative margin requirements was $72.5 million and is included in cash and cash equivalents on our consolidated balance sheets. The potential effects of netting arrangements with our derivative contracts, excluding the effects of collateral, would not have had a material impact on our consolidated balance sheets.
By using these derivative instruments, we expose ourselves to potential credit risk. Credit risk is the failure of the counterparty to perform under the terms of the derivative contract. We minimize this credit risk by entering into transactions with carefully selected, credit-worthy counterparties and distribute contracts among several financial institutions to reduce the concentration of credit risk.
Cash Flow Hedges
For derivative instruments that are designated and qualify as a cash flow hedge, the derivative's gain or loss is reported as a component of other comprehensive income (“OCI”) and recorded in accumulated other comprehensive income (“AOCI”) on our consolidated balance sheets. The gain or loss is subsequently reclassified into net earnings when the hedged exposure affects net earnings, in the same line item as the underlying hedged item on our consolidated statements of earnings.
Cash flow hedges related to anticipated transactions are designated and documented at the inception of each hedge. Cash flows from hedging transactions are classified in the same categories as the cash flows from the respective hedged items. For de-designated cash flow hedges in which the transactions are no longer likely to occur, the related accumulated derivative gains or losses are recognized in interest income and other, net on our consolidated statements of earnings based on the nature of the underlying transaction.
Net Investment Hedges
For derivative instruments that are designated and qualify as a net investment hedge, the derivative's, or qualifying non-derivative instrument’s gain or loss is reported as a component of OCI and recorded in AOCI. The gain or loss will be subsequently reclassified into net earnings when the hedged net investment is either sold or substantially liquidated.
Fair Value Hedges
For derivative instruments that are designated and qualify as a fair value hedge, the changes in fair value of the derivative instrument and the offsetting changes in fair value of the underlying hedged item due to changes in the hedged risk are recorded in interest income and other, net or interest expense on our consolidated statements of earnings.
Derivatives Not Designated As Hedging Instruments
We also enter into certain foreign currency forward contracts, commodity futures contracts, collars and swaps that are not designated as hedging instruments for accounting purposes. The changes in the fair values of these contracts are immediately recognized in interest income and other, net on our consolidated statements of earnings.
Normal Purchase Normal Sale
We enter into fixed-price and price-to-be-fixed green coffee purchase commitments, which we expect to take delivery and to utilize in a reasonable period of time in the ordinary course of business. Since these types of purchase commitments qualify for the normal purchase normal sale exemption, they are not recorded as derivative instruments on our consolidated balance sheets.
Refer to Note 3, Derivative Financial Instruments, and Note 5, Inventories, for further discussion of our derivative instruments and green coffee purchase commitments. Receivables, net of Allowance for Credit Losses
Our receivables are mainly comprised of receivables for product and equipment sales to and royalties from our licensees, as well as receivables from our Global Coffee Alliance and other Channel Development customers. The primary indicators of the credit quality of our receivables are aging, payment history, economic sector information and outside credit monitoring, and are assessed on a quarterly basis. Our credit loss exposure is mainly concentrated in our accounts receivable portfolio. Our allowance for credit losses is calculated using a loss-rate method based on historical experience, current market conditions and reasonable forecasts. We also assessed incremental risks due to COVID-19 on our licensees’ financial viability. For the fiscal year ended October 2, 2022, we did not observe a significant deterioration of our receivable portfolio that required a significant increase in our allowance for credit losses. As of October 2, 2022 and October 3, 2021, our allowance for credit losses was $27.2 million and $25.6 million, respectively.
Inventories
Inventories are stated at the lower of cost (primarily moving average cost) or net realizable value. We record inventory reserves for obsolete and slow-moving inventory and for estimated shrinkage between physical inventory counts. Inventory reserves are based on inventory obsolescence trends, historical experience and application of the specific identification method. As of October 2, 2022 and October 3, 2021, inventory reserves were $43.1 million and $36.6 million, respectively.
Property, Plant and Equipment
Property, plant and equipment is carried at cost less accumulated depreciation. Cost includes all direct costs necessary to acquire and prepare assets for use, including internal labor and overhead in some cases. Depreciation is computed using the straight-line method over estimated useful lives of the assets, generally ranging from 2 to 15 years for equipment and 30 to 40 years for buildings. Leasehold improvements are amortized over the shorter of their estimated useful lives or the related lease life, generally 10 years. For leases with renewal periods at our option, we generally use the original lease term, excluding renewal option periods, to determine estimated useful lives. If failure to exercise a renewal option imposes an economic penalty to us, we may determine at the inception of the lease that renewal is reasonably assured and include the renewal option period in the determination of the appropriate estimated useful lives.
The portion of depreciation expense related to production and distribution facilities is included in product and distribution costs on our consolidated statements of earnings. The costs of repairs and maintenance are expensed when incurred, while expenditures for refurbishments and improvements that significantly add to the productive capacity or extend the useful life of an asset are capitalized. When assets are disposed of, whether through retirement or sale, the net gain or loss is recognized in
net earnings. Long-lived assets to be disposed of are reported at the lower of their carrying amount or fair value less estimated costs to sell.
We evaluate property, plant and equipment for impairment when facts and circumstances indicate that the carrying values of such assets may not be recoverable. When evaluating for impairment, we first compare the carrying value of the asset to the asset’s estimated future undiscounted cash flows. If the estimated undiscounted future cash flows are less than the carrying value of the asset, we determine if we have an impairment loss by comparing the carrying value of the asset to the asset's estimated fair value and recognize an impairment charge when the asset’s carrying value exceeds its estimated fair value. The fair value of the asset is estimated using a discounted cash flow model based on forecasted future revenues and operating costs, using internal projections. Property, plant and equipment assets and ROU assets related to the store lease are grouped at the lowest level for which identifiable cash flows are largely independent of the cash flows of other assets and liabilities. For company-operated store assets, the impairment test is performed at the individual store asset group level.
We recognized net disposition and impairment charges of $66.6 million, $153.1 million and $294.9 million in fiscal 2022, 2021 and 2020, respectively. Of the total net disposition and impairment charges, $9.6 million, $53.1 million and $151.0 million in fiscal 2022, 2021 and 2020, respectively, were restructuring related and recorded in restructuring and impairment expenses. For fiscal 2022, 2021 and 2020, we evaluated COVID-19 business recovery trends and their estimated impacts on future revenue growth and profitability for assessing impairment of our company-operated retail store and related operating lease ROU assets. As a result, we recorded $14.3 million, $44.4 million and $59.6 million of impairment losses within store operating expenses on our consolidated statements of earnings during the fiscal years ended October 2, 2022, October 3, 2021 and September 27, 2020, respectively. Unless it is restructuring related, the nature of the underlying asset that is impaired or disposed of will determine the operating expense line on which the related impact is recorded on our consolidated statements of earnings.
Leases
The majority of our leases are operating leases for our company-operated retail store locations. We also lease, among other things, roasting, distribution and warehouse facilities and office space for corporate administrative purposes.
We categorize leases as either operating or finance leases at the commencement date of the lease. Operating lease agreements may contain tenant improvement allowances, rent holidays, rent escalation clauses and/or contingent rent provisions. We have lease agreements with lease and non-lease components, which are accounted for together as a single lease component for all underlying classes of assets.
We recognize a ROU asset and lease liability for each operating and finance lease with a contractual term greater than 12 months at the time of lease inception. We do not record leases with an initial term of 12 months or less on our consolidated balance sheet but continue to record rent expense on a straight-line basis over the lease term. We review contracts for identified assets where we have the right to direct the use of the asset and record those agreements as embedded leases on our consolidated balance sheet. Our leases often include options to extend or terminate at our sole discretion, which are included in the determination of lease term when they are reasonably certain to be exercised.
Our lease liability represents the present value of future lease payments over the lease term. Given our policy election to combine lease and non-lease components, we also consider fixed common area maintenance (“CAM”) part of our fixed future lease payments; therefore, fixed CAM is also included in our lease liability.
We cannot determine the interest rate implicit in each of our leases. Therefore, we use market and term-specific incremental borrowing rates. Our incremental borrowing rate for a lease is the rate of interest we expect to pay on a collateralized basis to borrow an amount equal to the lease payments under similar terms. Because we do not borrow on a collateralized basis, we consider a combination of factors, including our credit-adjusted risk-free interest rate, the risk profile and funding cost of the specific geographic market of the lease, the lease term and the effect of adjusting the rate to reflect consideration of collateral. Our credit-adjusted risk-free rate takes into consideration interest rates we pay on our unsecured long-term bonds as well as quoted interest rates obtained from financial institutions.
Total lease costs recorded as rent and other occupancy costs include fixed operating lease costs, variable lease costs and short-term lease costs. Most of our real estate leases require we pay certain expenses, such as CAM costs, real estate taxes and other executory costs, of which the fixed portion is included in operating lease costs. We recognize operating lease costs on a straight-line basis over the lease term. In addition to the above costs, variable lease costs also include amounts based on a percentage of gross sales in excess of specified levels and are recognized when probable and are not included in determining the present value of our lease liability. Our lease agreements do not contain any material residual value guarantees or material restrictive covenants. A significant majority of our leases are related to our company-operated stores, and their related costs are recorded within store operating expenses.
The ROU asset is measured at the initial amount of the lease liability adjusted for lease payments made at or before the lease commencement date, initial direct costs and any tenant improvement allowances received. For operating leases, ROU assets are reduced over the lease term by the recognized straight-line lease expense less the amount of accretion of the lease liability
determined using the effective interest method. For finance leases, ROU assets are amortized on a straight-line basis over the shorter of the useful life of the leased asset or the lease term. Interest expense on each finance lease liability is recognized utilizing the effective interest method. ROU assets are tested for impairment in the same manner as long-lived assets.
Additionally, we monitor for events or changes in circumstances that may require a reassessment of one of our leases and determine if a remeasurement is required. During fiscal 2022 and fiscal 2021, the COVID-19-related rent concessions we received for stores, primarily in our International segment, were immaterial. During fiscal 2020, we received $27.6 million of COVID-19-related rent concessions for stores in our International segment generally correlating with the temporary period our stores were closed. Consistent with updated guidance from the Financial Accounting Standards Board (“FASB”) in April 2020, we elected to treat COVID-19-related rent concessions as variable rent. Rent concessions were recognized as an offset to our rent expense within store operating expenses on our consolidated statement of earnings. See Note 10, Leases, for additional details. Additionally, for the fiscal years ended October 3, 2021 and September 27, 2020, we recognized accelerated amortization of ROU lease assets and other lease costs of $89.5 million and $87.7 million, respectively, due to planned store closures prior to the end of contractual lease terms, which were recorded in restructuring and impairments on the consolidated statement of earnings. In fiscal 2021, we substantially completed our plan to optimize our North America store portfolio and we did not recognize any material restructuring and impairment amounts related to this plan during the fiscal year ended October 2, 2022. Goodwill
We evaluate goodwill for impairment annually during our third fiscal quarter, or more frequently if an event occurs or circumstances change, such as material deterioration in performance or a significant number of store closures, that would indicate that impairment may exist. When evaluating goodwill for impairment, we may first perform a qualitative assessment to determine whether it is more likely than not that a reporting unit is impaired. If we do not perform a qualitative assessment, or if we determine that it is not more likely than not that the fair value of the reporting unit exceeds its carrying amount, we calculate the estimated fair value of the reporting unit. Fair value is typically calculated using a discounted cash flow model. For certain reporting units, where deemed appropriate, we may also utilize a market approach for estimating fair value. If the carrying amount of the reporting unit exceeds the estimated fair value, an impairment charge is recorded to reduce the carrying value to the estimated fair value.
As part of our ongoing operations, we may close certain stores within a reporting unit containing goodwill due to underperformance of the store or inability to renew our lease, among other reasons. We may abandon certain assets associated with a closed store, including leasehold improvements and other non-transferable assets. When a portion of a reporting unit that constitutes a business is to be disposed of, goodwill associated with the business is included in the carrying amount of the business in determining any loss on disposal. Our evaluation of whether the portion of a reporting unit being disposed of constitutes a business occurs on the date of abandonment. Although an operating store meets the accounting definition of a business prior to abandonment, it does not constitute a business on the closure date because the remaining assets on that date do not constitute an integrated set of activities (substantive processes) and assets that are capable of being managed for the purpose of providing a return to investors. As a result, when closing individual stores, we do not include goodwill in the calculation of any loss on disposal of the related assets.
We recorded no goodwill impairment during fiscal 2022, fiscal 2021 and fiscal 2020. See Note 8, Other Intangible Assets and Goodwill, for further information. Other Intangible Assets
Other intangible assets include finite-lived intangible assets, which mainly consist of acquired and reacquired rights, trade secrets, licensing agreements, contract-based patents and copyrights. These assets are amortized over their estimated useful lives and are tested for impairment using a similar methodology to our property, plant and equipment, as described above.
Indefinite-lived intangibles, which consist primarily of trade names and trademarks, are tested for impairment annually during the third fiscal quarter, or more frequently if an event occurs or circumstances change that would indicate that impairment may exist. When evaluating other intangible assets for impairment, we may first perform a qualitative assessment to determine whether it is more likely than not that an intangible asset group is impaired. If we do not perform the qualitative assessment, or if we determine that it is not more likely than not that the fair value of the intangible asset group exceeds its carrying amount, we calculate the estimated fair value of the intangible asset group. Fair value is the price a willing buyer would pay for the intangible asset group and is typically calculated using an income approach, such as a relief-from-royalty model. If the carrying amount of the intangible asset group exceeds the estimated fair value, an impairment charge is recorded to reduce the carrying value to the estimated fair value. In addition, we continuously monitor and may revise our intangible asset useful lives if and when facts and circumstances change.
There were no significant other intangible asset impairment charges recorded during fiscal 2022 and fiscal 2021. We recorded other intangible asset impairment charges of $22.1 million during fiscal 2020. See Note 8, Other Intangible Assets and Goodwill, for further information. Insurance Reserves
We use a combination of insurance and self-insurance mechanisms, including a wholly-owned captive insurance entity and participation in a reinsurance treaty, to provide for the potential liabilities for certain risks, including workers’ compensation, healthcare benefits, general liability, property insurance and director and officers’ liability insurance. Liabilities associated with the risks that are retained by us are not discounted and are estimated, in part, by considering historical claims experience, demographics, exposure and severity factors and other actuarial assumptions.
Revenue Recognition
Consolidated revenues are presented net of intercompany eliminations for wholly-owned subsidiaries and investees controlled by us and for product sales to and royalty and other fees from licensees accounted for under the equity method. Additionally, consolidated revenues are recognized net of any discounts, returns, allowances and sales incentives, including coupon redemptions and rebates.
Company-operated Store Revenues
Company-operated store revenues are recognized when payment is tendered at the point-of-sale as the performance obligation has been satisfied. For products sold via delivery platforms, revenues are also recognized when control of products are transferred to the customers. Delivery service fees are immaterial in the periods presented. Company-operated store revenues are reported excluding sales, use or other transaction taxes that are collected from customers and remitted to taxing authorities.
Licensed Store Revenues
Licensed store revenues consist of product and equipment sales, royalties and other fees paid by licensees using the Starbucks brand. Sales of coffee, tea, food and related products are generally recognized upon shipment to licensees, depending on contract terms. Shipping charges billed to licensees are also recognized as revenue, and the related shipping costs are included in product and distribution costs on our consolidated statements of earnings.
We consider pre-opening services, including site evaluation and selection, store architectural/design and development and operational training, to be performance obligations that are separate from the license to operate under the Starbucks brand. These services provide distinct value to our licensees, including business and industry insight and knowledge that transfers value apart from the license. Revenues associated with pre-opening services are recognized upon completion of the related performance obligations, generally when a store is opened. Royalty revenues are recognized based upon a percentage of reported sales, and other continuing fees, such as marketing and service fees, are recognized as the performance obligations are met.
Stored Value Cards
Stored value cards can be activated through various channels, including at our company-operated and most licensed store locations, online at Starbucks.com or via mobile devices held by our customers and at certain other third-party websites and locations, such as grocery stores, although they cannot be reloaded at these third-party websites or locations. Amounts loaded onto stored value cards are initially recorded as deferred revenue and recognized as revenue upon redemption. Historically, the majority of stored value cards are redeemed within one year.
In many of our company-owned markets, including the U.S., our stored value cards do not have an expiration date nor do we charge service fees that cause a decrement to customer balances. Based on historical redemption rates, a portion of stored value cards is not expected to be redeemed and will be recognized as breakage over time in proportion to stored value card redemptions. The redemption rates are based on historical redemption patterns for each market, including the timing and business channel in which the card was activated or reloaded, and remittance to government agencies under unclaimed property laws, if applicable.
Breakage is recognized as company-operated stores and licensed stores revenue within the consolidated statement of earnings. For the fiscal years ended October 2, 2022, October 3, 2021 and September 27, 2020, we recognized breakage revenue of $196.0 million, $164.5 million and $130.3 million in company-operated store revenues, respectively, and $16.7 million, $16.6 million and $14.3 million in licensed store revenues, respectively.
Loyalty Program
Customers in the U.S., Canada and certain other countries who register their Starbucks Card are automatically enrolled in the Starbucks Rewards program, which is primarily a spend-based loyalty program. They earn loyalty points (“Stars”) in a variety of ways, including with each purchase at participating Starbucks stores and when making purchases with the Starbucks-branded credit cards. Starbucks Rewards members can earn Stars by paying with cash, credit or debit cards, or selected mobile wallets at company-operated stores in the U.S. and Canada. After accumulating a certain number of Stars, the customer earns a reward that can be redeemed for free product that, regardless of where the related Stars were earned within that country, will be honored at company-operated stores and certain participating licensed store locations in that same country.
We defer revenue associated with the estimated selling price of Stars earned by Starbucks Rewards members towards free product as each Star is earned and a corresponding liability is established in deferred revenue. This deferral is based on the estimated value of the product for which the reward is expected to be redeemed, net of estimated unredeemed Stars. Stars generally expire after six months.
When a customer redeems an earned reward, we recognize revenue for the redeemed product and reduce the related deferred revenue.
Other Revenues
Other revenues primarily include royalty revenues, sales of packaged coffee, tea and a variety of ready-to-drink beverages and single-serve coffee and tea products to customers outside of our company-operated and licensed stores. Sales of these products are generally recognized upon shipment to customers, depending on contract terms.
Other revenues also include product sales to and licensing revenue from Nestlé related to our Global Coffee Alliance. Product sales to Nestlé are generally recognized when the product is shipped whereas royalty revenues are recognized based on a percentage of reported sales.
Deferred Revenues
Our deferred revenue primarily consists of the up-front prepaid royalty from Nestlé, for which we have continuing performance obligations to support the Global Coffee Alliance, and our unredeemed stored value card liability and unredeemed Stars associated with our loyalty program. See Note 11, Deferred Revenue, for further information. Disaggregation of Revenues
Revenues disaggregated by segment, product type and geographic area are disclosed in Note 17, Segment Reporting. Product and Distribution Costs
Product and distribution costs primarily consist of raw materials, purchased goods and packaging costs as well as operational costs of our supply chain organization, such as wages and benefits, occupancy costs and depreciation expenses, in support of sourcing, procuring, manufacturing, warehousing and transportation activities of products sold at our company-operated and licensed stores as well as through Channel Development and our other businesses. Also included are inventory and supply chain asset impairment costs.
Store Operating Expenses
Store operating expenses consist of costs incurred in our company-operated stores, primarily wages and benefits related to store partners (employees), occupancy costs and other costs that directly support the operation and sales-related activities of those stores.
General and Administrative Expenses
General and administrative expenses primarily consist of wages and benefits, professional service fees and occupancy costs for corporate headquarters and regional offices that support our corporate functions, including technology, finance, legal and partner resources.
Advertising
We expense most advertising costs as they are incurred, except for certain production costs that are expensed the first time the advertising takes place. Advertising expenses totaled $416.7 million, $305.1 million and $258.8 million in fiscal 2022, 2021 and 2020, respectively.
Government Subsidies
On March 27, 2020, the U.S. government enacted the Coronavirus Aid, Relief and Economic Security Act (“CARES Act”), which among other things, provides employer payroll tax credits for wages paid to employees who are unable to work during the COVID-19 pandemic and options to defer payroll tax payments for a limited period. Based on our evaluation of the CARES Act, we qualify for certain employer payroll tax credits as well as the deferral of payroll tax payments in the future. Additionally, the Canadian government enacted the Canada Emergency Wage Subsidy (“CEWS”) to help employers offset a portion of their employee wages for a limited period. We elected to treat qualified government subsidies from the U.S., Canada and other governments as offsets to the related operating expenses. The CARES Act and CEWS were no longer applicable to us in late fiscal 2021. The qualified payroll credits reduced our store operating expenses by $210.0 million and $349.6 million on our consolidated statement of earnings during fiscal 2021 and 2020, respectively. After netting the qualified credits against our payable, a receivable balance of $69.4 million and $172.4 million was included in prepaid expenses and other current assets as of October 2, 2022 and October 3, 2021, respectively. As of October 2, 2022, deferred payroll tax payments of $116.5 million were included in accrued liabilities on our consolidated balance sheets. As of October 3, 2021, deferred payroll tax payments of $116.4 million were included in both accrued liabilities and other long-term liabilities, respectively, on our consolidated balance sheets.
Store Preopening Expenses
Costs incurred in connection with the start-up and promotion of new company-operated store openings are expensed as incurred.
Asset Retirement Obligations
We recognize a liability for the fair value of required asset retirement obligations (“ARO”) when such obligations are incurred. Our AROs are primarily associated with leasehold improvements, which, at the end of a lease, we are contractually obligated to remove in order to comply with the lease agreement. At the inception of a lease with such conditions, we record an ARO liability and a corresponding capital asset in an amount equal to the estimated fair value of the obligation. We estimate the liability using a number of assumptions, including store closing costs, cost inflation rates and discount rates, and accrete the liability to its projected future value over time. The capitalized asset is depreciated using the same depreciation convention as leasehold improvement assets. Upon satisfaction of the ARO conditions, any difference between the recorded ARO liability and the actual retirement costs incurred is recognized as a gain or loss in store operating expense on our consolidated statements of earnings. As of October 2, 2022 and October 3, 2021, our net ARO assets included in property, plant and equipment were $26.1 million and $30.9 million, respectively, and our net ARO liabilities included in other long-term liabilities were $104.7 million and $116.5 million, respectively.
Stock-based Compensation
We maintain several equity incentive plans under which we may grant non-qualified stock options, incentive stock options, restricted stock, restricted stock units (“RSUs”) or stock appreciation rights to employees, non-employee directors and consultants; stock options have not been broadly used as part of our compensation strategy in recent years. We also have an employee stock purchase plan (“ESPP”). RSUs issued by us are equivalent to nonvested shares under the applicable accounting guidance. We record stock-based compensation expense based on the fair value of stock awards at the grant date and recognize the expense over the related service period following a graded vesting expense schedule. Expense for performance-based RSUs is recognized when it is probable the performance goal will be achieved. Performance goals are determined by the Board and may include measures such as earnings per share, operating income, return on invested capital, total shareholder return and metrics focused on building inclusive and diverse teams. The fair value of each stock option granted is estimated on the grant date using the Black-Scholes-Merton option valuation model. The assumptions used to calculate the fair value of options granted are evaluated and revised, as necessary, to reflect market conditions and our historical experience. The fair value of RSUs is based on the closing price of Starbucks common stock on the award date, less the present value of expected dividends not received during the vesting period. If applicable, our total shareholder return relative to our peer group is incorporated into the underlying assumptions using a Monte Carlo simulation valuation model to calculate grant date fair value. Compensation expense is recognized over the requisite service period for each separately vesting portion of the award, and only for those awards expected to vest, with forfeitures estimated at the date of grant based on our historical experience and future expectations.
Foreign Currency Translation
Our international operations generally use their local currency as their functional currency. Assets and liabilities are translated at exchange rates in effect at the balance sheet date. Income and expense accounts are translated at the average monthly exchange rates during the year. Resulting translation adjustments are reported as a component of OCI and recorded in AOCI on our consolidated balance sheets.
Income Taxes
We compute income taxes using the asset and liability method, under which deferred income taxes are recognized based on the differences between the financial statement carrying amounts and the respective tax bases of our assets and liabilities. Deferred tax assets and liabilities are measured using current enacted tax rates expected to apply to taxable income in the years in which we expect the temporary differences to reverse. The effect of a change in tax rates on deferred taxes is recognized in income in the period that includes the enactment date.
We routinely evaluate the likelihood of realizing the benefit of our deferred tax assets and may record a valuation allowance if, based on all available evidence, we determine that some portion of the tax benefit will not be realized. In evaluating our ability to recover our deferred tax assets within the jurisdictions from which they arise, we consider all available positive and negative evidence, including scheduled reversals of deferred tax liabilities, projected future taxable income, tax-planning strategies and results of recent operations. If we determine that we would be able to realize our deferred tax assets in the future in excess of their net recorded amount, we would make an adjustment to the deferred tax asset valuation allowance, which would reduce the provision for income taxes.
In addition, our income tax returns are periodically audited by domestic and foreign tax authorities. These audits include review of our tax filing positions, including the timing and amount of deductions taken and the allocation of income between tax jurisdictions. We evaluate our exposures associated with our various tax filing positions and recognize a tax benefit from an uncertain tax position only if it is more likely than not that the tax position will be sustained upon examination by the relevant taxing authorities, including resolutions of any related appeals or litigation processes, based on the technical merits of our position. The tax benefits recognized in the financial statements from such a position are measured based on the largest benefit that has a greater than 50% likelihood of being realized upon ultimate settlement. For uncertain tax positions that do not meet this threshold, we record a related liability. We adjust our unrecognized tax benefit liability and income tax expense in the period in which the uncertain tax position is effectively settled, the statute of limitations expires for the relevant taxing authority to examine the tax position or when new information becomes available.
Starbucks recognizes interest and penalties related to income tax matters in income tax expense on our consolidated statements of earnings. Accrued interest and penalties are included within the related tax balances on our consolidated balance sheets.
Global intangible low-taxed income (“GILTI”) provisions are applied, providing an incremental tax on foreign income. We have made a policy election to classify taxes due under the GILTI provision as a current period expense.
Earnings per Share
Basic earnings per share is computed based on the weighted average number of shares of common stock outstanding during the period. Diluted earnings per share is computed based on the weighted average number of shares of common stock and the effect of dilutive potential common shares outstanding during the period, calculated using the treasury stock method. Dilutive potential common shares include outstanding stock options and RSUs. Performance-based RSUs are considered dilutive when the related performance criterion has been met.
Common Stock Share Repurchases
We may repurchase shares of Starbucks common stock under a program authorized by our Board, including pursuant to a contract, instruction or written plan meeting the requirements of Rule 10b5-1(c)(1) of the Exchange Act. Under applicable Washington State law, shares repurchased are retired and not displayed separately as treasury stock on the financial statements. Instead, the par value of repurchased shares is deducted from common stock and the excess repurchase price over par value is deducted from additional paid-in capital and from retained earnings (deficit).
Recent Accounting Pronouncements
Recently Adopted Accounting Pronouncements
In the first quarter of fiscal 2022, we adopted the Financial Accounting Standards Board (“FASB”) issued guidance related to reference rate reform. The pronouncement provides temporary optional expedients and exceptions to the current guidance on contract modifications and hedge accounting to ease the financial reporting burden related to the expected market transition from the London Interbank Offered Rate (“LIBOR”) and other interbank offered rates to alternative reference rates. The guidance was effective upon issuance and generally can be applied to applicable contract modifications through December 31, 2022. The adoption of the new guidance did not have a material impact to our financial statements.
In June 2016, the FASB issued guidance replacing the incurred loss impairment methodology with a new methodology that reflects current expected credit losses on financial assets, including receivables and available-for-sale securities. The new methodology requires entities to estimate and recognize expected credit losses each reporting period. The guidance was adopted during the first quarter of fiscal 2021 under the modified retrospective approach and resulted in a $2.2 million transition adjustment to opening shareholders’ retained deficit on our consolidated statements of equity.
Note 2: Acquisitions, Divestitures and Strategic Alliance
Fiscal 2022
In the fourth quarter of fiscal 2022, we sold our Evolution Fresh brand and business to Bolthouse Farms. This transaction did not have a material impact on our consolidated financial statements.
Fiscal 2021
In the fourth quarter of fiscal 2021, we sold our 50% ownership interest in Starbucks Coffee Korea Co., Ltd. where our joint venture partner, E-Mart Inc., acquired an additional 17.5% interest and Apfin Investment Pte Ltd, an affiliate of GIC Private Limited, which is a Singapore sovereign wealth fund, acquired the remaining 32.5%. The sale had a combined price of $1.175 billion. This transaction resulted in a pre-tax gain of $864.5 million, which is included in net gain resulting from divestiture of certain operations on our consolidated statements of earnings.
Note 3: Derivative Financial Instruments
Interest Rates
From time to time, we enter into designated cash flow hedges to manage the variability in cash flows due to changes in benchmark interest rates. We enter into interest rate swap agreements, including forward-starting interest rate swaps and treasury locks, settled in cash based upon the difference between an agreed-upon benchmark rate and the prevailing benchmark rate at settlement. These agreements are generally settled around the time of the pricing of the related debt. Each derivative agreement's gain or loss is recorded in AOCI and is subsequently reclassified to interest expense over the life of the related debt.
To hedge the exposure to changes in the fair value of our fixed-rate debt, we enter into interest rate swap agreements, which are designated as fair value hedges. The changes in fair values of these derivative instruments and the offsetting changes in fair values of the underlying hedged debt due to changes in the relevant benchmark interest rates are recorded in interest expense. Refer to Note 9, Debt, for additional information on our long-term debt. Foreign Currency
To reduce cash flow volatility from foreign currency fluctuations, we enter into forward and swap contracts to hedge portions of cash flows of anticipated intercompany royalty payments, inventory purchases and intercompany borrowing and lending activities. The resulting gains and losses from these derivatives are recorded in AOCI and subsequently reclassified to revenue, product and distribution costs, or interest income and other, net, respectively, when the hedged exposures affect net earnings.
From time to time, we may enter into financial instruments, including, but not limited to, forward and swap contracts or foreign currency-denominated debt, to hedge the currency exposure of our net investments in certain international operations. The resulting gains and losses from these derivatives are recorded in AOCI and are subsequently reclassified to net earnings when the hedged net investment is either sold or substantially liquidated.
Foreign currency forward and swap contracts not designated as hedging instruments are used to mitigate the foreign exchange risk of certain other balance sheet items. Gains and losses from these derivatives are largely offset by the financial impact of translating foreign currency-denominated payables and receivables; these gains and losses are recorded in interest income and other, net.
Commodities
Depending on market conditions, we may enter into coffee forward contracts, futures contracts and collars to hedge anticipated cash flows under our price-to-be-fixed green coffee contracts, which are described further in Note 5, Inventories, or our longer-dated forecasted coffee demand where underlying fixed price and price-to-be-fixed contracts are not yet available. The resulting gains and losses are recorded in AOCI and are subsequently reclassified to product and distribution costs when the hedged exposure affects net earnings. Depending on market conditions, we may also enter into dairy forward contracts and futures contracts to hedge a portion of anticipated cash flows under our dairy purchase contracts and our forecasted dairy demand. The resulting gains or losses are recorded in AOCI and are subsequently reclassified to product and distribution costs when the hedged exposure affects net earnings.
Cash flow hedges related to anticipated transactions are designated and documented at the inception of each hedge. Cash flows from hedging transactions are classified in the same categories as the cash flows from the respective hedged items. For de-designated cash flow hedges in which the underlying transactions are no longer probable of occurring, the related accumulated derivative gains or losses are recognized in interest income and other, net on our consolidated statements of earnings. Due to ongoing global supply chain disruptions, certain coffee cash flow hedges have been de-designated early which resulted in insignificant amounts recognized in earnings during the fiscal year ended October 2, 2022 and October 3, 2021. These derivatives may be accounted for prospectively as non-designated derivatives until maturity, re-designated to new hedging relationships or terminated early. We continue to believe transactions related to our other designated cash flow hedges are probable to occur.
To mitigate the price uncertainty of a portion of our future purchases, including diesel fuel and other commodities, we enter into swap contracts, futures and collars that are not designated as hedging instruments. The resulting gains and losses are recorded in interest income and other, net to help offset price fluctuations on our beverage, food, packaging and transportation costs, which are included in product and distribution costs on our consolidated statements of earnings.
Gains and losses on derivative contracts and foreign currency-denominated debt designated as hedging instruments included in AOCI and expected to be reclassified into earnings within 12 months, net of tax (in millions): | | | | | | | | | | | | | | | | | | | | | | | | | | | | | |
| Net Gains/(Losses) Included in AOCI | | Net Gains/(Losses) Expected to be Reclassified from AOCI into Earnings within 12 Months | | Outstanding Contract/Debt Remaining Maturity (Months) |
| Oct 2,
2022 | | Oct 3,
2021 | | Sep 27,
2020 | | |
| Cash Flow Hedges: | | | | | | | | | |
| Coffee | $ | 153.9 | | | $ | 197.8 | | | $ | (2.5) | | | $ | 148.3 | | | 6 |
| Cross-currency swaps | (1.9) | | | 4.4 | | | 5.2 | | | — | | | 26 |
| Dairy | (2.6) | | | (0.4) | | | 0.5 | | | (2.6) | | | 11 |
| Foreign currency - other | 55.3 | | | 1.3 | | | 5.3 | | | 32.5 | | | 33 |
| Interest rates | (5.8) | | | (44.8) | | | (90.6) | | | 1.2 | | | 0 |
| Net Investment Hedges: | | | | | | | | | |
| Cross-currency swaps | 67.3 | | | 37.9 | | | 32.6 | | | — | | | 84 |
| Foreign currency | 16.1 | | | 16.0 | | | 16.0 | | | — | | | 0 |
| Foreign currency debt | 125.7 | | | (5.3) | | | (37.1) | | | — | | | 18 |
Pre-tax gains and losses on derivative contracts and foreign currency-denominated long-term debt designated as hedging instruments recognized in OCI and reclassifications from AOCI to earnings (in millions): | | | | | | | | | | | | | | | | | | | | | | | | | | | | | | | | | | | | | | | | | | | | | | |
| | | | | | Year Ended | | |
| | | | Gains/(Losses) Recognized in OCI Before Reclassifications | | Gains/(Losses) Reclassified from
AOCI to Earnings | | Location of gain/(loss) |
| | | | | Oct 2,
2022 | | Oct 3,
2021 | | Sep 27,
2020 | | Oct 2,
2022 | | Oct 3,
2021 | | Sep 27,
2020 | |
| Cash Flow Hedges: | | | | | | | | | | | | | | | | | | |
| Coffee | | | | | | $ | 76.9 | | | $ | 223.5 | | | $ | (1.2) | | | $ | 126.2 | | | $ | (3.5) | | | $ | 0.5 | | | Product and distribution costs |
| Cross-currency swaps | | | | | | 24.8 | | | 13.7 | | | 4.4 | | | (6.9) | | | 1.9 | | | 2.3 | | | Interest expense |
| | | | | | | | 39.4 | | | 12.7 | | | (6.1) | | | Interest income and other, net |
| Dairy | | | | | | 3.6 | | | 0.5 | | | 3.0 | | | 6.5 | | | 1.7 | | | 4.0 | | | Product and distribution costs |
| | | | | | | | — | | | — | | | (1.7) | | | Interest income and other, net(1) |
| Foreign currency - other | | | | | | 103.9 | | | (10.0) | | | (6.4) | | | 22.0 | | | 1.8 | | | 5.5 | | | Licensed stores revenues |
| | | | | | | | (2.3) | | | (7.3) | | | (8.7) | | | Product and distribution costs |
| | | | | | | | 13.7 | | | — | | | 6.1 | | | Interest income and other, net(1) |
| Interest rates | | | | | | 50.3 | | | 56.1 | | | (126.1) | | | (2.0) | | | (1.8) | | | — | | | Interest expense |
| | | | | | | | | | | — | | | (3.6) | | | — | | | Interest income and other, net |
| Net Investment Hedges: | | | | | | | | | | | | | | | | | | |
| Cross-currency swaps | | | | | | 53.5 | | | 20.5 | | | 56.8 | | | 14.3 | | | 13.4 | | | 13.3 | | | Interest expense |
| | | | | | | | | | | | | | | | | | |
| Foreign currency debt | | | | | | 175.5 | | | 42.6 | | | (18.1) | | | — | | | — | | | — | | | |
(1)As a result of the global COVID-19 impacts, we discontinued certain cash flow hedges during the fiscal year ended September 27, 2020.
Pre-tax gains and losses on non-designated derivatives and designated fair value hedging instruments and the related fair value hedged item recognized in earnings (in millions): | | | | | | | | | | | | | | | | | | | | | | | | | | | |
| | | | | | | Gains/(Losses) Recognized in Earnings |
| | Location of gain/(loss) recognized in earnings | | | | Year Ended |
| | | | | | | Oct 2, 2022 | | Oct 3, 2021 | | Sep 27, 2020 |
| Non-Designated Derivatives: | | | | | | | | | | | |
| Dairy | Interest income and other, net | | | | | | $ | 0.2 | | | $ | — | | | $ | — | |
| Diesel fuel and other commodities | Interest income and other, net | | | | | | 3.7 | | | 2.6 | | | (8.8) | |
| Coffee | Interest income and other, net | | | | | | 9.2 | | | — | | | — | |
| Foreign currency - other | Interest income and other, net | | | | | | 46.8 | | | 7.5 | | | 0.3 | |
| Fair Value Hedges: | | | | | | | | | | | |
| Interest rate swap | Interest expense | | | | | | (65.0) | | | (0.5) | | | 28.7 | |
| Long-term debt (hedged item) | Interest expense | | | | | | 73.9 | | | 14.0 | | | (23.8) | |
Notional amounts of outstanding derivative contracts (in millions): | | | | | | | | | | | |
| Oct 2, 2022 | | Oct 3, 2021 |
| Coffee | $ | 649 | | | $ | 481 | |
| Cross-currency swaps | 741 | | | 806 | |
| Dairy | 94 | | | 53 | |
| Diesel fuel and other commodities | 33 | | | 10 | |
| Foreign currency - other | 1,269 | | | 1,009 | |
| Interest rate swaps | 1,100 | | | 1,250 | |
Fair value of outstanding derivative contracts (in millions) including the location of the asset and/or liability on the consolidated balance sheets: | | | | | | | | | | | | | | | | | |
| | | Derivative Assets |
| Balance Sheet Location | | Oct 2, 2022 | | Oct 3, 2021 |
| Designated Derivative Instruments: | | | | | |
| Coffee | Prepaid expenses and other current assets | | $ | — | | | $ | 130.5 | |
| Cross-currency swaps | Other long-term assets | | 115.4 | | | 54.7 | |
| Dairy | Prepaid expenses and other current assets | | 0.5 | | | 0.8 | |
| Foreign currency - other | Prepaid expenses and other current assets | | 39.9 | | | 8.9 | |
| Other long-term assets | | 33.5 | | | 6.9 | |
| | | | | |
| Interest rate swap | Other long-term assets | | — | | | 22.7 | |
| Non-designated Derivative Instruments: | | | | | |
| | | | | |
| Diesel fuel and other commodities | Prepaid expenses and other current assets | | 0.4 | | | 0.1 | |
| Foreign currency | Prepaid expenses and other current assets | | 34.3 | | | 7.3 | |
| Other long-term assets | | 7.3 | | | — | |
| | | | | |
| | | Derivative Liabilities |
| Balance Sheet Location | | Oct 2, 2022 | | Oct 3, 2021 |
| Designated Derivative Instruments: | | | | | |
| | | | | |
| | | | |
| Cross-currency swaps | Other long-term liabilities | | $ | — | | | $ | 3.3 | |
| Dairy | Accrued liabilities | | 2.9 | | | 0.9 | |
| Foreign currency - other | Accrued liabilities | | 0.3 | | | 7.4 | |
| Other long-term liabilities | | — | | | 3.6 | |
| Interest rates | Accrued liabilities | | 12.0 | | | — | |
| Other long-term liabilities | | — | | | 1.3 | |
| Interest rate swap | Other long-term liabilities | | 34.0 | | | — | |
| Non-designated Derivative Instruments: | | | | | |
| Dairy | Accrued liabilities | | — | | | 0.2 | |
| | | | | |
| Foreign currency | Accrued liabilities | | 5.8 | | | 0.1 | |
| | | | | |
The following amounts were recorded on the consolidated balance sheets related to fixed-to-floating interest rate swaps designated in fair value hedging relationships: | | | | | | | | | | | | | | | | | | | | | | | |
| Carrying amount of hedged item | | Cumulative amount of fair value hedging adjustment included in the carrying amount |
| Oct 2, 2022 | | Oct 3, 2021 | | Oct 2, 2022 | | Oct 3, 2021 |
| Location on the balance sheet | | | | | | | |
| Long-term debt | $ | 1,047.7 | | | $ | 771.7 | | | $ | (52.3) | | | $ | 21.7 | |
Additional disclosures related to cash flow gains and losses included in AOCI, as well as subsequent reclassifications to earnings, are included in Note 12, Equity.
Note 4: Fair Value Measurements
Assets and Liabilities Measured at Fair Value on a Recurring Basis (in millions): | | | | | | | | | | | | | | | | | | | | | | | |
| | | | Fair Value Measurements at Reporting Date Using |
| | Balance at
October 2, 2022 | | Quoted Prices in Active Markets for Identical Assets (Level 1) | | Significant Other Observable Inputs (Level 2) | | Significant Unobservable Inputs (Level 3) |
| Assets: | | | | | | | |
| Cash and cash equivalents | $ | 2,818.4 | | | $ | 2,797.3 | | | $ | 21.1 | | | $ | — | |
| Short-term investments: | | | | | | | |
| Available-for-sale debt securities | | | | | | | |
| | | | | | | |
| | | | | | | |
| | | | | | | |
| Corporate debt securities | 22.4 | | | — | | | 22.4 | | | — | |
| | | | | | | |
| | | | | | | |
| | | | | | | |
| | | | | | | |
| U.S. government treasury securities | 9.3 | | | 9.3 | | | — | | | — | |
| Total available-for-sale debt securities | 31.7 | | | 9.3 | | | 22.4 | | | — | |
| Structured deposits | 275.1 | | | — | | | 275.1 | | | — | |
| Marketable equity securities | 57.7 | | | 57.7 | | | — | | | — | |
| Total short-term investments | 364.5 | | | 67.0 | | | 297.5 | | | — | |
| Prepaid expenses and other current assets: | | | | | | | |
| Derivative assets | 75.1 | | | — | | | 75.1 | | | — | |
| Long-term investments: | | | | | | | |
| Available-for-sale debt securities | | | | | | | |
| | | | | | | |
| | | | | | | |
| | | | | | | |
| Corporate debt securities | 134.7 | | | — | | | 134.7 | | | — | |
| Foreign government obligations | 3.8 | | | — | | | 3.8 | | | — | |
| Mortgage and other asset-backed securities | 56.5 | | | — | | | 56.5 | | | — | |
| State and local government obligations | 1.3 | | | — | | | 1.3 | | | — | |
| U.S. government treasury securities | 82.8 | | | 82.8 | | | — | | | — | |
| Total long-term investments | 279.1 | | | 82.8 | | | 196.3 | | | — | |
| Other long-term assets: | | | | | | | |
| Derivative assets | 156.2 | | | — | | | 156.2 | | | — | |
| Total assets | $ | 3,693.3 | | | $ | 2,947.1 | | | $ | 746.2 | | | $ | — | |
| Liabilities: | | | | | | | |
| Accrued liabilities: | | | | | | | |
| Derivative liabilities | $ | 21.0 | | | $ | — | | | $ | 21.0 | | | $ | — | |
| Other long-term liabilities: | | | | | | | |
| Derivative liabilities | 34.0 | | | — | | | 34.0 | | | — | |
| Total liabilities | $ | 55.0 | | | $ | — | | | $ | 55.0 | | | $ | — | |
| | | | | | | | | | | | | | | | | | | | | | | |
| | | | Fair Value Measurements at Reporting Date Using |
| | Balance at
October 3, 2021 | | Quoted Prices
in Active
Markets for
Identical Assets
(Level 1) | | Significant
Other Observable
Inputs
(Level 2) | | Significant
Unobservable Inputs
(Level 3) |
| Assets: | | | | | | | |
| Cash and cash equivalents | $ | 6,455.7 | | | $ | 6,455.7 | | | $ | — | | | $ | — | |
| Short-term investments: | | | | | | | |
| Available-for-sale debt securities | | | | | | | |
| | | | | | | |
| | | | | | | |
| Commercial paper | 63.0 | | | — | | | 63.0 | | | — | |
| Corporate debt securities | 24.7 | | | — | | | 24.7 | | | — | |
| | | | | | | |
| Mortgage and other asset-backed securities | 0.1 | | | — | | | 0.1 | | | — | |
| | | | | | | |
| Total available-for-sale debt securities | 87.8 | | | — | | | 87.8 | | | — | |
| Marketable equity securities | 74.4 | | | 74.4 | | | — | | | — | |
| Total short-term investments | 162.2 | | | 74.4 | | | 87.8 | | | — | |
| Prepaid expenses and other current assets: | | | | | | | |
| Derivative assets | 147.6 | | | 131.1 | | | 16.5 | | | — | |
| Long-term investments: | | | | | | | |
| Available-for-sale debt securities | | | | | | | |
| | | | | | | |
| Auction rate securities | 6.0 | | | — | | | — | | | 6.0 | |
| | | | | | | |
| Corporate debt securities | 162.0 | | | — | | | 162.0 | | | — | |
| Foreign government obligations | 4.0 | | | — | | | 4.0 | | | — | |
| Mortgage and other asset-backed securities | 31.9 | | | — | | | 31.9 | | | — | |
| State and local government obligations | 1.5 | | | — | | | 1.5 | | | — | |
| U.S. government treasury securities | 76.3 | | | 76.3 | | | — | | | — | |
| Total long-term investments | 281.7 | | | 76.3 | | | 199.4 | | | 6.0 | |
| Other long-term assets: | | | | | | | |
| Derivative assets | 84.3 | | | — | | | 84.3 | | | — | |
| Total assets | $ | 7,131.5 | | | $ | 6,737.5 | | | $ | 388.0 | | | $ | 6.0 | |
| Liabilities: | | | | | | | |
| Accrued liabilities: | | | | | | | |
| Derivative liabilities | $ | 8.6 | | | $ | 0.3 | | | $ | 8.3 | | | $ | — | |
| Other long-term liabilities: | | | | | | | |
| Derivative liabilities | 8.2 | | | — | | | 8.2 | | | — | |
| Total liabilities | $ | 16.8 | | | $ | 0.3 | | | $ | 16.5 | | | $ | — | |
There were no material transfers between levels and there was no significant activity within Level 3 instruments during the periods presented. The fair values of any financial instruments presented above exclude the impact of netting assets and liabilities when a legally enforceable master netting agreement exists.
Available-for-sale Debt Securities
Long-term investments generally mature within 5 years. Proceeds from sales of securities were $72.6 million, $134.1 million and $177.4 million for fiscal 2022, 2021 and 2020, respectively. Realized gains and losses were not material for fiscal 2022, 2021 and 2020. Gross unrealized holding gains and losses were not material as of October 2, 2022 and October 3, 2021.
Marketable Equity Securities
Marketable equity securities include equity mutual funds and exchange-traded funds. Our marketable equity securities portfolio approximates a portion of our liability under our MDCP, a defined contribution plan. Our MDCP liability was $85.9 million and $105.2 million as of October 2, 2022 and October 3, 2021, respectively. The changes in net unrealized holding gains and losses in the marketable equity securities portfolio included in earnings for fiscal 2022, 2021 and 2020 were not material. Gross unrealized holding gains and losses on marketable equity securities were not material as of October 2, 2022 and October 3, 2021.
Derivative Assets and Liabilities
Derivative assets and liabilities include foreign currency forward contracts, commodity futures contracts, collars and swaps, which are described further in Note 3, Derivative Financial Instruments. Assets and Liabilities Measured at Fair Value on a Nonrecurring Basis
Assets and liabilities recognized or disclosed at fair value on a nonrecurring basis include items such as property, plant and equipment, goodwill and other intangible assets, equity and other investments and other assets. These assets are measured at fair value if determined to be impaired. Impairment of property, plant and equipment and ROU assets is included in Note 1, Summary of Significant Accounting Policies and Estimates. We recognized impairments during fiscal years ended October 2, 2022, October 3, 2021 and September 27, 2020. Impairments recognized in fiscal years ended October 3, 2021 and September 27, 2020 were primarily related to our restructuring plan. See Note 1, Summary of Significant Accounting Policies and Estimates, Note 8, Other Intangible Assets and Goodwill and Note 10, Leases for additional discussion of these impairments. Fair Value of Other Financial Instruments
The estimated fair value of our long-term debt based on the quoted market price (Level 2) is included at Note 9, Debt. Note 5: Inventories (in millions) | | | | | | | | | | | |
| Oct 2, 2022 | | Oct 3, 2021 |
| Coffee: | | | |
| Unroasted | $ | 1,018.6 | | | $ | 670.3 | |
| Roasted | 310.3 | | | 233.5 | |
| Other merchandise held for sale | 430.9 | | | 329.3 | |
| Packaging and other supplies | 416.8 | | | 370.8 | |
| Total | $ | 2,176.6 | | | $ | 1,603.9 | |
Other merchandise held for sale includes, among other items, serveware, food and tea. Inventory levels vary due to seasonality, commodity market supply and price fluctuations.
As of October 2, 2022, we had committed to purchasing green coffee totaling $351 million under fixed-price contracts and an estimated $995 million under price-to-be-fixed contracts. A portion of our price-to-be-fixed contacts are effectively fixed through the use of futures. See Note 3, Derivative Financial Instruments for further discussion. Price-to-be-fixed contracts are purchase commitments whereby the quality, quantity, delivery period and other negotiated terms are agreed upon, but the date, and therefore the price, at which the base “C” coffee commodity price component will be fixed has not yet been established. For most contracts, either Starbucks or the seller has the option to “fix” the base “C” coffee commodity price prior to the delivery date. For other contracts, Starbucks and the seller may agree upon pricing parameters determined by the base “C” coffee commodity price. Until prices are fixed, we estimate the total cost of these purchase commitments. We believe, based on relationships established with our suppliers in the past and continuous monitoring of the business environment, the risk of non-delivery on these purchase commitments is remote. During the fiscal years ended October 2, 2022 and October 3, 2021, we did not record significant write-offs related to the COVID-19 pandemic. During fiscal 2020, we wrote off approximately $50 million of inventory that was expiring or expected to expire due to COVID-19 pandemic related store closures, primarily perishable food and beverage ingredients located at our stores, distribution centers and suppliers. This was included in product and distribution costs on our consolidated statement of earnings.
Note 6: Equity Investments (in millions) | | | | | | | | | | | |
| Oct 2, 2022 | | Oct 3, 2021 |
| Equity method investments | $ | 283.1 | | | $ | 216.0 | |
| Other investments | 28.1 | | | 52.5 | |
| Total | $ | 311.2 | | | $ | 268.5 | |
Equity Method Investments
As of October 2, 2022, we had a 50% ownership interest in Tata Starbucks Limited (India), which operates licensed Starbucks® retail stores. Prior to its divestiture in September 2021, we had a 50% ownership interest in Starbucks Coffee Korea Co., Ltd. Additional disclosure regarding changes in our equity method investments due to acquisition or divestiture is included in Note 2, Acquisitions, Divestitures and Strategic Alliance. We also license the rights to produce and distribute Starbucks-branded products to our 50% owned joint venture, The North American Coffee Partnership with the Pepsi-Cola Company, which develops and distributes bottled Starbucks® beverages, including Frappuccino coffee drinks, Starbucks Doubleshot espresso drinks, Starbucks® Iced Espresso Classics and Starbucks® Iced Coffee.
Our share of income and losses from our equity method investments is included in income from equity investees on our consolidated statements of earnings. Also included in this line item is our proportionate share of gross profit resulting from coffee and other product sales to, and royalty and license fee revenues generated from, equity investees. Revenues generated from these entities were $80.9 million, $160.8 million and $123.9 million in fiscal 2022, 2021 and 2020, respectively. Related product and distribution costs were $76.5 million, $92.1 million and $79.8 million in fiscal 2022, 2021 and 2020, respectively. As of October 2, 2022 and October 3, 2021, there were $14.8 million and $7.9 million of accounts receivable from equity investees, respectively, on our consolidated balance sheets, primarily related to product sales and royalty revenues.
Additionally, we hold equity interests in other entities to support our corporate and investment strategies. The related financial statements activities were not material during the periods presented.
Other Investments
We have equity interests in entities that develop and operate Starbucks licensed stores in several global markets, as well as in companies that support our strategic initiatives. We do not have significant influence over these entities and their fair values are not readily determinable. Therefore, we elected to measure these investments at cost with adjustments for observable changes in price or impairment.
Note 7: Supplemental Balance Sheet and Statement of Earnings Information (in millions)
Prepaid Expenses and Other Current Assets | | | | | | | | | | | |
| Oct 2, 2022 | | Oct 3, 2021 |
| Income tax receivable | $ | 27.7 | | | $ | 20.7 | |
| Government subsidies receivable | 69.4 | | | 172.4 | |
| Other prepaid expenses and current assets | 386.6 | | | 401.5 | |
| Total prepaid expenses and current assets | $ | 483.7 | | | $ | 594.6 | |
Property, Plant and Equipment, net | | | | | | | | | | | |
| Oct 2, 2022 | | Oct 3, 2021 |
| Land | $ | 46.1 | | | $ | 46.2 | |
| Buildings | 555.4 | | | 587.6 | |
| Leasehold improvements | 9,066.8 | | | 8,637.6 | |
| Store equipment | 3,018.2 | | | 2,934.1 | |
| Roasting equipment | 838.5 | | | 857.2 | |
| Furniture, fixtures and other | 1,526.1 | | | 1,392.0 | |
| Work in progress | 558.7 | | | 374.1 | |
| Property, plant and equipment, gross | 15,609.8 | | | 14,828.8 | |
| Accumulated depreciation | (9,049.3) | | | (8,459.3) | |
| Property, plant and equipment, net | $ | 6,560.5 | | | $ | 6,369.5 | |
Accrued Liabilities | | | | | | | | | | | |
| Oct 2, 2022 | | Oct 3, 2021 |
| | | |
| Accrued occupancy costs | $ | 84.6 | | | $ | 107.1 | |
| Accrued dividends payable | 608.3 | | | 578.1 | |
| Accrued capital and other operating expenditures | 878.1 | | | 840.7 | |
| Self-insurance reserves | 232.3 | | | 229.3 | |
| Income taxes payable | 139.2 | | | 348.0 | |
| Accrued business taxes | 194.6 | | | 218.0 | |
| Total accrued liabilities | $ | 2,137.1 | | | $ | 2,321.2 | |
Store Operating Expenses | | | | | | | | | | | | | | | | | | | | |
| | Year Ended |
| | Oct 2, 2022 | | Oct 3, 2021 | | Sep 27, 2020 |
| Wages and benefits | | $ | 8,157.7 | | | $ | 6,989.3 | | | $ | 6,131.9 | |
| Occupancy costs | | 2,674.1 | | | 2,561.5 | | | 2,388.0 | |
| Other expenses | | 2,730.0 | | | 2,380.1 | | | 2,244.1 | |
| Total store operating expenses | | $ | 13,561.8 | | | $ | 11,930.9 | | | $ | 10,764.0 | |
Note 8: Other Intangible Assets and Goodwill
Indefinite-Lived Intangible Assets | | | | | | | | | | | |
| (in millions) | Oct 2, 2022 | | Oct 3, 2021 |
| Trade names, trademarks and patents | $ | 97.5 | | | $ | 96.4 | |
| | | |
| | | |
Finite-Lived Intangible Assets | | | | | | | | | | | | | | | | | | | | | | | | | | | | | | | | | | | |
| Oct 2, 2022 | | Oct 3, 2021 |
| (in millions) | Gross Carrying Amount | | Accumulated Amortization | | Net Carrying Amount | | Gross Carrying Amount | | Accumulated Amortization | | Net Carrying Amount |
| Acquired and reacquired rights | $ | 990.0 | | | $ | (990.0) | | | $ | — | | | $ | 1,141.5 | | | $ | (971.9) | | | $ | 169.6 | |
| Acquired trade secrets and processes | 27.6 | | | (27.3) | | | 0.3 | | | 27.6 | | | (24.8) | | | 2.8 | |
| Trade names, trademarks and patents | 124.6 | | | (69.6) | | | 55.0 | | | 126.3 | | | (51.9) | | | 74.4 | |
| Licensing agreements | 19.3 | | | (16.2) | | | 3.1 | | | 18.8 | | | (13.5) | | | 5.3 | |
| Other finite-lived intangible assets | 20.6 | | | (20.6) | | | — | | | 24.0 | | | (22.6) | | | 1.4 | |
| Total finite-lived intangible assets | $ | 1,182.1 | | | $ | (1,123.7) | | | $ | 58.4 | | | $ | 1,338.2 | | | $ | (1,084.7) | | | $ | 253.5 | |
Amortization expense for finite-lived intangible assets was $192.7 million, $223.4 million and $223.7 million during fiscal 2022, 2021 and 2020, respectively. Our fiscal 2022 and 2021 analyses indicated excess fair values over carrying values for these assets, and therefore no impairment charge was recorded during these years. During the fiscal year ended September 27, 2020, we recorded a charge of $22.1 million to restructuring and impairments on our consolidated statement of earnings as the analysis indicated the carrying value of one of the assets exceeded its fair value.
Estimated future amortization expense as of October 2, 2022 (in millions): | | | | | |
| Fiscal Year Ending | |
| 2023 | $ | 20.5 | |
| 2024 | 19.9 | |
| 2025 | 13.9 | |
| 2026 | 1.3 | |
| 2027 | 1.0 | |
| Thereafter | 1.8 | |
| Total estimated future amortization expense | $ | 58.4 | |
Goodwill
Changes in the carrying amount of goodwill by reportable operating segment (in millions): | | | | | | | | | | | | | | | | | | | | | | | | | | | | | |
| North America | | International | | Channel
Development | | Corporate and Other | | Total |
| Goodwill balance at September 27, 2020 | $ | 491.8 | | | $ | 3,069.7 | | | $ | 34.7 | | | $ | 1.0 | | | $ | 3,597.2 | |
| | | | | | | | | |
| | | | | | | | | |
Other (1) | 1.4 | | | 78.6 | | | — | | | 0.1 | | | 80.1 | |
| Goodwill balance at October 3, 2021 | $ | 493.2 | | | $ | 3,148.3 | | | $ | 34.7 | | | $ | 1.1 | | | $ | 3,677.3 | |
| | | | | | | | | |
| | | | | | | | | |
Other (1) | (2.1) | | | (391.6) | | | — | | | (0.1) | | | (393.8) | |
| Goodwill balance at October 2, 2022 | $ | 491.1 | | | $ | 2,756.7 | | | $ | 34.7 | | | $ | 1.0 | | | $ | 3,283.5 | |
(1)“Other” consists of changes in the goodwill balance resulting from foreign currency translation.
During the fiscal year ended October 2, 2022, we completed our annual goodwill impairment analysis. The results of our analysis indicated significant excess fair values over carrying values across the different reporting units, and therefore no goodwill impairment was recorded.
Note 9: Debt
Revolving Credit Facility
Our $3.0 billion unsecured 5-year revolving credit facility (the “2021 credit facility”), of which $150 million may be used for issuances of letters of credit, is currently set to mature on September 16, 2026. The 2021 credit facility is available for working capital, capital expenditures and other corporate purposes, including acquisitions and share repurchases. We have the option,
subject to negotiation and agreement with the related banks, to increase the maximum commitment amount by an additional $1.0 billion.
Borrowings under the credit facility will bear interest at a variable rate based on LIBOR, and, for U.S. dollar-denominated loans under certain circumstances, a Base Rate (as defined in the credit facility), in each case plus an applicable margin. The applicable margin is based on the Company’s long-term credit ratings assigned by Moody’s and Standard & Poor’s rating agencies. The 2021 credit facility contains alternative interest rate provisions specifying rate calculations to be used at such time LIBOR ceases to be available as a benchmark due to reference rate reform. The “Base Rate” of interest is the highest of (i) the Federal Funds Rate plus 0.500%, (ii) Bank of America’s prime rate, and (iii) the Eurocurrency Rate (as defined in the credit facility) plus 1.000%.
The 2021 credit facility contains provisions requiring us to maintain compliance with certain covenants, including a minimum fixed charge coverage ratio, which measures our ability to cover financing expenses. As of October 2, 2022, we were in compliance with all applicable covenants. No amounts were outstanding under our 2021 credit facility as of October 2, 2022.
Short-term Debt
Under our commercial paper program, we may issue unsecured commercial paper notes up to a maximum aggregate amount outstanding at any time of $3.0 billion, with individual maturities that may vary but not exceed 397 days from the date of issue. Amounts outstanding under the commercial paper program are required to be backstopped by available commitments under our credit facility discussed above. The proceeds from borrowings under our commercial paper program may be used for working capital needs, capital expenditures and other corporate purposes, including, but not limited to, business expansion, payment of cash dividends on our common stock and share repurchases. As of October 2, 2022, we had $175.0 million in borrowings outstanding under the program. As of October 3, 2021, we had no borrowings outstanding under this program.
Additionally, we hold the following Japanese yen-denominated credit facilities that are available for working capital needs and capital expenditures within our Japanese market:
•A ¥5 billion, or $34.6 million, facility is currently set to mature on December 31, 2022. Borrowings under the credit facility are subject to terms defined within the facility and will bear interest at a variable rate based on TIBOR plus an applicable margin of 0.400%.
•A ¥10 billion, or $69.2 million, facility is currently set to mature on March 27, 2023. Borrowings under the credit facility are subject to terms defined within the facility and will bear interest at a variable rate based on TIBOR plus 0.350%.
As of October 2, 2022 and October 3, 2021, we had no borrowings outstanding under these Japanese yen-denominated credit facilities.
Long-term Debt
Components of long-term debt including the associated interest rates and related fair values by calendar maturity (in millions, except interest rates): | | | | | | | | | | | | | | | | | | | | | | | | | | |
| Oct 2, 2022 | | Oct 3, 2021 | | Stated Interest Rate | Effective Interest Rate (1) |
| Issuance | Face Value | Estimated Fair Value | | Face Value | Estimated Fair Value | |
| May 2022 notes | — | | — | | | 500.0 | | 503.1 | | | 1.300 | % | 1.334 | % |
| June 2022 notes | — | | — | | | 500.0 | | 506.7 | | | 2.700 | % | 2.819 | % |
| March 2023 notes | 1,000.0 | | 996.5 | | | 1,000.0 | | 1,035.9 | | | 3.100 | % | 3.107 | % |
October 2023 notes(2) | 750.0 | | 744.8 | | | 750.0 | | 794.8 | | | 3.850 | % | 2.859 | % |
February 2024 notes(3) | 500.0 | | 497.3 | | | — | | — | | | 2.912 | % | 3.143 | % |
March 2024 notes(4) | 588.4 | | 584.7 | | | 763.8 | | 761.0 | | | 0.372 | % | 0.462 | % |
| August 2025 notes | 1,250.0 | | 1,209.6 | | | 1,250.0 | | 1,371.5 | | | 3.800 | % | 3.721 | % |
| June 2026 notes | 500.0 | | 458.3 | | | 500.0 | | 526.4 | | | 2.450 | % | 2.511 | % |
| March 2027 notes | 500.0 | | 437.9 | | | 500.0 | | 513.0 | | | 2.000 | % | 2.058 | % |
| March 2028 notes | 600.0 | | 554.8 | | | 600.0 | | 663.2 | | | 3.500 | % | 3.529 | % |
| November 2028 notes | 750.0 | | 704.7 | | | 750.0 | | 855.9 | | | 4.000 | % | 3.958 | % |
August 2029 notes(2) | 1,000.0 | | 900.3 | | | 1,000.0 | | 1,109.9 | | | 3.550 | % | 3.840 | % |
| March 2030 notes | 750.0 | | 607.7 | | | 750.0 | | 758.6 | | | 2.250 | % | 3.084 | % |
| November 2030 notes | 1,250.0 | | 1,017.9 | | | 1,250.0 | | 1,286.9 | | | 2.550 | % | 2.582 | % |
| February 2032 notes | 1,000.0 | | 827.1 | | | — | | — | | | 3.000 | % | 3.155 | % |
| June 2045 notes | 350.0 | | 281.5 | | | 350.0 | | 414.1 | | | 4.300 | % | 4.348 | % |
| December 2047 notes | 500.0 | | 369.6 | | | 500.0 | | 556.5 | | | 3.750 | % | 3.765 | % |
| November 2048 notes | 1,000.0 | | 824.6 | | | 1,000.0 | | 1,248.6 | | | 4.500 | % | 4.504 | % |
| August 2049 notes | 1,000.0 | | 817.8 | | | 1,000.0 | | 1,241.0 | | | 4.450 | % | 4.447 | % |
| March 2050 notes | 500.0 | | 342.0 | | | 500.0 | | 527.5 | | | 3.350 | % | 3.362 | % |
| November 2050 notes | 1,250.0 | | 874.9 | | | 1,250.0 | | 1,339.5 | | | 3.500 | % | 3.528 | % |
| Total | 15,038.4 | | 13,052.0 | | | 14,713.8 | | 16,014.1 | | | | |
| Aggregate debt issuance costs and unamortized premium/(discount), net | (117.2) | | | | (119.7) | | | | | |
Hedge accounting fair value adjustment(2) | (52.3) | | | | 21.7 | | | | | |
| Total | $ | 14,868.9 | | | | $ | 14,615.8 | | | | | |
(1)Includes the effects of the amortization of any premium or discount and any gain or loss upon settlement of related treasury locks or forward-starting interest rate swaps utilized to hedge the interest rate risk prior to the debt issuance.
(2)Amount includes the change in fair value due to changes in benchmark interest rates related to hedging our October 2023 notes and $350 million of our August 2029 notes. Refer to Note 3, Derivative Financial Instruments, for additional information on our interest rate swap designated as a fair value hedge. (3)Floating rate notes which bear interest at a rate equal to Compounded SOFR (as defined in the February 2024 notes) plus 0.420%, resulting in a stated interest rate of 2.912% at October 2, 2022.
(4)Japanese yen-denominated long-term debt.
The following table summarizes our long-term debt maturities as of October 2, 2022 by fiscal year (in millions): | | | | | |
| Fiscal Year | Total |
| 2023 | $ | 1,750.0 | |
| 2024 | 1,088.4 | |
| 2025 | 1,250.0 | |
| 2026 | 500.0 | |
| 2027 | 500.0 | |
| Thereafter | 9,950.0 | |
| Total | $ | 15,038.4 | |
Note 10: Leases
In fiscal 2021, we substantially completed our plan to optimize our North America store portfolio, primarily in dense metropolitan markets by developing new store formats to better cater to changing customer tastes and preferences. During the fiscal years ended October 3, 2021 and September 27, 2020, we recognized accelerated amortization of ROU lease assets and other lease costs of $89.5 million and $87.7 million, respectively, which were recognized within restructuring and impairments on the consolidated statements of earnings. We did not recognize any material restructuring and impairment amounts related to this plan during the fiscal year ended October 2, 2022.
The components of lease costs (in millions): | | | | | | | | | | | | | | | | | | | |
| Year Ended | | |
| Oct 2, 2022 | | Oct 3, 2021 | | Sep 27, 2020 | | |
Operating lease costs(1) | $ | 1,554.8 | | | $ | 1,579.2 | | | $ | 1,573.6 | | | |
| Variable lease costs | 939.1 | | | 949.6 | | | 833.4 | | | |
| Short-term lease costs | 28.1 | | | 30.9 | | | 34.1 | | | |
| Total lease costs | $ | 2,522.0 | | | $ | 2,559.7 | | | $ | 2,441.1 | | | |
| | | | | | | |
| | | | | | | |
| | | | | | | |
(1)Includes immaterial amounts of sublease income and rent concessions.
The following table includes supplemental information (in millions): | | | | | | | | | | | | | | | | | | | |
| Year Ended | | |
| Oct 2, 2022 | | Oct 3, 2021 | | Sep 27, 2020 | | |
| Cash paid related to operating lease liabilities | $ | 1,647.3 | | | $ | 1,707.1 | | | $ | 1,463.3 | | | |
Operating lease liabilities arising from obtaining ROU assets(1) | 1,639.4 | | | 1,590.3 | | | 1,093.0 | | | |
| | | | | | | |
| | | | | | | |
| | | | | | | |
(1)Excludes the initial impact of adoption during the fiscal year ended September 27, 2020.
| | | | | | | | | | | | | | | | | |
| Oct 2, 2022 | | Oct 3, 2021 | | Sep 27, 2020 |
| Weighted-average remaining operating lease term | 8.5 years | | 8.7 years | | 8.8 years |
| Weighted-average operating lease discount rate | 2.6 | % | | 2.5 | % | | 2.5 | % |
Finance lease assets are recorded in property, plant and equipment, net with the corresponding lease liabilities included in accrued liabilities on the consolidated balance sheet. Finance leases were immaterial as of October 2, 2022, October 3, 2021 and September 27, 2020.
Minimum future maturities of operating lease liabilities (in millions): | | | | | |
| Fiscal Year | Total |
| 2023 | $ | 1,473.5 | |
| 2024 | 1,435.3 | |
| 2025 | 1,293.9 | |
| 2026 | 1,158.3 | |
| 2027 | 963.1 | |
| Thereafter | 3,539.6 | |
| Total lease payments | 9,863.7 | |
| Less imputed interest | (1,102.8) | |
| Total | $ | 8,760.9 | |
As of October 2, 2022, we have entered into operating leases that have not yet commenced of $1.1 billion, primarily related to real estate leases. These leases will commence between fiscal year 2023 and fiscal year 2028 with lease terms of 10 years to 20 years.
Note 11: Deferred Revenue
In the fourth quarter of fiscal 2018, we licensed the rights to sell and market our products in authorized channels through the Global Coffee Alliance and received an up-front prepaid royalty from Nestlé. The up-front payment of approximately $7 billion was recorded as deferred revenue as we have continuing performance obligations to support the Global Coffee Alliance, including providing Nestlé access to certain intellectual properties and products for future resale. The up-front payment is being recognized as other revenue on a straight-line basis over the estimated economic life of the arrangement of 40 years for the ongoing access to the licenses within the contractual territories. Our obligations to maintain the Starbucks brand and other intellectual properties are generally constant throughout the term of the arrangement. Therefore, a ratable recognition pattern is reflective of how we will satisfy our performance obligations.
At October 2, 2022, the current and long-term deferred revenue related to the Nestlé up-front payment was $177.0 million and $6.2 billion, respectively. At October 3, 2021, the current and long-term deferred revenue related to the Nestlé up-front payment was $177.0 million and $6.4 billion, respectively. During the fiscal years ended October 2, 2022, October 3, 2021 and September 27, 2020, we recognized $176.5 million, $176.6 million and $176.8 million of current deferred revenue, respectively, related to amortization of the up-front payment.
Changes in our deferred revenue balance related to our stored value cards and loyalty program (in millions): | | | | | |
Fiscal Year Ended October 2, 2022 | Total |
Stored value cards and loyalty program at October 3, 2021 | $ | 1,448.5 | |
| Revenue deferred - card activations, card reloads and Stars earned | 13,464.7 | |
| Revenue recognized - card and Stars redemptions and breakage | (13,361.9) | |
Other(1) | (48.3) | |
Stored value cards and loyalty program at October 2, 2022(2) | $ | 1,503.0 | |
| |
Fiscal Year Ended October 3, 2021 | Total |
Stored value cards and loyalty program at September 27, 2020 | $ | 1,280.5 | |
| Revenue deferred - card activations, card reloads and Stars earned | 12,563.4 | |
| Revenue recognized - card and Stars redemptions and breakage | (12,401.7) | |
Other(1) | 6.3 | |
Stored value cards and loyalty program at October 3, 2021(2) | $ | 1,448.5 | |
(1)“Other” primarily consists of changes in the stored value cards and loyalty program balances resulting from foreign currency translation.
(2)As of October 2, 2022, approximately $1.4 billion of this amount was current. As of October 3, 2021, approximately $1.3 billion of this amount was current.
Note 12: Equity
In addition to 2.4 billion shares of authorized common stock with $0.001 par value per share, we have authorized 7.5 million shares of preferred stock, none of which was outstanding at October 2, 2022.
Through open market transactions under our share repurchase program, we repurchased 20.3 million shares of common stock for $1.7 billion during the fiscal year ended September 27, 2020. During the second fiscal quarter of 2020, our Board authorized the repurchase of up to an additional 40 million shares under our ongoing share repurchase program. We temporarily suspended our share repurchase program in March 2020 upon the onset of the COVID-19 pandemic, and did not make any share repurchases in fiscal 2021.
Due to our business recovery and restoration of certain leverage metrics, we resumed our share repurchase program in the first quarter of fiscal 2022 and repurchased 36.3 million shares of common stock for $4.0 billion on the open market during the fiscal year ended October 2, 2022. On March 15, 2022, we announced that our Board authorized the repurchase of up to an additional 40 million shares under our ongoing share repurchase program. On April 4, 2022, we announced a temporary suspension of our share repurchase program to allow us to augment investments in our stores and partners. As of October 2, 2022, 52.6 million shares remained available for repurchase under current authorizations. We have resumed our share repurchase program in the first quarter of fiscal 2023.
During the fourth quarter of fiscal 2022, our Board declared a quarterly cash dividend to shareholders of $0.53 per share to be paid on November 25, 2022 to shareholders of record as of the close of business on November 11, 2022.
Comprehensive Income
Comprehensive income includes all changes in equity during the period, except those resulting from transactions with our shareholders. Comprehensive income is comprised of net earnings and other comprehensive income. Accumulated other comprehensive income reported on our consolidated balance sheets consists of foreign currency translation adjustments and other items and the unrealized gains and losses, net of applicable taxes, on available-for-sale debt securities and on derivative instruments designated and qualifying as cash flow and net investment hedges.
Changes in AOCI by component for the fiscal years ended October 2, 2022, October 3, 2021 and September 27, 2020, net of tax, are as follows: | | | | | | | | | | | | | | | | | | | | | | | | | | | | | |
| (in millions) | Available-for-Sale Securities | | Cash Flow Hedges | | Net Investment Hedges | | Translation Adjustment and Other | | Total |
| October 2, 2022 | | | | | | | | | |
| Net gains/(losses) in AOCI, beginning of period | $ | 1.5 | | | $ | 158.3 | | | $ | 48.6 | | | $ | (61.2) | | | $ | 147.2 | |
| Net gains/(losses) recognized in OCI before reclassifications | (17.2) | | | 206.7 | | | 171.1 | | | (794.7) | | | (434.1) | |
| Net (gains)/losses reclassified from AOCI to earnings | 0.2 | | | (166.0) | | | (10.6) | | | 0.1 | | | (176.3) | |
| Other comprehensive income/(loss) attributable to Starbucks | (17.0) | | | 40.7 | | | 160.5 | | | (794.6) | | | (610.4) | |
| | | | | | | | | |
| Net gains/(losses) in AOCI, end of period | $ | (15.5) | | | $ | 199.0 | | | $ | 209.1 | | | $ | (855.8) | | | $ | (463.2) | |
| | | | | | | | | | | | | | | | | | | | | | | | | | | | | |
| (in millions) | Available-for-Sale Securities | | Cash Flow Hedges | | Net Investment Hedges | | Translation Adjustment and Other | | Total |
| October 3, 2021 | | | | | | | | | |
| Net gains/(losses) in AOCI, beginning of period | $ | 5.7 | | | $ | (82.1) | | | $ | 11.5 | | | $ | (299.7) | | | $ | (364.6) | |
| Net gains/(losses) recognized in OCI before reclassifications | (2.7) | | | 240.2 | | | 47.1 | | | 190.4 | | | 475.0 | |
| Net (gains)/losses reclassified from AOCI to earnings | (1.5) | | | 0.2 | | | (10.0) | | | 48.1 | | | 36.8 | |
| Other comprehensive income/(loss) attributable to Starbucks | (4.2) | | | 240.4 | | | 37.1 | | | 238.5 | | | 511.8 | |
| | | | | | | | | |
| Net gains/(losses) in AOCI, end of period | $ | 1.5 | | | $ | 158.3 | | | $ | 48.6 | | | $ | (61.2) | | | $ | 147.2 | |
| | | | | | | | | | | | | | | | | | | | | | | | | | | | | |
| (in millions) | Available-for-Sale Securities | | Cash Flow Hedges | | Net Investment Hedges | | Translation Adjustment and Other | | Total |
| September 27, 2020 | | | | | | | | | |
| Net gains/(losses) in AOCI, beginning of period | $ | 3.9 | | | $ | 11.0 | | | $ | (10.1) | | | $ | (508.1) | | | $ | (503.3) | |
| Net gains/(losses) recognized in OCI before reclassifications | 6.5 | | | (95.0) | | | 28.9 | | | 208.4 | | | 148.8 | |
| Net (gains)/losses reclassified from AOCI to earnings | (4.0) | | | (1.1) | | | (9.8) | | | — | | | (14.9) | |
| Other comprehensive income/(loss) attributable to Starbucks | 2.5 | | | (96.1) | | | 19.1 | | | 208.4 | | | 133.9 | |
| Cumulative effect of accounting adoption | (0.7) | | | 3.0 | | | 2.5 | | | — | | | 4.8 | |
| Net gains/(losses) in AOCI, end of period | $ | 5.7 | | | $ | (82.1) | | | $ | 11.5 | | | $ | (299.7) | | | $ | (364.6) | |
Impact of reclassifications from AOCI on the consolidated statements of earnings (in millions): | | | | | | | | | | | | | | | | | | | | | | | | | | |
AOCI Components | | Amounts Reclassified from AOCI | | Affected Line Item in the Statements of Earnings |
| Year Ended | |
| Oct 2, 2022 | | Oct 3, 2021 | | Sep 27, 2020 | |
| Gains/(losses) on available-for-sale securities | | $ | (0.4) | | | $ | 1.8 | | | $ | 4.9 | | | Interest income and other, net |
| Gains/(losses) on cash flow hedges | | 196.6 | | | 1.9 | | | 1.9 | | | Please refer to Note 3, Derivative Instruments for additional information. |
| | | | | | | | |
| | | | | | | | |
| | | | | | | | |
| | | | | | | | |
| Gains/(losses) on net investment hedges | | 14.3 | | | 13.4 | | | 13.3 | | | Interest expense |
Translation adjustment and other (1) | | | | | | | | |
| | | | | | | | |
| | | | | | | | |
| Korea | | — | | | (58.9) | | | — | | | Net gain resulting from divestiture of certain operations |
| | | | | | | | |
| | | | | | | | |
| | 210.5 | | | (41.8) | | | 20.1 | | | Total before tax |
| | (34.2) | | | 5.0 | | | (5.2) | | | Tax (expense)/benefit |
| | $ | 176.3 | | | $ | (36.8) | | | $ | 14.9 | | | Net of tax |
(1) Release of cumulative translation adjustments and other activities to earnings upon sale or liquidation of foreign businesses.
Note 13: Employee Stock and Benefit Plans
We maintain several equity incentive plans under which we may grant non-qualified stock options, incentive stock options, restricted stock, restricted stock units (“RSUs”) or stock appreciation rights to employees, non-employee directors and consultants. We issue new shares of common stock upon exercise of stock options and the vesting of RSUs. We also have an employee stock purchase plan (“ESPP”).
As of October 2, 2022, there were 99.7 million shares of common stock available for issuance pursuant to future equity-based compensation awards and 10.8 million shares available for issuance under our ESPP.
Stock-based compensation expense recognized in the consolidated financial statements (in millions): | | | | | | | | | | | | | | | | | |
| Fiscal Year Ended | Oct 2, 2022 | | Oct 3, 2021 | | Sep 27, 2020 |
| RSUs | $ | 271.8 | | | $ | 316.9 | | | $ | 241.0 | |
| Options | (0.2) | | | 2.2 | | | 7.5 | |
| Total stock-based compensation expense recognized in the consolidated statements of earnings | $ | 271.6 | | | $ | 319.1 | | | $ | 248.5 | |
| Total related tax benefit | $ | 45.9 | | | $ | 51.6 | | | $ | 47.8 | |
| Total capitalized stock-based compensation included in net property, plant and equipment on the consolidated balance sheets | $ | 3.9 | | | $ | 3.7 | | | $ | 3.6 | |
RSUs
We have both time-vested and performance-based RSUs. Time-vested RSUs are awarded to eligible employees and entitle the grantee to receive shares of common stock at the end of a vesting period, subject to the employee’s continuing employment. The time-vested RSUs generally either vest in two or four equal annual installments beginning a year from the grant date. Our
performance-based RSUs are awarded to eligible employees and entitle the grantee to receive shares of common stock if we achieve specified performance goals during the performance period and the grantee remains employed through the vesting period.
RSU transactions for the fiscal year ended October 2, 2022 (in millions, except per share and contractual life amounts): | | | | | | | | | | | | | | | | | | | | | | | |
| Number
of
Shares | | Weighted
Average
Grant Date
Fair Value
per Share | | Weighted
Average
Remaining
Contractual
Life (Years) | | Aggregate
Intrinsic
Value |
| Nonvested, October 3, 2021 | 7.7 | | | $ | 86.23 | | | 0.9 | | $ | 869 | |
| Granted | 4.2 | | | 107.71 | | | | | |
| Vested | (3.7) | | | 80.02 | | | | | |
| Forfeited/canceled | (1.2) | | | 100.04 | | | | | |
| Nonvested, October 2, 2022 | 7.0 | | | 98.88 | | | 1.0 | | 587 | |
As of October 2, 2022, total unrecognized stock-based compensation expense related to nonvested RSUs, net of estimated forfeitures, was approximately $145 million, before income taxes, and is expected to be recognized over a weighted average period of approximately 2.0 years. The total fair value of RSUs vested was $298 million, $226 million and $211 million during fiscal 2022, 2021 and 2020, respectively. For fiscal 2021 and 2020, the weighted average fair value per RSU granted was $96.05 and $81.96, respectively.
Stock Options
We may provide stock options as a form of employee compensation, which are primarily time-vested. The majority of time-vested options become exercisable in four equal installments beginning a year from the grant date and generally expire 10 years from the grant date. Options granted to non-employee directors generally vest immediately or one year from grant. All outstanding stock options are non-qualified stock options. No stock options were granted during the fiscal year ended October 2, 2022.
The fair value of stock option awards was estimated at the grant date with the following weighted average assumptions for fiscal 2022, 2021 and 2020: | | | | | | | | | | | | | | | | | |
| Stock Options
Granted During the Period |
| Fiscal Year Ended | 2022 | | 2021 | | 2020 |
| Expected term (in years) | 0.0 | | 8.1 | | 7.8 |
| Expected stock price volatility | — | % | | 26.3 | % | | 27.3 | % |
| Risk-free interest rate | — | % | | 1.4 | % | | 1.2 | % |
| Expected dividend yield | — | % | | 1.6 | % | | 2.9 | % |
| Weighted average grant price | $ | — | | | $ | 110.46 | | | $ | 56.33 | |
| Estimated fair value per option granted | $ | — | | | $ | 27.59 | | | $ | 11.30 | |
The expected term of the options represents the estimated period of time until exercise and is based on historical experience of similar awards, giving consideration to the contractual terms, vesting schedules and expectations of future employee behavior. Expected stock price volatility is based on a combination of historical volatility of our stock and the one-year implied volatility of Starbucks traded options, for the related vesting periods. The risk-free interest rate is based on the implied yield available on U.S. Treasury zero-coupon issues with an equivalent remaining term. The dividend yield assumption is based on our anticipated cash dividend payouts. The amounts shown above for the estimated fair value per option granted are before the estimated effect of forfeitures, which reduce the amount of expense recorded in the consolidated statements of earnings.
Stock option transactions for the fiscal year ended October 2, 2022 (in millions, except per share and contractual life amounts): | | | | | | | | | | | | | | | | | | | | | | | |
| Shares
Subject to
Options | | Weighted
Average
Exercise
Price
per Share | | Weighted
Average
Remaining
Contractual
Life (Years) | | Aggregate
Intrinsic
Value |
| Outstanding, October 3, 2021 | 5.2 | | | $ | 54.58 | | | 4.5 | | $ | 303 | |
| Granted | — | | | — | | | | | |
| Exercised | (1.1) | | | 49.82 | | | | | |
| Expired/forfeited | 0.0 | | | 48.45 | | | | | |
| Outstanding, October 2, 2022 | 4.1 | | | 55.86 | | | 3.6 | | 117 | |
| Exercisable, October 2, 2022 | 4.1 | | | 55.86 | | | 3.6 | | 117 | |
| Vested and expected to vest, October 2, 2022 | 4.1 | | | 55.86 | | | 3.6 | | 117 | |
The aggregate intrinsic value in the table above, which is the amount by which the market value of the underlying stock exceeded the exercise price of outstanding options, is before applicable income taxes and represents the amount optionees would have realized if all in-the-money options had been exercised on the last business day of the period indicated.
As of October 2, 2022, there was immaterial unrecognized stock-based compensation expense, net of estimated forfeitures, related to nonvested options. The total intrinsic value of options exercised was $57 million, $219 million and $236 million during fiscal 2022, 2021 and 2020, respectively. The total fair value of options vested was $8 million, $14 million and $25 million during fiscal 2022, 2021 and 2020, respectively.
ESPP
Our ESPP allows eligible employees to contribute up to 10% of their base earnings toward the quarterly purchase of our common stock, subject to an annual maximum dollar amount. The purchase price is 95% of the fair market value of the stock on the last business day of the quarterly offering period. The number of shares issued under our ESPP was 0.6 million in fiscal 2022.
Deferred Compensation Plan
We have a Deferred Compensation Plan for Non-Employee Directors under which non-employee directors may, for any fiscal year, irrevocably elect to defer receipt of shares of common stock the director would have received upon vesting of restricted stock units. The number of deferred shares outstanding related to deferrals made under this plan is not material.
Defined Contribution Plans
We maintain voluntary defined contribution plans, both qualified and non-qualified, covering eligible employees as defined in the plan documents. Participating employees may elect to defer and contribute a portion of their eligible compensation to the plans up to limits stated in the plan documents, not to exceed the dollar amounts set by applicable laws.
Our matching contributions to all U.S. and non-U.S. plans were $156.7 million, $145.1 million and $132.7 million in fiscal 2022, 2021 and 2020, respectively.
Note 14: Income Taxes
Components of earnings before income taxes (in millions): | | | | | | | | | | | | | | | | | |
| Fiscal Year Ended | Oct 2, 2022 | | Oct 3, 2021 | | Sep 27, 2020 |
| United States | $ | 3,484.9 | | | $ | 4,138.5 | | | $ | 904.6 | |
| Foreign | 747.0 | | | 1,218.4 | | | 259.8 | |
| Total earnings before income taxes | $ | 4,231.9 | | | $ | 5,356.9 | | | $ | 1,164.4 | |
Provision/(benefit) for income taxes (in millions): | | | | | | | | | | | | | | | | | |
| Fiscal Year Ended | Oct 2, 2022 | | Oct 3, 2021 | | Sep 27, 2020 |
| Current taxes: | | | | | |
| U.S. federal | $ | 477.6 | | | $ | 681.8 | | | $ | 49.9 | |
| U.S. state and local | 164.0 | | | 190.0 | | | 36.9 | |
| Foreign | 283.8 | | | 409.8 | | | 181.4 | |
| Total current taxes | 925.4 | | | 1,281.6 | | | 268.2 | |
| Deferred taxes: | | | | | |
| U.S. federal | 92.6 | | | 10.4 | | | (8.4) | |
| U.S. state and local | 10.5 | | | (6.4) | | | (4.8) | |
| Foreign | (80.0) | | | (129.0) | | | (15.3) | |
| Total deferred taxes | 23.1 | | | (125.0) | | | (28.5) | |
| Total income tax expense | $ | 948.5 | | | $ | 1,156.6 | | | $ | 239.7 | |
Reconciliation of the statutory U.S. federal income tax rate with our effective income tax rate: | | | | | | | | | | | | | | | | | |
| Fiscal Year Ended | Oct 2, 2022 | | Oct 3, 2021 | | Sep 27, 2020 |
| Statutory rate | 21.0 | % | | 21.0 | % | | 21.0 | % |
| State income taxes, net of federal tax benefit | 3.3 | | | 2.7 | | | 2.2 | |
| Foreign rate differential | 0.3 | | | 0.5 | | | (3.2) | |
| Foreign derived intangible income | (0.8) | | | (0.5) | | | (1.4) | |
| Valuation allowances | (0.7) | | | 0.2 | | | 10.0 | |
| Excess tax benefits of stock-based compensation | (0.5) | | | (0.9) | | | (4.2) | |
| Charitable contributions | (0.3) | | | (0.4) | | | (1.7) | |
| Change in tax rates | 0.0 | | | (1.3) | | | (2.2) | |
| | | | | |
| | | | | |
| | | | | |
| | | | | |
| | | | | |
| Other, net | 0.1 | | | 0.3 | | | 0.1 | |
| Effective tax rate | 22.4 | % | | 21.6 | % | | 20.6 | % |
As of October 2, 2022, in certain foreign subsidiaries in which we are partially indefinitely reinvested, the gross taxable temporary difference between the accounting basis and tax basis was approximately $1.5 billion for which there could be up to approximately $230 million of unrecognized tax liability.
Tax effect of temporary differences and carryforwards that comprise significant portions of deferred tax assets and liabilities (in millions): | | | | | | | | | | | |
| Oct 2, 2022 | | Oct 3, 2021 |
| Deferred tax assets: | | | |
| Operating lease liabilities | $ | 2,289.1 | | | $ | 2,395.2 | |
| | | |
| Stored value card liability and deferred revenue | 1,662.6 | | | 1,679.4 | |
| Intangible assets and goodwill | 313.6 | | | 317.7 | |
| | | |
| | | |
| | | |
| | | |
| | | |
| | | |
| | | |
| | | |
| | | |
| Other | 605.7 | | | 641.0 | |
| Total | $ | 4,871.0 | | | $ | 5,033.3 | |
| Valuation allowance | (228.7) | | | (275.3) | |
| Total deferred tax asset, net of valuation allowance | $ | 4,642.3 | | | $ | 4,758.0 | |
| Deferred tax liabilities: | | | |
| Operating lease, right-of-use assets | (2,194.3) | | | (2,296.5) | |
| Property, plant and equipment | (482.2) | | | (451.2) | |
| | | |
| Other | (284.7) | | | (284.0) | |
| Total | (2,961.2) | | | (3,031.7) | |
| Net deferred tax asset (liability) | $ | 1,681.1 | | | $ | 1,726.3 | |
| Reported as: | | | |
| | | |
| Deferred income tax assets | 1,799.7 | | | 1,874.8 | |
| | | |
| Deferred income tax liabilities (included in Other long-term liabilities) | (118.6) | | | (148.5) | |
| Net deferred tax asset (liability) | $ | 1,681.1 | | | $ | 1,726.3 | |
The valuation allowances as of October 2, 2022 and October 3, 2021 were primarily related to net operating losses and other deferred tax assets of consolidated foreign subsidiaries.
As of October 2, 2022, we had federal net operating loss carryforwards of $70.8 million which have an indefinite carryforward period, state net operating loss carryforwards of $78.6 million which will begin to expire in fiscal 2024, federal tax credit carryforwards of $31.8 million which will begin to expire in fiscal 2030, state tax credit carryforwards of $1.4 million which will begin to expire in fiscal 2024 and foreign net operating loss carryforwards of $369.1 million, of which $102.0 million have an indefinite carryforward period and the remainder expire at various dates starting from fiscal 2023.
Uncertain Tax Positions
As of October 2, 2022, we had $89.7 million of gross unrecognized tax benefits of which $65.1 million, if recognized, would affect our effective tax rate. We recognized an expense of $2.3 million, a benefit of $4.6 million and an expense of $3.0 million of interest and penalties in income tax expense, prior to the benefit of the federal tax deduction, for fiscal 2022, 2021 and 2020, respectively. As of October 2, 2022 and October 3, 2021, we had accrued interest and penalties of $9.4 million and $7.1 million, respectively, within our consolidated balance sheets.
The following table summarizes the activity related to our unrecognized tax benefits (in millions): | | | | | | | | | | | | | | | | | |
| Oct 2, 2022 | | Oct 3, 2021 | | Sep 27, 2020 |
| Beginning balance | $ | 82.6 | | | $ | 123.7 | | | $ | 132.1 | |
| Increase related to prior year tax positions | 0.2 | | | 4.8 | | | 11.1 | |
| Decrease related to prior year tax positions | (0.7) | | | (11.9) | | | (0.5) | |
| Increase related to current year tax positions | 9.0 | | | 8.9 | | | 9.8 | |
| | | | | |
| Decreases related to settlements with taxing authorities | — | | | (4.4) | | | — | |
| Decrease related to lapsing of statute of limitations | (1.4) | | | (38.5) | | | (28.8) | |
| Ending balance | $ | 89.7 | | | $ | 82.6 | | | $ | 123.7 | |
We are currently under examination, or may be subject to examination, by various U.S. federal, state, local and foreign tax jurisdictions for fiscal 2016 through 2021. We are no longer subject to U.S. federal examination for years prior to fiscal 2018, U.S. state and local examinations for years prior to fiscal 2016 or examination in any material international markets prior to fiscal 2017.
We do not expect a significant amount of Company's gross unrecognized tax benefits to be recognized by the end of fiscal 2023 for reasons such as a lapse of the statute of limitations or resolution of examinations with tax authorities.
Note 15: Earnings per Share
Calculation of net earnings per common share (“EPS”) — basic and diluted (in millions, except EPS): | | | | | | | | | | | | | | | | | |
| Fiscal Year Ended | Oct 2, 2022 | | Oct 3, 2021 | | Sep 27, 2020 |
| Net earnings attributable to Starbucks | $ | 3,281.6 | | | $ | 4,199.3 | | | $ | 928.3 | |
| Weighted average common shares outstanding (for basic calculation) | 1,153.3 | | | 1,177.6 | | | 1,172.8 | |
| Dilutive effect of outstanding common stock options and RSUs | 5.2 | | | 7.9 | | | 9.0 | |
| Weighted average common and common equivalent shares outstanding (for diluted calculation) | 1,158.5 | | | 1,185.5 | | | 1,181.8 | |
| EPS — basic | $ | 2.85 | | | $ | 3.57 | | | $ | 0.79 | |
| EPS — diluted | $ | 2.83 | | | $ | 3.54 | | | $ | 0.79 | |
Potential dilutive shares consist of the incremental common shares issuable upon the exercise of outstanding stock options (both vested and non-vested) and unvested RSUs, calculated using the treasury stock method. The calculation of dilutive shares outstanding would exclude out-of-the-money stock options (i.e., such options’ exercise prices were greater than the average market price of our common shares for the period) because their inclusion would be antidilutive. As of October 2, 2022, we had an immaterial amount of out-of-the-money stock options and antidilutive RSUs. As of October 3, 2021 and September 27, 2020, we had an immaterial amount of antidilutive RSUs and no out-of-the-money stock options.
Note 16: Commitments and Contingencies
Legal Proceedings
In 2010 and 2011, an organization named Council for Education and Research on Toxics (“Plaintiff”) filed lawsuits in the Superior Court of the State of California, County of Los Angeles, against the Company and other companies who manufacture, package, distribute or sell brewed coffee. The suits were later consolidated into a single action. Plaintiff alleged that the Company and the other defendants failed to provide warnings for their coffee products of exposure to the chemical acrylamide as required under California Health and Safety Code section 25249.5, the California Safe Drinking Water and Toxic Enforcement Act of 1986, better known as Proposition 65. Plaintiff sought equitable relief, including providing warnings to consumers of coffee products, as well as civil penalties in the amount of the statutory maximum of two thousand five hundred dollars per day per alleged violation of Proposition 65, which the Plaintiff claimed was every day coffee is sold without a compliant warning. The Company denied the claims.
During the pendency of the litigation, the California Office of Environmental Health Hazard Assessment (“OEHHA”) proposed a new regulation clarifying that cancer warnings are not required for coffee under Proposition 65. The regulation was approved by the Office of Administrative Law and became effective on October 1, 2019. In 2020, the trial court granted the defendants’ motion for summary judgment, ruling that the coffee exemption regulation is a complete defense to the Plaintiff’s complaint. On October 26, 2022, the California Court of Appeal affirmed the trial court's dismissal of the case. The Plaintiff’s subsequent request for a rehearing before the Court of Appeals was denied. The Plaintiff has until December 5, 2022 to file a petition for review in the California Supreme Court. Starbucks believes that the likelihood that the Company will ultimately incur a material loss in connection with this litigation is less than reasonably possible. Accordingly, no loss contingency was recorded for this matter.
Starbucks is involved in various other legal proceedings arising in the ordinary course of business, including certain employment litigation cases that have been certified as class or collective actions, but, except as noted above, is not currently a party to any legal proceeding that management believes could have a material adverse effect on our consolidated financial position, results of operations or cash flows.
Note 17: Segment Reporting
Segment information is prepared on the same basis that our interim ceo, who is our Chief Operating Decision Maker, manages the segments, evaluates financial results and makes key operating decisions.
We have three reportable operating segments: 1) North America, which is inclusive of the U.S. and Canada; 2) International, which is inclusive of China, Japan, Asia Pacific, Europe, Middle East and Africa, Latin America and the Caribbean; and 3) Channel Development.
North America and International operations sell coffee and other beverages, complementary food, packaged coffees, single-serve coffee products and a focused selection of merchandise through company-operated stores and licensed stores. Our North America segment is our most mature business and has achieved significant scale.
Channel Development revenues include packaged coffee, tea, foodservice products and ready-to-drink beverages to customers outside of our company-operated and licensed stores. Most of our Channel Development revenues are from product sales to and royalty revenues from Nestlé through the Global Coffee Alliance.
Consolidated revenue mix by product type (in millions): | | | | | | | | | | | | | | | | | | | | | | | | | | | | | | | | | | | |
| Fiscal Year Ended | Oct 2, 2022 | | Oct 3, 2021 | | Sep 27, 2020 |
Beverage(1) | $ | 19,555.3 | | | 61 | % | | $ | 18,317.0 | | | 63 | % | | $ | 14,337.5 | | | 61 | % |
Food(2) | 5,804.2 | | | 18 | % | | 5,053.4 | | | 17 | % | | 3,799.2 | | | 16 | % |
Other(3) | 6,890.8 | | | 21 | % | | 5,690.2 | | | 20 | % | | 5,381.3 | | | 23 | % |
| Total | $ | 32,250.3 | | | 100 | % | | $ | 29,060.6 | | | 100 | % | | $ | 23,518.0 | | | 100 | % |
(1) Beverage represents sales within our company-operated stores.
(2) Food includes sales within our company-operated stores.
(3) “Other” primarily consists of packaged and single-serve coffees and teas, royalty and licensing revenues, beverage-related ingredients, serveware and ready-to-drink beverages, among other items.
Information by geographic area (in millions): | | | | | | | | | | | | | | | | | |
| Fiscal Year Ended | Oct 2, 2022 | | Oct 3, 2021 | | Sep 27, 2020 |
| Net revenues: | | | | | |
| United States | $ | 23,365.6 | | | $ | 20,377.8 | | | $ | 16,879.8 | |
| China | 3,008.3 | | | 3,674.8 | | | 2,582.8 | |
| Other countries | 5,876.4 | | | 5,008.0 | | | 4,055.4 | |
| Total | $ | 32,250.3 | | | $ | 29,060.6 | | | $ | 23,518.0 | |
| | | | | |
| Long-lived assets: | | | | | |
| United States | $ | 13,176.2 | | | $ | 12,819.4 | | | $ | 12,624.9 | |
| China | 4,174.0 | | | 4,673.8 | | | 4,425.6 | |
| Other countries | 3,609.5 | | | 4,143.0 | | | 4,517.6 | |
| Total | $ | 20,959.7 | | | $ | 21,636.2 | | | $ | 21,568.1 | |
No customer accounts for 10% or more of our revenues. Revenues are shown based on the geographic location of our customers. Revenues from countries other than the U.S. and China consist primarily of revenues from Japan, Canada and the U.K., which together account for approximately 74% of net revenues from other countries for fiscal 2022.
Management evaluates the performance of its operating segments based on net revenues and operating income. The accounting policies of the operating segments are the same as those described in Note 1, Summary of Significant Accounting Policies and Estimates. Operating income represents earnings before other income and expenses and income taxes. The identifiable assets by segment disclosed in this note are those assets specifically identifiable within each segment and include cash and cash equivalents, ROU assets, net property, plant and equipment, equity and cost investments, goodwill and other intangible assets. Assets not attributed to reportable operating segments are corporate assets and are primarily comprised of cash and cash equivalents available for general corporate purposes, investments, assets of the corporate headquarters and roasting facilities and inventory.
The table below presents financial information for our reportable operating segments and Corporate and Other segment for the fiscal years ended October 2, 2022, October 3, 2021 and September 27, 2020. | | | | | | | | | | | | | | | | | | | | | | | | | | | | | | | |
(in millions) | North America | | International | | | | Channel Development | | Corporate and Other | |
Total |
| Fiscal 2022 | | | | | | | | | | | |
| Total net revenues | $ | 23,370.8 | | | $ | 6,940.1 | | | | | $ | 1,843.6 | | | $ | 95.8 | | | $ | 32,250.3 | |
| Depreciation and amortization expenses | 808.4 | | | 513.0 | | | | | 0.1 | | | 126.4 | | | 1,447.9 | |
| Income from equity investees | — | | | 2.3 | | | | | 231.8 | | | — | | | 234.1 | |
| Operating income/(loss) | 4,486.5 | | | 833.2 | | | | | 817.3 | | | (1,519.2) | | | 4,617.8 | |
| Total assets | $ | 10,029.9 | | | $ | 8,602.8 | | | | | $ | 130.5 | | | $ | 9,215.2 | | | $ | 27,978.4 | |
| | | | | | | | | | | |
| Fiscal 2021 | | | | | | | | | | | |
| Total net revenues | $ | 20,447.9 | | | $ | 6,921.6 | | | | | $ | 1,593.6 | | | $ | 97.5 | | | $ | 29,060.6 | |
| Depreciation and amortization expenses | 753.9 | | | 544.7 | | | | | 1.2 | | | 141.9 | | | 1,441.7 | |
| Income from equity investees | — | | | 135.3 | | | | | 250.0 | | | — | | | 385.3 | |
| Operating income/(loss) | 4,259.3 | | | 1,245.7 | | | | | 789.1 | | | (1,422.0) | | | 4,872.1 | |
| Total assets | $ | 10,571.8 | | | $ | 10,083.3 | | | | | $ | 125.4 | | | $ | 10,612.1 | | | $ | 31,392.6 | |
| | | | | | | | | | | |
| Fiscal 2020 | | | | | | | | | | | |
Total net revenues(1) | $ | 16,296.2 | | | $ | 5,230.6 | | | | | $ | 1,925.0 | | | $ | 66.2 | | | $ | 23,518.0 | |
| Depreciation and amortization expenses | 762.0 | | | 518.4 | | | | | 1.2 | | | 149.7 | | | 1,431.3 | |
| Income from equity investees | — | | | 102.3 | | | | | 220.2 | | | — | | | 322.5 | |
Operating income/(loss)(1) | 1,801.7 | | | 370.6 | | | | | 687.2 | | | (1,297.8) | | | 1,561.7 | |
| Total assets | $ | 10,717.4 | | | $ | 9,449.7 | | | | | $ | 165.0 | | | $ | 9,042.4 | | | $ | 29,374.5 | |
(1) North America, International and Corporate and Other total net revenues and operating income/(loss) for fiscal year ended September 27, 2020 have been restated to conform with current period presentation.
REPORT OF INDEPENDENT REGISTERED PUBLIC ACCOUNTING FIRM
To the shareholders and the Board of Directors of Starbucks Corporation
Opinion on the Financial Statements
We have audited the accompanying consolidated balance sheets of Starbucks Corporation and subsidiaries (the “Company”) as of October 2, 2022 and October 3, 2021, the related consolidated statements of earnings, comprehensive income, equity, and cash flows, for each of the three years in the period ended October 2, 2022, and the related notes (collectively referred to as the “financial statements”). In our opinion, the financial statements present fairly, in all material respects, the financial position of the Company as of October 2, 2022 and October 3, 2021, and the results of its operations and its cash flows for each of the three years in the period ended October 2, 2022, in conformity with accounting principles generally accepted in the United States of America.
We have also audited, in accordance with the standards of the Public Company Accounting Oversight Board (United States) (PCAOB), the Company's internal control over financial reporting as of October 2, 2022, based on criteria established in Internal Control - Integrated Framework (2013) issued by the Committee of Sponsoring Organizations of the Treadway Commission and our report dated November 18, 2022, expressed an unqualified opinion on the Company's internal control over financial reporting.
Basis for Opinion
These financial statements are the responsibility of the Company's management. Our responsibility is to express an opinion on the Company's financial statements based on our audits. We are a public accounting firm registered with the PCAOB and are required to be independent with respect to the Company in accordance with the U.S. federal securities laws and the applicable rules and regulations of the Securities and Exchange Commission and the PCAOB.
We conducted our audits in accordance with the standards of the PCAOB. Those standards require that we plan and perform the audit to obtain reasonable assurance about whether the financial statements are free of material misstatement, whether due to error or fraud. Our audits included performing procedures to assess the risks of material misstatement of the financial statements, whether due to error or fraud, and performing procedures that respond to those risks. Such procedures included examining, on a test basis, evidence regarding the amounts and disclosures in the financial statements. Our audits also included evaluating the accounting principles used and significant estimates made by management, as well as evaluating the overall presentation of the financial statements. We believe that our audits provide a reasonable basis for our opinion.
Critical Audit Matter
The critical audit matter communicated below is a matter arising from the current-period audit of the financial statements that was communicated or required to be communicated to the Audit and Compliance Committee and that (1) relates to accounts or disclosures that are material to the financial statements and (2) involved our especially challenging, subjective or complex judgments. The communication of critical audit matters does not alter in any way our opinion on the financial statements, taken as a whole, and we are not, by communicating the critical audit matter below, providing a separate opinion on the critical audit matter or on the accounts or disclosures to which it relates.
Income Taxes — Indefinite Reinvestment of Foreign Earnings - Refer to Note 14 to the financial statements
Critical Audit Matter Description
Under the provisions of ASC 740, Income Taxes, (“ASC 740”), there is a presumption that investments in foreign subsidiaries will be recovered upon sale or through a partial or complete distribution of earnings to the parent entity, and therefore subject the parent entity to additional taxes. If sufficient evidence shows the foreign subsidiary has invested or will invest the undistributed earnings indefinitely, the ASC 740 presumption may be overcome, and no additional taxes shall be accrued. The Company has investments in the profitable operations of certain foreign subsidiaries that may be subject to additional foreign withholding taxes and/or U.S. federal and state income taxes upon sale or a partial or complete distribution of earnings, incremental to local income taxes already paid. As of October 2, 2022, the Company is partially indefinitely reinvested in certain foreign subsidiaries. The Company has recorded a deferred tax liability of $75 million related to the taxable temporary difference for which it is not indefinitely reinvested. For the remaining $1.5 billion of taxable temporary difference, there could be up to approximately $230 million of unrecognized tax liability.
The Company’s assertion of partial indefinite reinvestment for certain foreign subsidiaries requires management to make long-term forecasting assumptions and detailed plans for reinvestment. The most significant assumption supporting the Company’s indefinite reinvestment assertion is the forecast of capital expenditures in international markets. Performing audit procedures to evaluate the reasonableness of management’s indefinite reinvestment analysis and capital expenditures forecast required a high degree of auditor judgment and an increased extent of effort, including the need to involve our income tax specialists.
How the Critical Matter Was Addressed in the Audit
Our principal audit procedures related to management’s indefinite reinvestment analysis and the supporting forecast of capital expenditures for certain foreign subsidiaries, included the following, among others:
•We tested the effectiveness of controls related to management’s forecast of capital expenditures.
•We performed a retrospective review of management’s historical ability to accurately forecast capital expenditures by comparing actual results to management’s historical forecast.
•We inquired of senior executives of the Company to corroborate strategic plans for growth.
•We compared the forecasts obtained to support the indefinite reinvestment assertion to:
◦Historical capital expenditures, including costs per new store opening;
◦Historical new store growth; and
◦Historical profitability of new stores by region; and
◦Forecasts used by the Company for financial reporting purposes in other areas, such as the evaluation of the recoverability of goodwill; and
◦Internal communications to management and the Board of Directors; and
◦Forecasted information included in the Company’s press releases, other external communications and analyst reports; and
◦External publications of expected industry growth.
•With the assistance of our tax specialists, we evaluated the appropriateness of management’s analysis under ASC 740 and the sufficiency of the evidence provided by management to support that the Company has the intent and ability to partially indefinitely reinvest the undistributed earnings.
/s/ Deloitte & Touche LLP
Seattle, Washington
November 18, 2022
We have served as the Company's auditor since 1987.
Item 9.Changes in and Disagreements with Accountants on Accounting and Financial Disclosure
Not applicable.
Item 9A.Controls and Procedures
Disclosure Controls and Procedures
We maintain disclosure controls and procedures that are designed to ensure that material information required to be disclosed in our periodic reports filed or submitted under the Exchange Act, is recorded, processed, summarized and reported within the time periods specified in the SEC’s rules and forms. Our disclosure controls and procedures are also designed to ensure that information required to be disclosed in the reports we file or submit under the Exchange Act is accumulated and communicated to our management, including our principal executive officer and principal financial officer, as appropriate to allow timely decisions regarding required disclosure.
During the fourth quarter of fiscal 2022, we carried out an evaluation, under the supervision and with the participation of our management, including our interim chief executive officer and our chief financial officer, of the effectiveness of the design and operation of our disclosure controls and procedures, as defined in Rules 13a-15(e) and 15d-15(e) under the Exchange Act. Based upon that evaluation, our chief executive officer and chief financial officer concluded that our disclosure controls and procedures were effective, as of the end of the period covered by this report (October 2, 2022).
There were no changes in our internal control over financial reporting (as defined in Rules 13a-15(f) and 15d-15(f) of the Exchange Act) during our most recently completed fiscal quarter that materially affected or are reasonably likely to materially affect internal control over financial reporting.
The certifications required by Section 302 of the Sarbanes-Oxley Act of 2002 are filed as exhibits 31.1 and 31.2, respectively, to this 10-K. Report of Management on Internal Control over Financial Reporting
Our management is responsible for establishing and maintaining adequate internal control over financial reporting. Internal control over financial reporting is a process to provide reasonable assurance regarding the reliability of our financial reporting for external purposes in accordance with accounting principles generally accepted in the United States of America. Internal control over financial reporting includes maintaining records that in reasonable detail accurately and fairly reflect our transactions; providing reasonable assurance that transactions are recorded as necessary for preparation of our financial statements; providing reasonable assurance that receipts and expenditures are made in accordance with management authorization; and providing reasonable assurance that unauthorized acquisition, use or disposition of company assets that could have a material effect on our financial statements would be prevented or detected on a timely basis. Because of its inherent limitations, internal control over financial reporting is not intended to provide absolute assurance that a misstatement of our financial statements would be prevented or detected.
Management conducted an evaluation of the effectiveness of our internal control over financial reporting based on the framework and criteria established in Internal Control — Integrated Framework, issued by the Committee of Sponsoring Organizations of the Treadway Commission. This evaluation included review of the documentation of controls, evaluation of the design effectiveness of controls, testing of the operating effectiveness of controls and a conclusion on this evaluation. Based on this evaluation, management concluded that our internal control over financial reporting was effective as of October 2, 2022.
Our internal control over financial reporting as of October 2, 2022 has been audited by Deloitte & Touche LLP, an independent registered public accounting firm, as stated in their report which is included herein.
REPORT OF INDEPENDENT REGISTERED PUBLIC ACCOUNTING FIRM
To the shareholders and the Board of Directors of Starbucks Corporation
Opinion on Internal Control over Financial Reporting
We have audited the internal control over financial reporting of Starbucks Corporation and subsidiaries (the “Company”) as of October 2, 2022, based on criteria established in Internal Control - Integrated Framework (2013) issued by the Committee of Sponsoring Organizations of the Treadway Commission (COSO). In our opinion, the Company maintained, in all material respects, effective internal control over financial reporting as of October 2, 2022, based on criteria established in Internal Control - Integrated Framework (2013) issued by COSO.
We have also audited, in accordance with the standards of the Public Company Accounting Oversight Board (United States) (PCAOB), the consolidated financial statements as of and for the year ended October 2, 2022, of the Company and our report dated November 18, 2022, expressed an unqualified opinion on those financial statements.
Basis for Opinion
The Company’s management is responsible for maintaining effective internal control over financial reporting and for its assessment of the effectiveness of internal control over financial reporting, included in the accompanying Report of Management on Internal Control over Financial Reporting. Our responsibility is to express an opinion on the Company’s internal control over financial reporting based on our audit. We are a public accounting firm registered with the PCAOB and are required to be independent with respect to the Company in accordance with the U.S. federal securities laws and the applicable rules and regulations of the Securities and Exchange Commission and the PCAOB.
We conducted our audit in accordance with the standards of the PCAOB. Those standards require that we plan and perform the audit to obtain reasonable assurance about whether effective internal control over financial reporting was maintained in all material respects. Our audit included obtaining an understanding of internal control over financial reporting, assessing the risk that a material weakness exists, testing and evaluating the design and operating effectiveness of internal control based on the assessed risk, and performing such other procedures as we considered necessary in the circumstances. We believe that our audit provides a reasonable basis for our opinion.
Definition and Limitations of Internal Control over Financial Reporting
A company’s internal control over financial reporting is a process designed to provide reasonable assurance regarding the reliability of financial reporting and the preparation of financial statements for external purposes in accordance with generally accepted accounting principles. A company’s internal control over financial reporting includes those policies and procedures that (1) pertain to the maintenance of records that, in reasonable detail, accurately and fairly reflect the transactions and dispositions of the assets of the company; (2) provide reasonable assurance that transactions are recorded as necessary to permit preparation of financial statements in accordance with generally accepted accounting principles, and that receipts and expenditures of the company are being made only in accordance with authorizations of management and directors of the company; and (3) provide reasonable assurance regarding prevention or timely detection of unauthorized acquisition, use, or disposition of the company’s assets that could have a material effect on the financial statements.
Because of its inherent limitations, internal control over financial reporting may not prevent or detect misstatements. Also, projections of any evaluation of effectiveness to future periods are subject to the risk that controls may become inadequate because of changes in conditions, or that the degree of compliance with the policies or procedures may deteriorate.
/s/ Deloitte & Touche LLP
Seattle, Washington
November 18, 2022
Item 9B.Other Information
None.
Item 9C.Disclosure Regarding Foreign Jurisdictions that Prevent Inspections
Not applicable.
PART III
Item 10.Directors, Executive Officers and Corporate Governance
Information regarding our executive officers is set forth in Item 1 of Part I of this Report under the caption “Information about our Executive Officers.”
We adopted a code of ethics that applies to our chief executive officer, chief financial officer, controller and other finance leaders, which is a “code of ethics” as defined by applicable rules of the SEC. This code is publicly available on our website at www.starbucks.com/about-us/company-information/corporate-governance. If we make any amendments to this code other than technical, administrative or other non-substantive amendments, or grant any waivers, including implicit waivers, from a provision of this code to our chief executive officer, chief financial officer, chief accounting officer or controller, we will disclose the nature of the amendment or waiver, its effective date and to whom it applies on our website at www.starbucks.com/about-us/company-information/corporate-governance or in a report on Form 8-K filed with the SEC.
The remaining information required by this item is incorporated herein by reference to the sections entitled “Proposal 1 - Election of Directors,” “Beneficial Ownership of Common Stock,” “Corporate Governance” and “Corporate Governance - Audit and Compliance Committee” in our definitive Proxy Statement for the Annual Meeting of Shareholders to be held on March 23, 2023 (the “Proxy Statement”).
We will provide disclosure of delinquent Section 16(a) reports, if any, in our Proxy Statement, and such disclosure, if any, is incorporated herein by reference.
Item 11.Executive Compensation
The information required by this item is incorporated by reference to the sections entitled “Executive Compensation,” “Executive Compensation Tables,” “Compensation of Directors” and “Compensation Committee Interlocks and Insider Participation” in the Proxy Statement.
Item 12.Security Ownership of Certain Beneficial Owners and Management and Related Shareholder Matters
The information required by this item is incorporated by reference to the sections entitled “Equity Compensation Plan Information” and “Beneficial Ownership of Common Stock” in the Proxy Statement.
Item 13.Certain Relationships and Related Transactions and Director Independence
The information required by this item is incorporated by reference to the section entitled “Certain Relationships and Related Person Transactions” and “Corporate Governance - Affirmative Determinations Regarding Director Independence and Other Matters” in the Proxy Statement.
Item 14.Principal Accountant Fees and Services
The information required by this item is incorporated by reference to the sections entitled “Proposal 4 - Ratification of Selection of Deloitte & Touche LLP (PCAOB ID No. 34) as our Independent Registered Public Accounting Firm - Independent Registered Public Accounting Firm Fees” and “Proposal 4 - Ratification of Selection of Deloitte & Touche LLP as our Independent Registered Public Accounting Firm - Policy on Audit Committee Pre-Approval of Audit and Permissible Non-Audit Services of the Independent Registered Public Accounting Firm” in the Proxy Statement.
PART IV
Item 15.Exhibits and Financial Statement Schedules
(a) The following documents are filed as a part of this 10-K:
1. Financial Statements
The following financial statements are included in Part II, Item 8 of this 10-K:
•Consolidated Statements of Earnings for the fiscal years ended October 2, 2022, October 3, 2021 and September 27, 2020;
•Consolidated Statements of Comprehensive Income for the fiscal years ended October 2, 2022, October 3, 2021 and September 27, 2020;
•Consolidated Balance Sheets as of October 2, 2022 and October 3, 2021;
•Consolidated Statements of Cash Flows for the fiscal years ended October 2, 2022, October 3, 2021 and September 27, 2020;
•Consolidated Statements of Equity for the fiscal years ended October 2, 2022, October 3, 2021 and September 27, 2020;
•Notes to Consolidated Financial Statements; and
•Reports of Independent Registered Public Accounting Firm
2. Financial Statement Schedules
Financial statement schedules are omitted because they are not required or are not applicable, or the required information is provided in the consolidated financial statements or notes described in Item 15(a)(1) above.
3. Exhibits
| | | | | | | | | | | | | | | | | | | | | | | | | | | | | | | | | | | | | | |
| | | | Incorporated by Reference | | |
Exhibit Number | | Exhibit Description | | Form | | File No. | | Date of Filing | | Exhibit Number | | Filed Herewith |
| | | | 8-K | | 0-20322 | | 5/7/2018 | | 2.1 | | |
| | | | 10-Q | | 0-20322 | | 4/28/2015 | | 3.1 | | |
| | | | 8-K | | 0-20322 | | 3/19/2021 | | 3.1 | | |
| | | | S-3ASR | | 333-213645
| | 9/15/2016
| | 4.1 | | |
| | | | 8-K | | 0-20322 | | 3/20/2017 | | 4.2 | | |
| | | | 8-K | | 0-20322 | | 3/20/2017 | | 4.3 | | |
| | | | 8-K | | 0-20322 | | 11/22/2017 | | 4.2 | | |
| | | | | | | | | | | | |
| | | | 8-K | | 0-20322 | | 11/22/2017 | | 4.4 | | |
| | | | 8-K | | 0-20322 | | 2/28/2018 | | 4.2 | | |
| | | | 8-K | | 0-20322 | | 2/28/2018 | | 4.3 | | |
| | | | 8-K | | 0-20322 | | 2/28/2018 | | 4.4 | | |
| | | | 8-K | | 0-20322 | | 8/10/2018 | | 4.2 | | |
| | | | 8-K | | 0-20322 | | 8/10/2018 | | 4.3 | | |
| | | | 8-K | | 0-20322 | | 8/10/2018 | | 4.4 | | |
| | | | | | | | | | | | | | | | | | | | | | | | | | | | | | | | | | | | | | |
| | | | Incorporated by Reference | | |
Exhibit Number | | Exhibit Description | | Form | | File No. | | Date of Filing | | Exhibit Number | | Filed Herewith |
| | | | 8-K | | | | | | | | |
| | | | 8-K | | 0-20322 | | 5/13/2019 | | 4.2 | | |
| | | | 8-K | | 0-20322 | | 5/13/2019 | | 4.3 | | |
| | | | 8-K | | 0-20322 | | 5/13/2019 | | 4.4 | | |
| | | | 8-K | | 0-20322 | | 3/12/2020 | | 4.2 | | |
| | | | 8-K | | 0-20322 | | 3/12/2020 | | 4.3 | | |
| | | | 8-K | | 0-20322 | | 3/12/2020 | | 4.4 | | |
| | | | 8-K | | 0-20322 | | 3/12/2020 | | 4.5 | | |
| | | | 8-K | | 0-20322 | | 5/7/2020 | | 4.2 | | |
| | | | 8-K | | 0-20322 | | 5/7/2020 | | 4.4 | | |
| | | | 8-K | | 0-20322 | | 5/7/2020 | | 4.5 | | |
| | | | 8-K | | 0-20322 | | 2/14/2022 | | 4.2 | | |
| | | | | | |
| | | | | | | | | | | | | | | | | | | | | | | | | | | | | | | | | | | | | | |
| | | | Incorporated by Reference | | |
Exhibit Number | | Exhibit Description | | Form | | File No. | | Date of Filing | | Exhibit Number | | Filed Herewith |
| | | | 8-K | | 0-20322 | | 2/14/2022 | | 4.3 | | |
| | | | 8-K | | 0-20322 | | 2/14/2022 | | 4.4 | | |
| |
| | S-3ASR | | 333-190955 | | 9/3/2013 | | 4.1 | | |
| | | | 8-K | | 0-20322 | | 9/6/2013 | | 4.2 | | |
| | | | 8-K | | 0-20322 | | 9/6/2013 | | 4.3 | | |
| | | | | | | | | | | | |
| | | | 8-K | | 0-20322 | | 6/10/2015 | | 4.2 | | |
| | | | 8-K | | 0-20322 | | 6/10/2015 | | 4.4 | | |
| | | | | | | | | | | | |
| | | | | | | | | | | | |
| | | | 8-K | | 0-20322 | | 5/16/2016 | | 4.4 | | |
| | | | 8-K | | 0-20322 | | 5/16/2016 | | 4.5 | | |
| | | | 10-K | | 0-20322 | | 11/15/2019 | | 4.29 | | |
| | | | 10-Q | | 0-20322 | | 8/1/2017 | | 10.1 | | |
| | | | 8-K | | 0-20322 | | 1/14/2022 | | 10.1 | | |
| | | | 10-Q | | 0-20322 | | 2/4/2011 | | 10.2 | | |
| | | | | | | | | | | | | | | | | | | | | | | | | | | | | | | | | | | | | | |
| | | | Incorporated by Reference | | |
Exhibit Number | | Exhibit Description | | Form | | File No. | | Date of Filing | | Exhibit Number | | Filed Herewith |
| | | | 10-Q | | 0-20322 | | 7/28/2020 | | 10.1 | | |
| | | | 10-K | | 0-20322 | | 11/16/2018 | | 10.5 | | |
| | | | 10-Q | | 0-20322 | | 5/3/2022 | | 10.1 | | |
| | | | 10-Q
| | 0-20322 | | 2/10/2006 | | 10.2 | | |
| | | | 10-K | | 0-20322 | | 11/16/2018 | | 10.9 | | |
| | | | 10-K | | 0-20322 | | 11/18/2016 | | 10.14 | | |
| | | | 10-Q | | 0-20322 | | 4/26/2016 | | 10.2 | | |
| | Credit Agreement, dated September 16, 2021, among Starbucks Corporation, Bank of America, N.A., in its capacity as Administrative Agent, Swing Line Lender and L/C Issuer, Wells Fargo Bank, N.A., Citibank, N.A. and U.S. Bank National Association, as L/C Issuers, and the other Lenders from time to time a party thereto. | | 8-K | | 0-20322 | | 9/17/2021 | | 10.1 | | |
| | | | 8-K | | 0-20322 | | 7/29/2016 | | 10.1 | | |
| | | | 10-K | | 0-20322 | | 11/18/2016 | | 10.21 | | |
| | | | 10-K | | 0-20322 | | 11/15/2019 | | 10.22 | | |
| | | | 10-K | | 0-20322 | | 11/12/2020 | | 10.23 | | |
| | | | | | | | | | | | |
| | | | | | | | | | | | |
| | | | | | | | | | | | |
| | | | | | | | | | | | |
| | | | | | | | | | | | |
| | | | | | | | | | | | |
| | | | | | | | | | | | |
| | | | | | | | | | | | | | | | | | | | | | | | | | | | | | | | | | | | | | |
| | | | Incorporated by Reference | | |
Exhibit Number | | Exhibit Description | | Form | | File No. | | Date of Filing | | Exhibit Number | | Filed Herewith |
| | | | 10-K | | 0-20322 | | 11/12/2020 | | 10.24 | | |
| | | | 10-K | | 0-20322 | | 11/17/2017 | | 10.25 | | |
| | | | 10-K | | 0-20322 | | 11/16/2018 | | 10.23 | | |
| | | | 10-K | | 0-20322 | | 11/15/2019 | | 10.26 | | |
| | | | 10-K | | 0-20322 | | 11/12/2020 | | 10.29 | | |
| | | | 8-K | | 0-20322 | | 9/1/2022 | | 10.10 | | |
| | | | 8-K | | 0-20322 | | 9/2/2022 | | 10.10 | | |
| | | | | | | | | | | | X |
| | | | | | | | | | | | X |
| | | | | | | | | | | | X |
| | | | | | | | | | | | X |
| | | | | | | | | | | | X |
| | | | — | | — | | — | | — | | X |
| | | | | | | | | | | | | | | | | | | | | | | | | | | | | | | | | | | | | | |
| | | | Incorporated by Reference | | |
Exhibit Number | | Exhibit Description | | Form | | File No. | | Date of Filing | | Exhibit Number | | Filed Herewith |
| | | | | | | | | | | | |
| | | | — | | — | | — | | — | | X |
| | | | — | | — | | — | | — | | X |
| | | | — | | — | | — | | — | | X |
| | | | — | | — | | — | | — | | |
| 101 | | The following financial statements from the Company’s 10-K for the fiscal year ended October 2, 2022, formatted in iXBRL: (i) Consolidated Statements of Earnings, (ii) Consolidated Statements of Comprehensive Income, (iii) Consolidated Balance Sheets, (iv) Consolidated Statements of Cash Flows, (v) Consolidated Statements of Equity, and (vi) Notes to Consolidated Financial Statements | | — | | — | | — | | — | | X |
| 104 | | Cover Page Interactive Data File (formatted in iXBRL and contained in Exhibit 101) | | | | | | | | | | |
| | | | | | | | | | | | |
| | | | | | | | | | | | |
* Denotes a management contract or compensatory plan or arrangement.
** Furnished herewith.
Item 16.Form 10-K Summary
None.
SIGNATURES
Pursuant to the requirements of Section 13 or 15(d) of the Securities Exchange Act of 1934, the registrant has duly caused this report to be signed on its behalf by the undersigned, thereunto duly authorized. | | | | | | | | |
| | |
| STARBUCKS CORPORATION |
| |
| | |
| | |
| | |
| By: | /s/ Howard Schultz |
| | Howard Schultz
interim chief executive officer |
| |
November 18, 2022
Pursuant to the requirements of the Securities Exchange Act of 1934, this report has been signed below by the following persons on behalf of the registrant and in the capacities indicated as of November 18, 2022. | | | | | | | | | | | | | | |
| | Signature | | Title |
| | | | |
| By: | | /s/ Howard Schultz | | interim chief executive officer, director
(principal executive officer) |
| | Howard Schultz | |
| | | | |
| By: | | /s/ Rachel Ruggeri | | executive vice president, chief financial officer
(principal financial officer and principal accounting officer) |
| | Rachel Ruggeri | |
| | | | |
| By: | | /s/ Richard E. Allison, Jr. | | director |
| | Richard E. Allison, Jr. | | |
| | | | |
| By: | | /s/ Andrew Campion | | director |
| | Andrew Campion | | |
| | | | |
| By: | | /s/ Isabel Ge Mahe | | director |
| | Isabel Ge Mahe | | |
| | | | |
| By: | | /s/ Mellody Hobson | | director |
| | Mellody Hobson | | |
| | | | |
| By: | | /s/ Jørgen Vig Knudstorp | | director |
| | Jørgen Vig Knudstorp | | |
| | | | |
| | | | |
| | | | | | | | | | | | | | |
| | | | |
| | | | |
| By: | | /s/ Satya Nadella | | director |
| | Satya Nadella | | |
| | | | |
| By: | | /s/ Joshua Cooper Ramo | | director |
| | Joshua Cooper Ramo | | |
| | | | |
| By: | | /s/ Clara Shih | | director |
| | Clara Shih | | |