UNITED STATES
SECURITIES AND EXCHANGE COMMISSION
WASHINGTON, D.C. 20549
FORM 10-K
(Mark One)
For the fiscal year ended December 31, 2019
OR
For the transition period from to
Commission file number 1-9876
(Exact name of registrant as specified in its charter)
(State or other jurisdiction of incorporation or organization) | (I.R.S. Employer Identification No.) |
(Address of principal executive offices) | (Zip Code) | |
Registrant’s telephone number, including area code | |
Securities registered pursuant to Section 12(b) of the Act:
Title of Each Class | Trading Symbol(s) | Name of Each Exchange on Which Registered | ||
Securities registered pursuant to Section 12(g) of the Act: None
Indicate by check mark if the registrant is a well-known seasoned issuer, as defined in Rule 405 of the Securities Act.Yes ☒No☐
Indicate by check mark if the registrant is not required to file reports pursuant to Section 13 or Section 15(d) of the Act.Yes☐No ☒
Indicate by check mark whether the registrant (1) has filed all reports required to be filed by Section 13 or 15(d) of the Securities Exchange Act of 1934 during the preceding 12 months (or for such shorter period that the registrant was required to file such reports), and (2) has been subject to such filing requirements for the past 90 days. Yes ☒No☐
Indicate by check mark whether the registrant has submitted electronically every Interactive Data File required to be submitted pursuant to Rule 405 of Regulation S-T (§232.405 of this chapter) during the preceding 12 months (or for such shorter period that the registrant was required to submit such files). Yes ☒No☐
Indicate by check mark whether the registrant is a large accelerated filer, an accelerated filer, a non-accelerated filer, a smaller reporting company, or an emerging growth company. See the definitions of “large accelerated filer,” “accelerated filer,” “smaller reporting company,” and "emerging growth company" in Rule 12b-2 of the Exchange Act.
☒ | Accelerated filer | ☐ | |||
Non-accelerated filer | ☐ | Smaller reporting company | |||
Emerging growth company | |||||
If an emerging growth company, indicate by check mark if the registrant has elected not to use the extended transition period for complying with any new or revised financial accounting standards provided pursuant to Section 13(a) of the Exchange Act. ☐
Indicate by check mark whether the registrant is a shell company (as defined in Rule 12b-2 of the Exchange Act).Yes☐ No☒
The aggregate market value of the common shares of beneficial interest held by non-affiliates on June 28, 2019 (based upon the most recent closing sale price on the New York Stock Exchange as of such date of $27.42) was $3.3 billion.
As of February 21, 2020, there were 128,961,786 common shares of beneficial interest outstanding.
DOCUMENTS INCORPORATED BY REFERENCE
Portions of the Registrant’s Proxy Statement relating to its Annual Meeting of Shareholders to be held on April 29, 2020 have been incorporated by reference to Part III of this Form 10-K.
TABLE OF CONTENTS
Item No. | Page No. | |
1. | ||
1A. | ||
1B. | ||
2. | ||
3. | ||
4. | ||
5. | ||
6. | ||
7. | ||
7A. | ||
8. | ||
9. | ||
9A. | ||
9B. | ||
10. | ||
11. | ||
12. | ||
13. | ||
14. | ||
15. | ||
Forward-Looking Statements
This annual report on Form 10-K, together with other statements and information publicly disseminated by us, contains certain forward-looking statements within the meaning of Section 27A of the Securities Act of 1933, as amended, and Section 21E of the Securities Exchange Act of 1934, as amended. We intend such forward-looking statements to be covered by the safe harbor provisions for forward-looking statements contained in the Private Securities Litigation Reform Act of 1995 and include this statement for purposes of complying with those safe harbor provisions. Forward-looking statements, which are based on certain assumptions and describe our future plans, strategies and expectations, are generally identifiable by use of the words “believe,” “expect,” “intend,” “anticipate,” “estimate,” “project,” or similar expressions. You should not rely on forward-looking statements since they involve known and unknown risks, uncertainties and other factors, which are, in some cases, beyond our control and which could materially affect actual results, performances or achievements. Factors which may cause actual results to differ materially from current expectations include, but are not limited to, (i) disruptions in financial markets, (ii) general economic and local real estate conditions, (iii) the inability of major tenants to continue paying their rent obligations due to bankruptcy, insolvency or general downturn in their business, (iv) financing risks, such as the inability to obtain equity, debt, or other sources of financing on favorable terms and changes in LIBOR availability, (v) changes in governmental laws and regulations, (vi) the level and volatility of interest rates, (vii) the availability of suitable acquisition opportunities, (viii) the ability to dispose of properties, (ix) changes in expected development activity, (x) increases in operating costs, (xi) tax matters, including the effect of changes in tax laws and the failure to qualify as a real estate investment trust, and (xii) investments through real estate joint ventures and partnerships, which involve risks not present in investments in which we are the sole investor. Accordingly, there is no assurance that our expectations will be realized. For further discussion of the factors that could materially affect the outcome of our forward-looking statements and our future results and financial condition, see Item 1A. "Risk Factors.”
PART I
ITEM 1. Business
General Development of Business. Weingarten Realty Investors is a real estate investment trust (“REIT”) organized under the Texas Business Organizations Code. We, and our predecessor entity, began the ownership of shopping centers and other commercial real estate in 1948. Our primary business is leasing space to tenants in the shopping centers we own or lease. We also provide property management services for which we charge fees to either joint ventures where we are partners or other outside owners.
See “Management’s Discussion and Analysis of Financial Condition and Results of Operations” included in Item 7 and the Consolidated Financial Statements and Notes thereto included in Item 8 of this Annual Report on Form 10-K for the year ended December 31, 2019 for information on certain recent developments of the Company.
Narrative Description of Business. We are in the business of owning, managing and developing retail shopping centers. These centers may be mixed-use properties that have both retail and residential components. At December 31, 2019, we owned or operated under long-term leases, either directly or through our interest in real estate joint ventures or partnerships, a total of 170 properties, which are located in 16 states spanning the country from coast to coast. The portfolio of properties contains approximately 32.5 million square feet of gross leasable area that is either owned by us or others. We also owned interests in 23 parcels of land held for development that totaled approximately 11.9 million square feet.
Investment and Operating Strategy. Our goal is to remain a leader in owning and operating top-tier neighborhood and community shopping centers in certain markets of the United States ("U.S."). We expect to achieve this goal by:
• | raising net asset value and cash flows through quality acquisitions, redevelopments and new developments; |
• | focusing on core operating fundamentals through our decentralized operating platform built on local expertise in leasing and property management; |
• | disciplined growth from strategic acquisitions, redevelopments and new developments; |
• | disposition of assets that no longer meet our ownership criteria, in which proceeds may be recycled by repaying debt, purchasing new assets or reinvesting in currently owned assets or for other corporate purposes; and |
• | commitment to maintaining a conservatively leveraged balance sheet, strong liquidity, a well-staggered debt maturity schedule and strong credit agency ratings. |
1
We may either purchase, develop or lease income-producing properties in the future, and may also participate with other entities in property ownership through partnerships, joint ventures or similar types of co-ownership.
We may invest in mortgages; however, we have traditionally invested in first mortgages to real estate joint ventures or partnerships in which we own an equity interest or to obtain control over a real estate asset that we desire to own. We may also invest in securities of other issuers for the purpose, among others, of exercising control over such entities, subject to the gross income and asset tests necessary for REIT qualification.
In acquiring and developing properties, we attempt to accumulate enough properties in a geographic area to allow for the establishment of a regional office, which enables us to obtain in-depth knowledge of the market from a leasing perspective and to have easy access to the property and our tenants from a management viewpoint.
We expect to continue our focus on the future growth of the portfolio in neighborhood and community shopping centers in markets where we currently operate throughout the U.S. Our markets of interest reflect high income and job growth, as well as high barriers-to-entry. Our attention is also focused on high quality, supermarket-anchored and necessity-based centers, which may include mixed-use properties containing this type of retail component in addition to a residential component.
Diversification from both a geographic and tenancy perspective is a critical component of our operating strategy. Our largest markets are located in California, Florida and Texas, which represent 10.0%, 21.4% and 31.8%, respectively, of our total properties' gross leasable area. Total revenues generated by our centers located in Houston and its surrounding areas was 20.0% of total revenue for the year ended December 31, 2019, and an additional 9.3% of total revenue was generated in 2019 from centers that are located in other parts of Texas. An additional 19.8% and 17.9% of total revenue was generated in 2019 by our centers located in Florida and California, respectively. As of December 31, 2019, we also had 23 parcels of land held for development, five of which were located in Houston and its surrounding areas and 10 of which were located in other parts of Texas. Because of our investments in Texas, including Houston and its surrounding areas, Florida and California, changes in economic or real estate conditions in any of these areas could more significantly affect our business and operations than changes in other geographic areas.
With respect to tenant diversification, our two largest tenants, TJX Companies, Inc. and The Kroger Co., accounted for 2.6% and 2.5%, respectively, of our total base minimum rental revenues for the year ended December 31, 2019. No other tenant accounted for more than 1.8% of our total base minimum rental revenues. Our anchor tenants are supermarkets, value-oriented apparel/discount stores and other retailers or service providers who generally sell basic necessity-type goods and services. We believe the stability of our anchor tenants, combined with convenient locations, attractive and well-maintained properties, high quality retailers and a strong tenant mix, should ensure the long-term viability of our portfolio.
Strategically, we strive to finance our growth and working capital needs in a conservative manner, including managing our debt maturities. Our senior debt credit ratings were BBB with a projected stable outlook from Standard & Poors and Baa1 with a projected stable outlook from Moody’s Investor Services as of December 31, 2019. We intend to maintain a conservative approach to managing our balance sheet, which, in turn, should permit us to raise debt or equity capital when needed. At December 31, 2019 and 2018, our debt to total assets before depreciation ratio was 34.3% and 36.4%, respectively.
We have a $200 million share repurchase plan under which we may repurchase common shares of beneficial interest ("common shares") from time-to-time in open-market or privately negotiated purchases based on management's evaluation of market conditions and other factors. As of the date of this filing, $181.5 million of common shares remained available to be repurchased under the plan.
Our policies with respect to the investment and operating strategies discussed above are periodically reviewed by our Board of Trust Managers and may be modified without a vote of our shareholders.
Competition. We compete with numerous other developers and real estate companies (both public and private), financial institutions and other investors engaged in the development, acquisition and operation of shopping centers and mixed-use properties in our geographical areas. This results in competition for the acquisition of both existing income-producing properties and prime development sites.
2
We also compete for tenants to occupy the space that is developed, acquired and managed by our competitors. The principal competitive factors in attracting tenants to our properties are location, price, anchor tenants and maintenance of properties. We believe our key competitive advantages include the favorable locations of our properties, the strong demographics surrounding our centers, knowledge of markets and customer bases, our ability to provide a retailer with multiple locations with quality anchor tenants and the practice of continuous maintenance and renovation of our properties.
Qualification as a Real Estate Investment Trust. As of December 31, 2019, we met the qualification requirements of a REIT under the Internal Revenue Code, as amended. As a result, we will not be subject to federal income tax to the extent we meet certain requirements of the Internal Revenue Code, with the exception of our taxable REIT subsidiary.
Employees. At December 31, 2019, we employed 239 full-time persons; our principal executive offices are located at 2600 Citadel Plaza Drive, Houston, Texas 77008; and our phone number is (713) 866-6000. We also have nine regional offices located in various parts of the U.S. Management considers its relations with their personnel to be good.
Sustainability. We believe sustainability to be in the best interest of our tenants, investors, employees and the communities we operate. We are committed to reducing our environmental impact and believe this commitment is not only the right thing to do, but also supports us in achieving key strategic objectives in operations and development. More information about our sustainability initiatives, performance and disclosures are available on our website at www.weingarten.com.
Environmental Exposure. We are under various federal, state and local laws, ordinances and regulations that may cause us to be liable for costs and damages to remove or remediate certain hazardous or toxic substances as an operator and owner of real estate. For further information regarding our risks related to environmental exposure, see Item 1A. "Risk Factors."
Company Website and SEC Filings. Our website may be accessed at www.weingarten.com. We use the Investors section of our website as a channel for routine distribution of important information, including news releases, analyst presentations and financial information. All of our filings with the Securities and Exchange Commission ("SEC") can be accessed, and we post filings as soon as reasonably practicable after they are electronically filed with, or furnished to, the SEC, including our annual, quarterly and current reports on Forms 10-K, 10-Q and 8-K, our proxy statements and any amendments to those reports or statements. All such postings and filings are available on our website free of charge. You may also view any materials we file with the SEC at the SEC’s Internet site at www.sec.gov.
Financial Information. Additional financial information concerning us is included in the Consolidated Financial Statements located in Item 8 herein.
ITEM 1A. Risk Factors
The risks described below could materially and adversely affect our shareholders and our results of operations, financial condition, liquidity and cash flows. In addition to these risks, our operations may also be affected by additional factors not presently known or that we currently consider immaterial to our operations.
Disruptions in the financial markets could affect our liquidity and have other adverse effects on us and the market price of our common shares of beneficial interest.
The U.S. and global equity and credit markets may experience significant price volatility, dislocations and liquidity disruptions, which could cause market prices of many stocks to fluctuate substantially and the spreads on prospective debt financings to widen considerably. These circumstances could materially impact liquidity in the financial markets, making terms for certain financings less attractive, and in certain cases result in the unavailability of certain types of financing. Uncertainties in the equity and credit markets may negatively impact our ability to access additional financing at reasonable terms or at all, which may negatively affect our ability to complete dispositions, form joint ventures or refinance our debt. A prolonged downturn in the equity or credit markets could cause us to seek alternative sources of potentially less attractive financing, and require us to adjust our business plan accordingly. In addition, these factors may make it more difficult for us to sell properties or adversely affect the price we receive for properties that we do sell, as prospective buyers may experience increased costs of financing or difficulties in obtaining financing. These events in the equity and credit markets may make it more difficult or costly for us to raise capital through the issuance of our common shares or preferred shares. These disruptions in the financial markets also may have a material adverse effect on the market value of our common shares and other adverse effects on us or the economy generally. There can be no assurances that government responses to any disruptions in the financial markets would restore consumer confidence, maintain stabilized markets or provide the availability of equity or credit financing.
3
Among the market conditions that may affect the value of our common shares and access to the capital markets are the following:
• | The attractiveness of REIT securities as compared to other securities, including securities issued by other real estate companies, fixed income equity securities and debt securities; |
• | Changes in revenues or earnings estimates or publication of research reports and recommendations by financial analysts or actions taken by rating agencies with respect to our securities or those of other REITs; |
• | The degree of interest held by institutional investors; |
• | The market's perception of the quality of our assets and our growth potential; |
• | The ability of our tenants to pay rent to us and meet their other obligations to us under current lease terms; |
• | Our ability to re-lease space as leases expire; |
• | Our ability to refinance our indebtedness as it matures; |
• | Actual or anticipated quarterly fluctuations in our operating results and financial condition; |
• | Any changes in our dividend policy; |
• | Any future issuances of equity securities; |
• | Strategic actions by us or our competitors, such as acquisitions or restructurings; |
• | General market conditions and, in particular, developments related to market conditions for the real estate industry; and |
• | Domestic and international economic and political factors unrelated to our performance. |
The volatility in the stock market can create price and volume fluctuations that may not necessarily be comparable to operating performance.
The economic performance and value of our shopping centers depend on many factors, each of which could have an adverse impact on our cash flows and operating results.
The economic performance and value of our properties can be affected by many factors, including the following:
• | Changes in the national, regional and local economic climate; |
• | Changes in existing laws and regulations, including environmental regulatory requirements including, but not limited to, legislation on global warming, trade reform, health care reform, employment laws and immigration laws; |
• | Local conditions such as an oversupply of space or a reduction in demand for real estate in the area; |
• | The attractiveness of the properties to tenants; |
• | Competition from other available space; |
• | Competition for our tenants from Internet sales and shifts in consumer shopping patterns; |
• | Our tenant's ability to anticipate or revise their marketing and/or sales approach to meet changes in consumer shopping patterns; |
• | The ongoing disruption and/or consolidation of the retail sector; |
• | Our ability to provide adequate management services and to maintain our properties; |
• | Increased operating costs, if these costs cannot be passed through to tenants; |
• | The cost of periodically renovating, repairing and releasing spaces; |
• | The consequences of any armed conflict involving, or terrorist attack against, the U.S.; |
• | Our ability to secure adequate insurance; |
• | Fluctuations in interest rates; |
• | Changes in real estate taxes and other expenses; and |
4
• | Availability of financing on acceptable terms or at all. |
Our properties consist primarily of neighborhood and community shopping centers and, therefore, our performance is linked to general economic conditions in the market for retail space. The market for retail space has been and could in the future be adversely affected by weakness in the national, regional and local economies where our properties are located, the adverse financial condition of some large retail companies, the ongoing consolidation in the retail sector, the excess amount of retail space in a number of markets and increasing consumer purchases through the Internet. To the extent that any of these conditions exist, they are likely to affect market rents for retail space. In addition, we may face challenges in the management and maintenance of the properties or encounter increased operating costs, such as real estate taxes, insurance and utilities, which may make our properties unattractive to tenants. A significant decrease in rental revenue and an inability to replace such revenues may adversely affect our profitability, the ability to meet debt and other financial obligations and pay dividends to shareholders.
We have properties that are geographically concentrated, and adverse economic or other conditions in that area could have a material adverse effect on us.
We are particularly susceptible to adverse economic or other conditions in markets where our properties are concentrated, including California, Florida and Texas. These adverse conditions include increases in unemployment, industry slowdowns, including declining oil prices, business layoffs or downsizing, decreases in consumer confidence, relocations of businesses, changes in demographics, increases in real estate and other taxes, increases in regulations, severe weather conditions and natural disasters, any of which could have an increased material adverse effect on us than if our portfolio was more geographically diverse.
Our acquisition activities may not produce the cash flows that we expect and may be limited by competitive pressures or other factors.
We intend to acquire existing commercial properties to the extent that suitable acquisitions can be made on advantageous terms. Acquisitions of commercial properties involve risks such as:
• | We may have difficulty identifying acquisition opportunities that fit our investment strategy; |
• | Our estimates on expected occupancy and rental rates may differ from actual conditions; |
• | Our estimates of the costs of any redevelopment or repositioning of acquired properties may prove to be inaccurate; |
• | We may be unable to operate successfully in new markets where acquired properties are located, due to a lack of market knowledge or understanding of local economies; |
• | We may be unable to successfully integrate new properties into our existing operations; or |
• | We may have difficulty obtaining financing on acceptable terms or paying the operating expenses and debt service associated with acquired properties prior to sufficient occupancy. |
In addition, we may not be in a position or have the opportunity in the future to make suitable property acquisitions on advantageous terms due to competition for such properties with others engaged in real estate investment. Our inability to successfully acquire new properties may have an adverse effect on our results of operations.
Turmoil in capital markets could adversely impact acquisition activities and pricing of real estate assets.
Volatility in the capital markets could impact the availability of debt financing due to numerous factors, including the tightening of underwriting standards by lenders and credit rating agencies. These factors directly affect a lender’s ability to provide debt financing as well as increase the cost of available debt financing. As a result, we may not be able to obtain debt financing on favorable terms or at all. This may result in future acquisitions generating lower overall economic returns, which may adversely affect our results of operations and dividends paid to shareholders. Furthermore, any turmoil in the capital markets could adversely impact the overall amount of capital available to invest in real estate, which may result in price or value decreases of real estate assets.
5
Our real estate assets may be subject to impairment charges.
Periodically, we assess whether there are any indicators that the value of our real estate assets, including any capitalized costs and any identifiable intangible assets, may be impaired. A property's value is impaired only if the estimate of the aggregate future undiscounted cash flows without interest charges to be generated by the property are less than the carrying value of the property. In estimating cash flows, we consider factors such as expected future income, trends and prospects, the effects of demand, competition and other factors. If we are evaluating the potential sale of an asset or development/redevelopment alternatives, the undiscounted future cash flows consider the most likely course of action at the balance sheet date based on current plans, intended holding periods and available market information. Determining whether a property is impaired and, if impaired, the amount of write-down to fair value requires a significant amount of judgment by management and is based on the best information available to management at the time of evaluation. If market conditions deteriorate or management’s plans for certain properties change, additional write-downs could be required in the future, and any future impairment could have a material adverse effect on our results of operations in the period in which the charge is taken.
Reduction of rental income would adversely affect our profitability, our ability to meet our debt obligations and our ability to pay dividends to our shareholders.
The substantial majority of our income is derived from rental income from real property. As a result, our performance depends on our ability to collect rent from tenants. Our income and funds to pay dividends would be negatively affected if a significant number of our tenants, or any of our major tenants (as discussed in more detail below):
• | Delay lease commencements; |
• | Decline to extend or renew leases upon expiration; |
• | Fail to make rental payments when due; or |
• | Close stores or declare bankruptcy. |
Any of these actions could result in the termination of the tenants’ lease and the loss of rental income attributable to the terminated leases. In addition, lease terminations by an anchor tenant or a failure by that anchor tenant to occupy the premises could also result in lease terminations or reductions in rent by other tenants in the same shopping center under the terms of some leases. In these events, we cannot be sure that any tenant whose lease expires will renew that lease or that we will be able to re-lease space on economically advantageous terms. Furthermore, certain costs remain fixed even though a property may not be fully occupied. The loss of rental revenues from a number of our tenants and our inability to replace such tenants, particularly in the case of a substantial tenant with leases in multiple locations, may adversely affect our profitability, our ability to meet debt and other financial obligations and our ability to pay dividends to the shareholders.
Adverse effects on the success and stability of our anchor tenants, could lead to reductions of rental income.
Our rental income could be adversely affected in the event of a downturn in the business, or the bankruptcy or insolvency of, any anchor store or anchor tenant. Anchor tenants generally occupy large amounts of square footage, pay a significant portion of the total rents at a property and contribute to the success of other tenants by drawing significant numbers of customers to a property. The closing of one or more anchor stores at a property could adversely affect that property and result in lease terminations or reductions in rent from other tenants, whose leases may permit termination or rent reduction in those circumstances or whose own operations may suffer as a result. Furthermore, tenant demand for certain of our anchor spaces may decrease, and as a result, we may see an increase in vacancy and/or a decrease in rents for those spaces, which could have a negative impact to our rental income.
Adverse effects resulting from a shift in retail shopping from brick and mortar stores to online shopping may impact our operating results.
Online sales for many retailers has become a fundamental part of their business in addition to operating brick and mortar stores. Additionally, online sales from companies without physical stores has increased significantly. Although many of the retailers operating in our properties sell groceries, value-oriented apparel and other necessity-based type goods or provide services, including entertainment and dining, the shift to online shopping may cause certain of our tenants to reduce the size or number of their retail locations in the future. As a result, this could negatively affect our ability to lease space and our operating results.
6
We face significant competition in the leasing market, which may decrease or prevent increases in the occupancy and rental rates of our properties.
We compete with numerous developers, owners and operators of retail properties, many of which own properties similar to, and in the same market sectors as, our properties. If our competitors offer space at rental rates below current market rates, or below the rental rates we currently charge our tenants, we may lose existing or potential tenants, or we may be forced to reduce rental rates in order to attract new tenants and retain existing tenants when their leases expire.
Also, if our competitors develop additional retail properties in locations near our properties, there may be increased competition for customer traffic and creditworthy tenants, which may result in fewer tenants or decreased cash flows from tenants, or both, and may require us to make capital improvements to properties that we would not have otherwise made. Our tenants also face increasing competition from other forms of marketing of goods, such as direct mail and Internet marketing, which may decrease cash flow from such tenants. As a result, our financial condition and our ability to pay dividends to our shareholders may be adversely affected.
We may be unable to collect balances due from tenants in bankruptcy.
A tenant that files for bankruptcy protection may not continue to pay us rent. A bankruptcy filing by or relating to one of our tenants or a lease guarantor would bar all efforts by us to collect pre-bankruptcy debts from the tenant or the lease guarantor, or their property, unless the bankruptcy court permits us to do so. A tenant or lease guarantor bankruptcy could delay our efforts to collect past due balances under the relevant leases and could ultimately preclude collection of these sums. If a lease is rejected by a tenant in bankruptcy, we would have only a general unsecured claim for damages. As a result, it is likely that we would recover substantially less than the full value of any unsecured claims it holds, if at all.
Our development, redevelopment and construction activities could adversely affect our operating results.
We intend to continue the selective development, redevelopment and construction of retail and/or mixed-use properties in accordance with our development and underwriting policies as opportunities arise. Our development, redevelopment and construction activities include risks that:
• | We may abandon development opportunities after expending resources to determine feasibility; |
• | Construction costs of a project may exceed our original estimates; |
• | Occupancy rates and rents at a newly completed or redeveloped property may not be sufficient to make the property profitable; |
• | Rental rates could be less than projected; |
• | Delivery of multi-family units into uncertain residential environments may result in lower rents, sale price or take longer periods of time to reach economic stabilization; |
• | Project completion may be delayed because of a number of factors, including weather, labor disruptions, construction delays or delays in receipt of zoning or other regulatory approvals, adverse economic conditions, acts of terror or other acts of violence, or acts of God (such as fires, earthquakes or floods); |
• | Financing may not be available to us on favorable terms for development or redevelopment of a property; and |
• | We may not complete construction and lease-up on schedule, resulting in increased debt service expense and construction costs. |
Additionally, the time frame required for development, redevelopment, construction and lease-up of these properties means that we may have to wait years for a significant cash return. If any of the above events occur, the development and redevelopment of properties may hinder our growth and have an adverse effect on our results of operations, including additional impairment charges. Also, new development activities, regardless of whether or not they are ultimately successful, typically require substantial time and attention from management.
7
There is a lack of operating history with respect to any recent acquisitions and redevelopment or development of properties, and we may not succeed in the integration or management of additional properties.
These properties may have characteristics or deficiencies currently unknown to us that affect their value or revenue potential. It is also possible that the operating performance of these properties may decline under our management. We also may not have the experience in developing and managing mixed-use properties and may need to rely on external resources which may not perform as we expected. As we acquire additional properties, we will be subject to risks associated with managing new properties, including lease-up and tenant retention. In addition, our ability to manage our growth effectively will require us to successfully integrate any new acquisitions into our existing management structure. We may not succeed with this integration or effectively manage additional properties. Also, newly acquired properties may not perform as expected.
Real estate property investments are illiquid, and therefore, we may not be able to dispose of properties when desirable or on favorable terms.
Real estate property investments generally cannot be disposed of quickly. In addition, the Internal Revenue Code imposes restrictions on the ability of a REIT to dispose of properties that are not applicable to other types of real estate companies. Our ability to dispose of properties on advantageous terms depends on factors beyond our control, including competition from other sellers and the availability of attractive financing for potential buyers of our properties. We cannot predict the various market conditions affecting real estate investments that will exist at any particular time in the future. Therefore, we may not be able to quickly vary our portfolio in response to economic or other conditions promptly or on favorable terms, which could cause us to incur extended losses and reduce our cash flows and adversely affect dividends paid to shareholders.
As part of our capital recycling program, we intend to sell our non-core assets and may not be able to recover our investments, which may result in losses to us.
There can be no assurance that we will be able to recover the current carrying amount of all of our owned and partially owned non-core properties and investments in the future. Our failure to do so would require us to recognize impairment charges in the period in which we reached that conclusion, which could adversely affect our business, financial condition, operating results and cash flows.
Credit ratings may not reflect all the risks of an investment in our debt or equity securities and rating changes could adversely effect our revolving credit facility.
Our credit ratings are an assessment by rating agencies of our ability to pay our debts when due. Consequently, real or anticipated changes in our credit ratings will generally affect the market value of our debt. Credit ratings may be revised or withdrawn at any time by the rating agency at its sole discretion. Additionally, our revolving credit facility fees are based on our credit ratings. We do not undertake any obligation to maintain the ratings or to advise holders of our debt of any change in ratings. Each agency's rating should be evaluated independently of any other agency's rating.
There can be no assurance that we will be able to maintain our current credit ratings. Adverse changes in our credit ratings could impair our ability to obtain additional debt and equity financing on favorable terms, if at all, and could significantly reduce the market price of our publicly-traded securities.
Our cash flows and operating results could be adversely affected by required payments of debt or related interest and other risks of our debt financing.
We are generally subject to risks associated with debt financing. These risks include:
• | Our cash flow may not satisfy required payments of principal and interest; |
• | We may not be able to refinance existing indebtedness on our properties as necessary or the terms of the refinancing may be less favorable to us than the terms of existing debt; |
• | Required debt payments are not reduced if the economic performance of any property declines; |
• | Debt service obligations could reduce funds available for dividends to our shareholders and funds available for capital investment; |
• | Any default on our indebtedness could result in acceleration of those obligations and possible loss of property to foreclosure; and |
8
• | The risk that capital expenditures necessary for purposes such as re-leasing space cannot be financed on favorable terms. |
If a property is mortgaged to secure payment of indebtedness and we cannot make the mortgage payments, we may have to surrender the property to the lender with a consequent loss of any prospective income and equity value from such property. Any of these risks can place strains on our cash flows, reduce our ability to grow and adversely affect our results of operations.
We may be adversely affected by changes in LIBOR reporting practices or the method in which LIBOR is determined.
As of December 31, 2019, we had $17.4 million of secured debt and $0 outstanding debt on our $500 million unsecured revolving credit facility, expiring in March 2024, which bears interest at a floating rate based on the London Interbank Offered Rate (“LIBOR”) plus an applicable margin. We may incur additional debt indexed to LIBOR in the future. Central banks around the world, including the Federal Reserve, have commissioned working groups of market participants and official sector representatives with the goal of finding suitable replacements for LIBOR based on observable market transactions. It is expected that a transition away from the widespread use of LIBOR to alternative rates will occur over the course of the next few years. The United Kingdom Financial Conduct Authority (the authority that regulates LIBOR) announced it intends to stop compelling banks to submit rates for the calculation of LIBOR after 2021.
Accordingly, there is considerable uncertainty regarding the publication of such rates beyond 2021. The Federal Reserve Bank of New York and various other authorities have commenced the publication of reforms and actions relating to alternatives to U.S. dollar LIBOR (“USD-LIBOR”). The Alternative Reference Rates Committee ("ARRC") has proposed that the Secured Overnight Financing Rate ("SOFR") is the rate that represents best practice in the U.S. as the alternative to LIBOR for use in derivatives and other financial contracts that are currently indexed to USD-LIBOR. ARRC has proposed a paced market transition plan to SOFR from LIBOR. We are not able to predict when LIBOR will cease to be available or if SOFR, or another alternative reference rate, attains market traction as a LIBOR replacement. If LIBOR ceases to exist, we will need to agree upon a benchmark replacement index with the bank, and as such the interest rate on our revolving credit facility and certain secured debt may change. The new rate may not be as favorable as those in effect prior to any LIBOR phase-out. Furthermore, the transition process may result in delays in funding, higher interest expense, additional expenses, and increased volatility in markets for instruments that currently rely on LIBOR. Although the full impact of such reforms and actions, together with any transition away from LIBOR, including the potential or actual discontinuance of LIBOR publication, remains unclear and may span several reporting periods, these changes may have a material adverse impact on the availability of financing, including LIBOR-based loans, and on our financing costs.
Rising interest rates could increase our borrowing costs, thereby adversely affecting our cash flows and the amounts available for dividends to our shareholders, and decrease our share price, if investors seek higher yields through other investments.
We have indebtedness with interest rates that vary depending on market indices. Also, our credit facilities bear interest at variable rates. We may incur variable-rate debt in the future. Increases in interest rates on variable-rate debt would increase our interest expense, which would negatively affect net income and cash available for payment of our debt obligations and dividends to shareholders. In addition, an increase in interest rates could adversely affect the market value of our outstanding debt, as well as increase the cost of refinancing and the issuance of new debt or securities. An environment of rising interest rates could also lead holders of our securities to seek higher yields through other investments, which could adversely affect the market price of our shares. One of the factors which may influence the price of our shares in public markets is the annual dividend rate we pay as compared with the yields on alternative investments.
Our financial condition could be adversely affected by financial covenants.
Our credit facilities and public debt indentures under which our indebtedness is, or may be, issued contain certain financial and operating covenants, including, among other things, certain coverage ratios, as well as limitations on our ability to incur secured and unsecured indebtedness, restrictions on our ability to sell all or substantially all of our assets and engage in mergers and consolidations and certain acquisitions. These covenants could limit our ability to obtain additional funds needed to address cash shortfalls or pursue growth opportunities or transactions that would provide substantial return to our shareholders. In addition, a breach of these covenants could cause a default under or accelerate some or all of our indebtedness, which could have a material adverse effect on our financial condition.
9
Property ownership through real estate partnerships and joint ventures could limit our control of those investments and reduce our expected return.
Real estate partnership or joint venture investments may involve risks not otherwise present for investments made solely by us, including the possibility that our partner or co-venturer might become bankrupt, that our partner or co-venturer might at any time have different interests or goals than us, and that our partner or co-venturer may take action contrary to our instructions, requests, policies or objectives. Other risks of joint venture investments could include impasse on decisions, such as a sale or refinance, because neither our partner or co-venturer nor we would have full control over the partnership or joint venture. These factors could limit the return that we receive from those investments or cause our cash flows to be lower than our estimates.
Volatility in market and economic conditions may impact our partners’ ability to perform in accordance with our real estate joint venture and partnership agreements resulting in a change in control or the liquidation plans of its underlying properties.
Changes in control of our investments could result if any reconsideration events occur, such as amendments to our real estate joint venture and partnership agreements, changes in debt guarantees or changes in ownership due to required capital contributions. Any changes in control will result in the revaluation of our investments to fair value, which could lead to an impairment. We are unable to predict whether, or to what extent, a change in control may result or the impact of adverse market and economic conditions may have to our partners.
If we fail to qualify as a REIT in any taxable year, we will be subject to U.S. federal income tax as a regular corporation and could have significant tax liability.
We intend to operate in a manner that allows us to qualify as a REIT for U.S. federal income tax purposes. However, REIT qualification requires us to satisfy numerous requirements (some on an annual or quarterly basis) established under highly technical and complex provisions of the Internal Revenue Code, for which there are a limited number of judicial or administrative interpretations. Our status as a REIT requires an analysis of various factual matters and circumstances that are not entirely within our control. Accordingly, it is not certain we will be able to qualify and remain qualified as a REIT for U.S. federal income tax purposes. Even a technical or inadvertent violation of the REIT requirements could jeopardize our REIT qualification. If we fail to qualify as a REIT in any tax year, then:
• | We would be taxed as a regular domestic corporation, which, among other things, means that we would be unable to deduct dividends paid to our shareholders in computing our taxable income and would be subject to U.S. federal income tax on our taxable income at regular corporate rates; |
• | Any resulting tax liability could be substantial and would reduce the amount of cash available for dividends to shareholders, and could force us to liquidate assets or take other actions that could have a detrimental effect on our operating results; and |
• | Unless we were entitled to relief under applicable statutory provisions, we would be disqualified from treatment as a REIT for the four taxable years following the year during which we lost our qualification, and our cash available for dividends to our shareholders would, therefore, be reduced for each of the years in which we do not qualify as a REIT. |
Even if we remain qualified as a REIT, we may face other tax liabilities that reduce our cash flow. We may also be subject to certain U.S. federal, state and local taxes on our income and property either directly or at the level of our subsidiaries. Any of these taxes would decrease cash available for dividends to our shareholders.
Tax laws have changed and may continue to change at any time, and any such legislative or other actions could have a negative effect on us.
Tax laws remain under constant review by persons involved in the legislative process, at the Internal Revenue Service ("IRS") and the U.S. Department of the Treasury, and by various state and local tax authorities. Changes to tax laws, regulations, or administrative interpretations, which may be applied retroactively, could adversely affect us in a number of ways, including making it more difficult or more costly for us to qualify as a REIT or decreasing real estate values generally.
We cannot predict whether, when, in what forms, or with what effective dates, the tax laws, regulations, and administrative interpretations applicable to us or our shareholders may be further changed.
10
Compliance with REIT requirements may negatively affect our operating decisions.
To maintain our status as a REIT for U.S. federal income tax purposes, we must meet certain requirements, on an ongoing basis, including requirements regarding our sources of income, the nature and diversification of our assets, the amounts we distribute to our shareholders and the ownership of our common shares. We may also be required to pay dividends to our shareholders when we do not have funds readily available for distribution or at times when our funds are otherwise needed to fund capital expenditures or debt service obligations.
As a REIT, we must distribute at least 90% of our annual net taxable income (excluding net capital gains) to our shareholders. To the extent that we satisfy this distribution requirement, but distribute less than 100% of our net taxable income, we will be subject to U.S. federal corporate income tax on our undistributed taxable income. From time to time, we may generate taxable income greater than our income for financial reporting purposes, or our net taxable income may be greater than our cash flow available for distribution to our shareholders. If we do not have other funds available in these situations, we could be required to borrow funds, sell a portion of our securities at unfavorable prices or find other sources of funds in order to meet the REIT distribution requirements.
Our common shares dividend policy may change in the future.
The timing, amount and composition of any future dividends to our common shareholders will be at the sole discretion of our Board of Trust Managers and will depend upon a variety of factors as to which no assurance can be given. Our ability to make dividends to our common shareholders depends, in part, upon our operating results, overall financial condition, the performance of our portfolio (including occupancy levels and rental rates), our capital requirements, access to capital, our ability to qualify for taxation as a REIT and general business and market conditions. Any change in our dividend policy could have an adverse effect on the market price of our common shares.
Our declaration of trust contains certain limitations associated with share ownership.
To maintain our status as a REIT, our declaration of trust prohibits any individual from owning more than 9.8% of our outstanding common shares. This restriction is likely to discourage third parties from acquiring control without the consent of our Board of Trust Managers, even if a change in control were in the best interests of our shareholders.
Also, our declaration of trust requires the approval of the holders of 80% of our outstanding common shares and the approval by not less than 50% of the outstanding common shares not owned by any related person (a person owning more than 50% of our common shares) to consummate a business transaction such as a merger. There are certain exceptions to this requirement; however, the 80% approval requirement could make it difficult for us to consummate a business transaction even if it is in the best interests of our shareholders.
There may be future dilution of our common shares.
Our declaration of trust authorizes our Board of Trust Managers to, among other things, issue additional common or preferred shares or securities convertible or exchangeable into equity securities, without shareholder approval. We may issue such additional equity or convertible securities to raise additional capital. The issuance of any additional common or preferred shares or convertible securities could be substantially dilutive to holders of our common shares. Moreover, to the extent that we issue restricted shares, options, or warrants to purchase our common shares in the future and those options or warrants are exercised or the restricted shares vest, our shareholders may experience further dilution. Holders of our common shares have no preemptive rights that entitle them to purchase a pro rata share of any offering of shares of any class or series and, therefore, such sales or offerings could result in increased dilution to our shareholders.
We may issue debt and equity securities or securities convertible into equity securities, any of which may be senior to our common shares as to distributions and in liquidation, which could negatively affect the value of our common shares.
11
In the future, we may attempt to increase our capital resources by entering into unsecured or secured debt or debt-like financings, or by issuing additional debt or equity securities, which could include issuances of medium-term notes, senior notes, subordinated notes, secured debt, guarantees, preferred shares, hybrid securities, or securities convertible into or exchangeable for equity securities. In the event of our liquidation, our lenders and holders of our debt and, if any, preferred securities would receive distributions of our available assets before distributions to the holders of our common shares. Because any decision to incur debt and issue securities in future offerings may be influenced by market conditions and other factors beyond our control, we cannot predict or estimate the amount, timing, or nature of our future financings. Further, market conditions could require us to accept less favorable terms for the issuance of our securities in the future.
Our declaration of trust contains certain limitations that make removal of our Trust Managers difficult, which could limit our shareholders ability to effect changes to our management.
Our declaration of trust provides that a Trust Manager may only be removed for cause upon the affirmative vote of holders of two-thirds of the total votes authorized to be cast by shares outstanding and entitled to be voted. Vacancies may be filled by either a majority of the remaining Trust Managers or elected by the vote of holders of at least two-thirds of the outstanding shares at the Annual Meeting or a special meeting of the shareholders. These requirements provide limitations to make changes in our management by removing and replacing Trust Managers and may prevent a change of control that is in the best interests of our shareholders.
Loss of our key personnel could adversely affect the value of our common shares and operations.
We are dependent on the efforts of our key executive personnel. A significant number of persons in our management group are eligible for retirement. Although we believe qualified replacements could be found for these key executives and other members of our management group, the loss of their services could adversely affect the value of our common shares and operations.
Changes in accounting standards may adversely impact our reported financial condition and results of operations.
The Financial Accounting Standards Board (“FASB”), in conjunction with the SEC, continually engages in projects to evaluate additions or changes to current accounting standards which could impact how we currently account for our material transactions. We believe that these and other potential proposals could have varying degrees of impact on us ranging from minimal to material. At this time, we are unable to predict with certainty which, if any, proposals may be passed or what level of impact any such proposal could have on us, except as disclosed in Item 8.
We could be subject to litigation that may negatively impact our cash flows, financial condition and results of operations.
From time to time, we may be a defendant in lawsuits and regulatory proceedings relating to our business. Due to the inherent uncertainties of litigation and regulatory proceedings, we cannot accurately predict the ultimate outcome of any such litigation or proceedings. We could experience a negative impact to our cash flows, financial condition and results of operations due to an unfavorable outcome.
Compliance with certain laws and governmental rules and regulations may require us to make unintended expenditures that adversely affect our cash flows.
All of our properties are required to comply with certain laws and governmental rules and regulations, including the Americans with Disabilities Act, fire and safety regulations, building codes and other land use regulations, as they may be in effect or adopted by governmental agencies and bodies and become applicable to our properties. We may be required to make substantial capital expenditures to comply with those requirements, and these expenditures could have a material adverse effect on our ability to meet the financial obligations and pay dividends to our shareholders.
12
An uninsured loss or a loss that exceeds the policies on our properties could subject us to lost capital or revenue on those properties.
Under the terms and conditions of the leases currently in force on our properties, tenants generally are required to indemnify and hold us harmless from liabilities resulting from injury to persons, air, water, land or property, on or off the premises, due to activities conducted on the properties, except for claims arising from our negligence or intentional misconduct or that of our agents. Tenants are generally required, at the tenant’s expense, to obtain and keep in full force during the term of the lease, liability and tenant's property damage insurance policies. We have obtained comprehensive liability, casualty, property, flood, earthquake, environmental and rental loss insurance policies on our properties. All of these policies may involve substantial deductibles and certain exclusions. In addition, we cannot assure the shareholders that the tenants will properly maintain their insurance policies or have the ability to pay the deductibles. Should a loss occur that is uninsured or in an amount exceeding the combined aggregate limits for the policies noted above, or in the event of a loss that is subject to a substantial deductible under an insurance policy, we could lose all or part of our capital invested in, and anticipated revenue from, one or more of the properties, which could have a material adverse effect on our operating results and financial condition, as well as our ability to pay dividends to the shareholders.
We may be subject to liability under environmental laws, ordinances and regulations.
Under various federal, state and local laws, ordinances and regulations, we may be considered an owner or operator of real property or have arranged for the disposal or treatment of hazardous or toxic substances. As a result, we may become liable for the costs of disposal or treatment of hazardous or toxic substances released on or in our property. We may also be liable for certain other potential costs that could relate to hazardous or toxic substances (including governmental fines and injuries to persons and property). We may incur such liability whether or not we knew of, or were responsible for, the presence of such hazardous or toxic substances.
Natural disasters and severe weather conditions could have an adverse effect on our cash flow and operating results.
Changing weather patterns and climatic conditions, such as global warming, may have added to the unpredictability and frequency of natural disasters in some parts of the world and created additional uncertainty as to future trends and exposures. Our operations are located in many areas that have experienced and may in the future experience natural disasters and severe weather conditions such as hurricanes, tornadoes, earthquakes, droughts, floods and fires. The occurrence of natural disasters or severe weather conditions can delay new development and redevelopment projects, increase investment costs to repair or replace damaged properties, increase future property insurance costs, and negatively impact the tenant demand for lease space. Additionally, these weather conditions may also disrupt our tenants' businesses, which could affect the ability of some tenants to pay rent and may reduce the willingness of tenants to remain in or move to the affected area. Intense weather conditions during the last decade, among other factors, have caused our cost of property insurance to increase significantly. If insurance is unavailable to us or is unavailable on acceptable terms, or if our insurance is not adequate to cover business interruption or losses from these events, our earnings, liquidity or capital resources could be adversely affected.
Our business and operations would suffer in the event of system failures.
Despite the implementation of security measures and the existence of a disaster recovery and business continuity plans for our internal information technology systems, our systems are vulnerable to damages from any number of sources, including computer viruses, unauthorized access, energy blackouts, natural disasters, terrorism, war and telecommunication failures. Any system failure or accident that causes interruptions in our operations could result in a material disruption to our business. We may also incur additional costs to remedy damages caused by such disruptions.
13
We face risks relating to cybersecurity attacks, loss of confidential information and other business disruptions.
Our business is at risk from and may be impacted by cybersecurity attacks, including attempts to gain unauthorized access to our confidential data and other electronic security breaches. Such cybersecurity attacks can range from individual attempts to gain unauthorized access to our information technology systems to more sophisticated security threats. In addition to our own information technology systems, third parties have been engaged to provide information technology services relating to several key business functions, such as payroll, human resources, electronic communications and certain finance functions. While we and such third parties employ a number of measures to prevent, detect and mitigate these threats including a defense in depth strategy of firewalls, intrusion sensors, malware detection, password protection, backup servers, user training and periodic penetration testing, there is no guarantee such efforts will be successful in preventing a cybersecurity attack. As our reliance on technology has increased, so have the risks posed to our systems, both internal and those we have outsourced. Cybersecurity incidents could compromise the confidential information of our tenants, employees and third-party vendors and disrupt and affect the efficiency of our business operations.
ITEM 1B. Unresolved Staff Comments
None.
ITEM 2. Properties
At December 31, 2019, we owned or operated under long-term leases, either directly or through our interest in real estate joint ventures or partnerships, a total of 170 centers, primarily neighborhood, community and power shopping centers, which are located in 16 states spanning the country from coast to coast with approximately 32.5 million square feet of gross leasable area. Our centers are located principally in the South, West Coast and Southeast Coast of the U.S. with concentrations in California, Florida, and Texas. We also owned interests in 23 parcels of land held for development that totaled approximately 11.9 million square feet at December 31, 2019, of which approximately 11.7 million square feet may be used for new development or sold, and the remaining of which is adjacent to our existing operating centers may be used for expansion of those centers.
In 2019, no single center accounted for more than 7.1% of our total assets or 4.3% of base minimum rental revenues. The five largest centers, in the aggregate, represented approximately 13.4% of our base minimum rental revenues for the year ended December 31, 2019; otherwise, none of the remaining centers accounted for more than 2% of our base minimum rental revenues during the same period.
Our centers are designed to attract local area customers and are typically anchored by a supermarket or other national tenants (such as Kroger, HEB or T.J. Maxx). The centers are primarily neighborhood and community shopping centers that often include discounters, value-oriented retailers and specialty grocers as additional anchors or tenants, and typically range in size from 50,000 to 600,000 square feet of building area. Very few of the centers have climate-controlled common areas, but are designed to allow retail customers to park their automobiles in close proximity to any retailer in the center. Our centers are customarily constructed of masonry, steel and glass, and all have lighted, paved parking areas, which are typically landscaped with berms, trees and shrubs. They are generally located at major intersections in close proximity to neighborhoods that have existing populations sufficient to support retail activities of the types conducted in our centers.
We actively embrace various initiatives that support the future of environmentally friendly shopping centers. Our primary areas of focus include energy efficiency, waste recycling, water conservation and construction/development best practices. We recognize there are economic, environmental and social implications associated with the full range of our sustainability efforts, and that a commitment to incorporating sustainable practices should add long-term value to our centers.
As of December 31, 2019, the weighted average occupancy rate for our centers was 95.2% compared to 94.4% as of December 31, 2018. The average base rent per square foot was approximately $19.87 in 2019, $19.35 in 2018, $18.69 in 2017, $17.93 in 2016 and $16.92 in 2015 for our centers.
We have approximately 3,800 separate leases with 2,900 different tenants. Included among our top revenue-producing tenants are: TJX Companies, Inc., The Kroger Co., Whole Foods Market, Inc., H-E-B Grocery Company, LP, Ross Stores, Inc., Albertsons Companies, Inc., Home Depot, Inc., PetSmart, Inc., 24 Hour Fitness Worldwide, Inc., and Bed, Bath & Beyond Inc. The diversity of our tenant base is also evidenced by the fact that our largest tenant, TJX Companies, Inc., accounted for only 2.6% of base minimum rental revenues during 2019.
14
Tenant Lease Expirations
As of December 31, 2019, lease expirations for the next 10 years, assuming tenants do not exercise renewal options, are as follows:
Annual Rent of Expiring Leases | ||||||||||||||||||||
Year | Number of Expiring Leases | Square Feet of Expiring Leases (000’s) | Percentage of Leasable Square Feet | Total (000’s) | Per Square Foot | Percentage of Total Annual Net Rent | ||||||||||||||
2020 | 449 | 1,754 | 5.39 | % | $ | 35,652 | $ | 20.33 | 10.38 | % | ||||||||||
2021 | 525 | 2,553 | 7.84 | % | 49,827 | 19.52 | 14.50 | % | ||||||||||||
2022 | 517 | 2,921 | 8.97 | % | 56,190 | 19.24 | 16.35 | % | ||||||||||||
2023 | 413 | 2,408 | 7.40 | % | 43,818 | 18.20 | 12.75 | % | ||||||||||||
2024 | 384 | 2,652 | 8.15 | % | 45,994 | 17.34 | 13.39 | % | ||||||||||||
2025 | 156 | 1,265 | 3.89 | % | 22,974 | 18.16 | 6.69 | % | ||||||||||||
2026 | 93 | 650 | 2.00 | % | 14,667 | 22.56 | 4.27 | % | ||||||||||||
2027 | 80 | 857 | 2.63 | % | 15,129 | 17.65 | 4.40 | % | ||||||||||||
2028 | 95 | 1,323 | 4.06 | % | 21,119 | 15.96 | 6.15 | % | ||||||||||||
2029 | 87 | 818 | 2.51 | % | 13,748 | 16.81 | 4.00 | % | ||||||||||||
New Development/Redevelopment
At December 31, 2019, we had three projects in various stages of construction that were partially or wholly owned. We have funded $368.4 million through December 31, 2019 on these projects. We estimate our aggregate net investment upon completion to be $485.0 million. These projects are forecasted to have an average stabilized return on investment of approximately 5.5% when completed.
Upon completion, the estimated costs and square footage to be added to the portfolio for the three projects are as follows:
Project | City, State | Project Type | Retail Square Feet (000’s) | Residential Units | Net Estimated Costs (1) (000's) | Estimated Year of Completion | ||||||
West Alex | Alexandria, Virginia | Mixed-Use | 127 | 278 | $200,000 | 2022 | ||||||
Centro Arlington (2) | Arlington, Virginia | Mixed-Use | 72 | 366 | 135,000 | 2020 | ||||||
The Driscoll at River Oaks | Houston, Texas | Mixed-Use | 11 | 318 | 150,000 | 2022 | ||||||
___________________
(1) | Current net estimated costs represents WRI's share of capital expenditures net of any forecasted sales of land pads. |
(2) | Represents an unconsolidated joint venture where we have funded $121.1 million as of December 31, 2019, and we anticipate funding an additional $9 million through 2020. |
15
Property Listing
The following table is a list of centers, summarized by state and includes our share of both consolidated and unconsolidated real estate partnerships and joint ventures as of December 31, 2019:
ALL PROPERTIES BY STATE | Number of Properties | Gross Leasable Area (GLA) | % of Total GLA | ||||||
Arizona | 19 | 2,863,083 | 8.8 | % | |||||
California | 18 | 3,249,876 | 10.0 | % | |||||
Colorado | 5 | 1,710,705 | 5.3 | % | |||||
Florida | 28 | 6,953,434 | 21.4 | % | |||||
Georgia | 11 | 1,987,551 | 6.1 | % | |||||
Kentucky | 1 | 218,107 | 0.7 | % | |||||
Maryland | 1 | 80,841 | 0.2 | % | |||||
Nevada | 4 | 872,819 | 2.7 | % | |||||
New Mexico | 1 | 145,851 | 0.4 | % | |||||
North Carolina | 11 | 1,857,435 | 5.7 | % | |||||
Oregon | 2 | 179,746 | 0.5 | % | |||||
Tennessee | 4 | 654,550 | 2.0 | % | |||||
Texas | 54 | 10,339,646 | 31.8 | % | |||||
Utah | 1 | 304,899 | 0.9 | % | |||||
Virginia | 3 | 323,105 | 1.0 | % | |||||
Washington | 7 | 808,264 | 2.5 | % | |||||
Total | 170 | 32,549,912 | 100 | % | |||||
___________________
GLA includes 4.5 million square feet of our partners’ ownership interest in these properties and 6.5 million square feet not owned or managed by us. Additionally, encumbrances on our properties total $263.4 million. See Schedule III for additional information.
The following table is a detailed list of centers by state and includes our share of both consolidated and unconsolidated real estate partnerships and joint ventures as of December 31, 2019:
Center | CBSA (7) | Owned % | Foot Notes | GLA | Grocer Anchor ( ) indicates owned by others | Other Anchors ( ) indicates owned by others | ||||||||
Operating Properties | ||||||||||||||
Arizona | ||||||||||||||
Broadway Marketplace | Phoenix-Mesa-Scottsdale, AZ | 100.0 | % | 87,379 | Office Max, Ace Hardware | |||||||||
Camelback Miller Plaza | Phoenix-Mesa-Scottsdale, AZ | 100.0 | % | 150,711 | Sprouts Farmers Market | T.J. Maxx, PetSmart | ||||||||
Camelback Village Square | Phoenix-Mesa-Scottsdale, AZ | 100.0 | % | 240,951 | Fry’s Supermarket | (LA Fitness) | ||||||||
Desert Village Shopping Center | Phoenix-Mesa-Scottsdale, AZ | 100.0 | % | 107,071 | AJ Fine Foods | CVS | ||||||||
Fountain Plaza | Phoenix-Mesa-Scottsdale, AZ | 100.0 | % | 304,107 | Fry’s Supermarket | Dollar Tree, (Lowe's) | ||||||||
Madison Village Marketplace | Phoenix-Mesa-Scottsdale, AZ | 100.0 | % | 90,264 | Safeway | |||||||||
Monte Vista Village Center | Phoenix-Mesa-Scottsdale, AZ | 100.0 | % | 108,551 | (Wells Fargo) | |||||||||
Phoenix Office Building | Phoenix-Mesa-Scottsdale, AZ | 100.0 | % | 21,122 | Weingarten Realty Regional Office, Endurance Rehab | |||||||||
Pueblo Anozira Shopping Center | Phoenix-Mesa-Scottsdale, AZ | 100.0 | % | 157,532 | Fry’s Supermarket | Petco, Dollar Tree | ||||||||
Raintree Ranch Center | Phoenix-Mesa-Scottsdale, AZ | 100.0 | % | 133,020 | Whole Foods | |||||||||
Red Mountain Gateway | Phoenix-Mesa-Scottsdale, AZ | 100.0 | % | 204,928 | (Target), Bed Bath & Beyond, Famous Footwear | |||||||||
Scottsdale Horizon | Phoenix-Mesa-Scottsdale, AZ | 100.0 | % | 155,046 | Safeway | CVS | ||||||||
Scottsdale Waterfront | Phoenix-Mesa-Scottsdale, AZ | 100.0 | % | 93,334 | Olive & Ivy, P.F. Chang's, David's Bridal, Urban Outfitters | |||||||||
16
Center | CBSA (7) | Owned % | Foot Notes | GLA | Grocer Anchor ( ) indicates owned by others | Other Anchors ( ) indicates owned by others | ||||||||
Squaw Peak Plaza | Phoenix-Mesa-Scottsdale, AZ | 100.0 | % | 60,713 | Sprouts Farmers Market | |||||||||
Summit at Scottsdale | Phoenix-Mesa-Scottsdale, AZ | 51.0 | % | (1)(3) | 322,992 | Safeway | (Target), CVS, OfficeMax, PetSmart | |||||||
Entrada de Oro Plaza Shopping Center | Tucson, AZ | 100.0 | % | 109,075 | Walmart Neighborhood Market | |||||||||
Madera Village Shopping Center | Tucson, AZ | 100.0 | % | 106,858 | Safeway | Dollar Tree | ||||||||
Oracle Wetmore Shopping Center | Tucson, AZ | 100.0 | % | 343,298 | (Home Depot), (Nordstrom Rack), Jo-Ann Fabric, Cost Plus World Market, PetSmart, Walgreens, Ulta Beauty | |||||||||
Shoppes at Bears Path | Tucson, AZ | 100.0 | % | 66,131 | (CVS Drug) | |||||||||
Arizona Total: | 2,863,083 | |||||||||||||
California | ||||||||||||||
8000 Sunset Strip Shopping Center | Los Angeles-Long Beach-Anaheim, CA | 100.0 | % | 169,775 | Trader Joe's | CVS, Crunch, AMC Theaters, CB2 | ||||||||
Centerwood Plaza | Los Angeles-Long Beach-Anaheim, CA | 100.0 | % | 75,486 | Superior Grocers | Dollar Tree | ||||||||
The Westside Center | Los Angeles-Long Beach-Anaheim, CA | 100.0 | % | 36,540 | Guitar Center | |||||||||
Westminster Center | Los Angeles-Long Beach-Anaheim, CA | 100.0 | % | 440,437 | Albertsons | Home Depot, Ross Dress for Less, Petco, Rite Aid, Dollar Tree, 24 Hour Fitness | ||||||||
Chino Hills Marketplace | Riverside-San Bernardino-Ontario, CA | 100.0 | % | 310,812 | Smart & Final Stores | Dollar Tree, 24 Hour Fitness, Rite Aid | ||||||||
Valley Shopping Center | Sacramento--Roseville--Arden-Arcade, CA | 100.0 | % | 107,191 | Food 4 Less | |||||||||
El Camino Promenade | San Diego-Carlsbad, CA | 100.0 | % | 128,740 | T.J. Maxx, Dollar Tree, BevMo | |||||||||
Rancho San Marcos Village | San Diego-Carlsbad, CA | 100.0 | % | 133,439 | Vons | 24 Hour Fitness | ||||||||
San Marcos Plaza | San Diego-Carlsbad, CA | 100.0 | % | 80,086 | (Albertsons) | |||||||||
580 Market Place | San Francisco-Oakland-Hayward, CA | 100.0 | % | 100,097 | Safeway | 24 Hour Fitness, Petco | ||||||||
Gateway Plaza | San Francisco-Oakland-Hayward, CA | 100.0 | % | 352,778 | Raley’s | 24 Hour Fitness | ||||||||
Greenhouse Marketplace | San Francisco-Oakland-Hayward, CA | 100.0 | % | 232,824 | (Safeway) | (CVS), Jo-Ann Fabric, 99 Cents Only, Petco | ||||||||
Cambrian Park Plaza | San Jose-Sunnyvale-Santa Clara, CA | 100.0 | % | 171,190 | BevMo, Dollar Tree | |||||||||
Silver Creek Plaza | San Jose-Sunnyvale-Santa Clara, CA | 100.0 | % | 201,716 | Sprouts Farmers Market | Walgreens | ||||||||
Stevens Creek Central | San Jose-Sunnyvale-Santa Clara, CA | 100.0 | % | 195,863 | Safeway | Marshalls, Total Wine, Cost Plus World Market | ||||||||
Freedom Centre | Santa Cruz-Watsonville, CA | 100.0 | % | 150,865 | Safeway | Rite Aid, Big Lots | ||||||||
Stony Point Plaza | Santa Rosa, CA | 100.0 | % | 200,011 | Food Maxx | Ross Dress for Less, Fallas Paredes | ||||||||
Southampton Center | Vallejo-Fairfield, CA | 100.0 | % | 162,026 | Raley’s | Ace Hardware, Dollar Tree | ||||||||
California Total: | 3,249,876 | |||||||||||||
Colorado | ||||||||||||||
Aurora City Place | Denver-Aurora-Lakewood, CO | 50.0 | % | (1)(3) | 538,152 | (Super Target) | Barnes & Noble, Ross Dress For Less, PetSmart, Michaels, Conn's | |||||||
Crossing at Stonegate | Denver-Aurora-Lakewood, CO | 100.0 | % | 109,080 | King Sooper’s | |||||||||
Edgewater Marketplace | Denver-Aurora-Lakewood, CO | 100.0 | % | 270,548 | King Sooper's | Ace Hardware, (Target) | ||||||||
Lowry Town Center | Denver-Aurora-Lakewood, CO | 100.0 | % | 129,425 | (Safeway) | |||||||||
River Point at Sheridan | Denver-Aurora-Lakewood, CO | 100.0 | % | 663,500 | (Target), (Costco), Regal Cinema, Michaels, Conn's, PetSmart, Burlington | |||||||||
Colorado Total: | 1,710,705 | |||||||||||||
Florida | ||||||||||||||
Argyle Village Shopping Center | Jacksonville, FL | 100.0 | % | 306,506 | Publix | Bed Bath & Beyond, T.J. Maxx, Jo-Ann Fabric, Michaels, American Signature Furniture | ||||||||
Atlantic West | Jacksonville, FL | 50.0 | % | (1)(3) | 188,278 | (Walmart Supercenter) | T.J. Maxx, HomeGoods, Dollar Tree, Shoe Carnival, (Kohl's) | |||||||
Epic Village St. Augustine | Jacksonville, FL | 70.0 | % | (1) | 64,180 | (Epic Theaters) | ||||||||
Kernan Village | Jacksonville, FL | 50.0 | % | (1)(3) | 288,780 | (Walmart Supercenter) | Ross Dress for Less, Petco | |||||||
Boca Lyons Plaza | Miami-Fort Lauderdale-West Palm Beach, FL | 100.0 | % | 117,597 | Aroma Market & Catering | Ross Dress for Less | ||||||||
Deerfield | Miami-Fort Lauderdale-West Palm Beach, FL | 100.0 | % | 408,803 | Publix | T.J. Maxx, Marshalls, Cinépolis, YouFit, Ulta | ||||||||
Embassy Lakes Shopping Center | Miami-Fort Lauderdale-West Palm Beach, FL | 100.0 | % | 142,751 | Tuesday Morning, Dollar Tree | |||||||||
17
Center | CBSA (7) | Owned % | Foot Notes | GLA | Grocer Anchor ( ) indicates owned by others | Other Anchors ( ) indicates owned by others | ||||||||
Flamingo Pines | Miami-Fort Lauderdale-West Palm Beach, FL | 20.0 | % | (1)(3) | 148,841 | Publix | ||||||||
Hollywood Hills Plaza | Miami-Fort Lauderdale-West Palm Beach, FL | 20.0 | % | (1)(3) | 416,769 | Publix | Target, Chewy.com | |||||||
Northridge | Miami-Fort Lauderdale-West Palm Beach, FL | 20.0 | % | (1)(3) | 236,478 | Publix | Petco, Ross Dress for Less, Dollar Tree | |||||||
Pembroke Commons | Miami-Fort Lauderdale-West Palm Beach, FL | 20.0 | % | (1)(3) | 323,687 | Publix | Marshalls, Office Depot, LA Fitness, Dollar Tree | |||||||
Sea Ranch Centre | Miami-Fort Lauderdale-West Palm Beach, FL | 100.0 | % | 98,851 | Publix | CVS, Dollar Tree | ||||||||
Tamiami Trail Shops | Miami-Fort Lauderdale-West Palm Beach, FL | 20.0 | % | (1)(3) | 132,647 | Publix | CVS | |||||||
The Palms at Town & County | Miami-Fort Lauderdale-West Palm Beach, FL | 100.0 | % | 657,638 | Publix | Kohl's, Marshalls, HomeGoods, Dick's Sporting Goods, 24 Hour Fitness, Nordstrom Rack, CVS | ||||||||
TJ Maxx Plaza | Miami-Fort Lauderdale-West Palm Beach, FL | 100.0 | % | 161,429 | Fresco Y Mas | T.J. Maxx, Dollar Tree | ||||||||
Vizcaya Square Shopping Center | Miami-Fort Lauderdale-West Palm Beach, FL | 100.0 | % | 110,081 | Winn Dixie | |||||||||
Wellington Green Commons | Miami-Fort Lauderdale-West Palm Beach, FL | 100.0 | % | 136,556 | Whole Foods Market | |||||||||
Clermont Landing | Orlando-Kissimmee-Sanford, FL | 75.0 | % | (1)(3) | 347,284 | (J.C. Penney), (Epic Theater), T.J. Maxx, Ross Dress for Less, Michaels | ||||||||
Colonial Plaza | Orlando-Kissimmee-Sanford, FL | 100.0 | % | 498,457 | Hobby Lobby, Ross Dress for Less, Marshalls, Old Navy, Staples, Stein Mart, Barnes & Noble, Petco, Big Lots | |||||||||
Phillips Crossing | Orlando-Kissimmee-Sanford, FL | 100.0 | % | 145,644 | Whole Foods | Golf Galaxy, Michaels | ||||||||
Shoppes of South Semoran | Orlando-Kissimmee-Sanford, FL | 100.0 | % | 103,779 | Walmart Neighborhood Market | Dollar Tree | ||||||||
The Marketplace at Dr. Phillips | Orlando-Kissimmee-Sanford, FL | 20.0 | % | (1)(3) | 326,850 | Publix | HomeGoods, Stein Mart, Morton's of Chicago, Office Depot | |||||||
Winter Park Corners | Orlando-Kissimmee-Sanford, FL | 100.0 | % | 93,311 | Sprouts Farmers Market | |||||||||
Pineapple Commons | Port St. Lucie, FL | 20.0 | % | (1)(3) | 269,924 | Ross Dress for Less, Best Buy, PetSmart, Marshalls, (CVS) | ||||||||
Countryside Centre | Tampa-St. Petersburg-Clearwater, FL | 100.0 | % | 245,958 | T.J. Maxx, HomeGoods, Dick's Sporting Goods, Ross Dress for Less | |||||||||
East Lake Woodlands | Tampa-St. Petersburg-Clearwater, FL | 20.0 | % | (1)(3) | 104,430 | Walmart Neighborhood Market | Walgreens | |||||||
Largo Mall | Tampa-St. Petersburg-Clearwater, FL | 100.0 | % | 610,106 | (Publix) | Marshalls, Bealls, PetSmart, Bed Bath & Beyond, Staples, Michaels, (Target) | ||||||||
Sunset 19 Shopping Center | Tampa-St. Petersburg-Clearwater, FL | 100.0 | % | 267,819 | Sprouts Farmers Market | Hobby Lobby, Bed Bath & Beyond, Barnes & Noble, Old Navy, Cost Plus World Market | ||||||||
Florida Total: | 6,953,434 | |||||||||||||
Georgia | ||||||||||||||
Brownsville Commons | Atlanta-Sandy Springs-Roswell, GA | 100.0 | % | 81,913 | (Kroger) | |||||||||
Camp Creek Marketplace II | Atlanta-Sandy Springs-Roswell, GA | 100.0 | % | 228,003 | Burlington, DSW, LA Fitness, American Signature Furniture | |||||||||
Grayson Commons | Atlanta-Sandy Springs-Roswell, GA | 100.0 | % | 76,581 | Kroger | |||||||||
Lakeside Marketplace | Atlanta-Sandy Springs-Roswell, GA | 100.0 | % | 332,699 | (Super Target) | Ross Dress for Less, Petco | ||||||||
Mansell Crossing | Atlanta-Sandy Springs-Roswell, GA | 20.0 | % | (1)(3) | 102,930 | buybuy BABY, Ross Dress for Less, Party City | ||||||||
North Decatur Station | Atlanta-Sandy Springs-Roswell, GA | 51.0 | % | (1)(3) | 88,778 | Whole Foods 365 | ||||||||
Perimeter Village | Atlanta-Sandy Springs-Roswell, GA | 100.0 | % | 380,538 | Walmart Supercenter | Hobby Lobby, Cost Plus World Market, DSW | ||||||||
Publix at Princeton Lakes | Atlanta-Sandy Springs-Roswell, GA | 20.0 | % | (1)(3) | 72,205 | Publix | ||||||||
Roswell Corners | Atlanta-Sandy Springs-Roswell, GA | 100.0 | % | 327,261 | (Super Target), Fresh Market | T.J. Maxx | ||||||||
Roswell Crossing Shopping Center | Atlanta-Sandy Springs-Roswell, GA | 100.0 | % | 201,056 | Trader Joe's | Office Max, PetSmart, Walgreens | ||||||||
Thompson Bridge Commons | Gainesville, GA | 100.0 | % | 95,587 | (Kroger) | |||||||||
Georgia Total: | 1,987,551 | |||||||||||||
Kentucky | ||||||||||||||
Festival on Jefferson Court | Louisville/Jefferson County, KY-IN | 100.0 | % | 218,107 | Kroger | (PetSmart), (T.J. Maxx), Staples, Party City | ||||||||
Kentucky Total: | 218,107 | |||||||||||||
Maryland | ||||||||||||||
Pike Center | Washington-Arlington-Alexandria, DC-VA-MD-WV | 100.0 | % | 80,841 | Pier 1, DXL Mens Apparel | |||||||||
Maryland Total: | 80,841 | |||||||||||||
18
Center | CBSA (7) | Owned % | Foot Notes | GLA | Grocer Anchor ( ) indicates owned by others | Other Anchors ( ) indicates owned by others | ||||||||
Nevada | ||||||||||||||
Charleston Commons Shopping Center | Las Vegas-Henderson-Paradise, NV | 100.0 | % | 366,952 | Walmart | Ross Dress for Less, Office Max, 99 Cents Only, PetSmart | ||||||||
College Park Shopping Center | Las Vegas-Henderson-Paradise, NV | 100.0 | % | 195,215 | El Super | Factory 2 U, CVS | ||||||||
Francisco Center | Las Vegas-Henderson-Paradise, NV | 100.0 | % | 148,815 | La Bonita Grocery | (Ross Dress for Less) | ||||||||
Rancho Towne & Country | Las Vegas-Henderson-Paradise, NV | 100.0 | % | 161,837 | Smith’s Food | |||||||||
Nevada Total: | 872,819 | |||||||||||||
New Mexico | ||||||||||||||
North Towne Plaza | Albuquerque, NM | 100.0 | % | 145,851 | Whole Foods Market | HomeGoods | ||||||||
New Mexico Total: | 145,851 | |||||||||||||
North Carolina | ||||||||||||||
Galleria Shopping Center | Charlotte-Concord-Gastonia, NC-SC | 100.0 | % | 324,704 | (Walmart Supercenter) | |||||||||
Bull City Market | Durham-Chapel Hill, NC | 100.0 | % | 40,875 | Whole Foods Market | |||||||||
Hope Valley Commons | Durham-Chapel Hill, NC | 100.0 | % | 81,327 | Harris Teeter | |||||||||
Avent Ferry Shopping Center | Raleigh, NC | 100.0 | % | 119,652 | Food Lion | Family Dollar | ||||||||
Capital Square | Raleigh, NC | 100.0 | % | 143,063 | Food Lion | |||||||||
Falls Pointe Shopping Center | Raleigh, NC | 100.0 | % | 198,549 | Harris Teeter | (Kohl’s) | ||||||||
High House Crossing | Raleigh, NC | 100.0 | % | 87,517 | Lidl | |||||||||
Leesville Towne Centre | Raleigh, NC | 100.0 | % | 127,106 | Harris Teeter | |||||||||
Northwoods Shopping Center | Raleigh, NC | 100.0 | % | 77,803 | Walmart Neighborhood Market | Dollar Tree | ||||||||
Six Forks Shopping Center | Raleigh, NC | 100.0 | % | 468,402 | Food Lion | Target, Home Depot, Bed Bath & Beyond, PetSmart | ||||||||
Stonehenge Market | Raleigh, NC | 100.0 | % | 188,437 | Harris Teeter | Stein Mart, Walgreens | ||||||||
North Carolina Total: | 1,857,435 | |||||||||||||
Oregon | ||||||||||||||
Clackamas Square | Portland-Vancouver-Hillsboro, OR-WA | 20.0 | % | (1)(3) | 140,226 | (Winco Foods) | T.J. Maxx | |||||||
Raleigh Hills Plaza | Portland-Vancouver-Hillsboro, OR-WA | 20.0 | % | (1)(3) | 39,520 | New Seasons Market | Walgreens | |||||||
Oregon Total: | 179,746 | |||||||||||||
Tennessee | ||||||||||||||
Highland Square | Memphis, TN-MS-AR | 100.0 | % | 14,490 | Walgreens | |||||||||
Mendenhall Commons | Memphis, TN-MS-AR | 100.0 | % | 88,108 | Kroger | |||||||||
Ridgeway Trace | Memphis, TN-MS-AR | 100.0 | % | 306,556 | (Target), Best Buy, PetSmart, REI | |||||||||
The Commons at Dexter Lake | Memphis, TN-MS-AR | 100.0 | % | 245,396 | Kroger | Marshalls, HomeGoods, Stein Mart | ||||||||
Tennessee Total: | 654,550 | |||||||||||||
Texas | ||||||||||||||
Mueller Regional Retail Center | Austin-Round Rock, TX | 100.0 | % | 351,099 | Marshalls, PetSmart, Bed Bath & Beyond, Home Depot, Best Buy, Total Wine | |||||||||
North Park Plaza | Beaumont-Port Arthur, TX | 50.0 | % | (1)(3) | 281,035 | (Target), Spec's, Kirkland's | ||||||||
North Towne Plaza | Brownsville-Harlingen, TX | 100.0 | % | 144,846 | (Lowe's) | |||||||||
Rock Prairie Marketplace | College Station-Bryan, TX | 100.0 | % | 18,163 | ||||||||||
Overton Park Plaza | Dallas-Fort Worth-Arlington, TX | 100.0 | % | 462,800 | Sprouts Farmers Market | Burlington, PetSmart, T.J. Maxx, (Home Depot), buybuy BABY | ||||||||
Preston Shepard Place | Dallas-Fort Worth-Arlington, TX | 20.0 | % | (1)(3) | 361,830 | Nordstrom, Marshalls, Stein Mart, Office Depot, Petco, Burlington | ||||||||
10-Federal Shopping Center | Houston-The Woodlands-Sugar Land, TX | 15.0 | % | (1) | 132,473 | Sellers Bros. | Palais Royal, Harbor Freight Tools | |||||||
Alabama Shepherd Shopping Center | Houston-The Woodlands-Sugar Land, TX | 100.0 | % | 59,120 | Trader Joe's | PetSmart | ||||||||
Baybrook Gateway | Houston-The Woodlands-Sugar Land, TX | 100.0 | % | 241,149 | Ashley Furniture, Cost Plus World Market, Barnes & Noble, Michaels | |||||||||
Bellaire Blvd. Shopping Center | Houston-The Woodlands-Sugar Land, TX | 100.0 | % | 43,891 | Randall’s | |||||||||
Blalock Market at I-10 | Houston-The Woodlands-Sugar Land, TX | 100.0 | % | 97,277 | 99 Ranch Market | |||||||||
19
Center | CBSA (7) | Owned % | Foot Notes | GLA | Grocer Anchor ( ) indicates owned by others | Other Anchors ( ) indicates owned by others | ||||||||
Citadel Building | Houston-The Woodlands-Sugar Land, TX | 100.0 | % | 121,000 | Weingarten Realty Investors Corporate Office | |||||||||
Galveston Place | Houston-The Woodlands-Sugar Land, TX | 100.0 | % | 210,361 | Randall’s | Office Depot, Palais Royal, Spec's | ||||||||
Griggs Road Shopping Center | Houston-The Woodlands-Sugar Land, TX | 15.0 | % | (1) | 80,093 | Family Dollar, Citi Trends | ||||||||
Harrisburg Plaza | Houston-The Woodlands-Sugar Land, TX | 15.0 | % | (1) | 93,620 | dd's Discount | ||||||||
HEB - Dairy Ashford & Memorial | Houston-The Woodlands-Sugar Land, TX | 100.0 | % | 36,874 | H-E-B Fulfillment Center | |||||||||
Heights Plaza Shopping Center | Houston-The Woodlands-Sugar Land, TX | 100.0 | % | 71,277 | Kroger | Goodwill | ||||||||
I45/Telephone Rd. | Houston-The Woodlands-Sugar Land, TX | 15.0 | % | (1) | 171,600 | Sellers Bros. | Famsa, Harbor Freight Tools | |||||||
League City Plaza | Houston-The Woodlands-Sugar Land, TX | 15.0 | % | (1) | 129,467 | Crunch Fitness, Spec’s | ||||||||
Market at Westchase Shopping Center | Houston-The Woodlands-Sugar Land, TX | 100.0 | % | 81,441 | Blink Fitness | |||||||||
Oak Forest Shopping Center | Houston-The Woodlands-Sugar Land, TX | 100.0 | % | 157,812 | Kroger | Ross Dress for Less, Dollar Tree, PetSmart | ||||||||
Randalls Center/Kings Crossing | Houston-The Woodlands-Sugar Land, TX | 100.0 | % | 126,397 | Randall’s | CVS | ||||||||
Richmond Square | Houston-The Woodlands-Sugar Land, TX | 100.0 | % | 92,657 | Best Buy, Cost Plus World Market | |||||||||
River Oaks Shopping Center - East | Houston-The Woodlands-Sugar Land, TX | 100.0 | % | 71,265 | Kroger | |||||||||
River Oaks Shopping Center - West | Houston-The Woodlands-Sugar Land, TX | 100.0 | % | (5) | 230,026 | Kroger | Barnes & Noble, Talbots, Ann Taylor, GAP, JoS. A. Bank | |||||||
Shoppes at Memorial Villages | Houston-The Woodlands-Sugar Land, TX | 100.0 | % | 166,777 | Gulf Coast Veterinary Specialists | |||||||||
Shops at Kirby Drive | Houston-The Woodlands-Sugar Land, TX | 100.0 | % | 55,460 | Freebirds Burrito | |||||||||
Shops at Three Corners | Houston-The Woodlands-Sugar Land, TX | 70.0 | % | (1) | 282,613 | Fiesta | Ross Dress for Less, PetSmart, Office Depot, Big Lots | |||||||
Southgate Shopping Center | Houston-The Woodlands-Sugar Land, TX | 15.0 | % | (1) | 124,453 | Food-A-Rama | CVS, Family Dollar, Palais Royal | |||||||
The Centre at Post Oak | Houston-The Woodlands-Sugar Land, TX | 100.0 | % | 183,940 | Marshalls, Old Navy, Grand Lux Café, Nordstrom Rack, Arhaus | |||||||||
The Shops at Hilshire Village | Houston-The Woodlands-Sugar Land, TX | 100.0 | % | 117,473 | Kroger | Walgreens | ||||||||
Tomball Marketplace | Houston-The Woodlands-Sugar Land, TX | 100.0 | % | 326,545 | (Academy), (Kohl's), Ross Dress For Less, Marshalls | |||||||||
Village Plaza at Bunker Hill | Houston-The Woodlands-Sugar Land, TX | 57.8 | % | (1)(3) | 491,687 | H-E-B | PetSmart, Academy, Nordstrom Rack, Burlington | |||||||
West Gray | Houston-The Woodlands-Sugar Land, TX | 100.0 | % | 36,900 | Pier 1 | |||||||||
Westchase Shopping Center | Houston-The Woodlands-Sugar Land, TX | 100.0 | % | 347,475 | Whole Foods Market | (Target), Ross Dress for Less, Petco | ||||||||
Westhill Village Shopping Center | Houston-The Woodlands-Sugar Land, TX | 100.0 | % | 130,851 | Ross Dress for Less, Office Depot, 99 Cents Only | |||||||||
Independence Plaza | Laredo, TX | 100.0 | % | 347,302 | H-E-B | T.J. Maxx, Ross Dress for Less, Hobby Lobby, Petco, Ulta Beauty | ||||||||
North Creek Plaza | Laredo, TX | 100.0 | % | 487,850 | (H-E-B) | (Target), Marshalls, Old Navy, Best Buy, HomeGoods | ||||||||
Plantation Centre | Laredo, TX | 100.0 | % | 144,129 | H-E-B | |||||||||
Las Tiendas Plaza | McAllen-Edinburg-Mission, TX | 50.0 | % | (1)(3) | 500,084 | (Target), Dick's Sporting Goods, Conn's, Ross Dress for Less, Marshalls, Office Depot, (HomeGoods), (Forever 21) | ||||||||
Market at Nolana | McAllen-Edinburg-Mission, TX | 50.0 | % | (1)(3) | 245,057 | (Walmart Supercenter) | ||||||||
Market at Sharyland Place | McAllen-Edinburg-Mission, TX | 50.0 | % | (1)(3) | 301,174 | (Walmart Supercenter) | Kohl's, Dollar Tree | |||||||
McAllen Center | McAllen-Edinburg-Mission, TX | 50.0 | % | (1)(3)(6) | 103,702 | H-E-B | ||||||||
North Sharyland Crossing | McAllen-Edinburg-Mission, TX | 50.0 | % | (1)(3) | 3,576 | |||||||||
Northcross | McAllen-Edinburg-Mission, TX | 50.0 | % | (1)(3) | 75,066 | Barnes & Noble | ||||||||
Old Navy Building | McAllen-Edinburg-Mission, TX | 50.0 | % | (1)(3) | 15,000 | Old Navy | ||||||||
Sharyland Towne Crossing | McAllen-Edinburg-Mission, TX | 50.0 | % | (1)(3) | 492,797 | H-E-B | (Target), T.J. Maxx, Petco, Office Depot, Ross Dress for Less | |||||||
Trenton Crossing | McAllen-Edinburg-Mission, TX | 100.0 | % | 571,255 | (Target), (Kohl's), Hobby Lobby, Ross Dress for Less, Marshalls, PetSmart | |||||||||
Starr Plaza | Rio Grande City, TX | 50.0 | % | (1)(3) | 176,694 | H-E-B | Bealls | |||||||
Fiesta Trails | San Antonio-New Braunfels, TX | 100.0 | % | 486,470 | (H-E-B) | Marshalls, Bob Mills Furniture, Act III Theatres, Stein Mart, Petco | ||||||||
Parliament Square II | San Antonio-New Braunfels, TX | 100.0 | % | 54,541 | Incredible Pizza | |||||||||
20
Center | CBSA (7) | Owned % | Foot Notes | GLA | Grocer Anchor ( ) indicates owned by others | Other Anchors ( ) indicates owned by others | ||||||||
Stevens Ranch | San Antonio-New Braunfels, TX | 50.0 | % | (1) | 21,314 | |||||||||
The Shoppes at Wilderness Oaks | San Antonio-New Braunfels, TX | 100.0 | % | 20,081 | ||||||||||
Thousand Oaks Shopping Center | San Antonio-New Braunfels, TX | 15.0 | % | (1) | 161,807 | H-E-B | Bealls, Tuesday Morning | |||||||
Texas Total: | 10,339,646 | |||||||||||||
Utah | ||||||||||||||
West Jordan Town Center | Salt Lake City, UT | 100.0 | % | 304,899 | Lucky Supermarket | (Target), Petco | ||||||||
Utah Total: | 304,899 | |||||||||||||
Virginia | ||||||||||||||
Hilltop Village Center | Washington-Arlington-Alexandria, DC-VA-MD-WV | 100.0 | % | (4) | 250,811 | Wegmans | L.A. Fitness | |||||||
Virginia Total: | 250,811 | |||||||||||||
Washington | ||||||||||||||
2200 Westlake | Seattle-Tacoma-Bellevue, WA | 69.4 | % | (1)(3) | 87,014 | Whole Foods | ||||||||
Covington Esplanade | Seattle-Tacoma-Bellevue, WA | 100.0 | % | 187,388 | The Home Depot | |||||||||
Meridian Town Center | Seattle-Tacoma-Bellevue, WA | 20.0 | % | (1)(3) | 143,401 | (Safeway) | Jo-Ann Fabric, Tuesday Morning | |||||||
Queen Anne Marketplace | Seattle-Tacoma-Bellevue, WA | 51.0 | % | (1)(3) | 81,053 | Metropolitan Market | Bartell's Drug | |||||||
Rainier Square Plaza | Seattle-Tacoma-Bellevue, WA | 20.0 | % | (1)(3) | 111,735 | Safeway | Ross Dress for Less | |||||||
South Hill Center | Seattle-Tacoma-Bellevue, WA | 20.0 | % | (1)(3) | 134,010 | Bed Bath & Beyond, Ross Dress for Less, Best Buy | ||||||||
The Whittaker | Seattle-Tacoma-Bellevue, WA | 100.0 | % | 63,663 | Whole Foods | |||||||||
Washington Total: | 808,264 | |||||||||||||
Total Operating Properties | 32,477,618 | |||||||||||||
New Development | ||||||||||||||
Virginia | ||||||||||||||
Centro Arlington | Washington-Arlington-Alexandria, DC-VA-MD-WV | 90.0 | % | (1)(2)(3) | 72,294 | Harris Teeter | ||||||||
West Alex | Washington-Arlington-Alexandria, DC-VA-MD-WV | 100.0 | % | (2) | — | Harris Teeter | ||||||||
Virginia Total: | 72,294 | |||||||||||||
Total New Developments | 72,294 | |||||||||||||
Operating & New Development Properties | 32,549,912 | |||||||||||||
___________________
(1) | Denotes property is held by a real estate joint venture or partnership; however, the gross leasable area square feet figures include our partners’ ownership interest in the property and property owned by others. |
(2) | Denotes property currently under development. |
(3) | Denotes properties that are not consolidated under generally accepted accounting principles. |
(4) | Denotes Hilltop Village Center, a 50/50 Joint Venture reflecting current 100% economics to WRI. |
(5) | River Oaks Shopping Center - West includes The Driscoll at River Oaks which is under development. |
(6) | McAllen Center formerly reported as South 10th St. HEB. |
(7) | CBSA represents the Core Based Statistical Area. |
ITEM 3. Legal Proceedings
We are involved in various matters of litigation arising in the normal course of business. While we are unable to predict the amounts involved, our management and counsel believe that when such litigation is resolved, our resulting liability, if any, will not have a material effect on our consolidated financial statements.
ITEM 4. Mine Safety Disclosures
Not applicable.
21
PART II
ITEM 5. Market for Registrant’s Common Equity, Related Shareholder Matters and Issuer Purchases of Equity Securities
Our common shares are listed and traded on the New York Stock Exchange under the symbol “WRI.” As of February 21, 2020, the number of holders of record of our common shares was 1,651.
Securities Authorized for Issuance under Equity Compensation Plans
The following table summarizes the equity compensation plans under which our common shares may be issued as of December 31, 2019:
Plan category | Number of shares to be issued upon exercise of outstanding options, warrants and rights | Weighted average exercise price of outstanding options, warrants and rights | Number of shares remaining available for future issuance under equity compensation plans | |||
Equity compensation plans approved by shareholders | 207,416 | $23.84 | 952,877 | |||
Equity compensation plans not approved by shareholders | — | — | — | |||
Total | 207,416 | $23.84 | 952,877 | |||
22
Performance Graph
The graph and table below provides an indicator of cumulative total shareholder returns for us as compared with the S&P 500 Stock Index and the FTSE NAREIT Equity Shopping Centers Index, weighted by market value at each measurement point. The graph assumes that on December 31, 2014, $100 was invested in our common shares and that all dividends were reinvested by the shareholder.
Comparison of Five Year Cumulative Return
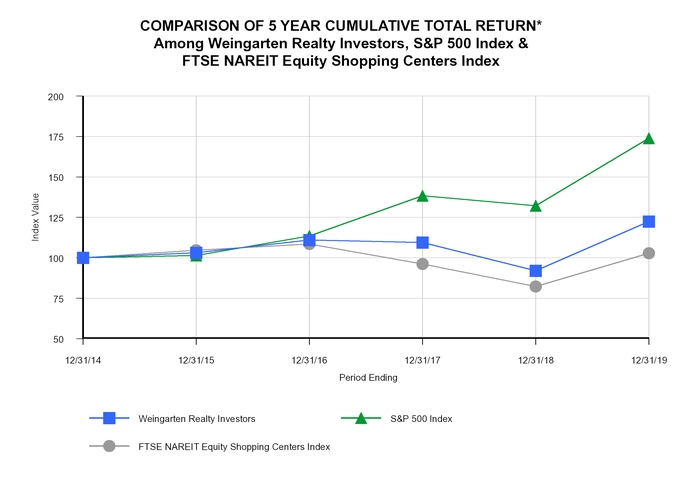
*$100 invested on December 31, 2014 in stock or index, including reinvestment of dividends.
Fiscal year ending December 31.
Source: SNL Financial LC
Fiscal year ending December 31.
Source: SNL Financial LC
2015 | 2016 | 2017 | 2018 | 2019 | |||||||||||||||
Weingarten Realty Investors | $ | 103.18 | $ | 111.00 | $ | 109.40 | $ | 92.03 | $ | 122.49 | |||||||||
S&P 500 Index | 101.38 | 113.51 | 138.29 | 132.23 | 173.86 | ||||||||||||||
FTSE NAREIT Equity Shopping Centers Index | 104.72 | 108.57 | 96.23 | 82.23 | 102.81 | ||||||||||||||
There can be no assurance that our share performance will continue into the future with the same or similar trends depicted in the graph above. We do not make or endorse any predications as to future share performance.
Issuer Purchases of Equity Securities
We have a $200 million share repurchase plan. Under this plan, we may repurchase common shares from time-to-time in open-market or in privately negotiated purchases. The timing and amount of any shares repurchased will be determined by management based on its evaluation of market conditions and other factors. The repurchase plan may be suspended or discontinued at any time, and we have no obligations to repurchase any amount of our common shares under the plan. As of the date of this filing, $181.5 million of common shares remained available to be repurchased under the plan. Also, for the three months ended December 31, 2019, no common shares were surrendered or deemed surrendered to us to satisfy any employees' tax withholding obligations in connection with the vesting and/or exercise of awards under our equity-based compensation plans.
23
ITEM 6. Selected Financial Data
The following table sets forth our selected consolidated financial data and should be read in conjunction with “Item 7. Management’s Discussion and Analysis of Financial Condition and Results of Operations,” the Consolidated Financial Statements and accompanying Notes in “Item 8. Financial Statements and Supplementary Data” and the financial schedules included elsewhere in this Form 10-K.
(Amounts in thousands, except per share amounts) Year Ended December 31, | |||||||||||||||||||
2019 (1) | 2018 (1) | 2017 | 2016 | 2015 | |||||||||||||||
Operating Data: | |||||||||||||||||||
Revenues | $ | 486,625 | $ | 531,147 | $ | 573,163 | $ | 549,555 | $ | 512,844 | |||||||||
Operating expenses | 327,095 | 356,820 | 395,356 | 354,453 | 327,993 | ||||||||||||||
Interest expense, net | 57,601 | 63,348 | 80,326 | 83,003 | 87,783 | ||||||||||||||
Interest and other income, net | 11,003 | 2,807 | 7,532 | 1,910 | 4,406 | ||||||||||||||
Gain on sale of property | 189,914 | 207,865 | 218,611 | 100,714 | 59,621 | ||||||||||||||
Income before income taxes and equity in earnings of real estate joint ventures and partnerships, net | 302,846 | 321,651 | 323,624 | 214,723 | 161,095 | ||||||||||||||
(Provision) benefit for income taxes | (1,040 | ) | (1,378 | ) | 17 | (6,856 | ) | (52 | ) | ||||||||||
Equity in earnings of real estate joint ventures and partnerships, net | 20,769 | 25,070 | 27,074 | 20,642 | 19,300 | ||||||||||||||
Gain on sale and acquisition of real estate joint venture and partnership interests | — | — | — | 48,322 | 879 | ||||||||||||||
Net income | 322,575 | 345,343 | 350,715 | 276,831 | 181,222 | ||||||||||||||
Less: net income attributable to noncontrolling interests | (7,140 | ) | (17,742 | ) | (15,441 | ) | (37,898 | ) | (6,870 | ) | |||||||||
Dividends and redemption costs of preferred shares | — | — | — | — | (13,517 | ) | |||||||||||||
Net income attributable to common shareholders | $ | 315,435 | $ | 327,601 | $ | 335,274 | $ | 238,933 | $ | 160,835 | |||||||||
Per Share Data - Basic: | |||||||||||||||||||
Net income attributable to common shareholders | $ | 2.47 | $ | 2.57 | $ | 2.62 | $ | 1.90 | $ | 1.31 | |||||||||
Weighted average number of shares - basic | 127,842 | 127,651 | 127,755 | 126,048 | 123,037 | ||||||||||||||
Per Share Data - Diluted: | |||||||||||||||||||
Net income attributable to common shareholders | $ | 2.44 | $ | 2.55 | $ | 2.60 | $ | 1.87 | $ | 1.29 | |||||||||
Weighted average number of shares - diluted | 130,116 | 128,441 | 130,071 | 128,569 | 124,329 | ||||||||||||||
Balance Sheet Data: | |||||||||||||||||||
Property before accumulated depreciation | $ | 4,145,249 | $ | 4,105,068 | $ | 4,498,859 | $ | 4,789,145 | $ | 4,262,959 | |||||||||
Total assets | 3,937,934 | 3,826,961 | 4,196,639 | 4,426,928 | 3,901,945 | ||||||||||||||
Debt, net | 1,732,338 | 1,794,684 | 2,081,152 | 2,356,528 | 2,113,277 | ||||||||||||||
Total equity | 1,876,160 | 1,750,699 | 1,809,842 | 1,716,896 | 1,545,010 | ||||||||||||||
Other Data: | |||||||||||||||||||
Cash flows from operating activities | $ | 270,050 | $ | 285,960 | $ | 269,758 | $ | 252,411 | $ | 245,435 | |||||||||
Cash flows from investing activities | (16,026 | ) | 432,954 | 298,992 | (366,172 | ) | (197,132 | ) | |||||||||||
Cash flows from financing activities | (274,870 | ) | (664,111 | ) | (588,695 | ) | 129,798 | (126,248 | ) | ||||||||||
Cash dividends per common share | 1.58 | 2.98 | 2.29 | 1.46 | 1.38 | ||||||||||||||
NAREIT funds from operations attributable to common shareholders - basic (2) | 271,608 | 307,934 | 308,517 | 291,656 | 258,126 | ||||||||||||||
NAREIT funds from operations attributable to common shareholders - diluted (2) | 273,720 | 307,934 | 311,601 | 293,652 | 260,029 | ||||||||||||||
Core funds from operations attributable to common shareholders - diluted (2) | 273,730 | 292,515 | 318,446 | 300,894 | 274,772 | ||||||||||||||
___________________
(1) | See Note 2 in Item 8 for newly issued accounting pronouncements that were adopted using a modified retrospective approach during the respective year and may affect the comparability of the above selected financial information. |
(2) | See Item 7 for the definition of funds from operations attributable to common shareholders for these non-GAAP measures. |
24
ITEM 7. Management’s Discussion and Analysis of Financial Condition and Results of Operations
The following discussion should be read in conjunction with the consolidated financial statements and notes thereto and the comparative summary of selected financial data appearing elsewhere in this report. Historical results and trends which might appear should not be taken as indicative of future operations. Our results of operations and financial condition, as reflected in the accompanying consolidated financial statements and related footnotes, are subject to management’s evaluation and interpretation of business conditions, retailer performance, changing capital market conditions and other factors which could affect the ongoing viability of our tenants. Discussion regarding our results of operations for fiscal year 2018 as compared to fiscal year 2017 is included in Item 7 of our Annual Report on Form 10-K for the year ended December 31, 2018, filed with the SEC on February 28, 2019.
Executive Overview
Weingarten Realty Investors is a REIT organized under the Texas Business Organizations Code. We, and our predecessor entity, began the ownership of shopping centers and other commercial real estate in 1948. Our primary business is leasing space to tenants in the shopping centers we own or lease. These centers may be mixed-use properties that have both retail and residential components. We also provide property management services for which we charge fees to either joint ventures where we are partners or other outside owners.
We operate a portfolio of rental properties, primarily neighborhood and community shopping centers, totaling approximately 32.5 million square feet of gross leasable area that is either owned by us or others. We have a diversified tenant base with our largest tenant comprising only 2.6% of base minimum rental revenues during 2019.
At December 31, 2019, we owned or operated under long-term leases, either directly or through our interest in real estate joint ventures or partnerships, a total of 170 properties, which are located in 16 states spanning the country from coast to coast.
We also owned interests in 23 parcels of land held for development that totaled approximately 11.9 million square feet at December 31, 2019.
We had approximately 3,800 leases with 2,900 different tenants at December 31, 2019. Rental revenue is primarily derived from operating leases with terms of 10 years or less, and may include multiple options, upon tenant election, to extend the lease term in increments up to five years. Many of our leases have increasing minimum rental rates during the terms of the leases through escalation provisions. In addition, the majority of our leases provide for variable rental revenues, such as reimbursements of real estate taxes, maintenance and insurance and may include an amount based on a percentage of the tenants’ sales. Our anchor tenants are supermarkets, value-oriented apparel/discount stores and other retailers or service providers who generally sell basic necessity-type goods and services. Although there is a broad shift in shopping patterns, including internet shopping that continues to affect our tenants, we believe our anchor tenants, most of which have adopted omni-channel models which help drive foot traffic, combined with convenient locations, attractive and well-maintained properties, high quality retailers and a strong tenant mix, should lessen the effects of these conditions and maintain the viability of our portfolio.
Our goal is to remain a leader in owning and operating top-tier neighborhood and community shopping centers and mixed-use properties in certain markets of the United States. Our strategic initiatives include: (1) owning quality shopping centers in preferred locations that attract strong tenants, (2) growing net income from our existing portfolio by increasing occupancy and rental rates, (3) raising net asset value and cash flow through quality acquisitions and new developments, (4) continuously redeveloping our existing shopping centers to increase cash flow and enhance the value of the centers and (5) maintaining a strong, flexible consolidated balance sheet and a well-managed debt maturity schedule. We believe these initiatives will keep our portfolio of properties among the strongest in our sector. Due to current capitalization rates in the market along with the uncertainty of changes in interest rates and various other market conditions, we intend to continue to be very prudent in our evaluation of all new investment opportunities. We believe the pricing of assets that no longer meet our ownership criteria remains reasonably stable while the price of our common shares remains below our net asset value. Given these conditions, we have been focused on dispositions of properties with risk factors that impact our willingness to own them going forward, and although we intend to continue with this strategy, our dispositions are expected to decrease to a normalized level in 2020. We intend to utilize the proceeds from dispositions to, among other things, fund acquisitions along with both new development and redevelopment projects.
25
As we discussed above, we continuously recycle non-core operating centers that no longer meet our ownership criteria and that will provide capital for growth opportunities. During 2019, we disposed of real estate assets, which were owned by us either directly or through our interest in real estate joint ventures or partnerships, with our share of aggregate gross sales proceeds totaling $451.7 million. We have approximately $96 million of dispositions currently under contracts or letters of intent; however, there are no assurances that these transactions will close at such prices or at all. For 2020, we expect the volume of dispositions will significantly decrease from those in 2019, and we anticipate that our normal disposition recycling program will range from $100 million to $150 million.
We intend to continue to actively seek acquisition properties that meet our return hurdles and to actively evaluate other opportunities as they enter the market. Due to the significant amount of capital available in the market, it has been difficult to participate at price points that meet our investment criteria. During 2019, we acquired six centers and other property, of which five are grocery-anchored shopping centers and one is in a 51% unconsolidated real estate joint venture, adding 828,000 square feet to the portfolio with our share of the aggregate gross purchase price totaling $246.4 million. For 2020, we expect to complete acquisition investments in the range of $100 million to $150 million; however, there are no assurances that this will actually occur.
We intend to continue to focus on identifying new development projects as another source of growth, as well as continue to look for redevelopment opportunities. The opportunities for additional new development projects are limited at this time primarily due to a lack of demand for new retail space. During 2019, we invested $150.4 million in two mixed-use new development projects that are partially or wholly owned and a 30-story, high-rise residential tower at our River Oaks Shopping Center in Houston, Texas, and we invested $19.2 million in 11 redevelopment projects that were partially or wholly owned. During 2019, we completed eight redevelopment projects, which added approximately 101,000 square feet to the portfolio with an incremental investment totaling $26.7 million. For 2020, we expect to invest in new development and redevelopments in the range of $75 million to $125 million, but we can give no assurances that this will actually occur.
We strive to maintain a strong, conservative capital structure which should provide ready access to a variety of attractive long and short-term capital sources. We carefully balance lower cost, short-term financing with long-term liabilities associated with acquired or developed long-term assets. We continue to look for transactions that will strengthen our consolidated balance sheet and further enhance our access to various sources of capital, while reducing our cost of capital. During 2019, we repaid a $50 million secured fixed-rate mortgage with a 7% interest rate. Additionally, proceeds from our disposition program and cash generated from operations further strengthened our balance sheet in 2019. Due to the variability in the capital markets, there can be no assurance that favorable pricing and accessibility will be available in the future.
Operational Metrics
In assessing the performance of our centers, management carefully monitors various operating metrics of the portfolio. As a result of our strong leasing activity and low tenant fallout, the operating metrics of our portfolio remained strong in 2019 as we focused on increasing rental rates and same property net operating income ("SPNOI" and see Non-GAAP Financial Measures for additional information). Our portfolio delivered solid operating results with:
• | occupancy of 95.2% at December 31, 2019; |
• | an increase of 3.3% in SPNOI that includes redevelopments for the twelve months ended December 31, 2019 over the same period of 2018; and |
• | rental rate increases of 16.3% for new leases and 10.2% for renewals during the three months ended December 31, 2019. |
26
Below are performance metrics associated with our signed occupancy, SPNOI growth and leasing activity on a pro rata basis:
December 31, | |||||
2019 | 2018 | ||||
Anchor (space of 10,000 square feet or greater) | 97.7 | % | 96.6 | % | |
Non-Anchor | 90.8 | % | 90.6 | % | |
Total Occupancy | 95.2 | % | 94.4 | % | |
Three Months Ended December 31, 2019 | Twelve Months Ended December 31, 2019 | ||||
SPNOI Growth (including Redevelopments) (1) | 2.5 | % | 3.3 | % | |
_______________
(1) | See Non-GAAP Financial Measures for a definition of the measurement of SPNOI and a reconciliation to net income attributable to common shareholders within this section of Item 7. |
Number of Leases | Square Feet ('000's) | Average New Rent per Square Foot ($) | Average Prior Rent per Square Foot ($) | Average Cost of Tenant Improvements per Square Foot ($) | Change in Base Rent on Cash Basis | |||||||||||||||
Leasing Activity: | ||||||||||||||||||||
Three Months Ended December 31, 2019 | ||||||||||||||||||||
New leases (1) | 49 | 160 | $ | 21.73 | $ | 18.69 | $ | 60.86 | 16.3 | % | ||||||||||
Renewals | 109 | 434 | 19.75 | 17.93 | — | 10.2 | % | |||||||||||||
Not comparable spaces | 37 | 153 | ||||||||||||||||||
Total | 195 | 747 | $ | 20.29 | $ | 18.14 | $ | 16.43 | 11.9 | % | ||||||||||
Twelve Months Ended December 31, 2019 | ||||||||||||||||||||
New leases (1) | 172 | 503 | $ | 25.34 | $ | 21.94 | $ | 43.99 | 15.5 | % | ||||||||||
Renewals | 483 | 2,292 | 17.52 | 16.64 | — | 5.2 | % | |||||||||||||
Not comparable spaces | 128 | 509 | ||||||||||||||||||
Total | 783 | 3,304 | $ | 18.92 | $ | 17.60 | $ | 7.92 | 7.5 | % | ||||||||||
_______________
(1) | Average external lease commissions per square foot for the three and twelve months ended December 31, 2019 were $6.82 and $5.91, respectively. |
Changing shopping habits, driven by rapid expansion of internet-driven procurement, led to increased financial problems for many retailers, which had a negative impact on the retail real estate sector. We continue to monitor the effects of these trends, including the impact of retail customer spending over the long-term. We believe the desirability of our physical locations, the significant diversification of our portfolio, both geographically and by tenant base, and the quality of our portfolio, along with its leading retailers and service providers that sell primarily grocery and basic necessity-type goods and services, position us well to mitigate the impact of these changes. Additionally, most retailers have implemented omni-channel models that integrate on-line shopping with in-store experiences that has further reinforced the need for bricks and mortar locations. Despite some tenant bankruptcies, we continue to believe there is retailer demand for quality space within strong, strategically located centers.
27
While we anticipate occupancy in 2020 to increase slightly from 2019, we may experience some fluctuations due to announced bankruptcies and the repositioning of those spaces in the future. A reduction in the availability of quality retail space, as well as continued retailer demand, contributed to the increase in overall rental rates on a same-space basis as we completed new leases and renewed existing leases; however, the magnitude of these increases decreased in comparison to previous years due to, among other factors, a shift in negotiating leverage to the tenant. We expect rental rates to continue to increase; however, we also expect the funding of tenant improvements and allowances will increase as well, and the variability in the mix of leasing transactions as to size of space, market, use and other factors may impact the magnitude of these increases, both positively and negatively. Leasing volume is anticipated to fluctuate due to the uncertainty in tenant fallouts related to bankruptcies and tenant non-renewals. Our expectation is that SPNOI growth including redevelopments will average between 1.5% to 2.5% for 2020 assuming no significant tenant bankruptcies, although there are no assurances that this will occur.
New Development/Redevelopment
At December 31, 2019, we had two mixed-use projects in the Washington D. C. market and a 30-story, high-rise residential tower at our River Oaks Shopping Center in Houston that were in various stages of development and are partially or wholly owned. We have funded $368.4 million through December 31, 2019 on these projects, and we estimate our aggregate net investment upon completion to be $485.0 million. Overall, the average projected stabilized return on investment for these multi-use properties, that include retail and residential components, is expected to approximate 5.5% upon completion.
We have 11 redevelopment projects in which we plan to invest approximately $74.2 million. Upon completion, the average projected stabilized return on our incremental investment on these redevelopment projects is expected to be between 8.0% and 12.0%.
We had approximately $40.7 million in land held for development at December 31, 2019 that may either be developed or sold. While we are experiencing some interest from retailers and other market participants in our land held for development, opportunities for economically viable developments remain limited. We intend to continue to pursue additional development and redevelopment opportunities in multiple markets; however, finding the right opportunities remains challenging.
Acquisitions
Acquisitions are a key component of our long-term growth strategy. The availability of quality acquisition opportunities remains sporadic in our targeted markets. Intense competition, along with a decline in the volume of high-quality core properties on the market, has driven pricing to very high levels. We intend to remain disciplined in approaching these opportunities, pursuing only those that provide appropriate risk-adjusted returns.
Dispositions
Dispositions are also a key component of our ongoing management process where we selectively prune properties from our portfolio that no longer meet our geographic or growth targets. Dispositions provide capital, which may be recycled into properties that are high barrier-to-entry locations within high growth metropolitan markets, and thus have higher long-term growth potential. Additionally, proceeds from dispositions may be used to reduce outstanding debt, further deleveraging our consolidated balance sheet, to repurchase our common shares and/or debt, dependent upon market prices, or to fund new development and redevelopment projects.
Summary of Critical Accounting Policies
Our discussion and analysis of financial condition and results of operations is based on our consolidated financial statements, which have been prepared in accordance with accounting principles generally accepted in the United States of America (“GAAP”). The preparation of these consolidated financial statements requires us to make estimates and judgments that affect the reported amounts of assets, liabilities and contingencies as of the date of the consolidated financial statements and the reported amounts of revenues and expenses during the reporting periods. We evaluate our assumptions and estimates on an ongoing basis. We base our estimates on historical experience and on various other assumptions that we believe to be reasonable under the circumstances, the results of which form the basis for making judgments about the carrying values of assets and liabilities that are not readily apparent from other sources. Actual results may differ from these estimates under different assumptions or conditions. We believe the following critical accounting policies require more significant judgments and estimates used in the preparation of our consolidated financial statements.
28
Real Estate Joint Ventures and Partnerships
To determine the method of accounting for real estate joint ventures and partnerships, management determines whether an entity is a variable interest entity (“VIE”) and, if so, determines which party is the primary beneficiary by analyzing whether we have both the power to direct the entity’s significant economic activities and the obligation to absorb potentially significant losses or receive potentially significant benefits. Significant judgments and assumptions inherent in this analysis include the design of the entity structure, the nature of the entity’s operations, future cash flow projections, the entity’s financing and capital structure, and contractual relationships and terms. We consolidate a VIE when we have determined that we are the primary beneficiary.
Primary risks associated with our involvement with our VIEs include the potential funding of the entities’ debt obligations or making additional contributions to fund the entities’ operations or capital activities.
Non-variable interest real estate joint ventures and partnerships over which we have a controlling financial interest are consolidated in our consolidated financial statements. In determining whether we have a controlling financial interest, we consider factors such as ownership interest, authority to make decisions, kick-out rights and substantive participating rights. Real estate joint ventures and partnerships where we do not have a controlling financial interest, but have the ability to exercise significant influence, are accounted for using the equity method.
Management continually analyzes and assesses reconsideration events, including changes in the factors mentioned above, to determine if the consolidation treatment remains appropriate. Decisions regarding consolidation of real estate joint ventures and partnerships frequently require significant judgment by our management. Errors in the assessment of consolidation could result in material changes to our consolidated financial statements.
Impairment
Our property, including right-of-use assets, is reviewed for impairment if events or changes in circumstances indicate that the carrying amount of the property, any capitalized costs and any identifiable intangible assets, may not be recoverable.
If such an event occurs, a comparison is made of the current and projected operating cash flows of each such property into the foreseeable future, with consideration of applicable holding periods, on an undiscounted basis to the carrying amount of such property. If we determine the carrying amount is not recoverable, our basis in the property is reduced to its estimated fair value to reflect impairment in the value of the asset. Fair values are determined by management utilizing cash flow models, market capitalization rates and market discount rates, or by obtaining third-party broker or appraisal estimates.
We review current economic considerations each reporting period, including the effects of tenant bankruptcies, the suspension of tenant expansion plans for new development projects, declines in real estate values and any changes to plans related to our new development projects, including land held for development, to identify properties where we believe market values may be deteriorating. Determining whether a property is impaired and, if impaired, the amount of write-down to fair value requires a significant amount of judgment by management and is based on the best information available to management at the time of evaluation. The evaluations used in these analyses could result in incorrect estimates when determining carrying values that could be material to our consolidated financial statements.
Our investment in real estate joint ventures and partnerships is reviewed for impairment each reporting period. We evaluate various factors, including operating results of the investee, our ability and intent to hold the investment and our views on current market and economic conditions, when determining if there is a decline in the investment value. We will record an impairment charge if we determine that a decline in the estimated fair value of an investment below its carrying amount is other than temporary. The ultimate realization of impairment losses is dependent on a number of factors, including the performance of each investment and market conditions. A considerable amount of judgment by our management is used in this evaluation and may have a significant impact on the resulting factors analyzed for these purposes.
29
Results of Operations
Comparison of the Year Ended December 31, 2019 to the Year Ended December 31, 2018
The following table is a summary of certain items in income from continuing operations from our Consolidated Statements of Operations, which we believe represent items that significantly changed during 2019 as compared to the same period in 2018:
Year Ended December 31, | ||||||||||||||
2019 | 2018 | Change | % Change | |||||||||||
Revenues | $ | 486,625 | $ | 531,147 | $ | (44,522 | ) | (8.4 | )% | |||||
Depreciation and amortization | 135,674 | 161,838 | (26,164 | ) | (16.2 | ) | ||||||||
Real estate taxes, net | 60,813 | 69,268 | (8,455 | ) | (12.2 | ) | ||||||||
Impairment loss | 74 | 10,120 | (10,046 | ) | (99.3 | ) | ||||||||
General and administrative expenses | 35,914 | 25,040 | 10,874 | 43.4 | ||||||||||
Interest expense, net | 57,601 | 63,348 | (5,747 | ) | (9.1 | ) | ||||||||
Interest and other income, net | 11,003 | 2,807 | 8,196 | 292.0 | ||||||||||
Gain on sale of property | 189,914 | 207,865 | (17,951 | ) | (8.6 | ) | ||||||||
Equity in earnings of real estate joint ventures and partnerships, net | 20,769 | 25,070 | (4,301 | ) | (17.2 | ) | ||||||||
Revenues
The decrease in revenues of $44.5 million is attributable primarily to the $47.5 million impact of dispositions, a decrease of $9.1 million from the write-off of lease intangibles due to the termination of tenant leases, which includes a write-off of a $10.1 million below-market lease intangible in 2018, and $4.3 million of revenues for real estate taxes paid directly by our tenants in 2018 that can no longer be recorded due to the adoption of the new lease accounting standard on January 1, 2019. Partially offsetting this decrease is revenue from acquisitions, as well as increases in rental rates and occupancy at our existing portfolio, new developments and redevelopments, which contributed $16.4 million.
Depreciation and Amortization
The decrease in depreciation and amortization of $26.2 million is attributable primarily to the $13.1 million write-off of an in-place lease intangible from the termination of a tenant lease in 2018 and disposition activities of $15.1 million, which is partially offset by an increase of $2.0 million primarily from acquisitions.
Real Estate Taxes, net
The decrease in real estate taxes, net of $8.5 million is attributable primarily to dispositions and $4.3 million of real estate taxes paid directly by our tenants in 2018 that can no longer be recorded due to the adoption of the new lease accounting standard on January 1, 2019.
Impairment Loss
The decrease in impairment loss of $10.0 million is attributable primarily to losses recognized in 2018 associated with three centers that were sold.
General and Administrative Expenses
The increase in general and administrative expenses of $10.9 million is attributable primarily to a reduction in capitalized indirect leasing costs of $10.2 million resulting from the adoption of the new lease accounting standard on January 1, 2019.
30
Interest Expense, net
Net interest expense decreased $5.7 million or 9.1%. The components of net interest expense were as follows (in thousands):
Year Ended December 31, | |||||||
2019 | 2018 | ||||||
Gross interest expense | $ | 67,993 | $ | 71,899 | |||
Gain on extinguishment of debt including related swap activity | — | (3,759 | ) | ||||
Amortization of debt deferred costs, net | 3,521 | 3,546 | |||||
Over-market mortgage adjustment | (327 | ) | (400 | ) | |||
Capitalized interest | (13,586 | ) | (7,938 | ) | |||
Total | $ | 57,601 | $ | 63,348 | |||
The decrease in net interest expense is attributable primarily to a reduction in the weighted average debt outstanding due to the pay down of debt with proceeds from dispositions and cash generated from operations. For the year ended December 31, 2019, the weighted average debt outstanding was $1.8 billion at a weighted average interest rate of 4.0% as compared to $1.9 billion outstanding at a weighted average interest rate of 4.0% in the same period of 2018. Additionally, net interest expense was impacted by an increase in capitalized interest of $5.6 million associated with an increase in new development investment, and a $3.8 million gain on extinguishment of debt in the first quarter of 2018, including the effect of a swap termination.
Interest and Other Income, net
The increase of $8.2 million in interest and other income, net is attributable primarily to a fair value increase of $6.8 million for assets held in a grantor trust related to deferred compensation and an increase of $1.4 million associated primarily with interest income from our short-term cash investments and other investments.
Gain on Sale of Property
The decrease of $18.0 million in gain on sale of property is attributable to the disposition of 15 centers and other property during 2019 as compared to 21 centers and other property in 2018.
Equity in Earnings of Real Estate Joint Ventures and Partnerships, net
The decrease of $4.3 million in equity in earnings of real estate joint ventures and partnerships, net is attributable primarily to impairment of interests in two joint ventures totaling $3.1 million.
Effects of Inflation
We have structured our leases in such a way as to remain largely unaffected should significant inflation occur. Many leases provide for increasing minimum rental rates during the terms of the leases through escalation provisions. In addition, many of our leases are for terms of less than 10 years, allowing us to adjust rental rates to changing market conditions when the leases expire. Some of our leases also contain percentage rent provisions whereby we receive increased rentals based on the tenants’ gross sales. Most of our leases also require the tenants to pay their proportionate share of operating expenses and real estate taxes, thereby reducing our exposure to increases in costs and operating expenses resulting from inflation. Under the current economic climate, inflation has been kept in check by the Federal Reserve and looks to remain low for the foreseeable future.
Economic Conditions
The U.S. is currently in a long economic expansion. At the end of 2019, certain financial indicators, such as yield curves, have declined or weakened somewhat, while other economic indicators, such as employment, remain strong. We believe that regardless of any mixed messages provided by the various soft-data trends, the recent trend by the U.S. leading economic indicators still points to continuing, if moderate, growth in the national economy. Our focus on supermarket-anchored centers in densely populated major metropolitan areas should position our portfolio to take advantage of a growing economy, and weather any downturns should the economy falter.
31
With respect to Houston and other markets that are energy dependent, the economic recovery from the oil downturn of 2015 to 2017 continued into its second year in 2019; however, future disruptions could impact the market in the long-term. The outlook for Houston’s economy specifically remains positive due primarily to economic diversity. Job growth throughout the Sunbelt is strong. Metros are becoming more economically diverse, with cities actively growing their indigenous, non-energy sectors, like medical and high-tech. Houston has been particularly focused on growing its data science, digital tech, and biotech clusters. Our presence in healthy, resilient metropolitan areas has been a part of our strategy to ensure our continued healthy, resilient property portfolio.
The trade areas for our portfolio of centers have seen robust growth in personal income and home values over the past year. As strengthening retail fundamentals drive demand for investments in top-tier retail real estate, we continue to dedicate internal resources to identify and evaluate available assets in our markets so that we may purchase the best assets and properties with the strongest upside potential. Also, we continue to look for redevelopment opportunities within our existing portfolio by repositioning our anchor tenants and new development opportunities to spur growth.
Capital Resources and Liquidity
Our primary operating liquidity needs are paying our common share dividends, maintaining and operating our existing properties, paying our debt service costs, excluding debt maturities, and funding capital expenditures. Under our 2020 business plan, cash flows from operating activities are expected to meet these planned capital needs.
The primary sources of capital for funding any debt maturities, acquisitions, new developments and redevelopments are our excess cash flow generated by our operating properties; credit facilities; proceeds from both secured and unsecured debt issuances; proceeds from equity issuances; and cash generated from the sale of property or interests in real estate joint ventures and partnerships and the formation of joint ventures. Amounts outstanding under the unsecured revolving credit facility are retired as needed with proceeds from the issuance of long-term debt, equity, cash generated from the disposition of properties and cash flow generated by our operating properties.
As of December 31, 2019, we had available borrowing capacity of $497.9 million under our unsecured revolving credit facility, and our debt maturities for 2020 total $22.7 million. As of December 31, 2019, we had cash and cash equivalents available of $41.5 million. Currently, we anticipate our disposition activities to continue, albeit at a lower rate than previous periods, and estimate between $100 million to $150 million in dispositions for 2020.
We believe net proceeds from planned capital recycling, combined with our available capacity under the revolving credit and short-term borrowing facilities, will provide adequate liquidity to fund our capital needs, including acquisitions, redevelopment and new development activities and, if necessary, special dividends. In the event our capital recycling program does not progress as expected, we believe other debt and equity alternatives are available to us. Although external market conditions are not within our control, we do not currently foresee any impediments to our entering the capital markets if needed.
During 2019, our share of aggregate gross sales proceeds from dispositions of centers owned by us, either directly or through our interest in real estate joint ventures or partnerships, totaled $451.7 million. Operating cash flows from assets disposed are included in net cash from operating activities in our Consolidated Statements of Cash Flows, while proceeds from these disposals are included as investing activities.
We have non-recourse debt secured by acquired or developed properties held in several of our real estate joint ventures and partnerships. At December 31, 2019, off-balance sheet mortgage debt for our unconsolidated real estate joint ventures and partnerships totaled $264.8 million, of which our pro rata ownership is $86.8 million. Scheduled principal mortgage payments on this debt, excluding deferred debt costs and non-cash related items totaling $(.6) million, at 100% are as follows (in millions):
2020 | $ | 3.1 | |
2021 | 173.0 | ||
2022 | 2.1 | ||
2023 | 2.2 | ||
2024 | 2.3 | ||
Thereafter | 82.7 | ||
Total | $ | 265.4 | |
32
We generally have the right to sell or otherwise dispose of our assets except in certain cases where we are required to obtain our joint venture partners’ consent or a lender's consent for assets held in special purpose entities.
Investing Activities
Acquisitions
During 2019, we acquired six grocery-anchored shopping centers and other property, one of which is in a 51% unconsolidated real estate joint venture, with our share of the aggregate gross purchase price totaling $246.4 million.
Dispositions
During 2019, we sold 15 centers and other property, including real estate assets owned through our interest in unconsolidated real estate joint ventures and partnerships. Our share of aggregate gross sales proceeds from these transactions totaled $451.7 million and generated our share of the gains of approximately $190.8 million.
New Development/Redevelopment
At December 31, 2019, we had two mixed-use projects and a 30-story, high-rise residential tower at our River Oaks Shopping Center under development with approximately .2 million of total square footage for retail and 962 residential units, that were partially or wholly owned. We have funded $368.4 million through December 31, 2019 on these projects. Upon completion, we expect our aggregate net investment in these multi-use projects to be $485.0 million.
At December 31, 2019, we had 11 redevelopment projects in which we plan to invest approximately $74.2 million. Upon completion, the average projected stabilized return on our incremental investment on these redevelopment projects is expected to be between 8.0% and 12.0%. During 2019, we completed eight redevelopment projects, which added approximately 101,000 square feet to the portfolio with an incremental investment totaling $26.7 million.
We typically finance our new development and redevelopment projects with proceeds from our unsecured revolving credit facility, as it is our general practice not to use third party construction financing. Management monitors amounts outstanding under our unsecured revolving credit facility and periodically pays down such balances using cash generated from operations, from debt issuances, from common and preferred share issuances and from the disposition of properties.
Capital Expenditures
Capital expenditures for additions to the existing portfolio, acquisitions, tenant improvements, new development, redevelopment and our share of investments in unconsolidated real estate joint ventures and partnerships are as follows (in thousands):
Year Ended December 31, | |||||||
2019 | 2018 | ||||||
Acquisitions | $ | 245,814 | $ | — | |||
New Development | 149,080 | 103,102 | |||||
Redevelopment | 25,342 | 38,657 | |||||
Tenant Improvements | 30,072 | 27,560 | |||||
Capital Improvements | 20,340 | 20,825 | |||||
Other | 5,991 | 4,745 | |||||
Total | $ | 476,639 | $ | 194,889 | |||
The increase in capital expenditures is attributable primarily to the acquisition of six centers and the net increased activity from our new development and redevelopment centers.
For 2020, we anticipate our acquisitions to total approximately $100 million to $150 million. Our new development and redevelopment investment for 2020 is estimated to be approximately $75 million to $125 million. For 2020, capital and tenant improvements is expected to be consistent with 2019 expenditures. No assurances can be provided that our planned activities will occur. Further, we have entered into commitments aggregating $98.5 million comprised principally of construction contracts which are generally due in 12 to 36 months and anticipated to be funded under our unsecured revolving credit facility or through the use of excess cash.
33
Capital expenditures for additions described above relate to cash flows from investing activities as follows (in thousands):
Year Ended December 31, | |||||||
2019 | 2018 | ||||||
Acquisition of real estate and land, net | $ | 218,849 | $ | 1,265 | |||
Development and capital improvements | 183,188 | 155,528 | |||||
Real estate joint ventures and partnerships - Investments | 74,602 | 38,096 | |||||
Total | $ | 476,639 | $ | 194,889 | |||
Capitalized soft costs, including payroll and other general and administrative costs, interest, insurance and real estate taxes, totaled $22.9 million and $16.2 million for the year ended December 31, 2019 and 2018, respectively.
Financing Activities
Debt
Total debt outstanding was $1.7 billion at December 31, 2019 and consisted of $17.4 million, which bears interest at variable rates, and $1.7 billion, which bears interest at fixed rates. Additionally, of our total debt, $281.6 million was secured by operating centers while the remaining $1.5 billion was unsecured.
At December 31, 2019, we have a $500 million unsecured revolving credit facility, which expires in March 2024 and provides borrowing rates that float at a margin over LIBOR plus a facility fee. At December 31, 2019, the borrowing margin and facility fee, which are priced off a grid that is tied to our senior unsecured credit ratings, were 82.5 and 15 basis points, respectively. The facility also contains a competitive bid feature that allows us to request bids for up to $250 million. Additionally, an accordion feature allows us to increase the facility amount up to $850 million. As of February 21, 2020, we had no amounts outstanding, and the available balance was $497.9 million, net of $2.1 million in outstanding letters of credit.
At December 31, 2019, we have a $10 million unsecured short-term facility that we maintain for cash management purposes. The facility, which matures in March 2021, provides for fixed interest rate loans at a 30-day LIBOR rate plus borrowing margin, facility fee and an unused facility fee of 125, 10, and 5 basis points, respectively. As of February 21, 2020, we had no amounts outstanding under this facility.
During 2019, the maximum balance and weighted average balance outstanding under both facilities combined were $5.0 million and $.1 million, respectively, at a weighted average interest rate of 3.3%.
On July 1, 2019, we repaid a $50 million secured fixed-rate mortgage with a 7.0% interest rate with cash from our disposition proceeds.
Our five most restrictive covenants, composed from both our public debt and revolving credit facility, include debt to asset, secured debt to asset, fixed charge, unencumbered asset test and unencumbered interest coverage ratios. We are not aware of any non-compliance with our public debt and revolving credit facility covenants as of December 31, 2019.
Our most restrictive public debt covenant ratios, as defined in our indenture and supplemental indenture agreements, were as follows at December 31, 2019:
Covenant | Restriction | Actual | ||
Debt to Asset Ratio | Less than 60.0% | 35.9% | ||
Secured Debt to Asset Ratio | Less than 40.0% | 5.8% | ||
Fixed Charge Ratio | Greater than 1.5 | 4.6 | ||
Unencumbered Asset Test | Greater than 150% | 299.7% | ||
34
Equity
Common share dividends paid totaled $203.3 million for the year ended December 31, 2019. Our dividend payout ratio (as calculated as dividends paid on common shares divided by core funds from operations attributable to common shareholders - basic) for the year ended December 31, 2019 approximated 74.8% (see Non-GAAP Financial Measures for additional information). Our Board of Trust Managers approved a first quarter 2020 dividend of $.395 per common share.
We have a $200 million share repurchase plan. Under this plan, we may repurchase common shares from time-to-time in open-market or in privately negotiated purchases. The timing and amount of any shares repurchased will be determined by management based on its evaluation of market conditions and other factors. The repurchase plan may be suspended or discontinued at any time, and we have no obligations to repurchase any amount of our common shares under the plan. At December 31, 2019 and as of the date of this filing, $181.5 million of common shares remained available to be repurchased under this plan.
We have an effective universal shelf registration statement which expires in September 2020. We will continue to closely monitor both the debt and equity markets and carefully consider our available financing alternatives, including both public offerings and private placements.
Contractual Obligations
We have debt obligations related to our mortgage loans and unsecured debt, including any draws on our credit facilities and payments for our finance lease obligation. We have shopping centers that are subject to ground leases where a third party owns and has leased the underlying land to us to construct and/or operate a shopping center. The table below excludes obligations related to our new development projects because such amounts are not fixed or determinable, and commitments aggregating $98.5 million comprised principally of construction contracts which are generally due in 12 to 36 months. The following table summarizes our primary contractual obligations as of December 31, 2019 (in thousands):
Payments due by period | |||||||||||||||||||
Total | Less than 1 year | 1 - 3 years | 3 - 5 years | More than 5 years | |||||||||||||||
Mortgages and Notes Payable (1) | |||||||||||||||||||
Unsecured Debt | $ | 1,648,315 | $ | 53,375 | $ | 404,456 | $ | 604,889 | $ | 585,595 | |||||||||
Secured Debt | 349,146 | 35,306 | 49,128 | 91,421 | 173,291 | ||||||||||||||
Lease Payments | 109,660 | 2,696 | 5,161 | 4,616 | 97,187 | ||||||||||||||
Other Obligations (2) | 94,698 | 65,485 | 29,213 | ||||||||||||||||
Total Contractual Obligations | $ | 2,201,819 | $ | 156,862 | $ | 487,958 | $ | 700,926 | $ | 856,073 | |||||||||
_______________
(1) | Includes our finance lease obligation (see Note 7 for additional information) and principal and interest with interest on variable-rate debt calculated using rates at December 31, 2019. Also, excludes a $57.4 million debt service guaranty liability. See Note 6 for additional information. |
(2) | Other obligations include income and real estate tax payments, commitments associated with our secured debt and other employee payments. Included in 2020, is the estimated contribution to our pension plan, which meets or exceeds the minimum statutory funding requirements; however, we have the right to discontinue contributions at any time. See Note 15 for additional information. |
Related to a development project in Sheridan, Colorado, we have provided a guaranty for the payment of any debt service shortfalls on tax increment revenue bonds issued in connection with the project. The Sheridan Redevelopment Agency ("Agency") issued Series A bonds used for an urban renewal project, of which $57.4 million remain outstanding at December 31, 2019. The bonds are to be repaid with incremental sales and property taxes and a public improvement fee ("PIF") to be assessed on current and future retail sales and, to the extent necessary, any amounts we may have to provide under a guaranty. The incremental taxes and PIF are to remain intact until the earlier of the payment of the bond liability in full or 2040. The debt associated with this guaranty has been recorded in our consolidated financial statements as of December 31, 2019.
Off Balance Sheet Arrangements
As of December 31, 2019, none of our off-balance sheet arrangements had a material effect on our liquidity or availability of, or requirement for, our capital resources. Letters of credit totaling $7.0 million were outstanding at December 31, 2019.
35
We have entered into several unconsolidated real estate joint ventures and partnerships. Under many of these agreements, we and our joint venture partners are required to fund operating capital upon shortfalls in working capital. As operating manager of most of these entities, we have considered these funding requirements in our business plan.
Reconsideration events, including changes in variable interests, could cause us to consolidate these joint ventures and partnerships. We continuously evaluate these events as we become aware of them. Some triggers to be considered are additional contributions required by each partner and each partner’s ability to make those contributions. Under certain of these circumstances, we may purchase our partner’s interest. Our material unconsolidated real estate joint ventures are with entities which appear sufficiently stable; however, if market conditions were to deteriorate and our partners are unable to meet their commitments, there is a possibility we may have to consolidate these entities. If we were to consolidate all of our unconsolidated real estate joint ventures, we would continue to be in compliance with our debt covenants.
As of December 31, 2019, one unconsolidated real estate joint venture was determined to be a VIE through the issuance of a secured loan, since the lender had the ability to make decisions that could have a significant impact on the profitability of the entity. Our maximum risk of loss associated with this VIE was limited to $34.0 million at December 31, 2019. Also at December 31, 2019, another joint venture arrangement for the future development of a mixed-use project was determined to be a VIE. We are not the primary beneficiary as the substantive participating rights associated with the entity are shared, and we do not have the power to direct the significant activities of the entity. We anticipate future funding of approximately $9 million associated with the mixed-use project through 2020.
Non-GAAP Financial Measures
Certain of our key performance indicators are considered non-GAAP financial measures. Management uses these measures along with our GAAP financial statements in order to evaluate our operating results. We believe these additional measures provide users of our financial information additional comparable indicators of our industry, as well as, our performance.
Funds from Operations Attributable to Common Shareholders
Effective January 1, 2019, the National Association of Real Estate Investment Trusts ("NAREIT") defines NAREIT FFO as net income (loss) attributable to common shareholders computed in accordance with GAAP, excluding gains or losses from sales of certain real estate assets (including: depreciable real estate with land, land development property and securities), changes in control of real estate equity investments, and interests in real estate equity investments and their applicable taxes, plus depreciation and amortization related to real estate and impairment of certain real estate assets and in substance real estate equity investments, including our share of unconsolidated real estate joint ventures and partnerships. We calculate NAREIT FFO in a manner consistent with the NAREIT definition.
Management believes NAREIT FFO is a widely recognized measure of REIT operating performance which provides our shareholders with a relevant basis for comparison among other REITs. Management uses NAREIT FFO as a supplemental internal measure to conduct and evaluate our business because there are certain limitations associated with using GAAP net income by itself as the primary measure of our operating performance. Historical cost accounting for real estate assets in accordance with GAAP implicitly assumes that the value of real estate assets diminishes predictably over time. Since real estate values instead have historically risen or fallen with market conditions, management believes that the presentation of operating results for real estate companies that uses historical cost accounting is insufficient by itself. There can be no assurance that NAREIT FFO presented by us is comparable to similarly titled measures of other REITs.
We also present Core FFO as an additional supplemental measure as it is more reflective of the core operating performance of our portfolio of properties. Core FFO is defined as NAREIT FFO excluding charges and gains related to non-cash, non-operating assets and other transactions or events that hinder the comparability of operating results. Specific examples of items excluded from Core FFO include, but are not limited to, gains or losses associated with the extinguishment of debt or other liabilities and transactional costs associated with unsuccessful development activities.
NAREIT FFO and Core FFO should not be considered as alternatives to net income or other measurements under GAAP as indicators of operating performance or to cash flows from operating, investing or financing activities as measures of liquidity. NAREIT FFO and Core FFO do not reflect working capital changes, cash expenditures for capital improvements or principal payments on indebtedness.
36
NAREIT FFO and Core FFO is calculated as follows (in thousands):
Year Ended December 31, | |||||||||||
2019 | 2018 | 2017 | |||||||||
Net income attributable to common shareholders | $ | 315,435 | $ | 327,601 | $ | 335,274 | |||||
Depreciation and amortization of real estate | 134,772 | 160,679 | 166,125 | ||||||||
Depreciation and amortization of real estate of unconsolidated real estate joint ventures and partnerships | 12,152 | 12,454 | 14,020 | ||||||||
Impairment of properties and real estate equity investments | 3,144 | 9,969 | 12,247 | ||||||||
Gain on sale of property, investments securities and interests in real estate equity investments | (190,597 | ) | (206,930 | ) | (217,659 | ) | |||||
Gain on dispositions of unconsolidated real estate joint ventures and partnerships | (1,380 | ) | (6,300 | ) | (6,187 | ) | |||||
Provision (benefit) for income taxes (1) | 133 | 2,223 | (711 | ) | |||||||
Noncontrolling interests and other (2) | (2,051 | ) | 8,238 | 5,408 | |||||||
NAREIT FFO – basic (3) | 271,608 | 307,934 | 308,517 | ||||||||
Income attributable to operating partnership units | 2,112 | — | 3,084 | ||||||||
NAREIT FFO – diluted (3) | 273,720 | 307,934 | 311,601 | ||||||||
Adjustments to Core FFO: | |||||||||||
Provision (benefit) for income taxes (1) | — | (1,488 | ) | (729 | ) | ||||||
Other impairment loss | — | 134 | 3,031 | ||||||||
Gain on extinguishment of debt including related swap activity | — | (3,131 | ) | — | |||||||
Lease terminations | — | (10,023 | ) | — | |||||||
Severance costs | — | — | 1,378 | ||||||||
Storm damage costs | — | — | 1,822 | ||||||||
Recovery of pre-development costs | — | — | (949 | ) | |||||||
Other | 10 | (911 | ) | 2,292 | |||||||
Core FFO – diluted | $ | 273,730 | $ | 292,515 | $ | 318,446 | |||||
FFO weighted average shares outstanding – basic | 127,842 | 127,651 | 127,755 | ||||||||
Effect of dilutive securities: | |||||||||||
Share options and awards | 842 | 790 | 870 | ||||||||
Operating partnership units | 1,432 | — | 1,446 | ||||||||
FFO weighted average shares outstanding – diluted | 130,116 | 128,441 | 130,071 | ||||||||
NAREIT FFO per common share – basic | $ | 2.12 | $ | 2.41 | $ | 2.41 | |||||
NAREIT FFO per common share – diluted | $ | 2.10 | $ | 2.40 | $ | 2.40 | |||||
Core FFO per common share – diluted | $ | 2.10 | $ | 2.28 | $ | 2.45 | |||||
(1) The applicable taxes related to gains and impairments of operating and non-operating real estate assets.
(2) Related to gains, impairments and depreciation on operating properties and unconsolidated real estate joint ventures, where applicable.
(3) 2019 NAREIT FFO is presented in accordance with 2018 Restatement of "Nareit's Funds from Operations White Paper."
37
Same Property Net Operating Income
We consider SPNOI an important additional financial measure because it reflects only those income and expense items that are incurred at the property level, and when compared across periods, reflects the impact on operations from trends in occupancy rates, rental rates and operating costs. We calculate this most useful measurement by determining our proportional share of SPNOI from all owned properties, including our share of SPNOI from unconsolidated joint ventures and partnerships, which cannot be readily determined under GAAP measurements and presentation. Although SPNOI is a widely used measure among REITs, there can be no assurance that SPNOI presented by us is comparable to similarly titled measures of other REITs. Additionally, we do not control these unconsolidated joint ventures and partnerships, and the assets, liabilities, revenues or expenses of these joint ventures and partnerships, as presented, do not represent our legal claim to such items.
Properties are included in the SPNOI calculation if they are owned and operated for the entirety of the most recent two fiscal year periods, except for properties for which significant redevelopment or expansion occurred during either of the periods presented, and properties that have been sold. While there is judgment surrounding changes in designations, we move new development and redevelopment properties once they have stabilized, which is typically upon attainment of 90% occupancy. A rollforward of the properties included in our same property designation is as follows:
Three Months Ended December 31, 2019 | Twelve Months Ended December 31, 2019 | ||||
Beginning of the period | 159 | 171 | |||
Properties added: | |||||
New Developments | — | 1 | |||
Properties removed: | |||||
Dispositions | (4 | ) | (17 | ) | |
End of the period | 155 | 155 | |||
38
We calculate SPNOI using net income attributable to common shareholders and adjusted for net income attributable to noncontrolling interests, other income (expense), income taxes and equity in earnings of real estate joint ventures and partnerships. Additionally to reconcile to SPNOI, we exclude the effects of property management fees, certain non-cash revenues and expenses such as straight-line rental revenue and the related reversal of such amounts upon early lease termination, depreciation and amortization, impairment losses, general and administrative expenses and other items such as lease cancellation income, environmental abatement costs, demolition expenses and lease termination fees. Consistent with the capital treatment of such costs under GAAP, tenant improvements, leasing commissions and other direct leasing costs are excluded from SPNOI. A reconciliation of net income attributable to common shareholders to SPNOI is as follows (in thousands):
Three Months Ended December 31, | Twelve Months Ended December 31, | ||||||||||||||
2019 | 2018 | 2019 | 2018 | ||||||||||||
Net income attributable to common shareholders | $ | 75,218 | $ | 59,507 | $ | 315,435 | $ | 327,601 | |||||||
Add: | |||||||||||||||
Net income attributable to noncontrolling interests | 2,074 | 3,722 | 7,140 | 17,742 | |||||||||||
Provision for income taxes | 358 | 10 | 1,040 | 1,378 | |||||||||||
Interest expense, net | 13,539 | 15,663 | 57,601 | 63,348 | |||||||||||
Property management fees | 686 | 685 | 2,899 | 2,904 | |||||||||||
Depreciation and amortization | 33,355 | 35,280 | 135,674 | 161,838 | |||||||||||
Impairment loss | — | 7,722 | 74 | 10,120 | |||||||||||
General and administrative | 9,021 | 7,325 | 35,914 | 25,040 | |||||||||||
Other (1) | 937 | 752 | 3,762 | 2,680 | |||||||||||
Less: | |||||||||||||||
Gain on sale of property | (45,951 | ) | (34,788 | ) | (189,914 | ) | (207,865 | ) | |||||||
Equity in earnings of real estate joint ventures and partnership interests, net | (2,989 | ) | (5,737 | ) | (20,769 | ) | (25,070 | ) | |||||||
Interest and other (income) expense, net | (3,594 | ) | 1,928 | (11,003 | ) | (2,807 | ) | ||||||||
Revenue adjustments (2) | (3,817 | ) | (3,022 | ) | (14,871 | ) | (25,007 | ) | |||||||
Adjusted income | 78,837 | 89,047 | 322,982 | 351,902 | |||||||||||
Less: Adjusted income related to consolidated entities not defined as same property and noncontrolling interests | (2,589 | ) | (14,780 | ) | (23,312 | ) | (62,520 | ) | |||||||
Add: Pro rata share of unconsolidated entities defined as same property | 8,931 | 8,838 | 34,440 | 34,201 | |||||||||||
Same Property Net Operating Income | 85,179 | 83,105 | 334,110 | 323,583 | |||||||||||
Less: Redevelopment Net Operating Income | (8,794 | ) | (7,880 | ) | (33,797 | ) | (29,181 | ) | |||||||
Same Property Net Operating Income excluding Redevelopments | $ | 76,385 | $ | 75,225 | $ | 300,313 | $ | 294,402 | |||||||
___________________
(1) | Other includes items such as environmental abatement costs, demolition expenses, lease termination fees and ground rent. Prior year amounts were restated to conform to the current year presentation due to the adoption on January 1, 2019 of Accounting Standard Codification 842. |
(2) | Revenue adjustments consist primarily of straight-line rentals, lease cancellation income and fee income primarily from real estate joint ventures and partnerships. |
Newly Issued Accounting Pronouncements
See Note 2 to our consolidated financial statements in Item 8 for additional information related to recent accounting pronouncements.
39
ITEM 7A. Quantitative and Qualitative Disclosures About Market Risk
We use fixed and floating-rate debt to finance our capital requirements. These transactions expose us to market risk related to changes in interest rates. Derivative financial instruments may be used to manage a portion of this risk, primarily interest rate contracts with major financial institutions. These agreements expose us to credit risk in the event of non-performance by the counter-parties. We do not engage in the trading of derivative financial instruments in the normal course of business. At December 31, 2019, we had fixed-rate debt of $1.7 billion and variable-rate debt of $17.4 million. In the event interest rates were to increase 100 basis points and holding all other variables constant, annual net income and cash flows for the following year would decrease by approximately $.2 million associated with our variable-rate debt, including the effect of the interest rate contracts. The effect of the 100 basis points increase would decrease the fair value of our variable-rate and fixed-rate debt by approximately $.1 million and $75.9 million, respectively.
ITEM 8. Financial Statements and Supplementary Data
WEINGARTEN REALTY INVESTORS | ||||
Index to Financial Statements | ||||
Page | ||||
(A) | ||||
(B) | Financial Statements: | |||
(i) | ||||
(ii) | ||||
(iii) | ||||
(iv) | ||||
(v) | ||||
(vi) | ||||
(C) | Financial Statement Schedules: | |||
II | ||||
III | ||||
IV | ||||
All other schedules are omitted since the required information is not present or is not present in amounts sufficient to require submission of the schedule or because the information required is included in the consolidated financial statements and notes thereto.
40
REPORT OF INDEPENDENT REGISTERED PUBLIC ACCOUNTING FIRM
To the Shareholders and the Board of Trust Managers of Weingarten Realty Investors
Opinion on the Financial Statements
We have audited the accompanying consolidated balance sheets of Weingarten Realty Investors and subsidiaries (the "Company") as of December 31, 2019 and 2018, the related consolidated statements of operations, comprehensive income, equity, and cash flows, for each of the three years in the period ended December 31, 2019, and the related notes and the schedules listed in the Index at Item 15 (collectively referred to as the "financial statements"). In our opinion, the financial statements present fairly, in all material respects, the financial position of the Company as of December 31, 2019 and 2018, and the results of its operations and its cash flows for each of the three years in the period ended December 31, 2019, in conformity with accounting principles generally accepted in the United States of America.
We have also audited, in accordance with the standards of the Public Company Accounting Oversight Board (United States) (PCAOB), the Company's internal control over financial reporting as of December 31, 2019, based on criteria established in Internal Control - Integrated Framework (2013) issued by the Committee of Sponsoring Organizations of the Treadway Commission and our report dated February 27, 2020, expressed an unqualified opinion on the Company's internal control over financial reporting.
Basis for Opinion
These financial statements are the responsibility of the Company's management. Our responsibility is to express an opinion on the Company's financial statements based on our audits. We are a public accounting firm registered with the PCAOB and are required to be independent with respect to the Company in accordance with the U.S. federal securities laws and the applicable rules and regulations of the Securities and Exchange Commission and the PCAOB.
We conducted our audits in accordance with the standards of the PCAOB. Those standards require that we plan and perform the audit to obtain reasonable assurance about whether the financial statements are free of material misstatement, whether due to error or fraud. Our audits included performing procedures to assess the risks of material misstatement of the financial statements, whether due to error or fraud, and performing procedures that respond to those risks. Such procedures included examining, on a test basis, evidence regarding the amounts and disclosures in the financial statements. Our audits also included evaluating the accounting principles used and significant estimates made by management, as well as evaluating the overall presentation of the financial statements. We believe that our audits provide a reasonable basis for our opinion.
Critical Audit Matter
The critical audit matter communicated below is a matter arising from the current-period audit of the financial statements that was communicated or required to be communicated to the audit committee and that (1) relates to accounts or disclosures that are material to the financial statements and (2) involved our especially challenging, subjective, or complex judgments. The communication of critical audit matters does not alter in any way our opinion on the financial statements, taken as a whole, and we are not, by communicating the critical audit matter below, providing a separate opinion on the critical audit matter or on the accounts or disclosures to which it relates.
Investment in Real Estate Joint Ventures and Partnerships - Refer to Note 1 Summary of Significant Accounting Policies of the 2019 Form 10-K
Critical Audit Matter Description
The Company’s evaluation of impairment for their investments in real estate joint ventures and partnerships involves an initial assessment of various factors, including operating results of the investee and the Company's ability and intent to hold the investment, to determine if there is a decrease in the investment value that may be other than temporary. Changes in the assumptions could have a significant impact on the investments in real estate joint ventures and partnerships identified for further analysis. Based on changes in management's intent for investments in real estate joint ventures and partnerships, a $3.1 million impairment loss has been recognized for the year ended December 31, 2019.
Given the Company’s evaluation of its intent to hold the investment when evaluating if a decline in fair value is other than temporary requires management to make significant assumptions, performing audit procedures to evaluate whether management appropriately evaluated this factor required a high degree of auditor judgment.
41
How the Critical Audit Matter Was Addressed in the Audit
Our audit procedures related to management’s evaluation of the Company’s intent to hold the investment in identifying indicators of an other than temporary decline in fair value included the following:
• | We tested the effectiveness of controls, including those related to the evaluation of the Company’s intent and ability to hold their investments. |
• | We evaluated the investments to identify any indications that impairment may be other than temporary by considering operating results of the investee and the Company’s intent to hold the investment. This included performing corroborating inquiries with management. |
• | We evaluated the Company’s historical experience regarding the timely recognition of impairment by evaluating real estate sales within the joint ventures to evaluate if they were sold at a gain and any subsequent changes to the Company’s intent to hold the investment. |
/s/ Deloitte & Touche LLP
Houston, Texas
February 27, 2020
We have served as the Company's auditor since 1963.
42
WEINGARTEN REALTY INVESTORS CONSOLIDATED STATEMENTS OF OPERATIONS (In thousands, except per share amounts) | |||||||||||
Year Ended December 31, | |||||||||||
2019 | 2018 | 2017 | |||||||||
Revenues: | |||||||||||
Rentals, net | $ | $ | $ | ||||||||
Other | |||||||||||
Total Revenues | |||||||||||
Operating Expenses: | |||||||||||
Depreciation and amortization | |||||||||||
Operating | |||||||||||
Real estate taxes, net | |||||||||||
Impairment loss | |||||||||||
General and administrative | |||||||||||
Total Operating Expenses | |||||||||||
Other Income (Expense): | |||||||||||
Interest expense, net | ( | ) | ( | ) | ( | ) | |||||
Interest and other income, net | |||||||||||
Gain on sale of property | |||||||||||
Total Other Income | |||||||||||
Income Before Income Taxes and Equity in Earnings of Real Estate Joint Ventures and Partnerships | |||||||||||
(Provision) Benefit for Income Taxes | ( | ) | ( | ) | |||||||
Equity in Earnings of Real Estate Joint Ventures and Partnerships, net | |||||||||||
Net Income | |||||||||||
Less: Net Income Attributable to Noncontrolling Interests | ( | ) | ( | ) | ( | ) | |||||
Net Income Attributable to Common Shareholders | $ | $ | $ | ||||||||
Earnings Per Common Share - Basic: | |||||||||||
Net income attributable to common shareholders | $ | $ | $ | ||||||||
Earnings Per Common Share - Diluted: | |||||||||||
Net income attributable to common shareholders | $ | $ | $ | ||||||||
See Notes to Consolidated Financial Statements.
43
WEINGARTEN REALTY INVESTORS CONSOLIDATED STATEMENTS OF COMPREHENSIVE INCOME (In thousands) | |||||||||||
Year Ended December 31, | |||||||||||
2019 | 2018 | 2017 | |||||||||
Net Income | $ | $ | $ | ||||||||
Cumulative effect adjustment of new accounting standards | ( | ) | |||||||||
Other Comprehensive (Loss) Income: | |||||||||||
Net unrealized gain on investments, net of taxes | |||||||||||
Realized gain on investments | ( | ) | |||||||||
Net unrealized gain on derivatives | |||||||||||
Reclassification adjustment of derivatives and designated hedges into net income | ( | ) | ( | ) | ( | ) | |||||
Retirement liability adjustment | |||||||||||
Total | ( | ) | ( | ) | |||||||
Comprehensive Income | |||||||||||
Comprehensive Income Attributable to Noncontrolling Interests | ( | ) | ( | ) | ( | ) | |||||
Comprehensive Income Adjusted for Noncontrolling Interests | $ | $ | $ | ||||||||
See Notes to Consolidated Financial Statements.
44
WEINGARTEN REALTY INVESTORS CONSOLIDATED BALANCE SHEETS (In thousands, except per share amounts) | |||||||
December 31, | |||||||
2019 | 2018 | ||||||
ASSETS | |||||||
Property | $ | $ | |||||
Accumulated Depreciation | ( | ) | ( | ) | |||
Property, net * | |||||||
Investment in Real Estate Joint Ventures and Partnerships, net | |||||||
Total | |||||||
Unamortized Lease Costs, net | |||||||
Accrued Rent, Accrued Contract Receivables and Accounts Receivable (net of allowance for doubtful accounts of $6,855 in 2018) * | |||||||
Cash and Cash Equivalents * | |||||||
Restricted Deposits and Escrows | |||||||
Other, net | |||||||
Total Assets | $ | $ | |||||
LIABILITIES AND EQUITY | |||||||
Debt, net * | $ | $ | |||||
Accounts Payable and Accrued Expenses | |||||||
Other, net | |||||||
Total Liabilities | |||||||
Commitments and Contingencies (see Note 16) | |||||||
Equity: | |||||||
Shareholders' Equity: | |||||||
Common Shares of Beneficial Interest - par value, $.03 per share; shares authorized: 275,000; shares issued and outstanding: 128,702 in 2019 and 128,333 in 2018 | |||||||
Additional Paid-In Capital | |||||||
Net Income Less Than Accumulated Dividends | ( | ) | ( | ) | |||
Accumulated Other Comprehensive Loss | ( | ) | ( | ) | |||
Total Shareholders' Equity | |||||||
Noncontrolling Interests | |||||||
Total Equity | |||||||
Total Liabilities and Equity | $ | $ | |||||
* Consolidated variable interest entities' assets and debt included in the above balances (see Note 17): | |||||||
Property, net | $ | $ | |||||
Accrued Rent, Accrued Contract Receivables and Accounts Receivable, net | |||||||
Cash and Cash Equivalents | |||||||
Debt, net | |||||||
See Notes to Consolidated Financial Statements.
45
WEINGARTEN REALTY INVESTORS CONSOLIDATED STATEMENTS OF CASH FLOWS (In thousands) | |||||||||||
Year Ended December 31, | |||||||||||
2019 | 2018 | 2017 | |||||||||
Cash Flows from Operating Activities: | |||||||||||
Net Income | $ | $ | $ | ||||||||
Adjustments to reconcile net income to net cash provided by operating activities: | |||||||||||
Depreciation and amortization | |||||||||||
Amortization of debt deferred costs and intangibles, net | |||||||||||
Non-cash lease expense | |||||||||||
Impairment loss | |||||||||||
Equity in earnings of real estate joint ventures and partnerships, net | ( | ) | ( | ) | ( | ) | |||||
Gain on sale of property | ( | ) | ( | ) | ( | ) | |||||
Distributions of income from real estate joint ventures and partnerships | |||||||||||
Changes in accrued rent, accrued contract receivables and accounts receivable, net | ( | ) | ( | ) | |||||||
Changes in unamortized lease costs and other assets, net | ( | ) | ( | ) | ( | ) | |||||
Changes in accounts payable, accrued expenses and other liabilities, net | ( | ) | ( | ) | |||||||
Other, net | ( | ) | |||||||||
Net cash provided by operating activities | |||||||||||
Cash Flows from Investing Activities: | |||||||||||
Acquisition of real estate and land, net | ( | ) | ( | ) | ( | ) | |||||
Development and capital improvements | ( | ) | ( | ) | ( | ) | |||||
Proceeds from sale of property and real estate equity investments, net | |||||||||||
Real estate joint ventures and partnerships - Investments | ( | ) | ( | ) | ( | ) | |||||
Real estate joint ventures and partnerships - Distributions of capital | |||||||||||
Purchase of investments | ( | ) | |||||||||
Proceeds from investments | |||||||||||
Other, net | |||||||||||
Net cash (used in) provided by investing activities | ( | ) | |||||||||
Cash Flows from Financing Activities: | |||||||||||
Proceeds from issuance of debt | |||||||||||
Principal payments of debt | ( | ) | ( | ) | ( | ) | |||||
Changes in unsecured credit facilities | ( | ) | ( | ) | |||||||
Repurchase of common shares of beneficial interest, net | ( | ) | |||||||||
Proceeds from issuance of common shares of beneficial interest, net | |||||||||||
Common share dividends paid | ( | ) | ( | ) | ( | ) | |||||
Debt issuance and extinguishment costs paid | ( | ) | ( | ) | ( | ) | |||||
Distributions to noncontrolling interests | ( | ) | ( | ) | ( | ) | |||||
Contributions from noncontrolling interests | |||||||||||
Other, net | ( | ) | ( | ) | |||||||
Net cash used in financing activities | ( | ) | ( | ) | ( | ) | |||||
Net (decrease) increase in cash, cash equivalents and restricted cash equivalents | ( | ) | ( | ) | |||||||
Cash, cash equivalents and restricted cash equivalents at January 1 | |||||||||||
Cash, cash equivalents and restricted cash equivalents at December 31 | $ | $ | $ | ||||||||
Supplemental disclosure of cash flow information: | |||||||||||
Cash paid for interest (net of amount capitalized of $13,586, $7,938 and $4,868, respectively) | $ | $ | $ | ||||||||
Cash paid for income taxes | $ | $ | $ | ||||||||
Cash paid for amounts included in operating lease liabilities | $ | $ | $ | ||||||||
See Notes to Consolidated Financial Statements.
46
WEINGARTEN REALTY INVESTORS
CONSOLIDATED STATEMENTS OF EQUITY
(In thousands)
Year Ended December 31, 2019, 2018 and 2017
Common Shares of Beneficial Interest | Additional Paid-In Capital | Net Income Less Than Accumulated Dividends | Accumulated Other Comprehensive Loss | Noncontrolling Interests | Total | ||||||||||||||||||
Balance, January 1, 2017 | $ | $ | $ | ( | ) | $ | ( | ) | $ | $ | |||||||||||||
Net income | |||||||||||||||||||||||
Shares issued under benefit plans, net | |||||||||||||||||||||||
Change in classification of deferred compensation plan | |||||||||||||||||||||||
Change in redemption value of deferred compensation plan | ( | ) | ( | ) | |||||||||||||||||||
Dividends paid – common shares ($2.29 per share) | ( | ) | ( | ) | |||||||||||||||||||
Distributions to noncontrolling interests | ( | ) | ( | ) | |||||||||||||||||||
Other comprehensive income | |||||||||||||||||||||||
Other, net | ( | ) | ( | ) | ( | ) | |||||||||||||||||
Balance, December 31, 2017 | ( | ) | ( | ) | |||||||||||||||||||
Net income | |||||||||||||||||||||||
Shares repurchased and cancelled | ( | ) | ( | ) | ( | ) | |||||||||||||||||
Shares issued under benefit plans, net | |||||||||||||||||||||||
Cumulative effect adjustment of new accounting standards | ( | ) | |||||||||||||||||||||
Dividends paid – common shares ($2.98 per share) | ( | ) | ( | ) | |||||||||||||||||||
Distributions to noncontrolling interests | ( | ) | ( | ) | |||||||||||||||||||
Contributions from noncontrolling interests | |||||||||||||||||||||||
Other comprehensive loss | ( | ) | ( | ) | |||||||||||||||||||
Other, net | ( | ) | ( | ) | |||||||||||||||||||
Balance, December 31, 2018 | ( | ) | ( | ) | |||||||||||||||||||
Net income | |||||||||||||||||||||||
Shares issued under benefit plans, net | |||||||||||||||||||||||
Dividends paid – common shares ($1.58 per share) | ( | ) | ( | ) | |||||||||||||||||||
Distributions to noncontrolling interests | ( | ) | ( | ) | |||||||||||||||||||
Contributions from noncontrolling interests | |||||||||||||||||||||||
Other comprehensive loss | ( | ) | ( | ) | |||||||||||||||||||
Other, net | |||||||||||||||||||||||
Balance, December 31, 2019 | $ | $ | $ | ( | ) | $ | ( | ) | $ | $ | |||||||||||||
See Notes to Consolidated Financial Statements.
47
NOTES TO CONSOLIDATED FINANCIAL STATEMENTS
Note 1. Summary of Significant Accounting Policies
Business
Weingarten Realty Investors is a REIT organized under the Texas Business Organizations Code. We currently operate, and intend to operate in the future, as a REIT.
We, and our predecessor entity, began the ownership of shopping centers and other commercial real estate in 1948. Our primary business is leasing space to tenants in the shopping centers we own or lease. These centers may be mixed-use properties that have both retail and residential components. We also provide property management services for which we charge fees to either joint ventures where we are partners or other outside owners.
We operate a portfolio of neighborhood and community shopping centers, totaling approximately 32.5 million square feet of gross leasable area that is either owned by us or others. We have a diversified tenant base, with our largest tenant comprising only 2.6 % of base minimum rental revenues during 2019. Total revenues generated by our centers located in Houston and its surrounding areas was 20.0 % of total revenue for the year ended December 31, 2019, and an additional 9.3 % of total revenue was generated in 2019 from centers that are located in other parts of Texas. Also, in Florida and California, an additional 19.8 % and 17.9 %, respectively, of total revenue was generated in 2019.
Basis of Presentation
Our consolidated financial statements include the accounts of our subsidiaries, certain real estate joint ventures or partnerships and VIEs which meet the guidelines for consolidation. All intercompany balances and transactions have been eliminated.
Our financial statements are prepared in accordance with GAAP. Such statements require management to make estimates and assumptions that affect the reported amounts of assets and liabilities and disclosure of contingent assets and liabilities at the date of the financial statements and the reported amounts of revenues and expenses during the reporting period. Actual results could differ from these estimates. We have evaluated subsequent events for recognition or disclosure in our consolidated financial statements.
Leases
As part of our operations, we are primarily a lessor of commercial retail space. In certain instances, we are also a lessee, primarily of ground leases associated with our operations. Our contracts are reviewed to determine if they qualify, under the GAAP definition, as a lease. A contract is determined to be a lease when the right to obtain substantially all of the economic benefits and to direct the use of an identified asset is transferred to a customer over a defined period of time for consideration. During this review, we evaluate among other items, asset specification, substitution rights, purchase options, operating rights and control over the asset during the contract period.
We have elected accounting policy practical expedients, both as a lessor and a lessee, to not separate any nonlease components (primarily common area maintenance) within a lease contract for all classes of underlying assets (primarily real estate assets). As a lessor, we have further determined that this policy will be effective only on a lease that has been classified as an operating lease and the revenue recognition pattern and timing is the same for both types of components. We have determined to account for both the lease and nonlease components as a single component when the lease component is the predominate component of a contract. Therefore, Accounting Standards Codification ("ASC") No. 842, “Leases” will be applied to these lease contracts for both types of components. Additionally, for lessee leases, we have also elected not to apply the overall balance sheet recognition requirements to short-term leases that are less 12 months from the lease commencement date.
Significant judgments and assumptions are inherent in not only determining if a contract contains a lease but also the lease classification, terms, payments, and, if needed, discount rates. Judgments include the nature of any options with the determination if they will be exercised, evaluation of implicit discount rates, assessment and consideration of “fixed” payments for straight-line rent revenue calculations and the evaluation of asset identification and substitution rights.
The determination of the discount rate used in a lease is the incremental borrowing rate of the lease contract. For lessee leases, this rate is often not readily determinable as the lessor’s initial direct costs and expected residual value are at the end of the lease term and are unknown. Therefore, as the lessee, our incremental borrowing rate will be used. Selected discount rates will reflect rates that we would have to pay to borrow on a fully collateralized basis over a term similar to the lease. Additionally, we will obtain lender quotes with similar terms and if not available, we consider the asset type, risk free rates and financing spreads to account for creditworthiness and collateral.
48
Our lessor leases are principally related to our shopping centers. We believe risk of an inadequate residual value of the leased asset upon the termination of these leases is low due to our ability to re-lease the space, the long-lived nature of our real estate assets and the propensity of real estate assets to hold their value over a long period of time.
Revenue Recognition
At the inception of a revenue producing contract, we determine if a contract qualifies as a lease and if not, then as a customer contract. Additionally, we exclude all taxes assessed by a governmental authority that is collected by us from Revenue. Based on this determination, the appropriate GAAP is applied to the contract, including its revenue recognition.
Rentals, net
Rental revenue is primarily derived from operating leases and, therefore, is generally recognized on a straight-line basis over the term of the lease, which typically begins the date the tenant takes control of the space. Variable rental revenue consists primarily of tenant reimbursements of taxes, maintenance expenses and insurance, is subject to our interpretation of lease provisions and is recognized over the term of a lease as services are provided. Additionally, variable rental revenue based on a percentage of tenants’ sales is recognized only after the tenant exceeds its sales breakpoint. In circumstances where we provide a tenant improvement allowance for improvements that are owned by the tenant, we recognize the allowance as a reduction of rental revenue on a straight-line basis over the term of the lease. Further, at the lease commencement date and on an ongoing basis, we consider the collectability of a lease when determining revenue to be recognized. Prior to the adoption of ASC No. 842, rental revenues were recognized under ASC No. 840, “Leases.”
Other
Other revenue consists of both customer contract revenue and income from contractual agreements with third parties or real estate joint ventures or partnerships, which do not meet the definition of a lease or a customer contract. Revenues which do not meet the definition of a lease or customer contract are recognized as the related services are performed under the applicable agreement.
We have identified primarily three types of customer contract revenue: (1) management contracts with real estate joint ventures or partnerships or third parties, (2) licensing and occupancy agreements and (3) certain non-tenant contracts. At contract inception, we assess the services provided in these contracts and identify any performance obligations that are distinct. To identify the performance obligation, we consider all services, whether explicitly stated or implied by customary business practices. We have identified the following substantive services, which may or may not be included in each contract type, that represent performance obligations:
Contract Type | Performance Obligation Description | Elements of Performance Obligations | Payment Timing | |||
Management Agreements | • Management and asset management services • Construction and development services • Marketing services | • Over time • Right to invoice • Long-term contracts | Typically monthly or quarterly | |||
• Leasing and legal preparation services • Sales commissions | • Point in time • Long-term contracts | |||||
Licensing and Occupancy Agreements | • Rent of non-specific space | • Over time • Right to invoice • Short-term contracts | Typically monthly | |||
• Set-up services | • Point in time • Right to invoice | |||||
Non-tenant Contracts | • Placement of miscellaneous items at our centers that do not qualify as a lease, i.e. advertisements, trash bins, etc. | • Point in time • Long-term contracts | Typically monthly | |||
• Set-up services | • Point in time • Right to invoice | |||||
We also assess collectability of the customer contract revenue prior to recognition. None of these customer contracts include a significant financing component.
49
Property
Real estate assets are stated at cost less accumulated depreciation. Depreciation is computed using the straight-line method, generally over estimated useful lives of 18 -40 years for buildings and 10 -20 years for parking lot surfacing and equipment. Major replacements where the betterment extends the useful life of the asset are capitalized, and the replaced asset and corresponding accumulated depreciation are removed from the accounts. All other maintenance and repair items are charged to expense as incurred.
Acquisitions of properties are accounted for utilizing the acquisition of a nonfinancial asset method and, accordingly, the results of operations of an acquired property are included in our results of operations from the date of acquisition. Estimates of fair values are based upon estimated future cash flows and other valuation techniques. Fair values are used to allocate and record the purchase price of acquired property among land, buildings on an “as if vacant” basis, tenant improvements, other identifiable intangibles and any goodwill or gain on purchase. Other identifiable intangible assets and liabilities include the effect of out-of-market leases, the value of having leases in place (“as is” versus “as if vacant” and absorption costs), out-of-market assumed mortgages and tenant relationships. Depreciation and amortization is computed using the straight-line method, generally over estimated useful lives of 40 years for buildings and over the lease term for other identifiable intangible assets. Costs associated with the successful acquisition of an asset are capitalized as incurred.
Property also includes costs incurred in the development and redevelopment of operating properties. These properties are carried at cost, and no depreciation is recorded on these assets until rent commences or no later than one year from the completion of major construction. These costs include preacquisition costs directly identifiable with the specific project, development and construction costs, interest, insurance and real estate taxes. Indirect development costs, including salaries and benefits, travel and other related costs that are directly attributable to the development of the property, are also capitalized. The capitalization of such costs ceases at the earlier of one year from the completion of major construction or when the property, or any completed portion, becomes available for occupancy.
Property also includes costs for tenant improvements paid by us, including reimbursements to tenants for improvements that are owned by us and will remain our property after the lease expires.
Property identified for sale is reviewed to determine if it qualifies as held for sale based on the following criteria: management has approved and is committed to the disposal plan, the assets are available for immediate sale, an active plan is in place to locate a buyer, the sale is probable and expected to qualify as a completed sale within a year, the sales price is reasonable in relation to the current fair value, and it is unlikely that significant changes will be made to the sales plan or that the sales plan will be withdrawn. Upon qualification, these properties are segregated and classified as held for sale at the lower of cost or fair value less costs to sell. Our individual property disposals do not qualify for discontinued operations presentation; thus, the results of operations through the disposal date and any associated gains are included in income from continuing operations.
Some of our properties are held in single purpose entities. A single purpose entity is a legal entity typically established at the request of a lender solely for the purpose of owning a property or group of properties subject to a mortgage. There may be restrictions limiting the entity’s ability to engage in an activity other than owning or operating the property, assuming or guaranteeing the debt of any other entity, or dissolving itself or declaring bankruptcy before the debt has been repaid. Most of our single purpose entities are 100 % owned by us and are consolidated in our consolidated financial statements.
Real Estate Joint Ventures and Partnerships
To determine the method of accounting for real estate joint ventures and partnerships, management determines whether an entity is a VIE and, if so, determines which party is the primary beneficiary by analyzing whether we have both the power to direct the entity’s significant economic activities and the obligation to absorb potentially significant losses or receive potentially significant benefits. Significant judgments and assumptions inherent in this analysis include the design of the entity structure, the nature of the entity’s operations, future cash flow projections, the entity’s financing and capital structure, and contractual relationships and terms. We consolidate a VIE when we have determined that we are the primary beneficiary.
Primary risks associated with our involvement with our VIEs include the potential funding of the entities’ debt obligations or making additional contributions to fund the entities’ operations or capital activities.
50
Non-variable interest real estate joint ventures and partnerships over which we have a controlling financial interest are consolidated in our consolidated financial statements. In determining if we have a controlling financial interest, we consider factors such as ownership interest, authority to make decisions, kick-out rights and substantive participating rights. Real estate joint ventures and partnerships where we do not have a controlling financial interest, but have the ability to exercise significant influence, are accounted for using the equity method.
Management continually analyzes and assesses reconsideration events, including changes in the factors mentioned above, to determine if the consolidation or equity method treatment remains appropriate.
Unamortized Lease Costs, net
Lease costs represent the initial direct costs incurred in origination, negotiation and processing of a lease agreement. Upon the adoption of ASC No. 842, such costs include outside broker commissions and other independent third party costs, as well as internal leasing commissions paid directly related to completing a lease and are amortized over the life of the lease on a straight-line basis. Prior to the adoption of ASC No. 842, such costs included outside broker commissions and other independent third party costs, as well as salaries and benefits, travel and other internal costs directly related to completing a lease and are amortized over the life of the lease on a straight-line basis. Costs related to salaries and benefits, supervision, administration, unsuccessful origination efforts and other activities are charged to expense as incurred. Also included are in place lease costs which are amortized over the life of the applicable lease term on a straight-line basis.
Accrued Rent, Accrued Contract Receivables and Accounts Receivable, net
Receivables include rental revenue, amounts billed and currently due from customer contracts and receivables attributable to straight-line rental commitments. Accrued contract receivables includes amounts due from customers for contracts that do not qualify as a lease in which we earned the right to the consideration through the satisfaction of the performance obligation, but before the customer pays consideration or before payment is due. Upon the adoption of ASC No. 842, individual leases are assessed for collectability and upon the determination that the collection of rents is not probable, accrued rent and accounts receivables are reduced as an adjustment to rental revenues. Revenue from leases where collection is deemed to be less than probable is recorded on a cash basis until collectability is determined to be probable. Further, we assess whether operating lease receivables, at a portfolio level, are appropriately valued based upon an analysis of balances outstanding, historical bad debt levels and current economic trends. An allowance for the uncollectible portion of the portfolio is recorded as an adjustment to rental revenues. Prior to the adoption of ASC No. 842, an allowance for the uncollectible portion of accrued rents and accounts receivable was determined based upon an analysis of balances outstanding, historical bad debt levels, tenant creditworthiness and current economic trends. Additionally, estimates of the expected recovery of pre-petition and post-petition claims with respect to tenants in bankruptcy are considered in assessing the collectability of the related receivables. Management’s estimate of the collectability of accrued rents and accounts receivable is based on the best information available to management at the time of evaluation.
Cash and Cash Equivalents
All highly liquid investments with original maturities of three months or less are considered cash equivalents. Cash and cash equivalents are primarily held at major financial institutions in the U.S. We had cash and cash equivalents in certain financial institutions in excess of federally insured levels. We have diversified our cash and cash equivalents amongst several banking institutions in an attempt to minimize exposure to any one of these entities. We believe we are not exposed to any significant credit risk and regularly monitor the financial stability of these financial institutions.
Restricted Deposits and Escrows
Restricted deposits are held or restricted for a specific use or in a qualified escrow account for the purposes of completing like-kind exchange transactions. Escrows consist of deposits held by third parties or lenders for a specific use; including, capital improvements, rental income and taxes.
Our restricted deposits and escrows consist of the following (in thousands):
December 31, | |||||||
2019 | 2018 | ||||||
Restricted deposits | $ | $ | |||||
Escrows | |||||||
Total | $ | $ | |||||
51
Other Assets, net
Other assets include an asset related to the debt service guaranty (see Note 6 for further information), tax increment revenue bonds, right-of-use assets, investments, investments held in a grantor trust, deferred tax assets (see Income Taxes), the net value of above-market leases and deferred debt costs associated with our revolving credit facilities. Right-of-use assets are amortized to achieve the recognition of rent expense on a straight-line basis after adjusting for the corresponding lease liabilities’ interest over the lives of the leases. Investments held in a grantor trust and investments in mutual funds are adjusted to fair value at each period with changes included in our Consolidated Statements of Operations. Investments held to maturity are carried at amortized cost and are adjusted using the interest method for amortization of premiums and accretion of discounts. Our tax increment revenue bonds have been classified as held to maturity and are recorded at amortized cost offset by a recognized credit loss (see Note 18 for further information). Above-market leases are amortized as adjustments to rental revenues over terms of the acquired leases. Deferred debt costs, including those classified in debt, are amortized primarily on a straight-line basis, which approximates the effective interest rate method, over the terms of the debt. Other miscellaneous receivables have a reserve applied to the carrying amount when it becomes apparent that conditions exist that may lead to our inability to fully collect on outstanding amounts due. Such conditions include delinquent or late payments on receivables, deterioration in the ongoing relationship with the borrower and other relevant factors. We establish a reserve when expected loss conditions exist by reviewing the borrower’s ability to generate revenues to meet debt service requirements and assessing the fair value of any collateral.
Other Liabilities, net
Other liabilities include non-qualified benefit plan liabilities (see Retirement Benefit Plans and Deferred Compensation Plan), lease liabilities and the net value of below-market leases. Lease liabilities are amortized to rent expense using the effective interest rate method, over the lease life. Below-market leases are amortized as adjustments to rental revenues over terms of the acquired leases.
Sales of Real Estate
Sales of real estate include the sale of tracts of land, property adjacent to shopping centers, operating properties, newly developed properties, investments in real estate joint ventures and partnerships and partial sales of real estate joint ventures and partnerships in which we participate.
These sales primarily fall under two types of contracts (1) sales of nonfinancial assets (primarily real estate) and (2) sales of investments in real estate joint ventures and partnerships of substantially nonfinancial assets. We review the sale contract to determine appropriate accounting guidance. Profits on sales of real estate are primarily not recognized until (a) a contract exists including: each party’s rights are identifiable along with the payment terms, the contract has commercial substance and the collection of consideration is probable; and (b) the performance obligation to transfer control of the asset has occurred; including transfer to the buyer of the usual risks and rewards of ownership.
We recognize gains on the sale of real estate to joint ventures and partnerships in which we participate to the extent we receive consideration from the joint venture or partnership, if it meets the sales criteria in accordance with GAAP.
Impairment
Our property, including right-of-use assets, is reviewed for impairment if events or changes in circumstances indicate that the carrying amount of the property, any capitalized costs and any identifiable intangible assets, may not be recoverable.
If such an event occurs, a comparison is made of the current and projected operating cash flows of each such property into the foreseeable future, with consideration of applicable holding periods, on an undiscounted basis to the carrying amount of such property. If we determine the carrying amount is not recoverable, our basis in the property is reduced to its estimated fair value to reflect impairment in the value of the asset. Fair values are determined by management utilizing cash flow models, market capitalization rates and market discount rates, or by obtaining third-party broker or appraisal estimates.
We review economic considerations at each reporting period, including the effects of tenant bankruptcies, the suspension of tenant expansion plans for new development projects, declines in real estate values, and any changes to plans related to our new development properties including land held for development, to identify properties where we believe market values may be deteriorating. Determining whether a property is impaired and, if impaired, the amount of write-down to fair value requires a significant amount of judgment by management and is based on the best information available to management at the time of evaluation. If market conditions deteriorate or management’s plans for certain properties change, additional write-downs could be required in the future.
52
Our investment in real estate joint ventures and partnerships is reviewed for impairment each reporting period. We evaluate various factors, including operating results of the investee, our ability and intent to hold the investment and our views on current market and economic conditions, when determining if there is a decline in the investment value. We will record an impairment charge if we determine that a decline in the estimated fair value of an investment below its carrying amount is other than temporary. The ultimate realization is dependent on a number of factors, including the performance of each investment and market conditions. There is no certainty that impairments will not occur in the future if market conditions decline or if management’s plans for these investments change.
Our investments in tax increment revenue bonds are reviewed for impairment, including the evaluation of changes in events or circumstances that may indicate that the carrying amount of the investment may not be recoverable. Realization is dependent on a number of factors, including investment performance, market conditions and payment structure. We will record an impairment charge if we determine that a decline in the value of the investment below its carrying amount is other than temporary, recovery of its cost basis is uncertain, and/or it is uncertain if the investment will be held to maturity.
Accrued contract receivables are reviewed for impairment based on changes in events or circumstances effecting our customers that may indicate that the carrying value of the asset may not be recoverable. An impairment charge will be recorded if we determine that the decline in the asset value is other than temporary or recovery of the cost basis is uncertain. Factors to be considered include current economic trends such as bankruptcy and market conditions affecting our investments in real estate joint ventures and partnerships.
See Note 10 for additional information regarding impairments.
Income Taxes
We have elected to be treated as a REIT under the Internal Revenue Code of 1986, as amended. As a REIT, we generally will not be subject to corporate level federal income tax on taxable income we distribute to our shareholders. To be taxed as a REIT, we must meet a number of requirements including defined percentage tests concerning the amount of our assets and revenues that come from, or are attributable to, real estate operations. As long as we distribute at least 90% of the taxable income of the REIT (without regard to capital gains or the dividends paid deduction) to our shareholders as dividends, we will not be taxed on the portion of our income we distribute as dividends unless we have ineligible transactions.
The Tax Relief Extension Act of 1999 gave REITs the ability to conduct activities which a REIT was previously precluded from doing as long as such activities are performed in entities which have elected to be treated as taxable REIT subsidiaries under the IRS code. These activities include buying or developing properties with the express purpose of selling them. We conduct certain of these activities in a taxable REIT subsidiary that we have created. We calculate and record income taxes in our consolidated financial statements based on the activities in this entity. Deferred tax assets and liabilities are recognized for the estimated future tax consequences attributable to differences between our carrying amounts of existing assets and liabilities and their respective tax bases and net operating loss and tax credit carry-forwards. These are measured using enacted tax rates in effect for the year in which those temporary differences are expected to be recovered or settled. A valuation allowance for deferred tax assets is established for those assets when we do not consider the realization of such assets to be more likely than not.
On December 22, 2017, the U.S. government enacted the Tax Cuts and Jobs Act of 2017 ("Tax Act"). The Tax Act made broad and complex changes to the Internal Revenue Code including, but not limited to, (1) reducing the U.S. federal corporate income tax rate from 35% to 21%, (2) establishing a 20% deduction for REIT dividends (other than any portion that is a capital gain dividend), (3) limiting the deductibility of business interest, (4) allowing full expensing of certain qualifying property, (5) eliminating the corporate Alternative Minimum Tax (“AMT”) and changing how existing AMT credits can be realized, (6) limiting current net operating loss deductions and providing an indefinite carryforward and (7) limiting the deductibility of certain executive compensation. Management’s evaluation of deferred taxes and the associated valuation allowance includes the impact of the Tax Act (see Note 11 for additional information).
Additionally, GAAP prescribes a recognition threshold and measurement attribute for the financial statement recognition of a tax position taken, or expected to be taken, in a tax return. A tax position may only be recognized in the consolidated financial statements if it is more likely than not that the tax position will be sustained upon examination. We believe it is more likely than not that our tax positions will be sustained in any tax examinations.
In addition, we are subject to the State of Texas business tax (“Texas Franchise Tax”), which is determined by applying a tax rate to a base that considers both revenues and expenses. Therefore, the Texas Franchise Tax is considered an income tax and is accounted for accordingly.
53
Share-Based Compensation
We have both share options and share awards outstanding. Since 2012, our employee long-term incentive program under our Amended and Restated 2010 Long-Term Incentive Plan grants only awards that incorporate both service-based and market-based measures for share awards to promote share ownership among the participants and to emphasize the importance of total shareholder return. The terms of each grant vary depending upon the participant's responsibilities and position within the Company. All awards are recorded at fair value on the date of grant and earn dividends throughout the vesting period; however, the dividends are subject to the same vesting terms as the award. Compensation expense is measured at the grant date and recognized over the vesting period. All share awards are awarded subject to the participant’s continued employment with us.
The share awards are subject to a three-year cliff vesting basis. Service-based and market-based share awards are subject to the achievement of select performance goals as follows:
• | Service-based awards and accumulated dividends typically vest three years from the grant date. These grants are subject only to continued employment and not dependent on future performance measures. Accordingly, if such vesting criteria are not met, compensation cost previously recognized would be reversed. |
• | Market-based awards vest based upon the performance metrics at the end of a three-year period. These awards are based |
Restricted shares granted to trust managers and share awards granted to retirement eligible employees are expensed immediately. Restricted shares and share awards have the same rights of a common shareholder, including the right to vote and receive dividends, except as otherwise provided by our Management Development and Executive Compensation Committee.
Options generally expire upon the earlier of termination of employment or 10 years from the date of grant, and all restricted shares are granted at no purchase price. Our policy is to recognize compensation expense for equity awards ratably over the vesting period, except for retirement eligible amounts.
Retirement Benefit Plans
Defined Benefit Plan:
We sponsor a noncontributory cash balance retirement plan (“Retirement Plan”) under which an account is maintained for each participant. Annual additions to each participant’s account include a service credit ranging from 3 %-5 % of compensation, depending on years of service, and an interest credit of 4.5 %. Vesting generally occurs after three years of service.
Investments of Plan Assets
Our investment policy for our plan assets has been to determine the objectives for structuring a retirement savings program suitable to the long-term needs and risk tolerances of participants, to select appropriate investments to be offered by the plan and to establish procedures for monitoring and evaluating the performance of the investments of the plan. Our overall plan objectives for selecting and monitoring investment options are to promote and optimize retirement wealth accumulation; to provide a full range of asset classes and investment options that are intended to help diversify the portfolio to maximize return within reasonable and prudent levels of risk; to control costs of administering the plan; and to manage the investments held by the plan.
The selection of investment options is determined using criteria based on the following characteristics: fund history, relative performance, investment style, portfolio structure, manager tenure, minimum assets, expenses and operation considerations. Investment options selected for use in the plan are reviewed at least on a semi-annual basis to evaluate material changes from the selection criteria. Asset allocation is used to determine how the investment portfolio should be split between stocks, bonds and cash. The asset allocation decision is influenced by investment time horizon; risk tolerance; and investment return objectives. The primary factor in establishing asset allocation is demographics of the plan, including attained age and future service. A broad market diversification model is used in considering all these factors, and the percentage allocation to each investment category may also vary depending upon market conditions. Re-balancing of the allocation of plan assets occurs semi-annually.
54
Defined Contribution Plans:
We have two separate and independent nonqualified supplemental retirement plans (“SRP”) for certain employees that are classified as defined contribution plans. These unfunded plans provide benefits in excess of the statutory limits of our noncontributory cash balance retirement plan. For active participants, annual additions to each participant’s account include an actuarially-determined service credit ranging from 3 % to 5 % and an interest credit of 4.5 %. Vesting generally occurs between five and 10 years of service. We have elected to use the actuarial present value of the vested benefits to which the participant was entitled if the participant separated immediately from the SRP, as permitted by GAAP.
The SRP participants' account balances prior to 2012 no longer receive service credits but continue to receive a 7.5 % interest credit for active participants. All inactive participants receive a December 31, 90-day LIBOR rate plus .50% interest credit.
We have a Savings and Investment Plan pursuant to which eligible employees may elect to contribute from 1 % of their salaries to the maximum amount established annually by the IRS. Employee contributions are matched by us at the rate of 50 % for the first 6 % of the employee's salary. The employees vest in the employer contributions ratably over a five-year period.
Deferred Compensation Plan
We have a deferred compensation plan for eligible employees allowing them to defer portions of their current cash salary or share-based compensation. Deferred amounts are deposited in a grantor trust, which are included in Other, net Assets, and are reported as compensation expense in the year service is rendered. Cash deferrals are invested based on the employee’s investment selections from a mix of assets selected using a broad market diversification model. Deferred share-based compensation cannot be diversified, and distributions from this plan are made in the same form as the original deferral.
Fair Value Measurements
Certain financial instruments, estimates and transactions are required to be calculated, reported and/or recorded at fair value. The estimated fair values of such financial items, including debt instruments, impaired assets, acquisitions and investment securities, have been determined using a market-based measurement. This measurement is determined based on the assumptions that management believes market participants would use in pricing an asset or liability; including, market capitalization rates, discount rates, current operating results, local economics and other factors. As a basis for considering market participant assumptions in fair value measurements, GAAP establishes a fair value hierarchy that distinguishes between market participant assumptions based on market data obtained from sources independent of the reporting entity (observable inputs that are classified within Levels 1 and 2 of the hierarchy) and the reporting entity’s own assumptions about market participant assumptions (unobservable inputs classified within Level 3 of the hierarchy).
Level 1 inputs utilize quoted prices (unadjusted) in active markets for identical assets or liabilities that we have the ability to access. Level 2 inputs are inputs other than quoted prices included in Level 1 that are observable for the asset or liability, either directly or indirectly. Level 2 inputs may include quoted prices for similar assets and liabilities in active markets, as well as inputs that are observable for the asset or liability (other than quoted prices), such as interest rates and yield curves that are observable at commonly quoted intervals. Level 3 inputs are unobservable inputs for the asset or liability, which is typically based on an entity’s own assumptions, as there is little, if any, related market activity. In instances where the determination of the fair value measurement is based on inputs from different levels of the fair value hierarchy, the level in the fair value hierarchy within which the entire fair value measurement falls is based on the lowest level input that is significant to the fair value measurement in its entirety. Our assessment of the significance of a particular input to the fair value measurement in its entirety requires judgment, and considers factors specific to the asset or liability. The fair value of such financial instruments, estimates and transactions was determined using available market information and appropriate valuation methodologies as prescribed by GAAP.
Internally developed and third party fair value measurements, including the unobservable inputs, are evaluated by management with sufficient experience for reasonableness based on current market knowledge, trends and transactional experience in the real estate and capital markets. Our valuation policies and procedures are determined by our Accounting Group, which reports to the Chief Financial Officer and the results of significant impairment transactions are discussed with the Audit Committee on a quarterly basis.
55
Fair value estimates are based on limited available market information for similar transactions, including our tax increment revenue bonds, investments held to maturity and debt, and there can be no assurance that the disclosed value of any financial instrument could be realized by immediate settlement of the instrument. The following provides information about the methods used to estimate the fair value of our financial instruments, including their estimated fair values:
Cash Equivalents and Restricted Cash
Cash equivalents and restricted cash are valued based on publicly-quoted market prices for identical assets.
Investments and Deferred Compensation Plan Obligations
Investments in mutual funds held in a grantor trust and mutual funds are valued based on publicly-quoted market prices for identical assets. The deferred compensation plan obligations corresponds to the value of our investments held in a grantor trust. Investments held to maturity are carried at amortized cost and are adjusted using the interest method for amortization of premiums and accretion of discounts.
Tax Increment Revenue Bonds
The fair value estimates of our held to maturity tax increment revenue bonds, which were issued by the Agency in connection with our investment in a development project in Sheridan, Colorado, are based on assumptions that management believes market participants would use in pricing, using widely accepted valuation techniques including discounted cash flow analysis based on the expected future sales tax revenues of the project. This analysis reflects the contractual terms of the bonds, including the period to maturity, and uses observable market-based inputs, such as market discount rates and unobservable market-based inputs, such as future growth and inflation rates.
Debt
The fair value of our debt may be based on quoted market prices for publicly-traded debt, on a third-party established benchmark for inactively traded debt and on the discounted estimated future cash payments to be made for non-traded debt. For inactively traded debt, our third-party provider establishes a benchmark for all REIT securities based on the largest, most liquid and most frequent investment grade securities in the REIT bond market. This benchmark is then adjusted to consider how a market participant would be compensated for risk premiums such as, longevity of maturity dates, lack of liquidity and credit quality of the issuer. The discount rates used approximate current lending rates for loans or groups of loans with similar maturities and credit quality, assumes the debt is outstanding through maturity and considers the debt’s collateral (if applicable). We have utilized market information as available or present value techniques to estimate the amounts required to be disclosed.
Reportable Segments
Our primary focus is to lease space to tenants in shopping centers that we own, lease or manage. We evaluate the performance of the reportable segments based on net operating income, defined as total revenues less operating expenses and real estate taxes. Management does not consider the effect of gains or losses from the sale of property or interests in real estate joint ventures and partnerships in evaluating segment operating performance.
No individual property constitutes more than 10% of our revenues or assets, and we have no operations outside of the United States of America. Therefore, our properties have been aggregated into one reportable segment since such properties and the tenants thereof each share similar economic and operating characteristics.
56
Accumulated Other Comprehensive Loss
Changes in accumulated other comprehensive loss by component consists of the following (in thousands):
Gain on Investments | Gain on Cash Flow Hedges | Defined Benefit Pension Plan | Total | ||||||||||||
Balance, January 1, 2017 | $ | ( | ) | $ | ( | ) | $ | $ | |||||||
Change excluding amounts reclassified from accumulated other comprehensive loss | ( | ) | ( | ) | ( | ) | |||||||||
Amounts reclassified from accumulated other comprehensive loss | (1) | ( | ) | (2) | ( | ) | |||||||||
Net other comprehensive (income) loss | ( | ) | ( | ) | ( | ) | ( | ) | |||||||
Balance, December 31, 2017 | ( | ) | ( | ) | |||||||||||
Cumulative effect adjustment of accounting standards | |||||||||||||||
Change excluding amounts reclassified from accumulated other comprehensive loss | ( | ) | ( | ) | |||||||||||
Amounts reclassified from accumulated other comprehensive loss | (1) | ( | ) | (2) | |||||||||||
Net other comprehensive loss (income) | ( | ) | |||||||||||||
Balance, December 31, 2018 | ( | ) | |||||||||||||
Change excluding amounts reclassified from accumulated other comprehensive loss | |||||||||||||||
Amounts reclassified from accumulated other comprehensive loss | (1) | ( | ) | (2) | ( | ) | |||||||||
Net other comprehensive loss (income) | ( | ) | |||||||||||||
Balance, December 31, 2019 | $ | $ | ( | ) | $ | $ | |||||||||
___________________
(1) | This reclassification component is included in interest expense. |
(2) | This reclassification component is included in the computation of net periodic benefit cost (see Note 15 for additional information). |
Additionally, as of December 31, 2019 and 2018, the net gain balance in accumulated other comprehensive loss relating to previously terminated cash flow interest rate swap contracts was $3.6 million and $4.5 million, respectively, which will be reclassified to net interest expense as interest payments are made on the originally hedged debt. Within the next 12 months, approximately $.9 million in accumulated other comprehensive loss is expected to be reclassified as a reduction to interest expense related to our interest rate contracts.
Reclassifications
We have reclassified prior years’ miscellaneous lease-related revenues identified during our implementation of ASC No. 842 of $1.3 million and $2.5 million for the year ended December 31, 2018 and 2017, respectively, to Rentals, net from Other revenue in our Consolidated Statements of Operations to conform to the current year presentation (see Note 2 for further information).
57
Note 2. Newly Issued Accounting Pronouncements
Adopted
In February 2016, the Financial Accounting Standards Board ("FASB") issued Accounting Standard Update ("ASU") No. 2016-02, "Leases." This ASU was further updated by ASU No. 2018-01, "Land Easement Practical Expedient for Transition for Topic 842," ASU No. 2018-10, "Codification Improvements to Topic 842," ASU No. 2018-11, "Targeted Improvements for Topic 842," ASU No. 2018-20, "Narrow-Scope Improvements for Lessors" and ASU No. 2019-01, "Codification Improvements to Topic 842." These ASUs set out the principles for the recognition, measurement, presentation and disclosure of leases for both lessees and lessors. The ASUs require lessees to adopt a right-of-use asset approach that will bring substantially all leases onto the balance sheet, with the exception of short-term leases. The subsequent accounting for this right-of-use asset will be based on a dual-model approach, under which the lease will be classified as either a finance or an operating lease. The lessor accounting model under these ASUs is similar to current guidance, but certain underlying principles in the lessor model have been aligned with the new revenue recognition standard. A practical expedient was added for lessors to elect, by class of underlying assets, to account for lease and nonlease components as a single lease component if certain criteria are met. The provisions of these ASUs were effective for us as of January 1, 2019. We adopted this guidance as of January 1, 2019 and applied it on a modified retrospective approach and elected not to restate comparative periods.
Upon adoption, we applied the following practical expedients:
• | The practical expedient package which allows an entity not to reassess (1) whether any expired or existing contracts are or contain leases; (2) the lease classification for expired or existing leases; and (3) initial direct costs for any existing leases. |
• | The practical expedient which allows an entity not to reassess whether any existing or expired land easements that were not previously accounted for as a lease or if the contract contains a lease. |
• | As an accounting policy election, a lessor may choose not to separate the nonlease components, by class of underlying assets, from the lease components and instead account for both types of components as a single lease component under certain conditions. |
• | As an accounting policy election, a lessee may choose not to separate the nonlease components, by class of underlying assets, from the lease components and instead account for both types of components as a single lease component. |
• | As an accounting policy election, a lessee may choose by class of the underlying asset, not to apply the recognition requirements to short-term leases. |
The adoption resulted in the following changes as of January 1, 2019:
• | From the Lessor Perspective: |
◦ | Our existing leases will continue to be classified as operating leases, however, leases entered into or modified after January 1, 2019 may be classified as either operating or sales-type leases, based on specific classification criteria. We believe the majority of our leases will continue to be classified as operating leases, and all operating leases will continue to have a similar pattern of recognition as under current GAAP. |
◦ | Capitalization of leasing costs has been limited under the new ASU which no longer allows indirect costs to be capitalized. Therefore, indirect, internally-generated leasing and legal costs are no longer capitalized and are recorded in General and administrative expenses in our Consolidated Statement of Operations in the period of adoption prospectively. We continue to capitalize direct costs as defined within the ASU. |
◦ | We are entitled to receive tenant reimbursements for operating expenses for common area maintenance (“CAM”). These ASUs have defined CAM reimbursement revenue as a nonlease component, which would need to be accounted for in accordance with Topic 606. However, we have applied the practical expedient for all of our real estate related leases, to account for the lease and nonlease components as a single, combined operating lease component as long as the nonlease component is not the predominate component of the combined components within a contract. |
58
◦ | We previously accounted for real estate taxes that are paid directly by the tenant on a gross basis in our consolidated financial statements. These ASUs have indicated that a lessor should exclude from variable payments, lessor costs paid by a lessee directly to a third party. Therefore, we have excluded any costs paid directly by the tenant from our revenues and expenses and will only include as variable payments those which are reimbursed to us by our tenants. Real estate taxes paid directly by our tenants was $ |
• | From the Lessee Perspective: |
◦ | On January 1, 2019, we were the lessee under ground lease agreements for land underneath all or a portion of |
We recognized right-of-use assets for our operating leases in Other Assets, along with corresponding lease liabilities in Other Liabilities on January 1, 2019 in the amounts of $44.2 million and $42.9 million, respectively, in the Consolidated Balance Sheet. The difference between the right-of-use assets and the lease liabilities is primarily associated with intangibles related to ground leases. For these existing operating leases, we continue to recognize a single lease expense for both our ground and office leases, currently included in Operating expenses and General and administrative expenses, respectively, in the Consolidated Statements of Operations.
◦ | We continue to recognize our finance lease asset balance in Property and our finance lease liability in Debt in our Consolidated Balance Sheets. The finance lease charges a portion of the payment to both asset amortization and interest expense. |
In June 2018, the FASB issued ASU No. 2018-07, "Improvements to Nonemployee Share-Based Payment Accounting." This ASU amends prior employee share-based payment guidance to include nonemployee share-based payment transactions for acquiring services or property. This ASU now aligns the determination of the measurement date, the accounting for performance conditions, and the accounting for share-based payments after vesting in addition to other items. The provisions of ASU No. 2018-07 were effective for us as of January 1, 2019 using a modified transition method upon adoption. The adoption of this ASU did not have a material impact to our consolidated financial statements.
Not Yet Adopted
In June 2016, the FASB issued ASU No. 2016-13, "Measurement of Credit Losses on Financial Instruments." This ASU was further updated by ASU No. 2018-19, "Codification Improvements to Topic 326, Financial Instruments - Credit Losses, "ASU No. 2019-04, "Codification Improvements to Topic 326, Financial Instruments - Credit Losses," ASU No. 2019-05, "Targeted Transition Relief" and ASU No. 2019-11, "Codification Improvements to Topic 326, Financial Instruments - Credit Losses." These ASUs amend prior guidance on the impairment of financial instruments, and adds an impairment model that is based on expected losses rather than incurred losses with the recognition of an allowance based on an estimate of expected credit losses. The provisions of ASU No. 2016-13, as amended in subsequently issued amendments, were effective for us as of January 1, 2020.
In identifying all of our financial instruments covered under this guidance, the majority of our instruments result from operating leasing transactions, which are not within the scope of the new standard and are to remain governed by the recently issued leasing guidance and other previously issued guidance. Upon adoption at January 1, 2020, we recognized the cumulative effect for credit losses which has decreased retained earnings and other assets by $.7 million, respectively. In addition, we evaluated controls around the implementation of this ASU and have concluded there will be no significant impact on our control structure.
In August 2018, the FASB issued ASU No. 2018-13, "Changes to the Disclosure Requirements for Fair Value Measurement." This ASU amends and removes several disclosure requirements including the valuation processes for Level 3 fair value measurements. The ASU also modifies some disclosure requirements and requires additional disclosures for changes in unrealized gains and losses included in other comprehensive income for recurring Level 3 fair value measurements and requires the range and weighted average of significant unobservable inputs used to develop Level 3 fair value measurements. The provisions of ASU No. 2018-13 were effective for us as of January 1, 2020 using a prospective transition method for amendments effecting changes in unrealized gains and losses, significant unobservable inputs used to develop Level 3 fair value measurements and narrative description on uncertainty of measurements. The remaining provisions of the ASU have been applied retrospectively. The adoption of this ASU did not have a material impact to our consolidated financial statements.
59
In August 2018, the FASB issued ASU No. 2018-14, "Changes to the Disclosure Requirements for Defined Benefit Plans." This ASU clarifies current disclosures and removes several disclosures requirements including accumulated other comprehensive income expected to be recognized over the next fiscal year and amount and timing of plan assets expected to be returned to the employer. The ASU also requires additional disclosures for the weighted-average interest crediting rates for cash balance plans and explanations for significant gains and losses related to changes in the benefit plan obligation. The provisions of ASU No. 2018-14 are effective for us as of December 31, 2020 using a retrospective basis for all periods presented, and early adoption is permitted. Although we are still assessing the impact of this ASU's adoption, we do not believe this ASU will have a material impact to our consolidated financial statements.
In December 2019, the FASB issued ASU No. 2019-12, "Simplifying the Accounting for Income Taxes." This ASU clarifies/simplifies current disclosures and removes several disclosures requirements. Simplification includes franchise taxes based partially on income as an income-based tax; entities should reflect enacted tax law and rate changes in the interim period that includes the enactment date; and allowing entities to allocate consolidated tax amounts to individual legal entities under certain elections. The provisions of ASU No. 2019-12 are effective for us as of January 1, 2021, and early adoption is permitted. Although we are still assessing the impact of this ASU's adoption, we do not believe this ASU will have a material impact to our consolidated financial statements.
Note 3. Property
Our property consists of the following (in thousands):
December 31, | |||||||
2019 | 2018 | ||||||
Land | $ | $ | |||||
Land held for development | |||||||
Land under development | |||||||
Buildings and improvements | |||||||
Construction in-progress | |||||||
Total | $ | $ | |||||
During the year ended December 31, 2019, we sold 15 centers and other property. Aggregate gross sales proceeds from these transactions approximated $464.1 million and generated gains of approximately $189.8 million. Also, for the year ended December 31, 2019, we acquired five grocery-anchored shopping centers and other property with an aggregate gross purchase price of approximately $219.6 million, and we invested $109.7 million in new development projects.
60
Note 4. Investment in Real Estate Joint Ventures and Partnerships
We own interests in real estate joint ventures or limited partnerships and have tenancy-in-common interests in which we exercise significant influence, but do not have financial and operating control. We account for these investments using the equity method, and our interests ranged for the periods presented from 20 % to 90 % in both 2019 and 2018. Combined condensed financial information of these ventures (at 100%) is summarized as follows (in thousands):
December 31, | |||||||
2019 | 2018 | ||||||
Combined Condensed Balance Sheets | |||||||
ASSETS | |||||||
Property | $ | $ | |||||
Accumulated depreciation | ( | ) | ( | ) | |||
Property, net | |||||||
Other assets, net | |||||||
Total Assets | $ | $ | |||||
LIABILITIES AND EQUITY | |||||||
Debt, net (primarily mortgages payable) | $ | $ | |||||
Amounts payable to Weingarten Realty Investors and Affiliates | |||||||
Other liabilities, net | |||||||
Total Liabilities | |||||||
Equity | |||||||
Total Liabilities and Equity | $ | $ | |||||
Year Ended December 31, | |||||||||||
2019 | 2018 | 2017 | |||||||||
Combined Condensed Statements of Operations | |||||||||||
Revenues, net | $ | $ | $ | ||||||||
Expenses: | |||||||||||
Depreciation and amortization | |||||||||||
Interest, net | |||||||||||
Operating | |||||||||||
Real estate taxes, net | |||||||||||
General and administrative | |||||||||||
Provision for income taxes | |||||||||||
Total | |||||||||||
Gain on dispositions | |||||||||||
Net Income | $ | $ | $ | ||||||||
Our investment in real estate joint ventures and partnerships, as reported in our Consolidated Balance Sheets, differs from our proportionate share of the entities’ underlying net assets due to basis differences, which arose upon the transfer of assets to the joint ventures. The net positive basis differences, which totaled $9.0 million and $5.2 million at December 31, 2019 and 2018, respectively, are generally amortized over the useful lives of the related assets.
61
We recorded joint venture fee income included in Other revenues for the year ended December 31, 2019, 2018 and 2017 of $6.5 million, $6.1 million and $6.2 million, respectively.
During 2019, a parcel of land was sold with gross sales proceeds of approximately $2.3 million, of which our share of the gain, included in equity earnings in real estate joint ventures and partnerships, totaled $1.1 million. In July 2019, a 51 % owned unconsolidated real estate joint venture acquired a center with a gross purchase price of $52.6 million. Also during 2019, we invested $47.6 million in a 90 % owned unconsolidated real estate joint venture for a mixed-use new development.
Note 5. Identified Intangible Assets and Liabilities
Identified intangible assets and liabilities associated with our property acquisitions are as follows (in thousands):
December 31, | |||||||
2019 | 2018 | ||||||
Identified Intangible Assets: | |||||||
Above-market leases (included in Other Assets, net) | $ | $ | |||||
Above-market leases - Accumulated Amortization | ( | ) | ( | ) | |||
In place leases (included in Unamortized Lease Costs, net) | |||||||
In place leases - Accumulated Amortization | ( | ) | ( | ) | |||
$ | $ | ||||||
Identified Intangible Liabilities: | |||||||
Below-market leases (included in Other Liabilities, net) | $ | $ | |||||
Below-market leases - Accumulated Amortization | ( | ) | ( | ) | |||
Above-market assumed mortgages (included in Debt, net) | |||||||
Above-market assumed mortgages - Accumulated Amortization | ( | ) | ( | ) | |||
$ | $ | ||||||
These identified intangible assets and liabilities are amortized over the applicable lease terms or the remaining lives of the assumed mortgages, as applicable.
The net amortization of above-market and below-market leases increased rental revenues by $4.6 million, $12.8 million and $3.7 million in 2019, 2018 and 2017, respectively. The significant year over year change in rental revenues in 2019 to 2018 is primarily due to a write-off of a below-market lease intangible from the termination of a tenant's lease in 2018. The estimated net amortization of these intangible assets and liabilities will increase rental revenues for each of the next five years as follows (in thousands):
2020 | $ | ||
2021 | |||
2022 | |||
2023 | |||
2024 | |||
62
The amortization of the in place lease intangible assets recorded in depreciation and amortization, was $14.9 million, $29.8 million and $21.0 million in 2019, 2018 and 2017, respectively. The significant year over year change in depreciation and amortization from 2019 to 2018 is primarily due to the write-off of in-place lease intangibles from the termination of tenant leases in 2018. The estimated amortization of these intangible assets will increase depreciation and amortization for each of the next five years as follows (in thousands):
2020 | $ | ||
2021 | |||
2022 | |||
2023 | |||
2024 | |||
The net amortization of above-market assumed mortgages decreased net interest expense by $.3 million, $.7 million and $1.1 million in 2019, 2018 and 2017, respectively. The estimated net amortization of these intangible liabilities will decrease net interest expense for each of the next five years as follows (in thousands):
2020 | $ | ||
2021 | |||
2022 | |||
2023 | |||
2024 | |||
The following table details the identified intangible assets and liabilities and the remaining weighted-average amortization period associated with our asset acquisitions in 2019 as follows:
Identified intangible assets and liabilities subject to amortization (in thousands): | ||||
Assets: | ||||
In place leases | $ | |||
Above-market leases | ||||
Liabilities: | ||||
Below-market leases | ||||
Identified intangible assets and liabilities remaining weighted-average amortization period (in years): | ||||
Assets: | ||||
In place leases | ||||
Above-market leases | ||||
Liabilities: | ||||
Below-market leases | ||||
63
Note 6. Debt
Our debt consists of the following (in thousands):
December 31, | |||||||
2019 | 2018 | ||||||
Debt payable, net to 2038 (1) | $ | $ | |||||
Unsecured notes payable under credit facilities | |||||||
Debt service guaranty liability | |||||||
Finance lease obligation | |||||||
Total | $ | $ | |||||
___________________
(1) | At December 31, 2019, interest rates ranged from |
The allocation of total debt between fixed and variable-rate as well as between secured and unsecured is summarized below (in thousands):
December 31, | |||||||
2019 | 2018 | ||||||
As to interest rate (including the effects of interest rate contracts): | |||||||
Fixed-rate debt | $ | $ | |||||
Variable-rate debt | |||||||
Total | $ | $ | |||||
As to collateralization: | |||||||
Unsecured debt | $ | $ | |||||
Secured debt | |||||||
Total | $ | $ | |||||
We maintain a $500 million unsecured revolving credit facility, which was amended and extended on December 11, 2019. This facility expires in March 2024, provides for two consecutive six-month extensions upon our request, and borrowing rates that float at a margin over LIBOR plus a facility fee. At December 31, 2019 and 2018, the borrowing margin and facility fee, which are priced off a grid that is tied to our senior unsecured credit ratings, were 82.5 and 15 basis points and 90 and 15 basis points, respectively. The facility also contains a competitive bid feature that allows us to request bids for up to $250 million. Additionally, an accordion feature allows us to increase the facility amount up to $850 million.
Additionally, we have a $10 million unsecured short-term facility, which was amended and extended on January 3, 2020, that we maintain for cash management purposes, which matures in March 2021. At both December 31, 2019 and 2018, the facility provided for fixed interest rate loans at a 30 -day LIBOR rate plus a borrowing margin, facility fee and an unused facility fee of 125, 10, and 5 basis points, respectively.
64
The following table discloses certain information regarding our unsecured notes payable under our credit facilities (in thousands, except percentages):
December 31, | |||||||
2019 | 2018 | ||||||
Unsecured revolving credit facility: | |||||||
Balance outstanding | $ | $ | |||||
Available balance | |||||||
Letter of credit outstanding under facility | |||||||
Variable interest rate (excluding facility fee) at end date | % | % | |||||
Unsecured short-term facility: | |||||||
Balance outstanding | $ | $ | |||||
Variable interest rate at end date | % | % | |||||
Both facilities: | |||||||
Maximum balance outstanding during the year | $ | $ | |||||
Weighted average balance | |||||||
Year-to-date weighted average interest rate (excluding facility fee) | % | % | |||||
Related to a development project in Sheridan, Colorado, we have provided a guaranty for the payment of any debt service shortfalls until a coverage rate of 1.4 x is met on tax increment revenue bonds issued in connection with the project. The bonds are to be repaid with incremental sales and property taxes and a PIF to be assessed on current and future retail sales and, to the extent necessary, any amounts we may have to provide under a guaranty. The incremental taxes and PIF are to remain intact until the earlier of the date the bond liability has been paid in full or 2040. Therefore, a debt service guaranty liability equal to the fair value of the amounts funded under the bonds was recorded. As of December 31, 2019 and 2018, we had $57.4 million and $60.9 million outstanding for the debt service guaranty liability, respectively.
During the year ended December 31, 2019, we repaid a $50 million secured fixed-rate mortgage with a 7.0 % interest rate from cash from our disposition proceeds.
During the year ended December 31, 2018, we prepaid, without penalty, our $200 million unsecured variable-rate term loan, swapped to a fixed rate of 2.5 %, and terminated three interest rate swap contracts that had an aggregate notional amount of $200 million, and we recognized a $3.4 million gain due to the probability that the related hedged forecasted transactions would no longer occur. Additionally, during the year ended December 31, 2018, we paid at par $51.0 million of outstanding debt. These transactions resulted in a net gain upon their extinguishment of $.4 million, excluding the effect of the swap termination.
Various leases and properties, and current and future rentals from those leases and properties, collateralize certain debt. At December 31, 2019 and 2018, the carrying value of such assets aggregated $.5 billion and $.6 billion, respectively. Additionally at December 31, 2019 and 2018, investments of $5.3 million and $5.2 million, respectively, included in Restricted Deposits and Escrows are held as collateral for letters of credit totaling $5.0 million.
65
Scheduled principal payments on our debt (excluding $21.8 million of a finance lease obligation, $(3.9 ) million net premium/(discount) on debt, $(5.5 ) million of deferred debt costs, $1.5 million of non-cash debt-related items, and $57.4 million debt service guaranty liability) are due during the following years (in thousands):
2020 | $ | ||
2021 | |||
2022 | |||
2023 | |||
2024 | |||
2025 | |||
2026 | |||
2027 | |||
2028 | |||
2029 | |||
Thereafter | |||
Total | $ | ||
Our various debt agreements contain restrictive covenants, including minimum interest and fixed charge coverage ratios, minimum unencumbered interest coverage ratios, minimum net worth requirements and maximum total debt levels. We are not aware of any non-compliance with our public debt and revolving credit facility covenants as of December 31, 2019.
Note 7. Lease Obligations
We are engaged in the operation of shopping centers, which are either owned or, with respect to certain shopping centers, operated under operating ground leases. These ground leases expire at various dates through 2069 with renewal options ranging from five years to 20 years and in some cases, include options to purchase the underlying asset by either the lessor or lessee. Generally, our ground lease variable payments for real estate taxes, insurance and utilities are paid directly by us and are not a component of rental expense. Most of our leases have increasing minimum rental rates during the terms of the leases through escalation provisions and also may include an amount based on a percentage of operating revenues or sublease tenant revenue. Space in our shopping centers is leased to tenants pursuant to agreements that generally provide for terms of 10 years or less and may include multiple options to extend the lease term in increments up to five years , for annual rentals subject to upward adjustments based on operating expense levels, sales volume, or contractual increases as defined in the lease agreements.
Also, we have two properties under a finance lease that consists of variable lease payments with a purchase option. The right-of-use asset associated with this finance lease at December 31, 2019 was $8.9 million. At December 31, 2018, the related assets associated with a capital lease in buildings and improvements totaled $15.7 million, and the balance of accumulated depreciation was $14.1 million. Amortization of property under the finance lease is included in depreciation and amortization expense. Note that amounts prior to January 1, 2019 were accounted for under ASC No. 840.
66
A schedule of lease costs including weighted average lease terms and weighted-average discount rates is as follows (in thousands, except as noted):
Year Ended December 31, | |||
2019 | |||
Operating lease cost: | |||
Included in Operating expense | $ | ||
Included in General and administrative expense | |||
Finance cost: | |||
Amortization of right-of-use asset (included in Depreciation and Amortization) | |||
Interest on lease liability (included in Interest expense, net) | |||
Short-term lease cost | |||
Variable lease cost | |||
Sublease income (included in Rentals, net) | ( | ) | |
Total lease cost | $ | ( | ) |
December 31, 2019 | |||
Weighted-average remaining lease term (in years): | |||
Operating leases | |||
Finance lease | |||
Weighted-average discount rate (percentage): | |||
Operating leases | % | ||
Finance lease | % | ||
A reconciliation of our lease liabilities on an undiscounted cash flow basis, which primarily represents shopping center ground leases, for the subsequent five years and thereafter, as calculated as of December 31, 2019, is as follows (in thousands):
Operating | Finance | ||||||
Lease payments: | |||||||
2020 | $ | $ | |||||
2021 | |||||||
2022 | |||||||
2023 | |||||||
2024 | |||||||
Thereafter | |||||||
Total | $ | $ | |||||
Lease liabilities(1) | |||||||
Undiscounted excess amount | $ | $ | |||||
___________________
(1) | Operating lease liabilities are included in Other Liabilities, and finance lease liabilities are included in Debt, net in our Consolidated Balance Sheet. |
67
Scheduled minimum rental payments as defined under ASC No. 840, under the terms of all non-cancelable operating leases in which we are the lessee, principally for shopping center ground leases, for the subsequent five years and thereafter ending December 31, as calculated as of December 31, 2018, were as follows (in thousands):
Operating | Finance | ||||||
Lease payments: | |||||||
2019 | $ | $ | |||||
2020 | |||||||
2021 | |||||||
2022 | |||||||
2023 | |||||||
Thereafter | |||||||
Total | $ | $ | |||||
Rental expense for operating leases as defined under ASC No. 840 was, in millions: $3.1 in 2018 and $2.9 in 2017, which was recognized in Operating expense. Minimum revenues under subleases, applicable to the ground lease rentals, under the terms of all non-cancelable tenant leases was, in millions: $22.8 million in 2018 and $27.1 million in 2017.
Future undiscounted, sublease payments applicable to the ground lease rentals, under the terms of all non-cancelable tenant leases, excluding estimated variable payments for the subsequent five years and thereafter ending December 31, as calculated as of December 31, 2019 and 2018, were as follows (in thousands):
December 31, 2019 | December 31, 2018 | ||||||
Sublease payments: | |||||||
Finance lease(1) | $ | $ | |||||
Operating leases: | |||||||
2019 | $ | ||||||
2020 | $ | ||||||
2021 | |||||||
2022 | |||||||
2023 | |||||||
2024 | |||||||
Thereafter | |||||||
Total | $ | $ | |||||
___________________
(1) |
Note 8. Common Shares of Beneficial Interest
We have a $200 million share repurchase plan where we may repurchase common shares from time-to-time in open-market or in privately negotiated purchases. The timing and amount of any shares repurchased will be determined by management based on its evaluation of market conditions and other factors. The repurchase plan may be suspended or discontinued at any time, and we have no obligations to repurchase any amount of our common shares under the plan.
68
Common dividends declared per share were $1.58 , $2.98 and $2.29 for the year ended December 31, 2019, 2018 and 2017, respectively. The regular dividend rate per share for our common shares for each quarter of 2019, 2018 and 2017 was $.395 , $.395 and $.385 , respectively. No special dividend was paid in 2019, and for each December 2018 and 2017, we paid a special dividend for our common shares in an amount per share of $1.40 and $.75 , respectively, which was due to the significant gains on dispositions of property. Subsequent to December 31, 2019, a first quarter dividend of $.395 per common share was approved by our Board of Trust Managers.
Note 9. Leasing Operations
As a commercial real estate lessor, generally our leases are for terms of 10 years or less and may include multiple options, upon tenant election, to extend the lease term in increments up to five years . Our leases typically do not include an option to purchase. Tenant terminations prior to the lease end date occasionally results in a one-time termination fee based on the remaining unpaid lease payments including variable payments and could be material to the tenant. Many of our leases have increasing minimum rental rates during the terms of the leases through escalation provisions. In addition, the majority of our leases provide for variable rental revenues, such as, reimbursements of real estate taxes, maintenance and insurance and may include an amount based on a percentage of the tenants’ sales.
Future undiscounted, lease payments for tenant leases, excluding estimated variable payments, at December 31, 2019 is as follows (in thousands):
2020 | $ | ||
2021 | |||
2022 | |||
2023 | |||
2024 | |||
Thereafter | |||
Total payments due | $ | ||
Future minimum rental income as defined under ASC No. 840 from tenant leases, excluding estimated contingent rentals, at December 31, 2018 is as follows (in thousands):
2019 | $ | ||
2020 | |||
2021 | |||
2022 | |||
2023 | |||
Thereafter | |||
Total payments due | $ | ||
Variable lease payments recognized in Rentals, net are as follows (in thousands):
Year Ended December 31, | ||||
2019 | ||||
Variable lease payments | $ | |||
Contingent rentals recognized in Rentals, net are as follows (in thousands):
Year Ended December 31, | |||||||
2018 | 2017 | ||||||
Contingent rentals | $ | $ | |||||
69
Note 10. Impairment
The following impairment charges were recorded on the following assets based on the difference between the carrying amount of the assets and the estimated fair value (see Note 18 for additional fair value information) (in thousands):
Year Ended December 31, | |||||||||||
2019 | 2018 | 2017 | |||||||||
Operating expenses: | |||||||||||
Properties held for sale, under contract for sale or sold (1) | $ | $ | $ | ||||||||
Land held for development and undeveloped land (1) | |||||||||||
Other | |||||||||||
Total impairment charges | |||||||||||
Other financial statement captions impacted by impairment: | |||||||||||
Equity in earnings of real estate joint ventures and partnerships, net (1) | |||||||||||
Net income attributable to noncontrolling interests | ( | ) | ( | ) | |||||||
Net impact of impairment charges | $ | $ | $ | ||||||||
___________________
(1) | Amounts reported were based on changes in management's plans or intent for the properties and/or investments in real estate joint ventures and partnerships, third party offers, recent comparable market transactions and/or a change in market conditions. |
Note 11. Income Tax Considerations
We qualify as a REIT under the provisions of the Internal Revenue Code, and therefore, no tax is imposed on our taxable income distributed to shareholders. To maintain our REIT status, we must distribute at least 90 % of our ordinary taxable income to our shareholders and meet certain income source and investment restriction requirements. Our shareholders must report their share of income distributed in the form of dividends.
Taxable income differs from net income for financial reporting purposes primarily because of differences in the timing of recognition of depreciation, rental revenue, repair expense, compensation expense, impairment losses and gain from sales of property. As a result of these differences, the book value of our net real estate assets is in excess of tax basis by $286.2 million and $211.0 million at December 31, 2019 and 2018, respectively.
The following table reconciles net income adjusted for noncontrolling interests to REIT taxable income (in thousands):
Year Ended December 31, | |||||||||||
2019 | 2018 | 2017 | |||||||||
Net income adjusted for noncontrolling interests | $ | $ | $ | ||||||||
Net (income) loss of taxable REIT subsidiary included above | ( | ) | ( | ) | |||||||
Net income from REIT operations | |||||||||||
Book depreciation and amortization | |||||||||||
Tax depreciation and amortization | ( | ) | ( | ) | ( | ) | |||||
Book/tax difference on gains/losses from capital transactions | ( | ) | |||||||||
Deferred/prepaid/above and below-market rents, net | ( | ) | ( | ) | ( | ) | |||||
Impairment loss from REIT operations | |||||||||||
Other book/tax differences, net | ( | ) | ( | ) | ( | ) | |||||
REIT taxable income | |||||||||||
Dividends paid deduction (1) | ( | ) | ( | ) | ( | ) | |||||
Dividends paid in excess of taxable income | $ | $ | $ | ||||||||
___________________
(1) | For 2019, 2018 and 2017, the dividends paid deduction includes designated dividends of $ |
70
For federal income tax purposes, the cash dividends distributed to common shareholders are characterized as follows:
Year Ended December 31, | ||||||||
2019 | 2018 | 2017 | ||||||
Ordinary income | % | % | % | |||||
Capital gain distributions | % | % | % | |||||
Total | % | % | % | |||||
Our deferred tax assets and liabilities, including a valuation allowance, consisted of the following (in thousands):
December 31, | |||||||
2019 | 2018 | ||||||
Deferred tax assets: | |||||||
Impairment loss (1) | $ | $ | |||||
Net operating loss carryforwards (2) | |||||||
Straight-line rentals | |||||||
Book-tax basis differential | |||||||
Other (4) | |||||||
Total deferred tax assets | |||||||
Valuation allowance (3) | ( | ) | ( | ) | |||
Total deferred tax assets, net of allowance | $ | $ | |||||
Deferred tax liabilities: | |||||||
Book-tax basis differential (1) | $ | $ | |||||
Other | |||||||
Total deferred tax liabilities | $ | $ | |||||
___________________
(1) | Impairment losses and book-tax basis differential liabilities will not be recognized until the related properties are sold. Realization of impairment losses is dependent upon generating sufficient taxable income in the year the property is sold. |
(2) | We have net operating loss carryforwards of $ |
(3) | Management believes it is more likely than not that a portion of the deferred tax assets, which primarily consists of impairment losses and net operating losses, will not be realized and established a valuation allowance. However, the amount of the deferred tax asset considered realizable could be reduced if estimates of future taxable income are reduced. |
(4) | Classification of prior year's amounts were made to conform to the current year presentation. |
We are subject to federal, state and local income taxes and have recorded an income tax provision (benefit) as follows (in thousands):
Year Ended December 31, | |||||||||||
2019 | 2018 | 2017 | |||||||||
Net income (loss) before taxes of taxable REIT subsidiary | $ | $ | $ | ( | ) | ||||||
Federal provision (benefit) (1) | $ | $ | $ | ( | ) | ||||||
Valuation allowance decrease | ( | ) | ( | ) | |||||||
Effect of change in statutory rate on net deferrals | |||||||||||
Other | ( | ) | |||||||||
Federal income tax provision (benefit) of taxable REIT subsidiary (2) | ( | ) | ( | ) | |||||||
State and local taxes, primarily Texas franchise taxes | |||||||||||
Total | $ | $ | $ | ( | ) | ||||||
___________________
(1) | At statutory rate of 21% for both the year ended December 31, 2019 and 2018 and 35% for the year ended December 31, 2017. |
(2) | All periods from December 31, 2016 through December 31, 2019 are open for examination by the IRS. |
71
Also, a current tax obligation of $.7 million and $1.5 million has been recorded at December 31, 2019 and 2018, respectively, in association with these taxes.
Note 12. Supplemental Cash Flow Information
Cash, cash equivalents and restricted cash equivalents consists of the following (in thousands):
December 31, | |||||||||||
2019 | 2018 | 2017 | |||||||||
Cash and cash equivalents | $ | $ | $ | ||||||||
Restricted deposits and escrows (see Note 1) | |||||||||||
Total | $ | $ | $ | ||||||||
Supplemental disclosure of non-cash transactions is summarized as follows (in thousands):
Year Ended December 31, | |||||||||||
2019 | 2018 | 2017 | |||||||||
Accrued property construction costs | $ | $ | $ | ||||||||
Reduction of debt service guaranty liability | ( | ) | ( | ) | ( | ) | |||||
Right-of-use assets exchanged for operating lease liabilities | |||||||||||
Increase in equity associated with deferred compensation plan | |||||||||||
Note 13. Earnings Per Share
Earnings per common share – basic is computed using net income attributable to common shareholders and the weighted average number of shares outstanding – basic. Earnings per common share – diluted includes the effect of potentially dilutive securities. Earnings per common share – basic and diluted components for the periods indicated are as follows (in thousands):
Year Ended December 31, | |||||||||||
2019 | 2018 | 2017 | |||||||||
Numerator: | |||||||||||
Net income | $ | $ | $ | ||||||||
Net income attributable to noncontrolling interests | ( | ) | ( | ) | ( | ) | |||||
Net income attributable to common shareholders – basic | |||||||||||
Income attributable to operating partnership units | |||||||||||
Net income attributable to common shareholders – diluted | $ | $ | $ | ||||||||
Denominator: | |||||||||||
Weighted average shares outstanding – basic | |||||||||||
Effect of dilutive securities: | |||||||||||
Share options and awards | |||||||||||
Operating partnership units | |||||||||||
Weighted average shares outstanding – diluted | |||||||||||
72
Anti-dilutive securities of our common shares, which are excluded from the calculation of earnings per common share – diluted, are as follows (in thousands):
Year Ended December 31, | ||||||||
2019 | 2018 | 2017 | ||||||
Operating partnership units | ||||||||
Total anti-dilutive securities | ||||||||
Note 14. Share Options and Awards
Under our Amended and Restated 2010 Long-Term Incentive Plan (as amended), 4.0 million common shares are reserved for issuance, and options and share awards of 1.0 million are available for future grant at December 31, 2019. This plan expires in April 2028.
Compensation expense, net of forfeitures, associated with share options and restricted shares totaled $8.3 million in 2019, $7.3 million in 2018 and $8.6 million in 2017, of which $.8 million in 2019, $1.1 million in 2018 and $1.7 million in 2017 was capitalized.
Options
The fair value of share options issued prior to 2012 was estimated on the date of grant using the Black-Scholes option pricing method based on the expected weighted average assumptions.
Following is a summary of the option activity for the three years ended December 31, 2019:
Shares Under Option | Weighted Average Exercise Price | |||||
Outstanding, January 1, 2017 | $ | |||||
Forfeited or expired | ( | ) | ||||
Exercised | ( | ) | ||||
Outstanding, December 31, 2017 | ||||||
Forfeited or expired | ( | ) | ||||
Exercised | ( | ) | ||||
Outstanding, December 31, 2018 | ||||||
Forfeited or expired | ( | ) | ||||
Exercised | ( | ) | ||||
Outstanding, December 31, 2019 | $ | |||||
The total intrinsic value of options exercised was $.9 million in 2019, $3.6 million in 2018 and $1.7 million in 2017. All share options were vested, and there was no unrecognized compensation cost related to share options.
The following table summarizes information about share options outstanding and exercisable at December 31, 2019:
Range of Exercise Prices | Outstanding | Exercisable | ||||||||||||||||||||||
Number | Weighted Average Remaining Contractual Life | Weighted Average Exercise Price | Aggregate Intrinsic Value (000’s) | Number | Weighted Average Remaining Contractual Life | Weighted Average Exercise Price | Aggregate Intrinsic Value (000’s) | |||||||||||||||||
$22.68 - $24.87 | $ | $ | ||||||||||||||||||||||
73
Share Awards
The fair value of the market-based share awards was estimated on the date of grant using a Monte Carlo valuation model based on the following assumptions:
Year Ended December 31, 2019 | |||||
Minimum | Maximum | ||||
Dividend yield | % | % | |||
Expected volatility (1) | % | % | |||
Expected life (in years) | N/A | ||||
Risk-free interest rate | % | % | |||
_______________
(1) | Includes the volatility of the FTSE NAREIT U.S. Shopping Center Index and Weingarten Realty Investors. |
A summary of the status of unvested share awards for the year ended December 31, 2019 is as follows:
Unvested Share Awards | Weighted Average Grant Date Fair Value | |||||
Outstanding, January 1, 2019 | $ | |||||
Granted: | ||||||
Service-based awards | ||||||
Market-based awards relative to FTSE NAREIT U.S. Shopping Center Index | ||||||
Market-based awards relative to three-year absolute TSR | ||||||
Trust manager awards | ||||||
Vested | ( | ) | ||||
Forfeited | ( | ) | ||||
Outstanding, December 31, 2019 | $ | |||||
As of December 31, 2019 and 2018, there was approximately $2.1 million and $1.8 million, respectively, of total unrecognized compensation cost related to unvested share awards, which is expected to be amortized over a weighted average of 1.8 years and 1.7 years at December 31, 2019 and 2018, respectively.
74
Note 15. Employee Benefit Plans
Defined Benefit Plan:
The following tables summarize changes in the benefit obligation, the plan assets and the funded status of our pension plan as well as the components of net periodic benefit costs, including key assumptions (in thousands). The measurement dates for plan assets and obligations were December 31, 2019 and 2018.
December 31, | |||||||
2019 | 2018 | ||||||
Change in Projected Benefit Obligation: | |||||||
Benefit obligation at beginning of year | $ | $ | |||||
Service cost | |||||||
Interest cost | |||||||
Actuarial loss (gain) (1) | ( | ) | |||||
Benefit payments | ( | ) | ( | ) | |||
Benefit obligation at end of year | $ | $ | |||||
Change in Plan Assets: | |||||||
Fair value of plan assets at beginning of year | $ | $ | |||||
Actual return on plan assets | ( | ) | |||||
Employer contributions | |||||||
Benefit payments | ( | ) | ( | ) | |||
Fair value of plan assets at end of year | $ | $ | |||||
Unfunded status at end of year (included in accounts payable and accrued expenses in 2019 and 2018) | $ | ( | ) | $ | ( | ) | |
Accumulated benefit obligation | $ | $ | |||||
Net loss recognized in accumulated other comprehensive loss | $ | $ | |||||
(1) | The change in actuarial loss (gain) is attributable primarily to census and mortality table updates and a decrease in the discount rate in 2019. |
The following is the required information for other changes in plan assets and benefit obligation recognized in other comprehensive income (in thousands):
Year Ended December 31, | |||||||||||
2019 | 2018 | 2017 | |||||||||
Net loss | $ | $ | $ | ||||||||
Amortization of net loss (1) | ( | ) | ( | ) | ( | ) | |||||
Total recognized in other comprehensive income | $ | ( | ) | $ | ( | ) | $ | ( | ) | ||
Total recognized in net periodic benefit cost and other comprehensive income | $ | $ | $ | ||||||||
___________________
(1) | The estimated net loss that will be amortized from accumulated other comprehensive loss into net periodic benefit cost over the next fiscal year is $ |
75
The following is the required information with an accumulated benefit obligation in excess of plan assets (in thousands):
December 31, | |||||||
2019 | 2018 | ||||||
Projected benefit obligation | $ | $ | |||||
Accumulated benefit obligation | |||||||
Fair value of plan assets | |||||||
The components of net periodic benefit cost are as follows (in thousands):
Year Ended December 31, | |||||||||||
2019 | 2018 | 2017 | |||||||||
Service cost | $ | $ | $ | ||||||||
Interest cost | |||||||||||
Expected return on plan assets | ( | ) | ( | ) | ( | ) | |||||
Amortization of net loss | |||||||||||
Total | $ | $ | $ | ||||||||
The components of net periodic benefit cost other than the service cost component are included in Interest and Other Income, net in the Consolidated Statements of Operations.
The assumptions used to develop net periodic benefit cost are shown below:
Year Ended December 31, | ||||||||
2019 | 2018 | 2017 | ||||||
Discount rate | % | % | % | |||||
Salary scale increases | % | % | % | |||||
Long-term rate of return on assets | % | % | % | |||||
The selection of the discount rate is made annually after comparison to yields based on high quality fixed-income investments. The salary scale is the composite rate which reflects anticipated inflation, merit increases, and promotions for the group of covered participants. The long-term rate of return is a composite rate for the trust. It is derived as the sum of the percentages invested in each principal asset class included in the portfolio multiplied by their respective expected rates of return. We considered the historical returns and the future expectations for returns for each asset class, as well as the target asset allocation of the pension portfolio. This analysis resulted in the selection of 7.00 % as the long-term rate of return assumption for 2019.
The assumptions used to develop the actuarial present value of the benefit obligation are shown below:
Year Ended December 31, | ||||||||
2019 | 2018 | 2017 | ||||||
Discount rate | % | % | % | |||||
Salary scale increases | % | % | % | |||||
The expected contribution to be paid for the Retirement Plan by us during 2020 is approximately $1.0 million. The expected benefit payments for the next 10 years for the Retirement Plan is as follows (in thousands):
2020 | $ | ||
2021 | |||
2022 | |||
2023 | |||
2024 | |||
2025-2029 | |||
76
The participant data used in determining the liabilities and costs for the Retirement Plan was collected as of January 1, 2019, and no significant changes have occurred through December 31, 2019.
At December 31, 2019, our investment asset allocation compared to our benchmarking allocation model for our plan assets was as follows:
Portfolio | Benchmark | ||||
Cash and Short-Term Investments | % | % | |||
U.S. Stocks | % | % | |||
International Stocks | % | % | |||
U.S. Bonds | % | % | |||
International Bonds | % | % | |||
Other | % | % | |||
Total | % | % | |||
The fair value of plan assets was determined based on publicly quoted market prices for identical assets, which are classified as Level 1 observable inputs. The allocation of the fair value of plan assets was as follows:
December 31, | |||||
2019 | 2018 | ||||
Cash and Short-Term Investments | % | % | |||
Large Company Funds | % | % | |||
Mid Company Funds | % | % | |||
Small Company Funds | % | % | |||
International Funds | % | % | |||
Fixed Income Funds | % | % | |||
Growth Funds | % | % | |||
Total | % | % | |||
Concentrations of risk within our equity portfolio are investments classified within the following sectors: technology, financial services, healthcare, consumer cyclical goods and industrial, which represents approximately 21 %, 17 %, 15 %, 12 % and 11 % of total equity investments, respectively.
Defined Contribution Plans:
Compensation expense related to our defined contribution plans was $3.9 million in 2019, $3.8 million in 2018 and $3.9 million in 2017.
Note 16. Commitments and Contingencies
Commitments and Contingencies
As of December 31, 2019 and 2018, we participated in two real estate ventures structured as DownREIT partnerships. We have operating and financial control over these ventures and consolidate them in our consolidated financial statements. These ventures allow the outside limited partners to put their interest in the partnership to us, and we have the option to redeem the interest in cash or a fixed number of our common shares, at our discretion. We also participate in a real estate venture that has a property in Texas that allows its outside partner to put operating partnership units to us. We have the option to redeem these units in cash or a fixed number of our common shares, at our discretion. The aggregate redemption value of these interests was approximately $45 million and $36 million as of December 31, 2019 and 2018, respectively.
As of December 31, 2019, we have entered into commitments aggregating $98.5 million comprised principally of construction contracts which are generally due in 12 to 36 months.
77
We issue letters of intent signifying a willingness to negotiate for acquisitions, dispositions or joint ventures, as well as other types of potential transactions, during the ordinary course of our business. Such letters of intent and other arrangements are non-binding to all parties unless and until a definitive contract is entered into by the parties. Even if definitive contracts relating to the acquisition or disposition of property are entered into, these contracts generally provide the purchaser a time period to evaluate the property and conduct due diligence. The purchaser, during this time, will have the ability to terminate a contract without penalty or forfeiture of any deposit or earnest money. No assurance can be provided that any definitive contracts will be entered into with respect to any matter covered by letters of intent, or that we will consummate any transaction contemplated by a definitive contract. Additionally, due diligence periods for property transactions are frequently extended as needed. An acquisition or disposition of property becomes probable at the time the due diligence period expires and the definitive contract has not been terminated. Our risk is then generally extended only to any earnest money deposits associated with property acquisition contracts, and our obligation to sell under a property sales contract.
We are subject to numerous federal, state and local environmental laws, ordinances and regulations in the areas where we own or operate properties. We are not aware of any contamination which may have been caused by us or any of our tenants that would have a material effect on our consolidated financial statements.
As part of our risk management activities, we have applied and been accepted into state sponsored environmental programs which will limit our expenses if contaminants need to be remediated. We also have an environmental insurance policy that covers us against third party liabilities and remediation costs.
While we believe that we do not have any material exposure to environmental remediation costs, we cannot give absolute assurance that changes in the law or new discoveries of contamination will not result in additional liabilities to us.
Litigation
We are involved in various matters of litigation arising in the normal course of business. While we are unable to predict the amounts involved, our management and counsel are of the opinion that, when such litigation is resolved, any additional liability, if any, will not have a material effect on our consolidated financial statements.
Note 17. Variable Interest Entities
Consolidated VIEs:
At December 31, 2019 and 2018, eight and nine of our real estate joint ventures, respectively, whose activities primarily consisted of owning and operating 21 neighborhood/community shopping centers, were determined to be VIEs. Based on a financing agreement by one of our real estate joint ventures that has a bottom dollar guaranty, which is disproportionate to our ownership, we have determined that we are the primary beneficiary and have consolidated this joint venture. For the remaining real estate joint ventures, we concluded we are the primary beneficiary based primarily on our significant power to direct the entities' activities without any substantive kick-out or participating rights.
A summary of our consolidated VIEs is as follows (in thousands):
December 31, | |||||||
2019 | 2018 | ||||||
Assets Held by VIEs | $ | $ | |||||
Assets Held as Collateral for Debt (1) | |||||||
Maximum Risk of Loss (1) | |||||||
___________________
(1) | Represents the amount of debt and related assets held as collateral associated with the bottom dollar guaranty at |
Restrictions on the use of these assets can be significant because they may serve as collateral for debt. Further, we are generally required to obtain our partner's approval in accordance with the joint venture agreement for any major transactions. Transactions with these joint ventures in our consolidated financial statements have primarily been positive as demonstrated by the generation of net income and operating cash flows, as well as the receipt of cash distributions. We and our partners are subject to the provisions of the joint venture agreements which include provisions for when additional contributions may be required to fund operating cash shortfalls, development expenditures and unplanned capital expenditures.
78
Unconsolidated VIEs:
At both December 31, 2019 and 2018, two unconsolidated real estate joint ventures were determined to be VIEs. We have determined that one entity was a VIE through the issuance of a secured loan, since the lender had the ability to make decisions that could have a significant impact on the success of the entity. Based on the associated agreements for the future development of a mixed-use project, we concluded that the other entity was a VIE, but we are not the primary beneficiary as the substantive participating rights associated with the entity are shared, and we do not have the power to direct the significant activities of the entity. Our analysis considered that all major decisions require unanimous member consent and those decisions include significant activities such as development, financing, leasing and operations of the entity.
A summary of our unconsolidated VIEs is as follows (in thousands):
December 31, | |||||||
2019 | 2018 | ||||||
Investment in Real Estate Joint Ventures and Partnerships, net (1) | $ | $ | |||||
Other Liabilities, net (2) | |||||||
Maximum Risk of Loss (3) | |||||||
___________________
(1) | The carrying amount of the investment represents our contributions to a real estate joint venture, net of any distributions made and our portion of the equity in earnings of the real estate joint venture. The increase between the periods represents new development funding of a mixed-use project. |
(2) | Includes the carrying amount of an investment where distributions have exceeded our contributions and our portion of the equity in earnings for a real estate joint venture. |
(3) | The maximum risk of loss has been determined to be limited to our debt exposure for the real estate joint ventures. Additionally, our investment, including contributions and distributions, associated with a mixed-use project is disclosed in (1) above. |
We and our partners are subject to the provisions of the joint venture agreements that specify conditions, including operating shortfalls, development expenditures and unplanned capital expenditures, under which additional contributions may be required. With respect to our future development of a mixed-use project, we anticipate funding of approximately $9 million through 2020.
Note 18. Fair Value Measurements
Recurring Fair Value Measurements:
Assets and liabilities measured at fair value on a recurring basis as of December 31, 2019 and 2018, aggregated by the level in the fair value hierarchy in which those measurements fall, are as follows (in thousands):
Quoted Prices in Active Markets for Identical Assets and Liabilities (Level 1) | Significant Other Observable Inputs (Level 2) | Significant Unobservable Inputs (Level 3) | Fair Value at December 31, 2019 | ||||||||||||
Assets: | |||||||||||||||
Cash equivalents, primarily money market funds (1) | $ | $ | |||||||||||||
Restricted cash, primarily money market funds (1) | |||||||||||||||
Investments, mutual funds held in a grantor trust (1) | |||||||||||||||
Total | $ | $ | $ | $ | |||||||||||
Liabilities: | |||||||||||||||
Deferred compensation plan obligations | $ | $ | |||||||||||||
Total | $ | $ | $ | $ | |||||||||||
___________________
(1) | For the year ended December 31, 2019, a net gain of $ |
79
Quoted Prices in Active Markets for Identical Assets and Liabilities (Level 1) | Significant Other Observable Inputs (Level 2) | Significant Unobservable Inputs (Level 3) | Fair Value at December 31, 2018 | ||||||||||||
Assets: | |||||||||||||||
Cash equivalents, primarily money market funds (1) | $ | $ | |||||||||||||
Restricted cash, primarily money market funds (1) | |||||||||||||||
Investments, mutual funds held in a grantor trust (1) | |||||||||||||||
Investments, mutual funds (1) | |||||||||||||||
Total | $ | $ | $ | $ | |||||||||||
Liabilities: | |||||||||||||||
Deferred compensation plan obligations | $ | $ | |||||||||||||
Total | $ | $ | $ | $ | |||||||||||
___________________
(1) | For the year ended December 31, 2018, a net gain of $ |
Nonrecurring Fair Value Measurements:
Investment in Real Estate Joint Ventures and Partnerships Impairments
Estimated fair values are determined by management utilizing the performance of each investment, the life and other terms of the investment, holding periods, market conditions, cash flow models, market capitalization rates and market discount rates, or by obtaining third-party broker valuation estimates, appraisals, bona fide purchase offers or the expected sales price of an executed sales agreement in accordance with our fair value measurements accounting policy. Market capitalization rates and market discount rates are determined by reviewing current sales of similar properties and transactions, and utilizing management’s knowledge and expertise in property marketing.
Quoted Prices in Active Markets for Identical Assets and Liabilities (Level 1) | Significant Other Observable Inputs (Level 2) | Significant Unobservable Inputs (Level 3) | Fair Value | Total Gains (Losses) (1) | |||||||||||||||
Investment in real estate joint ventures and partnerships (2) | $ | $ | $ | $ | ( | ) | |||||||||||||
Total | $ | $ | $ | $ | $ | ( | ) | ||||||||||||
____________
(1) | Total gains (losses) presented in this table relate to assets that are still held by us at December 31, 2019. |
(2) | In accordance with our policy of evaluating and recording impairments on the disposal of investments in real estate joint ventures and partnerships, investments with a carrying amount of $ |
80
Fair Value Disclosures:
Unless otherwise listed below, short-term financial instruments and receivables are carried at amounts which approximate their fair values based on their highly-liquid nature, short-term maturities and/or expected interest rates for similar instruments.
Schedule of our fair value disclosures is as follows (in thousands):
December 31, | |||||||||||||||||||||||
2019 | 2018 | ||||||||||||||||||||||
Carrying Value | Fair Value Using Significant Other Observable Inputs (Level 2) | Fair Value Using Significant Unobservable Inputs (Level 3) | Carrying Value | Fair Value Using Significant Other Observable Inputs (Level 2) | Fair Value Using Significant Unobservable Inputs (Level 3) | ||||||||||||||||||
Other Assets: | |||||||||||||||||||||||
Tax increment revenue bonds (1) | $ | $ | $ | $ | |||||||||||||||||||
Investments, held to maturity (2) | — | $ | — | $ | |||||||||||||||||||
Debt: | |||||||||||||||||||||||
Fixed-rate debt | |||||||||||||||||||||||
Variable-rate debt | |||||||||||||||||||||||
___________________
(1) | At December 31, 2019 and 2018, the credit loss balance on our tax increment revenue bonds was $ |
(2) | Investments held to maturity are recorded at cost. As of December 31, 2018, these investments had unrealized losses of $ |
The quantitative information about the significant unobservable inputs used for our nonrecurring Level 3 fair value measurements as of December 31, 2019 reported in the above table, is as follows:
Fair Value at December 31, | Range | |||||||||||||
2019 | Minimum | Maximum | ||||||||||||
Description | (in thousands) | Valuation Technique | Unobservable Inputs | 2019 | 2019 | |||||||||
Investment in real estate joint ventures and partnerships | $ | Discounted cash flows | Discount rate | % | % | |||||||||
Capitalization rate | % | % | ||||||||||||
Noncontrolling interest discount | % | |||||||||||||
81
Note 19. Quarterly Financial Data (Unaudited)
Summarized quarterly financial data is as follows (in thousands):
First | Second | Third | Fourth | |||||||||||||
2019 | ||||||||||||||||
Revenues | $ | (1) | $ | (1) | $ | (1) | $ | (1) | ||||||||
Net income | (2) | (2) | (2) | (2)(3) | ||||||||||||
Net income attributable to common shareholders | (2) | (2) | (2) | (2)(3) | ||||||||||||
Earnings per common share – basic | (2) | (2) | (2) | (2)(3) | ||||||||||||
Earnings per common share – diluted | (2) | (2) | (2) | (2)(3) | ||||||||||||
2018 | ||||||||||||||||
Revenues | $ | (1) | $ | (1) | $ | (1) | $ | (1) | ||||||||
Net income | (2)(4) | (1)(2)(3) | (2)(3) | (2)(3) | ||||||||||||
Net income attributable to common shareholders | (2)(4)(5) | (1)(2)(3) | (2)(3)(5) | (2)(3)(5) | ||||||||||||
Earnings per common share – basic | (2)(4)(5) | (1)(2)(3) | (2)(3)(5) | (2)(3)(5) | ||||||||||||
Earnings per common share – diluted | (2)(4)(5) | (1)(2)(3) | (2)(3)(5) | (2)(3)(5) | ||||||||||||
___________________
(1) | The quarter results include revenues associated with dispositions and acquisitions. Revenue amounts associated with dispositions are: $ |
(2) | The quarter results include significant gains on the sale of property and investments, including gains in equity in earnings from real estate joint ventures and partnerships, net. Gain amounts are: $ |
(3) | The quarter results include $ |
(4) | The quarter results include a gain on extinguishment of debt including related swap activity totaling $ |
(5) | Associated primarily with the gains discussed in (2) above, amounts in net income attributable to noncontrolling interests are: $ |
* * * * *
82
ITEM 9. Changes in and Disagreements with Accountants on Accounting and Financial Disclosure
Not applicable.
ITEM 9A. Controls and Procedures
Under the supervision and with the participation of our principal executive officer and principal financial officer, management has evaluated the effectiveness of the design and operation of our disclosure controls and procedures (as defined in Rule 13a-15(e) and 15d-15(e) of the Securities Exchange Act of 1934) as of December 31, 2019. Based on that evaluation, our principal executive officer and our principal financial officer have concluded that our disclosure controls and procedures were effective as of December 31, 2019.
There has been no change to our internal control over financial reporting during the quarter ended December 31, 2019 that has materially affected, or is reasonably likely to materially affect, our internal control over financial reporting.
MANAGEMENT’S ANNUAL REPORT ON INTERNAL CONTROL OVER FINANCIAL REPORTING
Weingarten Realty Investors and its subsidiaries (“WRI”) maintain a system of internal control over financial reporting, as defined in Rules 13a-15(f) and 15d-15(f) under the Securities Exchange Act, which is a process designed under the supervision of WRI’s principal executive officer and principal financial officer and effected by WRI’s Board of Trust Managers, management and other personnel, to provide reasonable assurance regarding the reliability of financial reporting and the preparation of financial statements for external purposes in accordance with generally accepted accounting principles.
WRI’s internal control over financial reporting includes those policies and procedures that:
• | Pertain to the maintenance of records that in reasonable detail accurately and fairly reflect the transactions and dispositions of WRI’s assets; |
• | Provide reasonable assurance that transactions are recorded as necessary to permit preparation of financial statements in accordance with generally accepted accounting principles, and that receipts and expenditures of WRI are being made only in accordance with authorizations of management and trust managers of WRI; and |
• | Provide reasonable assurance regarding prevention or timely detection of unauthorized acquisition, use or disposition of WRI’s assets that could have a material effect on the financial statements. |
WRI’s management has responsibility for establishing and maintaining adequate internal control over financial reporting for WRI. Management, with the participation of WRI’s Chief Executive Officer and Chief Financial Officer, conducted an evaluation of the effectiveness of WRI’s internal control over financial reporting as of December 31, 2019 based on the framework in Internal Control—Integrated Framework (2013) issued by the Committee of Sponsoring Organizations of the Treadway Commission.
Based on their evaluation of WRI’s internal control over financial reporting, WRI’s management along with the Chief Executive Officer and Chief Financial Officer believe that WRI’s internal control over financial reporting is effective as of December 31, 2019.
Deloitte & Touche LLP, WRI’s independent registered public accounting firm that audited the consolidated financial statements and financial statement schedules included in this Form 10-K, has issued an attestation report on the effectiveness of WRI’s internal control over financial reporting.
February 27, 2020
83
REPORT OF INDEPENDENT REGISTERED PUBLIC ACCOUNTING FIRM
To the Shareholders and the Board of Trust Managers of Weingarten Realty Investors
Opinion on Internal Control over Financial Reporting
We have audited the internal control over financial reporting of Weingarten Realty Investors and subsidiaries (the “Company”) as of December 31, 2019, based on criteria established in Internal Control - Integrated Framework (2013) issued by the Committee of Sponsoring Organizations of the Treadway Commission (COSO). In our opinion, the Company maintained, in all material respects, effective internal control over financial reporting as of December 31, 2019, based on criteria established in Internal Control - Integrated Framework (2013) issued by COSO.
We have also audited, in accordance with the standards of the Public Company Accounting Oversight Board (United States) (PCAOB), the consolidated financial statements and financial statement schedules as of and for the year ended December 31, 2019, of the Company and our report dated February 27, 2020, expressed an unqualified opinion on those financial statements and financial statement schedules.
Basis for Opinion
The Company’s management is responsible for maintaining effective internal control over financial reporting and for its assessment of the effectiveness of internal control over financial reporting, included in the accompanying Management's Annual Report On Internal Control Over Financial Reporting. Our responsibility is to express an opinion on the Company’s internal control over financial reporting based on our audit. We are a public accounting firm registered with the PCAOB and are required to be independent with respect to the Company in accordance with the U.S. federal securities laws and the applicable rules and regulations of the Securities and Exchange Commission and the PCAOB.
We conducted our audit in accordance with the standards of the PCAOB. Those standards require that we plan and perform the audit to obtain reasonable assurance about whether effective internal control over financial reporting was maintained in all material respects. Our audit included obtaining an understanding of internal control over financial reporting, assessing the risk that a material weakness exists, testing and evaluating the design and operating effectiveness of internal control based on the assessed risk, and performing such other procedures as we considered necessary in the circumstances. We believe that our audit provides a reasonable basis for our opinion.
Definition and Limitations of Internal Control over Financial Reporting
A company’s internal control over financial reporting is a process designed to provide reasonable assurance regarding the reliability of financial reporting and the preparation of financial statements for external purposes in accordance with generally accepted accounting principles. A company’s internal control over financial reporting includes those policies and procedures that (1) pertain to the maintenance of records that, in reasonable detail, accurately and fairly reflect the transactions and dispositions of the assets of the company; (2) provide reasonable assurance that transactions are recorded as necessary to permit preparation of financial statements in accordance with generally accepted accounting principles, and that receipts and expenditures of the company are being made only in accordance with authorizations of management and directors of the company; and (3) provide reasonable assurance regarding prevention or timely detection of unauthorized acquisition, use, or disposition of the company’s assets that could have a material effect on the financial statements.
Because of its inherent limitations, internal control over financial reporting may not prevent or detect misstatements. Also, projections of any evaluation of effectiveness to future periods are subject to the risk that controls may become inadequate because of changes in conditions, or that the degree of compliance with the policies or procedures may deteriorate.
/s/ Deloitte & Touche LLP
Houston, Texas
February 27, 2020
84
ITEM 9B. Other Information
Not applicable.
PART III
ITEM 10. Trust Managers, Executive Officers and Corporate Governance
Information with respect to our trust managers and executive officers is incorporated herein by reference to the “Election of Trust Managers - Proposal One," “Compensation Discussion and Analysis - Overview” and “Share Ownership of Beneficial Owners and Management” sections of our definitive Proxy Statement for the Annual Meeting of Shareholders to be held April 29, 2020.
Code of Conduct and Ethics
We have adopted a code of business and ethics for trust managers, officers and employees, known as the Code of Conduct and Ethics. The Code of Conduct and Ethics is available on our website at www.weingarten.com. Shareholders may request a free copy of the Code of Conduct and Ethics from:
Weingarten Realty Investors
Attention: Investor Relations
2600 Citadel Plaza Drive, Suite 125
Houston, Texas 77008
(713) 866-6000
www.weingarten.com
We have also adopted a Code of Ethical Conduct for Officers and Senior Financial Associates setting forth a code of ethics applicable to our principal executive officer, principal financial officer, chief accounting officer and financial associates, which is available on our website at www.weingarten.com. Shareholders may request a free copy of the Code of Conduct for Officers and Senior Financial Associates from the address and phone number set forth above.
Governance Guidelines
We have adopted governance guidelines, known as the Governance Policies, which are available on our website at www.weingarten.com. Shareholders may request a free copy of the Governance Policies from the address and phone number set forth above under “Code of Conduct and Ethics.”
ITEM 11. Executive Compensation
Information with respect to executive compensation is incorporated herein by reference to the “Compensation Discussion and Analysis,” “Trust Manager Compensation” including the "Trust Manager Compensation Table” section, “Compensation Committee Report” and “Summary Compensation Table” sections of our definitive Proxy Statement for the Annual Meeting of Shareholders to be held April 29, 2020.
ITEM 12. Security Ownership of Certain Beneficial Owners and Management and Related Shareholder Matters
The “Share Ownership of Beneficial Owners and Management” section of our definitive Proxy Statement for the Annual Meeting of Shareholders to be held April 29, 2020 is incorporated herein by reference.
85
The following table summarizes the equity compensation plans under which our common shares of beneficial interest may be issued as of December 31, 2019:
Plan category | Number of shares to be issued upon exercise of outstanding options, warrants and rights | Weighted average exercise price of outstanding options, warrants and rights | Number of shares remaining available for future issuance under equity compensation plans | |||
Equity compensation plans approved by shareholders | 207,416 | $23.84 | 952,877 | |||
Equity compensation plans not approved by shareholders | — | — | — | |||
Total | 207,416 | $23.84 | 952,877 | |||
ITEM 13. Certain Relationships and Related Transactions, and Trust Manager Independence
The “Governance,” "Compensation Committee Interlocks and Insider Participation” and "Certain Transactions" sections of our definitive Proxy Statement for the Annual Meeting of Shareholders to be held April 29, 2020 are incorporated herein by reference.
ITEM 14. Principal Accountant Fees and Services
The “Accounting Firm Fees” section within “Ratification of Independent Registered Public Accounting Firm - Proposal Two” of our definitive Proxy Statement for the Annual Meeting of Shareholders to be held April 29, 2020 is incorporated herein by reference.
PART IV
ITEM 15. Exhibits and Financial Statement Schedules
(a) | Financial Statements and Financial Statement Schedules: | |
— | Weingarten Realty Investors 2019 financial statements and financial statement schedules, together with the reports of Deloitte & Touche LLP, are listed in the index immediately preceding the financial statements in Item 8, Financial Statements and Supplementary Data. | |
(b) | Exhibits: | |
3.1 | — | |
3.2 | — | |
3.3 | — | |
3.4 | — | |
3.5 | — | |
3.6 | — | |
3.7 | — | |
3.8 | — | |
3.9 | — | |
86
3.10 | — | |
4.1 | — | |
4.2 | — | |
4.3 | — | |
4.4 | — | |
4.5 | — | |
4.6 | — | |
4.7 | — | |
4.8 | — | |
4.9 | — | |
4.10 | — | |
4.11 | — | |
4.12 | — | |
4.13 | — | |
10.1† | — | |
10.2† | — | |
10.3† | — | |
10.4† | — | |
10.5† | — | |
10.6† | — | |
10.7† | — | |
10.8† | — | |
87
10.9† | — | |
10.10† | — | |
10.11† | — | |
10.12† | — | |
10.13† | — | |
10.14† | — | |
10.15† | — | |
10.16† | — | |
10.17† | — | |
10.18† | — | |
10.19† | — | |
10.20† | — | |
10.21† | — | |
10.22† | — | |
10.23† | — | |
10.24† | — | |
10.25† | — | |
10.26† | — | |
10.27† | — | |
10.28† | — | |
88
10.29† | — | |
10.30† | — | |
10.31† | — | |
10.32† | — | |
10.33 | — | |
10.34 | — | |
10.35 | — | |
10.36 | — | |
10.37 | — | |
10.38 | — | |
10.39 | — | |
10.40 | — | |
10.41 | — | |
10.42 | — | |
89
10.43 | — | |
10.44 | — | |
10.45 | — | |
21.1* | — | |
23.1* | — | |
31.1* | — | |
31.2* | — | |
32.1** | — | |
32.2** | — | |
101.INS** | — | XBRL Instance Document - the instance document does not appear in the Interactive Data File because its XBRL tags are embedded within the Inline XBRL document |
101.SCH** | — | XBRL Taxonomy Extension Schema Document |
101.CAL** | — | XBRL Taxonomy Extension Calculation Linkbase Document |
101.DEF** | — | XBRL Taxonomy Extension Definition Linkbase Document |
101.LAB** | — | XBRL Taxonomy Extension Labels Linkbase Document |
101.PRE** | — | XBRL Taxonomy Extension Presentation Linkbase Document |
* | Filed with this report. | |
** | Furnished with this report. | |
† | Management contract or compensation plan or arrangement. | |
90
SIGNATURES
Pursuant to the requirements of Section 13 or 15(d) of the Securities and Exchange Act of 1934, the registrant has duly caused this report to be signed on its behalf by the undersigned, thereunto duly authorized.
WEINGARTEN REALTY INVESTORS | ||
By: | /s/ Andrew M. Alexander | |
Andrew M. Alexander | ||
Chairman/President/Chief Executive Officer | ||
Date: February 27, 2020
POWER OF ATTORNEY
KNOW ALL MEN BY THESE PRESENTS that each of Weingarten Realty Investors, a real estate investment trust organized under the Texas Business Organizations Code, and the undersigned trust managers and officers of Weingarten Realty Investors hereby constitute and appoint Andrew M. Alexander, Stanford Alexander, Stephen C. Richter and Joe D. Shafer or any one of them, its or his true and lawful attorney-in-fact and agent, for it or him and in its or his name, place and stead, in any and all capacities, with full power to act alone, to sign any and all amendments to this report, and to file each such amendment to the report, with all exhibits thereto, and any and all other documents in connection therewith, with the Securities and Exchange Commission, hereby granting unto said attorney-in-fact and agent full power and authority to do and perform any and all acts and things requisite and necessary to be done in and about the premises as fully to all intents and purposes as it or he might or could do in person, hereby ratifying and confirming all that said attorney-in-fact and agent may lawfully do or cause to be done by virtue hereof.
91
Pursuant to the requirement of the Securities and Exchange Act of 1934, this report has been signed below by the following persons on behalf of the registrant and in the capacities and on the dates indicated:
Signature | Title | Date | |
By: | /s/ Andrew M. Alexander | Chairman/President/Chief Executive Officer and Trust Manager (Principal Executive Officer) | February 27, 2020 |
Andrew M. Alexander | |||
By: | /s/ Stanford J. Alexander | Chairman Emeritus and Trust Manager | February 27, 2020 |
Stanford J. Alexander | |||
By: | /s/ Shelaghmichael C. Brown | Trust Manager | February 27, 2020 |
Shelaghmichael C. Brown | |||
By: | /s/ Stephen A. Lasher | Trust Manager | February 27, 2020 |
Stephen A. Lasher | |||
By: | /s/ Stephen C. Richter | Executive Vice President and Chief Financial Officer (Principal Financial Officer) | February 27, 2020 |
Stephen C. Richter | |||
By: | /s/ Thomas L. Ryan | Trust Manager | February 27, 2020 |
Thomas L. Ryan | |||
By: | /s/ Douglas W. Schnitzer | Trust Manager | February 27, 2020 |
Douglas W. Schnitzer | |||
By: | /s/ Joe D. Shafer | Senior Vice President/Chief Accounting Officer (Principal Accounting Officer) | February 27, 2020 |
Joe D. Shafer | |||
By: | /s/ C. Park Shaper | Trust Manager | February 27, 2020 |
C. Park Shaper | |||
By: | /s/ Marc J. Shapiro | Trust Manager | February 27, 2020 |
Marc J. Shapiro | |||
92
Schedule II
WEINGARTEN REALTY INVESTORS
VALUATION AND QUALIFYING ACCOUNTS
December 31, 2019, 2018, and 2017
(Amounts in thousands)
Description | Balance at beginning of period | Charged to costs and expenses | Deductions (1) | Balance at end of period | ||||||||||||
2019 | ||||||||||||||||
Tax Valuation Allowance | $ | $ | $ | $ | ||||||||||||
2018 | ||||||||||||||||
Allowance for Doubtful Accounts (2) | $ | $ | $ | $ | ||||||||||||
Tax Valuation Allowance | ||||||||||||||||
2017 | ||||||||||||||||
Allowance for Doubtful Accounts | $ | $ | $ | $ | ||||||||||||
Tax Valuation Allowance | ||||||||||||||||
___________________
(1) | The tax valuation allowance deductions for the year ended 2017 represents the effect of the change in the statutory tax rate as a result of the enactment of the Tax Act on December 22, 2017. For other periods presented, deductions included write-offs of amounts previously reserved. |
(2) |
93
WEINGARTEN REALTY INVESTORS
REAL ESTATE AND ACCUMULATED DEPRECIATION
DECEMBER 31, 2019
(Amounts in thousands)
Initial Cost to Company | Gross Amounts Carried at Close of Period | |||||||||||||||||||||||||||||||||||||
Description | Land | Building and Improvements | Cost Capitalized Subsequent to Acquisition | Land | Building and Improvements | Total (1) | Accumulated Depreciation | Total Costs, Net of Accumulated Depreciation | Encumbrances (2) | Date of Acquisition / Construction | ||||||||||||||||||||||||||||
Centers: | ||||||||||||||||||||||||||||||||||||||
10-Federal Shopping Center | $ | $ | $ | $ | $ | $ | $ | ( | ) | $ | $ | ( | ) | |||||||||||||||||||||||||
580 Market Place | ( | ) | ||||||||||||||||||||||||||||||||||||
8000 Sunset Strip Shopping Center | ( | ) | ||||||||||||||||||||||||||||||||||||
Alabama Shepherd Shopping Center | ( | ) | ||||||||||||||||||||||||||||||||||||
Argyle Village Shopping Center | ( | ) | ||||||||||||||||||||||||||||||||||||
Avent Ferry Shopping Center | ( | ) | ||||||||||||||||||||||||||||||||||||
Baybrook Gateway | ( | ) | ||||||||||||||||||||||||||||||||||||
Bellaire Blvd. Shopping Center | ( | ) | ||||||||||||||||||||||||||||||||||||
Blalock Market at I-10 | ( | ) | ||||||||||||||||||||||||||||||||||||
Boca Lyons Plaza | ( | ) | ||||||||||||||||||||||||||||||||||||
Broadway Marketplace | ( | ) | ||||||||||||||||||||||||||||||||||||
Brownsville Commons | ( | ) | ||||||||||||||||||||||||||||||||||||
Bull City Market | ( | ) | ||||||||||||||||||||||||||||||||||||
Cambrian Park Plaza | ( | ) | ||||||||||||||||||||||||||||||||||||
Camelback Miller Plaza | ( | ) | ||||||||||||||||||||||||||||||||||||
Camelback Village Square | ( | ) | ||||||||||||||||||||||||||||||||||||
Camp Creek Marketplace II | ( | ) | ||||||||||||||||||||||||||||||||||||
Capital Square | ( | ) | ||||||||||||||||||||||||||||||||||||
Centerwood Plaza | ( | ) | ||||||||||||||||||||||||||||||||||||
Charleston Commons Shopping Center | ( | ) | ||||||||||||||||||||||||||||||||||||
Chino Hills Marketplace | ( | ) | ||||||||||||||||||||||||||||||||||||
Citadel Building | ( | ) | ||||||||||||||||||||||||||||||||||||
College Park Shopping Center | ( | ) | ( | ) | ||||||||||||||||||||||||||||||||||
Colonial Plaza | ( | ) | ||||||||||||||||||||||||||||||||||||
Countryside Centre | ( | ) | ||||||||||||||||||||||||||||||||||||
Covington Esplanade | ( | ) | ||||||||||||||||||||||||||||||||||||
Crossing At Stonegate | ( | ) | ( | ) | ||||||||||||||||||||||||||||||||||
94
Initial Cost to Company | Gross Amounts Carried at Close of Period | |||||||||||||||||||||||||||||||||||||
Description | Land | Building and Improvements | Cost Capitalized Subsequent to Acquisition | Land | Building and Improvements | Total (1) | Accumulated Depreciation | Total Costs, Net of Accumulated Depreciation | Encumbrances (2) | Date of Acquisition / Construction | ||||||||||||||||||||||||||||
Deerfield Mall | $ | $ | $ | $ | $ | $ | $ | ( | ) | $ | $ | |||||||||||||||||||||||||||
Desert Village Shopping Center | ( | ) | ||||||||||||||||||||||||||||||||||||
Edgewater Marketplace | ( | ) | ||||||||||||||||||||||||||||||||||||
El Camino Promenade | ( | ) | ||||||||||||||||||||||||||||||||||||
Embassy Lakes Shopping Center | ( | ) | ||||||||||||||||||||||||||||||||||||
Entrada de Oro Plaza Shopping Center | ( | ) | ||||||||||||||||||||||||||||||||||||
Epic Village St. Augustine | ( | ) | ||||||||||||||||||||||||||||||||||||
Falls Pointe Shopping Center | ( | ) | ||||||||||||||||||||||||||||||||||||
Festival on Jefferson Court | ( | ) | ||||||||||||||||||||||||||||||||||||
Fiesta Trails | ( | ) | ||||||||||||||||||||||||||||||||||||
Fountain Plaza | ( | ) | ||||||||||||||||||||||||||||||||||||
Francisco Center | ( | ) | ( | ) | ||||||||||||||||||||||||||||||||||
Freedom Centre | ( | ) | ||||||||||||||||||||||||||||||||||||
Galleria Shopping Center | ( | ) | ||||||||||||||||||||||||||||||||||||
Galveston Place | ( | ) | ||||||||||||||||||||||||||||||||||||
Gateway Plaza | ( | ) | ( | ) | ||||||||||||||||||||||||||||||||||
Grayson Commons | ( | ) | ( | ) | ||||||||||||||||||||||||||||||||||
Greenhouse Marketplace | ( | ) | ||||||||||||||||||||||||||||||||||||
Griggs Road Shopping Center | ( | ) | ||||||||||||||||||||||||||||||||||||
Harrisburg Plaza | ( | ) | ( | ) | ||||||||||||||||||||||||||||||||||
HEB - Dairy Ashford & Memorial | ( | ) | ||||||||||||||||||||||||||||||||||||
Heights Plaza Shopping Center | ( | ) | ||||||||||||||||||||||||||||||||||||
High House Crossing | ( | ) | ||||||||||||||||||||||||||||||||||||
Highland Square | ( | ) | ||||||||||||||||||||||||||||||||||||
Hilltop Village Center | ( | ) | ||||||||||||||||||||||||||||||||||||
Hope Valley Commons | ( | ) | ||||||||||||||||||||||||||||||||||||
I45/Telephone Rd. | ( | ) | ( | ) | ||||||||||||||||||||||||||||||||||
Independence Plaza I & II | ( | ) | ( | ) | ||||||||||||||||||||||||||||||||||
Lakeside Marketplace | ( | ) | ||||||||||||||||||||||||||||||||||||
Largo Mall | ( | ) | ||||||||||||||||||||||||||||||||||||
League City Plaza | ( | ) | ||||||||||||||||||||||||||||||||||||
Leesville Towne Centre | ( | ) | ||||||||||||||||||||||||||||||||||||
Lowry Town Center | ( | ) | ||||||||||||||||||||||||||||||||||||
95
Initial Cost to Company | Gross Amounts Carried at Close of Period | |||||||||||||||||||||||||||||||||||||
Description | Land | Building and Improvements | Cost Capitalized Subsequent to Acquisition | Land | Building and Improvements | Total (1) | Accumulated Depreciation | Total Costs, Net of Accumulated Depreciation | Encumbrances (2) | Date of Acquisition / Construction | ||||||||||||||||||||||||||||
Madera Village Shopping Center | $ | $ | $ | $ | $ | $ | $ | ( | ) | $ | $ | |||||||||||||||||||||||||||
Madison Village Marketplace | ( | ) | ||||||||||||||||||||||||||||||||||||
Market at Westchase Shopping Center | ( | ) | ||||||||||||||||||||||||||||||||||||
Mendenhall Commons | ( | ) | ||||||||||||||||||||||||||||||||||||
Monte Vista Village Center | ( | ) | ||||||||||||||||||||||||||||||||||||
Mueller Regional Retail Center | ( | ) | ||||||||||||||||||||||||||||||||||||
North Creek Plaza | ( | ) | ||||||||||||||||||||||||||||||||||||
North Towne Plaza | ( | ) | ||||||||||||||||||||||||||||||||||||
North Towne Plaza | ( | ) | ( | ) | ||||||||||||||||||||||||||||||||||
Northwoods Shopping Center | ( | ) | ||||||||||||||||||||||||||||||||||||
Oak Forest Shopping Center | ( | ) | ||||||||||||||||||||||||||||||||||||
Oracle Wetmore Shopping Center | ( | ) | ||||||||||||||||||||||||||||||||||||
Overton Park Plaza | ( | ) | ||||||||||||||||||||||||||||||||||||
Parliament Square II | ( | ) | ||||||||||||||||||||||||||||||||||||
Perimeter Village | ( | ) | ( | ) | ||||||||||||||||||||||||||||||||||
Phillips Crossing | ( | ) | ||||||||||||||||||||||||||||||||||||
Phoenix Office Building | ( | ) | ||||||||||||||||||||||||||||||||||||
Pike Center | ( | ) | ||||||||||||||||||||||||||||||||||||
Plantation Centre | ( | ) | ||||||||||||||||||||||||||||||||||||
Pueblo Anozira Shopping Center | ( | ) | ( | ) | ||||||||||||||||||||||||||||||||||
Raintree Ranch Center | ( | ) | ||||||||||||||||||||||||||||||||||||
Rancho San Marcos Village | ( | ) | ||||||||||||||||||||||||||||||||||||
Rancho Towne and Country | ( | ) | ||||||||||||||||||||||||||||||||||||
Randalls Center/Kings Crossing | ( | ) | ||||||||||||||||||||||||||||||||||||
Red Mountain Gateway | ( | ) | ||||||||||||||||||||||||||||||||||||
Richmond Square | ( | ) | ||||||||||||||||||||||||||||||||||||
Ridgeway Trace | ( | ) | ||||||||||||||||||||||||||||||||||||
River Oaks Shopping Center - East | ( | ) | ||||||||||||||||||||||||||||||||||||
River Oaks Shopping Center - West | ( | ) | ||||||||||||||||||||||||||||||||||||
River Point at Sheridan | ( | ) | ||||||||||||||||||||||||||||||||||||
Roswell Corners | ( | ) | ||||||||||||||||||||||||||||||||||||
Roswell Crossing Shopping Center | ( | ) | ||||||||||||||||||||||||||||||||||||
96
Initial Cost to Company | Gross Amounts Carried at Close of Period | |||||||||||||||||||||||||||||||||||||
Description | Land | Building and Improvements | Cost Capitalized Subsequent to Acquisition | Land | Building and Improvements | Total (1) | Accumulated Depreciation | Total Costs, Net of Accumulated Depreciation | Encumbrances (2) | Date of Acquisition / Construction | ||||||||||||||||||||||||||||
San Marcos Plaza | $ | $ | $ | $ | $ | $ | $ | ( | ) | $ | $ | |||||||||||||||||||||||||||
Scottsdale Horizon | ( | ) | ||||||||||||||||||||||||||||||||||||
Scottsdale Waterfront | ( | ) | ||||||||||||||||||||||||||||||||||||
Sea Ranch Centre | ( | ) | ||||||||||||||||||||||||||||||||||||
Shoppes at Bears Path | ( | ) | ||||||||||||||||||||||||||||||||||||
Shoppes at Memorial Villages | ( | ) | ||||||||||||||||||||||||||||||||||||
Shoppes of South Semoran | ( | ) | ( | ) | ||||||||||||||||||||||||||||||||||
Shops at Kirby Drive | ( | ) | ||||||||||||||||||||||||||||||||||||
Shops at Three Corners | ( | ) | ||||||||||||||||||||||||||||||||||||
Silver Creek Plaza | ( | ) | ||||||||||||||||||||||||||||||||||||
Six Forks Shopping Center | ( | ) | ||||||||||||||||||||||||||||||||||||
Southampton Center | ( | ) | ( | ) | ||||||||||||||||||||||||||||||||||
Southgate Shopping Center | ( | ) | ( | ) | ||||||||||||||||||||||||||||||||||
Squaw Peak Plaza | ( | ) | ||||||||||||||||||||||||||||||||||||
Stevens Creek Central | ( | ) | ||||||||||||||||||||||||||||||||||||
Stonehenge Market | ( | ) | ||||||||||||||||||||||||||||||||||||
Stony Point Plaza | ( | ) | ||||||||||||||||||||||||||||||||||||
Sunset 19 Shopping Center | ( | ) | ||||||||||||||||||||||||||||||||||||
The Centre at Post Oak | ( | ) | ||||||||||||||||||||||||||||||||||||
The Commons at Dexter Lake | ( | ) | ||||||||||||||||||||||||||||||||||||
The Palms at Town & Country | ( | ) | ||||||||||||||||||||||||||||||||||||
The Shops at Hilshire Village | ( | ) | ||||||||||||||||||||||||||||||||||||
The Westside Center | ( | ) | ||||||||||||||||||||||||||||||||||||
The Whittaker | ( | ) | ||||||||||||||||||||||||||||||||||||
Thompson Bridge Commons | ( | ) | ||||||||||||||||||||||||||||||||||||
Thousand Oaks Shopping Center | ( | ) | ( | ) | ||||||||||||||||||||||||||||||||||
TJ Maxx Plaza | ( | ) | ||||||||||||||||||||||||||||||||||||
Tomball Marketplace | ( | ) | ||||||||||||||||||||||||||||||||||||
Trenton Crossing/North McAllen | ( | ) | ||||||||||||||||||||||||||||||||||||
Valley Shopping Center | ( | ) | ||||||||||||||||||||||||||||||||||||
Vizcaya Square Shopping Center | ( | ) | ||||||||||||||||||||||||||||||||||||
Wellington Green Commons & Pad | ( | ) | ( | ) | ||||||||||||||||||||||||||||||||||
97
Initial Cost to Company | Gross Amounts Carried at Close of Period | |||||||||||||||||||||||||||||||||||||
Description | Land | Building and Improvements | Cost Capitalized Subsequent to Acquisition | Land | Building and Improvements | Total (1) | Accumulated Depreciation | Total Costs, Net of Accumulated Depreciation | Encumbrances (2) | Date of Acquisition / Construction | ||||||||||||||||||||||||||||
West Jordan Town Center | $ | $ | $ | $ | $ | $ | $ | ( | ) | $ | $ | |||||||||||||||||||||||||||
Westchase Shopping Center | ( | ) | ( | ) | ||||||||||||||||||||||||||||||||||
Westhill Village Shopping Center | ( | ) | ||||||||||||||||||||||||||||||||||||
Westminster Center | ( | ) | ( | ) | ||||||||||||||||||||||||||||||||||
Winter Park Corners | ( | ) | ||||||||||||||||||||||||||||||||||||
( | ) | ( | ) | |||||||||||||||||||||||||||||||||||
New Development/Redevelopment: | ||||||||||||||||||||||||||||||||||||||
West Alex | ||||||||||||||||||||||||||||||||||||||
The Driscoll at River Oaks | ||||||||||||||||||||||||||||||||||||||
Miscellaneous (not to exceed 5% of total) | ( | ) | ||||||||||||||||||||||||||||||||||||
Total of Portfolio | $ | $ | $ | $ | $ | $ | $ | ( | ) | $ | $ | ( | ) | |||||||||||||||||||||||||
___________________
(1) | The book value of our net real estate assets is in excess of tax basis by approximately $ |
(2) | Encumbrances do not include $ |
Depreciation is computed using the straight-line method, generally over estimated useful lives of 18 -40 years for buildings and 10 -20 years for parking lot surfacing and equipment. Tenant and leasehold improvements are depreciated over the remaining life of the lease or the useful life whichever is shorter.
The changes in total cost of the properties were as follows (in thousands):
Year Ended December 31, | |||||||||||
2019 | 2018 | 2017 | |||||||||
Balance at beginning of year | $ | $ | $ | ||||||||
Additions at cost | |||||||||||
Retirements or sales | ( | ) | ( | ) | ( | ) | |||||
Property held for sale | ( | ) | |||||||||
Impairment loss | ( | ) | ( | ) | ( | ) | |||||
Balance at end of year | $ | $ | $ | ||||||||
98
The changes in accumulated depreciation were as follows (in thousands):
Year Ended December 31, | |||||||||||
2019 | 2018 | 2017 | |||||||||
Balance at beginning of year | $ | $ | $ | ||||||||
Additions at cost | |||||||||||
Retirements or sales | ( | ) | ( | ) | ( | ) | |||||
Property held for sale | ( | ) | |||||||||
Balance at end of year | $ | $ | $ | ||||||||
99
Schedule IV
WEINGARTEN REALTY INVESTORS
MORTGAGE LOANS ON REAL ESTATE
DECEMBER 31, 2019
(Amounts in thousands)
State | Interest Rate | Final Maturity Date | Periodic Payment Terms | Face Amount of Mortgages | Carrying Amount of Mortgages (1) | ||||||||||
Shopping Centers: | |||||||||||||||
First Mortgages: | |||||||||||||||
College Park Realty Company | NV | $ | $ | ||||||||||||
Total Mortgage Loans on Real Estate | $ | $ | |||||||||||||
___________________
(1) | The aggregate cost at December 31, 2019 for federal income tax purposes is $ |
100