Class A: GALLX Class C: GCLLX Institutional: GILLX Class IR: GSLLX Class R: GRLLX Class R6: GFCUX
Before you invest, you may want to review the Goldman Sachs Flexible Cap Growth Fund’s (the “Fund”) Prospectus, which contains more information about the Fund and its risks. You can find the Fund’s Prospectus and other information about the Fund, including the Statement of Additional Information (“SAI”) and most recent annual reports to shareholders, online at www.gsamfunds.com/summaries. You can also get this information at no cost by calling 800-621-2550 for Institutional shareholders, 800-526-7384 for all other shareholders or by sending an e-mail request to gs-funds-document-requests@gs.com. The Fund’s Prospectus and SAI, both dated July 31 2015, are incorporated by reference into this Summary Prospectus.
| INVESTMENT OBJECTIVE |
The Fund seeks long-term growth of capital.
| FEES AND EXPENSES OF THE FUND |
This table describes the fees and expenses that you may pay if you buy and hold shares of the Fund. You may qualify for sales charge discounts on purchases of Class A Shares if you and your family invest, or agree to invest in the future, at least $50,000 in Goldman Sachs Funds. More information about these and other discounts is available from your financial professional and in “Shareholder Guide—Common Questions Applicable to the Purchase of Class A Shares” beginning on page 48 of the Prospectus and “Other Information Regarding Maximum Sales Charge, Purchases, Redemptions, Exchanges and Dividends” beginning on page B-100 of the Fund’s SAI.
SHAREHOLDER FEES (fees paid directly from your investment)
| Class A | Class C | Institutional | Class IR | Class R | Class R6 | |||||||||||
| Maximum Sales Charge (Load) Imposed on |
5.50 | % | None | None | None | None | None | |||||||||
| Maximum Deferred Sales Charge (Load) (as a |
None | 1.00 | % | None | None | None | None | |||||||||
ANNUAL FUND OPERATING EXPENSES (expenses that you pay each year as a percentage of the value of your investment)
| Class A | Class C | Institutional | Class IR | Class R | Class R6 | |||||||||||||||||||
| Management Fees |
1.00 | % | 1.00 | % | 1.00 | % | 1.00 | % | 1.00 | % | 1.00 | % | ||||||||||||
| Distribution and/or Service (12b-1) Fees |
0.25 | % | 0.75 | % | None | None | 0.50 | % | None | |||||||||||||||
| Other Expenses2, 3 |
2.03 | % | 2.30 | % | 1.88 | % | 2.00 | % | 2.02 | % | 1.86 | % | ||||||||||||
| Service Fees |
None | 0.25 | % | None | None | None | None | |||||||||||||||||
| All Other Expenses3 |
2.03 | % | 2.05 | % | 1.88 | % | 2.00 | % | 2.02 | % | 1.86 | % | ||||||||||||
| Total Annual Fund Operating Expenses |
3.28 | % | 4.05 | % | 2.88 | % | 3.00 | % | 3.52 | % | 2.86 | % | ||||||||||||
| Fee Waiver and Expense Limitation2, 4 |
(2.06 | )% | (2.08 | )% | (2.06 | )% | (2.03 | )% | (2.05 | )% | (2.06 | )% | ||||||||||||
| Total Annual Fund Operating Expenses After Fee Waiver and Expense Limitation4 |
1.22 | % | 1.97 | % | 0.82 | % | 0.97 | % | 1.47 | % | 0.80 | % | ||||||||||||
| 1 | A contingent deferred sales charge (“CDSC”) of 1% is imposed on Class C Shares redeemed within 12 months of purchase. |
| 2 | The Fund’s “Other Expenses” have been restated to reflect expenses expected to be incurred during the current fiscal year. |
| 3 | The “Other Expenses” for Class R6 Shares have been estimated to reflect expenses expected to be incurred during the current fiscal year. |
| 4 | The Investment Adviser has agreed to (i) waive a portion of its management fees in order to achieve an effective net management fee rate of 0.78% as an annual percentage rate of the average daily net assets of the Fund; and (ii) reduce or limit “Other Expenses” (excluding acquired fund fees and expenses, transfer agency fees and expenses, taxes, interest, brokerage fees, shareholder meeting, litigation, indemnification and extraordinary expenses) to 0.004% of the Fund’s average daily net assets. These arrangements will remain in effect through at least July 31, 2016, and prior to such date, the Investment Adviser may not terminate the arrangements without the approval of the Board of Trustees. The Fund’s “Total Annual Fund Operating Expenses After Fee Waiver and Expense Limitation” have been restated to reflect the fee waiver and expense limitation currently in effect. |
2 SUMMARY PROSPECTUS — GOLDMAN SACHS FLEXIBLE CAP GROWTH FUND
| EXPENSE EXAMPLE |
This Example is intended to help you compare the cost of investing in the Fund with the cost of investing in other mutual funds.
This Example assumes that you invest $10,000 in Class A, Class C, Institutional, Class IR, Class R and/or Class R6 Shares of the Fund for the time periods indicated and then redeem all of your Class A, Class C, Institutional, Class IR, Class R and/or Class R6 Shares at the end of those periods. The Example also assumes that your investment has a 5% return each year and that the Fund’s operating expenses remain the same (except that the Example incorporates the fee waiver and expense limitation arrangements for only the first year). Although your actual costs may be higher or lower, based on these assumptions your costs would be:
| 1 Year | 3 Years | 5 Years | 10 Years | |||||||||||||
| Class A Shares |
$ | 677 | $ | 1,322 | $ | 1,999 | $ | 3,797 | ||||||||
| Class C Shares |
||||||||||||||||
| — Assuming complete redemption at end of period |
$ | 300 | $ | 1,042 | $ | 1,901 | $ | 4,120 | ||||||||
| — Assuming no redemption |
$ | 200 | $ | 1,042 | $ | 1,901 | $ | 4,120 | ||||||||
| Institutional Shares |
$ | 84 | $ | 697 | $ | 1,336 | $ | 3,056 | ||||||||
| Class IR Shares |
$ | 99 | $ | 736 | $ | 1,398 | $ | 3,174 | ||||||||
| Class R Shares |
$ | 150 | $ | 889 | $ | 1,651 | $ | 3,656 | ||||||||
| Class R6 Shares |
$ | 82 | $ | 691 | $ | 1,326 | $ | 3,036 | ||||||||
| PORTFOLIO TURNOVER |
The Fund pays transaction costs when it buys and sells securities or instruments (i.e., “turns over” its portfolio). A high rate of portfolio turnover may result in increased transaction costs, including brokerage commissions, which must be borne by the Fund and its shareholders, and is also likely to result in higher short-term capital gains for taxable shareholders. These costs are not reflected in the annual fund operating expenses or in the expense example above, but are reflected in the Fund’s performance. The Fund’s portfolio turnover rate for the fiscal year ended August 31, 2014 was 56% of the average value of its portfolio.
| PRINCIPAL STRATEGY |
The Fund invests, under normal circumstances, at least 80% of its net assets plus any borrowings for investment purposes (measured at time of purchase) (“Net Assets”) in equity investments in small-, mid- and large-cap issuers. Although the Fund invests primarily in publicly traded U.S. securities, it may invest up to 25% of its Net Assets in foreign securities, including securities of issuers in countries with emerging markets or economies (“emerging countries”) and securities quoted in foreign currencies. The Fund may also invest in privately held companies and companies that only recently began to trade publicly.
The Fund seeks to achieve its investment objective by investing, under normal circumstances, in approximately 90-110 companies that are considered by the Investment Adviser to be positioned for long-term growth. The Fund’s fundamental equity growth investment process involves evaluating potential investments based on specific characteristics believed to indicate a high-quality business with sustainable growth, including strong business franchises, favorable long-term prospects, and excellent management. The Investment Adviser will also consider valuation of companies when determining whether to buy and/or sell securities. The Investment Adviser may decide to sell a position for various reasons, including when a company’s fundamental outlook deteriorates, because of valuation and price considerations, for risk management purposes, or when a company is deemed to be misallocating capital. In addition, the Investment Adviser may sell a position in order to meet shareholder redemptions.
The Fund may invest up to 20% of its Net Assets in fixed income securities (including high yield fixed income securities), such as government, corporate and bank debt obligations.
The Fund’s benchmark index is the Russell 3000® Growth Index.
| PRINCIPAL RISKS OF THE FUND |
Loss of money is a risk of investing in the Fund. An investment in the Fund is not a bank deposit and is not insured or guaranteed by the Federal Deposit Insurance Corporation (“FDIC”) or any government agency. The Fund should not be relied upon as a complete investment program. There can be no assurance that the Fund will achieve its investment objective. Investments in the Fund involve substantial risks which prospective investors should consider carefully before investing.
Investment Style Risk. Different investment styles (e.g., “growth”, “value” or “quantitative”) tend to shift in and out of favor depending upon market and economic conditions and investor sentiment. The Fund may outperform or underperform other funds that invest in similar asset classes but employ different investment styles.
Large Shareholder Transactions Risk. The Fund may experience adverse effects when certain large shareholders purchase or redeem large amounts of shares of the Fund. Such large shareholder redemptions may cause the Fund to sell portfolio securities at times when it would not otherwise do so, which may negatively impact the Fund’s NAV and liquidity. Similarly, large Fund share purchases may adversely affect the Fund’s performance to the extent that the Fund is delayed in investing new cash and is required to maintain a larger cash position than it ordinarily would. These transactions may also accelerate the realization of taxable income to shareholders if such sales of investments resulted in gains, and may also increase transaction costs. In addition, a large redemption could result in the Fund’s current expenses being allocated over a smaller asset base, leading to an increase in the Fund’s expense ratio.
Market Risk. The value of the securities in which the Fund invests may go up or down in response to the prospects of individual companies, particular sectors or governments and/or general economic conditions throughout the world due to
3 SUMMARY PROSPECTUS — GOLDMAN SACHS FLEXIBLE CAP GROWTH FUND
increasingly interconnected global economies and financial markets.
Mid-Cap and Small-Cap Risk. Investments in mid-capitalization and small-capitalization companies involve greater risks than those associated with larger, more established companies. These securities may be subject to more abrupt or erratic price movements and may lack sufficient market liquidity, and these issuers often face greater business risks.
Stock Risk. Stock prices have historically risen and fallen in periodic cycles. U.S. and foreign stock markets have experienced periods of substantial price volatility in the past and may do so again in the future.
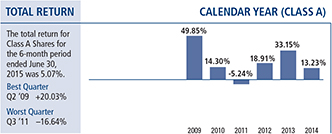
| PERFORMANCE |
The bar chart and table below provide an indication of the risks of investing in the Fund by showing: (a) changes in the performance of the Fund’s Class A Shares from year to year; and (b) how the average annual total returns of the Fund’s Class A, Class C, Institutional, Class IR, Class R and Class R6 Shares compare to those of a broad-based securities market index. The Fund’s past performance, before and after taxes, is not necessarily an indication of how the Fund will perform in the future. Updated performance information is available at no cost at www.gsamfunds.com/performance or by calling the appropriate phone number on the back cover of the Prospectus.
The bar chart (including “Best Quarter” and “Worst Quarter” information) does not reflect the sales loads applicable to Class A Shares. If the sales loads were reflected, returns would be less. Performance reflects applicable fee waivers and/or expense limitations in effect during the periods shown.
AVERAGE ANNUAL TOTAL RETURN
| For the period ended December 31, 2014 |
1 Year | 5 Years | Since Inception |
|||||||||
| Class A Shares (Inception 1/31/08) |
||||||||||||
| Returns Before Taxes |
6.97% | 12.91% | 9.49% | |||||||||
| Returns After Taxes on Distributions |
3.23% | 10.69% | 7.87% | |||||||||
| Returns After Taxes on Distributions and Sale of Fund Shares |
6.64% | 10.24% | 7.53% | |||||||||
| Class C Shares (Inception 1/31/08) |
||||||||||||
| Returns Before Taxes |
11.30% | 13.36% | 9.60% | |||||||||
| Institutional Shares (Inception 1/31/08) |
||||||||||||
| Returns Before Taxes |
13.71% | 14.68% | 10.86% | |||||||||
| Class IR Shares (Inception 1/31/08) |
||||||||||||
| Returns Before Taxes |
13.51% | 14.51% | 10.69% | |||||||||
| Class R Shares (Inception 1/31/08) |
||||||||||||
| Returns |
13.05% | 13.97% | 10.16% | |||||||||
| Russell 3000® Growth Index (reflects no deduction for fees or expenses) |
12.44% | 15.88% | 9.83% | |||||||||
| Class R6 Shares (Inception 7/31/15)* |
||||||||||||
| Returns |
13.71% | 14.68% | 10.86% | |||||||||
| Russell 3000® Growth Index (reflects no deduction for fees or expenses) |
12.44% | 15.88% | 9.83% | |||||||||
| * | Class R6 Shares commenced operations on July 31, 2015. Prior to that date, the performance of the Class R6 Shares is that of the Institutional Shares. Performance prior to July 31, 2015 has not been adjusted to reflect the lower expenses of Class R6 Shares. Class R6 Shares would have had similar returns (because these share classes represent interests in the same portfolio of securities) that differed only to the extent that Class R6 Shares and Institutional Shares have different expenses. |
The after-tax returns are for Class A Shares only. The after-tax returns for Class C, Institutional and Class IR Shares, and returns for Class R and Class R6 Shares (which are offered exclusively to employee benefit plans), will vary. After-tax returns are calculated using the historical highest individual federal marginal income tax rates and do not reflect the impact of state and local taxes. Actual after-tax returns depend on an investor’s tax situation and may differ from those shown. In addition, the after-tax returns shown are not relevant to investors who hold Fund shares through tax-deferred arrangements such as 401(k) plans or individual retirement accounts.
4 SUMMARY PROSPECTUS — GOLDMAN SACHS FLEXIBLE CAP GROWTH FUND
| PORTFOLIO MANAGEMENT |
Goldman Sachs Asset Management, L.P. is the investment adviser for the Fund (the “Investment Adviser” or “GSAM”).
Portfolio Managers: Steven M. Barry, Managing Director, Chief Investment Officer—Fundamental Equity, Chief Investment Officer—Growth Equity, has managed the Fund since 2008.
| BUYING AND SELLING FUND SHARES |
The minimum initial investment for Class A and Class C Shares is, generally, $1,000. The minimum initial investment for Institutional Shares is, generally, $1,000,000 for individual or certain institutional investors, alone or in combination with other assets under the management of the Investment Adviser and its affiliates. There is no minimum for initial purchases of Class IR, Class R and Class R6 Shares. Those share classes with a minimum initial investment requirement do not impose it on certain employee benefit plans, and Institutional Shares do not impose it on certain investment advisers investing on behalf of other accounts.
The minimum subsequent investment for Class A and Class C shareholders is $50, except for certain employee benefit plans, for which there is no minimum. There is no minimum subsequent investment for Institutional, Class IR, Class R or Class R6 shareholders. You may purchase and redeem (sell) shares of the Fund on any business day through certain banks, trust companies, brokers, dealers, investment advisers and other financial institutions (“Authorized Institutions”).
| TAX INFORMATION |
The Fund’s distributions are taxable, and will be taxed as ordinary income or capital gains, unless you are investing through a tax-deferred arrangement, such as a 401(k) plan or an individual retirement account. Investments through tax-deferred arrangements may become taxable upon withdrawal from such arrangements.
| PAYMENTS TO BROKER-DEALERS AND OTHER FINANCIAL INTERMEDIARIES |
If you purchase the Fund through an Authorized Institution, the Fund and/or its related companies may pay the Authorized Institution for the sale of Fund shares and related services. These payments may create a conflict of interest by influencing the Authorized Institution and your salesperson to recommend the Fund over another investment. Ask your salesperson or visit your Authorized Institution’s website for more information.
EQG1SUM3-R6