Exhibit 99.1

FOR IMMEDIATE RELEASE
HALLMARK ANNOUNCES THIRD QUARTER 2022 RESULTS
DALLAS, Texas, (November 14, 2022) - Hallmark Financial Services, Inc. (“Hallmark”) (NASDAQ: HALL) today filed its Form 10-Q and announced financial results for the third quarter and nine months ended September 30, 2022.
(1) | See “Non-GAAP Financial Measures” below |
Highlights:
· | On October 7, 2022, Hallmark completed the sale of substantially all of its excess and surplus lines operations, for $40.0 million cash consideration, plus an estimated $19.2 million consideration for the acquisition costs associated with certain net unearned premium reserves. As a result, the results of operations for the affected lines of business are included in discontinued operations for all periods shown in its Consolidated Statement of Operations and the corresponding assets and liabilities are presented separately as single line items in the asset and liability sections of its Consolidated Balance Sheet at September 30, 2022. |
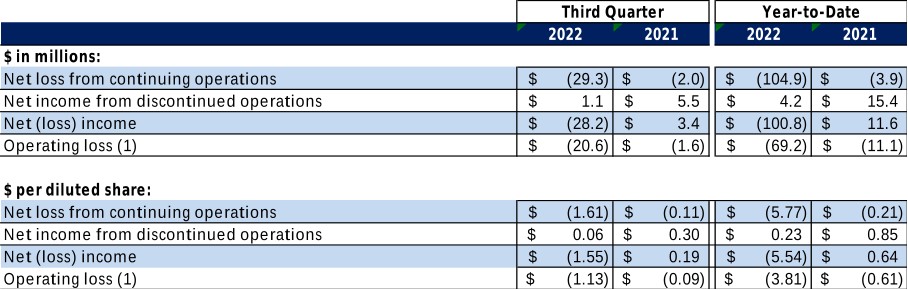
· | Net loss from continuing operations of $29.3 million, or $1.61 per share, in the third quarter of 2022 as compared to a net loss of $2.0 million, or $0.11 per share, for the same period of 2021. Year-to-date net loss from continuing operations of $104.9 million, or $5.77 per share, as compared to net loss from continuing operations of $3.9 million, or $0.21 per share, for the same period of 2021. |
· | Net income from discontinued operations of $1.1 million, or $0.06 per share, in the third quarter of 2022 as compared to net income from discontinued operations of $5.5 million, or $0.30 per share, for the same period of 2021. Year-to-date net income from discontinued operations of $4.2 million, or $0.23 per share, |
as compared to net income from discontinued operations of $15.4 million, or $0.85 per share, for the same period of 2021.
· | Net loss of $28.2 million, or $1.55 per share, in the third quarter of 2022 as compared to net income of $3.4 million, or $0.19 per share, for the same period of 2021. Year-to-date net loss of $100.8 million, or $5.54 per share, as compared to net income of $11.6 million, or $0.64 per share, for the same period of 2021. |
· | Net loss from continuing operations and net loss included an additional valuation allowance against net deferred tax assets of $6.5 million for the third quarter of 2022 resulting in a full valuation allowance against net deferred tax assets of $30.4 million year-to-date primarily due to recent net losses, including the current period net loss. |
· | Net loss from continuing operations and net loss for the third quarter included a $12.4 million after-tax impact from the previously exited contract binding business driven by unfavorable prior year loss reserve development of $14.0 million during the quarter. |
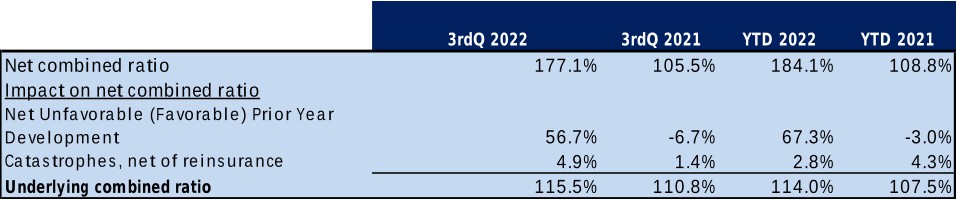
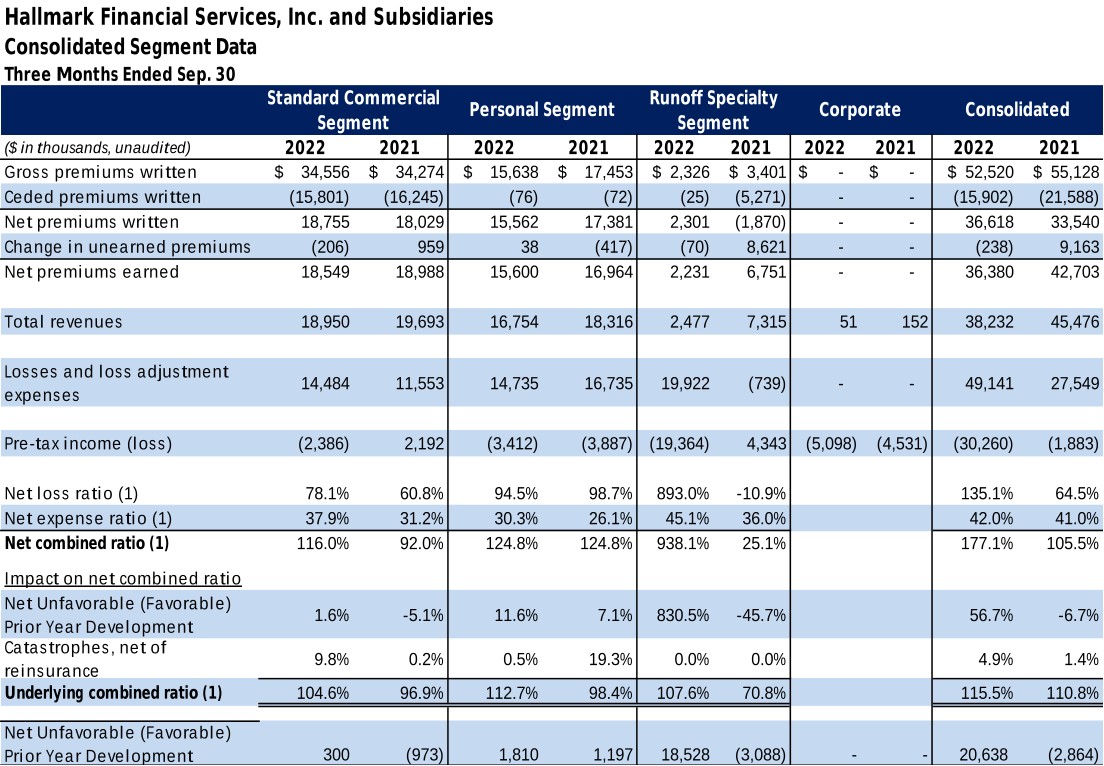
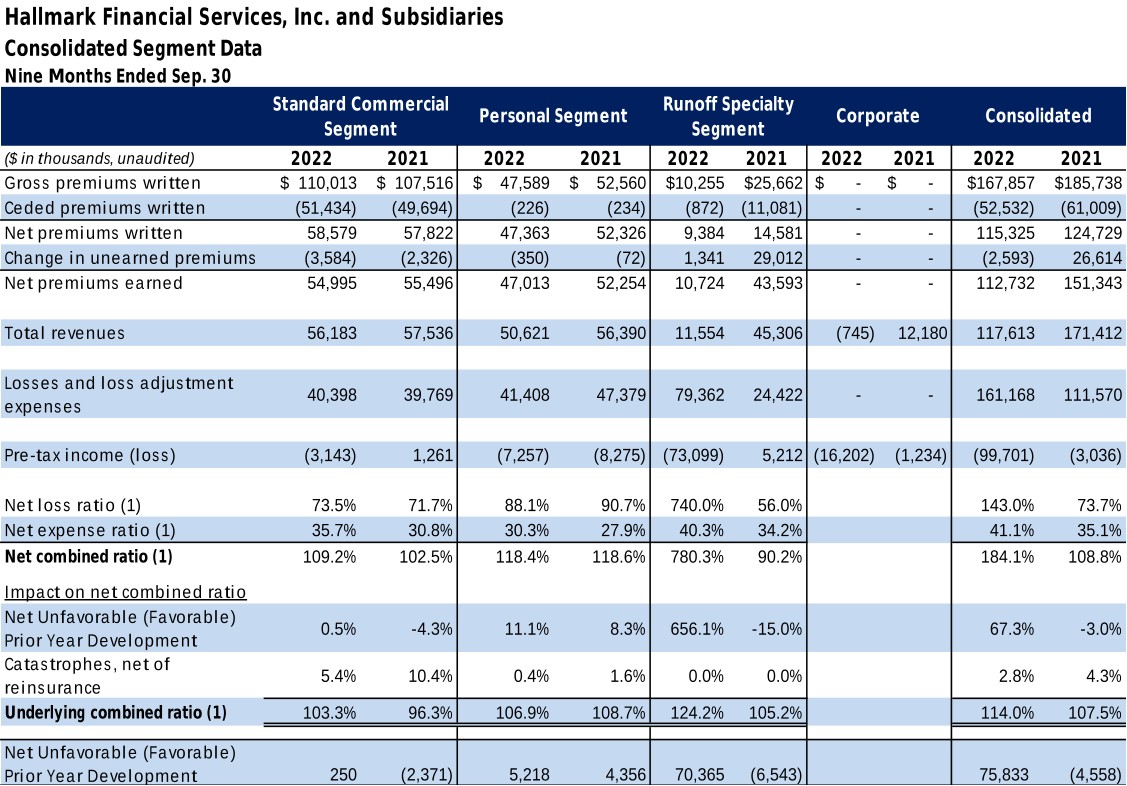
· | Net combined ratio of 177.1% and 184.1% for the three and nine months ended September 30, 2022, compared to 105.5% and 108.8% for the same periods the prior year. |
· | Underlying combined ratio (excluding net prior year development and catastrophe losses) of 115.5% and 114.0% for the three and nine months ended September 30, 2022, compared to 110.8% and 107.5% for the same periods the prior year. See Non-GAAP Financial Measures below. |
· | Gross premiums written for the three and nine months ended September 30, 2022 decreased 5.0% and 10.0%, respectively, compared to the same period the prior year. |
· | Net catastrophe losses were $1.8 million in the third quarter of 2022, or 4.9 points of the net combined ratio, as compared to $0.6 million, or 1.4 points of the net combined ratio, for the same period the prior year. Net catastrophe losses were $3.2 million for the first nine months of 2022, or 2.8 points of the net combined ratio, as compared to $6.6 million, or 4.3 points of the net combined ratio, for the same period the prior year. |
· | Net investment income was $3.7 million and $8.7 million during the three and nine months ended September 30, 2022, as compared to $2.2 million and $7.6 million during the same periods in 2021. |
· | Net investment losses of $2.8 million during the third quarter of 2022 as compared to net investment losses of $0.5 million during the same period the prior year. Net investment losses of $6.8 million for the nine months ended September 30, 2022 as compared to net investment gains of $9.1 million during the same period the prior year. |
Third Quarter and Year-to-Date 2022 Financial Review
(1) | See “Non-GAAP Financial Measures” below |
Gross Premiums Written
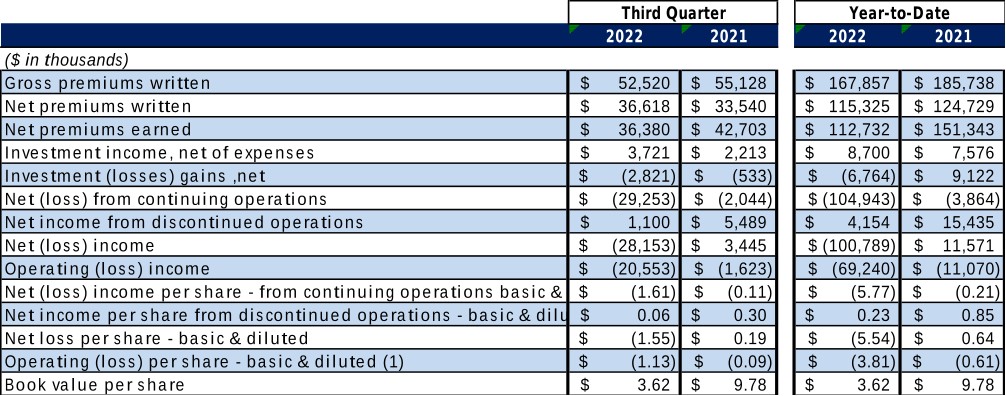
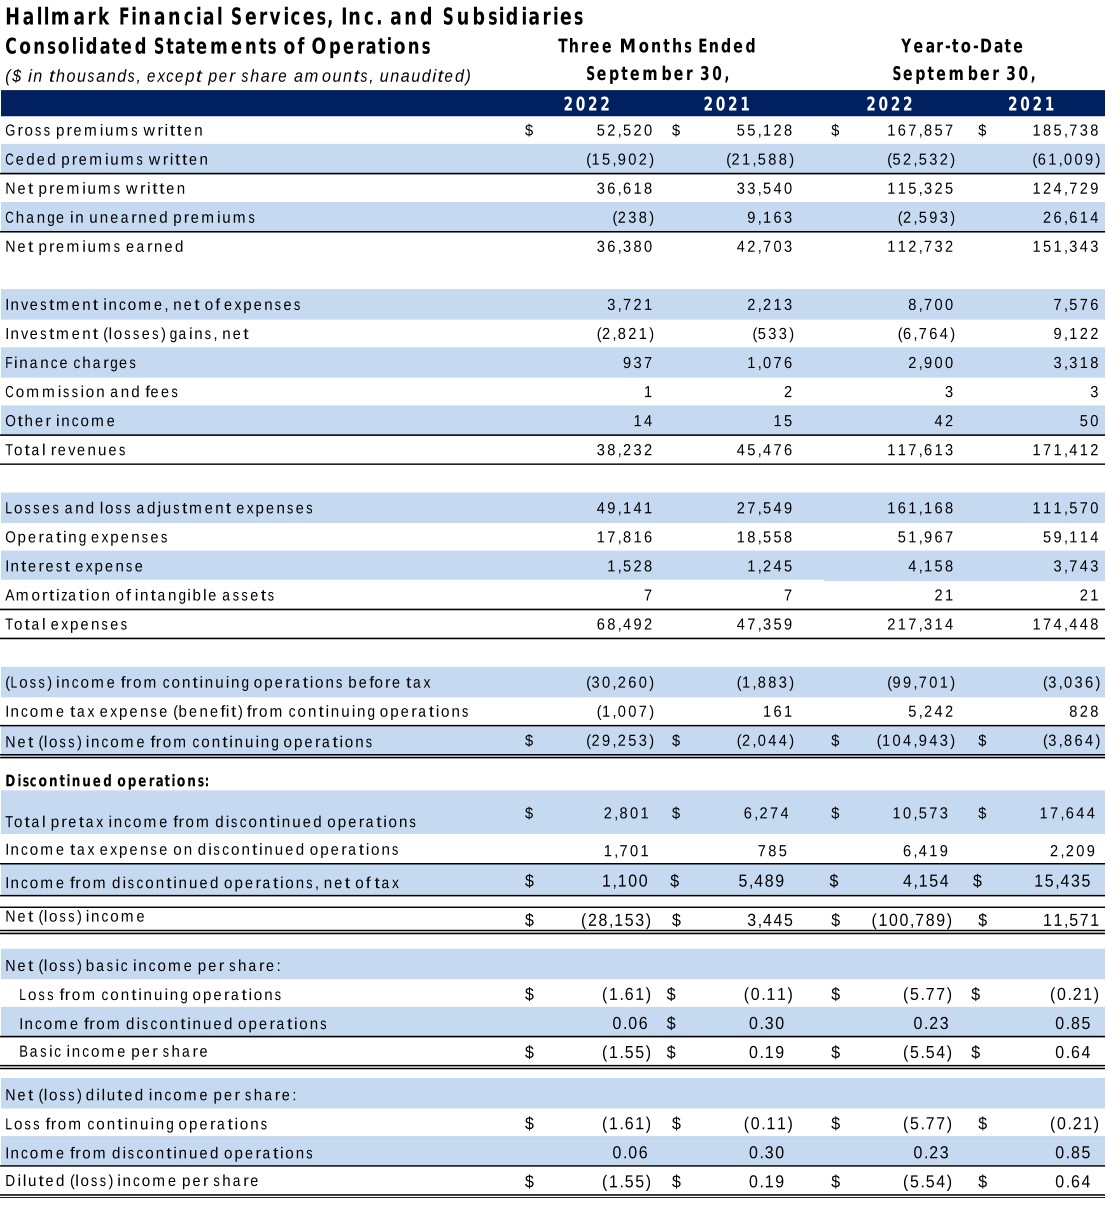
Gross premiums written were $52.5 million and $167.9 million during the three and nine months ended September 30, 2022, representing a decrease of 5% and 10% from the $55.1 million and $185.7 in gross premiums written for the same periods in 2021.
Net Premiums Written
Net premiums written were $36.6 million and $115.3 million during the three and nine months ended September 30, 2022, representing an increase of 9% and a decrease of 8%, respectively, from the $33.5 million and $124.7 million in net premiums written for the same periods in 2021.
Net Premiums Earned
Net premiums earned were $36.4 million and $112.7 million for the three and nine months ended September 30, 2022, representing a decrease of 15% and 26% from the $42.7 million and $151.3 million in net premiums earned for the same periods in 2021.
Investments
Total return on investment securities was -0.6% and -2.0% for the three and nine months ended September 30, 2022.
Despite significant outperformance relative to market benchmarks, severe declines in markets have precluded positive contribution from investments in the quarter and year to date periods. Year to date, the total return on Hallmark’s equity portfolio was -10.2% compared to -23.9% for the S&P 500 Stock Index. Year to date, the total return on Hallmark’s fixed income portfolio was -1.8% compared to -14.6% for the Bloomberg Aggregate Bond Index.
Net investment income was $3.7 million and $8.7 million during the three and nine months ended September 30, 2022, as compared to $2.2 million and $7.6 million during the same periods in 2021. The 68% increase in net investment income during the third quarter of 2022 was due to a greater amount of income generating securities and to higher yields.
Net investment losses were $2.8 million for the third quarter of 2022 as compared to net investment losses of $0.5 million for the same period in 2021. In the current quarter, net investment losses include $3.3 million unrealized losses on common and preferred stocks.
Net investment losses were $6.8 million for the nine months ended September 30, 2022 as compared to net investment gains of $9.1 million for the same period in 2021. Year to date, net investment losses include $1.1 million realized gains on common stocks and $8.4 million unrealized losses on common and preferred stocks.
Fixed-income securities were $417.1 million at September 30, 2022, with a tax equivalent book yield of 3.3% compared to 2.4% as of December 31, 2021. As of September 30, 2022, the fixed-income portfolio had an average modified duration of 1.0 years and 85% of the securities had remaining time to maturity of five years or less. As of September 30, 2022, 9% of the investment portfolio was invested in equity securities.
Total investments were $458.1 million at September 30, 2022. Cash and cash equivalents, including restricted cash were $138.3 million. Total investments, cash and cash equivalents, and restricted cash were $596.4 million or $32.79 per share.
Pre-Tax (Loss) Income from Continuing Operations
Pre-tax loss from continuing operations was $30.3 million for the three months ended September 30, 2022, as compared to a pre-tax loss from continuing operations of $1.9 million reported during the same period in 2021. The decline in pre-tax results from continuing operations for the third quarter of 2022 compared to the same period of the prior year was driven by higher losses and LAE of $21.6 million, lower net premiums earned of $6.3 million, higher net investment losses of $2.3 million, higher interest expense of $0.3 million and lower finance charges of $0.1 million, partially offset by higher net investment income of $1.5 million and lower operating expenses of $0.7 million.
Pre-tax loss from continuing operations was $99.7 million for the nine months ended September 30, 2022, as compared to a pre-tax loss from continuing operations of $3.0 million reported for the same period the prior year. The decline in pre-tax results from continuing operations for the nine months ended September 30, 2022, was driven by higher losses and LAE of $49.6 million, lower net premiums earned of $38.6 million, net investment losses of $6.8 million compared to net investment gains of $9.1 million the prior year, lower finance charges of $0.4 million and higher interest expense of $0.4 million, partially offset by lower operating expenses of $7.1 million and higher net investment income of $1.1 million.
Loss and Loss Adjustment Expenses (“LAE”) from Continuing Operations
Losses and LAE increased by $21.6 million to $49.1 million for the three months ended September 30, 2022, as compared to the same period of the previous year. The increase in losses and LAE during the third quarter 2022 was primarily due to $20.6 million of adverse prior year loss reserve development, $14.0 million of which was from the exited contract binding line of the primary commercial automobile business, as compared to $2.9 million of favorable prior year loss reserve development for the same period the prior year, as well as higher catastrophe loss. Losses and LAE for the third quarter of 2022 included $1.8 million of net catastrophe losses as compared to $0.6 million during the same period of the prior year.
Losses and LAE increased by $49.6 million to $161.2 million for the nine months ended September 30, 2022, as compared to the same period of the previous year. The increase in losses and LAE for the first nine months of 2022 was primarily due to $75.8 million of unfavorable prior year loss reserve development, $58.4 million of which was from the exited contract binding line of the primary commercial automobile business, as compared to $4.6 million of favorable prior year loss reserve development for the prior year period, partially offset by lower net catastrophe losses. Losses and LAE for the nine months ended September 30, 2022,
included $3.2 million of net catastrophe losses as compared to $6.6 million during the same period of the prior year.
Net (Loss) Income
Net loss from continuing operations was $29.3 million and $104.9 million for the three and nine months ended September 30, 2022 as compared to net loss from continuing operations of $2.0 million and $3.9 million for the same periods during 2021. On a diluted basis per share, net loss from continuing operations was $1.61 per share and $5.77 per share for the three and nine months ended September 30, 2022 as compared to a net loss from continuing operations of $0.11 per share and $0.21 per share for the three and nine months ended September 30, 2021.
Net income from discontinued operations was $1.1 million and $4.2 million for the three and nine months ended September 30, 2022 as compared to net income from discontinued operations of $5.5 million and $15.4 million for the same periods during 2021. On a diluted basis per share, net income from discontinued operations was $0.06 per share and $0.23 per share for the three and nine months ended September 30, 2022 as compared to a net income from discontinued operations of $0.30 per share and $0.85 per share for the three and nine months ended September 30, 2021.
Total net loss was $28.2 million and $100.8 million for the three and nine months ended September 30, 2022 as compared to total net income of $3.4 million and $11.6 million for the same periods during 2021. On a diluted basis per share, total net loss was $1.55 per share and $5.54 per share for the three and nine months ended September 30, 2022 as compared to net income of $0.19 per share and $0.64 per share for the three and nine months ended September 30, 2021.
The effective tax rate was -13.1% for the first nine months of 2022 compared to 20.8% for the same period in 2021. During the first nine months of 2022, Hallmark recorded a full valuation allowance of $30.4 million against net deferred tax assets primarily due to recent net losses, including the current period net loss. The effective rate for the nine months ended September 30, 2021 varied from the statutory tax rates primarily due to tax exempt interest income.
Net Loss, Expense and Combined Ratios
The net loss ratio for continuing operations was 135.1% and 143.0% for the three and nine months ended September 30, 2022, as compared to 64.5% and 73.7% reported during the same periods in 2021. Net unfavorable prior year loss reserve development contributed 56.7 points and 67.3 points to the net loss ratio for the three and nine months ended September 30, 2022, respectively, as compared to net favorable prior year loss reserve development reducing the net loss ratio 6.7 points and 3.0 points for the same periods during 2021. Catastrophe losses contributed 4.9 points and 2.8 points to the net loss ratio for the three and nine months ended September 30, 2022, respectively, as compared to 1.4 points and 4.3 points for the same periods during 2021.
The expense ratio was 42.0% and 41.1% for the three and nine months ended September 30, 2022, as compared to 41.0% and 35.1% during the same periods in 2021. The net combined ratio was 177.1% and 184.1% for the three and nine months ended September 30, 2022, as compared to 105.5% and 108.8% for the same periods during 2021. The exited contract binding business adversely impacted the net combined ratio by 35.3 points and 58.6 points during the three and nine months ended September 30, 2022.
Book Value Per Share
Book value per share decreased 63% to $3.62 per share as of September 30, 2022 as compared to $9.66 per share as of December 31, 2021.
Non-GAAP Financial Measures
The Company’s financial statements are prepared in accordance with United States generally accepted accounting principles (“GAAP”). However, the Company also presents and discusses certain non-GAAP financial measures that it believes are useful to investors as measures of operating performance. Management may also use such non-GAAP financial measures in evaluating the effectiveness of business strategies and for planning and budgeting purposes. However, these non-GAAP financial measures should not be viewed as an alternative or substitute for the results reflected in the Company’s GAAP financial statements. In addition, the Company’s definitions of these items may not be comparable to the definitions used by other companies.
Operating income and operating income per share are calculated by excluding net investment gains and losses and asset impairments or valuation allowances from GAAP net income from continuing operations. Asset impairments and valuation allowances are unusual and infrequent charges for the Company. Management believes that operating income and operating income per share provide useful information to investors about the performance of and underlying trends in the Company’s core insurance operations. Net income from continuing operations and net income per share from continuing operations are the GAAP measures that are most directly comparable to operating earnings and operating earnings per share. A reconciliation of operating income and operating income per share to the most comparable GAAP financial measures is presented below.

Underlying combined ratio is calculated by excluding the impact of net favorable or unfavorable prior year loss development and catastrophe losses from the calculation of the net combined ratio. Management
believes that the underlying combined ratio provides useful information to investors about the current performance of the Company's insurance operations absent historical developments and uncontrollable events. Combined ratio is the GAAP measure most comparable to underlying combined ratio. A reconciliation of the underlying combined ratio to the combined ratio is presented below.
About Hallmark
Hallmark is a property and casualty insurance holding company with a diversified portfolio of insurance products written on a national platform. With six insurance subsidiaries, Hallmark markets, underwrites and services commercial and personal insurance in select markets. Hallmark is headquartered in Dallas, Texas and its common stock is listed on NASDAQ under the symbol "HALL."
Forward-looking statements in this release are made pursuant to the “safe harbor” provisions of the Private Securities Litigation Reform Act of 1995. Investors are cautioned that actual results may differ materially from such forward-looking statements. Forward-looking statements involve risks and uncertainties including, but not limited to, continued acceptance of the Company’s products and services in the marketplace, competitive factors, interest rate trends, general economic conditions, the availability of financing, underwriting loss experience and other risks detailed from time to time in the Company’s filings with the Securities and Exchange Commission.
For further information, please contact:
Chris Kenney
President
Chief Financial Officer
817.348.1600
www.hallmarkgrp.com

(1) | The net loss ratio is calculated as incurred losses and loss adjustment expenses divided by net premiums earned, each determined in accordance with GAAP. The net expense ratio is calculated as total underwriting expenses offset by agency fee income divided by net premiums earned, each determined in accordance with GAAP. The net combined ratio is calculated as the sum of the net loss ratio and the net expense ratio. The underlying combined ratio is the net combined ratio excluding the impact of net prior year reserve development and catastrophes. |
(1) | The net loss ratio is calculated as incurred losses and loss adjustment expenses divided by net premiums earned, each determined in accordance with GAAP. The net expense ratio is calculated as total underwriting expenses offset by agency fee income divided by net premiums earned, each determined in accordance with GAAP. The net combined ratio is calculated as the sum of the net loss ratio and the net expense ratio. The underlying combined ratio is the net combined ratio excluding the impact of net prior year reserve development and catastrophes. |