000081676112/312022FYfalseP1YP2YP1Yhttp://fasb.org/us-gaap/2022#PropertyPlantAndEquipmentAndFinanceLeaseRightOfUseAssetAfterAccumulatedDepreciationAndAmortizationhttp://fasb.org/us-gaap/2022#PropertyPlantAndEquipmentAndFinanceLeaseRightOfUseAssetAfterAccumulatedDepreciationAndAmortizationhttp://fasb.org/us-gaap/2022#RevenueFromContractWithCustomerExcludingAssessedTax00008167612022-01-012022-12-3100008167612022-06-30iso4217:USD00008167612023-01-31xbrli:shares0000816761tdc:SubscriptionSoftwareLicenseRecurringMember2022-01-012022-12-310000816761tdc:SubscriptionSoftwareLicenseRecurringMember2021-01-012021-12-310000816761tdc:SubscriptionSoftwareLicenseRecurringMember2020-01-012020-12-310000816761tdc:ServicesAndOtherRecurringMember2022-01-012022-12-310000816761tdc:ServicesAndOtherRecurringMember2021-01-012021-12-310000816761tdc:ServicesAndOtherRecurringMember2020-01-012020-12-310000816761tdc:ProductAndServiceRecurringMember2022-01-012022-12-310000816761tdc:ProductAndServiceRecurringMember2021-01-012021-12-310000816761tdc:ProductAndServiceRecurringMember2020-01-012020-12-310000816761tdc:PerpetualSoftwareLicensesHardwareAndOtherMember2022-01-012022-12-310000816761tdc:PerpetualSoftwareLicensesHardwareAndOtherMember2021-01-012021-12-310000816761tdc:PerpetualSoftwareLicensesHardwareAndOtherMember2020-01-012020-12-310000816761tdc:ConsultingServicesMember2022-01-012022-12-310000816761tdc:ConsultingServicesMember2021-01-012021-12-310000816761tdc:ConsultingServicesMember2020-01-012020-12-3100008167612021-01-012021-12-3100008167612020-01-012020-12-31iso4217:USDxbrli:shares00008167612022-12-3100008167612021-12-3100008167612020-12-3100008167612019-12-310000816761us-gaap:CommonStockMember2019-12-310000816761us-gaap:AdditionalPaidInCapitalMember2019-12-310000816761us-gaap:RetainedEarningsMember2019-12-310000816761us-gaap:AccumulatedOtherComprehensiveIncomeMember2019-12-310000816761us-gaap:RetainedEarningsMember2020-01-012020-12-310000816761us-gaap:CommonStockMember2020-01-012020-12-310000816761us-gaap:AdditionalPaidInCapitalMember2020-01-012020-12-310000816761us-gaap:AccumulatedOtherComprehensiveIncomeMember2020-01-012020-12-310000816761us-gaap:CommonStockMember2020-12-310000816761us-gaap:AdditionalPaidInCapitalMember2020-12-310000816761us-gaap:RetainedEarningsMember2020-12-310000816761us-gaap:AccumulatedOtherComprehensiveIncomeMember2020-12-310000816761us-gaap:RetainedEarningsMember2021-01-012021-12-310000816761us-gaap:CommonStockMember2021-01-012021-12-310000816761us-gaap:AdditionalPaidInCapitalMember2021-01-012021-12-310000816761us-gaap:AccumulatedOtherComprehensiveIncomeMember2021-01-012021-12-310000816761us-gaap:CommonStockMember2021-12-310000816761us-gaap:AdditionalPaidInCapitalMember2021-12-310000816761us-gaap:RetainedEarningsMember2021-12-310000816761us-gaap:AccumulatedOtherComprehensiveIncomeMember2021-12-310000816761us-gaap:RetainedEarningsMember2022-01-012022-12-310000816761us-gaap:CommonStockMember2022-01-012022-12-310000816761us-gaap:AdditionalPaidInCapitalMember2022-01-012022-12-310000816761us-gaap:AccumulatedOtherComprehensiveIncomeMember2022-01-012022-12-310000816761us-gaap:CommonStockMember2022-12-310000816761us-gaap:AdditionalPaidInCapitalMember2022-12-310000816761us-gaap:RetainedEarningsMember2022-12-310000816761us-gaap:AccumulatedOtherComprehensiveIncomeMember2022-12-310000816761srt:MinimumMember2022-01-012022-12-310000816761srt:MaximumMember2022-01-012022-12-310000816761us-gaap:EquipmentMembersrt:MinimumMember2022-01-012022-12-310000816761us-gaap:EquipmentMembersrt:MaximumMember2022-01-012022-12-310000816761srt:MinimumMemberus-gaap:BuildingMember2022-01-012022-12-310000816761srt:MaximumMemberus-gaap:BuildingMember2022-01-012022-12-310000816761tdc:CustomerRentalEquipmentMember2022-01-012022-12-310000816761tdc:InternalUseSoftwareMember2022-01-012022-12-310000816761tdc:InternalUseSoftwareMember2021-12-310000816761tdc:InternalUseSoftwareMember2020-12-310000816761tdc:InternalUseSoftwareMember2019-12-310000816761tdc:ExternalUseSoftwareMember2021-12-310000816761tdc:ExternalUseSoftwareMember2020-12-310000816761tdc:ExternalUseSoftwareMember2019-12-310000816761tdc:InternalUseSoftwareMember2022-01-012022-12-310000816761tdc:InternalUseSoftwareMember2021-01-012021-12-310000816761tdc:InternalUseSoftwareMember2020-01-012020-12-310000816761tdc:ExternalUseSoftwareMember2022-01-012022-12-310000816761tdc:ExternalUseSoftwareMember2021-01-012021-12-310000816761tdc:ExternalUseSoftwareMember2020-01-012020-12-310000816761tdc:InternalUseSoftwareMember2022-12-310000816761tdc:ExternalUseSoftwareMember2022-12-310000816761tdc:InternalUseSoftwareMember2022-01-012022-12-310000816761tdc:InternalUseSoftwareMember2022-12-310000816761us-gaap:EmployeeStockOptionMember2022-01-012022-12-310000816761us-gaap:EmployeeStockOptionMember2021-01-012021-12-310000816761us-gaap:EmployeeStockOptionMember2020-01-012020-12-310000816761tdc:SubscriptionsRevenueMembersrt:AmericasMember2022-01-012022-12-310000816761tdc:SubscriptionsRevenueMembersrt:AmericasMember2021-01-012021-12-310000816761tdc:SubscriptionsRevenueMembersrt:AmericasMember2020-01-012020-12-310000816761tdc:PerpetualSoftwareLicensesHardwareAndOtherMembersrt:AmericasMember2022-01-012022-12-310000816761tdc:PerpetualSoftwareLicensesHardwareAndOtherMembersrt:AmericasMember2021-01-012021-12-310000816761tdc:PerpetualSoftwareLicensesHardwareAndOtherMembersrt:AmericasMember2020-01-012020-12-310000816761tdc:ConsultingRevenueMembersrt:AmericasMember2022-01-012022-12-310000816761tdc:ConsultingRevenueMembersrt:AmericasMember2021-01-012021-12-310000816761tdc:ConsultingRevenueMembersrt:AmericasMember2020-01-012020-12-310000816761srt:AmericasMember2022-01-012022-12-310000816761srt:AmericasMember2021-01-012021-12-310000816761srt:AmericasMember2020-01-012020-12-310000816761tdc:SubscriptionsRevenueMemberus-gaap:EMEAMember2022-01-012022-12-310000816761tdc:SubscriptionsRevenueMemberus-gaap:EMEAMember2021-01-012021-12-310000816761tdc:SubscriptionsRevenueMemberus-gaap:EMEAMember2020-01-012020-12-310000816761tdc:PerpetualSoftwareLicensesHardwareAndOtherMemberus-gaap:EMEAMember2022-01-012022-12-310000816761tdc:PerpetualSoftwareLicensesHardwareAndOtherMemberus-gaap:EMEAMember2021-01-012021-12-310000816761tdc:PerpetualSoftwareLicensesHardwareAndOtherMemberus-gaap:EMEAMember2020-01-012020-12-310000816761tdc:ConsultingRevenueMemberus-gaap:EMEAMember2022-01-012022-12-310000816761tdc:ConsultingRevenueMemberus-gaap:EMEAMember2021-01-012021-12-310000816761tdc:ConsultingRevenueMemberus-gaap:EMEAMember2020-01-012020-12-310000816761us-gaap:EMEAMember2022-01-012022-12-310000816761us-gaap:EMEAMember2021-01-012021-12-310000816761us-gaap:EMEAMember2020-01-012020-12-310000816761tdc:SubscriptionsRevenueMembertdc:AsiaPacificJapanMember2022-01-012022-12-310000816761tdc:SubscriptionsRevenueMembertdc:AsiaPacificJapanMember2021-01-012021-12-310000816761tdc:SubscriptionsRevenueMembertdc:AsiaPacificJapanMember2020-01-012020-12-310000816761tdc:PerpetualSoftwareLicensesHardwareAndOtherMembertdc:AsiaPacificJapanMember2022-01-012022-12-310000816761tdc:PerpetualSoftwareLicensesHardwareAndOtherMembertdc:AsiaPacificJapanMember2021-01-012021-12-310000816761tdc:PerpetualSoftwareLicensesHardwareAndOtherMembertdc:AsiaPacificJapanMember2020-01-012020-12-310000816761tdc:ConsultingRevenueMembertdc:AsiaPacificJapanMember2022-01-012022-12-310000816761tdc:ConsultingRevenueMembertdc:AsiaPacificJapanMember2021-01-012021-12-310000816761tdc:ConsultingRevenueMembertdc:AsiaPacificJapanMember2020-01-012020-12-310000816761tdc:AsiaPacificJapanMember2022-01-012022-12-310000816761tdc:AsiaPacificJapanMember2021-01-012021-12-310000816761tdc:AsiaPacificJapanMember2020-01-012020-12-3100008167612023-01-012022-12-3100008167612024-01-012022-12-310000816761srt:AmericasMember2021-12-310000816761srt:AmericasMember2022-12-310000816761us-gaap:EMEAMember2021-12-310000816761us-gaap:EMEAMember2022-12-310000816761tdc:AsiaPacificJapanMember2021-12-310000816761tdc:AsiaPacificJapanMember2022-12-3100008167612022-10-012022-12-31tdc:reporting_unitxbrli:pure0000816761tdc:UnitedStatesAndCertainForeignJurisdictionsMember2022-12-310000816761us-gaap:DomesticCountryMember2022-12-310000816761us-gaap:StateAndLocalJurisdictionMemberus-gaap:ResearchMember2022-12-310000816761tdc:A2012StockIncentivePlanMember2022-12-310000816761tdc:NewEmployeeStockInducementPlanMember2022-12-310000816761tdc:ServiceBasedAwardsMembersrt:MinimumMember2022-01-012022-12-310000816761srt:MinimumMembertdc:PerformanceBasedAwardsMember2022-01-012022-12-310000816761srt:MaximumMembertdc:PerformanceBasedAwardsMember2022-01-012022-12-310000816761us-gaap:RestrictedStockUnitsRSUMember2022-01-012022-12-310000816761us-gaap:RestrictedStockUnitsRSUMember2021-01-012021-12-310000816761us-gaap:RestrictedStockUnitsRSUMember2020-01-012020-12-310000816761us-gaap:RestrictedStockMember2022-12-310000816761us-gaap:RestrictedStockMember2022-01-012022-12-310000816761tdc:ServiceBasedSharesMember2022-01-012022-12-310000816761tdc:PerformanceBasedSharesMember2022-01-012022-12-310000816761tdc:EmployeeStockPuchaseProgramMember2018-01-302018-01-300000816761tdc:EmployeeStockPuchaseProgramMember2022-01-012022-12-310000816761tdc:EmployeeStockPuchaseProgramMember2022-12-310000816761tdc:EmployeeStockPuchaseProgramMember2021-01-012021-12-310000816761tdc:EmployeeStockPuchaseProgramMember2020-01-012020-12-310000816761us-gaap:PensionPlansDefinedBenefitMember2022-01-012022-12-310000816761us-gaap:PostemploymentRetirementBenefitsMember2022-01-012022-12-310000816761us-gaap:PensionPlansDefinedBenefitMember2021-01-012021-12-310000816761us-gaap:PostemploymentRetirementBenefitsMember2021-01-012021-12-310000816761us-gaap:PensionPlansDefinedBenefitMember2020-01-012020-12-310000816761us-gaap:PostemploymentRetirementBenefitsMember2020-01-012020-12-310000816761us-gaap:PensionPlansDefinedBenefitMember2021-12-310000816761us-gaap:PensionPlansDefinedBenefitMember2020-12-310000816761us-gaap:PostemploymentRetirementBenefitsMember2021-12-310000816761us-gaap:PostemploymentRetirementBenefitsMember2020-12-310000816761us-gaap:PensionPlansDefinedBenefitMember2022-12-310000816761us-gaap:PostemploymentRetirementBenefitsMember2022-12-310000816761us-gaap:DefinedBenefitPlanEquitySecuritiesMember2022-12-310000816761us-gaap:DefinedBenefitPlanEquitySecuritiesMember2021-12-310000816761us-gaap:DefinedBenefitPlanDebtSecurityMember2022-12-310000816761us-gaap:DefinedBenefitPlanDebtSecurityMember2021-12-310000816761tdc:InsuranceContractMember2022-12-310000816761tdc:InsuranceContractMember2021-12-310000816761us-gaap:DefinedBenefitPlanRealEstateMember2022-12-310000816761us-gaap:DefinedBenefitPlanRealEstateMember2021-12-310000816761us-gaap:FairValueMeasurementsRecurringMemberus-gaap:MoneyMarketFundsMember2022-12-310000816761us-gaap:FairValueInputsLevel1Memberus-gaap:MoneyMarketFundsMemberus-gaap:FairValueMeasurementsRecurringMember2022-12-310000816761us-gaap:FairValueInputsLevel2Memberus-gaap:MoneyMarketFundsMemberus-gaap:FairValueMeasurementsRecurringMember2022-12-310000816761us-gaap:FairValueInputsLevel3Memberus-gaap:MoneyMarketFundsMemberus-gaap:FairValueMeasurementsRecurringMember2022-12-310000816761us-gaap:DefinedBenefitPlanEquitySecuritiesMemberus-gaap:FairValueMeasurementsRecurringMember2022-12-310000816761us-gaap:FairValueInputsLevel1Memberus-gaap:DefinedBenefitPlanEquitySecuritiesMemberus-gaap:FairValueMeasurementsRecurringMember2022-12-310000816761us-gaap:FairValueInputsLevel2Memberus-gaap:DefinedBenefitPlanEquitySecuritiesMemberus-gaap:FairValueMeasurementsRecurringMember2022-12-310000816761us-gaap:FairValueInputsLevel3Memberus-gaap:DefinedBenefitPlanEquitySecuritiesMemberus-gaap:FairValueMeasurementsRecurringMember2022-12-310000816761us-gaap:FixedIncomeFundsMemberus-gaap:FairValueMeasurementsRecurringMember2022-12-310000816761us-gaap:FixedIncomeFundsMemberus-gaap:FairValueInputsLevel1Memberus-gaap:FairValueMeasurementsRecurringMember2022-12-310000816761us-gaap:FixedIncomeFundsMemberus-gaap:FairValueInputsLevel2Memberus-gaap:FairValueMeasurementsRecurringMember2022-12-310000816761us-gaap:FixedIncomeFundsMemberus-gaap:FairValueInputsLevel3Memberus-gaap:FairValueMeasurementsRecurringMember2022-12-310000816761us-gaap:DefinedBenefitPlanRealEstateMemberus-gaap:FairValueMeasurementsRecurringMember2022-12-310000816761us-gaap:DefinedBenefitPlanRealEstateMemberus-gaap:FairValueInputsLevel1Memberus-gaap:FairValueMeasurementsRecurringMember2022-12-310000816761us-gaap:DefinedBenefitPlanRealEstateMemberus-gaap:FairValueInputsLevel2Memberus-gaap:FairValueMeasurementsRecurringMember2022-12-310000816761us-gaap:DefinedBenefitPlanRealEstateMemberus-gaap:FairValueInputsLevel3Memberus-gaap:FairValueMeasurementsRecurringMember2022-12-310000816761tdc:InsuranceContractMemberus-gaap:FairValueMeasurementsRecurringMember2022-12-310000816761tdc:InsuranceContractMemberus-gaap:FairValueInputsLevel1Memberus-gaap:FairValueMeasurementsRecurringMember2022-12-310000816761us-gaap:FairValueInputsLevel2Membertdc:InsuranceContractMemberus-gaap:FairValueMeasurementsRecurringMember2022-12-310000816761tdc:InsuranceContractMemberus-gaap:FairValueInputsLevel3Memberus-gaap:FairValueMeasurementsRecurringMember2022-12-310000816761us-gaap:FairValueMeasurementsRecurringMember2022-12-310000816761us-gaap:FairValueInputsLevel1Memberus-gaap:FairValueMeasurementsRecurringMember2022-12-310000816761us-gaap:FairValueInputsLevel2Memberus-gaap:FairValueMeasurementsRecurringMember2022-12-310000816761us-gaap:FairValueInputsLevel3Memberus-gaap:FairValueMeasurementsRecurringMember2022-12-310000816761tdc:InsuranceContractMember2022-01-012022-12-310000816761us-gaap:DefinedBenefitPlanEquitySecuritiesMemberus-gaap:FairValueMeasurementsRecurringMember2021-12-310000816761us-gaap:FairValueInputsLevel1Memberus-gaap:DefinedBenefitPlanEquitySecuritiesMemberus-gaap:FairValueMeasurementsRecurringMember2021-12-310000816761us-gaap:FairValueInputsLevel2Memberus-gaap:DefinedBenefitPlanEquitySecuritiesMemberus-gaap:FairValueMeasurementsRecurringMember2021-12-310000816761us-gaap:FairValueInputsLevel3Memberus-gaap:DefinedBenefitPlanEquitySecuritiesMemberus-gaap:FairValueMeasurementsRecurringMember2021-12-310000816761us-gaap:FixedIncomeFundsMemberus-gaap:FairValueMeasurementsRecurringMember2021-12-310000816761us-gaap:FixedIncomeFundsMemberus-gaap:FairValueInputsLevel1Memberus-gaap:FairValueMeasurementsRecurringMember2021-12-310000816761us-gaap:FixedIncomeFundsMemberus-gaap:FairValueInputsLevel2Memberus-gaap:FairValueMeasurementsRecurringMember2021-12-310000816761us-gaap:FixedIncomeFundsMemberus-gaap:FairValueInputsLevel3Memberus-gaap:FairValueMeasurementsRecurringMember2021-12-310000816761us-gaap:DefinedBenefitPlanRealEstateMemberus-gaap:FairValueMeasurementsRecurringMember2021-12-310000816761us-gaap:DefinedBenefitPlanRealEstateMemberus-gaap:FairValueInputsLevel1Memberus-gaap:FairValueMeasurementsRecurringMember2021-12-310000816761us-gaap:DefinedBenefitPlanRealEstateMemberus-gaap:FairValueInputsLevel2Memberus-gaap:FairValueMeasurementsRecurringMember2021-12-310000816761us-gaap:DefinedBenefitPlanRealEstateMemberus-gaap:FairValueInputsLevel3Memberus-gaap:FairValueMeasurementsRecurringMember2021-12-310000816761tdc:InsuranceContractMemberus-gaap:FairValueMeasurementsRecurringMember2021-12-310000816761tdc:InsuranceContractMemberus-gaap:FairValueInputsLevel1Memberus-gaap:FairValueMeasurementsRecurringMember2021-12-310000816761us-gaap:FairValueInputsLevel2Membertdc:InsuranceContractMemberus-gaap:FairValueMeasurementsRecurringMember2021-12-310000816761tdc:InsuranceContractMemberus-gaap:FairValueInputsLevel3Memberus-gaap:FairValueMeasurementsRecurringMember2021-12-310000816761us-gaap:FairValueMeasurementsRecurringMember2021-12-310000816761us-gaap:FairValueInputsLevel1Memberus-gaap:FairValueMeasurementsRecurringMember2021-12-310000816761us-gaap:FairValueInputsLevel2Memberus-gaap:FairValueMeasurementsRecurringMember2021-12-310000816761us-gaap:FairValueInputsLevel3Memberus-gaap:FairValueMeasurementsRecurringMember2021-12-310000816761tdc:InsuranceContractMember2020-12-310000816761tdc:InsuranceContractMember2021-01-012021-12-310000816761us-gaap:OtherPostretirementBenefitPlansDefinedBenefitMember2022-12-310000816761tdc:UnitedStatesSavingsPlanCostMember2022-01-012022-12-310000816761tdc:UnitedStatesSavingsPlanCostMember2021-01-012021-12-310000816761tdc:UnitedStatesSavingsPlanCostMember2020-01-012020-12-310000816761tdc:InternationalSubsidiarySavingsPlanCostMember2022-01-012022-12-310000816761tdc:InternationalSubsidiarySavingsPlanCostMember2021-01-012021-12-310000816761tdc:InternationalSubsidiarySavingsPlanCostMember2020-01-012020-12-310000816761us-gaap:CrossCurrencyInterestRateContractMember2022-12-31iso4217:EUR0000816761us-gaap:InterestRateSwapMember2018-06-012018-06-300000816761us-gaap:InterestRateSwapMember2018-06-300000816761us-gaap:InterestRateSwapMember2022-06-282022-06-280000816761us-gaap:InterestRateSwapMember2022-06-280000816761us-gaap:MediumTermNotesMembertdc:CreditAgreementIssuedInJune2022Memberus-gaap:LineOfCreditMember2018-06-300000816761us-gaap:InterestRateSwapMember2022-12-310000816761us-gaap:ForeignExchangeContractMember2022-12-310000816761us-gaap:ForeignExchangeContractMember2021-12-310000816761us-gaap:CrossCurrencyInterestRateContractMember2021-12-310000816761us-gaap:InterestRateSwapMember2021-12-3100008167612019-07-012019-07-31tdc:patent00008167612021-08-312021-08-310000816761us-gaap:InterestRateSwapMember2022-06-012022-06-300000816761us-gaap:InterestRateSwapMember2022-06-300000816761us-gaap:CrossCurrencyInterestRateContractMember2022-06-012022-06-300000816761us-gaap:CrossCurrencyInterestRateContractMember2022-06-300000816761us-gaap:InterestRateSwapMemberus-gaap:FairValueMeasurementsRecurringMember2022-12-310000816761us-gaap:InterestRateSwapMemberus-gaap:FairValueInputsLevel1Memberus-gaap:FairValueMeasurementsRecurringMember2022-12-310000816761us-gaap:InterestRateSwapMemberus-gaap:FairValueInputsLevel2Memberus-gaap:FairValueMeasurementsRecurringMember2022-12-310000816761us-gaap:InterestRateSwapMemberus-gaap:FairValueInputsLevel3Memberus-gaap:FairValueMeasurementsRecurringMember2022-12-310000816761us-gaap:CrossCurrencyInterestRateContractMemberus-gaap:FairValueMeasurementsRecurringMember2022-12-310000816761us-gaap:CrossCurrencyInterestRateContractMemberus-gaap:FairValueInputsLevel1Memberus-gaap:FairValueMeasurementsRecurringMember2022-12-310000816761us-gaap:FairValueInputsLevel2Memberus-gaap:CrossCurrencyInterestRateContractMemberus-gaap:FairValueMeasurementsRecurringMember2022-12-310000816761us-gaap:FairValueInputsLevel3Memberus-gaap:CrossCurrencyInterestRateContractMemberus-gaap:FairValueMeasurementsRecurringMember2022-12-310000816761us-gaap:InterestRateSwapMemberus-gaap:FairValueMeasurementsRecurringMember2021-12-310000816761us-gaap:InterestRateSwapMemberus-gaap:FairValueInputsLevel1Memberus-gaap:FairValueMeasurementsRecurringMember2021-12-310000816761us-gaap:InterestRateSwapMemberus-gaap:FairValueInputsLevel2Memberus-gaap:FairValueMeasurementsRecurringMember2021-12-310000816761us-gaap:InterestRateSwapMemberus-gaap:FairValueInputsLevel3Memberus-gaap:FairValueMeasurementsRecurringMember2021-12-310000816761us-gaap:MediumTermNotesMembertdc:CreditAgreementIssuedInJune2022Memberus-gaap:LineOfCreditMember2022-06-282022-06-280000816761us-gaap:MediumTermNotesMembertdc:CreditAgreementIssuedInJune2022Memberus-gaap:LineOfCreditMember2022-06-280000816761us-gaap:RevolvingCreditFacilityMembertdc:CreditAgreementIssuedInJune2022Memberus-gaap:LineOfCreditMember2022-06-282022-06-280000816761us-gaap:RevolvingCreditFacilityMembertdc:CreditAgreementIssuedInJune2022Memberus-gaap:LineOfCreditMember2022-06-280000816761us-gaap:LetterOfCreditMembertdc:CreditAgreementIssuedInJune2022Memberus-gaap:LineOfCreditMember2022-06-280000816761us-gaap:BridgeLoanMembertdc:CreditAgreementIssuedInJune2022Memberus-gaap:LineOfCreditMember2022-06-280000816761tdc:RevolvingCreditFacilityEndingInJune2023Memberus-gaap:RevolvingCreditFacilityMember2018-06-300000816761us-gaap:SeniorNotesMembertdc:SeniorUnsecuredTermLoanIssuedJune2018Member2018-06-300000816761tdc:RevolvingCreditFacilityEndingInJune2023Memberus-gaap:RevolvingCreditFacilityMember2022-06-282022-06-280000816761tdc:CreditAgreementIssuedInJune2022Memberus-gaap:LineOfCreditMember2022-06-282022-06-28tdc:renewal0000816761us-gaap:MediumTermNotesMembertdc:CreditAgreementIssuedInJune2022Memberus-gaap:LineOfCreditMember2022-12-310000816761tdc:RevolvingCreditFacilityEndingInJune2023Memberus-gaap:RevolvingCreditFacilityMember2021-12-310000816761tdc:RevolvingCreditFacilityEndingInJune2023Memberus-gaap:RevolvingCreditFacilityMember2022-12-310000816761tdc:SeniorUnsecuredtermloanIssuedJune2018Membertdc:TermLoanMember2021-12-310000816761tdc:SeniorUnsecuredtermloanIssuedJune2018Membertdc:TermLoanMember2020-12-310000816761tdc:SeniorUnsecuredtermloanIssuedJune2018Membertdc:TermLoanMember2022-12-310000816761tdc:TermLoanMember2022-12-310000816761srt:MinimumMember2022-12-310000816761srt:MaximumMember2022-12-31tdc:segment0000816761tdc:AmericasSegmentMemberus-gaap:OperatingSegmentsMember2022-01-012022-12-310000816761tdc:AmericasSegmentMemberus-gaap:OperatingSegmentsMember2021-01-012021-12-310000816761tdc:AmericasSegmentMemberus-gaap:OperatingSegmentsMember2020-01-012020-12-310000816761tdc:EMEASegmentMemberus-gaap:OperatingSegmentsMember2022-01-012022-12-310000816761tdc:EMEASegmentMemberus-gaap:OperatingSegmentsMember2021-01-012021-12-310000816761tdc:EMEASegmentMemberus-gaap:OperatingSegmentsMember2020-01-012020-12-310000816761tdc:APJSegmentMemberus-gaap:OperatingSegmentsMember2022-01-012022-12-310000816761tdc:APJSegmentMemberus-gaap:OperatingSegmentsMember2021-01-012021-12-310000816761tdc:APJSegmentMemberus-gaap:OperatingSegmentsMember2020-01-012020-12-310000816761country:US2022-01-012022-12-310000816761country:US2021-01-012021-12-310000816761country:US2020-01-012020-12-310000816761tdc:NorthAmericaAndLatinAmericaRegionExcludingUnitedStatesMember2022-01-012022-12-310000816761tdc:NorthAmericaAndLatinAmericaRegionExcludingUnitedStatesMember2021-01-012021-12-310000816761tdc:NorthAmericaAndLatinAmericaRegionExcludingUnitedStatesMember2020-01-012020-12-310000816761country:US2022-12-310000816761country:US2021-12-310000816761tdc:NorthAmericaAndLatinAmericaRegionExcludingUnitedStatesMember2022-12-310000816761tdc:NorthAmericaAndLatinAmericaRegionExcludingUnitedStatesMember2021-12-310000816761us-gaap:AccumulatedGainLossNetCashFlowHedgeParentMember2019-12-310000816761us-gaap:AccumulatedDefinedBenefitPlansAdjustmentMember2019-12-310000816761us-gaap:AccumulatedTranslationAdjustmentMember2019-12-310000816761us-gaap:AccumulatedGainLossNetCashFlowHedgeParentMember2020-01-012020-12-310000816761us-gaap:AccumulatedDefinedBenefitPlansAdjustmentMember2020-01-012020-12-310000816761us-gaap:AccumulatedTranslationAdjustmentMember2020-01-012020-12-310000816761us-gaap:AccumulatedGainLossNetCashFlowHedgeParentMember2020-12-310000816761us-gaap:AccumulatedDefinedBenefitPlansAdjustmentMember2020-12-310000816761us-gaap:AccumulatedTranslationAdjustmentMember2020-12-310000816761us-gaap:AccumulatedGainLossNetCashFlowHedgeParentMember2021-01-012021-12-310000816761us-gaap:AccumulatedDefinedBenefitPlansAdjustmentMember2021-01-012021-12-310000816761us-gaap:AccumulatedTranslationAdjustmentMember2021-01-012021-12-310000816761us-gaap:AccumulatedGainLossNetCashFlowHedgeParentMember2021-12-310000816761us-gaap:AccumulatedDefinedBenefitPlansAdjustmentMember2021-12-310000816761us-gaap:AccumulatedTranslationAdjustmentMember2021-12-310000816761us-gaap:AccumulatedGainLossNetCashFlowHedgeParentMember2022-01-012022-12-310000816761us-gaap:AccumulatedDefinedBenefitPlansAdjustmentMember2022-01-012022-12-310000816761us-gaap:AccumulatedTranslationAdjustmentMember2022-01-012022-12-310000816761us-gaap:AccumulatedGainLossNetCashFlowHedgeParentMember2022-12-310000816761us-gaap:AccumulatedDefinedBenefitPlansAdjustmentMember2022-12-310000816761us-gaap:AccumulatedTranslationAdjustmentMember2022-12-310000816761us-gaap:ReclassificationOutOfAccumulatedOtherComprehensiveIncomeMember2022-01-012022-12-310000816761us-gaap:ReclassificationOutOfAccumulatedOtherComprehensiveIncomeMember2021-01-012021-12-310000816761us-gaap:ReclassificationOutOfAccumulatedOtherComprehensiveIncomeMember2020-01-012020-12-310000816761us-gaap:AllowanceForCreditLossMember2021-12-310000816761us-gaap:AllowanceForCreditLossMember2022-01-012022-12-310000816761us-gaap:AllowanceForCreditLossMember2022-12-310000816761us-gaap:AllowanceForCreditLossMember2020-12-310000816761us-gaap:AllowanceForCreditLossMember2021-01-012021-12-310000816761us-gaap:AllowanceForCreditLossMember2019-12-310000816761us-gaap:AllowanceForCreditLossMember2020-01-012020-12-310000816761us-gaap:ValuationAllowanceOfDeferredTaxAssetsMember2021-12-310000816761us-gaap:ValuationAllowanceOfDeferredTaxAssetsMember2022-01-012022-12-310000816761us-gaap:ValuationAllowanceOfDeferredTaxAssetsMember2022-12-310000816761us-gaap:ValuationAllowanceOfDeferredTaxAssetsMember2020-12-310000816761us-gaap:ValuationAllowanceOfDeferredTaxAssetsMember2021-01-012021-12-310000816761us-gaap:ValuationAllowanceOfDeferredTaxAssetsMember2019-12-310000816761us-gaap:ValuationAllowanceOfDeferredTaxAssetsMember2020-01-012020-12-31
UNITED STATES
SECURITIES AND EXCHANGE COMMISSION
Washington, D.C. 20549
FORM 10-K | | | | | |
| ☒ | ANNUAL REPORT PURSUANT TO SECTION 13 OR 15 (d) OF THE SECURITIES EXCHANGE ACT OF 1934 |
For the fiscal year ended December 31, 2022
OR | | | | | |
| ☐ | TRANSITION REPORT PURSUANT TO SECTION 13 OR 15(d) OF THE SECURITIES EXCHANGE ACT OF 1934 |
For the transition period from to
Commission File Number 001-33458
TERADATA CORPORATION
(Exact name of registrant as specified in its charter) | | | | | | | | |
| Delaware | | 75-3236470 |
(State or other jurisdiction of
incorporation or organization) | | (I.R.S. Employer
Identification No.) |
17095 Via Del Campo
San Diego, California 92127
(Address of principal executive offices) (Zip Code)
Registrant’s telephone number, including area code: (866) 548-8348
Securities registered pursuant to Section 12(b) of the Act: | | | | | | | | | | | | | | |
| Title of each class: | | Trading Symbol | | Name of Each Exchange on which Registered: |
| Common Stock, $0.01 par value | | TDC | | New York Stock Exchange |
Indicate by check mark if the registrant is a well-known seasoned issuer, as defined in Rule 405 of the Securities Act. Yes ý No ¨
Indicate by check mark if the registrant is not required to file reports pursuant to Section 13 or Section 15 (d) of the Act. Yes ¨ No ý
Indicate by check mark whether the registrant (1) has filed all reports required to be filed by Section 13 or 15 (d) of the Securities Exchange Act of 1934 during the preceding 12 months (or for such shorter period that the registrant was required to file such reports), and (2) has been subject to such filing requirements for the past 90 days. Yes ý No ¨
Indicate by check mark whether the registrant has submitted electronically every Interactive Data File required to be submitted pursuant to Rule 405 of Regulations S-T (§232.405 of this chapter) during the preceding 12 months (or for such shorter period that the registrant was required to submit such files). Yes ý No ¨
Indicate by check mark whether the Registrant is a large accelerated filer, an accelerated filer, a non-accelerated filer, a smaller reporting company, or an emerging growth company. See the definitions of "large accelerated filer," "accelerated filer," "smaller reporting company," and "emerging growth company" in Rule 12b-2 of the Exchange Act. | | | | | | | | | | | | | | | | | |
| Large accelerated filer | ý | | Accelerated filer | | ¨ |
| Non-accelerated filer | ¨ | | Smaller reporting company | | ☐ |
| | | Emerging growth company | | ☐ |
If an emerging growth company, indicate by check mark if the registrant has elected not to use the extended transition period for complying with any new or revised financial accounting standards provided pursuant to Section 13(a) of the Exchange Act ¨
Indicate by check mark whether the registrant has filed a report on and attestation to its management’s assessment of the effectiveness of its internal control over financial reporting under Section 404(b) of the Sarbanes-Oxley Act (15 U.S.C. 7262(b)) by the registered public accounting firm that prepared or issued its audit report. Yes ☒ No ¨
Indicate by check mark whether the registrant is a shell company (as defined in Rule 12b-2 of the Exchange Act). Yes ☐ No ý
The aggregate market value of voting stock held by non-affiliates of the registrant as of June 30, 2022, was approximately $3.8 billion.
At January 31, 2023, there were 100.8 million shares of common stock outstanding.
DOCUMENTS INCORPORATED BY REFERENCE | | | | | |
| Part III: | Portions of the registrant’s Notice of Annual Meeting of Stockholders and Proxy Statement, to be filed with the Securities and Exchange Commission pursuant to Regulation 14A within 120 days after registrant’s fiscal year end of December 31, 2022 are incorporated herein by reference. |
TABLE OF CONTENTS
| | | | | | | | |
| | |
| Item | Description | Page |
| | |
| | |
| 1. | | |
| 1A. | | |
| 1B. | | |
| 2. | | |
| 3. | | |
| 4. | | |
| | |
| | |
| | |
| 5. | | |
| 6. | | |
| 7. | | |
| 7A. | | |
| 8. | | |
| 9. | | |
| 9A. | | |
| 9B. | | |
| 9C. | | |
| | |
| | |
| | |
| 10. | | |
| 11. | | |
| 12. | | |
| 13. | | |
| 14. | | |
| | |
| | |
| | |
| 15. | | |
| 16. | | |
| | |
This report contains trademarks, service marks, and registered marks of Teradata Corporation and its subsidiaries, and other companies, as indicated.
PART I
FORWARD-LOOKING STATEMENTS
Forward-looking statements in our public filings or other public statements are subject to known and unknown risks, uncertainties and other factors that may cause our actual results, performance or achievements to be materially different from any future results, performance or achievements expressed or implied by such forward-looking statements or other public statements. These forward-looking statements were based on various facts and were derived utilizing numerous important assumptions and other important factors, and changes in such facts, assumptions or factors could cause actual results to differ materially from those in the forward-looking statements. Forward-looking statements include the information concerning our expected future financial and reporting performance, business strategy and trends, projected plans and objectives, liquidity, financial guidance, capital allocation, including share repurchase plans, and market conditions. Statements preceded by, followed by or that otherwise include the words "believe," "expects," "anticipates," "intend," "project," "estimate," "plan," "increase," "fluctuate," "strive," "looking ahead," "outlook," "guidance," "forecast," "continue," "likely," "potential," "drive," and similar expressions or future or conditional verbs such as "will," "should," "would," "may" and "could" are generally forward-looking in nature and not historical facts. You should understand that the factors described under "Risk Factors" and the following important factors could affect our future results and could cause actual results to differ materially from those expressed in such forward-looking statements:
•Our ability to timely and effectively execute our strategy, including our initiatives to provide and enhance our offerings for cloud environments and market acceptance of our cloud platform;
•Our ability to rapidly and successfully develop and introduce new solutions that include highly advanced technology, and the increased difficulty and complexity associated with producing new offerings with greater capacity, delivery and performance capabilities, which may increase the likelihood of reliability, quality and operability issues;
•The rapidly changing and intensely competitive nature of the information technology ("IT") industry and the analytic data platform business, including the ongoing consolidation activity, new and emerging analytic data technologies and competitors, and pressure on achieving continued price/performance gains for analytic data product offerings and solutions;
•Fluctuations in our operating results, timing of transactions, customer cancellations or non-renewals of subscription arrangements or support services, unanticipated delays or accelerations in our sales cycles and the difficulty of accurately estimating revenues;
•Risks associated with data privacy, cyberattacks and maintaining secure and effective products for our customers, as well as, internal IT and control systems;
•The impact of global economic fluctuations on the markets in general or on the ability of our suppliers and customers to meet their commitments to us, or the timing of purchases by our current and potential customers, including the potential impacts of catastrophic events, epidemics, pandemics, inflation, recessions, and/or labor availability on global economies; and
•Risks inherent in operating in foreign countries, including the impact of foreign currency fluctuations, economic, political, legal, regulatory, compliance, cultural, public health, and other conditions abroad.
Other factors not identified above, including the risk factors described in the section entitled "Risk Factors" included in this Annual Report on Form 10-K ("Annual Report"), may also cause actual results to differ materially from those projected by our forward-looking statements. Most of these factors are difficult to anticipate and are generally beyond our reasonable control. We undertake no obligation to release publicly any revisions to any forward-looking statements, to report events or to report the occurrence of unanticipated events.
Item 1. BUSINESS
Overview. Teradata Corporation ("we," "us," "Teradata," or the "Company") is a leading connected multi-cloud data platform for enterprise analytics, focused on helping companies leverage all their data across an enterprise, at scale. In doing so, we help companies find answers to their toughest business challenges in order to help them improve performance and drive growth. All of our efforts are in support of our purpose of transforming how businesses work and people live through the power of data.
With an ongoing commitment to profitable growth, Teradata has broadened its market opportunity by evolving into a leading connected multi-cloud data platform for enterprise analytics company from a provider of on-premises only, enterprise data warehouse solutions. We help our customers use analytics to derive business value from diverse data types, integrate and simplify their data and analytics ecosystem, and streamline access and management of data.
Our target market focuses on organizations that are among the world's most demanding, large-scale users of data. As data volumes grow exponentially along with increasing sources of data, we see these enterprises increasingly move to cloud-based analytic and data technologies. With companies pivoting to invest in the cloud, we believe it is essential for these enterprises to be able to integrate ecosystems across multi-cloud and on-premises environments, simplify access to data wherever it resides, and accommodate analytics at massive scale and speed to derive significant business value. Teradata is unique in our ability to address the full spectrum of analytics needs—from cloud-only to multi-cloud to hybrid and on-premises. As a result, we believe that the market for our products and services is large and growing.
Our customers use Teradata® technologies and innovations in leveraging data to solve their business challenges and drive business outcomes, which can include, among other things:
•digital identity management,
•financial visibility,
•resilient supply chains,
•fraud prevention,
•customer acquisition and retention,
•artificial intelligence and machine learning (AI/ML),
•regulatory compliance, and
•operational resilience.
Teradata offers a complete cloud analytics and data platform, with next-generation, cloud-native deployment and expansive analytics capabilities. Leading with Teradata VantageCloud, our technology platform uniquely allows companies to leverage all their data across an enterprise, whether in public or private clouds, in a multi-cloud environment, or on-premises. Our technology innovations connect multiple sources of data to drive ecosystem simplification, deliver multi-dimensional scale and integration, and support customers in deriving insights from their analytics and data. We offer full integration of datasets, tools, analytical languages and functions, including leading commercial and open source technologies, so that customers can use the toolsets of their choice. Our open platform, Teradata Vantage™, comprises deployment options that address the full span of analytics and data needs of:
•Teradata VantageCloud, including Teradata VantageCloud Lake, built on our cloud-native lake architecture, Teradata VantageCloud Enterprise for IT-managed enterprise workloads,
•ClearScape Analytics™, our broad analytics capabilities with in-database functionality, available across all of our deployment options, and
•Teradata VantageCore, our on-premises data and analytics offering, which seamlessly integrates with our cloud offerings to enable hybrid environments that large enterprises currently demand.
Teradata is a leader in cloud-based analytics, as recognized by leading industry analysts. We help companies smoothly move to the cloud, migrating a company's data to a cloud-based ecosystem by running the same software platform in all deployments—in cloud or on-premises—providing software license portability, data and workload automation tools, as well as associated services. Teradata VantageCloud Lake is a cloud-native software-as-a-service (“SaaS”) offering designed to rapidly accelerate business outcomes for virtually any use case, including ad hoc, exploratory, and departmental workloads. Teradata VantageCloud Enterprise is used for critical, IT-managed at-scale enterprise workloads. Overall, Teradata VantageCloud is designed to provide an optimized total cost of ownership across all workloads, financial governance, and business autonomy that we believe our target market of large enterprises demands.
ClearScape Analytics provides the holistic analytics capabilities of our portfolio, and is designed to be a secure, highly concurrent, and resilient analytics offering that provides in-database analytics functionality across advanced
calculations, data preparation, and significant machine learning capabilities. Our ClearScape Analytics capabilities provide the analytics enterprises need to improve business performance and drive profitable growth.
Our business consulting services include a broad range of offerings, including helping organizations establish a data and analytics vision, enable a multi-cloud ecosystem architecture, and identify and operationalize opportunities to ensure their data and analytics ecosystem investments deliver significant value. In addition, we offer robust support and maintenance services for our offerings. We also work closely with the top global systems integrators to enable customers to derive value from their Teradata technologies.
Teradata offers flexible purchase options for customers through our subscription offerings. We also offer "pay for what you use" consumption pricing. These flexible pricing options enable our customers to reduce complexity, risk, and cost.
Teradata operates with a flexible work environment, offering employees the choice of working where they can be most productive. Our global workforce is located in approximately 40 countries, and our corporate headquarters are in San Diego, California.
For the calendar year ended December 31, 2022, we had total revenues of $1.795 billion, of which approximately 58% was derived from the Americas region (North America and Latin America) and 42% from the International regions (Europe, Middle East, Africa, Asia Pacific and Japan). For financial information about our segments and geographic information, see "Note 14-Segment, Other Supplemental Information and Concentrations" in the Notes to Consolidated Financial Statements in this Annual Report.
History. Teradata was incorporated in 1979 as a Delaware corporation. After being acquired, Teradata eventually was spun off and became a publicly traded company named Teradata Corporation (NYSE: TDC) on September 30, 2007.
Industry and Market Opportunity. Leveraging data and analytics is a management priority for industry-leading companies as a means to drive growth, and that has resulted in a multi-billion dollar and growing data management and analytics market. We believe that companies are facing significant ongoing increases in data volumes and proliferation of data silos. Furthermore, the agility provided by cloud-based technologies provides significant benefit, but also creates complexity, with the rise of ecosystems that must span multiple cloud and on-premises environments. These factors all contribute to the increased complexity, cost, and risk associated with managing data and analytic environments. This is particularly true for our target market of global enterprise companies, and we believe that these companies require tightly integrated solutions that can accommodate significant scale and speed. We are focused on helping our large base of customers migrate to the cloud, expanding customers’ workloads in the cloud, and growing software consumption within our customer base. We also focus on acquiring new customers.
Our Strategy. Our strategy is to provide the leading connected multi-cloud data platform for enterprise analytics, in support of our purpose of transforming how companies work and people live through the power of data. Teradata is in a period of exciting transformation aligning our organization to be “cloud-first” across all parts of our business, as we consistently drive for profitable growth. In this regard, our strategic objectives are to:
•further strengthen our multi-cloud data platform offering, with our next generation cloud-native capabilities through Teradata VantageCloud Lake and Teradata VantageCloud Enterprise;
•establish Teradata’s position as a cloud-native platform with leading advanced analytics capabilities;
•enable end-to-end business outcomes through a seamless user experience;
•expand our product capabilities through deeper integration with cloud ecosystems;
•focus on partner enablement to drive solution execution on our open data platform;
•accelerate our cloud-first strategy by supporting our customers on their cloud migration journeys;
•expand customer footprints by onboarding new workloads in existing and new business buying centers;
•deepen relationships with strategic public cloud service providers, systems integrators, independent software vendors, and resellers;
•expand our go-to-market reach by onboarding new customers, making vertical investments, expanding customer success programs, and strengthening our partner relationships; and
•deliver operational excellence through efficient cost management and execution.
Our analytics and data offering is a scalable, secure, highly concurrent and resilient data platform that is designed to help companies solve complex data challenges at scale. We provide a data management solution that enables enterprises to support their data and analytic ecosystems, enable consistent data across business units, and easily grow and scale. Furthermore, as demand shifts to the cloud, we provide enterprise customers with the flexibility to address their hybrid and multi-cloud data and analytics needs, empowering operational, ad-hoc analytic and mixed workloads, whether in the cloud or on-premises.
We believe we are differentiated by providing our analytics and data platform offering across a secure, multi-cloud ecosystem. Our differentiated approach spans deployments in any of the top public cloud offerings including Amazon Web Services (AWS), Microsoft Azure, and Google Cloud, as well as private cloud platform instances, on- premises, or hybrid environments.
Our "data fabric" is a data integration and management layer included with our Teradata Vantage offerings that serves as the connective tissue in multi-cloud and between cloud, and on-premises environments. This technology innovation is designed to reduce data silos, as it brings data together and enables consistent data access across the ecosystem, so that users can query data regardless of where it lies. With our data fabric, we enable analytics and data integration across public clouds for a true multi-cloud experience that large enterprises are investing in to leverage diverse capabilities across multiple ecosystems and mitigate risk.
Furthermore, we augment these offerings with our "pay as you go" consumption pricing that provides flexibility for customers who desire to expand their analytics and data capabilities on an as-needed basis. The multi-cloud capability and consumption pricing combine to enable our customers to address their analytics needs, and de-risk their investments and buying decisions, as well as provide public cloud vendor flexibility. With cloud elasticity and our multi-dimensional scalability, customers can quickly grow their analytics to scale to provide robust business outcomes.
As customers increasingly grow their cloud-based analytic ecosystems, our strategy supports existing customers on that journey with the fastest path to migration that is enabled through license portability, the same software enabled whether on-premises or in the cloud, and a data fabric that connects all environments, as well as data and workload migration tools and services.
We also offer a competitive and compelling total cost of ownership by building out best-in-class capabilities that are designed to provide an easy experience for ingestion, exploration, development, consumption and operationalization of data and analytics. With a focus on delivering an outstanding user experience and an ability to start small and easily scale in the cloud, we are attracting new customers, migrating existing customers to the cloud with Teradata VantageCloud, and seeing customers expand their Teradata cloud environments.
Furthermore, with increasingly fragmented ecosystems consisting of multiple data inputs, Teradata provides an open platform approach, enabling integration into cloud and partner ecosystems. This integration extends the data and analytical capabilities of our offerings, allowing our customers greater flexibility to leverage the tools of their choice, deployed on top of a scalable and robust data platform. By empowering customers and partners to build how they like, we believe that we enable hundreds of business outcomes that can help our customers improve business performance and drive growth.
Our strategy is further supported by our commitment to be a responsible corporate citizen. We believe it is our responsibility to make a positive impact on and support important issues, such as addressing the climate crisis and environmental sustainability, promoting diversity, equity and inclusion, being a company that does not tolerate racism, supporting communities where we live and work, protecting data privacy, and acting ethically in everything we do. We actively engage with our people in a way that we believe is supportive of a culture where they can feel comfortable bringing their authentic and genuine selves to work.
Customers. Teradata concentrates our marketing and go-to-market efforts on enterprise companies that are seeking to improve business performance and view data as a strategic asset in achieving that objective. We focus on business, analytics, and technology buyers. We particularly focus on the following industries: Financial Services, Government, Healthcare and Life Sciences, Manufacturing, Retail, Telecommunications, and Travel/Transportation. We believe that these industries provide a good fit for our analytic solutions and services as they typically have the greatest analytic potential with large and growing data volumes, as well as complex data management requirements,
and large and varied groups of users. We currently do not have any customer that represents 10% or more of our total revenue.
Seasonality. Historically, our new contract bookings and renewals are seasonal, in line with customer spending patterns, with lower volume typically in the first quarter and higher volume generally in the fourth quarter of each calendar year. Such seasonality causes our working capital cash flow requirements to vary from quarter to quarter depending on the variability in the volume, timing of invoices and subsequent collection, and mix of platform sales. Historically, cash provided by operating activities is higher in the first half of the year due to collections of the higher receivable balances at December 31 driven by the higher contract bookings in the fourth quarter and receipts from annual renewals of our maintenance support agreements. In addition, contract bookings in the third month of each quarter has historically been significantly higher than in the first and second months. These factors, among others as more fully described in Item 1A, Risk Factors, in this Annual Report, make forecasting more difficult and may adversely affect our ability to accurately predict financial results. The size and complexity of our sales transactions can make for lengthy sales cycles which can also lead to less predictability of quarterly transactions.
However, we have transitioned the vast majority of our customers from perpetual to subscription-based purchasing options. As a result, our revenue from sales is ratable which generally increases the predictability of our revenue and the durability of our cash flows in the future. The majority of our customer contracts are based on a blended pricing model which provides a fixed capacity but also offers the customer an optional burst of consumption for seasonal activity. By also offering consumption pricing, our customers are enabled to reduce complexity, risk, and cost.
Sales, Marketing, Customer Services and Partners
Sales and Marketing. We primarily sell and market our solutions and services through a direct sales force. We have greater than 80% of our employees in customer-facing and/or revenue-driving roles (including sales, marketing, consulting, customer success, product engineering, and customer services).
We support our sales force with marketing and training programs that are designed to:
•grow awareness of Teradata as a multi-cloud leader, highlighting our technology leadership and innovation, differentiation, cloud, and analytics expertise;
•lead customers on their migration to the cloud with the benefits of multi-cloud and hybrid cloud capabilities, and then help them easily expand their environment when needed;
•create demand for, and adoption and expanded use of, our technologies: Teradata VantageCloud, Teradata Vantage, and ClearScape Analytics, as well as related services;
•educate and enable the sales force with the skills and knowledge to deliver our value proposition; and
•provide a robust set of tools for use by our sales teams.
Teradata focuses our brand messaging on our strength as a leading connected multi-cloud data platform for enterprise analytics. To support our growth objectives, we employ a broad range of modern marketing strategies, including programs to inform, educate and generate demand with customers and prospects, as well as keep our leading technology position at the forefront of the media, industry analysts, academics, and other influencers. These strategies include our global website, digital marketing, demos and trials of our software, webinars, conferences and events, public and media relations, social media, an extensive customer reference program, and targeted account-based marketing.
Customer Services. Our global customer services organization is dedicated to creating and sustaining an optimal customer experience, while driving predictable growth in annual recurring revenue. This organization focuses on ensuring that Teradata delivers business value and enables innovative use of our platform—ultimately retaining and driving greater consumption of our technology.
Strategic Partnerships. We seek to extend our sales and marketing reach by partnering with cloud service providers, alliance partners (including independent software vendors, open-source software distributors, and resellers), leading global and regional systems integrators, consultants, and universities that we believe complement our differentiated offerings. Strategic partnerships are a key element in our ability to leverage the value and expand the scope of our data and analytics platform offering in the marketplace.
•Cloud Service Providers: Teradata has established partnerships with the top three global public cloud service providers: AWS, Microsoft Azure, and Google Cloud. We work to continuously strengthen these partnerships so that Teradata can provide companies around the globe access to Teradata VantageCloud, our offering in the public cloud.
•Alliance Partners: Teradata has a focus on working collaboratively with independent software vendors in several areas, including AI/ML, tools, data and application integration solutions, data mining, analytics, business intelligence, and specific analytic and industry solutions. Our goal is to provide choices to our customers with partner offerings that are optimized and certified to work with the Teradata Vantage platform to deliver end-to-end data and analytic solutions and to provide comprehensive capabilities that support the customer’s analytic ecosystem.
•Systems Integrators and Consultants: We also work with a range of systems integrators and consultants who engage in the design, implementation, and integration of data warehouse and analytic solutions and analytic applications for our joint customers. Our strategic partnerships with select global and regional consulting and systems integration firms provide broad industry and technology expertise in the design of business solutions that leverage Teradata technology to enable enterprise analytics.
Competition. We compete in a large and growing data management and analytics market that is attractive to both current and new competitors. Participants in our cloud market include cloud data vendors (such as Amazon Web Services, Google Cloud, Microsoft Azure, and Snowflake) while the market for our other offerings includes traditional competitors such as IBM, Oracle, and SAP, as well as other open-source providers. We believe our focus on multi-cloud ecosystem simplification, providing solutions for the most scalable and complex workloads, and providing products designed to achieve desired business outcomes of our customers, enables us to successfully compete within our target market. We believe that our technology innovations of the Teradata Vantage platform, including Teradata VantageCloud, and ClearScape Analytics are highly differentiated, deliver substantive scale and integration, and are uniquely positioned to provide significant business value to our customers. Furthermore, we provide our customers with the opportunity to de-risk their buying decisions with the ability to deploy across the top public clouds, private cloud and on-premises, coupled with flexibility in purchasing and portable licensing. For more information on competition, see Item 1A, Risk Factors, in this Annual Report.
We believe that the principal competitive factors for our products and services include: data and analytics experience; business outcome delivery; multi-cloud offerings and experience; total cost of ownership; customer references; technology leadership; product quality; performance, scalability, availability, and manageability; partner relationships; support and consulting services capabilities; management of technologies in a complex analytical ecosystem; and industry knowledge.
Research and Development ("R&D"). We remain focused on designing and developing our analytics and data platform that anticipates our customers' evolving needs and supports solving their complex business challenges. Our teams are extending Teradata technologies and innovations: the Teradata Vantage platform, including Teradata VantageCloud, and ClearScape Analytics, in order to have consistent and differentiated capabilities that meet the demands of todays’ multi-cloud and hybrid ecosystems. We have delivered significant innovations such as VantageCloud Lake, our cloud-native analytics and data offering. With extensive in-database functionality, seamless and expedited interconnectivity, and robust features for easy operationalization, ClearScape Analytics enables companies to scale AI/ML quicker and more effectively.
We are simplifying our customers' journeys to cloud, empowering compelling analytics, as well as enabling a transformative cloud experience. With a focus on creating a truly open platform, we continue to build a deep integration with cloud data and analytic ecosystems, including advanced analytics and AI/ML tools. Furthermore, with our strong partnerships, our R&D team is extending our platform to enable deeper integration with a broader range of solution and services providers.
Our extensive and talented R&D workforce is one of our core strengths. Our R&D team is globally dispersed to take advantage of global engineering talent. We anticipate that we will continue to have significant R&D expenditures, which may include complementary strategic acquisitions, to help support the flow of innovative, high-quality cloud-based data and analytic offerings.
Intellectual Property and Technology. We own 612 patents in the United States. We are also the exclusive licensee of four additional patents in the United States and counterpart patents in foreign countries. Many of the patents that we own are licensed to others, and we are licensed to use certain patents owned by others. While our portfolio of patents and patent applications in aggregate is of significant value to our Company, we do not believe that any individual patent is by itself of material importance to our business.
In addition, we own copyrights and trade secrets in our code base that comprises all of the Teradata software offerings, including analytic data platforms and analytic applications and capabilities. Teradata’s software offerings reflect the investment of hundreds of person-years of development work.
The source code versions of our offerings are protected as trade secrets and, in all major markets, as unpublished copyright works. We take great efforts to protect our rights in all software offerings and related intellectual property; however, there can be no assurance that these measures will be successful. The Company owns the Teradata® word and logo trademarks, which are registered in the United States and in many foreign countries, as well as other trade names, service marks, and trademarks.
Sources of Materials. Our hardware components are assembled and configured by Flex Ltd. ("Flex"). Our platform line is designed to leverage the components from manufacturers that we believe are industry leaders. Our data storage devices and memory components utilize industry-standard technologies but are selected and configured to work optimally with our software and hardware platform. Flex also procures a wide variety of components used in the assembly process on our behalf. Although many of these components are available from multiple sources, Teradata utilizes preferred supplier relationships to better ensure more consistent quality, cost and delivery. Typically, these preferred suppliers maintain alternative processes and/or facilities to ensure business continuity of supply. Given our strategy to outsource product assembly activities to Flex and to source certain components from single suppliers, a disruption in production at Flex or at a supplier, a global shortage of components, commodity, transportation, and/or inflationary pressures could impact the timing or profitability of customer shipments. In addition, a significant change in the forecasts to any of these preferred suppliers could result in purchase obligations for components that may be in excess of demand. Although we did not experience significant disruptions in our supplier relationships during the COVID-19 pandemic, nor have we experienced issues from inflationary challenges or otherwise, the current inflation environment could present potential supply chain uncertainty, and we have implemented programs to mitigate these potential risks. For more information, see Item 1A, Risk Factors in this Annual Report.
Human Capital
Teradata’s people management objectives are to attract, retain, and develop the highest quality of diverse and inclusive talent, which allows our employees to thrive while positioning us to execute our Company strategy and drive profitable growth. Our future success depends on our ability to attract and retain highly skilled and innovative talent in all areas of our Company, with a heightened focus on sales and cloud talent. Competition for acquiring top talent and retaining our highly skilled people is intense throughout the IT industry. Our programs are designed to align to our core principles and focus on meaningful work, enabled management, a positive and inclusive workplace environment, career growth opportunities, and transparent and trustworthy leadership. We also provide complete flexibility to our workforce to choose whether they will work remote or hybrid, as well as offering competitive pay, and comprehensive health and wellness benefits and programs.
As of December 31, 2022, we had approximately 7,000 employees globally, with approximately 30% employed in the United States and 70% across the rest of the world. Our global workforce is critical to our overall business strategy across target markets. During fiscal 2022, our overall headcount decreased slightly as we continue to align and optimize our talent needs to drive our cloud-first and profitable growth strategy.
Culture Transformation. At Teradata, we transform how businesses work and people live through the power of data. We are deliberate in ensuring our culture supports our purpose and strategy. We strive to embody our core principles in all we do; and we recognize and reward behavior aligned to our core principles. We believe every employee plays a role in transforming our culture to meet the needs of the future. We are committed to work, learn, and grow together to help ensure our success.
We are committed to the following core principles to make sure we are fulfilling our purpose:
•accountability to each other
•agility in execution, and
•customer and market driven.
We value every member of the team because bringing together different voices makes us stronger and accelerates the momentum we need to create true transformation together.
Diversity, Equity, and Inclusion. Teradata’s core strength is our people, and creating an inclusive workplace where everyone feels safe and welcome being their genuine and authentic selves is a key focus for us. We are an equal opportunity employer, committed to sustaining a world-class team by providing an environment that is intentionally inclusive and fully encourages and leverages diversity in all aspects of our business.
We have many people and culture initiatives, with a strong focus on diversity, equity, and inclusion ("DEI").
•Our executive team and employee allies have signed a pledge committing to DEI and anti-racism.
•We have a DEI Advisory Board to support our mission to eradicate racism and inequality in the workplace.
•We provide resources and tools for our employees to help them engage within culturally- and geographically-dispersed work teams to enable a culture of growth, learning, and collaboration.
•We continue to empower our Inclusion Communities, which are networks of employees who unite based on shared characteristics, life experiences, or common interests. These communities are designed to provide support, networking and enhanced career and personal development. These networks include Teradata Alliance of Black Employees, Blend (a community for employees in India), Veterans Community, Teradata Pride, HISPA (Hispanic and Latin Allies), Women of Teradata, Green Agenda, Terabytes (work-life integration), Toastmasters International, and Asian and Pacific Islander Inclusion Community.
•In further support of the communities where we operate and live, we offer a global Diversity in Technology Scholarship Program for underrepresented minorities and women who are pursuing STEM-related degrees.
•Teradata earned a score of 100 out of 100 in the Human Rights Campaign Corporate Equality Index 2022 (CEI), a benchmarking survey and report that measures corporate policies and practices related to LGBTQ+ equality.
We believe that a diverse workforce is critical to our success, and we will continue to focus on the hiring, retention and advancement of underrepresented minorities and women in technology.
Health, Safety, and Wellness. We are committed to the health, safety, and wellness of our employees. We provide our employees and their families a variety of flexible and convenient health and wellness programs.
Compensation and Benefits. A key to our attraction, retention, and engagement strategies are the robust compensation and benefit programs we provide that are designed to meet the varied and evolving needs of a global and diverse workforce. In addition to our competitive base pay, these programs (which vary by country/region) include sales incentives, annual bonuses, stock awards, an Employee Stock Purchase Plan, a 401(k) Savings Plan with a company match, healthcare and insurance benefits, paid time off, family leave, and paid parental leave. As an example of our commitment to DEI, we ensure that all of our benefits provide coverage for domestic partners.
Talent Development. Teradata is committed to supporting the professional development of our employees by providing resources and tools that enable employees to manage their careers. Our talent programs provide employees with the resources to develop their careers, build leadership skills, and lead within their organizations. We have launched on-demand learning resources, such as LinkedIn Learning and Country Navigator, which give employees flexibility in when and how they learn. Our Learning Labs focus on understanding Culture Transformation and our Core Principles, Inclusive Leadership, and Building Your Personal Brand. We also provide executive and leadership development programs to help develop leaders at all levels.
Community Engagement. We believe that building connections between our employees, their families, and our communities creates a more meaningful, fulfilling, and enjoyable workplace. We support local STEM education programs to ensure emerging leaders in our communities have opportunities to explore their interests. Our Teradata Cares program empowers our employees to help build strong and vibrant communities, improve quality of life, and make a positive difference where we live and work through volunteerism and giving. We support our employees’ giving and volunteer efforts by providing matching donations for employee contributions to qualified not-for-profit
agencies, project grants, Annual Days of Caring, and supporting communities where we have employee populations. To further enable employees to support the charity of their choice, we afford every employee four days a year, during normal working hours, for volunteer efforts of their choice.
Properties and Facilities. Our corporate headquarters is located in San Diego, California. As of December 31, 2022, we operated 44 facilities in 31 countries throughout the world. We own our San Diego complex, while all other facilities are leased.
Information About Our Executive Officers. The following table and biographies sets forth information as of February 24, 2023 regarding the individuals who are serving as our executive officers. | | | | | | | | |
| Name | Age | Position(s) |
| Stephen McMillan | 52 | President and Chief Executive Officer |
| Hillary Ashton | 51 | Chief Product Officer |
| Claire Bramley | 45 | Chief Financial Officer |
| Todd Cione | 53 | Chief Revenue Officer |
| Kathleen Cullen-Cote | 58 | Chief People Officer |
| Michael Hutchinson | 57 | Chief Customer Officer |
| Margaret Treese | 56 | Chief Legal Officer |
| Jacqueline Woods | 61 | Chief Marketing Officer |
Stephen McMillan. Stephen McMillan is the Company’s President and Chief Executive Officer and has served in this role since joining the Company in June 2020. Mr. McMillan has served on the Company’s Board of Directors since June 2020. Previously, he served as the Executive Vice President of Global Services for F5 Networks, Inc., a transnational company that specializes in application services and application delivery networking, from October 2017 when he joined F5 until May 2020. Prior to joining F5, from September 2015 until October 2017, he was Senior Vice President, Customer Success and Managed Cloud Services at Oracle, where he was responsible for developing, overseeing, and expanding a customer success organization focused on the company’s strategic SaaS portfolio. From May 2012 to September 2015, he served as Senior Vice President, Managed Cloud Services at Oracle. Prior to joining Oracle, Mr. McMillan spent 19 years at IBM, where he held a number of leadership roles focused on global managed services, consulting, and IT.
Hillary Ashton. Hillary Ashton is the Company’s Chief Product Officer and has served in this role since August 2020. Prior to that Ms. Ashton served as the Executive Vice President of Teradata Products from November 2019, when she joined the Company, until August 2020. Prior to joining Teradata, she served as Executive Vice President and General Manager of PTC’s Augmented Reality (AR) business unit from July 2018 until November 2019. In this role, she was responsible for all operational aspects of the Vuforia business and its product lines, including executive leadership and vision, strategy, sales, and marketing. From 2014 to 2018, she served as SVP of Analytics SaaS solutions at Manthan and as Director, Customer Intelligence Solutions at SAS from 2003 to 2014.
Claire Bramley. Claire Bramley is the Company's Chief Financial Officer and has served in this role since joining Teradata in June 2021. She served as the Global Controller for HP Inc. from December 2018 until June 2021. From June 2015 until December 2018, she served as HP's Regional Head for Finance for EMEA, and from January 2013 to May 2015, she served as Vice President, Corporate Financial Planning and Analysis at HP. Prior to that, Ms. Bramley served as HP's Finance Director of Worldwide Personal Systems Financial Planning & Analysis from September 2011 to December 2012. Ms. Bramley also serves on the Board of Directors of Ansys, Inc.
Todd Cione. Todd Cione is the Company’s Chief Revenue Officer and has served in this role since joining Teradata in January 2021. Mr. Cione served as the Head of U.S. Enterprise Accounts for Apple, Inc., from the time he joined the company in July 2017 until December 2020. Prior to joining Apple, from 2016 until 2017, he was Senior Vice President, Oracle Digital, North America Applications, and from 2013 to 2015, he served as Chief Revenue Officer at Rackspace. Prior to joining Rackspace, Mr. Cione spent 15 years at Microsoft, where he most recently served as the Asia-Pacific Chief Operating Officer, based in Singapore.
Kathleen Cullen-Cote. Kathleen Cullen-Cote is the Company’s Chief People Officer and has served in this role since joining Teradata in July 2019. Prior to joining Teradata, Ms. Cullen-Cote served in human resource leadership roles at PTC Inc., a global computer software and services company, from 2002 to June 2019, including Executive Vice President and Chief Human Resources Officer from April 2019 to July 2019; Corporate Vice President, Human Resources from 2012 until March 2019; Senior Vice President, Human Resources, from December 2010 to 2012; and Vice President, Human Resources, from October 2009 until December 2010. Prior to that, Ms. Cullen-Cote served in human resource leadership roles at Imark Communications, Johnson and Johnson, Raytheon, and Barry Controls.
Michael Hutchinson. Michael Hutchinson is the Company's Chief Customer Officer and has served in this role since January 2022. Previously, from June 2021 when he joined the Company until December 2022, he served as Senior Vice President World-Wide Customer Success, Consulting and Renewals. Prior to joining Teradata, Mr. Hutchinson served as the Senior Vice President and Chief Customer Officer at Verint from August 2020 to May 2021 and as its Senior Vice President, Global Professional Services and Support from April 2018 until August 2020. From 1990-2018, he held several positions with Oracle Corporation most recently as the Group Vice President, North America Customer Success from December 2015 to March 2018.
Margaret Treese. Margaret Treese is the Company’s Chief Legal Officer and has served in this role since November 2020. Previously, from 2018 until January 2020, she served as Teradata’s Deputy General Counsel and Secretary. From 2007 until 2018, she served as the Chief Corporate and Governance Counsel and Assistant Secretary and was named Corporate Secretary of Teradata in 2018. Prior to joining Teradata, from 1995 to 2007, Ms. Treese held positions of increasing responsibility at NCR, including Law Vice President and Chief Americas Region Counsel for the Teradata Division Law Group, Chief Corporate Counsel and Assistant Secretary.
Jacqueline Woods. Jacqueline Woods is the Company's Chief Marketing Officer and has served in this role since joining Teradata in December 2021. Previously, she served as the Global Chief Marketing and Communications Officer for NeilsenIQ from 2019 until November 2021. Prior to that, Ms. Woods was with IBM Corporation serving as the company's Chief Marketing Officer of IBM Global Partner Ecosystem Division from 2017 until 2019, the Chief Marketing Officer of IBM Global Financing from 2015 until 2017, and held other executive roles at IBM between 2010-2015. Ms. Woods also serves on the Board of Directors of Winnebago Industries, Inc.
There are no family relationships between any of the executive officers or directors of Teradata.
There are no contractual obligations regarding the election of our executive officers or directors.
Information. Teradata makes available through its website, free of charge, its Annual Report on Form 10-K, Quarterly Reports on Form 10-Q, and Current Reports on Form 8-K, and all amendments to such reports, as soon as reasonably practicable after these reports are electronically filed or furnished to the U.S. Securities and Exchange Commission ("SEC") pursuant to Section 13(a) or 15(d) of the Securities Exchange Act of 1934 (the "Exchange Act"). These reports and other information are available, free of charge, at www.sec.gov. Teradata will furnish, without charge to a security holder upon written request, the Notice of Meeting and Proxy Statement for the 2023 Annual Meeting of Stockholders. Teradata will furnish the Code of Conduct and any other exhibit at cost (the Code of Conduct is also available through Teradata’s website at http://www.teradata.com/code-of-conduct/). Document requests are available by calling or writing to:
Teradata - Investor Relations
17095 Via Del Campo
San Diego, CA 92127
Phone: 858-485-2088
Website: www.teradata.com
Item 1A. RISK FACTORS
You should carefully consider each of the following risk factors and all other information set forth in this Annual Report. Based on the information currently known to us, we believe that the following information identifies the most significant risk factors affecting our company in each of these categories of risks. However, the risks and uncertainties our Company faces are not limited to those set forth in the risk factors described below. Additional risks and uncertainties not presently known to us or that we currently believe to be immaterial may also adversely affect our business.
In addition, past financial performance may not be a reliable indicator of future performance, and historical trends should not be used to anticipate results or trends in future periods.
If any of the following risks and uncertainties develops into actual events or occurrences, these events could have a material adverse effect on our business, financial condition or results of operations. In such case, the trading price of our common stock could decline.
RISKS RELATED TO OUR BUSINESS AND OPERATIONS
Our failure to successfully execute our cloud-first strategy and achieve the anticipated benefits of our business transformation, which includes successfully developing, launching, and scaling cloud-based products and product enhancements and/or enabling our data platform to operate effectively in cloud environments, could have a material adverse effect on our competitive position, business, brand and reputation, financial condition, results of operations and cash flows.
The successful implementation of our cloud-first strategy and continued execution of our business transformation presents organizational and infrastructure challenges. We may not be able to implement, execute and realize some or all of the anticipated benefits from our strategy or our business transformation plan on a timely basis, or at all. Even if the anticipated benefits and savings are substantially realized, there may be unforeseen consequences, internal control issues, or business impacts.
A core component of our business strategy is to expand and enhance our product offerings, particularly for analytic solutions in a cloud-based environment, to include newer market-relevant features, functionality, and cloud native options and to keep pace with price-to-performance gains. In this regard, we launched our Teradata VantageCloud Lake and Teradata VantageCloud Enterprise components of our Teradata Vantage product offering in 2022. Shortened product life cycles due to customer demands and competitive pressures impact the pace at which we must introduce and implement new technology as part of our product offerings. This requires a high-level anticipation of customer needs and technology trends, as well as innovation by both our software developers and the suppliers of the third-party software components included in our solutions. In addition, bringing new offerings to the market entails a costly and lengthy process, may increase our risk of liability and cause us to incur significant technical, legal or other costs. It is uncertain whether these new cloud offerings and deployment models will prove successful or whether we will be able to develop the necessary business models, infrastructure and systems to support and scale the business. This includes acquiring, retaining and developing the right people to execute our business strategy in a competitive job market. In addition, market acceptance of new product and service offerings will be dependent in part on our ability to include functionality and usability that address customer requirements, and to optimally price our offerings and services to meet customer demand and cover our costs. Our go-to-market, cloud, and multi-cloud strategies also must adjust to customers' changing buying preferences, and there can be no assurance that our go-to-market approach will adequately and completely address such preferences.
As part of our business strategy, we also continue to dedicate a significant amount of resources to our R&D efforts in order to maintain and advance our competitive position, including our initiatives to provide and improve our offerings for cloud environments and to enable our data platform to operate effectively in cloud environments. However, we may not receive significant revenues from these investments for several years, if at all. R&D expenses represent a significant portion of our discretionary fixed costs.
We may not successfully execute on our vision or strategy because of challenges we may face, including with regard to product planning and timing, technical hurdles that we fail to overcome in a timely fashion, or a lack of appropriate resources. If we are unable to successfully execute on our cloud-first strategy and/or continue to respond to market demands, develop leading technologies, timely deliver offerings to the market, timely scale our cloud
business to achieve gross margins comparable or better than our on-premises business, and maintain our leadership in analytic data solutions performance and scalability, our competitive position, business, brand and reputation, financial condition, guidance, and forecasts, results of operations, and cash flows may be adversely affected.
As we develop new offerings with enhanced capacity, delivery and performance capabilities, the increased difficulty and complexity associated with producing these offerings may increase the likelihood of reliability, quality, operability, and/or security issues.
From time to time, errors or security flaws are identified in our offerings, which in certain cases are discovered after the offerings are introduced and delivered to customers. This risk is enhanced when offerings are first introduced or when new versions are released. In particular, when we develop offerings with more advanced technology, the production of such offerings involve increased difficulty and complexity and as a result may increase the likelihood of reliability, quality, operability, and/or security issues with such offerings. Our products and services may also fail to perform to the full specifications and expectations of our customers, including as part of transitioning customers to the cloud, in particular those that involve customer and/or third-party dependencies. Additionally, third-party components that we integrate into our solutions can have undetected quality issues that can impact the performance of our offerings. We may not be able to detect or remedy all errors, including those that may be deemed critical by our customers, prior to release or deployment.
Such reliability, quality, operability, and security issues may negatively impact our ability to retain current customers, including due to customer cancellations or non-renewals, as well as our ability to obtain new customers and could expose us to liability, performance and warranty claims, as well as harm our brand and reputation. These and other risks associated with new offerings may have a material adverse impact on our results of operations and future performance.
If our existing customers fail to renew, or cancel, their subscription license arrangements or support agreements, or if customers do not renew on terms favorable to us, our business could be adversely affected.
Teradata’s platform offerings have been expanded to include a variety of subscription options, which impact the timing of when revenues are recognized and related cash flows are collected. The IT industry generally has been experiencing increasing pricing pressure from customers when purchasing or renewing support agreements. In addition, as our on-premises customers migrate all or a portion of their data analytics solutions to a cloud-based environment, some customers may select a cloud-based offering of one of our competitors and consequently cancel all or a portion of their arrangements with us. Mergers and acquisitions in certain industries that we serve could result in a reduction of the software and hardware being supported and put pressure on our subscription and support terms with customers who have merged. Given these factors, there can be no assurance that our current customers will renew their subscription and/or support agreements or agree to the same terms when they renew, which could result in our reducing or losing subscription and/or support fees which could adversely impact operating results.
Unanticipated delays or accelerations in our sales cycles makes accurate estimation of our revenues difficult and could result in significant fluctuations in our quarterly operating results and could impact any financial guidance and forecasts that we may provide.
The length of our sales cycle varies depending on several factors over which we may have little or no control, including the size and complexity of a potential transaction, whether a sale involves a cloud offering, the level of competition that we encounter in our selling activities and our current and potential customers’ internal budgeting and approval process, as well as overall macro-economic conditions. Because of a generally long sales cycle, we may expend significant effort over a long period of time in an attempt to obtain an order, but ultimately not complete the sale, or the order ultimately received may be smaller than anticipated. The long sales cycle for our products also makes it difficult to predict the quarter in which sales will occur. Delays in sales could cause significant variability in our results for any particular period and could impact any financial guidance and forecasts that we may provide.
We may experience variability in our operating results based on the purchasing behavior of our customers.
Our business has substantially shifted from a traditional, perpetual pricing and revenue model to a subscription-based model in which less revenue is recognized upfront at the time the customer enters into a transaction. The pace
and extent to which customers will continue to purchase, consume and renew our offerings on a subscription basis is variable and, therefore, has impacts on our results and operations. In addition, we have flexible pricing options for our cloud customers, including consumption-unit based, "pay as you go" pricing. Under such a pricing model, we generally recognize revenue based on consumption. To the extent that customers opt for such a flexible pricing model, we may not be able to accurately forecast the timing of customer consumption of our offerings. As a result, our actual results may differ from our projections. Furthermore, our on-premises subscription arrangements may provide the customers with the right to cancel our agreement upon certain notice periods, which we may change in the future. Such arrangements may impact the timing of revenue recognition for these customers and result in fluctuations in our quarterly operating results.
Demand for the offerings and services we sell could decline if we fail to maintain positive brand perception and recognition.
We strive to maintain a brand that reflects our commitment to customer service and innovation. We believe that recognition and the reputation of our brand is key to our success, including our ability to retain our existing customers and attract new customers. We have a distinguished history as an on-premises platform provider and one of our strategic objectives is to establish our position in the cloud market. A misperception in the market regarding our cloud capabilities could negatively impact our ability to migrate existing on-premises customers to our cloud-based solutions, drive expansion/consumption growth, and/or acquire new customers for our cloud business.
In addition, damage to the reputation of our brands could result in, among other things, declines in customer loyalty, customer cancellations or non-renewals, lower employee retention and productivity, and vendor relationship issues, all of which could materially affect our revenue and profitability.
Our future results depend in part on our relationships with key suppliers, strategic partners and other third parties.
Our development, marketing, and distribution plans depend in part on our ability to form strategic alliances with third parties that have complementary offerings, software, services, and skills. Our strategic partners include cloud service providers, consultants and system integrators, software and technology providers, hardware support service providers, and indirect channel distributors in certain countries. These relationships involve risks, including our partners changing their business focus, entering strategic alliances with other companies, being acquired by our competitors, failing to meet regulatory requirements or performance criteria, improperly using our confidential information or their market reputation deteriorating. If we fail to maintain or expand our relationships with strategic partners or if we are forced to seek alternative technology or technology for new solutions that may not be available on commercially reasonable terms, our business may be adversely affected.
As part of our cloud-first strategy, the growth of our business is dependent primarily on our relationships with public cloud service providers, Amazon Web Services (AWS), Google Cloud, and Microsoft Azure. Our strategic partnerships with these cloud service providers for our cloud offerings on their platforms require significant investments to ensure that our solutions are optimized in these cloud environments. In addition, there are geographies in which we operate that utilize alternative, local cloud-platform service providers where AWS, Google Cloud, and Microsoft Azure are inaccessible or not available. The cloud service providers maintain relationships with certain of our competitors, and our competitors may in the future establish relationships with additional competing cloud data platform providers. Any of these cloud service providers may decide to modify or terminate our business relationship or may otherwise enter into preferred relationships with one or more competing cloud data platform providers. If we are unsuccessful in meeting performance requirements or obtaining future returns on these investments, or if we are otherwise unable to maintain adequate relationships with any of these cloud service providers, our financial results may be adversely impacted.
Third-party vendors provide important elements to our solutions; if we do not maintain our relationships with these vendors or if these vendors cease to be going concerns, interruptions in the supply of our offerings may result. There are some components of our solutions that we purchase from single sources due to price, quality, technology or other reasons. For example, we rely on Flex as a key single source contract manufacturer for our on-premises hardware systems. In addition, we buy servers from Dell Technologies Inc. and storage disk systems from NetApp, Inc. Some components supplied by third parties may be critical to our solutions, and several of our suppliers may
terminate their agreements with us without cause with 180-days' notice. In addition, we rely on certain vendors for hardware support services and parts supply. If we were unable to purchase necessary services, parts, components or offerings from a particular vendor and had to find an alternative supplier, our shipments and deliveries could be delayed. Also, quality issues, commodity, transportation, wage, or other inflationary pressures, a disruption in our supply chain or the need to find alternative suppliers could impact the costs and/or timing associated with procuring necessary offerings, components and services. In any case, our operations could be adversely impacted. Similarly, our suppliers’ offerings and services have certain dependencies with respect to their own supply chain networks, and supply and/or inflation issues among our suppliers may also adversely impact our business.
A breach of security, disruption, or failure of our information systems or those of our third-party providers could adversely impact our business and financial results.
Our operations are dependent on our ability to protect our computer equipment and the information stored in our databases (and the computer equipment and database information of certain suppliers and other third parties) from damage by, among other things, earthquake, fire, natural disaster, cyber-attacks, power loss, telecommunications failures, unauthorized intrusions or exploitations, malicious or unintended insider actions that cause loss of data or loss of systems, including phishing schemes, and other events. The occurrence of one or more of these events could result in system failures and other interruptions in our operations, which could have a material adverse effect on our business, financial condition or results of operations. Additionally, we offer the ability for our employees to choose a remote work location. This increases vulnerability to our systems as additional endpoints need to be managed.
Prior to our transition to a subscription-based business, our customers generally purchased or leased on-premises hardware systems used in connection with our software solutions, which our customers deployed and operated. With respect to these types of customer on-premises solutions, the customer, directly or through its selected services providers, manages all aspects of the data controls and security with respect to any confidential, private or otherwise sensitive information stored or processed through these solutions, including any personally identifiable data or information, such as non-public data regarding our customers’ employees, customers' customers, consumers, data subjects, individuals’ identities, individual financial accounts and health information. By contrast, our software-as-a-service or cloud offerings generally require us to deploy or operate solutions for our customers, directly or through the use of third-party services providers, either on-premises at customer-selected data center facilities, or at third-party-hosted data center facilities. With respect to these cloud and software-as-a-service offerings, we and such service providers have increased roles, responsibilities and risk exposures regarding some or all aspects of the data controls and security with respect to any confidential, private or otherwise sensitive information stored or processed through these solutions on our systems or those of selected third-party providers. If unauthorized access to or use of such information or systems occurs, despite data security measures and third-party commitments to protect them, our results of operation, reputation, and relationships with our customers could be adversely impacted.
Experienced computer programmers, Nation State Sponsored Advanced Persistent Code ("NSSAPC") attackers (from countries such as Iran, China, Russia and certain European Eastern Bloc countries) and hackers may be able to penetrate our network security or that of our third-party providers and misappropriate or compromise our intellectual property or other confidential information or that of our customers, create system disruptions or cause shutdowns. Computer programmers and hackers also may be able to develop and deploy viruses, worms, and other malicious software programs that attack our offerings or otherwise exploit any security vulnerabilities of our offerings. In addition, phishing-scheme-perpetrators may be able to lure employees or contractors into providing such perpetrators with information that may enable them to avoid some of our network security controls or those of third-party providers which could result in system disruptions or a loss of confidential and proprietary information.
We have been subject to actual and potential cyber-attacks, and there can be no assurance that our defensive measures will be adequate to prevent them in the future. There is risk that these types of activities will recur and persist, that one or more of them may be successful in the future, that one or more of them may have been or will be successful but not detected, prevented, remediated or mitigated by us, and the costs to us to eliminate, detect, prevent, remediate, mitigate or alleviate cyber or other security problems, viruses, worms, malicious software programs, phishing schemes and security vulnerabilities could be significant, and our efforts to address these problems may not be successful and could adversely impact our future results of operations. In addition, while we
maintain insurance coverage to cover certain liabilities related to cyber-attacks and/or data breaches, such coverage may not adequately cover all costs, expenses, liability and damages that we or our customers may incur as a result of such incidents.
Increases in the cost of components used in our product, employee compensation, and/or increases in our other costs of doing business, have, and could continue to, adversely affect our profit margins.
Our hardware components are assembled and configured by Flex. Flex also procures a wide variety of components used in the assembly process on our behalf. Although many of these components are available from multiple sources, we utilize preferred supplier relationships to better ensure more consistent quality, cost and delivery. Components used in our products require commodities as part of their manufacturing. In addition, we have a global employee population. As such, increased costs and/or commodity and other inflation, and/or increased tariffs on certain items imported from foreign countries have affected our profit margins and could continue to result in declines in our profit margins. Historically, we have mitigated certain cost increases, in part, by increasing prices on some of our products and collaborating with suppliers, in particular Flex, reviewing alternative sourcing options, and engaging in internal cost reduction efforts, all as appropriate. However, we may not be able to fully offset increased costs. Further, if any price increases we adopt are not accepted by our customers and the market, our net sales, profit margins, earnings, and market share could be adversely affected.
Inadequate internal control over financial reporting and accounting practices could lead to errors, which could adversely impact our ability to assure timely and accurate financial reporting.
Internal control over financial reporting, no matter how well designed and operated, can provide only reasonable, not absolute, assurance that the control objectives will be met. These inherent limitations include system errors, the potential for human error and unauthorized actions of employees or contractors, inadequacy of controls, temporary lapses in controls due to shortfalls in transition planning and oversight of resources, and other factors. Consequently, such controls may not prevent or detect misstatements in our reported financial results as required under the Securities and Exchange Commission ("SEC") and the New York Stock Exchange ("NYSE") rules, which could increase our operating costs or impair our ability to operate our business. Controls may also become inadequate due to changes in circumstances, and it is necessary to replace, upgrade or modify our internal information systems from time to time. In addition, unforeseen risks may arise in connection with financial reporting systems due to inefficient business processes, business process reengineering projects, or changes in accounting standards.
If management is not successful in maintaining a strong internal control environment, material weaknesses could occur, causing investors to lose confidence in our reported financial information. This could lead to a decline in our stock price, limit our ability to access the capital markets in the future, and require us to incur additional costs to improve our internal control systems and procedures.
Our business is affected by the global economies in which we operate and the economic climate of the industries we serve.
Our business and results of operations are affected by international, national and regional economic conditions. In particular, the IT industry in which we operate is susceptible to significant changes in the strength of the economy and the financial health of companies and governmental entities that make spending commitments for new technologies. Accordingly, adverse global economic, inflationary, recessionary, and market conditions, including in certain economic sectors in which many of our customers operate (such as retail, manufacturing, financial services or government), may adversely impact our business. For example, adverse changes to the economy could impact the timing of purchases by our current and potential customers or the ability of our customers to fulfill their obligations to us. In addition, decreased or more closely scrutinized spending in our customers’ businesses and in the industries we serve, may adversely impact our business. Uncertainty about future economic conditions may make it difficult for us to forecast operating results and to make decisions about future investments. In addition, our inability or failure to quickly respond to inflation and the resulting buying behaviors of our customers could harm our business, results of operations and financial condition. Our success in periods of economic uncertainty may also be dependent, in part, on our ability to reduce costs in response to changes in demand, inflation or other activity.
Generating substantial revenues from our international operations poses several risks.
In 2022, the percentage of our total revenues from outside of the United States was 49%. We have exposure to more than 30 functional currencies. The risks associated with the geographic scope of our business operations include, among other things the following:
•Cultural, management, and staffing challenges associated with operating in countries around the world, including developing countries;
•Realignment of our international strategy and organization structure;
•The imposition of additional and/or different governmental controls and regulations;
•The ever-changing macro-economic and geo-political environment we operate in;
•Longer payment cycles for sales in foreign countries and difficulties in enforcing contracts and collecting accounts receivable;
•Fluctuations in the value of local currencies;
•Tariffs or other restrictions on foreign trade or investment;
•Foreign trade policy changes, trade regulations, and/or disputes may adversely affect sales of our solutions and services and may result in longer sales cycles;
•The imposition of sanctions against a country, company, person or entity with whom we do business that would restrict or prohibit our business; and
•Foreign government activities that favor domestic companies, including those that may require companies to procure goods and services from locally-based suppliers.
Any of these events, among others, could materially and adversely affect our financial condition and operating results.
Our offerings are subject to United States export controls and, when exported from the United States, or re-exported to another country, must be authorized under applicable United States export regulations. Changes in our offerings or changes in export regulations may create delays in the introduction of our offerings in international markets, prevent our customers with international operations from deploying our offerings throughout their global systems or, in some cases, prevent the export of our offerings to certain countries or customers altogether. Any change in export regulations or related legislation, shift in approach to the enforcement or scope of existing regulations, or change in the countries, persons or technologies targeted by these regulations could result in decreased use of our offerings by, or in our decreased ability to export or sell our offerings to, existing or potential customers with international operations.
There is active enforcement and ongoing focus by the SEC and other governmental authorities on the United States Foreign Corrupt Practices Act, the U.K. Bribery Act of 2010 and similar anti-bribery, anti-corruption laws in other countries. Given the breadth and scope of our international operations, we may not be able to detect improper or unlawful conduct by our international partners and employees, despite our high ethics, governance and compliance standards, which could put the Company at risk regarding possible violations of such laws and could result in various civil or criminal fines, penalties or administrative sanctions, and related costs, which could negatively impact the Company's business, brand, results of operations or financial condition.
Failure to successfully complete reorganization activities in connection with our transformation activities or otherwise could negatively affect our operations.
We have completed reorganization efforts in connection with our business transformation and we may continue to complete reorganization activity in furtherance of our strategy. In addition, from time to time, we may wind down certain business activities and/or facilities, cease doing business in certain geographic areas, and/or perform other organizational reeorganization projects in an effort to reduce costs and optimize operations. For example, in 2022, we ceased our operations in Russia and Belarus to comply with sanctions imposed as a result of Russia’s invasion of Ukraine. Reorganization activities involve risks as they may divert management's attention from our core businesses, increase expenses on a short‑term basis or reduce revenues. We may also experience a loss of continuity, loss of accumulated knowledge, or loss of efficiency during such transitional periods, all of which may negatively impact our business, financial condition, operating results, and cash flows.
The Company's business, results of operations, and financial condition have and could in the future be materially adversely affected by the COVID-19 pandemic.
Negative economic conditions related to the COVID-19 pandemic have impacted our business, financial condition, and results of operation in the past and could continue to impact us in the future. The degree to which the COVID-19 pandemic in the future affects our business, financial condition, and results of operations will depend on future developments, which are highly uncertain and cannot be predicted, including, but not limited to, the duration and spread of the unprecedented pandemic, its severity, the development of one or more COVID-19 variants, the actions to contain the virus or respond to its impact, the successful distribution of vaccines and their effectiveness, and how quickly and to what extent normal economic and operating conditions can resume. The COVID-19 pandemic or any other adverse public health development could also inhibit our ability to execute our strategic initiatives including, without limitation, improving the experience of our customers, investing in identified strategic growth platforms, and shifting the mix of revenue in our business to cloud as well as subscription revenue.
Our business and operations could be disrupted by weather conditions, including conditions exacerbated by global climate change.
Our global business operations, as well as those of our customers, supply chains, data warehouses, distribution channels, and public cloud service providers, are subject to interruptions by natural disasters, extreme weather conditions and the repercussions of climate change, which could include sea-level rise, tornadoes, hurricanes, earthquakes, floods, tsunamis, typhoons, drought, and fire, that could impact our business and operations. Unfavorable weather conditions could pose physical risks to our facilities and data warehouses, result in power outages and shortages, and/or result in failures of global critical infrastructure, telecommunication and security systems, natural resource availability, such as energy and water sources, employees’ ability to work, availability of supply chain and logistics, and the additional costs to maintain or resume operations, each of which could negatively impact our business and operations. The added cost of any environmental taxes, charges, assessments, or penalties levied could be incurred by or passed on to us, increasing the cost to run our business. Any enactment of laws or passage of regulations regarding greenhouse gas emissions or otherwise, could adversely affect our business, financial condition, and results of operations.
Any disruption at or near any of our facilities or other operations, or those of our customers, vendors, data warehouses, distribution channels, and public cloud service providers could adversely affect our business.
Disruptions could occur as a result of supply chain challenges; decreases in work force availability; natural resources availability; natural disasters; inclement weather; man-made disasters or other external events, such as terrorist acts or acts of war, pandemics and/or epidemics, boycotts and sanctions, widespread criminal activities, or protests and/or social unrest, or other events, at or in proximity to any of our facilities or those of our customers, vendors, data warehouses, distribution channels, and public cloud service providers. Such events and disruptions could make it difficult or impossible to deliver products and services to our customers or perform critical business functions and could adversely affect our business. For example, any disruption to our headquarters and data centers located in California, a region with potential seismic activity and wildfires and a region with an extreme risk of drought and vulnerability to future water scarcity due to climate change, may negatively impact our ability to respond to customers and provide services to maintain business continuity. Climate-related events, including the increasing frequency of extreme weather events, their impact on critical infrastructure and the potential to increase political instability in regions where we, our customers, our partners, and our vendors do business, may disrupt our business, our third-party suppliers, or the business of our customers and partners, and may cause us to experience additional costs to maintain or resume operations. Climate change and environmental regulations may result in changes in the demand for resources that could adversely impact the availability or cost of goods and services, including natural resources necessary to run our business. Additionally, any such disruption could cause us to incur costs to repair damages to our facilities, equipment, infrastructure, and business relationships.
Increased scrutiny from governments, investors, raters, customers, and others regarding our environmental, social, and governance ("ESG") practices and our inability to achieve any ESG goals we establish could impose additional costs, expose us to new risks, or negatively impact our reputation.
The ESG landscape is constantly changing, with an increased focus from certain investors, raters, employees, customers and other stakeholders which could result in greater expectations of us and our ESG initiatives, goals, efforts, transparency and communications which may not satisfy our stakeholders.
To meet expectations from our stakeholders, we are working to align our reporting with emerging ESG disclosures and potential new disclosure requirements from regulators, such as the SEC, while we also seek to report timely on progress toward our ESG objectives. In addition, we have established, and expect to continue to establish ESG goals. Our ESG program performance, including any ESG goals that we establish, may be reviewed by third-party providers of ESG assessment and ratings and such raters may unfavorably evaluate our ESG initiatives. If we fail, or are perceived to fail, to meet our stakeholders’ and/or raters’ expectations, including the achievement of the ESG goals that we establish, we could be exposed to increased risk of litigation, difficulty in attracting and retaining employees, negative investor sentiment, and an adverse impact on our reputation.
RISKS RELATED TO OUR INDUSTRY
The IT industry is intensely competitive and evolving, and competitive pressures could adversely affect our pricing practices or demand for our offerings and services.
We operate in the intensely competitive IT industry, which is characterized by rapidly changing technology, evolving industry standards and models for consuming and delivering business and IT services, frequent new product introductions, and frequent price and cost reductions. In general, as a participant in the data analytic solutions market, we face:
•Changes in customer IT spending preferences and other shifts in market demands, which drive changes in the Company's competition;
•Changes in pricing, marketing and product strategies, such as potential aggressive price discounting and the use of different pricing models by our competitors;
•Rapid changes in product delivery models, such as on-premises solutions versus cloud solutions;
•Rapid changes in computing technology and capabilities that challenge our ability to maintain differentiation at the lower range of business intelligence analytic functions;
•New and emerging analytic technologies, competitors, and business models;
•Continued emergence of open-source software that often rivals current technology offerings at a much lower cost despite its limited functionality;
•Changing competitive requirements and deliverables in developing and emerging markets; and
•Continuing trend toward consolidation of companies, which could adversely affect our ability to compete, including if our key partners merge or partner with our competitors.
Our competitors include established companies within our industry, including Amazon, Google, IBM, Oracle, Microsoft, and SAP, which are well-capitalized companies with widespread distribution, brand recognition and penetration of platforms and service offerings. The significant purchasing and market power of these larger competitors, which have greater financial resources than we do, could allow them to surpass our market penetration and marketing efforts to promote and sell their offerings and services. In addition, many other companies participate in specific areas of our business, such as enterprise applications, analytic platforms and business intelligence software. In some cases, we may partner with a company in one area of our business and compete with them in another. In particular, in delivering our Teradata VantageCloud and ClearScape Analytics platforms in a cloud environment to certain of our customers, we partner with each of Amazon Web Services, Google, and Microsoft, which are public cloud service providers. The status of our business relationships with these companies can influence our ability to compete for analytic data solutions opportunities in such areas. In addition, we see additional competition from both established and emerging cloud-only data vendors and open-source providers. Failure to compete successfully with new or existing competitors in these and other areas could have a material adverse impact on our ability to generate additional revenues or sustain existing revenue levels.
Current and evolving privacy laws and regulations regarding cloud computing, cross-border data transfer restrictions and other aspects of data privacy may limit the use and adoption of our solutions and services and adversely affect our business.
Regulation related to the provision of services over the Internet is evolving, as federal, state and foreign governments continue to adopt new, or modify existing, laws and regulations addressing data privacy and the collection, processing, storage, transfer and use of data. In some cases, data privacy laws and regulations, such as the European Union’s General Data Protection Regulation ("GDPR") that took effect in May 2018, and the California Consumer Privacy Act ("CCPA"), which took effect in January 2020, and is amended effective from
January 2023, impose new obligations directly on the Company as both a data controller and a data processor, as well as on many of our customers. New laws require us to evaluate any required changes to our solutions and services on an ongoing basis to enable Teradata and/or our customers to comply with the new legal requirements and may also increase our potential liability exposure through higher potential penalties for non-compliance. Further, laws such as the European Union’s proposed e-Privacy Regulation are increasingly aimed at the use of personal information for marketing purposes, and the tracking of individuals’ online activities. These new or proposed laws and regulations are subject to differing interpretations and may be inconsistent among jurisdictions. These and other requirements could reduce demand for our solutions and services, require us to take on more onerous obligations in our contracts, restrict our ability to store, transfer and process data or, in some cases, impact our ability to offer our solutions and services in certain locations or our customers' ability to deploy our solutions globally. For example, existing and developing laws regarding how companies transfer personal data from the European Economic Area to the United States could result in further limitations on the ability to transfer data across borders, particularly if governments are unable or unwilling to create new, or maintain existing, mechanisms that support cross-border data transfers, such as the long-awaited replacement for the EU-U.S. and Swiss-U.S. Privacy Shield framework. Additionally, certain countries have passed or are considering passing laws requiring local data residency. The costs of compliance with, and other burdens imposed by, privacy laws, regulations and standards may limit the use and adoption of our solutions and services, reduce overall demand for our solutions and services, make it more difficult to meet expectations from or commitments to customers, lead to significant fines, penalties or liabilities for noncompliance, or slow the pace at which we close sales transactions, any of which could harm our business.
In addition to government activity, privacy advocacy and other industry groups establish new self-regulatory standards that may place additional burdens on our ability to provide our solutions and services globally. Our customers expect us to meet voluntary certification and other standards established by third parties, such as related International Organization for Standardization ("ISO") standards. If we are unable to maintain these certifications or meet these standards, it could adversely affect our ability to provide our solutions to certain customers and could harm our business.
Furthermore, concerns regarding data privacy may cause our customers’ customers to resist providing the data necessary to allow our customers to use our solutions and services effectively. Even the perception that the privacy of personal information is not satisfactorily protected or does not meet regulatory requirements could inhibit sales of our offerings or services and could limit adoption of our cloud-based solutions.
RISKS RELATED TO HUMAN CAPITAL
We depend on key employees and face competition in hiring and retaining qualified employees.
Our employees and access to talent are critical to our success. Our future success depends on our ability to attract, retain, develop, and motivate the services of senior management and key personnel in all areas of our Company, including engineering and development, marketing and sales professionals, and consultants. Competition for highly skilled personnel and acquired talent in the IT industry is intense. We have experienced, and may continue to experience, voluntary workforce attrition, including the loss of senior management and key personnel, in part due to the highly-competitive job market in our industry. Furthermore, to advance our cloud-first strategy, we are required to attract and retain talent with expertise in cloud-based technologies, particularly with respect to our engineering and development teams. No assurance can be made that key personnel will remain with us, and it may be difficult and costly to replace such employees and/or obtain qualified talent who are not employees. We implemented a remote working policy to expand our talent pool for key personnel and we cannot predict the longer-term workforce implications. Competition is heightened for diverse talent as companies, including us, develop and enhance DEI initiatives. Our failure to execute on our key culture initiatives, hire, retain or replace our key personnel could have a material adverse impact on our business operations.
RISKS RELATED TO LEGAL AND REGULATORY MATTERS
We face uncertainties regarding legal proceedings, complex and changing laws and regulations, and other related matters.
In the normal course of business, we are subject to proceedings, lawsuits, claims and other matters, including those that relate to the environment, health and safety, employee benefits, export compliance, intellectual property, a variety of local laws and regulations, and other regulatory compliance and general matters. See "Note 10-
Commitments and Contingencies" in the Notes to Consolidated Financial Statements in this Annual Report. Because such matters are subject to many uncertainties, their outcomes are not predictable. There can be no assurances that the amounts required to satisfy alleged liabilities from such matters will not impact future operating results.
In addition, we are subject to diverse and complex laws and regulations, including those relating to corporate governance, public disclosure and reporting, which are rapidly changing and subject to many possible changes in the future. From time to time, we may conduct internal investigations in connection with our efforts to ensure compliance with such laws and regulations, the costs or results of which could impact our financial results. In addition, we may be subject to unexpected costs in connection with new public disclosure or other regulatory requirements that are issued from time to time. Laws and regulations impacting our customers, such as those relating to privacy, data protection and digital marketing, could also impact our future business. Because we do business in the government sector, we are generally subject to audits and investigations which could result in various civil or criminal fines, penalties or administrative sanctions, including debarment from future government business, which could negatively impact the Company’s results of operations or financial condition.
In addition, our facilities and operations, including former facilities and former operations for which we may have liabilities, are subject to a wide range of environmental protection laws. There can be no assurances that the costs required to comply with applicable environmental laws will not adversely impact future operating results.
Management time and resources are spent to understand and comply with changing laws, regulations and standards relating to such matters as corporate governance, accounting principles, public disclosure, SEC regulations, and the rules of the NYSE where our shares are listed. Rapid changes in accounting standards, and federal securities laws and regulations, among others, may substantially increase costs to our organization, challenge our ability to timely comply with all of them and could have a negative impact on our future operating results.
Gaps in protection of Teradata’s intellectual property or unlicensed use of third-party intellectual property could impact our business and financial condition.
As a technology company, our intellectual property portfolio is crucial to our continuing ability to be a leading multi-cloud data and analytics platform provider. We strive to enhance and, as much as is legally and reasonably possible, protect our proprietary intellectual property rights through patent, copyright, trademark and trade secret laws, as well as through technological safeguards and the actions of our people. These efforts include protection of the offerings and application, diagnostic and other software we develop.
Where gaps exist in our intellectual property protection, even if such gaps are reasonable, our business could be materially adversely impacted. We may be unable to prevent third parties from using our technology without our authorization or independently developing technology that is similar to ours, particularly in those countries where the laws do not protect our proprietary rights as fully as in the United States (such as Iran, China and certain European Eastern Bloc countries who may use NSSAPC to advance their own industries). With respect to inventions for which we choose to file patent applications, we may not be successful in securing patents for these claims, and our competitors may already have applied for patents that, once issued, will prevail over our patent rights or otherwise limit our ability to sell our offerings.
While we take steps to provide for confidentiality obligations of employees and third parties with whom we do business (including customers, suppliers and strategic partners), there is a risk that such parties will breach such obligations and jeopardize our intellectual property rights. Many customers have outsourced the administration and management of their data and analytics environments to third parties, including some of our competitors, who then have access to our confidential information. Although we have agreements in place to mitigate this risk, there can be no assurance that such protections will be sufficient. In addition, our ability to capture and re-use field-based developed intellectual property is important to future business opportunities and profits.
We are seeing an extended trend towards aggressive enforcement of intellectual property rights, especially by so-called “patent assertion entities” ("PAEs") or “non-practicing entities" ("NPEs"), as the functionality of offerings in our industry increasingly overlaps and the volume of issued software patents continues to grow. As a result, we have been, and in the future could be, subject to infringement claims which, regardless of their validity, could:
•Be expensive, time consuming, and divert company resources and management attention away from normal business operations;
•Require us to pay monetary damages or enter into non-standard royalty and licensing agreements;
•Require us to modify our product sales and development plans; or
•Require us to satisfy indemnification obligations to our customers.
Regardless of whether these claims have any merit, they can be burdensome to defend or settle and can harm our business, reputation, financial condition and results of operations.
A change in our effective tax rate can have a significant adverse impact on our business.
A number of factors may adversely impact our future effective tax rates, such as:
•The jurisdictions in which our profits are determined to be earned and taxed;
•The resolution of issues arising from tax audits with various tax authorities;
•Changes in the valuation of our deferred tax assets and liabilities;
•Adjustments to estimated taxes upon finalization of various tax returns; and
•Changes in available tax credits, especially surrounding tax credits in the United States for our research and development activities.
Tax rules may change in a manner that adversely affects our future reported results of operations or the way we conduct our business. Further changes in the tax laws of foreign jurisdictions could arise as a result of the base erosion and profit shifting project that was undertaken by the Organization for Economic Co-operation and Development ("OECD"). The OECD, which represents a coalition of member countries, recommended changes to numerous long-standing tax principles related to transfer pricing. Our income tax obligations are based in part on our corporate structure and inter-company arrangements, including the manner in which we develop, value, and use our intellectual property and the valuations of our inter-company transactions. Tax authorities may disagree with certain positions we have taken and assess additional taxes. We regularly assess the likely outcomes of these audits to determine the appropriateness of our tax provision; however, there can be no assurance that we will accurately predict the outcomes of these audits, and the actual outcomes of these audits could have a material impact on our financial condition or results of operations. In addition, governmental authorities in the United States and throughout the world may increase or impose new income taxes or indirect taxes, or revise interpretations of existing tax rules and regulations, as a means of financing the costs of stimulus and other measures enacted or taken, or that may be enacted or taken in the future. Such actions could have an adverse effect on our results of operations and cash flows.
RISKS RELATED TO OUR FINANCIAL CONDITION
Our indebtedness could adversely affect our financial condition and limit our financial flexibility.
The Company's indebtedness could:
•Expose us to interest rate risk;
•Increase our vulnerability to general adverse economic and industry conditions;
•Limit our ability to obtain additional financing or refinancing at attractive rates;
•Require the dedication of a substantial portion of our cash flow from operations to the payment of principal of, and interest on, our indebtedness, thereby reducing the availability of such cash flow to fund our growth strategy, working capital, capital expenditures, share repurchases and other general corporate purposes;
•Limit our flexibility in planning for, or reacting to, changes in our business and the industry; and
•Place us at a competitive disadvantage relative to our competitors with less debt.
Further, our outstanding indebtedness is subject to financial and other covenants, which may be affected by changes in economic or business conditions or other events that are beyond our control. If we fail to comply with the covenants under any of our indebtedness, we may be in default under the loan, which may entitle the lenders to accelerate the debt obligations. To avoid defaulting on our indebtedness, we may be required to take actions such as reducing or delaying capital expenditures, reducing or eliminating stock repurchases, selling assets, restructuring or refinancing all or part of our existing debt, or seeking additional equity capital, any of which may not be available on terms that are favorable to us, if at all.
Fluctuations in foreign currency exchange rates have affected our operating results and could continue to impact our revenue and net earnings.
Because the functional currency of most of our foreign activities is the applicable local currency, but our financial reporting currency is the U.S. dollar, we are required to translate the assets, liabilities, expenses, and revenues of our foreign activities into U.S. dollars at the applicable exchange rate in preparing our Consolidated Financial Statements. We operate in approximately 40 countries and are exposed to various foreign currencies in the Americas region (North America and Latin America), EMEA region (Europe, Middle East, and Africa) and APJ region (Asia Pacific and Japan). Accordingly, we face foreign currency exchange rate risk arising from transactions in the normal course of business. Foreign currency exchange rates have affected our revenue and net earnings and could continue to impact our revenue and net earnings. While we actively manage our foreign currency market risk in the normal course of business by entering into various derivative instruments to hedge against such risk, these derivative instruments involve risks and may not effectively limit our underlying exposure to foreign currency exchange rate fluctuations or minimize our net earnings and cash volatility associated with foreign currency exchange rate changes. Further, the failure of one or more counterparties to our foreign currency exchange rate contracts to fulfill their obligations to us could adversely affect our operating results.
| | | | | |
| Item 1B. | UNRESOLVED STAFF COMMENTS |
None.
As of December 31, 2022, Teradata operated 44 facilities in 31 countries consisting of approximately 776 thousand square feet throughout the world. Approximately 59% of this square footage is our headquarters in San Diego and is the only property that we own, the rest of our property is leased. Within the total facility portfolio, Teradata operates 8 facilities where R&D activity occurs totaling approximately 283 thousand square feet, of which approximately 81% is owned. The remaining approximately 493 thousand square feet of space includes office, repair, warehouse and other miscellaneous sites, and is 47% owned and 53% leased. Teradata believes its facilities are suitable and adequate to meet its current needs. Teradata’s corporate headquarters is in San Diego, California.
The information required to be set forth under this Item 3 is incorporated by reference to Note 10, Commitments and Contingencies—Legal Proceedings of the Notes to Consolidated Financial Statements included in this Annual Report on Form 10-K.
| | | | | |
| Item 4. | MINE SAFETY DISCLOSURES |
N/A.
PART II
| | | | | |
| Item 5. | MARKET FOR THE REGISTRANT’S COMMON EQUITY, RELATED STOCKHOLDER MATTERS AND ISSUER PURCHASES OF EQUITY SECURITIES |
Teradata common stock trades on the New York Stock Exchange under the symbol "TDC." There were approximately 23,156 registered holders of Teradata common stock as of February 3, 2023.
Teradata has not paid cash dividends and does not anticipate the payment of cash dividends to holders of Teradata common stock in the immediate future. The declaration of dividends in the future would be subject to the discretion of Teradata’s Board of Directors.
The information under the caption "Stock Ownership" and the caption "Current Equity Compensation Plan Information" in Part III, Item 12 of this Annual Report on Form 10-K is also incorporated by reference in this section.
The following graph compares the relative performance of Teradata stock, the Standard & Poor’s ("S&P") 500 Stock Index and the S&P Information Technology Index. This graph covers the five-year period from December 31, 2017 to December 31, 2022. In each case, assumes a $100 investment on December 31, 2017, and reinvestment of all dividends, if any.
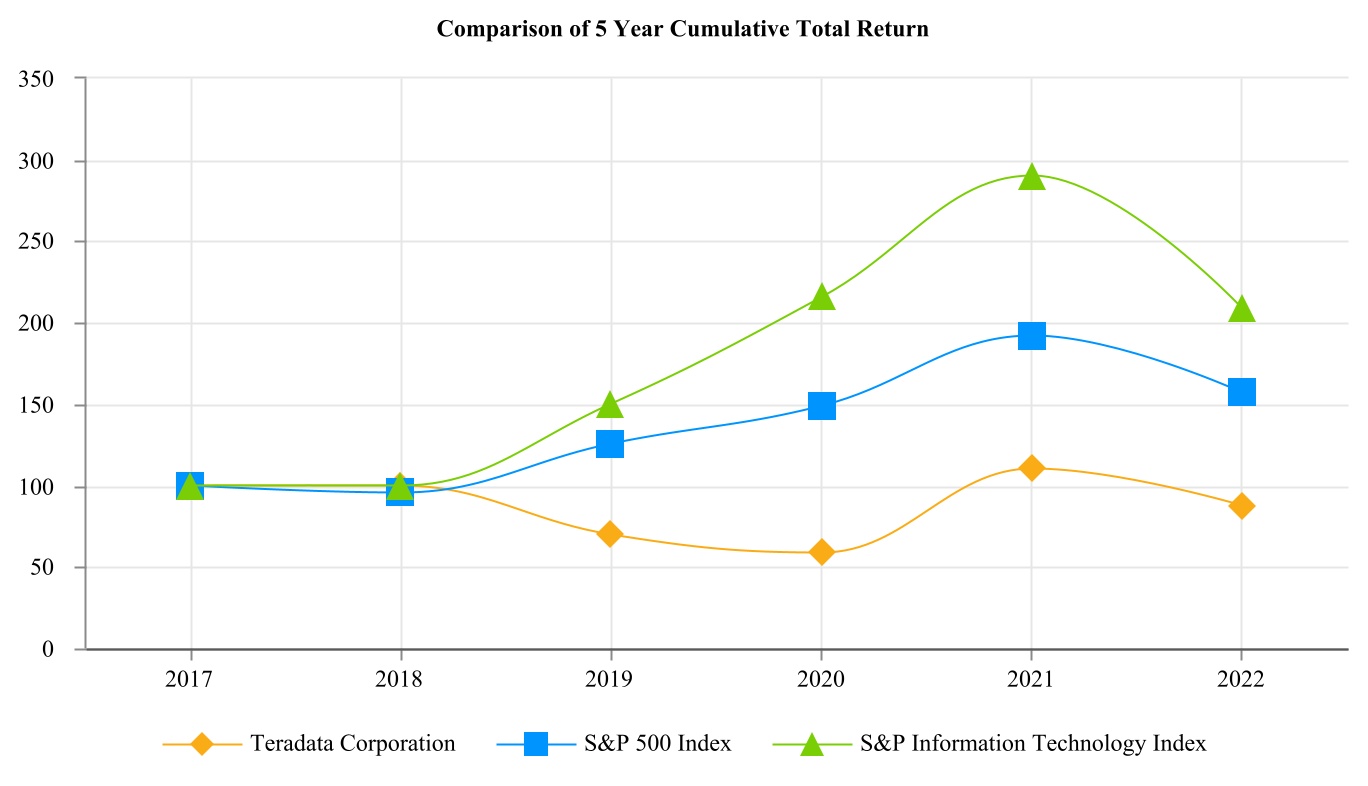
| | | | | | | | | | | | | | | | | | | | | | | | | | | | | | | | | | | | | | |
| | As of December 31, |
| Company/Index | | 2017 | | 2018 | | 2019 | | 2020 | | 2021 | | 2022 |
| Teradata Corporation | | $ | 100 | | | $ | 100 | | | $ | 70 | | | $ | 58 | | | $ | 110 | | | $ | 88 | |
| S&P 500 Index | | $ | 100 | | | $ | 96 | | | $ | 126 | | | $ | 149 | | | $ | 192 | | | $ | 157 | |
| S&P Information Technology Index | | $ | 100 | | | $ | 100 | | | $ | 150 | | | $ | 216 | | | $ | 290 | | | $ | 208 | |
Purchases of Equity Securities by the Issuer and Affiliated Purchases
Section 16 officers occasionally transfer vested shares earned under restricted share awards to the Company at the current market price to cover their withholding taxes. For the year ended December 31, 2022, the total of these purchases was 172,199 shares at an average price of $40.27 per share.
The following table provides information relating to the Company’s repurchase of common stock for the year ended December 31, 2022: | | | | | | | | | | | | | | | | | | | | | | | | | | | | | | | | | | | |
| Total
Number
of Shares Purchased | | Average
Price
Paid
per Share | | Total
Number
of Shares
Purchased
as Part of
Publicly
Announced
Dilution
Offset Program (1) | | Total
Number
of Shares
Purchased
as Part of
Publicly
Announced
General
Share
Repurchase Program (2) | | Maximum
Dollar
Value
that May
Yet Be
Purchased
Under the
Dilution
Offset Program | | Maximum
Dollar
Value
that May
Yet Be
Purchased
Under the
General Share
Repurchase Program |
| Period | | | | | |
| First quarter total | 5,117,861 | | | $ | 48.85 | | | — | | | 5,117,861 | | | $ | 7,532,006 | | | $ | 962,770,572 | |
| Second quarter total | 2,113,745 | | | $ | 31.84 | | | 246,525 | | | 1,867,220 | | | $ | 184,973 | | | $ | 904,270,266 | |
| Third quarter total | 962,984 | | | $ | 32.41 | | | 158,335 | | | 804,649 | | | $ | 960,284 | | | $ | 878,200,294 | |
| October 2022 | 464,425 | | | $ | 30.15 | | | — | | | 464,425 | | | $ | 983,906 | | | $ | 864,200,122 | |
| November 2022 | 485,759 | | | $ | 32.43 | | | 30,085 | | | 455,674 | | | $ | 21,342 | | | $ | 849,446,095 | |
| December 2022 | 270,627 | | | $ | 34.16 | | | — | | | 270,627 | | | $ | 55,573 | | | $ | 840,200,146 | |
| Fourth quarter total | 1,220,811 | | | $ | 31.95 | | | 30,085 | | | 1,190,726 | | | $ | 55,573 | | | $ | 840,200,146 | |
| 2022 Full year total | 9,415,401 | | | $ | 41.16 | | | 434,945 | | | 8,980,456 | | | $ | 55,573 | | | $ | 840,200,146 | |
1.The dilution offset program allows the Company to repurchase Teradata common stock to the extent of cash received from the exercise of stock options and the ESPP to offset dilution from shares issued pursuant to these plans.
2.The general share repurchase program authorized by the Board allows the Company to repurchase outstanding shares of Teradata common stock. Share repurchases made by the Company are reported on a trade date basis. On November 1, 2021, Teradata's Board of Directors authorized an additional $1 billion to be utilized to repurchase Teradata common stock under this share repurchase program. The general share repurchase program expires on December 31, 2025.
Accelerated Share Repurchase Agreement ("ASR")
On February 9, 2022 we entered into an ASR agreement with JPMorgan Chase Bank, National Association ("JPMorgan Chase") to purchase shares of our common stock from JPMorgan Chase for an aggregate purchase price of $250 million. Pursuant to the ASR, we received an initial delivery of 3,930,045 shares of common stock based on the closing price of the common stock of $50.89 on February 8, 2022. A final delivery of 1,635,863 shares was received on May 6, 2022 to complete the ASR agreement. The ASR agreement was entered into pursuant to our open market share repurchase authorization.
| | | | | |
| Item 7. | MANAGEMENT’S DISCUSSION AND ANALYSIS OF FINANCIAL CONDITION AND RESULTS OF OPERATIONS ("MD&A") |
You should read the following discussion in conjunction with the consolidated financial statements and the notes to those statements included in this Annual Report on Form 10-K ("Annual Report"). This Annual Report contains certain statements that are forward-looking within the meaning of the Private Securities Litigation Reform Act of 1995. Certain statements contained in the MD&A are forward-looking statements that involve risks and uncertainties. The forward-looking statements are not historical facts, but rather are based on current expectations, estimates, assumptions and projections about our industry, business and future financial results. Our actual results could differ materially from the results contemplated by these forward-looking statements due to several factors, including those discussed in other sections of this Annual Report. See "Risk Factors" and "Forward-looking Statements."
OVERVIEW
Teradata is a leading connected multi-cloud data platform for enterprise analytics, focused on helping companies leverage all their data across an enterprise, at scale. In doing so, we help companies to find answers to their toughest business challenges. All of our efforts are in support of our purpose of transforming how businesses work and people live through the power of data. Our platform is composed of our data platform – Teradata Vantage – which is designed to run across public cloud, private cloud and on-premises environments. This platform is supported by business consulting and support services that enable customers to extract insights from across a company’s entire data and analytics ecosystem. Teradata’s strategy is discussed under Part I, Item I of this Annual Report on Form 10-K.
We are continuing to execute on our key priorities, including migrating existing customers to the cloud, expanding our Teradata Vantage multi-cloud data platform product offering (which includes VantageCloud, VantageCloud Lake, VantageCloud Enterprise and ClearScape Analytics), adding new customers and expanding our footprint with existing customers, increasing our focus on diversity and inclusiveness, and driving operational excellence and agility across the Company.
To allow for greater transparency regarding the progress we are making toward achieving our strategic objectives, we utilize the following financial and performance metrics:
•Total Annual Recurring Revenue ("Total ARR") - annual value at a point in time of all recurring contracts, including subscription, cloud, software upgrade rights, and maintenance. ARR does not include managed services and third-party software.
•Public Cloud ARR (included within Total ARR) - annual value at a point in time of all contracts related to public cloud implementations of Teradata VantageCloud and does not include ARR related to private or managed cloud implementations.
•Cloud Net Expansion Rate - Teradata calculates its last-twelve months dollar-based cloud net expansion rate as of a fiscal quarter end as follows:
◦We identify the ARR for active cloud customers in the fiscal quarter ending one year prior to the given fiscal quarter (the "base period");
◦We then identify the public cloud ARR in the given fiscal quarter (the "current period") from the same set of active cloud customers as the base period, including increases in usage, as well as reductions and cancellations, and additional conversions of on-premises revenues to the cloud for customers active in the base period, all in constant currency; and
◦The quarterly dollar-based, cloud net expansion rate is calculated by taking the ARR from the current period and dividing by the ARR from the base period.
The last twelve-month dollar-based cloud net expansion rate is calculated by taking the average of the quarterly dollar-based cloud net expansion rate from the last fiscal quarter and the prior three fiscal quarters.
COVID-19 Update
During the twelve months ended December 31, 2022, there were some continued effects of the coronavirus pandemic ("COVID-19") and the related actions by governments around the world on our business, and economies generally. However, operationally we have been able to run our business without significant interruptions. Under our return-to-office plans, none of our employees are required to return to an office environment and can choose to continue to work remotely or under a hybrid model. There remains some uncertainty regarding the potential impact of COVID-19 and new variants on our business in the future, from both a financial and operational perspective. We will continue our diligent efforts to monitor and respond as appropriate to the impacts of the pandemic on our business, including the status of our workforce, supply chain, customers, suppliers, and vendors, based on the priorities described above. Our actions will continue to be informed by the requirements and recommendations of the federal, state or local authorities. We intend to remain agile and have contingency plans in place to appropriately respond to conditions as they unfold. For more information, see "Risk Factors" under Part I, Item 1A of this Annual Report on Form 10-K.
2022 FINANCIAL OVERVIEW
As more fully discussed in later sections of this MD&A, the following are the financial highlights for 2022:
•Revenue of $1,795 million decreased by 6% in 2022 as compared to 2021, with an underlying 3% decrease in recurring revenue. Perpetual software licenses, hardware and other revenue decreased by 16% and consulting services revenue decreased by 17%. Revenue was adversely impacted primarily by foreign currency fluctuations and lost revenue from ceasing our operations in Russia in the first quarter of 2022. The decline in consulting service revenue was additionally due to our focus on higher-margin engagements and purposeful decrease in consulting services given our strategic development of a partner ecosystem. Foreign currency fluctuations had a 4% adverse impact on total revenue compared to the prior year.
•Gross profit as a percent of revenue was 60.2% in 2022, a decrease from 61.9% in 2021, primarily due to adverse impact from foreign currency fluctuations, the loss of revenue due to exiting Russia operations, and an increasing mix of cloud revenue as our cloud business continues to scale as compared to the prior year.
•Operating expenses in 2022 increased by 1% as compared to 2021, primarily driven by higher stock-based compensation expense and expenses associated with exiting our business in Russia, partially offset by favorable impact from foreign currency fluctuations, and our cost discipline initiatives.
•Operating income was $118 million in 2022, down from $231 million in 2021.
•Net income was $33 million in 2022 versus net income of $147 million in 2021, primarily due to reduced revenue. Diluted net earnings per share was $0.31 in 2022 compared to diluted earnings per share of $1.30 in 2021.
RESULTS FROM OPERATIONS FOR THE YEARS ENDED DECEMBER 31, 2022 AND 2021
In July 2019, the Financial Accounting Standards Board ("FASB") issued Accounting Standards Update 2019-07, "Codification Updates to SEC Sections-Amendments to SEC Paragraphs Pursuant to SEC Final Rule Releases No. 33-10532, Disclosure Update and Simplification", which made a number of changes meant to simplify certain disclosures in financial condition and results of operations, particularly by eliminating year-to-year comparisons between prior periods previously disclosed. In accordance with the relevant aspects of the rule covering the current year annual report, we now include disclosures on results of operations for fiscal year 2022 versus 2021 only. For discussion of fiscal year 2021 versus 2020 see "Item 7. Management’s Discussion and Analysis of Financial Condition and Results of Operations" in our Annual Report filed with the SEC for the fiscal year ended December 31, 2021.
Revenue | | | | | | | | | | | | | | | | | | | | | | | | | | | | | |
| | | % of | | | | % of | | | | |
| In millions | 2022 | | Revenue | | 2021 | | Revenue | | | | |
| Recurring | $ | 1,419 | | | 79.1 | % | | $ | 1,464 | | | 76.4 | % | | | | |
| Perpetual software license, hardware and other | 65 | | | 3.6 | % | | 77 | | | 4.0 | % | | | | |
| Consulting services | 311 | | | 17.3 | % | | 376 | | | 19.6 | % | | | | |
| Total revenue | $ | 1,795 | | | 100.0 | % | | $ | 1,917 | | | 100.0 | % | | | | |
2022 compared to 2021 - Total revenue decreased 6% in 2022, which included a 4% negative impact from foreign currency exchange rate fluctuations. Total revenue was adversely impacted by the loss of approximately $60 million in revenue (approximately $45 million of which related to recurring revenue) as a result of our ceasing operations in Russia during the first quarter of 2022. Recurring revenue declined 3% in 2022, which included a 4% negative impact from foreign currency exchange rate fluctuations and a 3% negative impact from the loss of Russia recurring revenue.
For full year 2023, recurring revenue is expected to increase in the range of 4% to 7% year-over-year. Total revenue is expected to increase in the range of 1% to 4% year-over-year.
Revenues from perpetual software licenses, hardware, and other were down 16% in 2022, including 4% of adverse impact from foreign currency exchange rate fluctuations, as customers continue to transition to our subscription-based offerings, consistent with our overall strategy.
Aligned with our strategy, we expect perpetual software licenses, hardware and other revenue to decline in 2023.
Consulting services revenue decreased 17%, including a 6% adverse impact from foreign currency exchange rate fluctuations, as we continue to realign and focus our consulting resources on higher-margin engagements, both direct engagement with customers and joint engagement with partners that drive increased software consumption within our targeted customer base. Consulting services revenue was also impacted by ceasing our operations in Russia.
Consistent with our continued focus on higher-margin engagements that further our strategy and a deliberate decrease in lower-margin consulting services that are outside our core strategic focus, we are forecasting 2023 consulting services revenue to be roughly flat as compared to 2022.
As a portion of our operations and revenue occur outside the United States, and in currencies other than the U.S. dollar, we are exposed to fluctuations in foreign currency exchange rates. Based on currency rates as of January 31, 2023, Teradata is estimating a 0.5%-to-1.0% negative impact from currency translation on our 2023 full-year total revenues.
Financial and Performance Measures
Total ARR is composed of three main categories: (1) Public Cloud ARR, (2) ARR related to on-premises subscription-based contracts and private cloud ("Subscription ARR"), and (3) ARR related to our legacy perpetual maintenance and software upgrade rights. Our financial and performance measures for the following years ended
December 31 was as follows: | | | | | | | | | | | | | | |
| ARR | | | | |
| 2022 | | 2021 | |
| | | | |
| In millions | | | | |
| Public Cloud | $ | 357 | | $ | 202 | |
| Subscription | 844 | | 898 | |
| Maintenance and Software upgrade rights | 281 | | 392 | |
| | | | |
| Total ARR | $ | 1,482 | | $ | 1,492 | |
| | | | |
| Cloud Net Expansion rate | 117 | % | | 133 | % | |
Total ARR decreased 1% versus the prior year, with declines in Subscription ARR and Maintenance and Software upgrade rights ARR partially off-set by growth in Public Cloud ARR. Ceasing operations in Russia adversely affected Total ARR by approximately 4% and adverse foreign currency fluctuations had a negative 3% impact.
Public Cloud ARR increased 77% versus the prior year primarily due to on-premises customers migrating to Teradata VantageCloud along with a strong net expansion rate of 117%. This growth was driven by customer demand for our differentiated offerings, resulting in new, incremental workloads for both migrations and expansions. Subscription ARR decreased 6% in 2022 from the prior year primarily due to the adverse impact of foreign currency exchange rate fluctuations and ceasing operations in Russia.
Our Maintenance and Software upgrade rights ARR declined 28% compared to 2021. This was expected as we continue to transition to a subscription model and customers increasingly purchased Teradata on a subscription and/or public cloud basis, the decline is also due to foreign currency exchange rate fluctuations and ceasing operations in Russia. Excluding foreign currency exchange rate fluctuations, our overall ARR growth was primarily driven by increased demand for our differentiated offerings, increasing partner involvement, and incremental workloads driving migrations and expansions.
For the full year 2023, Public Cloud ARR is expected to increase in the range of 53% to 57% year-over-year. Total ARR is expected to increase in the range of 6% to 8% year-over-year.
Gross Profit
The Company often uses specific terms and definitions to describe variances in gross profit. The terms and definitions most often used are as follows:
•Revenue Mix - The proportion of recurring, consulting, and perpetual software licenses, hardware and other revenue that generates the total revenue of the Company. Changes in revenue mix can have an impact on gross profit even if total revenue remains unchanged.
•Recurring Revenue Mix - The proportion of various recurring revenue offerings that comprise the total of recurring revenue. For example, a higher mix of cloud deals will have a negative impact on total recurring gross profit until we achieve scale.
•Deal Mix - Refers to the type of transactions closed within the period that generate the total perpetual software license, hardware and other revenue. For example, a higher mix of Teradata versus third-party products can impact profitability.
Gross profit for the following years ended December 31 was as follows: | | | | | | | | | | | | | | | | | | | | | | | | | | | | | |
| | | % of | | | | % of | | | | |
| In millions | 2022 | | Revenue | | 2021 | | Revenue | | | | |
| Gross profit | | | | | | | | | | | |
| Recurring | $ | 1,022 | | | 72.0 | % | | $ | 1,099 | | | 75.1 | % | | | | |
| Perpetual software licenses, hardware and other | 18 | | | 27.7 | % | | 34 | | | 44.2 | % | | | | |
| Consulting services | 41 | | | 13.2 | % | | 53 | | | 14.1 | % | | | | |
| Total gross profit | $ | 1,081 | | | 60.2 | % | | $ | 1,186 | | | 61.9 | % | | | | |
2022 compared to 2021 - The decrease in recurring gross profit as a percentage of revenue was primarily driven by decreased revenue as a result of foreign currency exchange rate fluctuations, ceasing operations in Russia, charges related to ceasing operations in Russia, and a higher recurring revenue mix that shifted to cloud.
The decrease in perpetual software licenses, hardware and other gross profit as a percentage of revenue was primarily driven by deal mix and a higher ratio of perpetual hardware to software revenue as compared to prior year as the vast majority of all customers have transitioned to our subscription-based offerings, consistent with our overall strategy.
Consulting services gross profit as a percentage of revenue decreased as compared to the prior year primarily due to lower revenue. We continue to refocus our consulting organization on Teradata Vantage-oriented offerings and reduce our footprint in non-core consulting engagements, accompanied by our strategic development of a partner ecosystem.
For 2023, we expect overall gross profit as a percentage of revenue to be slightly lower than 2022. Recurring gross margin is expected to be lower due to a higher mix of cloud revenue though cloud gross margin is expected to increase as compared to 2022. We are investing in activities that continue to drive increased adoption and consumption of the Teradata Vantage platform, including greater efficiencies with cloud service providers, offset by enhancements to our consumption pricing model. In addition, we are forecasting less of a positive impact from upfront recurring revenue as customers continue to migrate to the Cloud. Consulting services margin is expected to be at a similar gross margin rate as 2022. We anticipate lower gross margin rates in perpetual software licenses, hardware and other in 2023 compared to 2022.
Operating Expenses | | | | | | | | | | | | | | | | | | | | | | | | | | | | | |
| | | % of | | | | % of | | | | |
| In millions | 2022 | | Revenue | | 2021 | | Revenue | | | | |
| Operating expenses | | | | | | | | | | | |
| Selling, general and administrative expenses | $ | 650 | | | 36.2 | % | | $ | 646 | | | 33.7 | % | | | | |
| Research and development expenses | 313 | | | 17.4 | % | | 309 | | | 16.1 | % | | | | |
| | | | | | | | | | | |
| Total operating expenses | $ | 963 | | | 53.6 | % | | $ | 955 | | | 49.8 | % | | | | |
2022 compared to 2021 - The increase in selling, general and administrative ("SG&A") expense was primarily driven by higher stock-based compensation and ceasing operations in Russia as compared to the prior year, partially offset by favorable impact from foreign currency exchange rate fluctuations and continued cost discipline as compared to the prior year.
R&D expenses increased in 2022 as compared to the prior year. R&D expenses were impacted by higher stock-based compensation, an increase in spending to focus our R&D efforts on accelerating our transformation and cloud-first strategy and related cloud initiatives, such as VantageCloud Lake, partially off-set by continued cost discipline initiatives as compared to the prior year.
We expect total operating expenses to decrease in 2023 as we continue to focus on our cost discipline initiatives, and align and optimize our talent needs to drive our cloud-first and profitable growth strategy.
Other Expense, net | | | | | | | | | | | | | | | |
| | | | | |
| In millions | 2022 | | 2021 | | |
| | | | | |
| Interest income | $ | 15 | | | $ | 6 | | | |
| Interest expense | (24) | | | (26) | | | |
| Other | (42) | | | (19) | | | |
| Total Other Expense, net | $ | (51) | | | $ | (39) | | | |
Other expense, net in 2022 and 2021, is comprised primarily of interest expense on long-term debt and finance leases, foreign currency transactions, as well as benefit costs for our pension and postemployment plans, partially offset by interest income earned on our cash and cash equivalents. Other expense is higher in 2022, primarily due to $22 million higher losses resulting from foreign currency transactions compared to the prior year.
Provision for Income Taxes
The effective income tax rate for the following years ended December 31 was as follows: | | | | | | | | | | | | | | | |
| 2022 | | 2021 | | |
| Effective Tax Rate | 50.7 | % | | 23.4 | % | | |
The 2022 effective tax rate included a net $1 million of discrete tax benefit, of which $2 million of tax benefit related to the reversal of a FIN 48 tax reserve due to the expiration of statute of limitations and $4 million of incremental tax benefit related to stock-based compensation. These tax benefits were partially offset by $5 million of discrete tax expense related to valuation allowances recorded against deferred tax assets and current receivables in Russia that are not expected to be realized as a result of the discontinuation of our business in Russia.
Effective on January 1, 2022, the U.S. tax law changed to require that R&D expenses be capitalized and amortized for tax purposes under Internal Revenue Code Section 174; as a result of this law change, we recognized approximately $4 million of tax expense related to global intangible low-taxed income ("GILTI") in our marginal effective tax rate for 2022. We expect that a majority of our foreign earnings will be repatriated to the U.S.
The 2021 effective tax rate included a net $8 million of discrete tax benefit, of which $3 million of tax benefit was related to true-up adjustments to reconcile our 2020 U.S. tax return versus the preliminary estimate as booked in its tax provision for the year ended December 31, 2020 and $2 million of tax benefit related to a reduction in the transition tax on accumulated foreign earnings resulting from the 2017 Tax Act based on our amended 2017 tax return. In addition, we recognized $4 million of incremental tax benefit related to stock-based compensation. These tax benefits were partially offset by $1 million of discrete tax expense related to adjustments to our accrual for unrecognized tax benefits in accordance with FIN 48.
We are expecting our full-year effective tax rate for 2023 to be approximately 37%, which takes into consideration, among other things, the forecasted earnings mix by jurisdiction and the estimated discrete items to be recognized in 2023. The forecasted tax rate is based on the overseas profits being taxed at an overall effective tax rate of approximately 25%, as compared to the U.S. federal statutory tax rate of 21%.
Revenue and Gross Profit by Operating Segment
Teradata manages its business under three geographic regions, which are also the Company’s operating segments: (1) Americas region (North America and Latin America); (2) EMEA region (Europe, Middle East, and Africa) and (3) APJ region (Asia Pacific and Japan). For purposes of discussing results by segment, management excludes the impact of certain items, consistent with the manner by which management evaluates the performance of each segment. This format is useful to investors because it allows analysis and comparability of operating trends. It also includes the same information that is used by Teradata management to make decisions regarding the segments and to assess financial performance. The chief operating decision maker, who is our President and Chief Executive Officer, evaluates the performance of the segments based on revenue and multiple profit measures, including segment gross profit. For management reporting purposes, assets are not allocated to the segments. Our segment results are reconciled to total company results reported under GAAP in Note 14 of Notes to Consolidated Financial Statements.
The following table presents revenue and operating performance by segment for the years ended December 31: | | | | | | | | | | | | | | | | | | | | | | | | | | |
| | | % of | | | | % of | |
| In millions | 2022 | | Revenue | | 2021 | | Revenue | |
| Segment revenue | | | | | | | | |
| Americas | $ | 1,038 | | | 57.8 | % | | $ | 1,044 | | | 54.5 | % | |
| EMEA | 465 | | | 25.9 | % | | 543 | | | 28.3 | % | |
| APJ | 292 | | | 16.3 | % | | 330 | | | 17.2 | % | |
| Total segment revenue | $ | 1,795 | | | 100 | % | | $ | 1,917 | | | 100 | % | |
| Segment gross profit | | | | | | | | |
| Americas | $ | 643 | | | 61.9 | % | | $ | 690 | | | 66.1 | % | |
| EMEA | 285 | | | 61.3 | % | | 337 | | | 62.1 | % | |
| APJ | 177 | | | 60.6 | % | | 188 | | | 57.0 | % | |
| | | | | | | | |
| | | | | | | | |
| Total segment gross profit | $ | 1,105 | | | 61.6 | % | | $ | 1,215 | | | 63.4 | % | |
2022 compared to 2021
Americas
Americas revenue decreased 1% including a 1% negative underlying impact from foreign currency exchange rate fluctuations. An increase in Americas recurring revenue of 1% was offset by a decrease of 4% in perpetual software licenses, hardware and other revenue and a decrease in consulting revenue of 11% as compared to the prior year. The decrease in Americas consulting revenue was expected due to our focus on higher-margin Teradata Vantage-oriented engagements and purposeful decrease in consulting services given our strategic development of a partner ecosystem. Segment gross profit, as a percentage of revenue, decreased due to a decrease in the gross profit associated with upfront revenue, as well as a higher mix of cloud revenues, both as compared to the prior period.
EMEA
EMEA revenue decreased 14%, which included a 7% unfavorable impact from foreign currency exchange rate fluctuations. The overall decrease in revenue included a decrease of 11% in EMEA recurring revenue, a 24% decrease in consulting revenue and a decrease of 11% in perpetual software licenses, hardware and other revenue. Overall revenue decreased due to the negative effects of foreign currency exchange rate fluctuations and ceasing operations in Russia. EMEA segment gross profit, as a percentage of revenue, was lower due to the negative impact of ceasing operations in Russia, which was partially offset by positive deal mix within perpetual software licenses, hardware and other revenue.
APJ
APJ revenue decreased 12%, which included a 10% unfavorable impact from foreign currency exchange rate fluctuations. The overall decrease in revenue included a decrease in APJ recurring revenue of 7% , a decrease of 44% ($7 million) in perpetual software licenses and hardware revenue and a decrease in consulting revenue of 17%. Perpetual software licenses, hardware and other revenue was down as customers continued to transition to subscription-based offerings, consistent with our overall strategy. The decrease in consulting revenue was also consistent with our focus on higher-margin Teradata Vantage-oriented engagements and purposeful decrease in consulting services given our strategic development of a partner ecosystem. APJ segment gross profit, as a percentage of revenue, was higher primarily due to a higher mix of recurring revenue, and the impact of cost-reduction efforts within the consulting organization.
FINANCIAL CONDITION, LIQUIDITY AND CAPITAL RESOURCES
Teradata ended 2022 with $569 million in cash and cash equivalents, a $23 million decrease from December 31, 2021, after using approximately $387 million for repurchases of Company common stock during the year. Cash provided by operating activities decreased by $44 million to $419 million in 2022 compared to 2021. The decrease in cash provided by operating activities was primarily due to lower net income in part due to ceasing operations in Russia during the first quarter of 2022 and timing of working capital dynamics. This was partially offset by the receipt of a $50 million tax refund in 2022 related to our Cares Act carryback claim, which was included in our cash provided by operating activities. Teradata used approximately $26 million of cash in 2022 for reorganization activities, including ceasing our operations in Russia, aligning our go-to-market function with our cloud-first strategy, and other activities to optimize our workforce, as compared to $40 million used in 2021 for similar purposes. Given current plans for reorganization activities, approximately $20 million of additional cash is expected to be used in 2023 for such initiatives, as compared to 2022.
Teradata’s management uses a non-GAAP measure called "free cash flow," which is not a measure defined under GAAP. We define free cash flow as net cash provided by operating activities less capital expenditures for property and equipment and additions to capitalized software. Free cash flow is one measure of assessing the financial performance of the Company, and this may differ from the definition used by other companies. The components that are used to calculate free cash flow are GAAP measures taken directly from the Consolidated Statements of Cash Flows. We believe that free cash flow information is useful for investors because it relates the operating cash flow of the Company to the capital that is spent to continue and improve business operations. In particular, free cash flow indicates the amount of cash available after capital expenditures for, among other things, investments in the Company’s existing businesses, strategic acquisitions, and repurchase of Teradata common stock. Free cash flow does not represent the residual cash flow available for discretionary expenditures since there may be other non-discretionary expenditures that are not deducted from the measure. This non-GAAP measure should not be considered a substitute for, or superior to, cash flows from operating activities under GAAP.
The table below shows net cash provided by operating activities and capital expenditures for the following periods: | | | | | | | | | | | | | | | |
| In millions | 2022 | | 2021 | | |
| Net cash provided by operating activities | $ | 419 | | | $ | 463 | | | |
| Less: | | | | | |
| Expenditures for property and equipment | (14) | | | (28) | | | |
| Additions to capitalized software | (2) | | | (3) | | | |
| Free cash flow | $ | 403 | | | $ | 432 | | | |
Financing activities and certain other investing activities are not included in our calculation of free cash flow. There were no material other investing activities in 2022 and 2021.
Teradata’s financing activities for the year ended December 31, 2022 primarily consisted of cash outflows of $387 million for share repurchases, repayments of our term loans of $413 million and $86 million of payments on finance leases, partially offset by $500 million from refinancing our prior term loan to our new Term Loan (as defined below) and as described in Note 12 of Notes to Consolidated Financial Statements and $5 million net inflows from other financing activities. At December 31, 2022, we had no outstanding borrowings on our $400 million Revolving Facility (as defined below).
Teradata’s financing activities for the year ended December 31, 2021 primarily consisted of cash outflows of $244 million for share repurchases, repayment of our term loan of $44 million and $92 million of payments on finance leases, partially offset by $24 million net inflows from other financing activities.
We purchased 9.4 million shares of our common stock at an average price per share of $41.16 in 2022 and 5.8 million shares of our common stock at an average price per share of $41.94 in 2021.
Share repurchases were made under two share repurchase programs initially authorized by our Board of Directors in 2008. The first of these programs (the "dilution offset program") authorizes us to repurchase Teradata common stock to the extent of cash received from the exercise of stock options and the Teradata Employee Stock Purchase
Plan ("ESPP") to offset dilution from shares issued pursuant to these plans. As of December 31, 2022, under our second share repurchase program (the "general share repurchase program"), we had approximately $840 million of authorization remaining to repurchase outstanding shares of Teradata common stock. Share repurchases are reported on a trade date basis. As part of our general share repurchase program, on February 9, 2022, we entered into a $250 million ASR agreement with JPMorgan Chase, which concluded on May 6, 2022.
Proceeds from the ESPP and the exercise of stock options, net of tax paid for shares withheld upon equity award settlement, were $8 million in 2022 and $24 million in 2021. These proceeds are included in other financing activities, net in the Consolidated Statements of Cash Flows.
Our total cash and cash equivalents held outside the United States in various foreign subsidiaries was $405 million as of December 31, 2022 and $401 million as of December 31, 2021. The remaining balance held in the United States was $164 million as of December 31, 2022 and $191 million as of December 31, 2021. We consider a majority of our foreign earnings as not indefinitely reinvested outside the United States. Effective January 1, 2018, the United States moved to a territorial system of international taxation and, as such, will generally not subject future foreign earnings to United States taxation upon repatriation in future years.
Management believes current cash, cash generated from operations, the net cash inflow from our refinancing as described above and the $400 million available under the Credit Facility will be sufficient to satisfy future working capital, research and development activities, capital expenditures, pension contributions, and other financing requirements for at least the next twelve months. We principally hold cash and cash equivalents in bank deposits and highly-rated money market funds.
Our ability to generate positive cash flows from operations is dependent on general economic conditions, competitive pressures, and other business and risk factors described in this Annual Report. If we are unable to generate sufficient cash flows from operations, or otherwise to comply with the terms of the credit facility and term loan agreement, we may be required to seek additional financing alternatives.
Long-Term Debt. On June 28, 2022, we entered into a Credit Agreement that provides for (i) a five-year unsecured term loan in an aggregate principal amount of $500 million (the "Term Loan"), and (ii) a five-year unsecured revolving credit facility in an aggregate principal amount of up to $400 million, including a $50 million sublimit for the issuance of standby letters of credit and a $50 million sublimit for swingline loans (the "Revolving Facility" and, collectively with the Term Loan, the "Credit Facility"). The Credit Facility replaces our prior revolving credit agreement in the maximum principal of $400 million and our prior term loan agreement in the principal amount of $500 million, both of which were entered into in 2018 (the "Prior Agreements"). In connection with the execution of the Credit Facility, the $400 million term loan then outstanding, which excluded the scheduled $13 million principal installment we paid during the first quarter of 2022 under the Prior Agreements, was repaid in full. Our long-term debt and minimum debt obligations as of December 31, 2022, including our Credit Facility are discussed in Note 12 of Notes to Consolidated Financial Statements. In addition, as disclosed in Note 9 of Notes to Consolidated Financial Statements, in June 2022, we entered into an interest rate swap to hedge approximately 90% of the floating interest rate of the total $500 million Term Loan and a cross currency swap to hedge a portion of the Euro currency exposure of our net investment in certain foreign subsidiaries.
Leases. In the normal course of business, we enter into operating and finance leases that impact, or could impact, our liquidity. Leases and minimum lease obligations as of December 31, 2022 are described in detail in Note 13 of Notes to Consolidated Financial Statements.
Contractual and Other Commercial Commitments. In the normal course of business, we enter into various contractual obligations that impact, or could impact, our liquidity. The following table and discussion outline our material obligations at December 31, 2022, with projected cash payments in the periods shown: | | | | | | | | | | | | | | | | | | | | | | | | | | | | | |
| Total | | | | 2024- | | 2026- | | 2028 and |
| In millions | Amounts | | 2023 | | 2025 | | 2027 | | Thereafter |
| Transition tax | $ | 69 | | | $ | 17 | | | $ | 52 | | | $ | — | | | $ | — | |
| Purchase obligations | 457 | | | 171 | | | 201 | | | 85 | | | — | |
| Total transition tax and purchase obligations | $ | 526 | | | $ | 188 | | | $ | 253 | | | $ | 85 | | | $ | — | |
Transition tax is the remaining payable balance as of December 31, 2022 of the one-time tax on accumulated foreign earnings resulting from the 2017 Tax Act. The payments associated with this deemed repatriation are being paid over seven years ending in 2025. Purchase obligations are committed purchase orders and other contractual commitments for goods and services and include non-cancelable contractual payments for fixed or minimum amounts to be purchased in relation to service agreements with various vendors for ongoing telecommunications, information technology, hosting and other services.
Additionally, we had $41 million of unrecognized tax benefits recorded on our balance sheet as of December 31, 2022, of which $22 million is recorded in non-current liabilities and $19 million is reflected as an offset to deferred tax assets related to certain tax attribute carryforwards. These items are not included in the table of obligations shown above. The settlement period for the non-current income tax liabilities cannot be reasonably estimated as the timing and the amount of the payments, if any, will depend on possible future tax examinations with the various tax authorities.
We also have postemployment and international pension obligations that may affect future cash flow. These items are not included in the table of obligations shown above. We are also potentially subject to concentration of supplier risk. Our hardware components are assembled exclusively by Flex Ltd. ("Flex"). Flex procures a wide variety of components used in the manufacturing process on our behalf. Although many of these components are available from multiple sources, we utilize preferred supplier relationships to better ensure more consistent quality, cost, and delivery. Typically, these preferred suppliers maintain alternative processes and/or facilities to ensure continuity of supply. Given our strategy to outsource manufacturing activities to Flex and to source certain components from single suppliers, a disruption in production at Flex or at a supplier could impact the timing of customer shipments and/or Teradata’s operating results. In addition, a significant change in the forecasts to any of these preferred suppliers could result in purchase obligations or components that may be in excess of demand. Postemployment and pension obligations are described in detail in "Note 8—Employee Benefit Plans" in the Notes to Consolidated Financial Statements.
Off-Balance Sheet Arrangements. We do not participate in transactions that generate relationships with unconsolidated entities or financial partnerships, such as entities often referred to as structured finance or special purpose entities, which would have been established for the purpose of facilitating off-balance sheet arrangements or for other contractually narrow or limited purposes.
CRITICAL ACCOUNTING POLICIES AND ESTIMATES
Our financial statements are prepared in accordance with GAAP. In connection with the preparation of these financial statements, we are required to make assumptions, estimates and judgments that affect the reported amounts of assets, liabilities, revenues, expenses and the related disclosure of contingent liabilities. These assumptions, estimates and judgments are based on historical experience and assumptions that are believed to be reasonable at the time. However, because future events and their effects cannot be determined with certainty, the determination of estimates requires the exercise of judgment. Our critical accounting policies are those that require assumptions to be made about matters that are highly uncertain. Different estimates could have a material impact on our financial results. Judgments and uncertainties affecting the application of these policies and estimates may result in materially different amounts being reported under different conditions or circumstances. Our management periodically reviews these estimates and assumptions to ensure that our financial statements are presented fairly and are materially correct.
In many cases, the accounting treatment of a particular transaction is specifically dictated by GAAP and does not require significant management judgment in its application. There are also areas in which management’s judgment in selecting among available alternatives would not produce a materially different result. The significant accounting policies and estimates that we believe are the most critical to aid in fully understanding and evaluating our reported financial results are discussed in the paragraphs below. Teradata’s senior management has reviewed these critical accounting policies and related disclosures with the Audit Committee of Teradata’s Board of Directors. For additional information regarding our accounting policies and other disclosures required by GAAP, see "Note 1—Description of Business, Basis of Presentation and Significant Accounting Policies" in the Notes to Consolidated Financial Statements.
Revenue Recognition
Revenue recognition for complex contractual arrangements requires judgment, including a review of specific contracts, past experience, creditworthiness of customers, international laws and other factors. Specifically, complex arrangements with nonstandard terms and conditions may require significant contract interpretation to determine the appropriate accounting. We must also apply judgment in determining all performance obligations in the contract and in determining the standalone selling price of each performance obligation, considering the price charged for each product when sold on a standalone basis and applicable renewal rates for services and subscriptions. Changes in judgments about these factors could impact the timing and amount of revenue recognized between periods.
We review the standalone selling price on a periodic basis and update it, when appropriate, to ensure that the practices employed reflect our recent pricing experience. We maintain internal controls over the establishment and updates of these estimates, which includes review and approval by management. For the year ended December 31, 2022 there was no material impact to revenue resulting from changes in the standalone selling price, nor do we expect a material impact from such changes in the near term. Refer to Notes 1 and 3 in the Notes to Consolidated Financial Statements included in this Annual Report on Form 10-K for discussion of our revenue recognition policies.
Income Taxes
In accounting for income taxes, we recognize deferred tax assets and liabilities based on the differences between the financial statement carrying amounts and the tax basis of assets and liabilities. The deferred tax assets and liabilities are determined based on the enacted tax rates expected to apply in the periods in which the deferred tax assets or liabilities are expected to be settled or realized. The Company made an accounting policy election in 2018 related to the 2017 Tax Act to provide for the tax expense related to GILTI in the year the tax is incurred.
Effective January 1, 2018, the United States moved to a territorial system of international taxation, and as such will generally not subject future foreign earnings to United States taxation upon repatriation in future years. The Company considers a majority of its foreign earnings not indefinitely reinvested outside of the United States. However, these distributions may be subject to non-U.S. withholding taxes if profits are distributed from certain jurisdictions; accordingly, the Company has recorded $5 million of deferred foreign tax expense with respect to certain earnings that are not considered permanently reinvested. Deferred taxes have not been provided on earnings considered indefinitely reinvested.
We account for uncertainty in income taxes by prescribing thresholds and attributes for the financial statement recognition and measurement of a tax position taken or expected to be taken in a tax return. We may recognize the tax benefit from an uncertain tax position only if it is more likely than not that the tax position will be sustained on examination by the taxing authorities, based on the technical merits of the position. We record any interest and/or penalties related to uncertain tax positions in the income tax expense line on our Consolidated Statements of Income. As of December 31, 2022, the Company has a total of $41 million of unrecognized tax benefits, of which $22 million is included in the other liabilities section of the Company’s consolidated balance sheet as a non-current liability and $19 million of uncertain tax positions relates to certain tax attributes generated by the Company which are netted against the underlying deferred tax assets recorded on the balance sheet.
We regularly review our deferred tax assets for recoverability and establish a valuation allowance if it is more likely than not that some portion or all of a deferred tax asset will not be realized. We have recorded $69 million in 2022 and $58 million in 2021 for valuation allowances, a majority of which offset our California R&D tax credit carryfoward, as the Company expects to continue to generate excess California R&D tax credits into the foreseeable future.
On January 1, 2020, we transferred certain of our intellectual property among our wholly-owned subsidiaries, which resulted in the recognition of deferred tax assets of $157 million. The recognition of deferred tax assets from intra-entity transfers of intellectual property required us to make significant estimates and assumptions to determine the fair value of such intellectual property. Significant assumptions in valuing the intellectual property include, but are not limited to, internal revenue and expense forecasts, and the discount rate. The sustainability of our future tax benefits is dependent upon the acceptance of these valuation estimates and assumptions by the taxing authorities.
Stock-based Compensation
We issue service-based and performance-based restricted share units. We measure compensation cost for service-based restricted share unit awards at fair value and recognize compensation expense over the service period. Our performance-based restricted share units vest only if specific performance conditions are satisfied. The number of shares that will be earned pursuant to our performance-based restricted share unit awards will vary based on actual performance. No shares will vest if the threshold objectives are not met. In the event the objectives are exceeded, additional shares will vest up to a maximum payout. The cost of our performance-based restricted share awards is expensed over the performance period based upon management’s estimate and analysis of the probability of meeting the performance criteria. Because the actual number of shares to be awarded is not known until the end of the performance period, the actual compensation expense related to our performance-based restricted share unit awards could differ from our current expectations. We account for forfeitures for both service-based and performance-based restricted share units as they occur instead of estimating forfeitures at the time of grant and revising those estimates in subsequent periods if actual forfeitures differ from our estimates.
Goodwill and Acquired Intangible Assets
The Company reviews goodwill for impairment annually and whenever events or changes in circumstances indicate the carrying value of goodwill may not be recoverable. For 2019, the Company performed a quantitative impairment test. In this test, the Company compared the fair value of each reporting unit to its carrying value. The Company typically determines the fair value of its reporting units using a weighting of fair values derived from the income and market approaches. Under the income approach, the Company calculates the fair value of a reporting unit based on the present value of estimated future cash flows. The market approach estimates fair value based on market multiples of revenue and earnings derived from comparable companies with similar operating and investment characteristics as the reporting unit. If the fair value of the reporting unit exceeds the carrying value of the net assets assigned to that unit, goodwill is not impaired. If the carrying value of the net assets assigned to the reporting unit exceeds the fair value of the reporting unit, then the Company records an impairment loss equal to the difference. In the fourth quarter of 2022, the Company performed its annual impairment test of goodwill and determined that no impairment to the carrying value of goodwill was necessary.
Determining the fair value of goodwill and acquired intangibles is judgmental in nature and involves the use of significant estimates and assumptions. These estimates and assumptions include revenue growth rates and operating margins used to calculate projected future cash flows, discount rates and future economic and market conditions. The Company’s estimates are based upon assumptions believed to be reasonable, but which are inherently uncertain and unpredictable. These valuations require the use of management’s assumptions, which may not reflect unanticipated events and circumstances that may occur.
Leases
Leases with durations greater than twelve months are recognized on the balance sheet. We determine if a contract contains a lease at inception. Our material operating leases primarily consist of automobiles in certain countries and real estate, including office, storage and parking space. Our operating leases generally have remaining terms of 2-4 years. Our finance leases primarily consist of equipment financed for the purpose of delivering services to our customers and generally have terms of 3 years.
Operating lease assets and liabilities are recognized at the lease commencement date. Operating lease liabilities represent the present value of lease payments not yet paid. Operating lease assets represent our right to use an underlying asset and are based upon the operating lease liabilities adjusted for prepayments or accrued lease payments, initial direct costs, lease incentives, and impairment of operating lease assets. To determine the present value of lease payments not yet paid, when available, we use the rate implicit in the lease. However, real estate leases do not typically provide a readily determinable implicit rate. Therefore, we estimate the incremental borrowing rate to discount the lease payments based on information available at lease commencement. The incremental borrowing rate used in the calculation of the lease liability is based on the secured rate associated with financed lease obligations for each location of leased property. Many of our leases include variable rental escalation clauses which are recognized when incurred. Some of our leases also include renewal options and/or termination options that are factored into the determination of lease payments and lease terms when it is reasonably certain that
the Company will exercise these options. Lease agreements do not contain any material residual value guarantees or material restrictive covenants. Leases with an initial term of 12 months or less are not recorded on the balance sheet. Changes in judgments and estimates, such as the likelihood of renewal options, impairments, or the incremental borrowing rate could impact the amounts of assets or liabilities recorded or could impact the amount of cost or expense recognized between periods.
Pension and Postemployment Benefits
We measure pension and postemployment benefit costs and credits using actuarial valuations. Actuarial assumptions attempt to anticipate future events and are used in calculating the expense and liability relating to these plans. These factors include assumptions we make about interest rates, expected investment return on plan assets, total and involuntary turnover rates, and rates of future compensation increases. In addition, our actuarial consultants also use subjective factors such as withdrawal rates and mortality rates to develop our valuations. We review and update these assumptions on an annual basis at the beginning of each fiscal year. We are required to consider current market conditions, including changes in interest rates, in making these assumptions. The actuarial assumptions that we use may differ materially from actual results due to changing market and economic conditions, higher or lower withdrawal rates, or longer or shorter life spans of participants. These differences may result in a significant impact to the measurement of our pension and postemployment benefit obligations and to the amount of pension and postemployment benefits expense we have recorded or may record. For example, as of December 31, 2022, a one-half percent increase/decrease in the discount rate would change the projected benefit obligation of our pension plans by approximately $6 million, and a one-half percent increase/decrease in our involuntary turnover assumption would change our postemployment benefit obligation by approximately $7 million.
RECENTLY ISSUED ACCOUNTING PRONOUNCEMENTS
A discussion of recently issued accounting pronouncements is described in "Note 1—Description of Business, Basis of Presentation and Significant Accounting Policies" in the Notes to Consolidated Financial Statements in this Annual Report, and we incorporate such discussion by reference.
| | | | | |
| Item 7A. | QUANTITATIVE AND QUALITATIVE DISCLOSURES ABOUT MARKET RISK |
The Company employs a foreign currency hedging strategy to limit potential losses in earnings or cash flows from adverse foreign currency exchange rate movements. Foreign currency exposures arise from transactions denominated in a currency other than the Company’s functional currency and from foreign denominated revenue and profit translated into U.S. dollars. The Company operates in approximately 40 countries and is exposed to various foreign currencies in the Americas region (North America and Latin America), EMEA region (Europe, Middle East, and Africa) and APJ region (Asia Pacific and Japan). Exposures are hedged with foreign currency forward contracts with maturity dates of twelve months or less. The potential loss in fair value at December 31, 2022, for such contracts resulting from a hypothetical 10% adverse change in all foreign currency exchange rates is approximately $1 million. This loss would be mitigated by corresponding gains on the underlying exposures.
In June 2022, Teradata entered into a four-year interest rate swap to hedge approximately 90% of the floating interest rate of the total $500 million Term Loan and a cross currency swap to hedge a portion of Euro currency exposure of its net investment in certain foreign subsidiaries as more fully described in "Note 12 - Debt" in the Notes to Consolidated Financial Statements in this Annual Report. The Company uses interest rate swaps to manage interest rate risks on future interest payments caused by interest rate changes on its variable rate term loan facility. The notional amount of the hedge will step-down according to the amortization schedule of the term loan. The fair value of these contracts and swaps are measured at the end of each reporting period using observable inputs other than quoted prices, specifically market spot and forward exchange rates. The fair value of interest rate swaps recorded in other assets at December 31, 2022 was $13 million. A hypothetical 50 basis point increase/decrease in interest rates would result in an increase/decrease to the fair value of the hedge of approximately $7 million. The fair value of the net investment Euro currency hedge recorded in other liabilities at December 31, 2022 was $1 million. A hypothetical 50 basis point increase/decrease in currency exchange rates would result in an increase/decrease to the fair value of the hedge of approximately $2 million.
For additional information regarding the Company’s foreign currency hedging strategy and interest rate swaps, see "Note 9 - Derivative Instruments and Hedging Activities" in the Notes to Consolidated Financial Statements in this Annual Report.
| | | | | |
| Item 8. | FINANCIAL STATEMENTS AND SUPPLEMENTARY DATA |
Report of Independent Registered Public Accounting Firm
To the Board of Directors and Stockholders of Teradata Corporation
Opinions on the Financial Statements and Internal Control over Financial Reporting
We have audited the accompanying consolidated balance sheets of Teradata Corporation and its subsidiaries (the “Company”) as of December 31, 2022 and 2021, and the related consolidated statements of income, of comprehensive income, of changes in stockholders’ equity and of cash flows for each of the three years in the period ended December 31, 2022, including the related notes and financial statement schedule listed in the index appearing under Item 15(a)(2) (collectively referred to as the “consolidated financial statements”). We also have audited the Company's internal control over financial reporting as of December 31, 2022, based on criteria established in Internal Control - Integrated Framework (2013) issued by the Committee of Sponsoring Organizations of the Treadway Commission (COSO).
In our opinion, the consolidated financial statements referred to above present fairly, in all material respects, the financial position of the Company as of December 31, 2022 and 2021, and the results of its operations and its cash flows for each of the three years in the period ended December 31, 2022 in conformity with accounting principles generally accepted in the United States of America. Also in our opinion, the Company maintained, in all material respects, effective internal control over financial reporting as of December 31, 2022, based on criteria established in Internal Control - Integrated Framework (2013) issued by the COSO.
Basis for Opinions
The Company's management is responsible for these consolidated financial statements, for maintaining effective internal control over financial reporting, and for its assessment of the effectiveness of internal control over financial reporting, included in Management’s Annual Report on Internal Control Over Financial Reporting appearing under Item 9A. Our responsibility is to express opinions on the Company’s consolidated financial statements and on the Company's internal control over financial reporting based on our audits. We are a public accounting firm registered with the Public Company Accounting Oversight Board (United States) (PCAOB) and are required to be independent with respect to the Company in accordance with the U.S. federal securities laws and the applicable rules and regulations of the Securities and Exchange Commission and the PCAOB.
We conducted our audits in accordance with the standards of the PCAOB. Those standards require that we plan and perform the audits to obtain reasonable assurance about whether the consolidated financial statements are free of material misstatement, whether due to error or fraud, and whether effective internal control over financial reporting was maintained in all material respects.
Our audits of the consolidated financial statements included performing procedures to assess the risks of material misstatement of the consolidated financial statements, whether due to error or fraud, and performing procedures that respond to those risks. Such procedures included examining, on a test basis, evidence regarding the amounts and disclosures in the consolidated financial statements. Our audits also included evaluating the accounting principles used and significant estimates made by management, as well as evaluating the overall presentation of the consolidated financial statements. Our audit of internal control over financial reporting included obtaining an understanding of internal control over financial reporting, assessing the risk that a material weakness exists, and testing and evaluating the design and operating effectiveness of internal control based on the assessed risk. Our audits also included performing such other procedures as we considered necessary in the circumstances. We believe that our audits provide a reasonable basis for our opinions.
Definition and Limitations of Internal Control over Financial Reporting
A company’s internal control over financial reporting is a process designed to provide reasonable assurance regarding the reliability of financial reporting and the preparation of financial statements for external purposes in accordance with generally accepted accounting principles. A company’s internal control over financial reporting includes those policies and procedures that (i) pertain to the maintenance of records that, in reasonable detail, accurately and fairly reflect the transactions and dispositions of the assets of the company; (ii) provide reasonable assurance that transactions are recorded as necessary to permit preparation of financial statements in accordance with generally accepted accounting principles, and that receipts and expenditures of the company are being made only in accordance with authorizations of management and directors of the company; and (iii) provide reasonable assurance regarding prevention or timely detection of unauthorized acquisition, use, or disposition of the company’s assets that could have a material effect on the financial statements.
Because of its inherent limitations, internal control over financial reporting may not prevent or detect misstatements. Also, projections of any evaluation of effectiveness to future periods are subject to the risk that controls may become inadequate because of changes in conditions, or that the degree of compliance with the policies or procedures may deteriorate.
Critical Audit Matters
The critical audit matter communicated below is a matter arising from the current period audit of the consolidated financial statements that was communicated or required to be communicated to the audit committee and that (i) relates to accounts or disclosures that are material to the consolidated financial statements and (ii) involved our especially challenging, subjective, or complex judgments. The communication of critical audit matters does not alter in any way our opinion on the consolidated financial statements, taken as a whole, and we are not, by communicating the critical audit matter below, providing a separate opinion on the critical audit matter or on the accounts or disclosures to which it relates.
Revenue Recognition - Evaluation of Nonstandard Terms and Conditions with Customers
As described in Notes 1 and 3 to the consolidated financial statements, the Company has $1,795 million of total revenue for the year ended December 31, 2022, of which a significant portion is generated from revenue with contracts which contain multiple performance obligations. When the Company enters into contracts with multiple performance obligations, management allocates the contract’s transaction price to each performance obligation using the relative standalone selling price of each distinct good or service in the contract. As disclosed by management, revenue recognition for complex contractual arrangements requires judgment, including a review of specific contracts and other factors. Specifically, complex arrangements with nonstandard terms and conditions may require significant contract interpretation to determine the appropriate accounting, including the determination whether promised goods or services are capable of being distinct and distinct within the context of the contract. If these criteria are not met, the promised goods or services are combined with other goods or services and accounted for as a combined performance obligation.
The principal considerations for our determination that performing procedures relating to revenue recognition, specifically related to the evaluation of nonstandard terms and conditions with customers, is a critical audit matter are the significant judgment by management in evaluating the impact of nonstandard terms and conditions with customers on revenue recognition and determining the appropriate revenue recognition. This in turn led to significant auditor judgment, subjectivity, and effort in performing procedures to evaluate the impact of nonstandard terms and conditions on revenue recognition.
Addressing the matter involved performing procedures and evaluating audit evidence in connection with forming our overall opinion on the consolidated financial statements. These procedures included testing the effectiveness of controls relating to the revenue recognition process, including controls over the evaluation of the impact of nonstandard terms and conditions with customers on revenue recognition. These procedures also included, among others (i) evaluating and testing management’s process for determining whether the criteria for revenue recognition have been met based on the specific terms and performance under the arrangement, and (ii) examining revenue arrangements on a test basis, which included evaluating the impact of nonstandard terms and conditions with
customers on revenue recognition. | | | | | |
| |
| /s/ | PricewaterhouseCoopers LLP |
| Atlanta, Georgia |
| February 24, 2023 |
We have served as the Company’s auditor since 2007.
TERADATA CORPORATION
Consolidated Statements of Income
In millions, except per share amounts
| | | | | | | | | | | | | | | | | |
| | For the Years Ended December 31 |
| | 2022 | | 2021 | | 2020 |
| Revenue | | | | | |
| Subscription software licenses | $ | 289 | | | $ | 303 | | | $ | 217 | |
| Services and other | 1,130 | | | 1,161 | | | 1,092 | |
| Total recurring | 1,419 | | | 1,464 | | | 1,309 | |
| Perpetual software licenses, hardware and other | 65 | | | 77 | | | 107 | |
| Consulting services | 311 | | | 376 | | | 420 | |
| Total revenue | 1,795 | | | 1,917 | | | 1,836 | |
| Cost of revenue | | | | | |
| Subscription software licenses | 22 | | | 12 | | | 29 | |
| Services and other | 375 | | | 353 | | | 342 | |
| Total recurring | 397 | | | 365 | | | 371 | |
| Perpetual software licenses, hardware and other | 47 | | | 43 | | | 64 | |
| Consulting services | 270 | | | 323 | | | 382 | |
| Total cost of revenue | 714 | | | 731 | | | 817 | |
| Gross profit | 1,081 | | | 1,186 | | | 1,019 | |
| Operating expenses | | | | | |
| Selling, general and administrative expenses | 650 | | | 646 | | | 669 | |
| Research and development expenses | 313 | | | 309 | | | 334 | |
| Total operating expenses | 963 | | | 955 | | | 1,003 | |
| Income from operations | 118 | | | 231 | | | 16 | |
| Other expense, net | | | | | |
| Interest expense | (24) | | | (26) | | | (27) | |
| Interest income | 15 | | | 6 | | | 4 | |
| Other expense | (42) | | | (19) | | | (17) | |
| Total other expense, net | (51) | | | (39) | | | (40) | |
| Income (loss) before income taxes | 67 | | | 192 | | | (24) | |
| Income tax expense (benefit) | 34 | | | 45 | | | (153) | |
| Net income | $ | 33 | | | $ | 147 | | | $ | 129 | |
| Net income per weighted average common share | | | | | |
| Basic | $ | 0.32 | | | $ | 1.35 | | | $ | 1.18 | |
| Diluted | $ | 0.31 | | | $ | 1.30 | | | $ | 1.16 | |
| Weighted average common shares outstanding | | | | | |
| Basic | 103.2 | | | 108.6 | | | 109.3 | |
| Diluted | 105.8 | | | 112.9 | | | 111.6 | |
The accompanying notes are an integral part of the consolidated financial statements.
TERADATA CORPORATION
Consolidated Statements of Comprehensive Income
In millions
| | | | | | | | | | | | | | | | | |
| | For the Years Ended December 31 |
| | 2022 | | 2021 | | 2020 |
| Net income | $ | 33 | | | $ | 147 | | | $ | 129 | |
| Other comprehensive income (loss): | | | | | |
| Foreign currency translation adjustments | (30) | | | (12) | | | 7 | |
| Unrealized loss on cross-currency net investment hedge, before tax | (1) | | | — | | | — | |
| | | | | |
| Total currency translation adjustments | (31) | | | (12) | | | 7 | |
| Derivatives: | | | | | |
| | | | | |
| Unrealized gain (loss) on derivatives, before tax | 25 | | | 14 | | | (8) | |
| Unrealized gain (loss) on derivatives, tax portion | (6) | | | (3) | | | 2 | |
| Unrealized gain (loss) on derivatives, net of tax | 19 | | | 11 | | | (6) | |
| Defined benefit plans: | | | | | |
| Reclassification of loss to net income | 9 | | | 11 | | | 9 | |
| Defined benefit plan adjustment, before tax | 33 | | | (2) | | | (15) | |
| Defined benefit plan adjustment, tax portion | (11) | | | (3) | | | 3 | |
| Defined benefit plan adjustment, net of tax | 31 | | | 6 | | | (3) | |
| Other comprehensive income (loss) | 19 | | | 5 | | | (2) | |
| Comprehensive income | $ | 52 | | | $ | 152 | | | $ | 127 | |
The accompanying notes are an integral part of the consolidated financial statements.
TERADATA CORPORATION
Consolidated Balance Sheets
In millions, except per share amounts
| | | | | | | | | | | |
| | At December 31 |
| | 2022 | | 2021 |
| Assets | | | |
| Current assets | | | |
| Cash and cash equivalents | $ | 569 | | | $ | 592 | |
| Accounts receivable, net | 364 | | | 336 | |
| Inventories | 8 | | | 26 | |
| Other current assets | 87 | | | 152 | |
| Total current assets | 1,028 | | | 1,106 | |
| Property and equipment, net | 244 | | | 288 | |
| Right of use assets - operating lease, net | 13 | | | 26 | |
| Goodwill | 390 | | | 396 | |
| Capitalized contract costs, net | 92 | | | 111 | |
| Deferred income taxes | 213 | | | 202 | |
| Other assets | 42 | | | 40 | |
| Total assets | $ | 2,022 | | | $ | 2,169 | |
| Liabilities and stockholders’ equity | | | |
| Current liabilities | | | |
| Current portion of long-term debt | $ | — | | | $ | 88 | |
| | | |
| Current portion of finance lease liability | 67 | | | 77 | |
| Current portion of operating lease liability | 8 | | | 12 | |
| Accounts payable | 94 | | | 67 | |
| Payroll and benefits liabilities | 137 | | | 148 | |
| Deferred revenue | 589 | | | 552 | |
| Other current liabilities | 112 | | | 89 | |
| Total current liabilities | 1,007 | | | 1,033 | |
| Long-term debt | 498 | | | 324 | |
| Finance lease liability | 54 | | | 53 | |
| Operating lease liability | 10 | | | 18 | |
| Pension and other postemployment plan liabilities | 101 | | | 138 | |
| Long-term deferred revenue | 8 | | | 27 | |
| Deferred tax liabilities | 7 | | | 7 | |
| Other liabilities | 79 | | | 109 | |
| Total liabilities | 1,764 | | | 1,709 | |
| Commitments and contingencies (Note 10) | | | |
| Stockholders’ equity | | | |
Preferred stock: par value $0.01 per share, 100.0 shares authorized, no shares issued and outstanding at December 31, 2022 and 2021, respectively | — | | | — | |
Common stock: par value $0.01 per share, 500.0 shares authorized, 101.1 and 107.2 shares issued and outstanding at December 31, 2022 and 2021, respectively | 1 | | | 1 | |
| Paid-in capital | 1,941 | | | 1,808 | |
| Accumulated deficit | (1,565) | | | (1,211) | |
| Accumulated other comprehensive loss | (119) | | | (138) | |
| Total stockholders’ equity | 258 | | | 460 | |
| Total liabilities and stockholders’ equity | $ | 2,022 | | | $ | 2,169 | |
The accompanying notes are an integral part of the consolidated financial statements.
TERADATA CORPORATION
Consolidated Statements of Cash Flows
In millions | | | | | | | | | | | | | | | | | |
| | For the Years Ended December 31 |
| | 2022 | | 2021 | | 2020 |
| Operating activities | | | | | |
| Net income | $ | 33 | | | $ | 147 | | | $ | 129 | |
| Adjustments to reconcile net income to net cash provided by operating activities: | | | | | |
| Depreciation and amortization | 134 | | | 149 | | | 172 | |
| Stock-based compensation expense | 126 | | | 112 | | | 101 | |
| | | | | |
| Deferred income taxes | (26) | | | 14 | | | (118) | |
| | | | | |
| | | | | |
| Changes in assets and liabilities: | | | | | |
| Receivables | (28) | | | (5) | | | 67 | |
| Inventories | 18 | | | 3 | | | 2 | |
| Account payables and accrued expenses | 35 | | | 17 | | | — | |
| Deferred revenue | 18 | | | 42 | | | 4 | |
| Other assets and liabilities | 109 | | | (16) | | | (90) | |
| Net cash provided by operating activities | 419 | | | 463 | | | 267 | |
| Investing activities | | | | | |
| Expenditures for property and equipment | (14) | | | (28) | | | (44) | |
| Additions to capitalized software | (2) | | | (3) | | | (7) | |
| | | | | |
| | | | | |
| | | | | |
| Other investing activities, net | (2) | | | — | | | — | |
| Net cash used in investing activities | (18) | | | (31) | | | (51) | |
| Financing activities | | | | | |
| Repurchases of common stock | (387) | | | (244) | | | (100) | |
| Proceeds from long-term borrowings | 500 | | | — | | | — | |
| Repayments of long-term borrowings | (413) | | | (44) | | | (25) | |
| | | | | |
| | | | | |
| | | | | |
| | | | | |
| Payments of finance leases | (86) | | | (92) | | | (70) | |
| Other financing activities, net | 5 | | | 24 | | | 9 | |
| Net cash used in financing activities | (381) | | | (356) | | | (186) | |
| Effect of exchange rate changes on cash and cash equivalents | (44) | | | (14) | | | 7 | |
| (Decrease) increase in cash, cash equivalents and restricted cash | (24) | | | 62 | | | 37 | |
| Cash, cash equivalents and restricted cash at beginning of year | 595 | | | 533 | | | 496 | |
| Cash, cash equivalents and restricted cash at end of year | $ | 571 | | | $ | 595 | | | $ | 533 | |
| Reconciliation of cash, cash equivalents and restricted cash to the Consolidated Balance Sheets | | | | | |
| Cash and cash equivalents | $ | 569 | | | $ | 592 | | | $ | 529 | |
| Restricted cash | 2 | | | 3 | | | 4 | |
| Total cash, cash equivalents and restricted cash | $ | 571 | | | $ | 595 | | | $ | 533 | |
| | | | | |
| Supplemental data | | | | | |
| Supplemental cash flow disclosure: | | | | | |
| Assets acquired by finance lease | $ | 78 | | | $ | 76 | | | $ | 85 | |
| Assets acquired by operating lease | $ | 4 | | | $ | 9 | | | $ | 8 | |
| Annual variable incentive payout settled in equity | $ | — | | | $ | 17 | | | $ | — | |
| Cash paid during the year for: | | | | | |
| Income taxes, net | $ | (18) | | | $ | 44 | | | $ | 39 | |
| Interest | $ | 23 | | | $ | 26 | | | $ | 27 | |
The accompanying notes are an integral part of the consolidated financial statements.
TERADATA CORPORATION
Consolidated Statements of Changes in Stockholders’ Equity
In millions
| | | | | | | | | | | | | | | | | | | | | | | | | | | | | | | | | | | |
| | Common Stock | | Paid-in | | Retained Earnings (Accumulated | | Accumulated Other Comprehensive | | |
| | Shares | | Amount | | Capital | | Deficit) | | (Loss) income | | Total |
| December 31, 2019 | 111 | | | $ | 1 | | | $ | 1,545 | | | $ | (1,143) | | | $ | (141) | | | $ | 262 | |
| Net income | — | | | — | | | — | | | 129 | | | — | | | 129 | |
| Employee stock compensation, employee stock purchase programs and option exercises, net of tax | 2 | | | — | | | 111 | | | — | | | — | | | 111 | |
| Repurchases of common stock, retired | (5) | | | — | | | — | | | (100) | | | — | | | (100) | |
| Pension and postemployment benefit plans, net of tax | — | | | — | | | — | | | — | | | (3) | | | (3) | |
| Unrealized loss on derivatives, net of tax | — | | | — | | | — | | | — | | | (6) | | | (6) | |
| Currency translation adjustment | — | | | — | | | — | | | — | | | 7 | | | 7 | |
| December 31, 2020 | 108 | | | $ | 1 | | | $ | 1,656 | | | $ | (1,114) | | | $ | (143) | | | $ | 400 | |
| Net income | — | | | — | | | — | | | 147 | | | — | | | 147 | |
| Employee stock compensation, employee stock purchase programs and option exercises, net of tax | 5 | | | — | | | 152 | | | — | | | — | | | 152 | |
| Repurchases of common stock, retired | (6) | | | — | | | — | | | (244) | | | — | | | (244) | |
| Pension and postemployment benefit plans, net of tax | — | | | — | | | — | | | — | | | 6 | | | 6 | |
| Unrealized gain on derivatives, net of tax | — | | | — | | | — | | | — | | | 11 | | | 11 | |
| Currency translation adjustment | — | | | — | | | — | | | — | | | (12) | | | (12) | |
| December 31, 2021 | 107 | | | $ | 1 | | | $ | 1,808 | | | $ | (1,211) | | | $ | (138) | | | $ | 460 | |
| Net income | — | | | — | | | — | | | 33 | | | — | | | 33 | |
| Employee stock compensation, employee stock purchase programs and option exercises, net of tax | 3 | | | — | | | 133 | | | — | | | — | | | 133 | |
| Repurchases of common stock, retired | (9) | | | — | | | — | | | (387) | | | — | | | (387) | |
| Pension and postemployment benefit plans, net of tax | — | | | — | | | — | | | — | | | 31 | | | 31 | |
| Unrealized gain on derivatives, net of tax | — | | | — | | | — | | | — | | | 19 | | | 19 | |
| Currency translation adjustment | — | | | — | | | — | | | — | | | (31) | | | (31) | |
| December 31, 2022 | 101 | | | $ | 1 | | | $ | 1,941 | | | $ | (1,565) | | | $ | (119) | | | $ | 258 | |
The accompanying notes are an integral part of the consolidated financial statements.
NOTES TO CONSOLIDATED FINANCIAL STATEMENTS
Note 1 Description of Business, Basis of Presentation and Significant Accounting Policies
Description of the Business. Teradata Corporation ("we," "us," "Teradata," or the "Company") is a provider of a leading connected multi-cloud data platform for enterprise analytics, focused on helping companies leverage all their data across an enterprise, at scale. Our platform is composed of our data platform – Teradata Vantage – which is designed to run across on-premises, private cloud and public cloud environments. This platform is supported by business consulting and support services that enable customers to extract insights from across a company’s entire data and analytics ecosystem.
Basis of Presentation. The financial statements are presented on a consolidated basis and include the accounts of the Company and its wholly-owned subsidiaries in accordance with accounting principles generally accepted in the United States of America ("GAAP").
Recurring revenue consists of our on-premises and cloud subscriptions, which have varying term lengths from one month to five years. Recurring revenue is intended to depict the revenue recognition model for these subscription transactions. The recurrence of these revenue streams in future periods depends on several factors, including contractual periods and customers' renewal decisions. Perpetual software licenses, hardware and other revenue consists of hardware and perpetual software licenses recognized upfront and revenue related to third party products. Consulting services revenue consists of consulting, implementation and installation services.
Use of Estimates. The preparation of financial statements in conformity with GAAP requires management to make estimates and judgments that affect the reported amounts of assets and liabilities, the disclosure of contingent assets and liabilities at the date of the financial statements, and revenues and expenses during the period reported. On an ongoing basis, management evaluates these estimates and judgments, including those related to allowances for doubtful accounts, the valuation of inventory to net realizable value, impairments of goodwill and other intangibles, stock-based compensation, leases, pension and other postemployment benefits, and income taxes and any changes will be accounted for on a prospective basis. Actual results could differ from those estimates.
Revenue Recognition
The Company adopted Financial Accounting Standards Board ("FASB") Standards Update No. 2014-09, Revenue from Contracts with Customers ("Topic 606") as of January 1, 2018 for all contracts not completed as of the date of adoption. The core principle of Topic 606 is that an entity should recognize revenue to depict the transfer of promised goods or services to customers in an amount that reflects the consideration to which the Company expects to be entitled in exchange for those goods or services. To achieve that core principle, the Company performs the following five steps:
1.identify the contract with a customer,
2.identify the performance obligations in the contract,
3.determine the transaction price,
4.allocate the transaction price to the performance obligations in the contract, and
5.recognize revenue when (or as) the Company satisfies a performance obligation.
The Company only applies the above five-step model to contracts when it is probable that the Company will collect the consideration it is entitled to in exchange for goods or services it transfers to the customer. The Company applies judgment in determining the customer’s ability and intention to pay, which is based on a variety of factors including the customer’s historical payment experience, published credit, and financial information pertaining to the customer.
Revenue is measured based on consideration specified in a contract with a customer, and excludes any sales, value add, and other taxes the Company collects concurrent with revenue-producing activities. A performance obligation is a promise in a contract to transfer a distinct good or service to the customer. The Company recognizes revenue when it satisfies a performance obligation by transferring control over a good or service to a customer. Estimates of variable consideration are included in revenue to the extent that it is probable that a significant reversal of cumulative revenue will not occur once the uncertainty is resolved. The Company uses the expected value method or the most likely amount method depending on the nature of the variable consideration. Our estimates of variable
consideration and determination of whether to include estimated amounts in the transaction price are based largely on an assessment of our anticipated performance and all information (historical, current and forecasted) that is reasonably available to us. If actual results in the future vary from the Company’s estimates, the Company adjusts these estimates in the period such variances become known. Typically, the amount of variable consideration is not material.
For contracts with multiple performance obligations, the Company allocates the contract’s transaction price to each performance obligation using the relative standalone selling price of each distinct good or service in the contract. The Company must apply judgment to determine whether promised goods or services are capable of being distinct and distinct within the context of the contract. If these criteria are not met, the promised goods or services are combined with other goods or services and accounted for as a combined performance obligation. Revenue is then recognized either at a point in time or over time depending on our evaluation of when the customer obtains control of the promised goods or services. This evaluation requires significant judgment and the decision to combine a group of contracts or separate the combined or single contract into multiple performance obligations could change the amount of revenue recorded in a given period. In addition, the Company has developed assumptions that require judgment to determine the standalone selling price for each performance obligation identified in the contract. The Company determines the standalone selling price for a good or service by considering multiple factors including, geographies, market conditions, product life cycles, competitive landscape, internal costs, gross margin objectives, purchase volumes and pricing practices. The Company reviews the standalone selling price for each of its performance obligations on a periodic basis and updates it, when appropriate, to ensure that the practices employed reflect the Company’s recent pricing experience. The Company maintains internal controls over the establishment and updates of these estimates, which includes review and approval by the Company’s management.
Teradata delivers its platform and services primarily through direct sales channels, as well as through other independent software vendors and distributors and value-added resellers. Standard payment terms may vary based on the country in which the contract is executed, but are generally between 30 days and 90 days. The following is a description of the principal activities and performance obligations from which the Company generates its revenue:
•Subscriptions - The Company sells on-premises and cloud subscriptions to its customers through its subscription licenses, cloud and hardware rental offerings. Teradata’s on-premises subscription licenses include a right-to-use license and revenue is recognized upfront at a point in time unless the customer has a contractual right to cancel, where revenue is recognized period-to-period based on the cancellation terms. Subscription licenses are reported within the subscription software licenses caption on the Consolidated Statements of Income. The subscription software license support and unspecified software license upgrade rights on a when-and-if-available basis that are included in the subscription are reported within the recurring services and other caption and recognized ratably over the contract term. Cloud arrangements include a right-to-access software license on third party hosted hardware such as the public cloud. Revenue is recognized ratably, or as consumed, over the contract term and included within the recurring services and other caption. Cloud arrangements typically include a minimum fixed amount that is recognized ratably over the contract term and may include an elastic amount for usage above the minimum, which is recognized monthly based on actual utilization. For the Company's hardware rental offering, the Company owns the hardware and typically finances the hardware to more closely align the use of cash with the expected cash inflows from contracts with customers. The revenue for these arrangements is generally recognized straight-line over the term of the contract and is included within the recurring services and other caption. Hardware rentals are generally accounted for as operating leases and considered outside the scope of Topic 606.
•Perpetual maintenance and software upgrade rights - Revenue for maintenance and unspecified software upgrade rights on a when-and-if-available basis are recognized straight-line over the term of the contract and included within the recurring services and other caption.
•Perpetual software licenses, hardware and other - Revenue for software is generally recognized when the customer has the ability to use and benefit from its right to use the license. Hardware is typically recognized upon delivery once title and risk of loss have been transferred (when control has passed). Other revenue includes the sale of all third-party related products.
•Consulting services - The Company accounts for individual services as separate performance obligations if a service is separately identifiable from other items in a combined arrangement and if a customer can benefit from it on its own or with other resources that are readily available to the customer. Revenue for consulting, managed services, implementation and installation services is recognized as services are provided by measuring progress toward the complete satisfaction of the Company’s obligation. Progress for services that are contracted for at a fixed price is generally measured based on hours incurred as a portion of total estimated hours. Progress for services that are contracted for on a time and materials basis is generally based on hours expended. These input methods (e.g. hours incurred or expended) of revenue recognition are considered a faithful depiction of our efforts to satisfy services contracts and therefore reflect the transfer of services to a customer under such contracts.
Significant Accounting Policies and Practical Expedients
The following are the Company’s significant accounting policies not already disclosed elsewhere and practical expedients relating to revenue from contracts with customers:
•Taxes assessed by a governmental authority that are both imposed on and concurrent with a specific revenue-producing transaction, that are collected by the Company from a customer, are excluded from revenue.
•Shipping and handling costs associated with outbound freight after control over a product has transferred to a customer are accounted for as fulfillment cost and are included in cost of revenues.
•The Company does not adjust for the effects of a significant financing component if the period between performance and customer payment is one year or less.
•The Company expenses the costs to obtain a contract as incurred when the expected amortization period is one year or less.
Shipping and Handling. Product shipping and handling are included in cost in the Consolidated Statements of Income.
Cash and Cash Equivalents. All short-term, highly-liquid investments having original maturities of three months or less are considered to be cash equivalents.
Allowance for Doubtful Accounts. Teradata establishes provisions for doubtful accounts using expected credit losses methodology and specific provisions for known issues.
Inventories. Inventories are stated at the lower of cost or market. Cost of service parts is determined using the average cost method. Finished goods inventory is determined using actual cost.
Long-Lived Assets
Property and Equipment. Property and equipment, leasehold improvements and rental equipment are stated at cost less accumulated depreciation. Depreciation is computed over the estimated useful lives of the related assets primarily on a straight-line basis. The Company's estimate of depreciation expense incorporates management assumptions regarding the useful economic lives and residual values of its assets. Equipment is generally depreciated over 3 to 5 years and buildings over 25 to 45 years. Leasehold improvements are depreciated over the life of the lease or the asset, whichever is shorter. Customer rental equipment is typically depreciated over the associated customer rental period, which is typically 3 years. Total depreciation expense on the Company’s property and equipment for December 31 was as follows: | | | | | | | | | | | | | | | | | |
| In millions | 2022 | | 2021 | | 2020 |
| Depreciation expense | $ | 127 | | | $ | 139 | | | $ | 138 | |
Capitalized Software. Direct development costs associated with internal-use software are capitalized and amortized over the estimated useful lives of the resulting software. The costs are capitalized when both the preliminary project stage is completed and it is probable that computer software being developed will be completed and placed in
service. Teradata typically amortizes capitalized internal-use software on a straight-line basis over three years beginning when the asset is substantially ready for use.
Costs incurred for the development of analytic database software that will be sold, leased or otherwise marketed are expensed as incurred based on the frequency and agile nature of development. The Company uses agile development methodologies to help respond to new technologies and trends and rapidly changing customer needs. Agile development methodologies are characterized by a more dynamic development process with more frequent and iterative revisions to a product release features and functions as the software is being developed. Due to the shorter development cycle and focus on rapid production associated with agile development, the Company did not capitalize any amounts for external-use software development costs in 2022, 2021 and 2020 due to the relatively short duration between the completion of the working model and the point at which a product is ready for general release.
The following table identifies the activity relating to capitalized software for the following periods: | | | | | | | | | | | | | | | | | | | | | | | | | | | | | | | | | | | |
| | Internal-use Software | | External-use Software |
| In millions | 2022 | | 2021 | | 2020 | | 2022 | | 2021 | | 2020 |
| Beginning balance at January 1 | $ | 10 | | | $ | 13 | | | $ | 13 | | | $ | — | | | $ | — | | | $ | 23 | |
| Capitalized | 3 | | | 3 | | | 7 | | | — | | | — | | | — | |
| Amortization | (5) | | | (6) | | | (7) | | | — | | | — | | | (23) | |
| Ending balance at December 31 | $ | 8 | | | $ | 10 | | | $ | 13 | | | $ | — | | | $ | — | | | $ | — | |
The aggregate amortization expense (actual and estimated) for internal-use software for the following periods is: | | | | | | | | | | | | | | | | | | | | | | | | | | | | | | | | | | | |
| | Actual | | For the years ended (estimated) |
| In millions | 2022 | | 2023 | | 2024 | | 2025 | | 2026 | | 2027 |
| Internal-use software amortization expense | $ | 5 | | | $ | 5 | | | $ | 4 | | | $ | 3 | | | $ | 3 | | | $ | 3 | |
| | | | | | | | | | | |
Valuation of Long-Lived Assets. Long-lived assets such as property and equipment, acquired intangible assets and internal capitalized software are reviewed for impairment when events or changes in circumstances indicate that the carrying amount of the assets may not be recoverable. An impairment is calculated based on the present value of future cash flows and an impairment loss would be recognized when estimated future undiscounted cash flows expected to result from the use of the asset and its eventual disposition are less than the carrying amount. No impairment was recognized during 2022, 2021 and 2020.
Goodwill. Goodwill represents the excess of the purchase price in a business combination over the fair value of net tangible and intangible assets acquired. Goodwill amounts are not amortized, but rather are tested for impairment annually or upon occurrence of an event or change in circumstances that would more likely than not reduce the fair value of a reporting unit below its carrying amount. See Note 5 for additional information.
Research and Development Costs. Research and development costs are expensed as incurred. Research and development costs primarily include labor-related costs, contractor fees, and overhead expenses directly related to research and development support.
Leases. In February 2016, the FASB issued guidance, ASU No. 2016-02, "Leases (Topic 842)", which requires a lessee to account for leases as finance or operating leases. Both types of leases will result in the lessee recognizing a right-of-use asset and a corresponding lease liability on its balance sheet, with differing methodology for income statement and cash flow recognition. For lessors, the standard modifies the classification criteria and the accounting for sales-type and direct financing leases. Entities will classify leases to determine how to recognize lease-related revenue and expense. The Company adopted the new standard as of January 1, 2019 using the modified retrospective adoption approach utilizing the optional transition method with prior periods not recast and have elected certain of the practical expedients allowed under the standard. See Note 13 for more information.
Pension and Postemployment Benefits. The Company accounts for its pension benefit and its non-U.S. postemployment benefit obligations using actuarial models. The measurement of plan obligations was made as of December 31, 2022. Liabilities are computed using the projected unit credit method. The objective under this method is to expense each participant’s benefits under the plan as they accrue, taking into consideration salary
increases and the plan’s benefit allocation formula. Thus, the total pension or postemployment benefit to which each participant is expected to become entitled is broken down into units, each associated with a year of past or future credited service.
The Company recognizes the funded status of its pension and non-U.S. postemployment plan obligations in its consolidated balance sheet and records, in other comprehensive income, certain gains and losses that arise during the period, but are deferred under pension and postemployment accounting rules. See Note 8 for additional information.
Foreign Currency. Assets and liabilities of non-U.S. subsidiaries that operate in a local currency environment are translated into U.S. dollars at period-end exchange rates. Income and expense accounts are translated at daily exchange rates prevailing during the period. Adjustments arising from the translation are included in accumulated other comprehensive income, a separate component of stockholders’ equity. Gains and losses resulting from foreign currency transactions are included in determining net income.
Income Taxes. Income tax expense is provided based on income before income taxes in the various jurisdictions in which the Company conducts its business. Deferred income taxes reflect the impact of temporary differences between assets and liabilities recognized for financial reporting purposes and such amounts recognized for tax purposes. These deferred taxes are determined based on the enacted tax rates expected to apply in the periods in which the deferred assets or liabilities are expected to be settled or realized. The Company made an accounting policy election in 2018 related to the 2017 Tax Act to provide for the tax expense related to global intangible low-taxed income ("GILTI") in the year the tax is incurred. Teradata recognizes tax benefits from uncertain tax positions only if it is more likely than not the tax position will be sustained on examination by taxing authorities, based on the technical merits of the position. The Company records valuation allowances related to its deferred income tax assets when it is more likely than not that some portion or all the deferred income tax assets will not be realized. See Note 6 for additional information.
Stock-based Compensation. Stock-based payments to employees, including restricted shares and restricted share units, are recognized in the financial statements based on their fair value. See Note 7 for additional information.
Earnings Per Share. Basic earnings per share is calculated by dividing net income by the weighted-average number of shares outstanding during the reported period. The calculation of diluted earnings per share is similar to basic earnings per share, except that the weighted-average number of shares outstanding includes the dilution from potential shares added from stock options, restricted share awards and other stock awards. Refer to Note 7 for share information on the Company’s stock compensation plans.
The components of basic and diluted earnings per share for the years ended December 31 are as follows: | | | | | | | | | | | | | | | | | |
| |
| In millions, except earnings per share | 2022 | | 2021 | | 2020 |
| Net income attributable to common stockholders | $ | 33 | | | $ | 147 | | | $ | 129 | |
| Weighted average outstanding shares of common stock | 103.2 | | | 108.6 | | | 109.3 | |
| Dilutive effect of employee stock options, restricted shares and other stock awards | 2.6 | | | 4.3 | | | 2.3 | |
| Common stock and common stock equivalents | 105.8 | | | 112.9 | | | 111.6 | |
| Earnings per share: | | | | | |
| Basic | $ | 0.32 | | | $ | 1.35 | | | $ | 1.18 | |
| Diluted | $ | 0.31 | | | $ | 1.30 | | | $ | 1.16 | |
Options to purchase 0.3 million shares in 2022 , 0.2 million shares in 2021 and 2.0 million shares in 2020 of common stock, were not included in the computation of diluted earnings per share because their exercise prices were greater than the average market price of the common shares and, therefore, the effect would have been anti-dilutive.
Recently Issued Accounting Pronouncements
The Company has assessed the Accounting Standards Updates and determined that they were not applicable or were not expected to have a material impact on the Company's financial statements.
Note 2 Supplemental Financial Information
| | | | | | | | | | | |
| | At December 31 |
| In millions | 2022 | | 2021 |
| Accounts receivable | | | |
| Trade | $ | 360 | | | $ | 344 | |
| Other | 16 | | | 1 | |
| Accounts receivable, gross | 376 | | | 345 | |
| Less: allowance for doubtful accounts | (12) | | | (9) | |
| Total accounts receivable, net | $ | 364 | | | $ | 336 | |
| Inventories | | | |
| Finished goods | $ | 5 | | | $ | 17 | |
| Service parts | 3 | | | 9 | |
| Total inventories | $ | 8 | | | $ | 26 | |
| Other current assets | | | |
| Income tax receivable | $ | 13 | | | $ | 85 | |
| Pre-paid expenses and Other | 74 | | | 67 | |
| Total other current assets | $ | 87 | | | $ | 152 | |
| Property and equipment | | | |
| Land | $ | 8 | | | $ | 8 | |
| Buildings and improvements | 86 | | | 90 | |
| Finance lease assets | 257 | | | 329 | |
| Machinery and other equipment | 553 | | | 463 | |
| Property and equipment, gross | 904 | | | 890 | |
| Less: accumulated depreciation | (660) | | | (602) | |
| Total property and equipment, net | $ | 244 | | | $ | 288 | |
| Other current liabilities | | | |
| Sales and value-added taxes | $ | 26 | | | $ | 31 | |
| Pension and other postemployment plan liabilities | 13 | | | 14 | |
| Other | 73 | | | 44 | |
| Total other current liabilities | $ | 112 | | | $ | 89 | |
| Deferred revenue | | | |
| Deferred revenue, current | $ | 589 | | | $ | 552 | |
| Long-term deferred revenue | 8 | | | 27 | |
| Total deferred revenue | $ | 597 | | | $ | 579 | |
| Other long-term liabilities | | | |
| Transition tax | $ | 52 | | | $ | 69 | |
| Uncertain tax positions | 22 | | | 22 | |
| Other | 5 | | | 18 | |
| Total other long-term liabilities | $ | 79 | | | $ | 109 | |
| | | |
| | | | | | | | | | | | | | | | | |
| Twelve Months Ended December 31, |
| In millions | 2022 | | 2021 | | 2020 |
| Other expense | | | | | |
| Foreign currency losses | $ | 30 | | | $ | 8 | | | $ | 5 | |
| Other | 12 | | | 11 | | | 12 | |
| Total Other expense | $ | 42 | | | $ | 19 | | | $ | 17 | |
Note 3 Revenue from Contracts with Customers
Disaggregation of Revenue from Contracts with Customers
The following table presents a disaggregation of revenue for the years ended December 31: | | | | | | | | | | | | | | | | | |
| In millions | 2022 | | 2021 | | 2020 |
| Americas | | | | | |
| Recurring | $ | 889 | | | $ | 879 | | | $ | 813 | |
| Perpetual software licenses, hardware and other | 23 | | | 24 | | | 47 | |
| Consulting services | 126 | | | 141 | | | 165 | |
| Total Americas | 1,038 | | | 1,044 | | | 1,025 | |
| EMEA | | | | | |
| Recurring | 330 | | | 371 | | | 312 | |
| Perpetual software licenses, hardware and other | 33 | | | 37 | | | 39 | |
| Consulting services | 102 | | | 135 | | | 134 | |
| Total EMEA | 465 | | | 543 | | | 485 | |
| APJ | | | | | |
| Recurring | 200 | | | 214 | | | 184 | |
| Perpetual software licenses, hardware and other | 9 | | | 16 | | | 21 | |
| Consulting services | 83 | | | 100 | | | 121 | |
| Total APJ | 292 | | | 330 | | | 326 | |
| Total Revenue | $ | 1,795 | | | $ | 1,917 | | | $ | 1,836 | |
Contract Balances
The timing of revenue recognition, billings and cash collections results in billed accounts receivable, contract assets, and customer advances and deposits (deferred revenue or contract liabilities) on the consolidated balance sheet. Accounts receivable include amounts due from customers that are unconditional. Contract assets relate to the Company’s rights to consideration for goods delivered or services completed and recognized as revenue but billing and the right to receive payment is conditional upon the completion of other performance obligations. Contract assets are included in other current assets on the balance sheet and are transferred to accounts receivable when the rights become unconditional. Deferred revenue consists of advance payments and billings in excess of revenue recognized. Deferred revenue is classified as either current or noncurrent based on the timing of when the Company expects to recognize revenue. These assets and liabilities are reported on a contract-by-contract basis at the end of each reporting period. The following table provides information about receivables, contract assets and deferred revenue from contracts with customers: | | | | | | | | | | | |
| In millions | December 31, 2022 | | December 31, 2021 |
| Accounts receivable, net | $ | 364 | | | $ | 336 | |
| Contract assets | $ | 7 | | | $ | 10 | |
| Current deferred revenue | $ | 589 | | | $ | 552 | |
| Long-term deferred revenue | $ | 8 | | | $ | 27 | |
Revenue recognized during the year ended December 31, 2022 from amounts included in deferred revenue at the beginning of the period was approximately $491 million.
Transaction Price Allocated to Unsatisfied Obligations
The following table includes estimated revenue expected to be recognized in the future related to the Company's unsatisfied (or partially satisfied) obligations at December 31, 2022: | | | | | | | | | | | | | | | | | | | | |
| In millions | | Total at December 31, 2022 | | Year 1 | | Year 2 and Thereafter |
| | | | | | |
| | | | | | |
| | | | | | |
| Remaining unsatisfied obligations | | $ | 2,400 | | | $ | 1,598 | | | $ | 802 | |
The amounts above represent the price of firm orders for which work has not been performed or goods have not been delivered and exclude unexercised contract options outside the stated contractual term that do not represent material rights to the customer. Although the Company believes that the contract value in the above table is firm, approximately $1,370 million of the amount includes customer-only general cancellation for convenience terms that the Company is contractually obligated to perform unless the customer notifies the Company otherwise. The Company expects to recognize revenue of approximately $617 million in the next year from contracts that are non-cancelable. The Company believes the inclusion of this information is important to understanding the obligations that the Company is contractually required to perform and provides useful information regarding remaining obligations related to these executed contracts.
Note 4 Contract Costs
The Company capitalizes sales commissions and other contract costs that are incremental direct costs of obtaining customer contracts if the expected amortization period of the asset is greater than one year. These costs are recorded in Capitalized contract costs on the Company’s balance sheet. The capitalized amounts are calculated based on the sales commissions for individual multi-term contracts. The judgments made in determining the amount of costs incurred include whether the commissions are in fact incremental and would not have occurred absent the customer contract. Costs to obtain a contract are amortized as selling, general and administrative expenses on a straight-line basis over the expected period of benefit, which is typically four years. These costs are periodically reviewed for impairment. The following table identifies the activity relating to capitalized contract costs: | | | | | | | | | | | | | | | | | | | | | | | | | | |
| In millions | | December 31, 2021 | | Capitalized | | Amortization | | December 31, 2022 |
| Capitalized contract costs | | $ | 111 | | | $ | 37 | | | $ | (56) | | | $ | 92 | |
| In millions | | December 31, 2020 | | Capitalized | | Amortization | | December 31, 2021 |
| Capitalized contract costs | | $ | 98 | | | $ | 58 | | | $ | (45) | | | $ | 111 | |
Note 5 Goodwill
The following table identifies the activity relating to goodwill by operating segment: | | | | | | | | | | | | | | | | | |
| In millions | Balance December 31,
2021 | | Currency
Translation
Adjustments | | Balance December 31,
2022 |
| Goodwill | | | | | |
| Americas | $ | 253 | | | $ | (1) | | | $ | 252 | |
| EMEA | 90 | | | (3) | | | 87 | |
| APJ | 53 | | | (2) | | | 51 | |
| Total goodwill | $ | 396 | | | $ | (6) | | | $ | 390 | |
In the fourth quarter of 2022, the Company performed its annual impairment test and determined that no impairment to the carrying value of goodwill was necessary. The Company reviewed its three reporting units in its 2022 goodwill impairment assessment, as each of the geographic operating segments were considered separate reporting units for purposes of testing. Based on the Company's evaluation and weighting of the events and circumstances that have occurred since the most recent quantitative test, the Company concluded that it was not more likely than not that each reporting unit's fair value was below its carrying value. Therefore, the Company determined that it was not necessary to perform a quantitative goodwill impairment test for the reporting units in 2022.
Note 6 Income Taxes
For the years ended December 31, income (loss) before income taxes consisted of the following: | | | | | | | | | | | | | | | | | |
| In millions | 2022 | | 2021 | | 2020 |
| Income (loss) before income taxes | | | | | |
| United States | $ | 17 | | | $ | 67 | | | $ | (41) | |
| Foreign | 50 | | | 125 | | | 17 | |
| Total income (loss) before income taxes | $ | 67 | | | $ | 192 | | | $ | (24) | |
For the years ended December 31, income tax expense (benefit) consisted of the following: | | | | | | | | | | | | | | | | | |
| In millions | 2022 | | 2021 | | 2020 |
| Income tax expense (benefit) | | | | | |
| Current | | | | | |
| Federal | $ | 29 | | | $ | (1) | | | $ | (45) | |
| State and local | 6 | | | 5 | | | 1 | |
| Foreign | 25 | | | 27 | | | 9 | |
| Deferred | | | | | |
| Federal | (21) | | | 3 | | | 34 | |
| State and local | (3) | | | 1 | | | 6 | |
| Foreign | (2) | | | 10 | | | (158) | |
| Total income tax expense (benefit) | $ | 34 | | | $ | 45 | | | $ | (153) | |
| Effective income tax rate | 50.7 | % | | 23.4 | % | | 637.5 | % |
The following table presents the principal components of the difference between the effective tax rate and the United States federal statutory income tax rate for the years ended December 31: | | | | | | | | | | | | | | | | | |
| 2022 | | 2021 | | 2020 |
| Income tax expense at the U.S. federal tax rate | 21.0 | % | | 21.0 | % | | 21.0 | % |
| Foreign income tax differential | 13.0 | % | | 2.8 | % | | (20.8) | % |
| U.S. tax on foreign earnings | 2.8 | % | | 0.3 | % | | (16.7) | % |
| State and local income taxes | (4.2) | % | | (1.3) | % | | 25.0 | % |
| U.S. permanent book/tax differences | 4.8 | % | | (2.3) | % | | (4.2) | % |
| U.S. research and development tax credits | (10.4) | % | | (2.6) | % | | 25.0 | % |
| Change in valuation allowance | 18.7 | % | | 3.2 | % | | (25.0) | % |
| Tax impact of NOL carry-back under the CARES act. | — | % | | — | % | | 79.2 | % |
| | | | | |
| | | | | |
| Tax impact of stock compensation | 3.6 | % | | 0.8 | % | | (66.7) | % |
| Deferred tax impact from intra-entity IP transfer | — | % | | — | % | | 654.2 | % |
| | | | | |
| | | | | |
| Tax Impact of uncertain tax positions | 1.5 | % | | 2.0 | % | | (29.2) | % |
| Other, net | (0.1) | % | | (0.5) | % | | (4.3) | % |
| Effective income tax rate | 50.7 | % | | 23.4 | % | | 637.5 | % |
The 2022 effective tax rate included a net $1 million of discrete tax benefit, of which $2 million of tax benefit related to the reversal of a capital FIN 48 tax reserve due to the expiration of statute of limitations and $4 million incremental tax benefit related to stock-based compensation. These tax benefits were partially offset by $5 million of discrete tax expenses related to valuation allowances recorded against deferred tax assets and current receivables in Russia that are not expected to be realized as a result of the discontinuation of the Company's business in Russia.
The 2021 effective tax rate included a net $8 million of discrete tax benefit, of which $3 million of tax benefit was related to true-up adjustments to reconcile the Company’s 2020 U.S. tax return versus the preliminary estimate as booked in its tax provision for the year ended December 31, 2020 and $2 million of tax benefit related to a reduction in the Transition Tax based on the Company’s amended 2017 tax return. In addition, the Company recognized $4 million of incremental tax benefit related to stock-based compensation. These tax benefits were partially offset
by $1 million of discrete tax expense related to adjustments to the Company’s accrual for unrecognized tax benefits in accordance with FIN 48.
The 2020 effective tax rate included $157 million of net discrete tax benefit. A discrete tax benefit of $157 million related to the transfer of foreign intellectual property was recorded in 2020 as more fully described below. In addition, the Company recognized a net $13 million of tax benefit resulting from the CARES Act of 2020, which allows U.S. corporations a one-time opportunity to claim income tax refunds by allowing a 5-year net operating loss ("NOL") carry-back for taxable losses incurred in the tax year 2020. Teradata carried back its 2020 NOL to claim a refund for taxes it paid in 2015, which created a one-time income tax benefit for the difference between the 35% 2015 carry back tax rate and the current 21% federal statutory rate. These tax benefits were partially offset by $9 million tax expense related to stock-based compensation and $4 million of incremental GILTI tax. These discrete net tax benefits resulted in full-year total income tax benefit in 2020 of $153 million, on a pre-tax net loss of $24 million, causing a tax rate of 637.5%.
On January 1, 2020, we transferred certain of our intellectual property among our wholly-owned subsidiaries, which resulted in the recognition of deferred tax assets of $157 million. The recognition of deferred tax assets from intra-entity transfers of intellectual property required the Company to make significant estimates and assumptions to determine the fair value of such intellectual property, using a discounted cash flow model. Significant assumptions in valuing the intellectual property include, but are not limited to, internal revenue and expense forecasts, and the discount rate. The sustainability of its future tax benefits is dependent upon the acceptance of these valuation estimates and assumptions by the taxing authorities.
Deferred income tax assets and liabilities included in the balance sheets at December 31 were as follows: | | | | | | | | | | | |
| In millions | 2022 | | 2021 |
| Deferred income tax assets | | | |
| Employee pensions and other liabilities | $ | 47 | | | $ | 65 | |
| Other balance sheet reserves and allowances | 19 | | | 8 | |
| Operating lease liabilities | 5 | | | 7 | |
| Tax loss and credit carryforwards | 99 | | | 86 | |
| Deferred revenue | 6 | | | 6 | |
| Intangibles and capitalized software | 172 | | | 159 | |
| Total deferred income tax assets | 348 | | | 331 | |
| Valuation allowance | (69) | | | (58) | |
| Net deferred income tax assets | 279 | | | 273 | |
| Deferred income tax liabilities | | | |
| | | |
| Right of use assets - operating lease | 3 | | | 6 | |
| Property and equipment | 35 | | | 41 | |
| | | |
| Other | 35 | | | 31 | |
| Total deferred income tax liabilities | 73 | | | 78 | |
| Total net deferred income tax assets | $ | 206 | | | $ | 195 | |
As of December 31, 2022, Teradata has NOL and tax credit carryforwards totaling $99 million (tax effected and before any valuation allowance offset and application of recognition criteria for uncertain tax positions). Of the total tax carryforwards, $14 million are NOLs in the United States and certain foreign jurisdictions, a small portion of which will begin to expire in 2023; $8 million are United States foreign tax credit carryforwards which expire in 2029, which have an $8 million valuation allowance offset; and $77 million are California R&D tax credits that have an indefinite carryforward period, which have a $57 million valuation allowance offset and $20 million of FIN 48 reserve recorded.
The Company considers a majority of its foreign earnings to not be indefinitely reinvested outside of the United States, and any distributions of profits from non-U.S. subsidiaries are not expected to cause a significant United States tax impact in the future. However, these distributions may be subject to non-U.S. withholding taxes if profits are distributed from certain jurisdictions. The Company has recorded $5 million of deferred foreign withholding tax
expense with respect to certain earnings which are not considered permanently reinvested as they would be taxable upon remittance. Deferred taxes have not been provided on earnings considered indefinitely reinvested.
The Company may recognize the tax benefit from an uncertain tax position only if it is more likely than not that the tax position will be sustained on examination by the taxing authorities, based on the technical merits of the position. The Company reflects any interest and penalties recorded in connection with its uncertain tax positions as a component of income tax expense.
As of December 31, 2022, the Company’s uncertain tax positions totaled approximately $41 million, of which $22 million is reflected in the other liabilities section of the Company’s balance sheet as a non-current liability and $19 million of uncertain tax positions relates to certain tax attributes generated by the Company, which are netted against the underlying deferred tax assets recorded on the balance sheet. The entire balance of $41 million in uncertain tax positions would cause a decrease in the effective income tax rate upon recognition. Teradata has recorded $3 million of interest accruals related to its uncertain tax liabilities as of December 31, 2022.
Below is a roll-forward of the Company’s liability related to uncertain tax positions at December 31: | | | | | | | | | | | |
| In millions | 2022 | | 2021 |
| Balance at January 1 | $ | 43 | | | $ | 39 | |
| | | |
| Gross increases for prior period tax positions | 1 | | | 5 | |
| Gross increases for current period tax positions | 3 | | | 3 | |
| Decreases due to the lapse of applicable statute of limitations | (3) | | | (4) | |
| Decreases relating to settlements with taxing authorities | (3) | | | — | |
| Balance at December 31 | $ | 41 | | | $ | 43 | |
The Company and its subsidiaries file income tax returns in the United States and various state jurisdictions, as well as numerous foreign jurisdictions. As of December 31, 2022, the Company has ongoing tax audits related to its 2020 U.S. Federal income tax return, as well as in a limited number of state and foreign jurisdictions. However, no material adjustments have been proposed or made in any of these examinations to date, which would result in any incremental income tax expense in future periods to the Company. The Company's tax returns for years 2019-2022 are still open for assessment by tax authorities in its major jurisdictions.
Note 7 Employee Stock-based Compensation Plans
The Company recorded stock-based compensation expense for the years ended December 31 as follows: | | | | | | | | | | | | | | | | | |
| In millions | 2022 | | 2021 | | 2020 |
| Stock options | $ | — | | | $ | — | | | $ | 1 | |
| Restricted share units | 122 | | | 109 | | | 98 | |
| Employee stock purchase program | 4 | | | 3 | | | 2 | |
| Total stock-based compensation before income taxes | 126 | | | 112 | | | 101 | |
| Tax benefit | (23) | | | (19) | | | (5) | |
| Total stock-based compensation, net of tax | $ | 103 | | | $ | 93 | | | $ | 96 | |
The Teradata Corporation 2007 Stock Incentive Plan (the "2007 SIP"), as amended, and the Teradata 2012 Stock Incentive Plan (the "2012 SIP"), as amended, provide for the grant of several different forms of stock-based compensation. The 2012 SIP was adopted and approved by stockholders in April 2012 and no further awards may be made under the 2007 SIP after that time. A total of approximately 33.9 million shares were authorized to be issued under the 2012 SIP. In May 2020, the Teradata Board of Directors adopted the Teradata New Employee Stock Inducement Plan (the "NESIP"), effective June 1, 2020. Pursuant to the NESIP, the Company may grant equity incentive compensation as a material inducement for certain individuals to commence employment with Teradata within the meaning of Rule 303A.08 of the NYSE Listed Company Manual. A total of 2.2 million shares are reserved for grant under the NESIP, the Teradata Incentive Stock Purchase Plan, and new CEO award, subject to adjustment as provided in the NESIP. The NESIP is scheduled to terminate on June 1, 2023, or such earlier date that the Board shall determine.
New shares of the Company’s common stock are issued as a result of the vesting of restricted share units and stock option exercises and at the time of grant for restricted shares, for awards under all plans.
As of December 31, 2022, the Company’s primary types of stock-based compensation were restricted shares, restricted share units and the employee stock purchase program (the "ESPP").
Stock Options
No options were granted in 2022, 2021 and 2020.
The following table summarizes the Company's stock option activity for the year ended December 31, 2022:
| | | | | | | | | | | | | | | | | | | | | | | |
| Shares in thousands | Shares Under Option | | Weighted-Average Exercise Price per Share | | Average Remaining Contractual Term (in years) | | Aggregate Intrinsic Value (in millions) |
| Outstanding at January 1, 2022 | 781 | | | $ | 41.12 | | | 2.7 | | $ | 5 | |
| | | | | | | |
| Exercised | (87) | | | $ | 31.62 | | | | | |
| Canceled | (173) | | | $ | 58.47 | | | | | |
| | | | | | | |
| Outstanding at December 31, 2022 | 521 | | | $ | 36.93 | | | | | |
| Fully vested and expected to vest at December 31, 2022 | 521 | | | $ | 36.93 | | | 2.2 | | $ | 1 | |
| Exercisable at December 31, 2022 | 521 | | | $ | 36.93 | | | 2.2 | | $ | 1 | |
The following table summarizes the total intrinsic value of options exercised and the cash received by the Company from option exercises under all share-based payment arrangements at December 31:
| | | | | | | | | | | | | | | | | |
| In millions | 2022 | | 2021 | | 2020 |
Intrinsic value of options exercised | $ | 1 | | | $ | 12 | | | $ | — | |
Cash received from option exercises | $ | 3 | | | $ | 31 | | | $ | — | |
| Tax benefit realized from option exercises | $ | — | | | $ | 2 | | | $ | — | |
Restricted Shares and Restricted Share Units
The 2012 SIP provides for the issuance of restricted shares, as well as restricted share units. These grants consist of both service-based and performance-based awards. Service-based awards typically vest over a three-year period beginning on the effective date of grant. These grants are not subject to future performance measures. The cost of these awards, determined to be the fair market value at the date of grant, is expensed ratably over the vesting period. Performance-based grants are subject to future performance measurements over a one-to three-year period. All performance-based shares that are earned in respect of an award will become vested at the end of the performance and/or service period provided the employee is continuously employed by the Company and applicable performance measures and other vesting conditions are met. The fair value of each performance-based award is determined on the grant date, based on the Company’s stock price, and assumes that performance targets will be achieved. Over the performance period, the number of shares of stock that will be issued is adjusted upward or downward based upon management’s assessment of the probability of achievement of performance targets. The ultimate number of shares issued and the related compensation cost recognized as expense will be based on a comparison of the final achievement of performance metrics to the specified targets. For substantially all restricted share grants, at the date of grant, the recipient has all rights of a stockholder, subject to certain restrictions on transferability and a risk of forfeiture. A recipient of restricted share units does not have the rights of a stockholder and is subject to restrictions on transferability and risk of forfeiture. For both restricted share grants and restricted share units, any potential dividend rights would be subject to the same vesting requirements as the underlying equity award. As a result, such rights are considered a contingent transfer of value and consequently these equity awards are not considered participating securities.
The following table reports restricted shares and restricted share unit activity during the year ended December 31, 2022: | | | | | | | | | | | |
| Shares in thousands | Number of
Shares | | Weighted-
Average
Grant
Date Fair
Value
per Share |
| Unvested shares at January 1, 2022 | 7,371 | | | $ | 33.38 | |
| Granted | 3,442 | | | $ | 47.44 | |
| Vested | (3,108) | | | $ | 34.06 | |
| Forfeited/canceled | (709) | | | $ | 39.30 | |
| Unvested shares at December 31, 2022 | 6,996 | | | $ | 39.40 | |
The following table summarizes the weighted-average fair value of restricted share units granted for Teradata equity awards and the total fair value of shares vested. | | | | | | | | | | | | | | | | | |
| 2022 | | 2021 | | 2020 |
Weighted-average fair value of restricted share units granted | $ | 47.44 | | | $ | 41.18 | | | $ | 20.74 | |
Total fair value of shares vested (in millions) | $ | 106 | | | $ | 93 | | | $ | 80 | |
As of December 31, 2022, there was $163 million of unrecognized compensation cost related to unvested restricted share grants. The unrecognized compensation cost is expected to be recognized over a remaining weighted-average period of 0.9 years.
The following table represents the composition of Teradata restricted share unit grants in 2022 | | | | | | | | | | | |
| Shares in thousands | Number of
Shares | | Weighted-
Average
Grant
Date Fair
Value |
| Service-based restricted share units | 2,900 | | | $ | 47.10 | |
| Performance-based restricted share units | 542 | | | $ | 49.27 | |
| Total restricted share unit grants | 3,442 | | | $ | 47.44 | |
Employee Stock Purchase Program
The Company’s ESPP, effective on October 1, 2007, and as amended effective as of January 30, 2018, provides eligible employees of Teradata and its designated subsidiaries an opportunity to purchase the Company’s common stock at a discount to the average of the highest and lowest sale prices on the last trading day of each month. The ESPP discount is 15% of the average market price and is considered compensatory.
The ESPP was amended as of August 2, 2021 to move from monthly purchases to purchases at the end of the 6-month purchase period. Additionally, a look-back feature was added to the plan whereby the purchase discount is based off the lower of the market prices at the beginning or end of each 6-month purchase period (September to February, and March to August). The ESPP discount remains at 15% of the relevant market price and is considered compensatory.
Employees may authorize payroll deductions of up to 10% of eligible compensation for common stock purchases. A total of 7 million shares were authorized to be issued under the ESPP, with approximately 0.7 million shares remaining under that authorization at December 31, 2022. The shares of Teradata common stock purchased by a participant on an exercise date (the last day of each month), for all purposes, are deemed to have been issued and sold at the close of business on such exercise date. Prior to that time, none of the rights or privileges of a stockholder exists with respect to such shares.
Employee purchases and aggregate cost were as follows at December 31: | | | | | | | | | | | | | | | | | |
| In millions | 2022 | | 2021 | | 2020 |
| Employee stock purchases | 0.4 | | | 0.3 | | | 0.7 | |
| Aggregate cost | $ | 12 | | | $ | 10 | | | $ | 14 | |
Note 8 Employee Benefit Plans
Pension and Postemployment Plans. Teradata currently sponsors defined benefit pension plans for certain of its international employees. For those international pension plans for which the Company holds asset balances, those assets are primarily invested in common/collective trust funds (which include publicly traded common stocks, corporate and government debt securities, real estate indirect investments, cash or cash equivalents) and insurance contracts.
Postemployment obligations relate to benefits provided to involuntarily terminated employees and certain inactive employees after employment but before retirement. These benefits are paid in accordance with various foreign statutory laws and regulations, and Teradata’s established postemployment benefit practices and policies. Postemployment benefits may include disability benefits, supplemental unemployment benefits, severance, workers’ compensation benefits, continuation of health care benefits and life insurance coverage, and are funded on a pay-as-you-go basis.
Pension and postemployment benefit costs for the years ended December 31 were as follows: | | | | | | | | | | | | | | | | | | | | | | | | | | | | | | | | | | | |
| | 2022 | | 2021 | | 2020 |
| In millions | Pension | | Postemployment | | Pension | | Postemployment | | Pension | | Postemployment |
| Service cost | $ | 6 | | | $ | 13 | | | $ | 7 | | | $ | 11 | | | $ | 7 | | | $ | 11 | |
| Interest cost | 2 | | | 1 | | | 1 | | | 1 | | | 2 | | | 1 | |
| Expected return on plan assets | (2) | | | — | | | (2) | | | — | | | (2) | | | — | |
| Settlement charge | — | | | — | | | — | | | — | | | 1 | | | — | |
| Curtailment gain | — | | | — | | | (2) | | | — | | | — | | | — | |
| Amortization of actuarial loss | 1 | | | 8 | | | 3 | | | 8 | | | 2 | | | 7 | |
| | | | | | | | | | | |
| | | | | | | | | | | |
| Total costs | $ | 7 | | | $ | 22 | | | $ | 7 | | | $ | 20 | | | $ | 10 | | | $ | 19 | |
The underfunded amount of pension and postemployment obligations is recorded as a liability in the Company’s consolidated balance sheet. The following tables present the changes in benefit obligations, plan assets, funded status and the reconciliation of the funded status to amounts recognized in the consolidated balance sheets and in accumulated other comprehensive income at December 31: | | | | | | | | | | | | | | | | | | | | | | | |
| | Pension | | Postemployment |
| In millions | 2022 | | 2021 | | 2022 | | 2021 |
| Change in benefit obligation | | | | | | | |
| Benefit obligation at January 1 | $ | 143 | | | $ | 164 | | | $ | 68 | | | $ | 64 | |
| Service cost | 6 | | | 7 | | | 13 | | | 11 | |
| Interest cost | 2 | | | 1 | | | 1 | | | 1 | |
| Plan participant contributions | 1 | | | 1 | | | — | | | — | |
| Actuarial (gain) loss | (28) | | | (7) | | | (12) | | | 10 | |
| Benefits paid | (2) | | | — | | | (15) | | | (18) | |
| Curtailment | — | | | (2) | | | — | | | — | |
| Settlement | (8) | | | (10) | | | — | | | — | |
| Plan Amendment | — | | | — | | | 3 | | | — | |
| Currency translation adjustments | (9) | | | (11) | | | — | | | — | |
| Benefit obligation at December 31 | $ | 105 | | | $ | 143 | | | $ | 58 | | | $ | 68 | |
| Change in plan assets | | | | | | | |
| Fair value of plan assets at January 1 | $ | 67 | | | $ | 72 | | | $ | — | | | $ | — | |
| Actual return on plan assets | (3) | | | 2 | | | — | | | — | |
| Company contributions | 5 | | | 7 | | | — | | | — | |
| Benefits paid | (1) | | | — | | | — | | | — | |
| Currency translation adjustments | (5) | | | (5) | | | — | | | — | |
| Plan participant contribution | 1 | | | 1 | | | — | | | — | |
| Settlements | (8) | | | (10) | | | — | | | — | |
| | | | | | | |
| Fair value of plan assets at December 31 | 56 | | | 67 | | | — | | | — | |
| Funded status (underfunded) | $ | (49) | | | $ | (76) | | | $ | (58) | | | $ | (68) | |
| Amounts Recognized in the Consolidated Balance Sheet | | | | | | | |
| Non-current assets | $ | 7 | | | $ | 8 | | | $ | — | | | $ | — | |
| Current liabilities | (2) | | | (2) | | | (11) | | | (12) | |
| Non-current liabilities | (54) | | | (82) | | | (47) | | | (56) | |
| Net amounts recognized | $ | (49) | | | $ | (76) | | | $ | (58) | | | $ | (68) | |
| Amounts Recognized in Accumulated Other Comprehensive Income (Loss) | | | | | | | |
| Unrecognized Net actuarial (gain) loss | $ | (8) | | | $ | 19 | | | $ | 50 | | | $ | 69 | |
| Unrecognized Prior service cost | — | | | — | | | 5 | | | 4 | |
| Total | $ | (8) | | | $ | 19 | | | $ | 55 | | | $ | 73 | |
The following table presents the accumulated pension benefit obligation at December 31: | | | | | | | | | | | |
| In millions | 2022 | | 2021 |
| Accumulated pension benefit obligation | $ | 99 | | | $ | 134 | |
The following table presents pension plans with accumulated benefit obligations in excess of plan assets at December 31: | | | | | | | | | | | |
| In millions | 2022 | | 2021 |
| Projected benefit obligation | $ | 81 | | | $ | 115 | |
| Accumulated benefit obligation | $ | 76 | | | $ | 109 | |
Fair value of plan assets | $ | 25 | | | $ | 31 | |
The following table presents the pre-tax net changes in projected benefit obligations recognized in other comprehensive income: | | | | | | | | | | | | | | | | | | | | | | | |
| | Pension | | Postemployment |
| In millions | 2022 | | 2021 | | 2022 | | 2021 |
| Actuarial (gain) loss arising during the year | $ | (23) | | | $ | (9) | | | $ | (12) | | | $ | 10 | |
Amortization of loss included in net periodic benefit cost | (1) | | | (3) | | | (8) | | | (8) | |
| Prior service cost arising during the year | — | | | — | | | 2 | | | — | |
Recognition of gain due to curtailment | — | | | 2 | | | — | | | — | |
| | | | | | | |
| Foreign currency exchange | (1) | | | (2) | | | — | | | — | |
Total recognized in other comprehensive income (loss) | $ | (25) | | | $ | (12) | | | $ | (18) | | | $ | 2 | |
The weighted-average rates and assumptions used to determine benefit obligations at December 31, and net periodic benefit cost for the years ended December 31, were as follows: | | | | | | | | | | | | | | | | | | | | | | | | | | | | | |
| | Pension Benefit Obligations | | Pension Benefit Cost |
| | 2022 | | 2021 | | 2022 | | 2021 | | 2020 |
| Discount rate | 3.3% | | 1.3% | | 1.3% | | 0.9% | | 1.2% |
| Rate of compensation increase | 3.1% | | 3.0% | | 3.0% | | 2.9% | | 3.0% |
| Expected return on plan assets | N/A | | N/A | | 3.1% | | 3.4% | | 3.5% |
| Interest crediting rate assumption | 1.5% | | 0.9% | | 0.9% | | 0.9% | | 0.9% |
| | Postemployment
Benefit Obligations | | Postemployment
Benefit Cost |
| | 2022 | | 2021 | | 2022 | | 2021 | | 2020 |
| Discount rate | 3.8% | | 2.0% | | 2.0% | | 1.6% | | 1.8% |
| Rate of compensation increase | 3.0% | | 3.0% | | 3.0% | | 3.0% | | 3.0% |
| Involuntary turnover rate | 4.0% | | 4.0% | | 4.0% | | 3.5% | | 3.0% |
The Company determines the expected return on assets based on individual plan asset allocations, historical capital market returns, and long-term interest rate assumptions, with input from its actuaries, investment managers, and independent investment advisors. The company emphasizes long-term expectations in its evaluation of return factors, discounting or ignoring short-term market fluctuations. Expected asset returns are reviewed annually, but are generally modified only when asset allocation strategies change or long-term economic trends are identified.
International discount rates were determined by examining interest rate levels and trends within each country, particularly yields on high-quality long-term corporate bonds, relative to our future expected cash flows. The discount rate used for countries with individually insignificant benefit obligation at year-end was derived by matching the plans’ expected future cash flows to the corresponding yields from the Citigroup Pension Liability Index. This yield curve has been constructed to represent the available yields on high-quality fixed-income investments across a broad range of future maturities.
Gains and losses have resulted from changes in actuarial assumptions and from differences between assumed and actual experience, including, among other items, changes in discount rates and differences between actual and assumed asset returns. These gains and losses (except those differences being amortized to the market-related value) are only amortized to the extent that they exceed 10% of the higher of the market-related value of plan assets or the projected benefit obligation of each respective plan. Amortization of deferred gains and losses are recognized in the Consolidated Statements of Income as a component of Other expense.
Plan Assets. The weighted-average asset allocations at December 31, by asset category are as follows:
| | | | | | | | | | | | | | | | | |
| Actual Asset Allocation
as of December 31 | | Target Asset |
| | 2022 | | 2021 | | Allocation |
| Equity securities | 31% | | 33% | | 32% |
| Debt securities | 51% | | 53% | | 53% |
| Insurance (annuity) contracts | 16% | | 11% | | 13% |
| Real estate | 2% | | 3% | | 2% |
| | | | | |
| Total | 100% | | 100% | | 100% |
Investment Strategy. Teradata employs several investment strategies across its various international pension plans. In some countries, particularly where Teradata does not have a large employee base, the Company may use insurance (annuity) contracts to satisfy its future pension payment obligations, whereby the Company makes pension plan contributions to an insurance company in exchange for which the pension plan benefits will be paid when the members reach a specified retirement age or on earlier exit of members from the plan. In other countries, the Company may employ local asset managers to manage investment portfolios according to the investment policies and guidelines established by the Company, and with consideration to individual plan liability structure and local market environment and risk tolerances. The Company’s investment policies and guidelines primarily emphasize diversification across and within asset classes to maximize long-term returns subject to prudent levels of risk, with the overall objective of enabling the plans to meet their future obligations. The investment portfolios contain a diversified blend of equity and fixed-income investments. Furthermore, equity investments are diversified across domestic and international stocks, small and large capitalization stocks, and growth and value stocks. Fixed-income assets are diversified across government and corporate bonds. Where applicable, real estate investments are made through real estate securities, partnership interests or direct investment, and are diversified by property type and location.
Fair Value. Fair value measurements are established utilizing a three-tier fair value hierarchy, which prioritizes the inputs used in measuring fair value. These tiers are more fully described in Note 11.
The following is a description of the valuation methodologies used for pension assets as of December 31, 2022.
Common/collective trust funds (which include money market funds, equity funds, bond funds, real estate indirect investments, etc.): Valued at the net asset value ("NAV") of shares held by the pension plan at year end, as reported to the pension plan by the trustee, which represents the fair value of shares held by the pension plan. Because the NAV of the shares held in the common/collective trust funds are derived by the value of the underlying investments, the Company has classified these underlying investments as Level 2 fair value measurements.
Insurance contracts: Valued by discounting the related future benefit payments using a current year-end market discount rate, which represents the fair value of the insurance contract. The Company has classified these contracts as Level 3 assets for fair value measurement purposes.
The following table sets forth by level, within the fair value hierarchy, the pension plan assets at fair value as of December 31, 2022: | | | | | | | | | | | | | | | | | | | | | | | |
| | | | Fair Value Measurements at Reporting Date Using |
| | | Quoted Prices in Active Markets
for Identical
Assets | | Significant
Other
Observable
Inputs | | Significant
Unobservable
Inputs |
| In millions | December 31, 2022 | | (Level 1) | | (Level 2) | | (Level 3) |
| Money market funds | $ | 2 | | | $ | — | | | $ | 2 | | | $ | — | |
| Equity funds | 17 | | | — | | | 17 | | | — | |
| Bond/fixed-income funds | 27 | | | — | | | 27 | | | — | |
| Real estate indirect investments | 3 | | | — | | | 3 | | | — | |
| Insurance contracts | 7 | | | — | | | — | | | 7 | |
| Total assets at fair value | $ | 56 | | | $ | — | | | $ | 49 | | | $ | 7 | |
The table below sets forth a summary of changes in the fair value of the pension plan level 3 assets for the year ended December 31, 2022: | | | | | |
| In millions | Insurance
Contracts |
| Balance as of January 1, 2022 | $ | 7 | |
| Purchases, sales and settlements, net | — | |
| Balance as of December 31, 2022 | $ | 7 | |
The following table sets forth by level, within the fair value hierarchy, the pension plan assets at fair value as of December 31, 2021: | | | | | | | | | | | | | | | | | | | | | | | | | | | | | |
| | | | Fair Value Measurements at Reporting Date Using | | |
| | | Quoted Prices in Active
Markets
for Identical
Assets | | Significant
Other
Observable
Inputs | | Significant
Unobservable
Inputs | | |
| In millions | December 31, 2021 | | (Level 1) | | (Level 2) | | (Level 3) | | |
| | | | | | | | | |
| Equity funds | $ | 22 | | | $ | — | | | $ | 22 | | | $ | — | | | |
| Bond/fixed-income funds | 36 | | | — | | | 36 | | | — | | | |
| Real estate indirect investments | 2 | | | — | | | 2 | | | — | | | |
| | | | | | | | | |
| Insurance contracts | 7 | | | — | | | — | | | 7 | | | |
| Total assets at fair value | $ | 67 | | | $ | — | | | $ | 60 | | | $ | 7 | | | |
The table below sets forth a summary of changes in the fair value of the pension plan level 3 assets for the year ended December 31, 2021: | | | | | |
| In millions | Insurance
Contracts |
| Balance as of January 1, 2021 | $ | 8 | |
| Purchases, sales and settlements, net | (1) | |
| Balance as of December 31, 2021 | $ | 7 | |
Cash Flows Related to Employee Benefit Plans
Cash Contributions. In 2023, the Company expects to contribute approximately $3 million to the international pension plans.
Estimated Future Benefit Payments. The Company expects to make the following benefit payments, estimated based on the assumptions used to measure the Company's benefit obligation at the end of the year, reflecting past and future service from its pension and postemployment plans: | | | | | | | | | | | |
| | Pension | | Postemployment |
| In millions | Benefits | | Benefits |
| Year | | | |
| 2023 | $ | 6 | | | $ | 11 | |
| 2024 | $ | 6 | | | $ | 11 | |
| 2025 | $ | 7 | | | $ | 11 | |
| 2026 | $ | 6 | | | $ | 11 | |
| 2027 | $ | 7 | | | $ | 11 | |
| 2028 - 2032 | $ | 38 | | | $ | 54 | |
Savings Plans. United States employees and many international employees participate in defined contribution savings plans. These plans generally provide either a specified percent of pay or a matching contribution on participating employees’ voluntary elections. The Company’s matching contributions typically are subject to a maximum percentage or level of compensation. Employee contributions can be made pre-tax, after-tax or a combination thereof. The following table identifies the expense for the United States and International subsidiary savings plans for the years ended December 31: | | | | | | | | | | | | | | | | | |
| In millions | 2022 | | 2021 | | 2020 |
| U.S. savings plan | $ | 16 | | | $ | 16 | | | $ | 19 | |
| International subsidiary savings plans | $ | 12 | | | $ | 14 | | | $ | 13 | |
Note 9 Derivative Instruments and Hedging Activities
As a portion of Teradata’s operations is conducted outside the United States and in currencies other than the U.S. dollar, the Company is exposed to potential gains and losses from changes in foreign currency exchange rates. In an attempt to mitigate the impact of currency fluctuations, the Company uses foreign exchange forward contracts to hedge transactional exposures resulting predominantly from foreign currency denominated inter-company receivables and payables. The forward contracts are designated as fair value hedges of specified foreign currency denominated inter-company receivables and payables and generally mature in three months or less. The fair values of foreign exchange contracts are based on market spot and forward exchange rates and represent estimates of possible value that may not be realized in the future. Across its portfolio of contracts, Teradata has both long and short positions relative to the U.S. dollar. As a result, Teradata’s net involvement is less than the total contract notional amount of the Company’s foreign exchange forward contracts.
Gains and losses from foreign exchange forward contracts are fully recognized each period and reported along with the offsetting gain or loss of the related hedged item, either in cost of revenues or in other income (expense), depending on the nature of the related hedged item.
During June 2022, Teradata entered into a cross-currency swap designated as a net investment hedge, to hedge the Euro currency exposure of its net investment in certain foreign subsidiaries. This agreement is a contract to exchange fixed-rate payments in one currency for fixed-rate payments in another currency. Changes in the fair value of this swap are recorded in Accumulated Other Comprehensive Loss in the same manner as foreign currency translation adjustments. In assessing the effectiveness of this hedge, the Company used a method based on changes in spot rates to measure the impact of the foreign currency exchange rate fluctuations on both its foreign subsidiary net investment and the related swap.
The cross-currency swap contract has an expiration date of June 29, 2026. At maturity of the cross-currency swap contract, the Company will deliver the notional amount of €143 million and will receive $150 million from the counterparty. The Company will receive monthly interest payments from the counterparty based on a fixed interest rate until maturity of the agreements.
In June 2022, Teradata refinanced its long-term debt and its associated interest rate swap ("Prior Interest Rate Swap"), which were due to mature in June 2023. As a result, Teradata terminated its five-year London Interbank
Offered Rate ("Libor") interest rate swap that had a $500 million initial notional amount to hedge the floating interest rate of its Libor term loan. On June 28, 2022, Teradata executed a five-year Secured Overnight Financing Rate ("SOFR") interest rate swap, to fix the interest rate on approximately 90% of the principal balance of the $500 million term loan, with an initial notional amount of $450 million, as more fully described in Note 12. The Company uses interest rate swaps to manage interest rate risks on future interest payments caused by interest rate changes on its variable rate term loan. The notional amount of the hedge steps down according to the amortization schedule of the term loan. The notional amount of the hedge was $450 million as of December 31, 2022.
The Company performed an initial effectiveness assessment on the interest rate swap and the net investment hedge foreign currency swap, and the hedges were determined to be effective. The hedges are being evaluated qualitatively on a quarterly basis for effectiveness. Changes in fair value are recorded in Accumulated Other Comprehensive Loss and periodic settlements of the interest rate swap will be recorded in interest expense along with the interest on amounts outstanding under the term loan.
The following table identifies the contract notional amount of the Company’s hedging instruments at December 31: | | | | | | | | | | | |
| In millions | 2022 | | 2021 |
| Contract notional amount of foreign exchange forward contracts | $ | 46 | | | $ | 110 | |
| Net contract notional amount of foreign exchange forward contracts | $ | 7 | | | $ | 41 | |
| Contract notional amount of foreign currency exchange (net investment hedge) | $ | 150 | | | $ | — | |
| Contract notional amount of interest rate swap | $ | 450 | | | $ | 413 | |
All derivatives are recognized in the consolidated balance sheets at their fair value. The notional amounts represent agreed-upon amounts on which calculations of dollars to be exchanged are based and are an indication of the extent of Teradata’s involvement in such instruments. These notional amounts do not represent amounts exchanged by the parties and, therefore, are not a measure of the instruments. Refer to Note 11 for disclosures related to the fair value of all derivative assets and liabilities.
The Company does not hold or issue derivative financial instruments for trading purposes, nor does it hold or issue leveraged derivative instruments. By using derivative financial instruments to hedge exposures to changes in foreign exchange and interest rates, the Company exposes itself to credit risk. The Company manages exposure to counterparty credit risk by entering into derivative financial instruments with highly rated institutions that can be expected to fully perform under the terms of the applicable contracts.
Note 10 Commitments and Contingencies
Legal Proceedings
In the ordinary course of business, the Company is subject to proceedings, lawsuits, governmental investigations, claims and other matters, including those that relate to the environment, health and safety, employee benefits, export compliance, intellectual property, tax matters and other regulatory compliance and general matters. It is not currently a party to any litigation, nor is it aware of any pending or threatened litigation against it that the Company believes would materially affect its business, operating results, financial condition or cash flows, other than the following.
On June 19, 2018, the Company and certain of its subsidiaries filed a lawsuit (the "TD-SAP 1" suit) in the U.S. District Court for the Northern District of California against SAP SE, SAP America, Inc., and SAP Labs, LLC (collectively, "SAP"). In the TD-SAP 1 lawsuit, the Company alleged, among other things, that SAP misappropriated certain of the Company’s trade secrets within the Company’s enterprise data analytics and warehousing products and used such trade secrets to help develop, improve, introduce, and sell one or more competing products. The Company further alleged that SAP employed anticompetitive practices using its substantial market position in the enterprise resource planning applications market to pressure the Company’s customers and prospective customers to use one or more of SAP's competing products and reduce or eliminate customers' and prospective customers' use of the Company's offerings. The Company sought an injunction barring SAP’s alleged conduct, monetary damages, and other available legal and equitable relief. In July 2019, SAP filed patent infringement counterclaims against the Company based on five of SAP’s U.S. patents. On August 31, 2020, the Company filed a second lawsuit against SAP (the "TD-SAP 2" suit) in the U.S. District Court for the Northern District of California, in which the Company alleged infringement by SAP of four of the Company's U.S. patents. On February 16, 2021, SAP filed additional patent infringement counterclaims against the Company in response. On
the same day, SAP also filed a lawsuit in Germany (the "TD-SAP 3" suit) for infringement of a single German patent. In November 2021, the district court dismissed the Company’s antitrust claims and most of its trade secret claims in the TD-SAP 1 suit. In December 2021, the Company appealed that decision to the U.S. Court of Appeals for the Federal Circuit in Washington, D.C. In the meantime, the Company and SAP have entered into a partial settlement agreement that has resulted in full dismissal of all claims and counterclaims in the TD-SAP 2 suit in California and the TD-SAP 3 suit in Germany as well as a stay of all claims and counterclaims remaining in the TD-SAP 1 suit pending resolution of the Company’s appeal. Currently, it is not possible to determine the likelihood of a loss or a reasonably estimated range of loss, if any, pertaining to any of SAP’s remaining patent counterclaims in the TD-SAP 1 lawsuit.
Other Contingencies. The Company provides its customers with certain indemnification rights. In general, the Company agrees to indemnify the customer if a third party asserts patent or other infringement on the part of the customer for its use of the Company’s offerings. The Company has indemnification obligations under its charter and bylaws to its officers and directors, and has entered into indemnification agreements with the officers and directors of its subsidiaries. From time to time, the Company also enters into agreements in connection with its acquisition and divestiture activities that include indemnification obligations by the Company. The fair value of these indemnification obligations is typically not readily determinable due to the conditional nature of the Company’s potential obligations and the specific facts and circumstances involved with each particular agreement. As such, the Company has generally not recorded a liability in connection with these indemnification arrangements. Historically, payments made by the Company under these types of agreements have not had a material effect on the Company’s consolidated financial condition, results of operations or cash flows.
Concentrations of Risk. The Company is potentially subject to concentrations of credit risk on accounts receivable and financial instruments such as hedging instruments, and cash and cash equivalents. Credit risk includes the risk of nonperformance by counterparties. The maximum potential loss may exceed the amount recognized on the balance sheet. Exposure to credit risk is managed through credit approvals, credit limits, selecting major international financial institutions (as counterparties to hedging transactions) and monitoring procedures. Teradata’s business often involves large transactions with customers, and if one or more of those customers were to default in its obligations under applicable contractual arrangements, the Company could be exposed to potentially significant losses. However, management believes that the reserves for potential losses were adequate at December 31, 2022 and December 31, 2021.
The Company is also potentially subject to concentrations of supplier risk. Our hardware components are assembled exclusively by Flex Ltd. ("Flex"). Flex procures a wide variety of components used in the manufacturing process on behalf of the Company. Although many of these components are available from multiple sources, Teradata utilizes preferred supplier relationships to provide more consistent and optimal quality, cost and delivery. Typically, these preferred suppliers maintain alternative processes and/or facilities to ensure continuity of supply. Given the Company’s strategy to outsource its manufacturing activities to Flex and to source certain components from single suppliers, a disruption in production at Flex or at a supplier could impact the timing of customer shipments and/or Teradata’s operating results. In addition, a significant change in the forecasts to any of these preferred suppliers could result in purchase obligations for components that may be in excess of demand.
Note 11 Fair Value Measurements
Fair value measurements are established utilizing a three-tier fair value hierarchy, which prioritizes the inputs used in measuring fair value. These tiers include: Level 1, defined as observable inputs such as quoted prices in active markets for identical assets or liabilities; Level 2, defined as significant other observable inputs, such as quoted prices in active markets for similar assets or liabilities, or quoted prices in less-active markets for identical assets; and Level 3, defined as unobservable inputs in which little or no market data exists, therefore requiring an entity to develop its own assumptions. Financial assets and liabilities are classified in their entirety based on the lowest level of input that is significant to the fair value measurement.
The Company’s assets and liabilities measured at fair value on a recurring basis include money market funds, interest rate swaps and foreign currency exchange contracts. A portion of the Company’s excess cash reserves are held in money market funds which generate interest income based on the prevailing market rates. Money market funds are included in cash and cash equivalents in the Company’s balance sheet. Money market fund holdings are measured at fair value using quoted market prices and are classified within Level 1 of the valuation hierarchy.
When deemed appropriate, the Company minimizes its exposure to changes in foreign currency exchange rates using derivative financial instruments, specifically, foreign exchange forward contracts. Additionally, in June 2022, Teradata executed a five-year interest rate swap with a $450 million initial notional amount to hedge the floating interest rate on its term-loan and a four-year cross-currency swap with initial notional amounts of €143 million/$150 million, as a net investment hedge to hedge the Euro currency exposure of our net investment in certain foreign subsidiaries. The fair value of these contracts and swaps are measured at the end of each interim reporting period using observable inputs other than quoted prices, specifically market spot and forward exchange rates. As such, these derivative instruments are classified within Level 2 of the valuation hierarchy. Fair value of unrealized gains for open contracts are recorded in other assets and the fair value of unrealized losses are recorded in other liabilities in the Company's balance sheet. The fair value of foreign exchange forward contracts recorded in other assets and other liabilities at December 31, 2022 and 2021 were not material. Realized gains and losses from the Company’s fair value hedges net of corresponding gains or losses on the underlying exposures were immaterial for years ended December 31, 2022, 2021 and 2020.
The Company’s assets and liabilities measured at fair value on a recurring basis and subject to fair value disclosure requirements at December 31, 2022 and December 31, 2021 were as follows:
| | | | | | | | | | | | | | | | | | | | | | | |
| | | | Fair Value Measurements at Reporting Date Using |
| | | Quoted Prices
in Active Markets
for Identical
Assets | | Significant
Other
Observable
Inputs | | Significant Unobservable Inputs |
| In millions | Total | | (Level 1) | | (Level 2) | | (Level 3) |
| Assets | | | | | | | |
| Money Market Funds at December 31, 2022 | $ | 211 | | | $ | 211 | | | $ | — | | | $ | — | |
| | | | | | | |
| Money Market Funds at December 31, 2021 | $ | 148 | | | $ | 148 | | | $ | — | | | $ | — | |
| | | | | | | |
| | | | | | | |
| Interest Rate Swap at December 31, 2022 | $ | 13 | | | $ | — | | | $ | 13 | | | $ | — | |
| | | | | | | |
| Liabilities | | | | | | | |
| Foreign Currency Swap at December 31, 2022 | $ | 1 | | | $ | — | | | $ | 1 | | | $ | — | |
| | | | | | | |
| Interest Rate Swap at December 31, 2021 | $ | 12 | | | $ | — | | | $ | 12 | | | $ | — | |
| | | | | | | |
Note 12 Debt
On June 28, 2022, the Company entered into a Credit Agreement that provides for (i) a five-year unsecured term loan in an aggregate principal amount of $500 million (the "Term Loan"), and (ii) a five-year unsecured revolving credit facility in an aggregate principal amount of up to $400 million, including a $50 million sublimit for the issuance of standby letters of credit and a $50 million sublimit for swingline loans (the "Revolving Facility" and, collectively with the Term Loan, the "Credit Facility"). The Credit Facility replaces the Company's prior revolving credit agreement in the maximum principal of $400 million and its prior term loan agreement in the initial principal amount of $500 million, both of which were entered into in 2018 and due to mature in June 2023 (the "Prior Agreements"). In connection with the execution of the Credit Facility, the $400 million term loan outstanding under the Prior Agreements was repaid in full.
All outstanding borrowings pursuant to the Revolving Facility are due and payable on June 28, 2027, however, the maturity date of the Revolving Facility may be extended by agreement of the parties for up to two additional one-year periods. The Term Loan is payable in quarterly installments, which commence on June 30, 2024, with 1.25% of the initial principal amount due on each of the first twelve payment dates, with all remaining principal due on June 28, 2027. Under the terms of the Credit Facility, Teradata from time to time and subject to certain conditions may increase the lending commitments under the Credit Facility in an aggregate principal amount up to an additional $450 million, to the extent that existing or new lenders agree to provide such additional commitments. The outstanding principal amount of the Credit Facility bears interest at a floating rate based upon, at Teradata’s option, a negotiated base rate or an adjusted term SOFR rate, plus in each case, a margin based on the Company's leverage ratio. As disclosed in Note 9, in June 2022, Teradata entered into an interest rate swap to hedge
approximately 90% (or $450 million as of December 31, 2022) of the floating interest rate of the total $500 million Term Loan and a cross currency swap to hedge a portion of Euro currency exposure of its net investment in certain foreign subsidiaries.
The Credit Facility is unsecured but is guaranteed by certain of Teradata’s material domestic subsidiaries and contains certain customary representations and warranties, default provisions, and affirmative and negative covenants, including, among others, covenants regarding the maintenance of a leverage ratio and covenants relating to financial reporting, compliance with laws, subsidiary indebtedness, liens, sale and leaseback transactions, mergers and other fundamental changes, and entry into certain restrictive agreements. Most of the covenants are subject to materiality, thresholds, and exceptions. In addition, the Credit Agreement provides that Teradata may request that the Credit Agreement be amended to establish key performance indicators with respect to certain environmental, social, and governance ("ESG") targets, pursuant to which certain positive or negative adjustments would be made to various fees and applicable margin based on Teradata’s performance against such ESG targets.
As of December 31, 2022 and 2021, the Company had no borrowings outstanding under the Credit Facility, leaving $400 million in additional borrowing capacity available under the Credit Facility. The Company was in compliance with all covenants as of December 31, 2022 and 2021.
The term loan principal outstanding was $500 million at December 31, 2022 and $413 million at December 31, 2021. As disclosed in Note 9, Teradata entered into an interest rate swap to hedge the floating interest rate of the term loan. As a result of the swap, Teradata’s fixed rate on approximately 90% of the term loan equals 3.25% excluding the applicable leverage-based margin as defined in the term loan agreement. As of December 31, 2022 and 2021, the all-in fixed rates are 4.24% and 4.23%, respectively. Deferred issuance costs are amortized over the five-year term of the Term Loan to interest expense . As of December 31, 2022 the remaining unamortized deferred issuance costs are approximately $2 million.
Annual contractual maturities of outstanding principal on the Term Loan at December 31, 2022, are as follows:
| | | | | |
| In millions | Principal payments |
| 2023 | $ | — | |
| 2024 | 19 | |
| 2025 | 25 | |
| 2026 | 25 | |
| 2027 | 431 | |
| Total | $ | 500 | |
The Term Loan is recognized on the Company’s balance sheet at its unpaid principal balance and is not subject to fair value measurement. However, given that the loan carries a variable rate, the Company estimates that the unpaid principal balance of the Term Loan would approximate its fair value. If measured at fair value in the financial statements, the Company’s Term Loan would be classified as Level 2 in the fair value hierarchy.
Note 13 Leases
Lessee
The Company leases property and equipment under finance and operating leases. The Company's operating leases primarily consist of automobiles in certain countries and real estate, including office, storage and parking spaces. The duration of these leases range from 2 to 4 years. The Company's finance leases primarily consist of equipment financed for the purpose of delivering services to our customers. For leases with terms greater than 12 months, the Company recorded the related asset and obligation at the present value of lease payments over the term. Many of our leases include variable rental escalation clauses which are recognized when incurred. Some of our leases also include renewal options and/or termination options that are factored into the determination of lease payments and lease terms when it is reasonably certain that the Company will exercise these options. Lease agreements do not contain any material residual value guarantees or material restrictive covenants. Leases with an initial term of 12 months or less are not recorded on the balance sheet. The Company recognizes lease expense for these leases on a straight-line basis over the lease term. For real estate leases beginning in 2019 and later, we account for lease
components (e.g., fixed payments including rent, real estate taxes and insurance costs) separately from the non-lease components (e.g., common-area maintenance costs). For automobile leases we account for lease and non-lease components together.
When available, the Company uses the rate implicit in the lease to discount lease payments to present value. However, real estate leases do not typically provide a readily determinable implicit rate. Therefore, the Company must estimate the incremental borrowing rate to discount the lease payments based on information available at lease commencement. The incremental borrowing rate used in the calculation of the lease liability is based on the secured rate associated with financed lease obligations for each location of leased property.
The table below presents the lease-related assets and liabilities recorded on the balance sheet at December 31: | | | | | | | | | | | | | | | | | | |
| | | | | | |
| In millions, except weighted average calculations | Classification on the Balance Sheet | | 2022 | | 2021 | |
| Assets | | | | | | |
| Operating lease assets | Right of use assets - operating lease, net | | $ | 13 | | | $ | 26 | | |
| Finance lease assets | Property and equipment, net | | 149 | | | 170 | | |
| Total lease assets | | | $ | 162 | | | $ | 196 | | |
| | | | | | | |
| Liabilities | | | | | | |
| Current | | | | | | |
| Operating | Current portion of operating lease liability | | $ | 8 | | | $ | 12 | | |
| Finance | Current portion of finance lease liability | | 67 | | | 77 | | |
| Non current | | | | | | |
| Operating | Operating lease liability | | 10 | | | 18 | | |
| Finance | Finance lease liability | | 54 | | | 53 | | |
| Total lease liabilities | | | $ | 139 | | | $ | 160 | | |
| | | | | | | |
| Weighted-average remaining lease term | | | | | | |
| Operating leases | | | 2.37 years | | 2.81 years | |
| Finance leases | | | 2.03 years | | 1.86 years | |
| Weighted-average discount rate | | | | | | |
Operating leases(1) | | | 5.00 | % | | 5.00 | % | |
| Finance leases | | | 4.97 | % | | 3.98 | % | |
(1) Upon adoption of the new lease standard, discount rates used for existing leases were established based on the Company's incremental borrowing rate at January 1, 2019. For new leases entered after January 1, 2019, the discount rate was determined based on the Company's incremental borrowing rate at lease commencement.
Lessee Costs
The table below presents certain information related to the lease costs for finance and operating leases recognized in the Company's consolidated statements of income for the years ended December 31: | | | | | | | | | | | | | | | | | | | | |
| In millions | | 2022 | | 2021 | | 2020 |
| Finance lease cost | | | | | | |
| Depreciation of leased assets | | $ | 69 | | | $ | 78 | | | $ | 55 | |
| Interest of lease liabilities | | 5 | | | 6 | | | 6 | |
| Operating lease cost | | 12 | | | 17 | | | 24 | |
| Sub-lease income from real estate properties owned and leased | | (5) | | | (5) | | | (6) | |
| Total lease cost | | $ | 81 | | | $ | 96 | | | $ | 79 | |
Other Information
The table below presents supplemental cash flow information related to cash paid for amounts included in the measurement of lease liabilities for the year ended December 31: | | | | | | | | | | | | |
| In millions | 2022 | | 2021 | |
| Operating cash flows for operating leases | $ | 15 | | | $ | 19 | | |
| Operating cash flows for finance leases | $ | 5 | | | $ | 6 | | |
| Financing cash flows for finance leases | $ | 86 | | | $ | 92 | | |
Undiscounted Cash Flows
The table below reconciles the undiscounted cash flows for each of the first five years and total of the remaining years to the finance lease liabilities and operating lease liabilities recorded on the balance sheet at December 31, 2022: | | | | | | | | | | | | | | | |
| In millions | | Operating Leases | | Finance Leases | |
| 2023 | | $ | 11 | | | $ | 72 | | |
| 2024 | | 8 | | | 39 | | |
| 2025 | | 3 | | | 17 | | |
| 2026 | | 1 | | | — | | |
| 2027 | | — | | | — | | |
| Thereafter | | — | | | — | | |
| Total minimum lease payments | | 23 | | | 128 | | |
| Less: amount of lease payments representing interest | | (5) | | | (7) | | |
| Present value of future minimum lease payments | | 18 | | | 121 | | |
| Less: current obligations under leases | | (8) | | | (67) | | |
| Long-term lease obligations | | $ | 10 | | | $ | 54 | | |
The table below provides the undiscounted cash flows for the Company's finance lease liabilities and operating lease obligations as of December 31, 2021:
| | | | | | | | | | | | | | | |
| In millions | | Operating Leases | | Finance Leases | |
| 2022 | | $ | 16 | | | $ | 80 | | |
| 2023 | | 9 | | | 44 | | |
| 2024 | | 7 | | | 11 | | |
| 2025 | | 2 | | | — | | |
| 2026 | | 1 | | | — | | |
| Thereafter | | — | | | — | | |
| Total minimum lease payments | | 35 | | | 135 | | |
| Less: amount of lease payments representing interest | | (5) | | | (5) | | |
| Present value of future minimum lease payments | | 30 | | | 130 | | |
| Less: current obligations under leases | | (12) | | | (77) | | |
| Long-term lease obligations | | $ | 18 | | | $ | 53 | | |
Lessor
The Company receives rental revenue for leasing hardware offerings to its customers. For our hardware rental offering, the Company owns or leases the hardware and may or may not provide managed services. Leases sometimes include options to renew but typically do not include lessee purchase options. The revenue for these operating leases is generally recognized straight-line over the term of the contract and is included within the recurring revenue caption on the consolidated statements of income. Equipment used for this revenue is reported within Property and equipment, net on the consolidated balance sheet.
The following table includes rental revenue for the years ended December 31: | | | | | | | | | | | | | | | | | | | | |
| In millions | | 2022 | | 2021 | | 2020 |
| Rental revenue* | | $ | 191 | | | $ | 162 | | | $ | 100 | |
*Rental revenue includes hardware maintenance.
The following table includes estimated rental revenue expected to be recognized in the future based on executed contracts at December 31, 2022: | | | | | |
| In millions | Rental Revenue |
| 2023 | $ | 182 | |
| 2024 | 89 | |
| 2025-26 | 56 | |
| |
| Total | $ | 327 | |
Note 14 Segment, Other Supplemental Information and Concentrations
Teradata manages its business under three geographic regions, which are also the Company’s operating segments: (1) Americas region (North America and Latin America); (2) EMEA region (Europe, Middle East and Africa) and (3) APJ region (Asia Pacific and Japan). For purposes of discussing results by segment, management excludes the impact of certain items, consistent with the manner by which management evaluates the performance of each segment. This format is useful to investors because it allows analysis and comparability of operating trends. It also includes the same information that is used by Teradata management to make decisions regarding the segments and to assess financial performance. The chief operating decision maker, who is our President and Chief Executive Officer, evaluates the performance of the segments based on revenue and multiple profit measures, including segment gross profit. For management reporting purposes assets are not allocated to the segments.
The following table presents segment revenue and segment gross profit for the Company for the years ended December 31: | | | | | | | | | | | | | | | | | |
| In millions | 2022 | | 2021 | | 2020 |
| Segment revenue | | | | | |
| Americas | $ | 1,038 | | | $ | 1,044 | | | $ | 1,025 | |
| EMEA | 465 | | | 543 | | | 485 | |
| APJ | 292 | | | 330 | | | 326 | |
| | | | | |
| Total revenue | 1,795 | | | 1,917 | | | 1,836 | |
| Segment gross profit | | | | | |
| Americas | 643 | | | 690 | | | 631 | |
| EMEA | 285 | | | 337 | | | 273 | |
| APJ | 177 | | | 188 | | | 168 | |
| | | | | |
| | | | | |
| Total segment gross profit | 1,105 | | | 1,215 | | | 1,072 | |
| Stock-based compensation expense | 16 | | | 18 | | | 16 | |
| Acquisition, integration and reorganization-related costs | 8 | | | 11 | | | 14 | |
| Amortization of capitalized software costs | — | | | — | | | 23 | |
| Total gross profit | 1,081 | | | 1,186 | | | 1,019 | |
| Selling, general and administrative expenses | 650 | | | 646 | | | 669 | |
| Research and development expenses | 313 | | | 309 | | | 334 | |
| | | | | |
| Total income from operations | $ | 118 | | | $ | 231 | | | $ | 16 | |
Certain items, including amortization of certain capitalized software costs, were excluded from segment gross profit to conform to the way the Company manages and reviews the results by segment.
The following table presents revenues by geographic area for the years ended December 31: | | | | | | | | | | | | | | | | | |
| In millions | 2022 | | 2021 | | 2020 |
| United States | $ | 914 | | | $ | 922 | | | $ | 921 | |
| Americas (excluding United States) | 124 | | | 122 | | | 104 | |
| EMEA | 465 | | | 543 | | | 485 | |
| APJ | 292 | | | 330 | | | 326 | |
| Total revenue | $ | 1,795 | | | $ | 1,917 | | | $ | 1,836 | |
The following table presents property and equipment, net by geographic area at December 31: | | | | | | | | | | | |
| In millions | 2022 | | 2021 |
| United States | $ | 172 | | | $ | 210 | |
| Americas (excluding United States) | 15 | | | 14 | |
| EMEA | 37 | | | 36 | |
| APJ | 20 | | | 28 | |
| Property and equipment, net | $ | 244 | | | $ | 288 | |
Concentrations. No single customer accounts for more than 10% of the Company's revenue for any period presented. As of December 31, 2022, the Company is not aware of any significant concentration of business transacted with a particular customer that could, if suddenly eliminated, have a material adverse effect on the Company’s operations. The Company's hardware components are assembled exclusively by Flex. In addition, the Company utilizes preferred supplier relationships to better ensure more consistent quality, cost, and delivery. There can be no assurances that a disruption in production at Flex or at a supplier would not have a material adverse effect on the Company's operations. In addition, a significant change in the forecasts to any of these preferred suppliers could result in purchase obligations or components that may be in excess of demand.
Note 15 Accumulated Other Comprehensive (Loss) Income
The following table provides information on changes in accumulated other comprehensive (loss) income, net of tax ("AOCI"), for the years ended December 31: | | | | | | | | | | | | | | | | | | | | | | | |
| In millions | Derivatives | | Defined
benefit
plans | | Foreign
currency
translation
adjustments | | Total
AOCI |
| Balance as of December 31, 2019 | $ | (15) | | | $ | (65) | | | $ | (61) | | | $ | (141) | |
| Other comprehensive (loss) income before reclassifications | (6) | | | (12) | | | 7 | | | (11) | |
| Amounts reclassified from AOCI | — | | | 9 | | | — | | | 9 | |
| Net other comprehensive (loss) income | (6) | | | (3) | | | 7 | | | (2) | |
| Balance as of December 31, 2020 | $ | (21) | | | $ | (68) | | | $ | (54) | | | $ | (143) | |
| Other comprehensive income (loss) before reclassifications | 11 | | | (1) | | | (12) | | | (2) | |
| Amounts reclassified from AOCI | — | | | 7 | | | — | | | 7 | |
| Net other comprehensive income (loss) | 11 | | | 6 | | | (12) | | | 5 | |
| Balance as of December 31, 2021 | $ | (10) | | | $ | (62) | | | $ | (66) | | | $ | (138) | |
| Other comprehensive income (loss) before reclassifications | 19 | | | 25 | | | (31) | | | 13 | |
| Amounts reclassified from AOCI | — | | | 6 | | | — | | | 6 | |
| Net other comprehensive income (loss) | 19 | | | 31 | | | (31) | | | 19 | |
| Balance as of December 31, 2022 | $ | 9 | | | $ | (31) | | | $ | (97) | | | $ | (119) | |
The following table presents the impact and respective location of AOCI reclassifications in the Consolidated Statements of Income for the years ended December 31: | | | | | | | | | | | | | | | | | | | | | | | | | | |
| In millions | | | | |
| AOCI Component | | Location | | 2022 | | 2021 | | 2020 |
| | | | | | | | |
| | | | | | | | |
| Other Expense | | Other Expense | | $ | (9) | | | $ | (11) | | | $ | (10) | |
| | | | | | | | |
| Tax portion | | Income tax benefit | | 3 | | | 4 | | | 1 | |
| Total reclassifications | | Net (loss) income | | $ | (6) | | | $ | (7) | | | $ | (9) | |
Further information on the Company’s defined benefit plans is included in Note 8.
| | | | | |
| Item 9. | CHANGES IN AND DISAGREEMENTS WITH ACCOUNTANTS ON ACCOUNTING AND FINANCIAL DISCLOSURE |
None.
| | | | | |
| Item 9A. | CONTROLS AND PROCEDURES |
Evaluation of Disclosure Controls and Procedures
Teradata maintains a system of disclosure controls and procedures (as defined in Rules 13a-15(e) and 15d-15(e) of the Securities Exchange Act of 1934 (the "Exchange Act")) that are designed to provide reasonable assurance that information required to be disclosed in its reports filed or submitted under the Exchange Act is recorded, processed, summarized and reported, within the time periods specified in the SEC’s rules and forms, and that such information is accumulated and communicated to management, including, as appropriate, the chief executive officer and the chief financial officer, to allow timely decisions regarding required disclosures. In designing and evaluating the disclosure controls and procedures, management recognizes that any controls and procedures, no matter how well designed and operated, can provide only reasonable assurance of achieving the desired control objectives.
Based on their evaluation, our Chief Executive Officer and Chief Financial Officer have concluded that our disclosure controls and procedures were effective to provide reasonable assurance as of December 31, 2022.
Management’s Annual Report on Internal Control Over Financial Reporting
Our management is responsible for establishing and maintaining adequate internal control over financial reporting as such term is defined in Rule 13a-15(f) under the Exchange Act. Teradata’s internal control over financial reporting is designed to provide reasonable assurance regarding the reliability of financial reporting and the preparation of financial statements for external purposes in accordance with generally accepted accounting principles. A company’s internal control over financial reporting includes those policies and procedures that (i) pertain to the maintenance of records that, in reasonable detail, accurately and fairly reflect the transactions and dispositions of the assets of the company; (ii) provide reasonable assurance that transactions are recorded as necessary to permit preparation of financial statements in accordance with generally accepted accounting principles, and that receipts and expenditures of the Company are being made only in accordance with authorizations of management and directors of the company; and (iii) provide reasonable assurance regarding prevention or timely detection of unauthorized acquisition, use, or disposition of the company’s assets that could have a material effect on the financial statements.
Because of its inherent limitations, internal control over financial reporting may not prevent or detect misstatements. Also, projections of any evaluation of effectiveness to future periods are subject to the risk that controls may become inadequate because of changes in conditions, or that the degree or compliance with the policies or procedures may deteriorate.
Management assessed the effectiveness of Teradata’s internal control over financial reporting as of the end of the period covered by this report. In making this assessment, management used the criteria set forth by the Committee of Sponsoring Organizations of the Treadway Commission ("COSO") in Internal Control – Integrated Framework (2013). Based on its assessment and those criteria, management concluded that Teradata’s internal control over financial reporting was effective as of December 31, 2022.
Teradata’s independent registered public accounting firm has issued their report on the effectiveness of Teradata’s internal control over financial reporting as of December 31, 2022, which appears in this Annual Report.
Changes in Internal Control over Financial Reporting
There have been no changes in our internal control over financial reporting that occurred during the last fiscal quarter ended December 31, 2022 that have materially affected, or are reasonably likely to materially affect, our internal control over financial reporting.
| | | | | |
| Item 9B. | OTHER INFORMATION |
None.
| | | | | |
| Item 9C. | DISCLOSURE REGARDING FOREIGN JURISDICTIONS THAT PREVENT INSPECTIONS |
Not applicable.
PART III
| | | | | |
| Item 10. | DIRECTORS, EXECUTIVE OFFICERS AND CORPORATE GOVERNANCE |
Information required to be included in Part III Item 10 is set forth under the captions "Election of Directors," "Our Corporate Governance," and "Committees of the Board" in Teradata’s Notice of Annual Meeting of Stockholders and Proxy Statement to be filed with the SEC within 120 days after the end of our fiscal 2022 year (the "2023 Proxy Statement") and is incorporated herein by reference. The information under the heading "Executive Officers of the Registrant" in Part I Item 1 of this Annual Report on Form 10-K is also incorporated by reference in this section.
| | | | | |
| Item 11. | EXECUTIVE COMPENSATION |
Information required to be included in Part III Item 11 is set forth under the captions "Director Compensation," "Compensation Discussion and Analysis," "Compensation Tables," "Potential Payments Upon Termination or
Change in Control," "Compensation and People Committee" and "Board Compensation and People Committee Report on Executive Compensation" in Teradata’s 2023 Proxy Statement and incorporated herein by reference.
| | | | | |
| Item 12. | SECURITY OWNERSHIP OF CERTAIN BENEFICIAL OWNERS AND MANAGEMENT AND RELATED STOCKHOLDER MATTERS |
Information required to be included in Part III Item 12 is set forth under the caption "Stock Ownership" and the caption "Current Equity Compensation Plan Information" under Item 3 of Teradata’s 2023 Proxy Statement and incorporated herein by reference.
| | | | | |
| Item 13. | CERTAIN RELATIONSHIPS AND RELATED TRANSACTIONS, AND DIRECTOR INDEPENDENCE |
Information required to be included in Part III Item 13 is set forth under the captions "Related Person Transactions" and "Board Independence and Related Transactions" in Teradata’s 2023 Proxy Statement and incorporated herein by reference.
| | | | | |
| Item 14. | PRINCIPAL ACCOUNTANT FEES AND SERVICES |
Information required to be included in Part III Item 14 is set forth under the caption "Fees Paid to Independent Registered Public Accounting Firm" in Teradata’s 2023 Proxy Statement and incorporated herein by reference.
PART IV
| | | | | |
| Item 15. | EXHIBITS, FINANCIAL STATEMENT SCHEDULES |
(a)Index
1. Financial Statements: The consolidated financial statements of the Company and the Report of Independent Registered Public Accounting Firm as set forth in Part II, Item 8 of this Annual Report: 2. Financial Statement Schedule: Financial Statement Schedule II – Valuation and Qualifying Accounts is included in this Annual Report on page 84. All other schedules are not required under the related instructions or are not applicable. Exhibits: See Index of Exhibits below for a listing of all exhibits to this Annual Report.
(b) Exhibits identified in parentheses below, on file with the SEC, are incorporated herein by reference as exhibits hereto. | | | | | | | | |
Reference
Number per Item
601 of
Regulation S-K | | Description |
| | |
| | |
| | |
| | |
| | |
| | |
| | |
| | |
| | |
| | |
| | |
| | |
| | | | | | | | |
| | |
| | |
| | |
| | |
| | |
| | |
| | |
| | |
| | |
| | |
| | |
| | |
| | |
| | |
| | |
| | |
| | |
| | |
| 101.INS | | Inline XBRL Instance Document – the instance document does not appear in the Interactive Data File because XBRL tags are embedded within the Inline XBRL document. |
| | |
| 101.SCH | | Inline XBRL Taxonomy Extension Schema Document |
| | |
| 101.CAL | | Inline XBRL Taxonomy Extension Calculation Linkbase Document |
| | |
| 101.DEF | | Inline XBRL Taxonomy Extension Definition Linkbase Document |
| | |
| 101.LAB | | Inline XBRL Taxonomy Extension Label Linkbase Document |
| | |
| 101.PRE | | Inline XBRL Taxonomy Extension Presentation Linkbase Document |
| | |
| 104 | | Cover page Interactive Data File (formatted as Inline XBRL and contained in Exhibit 101). |
| | | | | |
| * | Management contracts or compensatory plans, contracts or arrangements. |
| ** | Schedules have been omitted pursuant to Item 601(a)(5) of Regulation S-K. The Company hereby undertakes to furnish supplemental copies of any of the omitted schedules upon request by the U.S. Securities and Exchange Commission. |
TERADATA CORPORATION
SCHEDULE II—VALUATION AND QUALIFYING ACCOUNTS
(In millions)
| | | | | | | | | | | | | | | | | | | | | | | | | | | | | | | | |
| Column A | | Column B | | Column C | | Column D | | Column E |
| Description | | Balance at
Beginning
of Period | | Provision/reversals
Charged
to Costs &
Expenses | | Charged
to Other
Accounts | | Deductions | | Balance
at End of
Period |
| Allowance for doubtful accounts | | | | | | | | | | |
| Year ended December 31, 2022 | | $ | 9 | | | $ | 5 | | | $ | — | | | $ | (2) | | | $ | 12 | |
| Year ended December 31, 2021 | | $ | 14 | | | $ | (1) | | | $ | — | | | $ | (4) | | | $ | 9 | |
| Year ended December 31, 2020 | | $ | 18 | | | $ | (3) | | | $ | — | | | $ | (1) | | | $ | 14 | |
| Deferred tax valuation allowance | | | | | | | | | | |
| Year ended December 31, 2022 | | $ | 58 | | | $ | 11 | | | $ | — | | | $ | — | | | $ | 69 | |
| Year ended December 31, 2021 | | $ | 51 | | | $ | 7 | | | $ | — | | | $ | — | | | $ | 58 | |
| Year ended December 31, 2020 | | $ | 45 | | | $ | 6 | | | $ | — | | | $ | — | | | $ | 51 | |
| | | | | |
| Item 16. | FORM 10-K SUMMARY |
None.
SIGNATURES
Pursuant to the requirements of Section 13 or 15 (d) of the Securities Exchange Act of 1934, the registrant has duly caused this report to be signed on its behalf by the undersigned, thereunto duly authorized. | | | | | | | | | | | | | | |
| | | | |
| | | TERADATA CORPORATION |
| | |
| Date: February 24, 2023 | | By: | | /s/ Claire Bramley |
| | | | Claire Bramley |
| | | | Chief Financial Officer |
Pursuant to the requirements of the Securities Exchange Act of 1934, this report has been signed below by the following persons on behalf of the registrant and in the capacities and on the date indicated.
| | | | | | | | | | | |
| | | |
| Signature | | Title | |
| | | |
/s/ Stephen McMillan | | President and Chief Executive Officer and Director | |
Stephen McMillan | | | |
| | | |
/s/ Claire Bramley | | Chief Financial Officer | |
Claire Bramley | | (Principal Financial and Accounting Officer) | |
| | | |
/s/ Michael P. Gianoni | | Chairman of the Board | |
Michael P. Gianoni | | | |
| | | |
/s/ Lisa R. Bacus | | Director | |
Lisa R. Bacus | | | |
| | | |
/s/ Timothy C.K. Chou | | Director | |
Timothy C.K. Chou | | | |
| | |
/s/ Daniel R. Fishback | | Director | |
Daniel R. Fishback | | | |
| | | |
/s/ Todd E. McElhatton | | Director | |
Todd E. McElhatton | | | |
| | | |
/s/ Kimberly K. Nelson | | Director | |
Kimberly K. Nelson | | | |
| | | |
/s/ Joanne B. Olsen | | Director | |
Joanne B. Olsen | | | |
| | | |
/s/ John G. Schwarz | | Director | |
John G. Schwarz | | | |
| | | |
| | |
| | | |
| | | |