UNITED STATES
SECURITIES AND EXCHANGE COMMISSION
Washington, D.C. 20549
FORM 10-K
ANNUAL REPORT UNDER SECTION 13 OR 15(d) OF THE SECURITIES EXCHANGE ACT OF 1934 | ||
For the fiscal year ended December 31, 2019
OR
TRANSITION REPORT PURSUANT TO SECTION 13 OR 15(d) OF THE SECURITIES EXCHANGE ACT OF 1934 | ||
Commission file number 0-15946
(Exact name of registrant as specified in its charter)
(State or other jurisdiction of incorporation) | (I.R.S. Employer Identification Number) | ||
(Address of principal executive offices) | (Zip Code) | ||
Registrant’s telephone number, including area code: (678 ) 281-2020
Securities registered pursuant to Section 12(b) of the Act:
Title of each class
Trading symbol (s)
Name of each exchange on which registered
Securities registered pursuant to Section 12(g) of the Act:
None
Indicate by check mark whether the registrant is a well-known seasoned issuer, as defined in Rule 405 of the Securities Act. Yes þ No o
Indicate by check mark whether the registrant is not required to file reports pursuant to Section 13 or Section 15(d) of the Act. Yes o No þ
Indicate by check mark whether the registrant (1) has filed all reports required to be filed by Section 13 or 15(d) of the Securities Exchange Act of 1934 during the preceding 12 months (or for such shorter period that the registrant was required to file such reports), and (2) has been subject to such filing requirements for the past 90 days. Yes þ No o
Indicate by check mark whether the registrant has submitted electronically every Interactive Data File required to be submitted pursuant to Rule 405 of Regulation S-T during the preceding 12 months (or for such shorter period that the registrant was required to submit such files). Yes þ No o
Indicate by check mark if disclosure of delinquent filers pursuant to Item 405 of Regulation S-K is not contained herein, and will not be contained, to the best of the registrant’s knowledge, in definitive proxy or information statements incorporated by reference in Part III of this Form 10-K or any amendment to this Form 10-K. o
Indicate by check mark whether the registrant is a large accelerated filer, an accelerated filer, a non-accelerated filer, smaller reporting company, or an emerging growth company. See the definitions of “large accelerated filer,” “accelerated filer,” “smaller reporting company,” and “emerging growth company” in Rule 12b-2 of the Exchange Act. (Check one):
þ | Accelerated filer | o | Non-accelerated filer | o | Smaller reporting company | ||
(Do not check if a smaller reporting company) | |||||||
Emerging growth company | |||||||
Indicate by check mark whether the registrant is a shell company (as defined in Rule 12b-2 of the Exchange Act).
Yes ☐ No þ
If an emerging growth company, indicate by check mark if the registrant has elected not to use the extended transition period for complying with any new or revised financial accounting standards provided pursuant to Section 13(a) of the Exchange Act.
As of February 28, 2020, the number of shares of Common Stock outstanding was 30,475,671 . As of June 30, 2019 (the last business day of the registrant’s most recently completed second fiscal quarter), the aggregate market value of Common Stock held by non-affiliates, based upon the last sale price of the shares as reported on the Nasdaq Global Capital Market on such date, was approximately $1.16 billion (for this purpose, the Company has assumed that directors, executive officers are affiliates, as well as holders of more than 10% of the Company’s common stock that have indicated some intent to exercise control).
EBIX, INC.
INDEX TO ANNUAL REPORT ON FORM 10-K
Page | |
Reference | |
Exhibit 101 | |
SAFE HARBOR REGARDING FORWARD-LOOKING STATEMENTS
As used herein, the terms “Ebix,” “the Company,” “we,” “our” and “us” refer to Ebix, Inc., a Delaware corporation, and its consolidated subsidiaries as a combined entity, except where it is clear that the terms mean only Ebix, Inc.
This Form 10-K contains forward-looking statements and information within the “safe harbor” provisions of the Private Securities Litigation Reform Act of 1995, Section 27A of the Securities Act of 1933, and Section 21E of the Securities Exchange Act of 1934. These forward-looking statements include statements regarding future economic conditions, operational performance and financial condition, liquidity and capital resources, acceptance of the Company's products by the market, potential acquisitions and management's plans and objectives. Words such as “may,” “could,” “should,” “would,” “believe,” “expect,” “anticipate,” “estimate,” “intend,” “seek,” “plan,” “project,” “continue,” “predict,” “will,” “should,” and other words or expressions of similar meaning are intended by the Company to identify forward-looking statements, although not all forward-looking statements contain these identifying words. These statements are based on our current expectations about future events or results and information that is currently available to us, involve assumptions, risks, and uncertainties, and speak only as of the date on which such statements are made.
Our actual results may differ materially from those expressed or implied in these forward-looking statements. Factors that may cause such a difference, include, but are not limited to:
• | the willingness of independent insurance agencies to outsource their computer and other processing needs to third parties; |
• | our ability to raise additional financing to support our capital requirements; |
• | our ability to make new business acquisitions and integrate such acquired businesses into our operations; |
• | pricing and other competitive pressures and the Company's ability to gain or maintain share of sales as a result of actions by competitors and others; |
• | our ability to develop new products and respond to rapid technological changes; |
• | disruptions in internet connections and the protection of information transmitted over the internet; |
• | changes in estimates in critical accounting judgments; |
• | the effective protection of our intellectual property; |
• | changes in or failure to comply with laws and regulations, including accounting standards, |
• | taxation requirements (including tax rate changes, new tax laws and revised tax interpretations) in domestic or foreign jurisdictions; |
• | exchange rate fluctuations and other risks associated with investments and operations in foreign countries (particularly in Singapore, Australia and India wherein we have significant operations); |
• | volatility in equity markets, including market disruptions and significant interest rate fluctuations, which may impede our access to, or increase the cost of, external financing; and |
• | international conflict, including terrorist acts. |
These and other risks are described in more detail in Part I Item 1A, "Risk Factors", as well as in other reports subsequently filed with the SEC.
Except as expressly required by the federal securities laws, the Company undertakes no obligation to update any such factors, or to publicly announce the results of, or changes to any of the forward-looking statements contained herein, to reflect future events, developments or changed circumstances, or for any other reason.
Readers should carefully review the disclosures and the risk factors described in this and other documents we file from time to time with the SEC, including future reports on Forms 10-Q and 8-K, and any amendments thereto.
You may obtain our SEC filings at our website, www.ebix.com under the “Investor Information” section, or over the Internet at the SEC's web site, www.sec.gov.
PART I
Item 1. BUSINESS
Company Overview
Ebix, Inc. (“Ebix”, the “Company,” “we” or “our”), a Delaware corporation, was founded in 1976 as Delphi Systems, Inc., a California corporation. In December 2003, the Company changed its name to Ebix, Inc. The Company is listed on the Nasdaq Global Market.
The Company has its worldwide headquarters in Johns Creek, Georgia, and also has domestic and international operations spread across over 50 offices. The countries in which the Company has operating facilities and offices, include, among others, Australia, Brazil, Canada, India, Indonesia, New Zealand, Philippines, Singapore, the United Kingdom, United Arab of Emirates and United States of America. In these locations, Ebix employs skilled technology and business professionals who provide products, services, support and consultancy services to thousands of customers in approximately 70 countries across six continents.
The Company’s technology vision is to focus on convergence of all insurance and financial exchange channels, processes and entities for seamless data flow. The Company does this by designing products and services that are pioneering and at least a few years ahead of its competition. The Company's products feature fully customizable and scalable on-demand software designed to streamline the way insurance professionals manage distribution, marketing, sales, customer service, and accounting activities.
Ebix's goal is to be a leading powerhouse of insurance and financial transactions in the world. The Company strives to work collaboratively with clients to develop innovative technology strategies and solutions that address specific business challenges and requirements. Ebix combines the newest technologies with its capabilities in consulting, systems design and integration, IT and business process outsourcing, applications software, and web and application hosting to meet the individual needs of organizations. In the Insurance sector, the Company’s main focus is to develop and deploy a wide variety of insurance and reinsurance exchanges on an on-demand basis, while also providing Software-as-a-Service ("SaaS") enterprise solutions in the area of customer relationship management ("CRM"), front-end & back-end systems, outsourced administrative and risk compliance.
The Company’s E-learning solutions are provided to schools across the breadth of India with the goal of educating students in a classroom through high quality 2-D and 3-D animation and multimedia learning.
The Company’s EbixCash Exchanges (“EbixCash”) division has developed into an integral and leading source of our revenue and profits. With a "Phygital” strategy that combines 320,000 physical distribution outlets in many Associations of Southeast Asian Nations (“ASEAN”) countries, to an Omni-channel online digital platform, the Company’s EbixCash Financial exchange portfolio encompasses leadership in areas of domestic & international money remittance, foreign exchange (Forex), travel, pre-paid & gift cards, utility payments, software solutions for lending and wealth management etc. in India and other markets. EbixCash’s Forex operations have emerged as a leader in India’s airport Foreign Exchange business with operations in 26 international airports including Delhi, Mumbai, Hyderabad, Chennai and Kolkata, conducting over $4.8 billion in gross transaction value per year. EbixCash’s inward remittance business in India conducts approximately $5 billion gross annual remittance business, confirming its undisputed leadership position in India. EbixCash, through its travel portfolio of Via and Mercury, is also one of Southeast Asia’s leading travel exchanges with over 2,200+ employees, 212,000+ agent network, 25 branches and over 9,800 corporate clients; processing an estimated $2.5 billion in gross merchandise value per year.
During the year ended December 31, 2019, approximately 88% of Ebix revenues came from EbixCash and Insurance Exchanges. International revenue accounted for 68.6% and 60.4% of the Company’s total revenue for the twelve months ended December 31, 2019 and 2018, respectively.
Acquisition & Integration Strategy
While not entirely critical to the our future profitability or liquidity, the Company views acquisitions as an integral part of the its growth strategy, and an efficient way to further expand its reach, and an effective utilization of the operating cash generated from the Company's business. We are strategic and very selective when making acquisitions. We look at making complimentary accretive acquisitions as and when the Company has sufficient liquidity, stable cash flows, and access to financing at attractive interest rates to do so, if necessary.
The Company seeks to acquire businesses that complement Ebix's existing products and services. Any acquisition made by Ebix typically will fall into one of two different categories: one, wherein the acquired company has products and/or services
2
that are competitive to our existing products and services; and two, wherein the acquired company's products and services are a complement to and an extension of our existing products and services.
In cases where an acquired company's products and services are competitive to our existing products and services, upon acquisition, the Company immediately strives towards the goal of providing a single product or service in the functional area, with a common code base around the world rather than having multiple products addressing the same need. In each case, the Company immediately works towards assimilating the best of breed functionality on a common architecture approach, to provide a single product or service to our end customers. The Company's goal remains to provide an easy to use solution for our customer base, while ensuring that any product or service integrates seamlessly with other existing or outside functionalities. Regardless, of whether the acquired company's product/service is retired, or the existing product/service is retired, the Company is focused on maximizing operational efficiency for our business while creating new cutting-edge products and services that can replace either existing or acquired product or service offerings in order to make future product sales and maintenance more efficient.
Once an acquisition is consummated, the infrastructure, personnel resources, sales, product management, development, and other common functions are integrated with our existing operations to ensure that efficiencies are maximized and redundancies eliminated. We generally do not maintain separate sales, development, product management, implementation or quality control functions following the closing of any acquisition, in order to ensure that the integration is efficient across all fronts. The Company integrates and, where appropriate, centralizes certain key functions such as product development, information technology, marketing, sales, finance, administration, and quality assurance immediately after an acquisition, to ensure that the Company can maximize on cost efficiencies. Simultaneously with the integration of any acquired company, the Company's resources and infrastructure are leveraged to work across multiple functions, products and services, making it neither practical nor feasible to precisely separately track and disclose the specific earnings impact from the business combinations we have executed after they have been acquired. Consequently, the concept of “acquisitive growth” versus “organic growth” becomes obscured given the dynamics and underlying operating principals of Ebix's acquisition, integration, and growth strategy. This tactic is a key part of our business strategy that facilitates high levels of efficiency, operating income margins and consistent end-to-end vision for our business, and differentiates the Company from our competitors. Our plan is to make niche acquisitions in the insurance, e-learning, healthcare and international finance exchange sector, integrate them seamlessly into the Company and make them efficient by implementing Ebix's standardized processes, with the goal of increasing operating profits and cash flows for the Company.
In many of the acquisitions made by the Company, there are contingent consideration terms associated with the achievement of certain designated revenue targets for the acquired Company. This structure allows us to follow through with our integration strategy, while enabling the acquired company to be eligible for a revenue based contingent purchase consideration. Accordingly, we are able to maximize operational productivity while allowing the principals of the acquired company access to a greater opportunity for a contingent reward.
The Company's integration strategies are targeted at improving the efficiency of our business, centralizing key functions, exercising better control over our operations, and providing consistent technology and product vision across all functions, entities and products. This is a key part of our business philosophy designed to enable Ebix to operate at a high level of efficiency and facilitate a consistent end-to-end vision for the industry.
Recent Strategic Business Acquisitions
During the year ended December 31, 2019 the Company completed three business acquisitions, as follows:
Wallstreet Canada - Effective August 23, 2019, Ebix acquired Canada based Wall Street Finance (Canada) Ltd. ("Wallstreet Canada"), a foreign exchange and outward remittance service provider for approximately $2.1 million of upfront consideration inclusive of net acquired working capital. The valuation and purchase price allocation remains preliminary and will be finalized as soon as practicable but in no event longer than one year from the effective date of this transaction.
Essel Forex - Effective January 1, 2019, Ebix acquired the assets of India based Essel Forex Limited ("Essel Forex"), for approximately $8.7 million, plus possible future contingent earn-out payments of up to $721 thousand based on earned revenues. Ebix funded the entire transaction in cash, using its internal cash reserves. Essel Forex is a large provider of foreign exchange services in India with a wide spectrum of related products including sales of all major currencies, travelers’ checks, demand drafts, remittances, money transfers and prepaid cards primarily for corporate clients.
Zillious - Effective January 1, 2019, Ebix acquired an 80% controlling stake in India based Zillious Solutions Private Limited ("Zillious") for $10.1 million plus possible future contingent earn-out payments of up to $2.2 million, based on agreed milestones in the acquisition agreement. Zillious is an on-demand SaaS travel technology solution in the corporate travel segment in India.
3
During the year ended December 31, 2018, the Company completed thirteen business acquisitions in India, as follows:
Weizmann - Effective December 1, 2018, Ebix entered into an agreement to acquire 74.84% controlling stake in India based Weizmann Forex Limited ("Weizmann") for $63.1 million. Ebix also made a 90-day time bound public offer to acquire the remaining 25.16% publicly-held Weizmann Forex shares for approximately $21.1 million to public shareholders. The $77.35 million reported in the consolidated statement of cash flows used for investing activities includes a decrease in previously reported cash acquired of $1.5 million and $12.7 million for an additional 15.1% of the publicly-held Weizmann Forex shares during 2019. As of December 31, 2019, Ebix has approximately 89.94% of the controlling stake in India based Weizmann.
Pearl - Effective December 1, 2018, Ebix acquired the assets of India based Pearl International Tours and Travels Limited ("Pearl"), a provider of a comprehensive range of B2B and B2C travel services, under the brand name ‘Sastiticket’, ranging from domestic and international ticketing, incentives travel, leisure products, luxury holidays, and travel documentation for $3.4 million and has been integrated with Ebix Travels’ operations, which has brought in operational synergies and certain redundancies for the acquired operations.
Lawson - Effective December 1, 2018, Ebix acquired India based Lawson Travels ("Lawson"), a B2B provider of travel services and international ticketing, for $2.7 million and has been integrated with EbixCash Travels’ operations to bring in operational synergies and wider country wide footprint.
AHA Taxis - Effective October 1, 2018, Ebix acquired a 70% stake in India based AHA Taxis ("AHA Taxis"), a platform for on-demand inter-city cabs in India for $382 thousand. Consideration of $71 thousand was paid during the fourth quarter of 2018,$214 thousand during the first quarter of 2019, and $72 thousand remains to be paid. AHA focuses its attention on Corporate and Consumer inter-city travel primarily with a network of thousands of registered AHA Taxis.
Routier - Effective October 1, 2018, Ebix acquired a 67% stake in India based Routier ("Routier"), a marketplace for trucking logistics for $413 thousand.
Business Travels - Effective October 1, 2018, Ebix acquired the assets of India based Business Travels Pvt. Ltd ("Business Travels") for $1.1 million and same has been integrated with Ebix Travels’ operations to expand the wholesale travel and consolidation business. Consideration of $414 thousand was paid during the fourth quarter of 2018 and $689 thousand during the first quarter of 2019.
Miles - Effective August 1, 2018, Ebix entered into an agreement to acquire India based Miles Software ("Miles"), a provider of on-demand software on wealth and asset management to banks, asset managers and wealth management firms, for approximately $18.3 million, plus possible future contingent earn-out payments of up to $8.3 million based on earned revenues over the subsequent twenty-four month period following the effective date of the acquisition.
Leisure - Effective July 1, 2018, Ebix entered into an agreement to acquire India based Leisure Corp ("Leisure") for approximately $1.6 million, with the goal of creating a new travel division to focus on a niche segment of the travel market.
Mercury - Effective July 1, 2018, Ebix entered into an agreement to acquire India based Mercury Travels ("Mercury") for approximately $13.2 million, with the goal of creating a new travel division to focus on a niche segment of the travel market. Mercury’s Forex business has been integrated into EbixCash’s existing forex business.
Indus - Effective July 1, 2018, Ebix entered into an agreement to acquire India based Indus Software Technologies Pvt. Ltd. ("Indus"), a global provider of enterprise lending software solutions to financial institutions, captive auto finance and telecom companies, for approximately $22.9 million plus possible future contingent earn-out payments of up to $5.0 million based on the agreed upon revenues and EBITDA milestones achieved over the subsequent twenty-four month period following the effective date of the acquisition.
Centrum - Effective April 1, 2018, Ebix entered into an agreement to acquire India based CentrumDirect Limited ("Centrum"), a leader in India’s Foreign Exchange Operation markets for approximately $179.5 million. This acquisition was completed in June 2018. Subsequently, Centrum has been renamed as EbixCash World Money and has been tightly integrated into the EbixCash Exchange in India and abroad, with key business executives of Centrum's foreign exchange operations becoming an integral part of the combined EbixCash senior leadership.
4
Smartclass - Effective April 1, 2018, Ebix entered into an agreement to acquire a 60% stake in India based Smartclass Educational Services Private Limited ("Smartclass"), a leading e-learning Company engaged in the business of education services, development of education products, and implementation of education solutions for K-12 Schools through its E-Learning Venture. Under the terms of the agreement Ebix paid $8.6 million in cash for its stake in Smartclass.
Transcorp - Effective February 1, 2018, Ebix acquired the Money Transfer Service Scheme ("MTSS") Business of Transcorp International Limited ("Transcorp"), for upfront cash consideration in the amount of $7.25 million, of which $6.55 million was funded with cash and $700 thousand assumed in liabilities. MTSS operations of Transcorp has been consolidated with EbixCash’s MTSS operations resulting in operational synergies and certain redundancies to the combined operation.
Industry Overview
The insurance and financial industry markets have initiatives to reduce paper-based processes and facilitate improvements in the efficiency both at the back-end side and also at the consumer-end side. This evolution has involved all industry constituents and is directly impacting the manner in which various products are distributed. Management believes that both the industries will continue to experience significant change and increased efficiencies through online exchanges as reduced paper-based processes are becoming increasingly a norm across the world markets.
Products and Services
The Company reports as a single segment. The Company’s revenues are derived from three product/service groups. Presented in the table below is the breakout of our revenue streams for each of those product/service groups for the years ended December 31, 2019, 2018, and 2017:
For the Year Ended | ||||||||||||
December 31, | ||||||||||||
(In thousands) | 2019 | 2018 | 2017 | |||||||||
EbixCash Exchanges | 319,953 | 217,457 | 64,324 | |||||||||
Insurance Exchanges | 190,067 | 192,604 | 200,508 | |||||||||
Risk Compliance Solutions | 70,595 | 87,765 | 99,139 | |||||||||
Totals | $ | 580,615 | $ | 497,826 | $ | 363,971 | ||||||
Information on the geographic dispersion of the Company’s revenues and long-lived assets is furnished in Note 15 to the consolidated financial statements, included in Part II Item 8 of this Form 10-K. See Item 1A (Risk Factors) for discussion of certain risks related to our foreign operations.
The Company’s product and service strategy focuses on: (a) expansion of connectivity between all entities through its Exchange family of products in the financial, foreign currency exchange, travel, life, health, workers compensation, risk management, annuity and property and casualty ("P&C") sectors: namely through our EbixCash and EbixExchange family of products; (b) worldwide sales and support of P&C back-end insurance and broker management systems; (c) worldwide sale, customization, development, implementation and support of its P&C back-end insurance carrier system platforms; (d) risk compliance solution services, which include insurance certificate origination, certificate tracking, claims adjudication call center, consulting services and back office support; and (e) e-governance/e-learning solutions in emerging world markets. Ebix also provides software development, customization, and consulting services to a variety of entities in the insurance industry, including carriers, brokers, exchanges and standard making bodies.
Ebix’s revenue streams come from three product/service channels, as discussed in the following paragraphs. The Company derives its revenues primarily from our: financial transaction fees, software subscription and transaction fees, software license fees, risk compliance solution services fees, and professional service fees including associated fees for consulting, implementation, training, and project management provided to customers with installed systems, and applications.
Insurance Exchanges
Insurance Exchanges revenues are primarily derived from consideration paid by customers related to our SaaS platforms, related services and the licensing of software. A typical contract for our SaaS platform will also include services for setup, customization, transaction processing, maintenance, and/or hosting. Determining whether products and services are considered distinct performance obligations that should be accounted for separately may require significant judgement. Set-up
5
and customization services, related to our SaaS platforms, are not considered to be distinct from the usage fees associated with the SaaS platform and, accordingly, are accounted for as a single performance obligation. These services along with the usage or transaction fees are recognized over the contract duration which considers the significance of the upfront fees in the context of the contract and which may, therefore, exceed the initial contracted term.
Contracts generally do not contain a right of return or refund provisions. Our contracts often do contain overage fees, contingent fees, or service level penalties which are accounted for as variable consideration. Revenue accounted for as variable consideration is immaterial and is recognized using the “right to invoice” practical expedient when the invoiced amount equals the value provided to the customer.
Software-as-a-Service ("SaaS")
The Company allocates the transaction price to each distinct performance obligation using the relative stand-alone selling price. Determining the stand-alone selling price may require significant judgement. The stand-alone selling price is the price at which an entity has sold or would sell a promised good or service separately to a customer. The Company determines the stand-alone selling price based on observable price of products or services sold separately in comparable circumstances, when such observable prices are available. When standalone selling price is not directly observable, the Company estimates the stand-alone selling price using the market assessment approach by considering historical pricing and other market factors.
Software Licenses
Software license revenues attributable to a software license that is a separate performance obligation are recognized at the point in time that the customer obtains control of the license.
Subscription Services
Subscription services revenues are associated with performance obligations that are satisfied over specific time periods and primarily consist of post-contract support services. Revenue is generally recognized ratably over the contract term. Our subscription contracts are generally for an initial three-year period with subsequent one-year automatic renewals.
Transaction Fees
Transaction revenue is comprised of fees applied to the volume of transactions that are processed through our SaaS platforms. These are typically based on a per-transaction rate and are invoiced for the same period in which the transactions were processed and as the performance obligation is satisfied. The amount invoiced generally equals the value provided to the customer, and revenue is typically recognized when invoiced using the as-invoiced practical expedient.
Professional Services
Professional service revenue primarily consists of fees for setup, customization, training, or consulting. Professional service fees are generally on a time and materials basis or a fixed fee. Revenues for time and materials are recognized as such services are rendered while fixed fee revenues are recognized based on the input method driven by the expected hours to complete the project measured against the actual hours completed to date. Professional services, particularly related to SaaS platforms, may have significant dependencies on the related licensed software and may not be considered a distinct performance obligation.
Risk Compliance Services ("RCS")
RCS revenues consist of two revenue streams-Certificates of Insurance (COI) and Consulting Services. COI revenues are derived from consideration paid by customers for the creation and tracking of certificates of insurance. These are transactional-based revenues. Consulting Services revenues are driven by distinct consulting service engagements rendered to customers for which revenues are recognized using the output method on a time and material basis as the services are performed.
COI Creation and Tracking
The Company provides services to issue and track certificates of insurance in the United States and Australian markets. Revenue is derived from transaction fees for each certificate issued or tracked. The Company recognizes revenue at the issuance of each certificate or over the period the certificate is being tracked.
Consulting Services
6
The Company provides consulting services to clients around the world for project management and development. Consulting services fees are generally on a time and materials basis or a fixed fee. Revenues for time and materials are recognized using an output method as the services are rendered while fixed fee revenues are recognized based on the input method driven by the expected hours to complete the project measured against the actual hours completed to date.
EbixCash Exchanges ("EbixCash")
EbixCash revenues are primarily derived from consideration paid by customers for financial transaction services, including services like transferring or exchanging money. The significant majority of EbixCash revenue is for a single performance obligation and is recognized at a point in time. These revenues vary by transaction based upon channel, send and receive locations, the principal amount sent, whether the money transfer involves different send and receive currencies, and speed of service, as applicable.
EbixCash also offers several other services, including payment services and ticketing and travel services for which revenue is impacted by varying factors. EbixCash acts as the principal in most transactions and reports revenue on a gross basis, as EbixCash controls the service at all times prior to transfer to the customer, is primarily responsible for fulfilling the customer contracts, has the risk of loss, and has the ability to establish transaction prices.
The main services from which EbixCash derives revenue are as follow:
EbixCash Travel Exchanges
EbixCash Travel revenues are primarily derived from commissions and transaction fees received from various travel providers and international exchanges involved in the sale of travel to the consumer. EbixCash Travel revenue is for a single performance obligation and is recognized at a point in time. Travel revenues include reservation commissions, segment fees from global travel exchange providers, and transaction net revenues (i.e., the amount charged to travelers less the amount owed to travel service providers) in connection with our reservation services; ancillary fees, including travel insurance-related revenues and certain reservation booking fees; and credit card processing rebates and customer processing fees. EbixCash Travel services include the sale of hotel rooms, airline tickets, bus tickets and train tickets. EbixCash’s Travel revenue is also derived from ticket sales, wherein the commissions payable to EbixCash Travel, along with any transaction fees paid by travel providers and travel exchanges, is recognized as revenue after completion of the service. The transaction price on such services is agreed upon at the time of the purchase.
EbixCash Travel revenue for the corporate MICE (Meetings, Incentives, Conferences, and Exhibitions) packages is recognized at full purchase value at the completion of the obligation with the corresponding costs recorded under direct expenses. For MICE revenues, EbixCash Travel acts as the principal in transactions, and accordingly reports revenue on a gross basis. EbixCash Travel controls the service at all times prior to transfer to the customer, is responsible for fulfilling the customer contracts, has the risk of loss, and has the ability to establish transaction prices.
EbixCash Money Transfer
For the EbixCash money transfer business, EbixCash has one performance obligation whereupon the customer engages EbixCash to perform one integrated service. This typically occurs instantaneously when the beneficiary entitled to receive the money transferred by the sender visits the EbixCash outlet and collects the money. Accordingly, EbixCash recognizes revenue upon completion of the following: 1) the customer’s acknowledgment of EbixCash’s terms and conditions and the receipt of payment information, 2) the money transfer has been processed, 3) the customer has received a unique transaction identification number, and 4) funds are available to be picked up by the beneficiary. The transaction price is comprised of a transaction fee and the difference between the exchange rate set by EbixCash to the customer and the rate available in the wholesale foreign exchange market, as applicable, both of which are readily determinable at the time the transaction is initiated
Foreign Exchange and Outward Remittance Services
For EbixCash’s foreign exchange and payment services, customers agree to terms and conditions for all transactions, either at the time of initiating a transaction or signing a contract with EbixCash to provide payment services on the customer’s behalf. In the majority of EbixCash’s foreign exchange and payment services, EbixCash makes payments to the recipient to satisfy its performance obligation to the customer, and therefore, EbixCash recognizes revenue on foreign exchange and payment when this performance obligation has been fulfilled.
Consumer Payment Services
7
EbixCash offers several different bill payment services that vary by considerations such as: 1) who pays the fee to EbixCash (consumer or biller), 2) whether the service is offered to all potential consumers, or only to those for which EbixCash has a relationship with the biller, and 3) whether the service utilizes a physical agent network offered for consumers’ convenience, among other factors. The determination of which party is EbixCash’s customer for revenue recognition purposes is based on these considerations for each of EbixCash’s bill payment services. For all transactions, EbixCash’s customers agree to EbixCash’s terms and conditions, either at the time of initiating a transaction (where the consumer is determined to be the customer for revenue recognition purposes) or upon signing a contract with EbixCash to provide services on the biller’s behalf (where the biller is determined to be the customer for revenue recognition purposes). As with consumer money transfers, customers engage EbixCash to perform one integrated service-collect money from the consumer and process the bill payment transaction, thereby providing the billers real-time or near real-time information regarding their customers’ payments and simplifying the billers’ collection efforts. EbixCash’s revenues from bill payment services are generated from contracts to process transactions at any time during the duration of the contract. The transaction price on bill payment services is contractual and determinable. Certain biller agreements may include per-transaction or fixed periodic rebates, which EbixCash records as a reduction to revenue.
Gift Cards
EbixCash resells gift cards to consumers that can be later redeemed at various merchants. Gift cards are recorded as inventory until sold to the consumer. Gift card revenue is recognized at full purchase value at the time of sale with the corresponding cost of vouchers recorded as under direct expenses.
EbixCash Technology Services
EbixCash also offers on-demand technology to various providers in the area of lending, wealth & asset management, travel and logistics across the world.
Product Development
The Company focuses on maintaining high quality product development standards. Product development activities include research and the development of platform and/or client specific software enhancements such as adding functionality, improving usefulness, increasing responsiveness, adapting to newer software and hardware technologies, or developing and maintaining the Company’s websites.
The Company has spent $45.3 million, $39.1 million, and $33.9 million during the years ended December 31, 2019, 2018 and 2017, respectively, on product development initiatives. The Company’s product development efforts are focused on the continued enhancement and redesign of the EbixCash, Insurance Exchange, broker systems, carrier systems, and RCS product and service lines to keep our technology at the cutting edge in the markets we compete. Development efforts also provide new technologies for insurance carriers, brokers and agents, and the redesign, coding and development of new services for international and domestic markets.
Competition
We believe Ebix is in a unique position of being the only company worldwide in insurance and financial software markets that provides services in all three of our above listed revenue channels. Conversely, though, this also means that in each of these areas Ebix has different competitors. In fact, in most of these areas Ebix has a different competitor locally in each region in which it operates. In our Exchange and EbixCash operations, Ebix often has a different competitor on each line of exchange in each country but the scale of these entities is very limited.
The Company has centralized worldwide product development, intellectual property rights development and software and system development operations in Dubai, Singapore, and India which provides it a competitive edge. With its strong focus on quality, our Indian operations deliver cutting edge solutions for our customers across the world. India is rich in technical skills and the cost structure is significantly lower as compared to the United States. Ebix continues to expand its India operations as a learning center of excellence with a strong focus on hiring skilled professionals with expertise in insurance systems and software applications. This focus on building this knowledge base combined with the ability to hire more professional resources in India's lower cost structure has enabled Ebix to consistently protect its knowledge base and to deliver projects in a cost-effective fashion. The following is a closer and more detailed discussion of our competition in each of these three main channels.
Insurance Exchanges
8
Ebix operates a number of insurance exchanges and the competition for each of those exchanges varies within each of the regions in which Ebix operates.
Life Insurance Exchange: Ebix operates a straight through processing end-to-end Life Exchange service that has three life insurance exchanges in the United States, WinFlex, TPP, and LifeSpeed. WinFlex is an exchange for pre-sale life insurance illustrations between brokers and carriers, TPP is an underwriting and highly customized electronic application platform for Life insurance, while LifeSpeed is an order entry platform for life insurance. Each of these exchanges is presently deployed in the United States and the Company is also continuing to deploy them in other parts of the world. Ebix has two main competitors in the life exchange area: iPipeline and Insurance Technologies. Ebix differentiates itself by virtue of having an end-to-end solution in the market as with all of its exchanges being interfaced with other broker systems and customer relationship management ("CRM") services such as SmartOffice. We believe Ebix’s exchanges also have the largest aggregation of life insurance brokers and carriers transacting business in the United States.
Annuity Exchange: Ebix operates a straight through processing end-to-end Annuity Exchange service that has three life insurance exchanges in the United States - namely AnnuityNet, AMP and AN4. These exchanges are platforms for annuity transactions between brokers, carriers, broker general agents (“BGAs”), and other entities involved in annuity transactions. These exchanges are mainly deployed in the United States, however, while the Company endeavors to deploy it in other parts of the world, such as Latin America and Australia. Ebix has deployed its AN4 service that was fully developed internally by Ebix, and is highly scalable, customizable and can be delivered over the cloud. Ebix has one main competitor in the annuity exchange area, iPipeline. Again, Ebix differentiates itself from this competitor by virtue of having an end-to-end solution offering in the market with its exchanges being interfaced with broker systems and customer relationship management (CRM) services such as SmartOffice. Ebix exchanges also benefit from transacting the largest amounts of premiums in annuity business on any single exchange in the United States.
SmartOffice: Ebix’s customer relationship management exchange, SmartOffice is designed to address the specific needs of insurance companies, general agents, banks, financial advisors and investment dealers. Smart Office is tightly integrated into EbixExchange Life, Health, P&C and Annuity exchanges as a means to make end-to-end enterprise-wide information exchange seamless for our clients. This insurance industry specific domain expertise gives Ebix a competitive advantage over our competitors in the CRM area such as Salesforce.com, iPipeline, and Redtail.
Employee Benefits: Ebix currently provides employee benefit and health insurance exchange services using four platforms namely Facts, LuminX, HealthConnect and EbixEnterprise. EbixEnterprise, which we built from the ground up, is the most recent Enterprise Health Exchange being deployed by Ebix across all 50 states. Collectively, these platforms service approximately nine million lives and produce hundreds of thousands of health insurance quotes annually. These platforms are sold to health carriers and third party administrators. These platforms provide the full range of services such as employee enrollment, claims adjudication, accounting, employee benefits administration accounting and compliance. The HealthConnect insurance quoting portals service the individual and small group marketplace. Ebix has a number of competitors of varying sizes in this area. Trizetto is currently the largest employee benefits software player in the market in the US while there are other smaller size competitors, such as BenefitFocus and Ultimate Software.
A.D.A.M. Health Solutions: Ebix provides multimedia health content, training, patient education, and continuing education that targets large diversified websites, doctors, consumer health portals, country governments, hospitals, healthcare, biomedical, medical device, pharmaceutical, and education organizations. A.D.A.M.’s competitors are a variety of health content companies such as Healthwise, Staywell, Elsevier and Santovia who are primarily focused on the US markets. A.D.A.M. content is available in English and Spanish as well as other languages in Asia, Europe, the Middle East and South America.
EbixCash
With a "Phygital” strategy that combines 320,000 physical distribution outlets in many Associations of Southeast Asian Nations (“ASEAN”) countries, to an Omni-channel online digital platform, the Company’s EbixCash Financial exchange portfolio encompasses leadership in areas of domestic & international money remittance, foreign exchange ("Forex"), travel, pre-paid & gift cards, utility payments, lending, wealth management etc. in India and other markets. EbixCash’s Forex operations have emerged as a leader in India’s airport Foreign Exchange business with operations in 32 international airports including Delhi, Mumbai, Bangalore, Hyderabad, Chennai and Kolkata, conducting over $4.8 billion in gross transaction value per year. EbixCash’s inward remittance business in India conducts approx. $5 billion gross annual remittance business, confirming its undisputed leadership position in India. EbixCash, through its travel portfolio of Via and Mercury, is also one of Southeast Asia’s leading travel exchanges with over 2,200 employees, a 212,450 agent network, 25 branches and over 9,800 corporate clients; processing an estimated $2.5 billion in gross merchandise value per year.
9
EbixCash Forex (EbixCash World Money) - EbixCash’s Forex operations have emerged as a dominant leader in India’s Foreign Exchange business with operations in 29 international airports, 12 ports, hundreds of corporates, Hotels, DFS, temples, educational institutes etc.
EbixCash World Money Limited, the foreign exchange business is now the largest non - bank foreign exchange money in India in all segments of business such as retail travelers including retail, corporate and bank notes business. The company holds more than 25% market share in student segment (part of retail) wherein every fourth student's overseas education is processed by EbixCash World Money. EbixCash World Money is largest non -bank corporate foreign exchange provider in the country with more than 2200 companies. Competition is mostly fragmented. It is comprised of banks such as ICICI Bank, HDFC Bank as bank entities along with money exchange companies such as Thomas Cook in all the segments of business retail, corporate and bank notes.
With the largest currency exchange presence in international airports in India, EbixCash brands captures 95% brand recognition to all the passenger flowing in and out of the country. Currently, EbixCash is the single largest money exchange operator at airports in the India. EbixCash World Money is the largest bank note aggregator amongst the non -banks with dealing in 80 different currencies, highest by any company in the business segment.
EbixCash inward remittance business holds more than 70% market share with being the largest network for Western Union across the globe while being an exclusive partner to MoneyGram for India business. The other competitors in the segment, India Post, Supreme Securities, and Muthoot Forex each having less than ten percent market share. EbixCash is the largest principal agent for Money transfer operators such as Western Union, Moneygram, Ria, Transfast through its distribution network of 320,000 agents.
EbixCash Travel & Holidays: EbixCash Travel and Holidays is a 360 degree holiday and travel solutions enterprise with a holistic focus on delivering exceptional experience in all genres like holiday, travel, Airline, Luxury Train Travel/holidays, Buses, Cabs, MICE, sporting events, and others.
For the travel industry in India the last few years have been, in a sense, revolution waiting to happen. Empirical evidence clearly categorizes travel business enterprises in the regional and national domain focused on either a channel, a genre, a product or a demography combined with or without allied products such as foreign exchange & insurance. MakeMytrip, a relatively new entrant in the pan India holidays space, compared to Thomas Cook & SOTC has consistently focused on online push for holidays whereas the latter players have worked on investing to strengthen their offline presence and penetration. Thomas Cook has been very active as a leading Holiday player combined with Forex services. SOTC has also been active in Holidays. Most other players are offering Holidays in different regions or genres. The scale of these entities is very limited.
Risk Compliance Services (RCS)
Ebix’s focus in this channel pertains to business process outsourcing services that include providing domain intensive project management, time and material based system consulting services to clients across the world, and claims adjudication/settlement services, in addition to the creation and tracking of certificates of insurance issued in the United States and Australian markets. Further, the RCS Channel also consists of Broker and Carrier P&C systems.
Ebix's RCS channel focuses on helping its clients outsource any specific service or manpower to the Company on an onsite or offshore basis. Ebix's RCS certificate outsourcing business services are enabled by the Company’s SaaS-based proprietary software. Ebix’s RCS service offerings currently cater to a large number of Fortune 500 companies in the United States. Ebix’s RCS service offering in the insurance certificate issuance area has one main competitor in the United States, namely Applied Systems. Due to the highly fragmented market, the Ebix RCS service offering in the insurance certificate tracking area also has a number of smaller competitors such as Datamonitor, CMS, and Exigis.
In the Carrier P&C Systems, Ebix has two carrier system offerings for P&C carriers, Ebix-Advantage and Ebix Advantage Web. Ebix-Advantage is targeted at small, medium and large P&C carriers in the United States that operate in the personal, commercial and specialty line areas of insurance. Ebix AdvantageWeb is designed for the international markets and is targeted at the small, medium and large P&C carriers in the international markets that operate in the personal, commercial and specialty line areas of insurance. Ebix-AdvantageWeb is designed to be multi-currency and multilingual and is deployed in Brazil, the United Kingdom and the United States. Competition to both these products comes from large companies, such as CSC, Guidewire, Xchanging, Accenture and specialty medical malpractice players like Delphi.
Ebix operates P&C exchanges in Australia, New Zealand, the United Kingdom, and the United States. All of these exchanges are targeted to the areas of personal and commercial lines, and facilitate the exchange of insurance data between brokers and insurance carriers. Ebix continues to deploy these exchanges in the United States, Asia, Europe, Latin America, and Africa.
10
There is presently little competition in the P&C exchange area in Australia and New Zealand. Our PPL insurance underwriting exchange platform is deployed in London. Our competitive differentiation exists by virtue of having an end-to-end solution offering in the market allowing our exchanges to be interfaced with multiple broker systems.
To cater to broker P&C Systems, Ebix has three broker system offerings worldwide: eGlobal, WinBeat and EbixASP. The competition for these broker systems varies within each of the regions in which Ebix provides such products and services.
eGlobal is sold throughout the world. The product is multilingual and multi-currency and is available in a number of languages such as English, Chinese, Japanese, French, Portuguese, and Spanish. eGlobal is targeted to the medium and large P&C brokers around the world. eGlobal competition tends to be different in each country with no single competitor having a global offering. eGlobal competes with home grown systems and regional players in each country. Its uniqueness comes from the fact that the product is both multilingual and multi-currency yet still has a common code base around the world with features that are easily activated and deactivated.
WinBeat is a back-end broker system that is currently sold in Australia and New Zealand. It is targeted at small P&C brokers in these countries. The product at present is available only in English and can be deployed in a few hours with minimal training. WinBeat’s competition in Australia and New Zealand comes mainly from local vendors such as Lumley and SSP. Ebix intends to deploy WinBeat in a number of emerging insurance markets such as India and China.
Between eGlobal and WinBeat, Ebix's broker systems customer base in Australia spans 632 of the 790 P&C brokers in Australia giving it 80% of the broker systems customer base in this country.
EbixASP is Ebix’s P&C broker systems offering for the United States markets. The service is designed around the ACORD insurance standards used in the United States. EbixASP has two main competitors in the United States, specifically Vertafore and Applied Systems.
Intellectual Property
Ebix seeks protection under federal, state and foreign laws for strategic or financially important intellectual property developed in connection with our business. We regard our software as proprietary while adhering to open architecture industry standards and attempt to protect it with copyrights, trade secret laws and restrictions on the disclosure and transferring of title. Certain intellectual property, where appropriate, is protected by contracts, licenses, registrations, or other protections. Despite these precautions, it may be possible for third parties to copy aspects of the Company’s products or, without authorization, to obtain and use information which the Company regards as trade secrets.
Employees
As of December 31, 2019, the Company had 7,975 employees worldwide and is presented in the table below. None of the Company’s employees are presently covered by a collective bargaining agreement. Management considers the Company's relations with its employees to generally be good.
Number of Employees | |||
India | 6,478 | ||
United States | 572 | ||
Latin America | 478 | ||
Philippines | 170 | ||
Australia | 97 | ||
Indonesia | 80 | ||
Europe | 45 | ||
Singapore | 18 | ||
Canada | 13 | ||
United Arab Emirates | 14 | ||
New Zealand | 10 | ||
7,975 | |||
11
Information About Executive Officers
Following are the persons serving as our executive officers as of February 28, 2020, together with their ages, positions and brief summaries of their business experience:
Name | Age | Position | Officer Since | |||
Robin Raina | 53 | Chairman, President, and Chief Executive Officer | 1998 | |||
Robert F. Kerris | 67 | Chief Financial Officer | 2007 | |||
Graham Prior | 63 | Corporate Executive Vice President International Business & Intellectual Property | 2012 | |||
Leon d'Apice | 63 | Corporate Executive Vice President & Managing Director - Ebix Australia Group | 2012 | |||
James Senge Sr. | 59 | Senior Vice President EbixHealth | 2012 | |||
There are no family relationships among our executive officers, nor are there any arrangements or understandings between any of those officers and any other persons pursuant to which they were selected as officers.
ROBIN RAINA, 53, has been Ebix’s CEO since September 1999. He has been a Director at Ebix since 2000 and Chairman of the Board at Ebix since May 2002. Mr. Raina joined Ebix, Inc. in October 1997 as our Vice President—Professional Services and was promoted to Senior Vice President—Sales and Marketing in February 1998. Mr. Raina was promoted to Executive Vice President, Chief Operating Officer in December 1998. Mr. Raina was appointed President effective August 2, 1999, Chief Executive Officer effective September 23, 1999, and Chairman in May 2002. Mr. Raina holds an industrial engineering degree from Thapar University in Punjab, India.
ROBERT F. KERRIS, 67, serves as the Company’s Executive Vice President & Chief Financial Officer, and Corporate Secretary. Mr. Kerris rejoined the Company as Chief Financial Officer on September 23, 2019. He previously served in the same position with the Company from October 2007 until January 2017. He served as the Ebix’s Executive Vice President-Corporate Officer of Mergers & Acquisitions and Special Projects from January 2017 until March 2017. He rejoined the Company after having been the Chief Financial Officer at Dekra North America from March 2017 to April 2018. During the period from May 2018 through August 2019, Mr. Kerris worked in various fractional senior financial executive roles as a contracted consultant for clients of ITB Partners and Robert Half Management Resources. Previously before joining the Company, Mr. Kerris was Chief Financial Officer at Aelera Corporation from May 2006 to October 2007, Financial Vice President at Equifax, Inc. from November 2003 to April 2006, Corporate Controller at Interland, Inc. from September 2002 to October 2003, and held senior financial management positions at AT&T, BellSouth, and Northern Telecom. Mr. Kerris is an actively licensed certified public accountant and holds an accounting and economics degree from North Carolina State University where he graduated with honors.
GRAHAM PRIOR, 63, was made an executive officer of the Company in 2012. He serves as Corporate Executive Vice President International Business & Intellectual Property. Mr. Prior has been employed by Ebix since 1996 when the Company acquired Complete Broking Systems Ltd for which Mr. Prior was a part owner. Mr. Prior has been working within the insurance technology industry since 1990 and is currently responsible for the Company’s international operations in Singapore, New Zealand, Australia, Europe, Africa and Asia. Mr. Prior is also responsible for the Company’s worldwide product development initiatives.
LEON d’APICE, 63, was made an executive officer of the Company in 2012 He serves as the Company’s Corporate Executive Vice President and Managing Director – Ebix Australia Group. Mr. d’Apice, has been employed with Ebix since 1996 when the Company acquired Complete Broking Systems Ltd for which Mr. d’Apice was also a part owner. Mr. d’Apice has been in the information technology field since 1977 and is currently responsible for all of the operations of Ebix’s Australia business units.
12
JAMES SENGE, SR., 59, was made an executive officer of the Company in 2012. He serves as the Company’s Senior Vice President EbixHealth. Mr. Senge has been employed with Ebix since 2008 when the Company acquired Acclamation Systems, Inc. ("Acclamation"). Mr. Senge had been employed by Acclamation since 1979. During his over 32 years with Acclamation/Ebix Mr. Senge has been involved with all facets of the EbixHealth division, including being responsible for the strategic direction and day to day operations of the divisions. Mr. Senge’s focus is on expanding the Company’s reach into the on-demand, end to end technology solutions for the health insurance and healthcare markets. Mr. Senge works from Ebix’s Pittsburgh, Pennsylvania office.
General
Our principal executive offices are located at 1 Ebix Way Johns Creek, Georgia 30097, and our telephone number is (678) 281-2020.
Our official web site address is http://www.ebix.com. We make available, free of charge, at http://www.ebix.com, the charters for the committees of our board of directors, our code of conduct and ethics, and, as soon as practicable after we file them with the SEC, our annual reports on Form 10-K, our quarterly reports on Form 10-Q and current reports on Form 8-K. Any waiver of the terms of our code of conduct and ethics for the chief executive officer, the chief financial officer, any accounting officer, and all other executive officers will be disclosed on our Web site. The reference to our web site does not constitute incorporation by reference of any information contained at that site.
Certain materials we file with the SEC may also be read and copied at or through the Internet website maintained by the SEC at www.sec.gov.
Item 1A. RISK FACTORS
The following risks and uncertainties are not the only ones facing us. Additional risks and uncertainties, including risks and uncertainties of which we are currently unaware or which we believe are not material also could materially adversely affect our business, financial condition, results of operations or cash flows. In any case, the value of our common stock could decline, and you could lose all or a portion of your investment. See also, “Safe Harbor Regarding Forward-Looking Statements.”
Risks Related To Our Business and Industry
Our business may be materially adversely impacted by U.S. and global market and economic conditions, particularly adverse conditions in the insurance industry.
For the foreseeable future, we expect to continue to derive most of our revenue from products and services we provide to the insurance and financial services industries. Given the concentration of our business activities in these industries, we may be particularly exposed to certain economic downturns affecting these industry groups. U.S. and global market and economic conditions have been, and continue to be, disrupted and volatile. General business and economic conditions that could affect us and our customers include fluctuations in economic growth, debt and equity capital markets, liquidity of the global financial markets, the availability and cost of credit, investor and consumer confidence, and the strength of the economies in which our customers operate. A poor economic environment (including as a result of a prolonged U.S. Government shutdown) could result in significant decreases in demand for our products and services, including the delay or cancellation of current or anticipated projects, or could present difficulties in collecting accounts receivables from our customers due to their deteriorating financial condition. Our existing customers may be acquired by or merged into other entities that use our competitors' products or may decide to terminate their relationships with us for other reasons. As a result, our sales could decline if an existing customer is merged with or acquired by another company that has a poor economic outlook or is closed.
We may not be able to secure additional financing to support capital requirements when needed.
We may need to raise additional funds in the future in order to fund new product development, further organic growth initiatives, acquire new businesses, or for other purposes. Any required additional financing may not be available on terms favorable to us, or at all. If adequate funds are not available on acceptable terms, we may be unable to meet our strategic business objectives or compete effectively, and the future growth of our business could be adversely impacted. If additional funds are raised by our issuing equity securities, stockholders may experience dilution of their ownership and economic interests, and the newly issued securities may have rights superior to those of our common stock. If additional funds are raised by our issuance of debt, we may be subject to significant market risks related to interest rates, and operating risks regarding limitations on our activities.
13
Our future growth may depend in part on acquiring other businesses in our industry.
We expect to continue to grow, in part, by making business acquisitions. In the past, we have made accretive acquisitions to broaden our product and service offerings, expand our operations, and enter new geographic markets. We may continue to make selective acquisitions, enter into joint ventures, or otherwise engage in other appropriate business investments or arrangements that the we believe will strengthen the Company. However, the continued success of our acquisition program will depend on our ability to find and buy other attractive businesses at a reasonable price, to access the requisite financing resources if needed, and to integrate acquired businesses into our existing operations and there is no assurance that we will be able to continue to do so.
Any future acquisitions that we may undertake could be difficult to integrate, disrupt our business, dilute stockholder value and adversely impact our operating results.
Future business acquisitions subject the Company to a variety of risks, including those risks associated with an inability to efficiently integrate acquired operations, higher incremental cost of operations, outdated or incompatible technologies, labor difficulties, or an inability to realize anticipated synergies, whether within anticipated time frames or at all; one or more of which risks, if realized, could have an adverse impact on our operations. Among the issues related to the integration of such acquisitions are:
• | potential incompatibility of business cultures; |
• | potential delays in integrating diverse technology platforms; |
• | potential need for additional disclosure controls and internal controls over financial reporting; |
• | potential difficulties in coordinating geographically separated organizations; |
• | potential difficulties in re-training sales forces to market all of our products across all of our intended markets; |
• | potential difficulties implementing common internal business systems and processes; |
• | potential conflicts in third-party relationships; and |
• | potential loss of customers and key employees and the diversion of the attention of management from other ongoing business concerns. |
We may not be able to develop new products or services necessary to effectively respond to rapid technological changes.
To be successful, we must adapt to rapidly changing technological and market needs, by continually enhancing and introducing new products and services to address our customers' changing demands. The marketplace in which we operate is characterized by:
• | rapidly changing technology; |
• | evolving industry standards; |
• | frequent new product and service introductions; |
• | shifting distribution channels; and |
• | changing customer demands. |
Our future success will depend on our ability to adapt to this rapidly evolving marketplace. We could incur substantial costs if we need to modify our services or infrastructure in order to adapt to changes affecting our market, and we may be unable to effectively adapt to these changes.
The markets for our products and services are highly competitive and are likely to become more competitive, and our competitors may be able to respond more quickly to new or emerging technology and changes in customer requirements.
We operate in highly competitive markets. In particular, the online insurance distribution market, like the broader electronic commerce market, is rapidly evolving and highly competitive. Our insurance software business also experiences competition from certain large hardware suppliers that sell systems and system components to independent agencies and from small independent developers and suppliers of software, who sometimes work in concert with hardware vendors to supply systems to independent agencies. Pricing strategies and new product introductions and other pressures from existing or emerging competitors could result in a loss of customers or a rate of increase or decrease in prices for our services different than past experience. Our Internet facilitated businesses may also face indirect competition from insurance carriers that have subsidiaries which perform in-house agency and brokerage functions.
14
Some of our current competitors have longer operating histories, larger customer bases, greater brand recognition and significantly greater financial and marketing resources than we do. In addition, we believe we will face increasing competition as the online financial services industry develops and evolves. Our current and future competitors may be able to:
• | undertake more extensive marketing campaigns for their brands and services; |
• | devote more resources to website and systems development; |
• | adopt more aggressive pricing policies; and |
• | make more attractive offers to potential employees, online companies and third-party service providers. |
We operate in a price sensitive market and we are subject to pressures from customers to decrease our fees for the services
and solutions we provide. Any reduction in price would likely reduce our margins and could adversely affect our operating
results.
The competitive market in which we conduct our business could require us to reduce our prices. If our competitors offer discounts on certain products or services in an effort to recapture or gain market share or to sell other products, we may be required to lower our prices or offer other favorable terms to compete successfully. Any of these changes would likely reduce our margins and could adversely affect our operating results. Some of our competitors may bundle products and services that compete with us for promotional purposes or as a long-term pricing strategy or provide guarantees of prices and product implementations. In addition, many of the services and solutions that we provide and market are not unique or proprietary to us and our customers and target customers may not distinguish our services and solutions from those of our competitors. All of these factors could, over time, limit or reduce the prices that we can charge for our services and solutions. If we cannot offset price reductions with a corresponding increase in the number of sales or with lower spending, then the reduced revenue resulting from lower prices would adversely affect our margins and operating results.
Our current customers might not purchase additional software solutions, renew maintenance agreements or purchase additional professional services, or they might switch to other product or service offerings (including competitive products).
We rely on our existing customer base to generate additional business through the purchase of new software solutions as well as maintenance, consulting and training services. Existing customers might cancel or not renew their maintenance contracts, decide not to buy additional products and services, switch to on-premises models or accept alternative offerings from other vendors.
Our future success depends in part on our ability to sell additional features and services, and more subscriptions or enhanced offerings of our services to our current customers. This may also require increasingly sophisticated and costly sales efforts. Similarly, the rate at which our customers purchase new or enhanced services depends on a number of factors, including general economic conditions and our customers’ reaction to any price changes related to these additional features and services. If our efforts to up-sell to our customers are not successful our business may suffer.
If our customers do not renew their subscriptions for our services or reduce the number of paying subscriptions at the time of renewal, our revenue will decline and our business will suffer. If we cannot accurately predict subscription renewals or upgrade rates, we may not meet our revenue targets which may adversely affect the market price of our common stock.
Our customers have no obligation to renew their subscriptions for our services after the expiration of their initial subscription period, and historically some customers have elected not to do so. In addition, our customers may renew for fewer subscriptions, renew for shorter contract lengths or switch to lower cost and/or less profitable offerings of our services. We cannot accurately predict attrition rates given our diverse customer base and large number of multi-year subscription contracts. Our attrition rates may increase or fluctuate as a result of a number of factors, including customer dissatisfaction with our services, decreases in customers’ spending levels, decreases in the number of users at our customers, pricing increases or changes in general economic conditions.
Because we recognize revenue from subscriptions for our services over the term of the subscription, downturns or upturns in new business may not be immediately reflected in our operating results.
We generally recognize revenue from customers ratably over the terms of their subscription agreements, which are typically twelve to thirty-six months. As a result, most of the revenue we report in each quarter is the result of subscription agreements entered into during previous quarters. Consequently, a decline in new or renewed subscriptions in any one quarter may not be reflected in our revenue results for that quarter. Any such decline, however, will negatively impact our revenue in future quarters. Accordingly, the effect of significant downturns in sales and market acceptance of our services, and potential changes in our attrition rate, may not be fully reflected in our results of operations until future periods. Our subscription model
15
also makes it difficult for us to rapidly increase our revenue through additional sales in any period, as revenue from new customers must be recognized over the applicable subscription term.
Supporting our existing and growing customer base could strain our personnel resources and infrastructure, and if we are
unable to scale our operations and increase productivity, we may not be able to successfully implement our business plan.
We continue to experience significant growth in our customer base and personnel, which has placed a strain on our management, administrative, operational and financial infrastructure. We anticipate that additional investments in our internal infrastructure, data center capacity, research, customer support, and development will be required to scale our operations and increase productivity, in order to address the needs of our customers, further develop and enhance our services, expand into new geographic areas, and scale with our overall growth. The additional investments we are making will increase our cost base, which will make it more difficult for us to offset any future revenue shortfalls by reducing expenses in the short term.
We regularly upgrade or replace our various software systems. If the implementations of these new applications are delayed, or if we encounter unforeseen problems with our new systems or in migrating away from our existing applications and systems, our operations and our ability to manage our business could be negatively impacted.
Our success will depend in part upon the ability of our senior management to manage our projected growth effectively. To do so, we must continue to increase the productivity of our existing employees and to hire, train and manage new employees as needed. To manage the expected domestic and international growth of our operations and personnel, we will need to continue to improve our operational, financial and management controls, our reporting systems and procedures, and our utilization of real estate. If we fail to successfully scale our operations and increase productivity, we will be unable to execute our business plan.
Our product development cycles are lengthy, and we may incur significant expenses before we generate revenues, if any, from new products.
Because our products are complex and require rigorous testing, development cycles can be lengthy. Moreover, development projects can be technically challenging and expensive. The nature of these development cycles may cause us to experience delays between the time we incur expenses associated with research and development and the time we generate revenues, if any, from such expenses. If we expend a significant amount of resources on research and development and our efforts do not lead to the successful introduction or improvement of products that are competitive in the marketplace, this could materially and adversely affect our business and results of operations. Additionally, anticipated customer demand for a product we are developing could decrease after the development cycle has commenced. Such decreased customer demand may cause us to fall short of our sales targets, and we may nonetheless be unable to avoid substantial costs associated with the product’s development. If we are unable to complete product development cycles successfully and in a timely fashion and generate revenues from such future products, the growth of our business may be harmed.
Our sales cycle is variable and often lengthy, depends upon many factors outside our control, and requires us to expend significant time and resources prior to generating associated revenues.
The typical sales cycle for our solutions and services is lengthy and unpredictable, requires pre-purchase evaluation by a significant number of persons in our customers’ organizations, and often involves a significant operational decision by our customers. Our sales efforts involve educating our customers and industry analysts and consultants about the use and benefits of our solutions, including the technical capabilities of our solutions and the efficiencies achievable by organizations deploying our solutions. Customers typically undertake a significant evaluation process.
We regard our intellectual property in general and our software in particular, as critical to our success, and we may not be able to effectively or efficiently protect our intellectual property.
We rely on copyright laws and licenses and nondisclosure agreements to protect our proprietary rights as well as the intellectual property rights of third parties whose content we license. However, it is not possible to prevent all unauthorized uses of these rights. We cannot provide assurances that the steps we have taken to protect our intellectual property rights, and the rights of those from whom we license intellectual property, are adequate to deter misappropriation or that we will be able to detect unauthorized uses and take timely and effective steps to remedy this unauthorized conduct. In particular, a significant portion of our revenue is derived internationally, including in jurisdictions where protecting intellectual property rights may prove even more challenging. To prevent or respond to unauthorized uses of our intellectual property, we might be required to engage in costly and time-consuming litigation and we may not ultimately prevail.
16
If we infringe on the proprietary rights of others, our business operations may be disrupted, and any related litigation could be time consuming and costly.
Third parties may claim that we have violated their intellectual property rights. Any such claim, with or without merit, could subject us to costly litigation and divert the attention of key personnel. To the extent that we violate a patent or other intellectual property right of a third party, we may be prevented from operating our business as planned, and we may be required to pay damages, to obtain a license, if available, to use the right or to use a non-infringing method, if possible, to accomplish our objectives. The cost of such activity could have a material adverse effect on our business.
We depend on the continued services of our senior management and our ability to attract and retain other key personnel.
Our future success is substantially dependent on the continued services and continuing contributions of our senior management and other key personnel, particularly Robin Raina, our President and Chief Executive Officer, and Chairman of the Board. Since becoming Chief Executive Officer of the Company in 1999, Mr. Raina's strategic direction and vision for the Company and the implementation of such direction has been instrumental in our profitable turnaround and growth. The loss of the services of any of our executive officers or other key employees could harm our business. Our future success also depends on our ability to continue to attract, retain and motivate highly skilled employees. If we are not able to attract and retain key skilled personnel, our business could be harmed.
If we do not effectively manage our geographically dispersed workforce, we might not be able to run our business
efficiently and successfully.
Our success is dependent on appropriate alignment of our internal and external workforce planning processes, adequate resource allocation and our location strategy with our general strategy. We have employees located in the United States, India, Australia, Canada, New Zealand, Brazil, Singapore, and United Kingdom. Managing such a diverse and widely spread work force can be difficult and demanding for management. It is critical that we manage our internationally dispersed workforce effectively, taking short- and long-term workforce and skill requirements into consideration. This applies to the management of our internal as well as our external workforce. Changes in headcount and infrastructure needs as well as local legal or tax regulations could result in a mismatch between our expenses and revenue. Failure to manage our geographically dispersed workforce effectively could hinder our ability to run our business efficiently and successfully and could have an adverse effect on our business, financial position, profit, and cash flows.
Risks Related to Our Conduct of Business on the Internet
Our software solutions are deployed through cloud-based implementations, and if such implementations are compromised by data security breaches or other disruptions, our reputation could be harmed, and we could lose customers or be subject to significant liabilities.
Our software solutions typically are deployed in cloud-based environments, in which our products and associated services are made available using an Internet-based infrastructure. In cloud deployments, the infrastructure of third-party service providers used by our customers may be vulnerable to hacking incidents, other security breaches, computer viruses, telecommunications failures, power loss, other system failures and similar disruptions.
Any of these occurrences, whether intentional or accidental, could lead to interruptions, delays or cessation of operation of the servers of third-party service providers used by our customers, and to the unauthorized use or access of our software and proprietary information and sensitive or confidential data stored or transmitted by our products. The inability of service providers used by our customers to provide continuous access to their hosted services, and to secure their hosted services and associated customer information from unauthorized use, access or disclosure, could cause us to lose customers and to incur significant liability, and could harm our reputation, business, financial condition and results of operations.
We face risks in the transmittal of individual health-related and other personal information.
We face potential risks and financial liabilities associated with obtaining and transmitting personal account information that includes social security numbers and individual health-related information. Any significant breakdown, invasion, destruction or interruption of our information technology systems and infrastructure by employees, others with authorized access to our systems, or unauthorized persons could negatively affect operations. There can be no assurance that we will not be subject to cyber security incidents that bypass our security measures, result in the loss or theft of personal health information or other data subject to privacy laws or disrupt our information systems or business. While we have invested in the protection of our data and information technology to reduce these risks, there can be no assurance that our efforts will prevent breakdowns or breaches in our systems.
17
The controls implemented by our third-party service providers may not prevent or timely detect such system failures. Our property and business interruption insurance coverage may not be adequate to fully compensate us for losses that may occur. Our risks would include damage to our reputation and additional costs to address and remediate any problems encountered, as well as litigation and potential financial penalties.
Any disruption of our Internet connections could affect the success of our Internet-based products and services.
Any system failure, including network, software or hardware failure, that causes an interruption in our network or a decrease in the responsiveness of our website could result in reduced user traffic and reduced revenue. Continued growth in Internet usage could cause a decrease in the quality of Internet connection service. Websites have experienced service interruptions as a result of outages and other delays occurring throughout the worldwide Internet network infrastructure. In addition, there have been several incidents in which individuals have intentionally caused service disruptions of major e-commerce websites. If these outages, delays or service disruptions frequently occur in the future, usage of our web-based services could grow more slowly than anticipated or decline and we may lose revenues and customers. If the Internet data center operations that host any of our websites or web-based services were to experience a system failure, the performance of our website or web-based services would be harmed. These systems are also vulnerable to damage from fire, floods, and earthquakes, acts of terrorism, power loss, telecommunications failures, break-ins and similar events. The controls implemented by our third-party service providers may not prevent or timely detect such system failures. Our property and business interruption insurance coverage may not be adequate to fully compensate us for losses that may occur. In addition, our users depend on Internet service providers, online service providers and other website operators for access to our website. These providers could experience outages, delays and other difficulties due to system failures unrelated to our systems.
Concerns regarding security of transactions or the transmission of confidential information over the Internet or security problems we experience may prevent us from expanding our business or subject us to legal exposure.
If we do not maintain sufficient security features in our online product and service offerings, our products and services may not gain market acceptance, and we could also be exposed to legal liability. Despite the measures that we have or may take, our infrastructure will be potentially vulnerable to physical or electronic break-ins, computer viruses or similar problems. If a person circumvents our security measures, that person could misappropriate proprietary information or disrupt or damage our operations. Security breaches that result in access to confidential information could damage our reputation and subject us to a risk of loss or liability. We may be required to make significant expenditures to protect against or remediate security breaches. Additionally, if we are unable to adequately address our customers' concerns about security, we may have difficulty selling our products and services.
Uncertainty in the marketplace regarding the use of Internet users' personal information, or legislation limiting such use, could reduce demand for our services and result in increased expenses.
Concern among consumers and legislators regarding the use of personal information gathered from Internet users could create uncertainty in the marketplace. This could reduce demand for our services, increase the cost of doing business as a result of litigation costs or increased service delivery costs, or otherwise harm our business. Many state insurance codes limit the collection and use of personal information by insurance agencies, brokers and carriers or insurance service organizations.
Future government regulation of the Internet could place financial burdens on our businesses.
Because of the Internet's popularity and increasing use, new laws and regulations directed specifically at e-commerce may be adopted. These laws and regulations may cover issues such as the collection and use of data from website visitors and related privacy issues, pricing, taxation, telecommunications over the Internet; content; copyrights; distribution; and domain name piracy. The enactment of any additional laws or regulations, including international laws and regulations, could impede the growth of revenue from our Internet operations and place additional financial burdens on our business.
Risks Related To Foreign Operations
Our international operations are subject to a number of risks that could affect our revenues, operating results, and growth.
We market our products and services internationally and plan to continue to expand our Internet-based services to locations outside of the United States. We currently conduct operations in Australia, Canada, New Zealand, Brazil, Dubai, India, Indonesia, Philippines, New Zealand, Singapore and United Kingdom, and have product development activities and call center services in India. Our international operations are subject to other inherent risks which could have a material adverse effect on our business, including:
18
• | the impact of recessions in foreign economies on the level of consumers' insurance shopping and purchasing behavior; |
• | greater difficulty in collecting accounts receivable; |
• | difficulties and costs of staffing and managing foreign operations; |
• | reduced protection for intellectual property rights in some countries; |
• | burdensome regulatory requirements; |
• | trade and financing barriers, and differing business practices; |
• | potentially adverse tax consequences; and |
• | economic instability or political unrest such as crime, strikes, riots, civil disturbances, terrorist attacks and wars. |
A substantial portion of our assets and operations are located outside of the United States and we are subject to regulatory, tax, economic, political and other uncertainties in other foreign countries in which we operate.
We have significant offshore operations in foreign countries, including Australia, Brazil, Canada, Dubai, India, New Zealand, Singapore and United Kingdom. Wages in these countries have historically increased at a faster rate than in the United States. If this trend continues in the future, it would result in increased labor costs and thereby potentially reduce our operating margins. Also, there is no assurance that, in future periods, competition for skilled workers will not drive salaries higher in these countries, thereby resulting in increased costs for our technical professionals and reduced operating margins.
These countries have in the past experienced many of the problems that commonly confront the economies of developing countries, including high inflation, erratic gross domestic product growth and shortages of foreign exchange. Government actions concerning the economy in these countries could have a material adverse effect on private sector entities like us. In the past, certain of these governments have provided significant tax incentives and relaxed certain regulatory restrictions in order to encourage foreign investment in specified sectors of the economy, including the software development services industry. Programs that have benefited us include, among others, tax holidays, liberalized import and export duties and preferential rules on foreign investment and repatriation. Notwithstanding these benefits, as noted above, changes in government leadership or changes in policies in these countries that result in the elimination of any of the benefits realized by us or the imposition of new taxes applicable to such operations could have a material adverse effect on our business, results of operations and financial condition.
Our international business activities and processes expose us to numerous and often conflicting laws and regulations, policies, standards or other requirements and sometimes even conflicting regulatory requirements, and to risks that could
harm our business, financial position, profit, and cash flows.
We are a global company and currently market our products and services in the United States, Australia, Canada, Indonesia, Philippines, United Arab Emeritus, New Zealand, Brazil, Singapore, India and United Kingdom, amongst other countries. Our business in these countries is subject to numerous risks inherent in international business operations. Among others, these risks include:
• | Data protection and privacy regulations regarding access by government authorities to customer, partner, or employee data |
• | Data residency requirements (the requirement to store certain data only in and, in some cases, also to access such data only from within a certain jurisdiction) |
• | Conflict and overlap among tax regimes |
• | Possible tax constraints impeding business operations in certain countries |
• | Expenses associated with the localization of our products and compliance with local regulatory requirements |
• | Discriminatory or conflicting fiscal policies |
• | Operational difficulties in countries with a high corruption perception index |
• | Works councils, labor unions, and immigration laws in different countries |
• | Difficulties enforcing intellectual property and contractual rights in certain jurisdictions |
• | Country-specific software certification requirements |
• | Compliance with various industry standards |
• | Market volatilities or workforce restrictions due to changing laws and regulations resulting from political decisions (e.g. Brexit, government elections) |
As we expand into new countries and markets, these risks could intensify. The application of the respective local laws and regulations to our business is sometimes unclear, subject to change over time, and often conflicting among jurisdictions. Additionally, these laws and government approaches to enforcement are continuing to change and evolve, just as our products
19
and services continually evolve. Compliance with these varying laws and regulations could involve significant costs or require changes in products or business practices. Non-compliance could result in the imposition of penalties or cessation of orders due to alleged non-compliant activity. We do not believe we have engaged in any activities sanctionable under these laws and regulations, but governmental authorities could use considerable discretion in applying these statutes and any imposition of sanctions against us could be material. One or more of these factors could have an adverse effect on our operations globally or in one or more countries or regions, which could have an adverse effect on our business, financial position, profit, and cash flows.
The decision by British voters to exit the European Union may negatively impact our operations.
The U.K. exited the European Union (“Brexit”) on January 31, 2020. At present, the terms of Brexit and the resulting U.K./E.U. relationship are uncertain for companies doing business both in the U.K. and the overall global economy. The U.K. vote has impacted global markets, including various currencies, and resulted in a sharp decline in the value of the British Pound as compared to the U.S. dollar and other major currencies. The fluctuation of currency exchange rates may expose us to gains and losses on non-U.S. currency transactions. Volatility in the securities markets and in currency exchange rates may continue. While we have not experienced any material financial impact from Brexit on our business to date, we cannot predict its future implications. Any impact from Brexit on our business and operations over the long term will depend, in part, on the outcome of tariff, tax treaties, trade, regulatory, and other negotiations the U.K. conducts.
Changes in the method pursuant to which LIBOR rates are determined and potential phasing out of LIBOR after 2021 may
affect our financial results.
The United Kingdom Financial Conduct Authority (the “FCA”), which regulates the London Interbank Offered Rate (“LIBOR”) has announced that the FCA intends to stop compelling banks to submit rates for the calculation of LIBOR after 2021 (the “FCA Announcement”). The FCA Announcement indicates that the continuation of LIBOR on the current basis cannot and will not be guaranteed after 2021. Following the implementation of any reforms to LIBOR or the methods pursuant to which LIBOR rates are determined, or other benchmark rates that may be enacted in the United Kingdom or elsewhere, the manner of administration of such benchmarks may change, with the result that such benchmarks may perform differently than in the past, such benchmarks could be eliminated entirely, or there could be other consequences which cannot be predicted. Under the Regions Secured Credit Facility, as defined below, LIBOR may be used to set the fluctuating interest rate (the “Base Rate”) and the interest rate for any Eurodollar Rate Advance. If LIBOR is phased out, we may be required to renegotiate with our lender to establish a new interest rate (the “LIBOR Successor Rate”). We can give no assurance that we and our lender will be able to agree on a LIBOR Successor Rate. If we and our lender cannot agree on a LIBOR Successor Rate, our ability to draw upon the Regions Secured Credit Facility may be materially impacted.
Our earnings may be adversely affected if we change our intent not to repatriate foreign earnings or if such earnings become subject to U.S. tax on a current basis.
We have earnings outside of the United States. Other than amounts for which we have already accrued U.S. taxes, we consider foreign earnings to be indefinitely reinvested outside of the United States. While we have no plans to do so, events may occur that could effectively force us to change our intent not to repatriate such earnings. If such earnings are repatriated in the future or are no longer deemed to be indefinitely reinvested, we may have to accrue taxes associated with such earnings at a substantially higher rate than our projected effective income tax rate, and we may be subject to additional tax liabilities in certain foreign jurisdictions in which we operate. These increased taxes could have a material adverse effect on our business, results of operations and financial condition.
New legislation that would change U.S. or foreign taxation of business activities, including the imposition of tax based on gross revenue, could harm our business and financial results
Reforming the taxation of international businesses has been a priority for politicians, and a wide variety of changes have been proposed or enacted. Due to the large and expanding scale of our international business activities, any changes in the taxation of such activities may increase our tax expense, the amount of taxes we pay, or both, and could harm our business and financial results. For example, the Tax Cuts and Jobs Act, or the Tax Act, was enacted in December 2017 and significantly reformed the U.S. Internal Revenue Code of 1986, as amended, or the Code. The Tax Act lowered U.S. federal corporate income tax rates, changed the utilization of future net operating loss carryforwards, allowed for the expensing of certain capital expenditures, and put into effect sweeping changes to U.S. taxation of international business activities.
In addition, many jurisdictions and intergovernmental organizations have been discussing proposals that may change various aspects of the existing framework under which our tax obligations are determined in many of the countries in which we do business. Some jurisdictions have enacted, and others have proposed, taxes based on gross receipts applicable to digital services
20
regardless of profitability. The Organization for Economic Co-operation and Development has been working on a proposal that may change how taxable presence for digital services is defined and result in the imposition of taxes based on net income in countries where we have no physical presence. We continue to examine the impact these and other tax reforms may have on our business. The impact of these and other tax reforms is uncertain and one or more of these or similar measures may adversely effect our business.
Our tax expense and liabilities are also affected by other factors, such as changes in our business operations, acquisitions, investments, entry into new businesses and geographies, intercompany transactions, the relative amount of our foreign earnings, losses incurred in jurisdictions for which we are not able to realize related tax benefits, the applicability of special tax regimes, changes in foreign currency exchange rates. Significant judgment is required in evaluating and estimating our tax expense and liabilities. In the ordinary course of our business, there are many transactions and calculations for which the ultimate tax determination is uncertain. The U.S. Treasury Department, the IRS, and other standard-setting bodies will continue to interpret or issue guidance on how provisions of the U.S. Tax Act will be applied or otherwise administered. As future guidance is issued, we may make adjustments to amounts that we have previously recorded that may materially impact our financial statements in the period in which the adjustments are made.
We may have exposure to greater than anticipated tax liabilities.
Our future income taxes could be adversely affected by earnings being lower than anticipated in jurisdictions where we have lower statutory tax rates and higher than anticipated in jurisdictions where we have higher statutory tax rates, by changes in the valuation of our deferred tax assets and liabilities, or due to changes in tax laws, regulations, and accounting principles concerning the accounting for income taxes in the domestic and foreign jurisdictions in which we conduct operations. We are subject to regular review and audit by both domestic and foreign tax authorities. Any adverse outcome of such a review or audit could have a negative effect on our operating results and financial condition. In addition, the determination of our worldwide provision for income taxes requires significant judgment, and there are some transactions for which the ultimate tax treatment is uncertain. Although we believe our estimates are reasonable and appropriate, the ultimate tax outcome may differ from the amounts recorded in our financial statements and may materially affect our financial results in the period or periods for which such determination is made. The tax rates in the foreign jurisdictions in which the Company conducts operations have a significant impact on the Company's financial results and could increase.
Changes in tax laws or tax rulings could materially affect our financial position, results of operations, and cash flows.
The income and non-income tax regimes we are subject to or operate under are unsettled and may be subject to significant change. Changes in tax laws or tax rulings, or changes in interpretations of existing laws, could materially affect our financial position, results of operations, and cash flows. For example, changes to U.S. tax laws enacted in December 2017 had a significant impact on our tax obligations and effective tax rate for the fourth quarter of 2017 and in 2018. In addition, many countries in Europe, as well as a number of other countries and organizations, have recently proposed or recommended changes to existing tax laws or have enacted new laws that could significantly increase our tax obligations in many countries where we do business or require us to change the manner in which we operate our business. The Organization for Economic Cooperation and Development has been working on a Base Erosion and Profit Shifting Project, and issued in 2015, and is expected to continue to issue, guidelines and proposals that may change various aspects of the existing framework under which our tax obligations are determined in many of the countries in which we do business. The European Commission has conducted investigations in multiple countries focusing on whether local country tax rulings or tax legislation provides preferential tax treatment that violates European Union state aid rules and concluded that certain countries, including Ireland, have provided illegal state aid in certain cases. These investigations may result in changes to the tax treatment of our foreign operations. Due to the large and expanding scale of our international business activities and expiring tax holiday benefits, many of these types of changes to the taxation of our activities could increase our worldwide effective tax rate and harm our financial position, results of operations, and cash flows.
Our financial position and operating results may be adversely affected by the changing U.S. Dollar rates and fluctuations in other currency exchange rates.
We will be exposed to currency exchange risk with respect to the U.S. dollar in relation to the foreign currencies in the countries where we conduct operations because a significant portion of our operating expenses are incurred in foreign countries. This exposure may increase if we expand our operations overseas. We will monitor changes in our exposure to exchange rate risk that result from changes in our business operations.
The rapid spread of contagious illnesses can have an adverse effect on our business and results of operations.
The rapid spread of a contagious illness such as a novel coronavirus, or fear of such an event, can have a material adverse effect on the demand for worldwide travel and therefore have an adverse effect on our business and results of
21
operations. Similarly, travel restrictions or operational issues resulting from the rapid spread of contagious illnesses in a part of the world in which we have significant operations may have an adverse effect on our business and results of operations.
Risks Related To Corporate Governance
Principal shareholders may be able to exert control over our future direction and operations.
If our principal shareholders and the holdings of entities controlled by them vote in the same manner, this could delay, prevent or facilitate a change in control of Ebix or other significant changes to Ebix or its capital structure. Refer to the disclosure regarding “Security Ownership of Certain Beneficial Owners and Management and Related Stockholder Matters” in our annual proxy statement for more information.
Provisions in our articles of incorporation, bylaws, and Delaware law may make it difficult for a third party to acquire us, even in situations that may be viewed as desirable by our shareholders.
Our certificate of incorporation and bylaws, and the provisions of Delaware law may delay, prevent or otherwise make it more difficult to acquire us by means of a tender offer, a proxy contest, open market purchases, removal of incumbent directors and otherwise. These provisions, which are summarized below, are expected to discourage coercive takeover practices and inadequate takeover bids, and to encourage persons seeking to acquire control of us to first negotiate with us. We are subject to the “business combination” provisions of Section 203 of the Delaware General Corporation Law. In general, those provisions prohibit a publicly held Delaware corporation from engaging in various “business combination” transactions with any interested stockholder for a period of three years after the date of the transaction in which the person became an interested stockholder, unless:
• | The transaction is approved by the board of directors prior to the date the interested stockholder obtained interested stockholder status; |
• | Upon consummation of the transaction that resulted in the stockholder's becoming an interested stockholder, the stockholder owned at least 85% of the voting stock of the corporation outstanding at the time the transaction commenced; or |
• | On or subsequent to the date the business combination is approved by the board of directors, it is authorized at an annual or special meeting of stockholders by the affirmative vote of at least two-thirds of the outstanding voting stock that is not owned by the interested stockholder. |
These provisions could prohibit or delay mergers or other takeover or change of control attempts with respect to us and, accordingly, may discourage attempts to acquire us.
The Company has an SAR Agreement with Mr. Robin Raina which could have the effect of discouraging or making more difficult an acquisition or change of control of the Company even in situations that may be viewed as desirable by our shareholders.
On April 10, 2018, the Company entered into a Stock Appreciation Right Award Agreement (the “SAR Agreement”) with Robin Raina, the Company’s Chairman, President and Chief Executive Officer. The SAR Agreement replaced the Acquisition Bonus Agreement (the “ABA”) between the Company and Mr. Raina, dated July 15, 2009. At the time that Mr. Raina and the Company entered into the ABA, the Board had concluded that Mr. Raina’s retention was critical to the future success and growth of the Company, and consequently, the Board’s intention in entering into the ABA was to ensure that Mr. Raina would be appropriately rewarded for his contributions to the Company prior to an Acquisition Event (as defined below), as well as to further motivate Mr. Raina to maximize the value received by all stockholders of the Company if the Company were to be acquired. Under the terms of the ABA (with some exceptions), if Mr. Raina was then employed by the Company upon an event by which: (a) more than fifty percent (50%) of the voting stock of the Company is sold, transferred, or exchanged; (b) a merger or consolidation of the Company occurs; (c) the sale, exchange, or transfer of substantially all of the Company’s assets occurs; or (d) the Company is acquired or dissolved (each, an “Acquisition Event”).
In negotiating and entering into the SAR Agreement, the Board wished to resolve any uncertainty or ambiguities that may exist in the ABA, while preserving the original intent of the ABA of ensuring that Mr. Raina would be appropriately rewarded for his contributions prior to an Acquisition Event, as well as to further motivate Mr. Raina to maximize the value received by all stockholders of the Company if the Company were to be acquired. The SAR Agreement also recognizes Mr. Raina’s critical role in the future success and growth of the Company.
22
Upon the effective date of the SAR Agreement, Mr. Raina received 5,953,975 stock appreciation rights with respect to the Company’s common shares (the “SARs”). Upon an Acquisition Event (as defined in the SAR Agreement), each of the SARs entitles Mr. Raina to receive a cash payment from the Company equal to the excess, if any, of the net proceeds per share received in connection with an Acquisition Event over the base price of $7.95. Mr. Raina will only be entitled to receive a payment with respect to the SARs if he is employed by the Company at the time of an Acquisition Event or was terminated by the Company without cause within the 180-day period immediately preceding an Acquisition Event.
Annually, while Mr. Raina is employed by the Company and prior to an Acquisition Event, the Board shall determine whether a “shortfall” (as defined in the SAR Agreement) existed as of the end of the immediately preceding fiscal year. In the event the Board determines that a shortfall existed, Mr. Raina will be granted additional SARs (or, in the Board’s sole discretion, restricted shares or restricted stock units (each a “Share Grant”)) in an amount sufficient to eliminate such shortfall (each a “Shortfall Grant”). A “shortfall” will exist if the sum of the number of Company’s common shares deemed to be owned by Mr. Raina as of the date of the SAR Agreement (3,676,540 shares), the number of SARs granted to Mr. Raina, and the number of shares underlying any previously granted Shortfall Grant is less than twenty percent (20%) of the sum of the number of SARs and the number of outstanding shares reported by the Company in its audited financial statements as of the end of the immediately preceding fiscal year.
In the event that an Acquisition Event had occurred on December 31, 2019, and assuming that the stockholders of the Company received Net Proceeds of $33.41 per share (the closing price of the Company’s common stock on December 31, 2019) in connection with the Acquisition Event, Mr. Raina would have received a $157.7 million payment with respect to the SARs upon the occurrence of the Acquisition Event, determined by multiplying the number of SARS by the excess of the Net Proceeds per share over the base price of $7.95 per share.
Risks Related To Accounting and Financial Statements
We could potentially be required to recognize an impairment of goodwill or other indefinite-lived intangible assets.
Goodwill represents the excess of the amounts paid by us to acquire businesses over the fair value of their net assets at the date of acquisition. The Company’s indefinite-lived assets are associated with the contractual customer relationships existing with those property and casualty insurance carriers in Australia using our property and casualty data exchange and with certain large corporate customers using our client relationship management platform in the United States. At December 31, 2019, we had $952.4 million of goodwill and $42.1 million of indefinite-lived intangible assets carried on the Company's consolidated balance sheet. See Note 1 to the Consolidated Financial Statements for a discussion of our goodwill and indefinite-lived intangible assets. We evaluate goodwill and indefinite-lived intangible assets at least annually for any potential impairment. If it is determined that goodwill or indefinite-lived intangible assets have been impaired, we must write down the goodwill and indefinite-lived intangible assets by the amount of the impairment, with a corresponding charge to net income. These write downs could have a material adverse effect on our results of operations and financial condition.
If we fail to maintain an effective system of internal controls, we may not be able to accurately determine our financial results or prevent fraud. As a result, our stockholders could lose confidence in our financial results, which could harm our business and the market value of our common shares.
Effective internal controls over financial reporting are necessary for us to provide reliable and accurate financial reports and effectively prevent fraud. We may in the future discover areas of our internal controls that need improvement. Section 404 of the Sarbanes-Oxley Act of 2002, or (“SOX”), requires us to evaluate and report on the effectiveness of our internal controls over financial reporting and have our independent auditors issue their own opinion regarding the effectiveness of our internal control over financial reporting and related disclosures. While we continually undertake efforts to maintain an effective system of internal controls and compliance with SOX, we cannot always be certain that we will be successful in maintaining adequate control over our financial reporting and related financial processes. Furthermore, as we grow our business, our internal control structure may become more complex, and could possibly require significantly more resources to ensure our internal controls remain effective. If we or our independent auditors discover a material weakness or significant deficiency in our controls over financial reporting, the disclosure of that fact, even if immediately remedied, could significantly reduce the market value of our common stock. In addition, the existence of any material weakness or significant deficiency may require management to devote significant time and incur significant expense to remediate any such weaknesses, and management may not be able to remediate the same in a timely manner.
23
The nature of our business requires the application of complex revenue and expense recognition rules that require management to make estimates and assumptions. Additionally, the current legislative and regulatory environment affecting U.S. Generally Accepted Accounting Principles (“GAAP”) is uncertain and significant changes in current principles could affect our financial statements going forward.
The preparation of financial statements in conformity with GAAP requires management to make estimates and assumptions that affect the amounts reported in the consolidated financial statements. We base our estimates on historical experience and on various other assumptions that we believe to be reasonable under the circumstances, the results of which form the basis for making judgments about the carrying values of assets, liabilities, equity, revenues and expenses that are not readily apparent from other sources.
While we believe that our financial statements have been prepared in accordance with accounting principles generally accepted in the United States, we cannot predict with certainty the impact of future changes to accounting principles or our accounting policies on our financial statements going forward. In addition, were we to change our critical accounting estimates, including the timing of recognition of license revenue and other revenue sources, our reported revenues and results of operations could be significantly impacted.
We prepare our condensed consolidated financial statements in accordance with GAAP. The accounting rules and regulations that we must comply with are complex. The Financial Accounting Standards Board (the “FASB”) and the SEC, or other accounting organizations or governmental entities frequently issue new pronouncements or new interpretations of existing accounting standards. Recent actions and public comments from the FASB and the SEC have focused on the integrity of financial reporting. In addition, many companies' accounting policies are being subject to heightened scrutiny by regulators and the public. Changes in accounting standards, how the accounting standards are interpreted, or the adoption of new accounting standards can have a significant effect on our reported results, and could even retroactively affect previously reported transactions, and may require that we make significant changes to our systems, processes and controls.
Further, the accounting rules and regulations are continually changing in ways that could materially impact our financial statements. Changes resulting from these new standards may result in materially different financial results and may require that we change how we process, analyze and report financial information and that we change financial reporting controls. Such changes in accounting standards may have an adverse effect on our business, financial position, and income, which may negatively impact our financial results.
Current and future accounting pronouncements and other financial reporting standards, especially but not only concerning revenue recognition, may negatively impact the financial results we present.
We regularly monitor our compliance with applicable financial reporting standards and review new pronouncements and drafts thereof that are relevant to us. As a result, we might be required to change our accounting policies, particularly concerning revenue recognition, to alter our operational policy so that it reflects new or amended financial reporting standards, or to retroactively apply such new standards to previously issued financial statements.
Risks Related to Litigation and Regulation
The costs and effects of litigation, investigations or similar matters involving us or our subsidiaries, or adverse facts and developments related thereto, could materially affect our business, operating results and financial condition. Our insurance may not cover these costs.
We may be involved from time to time in a variety of litigation, investigations, inquiries or similar matters arising out of our business, including those described in “Part I, Item 3 - Legal Proceedings” and “Part II - Item 8. Financial Statements and Supplementary Data - Note 6 - Commitments and Contingencies” of this Report. Ebix cannot predict the outcome of these or any other legal matters. In the future, we may need to record litigation reserves with respect to these matters. Further, regardless of how these matters proceed, it could divert our management's attention and other resources away from our business. Our insurance may not cover all claims that may be asserted against us and indemnification rights to which we are entitled may not be honored, and any claims asserted against us, regardless of merit or eventual outcome, may harm our reputation. Should the ultimate judgments or settlements in any litigation or investigation significantly exceed our insurance coverage, they could have a material adverse effect on our business, financial condition and results of operations. In addition, premiums for insurance covering directors' and officers' liability are rising. We may not be able to obtain appropriate types or levels of insurance in the future, nor may we be able to obtain adequate replacement policies with acceptable terms or at historic rates, if at all.
24
Government investigations may require significant management time and attention, result in significant legal expenses or damages and cause the Company's business, financial condition, results of operations and cash flows to suffer. The Company could face additional governmental investigations with respect to these matters, could incur substantial costs to defend any such investigations and be required to pay damages, fines and penalties, or incur additional expenses or be subject to injunctions as a result of the outcome of such investigations. The unfavorable resolution of one or more matters could adversely impact the Company.
The Company has been subject to government investigations approximately six years back. The amount of time needed to resolve any such investigations is uncertain, and the Company cannot predict the outcome any such investigations or whether the Company will face additional government investigations, inquiries or other actions. Subject to certain limitations, the Company is obligated to indemnify current and former directors, officers and employees in connection with ongoing governmental investigations and any future government inquiries, investigations or actions. Such matters could require the Company to expend significant management time and incur significant legal and other expenses, result in civil and criminal actions seeking, among other things, injunctions against the Company and the payment of significant fines and penalties by the Company and adversely affect our ability to attract and retain customers and employees, which could have a material effect on the Company's financial condition, business, results of operations and cash flow. Additionally, marketplace rumors regarding any such investigations could affect the trading price of our common stock, regardless of whether these rumors are accurate.
If governmental authorities were to commence legal action related to any such investigations, then the Company could be required to pay significant penalties and could become subject to injunctions, a cease and desist order and other equitable remedies. The Company can provide no assurances as to the outcome of any such governmental investigation.
Federal Trade Commission laws and regulations that govern the insurance industry could expose us or the agents, brokers and carriers with whom we conduct business in our online marketplace to legal penalties.
We perform functions for licensed insurance agents, brokers and carriers and need to comply with complex regulations that vary from state to state and nation to nation. These regulations can be difficult to comply with, and open to interpretation. If we fail to properly interpret or comply with these regulations, we, the insurance agents, brokers or carriers doing business with us, our officers, or agents with whom we contract could be subject to various sanctions, including censure, fines, cease-and-desist orders, loss of license or other penalties. This risk, as well as other laws and regulations affecting our business and changes in the regulatory climate or the enforcement or interpretation of existing law, could expose us to additional costs, including indemnification of participating insurance agents, brokers or carriers, and could require changes to our business or otherwise harm our business. Furthermore, because the application of online commerce to the consumer insurance market is relatively new, the impact of current or future regulations on our business is difficult to anticipate. To the extent that there are changes in regulations regarding the manner in which insurance is sold, our business could be adversely affected.
Potential liabilities under the Foreign Corrupt Practices Act could have a material adverse effect on our business.
We are subject to the Foreign Corrupt Practice Act, or FCPA, which prohibits people or companies subject to United States jurisdiction and their intermediaries from engaging in bribery or other prohibited payments to foreign officials for the purposes of obtaining or retaining business or gaining an unfair business advantage. It also requires proper record keeping and characterization of such payments in reports filed with the SEC. Our international operations subject us to possible FCPA violations, likely more so than most companies. To the extent that any of our employees, supplies, distributors, consultants, subcontractors, or others engage in conduct that subjects us to exposure under the FCPA, or other anti-corruption legislation, we could suffer financial penalties, debarment from government contracts and other consequences that may have a material adverse effect on our business, financial condition or results of operations.
Risks Related To Our Common Stock
The price of our common stock may be extremely volatile.
In a future period, our results of operations may be below the expectations of public market investors, which could negatively affect the market price of our common stock. Furthermore, the stock market in general has sometimes experienced extreme price and volume fluctuations recently. We believe that, in the future, the market price of our common stock could fluctuate widely due to variations in our performance and operating results or because of any of the following factors:
• | announcements of new services, products, or technological innovations, or strategic relationships by us or our competitors; |
• | announcements of business acquisitions or strategic relationships by us or our competitors; |
25
• | trends or conditions in the insurance, software, business process outsourcing and Internet markets; |
• | changes in market valuations of our competitors; and |
• | general political, economic, regulatory and market conditions. |
In addition, the market prices of securities of technology companies, including our own, have been volatile and have experienced fluctuations that have often been unrelated or disproportionate to a specific company's operating performance. As a result, investors may not be able to sell shares of our common stock at or above the price at which an investor paid. In the past, following periods of volatility in the market price of a company's securities, securities class action litigation has often been instituted against that company. Any securities litigation would involve substantial costs and our management's attention could be diverted from our business.
Our ability and intent to pay cash dividends in the future may be limited.
We currently pay a $0.075 quarterly dividend on our common shares, and while the Board of Directors intends to pay quarterly dividends, the Board will make the determination of the amount of future cash dividends, if any, to be declared and paid based on, among other things, our financial condition, funds from operations, the level of our capital expenditures and future business prospects.
Quarterly and annual operating results may fluctuate, which could cause our stock price to be volatile.
Our quarterly and annual operating results may fluctuate significantly in the future due to a variety of factors related to our revenues or operating expenses in any particular period. Results of operations during any particular period are not necessarily an indication of our results for any other period. Factors that may adversely affect our periodic results may include the loss of a significant insurance agent, carrier or broker relationship or the merger of any of our participating insurance carriers with one another. Our operating expenses are based in part on our expectations of our future revenues and are partially fixed in the short term. We may be unable to adjust spending quickly enough to offset any unexpected revenue shortfall.
Risks Related to the Yatra Combination
Ebix and Yatra may have difficulty attracting, motivating and retaining executives and other key employees in light of the Merger.
Uncertainty about the effect of the Merger on Ebix’s and Yatra’s employees may have an adverse effect on Ebix and/or Yatra and consequently the combined business. This uncertainty may impair Ebix’s and Yatra’s respective ability to attract, retain and motivate key personnel before the Merger is completed and during the integration phase thereafter. Employee retention may be particularly challenging during the pendency of the Merger, as their respective employees may experience uncertainty about their future roles with the combined business. Additionally, Ebix’s and Yatra’s respective officers and employees may hold Yatra ordinary shares or vested options to purchase Yatra ordinary shares and, if the Merger is completed, may therefore be entitled to the Merger Consideration in respect of such Yatra ordinary shares and cash consideration in respect of such stock options, the receipt of which could lead certain officers and employees to no longer pursue employment with the combined business. Finally, the attention of Ebix’s and Yatra’s respective management teams may be directed towards the completion of the Merger and related matters and may be diverted or disrupted from their respective day to day business operations, including from other opportunities that might otherwise be beneficial to Ebix, Yatra and/or the combined company.
After completion of the Merger, Ebix may fail to realize the anticipated benefits and cost savings of the Merger, which could adversely affect the value of Ebix Common Stock.
The success of the Merger will depend, in part, on Ebix’s ability to realize the anticipated benefits and cost savings from combining the businesses of Ebix and Yatra. The ability of Ebix to realize these anticipated benefits and cost savings is subject to certain risks including:
• | Ebix’s ability to successfully combine the businesses of Ebix and Yatra, including with respect to systems and technology integration; |
• | Whether the combined businesses will perform as expected; |
• | The possibility that Ebix paid more for Yatra than the value it will derive from the acquisition; |
• | The assumption of known and unknown liabilities of Yatra. |
26
If Ebix is not able to successfully combine the businesses of Ebix and Yatra within the anticipated time frame, or at all, the anticipated cost savings and other benefits of the Merger may not be realized fully or at all or may take longer to realize than expected, the combined businesses may not perform as expected and the value of the Ebix Common Stock and Ebix Preferred Stock may be adversely affected.
Ebix and Yatra have operated and, until completion of the Merger, will continue to operate, independently, and there can be no assurances that their businesses can be integrated successfully. It is possible that the integration process could result in the loss of key Ebix or Yatra employees, the disruption of either company’s, or both companies’ ongoing businesses or unexpected integration issues, higher than expected integration costs and an overall post-completion integration process that takes longer than originally anticipated. Specifically, issues that must be addressed in integrating the operations of Ebix and Yatra in order to realize the anticipated benefits of the Merger so the combined business performs as expected include, among other things:
• | Integrating the companies’ technologies, products and services; |
• | Identifying and eliminating redundant and under-performing operations and assets; |
• | Harmonizing the companies’ operating practices, employee development and compensation programs, internal controls and other policies, procedures and processes; |
• | Addressing possible differences in business backgrounds, corporate cultures and management philosophies; |
• | Consolidating the companies’ corporate, administrative and information technology infrastructure; |
• | Coordinating sales, distribution and marketing efforts; |
• | Maintaining existing agreements with customers and suppliers and avoiding delays in entering into new agreements with prospective customers and suppliers; and |
• | Coordinating geographically dispersed organizations. |
• | |
In addition, at times, the attention of certain members of either company’s or both companies’ management and resources may be focused on completion of the Merger and the integration of the businesses of the two companies and diverted from day-to-day business operations, which may disrupt either company’s or both companies’ ongoing business and the business of the combined company.
After completion of the Merger, the combined company will be exposed to additional risks associated with Indian businesses, particularly those in the Indian travel industry, including bankruptcies, restructurings, consolidations and alliances of its partners, the credit worthiness of these partners, and the possible obligation to make payments to its partners.
Yatra does nearly all of its business with a wide variety of travel-related companies based in India, including airlines, large hotel chains and others. After the merger, the combined company will be exposed to risks associated with these Indian businesses, including bankruptcies, restructurings, consolidations and alliances of its partners, the credit worthiness of these partners, and the possible obligation to make payments to its partners. For example, the Indian airline industry in recent years has experienced significant losses and has undergone bankruptcies, restructurings, consolidations and other similar events. Jet Airways, one of the largest private airlines in the India, has recently ceased operations and subsequently been referred to insolvency proceedings, which has reduced the number of domestic and international flights available to Yatra and negatively impacted its revenue. The insolvency proceedings of Jet Airways may make doubtful the recovery of Yatra’s receivables from the airline, such as commissions, productivity linked bonus, tax collected at source and refunds for canceled tickets. The Jet Airways bankruptcy has created challenges for Yatra’s relationships with airlines, including by reducing the profitability of its airline ticketing business. Any future bankruptcies or increased consolidation could create additional challenges for both Yatra’s and the combined company’s relationships with airlines. The Yatra and Ebix forecasted financial information is inherently subject to uncertainties.
1B. UNRESOLVED STAFF COMMENTS
None.
Item 2. PROPERTIES
The Company’s corporate headquarters, including substantially all of our corporate administration and finance functions, is located in Johns Creek, Georgia where we own a commercial office building. In addition the Company and its subsidiaries lease office space primarily for sales and operations support in Salt Lake City, Utah, Pittsburgh, Pennsylvania, Pasadena, California, Birmingham, Alabama, Irvine, California and Phoenix, Arizona. Additionally, the Company leases office space in New Zealand,
27
Australia, Singapore, Dubai, Brazil, Canada, Indonesia, Philippines, and London for support, operations and sales offices. The Company also leases facilities all over the world, while owning five facilities in India. The Indian facilities provide software development and other technical and business process outsourcing services. Management believes its facilities are adequate for its current needs and that necessary suitable additional or substitute space will be available as needed at reasonable rates.
Information on the geographic dispersion of the Company’s revenues and long-lived assets is furnished in Note 15 to the consolidated financial statements, included in Part II Item 8 of this Form 10-K.
Item 3. LEGAL PROCEEDINGS
As the Company previously disclosed, in May 2013, twelve putative class action complaints were filed in the Delaware Court of Chancery against the Company and its board of directors challenging a proposed merger between the Company and an affiliate of Goldman Sachs & Co. On June 10, 2013, the Court entered an Order of Consolidation and Appointment of Lead Plaintiffs and a Leadership Structure consolidating the twelve actions and appointing lead plaintiffs (“Plaintiffs”) and lead counsel in the litigation, captioned In re Ebix, Inc. Stockholder Litigation, Consol. C.A. No. 8526-VCS (the “Litigation”).
In connection with the Litigation, on January 23, 2019, the parties entered into a Stipulation and Agreement of Settlement (the “Settlement Agreement”) pursuant to which the parties agreed, subject to approval by the Delaware Court of Chancery, to settle and resolve the Litigation pursuant to the terms set forth in the Settlement Agreement (the “Litigation Settlement”).
On April 5, 2019, the Delaware Court of Chancery determined that the Litigation Settlement was fair, reasonable, adequate and in the best interest of the plaintiffs, the class and the Company and awarded to plaintiffs’ counsel attorneys’ fees and expenses in the sum of $19.65 million, payable by the Company within 20 days, and entered an Order and Final Judgment (the “Order”) approving the Litigation Settlement. The Order provides for full settlement, satisfaction, compromise and release of all claims that were asserted or could have been asserted in the Litigation, whether on behalf of the class or the Company. The Order is publicly available for inspection at the Office of the Register in Chancery, and on the Court's online electronic filing system, File & ServeXpress.
The Settlement contains no admission of wrongdoing or liability, and may not be deemed to be a presumption as to the validity of any claims, causes of action or other issues. The Settlement was fully paid on May 2, 2019.
The Company is involved in various other claims and legal actions arising in the ordinary course of business, including labor related post-employment matters that in the aggregate amount to approximately $500 thousand. In the opinion of management, the ultimate likely disposition of these matters will not have a material adverse effect on the Company’s consolidated financial position, results of operations or liquidity.
Item 4. MINE SAFETY DISCLOSURES
Not applicable.
28
PART II
Item 5. MARKET FOR REGISTRANT’S COMMON EQUITY, RELATED STOCKHOLDER MATTERS AND ISSUER PURCHASES OF EQUITY SECURITIES
Market Information
At December 31, 2019, the principal market for the Company’s common stock was the Nasdaq Global Capital Market. The Company’s common stock trades under the symbol “EBIX.”
Holders
As of February 28, 2020, there were 30,475,671 shares of the Company’s common stock outstanding. As of February 28, 2020, there were 129 registered holders of record of the Company’s common stock.
Dividends
While the Board of Directors intends to continue to pay quarterly dividends, the Board will make the determination of the amount of future cash dividends, if any, to be declared and paid based on, among other things, the Company's financial condition, funds from operations, the level of its capital expenditures and its future business prospects.
Sales or Issuances of Unregistered Securities
None
Recent Repurchases of Equity Securities
As provided for under previous Board authorized share repurchase plans, throughout 2019 the Company repurchased 95,000 shares of our common stock for a total aggregate purchase price of $4.15 million.
There were no share repurchases during the fourth quarter of the fiscal period ended December 31, 2019, and the maximum number (or approximate dollar value) of shares that may yet be purchased under the current program is $80.1 million.
29
PERFORMANCE GRAPH
The line graph below compares the yearly percentage change in cumulative total stockholder return on our Common Stock for the last five fiscal years with the Nasdaq Stock Market (U.S.) stock index and the Nasdaq Computer Index. The following graph assumes the investment of $100 on December 31, 2014, and the reinvestment of any dividends (rounded to the nearest dollar).
Comparison of Five Year Cumulative Total Return
12/31/2014 | 12/31/2015 | 12/31/2016 | 12/31/2017 | 12/31/2018 | 12/31/2019 | ||||||||||||||||||
EBIX, INC. | $ | 100 | $ | 195 | $ | 341 | $ | 476 | $ | 257 | $ | 203 | |||||||||||
NASDAQ STOCK MARKET (U.S.) | $ | 100 | $ | 106 | $ | 114 | $ | 146 | $ | 140 | $ | 189 | |||||||||||
NASDAQ COMPUTER | $ | 100 | $ | 106 | $ | 119 | $ | 166 | $ | 159 | $ | 240 | |||||||||||
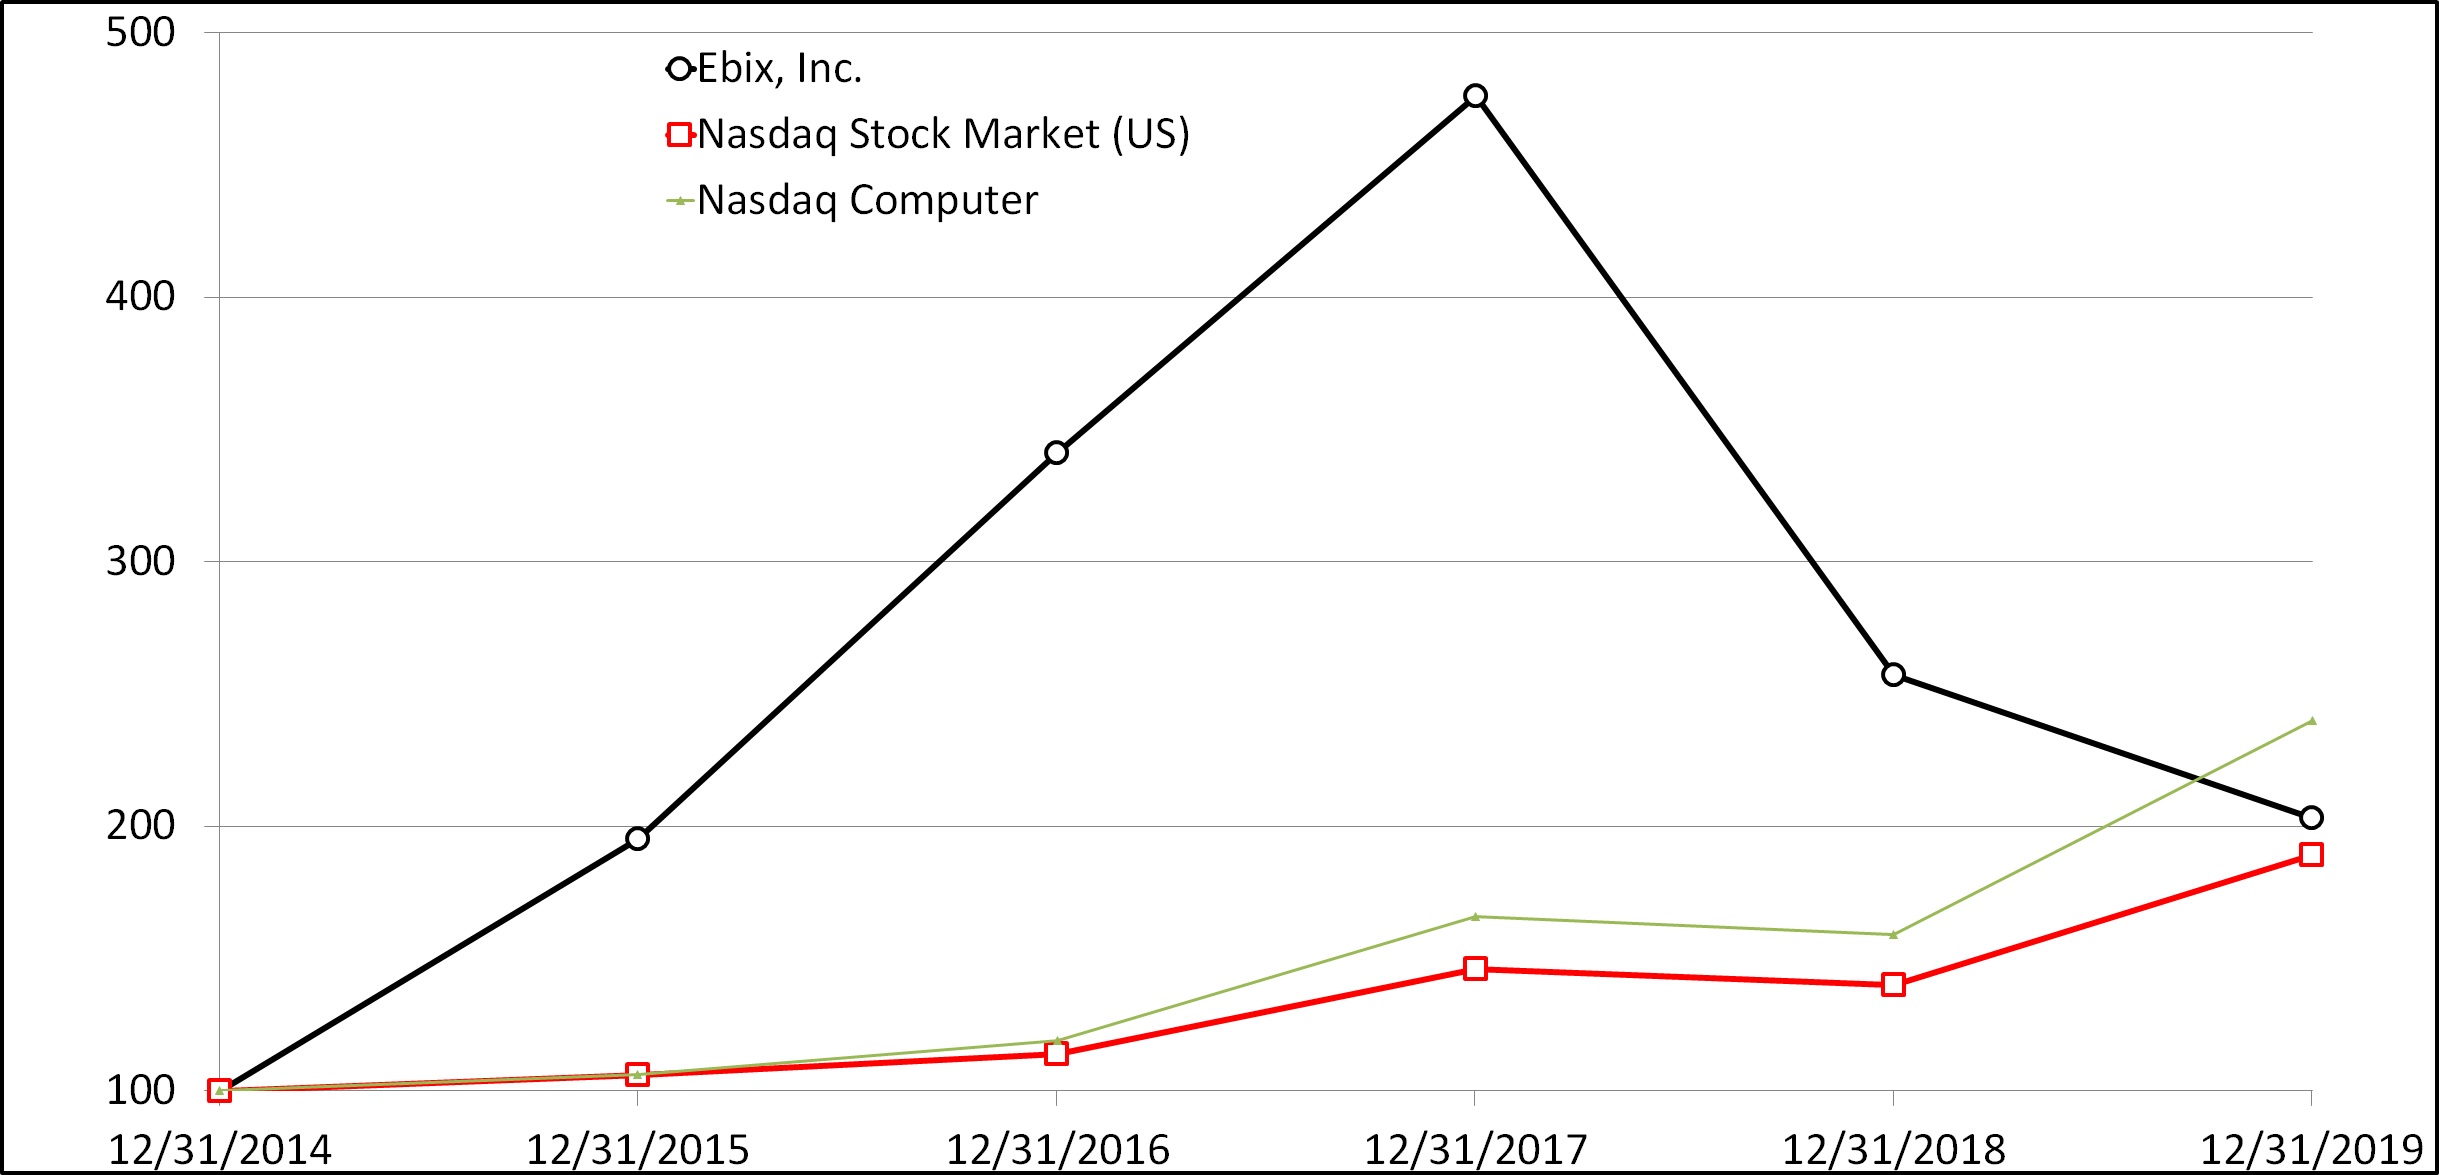
30
Item 6. SELECTED FINANCIAL DATA
The following data for fiscal years 2019, 2018, 2017, 2016, and 2015 should be read in conjunction with “Management’s Discussion and Analysis of Financial Condition and Results of Operations” and with our consolidated financial statements and the related notes and other financial information included herein.
Consolidated Financial Highlights
Year Ended December 31, | ||||||||||||||||||||
2019 | 2018 | 2017 | 2016 | 2015 | ||||||||||||||||
(In thousands, except per share amounts) | ||||||||||||||||||||
Results of Operations: | ||||||||||||||||||||
Revenue | $ | 580,615 | $ | 497,826 | $ | 363,971 | $ | 298,294 | $ | 265,482 | ||||||||||
Operating income | 155,673 | 152,979 | 113,221 | 100,281 | 88,714 | |||||||||||||||
Net income from continuing operations | $ | 96,720 | $ | 93,139 | $ | 100,618 | $ | 93,847 | $ | 79,533 | ||||||||||
Net income per share: | ||||||||||||||||||||
Basic | $ | 3.17 | $ | 2.97 | $ | 3.19 | $ | 2.88 | $ | 2.29 | ||||||||||
Diluted | $ | 3.16 | $ | 2.95 | $ | 3.17 | $ | 2.86 | $ | 2.28 | ||||||||||
Shares used in computing per share data: | ||||||||||||||||||||
Basic | 30,511 | 31,393 | 31,552 | 32,603 | 34,668 | |||||||||||||||
Diluted | 30,594 | 31,534 | 31,719 | 32,863 | 34,901 | |||||||||||||||
Cash dividend per common share | $ | 0.30 | $ | 0.30 | $ | 0.30 | $ | 0.30 | $ | 0.30 | ||||||||||
Financial Position: | ||||||||||||||||||||
Total assets | $ | 1,591,619 | $ | 1,610,947 | $ | 1,113,013 | $ | 803,755 | $ | 675,989 | ||||||||||
Short-term debt* | 23,650 | 19,053 | 14,500 | 12,500 | 600 | |||||||||||||||
Long-term debt* | 693,498 | 700,709 | 385,779 | 260,279 | 206,465 | |||||||||||||||
Redeemable common stock | — | — | — | — | — | |||||||||||||||
Stockholders’ equity | $ | 599,445 | $ | 544,437 | $ | 533,759 | $ | 438,636 | $ | 408,971 | ||||||||||
*Excluding amounts related to deferred financing costs | ||||||||||||||||||||
31
Item 7. MANAGEMENT’S DISCUSSION AND ANALYSIS ("MD&A") OF FINANCIAL CONDITION AND RESULTS OF OPERATIONS
As used herein, the terms “Ebix,” “the Company,” “we,” “our” and “us” refer to Ebix, Inc., a Delaware corporation, and its consolidated subsidiaries as a combined entity.
The information contained in this section has been derived from our historical financial statements and should be read together with our historical financial statements and related notes included elsewhere in this document. The discussion below contains forward-looking statements within the meaning of Section 27A of the Securities Act of 1933, as amended, and Section 21E of the Securities Exchange Act of 1934, as amended. These forward-looking statements involve risks and uncertainties including, but not limited to: demand and acceptance of services offered by us, our ability to achieve and maintain acceptable cost levels, pricing levels and actions by competitors, regulatory matters, general economic conditions, and changing business strategies. Forward-looking statements are subject to a number of factors that could cause actual results to differ materially from our expressed or implied expectations, including, but not limited to our performance in future periods, our ability to generate working capital from operations, the adequacy of our insurance coverage, and the results of litigation or investigations. Our forward-looking statements can be identified by the use of terminology such as “anticipates,” “expects,” “intends,” “believes,” “will” or the negative thereof or variations thereon or comparable terminology. Except as required by law, we undertake no obligation to publicly update or revise any forward-looking statement, whether as a result of new information, future events or otherwise.
OVERVIEW
Ebix endeavors to provide on-Demand software and e-commerce services to the insurance, financial, healthcare and e-learning industries. In the Insurance sector, the Company’s main focus is to develop and deploy a wide variety of insurance and reinsurance exchanges on an on-demand basis, while also, providing Software-as-a-Service ("SaaS") enterprise solutions in the area of CRM, front-end & back-end systems, outsourced administrative and risk compliance, across the world. The P&C exchanges operate primarily in Australia, New Zealand and the United Kingdom. With a "Phygital” strategy that combines 320,000 physical distribution outlets in many (“ASEAN”) countries, to an Omni-channel online digital platform, the Company’s EbixCash Financial exchange portfolio encompasses leadership in areas of domestic & international money remittance, Forex, travel, pre-paid & gift cards, utility payments, lending, wealth management etc., in India. The Company’s Forex Exchange has a dominant market share of India’s airport Foreign Exchange business encompassing 26 international airports like Delhi, Mumbai, Hyderabad, Chennai and Kolkata International airports, while conducting over $4.8 Billion in gross transaction value per annum. EbixCash’s inward remittance business in India conducts gross annual remittance of approximately $5 billion annually, while having an undisputed leadership position in the Indian markets. EbixCash, through its travel portfolio of Via and Mercury, is also one of Southeast Asia’s leading travel exchanges with over 2,200+ employees, 212,450+ agent network, 25 branches and 9800+ corporate clients; processing an estimated $2.5 Billion in GMV annually. Through its various SaaS-based software platforms, Ebix employs thousands of domain-specific technology professionals to provide products, support and consultancy to thousands of customers on six continents.
Ebix provides application software products for the insurance industry including carrier systems, agency systems and exchanges, as well as custom software development. Approximately 83% of the Company’s revenues are recurring. Rather than license our products in perpetuity, we typically either license them for a few years with ongoing support revenues or license them on a limited term basis using a subscription hosting or Application Service Provider ("ASP") model. Our goal is to be the leading powerhouse of back-end insurance transactions in the world. During 2019, combined subscription-based and transaction-based revenues increased by $104 million to $515 million, while as a percentage of the Company's total revenues increased to 89% in 2019, as compared to 83% 2018. In 2019, subscription based revenues decreased $7 million to $177 million, and as a percentage of the Company's total revenues decreased to 30% in 2019, as compared to 37% in the year 2018.
The Company’s technology vision is on the convergence of all processes in a manner such that data can seamlessly flow from entity to entity once an initial data entry has been made. Our customers include many of the top insurance and financial sector companies in the world.
The insurance and financial markets continue to focus on initiatives to reduce paper-based processes and facilitate improvements in efficiency both at the back-end side and also at the consumer-end side, involving all entities and directly impacts the manner in which insurance and financial products are distributed. Management believes that both the insurance and financial industry will continue to experience significant change and increased efficiencies through online exchanges as reduced paper-based processes are becoming increasingly a norm across the world insurance and financial markets.
Management focuses on a variety of key indicators to monitor operating and financial performance. These performance indicators include measurements of revenue growth, operating income, operating margin, income from continuing operations,
32
diluted earnings per share, and cash provided by operating activities. We monitor these indicators, in conjunction with our corporate governance practices, to ensure that our business is efficiently managed and that effective controls are maintained.
The MD&A discusses year-to-year comparisons between 2019 and 2018. Discussions of year-to-year comparisons between 2018 and 2017 not included in this Form 10-K, but can be found in “Management’s Discussion and Analysis of Financial Condition and Results or Operations” in the Company’s Annual Report on Form 10-K for the fiscal year ended December 31, 2018 filed with the SEC on March 1, 2019.
The key performance indicators for the twelve months ended December 31, 2019, 2018, and 2017 were as follows:
Key Performance Indicators Twelve Months Ended December 31, | ||||||||||||
(In thousands except per share data) | 2019 | 2018 | 2017 | |||||||||
Revenue | $ | 580,615 | $ | 497,826 | $ | 363,971 | ||||||
Revenue growth | 17 | % | 37 | % | 22 | % | ||||||
Operating income | $ | 155,673 | $ | 152,979 | $ | 113,221 | ||||||
Net income attributable to Ebix, Inc. | $ | 96,720 | $ | 93,139 | $ | 100,618 | ||||||
Diluted earnings per share | $ | 3.16 | $ | 2.95 | $ | 3.17 | ||||||
Cash provided by operating activities | $ | 60,793 | $ | 87,286 | $ | 76,807 | ||||||
RESULTS OF OPERATIONS
Year Ended December 31, | ||||||||||||
2019 | 2018 | 2017 | ||||||||||
(In thousands) | ||||||||||||
Operating revenue: | $ | 580,615 | $ | 497,826 | $ | 363,971 | ||||||
Operating expenses: | ||||||||||||
Costs of services provided | 205,165 | 168,415 | 129,494 | |||||||||
Product development | 45,302 | 39,078 | 33,854 | |||||||||
Sales and marketing | 19,578 | 17,587 | 16,303 | |||||||||
General and administrative, net (see Note 1) | 140,429 | 108,475 | 59,976 | |||||||||
Amortization and depreciation | 14,468 | 11,292 | 11,123 | |||||||||
Total operating expenses | 424,942 | 344,847 | 250,750 | |||||||||
Operating income | 155,673 | 152,979 | 113,221 | |||||||||
Interest income (expense), net | (41,703 | ) | (26,665 | ) | (11,672 | ) | ||||||
Other non-operating income | 337 | 60 | — | |||||||||
Non-operating expense - securities litigation | (21,140 | ) | — | — | ||||||||
Foreign exchange gain (loss), net | (2,376 | ) | (792 | ) | 1,811 | |||||||
Income before taxes | 90,791 | 125,582 | 103,360 | |||||||||
Income tax expense | (220 | ) | (32,501 | ) | (777 | ) | ||||||
Net income including noncontrolling interest | $ | 90,571 | $ | 93,081 | $ | 102,583 | ||||||
Net income attributable to noncontrolling interest | (6,149 | ) | $ | (58 | ) | $ | 1,965 | |||||
Net income attributable to Ebix, Inc. | $ | 96,720 | $ | 93,139 | $ | 100,618 | ||||||
TWELVE MONTHS ENDED DECEMBER 31, 2019 AND 2018
Operating Revenue
The Company derives its revenues primarily from subscription and transaction fees pertaining to services delivered over our exchanges or from our application service provider "ASP" platforms, fees for business process outsourcing services, and fees for software development projects including associated fees for consulting, implementation, training, and project management provided to customers with installed systems, e-governance solutions to governmental agencies in the health and education sectors, as well as foreign exchange, remittance (both inward and outward) and related services, including travel, from our new financial exchange.
33
Ebix’s revenue streams come from three product/service channels. Presented in the table below is the breakout of our revenues for each of those product/service channels for the years ended December 31, 2019 and 2018.
For the Year Ended | ||||||||
December 31, | ||||||||
(In thousands) | 2019 | 2018 | ||||||
EbixCash Exchanges | 319,953 | 217,457 | ||||||
Insurance Exchanges | 190,067 | 192,604 | ||||||
Risk Compliance Solutions | 70,595 | 87,765 | ||||||
Totals | $ | 580,615 | $ | 497,826 | ||||
In the table above for the year ending December 31, 2019 and 2018 respectfully, there is $4.3 million, and $3.4 million of Insurance Exchange revenues derived in India that are being reported within the EbixCash Exchange channel only above.
During the twelve months ended December 31, 2019, our total revenue increased $82.8 million, or 16.6%, to $580.6 million compared to $497.8 million in 2018. The Company leverages product cross-selling opportunities across all channels, as facilitated by our operating philosophy and business acquisition strategy. With respect to business acquisitions completed during the fiscal years 2019 and 2018 on a pro forma basis, as disclosed in the table in Note 4 “Pro Forma Financial Information” to the enclosed Consolidated Financial Statements, combined unaudited pro forma revenues increased $4.2 million or 0.7% to $581.1 million for the year 2019 from the $577.0 million of pro forma revenue for the year 2018, whereas there was a 16.6% increase in reported revenues for the same comparative periods. The cause for the difference between the 16.6% increase in reported 2019 revenue versus 2018 revenue, as compared to the essentially flat 2019 pro forma versus 2018 pro forma revenue is due to the effect of combining the additional revenue derived from those businesses acquired during the years 2019 and 2018, specifically Pearl, Weizmann, Lawson, Business Travels, Routier, AHA Taxis, Miles, Leisure Corp, Mercury, Indus, Smartclass, Centrum, Transcorp, ItzCash, YouFirst, Wall Street, Paul Merchants,Via and beBetter, with the Company's pre-existing operations. The 2019 and 2018 pro forma financial information below assumes that all such business acquisitions were made on January 1, 2018, whereas the Company's reported financial statements for 2019 only includes the operating results from the businesses since the effective date that they were acquired by Ebix, and thusly includes twelve months of Zillious, twelve months of Essel Forex, and eight months of Wallstreet Canada. Similarly, the 2018 pro forma financial information below includes a full year of results for Transcorp, Centrum, Smartclass, Indus, Mercury, Leisure, Miles, Routier, Business Travels, AHA Taxis, Pearl, Weizmann and Lawson as if they had been had been acquired on January 1, 2018, whereas the Company's reported financial statements for the 2018 includes only eleven months of Transcorp, nine months of Centrum, nine months of Smartclass, six months of Indus, six months of Mercury, six months of Leisure, five months of Miles, three months of Routier, three months of Business Travels, three months of AHA Taxis, one month of Pearl, one month of Weizmann and one month of Lawson.
The unaudited pro forma analysis is based on the following premises:
• | 2019 and 2018 pro forma revenue contains actual revenue of the acquired entities before acquisition date, as reported by the sellers, as well as actual revenue of the acquired entities after acquisition. Growth in revenues of the acquired entities after acquisition date is only reflected for the period after their acquisition. |
• | Revenue billed to existing clients from the cross selling of acquired products has been assigned to the acquired section of our business. |
• | Any existing products sold to new customers acquired through the acquisition customer base, has also been assigned to the acquired section of our business. |
• | 2018 pro forma revenues include revenues from some product lines whose sale was discontinued after the acquisition date and revenues from some customers whose contracts were discontinued. This is typically done for efficiency and/or competitive reasons. |
The impact from fluctuations of the exchange rates for the foreign currencies in the countries in which we conduct operations also partially adversely affected reported revenues. During each of the years 2019 and 2018 the change in foreign currency exchange rates decreased reported consolidated operating revenues by $(9.3) million, $(6.9) million, respectively.
The specific components of our revenue and the changes experienced during the past year are discussed immediately below.
Overall Exchange revenues increased $100.0 million or 24% as explained below:
34
•Insurance Exchange division revenues decreased by $2.5 million or 1%, principally due to challenges faced in our health content services channel, and the negative effect of foreign exchange losses associated with the strengthening U.S. dollar
•EbixCash Exchange division revenues increased $102.5 million, or 47%, due to a mix of inherent business growth and business acquisitions in the travel, foreign exchange, and software solutions sectors, offset by foreign exchange losses associated with the strengthening of the US Dollar.
•Risk Compliance Solutions division revenues decreased by $17.2 million, or 20%, primarily due to a decline in our U.S. professional consulting services associated with some major realignments in the sector
Costs of Services Provided
Costs of services provided, which includes costs associated with customer support, consulting, implementation, and training services, increased $36.8 million or 22%, from $168.4 million in 2018 to $205.2 million in 2019 and the Company's gross margin decreased to 64.7% in 2019 from 66.2% in 2018. The increase in the Company's costs of services provided and the slight decrease in the gross margin realized is due primarily to additional software development, consulting, customer support costs associated with the EbixCash Exchange operations in India.
Product Development Expenses
The Company’s product development efforts are focused on the development of new technologies for insurance carriers, brokers and agents, and the development of new data exchanges for use in domestic and international insurance markets, and the foreign exchange and travel sectors. Product development expenses increased $6.2 million, or 16%, from $39.1 million in 2018 to $45.3 million in 2019. This increase is primarily due to additional personnel costs associated with the 2018 business acquisitions of Miles and Indus.
Sales and Marketing Expenses
Sales and marketing expenses increased $2.0 million, or 11%, from $17.6 million in 2018 to $19.6 million in 2019. This increase is primarily due to advertising and marketing costs associated incurred in India to support our rapidly growing EbixCash foreign exchange, travel, and wealth management businesses.
General and Administrative Expenses
General and administrative ("G&A") expenses increased $32.0 million, or 29%, from $108.5 million in 2018 to $140.4 million in 2019. This increase in G&A expenses is partially due to a $12.1 million accounts receivable reserve that was recognized in the third quarter, as a precautionary measure in regards to receivables that are due from a public sector entity in India and were billed during the 2016 through 2019 operating periods. Payment of these receivables has been delayed due to liquidity issues at BSNL. The Government of India has recently approved funding to BSNL and the Company expects the accounts to be collectible once the Government funding reaches BSNL. Also contributing to the increase in G&A expenses were approximately $7.0 million of additional personnel costs primarily in support of our foreign currency exchange ("Forex") and travel services business operations, $7.6 million of commission costs associated with the Forex business, and $15.7 million of additional facility costs primarily associated with our expanding operations in India. Partially offsetting these increased costs was a $(15.4) million reduction of acquisition earnout accrual for ItzCash.
Amortization and Depreciation Expenses
Amortization and depreciation expenses increased to $3.2 million or 28% to $14.5 million in 2019 from $11.3 million in 2018 primarily due to the amortization of intangible assets associated with the Company's 2018 India acquisitions.
Interest Income
Interest income increased $193 thousand, or 44%, from $436 thousand in 2018 to $629 thousand in 2019 due to the increase in restricted cash balances.
Interest Expense
Interest expense increased $15.2 million, or 56% from $27.1 million in 2018 to $42.3 million in 2019. Interest expense increased primarily due to the increase in the average outstanding balance on our commercial banking credit facilities, which increased 30% to $722.7 million during twelve months ending December 31, 2019 from $554.0 million during twelve months
35
ending December 31, 2018. Additionally, interest expense increased due to increased balances in the working capital facility of our EbixCash operations in India which carry interest rates 9% to 10%.
Foreign Exchange Loss
Net foreign exchange loss of $2.4 million in 2019 consisted of $1.3 million of losses realized upon the settlement of certain transactions within our foreign operations that were denominated in a currency other than the subsidiary's functional currency and $1.1 million of losses recognized upon the remeasurement of other transactions within our foreign operations that were denominated in a currency other than the subsidiary's functional currency.
Income Taxes
The Company recognized income tax expense of $220 thousand in 2019 compared to $32.5 million of income tax expense in 2018, representing a decrease of $32.3 million. Our effective tax rate decreased to 0.2% in 2019, compared with 25.9% in 2018. Effective tax rate in 2018 was substantially higher due to the recording of the Transition tax resulting from enactment of the TCJA in 2018. Excluding this, the remaining decrease in the effective tax rate in 2019 versus 2018 has been primarily on account of prior year true-ups. Certain units of our development operations in India are entitled to tax holiday benefits ranging from 50% of taxable income to 100% of taxable income, which also has the effect of lower effective tax rate.
The pre-tax income from and the applicable statutory tax rates in each jurisdiction in which the Company had operations for the year ending December 31, 2019 are as follows:
(In thousands) | Pre-tax income | Statutory tax rate | ||||
United States | (47,574 | ) | 21.0 | % | ||
Canada | (134 | ) | 26.5 | % | ||
Brazil | 2,501 | 34.0 | % | |||
Australia | 3,027 | 30.0 | % | |||
Singapore | 6,276 | 17.0 | % | |||
New Zealand | 1,986 | 28.0 | % | |||
India | 57,489 | 34.6 | % | |||
Mauritius | 15,257 | 3.0 | % | |||
United Kingdom | 1,116 | 19.0 | % | |||
Sweden | 5,038 | 22.0 | % | |||
Thailand | (29 | ) | 20.0 | % | ||
Dubai | 45,838 | — | % | |||
Total | 90,791 | |||||
LIQUIDITY AND CAPITAL RESOURCES
Our principal sources of liquidity are the cash flows provided by our operating activities, and cash and cash equivalents on hand.
We intend to continue to utilize cash flows generated by our ongoing operating activities, in combination with possibly expanding our commercial lending facility, and the possible issuance of additional equity or debt securities to fund capital expenditures and organic growth initiatives, to make strategic business acquisitions, to retire outstanding indebtedness, and to repurchase shares of our common stock if and as market and operating conditions warrant.
We believe that anticipated cash flow provided by our operating activities, together with current cash balances and access to credit and the capital markets, if required, will be sufficient to meet our projected cash requirements for the next twelve months, although any projections of future cash needs, cash flows, and the general market conditions for credit and equity securities is subject to substantial uncertainty. In the event additional liquidity needs arise, we may raise funds from a combination of sources, including the potential issuance of debt or equity securities. However, there are no assurances that such financing will be available in amounts or on terms acceptable to us, if at all.
36
We regularly evaluate our liquidity requirements, including the need for additional debt or equity offerings, when considering potential business acquisitions, or the development of new products or services. During 2020, the Company intends to utilize its cash and other financing resources to fund organic growth initiatives, strategic business acquisitions, and new product development initiatives and service offerings.
Our cash and cash equivalents were $73.2 million and $137.9 million at December 31, 2019 and 2018, respectively. The Company holds material cash and cash equivalent balances overseas in foreign jurisdictions. The free flow of cash from certain countries where we hold such balances may be subject to repatriation tax effects and other restrictions. Furthermore, the repatriation of earnings from some of our foreign subsidiaries would result in the application of withholding taxes at source and taxation at the U.S. parent level upon receipt of the repatriation amounts. The approximate cash, cash equivalents, restricted cash, and short-term investments balances held in our domestic U.S. operations and each of our foreign subsidiaries as of February 24, 2020 is presented in the table below (figures denominated in thousands):
Cash, Restricted Cash and ST investments | |||
India | 75,385 | ||
United States | 15,270 | ||
Australia | 7,512 | ||
Philippines | 7,400 | ||
Europe | 3,521 | ||
Indonesia | 3,145 | ||
Canada | 2,245 | ||
New Zealand | 1,348 | ||
Singapore | 1,020 | ||
Latin America | 851 | ||
United Arab Emirates | 509 | ||
Mauritius | 9 | ||
Total | 118,215 | ||
Our current ratio increased to 1.55 at December 31, 2019 from 1.35 at December 31, 2018, and our working capital position increased to $129.0 million at December 31, 2019 as compared to $110.0 million at the end of 2018. The increase in our short-term liquidity position is primarily due to the following factors: (a) a $56.3 million reduction in other current liabilities primarily due to India Acquisition Consideration Contingencies at the end of 2018 paid in 2019; (b) a $27.2 million decrease in trade accounts payable; and, (c) Partially offset by a $64.6 million decrease in Cash and Cash Equivalents primarily due to funding of our 2018 India acquisitions. We believe that our ability to generate sustainable robust cash flow from operations will enable the Company to continue to meet its debt obligations and to fund its current liabilities from current assets, including available cash balances.
Business Combinations
The Company executes strategic business acquisitions in combination with organic growth initiatives as part of its expansion and growth strategy. The Company looks to acquire businesses that are complementary to Ebix's existing products and services.
During the year ended December 31, 2019, the Company completed three business acquisitions, as follows:
Wallstreet Canada- Effective August 23, 2019, Ebix acquired Canada based Wallstreet Canada, a foreign exchange and outward remittance service provider for approximately $2.1 million inclusive of net acquired working capital. The valuation and purchase price allocation remains preliminary and will be finalized as soon as practicable but in no event longer than one year from the effective date of this transaction.
37
Essel Forex- Effective January 1, 2019, Ebix acquired the assets of India based Essel Forex, for approximately $8.7 million, plus possible future contingent earn-out payments of up to $721 thousand based on earned revenues. Ebix funded the entire transaction in cash, using its internal cash reserves. Essel Forex is a large provider of foreign exchange services in India with a wide spectrum of related products including sales of all major currencies, travelers’ checks, demand drafts, remittances, money transfers and prepaid cards primarily for corporate clients. The Company has determined that the fair value of the contingent earn-out consideration is $396 thousand as of December 31, 2019.
Zillious- Effective January 1, 2019, Ebix acquired an 80% controlling stake in India based Zillious for $10.1 million plus possible future contingent earn-out payments of up to $2.2 million based on agreed milestones in the acquisition agreement. Zillious is an on-demand SaaS travel technology solution in the corporate travel segment in India. The Company has determined that the fair value of the contingent earn-out consideration is $1.5 million as of December 31, 2019.
During the year ended December 31, 2018, the Company completed thirteen business acquisitions, as follows
Weizmann- Effective December 1, 2018, Ebix entered into an agreement to acquire 74.84% controlling stake in India based Weizmann for $63.1 million. Ebix also made a 90-day time bound public offer to acquire the remaining 25.16% publicly-held Weizmann Forex shares for approximately $21.1 million to public shareholders. The $77.35 million reported in the consolidated statement of cash flows used for investing activities includes a decrease in previously reported cash acquired of $1.5 million and $12.7 million for an additional 15.1% of the publicly-held Weizmann Forex shares during 2019. As of December 31, 2019, Ebix has approximately 89.94% of the controlling stake in India based Weizmann.
Pearl- Effective December 1, 2018, Ebix acquired the assets of India based Pearl, a provider of a comprehensive range of B2B and B2C travel services, under the brand name ‘Sastiticket’, ranging from domestic and international ticketing, incentives travel, leisure products, luxury holidays, and travel documentation for $3.4 million and has been integrated with Ebix Travels’ operations, which has brought in operational synergies and certain redundancies for the acquired operations.
Lawson- Effective December 1, 2018, Ebix acquired India based Lawson, a B2B provider of travel services and international ticketing, for $2.7 million and has been integrated with EbixCash Travels’ operations to bring in operational synergies and wider country wide footprint.
AHA Taxis- Effective October 1, 2018, Ebix acquired a 70% stake in India based AHA Taxis, a platform for on-demand inter-city cabs in India for $382 thousand. Consideration of $71 thousand was paid during the fourth quarter of 2018, $214 thousand during the first quarter of 2019, and $72 thousand remains to be paid. AHA focuses its attention on Corporate and Consumer inter-city travel primarily with a network of thousands of registered AHA Taxis.
Routier- Effective October 1, 2018, Ebix acquired a 67% stake in India based Routier, a marketplace for trucking logistics for $413 thousand.
Business Travels- Effective October 1, 2018, Ebix acquired the assets of India based Business Travels for $1.1 million and same has been integrated with Ebix Travels’ operations to expand the wholesale travel and consolidation business. Consideration of $414 thousand was paid during the fourth quarter of 2018 and $689 thousand during the first quarter of 2019.
Miles - Effective August 1, 2018, Ebix entered into an agreement to acquire India based Miles, a provider of on-demand software on wealth and asset management to banks, asset managers and wealth management firms, for approximately $18.3 million, plus possible future contingent earn-out payments of up to $8.3 million based on earned revenues over the subsequent twenty-four month period following the effective date of the acquisition. The Company has determined that the fair value of the contingent earn-out consideration is $7.7 million as of December 31, 2019.
Leisure - Effective July 1, 2018, Ebix entered into an agreement to acquire India based Leisure for approximately $1.6 million, with the goal of creating a new travel division to focus on a niche segment of the travel market.
Mercury - Effective July 1, 2018, Ebix entered into an agreement to acquire India based Mercury Travels for approximately $13.2 million, with the goal of creating a new travel division to focus on a niche segment of the travel market. Mercury’s Forex business has been integrated into EbixCash’s existing forex business.
Indus - Effective July 1, 2018, Ebix entered into an agreement to acquire India based Indus, a global provider of enterprise lending software solutions to financial institutions, captive auto finance and telecom companies, for approximately $22.9 million plus possible future contingent earn-out payments of up to $5.0 million based on the agreed upon revenues and EBITDA milestones
38
achieved over the subsequent twenty-four month period following the effective date of the acquisition. The Company has determined that the fair value of the contingent earn-out consideration is zero as of December 31, 2019.
Centrum - Effective April 1, 2018, Ebix entered into an agreement to acquire India based Centrum, a leader in India’s Foreign Exchange Operation markets for approximately $179.5 million. This acquisition was completed in June 2018. Subsequently, Centrum has been renamed as EbixCash World Money and has been tightly integrated into the EbixCash Exchange in India and abroad, with key business executives of Centrum's foreign exchange operations becoming an integral part of the combined EbixCash senior leadership.
Smartclass - Effective April 1, 2018, Ebix entered into an agreement to acquire a 60% stake in India based Smartclass, a leading e-learning Company engaged in the business of education services, development of education products, and implementation of education solutions for K-12 Schools through its E-Learning Venture. Under the terms of the agreement Ebix paid $8.6 million in cash for its stake in Smartclass.
Transcorp - Effective February 1, 2018, Ebix acquired the MTSS Business of Transcorp, for upfront cash consideration in the amount of $7.25 million, of which $6.55 million was funded with cash and $700 thousand assumed in liabilities. MTSS operations of Transcorp has been consolidated with EbixCash’s MTSS operations resulting in operational synergies and certain redundancies to the combined operation.
As cited in the above paragraphs, the purchase price consideration for many of the Company's business acquisitions involves a potential future cash earnout based on reaching certain specified targets agreed with the sellers in the respective acquisition agreements. These contingent consideration liabilities are recorded at fair value on the acquisition date and are re-measured regularly based on the then assessed fair value and adjusted if necessary. As of December 31, 2019, the total of these contingent liabilities was $10.1 million, of which $1.5 million is reported in long-term liabilities, and $8.6 million is included in current liabilities in the Company's Consolidated Balance Sheet. As of December 31, 2018 the total of these contingent liabilities was $25.0 million of which $11.2 million was reported in long-term liabilities, and $13.8 million was included in current liabilities in the Company's Consolidated Balance Sheet.
Operating Activities
For the twelve months ended December 31, 2019, the Company generated $60.8 million of net cash flow from operating activities compared to $87.3 million for the year ended December 31, 2018, representing a decrease of $26.5 million or 30%. The major sources of cash provided by our operating activities during 2019 included net income of $96.7 million, less $6.1 million of net income attributable to a non-controlling interest, and net of $(16.5) million of non-cash gains recognized when reducing certain earn-out contingent liabilities, $(15.5) million of deferred tax benefits, $14.5 million of depreciation and amortization, $7.1 million of amortization of right-of-use assets, $3.4 million of non-cash share-based compensation, $2.7 million of amortization expense for capitalized software development costs, and $(26.5) million of working capital requirements. The primary cause for the decrease in our operating cash flow was the cash required to fund our substantially increased Gross merchandise value ("GMV") transactions for our travel and foreign exchange business and the $19.7 million paid to settle the derivative litigation matter discussed in Item 3 "Legal Proceedings".
For the twelve months ended December 31, 2018, the Company generated $87.3 million of net cash flow from operating
activities compared to $76.8 million for the year ended December 31, 2017, representing an increase of $10.5 million or 14%. The major sources of cash provided by our operating activities during 2018 included net income of $93.1 million, $(58) thousand of net income attributable to a non-controlling interest, net of $(13.0) million of deferred tax benefits, $11.3 million of depreciation and amortization, $2.8 million of non-cash share-based compensation, $2.2 million of amortization expense for capitalized software development costs, and $(8.3) million of working capital requirements primarily due to increased outstanding trade accounts receivables, contract liabilities and other assets.
Investing Activities
Net cash used for investing activities during the twelve months ended December 31, 2019, totaled $96.7 million and consisted of $105.5 million used for the acquisitions during the year (net of cash acquired), $5.3 million to reacquire Paul Merchant's 10% equity interest in Ebix’s combined international remittance business in India, $4.9 million of capital expenditures mainly in India to support our growing operations, and $8.0 million used and capitalized in connection with the development of software to be sold and marketed, or used internally. Partially offsetting these outflows was $27.0 million from the net maturities of marketable securities (specifically bank certificates of deposit).
39
Net cash used for investing activities during the twelve months ended December 31, 2018, totaled $251.6 million and consisted of $232.6 million used for the acquisitions during the year (net of cash acquired), $3.8 million paid in connection with the fulfillment of earnout payment obligations from a prior business acquisition made in 2017, $8.04 million of capital expenditures mainly in India to support our growing operations, $8.1 million used and capitalized in connection with the development of software to be sold and marketed, and $4.1 million used to purchase marketable securities (specifically bank certificates of deposit). Partially offsetting these outflows was $5.0 million received from Paul Merchants for a 10% equity interest in Ebix’s combined international remittance business in India.
Financing Activities
Net cash used by financing activities during the twelve months ended December 31, 2019, was $905 thousand, and primarily consisted of $13.0 million used to reacquire 295 thousand shares of the Company's common stock, $9.2 million used to pay quarterly dividends to the holders of our common stock, and $15.1 million used to make scheduled payments against the Regions term loan. Partially offsetting this cash outflow was $13.5 million provided by the Company's revolver with Regions, repayment of $6.5 million short term loan that had been made to a third party, and $19.1 million net funds provided by the EbixCash working capital facility in India.
Net cash provided by financing activities during the twelve months ended December 31, 2018, was $248.8 million which consisted of $150.0 million provided by the Company's revolving credit facility with Regions (net of repayments) and $175.5 million provided by the Company's term loan with Regions. Partially offsetting this cash inflow was $40.8 million used to reacquire 797 thousand shares of the Company's common stock, $9.3 million used to pay quarterly dividends to the holders of our common stock, $10.0 million used to make scheduled payments against the Regions term loan, $8.3 million short term loan to a third party, and $8.1 million used by overdraft facilities for our India operations.
Commercial Bank Financing Facility
On February 21, 2018, Ebix, Inc. and certain of its subsidiaries entered into the Sixth Amendment to the Regions Secured Credit Facility, dated August 5, 2014, among the Company, Regions and certain other lenders party thereto. The Sixth Amendment amends the Credit Agreement by increasing its existing credit facility from $450 million to $650 million, to assist in funding its growth. The increase in the bank line was the result of many members of the existing bank group expanding their share of the credit facility and the addition of BBVA Compass and Bank of the West to the Banking Syndicate, which diversifies Ebix’s lending group under the credit facility to ten participants. The syndicated bank group then comprised ten leading financial institutions that include Regions Bank, PNC Bank, BMO Harris Bank, BBVA Compass, Fifth Third Bank, KeyBank, Bank of the West, Silicon Valley Bank, Cadence Bank and Trustmark National Bank. Regions Bank continued to lead the banking group while serving as the administrative and collateral agent. PNC Bank and BMO Harris Bank were added as co-syndication agents, BBVA Compass and Fifth Third Bank as co-documentation agent, while Regions Capital Markets, PNC Capital Markets and BMO Harris Bank acted as joint lead arrangers and joint bookrunners. The new credit facility had the following key components: A five-year term loan for $250 million, with initial repayments starting June 30, 2018 due in the amount $3.13 million for the first eight quarters and increasing thereafter and a five-year revolving credit facility for $400 million. The new credit facility also allows for up to $150 million of incremental facilities.
On April 9, 2018, the Company and certain of its subsidiaries entered into the Seventh Amendment to the Regions Secured Credit Facility increasing the permitted indebtedness in the form of unsecured convertible notes from $250 million to $300 million.
On November 27, 2018, Ebix entered into the Eighth Amendment to the Regions Secured Credit Facility, dated August 5, 2014, among the Company, Regions and certain other lenders party thereto (as amended, the "Credit Agreement") to exercise $101.25 million of its aggregate $150 million accordion option, increasing the total Term Loan Commitment to $301.25 million from $250 million, with initial repayments starting December 31, 2018 due in the amount of $3.77 million for the first six quarters and increasing thereafter. The revolving credit facility increased from $400 million to $450 million. The Credit Agreement carries a leverage-based LIBOR related interest rate, which currently stands at approximately 4.250%. The expanded credit facility will continue to be used to fund the Company's future growth and share repurchase initiatives.
On September 27, 2019, the Company and certain of its subsidiaries entered into the Ninth Amendment (the “Ninth Amendment”) to the Credit Agreement which amended the definition of “Consolidated EBITDA" to add back the derivative legal settlement, “Indebtedness” to disqualify equity interests to be issued regarding the Yatra Online acquisition, and modified the maximum consolidated debt leverage ratios allowed.
At December 31, 2019, the outstanding balance on the revolving line of credit with Regions was $438.0 million and the facility carried an interest rate of 4.25%. This balance is included in the long-term liabilities section of the Consolidated Balance
40
Sheets. During 2019, the average and maximum outstanding balances on the revolving line of credit were $437.2 million and $438.0 million, respectively, and the weighted average interest rate was 4.90%.
At December 31, 2019, the outstanding balance on the term loan was $276.2 million of which $20.7 million is due within the next twelve months. This term loan also carried an interest rate of 4.25%. The current and long-term portions of the term loan are included in the respective current and long-term sections of the Condensed Consolidated Balance Sheets, the amounts of which were $20.7 million and $255.5 million respectively at December 31, 2019.
Contractual Obligations and Commercial Commitments
The following table summarizes our known contractual debt and lease obligations as of December 31, 2019. The table excludes commitments that are contingent based on events or factors uncertain at this time.
Payment Due by Period | ||||||||||||||||||||
Total | Less Than 1 Year | 1 - 3 Years | 3 - 5 Years | More than 5 years | ||||||||||||||||
(In thousands) | ||||||||||||||||||||
Revolving line of credit | $ | 438,037 | $ | — | $ | — | $ | 438,037 | $ | — | ||||||||||
Short and long-term debt | 279,111 | 23,650 | 50,836 | 204,625 | — | |||||||||||||||
Operating leases | 22,432 | 7,289 | 9,061 | 4,491 | 1,591 | |||||||||||||||
Capital leases | 727 | 201 | 350 | 176 | — | |||||||||||||||
Non-Cancelable Operating leases | 97,774 | 27,496 | 48,544 | 21,734 | — | |||||||||||||||
Total | $ | 838,081 | $ | 58,636 | $ | 108,791 | $ | 669,063 | $ | 1,591 | ||||||||||
Off Balance Sheet Transactions
We do not engage in off-balance sheet financing activities.
Inflation
We do not believe that the rate of inflation has had a material effect on our operating results. However, inflation could adversely affect our future operating results.
41
RECENT ACCOUNTING PRONOUNCEMENTS - The following is a brief discussion of recently released accounting pronouncements that are pertinent to the Company's business:
In December 2019 the FASB issued ASU 2019-12, Income Taxes (Topic 740): "Simplifying the Accounting for Income Taxes". ASU 2019-12 is expected to reduce the cost and complexity related to the accounting for income taxes by eliminating the need for an entity to analyze whether the following apply to a given reporting period:
• Exception to the incremental approach for intra period tax allocation;
• Exceptions to accounting for basis differences when there are ownership changes in foreign investments; and
• Exception in interim period income tax accounting for year-to-date losses that exceed anticipated losses.
For public business entities, the amendments in this Update are effective for fiscal years, and interim periods within those fiscal years, beginning after December 15, 2020. The Company not yet assessed the impact that the adoption of this guidance will have on its statement of financial position or its statement of income.
In November 2018, the FASB issued ASU 2018-18, Collaborative Arrangements (Topic 808): "Clarifying the Interaction between Topic 808 and Topic 606 (Revenues from Customers)". ASU 2018-18 clarifies the interaction between the guidance for certain collaborative arrangements and the Revenue Recognition financial accounting and reporting standard. A collaborative arrangement is a contractual arrangement under which two or more parties actively participate in a joint operating activity and are exposed to significant risks and rewards that depend on the activity’s commercial success. The ASU provides guidance on how to assess whether certain transactions between collaborative arrangement participants should be accounted for within the revenue recognition standard. The ASU also provides comparability in the presentation of revenue for certain transactions between collaborative arrangement participants. It accomplishes this by allowing organizations to only present units of account in collaborative arrangements that are within the scope of the revenue recognition standard together with revenue accounted for under the revenue recognition standard. The parts of the collaborative arrangement that are not in the scope of the revenue recognition standard should be presented separately from revenue accounted for under the revenue recognition standard. The amendments in ASU No. 2018-18 are effective for fiscal years beginning after December 15, 2019, and interim periods within those fiscal years.
In August 2018, the FASB issued ASU 2018-13, Fair Value Measurement (Topic 820): "Disclosure Framework-Changes to the Disclosure Requirements for Fair Value Measurement". ASU 2018-13 is intended to improve the effectiveness of ASC 820’s disclosure requirements. The amendments in this ASU are effective for public business entities for fiscal years beginning after December 15, 2019, including interim periods within that fiscal year.
In February 2018, the FASB issued 2018-02, Income Statement-Reporting Comprehensive Income (Topic 220): "Reclassification of Certain Tax Effects from Accumulated Other Comprehensive Income". The ASU provides that the stranded tax effects from the Tax Act in accumulated other comprehensive loss may be reclassified to retained earnings. The amendments in this ASU are effective for all entities for fiscal years beginning after December 15, 2018, and interim periods within those fiscal years.
In January 2017, the FASB issued ASU 2017-04, Intangibles-Goodwill and Other (Topic 350): "Simplifying the Test for Goodwill Impairment". To simplify the subsequent measurement of goodwill, the FASB eliminated Step 2 from the goodwill impairment test. In computing the implied fair value of goodwill under Step 2, an entity had to perform procedures to determine the fair value at the impairment testing date of its assets and liabilities (including unrecognized assets and liabilities). Instead, under the amendments in this ASU, an entity should perform its annual, or interim, goodwill impairment test by comparing the fair value of a reporting unit with its carrying amount. A public business entity filer should adopt the amendments in this ASU for its annual or any interim goodwill impairment tests in fiscal years beginning after December 15, 2019.
In January 2017, the FASB issued ASU 2017-01, Business Combinations (Topic 805): "Clarifying the Definition of a Business" which amended the existing FASB ASC. The standard provides additional guidance to assist entities with evaluating whether transactions should be accounted for as acquisitions (or disposals) of assets or businesses. The definition of a business affects many areas of accounting, including acquisitions, disposals, goodwill, and consolidation. ASU 2017-01 is effective for fiscal 2019 with early adoption permitted. The Company adopted this guidance in 2019 and it had an effect classification certain of its recent acquisitions.
In October 2016, the FASB issued ASU 2016-16, Taxes (Topic 740): "Intra-Entity Transfers of Assets Other Than Inventory". Current GAAP prohibits the recognition of current and deferred income taxes for an intra-entity asset transfer until the asset has been sold to an outside party. This prohibition on recognition is an exception to the principle of comprehensive recognition of current and deferred income taxes in GAAP. The amendments specified by ASU 2016-16 require an entity to recognize the income tax consequences of an intra-entity transfer of an asset other than inventory when the transfer occurs. The
42
amendments eliminate the exception for an intra-entity transfer of an asset other than inventory. Two common examples of assets included in the scope of the amendments are intellectual property, and property, plant and equipment. The amendments do not include new disclosure requirements; however, existing disclosure requirements might be applicable when accounting for the current and deferred income taxes for an intra-entity transfer of an asset other than inventory. The amendments align the recognition of income tax consequences for intra-entity transfers of assets other than inventory with International Financial Reporting Standards. IAS 12, Income Taxes, requires recognition of current and deferred income taxes resulting from an intra-entity transfer of any asset (including inventory) when the transfer occurs. The amendments are effective for public business entities for annual reporting periods beginning after December 15, 2017, including interim reporting periods within those annual reporting periods. Early adoption is permitted for all entities in the first interim period if an entity issues interim financial statements. The amendments should be applied on a modified retrospective basis through a cumulative-effect adjustment directly to retained earnings as of the beginning of the period of adoption. The Company adopted this new standard and it did not have a material effect on its consolidated statement of financial position or statement of income.
In June 2016, the FASB issued ASU 2013-13. Financial Instruments - Credit Losses (Topic 326). The main objective of this ASU is to provide financial statement users with more decision-useful information about the expected credit losses on financial instruments and other commitments to extend credit held by a reporting entity at each reporting date. The measurement of expected credit losses is based on relevant information about past events, including historical experience, current conditions, and reasonable and supportable forecasts that affect the collectibility of the reported amount. An entity must use judgment in determining the relevant information and estimation methods that are appropriate in its circumstances. For public business entities that are U.S. Securities and Exchange Commission (SEC) filers, the amendments in this Update are effective for fiscal years beginning after December 15, 2019, including interim periods within those fiscal years. The Company has receivable that are over one year old that will need to be evaluated under this new standard which the Company will adopt in 2020.
In February 2016, the FASB issued ASU 2016-02, Leases (Topic 842). This new accounting guidance is intended to improve financial reporting about leasing transactions. The ASU affects all companies and other organizations that lease assets such as real estate, airplanes, and manufacturing equipment. The ASU will require organizations that lease assets referred to as “Lessees” to recognize on the balance sheet the assets and liabilities for the rights and obligations created by those leases. An organization is to provide disclosures designed to enable users of financial statements to understand the amount, timing, and uncertainty of cash flows arising from leases. These disclosures include qualitative and quantitative requirements concerning additional information about the amounts recorded in the financial statements. Under the new guidance, a lessee is required to recognize assets and liabilities for leases with lease terms of more than twelve months. Consistent with current GAAP, the recognition, measurement, and presentation of expenses and cash flows arising from a lease by a lessee primarily will depend on its classification as a finance or operating lease. However, unlike current GAAP which requires only capital leases to be recognized on the balance sheet the new ASU requires both types of leases (i.e., operating and capital) to be recognized on the balance sheet. The capital lease is accounted for in substantially the same manner as capital leases are accounted for under existing GAAP. For operating leases there now is the recognition of a lease liability and a lease asset for all such leases greater than one year in term. Public companies are required to adopt the new leasing standard for fiscal years, and interim periods within those fiscal years, beginning after December 15, 2018. We adopted Topic 842 effective January 1, 2019 using a modified retrospective method and will not restate comparative periods. As permitted under the transition guidance, we carried forward the assessment of whether our contracts contain or are leases, classification of our leases and remaining lease terms. See Note 20.
APPLICATION OF CRITICAL ACCOUNTING POLICIES
The preparation of financial statements in conformity with GAAP, as promulgated in the United States, requires our management to make estimates and assumptions that affect the reported amounts of assets and liabilities, revenues and expenses and related disclosures of contingent assets and liabilities in our consolidated financial statements and accompanying notes. We believe the most complex and sensitive judgments, because of their significance to the consolidated financial statements, result primarily from the need to make estimates and assumptions about the effects of matters that are inherently uncertain. The following accounting policies involve the use of “critical accounting estimates” because they are particularly dependent on estimates and assumptions made by management about matters that are uncertain at the time the accounting estimates are made. In addition, while we have used our best estimates based on facts and circumstances available to us at the time, different estimates reasonably could have been used in the current period, or changes in the accounting estimates that we used are reasonably likely to occur from period to period which may have a material impact on our financial condition and results of operations. For additional information about these policies, see Note 1 "Description of Business and Summary of Significant Accounting Policies" of the notes to the consolidated financial statements in this Form 10-K. Although we believe that our estimates, assumptions and judgments are reasonable, they are limited based upon information presently available. Actual results may differ significantly from these estimates under different assumptions, judgments or conditions.
43
Revenue Recognition and Contract Liabilities—The Company derives its revenues primarily from software subscription and transaction fees, software license fees, financial transaction fees, risk compliance solution services fees, and professional service fees including associated fees for consulting, implementation, training, and project management provided to customers with installed systems, and applications. Sales and value-added taxes are not included in revenues, but rather are recorded as a liability until the taxes assessed are remitted to the respective taxing authorities.
The Company determines revenue recognition by applying the following steps:
• | identification of the contract, or contracts, with a customer; |
• | identification of the performance obligations in the contract; |
• | determination of the transaction price; |
• | allocation of the transaction price to the performance obligations in the contract; and |
• | recognition of revenue when, or as, we satisfy a performance obligation. |
The Company analyzes its different services individually to determine the appropriate basis for revenue recognition, as further described below. Additionally, certain services exist in multiple channels. As Ebix derives revenues from three product/service channels—EbixCash Exchanges, Insurance Exchanges, and Risk Compliance Solutions—for policy disclosure purposes, contracts are discussed in conjunction with the channel to which they are most significant.
The Company assesses the terms of customer contracts including termination rights, penalties (implied or explicit), and renewal rights.
Insurance Exchanges
Insurance Exchanges revenues are primarily derived from consideration paid by customers related to our SaaS platforms, related services and the licensing of software. A typical contract for our SaaS platform will also include services for setup, customization, transaction processing, maintenance, and/or hosting. Determining whether products and services are considered distinct performance obligations that should be accounted for separately may require significant judgement. Set-up and customization services, related to our SaaS platforms, are not considered to be distinct from the usage fees associated with the SaaS platform and, accordingly, are accounted for as a single performance obligation. These services along with the usage or transaction fees are recognized over the contract duration which considers the significance of the upfront fees in the context of the contract and which may, therefore, exceed the initial contracted term.
Contracts generally do not contain a right of return or refund provisions. Our contracts often do contain overage fees, contingent fees, or service level penalties which are accounted for as variable consideration. Revenue accounted for as variable consideration is immaterial and is recognized using the “right to invoice” practical expedient when the invoiced amount equals the value provided to the customer.
Software-as-a-Service ("SaaS")
The Company allocates the transaction price to each distinct performance obligation using the relative stand-alone selling price. Determining the stand-alone selling price may require significant judgement. The stand-alone selling price is the price at which an entity has sold or would sell a promised good or service separately to a customer. The Company determines the stand-alone selling price based on observable price of products or services sold separately in comparable circumstances, when such observable prices are available. When standalone selling price is not directly observable, the Company estimates the stand-alone selling price using the market assessment approach by considering historical pricing and other market factors.
Software Licenses
Software license revenues attributable to a software license that is a separate performance obligation are recognized at the point in time that the customer obtains control of the license.
Subscription Services
Subscription services revenues are associated with performance obligations that are satisfied over specific time periods and primarily consist of post-contract support services. Revenue is generally recognized ratably over the contract term. Our subscription contracts are generally for an initial three-year period with subsequent one-year automatic renewals.
44
Transaction Fees
Transaction revenue is comprised of fees applied to the volume of transactions that are processed through our SaaS platforms. These are typically based on a per-transaction rate and are invoiced for the same period in which the transactions were processed and as the performance obligation is satisfied. The amount invoiced generally equals the value provided to the customer, and revenue is typically recognized when invoiced using the as-invoiced practical expedient.
Professional Services
Professional service revenue primarily consists of fees for setup, customization, training, or consulting. Professional service fees are generally on a time and materials basis or a fixed fee. Revenues for time and materials are recognized as such services are rendered while fixed fee revenues are recognized based on the input method driven by the expected hours to complete the project measured against the actual hours completed to date. Professional services, particularly related to SaaS platforms, may have significant dependencies on the related licensed software and may not be considered a distinct performance obligation.
Risk Compliance Services ("RCS")
RCS revenues consist of two revenue streams-Certificates of Insurance (COI) and Consulting Services. COI revenues are derived from consideration paid by customers for the creation and tracking of certificates of insurance. These are transactional-based revenues. Consulting Services revenues are driven by distinct consulting service engagements rendered to customers for which revenues are recognized using the output method on a time and material basis as the services are performed.
COI Creation and Tracking
The Company provides services to issue and track certificates of insurance in the United States and Australian markets. Revenue is derived from transaction fees for each certificate issued or tracked. The Company recognizes revenue at the issuance of each certificate or over the period the certificate is being tracked.
Consulting Services
The Company provides consulting services to clients around the world for project management and development. Consulting services fees are generally on a time and materials basis or a fixed fee. Revenues for time and materials are recognized using an output method as the services are rendered while fixed fee revenues are recognized based on the input method driven by the expected hours to complete the project measured against the actual hours completed to date.
EbixCash Exchanges ("EbixCash")
EbixCash revenues are primarily derived from consideration paid by customers for financial transaction services, including services like transferring or exchanging money. The significant majority of EbixCash revenue is for a single performance obligation and is recognized at a point in time. These revenues vary by transaction based upon channel, send and receive locations, the principal amount sent, whether the money transfer involves different send and receive currencies, and speed of service, as applicable.
EbixCash also offers several other services, including payment services and ticketing and travel services for which revenue is impacted by varying factors. EbixCash acts as the principal in most transactions and reports revenue on a gross basis, as EbixCash controls the service at all times prior to transfer to the customer, is primarily responsible for fulfilling the customer contracts, has the risk of loss, and has the ability to establish transaction prices.
The main services from which EbixCash derives revenue are as follow:
EbixCash Travel Exchanges
EbixCash Travel revenues are primarily derived from commissions and transaction fees received from various travel providers and international exchanges involved in the sale of travel to the consumer. EbixCash Travel revenue is for a single performance obligation and is recognized at a point in time. Travel revenues include reservation commissions, segment fees from global travel exchange providers, and transaction net revenues (i.e., the amount charged to travelers less the amount owed to travel service providers) in connection with our reservation services; ancillary fees, including travel insurance-related revenues and certain reservation booking fees; and credit card processing rebates and customer processing fees. EbixCash Travel services include the sale of hotel rooms, airline tickets, bus tickets and train tickets. EbixCash’s Travel revenue is also derived from ticket sales,
45
wherein the commissions payable to EbixCash Travel, along with any transaction fees paid by travel providers and travel exchanges, is recognized as revenue after completion of the service. The transaction price on such services is agreed upon at the time of the purchase.
EbixCash Travel revenue for the corporate MICE (Meetings, Incentives, Conferences, and Exhibitions) packages is recognized at full purchase value at the completion of the obligation with the corresponding costs recorded under direct expenses. For MICE revenues, EbixCash Travel acts as the principal in transactions, and accordingly reports revenue on a gross basis. EbixCash Travel controls the service at all times prior to transfer to the customer, is responsible for fulfilling the customer contracts, has the risk of loss, and has the ability to establish transaction prices.
EbixCash Money Transfer
For the EbixCash money transfer business, EbixCash has one performance obligation whereupon the customer engages EbixCash to perform one integrated service. This typically occurs instantaneously when the beneficiary entitled to receive the money transferred by the sender visits the EbixCash outlet and collects the money. Accordingly, EbixCash recognizes revenue upon completion of the following: 1) the customer’s acknowledgment of EbixCash’s terms and conditions and the receipt of payment information, 2) the money transfer has been processed, 3) the customer has received a unique transaction identification number, and 4) funds are available to be picked up by the beneficiary. The transaction price is comprised of a transaction fee and the difference between the exchange rate set by EbixCash to the customer and the rate available in the wholesale foreign exchange market, as applicable, both of which are readily determinable at the time the transaction is initiated
Foreign Exchange and Outward Remittance Services
For EbixCash’s foreign exchange and payment services, customers agree to terms and conditions for all transactions, either at the time of initiating a transaction or signing a contract with EbixCash to provide payment services on the customer’s behalf. In the majority of EbixCash’s foreign exchange and payment services, EbixCash makes payments to the recipient to satisfy its performance obligation to the customer, and therefore, EbixCash recognizes revenue on foreign exchange and payment when this performance obligation has been fulfilled.
Consumer Payment Services
EbixCash offers several different bill payment services that vary by considerations such as: 1) who pays the fee to EbixCash (consumer or biller), 2) whether the service is offered to all potential consumers, or only to those for which EbixCash has a relationship with the biller, and 3) whether the service utilizes a physical agent network offered for consumers’ convenience, among other factors. The determination of which party is EbixCash’s customer for revenue recognition purposes is based on these considerations for each of EbixCash’s bill payment services. For all transactions, EbixCash’s customers agree to EbixCash’s terms and conditions, either at the time of initiating a transaction (where the consumer is determined to be the customer for revenue recognition purposes) or upon signing a contract with EbixCash to provide services on the biller’s behalf (where the biller is determined to be the customer for revenue recognition purposes). As with consumer money transfers, customers engage EbixCash to perform one integrated service-collect money from the consumer and process the bill payment transaction, thereby providing the billers real-time or near real-time information regarding their customers’ payments and simplifying the billers’ collection efforts. EbixCash’s revenues from bill payment services are generated from contracts to process transactions at any time during the duration of the contract. The transaction price on bill payment services is contractual and determinable. Certain biller agreements may include per-transaction or fixed periodic rebates, which EbixCash records as a reduction to revenue.
Gift Cards
EbixCash resells gift cards to consumers that can be later redeemed at various merchants. Gift cards are recorded as inventory until sold to the consumer. Gift card revenue is recognized at full purchase value at the time of sale with the corresponding cost of vouchers recorded as under direct expenses.
EbixCash Technology Services
EbixCash also offers on-demand technology to various providers in the area of lending, wealth & asset management, travel and logistics across the world.
46
Allowance for Doubtful Accounts Receivable
Management specifically analyzes the aging of accounts receivable and historical bad debts, write-offs, customer concentrations, customer credit-worthiness, current economic trends, and changes in our customer payment patterns when evaluating the adequacy of the allowance for doubtful accounts receivable.
Valuation of Goodwill
Goodwill represents the cost in excess of the fair value of the identifiable net assets from the businesses that we acquire. In accordance with the relevant FASB accounting guidance, goodwill is tested for impairment at the reporting unit level on an annual basis or on an interim basis if an event occurred or circumstances change that would indicate that fair value of a reporting unit decreased below its carrying value. Potential impairment indicators include a significant change in the business climate, legal factors, operating performance indicators, competition, customer retention and the sale or disposition of a significant portion of the business. The Company first assesses certain qualitative factors to determine whether the existence of events or circumstances would indicate that it is more likely than not that the fair value of our reporting unit was less than its carrying amount.
The aforementioned quantitative testing process involves comparing the reporting unit carrying values to their respective fair values; we determine fair value of our reporting unit by applying the discounted cash flow method using the present value of future estimated net cash flows. If the fair value of a reporting unit exceeds its carrying value, then no further testing is required. However, if a reporting unit’s fair value were to be less than its carrying value, we would then determine the amount of the impairment charge, if any, which would be the amount that the carrying value of the reporting unit’s goodwill exceeded its implied value. We perform our annual goodwill impairment evaluation and testing as of October 1st of each year or when events or circumstances dictate more frequently.
The Company has considered the guidance within ASC 350 “Goodwill and Other Intangible Assets” and ASC 280 “Segment Reporting” in concluding that Ebix effectively operates as one reporting unit. The fair value the Company's reporting unit was thus there was no impairment indicated. During the years ended December 31, 2019, 2018, and 2017, we had no impairment of any our reporting unit goodwill balances.
Projections of cash flows are based on our views of revenue growth rates, operating costs, anticipated future economic conditions, the appropriate discount rates relative to risk, and estimates of residual values and terminal values. We believe that our estimates are consistent with assumptions that marketplace participants would use in their estimates of fair value. The use of different estimates or assumptions for our projected discounted cash flows (e.g., revenue growth rates, future economic conditions, discount rates, and estimates of terminal values) when determining the fair value of our reporting unit could result in different values and may result in a goodwill impairment charge.
Income Taxes
We account for income taxes in accordance with FASB accounting guidance on the accounting and disclosure of income taxes, which involves estimating the Company’s current tax exposure together with assessing temporary differences resulting from differing treatment of items for tax and accounting purposes. These differences result in deferred tax assets and liabilities, which are included in our Consolidated Balance Sheets. We then assess the likelihood that our net deferred tax assets will be recovered from future taxable income in the years in which those temporary differences are expected to be recovered or settled, and, to the extent we believe that recovery is not likely, we establish a valuation allowance.
On December 22, 2017, the TCJA was enacted, substantially changing the U.S. tax system and affecting the Company in a number of ways. Notably, the TCJA: establishes a flat corporate income tax rate of 21.0% on U.S. earnings; imposes a one-time tax on unremitted cumulative non-U.S. earnings of foreign subsidiaries (“Transition Tax”);imposes a new minimum tax on certain non-U.S. earnings, irrespective of the territorial system of taxation, and generally allows for the repatriation of future earnings of foreign subsidiaries without incurring additional U.S. taxes by transitioning to a territorial system of taxation; subjects certain payments made by a U.S. company to a related foreign company to certain minimum taxes (Base Erosion Anti-Abuse Tax); eliminates certain prior tax incentives for manufacturing in the United States and creates an incentive for U.S. companies to sell, lease or license goods and services abroad by allowing for a reduction in taxes owed on earnings related to such sales; allows the cost of investments in certain depreciable assets acquired and placed in service after September 27, 2017 to be immediately expensed; and reduces deductions with respect to certain compensation paid to specified executive officers.
In March 2018, the FASB Issued ASU No. 2018-05, Income Taxes (Topic 740): Amendments to SEC Paragraphs Pursuant to SEC SAB No. 118. ASU 2018-05 was issued to incorporate into Topic 740 recent SEC guidance related to the income
47
tax accounting implications of the TCJA. Due to the complexities involved in accounting for the enactment of the TCJA, the SEC Staff had issued SAB No. 118 which allowed the Company to record provisional amounts in earnings for the year ended December 31, 2017. ASU 2018-05 became effective immediately and permitted companies to use provisional amounts for certain income tax effects of the TCJA during a one-year measurement period. The Transition Tax is based on the Company’s total post-1986 earnings and profits that were previously deferred from U.S. income taxes. The Company completed its tax accounting for the TCJA during Q4 2018 and recorded an adjustment of $24.53 million related to the transition tax after taking into consideration carried forward NOLs and other tax attributes available for set-off.
The Company does not recognize a deferred U.S. tax liability and associated income tax expense for the undistributed earnings of its foreign subsidiaries, which are considered indefinitely invested because those foreign earnings will remain permanently reinvested in those subsidiaries to fund ongoing operations and growth.
The Company follows the provisions of FASB accounting guidance on accounting for uncertain income tax positions. This guidance clarified the accounting for uncertainty in income taxes by prescribing the minimum recognition threshold a tax position is required to meet before being recognized in the financial statements. The guidance utilizes a two-step approach for evaluating tax positions. Recognition (“Step 1”) occurs when an enterprise concludes that a tax position, based solely on its technical merits is more likely than not to be sustained upon examination. Measurement (“Step 2”) is only addressed if Step 1 has been satisfied. Under Step 2, the tax benefit is measured at the largest amount of benefit, determined on a cumulative probability basis that is more likely than not to be realized upon final settlement. As used in this context, the term “more likely than not” is interpreted to mean that the likelihood of occurrence is greater than 50%.
Foreign Currency Translation
The functional currency for the Company's main foreign subsidiaries in India, Dubai and Singapore is the U.S. dollar because the intellectual property research and development activities provided by its Singapore and Dubai subsidiaries, and the product development and information technology enabled services activities for the insurance industry provided by its India subsidiary, both in support of Ebix's operating divisions across the world, are transacted in U.S. dollars.
The functional currency of the Company's other foreign subsidiaries is the local currency of the country in which the subsidiary operates. The assets and liabilities of these foreign subsidiaries are translated into U.S. dollars at the rates of exchange at the balance sheet dates. Income and expense accounts are translated at the average exchange rates in effect during the period. Gains and losses resulting from translation adjustments are included as a component of accumulated other comprehensive income in the accompanying consolidated balance sheets. Foreign exchange transaction gains and losses that are derived from transactions denominated in a currency other than the subsidiary's functional currency are included in the determination of net income.
48
Item 7A. QUANTITATIVE AND QUALITATIVE DISCLOSURES ABOUT MARKET RISK
The Company is subject to certain market risks, including foreign currency exchange rates and interest rates. The Company’s exposure to foreign currency exchange rates risk is related to our foreign-based operations where transactions are denominated in foreign currencies and are subject to market risk with respect to fluctuations in the relative value of those currencies. A significant portion of the Company’s operations are based in the U.S., and furthermore the functional currencies in our India, Singapore, and Dubai product development centers is the U.S. dollar; accordingly a large portion of our business transactions are denominated in U.S. dollars. However, the Company has operations in Australia, India, New Zealand, Great Britain, Canada, Brazil, Dubai, Singapore, Philippines, Indonesia, and United Arab Emirates where we conduct transactions in the local currencies of each of these locations. There can be no assurance that fluctuations in the value of those foreign currencies will not have a material adverse effect on the Company’s business, operating results, revenues or financial condition. During the years of 2019 and 2018 the net change in the cumulative foreign currency translation account, which is a component of stockholders’ equity, was an unrealized losses of $15.0 million, and $39.4 million, respectively. The Company considered the historical trends in currency exchange rates and determined that it was reasonably possible that adverse changes in our respective foreign currency exchange rates of 20% could possibly be experienced in the near term future. Such an adverse change in currency exchange rates would have resulted in a reduction to pre-tax income of approximately $14.8 million and $15.8 million for the years ended December 31, 2019 and 2018, respectively.
The Company’s exposure to interest rate risk relates to its interest expense on outstanding debt obligations and to its interest income on existing cash balances. As of December 31, 2019, the Company had $717.2 million of outstanding debt obligations, excluding amounts related to deferred financing costs, which consisted of a $276.2 million term loan, a $438.0 million balance on our commercial banking revolving line of credit, a $1.8 million note due to IHC by the EbixHealth JV, and $1.2 million of remaining debt pertaining to the Weizmann acquisition. The Company’s revolving line of credit bears interest at the rate of LIBOR + 2.25%, and stood at 4.25% at December 31, 2019. The Company is exposed to market risk in relation to this line of credit and secured term loan in regards to the potential increase to interest expense arising from adverse changes in the LIBOR interest rates. This interest rate risk is estimated as the potential decrease in earnings resulting from a hypothetical 30% increase in the LIBOR rate. Such an adverse change in the LIBOR rate would have resulted in a reduction to pre-tax income of approximately $5.7 million and $3.8 million for the years ending December 31, 2019 and 2018, respectively. The Company’s average cash balances and short term investments during 2019 were $124.6 million and its existing cash balances as of December 31, 2019 was $73.2 million and short term investments was $4.4 million. The Company is exposed to market risk in relation to these cash balances in regards to the potential loss of interest income arising from adverse changes in interest rates. This interest rate risk is estimated as the potential decrease in earnings resulting from a hypothetical 20% decrease in interest rates earned on deposited funds. Such an adverse change in these interest rates would have resulted in a reduction to pre-tax income of approximately $359 thousand and $365 thousand for the years ended December 31, 2019 and 2018, respectively.
49
Item 8. FINANCIAL STATEMENTS AND SUPPLEMENTARY DATA
50
REPORT OF INDEPENDENT REGISTERED PUBLIC ACCOUNTING FIRM
To the Stockholders and the Board of Directors of Ebix, Inc.
Opinion on the Financial Statements
We have audited the accompanying consolidated balance sheet of Ebix, Inc. and its subsidiaries (the Company) as of December 31, 2019, the related consolidated statements of income, comprehensive income, stockholders' equity, and cash flows for the year then ended, and the related notes to the consolidated financial statements and schedule (collectively, the financial statements). In our opinion, the financial statements present fairly, in all material respects, the financial position of the Company as of December 31, 2019, and the results of its operations and its cash flows for the year ended December 31, 2019, in conformity with accounting principles generally accepted in the United States of America.
We have also audited, in accordance with the standards of the Public Company Accounting Oversight Board (United States) (PCAOB), the Company's internal control over financial reporting as of December 31, 2019, based on criteria established in Internal Control - Integrated Framework issued by the Committee of Sponsoring Organizations of the Treadway Commission in 2013, and our report dated March 2, 2020 expressed an unqualified opinion on the effectiveness of the Company's internal control over financial reporting.
Adoption of New Accounting Standard
As discussed in Note 20 to the consolidated financial statements, the Company has changed its method of accounting for leases effective January 1, 2019 due to the adoption of ASC 842, Leases.
Basis for Opinion
These financial statements are the responsibility of the Company’s management. Our responsibility is to express an opinion on the Company’s financial statements based on our audit. We are a public accounting firm registered with the PCAOB and are required to be independent with respect to the Company in accordance with U.S. federal securities laws and the applicable rules and regulations of the Securities and Exchange Commission and the PCAOB.
We conducted our audit in accordance with the standards of the PCAOB. Those standards require that we plan and perform the audit to obtain reasonable assurance about whether the financial statements are free of material misstatement, whether due to error or fraud. Our audit included performing procedures to assess the risks of material misstatement of the financial statements, whether due to error or fraud, and performing procedures that respond to those risks. Such procedures included examining, on a test basis, evidence regarding the amounts and disclosures in the financial statements. Our audit also included evaluating the accounting principles used and significant estimates made by management, as well as evaluating the overall presentation of the financial statements. We believe that our audit provides a reasonable basis for our opinion.
Critical Audit Matter
The critical audit matter communicated below was a matter arising from the current-period audit of the financial statements that was communicated or required to be communicated to the Company’s Audit Committee and that: (1) related to accounts or disclosures that are material to the financial statements and (2) involved our especially challenging, subjective, or complex judgments. The communication of critical audit matters does not alter in any way our opinion on the financial statements, taken as a whole, and we are not, by communicating the critical audit matter below, providing a separate opinion on the critical audit matter or on the accounts or disclosures to which it relates.
Revenue Recognition Software-as-a-Service (“SaaS”) Arrangements
As described in Note 1 of the consolidated financial statements, the Company derives a portion of its revenues from contracts with customers that include the use of the Company’s proprietary SaaS platforms. A typical contract for a SaaS platform will also include services for setup, customization, transaction processing, maintenance, and/or hosting. Management applied significant judgment in determining revenue recognition for these customer agreements including:
• | Determination of whether products and services are considered distinct performance obligations that should be accounted for together versus separately, such as non-refundable upfront fees or customization related to the setup of the Company’s proprietary SaaS and the related use of the SaaS. |
• | Determination of stand-alone selling prices (SSP) for each distinct performance obligation and for products and services that are not sold separately based on internal and external data. |
51
• | The pattern of delivery (i.e., timing of when revenue is recognized) for each distinct performance obligation. |
• | Determination of the contract duration, which considers the significance of the upfront fees in the context of the contract and which may, therefore, exceed the initial contracted term. |
We identified the Company’s revenue recognition of non-refundable upfront fees and professional services related to the setup of the Company’s proprietary SaaS as a critical audit matter because auditing the identification and accounting for performance obligations, determination of initial transaction price and the calculation of the SSP for each performance obligation, and estimation of contract duration period required significant audit effort and a high degree of auditor judgment and subjectivity to perform our audit procedures and evaluate the audit evidence obtained.
Our audit procedures related to the Company’s revenue recognition for these customer agreements included the following, among others:
• | We obtained an understanding of the relevant controls related to new SaaS contracts and tested such controls for design and operating effectiveness, including management review controls related to identifying distinct performance obligations, determining the initial transaction price and the SSP over each of the identified performance obligation and determining the contract duration period. |
• | Evaluated the Company’s policies in accordance with the applicable accounting standards. |
• | Selected a sample of customer agreements and performed the following procedures: |
◦ | Obtained and read contract source documents for each selection, including master agreements, statements of work, and other documents that were part of the agreement. |
◦ | Tested management’s identification of significant terms for completeness, including the identification of distinct performance obligations and contract duration. |
◦ | Assessed the terms in the customer agreement and evaluated the appropriateness of management’s application of Company accounting policies, along with the use of estimates, in the determination of revenue recognition conclusions. |
• | Evaluated the reasonableness of management’s approach and the inputs used to determine SSP for products and services that were not sold separately and tested the completeness and accuracy of the data used in determining the SSP. |
• | Tested the mathematical accuracy of management’s calculations of revenue and the associated timing of revenue recognized in the financial statements. |
/s/ RSM US LLP
We have served as the Company's auditor since 2018.
Atlanta, Georgia
March 2, 2020
52
REPORT OF INDEPENDENT REGISTERED PUBLIC ACCOUNTING FIRM
The Board of Directors and Stockholders of Ebix, Inc.
Opinion on the Financial Statements
We have audited the accompanying consolidated balance sheet of Ebix, Inc. and subsidiaries (the “Company”) as of December 31, 2018, and the related consolidated statements of income, comprehensive income, stockholders’ equity, and cash flows for the year ended as of December 31, 2018, and related notes (collectively referred to as the “financial statements”). In our opinion, the financial statements present fairly, in all material respects, the financial position of the company as of December 31, 2018, and the results of its operations and its cash flows for the year ended December 31, 2018, in conformity with accounting principles generally accepted in the United States of America.
We have also audited, in accordance with the standards of the Public Company Accounting Oversight Board (United States) (PCAOB), the Company’s internal control over financial reporting as of December 31, 2018, based on criteria established in Internal Control-Integrated Framework (2013) issued by the Committee of Sponsoring Organizations of the Treadway Commission (COSO), and our report dated March 1, 2019 expressed an unqualified opinion on the Company's internal control over financial reporting.
Basis of Opinion
These financial statements are the responsibility of the Company’s management. Our responsibility is to express an opinion on the Company’s financial statements based on our audit. We are a public accounting firm registered with the PCAOB and are required to be independent with respect to the Company in accordance with the U.S. federal securities laws and the applicable rules and regulations of the Securities and Exchange Commission and the PCAOB.
We conducted our audit in accordance with the standards of the PCAOB. Those standards require that we plan and perform the audit to obtain reasonable assurance about whether the financial statements are free of material misstatement, whether due to error or fraud. Our audits included performing procedures to assess the risks of material misstatement of the financial statements, whether due to error or fraud, and performing procedures that respond to those risks. Such procedures included examining, on a test basis, evidence regarding the amounts and disclosures in the financial statements. Our audit also included evaluating the accounting principles used and significant estimates made by management, as well as evaluating the overall presentation of the financial statements. We believe that our audits provide a reasonable basis for our opinion.
T R Chadha & Co LLP
We have served as the Company’s auditor since 2018.
New Delhi, India
March 1, 2019
53
REPORT OF INDEPENDENT REGISTERED PUBLIC ACCOUNTING FIRM
The Board of Directors and Stockholders of Ebix, Inc.
Opinion on the Financial Statements
We have audited the accompanying consolidated balance sheet of Ebix, Inc. and subsidiaries (the Company) as of December 31, 2017, and the related consolidated statements of income, comprehensive income, stockholders’ equity, and cash flows for each of the years in the two-year period ended December 31, 2017, and related notes and accompanying financial statements listed in the index at item 15 (collectively referred to as the consolidated financial statements). In our opinion, the consolidated financial statements present fairly, in all material respects, the financial position of the Company as of December 31, 2017, and the results of their operations and their cash flows for each of the years in the two-year period ended December 31, 2017, in conformity with accounting principles generally accepted in the United States of America.
We also have audited, in accordance with the standards of the Public Company Accounting Oversight Board (United States) (PCAOB), the Company’s internal control over financial reporting as of December 31, 2017, based on criteria established in Internal Control-Integrated Framework (2013) issued by the Committee of Sponsoring Organizations of the Treadway Commission (COSO), and our report dated March 1, 2018, expressed an adverse opinion.
Basis for Opinion
These consolidated financial statements are the responsibility of the Company’s management. Our responsibility is to express an opinion on the Company’s consolidated financial statements based on our audits. We are a public accounting firm registered with the PCAOB and are required to be independent with respect to the Company in accordance with the U.S. federal securities laws and the applicable rules and regulations of the Securities and Exchange Commission and the PCAOB.
We conducted our audits in accordance with the standards of the PCAOB. Those standards require that we plan and perform the audit to obtain reasonable assurance about whether the consolidated financial statements are free of material misstatement, whether due to error or fraud. Our audits included performing procedures to assess the risks of material misstatement of the consolidated financial statements, whether due to error or fraud, and performing procedures that respond to those risks. Such procedures included examining, on a test basis, evidence regarding the amounts and disclosures in the consolidated financial statements. Our audits also included evaluating the accounting principles used and significant estimates made by management, as well as evaluating the overall presentation of the consolidated financial statements. We believe that our audits provide a reasonable basis for our opinion.
Cherry Bekaert LLP
We served as the Company’s auditor since 2008 until 2017.
Atlanta, Georgia
March 1, 2018
54
Ebix, Inc. and Subsidiaries
Consolidated Statements of Income
Year Ended December 31, | |||||||||||
2019 | 2018 | 2017 | |||||||||
(In thousands, except per share amounts) | |||||||||||
Operating revenue: | $ | $ | $ | ||||||||
Operating expenses: | |||||||||||
Costs of services provided | |||||||||||
Product development | |||||||||||
Sales and marketing | |||||||||||
General and administrative, net (see Note 3) | |||||||||||
Amortization and depreciation | |||||||||||
Total operating expenses | |||||||||||
Operating income | |||||||||||
Interest income | |||||||||||
Interest expense | ( | ) | ( | ) | ( | ) | |||||
Non-operating income | |||||||||||
Non-operating expense - litigation settlement (see Note 6) | ( | ) | |||||||||
Foreign currency exchange (loss) gain | ( | ) | ( | ) | |||||||
Income before income taxes | |||||||||||
Income tax provision | ( | ) | ( | ) | ( | ) | |||||
Net income including noncontrolling interest | $ | $ | $ | ||||||||
Net (loss) income attributable to noncontrolling interest (see Note 18) | ( | ) | ( | ) | |||||||
Net income attributable to Ebix, Inc. | $ | $ | $ | ||||||||
Basic earnings per common share | $ | $ | $ | ||||||||
Diluted earnings per common share | $ | $ | $ | ||||||||
Basic weighted average shares outstanding | |||||||||||
Diluted weighted average shares outstanding | |||||||||||
See accompanying notes to the consolidated financial statements.
55
Ebix, Inc. and Subsidiaries
Consolidated Statements of Comprehensive Income
Year Ended December 31, | ||||||||||||
2019 | 2018 | 2017 | ||||||||||
(In thousands) | ||||||||||||
Net income including noncontrolling interest | $ | $ | $ | |||||||||
Other comprehensive income (loss): | ||||||||||||
Foreign currency translation adjustments | ( | ) | ( | ) | ||||||||
Total other comprehensive (loss) income | ( | ) | ( | ) | ||||||||
Comprehensive income | $ | $ | $ | |||||||||
Comprehensive (loss) income attributable to noncontrolling interest (see Note 18) | ( | ) | ( | ) | ||||||||
Comprehensive income attributable to Ebix, Inc. | $ | $ | $ | |||||||||
See accompanying notes to the consolidated financial statements.
56
Ebix, Inc. and Subsidiaries
Consolidated Balance Sheets
December 31, | |||||||
2019 | 2018 | ||||||
(In thousands, except share and per share amounts) | |||||||
ASSETS | |||||||
Current assets: | |||||||
Cash and cash equivalents | $ | $ | |||||
Receivables from service providers | |||||||
Short-term investments | |||||||
Restricted cash | |||||||
Fiduciary funds - restricted | |||||||
Trade accounts receivable, less allowances of $21,696 and $6,969, respectively | |||||||
Other current assets | |||||||
Total current assets | |||||||
Property and equipment, net | |||||||
Right-of-use assets | |||||||
Goodwill | |||||||
Intangibles, net | |||||||
Indefinite-lived intangibles | |||||||
Capitalized software development costs, net | |||||||
Deferred tax assets, net | |||||||
Other assets | |||||||
Total assets | $ | $ | |||||
LIABILITIES AND STOCKHOLDERS’ EQUITY | |||||||
Current liabilities: | |||||||
Accounts payable and accrued liabilities | $ | $ | |||||
Payables to service agents | |||||||
Accrued payroll and related benefits | |||||||
Working capital facility | |||||||
Fiduciary funds - restricted | |||||||
Short-term debt | |||||||
Contingent liability for earn-out acquisition consideration | |||||||
Current portion of long-term debt, net of deferred financing costs of $575 and $575, respectively | |||||||
Contract liabilities | |||||||
Lease liability | |||||||
Other current liabilities | |||||||
Total current liabilities | |||||||
Revolving line of credit | |||||||
Long-term debt, less current portion, net of deferred financing costs of $1,534 and $1,811, respectively | |||||||
Contingent liability for earn-out acquisition consideration | |||||||
Contract liabilities | |||||||
Lease liability | |||||||
Deferred tax liability, net | |||||||
Other liabilities | |||||||
Total liabilities | |||||||
Commitments and Contingencies, Note 6 | |||||||
57
Stockholders’ equity: | |||||||
Preferred stock, $.10 par value, 500,000 shares authorized, no shares issued and outstanding at December 31, 2019 and 2018 | |||||||
Series Y Convertible preferred stock, $0.10 par value, 350,000 shares authorized, no shares issued and outstanding at December 31, 2019 and no shares authorized, issued and outstanding at December 31, 2018 | |||||||
Common stock, $.10 par value, 220,000,000 shares authorized, 30,492,044 issued and outstanding at December 31, 2019 and 30,567,725 issued and outstanding at December 31, 2018 | |||||||
Additional paid-in capital | |||||||
Retained earnings | |||||||
Accumulated other comprehensive loss | ( | ) | ( | ) | |||
Total Ebix, Inc. stockholders’ equity | |||||||
Noncontrolling interest (see Note 18) | |||||||
Total stockholders' equity | |||||||
Total liabilities and stockholders’ equity | $ | $ | |||||
See accompanying notes to the consolidated financial statements.
58
Ebix, Inc. and Subsidiaries
Consolidated Statements Stockholders’ Equity
Common Stock | ||||||||||||||||||||||||||
Issued Shares | Amount | Additional Paid-in Capital | Retained Earnings | Accumulated Other Comprehensive Loss | Noncontrol-ling interest | Total | ||||||||||||||||||||
(In thousands, except per share amounts) | ||||||||||||||||||||||||||
Balance, January 1, 2017 | $ | $ | $ | $ | ( | ) | $ | |||||||||||||||||||
Net income attributable to Ebix, Inc. | — | — | — | — | — | |||||||||||||||||||||
Net income attributable to noncontrolling interest | — | — | — | — | — | |||||||||||||||||||||
Cumulative translation adjustment | — | — | — | — | — | |||||||||||||||||||||
Exercise of stock options | — | — | — | |||||||||||||||||||||||
Deferred compensation and amortization related to options and restricted stock | — | — | — | — | — | |||||||||||||||||||||
Repurchase and retirement of common stock | ( | ) | ( | ) | ( | ) | ( | ) | — | — | ( | ) | ||||||||||||||
Vesting of restricted stock | ( | ) | — | — | — | |||||||||||||||||||||
Forfeiture of certain shares to satisfy exercise costs and the recipients income tax obligations related to stock options exercised and restricted stock vested | ( | ) | ( | ) | — | — | — | ( | ) | |||||||||||||||||
Noncontrolling interest | — | — | — | — | — | |||||||||||||||||||||
Capital Contribution to joint venture, loans converted to capital contribution | — | — | — | — | ||||||||||||||||||||||
Dividends paid | — | — | — | ( | ) | — | — | ( | ) | |||||||||||||||||
Balance, December 31, 2017 | $ | $ | $ | $ | ( | ) | $ | $ | ||||||||||||||||||
Cumulative effect of accounting change (adoption of Topic 606), net of tax effect | — | — | — | ( | ) | — | — | ( | ) | |||||||||||||||||
Cumulative effect of accounting change (adoption of ASC 340-40), net of tax effect | — | — | — | ( | ) | — | — | ( | ) | |||||||||||||||||
Net income attributable to Ebix, Inc. | — | — | — | — | ||||||||||||||||||||||
Net loss attributable to noncontrolling interest | — | — | — | — | — | ( | ) | ( | ) | |||||||||||||||||
Cumulative translation adjustment | — | — | — | — | ( | ) | — | ( | ) | |||||||||||||||||
Exercise of stock options | — | |||||||||||||||||||||||||
Repurchase and retirement of common stock | ( | ) | ( | ) | ( | ) | — | — | ( | ) | ||||||||||||||||
Deferred compensation and amortization related to options and restricted stock | — | — | — | — | — | |||||||||||||||||||||
Vesting of restricted stock | ( | ) | — | — | — | |||||||||||||||||||||
59
Forfeiture of certain shares to satisfy exercise costs and the recipients income tax obligations related to stock options exercised and restricted stock vested | ( | ) | ( | ) | — | — | — | ( | ) | |||||||||||||||||
Noncontrolling interest | — | — | ( | ) | — | — | ||||||||||||||||||||
Common stock dividends paid, $0.30 per share | — | — | — | ( | ) | — | — | ( | ) | |||||||||||||||||
Balance, December 31, 2018 | $ | $ | $ | $ | ( | ) | $ | $ | ||||||||||||||||||
Net income attributable to Ebix, Inc. | — | — | — | — | — | |||||||||||||||||||||
Net loss attributable to noncontrolling | — | — | — | — | — | ( | ) | ( | ) | |||||||||||||||||
Cumulative translation adjustment | — | — | — | — | ( | ) | — | ( | ) | |||||||||||||||||
Repurchase and retirement of common stock | ( | ) | ( | ) | ( | ) | — | — | ( | ) | ||||||||||||||||
Deferred compensation and amortization related to options and restricted stock | — | — | — | — | — | |||||||||||||||||||||
Vesting of restricted stock | ( | ) | — | — | — | |||||||||||||||||||||
Forfeiture of certain shares to satisfy exercise costs and the recipients income tax obligations related to stock options exercised and restricted stock vested | ( | ) | ( | ) | — | — | — | ( | ) | |||||||||||||||||
Noncontrolling interest | — | — | — | — | ( | ) | ( | ) | ||||||||||||||||||
Common stock dividends paid, $0.30 per share | — | — | — | ( | ) | — | ( | ) | ||||||||||||||||||
Balance, December 31, 2019 | $ | $ | $ | $ | ( | ) | $ | $ | ||||||||||||||||||
See accompanying notes to the consolidated financial statements.
60
Ebix, Inc. and Subsidiaries
Consolidated Statements of Cash Flows
Year Ended December 31, | |||||||||||
2019 | 2018 | 2017 | |||||||||
(In thousands) | |||||||||||
Cash flows from operating activities: | |||||||||||
Net income attributable to Ebix, Inc. | $ | $ | $ | ||||||||
Net (loss) income attributable to noncontrolling interest | ( | ) | ( | ) | |||||||
Adjustments to reconcile net income to cash provided by operating activities: | |||||||||||
Depreciation and amortization | |||||||||||
Provision for doubtful accounts | |||||||||||
Provision for deferred taxes, net of acquisitions and effects of currency translation | ( | ) | ( | ) | ( | ) | |||||
Unrealized foreign exchange losses | |||||||||||
Amortization of right-of-use assets | |||||||||||
Amortization of capitalized software development costs | |||||||||||
Share-based compensation | |||||||||||
Reduction of acquisition earn-out contingent liability | ( | ) | ( | ) | ( | ) | |||||
Changes in current assets and liabilities, net of acquisitions: | |||||||||||
Accounts receivable | ( | ) | ( | ) | |||||||
Receivables from service providers | ( | ) | |||||||||
Payables to service agents | ( | ) | |||||||||
Other assets | ( | ) | ( | ) | ( | ) | |||||
Accounts payable and accrued expenses | ( | ) | ( | ) | |||||||
Accrued payroll and related benefits | ( | ) | ( | ) | ( | ) | |||||
Lease liabilities | ( | ) | ( | ) | ( | ) | |||||
Reserve for potential uncertain income tax return positions | ( | ) | |||||||||
Other liabilities | |||||||||||
Contract liabilities | ( | ) | ( | ) | ( | ) | |||||
Net cash provided by operating activities | |||||||||||
Cash flows from investing activities: | |||||||||||
Cash paid for acquisitions, net of cash acquired | ( | ) | ( | ) | ( | ) | |||||
Cash (paid to) received from Paul Merchants for 10% stake in MTSS combined business and other investment | ( | ) | |||||||||
Payment of acquisition earn-out contingency | ( | ) | ( | ) | |||||||
Maturities (purchases) of marketable securities | ( | ) | |||||||||
Capitalized software development costs | ( | ) | ( | ) | ( | ) | |||||
Capital expenditures | ( | ) | ( | ) | ( | ) | |||||
Net cash used in investing activities | ( | ) | ( | ) | ( | ) | |||||
Cash flows from financing activities: | |||||||||||
Proceeds from / (payment) to line of credit, net | |||||||||||
Proceeds from term loan | |||||||||||
Principal payments on term loan obligation | ( | ) | ( | ) | ( | ) | |||||
Payments on short-term notes, net | ( | ) | |||||||||
Working capital facility | ( | ) | |||||||||
Repurchase of common stock | ( | ) | ( | ) | ( | ) | |||||
61
Payments of long term debt | ( | ) | ( | ) | |||||||
Payments for capital lease obligations | ( | ) | ( | ) | |||||||
Proceeds from exercise of common stock options | |||||||||||
Forfeiture of certain shares to satisfy exercise costs and the recipients income tax obligations related to stock options exercised and restricted stock vested | ( | ) | ( | ) | ( | ) | |||||
Dividends paid | ( | ) | ( | ) | ( | ) | |||||
Net cash (used) provided by financing activities | |||||||||||
Effect of foreign exchange rates on cash and cash equivalents | ( | ) | ( | ) | |||||||
Net change in cash and cash equivalents, and restricted cash | ( | ) | ( | ) | |||||||
Cash and cash equivalents, and restricted cash at the beginning of the year | |||||||||||
Cash and cash equivalents, and restricted cash at the end of the year | $ | $ | $ | ||||||||
Supplemental disclosures of cash flow information: | |||||||||||
Interest paid | |||||||||||
Income taxes paid | |||||||||||
See accompanying notes to the consolidated financial statements.
62
Ebix, Inc. and Subsidiaries
Supplemental schedule of noncash financing activities:
As of December 31, 2018, there was $77.6 million of the upfront cash consideration and contingent consideration included in Other current liabilities in the Company's Consolidated Balance Sheet.
As of December 31, 2018, there were 200,000 shares totaling $8.8 million of share repurchases that were not settled until January 2019.
During 2018, there were 8,875 shares, totaling $467 thousand, used to satisfy exercise costs and the recipients' income tax obligations related to stock options exercised and restricted stock vesting.
During 2017, there were 6,134 shares, totaling $398 thousand, used to satisfy exercise costs and the recipients' income tax obligations related to stock options exercised and restricted stock vesting.
63
Ebix, Inc. and Subsidiaries
Notes to Consolidated Financial Statements
Note 1. Description of Business and Summary of Significant Accounting Policies
Description of Business— Ebix, Inc. and its subsidiaries, (“Ebix” or the “Company”, "we", "us", and "our") is a leading international supplier of on-demand infrastructure Exchanges to the insurance, financial, and healthcare industries. In the insurance industry, the Company’s main focus is to develop and deploy a wide variety of insurance and reinsurance exchanges on an on-demand basis, while also providing SaaS enterprise solutions in the area of CRM, front-end and back-end systems, outsourced administrative and risk compliance. The Company's products feature fully customizable and scalable on-demand software designed to streamline the way insurance professionals manage distribution, marketing, sales, customer service, and accounting activities. With a "Phygital” strategy that combines physical distribution outlets in many Association of Southeast Asian Nations (ASEAN) countries to a Omni-channel online digital platform, the Company’s EbixCash Financial exchange portfolio encompasses leadership in areas of domestic and international money remittance, foreign exchange (Forex), travel, pre-paid & gift cards, utility payments, lending, and wealth management in India and other markets. The Company has its headquarters in Johns Creek, Georgia and also conducts operating activities in Australia, Canada, India, New Zealand, Singapore, United Kingdom, Brazil, Philippines, Indonesia, Thailand and United Arab Emirates. International revenue accounted for 68.6 %, 60.4 %, and 41.8 % of the Company’s total revenue in 2019, 2018, and 2017, respectively.
Summary of Significant Accounting Policies
Basis of Presentation— The consolidated financial statements include the accounts of Ebix and its wholly and majority-owned subsidiaries. Non-controlling interests in net income or losses, and net equity are reported in amounts that reflect the non-controlling party(s) percentage ownership in the respect subsidiaries. The effect of intercompany balances and transactions has been eliminated.
Use of Estimates—The preparation of consolidated financial statements in conformity with accounting principles generally accepted in the United States of America ("GAAP") requires management to make estimates and assumptions that affect the reported amounts of assets and liabilities and disclosure of contingent assets and liabilities at the dates of the financial statements and reported amounts of revenue and expenses during those reporting periods. Management has made material estimates primarily with respect to revenue recognition and contract liabilities, accounts receivable, acquired intangible assets, annual impairment reviews of goodwill and indefinite-lived intangible assets, investments, contingent earnout liabilities in connection with business acquisitions, and the provision for income taxes. Actual results may be materially different from those estimates.
Reclassification—Certain prior year amounts have been reclassified to be consistent with current year presentation within our financial statements, specifically with respect to the presentation of receivables from service providers and payables to service agents.
Cash and Cash Equivalents—The Company considers all highly liquid investments with an original maturity of three months or less at the time of purchase to be cash equivalents. Such investments are stated at cost, which approximates fair value. The Company does maintain cash balances in banking institutions in excess of federally insured amounts and therefore is exposed to the related potential credit risk associated with such cash deposits.
64
The following table provides a reconciliation of cash, cash equivalents, and restricted cash reported within the statement of financial position that sum to the total of the same such amounts shown in the statement of cash flows:
For the Year Ended December 31, | |||||||||||
2019 | 2018 | 2017 | |||||||||
(In thousands) | |||||||||||
Cash and cash equivalents | $ | $ | |||||||||
Restricted cash | |||||||||||
Restricted cash included in other long-term assets | |||||||||||
Total cash, cash equivalents, and restricted cash shown in the statement of cash flows | $ | $ | $ | ||||||||
Fiduciary Funds - Restricted—Due to the EbixHealth JV being a third party administrator (“TPA”), the Company collects premiums from insureds and, after deducting its fees, remits these premiums to insurance companies. Unremitted insurance premiums and/or claim funds established for the benefit of various carriers are held in a fiduciary capacity until disbursed by the Company. The use of premiums collected from insureds but not yet remitted to insurance companies is restricted by law in certain states. The total assets held on behalf of others, $5.0 million, are recorded as an asset and offsetting fiduciary funds - restricted liability.
Fair Value Measurements—The Company follows the relevant GAAP guidance regarding the determination and measurement of the fair value of assets/liabilities in which fair value is defined as the exchange price that would be received for an asset or paid to transfer a liability (an exit price) in the principal or most advantageous market for the asset or liability in an orderly transaction valuation hierarchy which requires an entity to maximize the use of observable inputs when measuring fair value. The guidance describes the following three levels of inputs that may be used in the methodology to measure fair value:
• | Level 1 — Unadjusted quoted prices available in active markets for identical investments to the reporting entity at the measurement date. |
• | Level 2 — Other than quoted prices included in Level 1 inputs, which are observable for the asset or liability, either directly or indirectly, for substantially the full term of the asset or liability. |
• | Level 3 — Unobservable inputs, which are used to the extent that observable inputs are not available, and used in situations where there is little or no market activity for the asset or liability and wherein the reporting entity makes estimates and assumptions related to the pricing of the asset or liability including assumptions regarding risk. |
A financial instrument’s level within the fair value hierarchy is based on the lowest level of any input that is significant to the fair value measurement.
As of December 31, 2019 and 2018, the Company has the following financial instruments for which it had to consider fair values and had to make fair value assessments:
• | Short-term investments (commercial bank certificates of deposits and mutual funds), for which the fair values are measured as a Level 1 instrument. |
• | Contingent accrued earn-out business acquisition consideration liabilities for which fair values are measured as Level 3 instruments. These contingent consideration liabilities were recorded at fair value on the acquisition date and are remeasured quarterly based on the then assessed fair value and adjusted if necessary. The increases or decreases in the fair value of contingent consideration can result from changes in anticipated revenue levels and changes in assumed discount periods and rates. As the fair value measure is based on significant inputs that are not observable in the market, they are categorized as Level 3. |
Other financial instruments not measured at fair value on the Company's consolidated balance sheets at December 31, 2019 and 2018 but which require disclosure of their fair values include: cash and cash equivalents, accounts receivable, accounts payable and accrued expenses, accrued payroll and related benefits, finance lease obligations, and the revolving line of credit and term loan debt . The Company believes that the estimated fair value of such instruments at December 31, 2019 and 2018 reasonably approximates their carrying value as reported on the consolidated balance sheets.
65
Additional information regarding the Company's assets and liabilities that are measured at fair value on a recurring basis is presented in the following tables:
Fair Values at Reporting Date Using* | |||||||||||||
Descriptions | Balance at December 31, 2019 | Quoted Prices in Active Markets for Identical Assets or Liabilities (Level 1) | Significant Other Observable Inputs (Level 2) | Significant Unobservable Inputs (Level 3) | |||||||||
(In thousands) | |||||||||||||
Assets | |||||||||||||
Commercial bank certificates of deposits ($50 thousand is recorded in the long term asset section of the consolidated balance sheets in "Other Assets") | $ | $ | $ | — | $ | — | |||||||
Mutual funds | — | — | |||||||||||
Total assets measured at fair value | $ | $ | $ | — | $ | — | |||||||
Liabilities | |||||||||||||
Contingent earn-out acquisition consideration (a) | — | — | |||||||||||
Total liabilities measured at fair value | $ | $ | $ | $ | |||||||||
(a) The income valuation approach is applied and the valuation inputs include the contingent payment arrangement terms, projected cash flows, rate of return, and probability assessments. | |||||||||||||
* During the year ended December 31, 2019 there were no transfers between fair value Levels 1, 2 or 3. | |||||||||||||
66
Fair Values at Reporting Date Using* | |||||||||||||
Descriptions | Balance at December 31, 2018 | Quoted Prices in Active Markets for Identical Assets or Liabilities (Level 1) | Significant Other Observable Inputs (Level 2) | Significant Unobservable Inputs (Level 3) | |||||||||
(In thousands) | |||||||||||||
Assets | |||||||||||||
Commercial bank certificates of deposits ($681 thousand is recorded in the long term asset section of the consolidated balance sheets in "Other Assets") | $ | — | — | ||||||||||
Mutual Funds | — | — | |||||||||||
Total assets measured at fair value | $ | $ | $ | — | $ | — | |||||||
Liabilities | |||||||||||||
Contingent earn-out acquisition consideration (a) | — | — | |||||||||||
Total liabilities measured at fair value | $ | $ | $ | $ | |||||||||
(a) The income valuation approach is applied and the valuation inputs include the contingent payment arrangement terms, projected cash flows, rate of return, and probability assessments. | |||||||||||||
* During the year ended December 31, 2018, there were no transfers between fair value Levels 1, 2 or 3. | |||||||||||||
For the Company's assets and liabilities measured at fair value on a recurring basis using significant unobservable inputs (Level 3), the following table provides a reconciliation of the beginning and ending balances for each category therein, and gains or losses recognized during the year:
67
Fair Value Measurements Using Significant Unobservable Inputs (Level 3) | ||||||||
Contingent Liability for Accrued Earn-out Acquisition Consideration | Balance at December 31, 2019 | Balance at December 31, 2018 | ||||||
(In thousands) | ||||||||
Beginning balance | $ | |||||||
Total remeasurement adjustments: | ||||||||
(Gains) or losses included in earnings ** | ( | ) | ( | ) | ||||
Reductions recorded against goodwill | ( | ) | ||||||
Foreign currency translation adjustments *** | ( | ) | ( | ) | ||||
Acquisitions and settlements | ||||||||
Business acquisitions | ||||||||
Settlements | ( | ) | ||||||
Ending balance | $ | $ | ||||||
The amount of total (gains) or losses for the year included in earnings or changes to net assets, attributable to changes in unrealized (gains) or losses relating to assets or liabilities still held at year-end. | $ | ( | ) | $ | ( | ) | ||
** recorded as a component of general and administrative expenses | ||||||||
*** recorded as a component of other comprehensive income within stockholders' equity | ||||||||
Quantitative Information about Level 3 Fair Value Measurements
The significant unobservable inputs used in the fair value measurement of the Company's contingent consideration liabilities designated as Level 3 are as follows:
(In thousands) | Fair Value at December 31, 2019 | Valuation Technique | Significant Unobservable Input | |||
Contingent acquisition consideration: (Wdev, Miles, Zillious, and Essel acquisitions) | $ | Discounted cash flow | Expected future annual revenue streams and probability of achievement | |||
68
(In thousands) | Fair Value at December 31, 2018 | Valuation Technique | Significant Unobservable Input | |||
Contingent acquisition consideration: (Wdev, ItzCash, Indus and Miles acquisitions) | $ | Discounted cash flow | Expected future annual revenue streams and probability of achievement | |||
Sensitivity to Changes in Significant Unobservable Inputs
As presented in the table above, the significant unobservable inputs used in the fair value measurement of contingent consideration related to business acquisitions are forecasts of expected future annual revenues as developed by the Company's management and the probability of achievement of those revenue forecasts. The discount rate used in these calculations is 12.6 %. Significant increases (decreases) in these unobservable inputs in isolation would likely result in a significantly (lower) higher fair value measurement.
Revenue Recognition and Contract Liabilities—The Company derives its revenues primarily from software subscription and transaction fees, software license fees, financial transaction fees, risk compliance solution services fees, and professional service fees including associated fees for consulting, implementation, training, and project management provided to customers with installed systems, and applications. Sales and value-added taxes are not included in revenues, but rather are recorded as a liability until the taxes assessed are remitted to the respective taxing authorities.
The Company determines revenue recognition by applying the following steps:
• | identification of the contract, or contracts, with a customer; |
• | identification of the performance obligations in the contract; |
• | determination of the transaction price; |
• | allocation of the transaction price to the performance obligations in the contract; and |
• | recognition of revenue when, or as, we satisfy a performance obligation. |
The Company analyzes its different services individually to determine the appropriate basis for revenue recognition, as further described below. Additionally, certain services exist in multiple channels. As Ebix derives revenues from three product/service channels—EbixCash Exchanges, Insurance Exchanges, and Risk Compliance Solutions—for policy disclosure purposes, contracts are discussed in conjunction with the channel to which they are most significant.
The Company assesses the terms of customer contracts including termination rights, penalties (implied or explicit), and renewal rights.
Insurance Exchanges
Insurance Exchanges revenues are primarily derived from consideration paid by customers related to our SaaS platforms, related services and the licensing of software. A typical contract for our SaaS platform will also include services for setup, customization, transaction processing, maintenance, and/or hosting. Determining whether products and services are considered distinct performance obligations that should be accounted for separately may require significant judgement. Set-up and customization services, related to our SaaS platforms, are not considered to be distinct from the usage fees associated with the SaaS platform and, accordingly, are accounted for as a single performance obligation. These services along with the usage or transaction fees are recognized over the contract duration which considers the significance of the upfront fees in the context of the contract and which may, therefore, exceed the initial contracted term.
Contracts generally do not contain a right of return or refund provisions. Our contracts often do contain overage fees, contingent fees, or service level penalties which are accounted for as variable consideration. Revenue accounted for as variable consideration is immaterial and is recognized using the “right to invoice” practical expedient when the invoiced amount equals the value provided to the customer.
Software-as-a-Service ("SaaS")
69
The Company allocates the transaction price to each distinct performance obligation using the relative stand-alone selling price. Determining the stand-alone selling price may require significant judgement. The stand-alone selling price is the price at which an entity has sold or would sell a promised good or service separately to a customer. The Company determines the stand-alone selling price based on observable price of products or services sold separately in comparable circumstances, when such observable prices are available. When standalone selling price is not directly observable, the Company estimates the stand-alone selling price using the market assessment approach by considering historical pricing and other market factors.
Software Licenses
Software license revenues attributable to a software license that is a separate performance obligation are recognized at the point in time that the customer obtains control of the license.
Subscription Services
Subscription services revenues are associated with performance obligations that are satisfied over specific time periods and primarily consist of post-contract support services. Revenue is generally recognized ratably over the contract term. Our subscription contracts are generally for an initial three-year period with subsequent one-year automatic renewals.
Transaction Fees
Transaction revenue is comprised of fees applied to the volume of transactions that are processed through our SaaS platforms. These are typically based on a per-transaction rate and are invoiced for the same period in which the transactions were processed and as the performance obligation is satisfied. The amount invoiced generally equals the value provided to the customer, and revenue is typically recognized when invoiced using the as-invoiced practical expedient.
Professional Services
Professional service revenue primarily consists of fees for setup, customization, training, or consulting. Professional service fees are generally on a time and materials basis or a fixed fee. Revenues for time and materials are recognized as such services are rendered while fixed fee revenues are recognized based on the input method driven by the expected hours to complete the project measured against the actual hours completed to date. Professional services, particularly related to SaaS platforms, may have significant dependencies on the related licensed software and may not be considered a distinct performance obligation.
Risk Compliance Services ("RCS")
RCS revenues consist of two revenue streams-Certificates of Insurance (COI) and Consulting Services. COI revenues are derived from consideration paid by customers for the creation and tracking of certificates of insurance. These are transactional-based revenues. Consulting Services revenues are driven by distinct consulting service engagements rendered to customers for which revenues are recognized using the output method on a time and material basis as the services are performed.
COI Creation and Tracking
The Company provides services to issue and track certificates of insurance in the United States and Australian markets. Revenue is derived from transaction fees for each certificate issued or tracked. The Company recognizes revenue at the issuance of each certificate or over the period the certificate is being tracked.
Consulting Services
The Company provides consulting services to clients around the world for project management and development. Consulting services fees are generally on a time and materials basis or a fixed fee. Revenues for time and materials are recognized using an output method as the services are rendered while fixed fee revenues are recognized based on the input method driven by the expected hours to complete the project measured against the actual hours completed to date.
EbixCash Exchanges ("EbixCash")
EbixCash revenues are primarily derived from consideration paid by customers for financial transaction services, including services like transferring or exchanging money. The significant majority of EbixCash revenue is for a single performance obligation and is recognized at a point in time. These revenues vary by transaction based upon channel, send and receive locations, the principal amount sent, whether the money transfer involves different send and receive currencies, and speed of service, as applicable.
70
EbixCash also offers several other services, including payment services and ticketing and travel services for which revenue is impacted by varying factors. EbixCash acts as the principal in most transactions and reports revenue on a gross basis, as EbixCash controls the service at all times prior to transfer to the customer, is primarily responsible for fulfilling the customer contracts, has the risk of loss, and has the ability to establish transaction prices.
The main services from which EbixCash derives revenue are as follow:
EbixCash Travel Exchanges
EbixCash Travel revenues are primarily derived from commissions and transaction fees received from various travel providers and international exchanges involved in the sale of travel to the consumer. EbixCash Travel revenue is for a single performance obligation and is recognized at a point in time. Travel revenues include reservation commissions, segment fees from global travel exchange providers, and transaction net revenues (i.e., the amount charged to travelers less the amount owed to travel service providers) in connection with our reservation services; ancillary fees, including travel insurance-related revenues and certain reservation booking fees; and credit card processing rebates and customer processing fees. EbixCash Travel services include the sale of hotel rooms, airline tickets, bus tickets and train tickets. EbixCash’s Travel revenue is also derived from ticket sales, wherein the commissions payable to EbixCash Travel, along with any transaction fees paid by travel providers and travel exchanges, is recognized as revenue after completion of the service. The transaction price on such services is agreed upon at the time of the purchase.
EbixCash Travel revenue for the corporate MICE (Meetings, Incentives, Conferences, and Exhibitions) packages is recognized at full purchase value at the completion of the obligation with the corresponding costs recorded under direct expenses. For MICE revenues, EbixCash Travel acts as the principal in transactions, and accordingly reports revenue on a gross basis. EbixCash Travel controls the service at all times prior to transfer to the customer, is responsible for fulfilling the customer contracts, has the risk of loss, and has the ability to establish transaction prices.
EbixCash Money Transfer
For the EbixCash money transfer business, EbixCash has one performance obligation whereupon the customer engages EbixCash to perform one integrated service. This typically occurs instantaneously when the beneficiary entitled to receive the money transferred by the sender visits the EbixCash outlet and collects the money. Accordingly, EbixCash recognizes revenue upon completion of the following: 1) the customer’s acknowledgment of EbixCash’s terms and conditions and the receipt of payment information, 2) the money transfer has been processed, 3) the customer has received a unique transaction identification number, and 4) funds are available to be picked up by the beneficiary. The transaction price is comprised of a transaction fee and the difference between the exchange rate set by EbixCash to the customer and the rate available in the wholesale foreign exchange market, as applicable, both of which are readily determinable at the time the transaction is initiated
Foreign Exchange and Outward Remittance Services
For EbixCash’s foreign exchange and payment services, customers agree to terms and conditions for all transactions, either at the time of initiating a transaction or signing a contract with EbixCash to provide payment services on the customer’s behalf. In the majority of EbixCash’s foreign exchange and payment services, EbixCash makes payments to the recipient to satisfy its performance obligation to the customer, and therefore, EbixCash recognizes revenue on foreign exchange and payment when this performance obligation has been fulfilled.
Consumer Payment Services
EbixCash offers several different bill payment services that vary by considerations such as: 1) who pays the fee to EbixCash (consumer or biller), 2) whether the service is offered to all potential consumers, or only to those for which EbixCash has a relationship with the biller, and 3) whether the service utilizes a physical agent network offered for consumers’ convenience, among other factors. The determination of which party is EbixCash’s customer for revenue recognition purposes is based on these considerations for each of EbixCash’s bill payment services. For all transactions, EbixCash’s customers agree to EbixCash’s terms and conditions, either at the time of initiating a transaction (where the consumer is determined to be the customer for revenue recognition purposes) or upon signing a contract with EbixCash to provide services on the biller’s behalf (where the biller is determined to be the customer for revenue recognition purposes). As with consumer money transfers, customers engage EbixCash to perform one integrated service-collect money from the consumer and process the bill payment transaction, thereby providing the billers real-time or near real-time information regarding their customers’ payments and simplifying the billers’ collection efforts. EbixCash’s revenues from bill payment services are generated from contracts to process transactions at any time during
71
the duration of the contract. The transaction price on bill payment services is contractual and determinable. Certain biller agreements may include per-transaction or fixed periodic rebates, which EbixCash records as a reduction to revenue.
Gift Cards
EbixCash resells gift cards to consumers that can be later redeemed at various merchants. Gift cards are recorded as inventory until sold to the consumer. Gift card revenue is recognized at full purchase value at the time of sale with the corresponding cost of vouchers recorded as under direct expenses.
EbixCash Technology Services
EbixCash also offers on-demand technology to various providers in the area of lending, wealth & asset management, travel and logistics across the world.
Contract Liabilities
Contract liabilities includes payments or billings that have been received or made prior to performance. In certain cases, cash collections pertain to maintenance and support fees, initial setup or registration fees under hosting agreements, software license fees received in advance of delivery and acceptance, and software development fees paid in advance of completion and delivery. Approximately $6.4 million and $10.2 million of contract liabilities were included in billed accounts receivable at December 31, 2019 and 2018, respectively.
Impact of New Revenue Recognition Standard on Financial Statement Line Items
Effective January 1, 2018, we adopted Accounting Standards Update 2014-09, Revenue from Contracts with Customers, and other related updates. This standard requires entities to recognize revenue to depict the transfer of promised goods or services to customers in an amount that reflects the consideration to which the entity expects to be entitled in exchange for those goods or services. We applied this standard to contracts for which performance was not substantially complete as of the date of adoption. For those contracts that were modified prior to the date of adoption, we reflected the aggregate effect of those modifications when determining the appropriate accounting under the new standard. We don’t believe the effect of applying this practical expedient resulted in material differences. We applied this standard through a cumulative effect adjustment to retained earnings as of the beginning of the year of adoption. Upon adoption, the cumulative effect of applying this standard resulted in a decrease of approximately $8.8 million to retained earnings as of January 1, 2018. Revenue presented for periods prior to 2018 was accounted for under previous standards and has not been adjusted. Revenue and net income for 2018 did not differ materially from amounts that would have resulted from application of the previous standards.
Disaggregation of Revenue
The following tables present revenue disaggregated by primary geographical regions and product channels for the years ended December 31, 2019 , 2018 and 2017:
72
Year Ended December 31, | ||||||||||||
2019 | 2018 | 2017 | ||||||||||
(In thousands) | ||||||||||||
United States | $ | $ | $ | |||||||||
Canada | ||||||||||||
Latin America | ||||||||||||
Australia | ||||||||||||
Singapore* | ||||||||||||
New Zealand | ||||||||||||
India* | ||||||||||||
Europe | ||||||||||||
Indonesia* | ||||||||||||
Philippines* | ||||||||||||
United Arab Emirates* | ||||||||||||
Mauritius* | ||||||||||||
$ | $ | $ | ||||||||||
*Primarily India led businesses for which total revenue was $320.0 million, $217.5 million and $64.3 million for the years ended December 31, 2019, 2018, and 2017, respectively. | ||||||||||||
For the Year Ended | ||||||||||||
December 31, | ||||||||||||
(In thousands) | 2019 | 2018 | 2017 | |||||||||
EbixCash Exchanges | $ | $ | $ | |||||||||
Insurance Exchanges | ||||||||||||
Risk Compliance Solutions | ||||||||||||
Totals | $ | $ | $ | |||||||||
Costs to Obtain and Fulfill a Contract
The Company’s capitalized costs are primarily derived from the fulfillment of SaaS related setup and customizations from which the customer receives benefit through continued access to and use of the SaaS product platforms. In accordance with the guidance in ASC 340-40-25-5, we capitalize the costs directly related to the setup and development of these customizations which satisfy the Company’s performance obligation with respect to access to the Company’s underlying product platforms. The capitalized costs primarily consist of the salaries of the developers directly involved in fulfilling the project and are solely based on the time spent on that project. The Company amortizes the capitalized costs ratably over the expected useful life of the related customizations, matching our treatment for the related revenue, and the capitalized costs are recoverable from profit margin included in the contract. As of December 31, 2019, the Company had $734 thousand of contract costs in “Other current assets” and $1.2 million in “Other Assets” on the Company's Condensed Consolidated Balance Sheets.
(In thousands) | December 31, 2019 | December 31, 2018 | ||||||
Balance, beginning of period | $ | $ | ||||||
Costs recognized from beginning balance | ( | ) | ( | ) | ||||
Additions, net of costs recognized | ||||||||
Balance, end of period | $ | $ | ||||||
73
Contract Liabilities
The Company records contract liabilities when it receives payments or invoices in advance of the performance of services.A significant portion of this balance relates to contracts where the customer has paid in advance for the use of our SaaS platforms over a specified period of time. This portion is recognized as the related performance obligation is fulfilled (generally less than one year). Part of our performance obligation for these contracts consists of the requirement to provide our customers with continued access to, and use of, our SaaS platforms and associated customizations. Without continued access to the SaaS platform, the customizations have no separate benefit to the customer. Our customers simultaneously receive and consume the benefits as we provide access over time. The remaining portion of the contract liabilities balance consists primarily of customer-specific customizations that are not distinct from related performance obligations that transfer over time. This portion is recognized over the expected useful life of the customizations.
(In thousands) | December 31, 2019 | December 31, 2018 | ||||||
Balance, beginning of period | $ | $ | ||||||
Revenue recognized from beginning balance | ( | ) | ( | ) | ||||
Additions from business acquisitions | ||||||||
Additions, net of revenue recognized and currency translation | ||||||||
Balance, end of period | $ | $ | ||||||
Revenue Allocated to Remaining Performance Obligations
The following table presents our estimated revenue allocated to remaining performance obligations for contracted revenue that has not yet been recognized, representing our “contractually committed” revenue as of December 31, 2019 that we will transfer from contract liabilies and recognize in future periods:
Estimated Revenue (In thousands): | |||
For the year ending December 31, 2020 | $ | ||
For the year ending December 31, 2021 | |||
For the year ending December 31, 2022 | |||
For the year ending December 31, 2023 | |||
For the year ending December 31, 2024 | |||
$ | |||
During the third quarter of 2019, the Company recorded a $12.1 million provision for doubtful account as a precautionary measure, against the receivables due from a public sector entity, BSNL, in India. Payment of these receivables has been delayed
74
due to liquidity issues at BSNL. The Government of India has recently approved funding to BSNL and the Company expects the accounts to be collectible once the Government funding reaches BSNL.
Costs of Services Provided—Costs of services provided consist of data processing costs, customer support costs including personnel costs to maintain our proprietary databases, costs to provide customer call center support, hardware and software expense associated with transaction processing systems and exchanges, telecommunication and computer network expense, and occupancy costs associated with facilities where these functions are performed. Depreciation expense is not included in costs of services provided.
Goodwill and Indefinite-Lived Intangible Assets—Goodwill represents the cost in excess of the fair value of the identifiable net assets from the businesses that we acquire. In accordance with ASC 350, “Goodwill and Other Intangible Assets"
and ASU No. 2011-08, “Testing Goodwill for Impairment”, goodwill is tested for impairment at the reporting unit level on an annual basis or on an interim basis if an event occurred or circumstances change that would indicate that fair value of our reporting unit decreased below its carrying value. Potential impairment indicators include a significant change in the business climate, legal factors, operating performance indicators, competition, customer retention and the sale or disposition of a significant portion of the business. The Company applies the accounting guidance concerning goodwill impairment evaluation whereby the Company first assesses certain qualitative factors to determine whether the existence of events or circumstances would indicate that it is more likely than not that the fair value of a reporting unit was less than its carrying amount. If after assessing the totality of events and circumstances, we were to determine that it is more likely than not that the fair value of a reporting unit is less than its carrying amount, then we would perform quantitative impairment testing.
We perform our annual goodwill impairment evaluation and testing as of October 1st of each year or, when events or circumstances dictate, more frequently.
This analysis consisted of an evaluation of financial and industry trends and the Company's market capitalization which exceeded its carrying value by approximately $700 million as of our measurement date.
Changes in the carrying amount of goodwill for the years ended December 31, 2019 and 2018 are as follows:
December 31, 2019 | December 31, 2018 | ||||||
(In thousands) | |||||||
Beginning Balance | $ | $ | |||||
Additions for current year acquisitions | |||||||
Adjustments for final purchase accounting | ( | ) | |||||
Foreign currency translation adjustments | ( | ) | ( | ) | |||
Ending Balance | $ | $ | |||||
75
to these carriers and corporate clients cannot feasibly be effectively replaced in the foreseeable future, and accordingly the cash flows forthcoming from these customers are expected to continue indefinitely. With respect to the determination of the indefinite life, the Company considered the expected use of these intangible assets, historical experience in renewing or extending similar arrangements and the effects of competition, and concluded that there were no indications from these factors to suggest that the expected useful life of these customer relationships would be finite. The Company concluded that no legal, regulatory, contractual, or competitive factors limited the useful life of these intangible assets and therefore their life was considered to be indefinite, accordingly, the Company expects these customer relationships to remain the same for the foreseeable future. Additionally, based on the final purchase price allocation valuation report for the EbixHealth JV (see Note 18 for further explanations), it was concluded that the customer relationship with our joint venture partner, to be by its nature, an indefinite-lived customer relationship.
Indefinite-lived intangible assets are not amortized, but rather are tested for impairment annually. We perform our annual impairment testing of indefinite-lived intangible assets as of October 1st of each year. During the years ended December 31, 2019, 2018, and 2017, we had no impairments to the recorded balances of our indefinite-lived intangible assets. We perform the impairment test for our indefinite-lived intangible assets by comparing the asset’s fair value to its carrying value. An impairment charge is recognized if the asset’s estimated fair value is less than its carrying value.
To estimate the fair value, we utilize cash flow projections. Projections of cash flows are based on our views of revenue growth rates, operating costs, anticipated future economic conditions, the appropriate discount rates relative to risk, and estimates of residual values and terminal values. We believe that our estimates are consistent with assumptions that marketplace participants would use in their estimates of fair value. The use of different estimates or assumptions for our projected discounted cash flows (e.g., revenue growth rates, future economic conditions, discount rates, and estimates of terminal values) when determining the fair value of our reporting unit could result in different values and may result in a goodwill impairment charge.
Purchased Intangible Assets —Purchased intangible assets represent the estimated fair value of acquired intangible assets from the businesses that we acquire. These purchased intangible assets include customer relationships, developed technology, informational databases, and trademarks. We amortize these intangible assets on a straight-line basis over their estimated useful lives, as follows:
Life | ||
Category | (years) | |
Customer relationships | 7-20 | |
Developed technology | 3-12 | |
Airport contract | 9 | |
Store networks | 5 | |
Dealer networks | 15-20 | |
Brand | 15 | |
Trademarks | 3-15 | |
Non-compete agreements | 5 | |
Database | 10 | |
76
December 31, | |||||||
2019 | 2018 | ||||||
(In thousands) | |||||||
Finite-lived intangible assets: | |||||||
Customer relationships | $ | $ | |||||
Developed technology | |||||||
Dealer networks | |||||||
Airport Contract | |||||||
Store Networks | |||||||
Trademarks | |||||||
Brand | |||||||
Non-compete agreements | |||||||
Backlog | |||||||
Database | |||||||
Total intangibles | |||||||
Accumulated amortization | ( | ) | ( | ) | |||
Finite-lived intangibles, net | $ | $ | |||||
Indefinite-lived intangibles: | |||||||
Customer/territorial relationships | $ | $ | |||||
Income Taxes — The Company follows the asset and liability method of accounting for income taxes pursuant to the pertinent guidance issued by the FASB. Deferred income taxes are recorded to reflect the estimated future tax effects of differences between the financial statement and tax basis of assets, liabilities, operating losses, and tax credit carry forwards using the tax rates expected to be in effect when the temporary differences reverse. Valuation allowances, if any, are recorded to reduce deferred tax assets to the amount management considers more likely than not to be realized. Such valuation allowances are recorded for the portion of the deferred tax assets that are not expected to be realized based on the levels of historical taxable income and projections for future taxable income over the periods in which the temporary differences will be deductible.
The Company applies the relevant FASB accounting guidance on accounting for uncertainty in income taxes positions. This guidance clarifies the accounting for uncertainty in income taxes by prescribing the minimum recognition threshold a tax position is required to meet before being recognized in the financial statements. In this regard we recognize the tax benefit from
uncertain tax positions only if it is more likely than not that the tax position will be sustained on examination by the taxing
authorities, based on the technical merits of the position.
The functional currency of the Company's other foreign subsidiaries is the local currency of the country in which the subsidiary operates. The assets and liabilities of these foreign subsidiaries are translated into U.S. dollars at the rates of exchange at the balance sheet dates. Income and expense accounts are translated at the average exchange rates in effect during the period. Gains and losses resulting from translation adjustments are included as a component of accumulated other comprehensive income in the accompanying consolidated balance sheets, and are included in the consolidated statements of comprehensive income. Foreign exchange transaction gains and losses that are derived from transactions denominated in a currency other than the subsidiary's functional currency are included in the determination of net income.
77
in sales and marketing expenses in the accompanying Consolidated Statements of Income. In 2017, reported sales and marketing expenses included $3.9 million of amortization of certain direct-response advertising costs associated with our medical education services, which had been capitalized in accordance with Accounting Standards Codification ("ASC") Topic 340. These costs were being amortized to advertising expense over periods ranging from twelve to twenty-four months based on the type of product the customer purchased. Deferred advertising costs amounted to $1.9 million at December 31, 2017.
Effective January 1, 2018 Subtopic 340-40 replaced that guidance to require the costs of direct-response advertising to be expensed as they are incurred or the first time the advertising takes place. The Company was required to recognize a cumulative effective change to opening retained earnings in the year of adoption of the standard. The Company recorded a one-time $1.9 million adjustment to retained earnings on January 1, 2018 and is expensing all future costs from this date forward. Under the new guidance Subtopic 340-40, the Company's expense decreased by $522 thousand during 2018 from what would have been recorded under legacy US GAAP 340-20.
Life | |
Asset Category | (years) |
Buildings | |
Building Improvements | |
Computer equipment | |
Furniture, fixtures and other | |
Software | |
Land Improvements | |
Land | Unlimited life |
Leasehold improvements | Shorter of asset life or life of the lease |
In December 2019, the FASB issued ASU 2019-12, Income Taxes (Topic 740): "Simplifying the Accounting for Income Taxes". ASU 2019-12 is expected to reduce the cost and complexity related to the accounting for income taxes by eliminating the need for an entity to analyze whether the following apply to a given reporting period:
• Exception to the incremental approach for intra period tax allocation;
• Exceptions to accounting for basis differences when there are ownership changes in foreign investments; and
• Exception in interim period income tax accounting for year-to-date losses that exceed anticipated losses.
For public business entities, the amendments in this Update are effective for fiscal years, and interim periods within those fiscal years, beginning after December 15, 2020. The Company not yet assessed the impact that the adoption of this guidance will have on its statement of financial position or its statement of income.
78
In November 2018, the FASB issued ASU 2018-18, Collaborative Arrangements (Topic 808): "Clarifying the Interaction between Topic 808 and Topic 606 (Revenues from Customers)". ASU 2018-18 clarifies the interaction between the guidance for certain collaborative arrangements and the Revenue Recognition financial accounting and reporting standard. A collaborative arrangement is a contractual arrangement under which two or more parties actively participate in a joint operating activity and are exposed to significant risks and rewards that depend on the activity’s commercial success. The ASU provides guidance on how to assess whether certain transactions between collaborative arrangement participants should be accounted for within the revenue recognition standard. The ASU also provides comparability in the presentation of revenue for certain transactions between collaborative arrangement participants. It accomplishes this by allowing organizations to only present units of account in collaborative arrangements that are within the scope of the revenue recognition standard together with revenue accounted for under the revenue recognition standard. The parts of the collaborative arrangement that are not in the scope of the revenue recognition standard should be presented separately from revenue accounted for under the revenue recognition standard. The amendments in ASU No. 2018-18 are effective for fiscal years beginning after December 15, 2019, and interim periods within those fiscal years.
In August 2018, the FASB issued ASU 2018-13, Fair Value Measurement (Topic 820): "Disclosure Framework-Changes to the Disclosure Requirements for Fair Value Measurement". ASU 2018-13 is intended to improve the effectiveness of ASC 820’s disclosure requirements. The amendments in this ASU are effective for public business entities for fiscal years beginning after December 15, 2019, including interim periods within that fiscal year.
In February 2018, the FASB issued 2018-02, Income Statement-Reporting Comprehensive Income (Topic 220): "Reclassification of Certain Tax Effects from Accumulated Other Comprehensive Income". The ASU provides that the stranded tax effects from the Tax Act in accumulated other comprehensive loss may be reclassified to retained earnings. The amendments in this ASU are effective for all entities for fiscal years beginning after December 15, 2018, and interim periods within those fiscal years.
In January 2017, the FASB issued ASU 2017-04, Intangibles-Goodwill and Other (Topic 350): "Simplifying the Test for Goodwill Impairment". To simplify the subsequent measurement of goodwill, the FASB eliminated Step 2 from the goodwill impairment test. In computing the implied fair value of goodwill under Step 2, an entity had to perform procedures to determine the fair value at the impairment testing date of its assets and liabilities (including unrecognized assets and liabilities). Instead, under the amendments in this ASU, an entity should perform its annual, or interim, goodwill impairment test by comparing the fair value of a reporting unit with its carrying amount. A public business entity filer should adopt the amendments in this ASU for its annual or any interim goodwill impairment tests in fiscal years beginning after December 15, 2019.
In January 2017, the FASB issued ASU 2017-01, Business Combinations (Topic 805): "Clarifying the Definition of a Business" which amended the existing FASB ASC. The standard provides additional guidance to assist entities with evaluating whether transactions should be accounted for as acquisitions (or disposals) of assets or businesses. The definition of a business affects many areas of accounting, including acquisitions, disposals, goodwill, and consolidation. ASU 2017-01 is effective for fiscal 2019 with early adoption permitted. The Company adopted this guidance in 2019 and it had an effect classification certain of its recent acquisitions.
In October 2016, the FASB issued ASU 2016-16, Taxes (Topic 740): "Intra-Entity Transfers of Assets Other Than Inventory". Current GAAP prohibits the recognition of current and deferred income taxes for an intra-entity asset transfer until the asset has been sold to an outside party. This prohibition on recognition is an exception to the principle of comprehensive recognition of current and deferred income taxes in GAAP. The amendments specified by ASU 2016-16 require an entity to recognize the income tax consequences of an intra-entity transfer of an asset other than inventory when the transfer occurs. The amendments eliminate the exception for an intra-entity transfer of an asset other than inventory. Two common examples of assets included in the scope of the amendments are intellectual property, and property, plant and equipment. The amendments do not include new disclosure requirements; however, existing disclosure requirements might be applicable when accounting for the current and deferred income taxes for an intra-entity transfer of an asset other than inventory. The amendments align the recognition of income tax consequences for intra-entity transfers of assets other than inventory with International Financial Reporting Standards. IAS 12, Income Taxes, requires recognition of current and deferred income taxes resulting from an intra-entity transfer of any asset (including inventory) when the transfer occurs. The amendments are effective for public business entities for annual reporting periods beginning after December 15, 2017, including interim reporting periods within those annual reporting periods. Early adoption is permitted for all entities in the first interim period if an entity issues interim financial statements. The amendments should be applied on a modified retrospective basis through a cumulative-effect adjustment directly to retained earnings as of the beginning of the period of adoption. The Company adopted this new standard and it not did have a material effect on its consolidated statement of financial position or statement of income.
In June 2016, the FASB issued ASU 2013-13. Financial Instruments - Credit Losses (Topic 326). The main objective of this ASU is to provide financial statement users with more decision-useful information about the expected credit losses on financial instruments and other commitments to extend credit held by a reporting entity at each reporting date. The measurement of expected credit losses is based on relevant information about past events, including historical experience, current conditions, and reasonable
79
and supportable forecasts that affect the collectibility of the reported amount. An entity must use judgment in determining the relevant information and estimation methods that are appropriate in its circumstances. For public business entities that are U.S. Securities and Exchange Commission (SEC) filers, the amendments in this Update are effective for fiscal years beginning after December 15, 2019, including interim periods within those fiscal years. The Company has receivables that are over one year old that will need to be evaluated under this new standard which the Company will adopt in 2020.
Note 2. Earnings per Share
The basic and diluted earnings per share (“EPS”), and the basic and diluted weighted average shares outstanding for all periods as presented in the accompanying Consolidated Statements of Income are shown below:
For the year ended December 31, | ||||||||||||
(In thousands, except per share amounts) | ||||||||||||
Earnings per share: | 2019 | 2018 | 2017 | |||||||||
Basic earnings per common share | $ | $ | $ | |||||||||
Diluted earnings per common share | $ | $ | $ | |||||||||
Basic weighted average shares outstanding | ||||||||||||
Diluted weighted average shares outstanding | ||||||||||||
Basic EPS is equal to net income attributable to Ebix, Inc. divided by the weighted average number of shares of common stock outstanding for the period. Diluted EPS takes into consideration common stock equivalents which for the Company consist of stock options and restricted stock. With respect to stock options, diluted EPS is calculated as if the Company had additional common stock outstanding from the beginning of the year or the date of grant or issuance, net of assumed repurchased shares using the treasury stock method. With respect to restricted stock, diluted EPS is calculated as if the Company had additional common stock outstanding from the beginning of the year or the date of grant or issuance. Diluted EPS is equal to net income attributable to Ebix, Inc divided by the combined sum of the weighted average number of shares outstanding and common stock equivalents. At December 31, 2019, 2018, and 2017 there were 181,875 , 42,000 , and zero respectively of potentially issuable shares with respect to stock options which could dilute EPS in the future but which were excluded from the diluted EPS calculation because presently their effect is anti-dilutive. Diluted shares outstanding are determined as follows for each year ended December 31, 2019, 2018, and 2017:
80
For the year ended December 31, | |||||||||
(In thousands) | |||||||||
2019 | 2018 | 2017 | |||||||
Basic weighted average shares outstanding | |||||||||
Incremental shares for common stock equivalents | |||||||||
Diluted shares outstanding | |||||||||
Note 3. Business Acquisitions
The Company’s business acquisitions are accounted for under the purchase method of accounting in accordance with ASC 805 ("Business Combinations"). Accordingly, the consideration paid by the Company for the businesses it purchases is allocated to the tangible and intangible assets and liabilities acquired based upon their estimated fair values as of the date of the acquisition. The excess of the purchase price over the estimated fair values of assets acquired and liabilities assumed is recorded as goodwill. Recognized goodwill pertains in part to the value of the expected synergies to be derived from combining the operations of the businesses we acquire including the value of the acquired workforce. While we use our best estimates and assumptions to accurately value assets acquired and liabilities assumed at the acquisition date as well as contingent consideration, where applicable, our estimates are inherently uncertain and subject to refinement. As a result, during the measurement period, which may be up to one year from the acquisition date, we may record significant adjustments to the assets acquired and liabilities assumed with the corresponding offset to goodwill. Upon the conclusion of the measurement period or final determination of the values of assets acquired or liabilities assumed, whichever comes first, any subsequent adjustments are recognized in our consolidated statements of income.
The Company's practice is to immediately integrate all functions including infrastructure, sales and marketing, administration, product development after a business acquisition is consummated, so as to ensure that synergistic efficiencies are maximized, redundancies eliminated, and to leverage cross-selling opportunities. Furthermore, the Company centralizes certain key functions such as information technology, marketing, sales, human resources, finance, and other general administrative functions after an acquisition, in order to realize cost efficiencies. By executing this integration strategy, it becomes neither practical nor feasible to accurately and separately track and disclose the earnings from the business combinations we have executed after they have been acquired.
A significant component of the purchase price consideration for many of the Company's business acquisitions is a potential future cash earnout based on reaching certain specified future revenue targets. The terms for the contingent earn-out payments in most of the Company's business acquisitions typically address revenues achieved by the acquired entity over a one, two, and/or three year period subsequent to the effective date of their acquisition by Ebix. These terms typically establish a minimum threshold revenue target with achievement of revenues recognized over that target being awarded in the form of a specified cash earn-out payment. The Company applies these terms in its calculation and determination of the fair value of contingent earn-out liabilities for purchased businesses as part of the related valuation and purchase price allocation exercise for the corresponding acquired assets and liabilities. The Company recognizes these potential obligations as contingent liabilities as reported on its Consolidated Balance Sheets. As discussed in more detail in Note 1, these contingent consideration liabilities are recorded at fair value on the acquisition date and are remeasured quarterly based on the then assessed fair value and adjusted if necessary. During each of the years ending December 31, 2019, 2018 and 2017, these aggregate contingent accrued earn-out business acquisition consideration liabilities, were reduced by $16.5 million, $1.4 million, and $164 thousand, respectively, due to remeasurements as based on the then assessed fair value and changes in the amount and timing of anticipated future revenue levels. These reductions to the contingent accrued earn-out liabilities resulted in corresponding reduction to general and administrative expenses as reported on the Consolidated Statements of Income. As of December 31, 2019, the total of these contingent liabilities was $10.1 million, of which $1.5 million is reported in long-term liabilities, and $8.6 million is included in current liabilities in the Company's Consolidated Balance Sheet. As of December 31, 2018, the total of these contingent liabilities was $25.0 million of which $11.2 million was reported in long-term liabilities, and $13.8 million was included in current liabilities in the Company's Consolidated Balance Sheet.
2019 Acquisitions
Wallstreet Canada- Effective August 23, 2019, Ebix acquired Canada based Wallstreet Canada, a foreign exchange and outward remittance service provider for approximately $2.1 million inclusive of net acquired working capital. The valuation and purchase price allocation remains preliminary and will be finalized as soon as practicable but in no event longer than one year from the effective date of this transaction.
81
Essel Forex- Effective January 1, 2019, Ebix acquired the assets of India based Essel Forex, for approximately $8.7 million, plus possible future contingent earn-out payments of up to $721 thousand based on earned revenues. Ebix funded the entire transaction in cash, using its internal cash reserves. Essel Forex is a large provider of foreign exchange services in India with a wide spectrum of related products including sales of all major currencies, travelers’ checks, demand drafts, remittances, money transfers and prepaid cards primarily for corporate clients. The Company has determined that the fair value of the contingent earn-out consideration is $396 thousand as of December 31, 2019.
Zillious- Effective January 1, 2019, Ebix acquired an 80 % controlling stake in India based Zillious for $10.1 million plus possible future contingent earn-out payments of up to $2.2 million based on agreed milestones in the acquisition agreement. Zillious is an on-demand SaaS travel technology solution in the corporate travel segment in India. The Company has determined that the fair value of the contingent earn-out consideration is $1.5 million as of December 31, 2019.
2018 Acquisitions
Weizmann- Effective December 1, 2018, Ebix entered into an agreement to acquire 74.84 % controlling stake in India based Weizmann for $63.1 million. Ebix also made a 90-day time bound public offer to acquire the remaining 25.16 % publicly-held Weizmann Forex shares for approximately $21.1 million to public shareholders. The $77.35 million reported in the consolidated statement of cash flows used for investing activities includes a decrease in previously reported cash acquired of $1.5 million and $12.7 million for an additional 15.1 % of the publicly-held Weizmann Forex shares during 2019. As of December 31, 2019, Ebix has approximately 89.94 % of the controlling stake in India based Weizmann.
Pearl- Effective December 1, 2018, Ebix acquired the assets of India based Pearl, a provider of a comprehensive range of B2B and B2C travel services, under the brand name ‘Sastiticket’, ranging from domestic and international ticketing, incentives travel, leisure products, luxury holidays, and travel documentation for $3.4 million and has been integrated with Ebix Travels’ operations, which has brought in operational synergies and certain redundancies for the acquired operations.
Lawson- Effective December 1, 2018, Ebix acquired India based Lawson, a B2B provider of travel services and international ticketing, for $2.7 million and has been integrated with EbixCash Travels’ operations to bring in operational synergies and wider country wide footprint.
AHA Taxis- Effective October 1, 2018, Ebix acquired a 70 % stake in India based AHA Taxis, a platform for on-demand inter-city cabs in India for $382 thousand. Consideration of $71 thousand was paid during the fourth quarter of 2018, $214 thousand during the first quarter of 2019, and $72 thousand remains to be paid. AHA focuses its attention on Corporate and Consumer inter-city travel primarily with a network of thousands of registered AHA Taxis.
Routier- Effective October 1, 2018, Ebix acquired a 67 % stake in India based Routier, a marketplace for trucking logistics for $413 thousand.
Business Travels- Effective October 1, 2018, Ebix acquired the assets of India based Business Travels for $1.1 million and same has been integrated with Ebix Travels’ operations to expand the wholesale travel and consolidation business. Consideration of $414 thousand was paid during the fourth quarter of 2018 and $689 thousand during the first quarter of 2019.
Miles - Effective August 1, 2018, Ebix entered into an agreement to acquire India based Miles, a provider of on-demand software on wealth and asset management to banks, asset managers and wealth management firms, for approximately $18.3 million, plus possible future contingent earn-out payments of up to $8.3 million based on earned revenues over the subsequent twenty-four month period following the effective date of the acquisition. The Company has determined that the fair value of the contingent earn-out consideration is $7.7 million as of December 31, 2019.
Leisure - Effective July 1, 2018, Ebix entered into an agreement to acquire India based Leisure for approximately $1.6 million, with the goal of creating a new travel division to focus on a niche segment of the travel market.
Mercury - Effective July 1, 2018, Ebix entered into an agreement to acquire India based Mercury Travels for approximately $13.2 million, with the goal of creating a new travel division to focus on a niche segment of the travel market. Mercury’s Forex business has been integrated into EbixCash’s existing forex business.
Indus - Effective July 1, 2018, Ebix entered into an agreement to acquire India based Indus, a global provider of enterprise lending software solutions to financial institutions, captive auto finance and telecom companies, for approximately $22.9 million plus possible future contingent earn-out payments of up to $5.0 million based on the agreed upon revenues and EBITDA milestones
82
achieved over the subsequent twenty-four month period following the effective date of the acquisition. The Company has determined that the fair value of the contingent earn-out consideration is zero as of December 31, 2019.
Centrum - Effective April 1, 2018, Ebix entered into an agreement to acquire India based Centrum, a leader in India’s Foreign Exchange Operation markets for approximately $179.5 million. This acquisition was completed in June 2018. Subsequently, Centrum has been renamed as EbixCash World Money and has been tightly integrated into the EbixCash Exchange in India and abroad, with key business executives of Centrum's foreign exchange operations becoming an integral part of the combined EbixCash senior leadership.
Smartclass - Effective April 1, 2018, Ebix entered into an agreement to acquire a 60 % stake in India based Smartclass, a leading e-learning Company engaged in the business of education services, development of education products, and implementation of education solutions for K-12 Schools through its E-Learning Venture. Under the terms of the agreement, Ebix paid $8.6 million in cash for its stake in Smartclass.
Transcorp - Effective February 1, 2018, Ebix acquired the MTSS Business of Transcorp, for upfront cash consideration in the amount of $7.25 million, of which $6.55 million was funded with cash and $700 thousand assumed in liabilities. MTSS operations of Transcorp has been consolidated with EbixCash’s MTSS operations resulting in operational synergies and certain redundancies to the combined operation.
Company acquired | Date acquired | Goodwill | Intangibles Assets | Contingent Earn-Out Provision | ||||||||||
(In thousands) | ||||||||||||||
Transcorp | Feb-18 | $ | $ | $ | ||||||||||
Centrum | Apr-18 | |||||||||||||
SmartClass | Apr-18 | |||||||||||||
Indus | Jul-18 | |||||||||||||
Leisure | Jul-18 | |||||||||||||
Mercury | Jul-18 | |||||||||||||
Miles | Aug-18 | |||||||||||||
AHA Taxis | Oct-18 | |||||||||||||
Business Travels | Oct-18 | |||||||||||||
Routier | Oct-18 | |||||||||||||
Lawson | Dec-18 | |||||||||||||
Pearl | Dec-18 | |||||||||||||
Weizmann | Dec-18 | |||||||||||||
Total for 2018 acquisitions | $ | $ | $ | |||||||||||
Essel Forex | Jan-19 | |||||||||||||
Zillious | Jan-19 | |||||||||||||
Wallstreet Canada* | Aug-19 | |||||||||||||
Total for 2019 acquisitions | $ | $ | $ | |||||||||||
*The valuation and purchase price allocation remains preliminary and will be finalized as soon as practicable but in no event longer than one year from the effective date of this transaction. | ||||||||||||||
83
December 31, | ||||||||
(In thousands) | 2019 | 2018 | ||||||
Fair value of total consideration transferred | ||||||||
Cash | $ | $ | ||||||
Consideration payable upon certain conditions being met | ||||||||
Contingent earn-out consideration arrangement (net) | ( | ) | ||||||
Total consideration transferred | ||||||||
Fair value of equity components recorded (not part of consideration) | ||||||||
Recognition of noncontrolling interest of joint ventures | ( | ) | ||||||
Total equity components recorded | ( | ) | ||||||
Total consideration transferred and equity components recorded | $ | $ | ||||||
Fair value of assets acquired and liabilities assumed | ||||||||
Cash, net of adjustment | $ | ( | ) | $ | ||||
Other current assets | ||||||||
Property, plant, and equipment | ||||||||
Other long term assets | ||||||||
Intangible assets, definite lived | ||||||||
Capitalized software development costs | ||||||||
Deferred tax liability | ||||||||
Current and other liabilities, net of consideration transferred | ( | ) | ||||||
Net assets acquired, excludes goodwill | ||||||||
Goodwill | ||||||||
Total net assets acquired | $ | $ | ||||||
The following table summarizes the separately identified intangible assets acquired as a result of the acquisitions that occurred during 2019 and 2018:
December 31, | ||||||||||||
2019 | 2018 | |||||||||||
Weighted Average | Weighted Average | |||||||||||
Intangible asset category | Fair Value | Useful Life | Fair Value | Useful Life | ||||||||
(In thousands) | (In years) | (In thousands) | (In years) | |||||||||
Customer relationships | $ | $ | ||||||||||
Developed technology | ||||||||||||
Agent network | ||||||||||||
Airport contracts | ||||||||||||
Store networks | ||||||||||||
Brand | ||||||||||||
Branch network | ||||||||||||
Purchase accounting adjustments for prior year acquisitions | ( | ) | ||||||||||
Total acquired intangible assets | $ | $ | ||||||||||
84
Estimated aggregate future amortization expense for the intangible assets recorded as part of the business acquisitions described above and all other prior acquisitions is as follows:
Future Amortization Expenses (In thousands): | |||
For the year ending December 31, 2020 | $ | ||
For the year ending December 31, 2021 | |||
For the year ending December 31, 2022 | |||
For the year ending December 31, 2023 | |||
For the year ending December 31, 2024 | |||
Thereafter | |||
$ | |||
Note 4. Unaudited Pro Forma Financial Information (re: 2019 and 2018 acquisitions)
This unaudited pro forma financial information is provided for informational purposes only and does not project the Company’s results of operations for any future period.
The aggregated unaudited pro forma financial information pertains to all of the Company's acquisitions made during 2019 and 2018, which includes the acquisitions of Transcorp (acquired February 2018), Centrum (acquired April 2018), Smartclass (acquired April 2018), Indus (acquired July 2018), Mercury (acquired July 2018), Leisure (acquired July 2018), Miles (acquired August 2018), Routier (acquired October 2018), Business Travels (acquired October 2018), Aha Taxis (acquired October 2018), Pearl (acquired December 2018), Weizmann (acquired December 2018), Zillious (acquired January 2019), Essel (acquired January 2019), and Wallstreet Canada (acquired August 2019) as presented in the table below, and is provided for informational purposes only and does not project the Company's expected results of operations for any future period. No effect has been given in this pro forma information for future synergistic benefits that may still be realized as a result of combining these companies or costs that may yet be incurred in integrating their operations. The 2019 and 2018 pro forma financial information below assumes that all such business acquisitions were made on January 1, 2018, whereas the Company's reported financial statements for 2019 only includes the operating results from the businesses since the effective date that they were acquired by Ebix, and therefore includes twelve months of Zillious, twelve months of Essel Forex, and eight months of Wallstreet Canada. Similarly, the 2018 pro forma financial information below includes a full year of results for Transcorp, Centrum, Smartclass, Indus, Mercury, Leisure, Miles, Routier, Business Travels, AHA Taxis, Pearl, Weizmann and Lawson as if they had been had been acquired on January 1, 2018, whereas the Company's reported financial statements for the 2018 includes only eleven months of Transcorp, nine months of Centrum, nine months of Smartclass, six months of Indus, six months of Mercury, six months of Leisure, five months of Miles, three months of Routier, three months of Business Travels, three months of AHA Taxis, one month of Pearl, one month of Weizmann, and one month of Lawson.
As Reported 2019 | Pro Forma 2019 | As Reported 2018 | Pro Forma 2018 | |||||||||||||
(unaudited) | (unaudited) | |||||||||||||||
(In thousands, except per share amounts) | ||||||||||||||||
Revenue | $ | $ | $ | $ | ||||||||||||
Net income attributable to Ebix, Inc. | $ | $ | $ | $ | ||||||||||||
Basic EPS | $ | $ | $ | $ | ||||||||||||
Diluted EPS | $ | $ | $ | $ | ||||||||||||
In the above table, the unaudited pro forma revenue for the year ended December 31, 2019 increased by $4.2 million from the unaudited pro forma revenue for 2018 of $577.0 million to $581.1 million, representing a 0.7 % increase. The reported revenue in the amount of $580.6 million for the year ended December 31, 2019 increased by $82.8 million or 16.6 % from the $497.8 million of reported revenue for the year ended December 31, 2018.
The cause for the difference between the 16.6 % increase in reported 2019 revenue versus 2018 revenue, as compared to the 0.7 % increase in 2019 unaudited pro forma versus 2018 unaudited pro forma revenue is due to the effect of combining the additional revenue derived from those businesses acquired during the years 2019 and 2018, specifically Wallstreet Canada, Zillious,
85
Essel Forex, Transcorp, Centrum, Smartclass, Indus, Mercury, Leisure, Miles, Routier, Business Travels, AHA Taxis, Pearl, Weizmann, and Lawson with the Company's pre-existing operations. The 2019 and 2018 unaudited pro forma financial information assumes that all such business acquisitions were made on January 1, 2018, whereas the Company's reported financial statements for 2019 thusly includes twelve months of Zillious, twelve months of Essel Forex, and four months of Wallstreet Canada.
The above unaudited pro forma analysis is based on the following premises:
• | 2019 and 2018 pro forma revenue contains actual revenue of the acquired entities before acquisition date, as reported by the sellers, as well as actual revenue of the acquired entities after acquisition. Growth in revenues of the acquired entities after acquisition date is only reflected for the period after their acquisition. |
• | Revenue billed to existing clients from the cross selling of acquired products has been assigned to the acquired section of our business. |
• | Any existing products sold to new customers acquired through the acquisition customer base, has also been assigned to the acquired section of our business. |
• | The impact from fluctuations of the exchange rates for the foreign currencies in the countries in which we conduct operations also partially affected reported revenues. During each of the years 2019 and 2018 the change in foreign currency exchange rates decreased consolidated operating revenues by $( |
Note 5. Commercial Bank Financing Facility
On February 21, 2018, Ebix, Inc. and certain of its subsidiaries entered into the Sixth Amendment to the Regions Secured Credit Facility, dated August 5, 2014, among the Company, Regions and certain other lenders party thereto (as amended, the "Credit Agreement"). The Sixth Amendment amends the Credit Agreement by increasing its existing credit facility from $450 million to $650 million, to assist in funding its growth. The increase in the bank line was the result of many members of the existing bank group expanding their share of the credit facility and the addition of BBVA Compass and Bank of the West to the Banking Syndicate, which diversifies Ebix’s lending group under the credit facility to ten participants. The syndicated bank group then comprised ten leading financial institutions that include Regions Bank, PNC Bank, BMO Harris Bank, BBVA Compass, Fifth Third Bank, KeyBank, Bank of the West, Silicon Valley Bank, Cadence Bank and Trustmark National Bank. Regions Bank continued to lead the banking group while serving as the administrative and collateral agent. PNC Bank and BMO Harris Bank were added as co-syndication agents, BBVA Compass and Fifth Third Bank as co-documentation agent, while Regions Capital Markets, PNC Capital Markets and BMO Harris Bank acted as joint lead arrangers and joint bookrunners. The new credit facility had the following key components: A five-year term loan for $250 million, with initial repayments starting June 30, 2018 due in the amount $3.13 million for the first eight quarters and increasing thereafter and a five-year revolving credit facility for $400 million. The new credit facility also allows for up to $150 million of incremental facilities.
On April 9, 2018, the Company and certain of its subsidiaries entered into the Seventh Amendment to the Regions Secured Credit Facility increasing the permitted indebtedness in the form of unsecured convertible notes from $250 million to $300 million.
On November 27, 2018, Ebix entered into the Eighth Amendment to the Regions Secured Credit Facility, dated August 5, 2014, among the Company, Regions and certain other lenders party thereto to exercise $101.25 million of its aggregate $150 million accordion option, increasing the total Term Loan Commitment to $301.25 million from $250 million, with initial repayments starting December 31, 2018 due in the amount of $3.77 million for the first six quarters and increasing thereafter. The revolving credit facility increased from $400 million to $450 million. The Credit Agreement carries a leverage-based LIBOR related interest rate, which currently stands at approximately 4.250 %. The expanded credit facility will continue to be used to fund the Company's future growth and share repurchase initiatives.
On September 27, 2019, the Company and certain of its subsidiaries entered into the Ninth Amendment (the “Ninth Amendment”) to the Credit Agreement which amended the definition of “Consolidated EBITDA" to add back the derivative legal settlement, “Indebtedness” to disqualify equity interests to be issued regarding the Yatra Online acquisition, and modified the maximum consolidated debt leverage ratios allowed.
At December 31, 2019, the outstanding balance on the revolving line of credit with Regions was $438.0 million and the facility carried an interest rate of 4.25 %. This balance is included in the long-term liabilities section of the Consolidated Balance Sheets. During 2019, the average and maximum outstanding balances on the revolving line of credit were $437.2 million and $438.0 million, respectively, and the weighted average interest rate was 4.90 %. At December 31, 2018, the outstanding balance on the revolving line of credit was $424.5 million and the facility carried an interest rate of 4.88 %.
86
Note 6. Commitments and Contingencies
Contingencies—As the Company previously disclosed, in May 2013, twelve putative class action complaints were filed in the Delaware Court of Chancery against the Company and its board of directors challenging a proposed merger between the Company and an affiliate of Goldman Sachs & Co. On June 10, 2013, the Court entered an Order of Consolidation and Appointment of Lead Plaintiffs and a Leadership Structure consolidating the twelve actions and appointing lead plaintiffs (“Plaintiffs”) and lead counsel in the litigation, captioned In re Ebix, Inc. Stockholder Litigation, Consol. C.A. No. 8526-VCS (the “Litigation”).
In connection with the Litigation, on January 23, 2019, the parties entered into a Stipulation and Agreement of Settlement (the “Settlement Agreement”) pursuant to which the parties agreed, subject to approval by the Delaware Court of Chancery, to settle and resolve the Litigation pursuant to the terms set forth in the Settlement Agreement (the “Litigation Settlement”).
On April 5, 2019, the Delaware Court of Chancery determined that the Litigation Settlement was fair, reasonable, adequate and in the best interest of the plaintiffs, the class and the Company and awarded to plaintiffs’ counsel attorneys’ fees and expenses in the sum of $19.65 million, payable by the Company within 20 days, and entered an Order and Final Judgment (the “Order”)
approving the Litigation Settlement. The Order provides for full settlement, satisfaction, compromise and release of all claims that were asserted or could have been asserted in the Litigation, whether on behalf of the class or the Company. The Order is publicly available for inspection at the Office of the Register in Chancery, and on the Court's online electronic filing system, File & ServeXpress.
The Settlement contains no admission of wrongdoing or liability, and may not be deemed to be a presumption as to the validity of any claims, causes of action or other issues. The Settlement was fully paid on May 2, 2019.
The Company is involved in various other claims and legal actions arising in the ordinary course of business, including labor related post-employment matters that in the aggregate amount to approximately $500 thousand. In the opinion of management, the ultimate likely disposition of these matters will not have a material adverse effect on the Company’s consolidated financial position, results of operations or liquidity.
Lease Commitments— See Note 20.
Business Acquisition Earn-out Contingencies—A significant component of the purchase price consideration for many of the Company's business acquisitions is a potential future cash earnout based on reaching certain specified future revenue targets. The terms for the contingent earn-out payments in most of the Company's business acquisitions typically address the GAAP recognizable revenues achieved by the acquired entity over a one, two, and/or three year period subsequent to the effective date of their acquisition by Ebix. These terms typically establish a minimum threshold revenue target with achievement of revenues recognized over that target being awarded in the form of a specified cash earn-out payment. The Company applies these terms in its calculation and determination of the fair value of contingent earn-out liabilities for purchased businesses as part of the related valuation and purchase price allocation exercise for the corresponding acquired assets and liabilities. As of December 31, 2019, the total of these contingent liabilities was $10.1 million, of which $1.5 million is reported in long-term liabilities, and $8.6 million is included in current liabilities in the Company's Consolidated Balance Sheet. As of December 31, 2018, the total of these contingent liabilities was $25.0 million of which $11.2 million was reported in long-term liabilities, and $13.8 million was included in current liabilities in the Company's Consolidated Balance Sheet.
Self -Insurance—For some of the Company’s U.S. employees the Company has a self-insured plan for its health insurance program and has a stop loss policy that limits the individual liability to $120 thousand per person and the aggregate liability to 125 % of the expected claims based upon the number of participants and historical claims. As of December 31, 2019 and 2018, the amount accrued on the Company’s consolidated balance sheet for the self-insured component of the Company’s employee health insurance was $362 thousand and $232 thousand, respectively. The maximum potential estimated cumulative liability for the annual contract period, which ends in September 2020, is $2.9 million. During the years ending December 31, 2019 and 2018, the Company recognized $2.6 million, and $2.1 million of expense, respectively, associated with claims from its self-insured health insurance program.
87
Gratuity Leave—In accordance with Indian law, we pay gratuity to our eligible employees in India. Under our gratuity plan, an employee is entitled to receive a gratuity payment on the termination of his or her employment if the employee has rendered continuous service to our company for not less than five years, or if the termination of employment is due to death or disability. The amount of gratuity payable to an eligible employee is based on number of years of employment and is limited to a maximum of $28 thousand per employee. As of December 31, 2019 and 2018, the amount accrued on the Company’s consolidated balance sheet for gratuity leave was $3.2 million and $1.6 million, respectively.
Note 7. Share-Based Compensation
Stock Options—The Company accounts for compensation expense associated with stock options issued to employees, Directors, and non-employees based on their fair value, which is calculated using an option pricing model, and is recognized over the service period, which is usually the vesting period. At December 31, 2019, the Company had two equity based compensation plans. No stock options were granted to employees or non-employees during 2019, 2018, and 2017; however, options were granted to Directors in 2019, 2018, and 2017. Stock compensation expense of $537 thousand, $449 thousand and $433 thousand was recognized during the years ending December 31, 2019, 2018, and 2017, respectively, on outstanding and unvested options.
The fair value of options granted during 2019 is estimated on the date of grant using a Black-Scholes option pricing model. The following table includes the weighted- average assumptions used in estimating the fair values and the resulting weighted-average fair value of stock options granted in the periods presented:
Year Ended December 31, | |||||||||||
2019 | 2018 | 2017 | |||||||||
Weighted average fair values of stock options granted | $ | $ | $ | ||||||||
Expected volatility | % | % | % | ||||||||
Expected dividends | % | % | % | ||||||||
Weighted average risk-free interest rate | % | % | % | ||||||||
Expected life of stock options (in years) | |||||||||||
A summary of stock option activity for the years ended December 31, 2019, 2018, and 2017 is as follows:
Shares | Weighted Average Exercise Price | Weighted Average Remaining Contractual Term (Years) | Aggregate Intrinsic Value | |||||||||
(In thousands) | ||||||||||||
Outstanding at January 1, 2017 | $ | $ | ||||||||||
Granted | $ | |||||||||||
Exercised | ( | ) | $ | |||||||||
Canceled | $ | |||||||||||
Outstanding at December 31, 2017 | $ | $ | ||||||||||
Granted | $ | |||||||||||
Exercised | ( | ) | $ | |||||||||
Canceled | $ | |||||||||||
Outstanding at December 31, 2018 | $ | $ | ||||||||||
Granted | $ | |||||||||||
Exercised | $ | |||||||||||
Canceled | ( | ) | $ | |||||||||
Outstanding at December 31, 2019 | $ | $ | ||||||||||
Exercisable at December 31, 2019 | $ | $ | ||||||||||
88
The aggregate intrinsic value for stock options outstanding and exercisable is defined as the difference between the market value of the Company’s stock as of the end of the period and the exercise price of the stock options. The total intrinsic value of stock options exercised during 2019, 2018, and 2017 was zero , $900 thousand, and $169 thousand, respectively.
Cash received or the value of stocks canceled from option exercises under all share-based payment arrangements for the years ended December 31, 2019, 2018, and 2017, was zero , $439 thousand and $52 thousand, respectively.
A summary of non-vested options and changes for the years ended December 31, 2019, 2018 and 2017 is as follows:
Non-Vested Number of Shares | Weighted Average Exercise Price | |||||
Non-vested balance at January 1, 2017 | $ | |||||
Granted | $ | |||||
Vested | ( | ) | $ | |||
Canceled | $ | |||||
Non-vested balance at December 31, 2017 | $ | |||||
Granted | $ | |||||
Vested | ( | ) | $ | |||
Canceled | $ | |||||
Non-vested balance at December 31, 2018 | $ | |||||
Granted | $ | |||||
Vested | ( | ) | $ | |||
Canceled | ( | ) | $ | |||
Non-vested balance at December 31, 2019 | $ | |||||
The following table summarizes information about stock options outstanding by price range as of December 31, 2019:
Options Outstanding | Options Exercisable | |||||||||||||||
Exercise Prices | Number Outstanding | Weighted-Average Remaining Contractual Life (Years) | Weighted-Average Exercise Price | Number of Shares | Weighted-Average Exercise Price | |||||||||||
$21.19 | $ | $ | ||||||||||||||
$28.59 | $ | $ | ||||||||||||||
$41.60 | $ | $ | ||||||||||||||
$42.56 | $ | $ | ||||||||||||||
$49.22 | $ | $ | ||||||||||||||
$52.92 | $ | $ | ||||||||||||||
$53.90 | $ | $ | ||||||||||||||
$ | $ | |||||||||||||||
Restricted Stock—Pursuant to the Company’s restricted stock agreements, the restricted stock granted generally vests as follows: one third after one year, and the remaining in eight equal quarterly installments. The restricted stock also vests with respect to any unvested shares upon the applicable employee’s death, disability or retirement, the Company’s termination of the employee other than for cause, or for a change in control of the Company. A summary of the status of the Company’s non-vested restricted stock grant shares is presented in the following table:
89
Shares | Weighted-Average Grant Date Fair Value | |||||
Non-vested at January 1, 2017 | $ | |||||
Granted | $ | |||||
Vested | ( | ) | $ | |||
Forfeited | $ | |||||
Non-vested at December 31, 2017 | $ | |||||
Granted | $ | |||||
Vested | ( | ) | $ | |||
Forfeited | ( | ) | $ | |||
Non-vested at December 31, 2018 | $ | |||||
Granted | $ | |||||
Vested | ( | ) | $ | |||
Forfeited | $ | |||||
Non-vested at December 31, 2019 | $ | |||||
In the aggregate the total compensation expense recognized in connection with the restricted grants was $2.9 million, $2.4 million, and $2.4 million during each of the years ending December 31, 2019, 2018, and 2017, respectively.
As of December 31, 2019, there was $3.9 million of total unrecognized compensation cost related to non-vested share based compensation arrangements granted under the 2006 and 2010 Incentive Compensation Program. That cost is expected to be recognized over a weighted-average period of 1.77 years. The total fair value of shares vested during the years ended December 31, 2019, 2018, and 2017 was $1.4 million, $2.8 million, and $2.1 million, respectively.
As of December 31, 2019, the Company has 5.2 million shares of common stock reserved for possible future stock option and restricted stock grants.
Note 8. Income Taxes
The income tax expense (benefit) consists of the following:
Year Ended December 31, | |||||||||||
2019 | 2018 | 2017 | |||||||||
(In thousands) | |||||||||||
Current: | |||||||||||
US federal | $ | $ | $ | ||||||||
US state | |||||||||||
Non US | |||||||||||
Deferred: | |||||||||||
US federal | ( | ) | ( | ) | |||||||
US state | ( | ) | ( | ) | ( | ) | |||||
Non US | ( | ) | ( | ) | ( | ) | |||||
( | ) | ( | ) | ( | ) | ||||||
Total | $ | $ | $ | ||||||||
Income (loss) before income taxes includes the following components:
90
Year Ended December 31, | |||||||||||
2019 | 2018 | 2017 | |||||||||
(In thousands) | |||||||||||
US | $ | ( | ) | $ | ( | ) | $ | ( | ) | ||
Non US | |||||||||||
Total | $ | $ | $ | ||||||||
A reconciliation of the statutory federal income tax rate to the effective income tax rate consists of the following:
Year Ended December 31, | ||||||||
2019 | 2018 | 2017 | ||||||
Statutory US federal income tax rate | % | % | % | |||||
US state income taxes, net of federal benefit | ( | )% | ( | )% | ( | )% | ||
Non-US tax rate differential | ( | )% | ( | )% | ( | )% | ||
GILTI Related | % | % | % | |||||
SubPart F | % | % | % | |||||
Tax holidays | ( | )% | ( | )% | ( | )% | ||
Tax Credits | ( | )% | ( | )% | ( | )% | ||
Passive income exemption | ( | )% | ( | )% | ( | )% | ||
Acquisition contingent earnout liability adjustments | ( | )% | ( | )% | % | |||
Nondeductible items | % | ( | )% | % | ||||
Effect of valuation allowance | % | ( | )% | ( | )% | |||
Prior year Transition Tax and related true-ups | % | % | % | |||||
Uncertain tax positions | ( | )% | % | % | ||||
Rate change on deferred taxes primarily due to tax reform | % | % | ( | )% | ||||
Other | ( | )% | % | ( | )% | |||
Effective income tax rate | % | % | % | |||||
The Company's effective tax rate decreased to 0.2 % in 2019, compared with 25.9 % in 2018. The effective tax rate was substantially higher in 2018 primarily due to the recording of a one-time tax liability of the transition tax resulting from enactment of the TCJA. Excluding this, the remaining decrease in the effective tax rate in 2019 is primarily related to prior year true-ups
Excluding one-time impact of Transition tax and related true-ups, the Company’s consolidated worldwide effective tax rate benefits from the effects of conducting significant operations in certain foreign jurisdictions, specifically India and Dubai, where certain units enjoys tax holidays or tax concessions which is partially offset by GILTI tax in the US.
Deferred tax assets and liabilities are comprised of the following:
91
December 31, 2019 | December 31, 2018 | ||||||||||||||
Deferred | Deferred | ||||||||||||||
Assets | Liabilities | Assets | Liabilities | ||||||||||||
(In thousands) | |||||||||||||||
Depreciation and amortization | $ | $ | $ | $ | |||||||||||
Share-based compensation | |||||||||||||||
Accruals and prepaids | |||||||||||||||
Bad debts | |||||||||||||||
Acquired intangible assets | |||||||||||||||
Net operating loss carryforwards | |||||||||||||||
Tax credit carryforwards (primarily Minimum Alternative Tax ("MAT") in India) | |||||||||||||||
Valuation allowance | ( | ) | — | ( | ) | — | |||||||||
Total deferred taxes | $ | $ | $ | $ | |||||||||||
Amounts recognized in the consolidated balance sheets:
2019 | 2018 | ||||
(In thousands) | |||||
Non-current deferred tax assets | |||||
ASU 2013-11 reclass, described below | |||||
Net deferred tax assets | |||||
Non-current deferred tax liabilities | |||||
The valuation allowance increased by $1.3 million and $2.0 million during the years ended December 31, 2019 and 2018, respectively. The presentation above has been modified to correctly show the valuation allowances that should have been recorded and to gross up the Company’s deferred tax assets for implied valuation allowances that were inherited through acquisitions.
We have US Federal, state and foreign operating losses and credit carryforwards as follows:
Year Ended December 31, | ||||||||
2019 | 2018 | |||||||
(In thousands) | ||||||||
US Federal loss carryforwards | $ | $ | ||||||
US state loss carryforwards | ||||||||
Foreign loss carryforwards | ||||||||
US Federal credit carryforwards | ||||||||
Foreign credit carryforwards | ||||||||
The US federal and state operating loss carryforwards expire at varying dates through 2027. The federal credits begin to expire in 2028. We also have non-US US tax credits (primarily MAT paid in India) carried forward of approximately $46.9 million as of December 31, 2019, which is available for set-off against the future tax liability of certain Indian operations on a staggered basis over a period up-to fifteen years .
On December 22, 2017, the TCJA was enacted, substantially changing the U.S. tax system and affecting the Company in a number of ways. Notably, the TCJA: establishes a flat corporate income tax rate of 21.0 % on U.S. earnings; imposes a one-time tax on unremitted cumulative non-U.S. earnings of foreign subsidiaries (“Transition Tax”);imposes a new minimum tax on certain non-U.S. earnings, irrespective of the territorial system of taxation, and generally allows for the repatriation of future
92
earnings of foreign subsidiaries without incurring additional U.S. taxes by transitioning to a territorial system of taxation; subjects certain payments made by a U.S. company to a related foreign company to certain minimum taxes (Base Erosion Anti-Abuse Tax); eliminates certain prior tax incentives for manufacturing in the United States and creates an incentive for U.S. companies to sell, lease or license goods and services abroad by allowing for a reduction in taxes owed on earnings related to such sales; allows the cost of investments in certain depreciable assets acquired and placed in service after September 27, 2017 to be immediately expensed; and reduces deductions with respect to certain compensation paid to specified executive officers.
In March 2018, the FASB Issued ASU No. 2018-05, Income Taxes (Topic 740): Amendments to SEC Paragraphs Pursuant to SEC Staff Accounting Bulletin No. 118. ASU 2018-05 was issued to incorporate into Topic 740 recent SEC guidance related to the income tax accounting implications of the TCJA. Due to the complexities involved in accounting for the enactment of the TCJA, the SEC Staff had issued SAB No. 118 which allowed the Company to record provisional amounts in earnings for the year ended December 31, 2017. ASU 2018-05 became effective immediately and permitted companies to use provisional amounts for certain income tax effects of the TCJA during a one-year measurement period. The Transition Tax is based on the Company’s total post-1986 earnings and profits that were previously deferred from U.S. income taxes. The Company completed its tax accounting for the TCJA during Q4 2018 and recorded an adjustment of $24.5 million related to the transition tax after taking into consideration carried forward NOLs and other tax attributes available for set-off.
The Company has not recognized a deferred U.S. tax liability and associated income tax expense for the undistributed earnings of its foreign subsidiaries which we consider indefinitely invested because those foreign earnings will remain permanently reinvested in those subsidiaries to fund ongoing operations and growth. Upon distribution of those earnings in the form of dividends or otherwise, we may be subject to income taxes and withholding taxes payable in various jurisdictions, which could potentially be partially offset by foreign tax credits. At December 31, 2019 the cumulative amount of the Company’s undistributed foreign earnings was approximately $740.5 million, inclusive of income previously taxed in the United States.
The following table summarizes the activity related to provision made by the Company in the books for uncertain tax positions:
Year Ended December 31, | |||||||||||
2019 | 2018 | 2017 | |||||||||
(In thousands) | |||||||||||
Beginning Balance | $ | $ | $ | ||||||||
Additions for tax positions related to current year | |||||||||||
Additions for tax positions of prior years | |||||||||||
Reductions for tax position of prior years | ( | ) | |||||||||
Ending Balance | $ | $ | $ | ||||||||
The Company recognizes estimated interest accrued and penalties related to uncertain tax positions as part of the income tax expense provided for such positions. The Company accrued as of December 31, 2019 and 2018 approximately $1.0 million and $1.1 million, respectively, of estimated interest and penalties. These amounts are included in the December 31, 2019 and 2018 balances in the preceding table of $9.2 million and $9.3 million, respectively, which is included in other long term liabilities in the accompanying Consolidated Balance Sheet.
We file income tax returns in the US federal, many US state and local jurisdictions, and certain foreign jurisdictions. We have substantially resolved all US federal income tax matters for tax years prior to 2015. Our state and foreign tax matters may remain open from 2008 forward.
Note 9. Stock Repurchases
Effective February 6, 2017, the Company's Board of Directors unanimously approved and authorized a share repurchase plan of $150.0 million. The Board directed that the repurchases be funded with available cash balances and cash generated by the Company's operating activities. Under certain circumstances the aggregate amount of repurchases of the Company's equity shares may be limited by the terms and underlying financial covenants regarding the Company's commercial bank financing facility.
The Company's share repurchase plan’s terms have been structured to comply with the SEC’s Rule 10b-18, and are subject to market conditions and applicable legal requirements. The program does not obligate the Company to acquire any specific number of shares and may be suspended or terminated at any time. All purchases are made in the open market. Treasury stock is recorded
93
at its acquired cost. During 2019, the Company repurchased and retired 95,000 shares of its common stock under these plans for total consideration of $4.2 million. During 2018, the Company repurchased and retired 996,773 shares of its common stock under this plan for total consideration of $49.6 million.
As of December 31, 2019, the Company had $80.1 million remaining in its share repurchase authorization.
Note 10. Accounts Payable and Accrued Expenses
Accounts payable and accrued expenses at December 31, 2019, and December 31, 2018, consisted of the following:
2019 | 2018 | ||||||
(In thousands) | |||||||
Trade accounts payable | $ | $ | |||||
Accrued professional fees | |||||||
Income taxes payable* | |||||||
Share repurchases accrued | |||||||
Sales taxes payable | |||||||
Other accrued liabilities | |||||||
Total | $ | $ | |||||
* Long term portion of income taxes payable pertaining to the 2017 Tax Cuts and Jobs Act one-time transition tax totaling $16.8 million is included in other liabilities in the Company's Consolidated Balance Sheets.
Note 11. Other Current Assets
Other current assets at December 31, 2019 and December 31, 2018 consisted of the following:
2019 | 2018 | ||||||
(In thousands) | |||||||
Prepaid expenses | $ | $ | |||||
Other third party receivables | |||||||
Sales taxes receivable from customers | |||||||
Credit card merchant account balance receivable | |||||||
Short term portion of capitalized costs to obtain and fulfill contracts | |||||||
Accrued interest receivable | |||||||
Other | |||||||
Total | $ | $ | |||||
Note 12. Other Current Liabilities
Other current liabilities at December 31, 2019 and December 31, 2018 consisted of the following:
2019 | 2018 | ||||||
(In thousands) | |||||||
Acquisition obligations (upfront purchase and contingent consideration) | $ | $ | |||||
Redemption liability to reacquire 10% equity stake from PML | |||||||
Customer advances (deposits) | |||||||
Other | |||||||
Total | $ | $ | |||||
Note 13. Property and Equipment
94
Property and equipment at December 31, 2019 and 2018 consisted of the following:
2019 | 2018 | ||||||
(In thousands) | |||||||
Computer equipment | $ | $ | |||||
Buildings | |||||||
Land | |||||||
Land improvements | |||||||
Leasehold improvements | |||||||
Furniture, fixtures and other | |||||||
Less accumulated depreciation and amortization | ( | ) | ( | ) | |||
$ | $ | ||||||
Depreciation expense was $4.3 million, $3.7 million and $3.8 million, for the years ended December 31, 2019, 2018, and 2017, respectively.
Note 14. Cash Option Profit Sharing Plan and Trust
The Company maintains a 401(k) Cash Option Profit Sharing Plan, for our U.S. based employees, which allows participants to contribute a percentage of their compensation to the Profit Sharing Plan and Trust up to the Federal maximum. The Company matches 100 % of an employee’s 1 % contributed and 50 % on the 2 % contributed by an employee. Accordingly, the Company’s contributions to the Plan were $557 thousand, $536 thousand and $610 thousand for the years ending December 31, 2019, 2018, and 2017, respectively.
Note 15. Geographic Information
The Company operates with one operating and one reportable segment whose results are regularly reviewed by the Company's CEO, its chief operating decision maker as to operating performance and the allocation of resources. External customer revenues in the tables below were attributed to a particular country based on whether the customer had a direct contract with the Company which was executed in that particular country for the sale of the Company's products/services with an Ebix subsidiary located in that country.
The following enterprise wide information relates to the Company's geographic locations:
95
Year ended December 31, | ||||||||||||||||||||||||
2019 | 2018 | 2017 | ||||||||||||||||||||||
External Revenues | Long-lived assets | External Revenues | Long-lived assets | External Revenues | Long-lived assets | |||||||||||||||||||
(In thousands) | ||||||||||||||||||||||||
United States | $ | $ | $ | $ | $ | $ | ||||||||||||||||||
Canada | ||||||||||||||||||||||||
Latin America | ||||||||||||||||||||||||
Australia | ||||||||||||||||||||||||
Singapore* | ||||||||||||||||||||||||
New Zealand | ||||||||||||||||||||||||
India* | ||||||||||||||||||||||||
Europe | ||||||||||||||||||||||||
Indonesia* | ||||||||||||||||||||||||
Philippines* | ||||||||||||||||||||||||
United Arab Emirates* | ||||||||||||||||||||||||
Mauritius* | ||||||||||||||||||||||||
$ | $ | $ | $ | $ | $ | |||||||||||||||||||
*Primarily India led businesses for which total revenue was $320.0 million, $217.5 million and $64.3 million for the years ended December 31, 2019, 2018, and 2017, respectively. | ||||||||||||||||||||||||
Note 16. Related Party Transactions
We consider Regions Bank ("Regions") to be a related party because Regions provides financing to the Company via a syndicated commercial banking facility (refer to Note 5 to these Consolidated Financial Statements), for which Regions is the lead bank, and because Regions is also a customer to whom the Company sells products and services. Revenues recognized from Regions were $193 thousand, $221 thousand, and $301 thousand for the years ended December 31, 2019, 2018, and 2017, respectively. Accounts receivable due from Regions were $13 thousand and $74 thousand at December 31, 2019 and 2018, respectively.
We also consider the BMO Bank ("BMO") to be a related party because BMO is a participating bank in the above cited syndicated commercial banking facility, and because BMO is also a customer to whom the Company sells products and services. Revenues recognized from BMO were $351 thousand for the year ended December 31, 2019, and the accounts receivable due from BMO were $29 thousand at December 31, 2019.
As discussed in Note 18 "Investment in Joint Ventures", Vayam Technologies Ltd ("Vayam") is also a customer of the Ebix Vayam Limited JV, and during the twelve months ending December 31, 2019 and 2018, the Ebix Vayam Limited JV recognized $1.4 million and $13.6 million of revenue from Vayam, respectively. As of December 31, 2019, Vayam had $22.8 million of accounts receivable with the Ebix Vayam Limited JV.
Also, as discussed in Note 18 "Investment in Joint Ventures", an in regards to the EbixHealth JV it was concluded that the customer relationship with IHC, our joint venture partner, to be by its nature, a related party.
96
Note 17. Quarterly Financial Information (unaudited)
The following is the unaudited quarterly financial information for 2019, 2018, and 2017:
First Quarter | Second Quarter | Third Quarter | Fourth Quarter | |||||||||||||
(In thousands, except share data) | ||||||||||||||||
Year ended December 31, 2019 | ||||||||||||||||
Total revenues | $ | $ | $ | $ | ||||||||||||
Gross Profit | ||||||||||||||||
Operating income | ||||||||||||||||
Net income from continuing operations | $ | $ | $ | $ | ||||||||||||
Net income per common share: | ||||||||||||||||
Basic | $ | $ | $ | $ | ||||||||||||
Diluted | $ | $ | $ | $ | ||||||||||||
Year ended December 31, 2018 | ||||||||||||||||
Total revenues | $ | $ | $ | $ | ||||||||||||
Gross Profit | ||||||||||||||||
Operating income | ||||||||||||||||
Net income from continuing operations | ||||||||||||||||
Net income per common share: | ||||||||||||||||
Basic | $ | $ | $ | $ | ||||||||||||
Diluted | $ | $ | $ | $ | ||||||||||||
Year ended December 31, 2017 | ||||||||||||||||
Total revenues | $ | $ | $ | $ | ||||||||||||
Gross Profit | ||||||||||||||||
Operating income | ||||||||||||||||
Net income from continuing operations | ||||||||||||||||
Net income per common share: | ||||||||||||||||
Basic | $ | $ | $ | $ | ||||||||||||
Diluted | $ | $ | $ | $ | ||||||||||||
In some instances the sum of the quarterly basic and diluted net income per share amounts may not agree to the full year basic and diluted net income per share amounts reported on the Consolidated Statements of Income because of rounding.
97
Note 18. Investment in Joint Ventures
Effective February 7, 2016, Ebix and Vayam Technologies Ltd ("Vayam") formed a joint venture named Ebix Vayam Limited JV. This joint venture was established to carry out IT projects in the government sector of the country of India and particularly in regards to the implementation of e-governance projects in the areas of education and healthcare. Ebix has a 51 % equity interest in the joint venture, and Vayam has a 49 % equity interest in the joint venture. Ebix is fully consolidating the operations of the Ebix Vayam Limited JV into the Company's financial statements and separately reporting the Vayam minority, non-controlling, interest in the joint venture's net income and equity. Vayam is also a customer of the Ebix Vayam Limited JV, and during the twelve months ending December 31, 2019 and 2018, the Ebix Vayam Limited JV recognized $1.4 million and $13.6 million of revenue from Vayam, respectively. As of December 31, 2019, Vayam had $22.8 million of accounts receivable with the Ebix Vayam Limited JV, net of the estimated allowance for doubtful accounts receivable in the amount of $12.1 million recorded during 2019. In the third quarter of 2019, the Company recorded bad debt reserve as a precautionary measure, against the receivables due from a public sector entity, BSNL, in India. Payment of these receivables has been delayed due to liquidity issues at BSNL. The Government of India has recently approved funding to BSNL and the Company expects the accounts to be collectible once the Government funding reaches BSNL
Effective September 1, 2015, Ebix and IHC formed a joint venture named EbixHealth JV. This joint venture was established to promote and market a best practices administration data exchange for health and pet insurance lines of business nationally. Ebix has a 51 % equity interest in the joint venture and IHC has a 49 % equity interest the joint venture. IHC is also a customer of the EbixHealth JV, and during the twelve months ending December 31, 2019 and 2018, the EbixHealth JV recognized $2.8 million and $7.6 million of revenue from IHC, respectively. As of December 31, 2019, IHC had $335 thousand of accounts receivable with the EbixHealth JV. Furthermore, as a related party, IHC also has been and continues to be a customer of Ebix, and during the twelve months ending December 31, 2019 and 2018, the Company recognized $78 thousand and zero , respectively, of revenue from IHC. As of December 31, 2019 Ebix had $8 thousand of outstanding accounts receivable from IHC. The EbixHealth JV has a $1.8 million note due to IHC. Additionally, based on the final purchase price allocation valuation report for the EbixHealth JV it was concluded that the customer relationship with IHC, our joint venture partner, to be by its nature, an indefinite-lived customer relationship.
Note 19. Capitalized Software Development Costs
In accordance with ASC 350-40 “Internal-Use Software” and/or ASC 350-985 “Software” the Company has capitalized certain software and product related development costs associated with the Company’s continuing medical education service offerings, development of Property and Casualty (P&C) underwriting insurance data exchange platform servicing the London markets; development of EbixCash’s SaaS based Asset Management and Collection platforms having global application; development of EbixCash’s new single-sign on agent and customer portal including mobile application, and content development work related to E-Learning division of EbixCash. During the year ended December 31, 2019 and 2018, the Company capitalized $8.0 million and $8.1 million, respectively, of such development costs. As of December 31, 2019 and 2018, a total of $19.2 million and $14.1 million, respectively, of remaining unamortized development costs are reported on the Company’s consolidated balance sheet. During the year ended December 31, 2019 and 2018, the Company recognized $2.7 million and $2.2 million, respectively, of amortization expense with regards to these capitalized software development costs, which is included in costs of services provided in the Company’s consolidated income statement. The capitalized continuing medical education product costs are being amortized using a three-year to five-year straight-line methodology and certain continuing medical education products costs are immediately expensed. The capitalized software development costs for the property and casualty underwriting insurance data exchange platform are being amortized over a period of five years. The capitalized software development costs related to EbixCash products mentioned above shall be amortized over a period of five years once the platforms / products are rolled out in the market.
Note 20: Leases
In February 2016, the FASB issued ASU 2016-02, Leases (Topic 842). This new accounting guidance is intended to improve financial reporting about leasing transactions. The ASU requires organizations that lease assets referred to as “Lessees” to recognize on the balance sheet the assets and liabilities for the rights and obligations created by those leases. An organization is to provide disclosures designed to enable users of financial statements to understand the amount, timing, and uncertainty of cash flows arising from leases. These disclosures include qualitative and quantitative requirements concerning additional information about the amounts recorded in the financial statements. Under the new guidance, a lessee is required to recognize assets and liabilities for leases with lease terms of more than twelve months. Consistent with current GAAP, the recognition,
98
measurement, and presentation of expenses and cash flows arising from a lease by a lessee primarily will depend on its classification as a finance or operating lease. However, unlike former GAAP, which requires only financing leases to be recognized on the balance sheet, the new ASU requires both types of leases (i.e., operating and financing) to be recognized on the balance sheet. The financing lease will be accounted for in substantially the same manner as capital leases were accounted for under the previous guidance. For operating leases, there is now the recognition of a lease liability and a lease asset for all such leases greater than one year in term.
The Company adopted Topic 842 effective January 1, 2019, using a modified retrospective method and did not restate comparative periods. The Company elected to adopt the package of practical expedients; accordingly, the Company retained the lease classification and initial direct costs for any leases that existed prior to adoption and we did not revisit whether any existing or expired contracts contain leases. The Company has operating and finance leases for office space, retail, data centers and certain office equipment with expiration dates ranging through 2029, with various renewal options. Only renewal options that were reasonably assured to be exercised are included in the lease liability. As of December 31, 2019, the maturity of lease liabilities under Topic 842 are as follows:
Year | Operating Leases | Financing Leases | Total | |||||||||
(In thousands) | ||||||||||||
2020 | $ | $ | $ | |||||||||
2021 | ||||||||||||
2022 | ||||||||||||
2023 | ||||||||||||
2024 | ||||||||||||
Thereafter | ||||||||||||
Total | ||||||||||||
Less: present value discount* | ( | ) | ( | ) | ( | ) | ||||||
Present value of lease liabilities | ||||||||||||
Less: current portion of lease liabilities | ( | ) | ( | ) | ( | ) | ||||||
Total long-term lease liabilities | $ | $ | $ | |||||||||
* The discount rate used was the relevant incremental borrowing rate in each of the jurisdictions wherein the leased properties are located | ||||||||||||
The company's net assets recorded under operating and finance leases were $19.8 million as of December 31, 2019. The lease cost recognized in our Condensed Consolidated Statement of Income in the category of General and Administrative, is summarized as follows:
December 31, 2019 | ||||
(In thousands) | ||||
Operating Lease Cost | $ | |||
Finance Lease Cost: | ||||
Amortization of Lease Assets | ||||
Interest on Lease liabilities | ||||
Finance Lease Cost | ||||
Sublease Income | ( | ) | ||
Total Net Lease Cost | $ | |||
Other information about lease amounts recognized in our Condensed Consolidated Statement of Income is summarized as follows:
99
December 31, 2019 | ||
Weighted Average Lease Term - Operating Leases | ||
Weighted Average Lease Term - Finance Leases | ||
Weighted Average Discount Rate - Operating Leases | % | |
Weighted Average Discount Rate - Finance Leases | % | |
Commitments for minimum rentals under non-cancellable leases, under the legacy guidance in ASC 840 as of December 31, 2018 were as follows:
Year | Operating Leases | Financing Leases | ||||||
(In thousands) | ||||||||
2019 | $ | $ | ||||||
2020 | ||||||||
2021 | ||||||||
2022 | ||||||||
2023 | ||||||||
Thereafter | ||||||||
Total | $ | $ | ||||||
Less: sublease income | ( | ) | ||||||
Net lease payments | $ | |||||||
Less: amount representing interest | ( | ) | ||||||
Present value of obligations under financing leases | $ | |||||||
Less: current portion | ( | ) | ||||||
Long-term obligations | $ | |||||||
As of December 31, 2019, our lease liability of $19.2 million does not include certain arrangements, which are primarily airport leases that do not meet the definition of a lease under Topic 842. Such arrangements represent further commitments of approximately $97.8 million as follows:
Year | Commitments | |||
(In thousands) | ||||
2020 | $ | |||
2021 | ||||
2022 | ||||
2023 | ||||
2024 | ||||
Thereafter | ||||
Total | $ | |||
The Company leases office space under non-cancelable operating leases with expiration dates ranging through 2028, with various renewal options. Finance leases range from three to five years and are primarily for office equipment. There were multiple assets under various individual finance leases at December 31, 2019 and 2018. Rental expense for office and airport facilities and certain equipment subject to operating leases during the year ended December 31, 2019 and 2018 was $37.8 million and $22.3 million, respectively.
Note 21: Working Capital Facility
100
The Company maintains working capital debt facilities with banks in India for working capital funding requirements to support our foreign exchange, travel and remittance businesses. We are required to extend short term credits to franchisee networks (B2B) and corporate customers. Additionally, we are required to maintain minimum levels of foreign currency inventory across branches and airport operations. Typically, these facilities carry interest rates 9 % to 10 % and are rupee denominated working capital lines and are collateralized against the receivables of these businesses and existing foreign currency inventory on hand.
As of December 31, 2019 and 2018, the total of these working capital facilities was $28.4 million and $10.5 million, respectively, and is included in current liabilities in the Company's Condensed Consolidated Balance Sheet.
Note 22. Concentrations of Credit Risk
Credit Risk
The Company is potentially subject to concentrations of credit risk in its accounts receivable. Credit risk is the risk of an unexpected loss if a customer fails to meet its contractual obligations. Although the Company is directly affected by the financial condition of its customers and the loss of or a substantial reduction in orders or the ability to pay from the customer could have a material effect on the consolidated financial statements, management does not believe significant credit risks exist at December 31, 2019. The Company had one customer whose accounts receivable balances individually represented 10 % or more of the Company’s total accounts receivable.
Major Customer
Note 23. Subsequent Events
Dividends
The Company decleared its quarterly cash dividend to the holders of its common stock, whereby a dividend in the amount of $0.075 per common share will be paid on March 16, 2020 to shareholders of record on March 2, 2020.
Compensatory Arrangements of Certain Officers
On January 2, 2020, Mr. Raina proposed and the Compensation Committee accepted that Mr. Raina’s salary be paid in shares of common stock of the Company for his 2020 compensation. As a result, the Company has granted Mr. Raina 107,655 shares of restricted common stock, which represents his annual salary of $3.6 million divided by $33.44 , the closing price of Ebix common stock on January 2, 2020. One third of the shares vest after one year, and the remaining in eight equal quarterly installments.
101
Item 9. CHANGES IN AND DISAGREEMENTS WITH ACCOUNTANTS ON ACCOUNTING AND FINANCIAL DISCLOSURE
As previously disclosed on October 5, 2018, the Audit Committee of the Company's Board of Directors solicited proposals from four major accounting firms and conducted an extensive evaluation process in connection with the selection of the Company's independent auditors. Following this process, on December 21, 2018, the Audit Committee appointed RSM US LLP ("RSM") to serve as the Company's independent auditor for fiscal year ending December 31, 2019. T R Chadha & Co. LLP (“TRC”) were the Company's auditor for the fiscal year ending December 31, 2018. TRC was appointed to serve as the Company’s independent auditor for 2018 on October 5, 2018, replacing Cherry Bekaert LLP (“CBH”), as previously announced. CBH served as the Company’s auditor from 2008 through October 5, 2018.
During the most recent fiscal year neither the Company nor anyone acting on behalf of the Company, consulted RSM regarding any of the matters or events set forth in Item 3.04(a)(2) of Regulation S-K.
In connection with the audits of the Company's consolidated financial statements for the fiscal years ended December 31, 2018, and 2017 there were no disagreements with either TRC or CBH on any matters of accounting principles or practices, financial statement disclosure or auditing scope and procedures which, if not resolved to the satisfaction of TRC or CBH, as applicable, would have caused such former accounting firm to make reference to the matter in their report.
Except as provided in the as following sentence, there were no reportable events (as that term is described in Item 304(a)(1)(v) of Regulation S-K during the fiscal years ended December 31, 2017, 2018, or 2019. The reports of CBH on the Company’s consolidated financial statements as of and for the years ended December 31, 2016 and 2017 did not contain an adverse opinion or a disclaimer of opinion, and were not qualified or modified as to uncertainty, audit scope or accounting principles, except that CBH’s report on internal control over financial reporting expressed an opinion that the Company had not maintained effective internal control over financial reporting as of December 31, 2017 because of the effect of material weaknesses identified by Company management in the design of the Company’s controls over accounting for business combinations, the preparation of the income tax provision, and having contemporaneous documentation of significant acquisition related transactions.
The audit committee of the Company decided to retain KPMG for valuation work and Ernst &Young for tax advice, tax provisioning and SOX internal control evaluation work for the year 2019.
102
Item 9A. CONTROLS AND PROCEDURES
Disclosure Controls and Procedures: We maintain a system of disclosure controls and procedures designed to provide reasonable assurance that the information required to be disclosed by the Company in reports that we file and submit under the Exchange Act is recorded, processed, summarized and reported accurately within the time periods specified in the SEC's rules and forms. Disclosure controls also are designed to reasonably assure that such information is accumulated and communicated to management, including the Chief Executive Officer and Chief Financial Officer, as appropriate, to allow timely decisions regarding required disclosures. Disclosure controls include components of internal control over financial reporting, which consists of control processes designated to provide reasonable assurance regarding the reliability of financial reporting and the preparation of financial statements in accordance with United States generally accepted accounting principles.
We monitor and evaluate on an ongoing basis our disclosure controls and procedures in order to improve their overall effectiveness. In the course of these evaluations, we modify and refine our internal processes and controls as conditions warrant.
Our management, including our Chief Executive Officer and Chief Financial Officer, evaluated the effectiveness of our “disclosure controls and procedures” (as defined in Rule 13a-15(e) promulgated under the Exchange Act) as of December 31, 2019. Based on that evaluation, management has concluded that our disclosure controls and procedures are effective to ensure that information required to be disclosed in the reports that we file or submit under the Exchange Act is accurately recorded, processed, summarized and reported within the time periods specified in the SEC's rules and forms, and to ensure that information is accumulated and communicated to our management, including the Chief Executive Officer and Chief Financial Officer, as appropriate to allow timely decisions regarding required disclosure.
Management’s Report on Internal Control over Financial Reporting
Management is responsible for establishing and maintaining adequate internal control over financial reporting (as defined in Rule 13a-15(f) under the Exchange Act). Our internal control system is designed to provide reasonable assurance regarding the reliability of financial reporting and the preparation of financial statements for external purposes in accordance with United States generally accepted accounting principles.
The term “internal control over financial reporting” is defined as a process designed by, or under the supervision of, our principal executive and principal financial officers, or persons performing similar functions, and effected by our board of directors, audit committee, management and other personnel, to provide reasonable assurance regarding the reliability of financial reporting and the preparation of financial statements for external purposes in accordance with generally accepted accounting principles and includes those policies and procedures that:
Pertain to the maintenance of records that in reasonable detail accurately and fairly reflect our transactions and dispositions of assets;
(2) | Provide reasonable assurance that transactions are recorded as necessary to permit preparation of financial statements in accordance with generally accepted accounting principles, and that receipts and expenditures are being made only in accordance with authorizations of our management and directors; and, |
(3) | Provide reasonable assurance regarding prevention or timely detection of unauthorized acquisition, use or disposition of our assets that could have a material effect on our financial statements. |
Because of its inherent limitations, internal control over financial reporting cannot provide absolute assurance. It is a process that involves human diligence and compliance and is subject to lapses in judgment and breakdowns resulting from human failures. Internal control over financial reporting also can be circumvented by collusion or improper management override of controls. Because of such limitations, there is a risk that material misstatements due to error or fraud may not be prevented or detected on a timely basis by internal control over financial reporting. However, these inherent limitations are known features of the financial reporting process and, therefore, it is possible to design into the process safeguards to reduce, though not eliminate, this risk. Also, projections of any evaluation of the effectiveness of internal control over financial reporting to future periods are subject to the risk that the controls may become inadequate because of changes in conditions, or that the degree of compliance with the policies or procedures may deteriorate.
In making its assessment of the effectiveness of the Company controls over financial reporting, management used the criteria set forth by the 2013 Committee of Sponsoring Organizations of the Treadway Commission, or 2013 COSO Internal
103
Control-Integrated Framework. Based on our assessment and those criteria, management believes that we maintained effective internal control over financial reporting as of December 31, 2019.
RSM US LLP, the independent registered public accounting firm that audited our Consolidated Financial Statements included in this Annual Report on Form 10-K, audited the effectiveness of our internal control over financial reporting as of December 31, 2019. RSM has issued their report which is included in this Annual Report on Form 10-K.
104
Remediation Plans
As previously disclosed, the Company had concluded that material weaknesses existed as of December 31, 2017. The Company engaged Ernst & Young LLP to assist in the review and analysis of the Company’s interim and annual income tax provision methodology, computations and financial reporting. The Company continued to further strengthen controls for income taxes in 2018 with the use of additional resources and expanded use of the independent third-party firm and outside legal tax counsel.
The Company engaged KPMG LLP to assist in the preparation and analysis of the Company’s Purchase Price Accounting and Goodwill Impairment procedures and calculations. The Company continued to further strengthen controls for Valuation Accounting in 2018 with the use of additional resources and expanded use of the independent third-party firms and outside legal counsel. In addition the Company continued to review its procedures surrounding Valuation Accounting, including enhanced internal review and documentation processes.
Management believes these remediation plans were effective in addressing the material weaknesses that existed as of December 31, 2017 and believes that we maintained effective internal control over financial reporting as of December 31, 2018.
Changes in Internal Control over Financial Reporting
The remediation actions set forth above in “Remediation Plans” are changes in the Company’s internal control over financial reporting (as defined in Securities Exchange Act Rule 13a-15(f) or Rule 15d-15(f)) in of 2018 that have materially affected, or are reasonably likely to materially affect, the Company’s internal control over financial reporting.
105
REPORT OF INDEPENDENT REGISTERED PUBLIC ACCOUNTING FIRM
To the Stockholders and the Board of Directors of Ebix, Inc.
Opinion on the Internal Control Over Financial Reporting
We have audited Ebix, Inc. and subsidiaries’ (the Company) internal control over financial reporting as of December 31, 2019, based on criteria established in Internal Control - Integrated Framework issued by the Committee of Sponsoring Organizations of the Treadway Commission in 2013. In our opinion, the Company maintained, in all material respects, effective internal control over financial reporting as of December 31, 2019, based on criteria established in Internal Control - Integrated Framework issued by the Committee of Sponsoring Organizations of the Treadway Commission in 2013.
We have also audited, in accordance with the standards of the Public Company Accounting Oversight Board (United States) (PCAOB), the consolidated balance sheet of the Company as of December 31, 2019, and the related consolidated statements of income, comprehensive income, stockholders’ equity, and cash flows of the Company for the year then ended, and the related notes to the consolidated financial statements and our report dated March 2, 2020 expressed an unqualified opinion.
Basis for Opinion
The Company’s management is responsible for maintaining effective internal control over financial reporting and for its assessment of the effectiveness of internal control over financial reporting in the accompanying Management’s Report on Internal Control over Financial Reporting. Our responsibility is to express an opinion on the Company’s internal control over financial reporting based on our audit. We are a public accounting firm registered with the PCAOB and are required to be independent with respect to the Company in accordance with U.S. federal securities laws and the applicable rules and regulations of the Securities and Exchange Commission and the PCAOB.
We conducted our audit in accordance with the standards of the PCAOB. Those standards require that we plan and perform the audit to obtain reasonable assurance about whether effective internal control over financial reporting was maintained in all material respects. Our audit included obtaining an understanding of internal control over financial reporting, assessing the risk that a material weakness exists, and testing and evaluating the design and operating effectiveness of internal control based on the assessed risk. Our audit also included performing such other procedures as we considered necessary in the circumstances. We believe that our audit provides a reasonable basis for our opinion.
Definition and Limitations of Internal Control Over Financial Reporting
A company's internal control over financial reporting is a process designed to provide reasonable assurance regarding the reliability of financial reporting and the preparation of financial statements for external purposes in accordance with generally accepted accounting principles. A company's internal control over financial reporting includes those policies and procedures that (1) pertain to the maintenance of records that, in reasonable detail, accurately and fairly reflect the transactions and dispositions of the assets of the company; (2) provide reasonable assurance that transactions are recorded as necessary to permit preparation of financial statements in accordance with generally accepted accounting principles, and that receipts and expenditures of the company are being made only in accordance with authorizations of management and directors of the company; and (3) provide reasonable assurance regarding prevention or timely detection of unauthorized acquisition, use or disposition of the company's assets that could have a material effect on the financial statements.
Because of its inherent limitations, internal control over financial reporting may not prevent or detect misstatements. Also, projections of any evaluation of effectiveness to future periods are subject to the risk that controls may become inadequate because of changes in conditions, or that the degree of compliance with the policies or procedures may deteriorate.
/s/ RSM US LLP
Atlanta, Georgia
March 2, 2020
106
Item 9B. OTHER INFORMATION
None.
PART III
Item 10. DIRECTORS, EXECUTIVE OFFICERS AND CORPORATE GOVERNANCE
Directors
ROBIN RAINA, 53, has been a director at Ebix since 2000 and Chairman of the Board at Ebix since May 2002. Mr. Raina joined Ebix in October 1997 as our Vice President-Professional Services and was promoted to Senior Vice President-Sales and Marketing in February 1998. Mr. Raina was promoted to Executive Vice President, Chief Operating Officer in December 1998. Mr. Raina was appointed President effective August 2, 1999, Chief Executive Officer effective September 23, 1999 and Chairman in May 2002. Mr. Raina holds an industrial engineering degree from Thapar University in Punjab, India
Areas of Relevant Experience. Mr. Raina’s strategic direction for the Company and implementation of such direction has proven instrumental for the Company’s turnaround and growth.
HANS U. BENZ, 74, After a master degree at the “Swiss Harvard Business School” HSG in St. Gall in 1970, Hans Benz has made a System- and Business-Engineer career for 40 years in many different positions. He joined Ebix as a director in 2005. From 2001 to 2005 Mr. Benz was President of the holding of the BISON GROUP, a Swiss corporation that develops and implements process-oriented business solution software in Europe. Prior to this position and from 1995 to 2001 he was President of a Swiss banking software development company belonging to the UBS Group. Previously Mr. Benz was with the private bank of Coutts & Co., Zürich as Senior Vice President and was also head of their global IT organization as a part of their larger worldwide NatWest IT organization.
Areas of Relevant Experience. Mr. Benz’s former business experience extends from wholesale and retail industry to the Swiss private insurance industry as founding partner in a national data center. He has extensive experience in the software ERP and finance sectors, international marketing, strategic planning, IT planning, executive compensation, and defining strategic vision.
.
PAVAN BHALLA, 57, has been a director since June 2004. He is currently a Partner with FCM LLC, a consulting firm that serves the largest private equity firms in the world. Prior to that, from May 2017 to March 2019, he was President of Alight Solutions, a global provider of HR outsourced solutions. From September 2011 to April 2017, he was with Aon Corporation and held a number of positions including the CEO of their HR Outsourcing business. Prior to this role, he was the Executive Vice President, Chief Financial Officer and Treasurer of Harris Interactive Inc., a position he held since October 2010. Prior to that, Mr. Bhalla served as Vice President for Hewitt Associates, and had been in this role since August 2006. Before the roles at Hewitt Associates and Harris Interactive, Mr. Bhalla served as the Senior Vice President-Finance of MCI Inc., a global telecommunications company, and supervised the financial management of MCI’s domestic business units. Prior to joining MCI in August 2003, Mr. Bhalla spent more than seven years with BellSouth Corporation, a telecommunications company, serving in a variety of executive positions, including Chief Financial Officer of BellSouth Long Distance from 1999 to 2002 and Corporate Controller of BellSouth Cellular Corp. from 1997 to 1999. Mr. Bhalla holds a master’s degree in business administration from the University of Chicago’s Booth School of Business. He is also a registered Certified Public Accountant from Illinois.
Areas of Relevant Experience. Mr. Bhalla has extensive hands-on relevant experience in corporate finance and international business transactions. His extensive accounting and financial background qualifies him as an audit committee financial expert under applicable SEC and the Nasdaq Stock Market Marketplace Rules (the “Nasdaq Marketplace Rules”).
NEIL D. ECKERT, 57, has been a director since 2005. Neil Eckert serves as the Executive Chairman of IncubEx, a company that specialises in the development of environmental commodity markets. He was also co-founder and Chief Executive Office of Climate Exchange PLC until the sale of the company to Intercontinental Exchange in July 2010 for approximately $600 million. Climate Exchange owned Chicago Climate exchange and European Climate exchange which hosted over 90% of Global Carbon Emissions Trading Scheme volumes. Mr. Eckert was also previously founding Chairman of Trading Emissions PLC, an Aim listed company that invested in Emissions reduction permits. Mr. Eckert founded Brit Insurance in 1995 and served as CEO until 2005. He was founder and Chairman of Aggregated Micropower PLC, an Aim listed renewable developer until its sale in January 2020.
107
Areas of Relevant Experience. Mr. Eckert has an extensive background with experience of operating as the CEO of two different public companies and has executive experience in strategic planning, hands-on understanding of insurance industry, sales and marketing, corporate finance, executive compensation and international matters.
GEORGE W. HEBARD III, 46, has been a director since March 2015. Mr. Hebard was nominated pursuant to the Director Nomination Agreement. Mr. Hebard is the Managing Partner of Ziba Capital, a New York investment firm. He previously served as a Managing Director of Barington Capital Group, a New York investment firm, from January 2014 to June 2019. Mr. Hebard was previously Interim Principal Executive Officer and Interim Chief Operating Officer of Enzon Pharmaceuticals, Inc., a position he held as an employee from May 2012 to December 2013 and as a consultant from January 2014 to March 2016. From September 2011 to April 2012, Mr. Hebard was a Managing Director at Icahn Capital LP, the entity through which Carl C. Icahn manages investment funds. From January 2005 to September 2011, Mr. Hebard served as a Managing Director at Blue Harbour Group, an investment firm in Greenwich, Connecticut. Prior to Blue Harbour Group, Mr. Hebard served as a Managing Director at Ranger Partners from April 2002 to December 2003, and prior to Ranger Partners, Mr. Hebard was an Associate at Icahn Associates Corp. from August 1998 to April 2002. Mr. Hebard has been a director of Ebix, Inc. (NASDAQ: EBIX) since March 2015. He was also a director of Turning Point Brands, Inc. (NYSE: TPB) from May 2014 to September 2018 and a director of Enzon Pharmaceuticals, Inc. (NASDAQ: ENZN) from February 2012 to November 2013. He has an MBA from INSEAD and an A.B. in Economics from Princeton University.
Areas of Relevant Experience. Mr. Hebard brings to the Board over twenty years of experience working in finance and investment management, including a strong record as a financially sophisticated investor with a broad understanding of the operational, financial and strategic issues facing public and private companies.
ROLF HERTER, 56, has been a director since 2005. Mr. Herter is the managing partner of Streichenberg, Attorneys at Law in Zurich, Switzerland. Streichenberg is a mid-sized commercial law firm, and Mr. Herter has been managing partner since 2004. Mr. Herter’s practice consists, among others, of representation for information technology companies, both private and publicly held. He has served on the board of directors of several companies and is currently serving as a member of the board of directors of YSMA AG, Immo Swiss Investments AG in liq., Bantex AG in liq., Eurotas Trust AG in liq., Invitech AG in liq., Ostschweizerische Treuhandgesellschaft AG. He also serves as a supervisor of investments for several Swiss and German companies. Mr. Herter’s law firm, Streichenberg, represented and Mr. Herter was, until November, 2019, a director of, the Rennes Foundation, a holder of 10.9% of Ebix’s outstanding common stock.
Areas of Relevant Experience. Mr. Herter has extensive experience in the legal sector with expertise in managing multiple companies in terms of investments, capital structure, organization restructuring and governance, and with an expertise in European affairs.
HANS UELI KELLER, 67, has been a director since 2004. Mr. Keller has spent over 20 years with Zurich-based Credit Suisse, a global financial services company, serving as Executive Board Member from 1997 to 2000, head of retail banking from 1993 to 1995, and head of marketing from 1985 to 1992. He serves as chairman of the board of Helvetica Property Investors AG, Zurich, a real estate fund and asset management company.
Areas of Relevant Experience. Mr. Keller has extensive executive experience in sales and marketing, corporate finance, strategic planning, executive compensation, and international distribution.
Executive Officers
We have five executive officers: Robin Raina, Robert F. Kerris, Graham Prior, Leon d’Apice and James Senge, Sr. Information as to Mr. Raina is provided above. Robert F. Kerris rejoined the Company as Chief Financial Officer on September 23, 2019, replacing Sean T. Donaghy, who continues to serve with the Company as Senior Vice President - Finance.
ROBERT F. KERRIS, 67, serves as the Company’s Chief Financial Officer and Secretary. Prior to joining the Company, he served as the Chief Financial Officer at Dekra North America from March 2017 to April 2018. During the period from May 2018 through August 2019 Mr. Kerris worked in various fractional senior financial executive roles as a contracted consultant for clients of ITB Partners and Robert Half Management Resources. He served as the Ebix’s Executive Vice President-Corporate Officer of Mergers & Acquisitions and Special Projects from January 2017 until March 2017. As mentioned above, Mr. Kerris previously served as the Company's Chief Financial Officer and Corporate Secretary beginning in October 2007. Previously before joining the Company, Mr. Kerris was Chief Financial Officer at Aelera Corporation from May 2006 to October 2007 through January 2017, Financial Vice President at Equifax, Inc. from November 2003 to April 2006, Corporate Controller at Interland, Inc. from September 2002 to October 2003, and held senior financial management positions at AT&T, BellSouth, and Northern
108
Telecom. Mr. Kerris is an actively licensed certified public accountant and holds an accounting and economics degree from North Carolina State University where he graduated with honors.
GRAHAM PRIOR, 62, serves as Corporate Executive Vice President International Business & Intellectual Property. Mr. Prior has been employed by Ebix since 1996 when the Company acquired Complete Broking Systems Ltd., for which Mr. Prior was a part owner. Mr. Prior has been working within the insurance technology industry since 1990 and is currently responsible for the Company’s international operations in Singapore, New Zealand, Australia, Europe, Africa and Asia. Mr. Prior is also responsible for the company’s worldwide product development initiatives. Mr. Prior is a chartered accountant and holds a Bachelor of Commerce and Administration degree from Victoria University, Wellington, New Zealand.
LEON d’APICE, 62, serves as the Company’s Executive Vice President and Managing Director - Ebix Australia Group Head. Mr. d’Apice has been employed with Ebix since 1996 when the Company acquired Complete Broking Systems Ltd. for which Mr. d’Apice was also a part owner. Mr. d’Apice has been in the information technology field since 1977 and is currently responsible for all of the operations of Ebix’s Australian business units. Mr. d’Apice holds a Bachelor of Commerce degree with a major in Accounting and Financial Management from the University of New South Wales, Australia.
JAMES SENGE, SR., 58, serves as the Company’s Senior Vice President EbixHealth. Mr. Senge has been employed with Ebix (as a result of the business acquisition of Acclamation Systems, Inc. in 2008) since 1979. During his over 32 years with Acclamation/Ebix, Mr. Senge has been involved with all facets of the EbixHealth division, including being responsible for the strategic direction and day- to-day operations of the divisions. Mr. Senge’s focus is on expanding the Company’s reach into the on-demand, end-to-end technology solutions for the health insurance and healthcare markets. Mr. Senge works from Ebix’s Pittsburgh, Pennsylvania office.
Corporate Governance
The following table lists our three board committees, the directors who served on them as of the end of 2018 and the number of committee meetings held in 2018.
Name | Audit | Compensation | Corporate Governance and Nominating | |||
Mr. Bhalla | C | |||||
Mr. Benz | M | M | ||||
Mr. Eckert | M | C | ||||
Mr. Herter | M | |||||
Mr. Keller | M | C | ||||
Mr. Raina | ||||||
Mr. Hebard | ||||||
2019 Meetings | 5 | 7 | 2 | |||
On February 20, 2015, the Board appointed Hans Ueli Keller as Lead Independent Director. As Lead Independent Director, Mr. Keller's responsibilities include, but are not limited to: (i) coordinating the activities of the independent directors; (ii) setting the agenda for board meetings in conjunction with the CEO and corporate secretary; (iii) chairing executive sessions of the independent directors; and (iv) performing such other duties as are assigned from time to time by the board.
In early 2019, Joseph R. Wright informed the Board of Directors that he wished to resign from the Board. As such, he was not placed in the slate for election as a director at the Company’s Annual Meeting in August and was no longer a member of the Board of Directors as of the date of the Annual Meeting. His resignation was not due to any disagreements with the Company. On June 11, 2019, Neil Eckert was asked by the Board and accepted a position serving on the Compensation Committee.
It is the Company's policy that directors should attend each meeting of the Board of Directors and each meeting of the committees on which they serve. During 2019, the Company's full Board of Directors met four times, with three of the meetings being in person and one of the meetings being conducted over telephonic conference calls. Each member of the Board of Directors attended all of the regular meetings of the Board and the Board committees on which the director served and for which they were eligible to participate. In addition to participation at Board and committee meetings, our directors discharge their responsibilities throughout the year through personal meetings and other communications, including considerable telephone contact with the
109
Chairman and Chief Executive Officer and sometimes with others pertinent members of management regarding matters of interest and concern to the Company.
Effective January 9, 2015, the Company amended its bylaws in a way that changed the procedures by which security holders may recommend nominees to the Company’s Board of Directors. Section 3.10 of the Amended and Restated Bylaws creates certain advance notice requirements for stockholder nominations of directors at both annual and special meetings. To be timely, a director nomination by a stockholder for an annual meeting must be submitted not less than 90 nor more than 120 days before the anniversary date of the immediately preceding annual meeting. In the case of a nomination at a special meeting, notice of such nomination must be given within 10 days that notice of such meeting was provided or made public.
In addition, Section 3.10 requires disclosures relating to the nominees and their relationships with stockholders proposing their nomination. Among other things, Section 3.10 requires a proposed nominee to: (1) represent and promise that the nominee is not, nor will become, party to any understanding with another person (a) to vote or act as a Director in a certain manner or (b) concerning compensation, reimbursement or indemnification without disclosure to the Company; and (2) represent that, if elected to the Board, such nominee would comply with Regulation FD and Company governance, trading, ethics, stock ownership and other policies.
Section 3.10 also requires disclosures similar to a stockholder proposing business for an annual meeting. In addition, a proposing stockholder, including its affiliates, must disclose all agreements or other understandings with a director nominee it has proposed, as well as any other material interest involved in such nomination.
Code of Conduct and Ethics
The Board has adopted the Code of Conduct and Ethics (the “Code of Ethics”), which applies to the senior financial officers (the “Senior Financial Officers”) of the Company and its subsidiaries, including its principal executive officer, principal financial officer and principal accounting officer. Our Board also has adopted a Code of Conduct, articulating standards of business and professional ethics, which is applicable to all of our directors, officers and employees. The Company is committed to the highest standards of professional and ethical conduct, and the Code of Ethics and Code of Conduct provide guidance as to upholding these standards.
The Code of Ethics consists of basic standards of business practice, as well as professional and personal conduct, including prohibitions against any conduct or transactions that might constitute a conflict of interest between the Senior Financial Officers and the Company. Any action that might constitute a conflict of interest is reviewed by Company management, and potential conflicts of executive officers or members of the Board are reviewed by the Board.
This Code of Ethics is posted on the Company’s website at www.ebix.com, where it may be found by navigating to “Ebix Inc. Code of Ethics” under Corporate Governance within the Investor section of the website. Any amendment to or waiver of the Code of Ethics must be approved by the Audit Committee and will be promptly disclosed by the Company. The Company intends to satisfy the disclosure requirement under Form 8-K regarding an amendment to, or waiver from, a provision of the Code of Ethics by posting such information on the Company’s website, at the address and location specified above. These codes are reviewed annually and amended as necessary or appropriate in response to changing regulatory requirements and evolving best practices.
Audit Committee and Audit Committee Financial Expert
The Company has a standing Audit Committee. The Audit Committee’s principal responsibility is to assist the Board in its general oversight of the Company’s financial reporting, internal controls, ethics compliance and audit functions. This committee is directly responsible for the appointment, compensation and oversight of the work of the Company’s independent public accounting firm, reviews the annual financial results and the annual audit of the Company’s financial statements and approves the inclusion of the audited financial statements in the Company’s Annual Report on Form 10-K.
The Audit Committee assists the Board in monitoring: (a) the integrity of our financial statements, (b) the effectiveness of our internal control over financial reporting, (c) the effectiveness of our disclosure controls, (d) the qualifications and independence of our independent registered public accounting firm, (e) the performance of our independent registered public accounting firm, and (f) our compliance with legal and regulatory requirements. The Audit Committee is also responsible for oversight of the Company’s major financial risk exposures and the steps management has taken to monitor and control such exposures, including the Company’s risk assessment and risk management policies. The Audit Committee’s charter provides that the Audit Committee review and approve related party transactions and conflicts of interest questions between Board members or senior management, on the one hand, and the Company, on the other hand (as defined and required by applicable securities
110
laws, rules and regulations and the rules of the Nasdaq). The Audit Committee is also responsible for reviewing and monitoring compliance with the Company’s Code of Ethics for Senior Financial Officers. In addition, the Audit Committee has established procedures for the receipt, retention and treatment of complaints received by the Company regarding accounting, financial reporting, internal accounting controls or auditing matters and the confidential and anonymous submission by Company employees of concerns regarding accounting and auditing matters.
The Audit Committee exercises oversight responsibility regarding the quality and integrity of our auditing and financial reporting practices. In discharging this responsibility, the Audit Committee, among other things, holds the authority to approve or remove the independent registered public accounting firm and to pre-approve the audit and any non-audit service to be provided by the auditors and reviews the results and scope of the annual audit performed by the auditors. The Audit Committee has three members, who currently are Messrs. Bhalla (Chairman), Benz and Keller. After reviewing the qualifications of the current members of the Audit Committee, and any relationships they may have with the Company that might affect their independence from the Company, our Board has determined that: (1) all current members of the Audit Committee are “independent” as that concept is defined in Section 10A of the Securities Exchange Act of 1934, (2) all current members of the Audit Committee are “independent” as that concept is defined in the Nasdaq listing standards, (3) all current members of the Audit Committee are financially literate, and (4) Mr. Bhalla qualifies as an “audit committee financial expert” as defined under SEC rules promulgated under the Sarbanes-Oxley Act of 2002. The Audit Committee met five times during 2019. The Audit Committee exercises its authority pursuant to a written charter that was adopted in October 2004.
Delinquent Section 16(a) Reports
Section 16(a) of the Securities Exchange Act of 1934 requires the Company's officers and directors and persons who beneficially own more than ten percent of a registered class of our equity securities to file with the Securities and Exchange Commission reports of securities ownership on Form 3 and changes in such ownership on Forms 4 and 5. Officers, directors and more than ten percent beneficial owners also are required by rules promulgated by the Securities and Exchange Commission to furnish the Company with copies of all such Section 16(a) reports that they file. Based solely upon a review of the copies of Forms 3, 4, and 5 furnished to the Company or representations by certain executive officers and directors that no such reports were required for them, the Company believes that during 2019 all of the Company's directors, officers and more than ten-percent beneficial owners filed all such reports on a timely basis except for Board directors Bhalla, Benz, Eckert, Hebard, and Keller, each of whom filed a Form 4 on January 7, 2019 for grants of options provided on December 31, 2018.
Item 11. EXECUTIVE COMPENSATION
Compensation Disclosure and Analysis
Objectives and Goals
The objectives of the Compensation Committee have been to adopt a compensation approach that is simple, internally equitable, and externally competitive, and that attracts, motivates, and retains qualified people capable of contributing to the growth, success and profitability of the Company, thereby contributing to long-term stockholder value.
Simplicity. The Compensation Committee believes that a compensation package with three major elements of compensation is the simplest approach, consistent with the Company’s goals. The Company generally does not utilize special personal perquisites such as private jets, payment of country club dues, Company-furnished motor vehicles, permanent lodging, or defrayment of the cost of personal entertainment.
Internal Equity. Internal equity has generally been evaluated based on an assessment of the relative contributions of the members of the management team. In 2017, the Compensation Committee did not undertake any formal audit or similar analysis of compensation equity with respect to either the CEO relative to the other members of the management team or with respect to the management team relative to the Company’s employees generally. However, the Compensation Committee believes that the relative difference between CEO compensation and the compensation of the Company’s other executives is consistent with such differences found in the Company’s insurance services peer group and the market for executive-level personnel for public companies of similar size.
External Competitiveness. The Compensation Committee believes it is important to management retention and morale that compensation be competitive with our competitors. In setting annual compensation, the Compensation Committee generally reviews market data and compares total annual compensation opportunities for our executive officers with compensation opportunities for similar positions at comparable companies. Based on this review, the Compensation Committee approves
111
compensation levels and opportunities for our CEO and our other executive officers that the Compensation Committee believes are competitive with the marketplace and provide appropriate retention and incentive value.
Major Compensation Components
The principal components of compensation for our executive officers are: (i) base salary, (ii) short-term incentives, generally in the form of cash bonus programs, and (iii) long-term incentives, generally in the form of equity-based awards such as stock awards. We believe the Company’s goals are best met by utilizing an approach to compensation with these three distinct elements.
Base Salary:
Base salaries for our executive officers are established based on the scope of their responsibilities, prior relevant background, professional experience, and technical training. Also in this regard, the Compensation Committee takes into account competitive market compensation paid by the companies represented in the compensation data it reviews for similar positions, and the overall market demand for such executives. Although the Company considered the same factors in establishing the base salaries of each of its executive officers, due to the different levels of roles played by each executive, the base salaries are justifiably substantially different.
On April 10, 2019, the Company’s Board of Directors, upon recommendation from the Compensation Committee, announced the following changes to the Mr. Raina’s compensation:
(a) | Mr. Raina’s salary for 2019 and going forward is to be paid in shares of common stock of the Company. As a result, the Company has granted Mr. Raina 54,870 shares of restricted common stock, which represents his annual salary of $2,400,000 divided by $43.74, the closing price of the Company’s common stock on January 2, 2019. One third of these shares will vest on January 1, 2020 with the remaining stock vesting in quarterly installments over the next eight quarters. |
(b) | The Company increased Mr. Raina’s annual salary to $3,600,000, effective January 1, 2019. As a result of the salary increase, Mr. Raina was granted 23,247 shares of restricted common stock which represents $1,200,000 divided by $51.62, the closing price of Ebix common stock on April 10, 2019. One third of these shares will vest on January 1, 2020 with the remaining stock vesting in quarterly installments over the next eight quarters. |
On August 25, 2016, the Compensation Committee increased the base salary of Mr. Raina, the Company’s President and Chief Executive Officer (CEO), from $1,300,000 to $2,400,000, in recognition of his leadership and significant contributions to the growth of the Company and the creation of stockholder value. This was the first increase to the CEO’s base salary since 2012. There was no increase in Mr. Raina’s base salary in 2018.
The stockholders approved a Bonus Plan for Mr. Raina at the 2016 Annual Meeting. The Bonus Plan provides for the payment of annual cash incentive awards to the Company’s Chief Executive Officer based upon the achievement by the Company of specified performance goals. The Bonus Plan was intended to preserve the Company’s federal income tax deduction for annual incentive payments to the CEO by meeting the requirements for “qualified performance-based compensation” under Section 162(m) of the Internal Revenue Code of 1986 as amended (the “Code”) (or any successor provision). However, Section 162(m) of the Code was amended in December 2017 as discussed below. Participation in the Bonus Plan is limited to the CEO of the Company. The Company does not anticipate that compensation paid to any of its other executive officers will be subject to the compensation deduction limits of Section 162(m). The Bonus Plan provides that Mr. Raina is eligible to receive cash incentives in connection with a particular fiscal year during the term of the Bonus Plan if the Company meets or exceeds certain performance goals (“Performance Goals”) set each year by the Compensation Committee. Not later than ninety (90) days after the commencement of any fiscal year during the term of the Bonus Plan (or such other date as may be permitted or required by Section 162(m)), and at a time when the outcome is uncertain, the Compensation Committee will set in writing Performance Goals based on one or more of the following business criteria:
• | Revenue |
• | Sales |
• | Profit (net profit, gross profit, operating profit or other corporate profit measures) |
• | Earnings (EBIT, EBITDA, earnings per share, or other corporate earnings measures) |
• | Net income (before or after taxes, operating income or other income measures) |
112
• | Cash (cash flow, cash generation or other cash measures) |
• | Stock price or performance |
• | Total stockholder return (stock price appreciation plus reinvested dividends divided by beginning share price) |
• | Return measures (return on assets, capital, equity, investments or sales, and cash flow return on assets, capital, equity, or sales) |
• | Market share |
• | Improvements in capital structure |
• | Expenses (expense management, expense ratio, expense efficiency ratios or other expense measures) |
• | Business expansion or consolidation (acquisitions and divestitures) |
• | Strategic plan development and implementation |
At the time the Compensation Committee sets the Performance Goals for a particular fiscal year, it will also set in writing the CEO’s incentive bonus opportunity, expressed as a dollar amount or a percentage of the CEO’s base salary, which will be earned if the established Performance Goals are achieved.
Performance Goals may be specified in absolute terms, on an adjusted basis, in percentages, or in terms of growth from period to period or growth rates over time, as well as measured relative to the performance of a group of comparator companies, or a published or special index, or a stock market index. Performance Goals need not be based upon an increase or positive result under a business criterion and could include, for example, the maintenance of the status quo or the limitation of economic losses (measured, in each case, by reference to a specific business criterion). Performance measures may but need not be determinable in conformance with generally accepted accounting principles.
Payment of annual incentives under the Bonus Plan will be made promptly following the Compensation Committee’s written certification that the Performance Goals and any other material conditions were satisfied. The Compensation Committee has the right to exercise negative discretion to pay out an annual incentive to the CEO under the Bonus Plan that is less than the amount that would have been payable based solely upon application of the applicable Performance Goals. In no event shall the CEO receive bonus payments under the Bonus Plan in connection with any one fiscal year which exceed $3,000,000. The Compensation Committee may, in its discretion pay annual incentives to the other named executive officers.
Long-Term Incentives:
While While salary and short-term incentives are primarily designed to compensate current and past performance, the primary goal of the long-term incentives, such as stock options and restricted stock awards, is to link executive officer compensation with the long-term interests of the stockholders.
On January 7, 2019, the Compensation Committee, in consultation with the entire Board, granted 13,541 shares of restricted stock to Mr. Raina under the 2010 Plan. The shares vest over a three-year period. The first one-third of these awards vest on January 7, 2020 and the remaining two-thirds vest in quarterly installments over the next eight quarters.
Use of Compensation Consultants and Benchmarking
During 2018 the Compensation Committee did not retain any compensation consultants or engage in any formal benchmarking, however the Compensation Committee engaged the services of Korn Ferry in connection with its review of the ABA in December of 2017. As required by the Settlement Agreement, described below, the Company intended to retain an outside compensation consulting firm in May 2019 to review and evaluate the compensation arrangements for the Company’s executive officers for future periods. In June 2019, after much analysis of potential consulting firms, the Compensation Committee recommended and the Board of Directors subsequently approved retaining Ernst & Young LLP as a compensation consultant to assist with executive compensation matters.
Other Compensation Components
Company executives are eligible to participate in the Company’s health care, insurance and other welfare and employee benefit programs, which are the same for all eligible employees, including Ebix’s executive officers.
113
Use of Employment and Severance Agreements
In the past, the Compensation Committee has determined that competitive considerations merit the use of employment contracts or severance agreements for certain members of senior management. Presently, however, no member of senior management is employed under an employment contract.
Recapture and Forfeiture Policies
Historically the Company has not had formal policies with respect to the adjustment or recapture of performance based awards where the financial measures on which such awards are based or to be based are adjusted for changes in reported results such as, but not limited to, instances where the Company’s financial statements are restated. The Compensation Committee does not believe that repayment should be required where the Plan participant has acted in good faith and the errors are not attributable to the participant’s gross negligence or willful misconduct. In such later situations, the Compensation Committee believes the Company has or will have available negotiated or legal remedies. However, the Compensation Committee may elect to take into account factors such as the timing and amount of any financial restatement or adjustment, the amounts of benefits received, and the clarity of accounting requirements leading to any restatement in fixing of future compensation.
Deductibility of Compensation and Related Tax Considerations
As one of the factors in its review of compensation matters, the Compensation Committee considers the anticipated tax treatment to the Company and to the executives of various payments and benefits.
Section 162(m). For 2017 and earlier, Section 162(m) imposed a $1.0 million limit on the amount that a publicly traded company may deduct for compensation paid to its chief executive officer and its next three most highly compensated executives, excluding the chief financial officer. This limitation did not apply to pay that qualifies as “performance-based compensation.” In order to qualify as performance-based, compensation must, among other things, be based solely on the attainment of pre-established, objective goals under a stockholder approved plan with no discretion permitted in determining award payouts. However, the Tax Cuts and Jobs Act adopted in December 2017 made significant changes to Section 162(m) of the Code that impacted public companies, including our company. Starting with the 2018 fiscal year, only performance-based compensation that is paid pursuant to a binding contract in effect on November 2, 2017 is exempt from the $1,000,000 deduction limit. Accordingly, any compensation that we paid pursuant to new compensation arrangements entered into after November 2, 2017, even if performance-based, will count towards the $1,000,000 deduction limit. In addition, the $1,000,000 deduction limit applies to a broader group of executives, including the chief financial officer and any individual who serves as our chief executive officer or chief financial officer at any time after January 1, 2018, plus any executive who is among our three most highly compensated executive officers for any fiscal year beginning with 2018. While the Bonus Plan described above was intended to preserve the Company’s federal income tax deduction for annual incentive payments to the CEO by meeting the requirements for “qualified performance-based compensation” under Section 162(m), as a result of these changes made to Section 162(m) the Bonus Plan, to the extent changed after November 2, 2017 will no longer be excluded from the $1.0 million limitation. In order to maintain flexibility in compensating executive officers in a manner designed to promote varying corporate goals, some of the compensation that we provide to our executive officers may not be deductible.
Section 280G. Code Section 280G generally denies a deduction for a significant portion of certain compensatory payments made to corporate officers, certain stockholders and certain highly-compensated employees if the payments are contingent on a change of control of the employer and the aggregate amounts of the payments to the relevant individual exceed a specified relationship to that individual’s average compensation from the employer over the preceding five years. In addition, Code Section 4999 imposes on that individual a 20% excise tax on the same portion of the payments received for which the employer is denied a deduction under Section 280G. In determining whether to approve an obligation to make payments for which Section 280G would deny the Company a deduction or whether to approve an obligation to indemnify (or “gross-up”) an executive against the effects of the Section 4999 excise tax, the Compensation Committee has adopted an approach similar to that described above with respect to payments which may be subject to the deduction limitations of Section 162(m).
Compensation Committee Conclusion
Attracting and retaining talented and motivated management and employees is essential to create long-term stockholder value. Offering a competitive, performance-based compensation program with a large equity component helps to achieve this objective by aligning the interests of the Company’s CEO and other executive officers with those of stockholders. The Compensation Committee believes that Ebix’s 2018 compensation program met these objectives. Likewise, based on our review, the Compensation Committee finds the total compensation (and, in the case of the severance and change-in-control scenarios, the potential payouts) to the Company’s CEO and other named executive officers in the aggregate to be reasonable and not excessive.
114
Acquisition Bonus Agreement, April SAR Agreement and Amended SAR Agreement
On April 10, 2018, the Company entered into a Stock Appreciation Right Award Agreement (the “April SAR Agreement”) with Robin Raina, the Company’s Chairman, President and Chief Executive Officer. The April SAR Agreement replaced the Acquisition Bonus Agreement (the “ABA”) between the Company and Mr. Raina, dated July 15, 2009.
In recent years, certain claims have been raised by stockholders in litigation in the Court of Chancery of the State of Delaware (the “Delaware Court of Chancery”) challenging, among other things, the validity and interpretation of certain terms of the ABA and, subsequently, the April SAR Agreement (the “Litigation”). In connection with the Litigation, Mr. Raina asserted a conditional cross-claim against the Company for reformation of the ABA. The terms of the ABA generally provided that if Mr. Raina was employed by the Company upon the occurrence of: (i) an event in which more than 50% of the voting stock of the Company was sold, transferred, or exchanged, (ii) a merger or consolidation of the Company, (iii) the sale, exchange, or transfer of all or substantially all of the Company’s assets, or (iv) the acquisition or dissolution of the Company (each, an “Acquisition Event”), the Company would pay Mr. Raina a cash bonus based on a formula that was disputed by Plaintiffs in the Litigation and a tax gross-up payment for excise taxes that would be imposed on Mr. Raina for the cash bonus payment. Upon the execution of the April SAR Agreement, the ABA was terminated and each party relinquished their respective rights and benefits under the ABA.
Upon the effective date of the April SAR Agreement, Mr. Raina received 5,953,975 stock appreciation rights with respect to the Company’s common shares (the “SARs”). Upon an Acquisition Event, each of the SARs entitled Mr. Raina to receive a cash payment from the Company equal to the excess, if any, of the net proceeds per share received in connection with the Acquisition Event over the base price of $7.95 per share. Although the SARs were not granted under the Company’s 2010 Stock Incentive Plan (the “Plan”), the April SAR Agreement incorporated certain provisions of the Plan, including the provisions requiring equitable adjustment of the number of SARs and the base price in connection with certain corporate events (including stock splits). Under the terms of the April SAR Agreement, Mr. Raina would have been entitled to receive full payment with respect to the SARs if either he (i) were employed by the Company on the closing date of an Acquisition Event or (ii) had been involuntarily terminated by the Company without cause (as defined in the April SAR Agreement) within the 180-day period immediately preceding an Acquisition Event. All of the SARs would have been forfeited if Mr. Raina’s employment had been terminated for any other reason prior to the closing date of an Acquisition Event.
In addition, while Mr. Raina was employed by the Company and prior to an Acquisition Event, the April SAR Agreement provided that the Company’s Board would determine annually whether a “shortfall” (as described below) existed as of the end of the immediately preceding fiscal year. In the event the Board determined that a shortfall existed, Mr. Raina would have been granted additional SARs (or, in the Board’s sole discretion, additional restricted shares or restricted stock units (each a “Share Grant”)) in an amount sufficient to eliminate such shortfall (each a “Shortfall Grant”). Under the terms of the April SAR Agreement, a shortfall existed if: (A) the sum of (i) the number of common shares deemed to be owned by Mr. Raina as of the effective date of the April SAR Agreement, plus (ii) the number of SARs granted to Mr. Raina (including any Shortfall Grants), plus (iii) the number of shares underlying any previously granted Share Grant, was less than 20% of (B) the sum of (i) the number of SARs granted to Mr. Raina (including any Shortfall Grants), plus (ii) the number of outstanding shares reported by the Company in its audited financial statements as of the end of the immediately preceding fiscal year. Under the terms of the April SAR Agreement, if the Board elected to make a Shortfall Grant in respect of such shortfall, such SARs would have been subject to the same terms and conditions as the SARs initially granted under the April SAR Agreement. If the Board elected to make a Share Grant in respect of such shortfall, such restricted shares or restricted stock units would have had such terms and conditions as determined by the Board, but generally would have followed the terms of the restricted shares or restricted stock units granted to other executives of the Company at or about the time of such Share Grant, but no Share Grant would have vested more rapidly than one-third of such Share Grant prior to the first anniversary of the grant date, with the remainder vesting in eight equal quarterly installments following the first anniversary of the grant date. The April SAR Agreement also provided for the Company to make tax gross-up payments for excise taxes that would be imposed on Mr. Raina in respect of any payments (other than any payments with respect to any Share Grants) made in connection with a change in control of the Company under Section 4999 of the Internal Revenue Code.
In connection with the foregoing Litigation, on January 23, 2019, the parties entered into a Stipulation and Agreement of Settlement (the “Settlement Agreement”) pursuant to which the parties agreed, subject to approval by the Delaware Court of Chancery, to settle and resolve the Litigation pursuant to the terms set forth in the Settlement Agreement (the “Litigation Settlement”). Thereafter, notice of the Litigation Settlement was prepared and mailed on February 4, 2019 (the “Notice”). On April 5, 2019, the Delaware Court of Chancery determined that the Litigation Settlement was fair, reasonable, adequate and in the best interest of the plaintiffs, the class and the Company, and entered an Order and Final Judgment approving the Litigation Settlement. The Litigation Settlement includes, among other things, the adoption and entry into an Amended Stock Appreciation
115
Right Award Agreement (the “Amended SAR Agreement”), as well as certain governance measures set forth in the Settlement Agreement. The Amended SAR Agreement was negotiated as part of the Litigation Settlement and became effective May 7, 2019, and includes the following changes and modifications to the April SAR Agreement:
(a) | Mr. Raina will commit to continue to serve and not resign as the Company’s Chief Executive Officer for at least two years following Final Approval of the Litigation Settlement; |
(b) | any shares paid, awarded or otherwise received by Mr. Raina as compensation after the effective date of the Amended SAR Agreement, including any shares received by Mr. Raina from the exercise of any options granted after the effective date of the April SAR Agreement or from the grant or vesting of any restricted shares or settlement of any restricted stock units granted after the effective date of the April SAR Agreement (but excluding any shares received as a result of the grant, vesting or settlement of any Share Grants), will be excluded from the outstanding shares for purposes of the Board’s annual shortfall determination; |
(c)if an Acquisition Event occurs more than 180 days after, but not later than the tenth anniversary of, the date that Mr. Raina’s employment is involuntarily terminated by the Company without Cause (as defined in the Amended SAR Agreement), 1,000,000 SARs will be deemed accrued and will be eligible to vest on the closing date of the Acquisition Event, which number will be increased by 750,000 SARs beginning on the first anniversary of Final Approval of the Litigation Settlement and each anniversary thereafter (subject in each case to Mr. Raina’s continued employment on each anniversary date), until 100% of the SARs (including any Shortfall Grants) have accrued and are eligible to vest on the closing date of an Acquisition Event that occurs more than 180 days after, but not later than the tenth anniversary of, the date that Mr. Raina’s employment is involuntarily terminated by the Company without Cause; provided, however, that, (i) no additional SARs will accrue following the date that Mr. Raina’s employment is involuntarily terminated by the Company without Cause, (ii) any accrued SARs will be forfeited if an Acquisition Event does not occur prior to the tenth anniversary of the date that Mr. Raina’s employment is involuntarily terminated by the Company without Cause, and (iii) all of the SARs will be forfeited if Mr. Raina’s employment terminates for any other reason prior to the closing date of an Acquisition Event; and
(d)the obligation of the Company to make tax gross-up payments for excise taxes that would be imposed on Mr. Raina in respect of any payments made in connection with a change in control of the Company will be eliminated.
Stockholder Advisory Vote
At the last Annual Meeting of Stockholders, approximately 72% of the votes cast by the Ebix stockholders present in person or by proxy and entitled to vote at the Annual Meeting and on the proposal were cast in support of the compensation of the Company’s named executive officers, as discussed and disclosed in the proxy statement. The Board and the Compensation Committee appreciate and value the views of our stockholders. After discussions with certain Ebix stockholders, the Company understands that a portion of the negative vote was directed at the ABA, the April SAR Agreement and the related litigation described above.
The Board and Mr. Raina terminated the ABA and entered into the April SAR agreement. In addition, the April SAR Agreement will be replaced by the Amended SAR Agreement pursuant to the Litigation Settlement as described above. Going forward, future advisory votes on executive compensation will serve as an additional tool to guide the Board and the Compensation Committee in evaluating the alignment of the Company’s executive compensation program with the interests of the Company and its stockholders.
Risk Considerations
Our Compensation Committee has reviewed risks arising from our compensation policies and practices for both our executives and non-executive employees and has determined that they are not reasonably likely to have a material adverse effect on the Company.
Compensation Committee Interlocks and Insider Participation
The Company's Compensation Committee currently consists of Mr. Keller and Mr. Benz. None of the members of the Compensation Committee have ever been officers or employees of the Company. No interlocking relationship exists between the
116
members of the Company's Board of Directors or Compensation Committee and the Board of Directors or Compensation Committee of any other company.
.
Compensation Committee Report
The Compensation Committee has reviewed and discussed with the Company’s Chief Executive Officer and Chief Financial Officer the above Compensation Disclosure and Analysis. Based on such review and discussion, the Compensation Committee recommended to the Board that the Compensation Discussion and Analysis be included in this amendment to the Form 10-K.
This report has been submitted by the Compensation Committee:
Hans U. Benz, Neil Eckert and Hans Ueli Keller
The foregoing report shall not be deemed incorporated by reference by any general statement incorporating by reference this annual report into any filing under the Securities Act of 1933 or under the Securities Exchange Act of 1934, except to the extent that we specifically incorporate this information by reference, and shall not otherwise be deemed filed under such Acts.
Executive Compensation and Director Compensation Tables
The following table provides information relating to compensation earned by or paid to our named executive officers in all capacities.
117
Summary Compensation Table
Name and Principal Position | Year | Salary ($) | Bonus ($) | Stock Awards ($) (1) | Option Awards ($) | Non-Equity Incentive Plan Compensation ($) | All Other Compensation ($) | Total | ||||||||||||||||
Robin Raina, President, | 2019 | $ | — | 2,000,000 | (2 | ) | 4,200,000 | — | 1,584 | 6,000 | (3 | ) | $ | 6,207,584 | ||||||||||
Chief Executive Officer | 2018 | $ | 2,400,000 | 2,000,000 | (2 | ) | — | — | — | 9,751 | (3 | ) | $ | 4,409,751 | ||||||||||
and Chairman of the Board | 2017 | $ | 2,400,000 | 1,000,000 | 3,000,000 | — | — | 8,038 | (3 | ) | $ | 6,408,038 | ||||||||||||
Robert F. Kerris, Chief Financial Officer and Secretary | 2019 | $ | 225,000 | — | — | 779 | (4 | ) | $ | 225,779 | ||||||||||||||
Sean Donaghy | 2019 | $ | 185,000 | 50,000 | $ | 235,000 | ||||||||||||||||||
Former Chief | 2018 | $ | 181,693 | 30,000 | 2,724 | $ | 214,417 | |||||||||||||||||
Financial Officer | 2017 | $ | 157,500 | 30,000 | 2,345 | $ | 189,845 | |||||||||||||||||
Graham Prior, | 2019 | $ | 159,863 | — | — | — | — | (5 | ) | $ | 159,863 | |||||||||||||
Corporate Senior | 2018 | $ | 161,694 | — | — | — | — | — | (5 | ) | $ | 161,694 | ||||||||||||
Vice President | 2017 | $ | 163,064 | — | — | — | — | — | (5 | ) | $ | 163,064 | ||||||||||||
Leon d'Apice, | 2019 | $ | 208,706 | (6 | ) | — | — | — | — | (6 | ) | 25,650 | (6 | ) | $ | 234,356 | ||||||||
Managing Director- | 2018 | $ | 224,400 | (6 | ) | — | — | — | — | (6 | ) | 20,785 | (6 | ) | $ | 245,185 | ||||||||
Ebix Australia Group | 2017 | $ | 226,848 | (6 | ) | 100,000 | — | — | — | (6 | ) | 27,318 | (6 | ) | $ | 354,166 | ||||||||
James Senge, Sr., | 2019 | $ | 225,000 | — | — | — | 2,337 | $ | 227,337 | |||||||||||||||
Senior Vice President | 2018 | $ | 225,000 | — | — | — | — | 3,075 | $ | 228,075 | ||||||||||||||
EbixHealth | 2017 | $ | 225,000 | — | — | — | — | 3,075 | $ | 228,075 | ||||||||||||||
Footnotes | ||
(1) | These amounts reflect the aggregate grant date fair value computed in accordance with accounting guidance related to stock compensation, based on the stock price on the date of grant. | |
(2) | 2018 bonus of $2,000,000 was earned in 2018 and paid in 2019. | |
(3) | Amount includes a Company matching contribution to a 401(k)/Retirement Plan of $3,751 in 2018, $ 2,038 in 2017 $3,975 in 2016. Also includes a $6,000 allowance for miscellaneous business and travel expenses per year. | |
(4) | Mr. Kerris was named Chief Financial Officer effective September 21, 2019. Replacing Sean Donaghy on that date. | |
(5) | Mr. Prior was compensated in Singapore Dollars. For 2019, all sums were derived by using the exchange rate of 0.7333 For 2018, all sums were derived by using the exchange rate of .7417. For 2017 all sums were derived by using the exchange rate of .75554. | |
(6) | Mr. d’Apice was compensated in Australian Dollars. For 2019, all sums were derived by using the exchange rate as of December 31, 2019 of 0.6957. For 2018, all sums were derived by using the exchange rate of .7480. For 2017, all sums were derived by using the exchange rate of December 31, 2017 of 0.7805. | |
(7) | Reflects a 401(k) superannuation in Australia which is accessible after age 65. | |
118
Grants of Plan-Based Awards for 2019
Name | Grant Date | Estimated Future Payouts Under Non-Equity Incentive Plan Awards | All Other Stock Awards: Number of Shares of Stock or Units (#) | All Other Option Awards: Number of Securities Underlying Options (#) | Exercise or Base Price of Option Awards ($/Sh) | Grant Date Fair Value of Stock and Option Awards ($) | |||||||||||||||||
Threshold ($) | Target ($) | Maximum ($) | |||||||||||||||||||||
Robin Raina | — | — | — | — | — | — | $ | — | |||||||||||||||
Robert F. Herris | — | — | — | — | — | — | $ | — | |||||||||||||||
Sean T. Donaghy | — | — | — | — | — | — | $ | — | |||||||||||||||
Graham Prior | — | — | — | — | — | — | $ | — | |||||||||||||||
Leon d' Apice | — | — | — | — | — | — | $ | — | |||||||||||||||
James Senge, Sr | — | — | — | — | — | — | $ | — | |||||||||||||||
119
Outstanding Equity Awards at 2019 Fiscal Year-End
Option Awards | Stock Awards | |||||||||||||||||||||||||||||||||||||||||
Number of Securities Underlying Unexercised Options (#) | Number of Securities Underlying Unexercised Options (#) | Equity Incentive Plan Awards: Number of Securities Underlying Unexercised Unearned Options | Option Exercise Price | Option Expiration | Number of Shares or Units of Stock That Have Not Vested | Market Value of Shares or Units of Stock That Have Not Vested | Equity Incentive Plan Awards: Number of Unearned Shares, Units or Other Rights That Have Not Vested | Equity Incentive Plan Awards: Market or Payout Value of Unearned Shares, Units or Other Rights That Have Not Vested | ||||||||||||||||||||||||||||||||||
Name | Exercisable | Un-exercisable | (#) | ($) | Date | (#) | ($) | (#) | ($) | |||||||||||||||||||||||||||||||||
Robin Raina, President, Chief Executive Officer and Chairman of the Board | — | — | — | $ | — | — | 101,853 | (1 | ) | $ | 3,402,908.73 | — | $ | — | ||||||||||||||||||||||||||||
Robert F. Kerris, Chief Financial Officer and Secretary | — | — | — | $ | — | — | — | ) | $ | — | — | $ | — | |||||||||||||||||||||||||||||
Sean Donaghy, Former Chief Financial Officer | — | — | — | $ | — | — | — | — | — | $ | — | |||||||||||||||||||||||||||||||
Graham Prior, Corporate Senior Vice President | — | — | — | $ | — | — | — | $ | — | — | $ | — | ||||||||||||||||||||||||||||||
Leon d'Apice, Managing Director, Ebix Australia Group | — | — | — | $ | — | — | — | $ | — | — | $ | — | ||||||||||||||||||||||||||||||
James Senge, Sr., Senior Vice President, EbixHealth | — | — | — | $ | — | — | — | $ | — | — | $ | — | ||||||||||||||||||||||||||||||
(1) | Robin Raina has been awarded restricted stock grants by the Compensation Committee: (i) a grant of 40,780 shares of Company common stock on July 25, 2017 of which 10,195 shares were unvested as of December 31, 2019; (ii) a grant of 13,541 shares of Company common stock on January 7, 2019 of which 13,541 shares were unvested as of December 31, 2019; (iii) a grant of 54,870 shares of Company common stock on April 10, 2019 of which 54,870 shares were unvested as of December 31, 2019; (iv) a grant of 23,247 shares of Company common stock on April 10, 2019 of which 23,247 shares were unvested as of December 31, 2019. | |
120
Option Exercises and Stock Vested
Option Awards | Stock Awards | |||||||||||||||||
Number of Shares Acquired | Value Realized on | Number of Shares Acquired | Value Realized on | |||||||||||||||
Name | on Exercise | Exercise | on Vesting | Vesting | ||||||||||||||
(a) | (#) | ($) (1) | (#) | ($) (2) | ||||||||||||||
Robin Raina, President, Chief Executive Officer and Chairman of the Board | — | $ | — | 13,593 | $ | 639,708 | ||||||||||||
Robert F. Kerris -Chief Financial Officer and Secretary | — | $ | — | — | $ | — | ||||||||||||
Sean Donaghy - Former Chief Financial Officer | — | $ | — | 144 | $ | 7,917 | ||||||||||||
Graham Prior, Corporate Senior Vice President | — | $ | — | — | $ | — | ||||||||||||
Leon d'Apice, Managing Director, Ebix Australia Group | — | $ | — | — | $ | — | ||||||||||||
James Senge, Sr., Senior Vice President, EbixHealth | — | $ | — | 541 | $ | 29,742 | ||||||||||||
(1) | Reflects the excess of the fair market value of the shares at the time of exercise over the exercise price of the options. |
(2) | Reflects the fair market value of the shares on the vesting date. |
Pension Benefits and Nonqualified Deferred Compensation
The Company does not sponsor or maintain any tax-qualified defined benefit plans, supplemental executive retirement plans or nonqualified deferred compensation plans.
Potential Payments for Mr. Raina Upon a Change of Control
Below is the description of severance payments that Mr. Raina would have received under the April SAR Agreement had certain events occurred in 2018. As described above, under the "Acquisition Bonus Agreement, April SAR Agreement and Amended SAR Agreement" section, the April SAR Agreement will be replaced by the Amended SAR Agreement upon Final Approval (as defined in the Settlement Agreement) of the Litigation Settlement. The below disclosure is the Company’s disclosure of potential payments under the original April SAR Agreement, as that was the agreement in place as of December 31, 2018.
As mentioned previously, no member of senior management other than Mr. Raina has an employment or severance agreement. Except as described below for Mr. Raina, upon a termination or change of control, each of the executive officers will receive only the unpaid portion of their salary and benefits through the date of termination. No severance payments, acceleration of equity vesting, or other special payments will be due to such executive officers, regardless of the circumstances of the termination.
Upon the effective date of the April SAR Agreement, Mr. Raina received 5,953,975 stock appreciation rights with respect to the Company’s common shares (the “SARs”). Upon an Acquisition Event, each of the SARs entitles Mr. Raina to receive a cash payment from the Company equal to the excess, if any, of the net proceeds per share received in connection with an Acquisition Event over the base price of $7.95. Mr. Raina will only be entitled to receive a payment with respect to the SARs if he is employed by the Company at the time of an Acquisition Event or was terminated by the Company without cause within the 180-day period immediately preceding an Acquisition Event.
Annually, while Mr. Raina is employed by the Company and prior to an Acquisition Event, the Board shall determine whether a “shortfall” (as defined in the April SAR Agreement) existed as of the end of the immediately preceding fiscal year. In the event the Board determines that a shortfall existed, Mr. Raina will be granted additional SARs (or, in the Board’s sole discretion, restricted shares or restricted stock units (each a “Share Grant”)) in an amount sufficient to eliminate such shortfall (each a “Shortfall Grant”). A “shortfall” will exist if the sum of the number of Company’s common shares deemed to be owned by Mr. Raina as of the date of the SAR Agreement (3,676,540 shares), the number of SARs granted to Mr. Raina, and the number of shares underlying any previously granted Shortfall Grant is less than twenty percent (20%) of the sum of the number of SARs and the number of outstanding shares reported by the Company in its audited financial statements as of the end of the immediately preceding fiscal year.
No Shortfall Grant was made for 2019. As a result, in the event that an Acquisition Event had occurred on December 31, 2019, and assuming that the Company received Net Proceeds of $33.41 per share (the closing price of the Company’s common stock on December 31, 2019), Mr. Raina would have received a $157.7 million payment upon the Acquisition Event, which
121
payment does not include a tax gross-up payment described above. As noted above, the April SAR Agreement will be replaced with the Amended SAR Agreement upon Final Approval (as defined in the Settlement Agreement) of the Litigation Settlement.
Pay Ratio Disclosure
On August 5, 2015, the SEC adopted new rules implementing the pay ratio disclosure requirement of the Dodd-Frank Wall Street Reform and Consumer Protection Act of 2010 (Dodd-Frank Act). These rules require reporting companies to disclose the ratio of the annual compensation of the company's median employee to the annual compensation of its principal executive officer.
The 2019 annual total compensation of our CEO Mr. Raina was $6,200,000, the 2019 annual total compensation of our median compensated employee was $14,850, and the ratio of those amounts is 417 to 1. The 2019 annual total compensation of our median compensated US employee was $74,750; and the ratio of those amounts is 83 to 1. For purposes of identifying the median compensated employee, we took into account salary, bonus, and fair market value of the shares on the vesting date during the year for all our employees as of December 31, 2019. We annualized this compensation for employees who did not work the entire year, except for employees designated as seasonal or temporary.
There is a lot of flexibility in how the median employees are identified. Companies are using different approaches that are appropriate for their employee population and compensation programs and are using estimates and assumptions. As a result, the ratio that other companies have calculated may not be comparable to the ratio that we have presented not only because of different businesses or different compensation programs, but because of using different methodologies and assumptions.
Director Compensation
On June 11, 2019, the Board granted to five of the non-employee directors 6,000 stock options of which one-fourth will vest on June 11, 2020, and the remaining options will vest ratably each quarter in the years 2021, 2022 and 2023.On September 27, 2019, the Board granted to each non-employee director 6,000 stock options of which one-fourth will vest on September 27, 2020, and the remaining options will vest ratably each quarter in the years 2021, 2022 and 2023. In addition each non-employee director received an annual cash retainer of $25,000 during 2019. Mr. Keller received an additional cash retainer of $16,000 for serving as the Compensation Committee Chairman and $8,000 for serving on the Audit Committee. Mr. Benz received an additional cash retainer of $8,000 for serving on the Audit Committee and $8,000 for serving on the Compensation Committee. Mr. Bhalla received an additional cash retainer of $24,000 for serving as the Audit Committee Chairman and $8,000 for serving on the Audit Committee
Director Compensation
Name | Fees Earned or Paid in Cash | Option Awards ($) | Total ($) | ||||||||||||
Pavan Bhalla | $ | 57,000 | $ | 154,002 | $ | 211,002 | |||||||||
Hans Ueli Keller | $ | 49,000 | $ | 154,002 | $ | 203,002 | |||||||||
Hans U. Benz | $ | 41,000 | $ | 154,002 | $ | 195,002 | |||||||||
Neil D. Eckert | $ | 25,000 | $ | 154,002 | $ | 179,002 | |||||||||
Rolf Herter | $ | 25,000 | $ | 154,002 | $ | 179,002 | |||||||||
George Hebard, III | $ | 25,000 | $ | 67,139 | $ | 92,139 | |||||||||
The following table lists below the aggregate number of outstanding options held by each director as of December 31, 2019:
Aggregate Stock Option | |||
Awards at Year End | |||
Pavan Bhalla | 30,000 | ||
Hans Ueli Keller | 36,000 | ||
Hans U. Benz | 36,000 | ||
Neil D. Eckert | 36,000 | ||
Rolf Herter | 36,000 | ||
George Hebard, III | 30,000 | ||
122
Item 12. SECURITY OWNERSHIP OF CERTAIN BENEFICIAL OWNERS AND MANAGEMENT AND RELATED STOCKHOLDER MATTERS
Securities Authorized for Issuance Under Equity Compensation Plans
As of December 31, 2019, we maintained the 1996 Stock Incentive Plan, as amended and restated in 2006 and the 2010 Ebix Equity Incentive Plan as approved by our stockholders. The table below provides information as of December 31, 2019 related to these plans.
Number of Securities to be Issued Upon Exercise of Outstanding Options | Weighted-Average Exercise Price of Outstanding Options | Number of Securities Remaining Available for Future Issuance Under Equity | ||||||||||
Plan Category | Warrants and Rights | Warrants and Rights | Compensation Plans | |||||||||
Equity Compensation Plans Approved by Security Holders: | ||||||||||||
-1996 Stock Incentive Plan, as amended and restated in 2006 | — | $ | — | 1,097,563 | ||||||||
-2010 Stock Incentive Plan | 217,875 | $ | 43.78 | 4,066,987 | ||||||||
Equity Compensation Plans Not Approved by Security Holders | 5,953,975 | (1) | N/A | |||||||||
Total | 6,171,850 | $ | 43.78 | 5,164,550 | ||||||||
(1) These are the SARs granted to Mr. Raina under the April SAR Agreement
Security Ownership of Certain Beneficial Owners and Management and Related Stockholder Matters
Current Beneficial Ownership | ||||
Name of Beneficial Owner | Number of Shares (1) | Percent of Class (2) | ||
Robin Raina(3) | 3,911,182 | 12.8% | ||
Neil D. Eckert(4) | 95,492 | * | ||
Rolf Herter(5) | 90,178 | * | ||
Leon d’Apice | 50,823 | * | ||
Hans Ueli Keller(6) | 34,303 | * | ||
Hans U. Benz(7) | 19,748 | * | ||
Pavan Bhalla(8) | 66,341 | * | ||
James S. Senge, Sr. | 12,893 | * | ||
Graham Prior | 16,784 | * | ||
George Hebard(9) | 55,875 | * | ||
Robert F. Kerris | 3 | * | ||
Directors and executive officers as a group (12 persons)(10) | 4,353,622 | 14.3% | ||
Other Beneficial Holders | ||||
FMR LLC(11) | 2,388,527 | 7.8% | ||
Blackrock Inc. (12) | 3,575,844 | 11.7% | ||
Nesbit United S.A. (13) | 2,673,981 | 8.8% | ||
The Vanguard Group (14) | 2,470,417 | 8.1% | ||
123
*Less than 1%.
(1)For purposes of this table, a person is deemed to be the beneficial owner of a security if he or she: (a) has or shares voting power or dispositive power with respect to such security, or (b) has the right to acquire such ownership within 60 days. “Voting power” is the power to vote or direct the voting of shares, and “dispositive power” is the power to dispose or direct the disposition of shares, irrespective of any economic interest in such shares. |
(2)In calculating the percentage ownership or percent of equity vote for a given individual or group, the number of common shares outstanding includes unissued shares subject to options, warrants, rights or conversion privileges exercisable within 60 days held by such individual or group, but are not deemed outstanding by any other person or group. Percentage is based on 30,475,671 shares of our common stock outstanding as of February 28, 2020. |
(3)Mr. Raina’s ownership includes: (a) 108,650 shares of restricted stock and (b) 217,064 shares held as trustee for the Robin Raina Foundation, a 501(c) charity organization, which were donated by Robin Raina from vested restricted stock grants previously issued to Mr. Raina by the Company and to which Mr. Raina disclaims any beneficial ownership. The Federal Tax ID Number for the foundation is 51-0497387. The address of Mr. Raina is 1 Ebix Way, Johns Creek, Georgia 30097. |
(4) Mr. Eckert’s ownership includes options to purchase 16,875 shares of our common stock which are exercisable as of February 28, 2020, or that will become exercisable within 60 days after that date. |
(5)Mr. Herter’s ownership includes options to purchase 16,875 shares of our common stock which are exercisable as of February 28, 2020, or that will become exercisable within 60 days after that date. |
(6) Mr. Keller’s ownership includes options to purchase 16,875shares of our common stock which are exercisable as of February 28, 2020, or that will become exercisable within 60 days after that date. |
(7)Mr. Benz’s ownership includes options to purchase 16,875 shares of our common stock which are exercisable as of February 28, 2020, or that will become exercisable within 60 days after that date. |
(8)Mr. Bhalla’s ownership includes options to purchase 10,875 shares of our common stock which are exercisable as of February 28, 2020, or that will become exercisable within 60 days after that date. |
(9)Mr. Hebard’s ownership includes options to purchase 16,875 shares of our common stock which are exercisable as of February 28, 2020, or that will become exercisable within 60 days after that date. |
(10) Includes options to purchase shares of our common stock which are exercisable as of February 28, 2020, or that will become exercisable within 60 days after that date. |
(12) Ownership consists of shares of our common stock beneficially owned by FMR LLC, certain of its subsidiaries and affiliates, and other companies (“FMR”) as disclosed on its joint Schedule 13G/A filed with the SEC on February 7, 2020. The address of FMR is 245 Summer Street, Boston, Massachusetts 02210. |
(13)Ownership consists of shares of our common stock beneficially owned by Blackrock, Inc. and its wholly-owned subsidiaries (“Blackrock”) as disclosed on its Schedule 13G/A filed with the SEC on February 4, 2020. The address of Blackrock is 55 East 52nd Street, New York, New York 10055. |
(14) The address of the Nesbit United S.A. is Rätikonstrasse 13, Vaduz, Principality of Liechtenstein FL-9490. |
(15)Ownership consists of shares of our common stock beneficially owned by The Vanguard Group, Inc. and its wholly-owned subsidiaries (collectively, “Vanguard”), as disclosed on Vanguard’s joint schedule 13G/A filed with the SEC on February 12, 2020. The address of Vanguard is 100 Vanguard Blvd., Malvern, Pennsylvania 19355. |
Item 13. CERTAIN RELATIONSHIPS AND RELATED TRANSACTIONS, AND DIRECTOR INDEPENDENCE
Related Party Transactions
Under the Audit Committee's charter, and consistent with NASDAQ rules, any material potential or actual conflict of interest or transaction between the Company and any "related person" of the Company must be reviewed and approved by the Audit Committee. SEC rules define a "related person" of the Company as any director (or nominee), executive officer, 5%-or-greater shareholder or immediate family member of any of these persons.
Rahul Raina is the Company’s Corporate Vice President Sales Ebix RCS & A.D.A.M. International Business Development and the brother of Robin Raina, our Chairman of the Board, President, and Chief Executive Officer. During each of 2019 and 2018 he was paid a salary of $150,000, respectively, and received zero cash bonus. He received no share-based compensation awards in either 2019 or 2018.
124
During the year ended December 31, 2019 and 2018, Ebix did not donate to the Robin Raina Foundation, a non-profit 501(c) charity in support of the cause of building and providing homes for the severely underprivileged in India.
Director Independence
Our business is managed by the Company’s employees under the direction and oversight of the Board. Except for Mr. Raina, none of our current directors are an employee of the Company. We keep directors informed of our business through discussions with management, materials we provide to them, visits to our offices and facilities and their participation in Board and Board committee meetings.
Under our Corporate Governance Guidelines, we require that a majority of the Board consist of independent, non-management directors, who also meet the criteria for independence required by the Nasdaq Marketplace Rules. Under such rules, a director is independent if he or she does not have a material relationship with the Company. Our Board annually evaluates each member’s independent status.
The Board has determined that, as of January 1 2020, the following seven of the Company’s directors are independent under the Nasdaq Marketplace Rules: Messrs. Benz, Bhalla, Eckert, Hebard, Herter, and Keller. Mr. Raina, as a management director, participates in the Board’s activities and provides valuable insight and advice.
Non-management directors have access to individual members of management or to other employees of the Company on a confidential basis. Directors also have access to Company records and files and directors may contact other directors without informing Company management of the purpose or even the fact of such contact.
Item 14. PRINCIPAL ACCOUNTANT FEES AND SERVICES
Independent Registered Public Accounting Firm
As previously announced, the Audit Committee appointed RSM US LLP ("RSM") to serve as the Company's independent auditor for fiscal year 2019. T. R. Chadha & Co. (“TRC”) served as Ebix’s registered public accountants for the year ended December 31, 2018.
The following tables presents fees billed for professional services rendered for the audit of our annual financial statements for 2019 and 2018 and fees billed for other services rendered during 2019 by TRC and during 2018 by CBH, our independent registered public accounting firm during these periods.
Services Rendered by RSM US LLP | 2019 | 2018 | ||||||||
Audit Fees (1) | $ | 918,750 | $ | — | ||||||
Audit Related Fees (2) | $ | — | $ | — | ||||||
Tax Compliance Service Fees | $ | — | $ | — | ||||||
All Other Fees (3) | $ | — | $ | — | ||||||
Services Rendered by T R Chadha & Co LLP | 2019 | 2018 | ||||||||
Audit Fees (1) | $ | — | $ | 450,000 | ||||||
Audit Related Fees (2) | $ | — | $ | — | ||||||
Tax Compliance Service Fees | $ | — | $ | — | ||||||
All Other Fees (3) | $ | 20,594 | $ | — | ||||||
Services Rendered by Cherry Bekaert LLP | 2019 | 2018 | ||||||||
Audit Fees (1) | $ | — | $ | 280,000 | ||||||
Audit Related Fees (2) | $ | 66,570 | $ | — | ||||||
Tax Compliance Service Fees | $ | — | $ | 35,000 | ||||||
All Other Fees (3) | $ | 158,504 | $ | 105,726 | ||||||
125
(1) Integrated audit of the consolidated financial statements including quarterly reviews according to the engagement letter and administrative fees. . |
(2) Includes fees associated with the review of valuation reports associated with business acquisition and audits of the Company's 401(K) plans, and related out of pocket expenses incurred by the auditors. |
(3) Includes fees related to the audit of the financial statements and the Company's purchase accounting for certain acquired businesses. |
The Audit Committee considered and pre-approved all of the above-referenced fees and services. Pursuant to a policy adopted by our Board of Directors, the Audit Committee requires advance approval of all audit services and permitted non-audit services to be provided by the independent registered public accounting firm as required by the Securities Exchange Act of 1934.
PART IV
Item 15. EXHIBITS, FINANCIAL STATEMENT SCHEDULES
(a) 1. Financial Statements
The following consolidated financial statements and supplementary data of the Company and its subsidiaries, required by Part II, Item 8 are filed herewith:
• | Report of Independent Registered Public Accounting Firm. |
• | Consolidated Balance Sheets as of December 31, 2019 and December 31, 2018 . |
• | Consolidated Statements of Income for the years ended December 31, 2019, December 31, 2018, and December 31, 2017. |
• | Consolidated Statements of Comprehensive Income for the years ended December 31, 2019, December 31, 2018, and December 31, 2017. |
• | Consolidated Statements of Stockholders’ Equity for the years ended December 31, 2019, December 31, 2018, and December 31, 2017. |
• | Consolidated Statements of Cash Flows for the years ended December 31, 2019, December 31, 2018, and December 31, 2017. |
• | Notes to Consolidated Financial Statements |
2. Financial Statement Schedules
The following consolidated financial statement schedule is filed herewith:
• | Schedule II—Valuation and Qualifying Accounts for the years ended December 31, 2019, December 31, 2018, and December 31, 2017. |
• | Schedules other than those listed above have been omitted because they are not applicable or the required information is included in the financial statements or notes thereto. |
3. Exhibits—The exhibits filed herewith or incorporated by reference are listed on the Exhibit Index attached hereto.
126
EXHIBIT INDEX
127
128
23.3* | |||
31.1* | |||
31.2* | |||
32.1* | |||
32.2* | |||
101* | XBRL (Extensible Business Reporting Language) - The following materials from Ebix, Inc.'s Annual Report on Form 10-K for the year ended December 31, 2019, formatted in XBRL (eXtensible Business Reporting Language): (i) the Consolidated Balance Sheets, (ii) the Consolidated Statements of Operations, (iii) the Consolidated Statements of Comprehensive Income (Loss) (iv) the Consolidated Statements of Stockholders' Equity and Comprehensive Income (Loss), (v) the Consolidated Statements of Cash Flows, and (vi) Notes to Consolidated Financial Statements which were tagged as blocks of text. | ||
* Filed herewith
** Indicates management contract or compensatory plan or arrangement.
129
SIGNATURES
Pursuant to the requirements of Section 13 or 15(d) of the Securities Exchange Act of 1934, the Registrant has duly caused this amendment to be signed on its behalf by the undersigned, thereunto duly authorized.
EBIX, INC. (Registrant) | |||
By: | /s/ ROBIN RAINA | ||
Robin Raina | |||
Chairman of the Board, President and Chief Executive Officer | |||
Principal Executive Officer | |||
Date: March 2, 2020
Pursuant to the requirements of the Securities Exchange Act of 1934, this report has been signed below by the following persons on behalf of the registrant and in the capacities and on the dates indicated.
Signature | Title | Date | ||
/s/ ROBIN RAINA | Chairman of the Board, President, and Chief Executive Officer (principal executive officer) | March 2, 2020 | ||
(Robin Raina) | ||||
/s/ ROBERT F. KERRIS | Chief Financial Officer (principal financial and accounting officer) | March 2, 2020 | ||
(Robert F. Kerris) | ||||
/s/ HANS U. BENZ | Director | March 2, 2020 | ||
(Hans U. Benz) | ||||
/s/ PAVAN BHALLA | Director | March 2, 2020 | ||
(Pavan Bhalla) | ||||
/s/ NEIL D. ECKERT | Director | March 2, 2020 | ||
(Neil D. Eckert) | ||||
/s/ ROLF HERTER | Director | March 2, 2020 | ||
(Rolf Herter) | ||||
/s/ HANS UELI KELLER | Director | March 2, 2020 | ||
(Hans Ueli Keller) | ||||
/s/ GEORGE W. HEBARD III | Director | March 2, 2020 | ||
(George W. Hebard III) | ||||
130
Schedule II
Ebix, Inc.
Schedule II—Valuation and Qualifying Accounts
Years ended December 31, 2019, December 31, 2018 and December 31, 2017
Allowance for doubtful accounts receivable (in thousands):
Year ended December 31, | ||||||||||||
2019 | 2018 | 2017 | ||||||||||
Beginning balance | $ | $ | $ | |||||||||
Provision for doubtful accounts | ||||||||||||
Write-off of accounts receivable against allowance | ( | ) | ( | ) | ( | ) | ||||||
Other (opening balance adjustments on acquisitions) | ||||||||||||
Ending balance | $ | $ | $ | |||||||||
Valuation allowance for deferred tax assets (in thousands):
Year ended December 31, | ||||||||||||
2019 | 2018 | 2017 | ||||||||||
Beginning balance | $ | ( | ) | $ | ( | ) | $ | ( | ) | |||
Decrease (increase) | ( | ) | ( | ) | ||||||||
Ending balance | $ | ( | ) | $ | ( | ) | $ | ( | ) | |||
131