0000813672false2021FYhttp://fasb.org/us-gaap/2021-01-31#OtherAssetshttp://fasb.org/us-gaap/2021-01-31#OtherAssetshttp://fasb.org/us-gaap/2021-01-31#AccountsPayableAndAccruedLiabilitiesCurrenthttp://fasb.org/us-gaap/2021-01-31#AccountsPayableAndAccruedLiabilitiesCurrenthttp://fasb.org/us-gaap/2021-01-31#OtherLiabilitiesNoncurrenthttp://fasb.org/us-gaap/2021-01-31#OtherLiabilitiesNoncurrent00008136722021-01-032022-01-0100008136722021-07-03iso4217:USD00008136722022-02-05xbrli:shares00008136722018-12-302019-12-2800008136722022-01-0100008136722021-01-02iso4217:USDxbrli:shares0000813672cdns:ProductandmaintenanceMember2021-01-032022-01-010000813672cdns:ProductandmaintenanceMember2019-12-292021-01-020000813672cdns:ProductandmaintenanceMember2018-12-302019-12-280000813672us-gaap:TechnologyServiceMember2021-01-032022-01-010000813672us-gaap:TechnologyServiceMember2019-12-292021-01-020000813672us-gaap:TechnologyServiceMember2018-12-302019-12-2800008136722019-12-292021-01-020000813672us-gaap:CommonStockMember2018-12-290000813672us-gaap:CommonStockIncludingAdditionalPaidInCapitalMember2018-12-290000813672us-gaap:TreasuryStockMember2018-12-290000813672us-gaap:RetainedEarningsMember2018-12-290000813672us-gaap:AccumulatedOtherComprehensiveIncomeMember2018-12-2900008136722018-12-290000813672us-gaap:RetainedEarningsMember2018-12-302019-12-280000813672us-gaap:AccumulatedOtherComprehensiveIncomeMember2018-12-302019-12-280000813672us-gaap:CommonStockMember2018-12-302019-12-280000813672us-gaap:TreasuryStockMember2018-12-302019-12-280000813672us-gaap:CommonStockIncludingAdditionalPaidInCapitalMember2018-12-302019-12-280000813672us-gaap:CommonStockMember2019-12-280000813672us-gaap:CommonStockIncludingAdditionalPaidInCapitalMember2019-12-280000813672us-gaap:TreasuryStockMember2019-12-280000813672us-gaap:RetainedEarningsMember2019-12-280000813672us-gaap:AccumulatedOtherComprehensiveIncomeMember2019-12-2800008136722019-12-280000813672srt:CumulativeEffectPeriodOfAdoptionAdjustmentMemberus-gaap:RetainedEarningsMember2019-12-280000813672srt:CumulativeEffectPeriodOfAdoptionAdjustmentMember2019-12-280000813672us-gaap:RetainedEarningsMember2019-12-292021-01-020000813672us-gaap:AccumulatedOtherComprehensiveIncomeMember2019-12-292021-01-020000813672us-gaap:CommonStockMember2019-12-292021-01-020000813672us-gaap:TreasuryStockMember2019-12-292021-01-020000813672us-gaap:CommonStockIncludingAdditionalPaidInCapitalMember2019-12-292021-01-020000813672us-gaap:CommonStockMember2021-01-020000813672us-gaap:CommonStockIncludingAdditionalPaidInCapitalMember2021-01-020000813672us-gaap:TreasuryStockMember2021-01-020000813672us-gaap:RetainedEarningsMember2021-01-020000813672us-gaap:AccumulatedOtherComprehensiveIncomeMember2021-01-020000813672us-gaap:RetainedEarningsMember2021-01-032022-01-010000813672us-gaap:AccumulatedOtherComprehensiveIncomeMember2021-01-032022-01-010000813672us-gaap:CommonStockMember2021-01-032022-01-010000813672us-gaap:TreasuryStockMember2021-01-032022-01-010000813672us-gaap:CommonStockIncludingAdditionalPaidInCapitalMember2021-01-032022-01-010000813672us-gaap:CommonStockMember2022-01-010000813672us-gaap:CommonStockIncludingAdditionalPaidInCapitalMember2022-01-010000813672us-gaap:TreasuryStockMember2022-01-010000813672us-gaap:RetainedEarningsMember2022-01-010000813672us-gaap:AccumulatedOtherComprehensiveIncomeMember2022-01-010000813672srt:MinimumMemberus-gaap:ComputerEquipmentMember2021-01-032022-01-010000813672srt:MaximumMemberus-gaap:ComputerEquipmentMember2021-01-032022-01-010000813672us-gaap:BuildingMembersrt:MinimumMember2021-01-032022-01-010000813672us-gaap:BuildingMembersrt:MaximumMember2021-01-032022-01-010000813672us-gaap:LeaseholdImprovementsMember2021-01-032022-01-010000813672srt:MaximumMembercdns:BuildingimprovementsandlandimprovementsMember2021-01-032022-01-010000813672srt:MinimumMemberus-gaap:FurnitureAndFixturesMember2021-01-032022-01-010000813672us-gaap:FurnitureAndFixturesMembersrt:MaximumMember2021-01-032022-01-010000813672srt:MinimumMemberus-gaap:EquipmentMember2021-01-032022-01-010000813672us-gaap:EquipmentMembersrt:MaximumMember2021-01-032022-01-010000813672srt:MinimumMember2021-01-032022-01-010000813672srt:MaximumMember2021-01-032022-01-010000813672srt:MinimumMember2022-01-010000813672srt:MaximumMember2022-01-010000813672us-gaap:ForwardContractsMember2021-01-032022-01-01xbrli:pure0000813672srt:MaximumMember2019-12-292021-01-0200008136722018-12-302019-09-280000813672us-gaap:RevolvingCreditFacilityMember2022-01-010000813672us-gaap:RevolvingCreditFacilityMember2021-01-020000813672cdns:SeniorNotesDueTwentyTwentyFourMemberus-gaap:SeniorNotesMember2022-01-010000813672cdns:SeniorNotesDueTwentyTwentyFourMemberus-gaap:SeniorNotesMember2021-01-020000813672us-gaap:RevolvingCreditFacilityMember2021-01-032022-01-010000813672srt:MinimumMemberus-gaap:RevolvingCreditFacilityMemberus-gaap:LondonInterbankOfferedRateLIBORMember2021-01-032022-01-010000813672us-gaap:RevolvingCreditFacilityMembersrt:MaximumMemberus-gaap:LondonInterbankOfferedRateLIBORMember2021-01-032022-01-010000813672srt:MinimumMemberus-gaap:RevolvingCreditFacilityMemberus-gaap:BaseRateMember2021-01-032022-01-010000813672us-gaap:RevolvingCreditFacilityMembersrt:MaximumMemberus-gaap:BaseRateMember2021-01-032022-01-010000813672srt:MinimumMemberus-gaap:RevolvingCreditFacilityMember2021-01-032022-01-010000813672us-gaap:RevolvingCreditFacilityMembersrt:MaximumMember2021-01-032022-01-010000813672srt:MinimumMemberus-gaap:RevolvingCreditFacilityMember2021-01-032022-01-010000813672us-gaap:RevolvingCreditFacilityMembersrt:MaximumMember2021-01-032022-01-010000813672cdns:SeniorNotesDueTwentyTwentyFourMemberus-gaap:SeniorNotesMember2014-10-090000813672cdns:SeniorNotesDueTwentyTwentyFourMemberus-gaap:SeniorNotesMember2014-10-092014-10-0900008136722019-12-290000813672cdns:CustomICDesignMember2021-01-032022-01-010000813672cdns:CustomICDesignMember2019-12-292021-01-020000813672cdns:CustomICDesignMember2018-12-302019-12-280000813672cdns:DigitalICDesignandSignoffMember2021-01-032022-01-010000813672cdns:DigitalICDesignandSignoffMember2019-12-292021-01-020000813672cdns:DigitalICDesignandSignoffMember2018-12-302019-12-280000813672cdns:FunctionalVerificationincludingEmulationandPrototypingHardwareMember2021-01-032022-01-010000813672cdns:FunctionalVerificationincludingEmulationandPrototypingHardwareMember2019-12-292021-01-020000813672cdns:FunctionalVerificationincludingEmulationandPrototypingHardwareMember2018-12-302019-12-280000813672cdns:IPMember2021-01-032022-01-010000813672cdns:IPMember2019-12-292021-01-020000813672cdns:IPMember2018-12-302019-12-280000813672cdns:SystemDesignAndAnalysisMember2021-01-032022-01-010000813672cdns:SystemDesignAndAnalysisMember2019-12-292021-01-020000813672cdns:SystemDesignAndAnalysisMember2018-12-302019-12-280000813672cdns:NUMECAMember2021-02-230000813672cdns:NUMECAMember2021-01-032022-01-010000813672cdns:PointwiseMember2021-01-032022-01-010000813672cdns:PointwiseMember2021-04-140000813672cdns:Fiscal2021AcquisitionsMembercdns:ExistingTechnologyMember2021-01-032022-01-010000813672cdns:Fiscal2021AcquisitionsMembercdns:AgreementsAndRelationshipMember2021-01-032022-01-010000813672cdns:Fiscal2021AcquisitionsMembercdns:TradenameTrademarkAndPatentsMember2021-01-032022-01-010000813672cdns:Fiscal2021AcquisitionsMember2021-01-032022-01-010000813672cdns:AWRAndIntegrandMember2019-12-292021-01-020000813672cdns:AWRAndIntegrandMemberus-gaap:FairValueInputsLevel3Member2021-01-020000813672cdns:ExistingTechnologyMember2022-01-010000813672cdns:AgreementsAndRelationshipMember2022-01-010000813672cdns:TradenameTrademarkAndPatentsMember2022-01-010000813672cdns:ExistingTechnologyMember2021-01-020000813672cdns:AgreementsAndRelationshipMember2021-01-020000813672cdns:TradenameTrademarkAndPatentsMember2021-01-020000813672stpr:MA2021-01-032022-01-010000813672stpr:CA2019-12-292021-01-020000813672us-gaap:DomesticCountryMember2022-01-010000813672cdns:CaliforniaStateMember2022-01-010000813672cdns:StatesOtherThanCaliforniaMember2022-01-010000813672us-gaap:ForeignCountryMember2022-01-010000813672cdns:A2014OmnibusEquityIncentivePlanMember2021-01-032022-01-010000813672cdns:A2014OmnibusEquityIncentivePlanMember2022-01-010000813672srt:MinimumMembercdns:A2014OmnibusEquityIncentivePlanMemberus-gaap:EmployeeStockOptionMember2021-01-032022-01-010000813672cdns:A2014OmnibusEquityIncentivePlanMembersrt:MaximumMemberus-gaap:EmployeeStockOptionMember2021-01-032022-01-010000813672cdns:OneThousandNineHundredNinetyFiveDirectorsStockOptionsPlanMember2022-01-010000813672cdns:OneThousandNineHundredNinetyFiveDirectorsStockOptionsPlanMember2021-01-032022-01-010000813672cdns:OneThousandNineHundredNinetyFiveDirectorsStockOptionsPlanMemberus-gaap:EmployeeStockMember2021-01-032022-01-010000813672us-gaap:EmployeeStockOptionMember2021-01-032022-01-010000813672us-gaap:EmployeeStockOptionMember2019-12-292021-01-020000813672us-gaap:EmployeeStockOptionMember2018-12-302019-12-280000813672us-gaap:RestrictedStockMember2021-01-032022-01-010000813672us-gaap:RestrictedStockMember2019-12-292021-01-020000813672us-gaap:RestrictedStockMember2018-12-302019-12-280000813672cdns:EmployeeStockPurchasePlanEsppMember2021-01-032022-01-010000813672cdns:EmployeeStockPurchasePlanEsppMember2019-12-292021-01-020000813672cdns:EmployeeStockPurchasePlanEsppMember2018-12-302019-12-280000813672us-gaap:CostOfSalesMember2021-01-032022-01-010000813672us-gaap:CostOfSalesMember2019-12-292021-01-020000813672us-gaap:CostOfSalesMember2018-12-302019-12-280000813672cdns:CostOfServicesMember2021-01-032022-01-010000813672cdns:CostOfServicesMember2019-12-292021-01-020000813672cdns:CostOfServicesMember2018-12-302019-12-280000813672us-gaap:SellingAndMarketingExpenseMember2021-01-032022-01-010000813672us-gaap:SellingAndMarketingExpenseMember2019-12-292021-01-020000813672us-gaap:SellingAndMarketingExpenseMember2018-12-302019-12-280000813672us-gaap:ResearchAndDevelopmentExpenseMember2021-01-032022-01-010000813672us-gaap:ResearchAndDevelopmentExpenseMember2019-12-292021-01-020000813672us-gaap:ResearchAndDevelopmentExpenseMember2018-12-302019-12-280000813672us-gaap:GeneralAndAdministrativeExpenseMember2021-01-032022-01-010000813672us-gaap:GeneralAndAdministrativeExpenseMember2019-12-292021-01-020000813672us-gaap:GeneralAndAdministrativeExpenseMember2018-12-302019-12-280000813672us-gaap:EmployeeStockOptionMember2022-01-010000813672srt:MinimumMemberus-gaap:RestrictedStockMember2021-01-032022-01-010000813672srt:MaximumMemberus-gaap:RestrictedStockMember2021-01-032022-01-010000813672cdns:PerformancebasedrestrictedstockgrantsMember2022-01-010000813672cdns:PerformancebasedrestrictedstockgrantsMember2021-01-032022-01-010000813672cdns:PerformancebasedrestrictedstockgrantsMember2019-12-292021-01-020000813672cdns:PerformancebasedrestrictedstockgrantsMember2018-12-302019-12-280000813672cdns:MarketbasedperformancerestrictedstockgrantsMember2021-01-032022-01-010000813672cdns:MarketbasedperformancerestrictedstockgrantsMember2019-12-292021-01-020000813672cdns:MarketbasedperformancerestrictedstockgrantsMember2018-12-302019-12-280000813672us-gaap:RestrictedStockMember2021-01-020000813672us-gaap:RestrictedStockMember2022-01-010000813672cdns:EmployeeStockPurchasePlanEsppMember2021-01-032022-01-010000813672cdns:EmployeeStockPurchasePlanwithOfferingPeriodCommencingonFebruaryOneTwoThousandFourteenMemberMember2022-01-010000813672cdns:EmployeeStockPurchasePlanwithOfferingPeriodCommencingonFebruaryOneTwoThousandFourteenMemberMember2020-02-012021-01-020000813672cdns:EmployeeStockPurchasePlanEsppMember2022-01-010000813672cdns:PurchaseRightsGrantedMember2021-01-032022-01-010000813672cdns:PurchaseRightsGrantedMember2019-12-292021-01-020000813672cdns:PurchaseRightsGrantedMember2018-12-302019-12-280000813672cdns:EmployeeStockPurchasePlanEsppMember2019-12-292021-01-020000813672cdns:EmployeeStockPurchasePlanEsppMember2018-12-302019-12-280000813672cdns:EmployeeStockPurchasePlanEsppMember2021-01-020000813672cdns:EmployeeStockPurchasePlanEsppMember2019-12-280000813672cdns:EmployeeEquityIncentivePlansMember2022-01-010000813672cdns:EmployeeStockPurchasePlanEsppMember2022-01-010000813672cdns:DirectorsStockOptionPlansMember2022-01-0100008136722021-08-040000813672us-gaap:PerformanceSharesMember2021-01-032022-01-010000813672us-gaap:PerformanceSharesMember2019-12-292021-01-020000813672us-gaap:PerformanceSharesMember2018-12-302019-12-280000813672us-gaap:EmployeeStockOptionMember2021-01-032022-01-010000813672us-gaap:EmployeeStockOptionMember2019-12-292021-01-020000813672us-gaap:EmployeeStockOptionMember2018-12-302019-12-280000813672us-gaap:RestrictedStockMember2021-01-032022-01-010000813672us-gaap:RestrictedStockMember2019-12-292021-01-020000813672us-gaap:RestrictedStockMember2018-12-302019-12-280000813672cdns:OtherequityinvestmentsnotreadilymarketableMember2022-01-010000813672cdns:OtherequityinvestmentsnotreadilymarketableMember2021-01-020000813672us-gaap:MoneyMarketFundsMember2022-01-010000813672us-gaap:FairValueInputsLevel1Memberus-gaap:MoneyMarketFundsMember2022-01-010000813672us-gaap:FairValueInputsLevel2Memberus-gaap:MoneyMarketFundsMember2022-01-010000813672us-gaap:MoneyMarketFundsMemberus-gaap:FairValueInputsLevel3Member2022-01-010000813672us-gaap:FairValueInputsLevel1Member2022-01-010000813672us-gaap:FairValueInputsLevel2Member2022-01-010000813672us-gaap:FairValueInputsLevel3Member2022-01-010000813672us-gaap:FairValueInputsLevel1Member2021-01-020000813672us-gaap:FairValueInputsLevel2Member2021-01-020000813672us-gaap:FairValueInputsLevel3Member2021-01-020000813672us-gaap:MoneyMarketFundsMember2021-01-020000813672us-gaap:FairValueInputsLevel1Memberus-gaap:MoneyMarketFundsMember2021-01-020000813672us-gaap:FairValueInputsLevel2Memberus-gaap:MoneyMarketFundsMember2021-01-020000813672us-gaap:MoneyMarketFundsMemberus-gaap:FairValueInputsLevel3Member2021-01-020000813672cdns:A2021AcquisitionMemberus-gaap:FairValueInputsLevel3Member2022-01-010000813672us-gaap:MeasurementInputDiscountRateMembercdns:NUMECAMemberus-gaap:FairValueInputsLevel3Member2021-01-032022-01-010000813672us-gaap:MeasurementInputDiscountRateMembercdns:PointwiseMemberus-gaap:FairValueInputsLevel3Member2021-01-032022-01-010000813672us-gaap:MeasurementInputDiscountRateMembersrt:MinimumMembercdns:ExistingTechnologyMembercdns:PointwiseMemberus-gaap:FairValueInputsLevel3Member2021-01-032022-01-010000813672us-gaap:MeasurementInputDiscountRateMembersrt:MinimumMembercdns:ExistingTechnologyMembercdns:NUMECAMemberus-gaap:FairValueInputsLevel3Member2021-01-032022-01-010000813672us-gaap:MeasurementInputDiscountRateMembercdns:ExistingTechnologyMembercdns:NUMECAMembersrt:MaximumMemberus-gaap:FairValueInputsLevel3Member2021-01-032022-01-010000813672us-gaap:MeasurementInputDiscountRateMembercdns:ExistingTechnologyMembercdns:PointwiseMembersrt:MaximumMemberus-gaap:FairValueInputsLevel3Member2021-01-032022-01-010000813672us-gaap:MeasurementInputDiscountRateMemberus-gaap:CustomerRelationshipsMembercdns:NUMECAMemberus-gaap:FairValueInputsLevel3Member2021-01-032022-01-010000813672us-gaap:MeasurementInputDiscountRateMemberus-gaap:CustomerRelationshipsMembercdns:PointwiseMemberus-gaap:FairValueInputsLevel3Member2021-01-032022-01-010000813672us-gaap:MeasurementInputDiscountRateMemberus-gaap:CustomerRelationshipsMembersrt:MinimumMembercdns:NUMECAMemberus-gaap:FairValueInputsLevel3Member2021-01-032022-01-010000813672us-gaap:MeasurementInputDiscountRateMemberus-gaap:CustomerRelationshipsMembersrt:MinimumMembercdns:PointwiseMemberus-gaap:FairValueInputsLevel3Member2021-01-032022-01-010000813672us-gaap:MeasurementInputDiscountRateMemberus-gaap:CustomerRelationshipsMembercdns:PointwiseMembersrt:MaximumMemberus-gaap:FairValueInputsLevel3Member2021-01-032022-01-010000813672us-gaap:MeasurementInputDiscountRateMemberus-gaap:CustomerRelationshipsMembercdns:NUMECAMembersrt:MaximumMemberus-gaap:FairValueInputsLevel3Member2021-01-032022-01-010000813672cdns:AWRAndIntegrandMemberus-gaap:MeasurementInputDiscountRateMembersrt:MinimumMemberus-gaap:FairValueInputsLevel3Member2019-12-292021-01-020000813672cdns:AWRAndIntegrandMemberus-gaap:MeasurementInputDiscountRateMembersrt:MaximumMemberus-gaap:FairValueInputsLevel3Member2019-12-292021-01-020000813672cdns:AWRAndIntegrandMemberus-gaap:MeasurementInputDiscountRateMemberus-gaap:FairValueInputsLevel3Member2019-12-292021-01-020000813672us-gaap:MeasurementInputDiscountRateMembercdns:AWRAndIntegrandMembersrt:MinimumMembercdns:ExistingTechnologyMemberus-gaap:FairValueInputsLevel3Member2019-12-292021-01-020000813672us-gaap:MeasurementInputDiscountRateMembercdns:AWRAndIntegrandMembercdns:ExistingTechnologyMembersrt:MaximumMemberus-gaap:FairValueInputsLevel3Member2019-12-292021-01-020000813672us-gaap:MeasurementInputDiscountRateMembercdns:AWRAndIntegrandMemberus-gaap:CustomerRelationshipsMembersrt:MinimumMemberus-gaap:FairValueInputsLevel3Member2021-01-032022-01-010000813672us-gaap:MeasurementInputDiscountRateMembercdns:AWRAndIntegrandMemberus-gaap:CustomerRelationshipsMembersrt:MaximumMemberus-gaap:FairValueInputsLevel3Member2021-01-032022-01-010000813672us-gaap:MeasurementInputDiscountRateMembercdns:AWRAndIntegrandMembersrt:MinimumMemberus-gaap:CustomerContractsMemberus-gaap:FairValueInputsLevel3Member2019-12-292021-01-020000813672us-gaap:MeasurementInputDiscountRateMembercdns:AWRAndIntegrandMemberus-gaap:CustomerContractsMembersrt:MaximumMemberus-gaap:FairValueInputsLevel3Member2019-12-292021-01-020000813672us-gaap:EmployeeSeveranceMember2018-12-290000813672us-gaap:FacilityClosingMember2018-12-290000813672us-gaap:EmployeeSeveranceMember2018-12-302019-12-280000813672us-gaap:FacilityClosingMember2018-12-302019-12-280000813672us-gaap:EmployeeSeveranceMember2019-12-280000813672us-gaap:FacilityClosingMember2019-12-280000813672us-gaap:EmployeeSeveranceMember2019-12-292021-01-020000813672us-gaap:FacilityClosingMember2019-12-292021-01-020000813672us-gaap:EmployeeSeveranceMember2021-01-020000813672us-gaap:FacilityClosingMember2021-01-020000813672us-gaap:EmployeeSeveranceMember2021-01-032022-01-010000813672us-gaap:FacilityClosingMember2021-01-032022-01-010000813672us-gaap:EmployeeSeveranceMember2022-01-010000813672us-gaap:FacilityClosingMember2022-01-010000813672country:US2021-01-032022-01-010000813672country:US2019-12-292021-01-020000813672country:US2018-12-302019-12-280000813672cdns:OtherAmericaMember2021-01-032022-01-010000813672cdns:OtherAmericaMember2019-12-292021-01-020000813672cdns:OtherAmericaMember2018-12-302019-12-280000813672srt:AmericasMember2021-01-032022-01-010000813672srt:AmericasMember2019-12-292021-01-020000813672srt:AmericasMember2018-12-302019-12-280000813672country:CN2021-01-032022-01-010000813672country:CN2019-12-292021-01-020000813672country:CN2018-12-302019-12-280000813672cdns:OtherAsiaMember2021-01-032022-01-010000813672cdns:OtherAsiaMember2019-12-292021-01-020000813672cdns:OtherAsiaMember2018-12-302019-12-280000813672srt:AsiaMember2021-01-032022-01-010000813672srt:AsiaMember2019-12-292021-01-020000813672srt:AsiaMember2018-12-302019-12-280000813672us-gaap:EMEAMember2021-01-032022-01-010000813672us-gaap:EMEAMember2019-12-292021-01-020000813672us-gaap:EMEAMember2018-12-302019-12-280000813672country:JP2021-01-032022-01-010000813672country:JP2019-12-292021-01-020000813672country:JP2018-12-302019-12-280000813672country:US2022-01-010000813672country:US2021-01-020000813672country:US2019-12-280000813672cdns:OtherAmericaMember2022-01-010000813672cdns:OtherAmericaMember2021-01-020000813672cdns:OtherAmericaMember2019-12-280000813672srt:AmericasMember2022-01-010000813672srt:AmericasMember2021-01-020000813672srt:AmericasMember2019-12-280000813672country:CN2022-01-010000813672country:CN2021-01-020000813672country:CN2019-12-280000813672cdns:OtherAsiaMember2022-01-010000813672cdns:OtherAsiaMember2021-01-020000813672cdns:OtherAsiaMember2019-12-280000813672srt:AsiaMember2022-01-010000813672srt:AsiaMember2021-01-020000813672srt:AsiaMember2019-12-280000813672us-gaap:EMEAMember2022-01-010000813672us-gaap:EMEAMember2021-01-020000813672us-gaap:EMEAMember2019-12-280000813672country:JP2022-01-010000813672country:JP2021-01-020000813672country:JP2019-12-28
UNITED STATES SECURITIES AND EXCHANGE COMMISSION
Washington, D.C. 20549
_____________________________________
FORM 10-K
_____________________________________
(Mark One) | | | | | | | | |
| ☒ | ANNUAL REPORT PURSUANT TO SECTION 13 OR 15(d) OF THE SECURITIES EXCHANGE ACT OF 1934 |
For the fiscal year ended January 1, 2022
OR | | | | | | | | |
| ☐ | TRANSITION REPORT PURSUANT TO SECTION 13 OR 15(d) OF THE SECURITIES EXCHANGE ACT OF 1934 |
For the transition period from _________ to_________.
Commission file number 000-15867
_____________________________________
CADENCE DESIGN SYSTEMS, INC.
(Exact name of registrant as specified in its charter)
____________________________________ | | | | | | | | | | | | | | |
| Delaware | | 00-0000000 |
(State or Other Jurisdiction of
Incorporation or Organization) | | (I.R.S. Employer
Identification No.) |
| | | |
| 2655 Seely Avenue, Building 5, | San Jose, | California | | 95134 |
| (Address of Principal Executive Offices) | | (Zip Code) |
(408)-943-1234
(Registrant’s Telephone Number, including Area Code)
Securities registered pursuant to Section 12(b) of the Act: | | | | | | | | |
| Title of Each Class | Trading Symbol(s) | Names of Each Exchange on which Registered |
| Common Stock, $0.01 par value per share | CDNS | Nasdaq Global Select Market |
Securities registered pursuant to Section 12(g) of the Act:
None
Indicate by check mark if the registrant is a well-known seasoned issuer, as defined in Rule 405 of the Securities Act. Yes ☒ No ☐
Indicate by check mark if the registrant is not required to file reports pursuant to Section 13 or Section 15(d) of the Act. Yes ☐ No ☒
Indicate by check mark whether the registrant (1) has filed all reports required to be filed by Section 13 or 15(d) of the Securities Exchange Act of 1934 during the preceding 12 months (or for such shorter period that the registrant was required to file such reports), and (2) has been subject to such filing requirements for the past 90 days. Yes ☒ No ☐
Indicate by check mark whether the registrant has submitted electronically every Interactive Data File required to be submitted pursuant to Rule 405 of Regulation S-T (§ 232.405 of this chapter) during the preceding 12 months (or for such shorter period that the registrant was required to submit such files). Yes ☒ No ☐
Indicate by check mark whether the registrant is a large accelerated filer, an accelerated filer, a non-accelerated filer, a smaller reporting company, or an emerging growth company. See the definitions of “large accelerated filer,” “accelerated filer,” “smaller reporting company,” and “emerging growth company” in Rule 12b-2 of the Exchange Act.
| | | | | | | | | | | | | | | | | | | | |
| Large Accelerated Filer | | ☒ | | Accelerated Filer | | ☐ |
| Non-accelerated Filer | | ☐ | | Smaller Reporting Company | | ☐ |
| | | | Emerging Growth Company | | ☐ |
If an emerging growth company, indicate by check mark if the registrant has elected not to use the extended transition period for complying with any new or revised financial accounting standards provided pursuant to Section 13(a) of the Exchange Act. ☐
Indicate by check mark whether the registrant has filed a report on and attestation to its management’s assessment of the effectiveness of its internal control over financial reporting under Section 404(b) of the Sarbanes-Oxley Act (15 U.S.C. 7262(b)) by the registered public accounting firm that prepared or issued its audit report. ☒
Indicate by check mark whether the registrant is a shell company (as defined in Rule 12b-2 of the Act). Yes ☐ No ☒
The aggregate market value of the voting and non-voting common equity held by non-affiliates computed by reference to the price at which the common equity was last sold as of the last business day of the registrant’s most recently completed second fiscal quarter ended July 3, 2021 was approximately $38,179,000,000.
On February 5, 2022, approximately 277,336,000 shares of the Registrant’s Common Stock, $0.01 par value, were outstanding.
DOCUMENTS INCORPORATED BY REFERENCE
Portions of the definitive proxy statement for Cadence Design Systems, Inc.’s 2022 Annual Meeting of Stockholders are incorporated by reference into Part III hereof.
CADENCE DESIGN SYSTEMS, INC.
ANNUAL REPORT ON FORM 10-K
FOR THE FISCAL YEAR ENDED JANUARY 1, 2022
Table of Contents
| | | | | | | | |
| | | Page |
| PART I. | | |
| | |
| Item 1. | | |
| | |
| Item 1A. | | |
| | |
| Item 1B. | | |
| | |
| Item 2. | | |
| | |
| Item 3. | | |
| | |
| Item 4. | | |
| | |
| PART II. | | |
| Item 5. | | |
| | |
| Item 6. | | |
| | |
| Item 7. | | |
| | |
| Item 7A. | | |
| | |
| Item 8. | | |
| | |
| Item 9. | | |
| | |
| Item 9A. | | |
| | |
| Item 9B. | | |
| | |
| Item 9C. | | |
| | |
| PART III. | | |
| | |
| Item 10. | | |
| | |
| Item 11. | | |
| | |
| Item 12. | | |
| | |
| Item 13. | | |
| | |
| Item 14. | | |
| | |
| PART IV. | | |
| | |
| Item 15. | | |
| | |
| Item 16. | | |
| | |
| | |
PART I.
Item 1. Business
This Annual Report on Form 10-K and the documents incorporated by reference in this Annual Report on Form 10-K contain statements that are not historical in nature, are predictive, or that depend upon or refer to future events or conditions or contain other forward-looking statements. Statements including, but not limited to, statements regarding the extent and timing of future revenues and expenses and customer demand, statements regarding the deployment of our products and services, statements regarding our reliance on third parties, statements regarding the impact on our business of the COVID-19 pandemic and related public health measures or mandates, and other and statements using words such as “anticipates,” “believes,” “could,” “estimates,” “expects,” “forecasts,” “intends,” “may,” “plans,” “projects,” “should,” “targets,” “will” and “would,” and words of similar import and the negatives thereof, constitute forward-looking statements. These statements are predictions based upon our current expectations about future events. Actual results could vary materially as a result of certain factors, including but not limited to those expressed in these statements. Important risks and uncertainties that could cause actual results to differ materially from those contained in the forward-looking statements include, but are not limited to, those identified in “Proprietary Technology,” “Competition,” “Risk Factors,” “Critical Accounting Estimates,” “Results of Operations,” “Quantitative and Qualitative Disclosures About Market Risk” and “Liquidity and Capital Resources” sections contained in this Annual Report on Form 10-K and the risks discussed in our other Securities and Exchange Commission (“SEC”) filings.
We urge you to consider these factors carefully in evaluating the forward-looking statements contained in this Annual Report on Form 10-K. All subsequent written or oral forward-looking statements attributable to our company or persons acting on our behalf are expressly qualified in their entirety by these cautionary statements. The forward-looking statements included in this Annual Report on Form 10-K are made only as of the date of this Annual Report on Form 10-K. We do not intend, and undertake no obligation, to update these forward-looking statements.
Overview
Cadence is a leader in electronic system design, building upon more than 30 years of computational software expertise. We apply our underlying Intelligent System Design™ strategy to deliver computational software, hardware and IP that turn design concepts into reality. Our customers include some of the world’s most innovative companies that deliver extraordinary electronic products from chips to boards to systems for dynamic market applications.
We enable our customers to develop electronic products. Our products and services are designed to give our customers a competitive edge in their development of integrated circuits (“ICs”), systems-on-chip (“SoCs”), and increasingly sophisticated electronic devices and systems. Our products and services do this by optimizing performance, minimizing power consumption, shortening the time to bring our customers’ products to market, improving engineering productivity and reducing their design, development and manufacturing costs.
Our electronic systems customers deliver entire devices, such as smartphones, laptop computers, gaming systems, automobiles and autonomous driving systems, servers, cloud data center infrastructure, artificial intelligence (“AI”) systems, aerospace and defense, medical equipment and networking products. These systems companies internally develop, or externally purchase, the sub-components for their products, including printed circuit boards (“PCBs”), which interconnect all the hardware components, ICs, which are often referred to as computer chips, and software at various levels which runs on the hardware. Our semiconductor customers deliver ICs, which include subcategories such as processors, SoCs, AI, memory, analog and other types of chips.
We offer software, hardware, services and reusable IC design blocks, which are commonly referred to as intellectual property (“IP”). Our semiconductor customers use our offerings to design, configure, analyze and verify ICs. Additionally, customers license our IP, which accelerates their product development processes by providing pre-designed and verified circuit blocks for their ICs. Systems customers use our offerings to design, simulate, and verify the electro-thermal and physical functionality of their ICs, PCBs, and systems products.
Our strategy, which we call Intelligent System Design, is to provide the computational software technologies necessary for our electronic system and semiconductor customers to develop products across a variety of vertical markets including consumer, hyperscale computing, mobile, 5G communications, automotive, aerospace and defense, industrial and healthcare. We address the challenges posed by the needs and trends of electronic systems companies as well as semiconductor companies delivering greater portions of these systems.
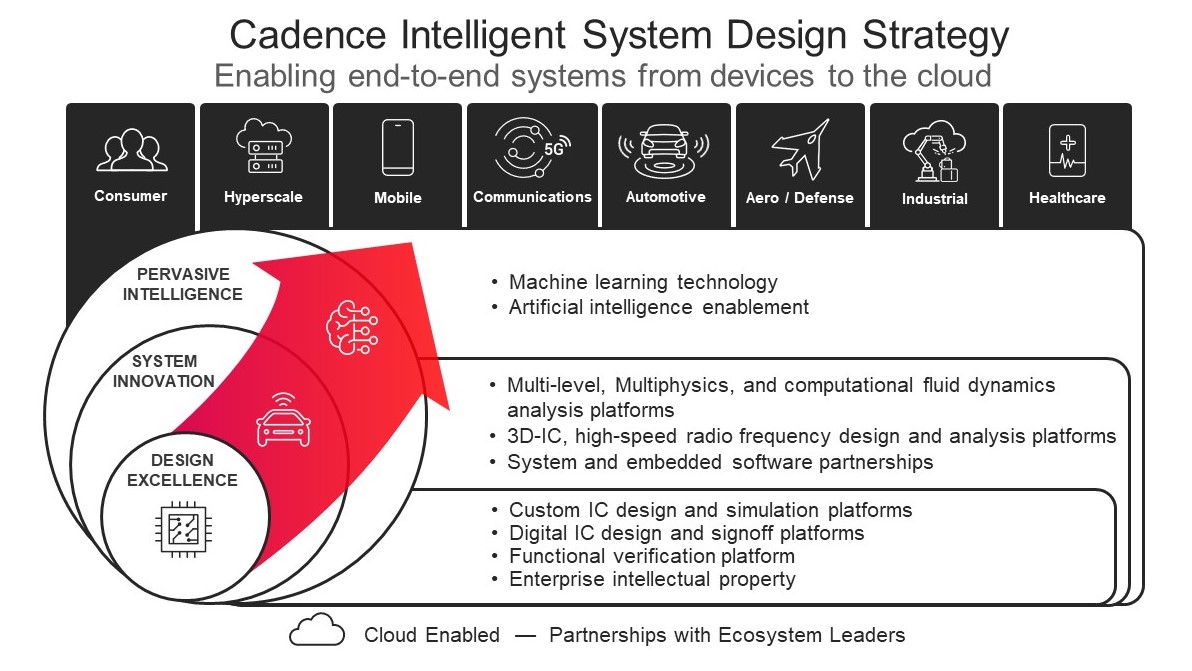
The development of electronic products, or their sub-components, is complex and requires many engineers using our solutions with specialized knowledge and skill. The rate of technical innovation in electronics is swift, long driven by a concept known as Moore’s Law, which more than 50 years ago predicted that the complexity of ICs would double approximately every 24 months. In order to make our customers successful, our products must handle this exponential growth rate in complexity, without requiring a corresponding increase in our customers’ costs. Historically, the industry that provided the tools used by IC engineers was referred to as Electronic Design Automation (“EDA”). Today, our offerings include and extend beyond EDA to enable computational software for Intelligent System Design across three layers as illustrated below—starting with IC and SoC design excellence, followed by system innovation, and then pervasive intelligence.
The IC and SoC design excellence requires technologies for custom IC, digital IC design and signoff, and functional verification, and leverages pre-built semiconductor IP. These tools, IP and associated services are specifically designed to meet the growing requirements of engineers designing increasingly complex chips across analog, digital and mixed-signal domains, and perform the associated verification tasks, including validation of low-level software running on the silicon model, thereby enabling design teams to manage complexity and verification throughput without commensurately increasing the team size or extending the project schedule, while reducing technical risks.
The second layer of our strategy centers around system innovation. It includes tools and services used for system design of the packages that encapsulate the ICs and the PCBs, system simulation which includes electromagnetic, electro-thermal and other multi-physics analysis necessary as part of optimizing the full system’s performance, radio frequency (“RF”) and microwave systems, and embedded software.
The third layer of our strategy addresses pervasive intelligence in new electronics. It starts with providing solutions and services to develop AI-enhanced systems and includes machine learning and deep learning capabilities being added to the Cadence® technology portfolio to make IP and tools more automated and to produce optimized results faster.
Our software and emulation products also support cloud access to address the growing computational needs of our customers.
Recent Acquisitions
During fiscal 2021, we continued to execute our Intelligent System Design strategy and expanded our product offerings and solutions into computational fluid dynamics (“CFD”) with our acquisitions of Belgium-based NUMECA International, a leader in CFD technology, and Pointwise, Inc, a leading provider of CFD meshing technology. The addition of these technologies and talent broadens our System Design and Analysis portfolio and expertise.
Chief Executive Officer Transition
On December 15, 2021, Anirudh Devgan assumed the role of President and Chief Executive Officer of Cadence, replacing Lip-Bu Tan. Prior to his role as Chief Executive Officer, Dr. Devgan served as President of Cadence. Concurrently, Mr. Tan transitioned to the role of Executive Chair.
Business Drivers
Our products and services enable our customers to design complex and innovative electronic products that are accelerated by the growing digital transformation. Demand for our technology and expertise is driven by increasing complexity and our customers’ investment in new designs and products. The most promising new opportunities for us involve enabling the design of electronic systems for consumers, including augmented reality (“AR”), virtual reality (“VR”), and industrial internet of things (“IIoT”), hyperscale computing (including data center infrastructure), AI, edge computing, mobile, communications (including 5G networks), automotive, aerospace and defense, and industrial and healthcare subsystems. Large and existing electronics categories, such as data center infrastructure, mobile, smartphones and networking products continue to provide business opportunities for us as customers initiate new design projects.
Underlying the requirements within any particular vertical market sector is the availability of rapidly improving IC manufacturing technology. In order for our customers to take advantage of such advancements, some of our products need to first incorporate new capabilities such that they can exploit new manufacturing capabilities. This dependency means that we must invest significantly in product research and development (“R&D”) to keep pace with the latest manufacturing technology. The demand for new IC manufacturing technology directly impacts the demand for our newest products.
Another driver for our business is the differentiation, capabilities and benefits provided to our customers by our products. With the rapid pace of innovation comes the opportunity for our products to address growing key challenges associated with electronic product creation, such as power consumption, performance, chip area and cost. Our products and services have unique attributes that our customers value. In general, these attributes can be grouped into broader categories such as quality of results (“QoR”) (in terms of power consumption, performance and chip area), engineering productivity, tool performance, manufacturing, reliability, and faster time to market. Many of these attributes contribute to the sustainability of our planet by enabling our customers to create innovative products that optimize power, space and energy needs. We are applying machine learning or computational software techniques within our products to enhance QoR, productivity, performance, manufacturing, reliability and methodology.
Products and Product Strategy
Our Intelligent System Design strategy enables our customers to address a broad range of challenges that arise as they develop electronic products. Our solutions are categorized according to the role they play in the electronic product design process. We group our products into categories related to major design activities, including Custom IC Design and Simulation, Digital IC Design and Signoff, Functional Verification, IP, and System Design and Analysis.
Custom IC Design and Simulation
Our custom IC design and simulation offerings are used by our customers to create schematic and physical representations of circuits down to the transistor level for analog, mixed-signal, custom digital, memory and RF designs. These representations are verified using simulation tools optimized for each type of design, including the design capture environment, simulation and IC layout within the Virtuoso® custom IC design platform. Other tools in the custom IC portfolio are used to prepare the designs for manufacturing.
The Virtuoso Advanced-Node Platform adds functionality to the base Virtuoso package to enable the use of three-dimensional transistors (“FinFETs”), multi-patterning and other technologies required for advanced designs. The Virtuoso RF Solution addresses the challenges of RF design across chip, package and board. The Spectre® Simulation Platform provides large-scale verification simulation. The Virtuoso System Design Platform enables engineers to design and verify concurrently across the chip, package and board.
Digital IC Design and Signoff
Our digital IC design and signoff solutions are used to create logical representations of a digital circuit or an IC that can be verified for correctness prior to implementation (please refer to the discussion under “Functional Verification” below). Once the logic is verified, the design representation is implemented, or converted to a format ready for silicon manufacturing, using additional software tools within this category. The manufacturing representation is also analyzed and verified. Our digital IC design and signoff technology suite provides a full flow to achieve power, performance and area (“PPA”) design targets, and includes three major categories: logic design, physical implementation and signoff.
Our logic design offering is comprised of logic synthesis, test and equivalence checking capabilities and is typically used by customers to create and verify designs in conjunction with our functional verification capabilities. The offering includes the Genus™ Synthesis Solution, a logic synthesis offering that provides fast throughput while also offering high quality results, and the Joules™ RTL Power Solution, which delivers fast power analysis while preserving near-signoff accuracy. We also offer the Modus software solution, which reduces SoC design-for-test time.
Our physical implementation offering comprises tools used near the end of the design process, including place and route, optimization and multi-patterning preparation. The Innovus™ Implementation System is a physical implementation offering that delivers fast design turnaround time while also delivering improved PPA characteristics. This offering enables customers to address the technology challenges of the latest semiconductor advanced-process nodes, create a physical representation of logic models and prepare a design for signoff.
Our signoff offering is comprised of tools used to sign off the design as ready for manufacture by a semiconductor foundry, which provides certification for this step. This offering includes the Tempus™ Timing Signoff Solution, Voltus™ Power Integrity Solution, Quantus™ Extraction Solution and Pegasus™ Physical Verification System. Our design-for-manufacturing products are also included in our signoff offering and are used by customers to address manufacturing and yield issues as early in the product development process as possible.
Functional Verification
Functional verification products are used by our customers to effectively and efficiently verify that the circuitry or the software they have designed is consistent with the functional specification. Verification is largely done throughout the design process, with the objective of identifying as many potential functional problems as possible before manufacturing the circuitry, thereby significantly reducing the risk of discovering a costly error in the completed product.
Our Verification Suite™ includes four primary verification engines, starting with the JasperGold® Formal Verification Platform and Xcelium™ Parallel Logic Simulation Platform, which are used in the early stages of design verification, often at the IP and subsystem level. Once the design is more mature, with early formal and simulation verification tasks performed, verification engineers deploy our Palladium® Enterprise Emulation Platform and Protium™ FPGA-Based Prototyping Platforms for more comprehensive chip verification, often running low-level embedded software on top of a model of the chip, to provide for proper functionality before silicon manufacturing.
These engines are used for early bug detection, verification of block-level functionality, verification acceleration and emulation of system-level functionality, system-level power exploration, analysis and optimization, and system-level prototyping for hardware/software co-verification. Our Palladium platform provides high throughput, capacity, data center reliability and workgroup productivity to enable global design teams to develop advanced hardware-software systems. The Protium platform leverages a common front end with the Palladium environment to move designs rapidly from emulation to the prototyping stage, allowing for software development to start weeks to months earlier than otherwise possible.
These engines are also supported by other verification tools that provide an environment that allows for effective verification throughput and management, including verification planning and metric tracking, testbench automation, debugging and software-driven tests, enabling our customers to coordinate verification activities across multiple verification engines, teams and locations for effective verification closure.
IP
Our IP offerings consist of pre-verified, customizable functional blocks, which customers integrate into their ICs to accelerate the development process and to reduce the risk of errors in the design process. We offer many types of IP, including Tensilica® configurable digital signal processors (“DSPs”), vertically targeted subsystems for AI, audio/voice, baseband and vision/imaging applications, controllers and physical interfaces for standard protocols and analog IP. Our design IP portfolio also includes solutions for high speed SerDes, PCI, USB and many other standards.
We also offer a broad range of Verification IP (“VIP”) with memory models, which model the expected behavior of many industry standard protocols when used with verification solutions and are complementary to our design IP offerings. Our VIP and accelerated VIP are used with our full suite of functional verification engines to emulate and model the expected behavior and interaction of standard industry system interface protocols including DDR, USB, and PCI Express® in silicon. Our customers also use our System VIP offerings to perform full system-level chip verification.
System Design and Analysis
Our system design and analysis offerings are used by our customers to develop PCBs and advanced IC packages and to analyze electromagnetic, electro-thermal and other multi-physics effects.
The capabilities in the Allegro® System Design Platform include PCB authoring and implementation, IC package and system-in-package design, signal and power integrity analysis, and PCB library design management and collaboration. The need for compact, high-performance mobile, consumer and automotive design with advanced serial interconnect is driving the technology evolution for our PCB offerings. For mainstream PCB customers, where individual or small team productivity is a focus, we provide the OrCAD® family of offerings that is primarily marketed worldwide through a network of resellers.
The speed and close proximity of signals on silicon, through packages to boards, and through connectors and cables, exposes these communications to various kinds of interference, generates heat and emits electromagnetic radiation. Careful analysis is required for these systems to work as designed under a wide range of operating conditions and within compliance of standards and laws. The complexity of these devices and signal transmissions requires analysis and simulation throughout the product lifecycle to meet these objectives. Our Clarity™ 3D Solver for electromagnetic and power electronics analysis and simulation, as well as our Celsius™ Thermal Solver, provide the foundation for multi-physics analysis technology, with complete electrical-thermal co-simulation for electronic systems from ICs to physical enclosures.
The addition of our CFD solution expands our ability to meet the growing design challenges of electronic and systems companies. Our CFD solution enables our customers to extend their multi-physics analysis workflows to address simulation and analysis challenges for applications such as aerodynamics, hydrodynamics, propulsion, heat transfer, and combustion.
Product Arrangements
We primarily license our software using time-based licenses. Our time-based license arrangements offer customers the right to access and use all of the products delivered at the outset of an arrangement and updates throughout the entire term of the arrangement, which is generally two to three years, with no rights to return. Our updates provide for continued access to our evolving technology as our customers’ designs migrate to more advanced nodes. In addition, certain time-based license arrangements include the right for the customer to remix among the products delivered at the outset of the arrangement and use unspecified additional products that become commercially available during the term of the arrangement.
A small portion of our software is licensed under perpetual licenses, which does not include the right to use new technology. Payment terms for time-based licenses generally provide for payments to be made over the license period, and payment terms for perpetual licenses generally are net 30 days.
The Cadence Cloud portfolio, consisting of Cadence-managed and customer-managed environments for electronic product developers using the scalability of the cloud, continues to expand, with additional cloud-ready products added or under development in fiscal 2021. Contractual arrangements with customers for both environments are time-based, similar to the on-premises software license arrangements described above, and may also include usage-based terms.
Our emulation and prototyping hardware products are either sold or leased to our customers. Our emulation hardware can also be accessed remotely via a Cadence-managed cloud arrangement.
We generally license our design IP under nonexclusive license agreements that provide usage rights for specific designs. Some customers enter into a non-cancellable IP Access Agreement (“IPAA”), whereby the customer commits to a fixed dollar amount over a specified period of time that can be used to purchase from a list of IP products or services. In addition, for certain IP license agreements, we collect royalties as our customers ship their product that includes our IP to their customers.
For a further description of our license agreements, our emulation and prototyping hardware sale or lease agreements, revenue recognition policies and results of operations, please refer to the discussion under “Critical Accounting Estimates” under Part II, Item 7, “Management’s Discussion and Analysis of Financial Condition and Results of Operations.”
Technical Support and Maintenance
Customer service and support is critical to the adoption and successful use of our products. We provide our customers with technical support and maintenance to facilitate their use of our software, hardware and IP solutions.
Our education services offerings can be customized and include training programs that are delivered online, app-based, or in a classroom setting. The content of these offerings ranges from the latest design techniques to methodologies for using the most recent features of our products. The primary focus of education services is to accelerate our customers’ path to productivity in the use of our products.
Our Learning and Support System gives customers easy access to extensive online training and webinar offerings to support the increase in the number of our customers’ employees working from home.
Services
We offer a number of services, including services related to methodology, education and hosted design solutions. These services may be sold separately or sold and performed in conjunction with the license, sale or lease of our products. As necessary, specialized design services engineers are assigned to internal R&D projects associated with our design IP business.
As part of our services offerings, we design advanced ICs, develop custom IP and help customers address design challenges. This enables us to target and accelerate the development of new software technology and products to satisfy current and future design requirements.
We offer engineering services to collaborate with our customers in the design of complex ICs and the implementation of key design capabilities, including low power design, IC packaging and board design, functional verification, digital implementation, analog/mixed-signal design and system-level design. The customers for these services primarily consist of semiconductor and systems companies developing products for the consumer, hyperscale computing, 5G communications, mobile automotive, aerospace and defense, industrial and healthcare verticals. These ICs range from digital SoCs and analog and RF designs to complex mixed-signal ICs.
In delivering methodology services, we leverage our experience and knowledge of design techniques, our products, leading practices and different design environments to improve the productivity of our customers’ engineering teams. Depending on the customers’ projects and needs, we work with customers using outsourced, consultative and collaborative offerings.
Third-Party Programs and Initiatives
In addition to our products, many customers use design tools that are provided by other companies, as well as design IP available from alternative suppliers. We support the use of third-party design products and design IP through our Cadence Connections® program and through our participation in industry groups such as the Silicon Integration Initiative and Accellera System Initiative. We actively contribute to the development and deployment of industry standards.
We also have a strategic partnership with Green Hills Software, an industry leader in embedded safety and security software solutions.
Product and Maintenance and Services Revenue
Revenue, and revenue as a percentage of total revenue, from our product and maintenance and services offerings for the last three fiscal years were as follows:
| | | | | | | | | | | | | | | | | | | | | | | | | | | | | | | | | | | |
| 2021 | | 2020 | | 2019 |
| (In millions, except percentages) |
| Product and maintenance | $ | 2,813 | | | 94 | % | | $ | 2,537 | | | 95 | % | | $ | 2,204 | | | 94 | % |
| Services | 175 | | | 6 | % | | 146 | | | 5 | % | | 132 | | | 6 | % |
| Total revenue | $ | 2,988 | | | | | $ | 2,683 | | | | | $ | 2,336 | | | |
In any fiscal year, we expect between 85% and 90% of our annual revenue to be characterized as recurring revenue. Revenue characterized as recurring includes revenue recognized over time from our software arrangements, services, royalties, maintenance on IP licenses and hardware, operating leases of hardware and revenue recognized at varying points in time over the term of our IP Access Agreements that include non-cancellable commitments from customers.
The remainder of our revenue is recognized at a point in time and is characterized as up-front revenue. Up-front revenue is primarily generated by our sales of emulation and prototyping hardware and individual IP licenses. The percentage of our recurring and up-front revenue and fluctuations in revenue within our geographies are impacted by delivery of hardware and IP products to our customers in any single fiscal period.
For additional information and analysis on our revenue, including revenue by geography, see the discussion under “Results of Operations” under Part II, Item 7, “Management’s Discussion and Analysis of Financial Condition and Results of Operations.” For our fiscal 2021 results of operations and our financial position as of January 1, 2022, see Part IV, Item 15, “Exhibits and Financial Statement Schedules.”
Remaining Performance Obligations
Revenue allocated to remaining performance obligations represents the transaction price allocated to the performance obligations that are unsatisfied, or partially unsatisfied, which includes unearned revenue and amounts that will be invoiced and recognized as revenue in future periods. We have elected to exclude the potential future royalty receipts from the remaining performance obligations. Contracted but unsatisfied performance obligations were approximately $4.4 billion as of January 1, 2022, which included $119.5 million of non-cancellable IPAA commitments from customers where actual product selection and quantities of specific products or services are to be determined by customers at a later date. As of January 1, 2022, we expected to recognize approximately 55% of the contracted but unsatisfied performance obligations, excluding non-cancellable IPAA commitments, as revenue over the next 12 months and the remainder thereafter.
Marketing and Sales
We generally market our products and provide services to existing and prospective customers through a direct sales force consisting of sales people and applications engineers. Applications engineers provide technical pre-sales and post-sales support for our products. Due to the complexity of many of our products and the system design process, the sales cycle is generally long, requiring three to six months or more. During the sales cycle, our direct sales force generally provides technical presentations, product demonstrations and support for on-site customer evaluation of our solutions. We also promote our products and services through advertising, marketing automation, trade shows, public relations and the internet. We selectively utilize value-added resellers to broaden our reach and reduce cost of sales. Our OrCAD products and certain Allegro products are primarily marketed through these channels. With respect to international sales, we generally market and support our products and services through our subsidiaries. We also use a third-party distributor to license our products and services to certain customers in Japan.
Research and Development
Our future performance depends on our ability to innovate, commercialize newly developed solutions and enhance and maintain our current products. The primary areas of our R&D align with our product categories discussed above. We must continuously adapt our products to solve new or increased physics challenges that arise with each successive process node and address the increase in complexity that is introduced by the resulting much larger designs. We must also keep pace with our customers’ technical developments, satisfy industry standards and meet our customers’ increasingly demanding performance, productivity, quality and predictability requirements. Therefore, we expect to continue to invest in R&D.
Hardware Manufacturing and Software Distribution
Our emulation and prototyping hardware, including all individual PCBs, custom ICs and FPGA-based prototyping components, is manufactured, assembled and tested by subcontractors before delivery to our customers. Software and documentation are primarily distributed to customers by secure electronic delivery.
Proprietary Technology
Our success depends, in part, upon our proprietary technology. We generally rely on patents, copyrights, trademarks and trade secret laws, licenses and restrictive agreements to establish and protect our proprietary rights in technology and products. Many of our products include software or other IP licensed from third parties. We may have to seek new licenses or renew existing licenses for third-party software and other IP in the future. As part of performing engineering services for customers, our engineering services business uses certain software and other IP licensed from third parties, including that of our competitors.
Governmental Regulations
We are subject to a variety of federal, state, local and foreign laws and regulations relating to our business and operations. These include, but are not limited to, laws and regulations related to import and export controls, anti-corruption, competition, data privacy, and employment. For example, we are subject to the regulations of the United States and certain other jurisdictions in selling or shipping our products and technology outside the United States and to foreign nationals, including tariffs, trade protection measures, import or export licensing requirements, sanctions and other trade regulations, such as the U.S. Export Administration Regulations including “Entity List” restrictions imposed by the Bureau of Industry and Security (“BIS”) of the U.S. Department of Commerce (“DOC”). Import/export regulations limiting or banning sales into certain countries or to certain companies have impacted our ability to transact business in certain countries and with certain customers. Future export regulations may also impact our ability to transact business with certain customers and in certain countries and may restrict certain non-U.S. person employees from performing their duties at Cadence without first obtaining appropriate authorization if their duties involve an export, reexport, or transfer of export-controlled technology. In addition, as a result of our international operations, we are subject to laws and regulations, such as the U.S. Foreign Corrupt Practices Act, the U.K. Bribery Act and other local laws, prohibiting corrupt payments to governmental officials, as well as anti-competition regulations. We are also subject to laws and regulations governing data privacy in the U.S. and other jurisdictions, such as the General Data Protection Regulation (“GDPR”) in the European Union.
These laws and regulations are complex and may change or develop over time, sometimes with limited notice. We may incur significant expenditures in future periods related to compliance, which could restrict our business operations. For more information on risks related to these regulations, see the relevant discussions throughout Item 1A, "Risk Factors."
Competition
We compete most frequently with Synopsys, Inc., Siemens EDA, and ANSYS, Inc., and also with numerous other tools providers, electronics device manufacturers with their own EDA capabilities, technical or computational software companies, electronics design and consulting companies, and other IP companies. These include U.S. based companies such as Keysight Technologies, Inc. and CEVA, Inc., and foreign companies such as Altium Limited (Australia), Zuken Ltd. (Japan), and emerging competitors in China like Huada Empyrean, Xpeedic, X-EPIC, Primarius Technologies and Giga-DA.
Certain competitive factors in the engineering services business differ from those of the products businesses. While we compete with other computational software companies in the engineering services business, our principal competitors include independent engineering service businesses. Many of these companies are also customers, and therefore use our product offerings in the delivery of their services or products.
For more information on risks related to competitive factors affecting our business, see the relevant discussions throughout Item 1A, “Risk Factors.”
Human Capital Resource Management
Our future success is inextricably linked to our ability to attract, retain and develop exceptional talent globally. To facilitate talent attraction and retention, we invest in key initiatives including, but not limited to, furthering diversity, equity and inclusion, physical and mental health, and talent development. To measure engagement and collect feedback from our employees, we administer regular employee engagement surveys. Our cultural tenet is “One Team – One Cadence.” This culture-first message underpins our belief that a diverse, highly supported and engaged workforce is critical to the foundation of our business success.
Employees
Our employees represent the best and brightest in our industry, and the talent we select to be a part of our team defines our culture and success. As of January 1, 2022, we had approximately 9,300 employees. Our global workforce is highly educated, technical and specialized, with a substantial majority of employees working in technical roles.
Diversity, Equity and Inclusion
We believe that workforce diversity, equity and inclusion advance high performance and innovation. We recognize that gender and racial disparities remain a challenge in the technology field, and with a high proportion of technical employees, we are deeply committed to addressing this issue and have appointed executive sponsors to drive this commitment throughout our company. Some of our key programs and initiatives aimed at addressing this issue include:
•Regular monitoring of the diversity of our current workforce and candidate pool, with an aim to identify and address areas where we can improve.
•Partnerships with organizations such as National Society of Black Engineers, Society of Hispanic Professional Engineers, Out in Tech, National GEM Consortium, and Society of Women Engineers to advance our inclusion efforts. These partnerships allow us to do more targeted recruiting, outreach and engagement with these communities.
•An Advanced Leadership Program for top women, Black and Latinx talent, which provides specialized coaching, workshops and career opportunities.
•An IMPACT mentorship program which gives women, U.S. Black and Latinx employees an opportunity to choose a meaningful mentor.
•Unconscious bias and inclusive leadership training and resources for managers.
•Inclusion groups for Black, Latinx, LGBTQ+, Veterans and women employees and allies which host networking events to foster dialogue and promote awareness.
Health, Safety and Wellness
We strive to create a safe and rewarding environment to enable our employees to develop the innovations necessary for our sustained success.
To provide for both the physical and mental health of our employees, we offer a variety of benefits that go beyond traditional health insurance. Our U.S. health and well-being benefits include fertility benefits, coverage for transgender employees undergoing medical treatment, expanded new parent leave, adoption and surrogacy benefits, financial planning and coaching services, and legal services. We also provide training and tools for stress management, time management, conflict resolution and emotional well-being.
The vast majority of our employees continued to work from home during fiscal 2021. To promote health and well-being during the challenges brought on by the COVID-19 pandemic, we provided employees with additional time off to focus on themselves and their families and provided global employee assistance programs to connect employees and their families with resources, information and counseling to address the challenges caused by the pandemic, such as increased anxiety or stress.
Compensation and Benefits
To inspire and recognize our employees, we offer competitive compensation and benefits programs. Our compensation programs link employee compensation to our business and individual performance. We also offer a semi-annual bonus program, 401(k) match, Employee Stock Purchase Plan and equity compensation. In addition, our employees are eligible to receive monetary awards from their colleagues through our peer-to-peer recognition program.
Talent Development
To help employees succeed in their current roles, pursue their passions and develop the skills necessary for advancement, we provide formal training programs and curriculums in addition to on-the-job training. Our High-Performance Culture portal provides our employees with valuable resources such as a comprehensive online Learning Management program with training and development tools on a broad range of topics and skills. We also offer tuition reimbursement opportunities to employees continuing in fields relevant to their job.
Community Outreach
We believe it is important that we create meaningful opportunities for employees to connect and contribute to their community. We provide opportunities for paid volunteer time off annually, charitable contribution matching, company-wide volunteer campaigns and international service immersion projects.
During fiscal 2021, we formed the Cadence Giving Foundation with the goal of giving back to the communities where we live and work. This stand-alone, non-profit foundation will partner with other charitable initiatives to support critical needs in areas such as diversity, equity and inclusion, environmental sustainability and science, technology, engineering, and mathematics (“STEM”) education.
Corporate Responsibility
We believe that, in general, the best and brightest talent is inclined to build a career with a responsible organization that positively impacts society. Among our efforts to be that type of organization, we recognize that climate change is one of the greatest challenges of our time, and we are committed to doing our part to contribute to the health of the planet by actively investing in initiatives to reduce our environmental footprint. Through these initiatives, we plan to reduce our scope 1 and scope 2 greenhouse gas emissions 25% by 2025, over our 2019 baseline. We encourage you to review our 2020 Sustainability Report (located at www.cadence.com), and our 2021 Sustainability Report when released, for more information on all of our Environmental, Social and Governance (“ESG”) initiatives.
Corporate Information
Our headquarters is located at 2655 Seely Avenue, San Jose, California 95134. Our telephone number is (408) 943-1234. We use our website at www.cadence.com to communicate important information about our company, including news releases and financial information. Our website permits investors to subscribe to email notification alerts when we post new material information on our website. We also make available on our investor relations webpage, free of charge, copies of our SEC filings and submissions, which can be found at the SEC’s website, www.sec.gov, as soon as reasonably practicable after electronically filing or furnishing such documents with the SEC. Stockholders may also request copies of these documents by writing to our Corporate Secretary at the address above. Website references are provided throughout this document for convenience only. The contents of these websites do not constitute a part of this Annual Report and shall not be deemed incorporated by reference into this Annual Report unless expressly noted.
Fiscal Year End
Our fiscal years are 52- or 53-week periods ending on the Saturday closest to December 31. Fiscal 2021 was a 52-week fiscal year, compared to 2020, which was a 53-week fiscal year.
INFORMATION ABOUT OUR EXECUTIVE OFFICERS
The following table provides information regarding our executive officers as of February 22, 2022:
| | | | | | | | | | | | | | |
| Name | | Age | | Positions and Offices |
| Anirudh Devgan | | 52 | | President and Chief Executive Officer |
| John M. Wall | | 51 | | Senior Vice President and Chief Financial Officer |
| Thomas P. Beckley | | 64 | | Senior Vice President and General Manager of the Custom IC and PCB Group |
| Paul Cunningham | | 44 | | Senior Vice President and General Manager of the System and Verification Group |
| Alinka Flaminia | | 60 | | Senior Vice President, Chief Legal Officer and Corporate Secretary |
| Chin-Chi Teng | | 56 | | Senior Vice President and General Manager of the Digital and Signoff Group |
| Neil Zaman | | 53 | | Senior Vice President and Chief Revenue Officer |
Our executive officers are appointed by the Board of Directors and serve at the discretion of the Board of Directors.
ANIRUDH DEVGAN has served as Chief Executive Officer of Cadence since December 2021 and President of Cadence since November 2017. From May 2012 to November 2017, Dr. Devgan held several positions at Cadence, most recently as Executive Vice President, Research and Development from March 2017 to November 2017 and Senior Vice President, Research and Development from November 2013 to March 2017. Prior to joining Cadence, from May 2005 to March 2012, Dr. Devgan served as Corporate Vice President and General Manager of the Custom Design Business Unit at Magma Design Automation, Inc., an EDA company. Dr. Devgan has a B.Tech. in electrical engineering from the Indian Institute of Technology, Delhi, and an M.S. and Ph.D. in electrical and computer engineering from Carnegie Mellon University.
JOHN M. WALL has served as Senior Vice President and Chief Financial Officer of Cadence since October 2017. From October 2000 to September 2017, Mr. Wall held several positions at Cadence, most recently as Corporate Vice President and Corporate Controller from April 2016 to October 2017, Vice President, Finance and Operations, Worldwide Revenue Accounting and Sales Finance from 2015 to 2016 and Vice President, Finance and Operations, EMEA and Worldwide Revenue Accounting from 2005 to 2015. Mr. Wall has an NCBS from the Institute of Technology, Tralee and is a Fellow of the Association of Chartered Certified Accountants.
THOMAS P. BECKLEY has served as Senior Vice President and General Manager of the Custom IC and PCB Group of Cadence since 2018. From September 2012 to September 2018, Mr. Beckley served as Senior Vice President, Research and Development of Cadence. From April 2004 to September 2012, Mr. Beckley served as Corporate Vice President, Research and Development of Cadence. Prior to joining Cadence, Mr. Beckley served as President and Chief Executive Officer of Neolinear, Inc., a developer of auto-interactive and automated analog/RF tools and solutions for mixed-signal design that was acquired by Cadence in April 2004. Mr. Beckley has a B.S. in mathematics and physics from Kalamazoo College and an M.B.A. from Vanderbilt University.
PAUL CUNNINGHAM has served as Senior Vice President and General Manager of the System and Verification Group since March 2021. From August 2011 to March 2021, Mr. Cunningham held several positions at Cadence, most recently as Corporate Vice President of the System Verification Group beginning January 2018. Prior to joining Cadence, Mr. Cunningham was co-founder and Chief Executive Officer of Azuro, Inc., a clock concurrent optimization company, that Cadence acquired in July 2011. Mr. Cunningham has an M.A. and Ph.D. in computer science from the University of Cambridge in the United Kingdom.
ALINKA FLAMINIA has served as Senior Vice President, Chief Legal Officer and Corporate Secretary of Cadence since June 2020. Prior to joining Cadence, Ms. Flaminia served as Senior Vice President, General Counsel and Corporate Secretary of Mellanox Technologies Ltd., a supplier of intelligent interconnect solutions, from September 2016 until its acquisition by NVIDIA Corporation in April 2020. She also served as General Counsel and Corporate Secretary of PMC-Sierra, Inc., a semiconductor company, from 2007 until its acquisition by Microsemi Corporation in 2016. Ms. Flaminia has a B.A. from Yale University, and a J.D. from Colorado University, School of Law.
CHIN-CHI TENG has served as Senior Vice President and General Manager of the Digital and Signoff Group of Cadence since September 2018. From January 2002 to September 2018, Dr. Teng held several positions at Cadence, most recently as Corporate Vice President, Research and Development from June 2015 to September 2018, and Vice President, Research and Development from March 2009 to June 2015. Dr. Teng has a B.S. in electrical engineering from the National Taiwan University and a Ph.D. in electrical and computer engineering from the University of Illinois, Urbana-Champaign.
NEIL ZAMAN has served as Chief Revenue Officer since October 2020 and as Senior Vice President, Worldwide Field Operations since September 2015. From October 1999 to September 2015, Mr. Zaman held several positions at Cadence, most recently as Corporate Vice President, North America Field Operations. Prior to joining Cadence, Mr. Zaman held positions at Phoenix Technologies Ltd., a developer of core system software, and IBM Corporation, a technology and consulting company. Mr. Zaman has a B.S. in finance from California State University, Hayward.
Item 1A. Risk Factors
Our operations and financial results are subject to various risks and uncertainties, including those described in the sections below, that could adversely affect our business, financial condition, results of operations, cash flows, liquidity, revenue, growth, prospects, demand, reputation, and the trading price of our common stock, and make an investment in us speculative or risky. The following does not summarize all of the risks that we face, and there may be additional risks or uncertainties that are currently unknown or not believed to be material that occur or become material.
Business and Operational Risks
The ongoing COVID-19 pandemic could continue to adversely affect our business, results of operations and financial condition.
We are unable to accurately predict the full impact that the COVID-19 pandemic will have on our results of operations, financial condition, liquidity and cash flows due to numerous uncertainties, including the duration and severity of the pandemic, the impact of COVID-19 variants, and the distribution, acceptance and effectiveness of vaccines and containment measures. Our compliance with these measures has impacted our day-to-day operations and could disrupt our business and operations, as well as that of our key customers, suppliers (including contract manufacturers) and other counterparties, for an indefinite period of time. To support the health and well-being of our employees, customers, partners and communities, a vast majority of our employees are still working remotely as of February 22, 2022. However, we have begun a limited pilot program for employees to begin voluntarily returning to work in certain jurisdictions with lower rates of new COVID-19 cases and higher vaccination rates.
The disruptions to our operations caused by COVID-19 may result in inefficiencies, delays and additional costs in our product development, sales, marketing and customer service efforts that we cannot fully mitigate through remote or other alternative work arrangements. In addition, we have experienced, and may continue to experience, some volatility in our hardware product delivery times due to delays in obtaining access to customer sites. Volatile surges in demand and in infection rates may also result in the unavailability, delay, or congestion of, and increased costs for, transportation and the raw materials, inputs, and other matters used in our business and by our customers. Moreover, access by our employees to our laboratory facilities that are necessary for the development of certain IP products has been and may in the future be disrupted due to local conditions.
More generally, the impact of the pandemic may increase the possibility of an extended global economic downturn and extended periods of high inflation, and has caused volatility in financial markets, which could affect demand for our products and services and impact our results and financial condition even after the pandemic is contained and local conditions improve. For example, we may be unable to collect receivables from those customers significantly impacted by COVID-19 and, in fact, have received and may continue to receive, requests from our customers to delay their payments to us, while we continue to provide services to these customers. Also, a decrease in orders in a given period could negatively affect our revenues in future periods, particularly if experienced on a sustained basis, because a substantial proportion of our software licenses yield revenue recognized over time. The pandemic may also have the effect of heightening many of the other risks described in this “Risk Factors” section, including risks associated with our customers and supply chain. We will continue to evaluate the nature and extent of the impact of COVID-19 to our business.
We have experienced varied operating results, and our operating results for any particular fiscal period are affected by the timing of revenue recognition, particularly for our emulation and prototyping hardware and IP products.
Historical results of operations should not be viewed as reliable indicators of our future performance. Various factors affect our operating results, and some of them are not within our control. Our operating results for any period are affected by the mix of products and services sold in a given period and the timing of revenue recognition, particularly for our emulation and prototyping hardware and IP products. In addition, we have recorded net losses in the past and may record net losses in the future. Also, our cash flows from operating activities have and will continue to fluctuate due to a number of factors, including the timing of our billings, collections, disbursements and tax payments.
A substantial portion of the product revenue related to our hardware business and our IP offerings is recognized upon delivery, and our forecasted revenue results are based, in part, on our expectations of hardware and IP to be delivered in a particular quarter. Therefore, changes in hardware and IP bookings or deliveries relative to expectations will have a more immediate impact on our revenue than changes in software or services bookings, for which revenue is generally recognized over time.
As we continue to expand our IP offerings, a portion of the revenue related to our IP bookings will be deferred until we complete and deliver the licensed IP to our customers. As a result, costs related to the research and development of the IP may be incurred prior to the recognition of the related revenue.
Revenue related to our hardware and IP products is inherently difficult to predict because sales of our hardware and IP products depend on the commencement of new projects for the design and development of complex ICs and systems by our customers, our customers’ willingness to expend capital to deploy our new and existing hardware or IP products in those projects and the availability of our new and existing hardware or IP products for delivery. Therefore, our hardware or IP sales may be delayed or may decrease if our customers delay or cancel projects because their spending is constrained or if there are problems or delays with the supply, delivery or installation of our hardware or IP products or our hardware suppliers. Moreover, the hardware and IP markets are highly competitive, and our customers may choose to purchase a competitor’s hardware or IP product based on cost, performance or other factors. These factors may result in lower revenue, which would have an adverse effect on our business, results of operations or cash flows.
A substantial proportion of our software licenses yield revenue recognized over time, which may make it difficult for us to rapidly increase our revenue in future fiscal periods, and means that a decrease in orders in a given period would negatively affect our revenues in future periods.
We plan our operating expenses based on forecasted revenue, expected business needs and other factors such as changes in inflation. These expenses and the effect of long-term commitments are relatively fixed in the short term. Bookings and the related revenue are harder to forecast in a difficult economic environment. If we experience a shortfall in bookings, our operating results could differ from our expectations because we may not be able to quickly reduce our expenses in response to short-term business changes. Our operating expenses are also impacted by economic conditions, such as inflation. Unexpected increases in inflation could cause our expenses to increase at a rate faster than our product pricing to recover such increases.
The methods, estimates and judgments that we use in applying our accounting policies have a significant impact on our results of operations (see “Critical Accounting Estimates” under Part II, Item 7, “Management’s Discussion and Analysis of Financial Condition and Results of Operations”). Such methods, estimates and judgments are, by their nature, subject to substantial risks, uncertainties and assumptions, and factors may arise over time that may lead us to change our methods, estimates and judgments. Changes in those methods, estimates and judgments could significantly affect our results of operations.
Any periods of uncertainty in the global economy and international trade relations, changes in governmental policies relating to technology, and any potential downturn in the semiconductor and electronics industries, may negatively impact our business and reduce our bookings levels and revenue.
Purchases of our products and services are dependent upon the commencement of new design projects by IC manufacturers and electronics systems companies. The IC and electronics systems industries are cyclical and are characterized by constant and rapid technological change, rapid product obsolescence and price erosion, evolving standards, short product life cycles and wide fluctuations in product supply and demand.
The IC and electronics systems industries have also experienced significant downturns in connection with, or in anticipation of, maturing product cycles of both these industries’ and their customers’ products. The current outlook for the global economy is uncertain and may result in a decrease in spending on our products and services despite recent growth.
Uncertainty about future political and economic conditions, adverse changes to international trade relationships between countries in which we do business or future decline in corporate or consumer spending could negatively impact our customers’ businesses, reducing the number of new chip designs and their overall research and development spending, including their spending on our products and services, and as a result decrease demand for our products and services. Decreased bookings for our products and services, customer bankruptcies, consolidation among our customers, or problems or delays with our hardware suppliers or with the supply or delivery of our hardware products could also adversely affect our ability to grow our business or adversely affect our future revenues and financial results. Our future business and financial results, including demand for our products and services, are subject to considerable uncertainties that could impact our stock price. If economic conditions or international trade relationships between countries in which we do business deteriorate in the future, or, in particular, if semiconductor or electronics systems industry revenues do not grow, including as a result of the current global semiconductor shortage extending or intensifying, the ability to export or import products or services by the semiconductor or electronics systems industry is adversely restricted, or our supplies of hardware components and products are subject to problems or delays, we may be adversely affected.
We are subject to governmental export and import controls that could subject us to liability or impair our ability to compete in global markets as well as a variety of other laws and regulations.
We must comply with regulations of the United States and of certain other countries in selling or shipping our products and transferring our technology outside the United States, to foreign nationals or across borders. Changes in these regulations or restrictions due to changes in trade relationships with the United States, including new tariffs, trade protection measures, import or export licensing requirements, sanctions, trade embargoes and other trade barriers, could harm our business, operating results or financial condition.
For example, in fiscal 2019, the DOC placed certain entities who are our customers on the “Entity List,” limiting our ability to deliver products and services to these entities. When certain customers are on the Entity List or are subject to new or expanded trade restrictions, such as the expansion in scope by the DOC of the military end-user and military end-use regulations in April 2020 and the foreign-produced direct product rules in August 2020, it will have a negative effect on our ability to sell products and provide services to these customers without first obtaining a license from the BIS. In addition, new or expanded trade restrictions, such as the continued expansion of the military end-user and military end-use rule, the foreign-produced direct product rules, or any future rule that will prevent a class of technology from export to any specific country or countries without a license, will increase our costs or expenses. Entity List restrictions and other trade restrictions may also encourage customers to seek substitute products from our competitors, including a growing class of foreign competitors and open source alternatives, that are not subject to these restrictions or to develop their own solutions, thereby decreasing our long-term competitiveness. In addition, although customers are not prohibited from paying (and we are not restricted from collecting) for products we previously delivered to them, the credit risks associated with outstanding receivables from customers on the Entity List – including receivables from anti-piracy enforcement efforts and litigation settlements – and other trade restrictions could increase as a result of these limitations. In particular, China’s stated national policy to be a global leader in all segments of the semiconductor industry by 2030 has resulted in and may continue to cause increased competitive capability in China.
We cannot predict whether or when any changes will be made that eliminate or decrease these limitations on our ability to sell products and provide services to these Entity List customers or other customers impacted by other trade restrictions. We are unable to predict the duration of the export restrictions imposed with respect to any particular customer or the long-term effects on our business or our customers’ business. Additionally, other companies may be added to the Entity List and/or be subject to new or expanded trade restrictions and restrictions may be imposed against specific countries. In addition, there may be indirect impacts to our business which we cannot reasonably quantify, including that a country-specific export control may limit or prevent our employees who are nationals of the restricted country from performing their duties unless a license can be obtained. Additionally our business may also be impacted by other trade restrictions that may be imposed by the U.S., China, or other countries. Restrictions on our ability to sell and ship our products to customers on the Entity List have had, and may continue to have, an adverse effect on our business, results of operations or financial condition.
Failure to obtain export licenses or restrictions on trade imposed by the United States or other countries could harm our business by rendering us unable to sell or ship products and transfer our technology outside of the United States or across borders. Although we have implemented policies and procedures to help us comply with all applicable trade restrictions, we and governmental authorities have had and may in the future have reason to inquire into particular sales. For example, in February 2021, we received an administrative subpoena from BIS requesting the production of records in connection with certain sales to China. We are cooperating with BIS and are in the process of responding to the subpoena as well as conducting an internal review. Such inquiries are subject to uncertainties and the outcomes of this and other proceedings that may occur are difficult to predict. The laws and policies of the United States and other countries in this area are evolving and changing, and we have experienced and may continue to experience challenges in complying with new rules as they become effective. Any failure or alleged failure to comply with these laws and policies could have negative consequences, including significant legal costs, government investigations, penalties, denial of export privileges and debarment from participation in U.S. government contracts, any of which could have a material adverse effect on our operations, reputation and financial condition.
In addition to export control laws, our global operations are subject to numerous U.S. and foreign laws and regulations, including those related to anti-corruption, tax, corporate governance, financial and other disclosures, competition, data privacy and employment. These laws and regulations are complex and may have differing or conflicting legal standards, making compliance difficult and costly, and changes to these laws may require us to make significant changes to our business operations that may adversely affect our business overall. The policies and procedures we have implemented to assist our compliance with these laws and regulations do not provide complete assurance that our employees, contractors, agents or partners will not violate such laws and regulations. Any violation individually or in the aggregate could have a material adverse effect on our operations, reputation and financial condition.
We have acquired and expect to acquire other companies and businesses and may not realize the expected benefits of these acquisitions.
We have acquired and expect to acquire other companies and businesses in order to expand our product offerings and enter into new markets. Our future revenue growth and expansion of our business is dependent on our successful integration of our acquisitions. We may incur significant costs in connection with potential transactions, including acquisitions that are not consummated. Potential and completed acquisitions involve a number of risks. If any of the following acquisition-related risks occur, our business, operating results or financial condition could be adversely impacted:
•the failure to complete transactions on a timely basis or at all, including as a result of governmental antitrust approval dynamics;
•the failure to realize, or a delay in realizing, anticipated benefits such as cost savings and revenue enhancements;
•overlapping customers and product sets that impact our ability to maintain revenue at historical rates;
•the failure to understand, compete and operate effectively in markets where we have limited experience;
•the failure to integrate, combine or manage acquired products, infrastructure, technologies and businesses effectively;
•difficulties in integrating or retaining employees;
•the substantial diversion of management’s attention from day-to-day business when evaluating and negotiating these transactions and integrating an acquired company or business;
•unanticipated costs or assumed liabilities, including those incurred to remediate issues of an acquired company discovered during due diligence or thereafter, such that we cannot realize the anticipated value of the acquisition; or
•unwillingness of customers of an acquired business to continue licensing or buying products from us.
In a number of our completed acquisitions, we have agreed to make future payments, either in the form of employee retention bonuses or contingent purchase price payments, based on the achievement of specified milestones. The performance goals pursuant to which these future payments may be made generally relate to the achievement by the acquired company or business, or by the employees who joined us with the acquired company or business, of certain specified bookings, revenue, run rate, product proliferation, product development or employee retention goals during a specified period following completion of the applicable acquisition. The specific performance goal levels and amounts and timing of employee bonuses or contingent purchase price payments vary with each acquisition. We may use contingent payments in connection with acquisitions in the future, and we may be required to make certain contingent payments without deriving the value we expect to derive from an acquisition in excess of such payments.
Future acquisitions may involve issuances of stock as full or partial payment of the purchase price for the acquired company or business, grants of restricted stock, restricted stock units or stock options to employees of the acquired companies or businesses (which may be dilutive to existing stockholders), expenditure of substantial cash resources or the incurrence of a material amount of debt. These arrangements may impact our liquidity, financial position and results of operations or increase dilution of our stockholders’ equity interests in the company.
We make and expect to make strategic investments and may not realize the expected benefits of these investments.
We have made and expect to make strategic investments in which we have a minority equity interest and do not have operational control. These strategic investments may also involve collaboration agreements that further and complement our strategy and marketing efforts. We may not be able to realize the expected benefits of these investments, and the related collaborations may be difficult to manage without sole decision-making authority and the economic or business interests in these collaborations may become inconsistent with our interests. These challenges could have an adverse effect on our business, operating results or financial condition.
The accounting applied to strategic investments depends on a number of factors, including, but not limited to, our percentage of ownership and the level of our influence over the entity. Losses experienced by these strategic investment entities or associated impairment charges could adversely impact our operating results and the value of our investment. In addition, if these entities fail and cease operations, we may lose the value of our investment and shared profits.
The effect of foreign exchange rate fluctuations may adversely impact our revenue, expenses, cash flows and financial condition.
We have significant operations outside the United States. Our revenue from international operations as a percentage of total revenue has historically exceeded 50%, and we expect that revenue from our international operations will continue to account for a significant portion of our total revenue. We also transact business in various foreign currencies, although the majority of our revenue contracts worldwide are denominated in U.S. dollars. Volatility of currencies in countries where we conduct business, most notably the U.S. dollar, Chinese renminbi, Japanese yen, European Union euro, British pound and Indian rupee have had and may in the future have an effect on our revenue or operating results.
Fluctuations in the exchange rate between the U.S. dollar and the currencies of other countries where we conduct business could seriously affect our business, operating results or financial condition, including due to inflation, devaluations and currency controls. For example, if we price our products and services in a foreign currency, we receive fewer U.S. dollars when this currency declines in value relative to the U.S. dollar. If we price our products and services in U.S. dollars, the decrease in value of a local currency results in an increase in the price for our products and services compared to those products of our competitors that are priced in this currency. This could result in our prices being uncompetitive in markets where business is transacted in the local currency. On the other hand, when a foreign currency increases in value relative to the U.S. dollar, it takes more U.S. dollars to purchase the same amount of the foreign currency. As we use the foreign currency to fund payroll costs and other operating expenses in our international operations, this results in an increase in operating expenses. Approximately 34% of our total costs and expenses are transacted in foreign currencies. Our attempts to reduce the effect of foreign currency fluctuations may be unsuccessful, and significant exchange rate movements may adversely impact our results of operations as expressed in U.S. dollars.
We could suffer serious harm to our business because of the infringement of our intellectual property rights by third parties or because of our infringement of the intellectual property rights of third parties, as well as any associated efforts to enforce such rights, including through intellectual property litigation.
There are numerous patents relating to our business and ecosystem. New patents are being issued at a rapid rate and are owned by computational software companies as well as entities and individuals outside the computational software field, including parties whose income is primarily derived from infringement-related licensing and litigation. It is not always practicable or possible to determine in advance whether a product or any of its components infringes the patent rights of others. As a result, from time to time, we may be compelled to respond to or prosecute intellectual property infringement claims to protect our rights or defend a customer’s rights.
Intellectual property infringement claims, including contractual defense reimbursement obligations related to third-party claims against our customers, regardless of merit, could consume valuable management time, result in costly litigation or cause product shipment delays, all of which could seriously harm our business, operating results or financial condition. The risk of infringement and related indemnification claims associated with design IP products that are incorporated into a customer product broadly used by consumers may be higher than the risk associated with our software products. In settling these claims, we may be required to enter into royalty or licensing agreements with the third parties claiming infringement. These royalty or licensing agreements may not be available on terms favorable to us or at all. Being compelled to enter into a license agreement with unfavorable terms could seriously harm our business, operating results or financial condition.
Any potential intellectual property litigation could compel us to do one or more of the following:
•pay damages (including the potential for treble damages), license fees or royalties (including royalties for past periods);
•stop licensing products or providing services that use the challenged intellectual property;
•obtain a license to sell or use the relevant technology, which license may not be available on reasonable terms, or at all; or
•redesign the challenged technology, which could be time consuming and costly, or impossible.
If we were compelled to take any of these actions, our business, reputation or operating results might suffer.
If our security measures are breached or vulnerabilities are discovered in our products and services, and an unauthorized party obtains access to customer data, financial data or assets or our proprietary business information, our information systems and products and services may be perceived as being unsecure, we could experience business or financial harm, and our business and reputation could be harmed.
Our products and services involve storage, including cloud-based storage, and transmission of our proprietary information and that of our customers. Despite our security measures, our information technology and infrastructure, as well as our products and services, may be vulnerable to cyber attacks by unauthorized third parties (which may include nation-states and individuals sponsored by them) or breaches due to employee error, malfeasance or other vulnerabilities or disruptions, which could result in unauthorized disclosure of sensitive information and could significantly interfere with our business operations or those of our customers. Third parties attempt to gain unauthorized access through a variety of methods (such as the use of viruses, malware, ransomware, phishing, denial of service attacks and other cyber attacks) and corrupt the processes of the products and services that we provide. We may also be a target of malicious attacks in an attempt to gain access to our network, including our Cadence Cloud portfolio, which includes both our managed and customer-managed environments, or data centers or those of our customers or end users; steal proprietary information related to our business, products, services or infrastructure; steal financial data or assets or interrupt our systems and services or those of our customers or others. Breaches of our security measures or vulnerabilities in our products or services could expose us to a risk of loss or misuse of this information, loss of financial assets, business interruption, litigation and potential liability. Because techniques used to obtain unauthorized access or to sabotage information systems change frequently and generally are not recognized until launched against a target, we may be unable to anticipate these techniques or to implement adequate preventive measures. In recent years, we have observed, and expect to continue to see, far reaching vulnerabilities, such as the remote code execution vulnerability in Log4j, an open source component of the Apache Software Foundation, that was widely reported in December 2021 as impacting many systems globally. Furthermore, we have and may continue to acquire companies with less sophisticated security measures and that have had or may experience in the future cybersecurity incidents causing business or financial harm. In addition, if we select a vendor that uses cloud storage of information as part of their service or product offerings or are selected as a vendor for our Cadence Cloud portfolio, despite our attempts to validate the security of such services, our proprietary information may be misappropriated by third parties. In the event of an actual or perceived breach of our security, or the security of one of our vendors, the market perception of the effectiveness of our security measures could be harmed, legal or regulatory actions could be initiated against us and we could suffer damage to our reputation or our business, or lose existing customers and our ability to obtain new customers (including government customers), or suffer harm to our financial condition.
Risks associated with our international operations could adversely impact our financial condition.
A significant amount of our revenue is derived from our international operations, and we have offices throughout the world, including key research and development facilities outside of the United States. Our international operations may be subject to a number of risks, including:
•government trade restrictions, including tariffs, export or import regulations, sanctions or other trade barriers, including licensing requirements for exports, which may lengthen the sales cycle or restrict or prohibit the sale or licensing of certain products;
•country-specific export controls could impact our employees who are nationals of the restricted country, preventing these foreign nationals from performing their technology-focused roles which may slow our pace of innovation and/or impact our ability to service customers unless an export license is granted;
•limitations on repatriation of earnings and on the conversion of foreign currencies;
•reduced protection of intellectual property rights and heightened exposure to intellectual property theft;
•longer collection periods for receivables and greater difficulty in collecting accounts receivable;
•difficulties in managing foreign operations;
•political and economic instability;
•unexpected changes in legal and regulatory requirements;
•differing employment practices and labor issues or inability to continue to offer competitive compensation in certain growing regions;
•variations in costs or expenses associated with our international operations, including as a result of changes in foreign tax laws or devaluation of the U.S. dollar relative to other foreign currencies; and
•public health emergencies and related public health measures, including restrictions on travel between jurisdictions in which we and our customers and suppliers operate.
Some of our international research and development and other facilities are in parts of the world where there may be a greater risk of business interruption as a result of political instability, terrorist acts or military conflicts than businesses located domestically. Furthermore, this potential harm is exacerbated because damage to or disruptions at our international research and development facilities could have a more significant adverse effect on our ability to develop new or improve existing products than other businesses that may only have sales offices or other less critical operations abroad. We are not insured for losses or interruptions caused by acts of war. Furthermore, our operations are dependent upon the connectivity of our operations throughout the world. Activities that interfere with our international connectivity or operations, such as cyber hacking, the introduction of a virus into our computer systems, natural disasters, public health emergencies, civil unrest or terrorism, could significantly interfere with our business operations.
In addition, internal controls, policies and procedures and employee training and compliance programs that we have implemented to deter prohibited practices may not prevent our employees, contractors or agents from violating or circumventing our policies and the laws and regulations applicable to our worldwide operations.
We depend upon our management team and key employees, and our failure to attract, train, motivate and retain management and key employees may make us less competitive and therefore harm our results of operations.
Our business depends upon the continued services, efforts and abilities of our senior management and other key employees. Competition for highly skilled executive officers and employees can be intense, particularly in geographic areas recognized as high technology centers. In addition, competition for qualified personnel, including software engineers, in the EDA, commercial electronics engineering services and IP industries has intensified. Further, increased uncertainty regarding social, political and immigration policies in the United States and abroad may make it difficult to recruit employees with adequate experience; and governmental policies resulting in increased funding of domestic technology companies, such as China’s stated national policy to be a global leader in all segments of the semiconductor industry by 2030, has caused and may continue to cause difficulty in retaining and attracting local talent. We may also experience increased compensation costs that are not offset by either improved productivity or higher sales. We may not be successful in recruiting new personnel and in training, retaining and motivating existing personnel. Our ability to do so also depends on how well we maintain a strong workplace culture that is attractive to employees, particularly as we transition employees back to the office, and hiring and training of new employees may be adversely impacted by global economic uncertainty and office closures. In October 2021, we expanded our vaccine policy to require that U.S. employees be fully vaccinated against COVID-19, or obtain an accommodation, by December 2021, and the implementation of this policy may result in difficulty attracting or retaining employees. From time to time, there may be changes in our management team resulting from the hiring and departure of executive officers, and as a result, we may experience disruption to our business that may harm our operating results and our relationships with our employees, customers and suppliers may be adversely affected.
To attract, retain and motivate individuals with the requisite expertise, we may be required to grant large numbers of stock options or other stock-based incentive awards, which may be dilutive to existing stockholders and increase compensation expense, and pay significant base salaries and cash bonuses, which could harm our operating results. The high cost of training new employees, not fully utilizing these employees, or losing trained employees to competing employers could also reduce our operating margins and harm our business or operating results.
We rely on our proprietary technology, as well as software and other intellectual property rights licensed to us by third parties, and we cannot assure that the precautions taken to protect our rights will be adequate or that we will continue to be able to adequately secure such intellectual property rights from third parties.
Our success depends, in part, upon our proprietary technology. We generally rely on patents, copyrights, trademarks, trade secrets, licenses and restrictive agreements to establish and protect our proprietary rights in technology and products. Despite the precautions we may take to protect our intellectual property, third parties have tried in the past, and may try in the future, to challenge, invalidate or circumvent these safeguards. Our patents and other intellectual property rights may not provide us with sufficient competitive advantages. Patents may not be issued on any of our pending applications and our issued patents may not be sufficiently broad to protect our technology. Furthermore, the laws of foreign countries may not protect our proprietary rights in those countries to the same extent as applicable law protects these rights in the United States, and we may encounter difficulties in our attempts to protect our intellectual property in foreign jurisdictions, including as a result of impacts from changes in international trade relationships. The protection of our intellectual property may require the expenditure of significant financial and managerial resources. Moreover, the steps we take to protect our intellectual property may not adequately protect our rights, or deter or prevent third parties from infringing or misappropriating our proprietary rights.
Many of our products include software or other intellectual property licensed from third parties. We may have to seek new or renew existing licenses for such software and other intellectual property in the future. Our engineering services business holds licenses to certain software and other intellectual property owned by third parties, including that of our competitors. Our failure to obtain software, other intellectual property licenses or other intellectual property rights that are necessary or helpful for our business on favorable terms, or our need to engage in litigation over these licenses or rights, could seriously harm our business, operating results or financial condition.
We have substantial cash requirements in the United States, but a significant portion of our cash is held and generated outside of the United States, and if our cash available in the United States is insufficient to meet our operating expenses and debt repayment obligations in the United States, then we may be required to raise cash in ways that could negatively affect our financial condition, results of operations and the market price of our common stock.
We have significant operations outside the United States. As of January 1, 2022, approximately 55% of our cash and cash equivalents balance was held by subsidiaries outside the United States, with the remainder of the balance held by us or our subsidiaries in the United States. While we believe that the combination of our current U.S. cash and cash equivalents, future U.S. operating cash flows and other cash that may be accessible to us on attractive terms are sufficient to meet our ongoing U.S. operating expenses and debt repayment obligations, we cannot accurately predict the full impact that COVID-19 may have on our cash flows. In addition, although the U.S. Tax Cuts and Jobs Act (the “Tax Act”) may have reduced the tax impact of repatriation of foreign earnings, there are still administrative processes associated with repatriation of foreign earnings that could affect the timing of returning cash to the U.S. from non-U.S. jurisdictions. Accordingly, if our U.S. cash were insufficient to meet our future funding obligations in the United States, we could be required to seek funding sources on less attractive terms, which could negatively impact our results of operations, financial position and the market price of our common stock.
The long sales cycle of our products and services may cause our operating results to fluctuate unexpectedly.
Generally, we have a long sales cycle that can extend up to six months or longer. The complexity and expense associated with our products and services generally require a lengthy customer education, evaluation and approval process. Consequently, we may incur substantial expenses and devote significant management effort and expense to develop potential relationships that do not result in agreements or revenue and may prevent us from pursuing other opportunities. In addition, sales of our products and services have been and may in the future be delayed if customers delay approval or commencement of projects because of the timing of customers’ competitive evaluation processes or customers’ budgetary constraints and budget cycles. Long sales cycles for hardware products subject us to a number of significant risks over which we have limited control, including insufficient, excess or obsolete inventory, variations in inventory valuation and fluctuations in quarterly operating results.
Our restructuring plans incur substantial costs and may not result in the benefits we have anticipated, possibly having a negative effect on our future operating results.
In recent fiscal years, we have initiated restructuring plans in an effort to better align our resources with our business strategy. We incur substantial costs to implement restructuring plans, and our restructuring activities may subject us to reputational risks and litigation risks and expenses. Our past restructuring plans do not provide any assurance that we will realize anticipated cost savings and other benefits or that additional restructuring plans will not be required or implemented in the future. In addition, our restructuring plans may have other consequences, such as attrition beyond our planned reduction in workforce, a negative effect on employee morale and productivity or our ability to attract highly skilled employees. Our competitors may also use our restructuring plans to seek to gain a competitive advantage over us. As a result, our restructuring plans may affect our revenue and other operating results in the future.
The investment of our cash is subject to risks that may cause losses and affect the liquidity of these investments.
Our marketable investments include various money market funds and may include other investments as well. Weakened financial markets have at times adversely impacted the general credit, liquidity, market prices and interest rates for these and other types of investments. Additionally, changes in monetary policy by the Federal Open Market Committee or other relevant regulators and concerns about the rising U.S. government debt level may cause a decrease in the purchasing power of the U.S. dollar and adversely affect our investment portfolio. The financial market and monetary risks associated with our investment portfolio may have a material adverse effect on our financial condition, liquidity, results of operations or cash flows.
Our business is subject to the risk of natural disasters and global climate change.
Our corporate headquarters, including certain of our research and development operations and certain of our distribution facilities, is located in the Silicon Valley area of Northern California, a region known to experience seismic activity and wildfires. If significant seismic activity or wildfires were to occur or reoccur, our operations may be interrupted, which could adversely impact our business and results of operations.
Our offices around the world may also be adversely impacted by natural disasters, including those intensified by climate change. Our offices, and those of our customers and suppliers, can be disrupted by droughts, extreme temperatures, fires, flooding and other climate change-related risks, as well as earthquakes, actions by utility providers, and other catastrophic events such as an actual or threatened public health emergency. If a catastrophic event occurs at or near any of our offices, or utility providers or public health officials take certain actions (e.g., shut off power to our facilities or impose travel restrictions), our operations may be interrupted, which could adversely impact our business and results of operations. If a catastrophic event impacts a significant number of our customers, resulting in decreased demand for their and our products, or our ability to provide services and maintenance to our customers, our business and results of operations could be adversely impacted.
Risks Related to Customers, Suppliers and Industry Competition
Customer consolidation could affect our operating results.
There has been a trend toward customer consolidation in the semiconductor industry through business combinations, including mergers, asset acquisitions and strategic partnerships. If this trend continues, it could make us more dependent on fewer customers who may be able to exert increased pressure on our prices and other contract terms and could increase the portion of our total sales concentration for any single customer. Customer consolidation activity could also reduce the demand for our products and services if such customers streamline research and development or operations, reduce purchases or delay purchasing decisions. These outcomes could negatively impact our operating results and financial condition.
Our failure to respond quickly to technological developments or customers’ increasing technological requirements and to continue to develop or acquire technological capabilities could make our products uncompetitive and obsolete and impede our ability to address the requirements in technology segments that are expected to contribute to our growth.
Our strategy is designed to increase our business among electronic systems companies, which are now developing their own ICs and other electronic subsystems. Our strategy is also intended to increase our business among semiconductor companies, which are increasing their contribution to the end products into which their ICs and other electronic subsystems are incorporated. Part of this strategy involves addressing the needs across a variety of vertical markets including consumer, hyperscale computing, mobile, 5G communications, automotive, aerospace and defense, industrial and healthcare, where increased investment is expected by our customers. Each of these markets require technologies, expertise, and marketing and operations infrastructure that are application-specific. Our inability to develop or acquire these application-specific capabilities could impede our ability to expand our business in these categories and ultimately affect our future growth. Currently, the industries we serve are experiencing the following trends:
•changes in the design and manufacturing of ICs, including migration to advanced-process nodes and three-dimensional transistors, such as FinFETs, present major challenges to the semiconductor industry, particularly in IC design, design automation, design of manufacturing equipment, and the manufacturing process itself. With migration to advanced-process nodes, the industry must adapt to more complex physics and manufacturing challenges, such as the need to draw features on silicon that are many times smaller than the wavelength of light used to draw the features via lithography. Models of each component’s electrical properties and behavior also become more complex as do requisite analysis, design, verification and manufacturing capabilities. Novel design tools and methodologies must be invented and enhanced quickly to remain competitive in the design of electronics in the smallest nanometer ranges;
•the ability to design SoCs increases the complexity of managing a design that, at the lowest level, is represented by billions of shapes on fabrication masks. In addition, SoCs typically incorporate microprocessors and DSPs that are programmed with software, requiring simultaneous design of the IC and the related software embedded on the IC;
•with the availability of seemingly endless gate capacity, there is an increase in design reuse, or the combining of off-the-shelf design IP with custom logic to create ICs or SoCs. The unavailability of a broad range of high-quality design IP (including our own) that can be reliably incorporated into a customer’s design with our software products and services could lead to reduced demand for our products and services;
•increased technological capability of the FPGA logic chip, which creates an alternative to IC implementation for some companies and could reduce demand for our IC implementation products and services;
•a growing number of low-cost engineering service businesses could reduce the need for some IC companies to invest in EDA products;
•adoption of cloud computing technologies with accompanying new engagement models for an increasing number of software categories may impact our business;
•integration and optimization of solutions for system design with core EDA technologies could result in reduced demand for our broad portfolio;
•with Moore's Law slowing, the trend towards more on-chip integration and advanced system level 3D package design may change the requirements for the design, multi-physics analysis, and verification of complex homogeneous and heterogeneous systems; and
•changing end-user dynamics in our eight target technology verticals - consumer, hyperscale computing, mobile, 5G communications, automotive, aerospace and defense, industrial and healthcare - could advance the need from simple ICs to full-system design and analysis capabilities that require increasingly complex computational software-based solutions.
If we are unable to respond quickly and successfully to these trends, we may lose our competitive position, and our products or technologies may become obsolete. To compete successfully, we must develop, acquire or license new products and improve our existing products and processes on a schedule that keeps pace with technological developments and the requirements for products addressing a broad spectrum of designers and designer expertise in our industries. We must provide frequent and relevant updates to our software products in order to provide substantial benefit to the customer throughout the license periods because of the rapid changes in our customers’ industries. The market must also accept our new and improved products. Our hardware platforms must be enhanced periodically to reduce the likelihood that a competitor surpasses the capabilities we offer. Our introduction of new products could reduce the demand and revenue of our older products or affect their pricing. We must also be able to support a range of changing computer software, hardware platforms and customer preferences. A transition by our customers to different business models associated with cloud computing technologies could result in reduced revenue. We cannot guarantee that we will be successful in keeping pace with all, or any, of the customer trends.
We have invested and expect to continue to invest in research and development efforts for new and existing products and technologies and technical sales support. Such investments may affect our operating results, and, if the return on these investments is lower or develops more slowly than we expect, our revenue and operating results may suffer.
We have invested and expect to continue to invest in research and development for new and existing products, technologies and services in response to our customers’ increasing technological requirements. Such investments may be in related areas, such as technical sales support, and may include increases in employee headcount. These investments may involve significant time, risks and uncertainties, including the risk that the expenses associated with these investments may affect our margins and operating results and that such investments may not generate sufficient revenues to offset liabilities assumed and expenses associated with these new investments. We believe that we must continue to invest a significant amount of time and resources in our research and development efforts and technical sales support to maintain and improve our competitive position. If we do not achieve the benefits anticipated from these investments, if the achievement of these benefits is delayed, or if customers reduce or slow the need to upgrade or enhance their computational software products and design flows, our revenue and operating results may be adversely affected.
Our operating results and revenue could be adversely affected by customer payment delays, customer bankruptcies and defaults or modifications of licenses.
Our customers have and may continue to face challenging financial or operating conditions, including due to macroeconomic conditions or catastrophic events, and delay or default on their payment commitments to us, request to modify contract terms, or modify or cancel plans to license our products. Our customers’ inability to fulfill payment commitments, in turn, could adversely affect our revenue, operating expenses and cash flow. Additionally, our customers have, in the past, sought, and may, in the future, seek, to renegotiate pre-existing contractual commitments. Payment defaults by our customers or significant reductions in existing contractual commitments could have a material adverse effect on our financial condition and operating results.
The competition in our industries is substantial, and we may not be able to continue to compete successfully in our industries.
The industries in which we do business, including software, hardware, IP and services for enabling the design of electronic products, are highly competitive and require us to identify and develop or acquire innovative and cost-competitive products, integrate them into platforms and market them in a timely manner. We may not be able to compete successfully in these industries, which could seriously harm our business, operating results or financial condition. Factors that could affect our ability to compete successfully include:
•the development by others of competitive products or platforms and engineering services, possibly resulting in a shift of customer preferences away from our products and services and significantly decreased revenue;
•aggressive pricing competition by some of our competitors, including through significant discounts, may cause us to reduce the prices of our products, offer terms that are unfavorable to us or lose our competitive position, any of which could result in lower revenues or profitability and could adversely impact our ability to realize the revenue and profitability forecasts for our software or emulation and prototyping hardware systems products and could, over time, significantly constrain the prices that we can charge for our products;
•the challenges of advanced-node design may lead some customers to work with more mature, less risky manufacturing processes that may reduce their need to upgrade or enhance their EDA products and design flows;
•the challenges of developing (or acquiring externally developed) technology solutions that are adequate and competitive in meeting the rapidly evolving requirements of next-generation design challenges;
•intense competition to attract acquisition targets, possibly making it more difficult for us to acquire companies or technologies at an acceptable price, or at all;
•new entrants, including larger electronic systems companies, in our industry;
•the combination of our competitors or collaboration among many companies to deliver more comprehensive offerings than they could individually;
•our entry into new product categories or technology verticals, including those in which success depends on absolute or relative scale;
•decisions by electronics manufacturers to perform engineering services or IP development internally, rather than purchase these services from outside vendors due to budget constraints or excess engineering capacity;
•actions by regulators to limit the contractual terms that either we or our customers can apply to product and service offerings; and
•events or circumstances that damage the reputation of our company, leadership, products, services or technologies.
For more information about our specific competitors, see “Competition” under Item 1 of Part I of this Annual Report on Form 10-K.
Our future revenue is dependent in part upon our installed customer base continuing to license or buy products and purchase services.
Our installed customer base has traditionally generated additional new license, services and maintenance revenues. In future periods, customers may not necessarily license or buy additional products or contract for additional services or maintenance. Our customers, many of which are large semiconductor and systems companies, often have significant bargaining power in negotiations with us. Customer consolidation can reduce the total level of purchases of our software, hardware, IP and services, and in some cases, increase customers’ bargaining power in negotiations with their suppliers, including us.
We depend on a single supplier or a limited number of suppliers for certain hardware components and contract manufacturers for production of our emulation and prototyping hardware products, making us vulnerable to supply disruption and price fluctuation.
Our reliance on single or a limited number of suppliers and contract manufacturers for certain hardware components and contract manufacturers for production of our emulation and prototyping hardware products could result in product delivery problems and delays and reduced control over contractual terms and quality. In some cases, it may not be practical or feasible to have multiple sources to procure certain key components. We may suffer a disruption in the supply of certain hardware components if we are unable to purchase sufficient components on a timely basis or at all for any reason. Any supply or manufacturing disruption, including delay in delivery of components by our suppliers or products by our manufacturers, or the bankruptcy, shutdown or upstream supply chain issues of our suppliers or manufacturers, could delay our production process and prevent us from delivering completed hardware products to customers or from supplying new evaluation units to customers, which could have a negative impact on our revenue and operating results. For example, the global semiconductor shortage in 2021 has negatively impacted and may continue to negatively impact multiple segments of the semiconductor industry, including our customers.
Tax, Regulatory and Litigation Risks
Our results could be adversely affected by an increase in our effective tax rate as a result of U.S. and foreign tax law changes, outcomes of current or future tax examinations, or by material differences between our forecasted and actual effective tax rates.
Tax laws, regulations, and administrative practices in various jurisdictions are evolving and may be subject to significant changes due to economic, political and other conditions including the fiscal impacts caused by the COVID-19 pandemic. Governments, including the United States, are increasingly focused on ways to increase tax revenues, particularly from multinational corporations, which may lead to changes in tax laws, an increase in audit activity and harsher positions taken by tax authorities. We are currently subject to tax audits in various jurisdictions and these jurisdictions may assess additional tax liabilities against us.
Our operations are subject to income and transaction taxes in the United States and in multiple foreign jurisdictions, with a significant amount of our foreign earnings generated by our subsidiaries organized in Ireland and Hungary. Any significant change in our future effective tax rates could adversely impact our results of operations, cash flows and financial position. Our future effective tax rates could be adversely affected by factors that include, but are not limited to, changes in tax laws or the interpretation of such tax laws in jurisdictions in which we have business activity, earnings being lower than anticipated in jurisdictions with low statutory tax rates, changes in tax benefits from stock-based compensation, changes in the valuation of our deferred tax assets and liabilities, changes in our recognition or measurement of a tax position taken in a prior period, increases to interest or penalty expenses, new accounting standards or interpretations of such standards, or results of examinations by the Internal Revenue Service (“IRS”), state, and foreign tax or other governmental authorities. In addition, beginning in fiscal 2022, for United States corporation income tax purposes, we are required to capitalize and amortize R&D costs rather than expense these costs as incurred. To the extent this requirement stays in effect, it will significantly increase our fiscal 2022 effective tax rate and cash tax payments compared to fiscal 2021.
The IRS and other tax authorities regularly examine our income tax returns and other non-income tax returns, such as payroll, sales, use, value-added, net worth or franchise, property, goods and services, consumption, import, stamp, and excise taxes, in both the United States and foreign jurisdictions. The calculation of our provision for income taxes and our accruals for other taxes requires us to use significant judgment and involves dealing with uncertainties in the application of complex tax laws and regulations. In determining the adequacy of our provision for income taxes, we regularly assess the potential settlement outcomes resulting from income tax examinations. However, the final outcome of tax examinations cannot be estimated with certainty and could be materially different from the amount that is reflected in our historical income tax provisions and accruals for other taxes. Should the IRS or other tax authorities assess additional taxes, penalties or interest as a result of a current or a future examination, we may be required to record charges to operations in future periods that could have a material impact on our results of operations, financial position or cash flows in the applicable period or periods.
The current U.S. presidential administration and Congress have proposed several changes to corporate tax rules that, if enacted, could increase our future tax liability. In October 2021, the Organisation for Economic Co-operation and Development (“OECD”) announced an agreement among 137 countries, including Ireland and Hungary, to adopt new rules to provide greater taxing rights to jurisdictions where customers or users are located and the introduction of a corporate global minimum tax rate of 15% with a target effective date of fiscal 2023. Furthermore, many countries have enacted or proposed new laws to tax digital transactions. These developments in tax laws and regulations, and compliance with these rules, could have a material adverse effect on our operating results, financial position and cash flows.
Forecasts of our annual effective tax rate do not include the anticipation of future tax law changes, and are complex and subject to uncertainty because our income tax position for each year combines the effects of estimating the amount and composition of our annual income or loss in jurisdictions with varying income tax rates, as well as benefits from available deferred tax assets, the impact of various accounting rules, our interpretations of changes in tax laws and results of tax audits. In addition, we account for certain tax benefits from stock-based compensation in the period the stock compensation vests or is settled, which may cause increased variability in our quarterly effective tax rates. If there were a material difference between forecasted and actual tax rates, it could have a material impact on our results of operations.
Litigation, government investigations or regulatory proceedings could adversely affect our financial condition or operations.
We currently are, and in the future may be, involved in various disputes and legal proceedings that arise in the ordinary course of business. These include disputes and legal proceedings related to intellectual property, indemnification, mergers and acquisitions, licensing, contracts, customers, products, distribution and other commercial arrangements and employee relations matters. Governments and regulatory agencies in the jurisdictions in which we operate may also open or initiate investigations or regulatory proceedings. For information regarding legal proceedings in which we are currently engaged, please refer to the discussion under Part I, Item 3, “Legal Proceedings” and Note 18 in the notes to consolidated financial statements. We cannot provide any assurances that the final outcome of these legal proceedings or any other proceedings that may arise in the future will not have a material adverse effect on our business, reputation, operating results, financial condition or cash flows. Legal proceedings can be time consuming and expensive and could divert management’s time and attention from our business, which could have a material adverse effect on our revenues and operating results.
Errors or defects in our products and services could expose us to liability and harm our business.
Our customers use our products and services in designing and developing products that involve a high degree of technological complexity, each of which has its own specifications. Because of the complexity of the systems and products with which we work, some of our products and designs can be adequately tested only when put to full use in the marketplace. As a result, our customers or their end users may discover errors or defects in our software or the systems we design, or the products or systems incorporating our design and intellectual property may not operate as expected. Errors or defects could result in:
•reputational damage;
•failure to attract new or retain existing customers or market share and acceptance;
•diversion of development resources to resolve the problem;
•loss of or delay in revenue or payments and increased service costs; and
•liability for damages.
Our reported financial results may be adversely affected by changes in United States generally accepted accounting principles, and we may incur significant costs to adjust our accounting systems and processes to comply with significant changes.
United States generally accepted accounting principles (“U.S. GAAP”) are subject to interpretation by the Financial Accounting Standards Board (“FASB”), the SEC and various bodies formed to promulgate and interpret appropriate accounting principles. We are also subject to evolving rules and regulations of the countries in which we do business. Changes to accounting standards or interpretations thereof may result in different accounting principles under U.S. GAAP that could have a significant effect on our reported financial results.
In addition, we have in the past and may in the future need to significantly change our customer contracts, accounting systems and processes when we adopt future or proposed changes in accounting principles. The cost and effect of these changes may negatively impact our results of operations during the periods of transition.
If we become subject to unfair hiring claims, we could be prevented from hiring needed employees, incur liability for damages and incur substantial costs in defending ourselves.
When companies in our industry lose employees to competitors, they frequently claim that these competitors have engaged in unfair hiring practices or that the employment of these persons would involve the disclosure or use of trade secrets. These claims could prevent us from hiring employees or cause us to incur liability for damages. We could also incur substantial costs in defending ourselves or our employees against these claims, regardless of their merits. Defending ourselves from these claims could also divert the attention of our management away from our operations.
We are subject to evolving corporate governance and public disclosure expectations and regulations that impact compliance costs and risks of noncompliance.
We are subject to changing rules and regulations promulgated by a number of governmental and self-regulatory organizations, including the SEC, Nasdaq, and the FASB, as well as evolving investor and stakeholder expectations around corporate governance, executive compensation and environmental and social practices and disclosures. These rules, regulations and expectations continue to evolve in scope and complexity, and many new requirements have been created in response to laws enacted by the U.S. and foreign governments, making compliance more difficult and uncertain. The increase in costs to comply with such evolving expectations, rules and regulations, as well as any risk of noncompliance, could adversely impact us. Our disclosures and public positions or commitments on these matters may change from time to time, as may corresponding internal controls and external reporting standards, which can expose us to reputational, legal, and other risks, including as a result of a failure or perceived failure to achieve publicly disclosed aspirations, targets, or goals, such as our greenhouse gas emissions reduction target, or a failure to report accurately.
Risks Related to Our Securities and Indebtedness
Our stock price has been and may continue to be subject to fluctuations.
Our stock price is subject to changes in recommendations or earnings estimates by financial analysts, changes in investors’ or analysts’ valuation measures for our stock, our credit ratings and market trends unrelated to our performance. Furthermore, speculation in the press or investment community about our strategic position, financial condition, results of operations, business or security of our products, can cause changes in our stock price. In addition to these factors and industry and general economic and political conditions, our stock price may be adversely impacted by announcements related to financial results or forecasts that fail to meet or are inconsistent with earlier projections or the expectations of our securities analysts or investors, announcements of new products or acquisitions of new technologies by us, our competitors or our customers, or announcements by us of acquisitions, major transaction or litigation developments, or management changes. A significant drop in our stock price could expose us to the risk of securities class action or shareholder derivative lawsuits, which may result in substantial costs and divert management’s attention and resources, which may adversely affect our business.
Anti-takeover defenses in our certificate of incorporation and bylaws and certain provisions under Delaware law could prevent an acquisition of our company or limit the price that investors might be willing to pay for our common stock.
Our certificate of incorporation and bylaws and certain provisions of the Delaware General Corporation Law that apply to us could make it difficult for another company to acquire control of our company. For example, our certificate of incorporation allows our Board of Directors to designate and issue, at any time and without stockholder approval up to 400,000 shares of preferred stock in one or more series. All 400,000 shares of preferred stock are currently designated as Series A Preferred, but because no such shares are outstanding or reserved for issuance, our Board of Directors may reduce the number of shares of preferred stock designated as Series A Preferred to zero. Subject to the Delaware General Corporation Law, our Board of Directors may, as to any shares of preferred stock the terms of which have not then been designated, fix the rights, preferences, privileges and restrictions on these shares, fix the number of shares and designation of any series, and increase or decrease the number of shares of any series if not below the number of outstanding shares plus the number of shares reserved for issuance. Our Board of Directors has the power to issue shares of Series A Preferred with dividend, voting and liquidation rights superior to our common stock at a rate of 1,000-to-1 without further vote or action by the common stockholders.
In addition, Section 203 of the Delaware General Corporation Law generally prohibits a Delaware corporation from engaging in any business combination with a person owning 15% or more of its voting stock, or who is affiliated with the corporation and owned 15% or more of its voting stock at any time within three years prior to the proposed business combination, for a period of three years from the date the person became a 15% owner, unless specified conditions are met.
All or any one of these factors could limit the price that certain investors would be willing to pay for shares of our common stock and could allow our Board of Directors to resist, delay or prevent an acquisition of our company, even if a proposed transaction were favored by a majority of our independent stockholders.
Our debt obligations expose us to risks that could adversely affect our business, operating results or financial condition, and could prevent us from fulfilling our obligations under such indebtedness.
We have significant outstanding indebtedness, as well as the ability to access additional borrowings under our revolving credit facility. Subject to the limits contained in the credit agreement governing our revolving credit facility, the indenture that governs the 4.375% Senior Notes due October 15, 2024 (the “2024 Notes”) and our other debt instruments, we may be able to incur substantial additional debt from time to time to finance working capital, capital expenditures, investments or acquisitions, share repurchases or for other purposes. If we do so, the risks related to our level of debt could intensify. Specifically, our level of debt could have important consequences, including the following:
•making it more difficult for us to satisfy our obligations to service our debt as described above;
•limiting our ability to obtain additional financing to fund future working capital, capital expenditures, acquisitions or other general corporate requirements;
•requiring a substantial portion of our cash flows (including U.S. cash) to be dedicated to debt service payments instead of other purposes, thereby reducing the amount of cash flows available for working capital, capital expenditures, acquisitions and other general corporate purposes and potentially requiring repatriation of cash from outside the United States;
•increasing our vulnerability to adverse economic and industry conditions;
•exposing us to the risk of increased interest rates as certain of our borrowings, including borrowings under our revolving credit facility, are at variable rates of interest;
•limiting our flexibility in planning for and reacting to changes in the industry in which we compete;
•placing us at a disadvantage compared to other, less leveraged competitors and competitors that have greater access to capital resources;
•limiting our interest deductions for U.S. income tax purposes; and
•increasing our cost of borrowing.
At the option of the holders of our outstanding notes, we may, under certain circumstances, be required to repurchase such notes.
Under the terms of our 2024 Notes, we may be required to repurchase for cash such notes prior to their maturity in connection with the occurrence of certain significant corporate events. Specifically, we are required to offer to repurchase such notes upon a “change of control triggering event” (as defined in the indenture related to such notes), such as a change of control accompanied by certain downgrades in the credit ratings of such notes. The repayment obligations under such notes may have the effect of discouraging, delaying or preventing a takeover of our company. If we were required to pay the 2024 Notes prior to their scheduled maturity, it could have a significant negative impact on our cash and liquidity and could impact our ability to invest financial resources in other strategic initiatives.
The terms of the agreement governing our revolving credit facility and the indenture governing our 2024 Notes restrict our current and future operations, particularly our ability to respond to changes or to take certain actions.
The agreement governing our revolving credit facility contains a number of restrictive covenants that impose significant operating and financial restrictions on us and may limit our ability to engage in acts that may be in our long-term best interest, including restrictions on our ability to:
•incur liens or additional indebtedness and guarantee indebtedness;
•enter into transactions with affiliates;
•alter the businesses we conduct; and
•consolidate, merge or sell all or substantially all of our assets.
In addition, the restrictive covenants in the agreement governing our revolving credit facility require us to maintain specified financial ratios. Our ability to meet those financial ratios can be affected by events beyond our control, and we may be unable to meet them.
A breach of the covenants or restrictions under the agreement governing our revolving credit facility could result in an event of default under the applicable indebtedness. Such a default may allow the creditors to accelerate the related debt and may result in the acceleration of any other debt to which a cross-acceleration or cross-default provision applies. In addition, an event of default under the credit agreement governing our revolving credit facility would permit the lenders under our revolving credit facility to terminate all commitments to extend further credit under that facility. In the event our lenders or note holders accelerate the repayment of our borrowings, we and our subsidiaries may not have sufficient assets to repay that indebtedness. As a result of these restrictions, we may be:
•limited in how we conduct our business;
•unable to raise additional debt or equity financing to operate during general economic or business downturns; or
•unable to compete effectively or to take advantage of new business opportunities.
The indenture governing our 2024 Notes also contains certain restrictive covenants that impose operating and financial restrictions on us and may limit our ability to engage in acts that may be in our long-term best interest, including restrictions on our ability to incur liens and to enter into sale and leaseback transactions.
These restrictions may affect our ability to grow in accordance with our strategy. In addition, our financial results, our substantial indebtedness and our credit ratings could adversely affect the availability and terms of our financing.
We may not be able to generate sufficient cash to service all of our indebtedness and may be forced to take other actions to satisfy our obligations under our indebtedness, which may not be successful.
Our ability to make scheduled payments on or refinance our debt obligations depends on our financial condition and operating performance, which are subject to prevailing economic and competitive conditions and to certain financial, business, legislative, regulatory and other factors beyond our control. We may be unable to maintain a level of cash flows from operating activities sufficient to permit us to pay the principal, premium, if any, and interest on our indebtedness. Our inability to generate sufficient cash flows to satisfy our debt obligations, or to refinance our indebtedness on commercially reasonable terms or at all, would materially and adversely affect our financial position and results of operations and our ability to satisfy our debt obligations.
If our cash flows and capital resources are insufficient to fund our debt service obligations, we could face substantial liquidity problems and could be forced to reduce or delay investments and capital expenditures or to dispose of material assets or operations, seek additional debt or equity capital or restructure or refinance our indebtedness. We may not be able to effect any such alternative measures, if necessary, on commercially reasonable terms or at all and, even if successful, those alternative actions may not allow us to meet our scheduled debt service obligations. The agreement governing our revolving credit facility restricts our ability to dispose of assets and use the proceeds from those dispositions and may also restrict our ability to raise debt or equity capital to be used to repay other indebtedness when it becomes due. We may not be able to consummate those dispositions or to obtain proceeds in an amount sufficient to meet any debt service obligations then due.
In addition, we conduct a substantial portion of our operations through our subsidiaries, none of which are currently guarantors of our indebtedness. Accordingly, repayment of our indebtedness is dependent on the generation of cash flow by our subsidiaries and their ability to make such cash available to us, by dividend, debt repayment or otherwise. Our subsidiaries do not have any obligation to pay amounts due on our indebtedness or to make funds available for that purpose. Our subsidiaries may not be able to, or may not be permitted to, make distributions to enable us to make payments in respect of our indebtedness. Each subsidiary is a distinct legal entity, and, under certain circumstances, legal and contractual restrictions may limit our ability to obtain cash from our subsidiaries. In the event that we do not receive distributions from our subsidiaries, we may be unable to make required principal and interest payments on our indebtedness.
If we cannot make scheduled payments on our debt, we will be in default and holders of our debt could declare all outstanding principal and interest to be due and payable, the lenders under our revolving credit facility could terminate their commitments to loan money and we could be forced into bankruptcy or liquidation. In addition, a material default on our indebtedness could suspend our eligibility to register securities using certain registration statement forms under SEC guidelines that permit incorporation by reference of substantial information regarding us, potentially hindering our ability to raise capital through the issuance of our securities and increasing our costs of registration.
Despite our current level of indebtedness, we and our subsidiaries may incur substantially more debt. This could further exacerbate the risks to our financial condition described above.
We and our subsidiaries may incur significant additional indebtedness in the future. Although the agreement governing our revolving credit facility contains restrictions on the incurrence of additional indebtedness, these restrictions are subject to a number of qualifications and exceptions, and the additional indebtedness incurred in compliance with these restrictions could be substantial. If we incur any additional indebtedness that ranks equally with the 2024 Notes, then subject to any collateral arrangements we may enter into, the holders of that debt will be entitled to share ratably in any proceeds distributed in connection with any insolvency, liquidation, reorganization, dissolution or other winding up of our company.
Our variable rate indebtedness subjects us to interest rate risk, which could cause our debt service obligations to increase significantly.
Borrowings under our revolving credit facility are at variable rates of interest and expose us to interest rate risk. If interest rates were to increase, our debt service obligations on our variable rate indebtedness would increase even though the amount borrowed remained the same, and our net income and cash flows, including cash available for servicing our indebtedness, would correspondingly decrease. In the future, we may enter into interest rate swaps that involve the exchange of floating for fixed rate interest payments in order to reduce interest rate volatility. However, we may not maintain interest rate swaps with respect to all of our variable rate indebtedness, and any swaps we enter into may not fully mitigate our interest rate risk.
Our revolving credit facility utilizes, at our option, either (1) LIBOR, plus a margin of between 0.750% and 1.250%, determined by reference to the credit rating of our unsecured debt, or (2) base rate plus a margin of 0.000% to 0.250%, determined by reference to the credit rating of our unsecured debt, to calculate the amount of accrued interest on any borrowings. Regulators in certain jurisdictions including the United Kingdom and the United States have begun to phase out the use of LIBOR, ceasing publication for certain tenors of the U.S. dollar (and other) LIBOR at the end of 2021, with plans to cease publication for the remaining tenors of U.S. dollar LIBOR beginning June 30, 2023. Our revolving credit facility contains provisions that contemplate the transition from LIBOR under specified events; however, the transition from LIBOR to a new replacement benchmark remains uncertain at this time and the consequences of such developments cannot be entirely predicted, but could result in an increase in the cost of our borrowings under our existing credit facility and any future borrowings.
In addition, our revolving credit facility uses a pricing grid based on our credit ratings. If our credit ratings are downgraded or other negative action is taken, the interest rate payable by us under our revolving credit facility would increase. Credit rating downgrades could also restrict our ability to obtain additional financing in the future and affect the terms of any such financing.
Various factors could increase our future borrowing costs or reduce our access to capital, including a lowering or withdrawal of the ratings assigned to us and our 2024 Notes by credit rating agencies.
We may in the future seek additional financing for a variety of reasons, and our future borrowing costs, terms and access to capital could be affected by factors including the condition of the debt and equity markets, the condition of the economy generally, prevailing interest rates, our level of indebtedness, our credit rating and our business and financial condition. In addition, the 2024 Notes currently have an investment grade credit rating, which could be lowered or withdrawn entirely by a credit rating agency based on adverse changes to circumstances relating to the basis of the credit rating. Consequently, real or anticipated changes in our credit ratings will generally affect the market value of the 2024 Notes. Any future lowering of the credit ratings of the 2024 Notes likely would make it more difficult or more expensive for us to obtain additional debt financing.
Item 1B. Unresolved Staff Comments
None.
Item 2. Properties
We own land and buildings at our headquarters located in San Jose, California. We also own buildings in India. As of January 1, 2022, the total square footage of our owned buildings was approximately 1,010,000.
We lease additional facilities in the United States and various other countries. We may sublease certain of these facilities where space is not fully utilized.
We believe that these facilities are adequate for our current needs and that suitable additional or substitute space will be available as needed to accommodate any expansion of our operations.
Item 3. Legal Proceedings
From time to time, we are involved in various disputes and legal proceedings that arise in the ordinary course of business. These include disputes and legal proceedings related to intellectual property, indemnification obligations, mergers and acquisitions, licensing, contracts, customers, products, distribution and other commercial arrangements and employee relations matters. At least quarterly, we review the status of each significant matter and assess its potential financial exposure. If the potential loss from any claim or legal proceeding is considered probable and the amount or the range of loss can be estimated, we accrue a liability for the estimated loss. Legal proceedings are subject to uncertainties, and the outcomes are difficult to predict. Because of such uncertainties, accruals are based on our judgments using the best information available at the time. As additional information becomes available, we reassess the potential liability related to pending claims and legal proceedings and may revise estimates.
Item 4. Mine Safety Disclosures
Not applicable.
PART II.
Item 5. Market for Registrant’s Common Equity, Related Stockholder Matters and Issuer Purchases of Equity Securities
Our common stock is traded on the Nasdaq Global Select Market under the symbol CDNS. As of February 5, 2022, we had 384 registered stockholders and approximately 340,000 beneficial owners of our common stock.
Stockholder Return Performance Graph
The following graph compares the cumulative 5-year total stockholder return on our common stock relative to the cumulative total return of the Nasdaq Composite Index, the S&P 500 Index and the S&P 500 Information Technology Index. The graph assumes that the value of the investment in our common stock and in each index on December 31, 2016 (including reinvestment of dividends) was $100 and tracks it each year thereafter on the last day of our fiscal year through January 1, 2022 and, for each index, on the last day of the calendar year.
| | | | | | | | | | | | | | | | | | | | | | | | | | | | | | | | | | | | | | |
| | | | | | | | | | | | |
| | 12/31/2016 | | 12/30/2017 | | 12/29/2018 | | 12/28/2019 | | 1/2/2021 | | 1/1/2022 |
| | | | | | | | | | | | |
| Cadence Design Systems, Inc. | | $ | 100.00 | | | $ | 165.82 | | | $ | 171.85 | | | $ | 278.71 | | | $ | 540.96 | | | $ | 738.90 | |
| Nasdaq Composite | | 100.00 | | | 129.64 | | | 125.96 | | | 172.17 | | | 249.51 | | | 304.85 | |
| S&P 500 | | 100.00 | | | 121.83 | | | 116.49 | | | 153.17 | | | 181.35 | | | 233.41 | |
| S&P 500 Information Technology | | 100.00 | | | 138.83 | | | 138.43 | | | 208.05 | | | 299.37 | | | 402.73 | |
The stock price performance included in this graph is not necessarily indicative of future stock price performance.
Issuer Purchases of Equity Securities
As of the end of fiscal 2020, approximately $739 million remained available under the previously announced authorization to repurchase shares of our common stock. In August 2021, our Board of Directors increased the prior authorization to repurchase shares of our common stock by authorizing an additional $1 billion. The actual timing and amount of repurchases are subject to business and market conditions, corporate and regulatory requirements, stock price, acquisition opportunities and other factors. As of January 1, 2022, approximately $1.1 billion of the share repurchase authorization remained available to repurchase shares of our common stock.
The following table presents repurchases made under our current authorization and shares surrendered by employees to satisfy income tax withholding obligations during the three months ended January 1, 2022:
| | | | | | | | | | | | | | | | | | | | | | | |
| Period | Total Number of Shares Purchased (1) | | Average Price Paid Per Share (2) | | Total Number of
Shares Purchased
as Part of
Publicly Announced
Plans or Programs | | Maximum Dollar Value of Shares Authorized for Repurchase Under Publicly Announced Plan or Program (1) (In millions) |
| October 3, 2021 - November 6, 2021 | 273,361 | | | $ | 160.04 | | | 258,000 | | | $ | 1,195 | |
| November 7, 2021 - December 4, 2021 | 206,571 | | | $ | 182.03 | | | 188,200 | | | $ | 1,161 | |
| December 5, 2021 - January 1, 2022 | 202,711 | | | $ | 182.44 | | | 188,800 | | | $ | 1,126 | |
| Total | 682,643 | | | $ | 173.34 | | | 635,000 | | | |
_________________
(1)Shares purchased that were not part of our publicly announced repurchase programs represent employee surrender of shares of restricted stock to satisfy employee income tax withholding obligations due upon vesting, and do not reduce the dollar value that may yet be purchased under our publicly announced repurchase programs.
(2)The weighted average price paid per share of common stock does not include the cost of commissions.
Item 6. [Reserved]
Item 7. Management’s Discussion and Analysis of Financial Condition and Results of Operations
The following discussion should be read in conjunction with the consolidated financial statements and notes thereto included elsewhere in this Annual Report on Form 10-K and with Part I, Item 1A, “Risk Factors.” Please refer to the cautionary language at the beginning of Part I of this Annual Report on Form 10-K regarding forward-looking statements.
Business Overview
We enable our customers to develop electronic products. Our products and services are designed to give our customers a competitive edge in their development of ICs, SoCs, and increasingly sophisticated electronic devices and systems. Our products and services do this by optimizing performance, minimizing power consumption, shortening the time to bring our customers’ products to market, improving engineering productivity and reducing their design, development and manufacturing costs. We offer software, hardware, services and reusable IC design blocks, which are commonly referred to as IP.
Our strategy, which we call Intelligent System Design, is to provide the technology necessary for our customers to develop electronic products across a variety of vertical markets including consumer, hyperscale computing, mobile, 5G communications, automotive, aerospace and defense, industrial and healthcare. Our products and services enable our customers to develop complex and innovative electronic products, so demand for our technology is driven by our customers’ investment in new designs and products. Historically, the industry that provided the tools used by IC engineers was referred to as EDA. Today, our offerings include and extend beyond EDA.
We group our products into categories related to major design activities:
•Custom IC Design and Simulation;
•Digital IC Design and Signoff;
•Functional Verification;
•IP; and
•System Design and Analysis.
During fiscal 2021, we continued to execute our Intelligent System Design strategy with our announcement of the next generation of hardware-software products in our Functional Verification product category, which consists of the integrated Palladium Z2 emulation and Protium X2 prototyping systems, to accelerate hardware debug and software validation. We also completed our acquisitions of Belgium-based NUMECA, a leader in computational fluid dynamics (“CFD”), and Pointwise Inc, a leading provider of CFD Meshing technology. The addition of these technologies and talent broadens our System Design and Analysis portfolio and expertise. These acquisitions increased expenses, including amortization of acquired intangible assets, more than revenue during fiscal 2021.
For additional information about our products, see the discussion in Item 1, “Business,” under the heading “Products and Product Strategy.”
Management uses certain performance indicators to manage our business, including revenue, certain elements of operating expenses and cash flow from operations, and we describe these items further below under the headings “Results of Operations” and “Liquidity and Capital Resources.”
During the second quarter of fiscal 2021, we offered a voluntary retirement program to eligible employees in the United States. This program resulted in a one-time charge for voluntary termination and post-employment benefits of $26.8 million. As of January 1, 2022, liabilities related to the voluntary retirement program were $17.5 million and were included in accounts payable and accrued liabilities and other long-term liabilities on our consolidated balance sheet. We expect to make cash payments to settle these liabilities through fiscal 2023, including $17.0 million that is expected to be paid in the next twelve months.
COVID-19 Impact
In March 2020, the World Health Organization declared the outbreak of COVID-19 a pandemic. The effects of the ongoing global pandemic have been widespread and have resulted in authorities implementing numerous measures to contain the virus, including travel bans and restrictions, quarantines, shelter-in-place orders and business limitations and shutdowns. We are unable to accurately predict the full impact that COVID-19 will have on our results of operations, financial condition, liquidity and cash flows due to numerous uncertainties, including the duration and severity of the pandemic and containment measures and the distribution, acceptance and effectiveness of vaccines. Our efforts to comply with these containment measures have impacted our day-to-day operations and could disrupt our business and operations, as well as that of our key customers, suppliers (including contract manufacturers) and other counterparties, for an indefinite period of time. To support the health and well-being of our employees, customers, partners and communities, a vast majority of our employees are still working remotely as of January 1, 2022. However, we have begun a limited pilot program for employees to begin voluntarily returning to work in certain jurisdictions with lower rates of new COVID-19 cases and higher vaccination rates.
Since its inception, the COVID-19 pandemic has caused some volatility in our delivery timing for our hardware and IP products to certain customers. Many of our customers’ employees are working remotely, and, in some cases, we have experienced delivery lead times that are longer than normal because of delays in getting access to customer sites to complete our deliveries. In other cases, the amount of our hardware and IP products that we have been able to deliver has been greater than we originally anticipated at the beginning of the respective period. Despite the challenges the COVID-19 pandemic has posed to our operations, it did not have a material, adverse impact on our results of operations, financial condition, liquidity or cash flows during fiscal 2021. We will continue to evaluate the nature and extent of the impact of COVID-19 on our business. See Part I, Item 1A, “Risk Factors” for additional information on the impact of COVID-19 on our business.
Results of Operations
The discussion of our fiscal 2021 consolidated results of operations include year-over-year comparisons to fiscal 2020 for revenue, cost of revenue, operating expenses, operating margin, other non-operating expenses, income taxes and cash flows. For a discussion of the fiscal 2020 changes compared to fiscal 2019, see the discussion in Item 7, “Management’s Discussion and Analysis of Financial Condition and Results of Operations” in our Annual Report on Form 10-K for the fiscal year ended January 2, 2021, filed on February 22, 2021.
Our fiscal years are 52- or 53-week periods ending on the Saturday closest to December 31. Fiscal 2021 was a 52-week fiscal year, compared to 2020, which was a 53-week fiscal year. The additional week in fiscal 2020 resulted in additional revenue of approximately $45 million and additional expense, including stock-based compensation and amortization of acquired intangibles, of approximately $35 million.
Results of operations for fiscal 2021, as compared to fiscal 2020, reflect the following:
•revenue growth that exceeded the growth of our costs and expenses;
•increased product and maintenance revenue, primarily from growth in our software and hardware product offerings;
•continued investment in research and development activities focused on expanding and enhancing our product portfolio; and
•higher selling costs, including additional investment in technical sales support in response to our customers’ increasing technological requirements.
Revenue
We primarily generate revenue from licensing our software and IP, selling or leasing our emulation and prototyping hardware technology, providing maintenance for our software, hardware and IP, providing engineering services and earning royalties generated from the use of our IP. The timing of our revenue is significantly affected by the mix of software, hardware and IP products generating revenue in any given period and whether the revenue is recognized over time or at a point in time, upon completion of delivery.
In any fiscal year, we expect that between 85% and 90% of our annual revenue will be characterized as recurring revenue. Revenue characterized as recurring includes revenue recognized over time from our software arrangements, services, royalties, maintenance on IP licenses and hardware, and operating leases of hardware and revenue recognized at varying points in time over the term of our IP Access Agreements that include non-cancellable commitments from customers.
The remainder of our revenue is recognized at a point in time and is characterized as up-front revenue. Up-front revenue is primarily generated by our sales of emulation and prototyping hardware and individual IP licenses. The percentage of our recurring and up-front revenue and fluctuations in revenue within our geographies are impacted by delivery of hardware and IP products to our customers in any single fiscal period.
Revenue by Year
The following table shows our revenue for fiscal 2021 and 2020 and the change in revenue between years:
| | | | | | | | | | | | | | | | | | | | | | | | | | | | | |
| | | | | | Change |
| | 2021 | | 2020 | | | | 2021 vs. 2020 | | |
| | (In millions, except percentages) |
| Product and maintenance | $ | 2,812.9 | | | $ | 2,536.6 | | | | | $ | 276.3 | | | 11 | % | | | | |
| Services | 175.3 | | | 146.3 | | | | | 29.0 | | | 20 | % | | | | |
| Total revenue | $ | 2,988.2 | | | $ | 2,682.9 | | | | | $ | 305.3 | | | 11 | % | | | | |
Product and maintenance revenue increased during fiscal 2021, as compared to fiscal 2020, primarily because of increased revenue from each of our five product categories. This growth is driven by our customers investing in new, complex designs for their products including electronic systems for consumer, hyperscale computing, 5G communications, automotive, aerospace and defense, industrial and healthcare.
Services revenue increased during fiscal 2021, as compared to fiscal 2020, primarily due to the timing of performance obligations being fulfilled for certain customer contracts during fiscal 2021. Services revenue may fluctuate from period to period based on the timing of fulfillment of our services and IP performance obligations.
No one customer accounted for 10% or more of total revenue during fiscal 2021 or 2020.
Revenue by Product Category
The following table shows the percentage of product and related maintenance revenue contributed by each of our five product categories and services during fiscal 2021 and 2020:
| | | | | | | | | | | | | |
| | 2021 | | 2020 | | |
| Custom IC Design and Simulation | 23 | % | | 25 | % | | |
| Digital IC Design and Signoff | 29 | % | | 29 | % | | |
| Functional Verification, including Emulation and Prototyping Hardware | 24 | % | | 22 | % | | |
| IP | 13 | % | | 14 | % | | |
| System Design and Analysis | 11 | % | | 10 | % | | |
| Total | 100 | % | | 100 | % | | |
Revenue by product category fluctuates from period to period based on demand for our products and services, our available resources and our ability to deliver and support them. Certain of our licensing arrangements allow customers the ability to remix among software products. Additionally, we have arrangements with customers that include a combination of our products, with the actual product selection and number of licensed users to be determined at a later date. For these arrangements, we estimate the allocation of the revenue to product categories based upon the expected usage of our products. The actual usage of our products by these customers may differ and, if that proves to be the case, the revenue allocation in the table above would differ.
Revenue by Geography
| | | | | | | | | | | | | | | | | | | | | | | | | | | | | |
| | | | | | Change |
| | 2021 | | 2020 | | | | 2021 vs. 2020 | | |
| | (In millions, except percentages) |
| United States | $ | 1,293.0 | | | $ | 1,096.3 | | | | | $ | 196.7 | | | 18 | % | | | | |
| Other Americas | 42.1 | | | 43.6 | | | | | (1.5) | | | (3) | % | | | | |
| China | 378.1 | | | 406.6 | | | | | (28.5) | | | (7) | % | | | | |
| Other Asia | 566.8 | | | 487.4 | | | | | 79.4 | | | 16 | % | | | | |
| Europe, Middle East and Africa | 523.4 | | | 469.8 | | | | | 53.6 | | | 11 | % | | | | |
| Japan | 184.8 | | | 179.2 | | | | | 5.6 | | | 3 | % | | | | |
| Total revenue | $ | 2,988.2 | | | $ | 2,682.9 | | | | | $ | 305.3 | | | 11 | % | | | | |
The increase in revenue in the United States and Other Asia during fiscal 2021, as compared to fiscal 2020, was attributable to growth in revenue from each of our five product categories.
The decrease in revenue in China during fiscal 2021, as compared to fiscal 2020, was due to higher-than-typical volume in China during fiscal 2020. During fiscal 2020, we experienced an increase in demand for our emulation and prototyping hardware and IP product offerings from our customers in China that resulted in a larger percentage of total revenue coming from that geography.
The increase in revenue in Europe, Middle East and Africa during fiscal 2021, as compared to fiscal 2020, was attributable to growth in revenue from System Design and Analysis, Digital IC Design and Custom IC Design product offerings.
Revenue by Geography as a Percent of Total Revenue | | | | | | | | | | | | | |
| | 2021 | | 2020 | | |
| United States | 43 | % | | 41 | % | | |
| Other Americas | 2 | % | | 1 | % | | |
| China | 13 | % | | 15 | % | | |
| Other Asia | 19 | % | | 18 | % | | |
| Europe, Middle East and Africa | 17 | % | | 18 | % | | |
| Japan | 6 | % | | 7 | % | | |
| Total | 100 | % | | 100 | % | | |
Most of our revenue is transacted in the United States dollar. However, certain revenue transactions are denominated in foreign currencies. For an additional description of how changes in foreign exchange rates affect our consolidated financial statements, see the discussion under Item 7A, “Quantitative and Qualitative Disclosures About Market Risk – Foreign Currency Risk.”
Cost of Revenue
| | | | | | | | | | | | | | | | | | | | | | | | | | | | | |
| | | | | | Change |
| | 2021 | | 2020 | | | | 2021 vs. 2020 | | |
| | (In millions, except percentages) |
| Cost of product and maintenance | $ | 222.6 | | | $ | 231.0 | | | | | $ | (8.4) | | | (4) | % | | | | |
| Cost of services | 84.4 | | | 74.5 | | | | | 9.9 | | | 13 | % | | | | |
| Total cost of revenue | $ | 307.0 | | | $ | 305.5 | | | | | $ | 1.5 | | | — | % | | | | |
The following table shows cost of revenue as a percentage of related revenue for fiscal 2021 and 2020:
| | | | | | | | | | | | | |
| | 2021 | | 2020 | | |
| Cost of product and maintenance | 8 | % | | 9 | % | | |
| Cost of services | 48 | % | | 51 | % | | |
Cost of Product and Maintenance
Cost of product and maintenance includes costs associated with the sale and lease of our emulation and prototyping hardware and licensing of our software and IP products, certain employee salary and benefits and other employee-related costs, cost of our customer support services, amortization of technology-related and maintenance-related acquired intangibles, costs of technical documentation and royalties payable to third-party vendors. Cost of product and maintenance depends primarily on our hardware product sales in any given period, but is also affected by employee salary and benefits and other employee-related costs, reserves for inventory, and the timing and extent to which we acquire intangible assets, license third-party technology or IP, and sell our products that include such acquired or licensed technology or IP.
A summary of cost of product and maintenance for fiscal 2021 and 2020 is as follows: | | | | | | | | | | | | | | | | | | | | | | | | | | | | | |
| | | | | | | | Change |
| | 2021 | | 2020 | | | | 2021 vs. 2020 | | |
| | (In millions, except percentages) |
| Product and maintenance-related costs | $ | 175.0 | | | $ | 184.8 | | | | | $ | (9.8) | | | (5) | % | | | | |
| Amortization of acquired intangibles | 47.6 | | | 46.2 | | | | | 1.4 | | | 3 | % | | | | |
| Total cost of product and maintenance | $ | 222.6 | | | $ | 231.0 | | | | | $ | (8.4) | | | (4) | % | | | | |
Product and maintenance-related costs decreased during fiscal 2021, when compared to fiscal 2020, due to the following:
| | | | | | | |
| | Change |
| | 2021 vs. 2020 | | |
| | (In millions) |
| Emulation and prototyping hardware costs | $ | (12.3) | | | |
| Salary, benefits and other employee-related costs | 2.6 | | | |
| Other items | (0.1) | | | |
| Total change in product and maintenance-related costs | $ | (9.8) | | | |
Costs associated with our emulation and prototyping hardware products include components, assembly, testing, applicable reserves and overhead. These costs make our cost of emulation and prototyping hardware products higher, as a percentage of revenue, than our cost of software and IP products. The decrease in emulation and prototyping hardware costs during fiscal 2021, as compared to fiscal 2020, was primarily due to the mix of products generating revenue and a decrease in charges related to previous generations of our emulation hardware.
Amortization of acquired intangibles included in cost of product and maintenance increased during fiscal 2021, as compared to fiscal 2020, primarily due to technology-related intangible assets acquired with our acquisitions of NUMECA and Pointwise during the first half of fiscal 2021 and in-process technology being placed into service during the second quarter of fiscal 2020. This increase was partially offset by certain technology-related intangible assets becoming fully amortized during fiscal 2021 and during fiscal 2020.
Cost of Services
Cost of services primarily includes employee salary, benefits and other employee-related costs to perform work on revenue-generating projects and costs to maintain the infrastructure necessary to manage a services organization. Cost of services may fluctuate from period to period based on our utilization of design services engineers on revenue-generating projects rather than internal development projects.
Operating Expenses
Our operating expenses include marketing and sales, research and development, and general and administrative expenses. Factors that tend to cause our operating expenses to fluctuate include changes in the number of employees due to hiring and acquisitions, our annual merit cycle, stock-based compensation, restructuring and other employment separation activities (such as the voluntary retirement program), foreign exchange rate movements, volatility in variable compensation programs that are driven by operating results and charitable donations.
Many of our operating expenses are transacted in various foreign currencies. We recognize lower expenses in periods when the United States dollar strengthens in value against other currencies and we recognize higher expenses when the United States dollar weakens against other currencies. For an additional description of how changes in foreign exchange rates affect our consolidated financial statements, see the discussion in Item 7A, “Quantitative and Qualitative Disclosures About Market Risk – Foreign Currency Risk.”
Our operating expenses for fiscal 2021 and 2020 were as follows:
| | | | | | | | | | | | | | | | | | | | | | | | | | | | | |
| | | | | | | | Change |
| | 2021 | | 2020 | | | | 2021 vs. 2020 | | |
| | (In millions, except percentages) |
| Marketing and sales | $ | 560.3 | | | $ | 516.5 | | | | | $ | 43.8 | | | 8 | % | | | | |
| Research and development | 1,134.3 | | | 1,033.7 | | | | | 100.6 | | | 10 | % | | | | |
| General and administrative | 189.0 | | | 154.4 | | | | | 34.6 | | | 22 | % | | | | |
| Total operating expenses | $ | 1,883.6 | | | $ | 1,704.6 | | | | | $ | 179.0 | | | 11 | % | | | | |
Our operating expenses, as a percentage of total revenue, for fiscal 2021 and 2020 were as follows:
| | | | | | | | | | | | | |
| | 2021 | | 2020 | | |
| Marketing and sales | 19 | % | | 19 | % | | |
| Research and development | 38 | % | | 39 | % | | |
| General and administrative | 6 | % | | 6 | % | | |
| Total operating expenses | 63 | % | | 64 | % | | |
Marketing and Sales
The changes in marketing and sales expense were due to the following:
| | | | | | | |
| | Change |
| | 2021 vs. 2020 | | |
| | (In millions) |
| Salary, benefits and other employee-related costs | $ | 35.2 | | | |
| Voluntary retirement program | 6.7 | | | |
| Professional services | 3.8 | | | |
| Home office-related expenses | (2.0) | | | |
| Other items | 0.1 | | | |
| Total change in marketing and sales expense | $ | 43.8 | | | |
Salary, benefits and other employee-related costs included in marketing and sales increased during fiscal 2021, as compared to fiscal 2020, primarily due to additional headcount from hiring and acquisitions and increased variable compensation. This increase was partially offset by reduced home office-related expenses associated with the transition to a remote work environment during fiscal 2020 due to the COVID-19 pandemic.
Research and Development
The changes in research and development expense were due to the following: | | | | | | | |
| | Change |
| | 2021 vs. 2020 | | |
| | (In millions) |
| Salary, benefits and other employee-related costs | $ | 75.9 | | | |
| Voluntary retirement program | 14.7 | | | |
| Facilities and other infrastructure costs | 7.7 | | | |
| Stock-based compensation | 6.2 | | | |
| Professional services | 2.7 | | | |
| Home office-related costs | (5.3) | | | |
| Other items | (1.3) | | | |
| Total change in research and development expense | $ | 100.6 | | | |
Salary, benefits and other employee-related costs included in research and development expense increased during fiscal 2021, as compared to fiscal 2020, due primarily to additional headcount from hiring and acquisitions as we continue to expand and enhance our product portfolio. This increase was partially offset by reduced home office-related expenses associated with the transition to a remote work environment during fiscal 2020 due to the COVID-19 pandemic.
General and Administrative
The changes in general and administrative expense were due to the following:
| | | | | | | |
| | Change |
| | 2021 vs. 2020 | | |
| | (In millions) |
| Contributions to non-profit organizations | $ | 15.0 | | | |
| Salary, benefits and other employee-related costs | 5.9 | | | |
| Stock-based compensation | 4.5 | | | |
| Professional services | 3.2 | | | |
| Voluntary retirement program | 2.2 | | | |
| Other items | 3.8 | | | |
| Total change in general and administrative expense | $ | 34.6 | | | |
The increase in contributions to non-profit organizations is the result of our continued commitment to support charitable initiatives. During the fourth quarter of fiscal 2021, we launched the Cadence Giving Foundation, a stand-alone, non-profit organization that was established to partner with other charitable initiatives to give back to the communities where we live and work. The Cadence Giving Foundation will also support critical needs in areas such as diversity, equity and inclusion, environmental sustainability and STEM education.
Salary, benefits and other employee-related costs included in general and administrative expense increased during fiscal 2021, as compared to fiscal 2020, due primarily to additional headcount from hiring and acquisitions.
Amortization of Acquired Intangibles
Amortization of acquired intangibles consists primarily of amortization of customer relationships, acquired backlog, trade names, trademarks and patents. Amortization in any given period depends primarily on the timing and extent to which we acquire intangible assets.
| | | | | | | | | | | | | | | | | | | | | | | | | | | | | |
| | | | | | | | Change |
| | 2021 | | 2020 | | | | 2021 vs. 2020 | | |
| | (In millions, except percentages) |
| Amortization of acquired intangibles | $ | 19.6 | | | $ | 18.0 | | | | | $ | 1.6 | | | 9 | % | | | | |
Amortization of acquired intangibles increased during fiscal 2021, as compared to fiscal 2020, primarily due to intangibles assets acquired from Pointwise and Numeca during fiscal 2021.
Restructuring
We have initiated restructuring plans in recent years, most recently in fiscal 2020, to better align our resources with our business strategy. Because the restructuring charges and related benefits are derived from management’s estimates made during the formulation of the restructuring plans, based on then-currently available information, our restructuring plans may not achieve the benefits anticipated on the timetable or at the level contemplated. Additional actions, including further restructuring of our operations, may be required in the future. For additional information about our restructuring plans, see Note 16 in the notes to consolidated financial statements.
Operating margin
Operating margin represents income from operations as a percentage of total revenue. Our operating margin for fiscal 2021 and 2020 was as follows:
| | | | | | | | | | | | | |
| 2021 | | 2020 | | |
| Operating margin | 26 | % | | 24 | % | | |
Operating margin increased during fiscal 2021, as compared to fiscal 2020, primarily because revenue growth in each of our five product categories exceeded growth in operating expenses.
Interest Expense
Interest expense for fiscal 2021 and 2020 was comprised of the following:
| | | | | | | | | | | | | |
| | 2021 | | 2020 | | |
| | (In millions) |
| Contractual cash interest expense: | | | | | |
| 2024 Notes | $ | 15.3 | | | $ | 15.5 | | | |
| Revolving credit facility | 0.7 | | | 4.4 | | | |
| Amortization of debt discount: | | | | | |
| 2024 Notes | 0.8 | | | 0.8 | | | |
| Other | 0.2 | | | — | | | |
| Total interest expense | $ | 17.0 | | | $ | 20.7 | | | |
Interest expense decreased during fiscal 2021, as compared to fiscal 2020, primarily due to a decrease in outstanding borrowing under our revolving credit facility. During the first quarter of fiscal 2020, we had outstanding borrowings of $350 million under our revolving credit facility as a precautionary measure to provide additional liquidity in light of global economic uncertainty that was present at that time. All outstanding borrowings under our revolving credit facility were repaid in the fourth quarter of fiscal 2020. For an additional description of our debt arrangements, including our revolving credit facility, see Note 3 in the notes to consolidated financial statements.
Income Taxes
The following table presents the provision for income taxes and the effective tax rate for fiscal 2021 and 2020:
| | | | | | | | | | | | | |
| | 2021 | | 2020 | | |
| | (In millions, except percentages) |
| Provision for income taxes | $ | 72.5 | | | $ | 42.1 | | | |
| Effective tax rate | 9.4 | % | | 6.7 | % | | |
Our provision for fiscal 2021 was primarily attributable to federal, state and foreign income taxes on our fiscal 2021 income, partially offset by the tax benefit of $22.1 million related to our foreign-derived intangible income, and the tax benefit of $64.3 million related to stock-based compensation that vested or was exercised during the period. We also recognized a tax benefit of $10.5 million related to the release of the valuation allowance on our Massachusetts R&D tax credits because we expect to utilize these tax credits prior to expiration based on strong current earnings and future taxable income projections.
Our provision for fiscal 2020 was primarily attributable to federal, state and foreign income taxes on our fiscal 2020 income, partially offset by the tax benefit of $22.2 million related to the partial release of the valuation allowance on our California R&D tax credit deferred tax assets and the tax benefit of $60.1 million related to stock-based compensation that vested or was exercised during fiscal 2020.
The United States enacted the Tax Cuts and Jobs Act in December 2017 that requires companies to capitalize all of their R&D costs, including software development costs, incurred in tax years beginning after December 31, 2021. Beginning in fiscal 2022, we must capitalize and amortize R&D costs over five years for domestic research and 15 years for international research rather than expensing these costs as incurred. If the United States doesn’t repeal or defer the effective date of the law in the future, then we expect our fiscal 2022 effective tax rate and our cash tax payments to increase significantly as compared to fiscal 2021. We also expect to recognize increases to our deferred tax assets as we begin to capitalize domestic research costs.
Our future effective tax rates may also be materially impacted by tax amounts associated with our foreign earnings at rates different from the United States federal statutory rate, research credits, the tax impact of stock-based compensation, accounting for uncertain tax positions, business combinations, closure of statutes of limitations or settlement of tax audits, changes in valuation allowance and changes in tax law. A significant amount of our foreign earnings is generated by our subsidiaries organized in Ireland and Hungary. Our future effective tax rates may be adversely affected if our earnings were to be lower in countries where we have lower statutory tax rates. We currently expect that our fiscal 2022 effective tax rate will be approximately 25%. We expect that our quarterly effective tax rates will vary from our fiscal 2022 effective tax rate as a result of recognizing the income tax effects of stock-based awards in the quarterly periods that the awards vest or are settled and other items that we cannot anticipate. For additional discussion about how our effective tax rate could be affected by various risks, see Part I, Item 1A, “Risk Factors.” For further discussion regarding our income taxes, see Note 8 in the notes to consolidated financial statements.
Liquidity and Capital Resources | | | | | | | | | | | | | | | | | | | | | |
| | As of | | Change |
| | January 1,
2022 | | January 2,
2021 | | | | 2021 vs. 2020 | | |
| | (In millions) |
| Cash and cash equivalents | $ | 1,088.9 | | | $ | 928.4 | | | | | $ | 160.5 | | | |
| Net working capital | 744.5 | | | 681.8 | | | | | 62.7 | | | |
Cash and Cash Equivalents
As of January 1, 2022, our principal sources of liquidity consisted of $1,088.9 million of cash and cash equivalents as compared to $928.4 million as of January 2, 2021.
Our primary sources of cash and cash equivalents during fiscal 2021 were cash generated from operations, proceeds from the exercise of stock options and proceeds from stock purchases under our employee stock purchase plan.
Our primary uses of cash and cash equivalents during fiscal 2021 were payments related to salaries and benefits, operating expenses, repurchases of our common stock, payments for business combinations, net of cash acquired, payments for income taxes, purchases of inventory, payment of employee taxes on vesting of restricted stock and purchases of property, plant and equipment.
Approximately 55% of our cash and cash equivalents were held by our foreign subsidiaries as of January 1, 2022. Our cash and cash equivalents held by our foreign subsidiaries may vary from period to period due to the timing of collections and repatriation of foreign earnings.
Net Working Capital
Net working capital is comprised of current assets less current liabilities, as shown on our consolidated balance sheets. The increase in our net working capital as of January 1, 2022, as compared to January 2, 2021, is primarily due to improved results from operations, the timing of cash receipts from customers and disbursements made to vendors.
Cash Flows from Operating Activities
Cash flows from operating activities during fiscal 2021 and 2020 were as follows: | | | | | | | | | | | | | | | | | | | | | |
| | | | Change |
| | 2021 | | 2020 | | | | 2021 vs. 2020 | | |
| | (In millions) |
| Cash provided by operating activities | $ | 1,101.0 | | | $ | 904.9 | | | | | $ | 196.1 | | | |
Cash flows from operating activities include net income, adjusted for certain non-cash items, as well as changes in the balances of certain assets and liabilities. Our cash flows from operating activities are significantly influenced by business levels and the payment terms set forth in our customer agreements. The increase in cash flows from operating activities during fiscal 2021, as compared to fiscal 2020, was primarily due to improved results from operations and timing of cash receipts from customers and disbursements made to vendors.
Cash Flows from Investing Activities
Cash flows used for investing activities during fiscal 2021 and 2020 were as follows: | | | | | | | | | | | | | | | | | | | | | |
| | | | Change |
| | 2021 | | 2020 | | | | 2021 vs. 2020 | | |
| | (In millions) |
| Cash used for investing activities | $ | (293.0) | | | $ | (292.2) | | | | | $ | (0.8) | | | |
Cash used for investing activities during fiscal 2021 and fiscal 2020, consisted primarily of cash paid in business combinations, net of cash acquired, and payments for purchases of property, plant and equipment. We expect to continue our investing activities, including purchasing property, plant and equipment, purchasing intangible assets, business combinations, purchasing software licenses, and making strategic investments.
Cash Flows from Financing Activities
Cash flows used for financing activities during fiscal 2021 and 2020 were as follows: | | | | | | | | | | | | | | | | | | | | | |
| | | | Change |
| | 2021 | | 2020 | | | | 2021 vs. 2020 | | |
| | (In millions) |
| Cash used for financing activities | $ | (643.8) | | | $ | (415.3) | | | | | $ | (228.5) | | | |
The increase in cash used for financing activities during fiscal 2021, as compared to fiscal 2020, was primarily due to an increase in payments for repurchases of our common stock.
Other Factors Affecting Liquidity and Capital Resources
Stock Repurchase Program
As of the end of fiscal 2020, approximately $739 million remained available under the previously announced authorization to repurchase shares of our common stock. In August 2021, our Board of Directors increased the prior authorization to repurchase shares of our common stock by authorizing an additional $1 billion. The actual timing and amount of repurchases are subject to business and market conditions, corporate and regulatory requirements, stock price, acquisition opportunities and other factors. As of January 1, 2022, approximately $1.1 billion remained available to repurchase shares of our common stock. See Part II, Item 5, “Market for Registrant’s Common Equity, Related Stockholder Matters and Issuer Purchases of Equity Securities” for additional information.
Revolving Credit Facility
On June 30, 2021, we terminated our then-existing revolving credit facility, dated January 30, 2017, and entered into a five-year senior unsecured revolving credit facility with a group of lenders led by Bank of America, N.A., as administrative agent (the “2021 Credit Facility”). The 2021 Credit Facility provides for borrowings up to $700.0 million, with the right to request increased capacity up to an additional $350.0 million upon receipt of lender commitments, for total maximum borrowings of $1.05 billion. The 2021 Credit Facility expires on June 30, 2026. Any outstanding loans drawn under the 2021 Credit Facility are due at maturity on June 30, 2026, subject to an option to extend the maturity date. Outstanding borrowings may be repaid at any time prior to maturity. As of January 1, 2022, there were no borrowings outstanding under the 2021 Credit Facility, and we were in compliance with all financial covenants associated with such credit facility.
2024 Notes
In October 2014, we issued $350.0 million aggregate principal amount of 4.375% Senior Notes due October 15, 2024. We received net proceeds of $342.4 million from the issuance of the 2024 Notes, net of a discount of $1.4 million and issuance costs of $6.2 million. Interest is payable in cash semi-annually. The 2024 Notes are unsecured and rank equal in right of payment to all of our existing and future senior indebtedness. As of January 1, 2022, we were in compliance with all covenants associated with the 2024 Notes.
For additional information relating to our debt arrangements, see Note 3 in the notes to consolidated financial statements.
Other Liquidity Requirements
A summary of other capital and liquidity requirements as of January 1, 2022 is as follows:
| | | | | | | | | | | |
| Total | | Due in Less Than 1 Year |
| (In millions) |
Operating lease obligations(1) | $ | 171.1 | | | $ | 32.0 | |
Purchase obligations | 62.4 | | | 50.9 | |
| Contractual interest payments | 48.7 | | | 15.9 | |
| Voluntary retirement program | 17.5 | | | 17.0 | |
| Income tax payable | 8.0 | | | 8.0 | |
Other long-term contractual obligations (2) | 47.9 | | | — | |
| Total | $ | 355.6 | | | $ | 123.8 | |
_________________
(1) This table includes future payments under leases that had commenced as of January 1, 2022 as well as leases that had been signed but not yet commenced as of January 1, 2022.
(2) Included in other long-term contractual obligations are long-term income tax liabilities of $23.1 million related to unrecognized tax benefits. The remaining portion of other long-term contractual obligations is primarily liabilities associated with defined benefit retirement plans and acquisitions.
We expect that current cash and cash equivalent balances, cash flows that are generated from operations and financing activities will be sufficient to meet the needs of our domestic and international operating activities, and other capital and liquidity requirements, including acquisitions and share repurchases for at least the next 12 months and thereafter for the foreseeable future.
Off-Balance Sheet Arrangements
As of January 1, 2022, we did not have any significant off-balance sheet arrangements that are reasonably likely to have a material current or future effect on our operating results or financial condition.
Critical Accounting Estimates
In preparing our consolidated financial statements, we make assumptions, judgments and estimates that can have a significant impact on our revenue, operating income and net income, as well as on the value of certain assets and liabilities on our consolidated balance sheets. We base our assumptions, judgments and estimates on historical experience and various other factors that we believe to be reasonable under the circumstances. Actual results could differ materially from these estimates under different assumptions or conditions. At least quarterly, we evaluate our assumptions, judgments and estimates, and make changes as deemed necessary.
We believe that the assumptions, judgments and estimates involved in the accounting for income taxes, revenue recognition and business combinations have the greatest potential impact on our consolidated financial statements; therefore, we consider these to be our critical accounting estimates. For information on our significant accounting policies, see Note 2 in the notes to consolidated financial statements.
Revenue Recognition
Our contracts with customers often include promises to transfer multiple software and/or IP licenses, hardware and services, including professional services, technical support services, and rights to unspecified updates to a customer. These contracts require us to apply judgment in identifying and evaluating any terms and conditions in contracts which may impact revenue recognition. Determining whether licenses and services are distinct performance obligations that should be accounted for separately, or not distinct and thus accounted for together, requires significant judgment. In some arrangements, such as most of our IP license arrangements, we have concluded that the licenses and associated services are distinct from each other. In other arrangements, like our time-based software arrangements, the licenses and certain services are not distinct from each other. Our time-based software arrangements include multiple software licenses and updates to the licensed software products, as well as technical support, and we have concluded that these promised goods and services are a single, combined performance obligation.
Judgment is required to determine the stand-alone selling prices (“SSPs”) for each distinct performance obligation. We rarely license or sell products on a standalone basis, so we are required to estimate the SSP for each performance obligation. In instances where the SSP is not directly observable because we do not sell the license, product or service separately, we determine the SSP using information that may include market conditions and other observable inputs. We typically have more than one SSP for individual performance obligations due to the stratification of those items by classes of customers and circumstances. In these instances, we may use information such as the size of the customer and geographic region of the customer in determining the SSP.
Revenue is recognized over time for our combined performance obligations that include software licenses, updates, and technical support as well as for maintenance and professional services that are separate performance obligations. For our professional services, revenue is recognized over time, generally using costs incurred or hours expended to measure progress. Judgment is required in estimating project status and the costs necessary to complete projects. A number of internal and external factors can affect these estimates, including labor rates, utilization and efficiency variances and specification and testing requirement changes. For our other performance obligations recognized over time, revenue is generally recognized using a time-based measure of progress reflecting generally consistent efforts to satisfy those performance obligations throughout the arrangement term.
If a group of agreements are so closely related that they are, in effect, part of a single arrangement, such agreements are deemed to be one arrangement for revenue recognition purposes. We exercise significant judgment to evaluate the relevant facts and circumstances in determining whether the separate agreements should be accounted for separately or as, in substance, a single arrangement. Our judgments about whether a group of contracts comprise a single arrangement can affect the allocation of consideration to the distinct performance obligations, which could have an effect on results of operations for the periods involved.
We are required to estimate the total consideration expected to be received from contracts with customers. In some circumstances, the consideration expected to be received is variable based on the specific terms of the contract or based on our expectations of the term of the contract. Generally, we have not experienced significant returns or refunds to customers. These estimates require significant judgment and the change in these estimates could have an effect on our results of operations during the periods involved.
Accounting for Income Taxes
We are subject to income taxes in the United States and numerous foreign jurisdictions. Significant judgment is required in evaluating and estimating our provision for these taxes. There are many transactions that occur during the ordinary course of business for which the ultimate tax determination is uncertain. Our provision for income taxes could be adversely affected by our earnings being lower than anticipated in countries where we have lower statutory rates and higher than anticipated in countries where we have higher statutory rates, losses incurred in jurisdictions for which we are not able to realize the related tax benefit, changes in foreign currency exchange rates, entry into new businesses and geographies and changes to our existing businesses, acquisitions and investments, changes in our deferred tax assets and liabilities including changes in our assessment of valuation allowances, changes in the relevant tax laws or interpretations of these tax laws, and developments in current and future tax examinations.
We only recognize the tax benefit of an income tax position if we judge that it is more likely than not that the tax position will be sustained, solely on its technical merits, in a tax audit including resolution of any related appeals or litigation processes. To make this judgment, we must interpret complex and sometimes ambiguous tax laws, regulations and administrative practices. If we judge that an income tax position meets this recognition threshold, then we must measure the amount of the tax benefit to be recognized by estimating the largest amount of tax benefit that has a greater than 50% cumulative probability of being realized upon settlement with a taxing authority that has full knowledge of all of the relevant facts. It is inherently difficult and subjective to estimate such amounts, as this requires us to determine the probability of various possible settlement outcomes. We must reevaluate our income tax positions on a quarterly basis to consider factors such as changes in facts or circumstances, changes in tax law, effectively settled issues under audit, the lapse of applicable statute of limitations, and new audit activity. Such a change in recognition or measurement would result in recognition of a tax benefit or an additional charge to the tax provision. For a more detailed description of our unrecognized tax benefits, see Note 8 in the notes to consolidated financial statements.
During fiscal 2019, we completed intercompany transfers of certain intangible property rights to our Irish subsidiary, which resulted in the establishment of a deferred tax asset and the recognition of an income tax benefit of $575.6 million. To determine the value of the deferred tax asset, we were required to make significant estimates in determining the fair value of the transferred IP rights. These estimates included, but are not limited to, the income and cash flows that the IP rights are expected to generate in the future, the appropriate discount rate to apply to the income and cash flow projections, and the useful lives of the IP rights. These estimates are inherently uncertain and unpredictable, and if different estimates were used, it would impact the fair value of the IP rights and the related value of the deferred tax asset and the income tax benefit recognized in fiscal 2019 and in future periods when the deferred tax asset is realized. In addition, we reviewed the need to establish a valuation allowance on the deferred tax asset of $575.6 million by evaluating whether there is a greater than 50% likelihood that some portion or all of the deferred tax asset will not be realized. To make this judgment, we must make significant estimates and predictions of the amount and category of future taxable income from various sources and weigh all available positive and negative evidence about these possible sources of taxable income. We give greater weight to evidence that can be objectively verified. Based on our evaluation and weighting of the positive and negative evidence, we concluded that it is greater than 50% likely that the deferred tax asset of $575.6 million will be realized in future periods and that a valuation allowance was not currently required. If, in the future, we evaluate that this deferred tax asset is not likely to be realized, an increase in the related valuation allowance could result in a material income tax expense in the period such a determination is made.
Business Combinations
When we acquire businesses, we allocate the purchase price to the acquired tangible assets and assumed liabilities, including deferred revenue, liabilities associated with the fair value of contingent consideration and acquired identifiable intangible assets. Any residual purchase price is recorded as goodwill. The allocation of the purchase price requires us to make significant estimates in determining the fair values of these acquired assets and assumed liabilities, especially with respect to intangible assets and goodwill. These estimates are based on information obtained from management of the acquired companies, our assessment of this information, and historical experience. These estimates can include, but are not limited to, the cash flows that an acquired business is expected to generate in the future, the cash flows that specific assets acquired with that business are expected to generate in the future, the appropriate weighted average cost of capital, and the cost savings expected to be derived from acquiring an asset. These estimates are inherently uncertain and unpredictable, and if different estimates were used, the purchase price for the acquisition could be allocated to the acquired assets and assumed liabilities differently from the allocation that we have made to the acquired assets and assumed liabilities. In addition, unanticipated events and circumstances may occur that may affect the accuracy or validity of such estimates, and if such events occur, we may be required to adjust the value allocated to acquired assets or assumed liabilities.
We also make significant judgments and estimates when we assign useful lives to the definite-lived intangible assets identified as part of our acquisitions. These estimates are inherently uncertain and if we used different estimates, the useful life over which we amortize intangible assets would be different. In addition, unanticipated events and circumstances may occur that may impact the useful life assigned to our intangible assets, which would impact our amortization of intangible assets expense and our results of operations.
During fiscal 2021, we acquired intangible assets of $88.9 million with our acquisition of NUMECA and Pointwise. The fair value of the definite-lived intangible assets acquired with these acquisitions was determined using variations of the income approach.
For acquired existing technology, the fair value was determined by applying the relief-from-royalty method. This method is based on the application of a royalty rate to forecasted revenue to quantify the benefit of owning the intangible asset rather than paying a royalty for use of the asset. To estimate royalty savings over time, we projected revenue from the acquired existing technology over the estimated remaining life of the technology, including the effect of assumed technological obsolescence, before applying an assumed royalty rate. For NUMECA, we assumed technological obsolescence at a rate of 6.7% annually, before applying an assumed royalty rate of 22%. For Pointwise, we assumed technological obsolescence at a rate of 10.0% annually, before applying an assumed royalty rate of 25%. The present value of after-tax royalty savings were determined using discount rates ranging from 10.5% to 12.0%.
The fair value for acquired agreements and relationships was determined by using the multi-period excess earnings method. This method reflects the present value of the projected cash flows that are expected to be generated from existing customers, less charges representing the contribution of other assets to those cash flows. Projected income from existing customer relationships considered a customer retention rate of 95% for both NUMECA and Pointwise. The present value of operating cash flows from existing customers was determined using discount rates ranging from 10.5% to 12.0%.
We believe that our estimates and assumptions related to the fair value of its acquired intangible assets are reasonable, but significant judgment is involved.
New Accounting Standards
For additional information about the adoption of new accounting standards, see Note 2 in the notes to consolidated financial statements.
Item 7A. Quantitative and Qualitative Disclosures About Market Risk
Foreign Currency Risk
A material portion of our revenue, expenses and business activities are transacted in the U.S. dollar. In certain foreign countries where we price our products and services in U.S. dollars, a decrease in value of the local currency relative to the U.S. dollar results in an increase in the prices for our products and services compared to those products of our competitors that are priced in local currency. This could result in our prices being uncompetitive in certain markets.
In certain countries where we may invoice customers in the local currency, our revenues benefit from a weaker dollar and are adversely affected by a stronger dollar. The opposite impact occurs in countries where we record expenses in local currencies. In those cases, our costs and expenses benefit from a stronger dollar and are adversely affected by a weaker dollar. The fluctuations in our operating expenses outside the United States resulting from volatility in foreign exchange rates are not generally moderated by corresponding fluctuations in revenues from existing contracts.
We enter into foreign currency forward exchange contracts to protect against currency exchange risks associated with existing assets and liabilities. A foreign currency forward exchange contract acts as a hedge by increasing in value when underlying assets decrease in value or underlying liabilities increase in value due to changes in foreign exchange rates. Conversely, a foreign currency forward exchange contract decreases in value when underlying assets increase in value or underlying liabilities decrease in value due to changes in foreign exchange rates. These forward contracts are not designated as accounting hedges, so the unrealized gains and losses are recognized in other income, net, in advance of the actual foreign currency cash flows with the fair value of these forward contracts being recorded as accrued liabilities or other current assets.
We do not use forward contracts for trading purposes. Our forward contracts generally have maturities of 90 days or less. We enter into foreign currency forward exchange contracts based on estimated future asset and liability exposures, and the effectiveness of our hedging program depends on our ability to estimate these future asset and liability exposures. Recognized gains and losses with respect to our current hedging activities will ultimately depend on how accurately we are able to match the amount of foreign currency forward exchange contracts with actual underlying asset and liability exposures.
The following table provides information about our foreign currency forward exchange contracts as of January 1, 2022. The information is provided in United States dollar equivalent amounts. The table presents the notional amounts, at contract exchange rates, and the weighted average contractual foreign currency exchange rates expressed as units of the foreign currency per United States dollar, which in some cases may not be the market convention for quoting a particular currency. All of these forward contracts matured during February, 2022.
| | | | | | | | | | | |
| Notional
Principal | | Weighted
Average
Contract
Rate |
| | (In millions) | | |
| Forward Contracts: | | | |
| European Union euro | $ | 140.8 | | | 0.88 | |
| British pound | 104.3 | | | 0.74 | |
| Israeli shekel | 84.1 | | | 3.10 | |
| Japanese yen | 57.5 | | | 114.50 | |
| Indian rupee | 29.4 | | | 75.23 | |
| Swedish krona | 22.3 | | | 9.01 | |
| Canadian dollar | 11.7 | | | 1.26 | |
| Chinese renminbi | 7.3 | | | 6.43 | |
| Taiwan dollar | 5.6 | | | 27.62 |
| Other | 6.4 | | | N/A |
| Total | $ | 469.4 | | | |
| Estimated fair value | $ | (0.3) | | | |
We actively monitor our foreign currency risks, but our foreign currency hedging activities may not substantially offset the impact of fluctuations in currency exchange rates on our results of operations, cash flows and financial position.
Interest Rate Risk
Our exposure to market risk for changes in interest rates relates primarily to our portfolio of cash and cash equivalents and balances outstanding on our revolving credit facility, if any. We are exposed to interest rate fluctuations in many of the world’s leading industrialized countries, but our interest income and expense is most sensitive to fluctuations in the general level of United States interest rates. In this regard, changes in United States interest rates affect the interest earned on our cash and cash equivalents and the costs associated with foreign currency hedges.
All highly liquid securities with a maturity of three months or less at the date of purchase are considered to be cash equivalents. The carrying value of our interest-bearing instruments approximated fair value as of January 1, 2022.
Interest rates under our revolving credit facility are variable, so interest expense could be adversely affected by changes in interest rates, particularly for periods when we maintain a balance outstanding under the revolving credit facility. Interest rates for our revolving credit facility can fluctuate based on changes in market interest rates and in an interest rate margin that varies based on our consolidated leverage ratio. Assuming all loans were fully drawn and we were to fully exercise our right to increase borrowing capacity under our revolving credit facility, each quarter point change in interest rates would result in a $2.6 million change in annual interest expense on our indebtedness under our revolving credit facility. As of January 1, 2022, there were no borrowings outstanding under our revolving credit facility. For an additional description of the revolving credit facility, see Note 3 in the notes to consolidated financial statements.
Equity Price Risk
Equity Investments
We have a portfolio of equity investments that includes marketable equity securities and non-marketable investments. Our equity investments are made primarily in connection with our strategic investment program. Under our strategic investment program, from time to time, we make cash investments in companies with technologies that are potentially strategically important to us. See Note 8 in the notes to consolidated financial statements for an additional description of these investments.
Item 8. Financial Statements and Supplementary Data
The financial statements required by Item 8 are submitted as a separate section of this Annual Report on Form 10-K. See Part IV, Item 15, “Exhibits and Financial Statement Schedules.”
Item 9. Changes in and Disagreements With Accountants on Accounting and Financial Disclosure
None.
Item 9A. Controls and Procedures
Evaluation of Disclosure Controls and Procedures
As required by Rule 13a-15 of the Securities Exchange Act of 1934, as amended (the “Exchange Act”) under the supervision and with the participation of our management, including our Chief Executive Officer (“CEO”) and our Chief Financial Officer (“CFO”), we evaluated the effectiveness of the design and operation of our disclosure controls and procedures (as defined in Rules 13a-15(e) and 15d-15(e) under the Exchange Act) as of January 1, 2022.
The evaluation of our disclosure controls and procedures included a review of our processes and the effect on the information generated for use in this Annual Report on Form 10-K. In the course of this evaluation, we sought to identify any material weaknesses in our disclosure controls and procedures, to determine whether we had identified any acts of fraud involving personnel who have a significant role in our disclosure controls and procedures, and to confirm that any necessary corrective action, including process improvements, was taken. This type of evaluation is done every fiscal quarter so that our conclusions concerning the effectiveness of these controls can be reported in our periodic reports filed with the SEC. The overall goals of these evaluation activities are to monitor our disclosure controls and procedures and to make modifications as necessary. We intend to maintain these disclosure controls and procedures, modifying them as circumstances warrant.
Based on their evaluation as of January 1, 2022, our CEO and CFO have concluded that our disclosure controls and procedures were effective to provide reasonable assurance that the information required to be disclosed by us in our reports filed or submitted under the Exchange Act is recorded, processed, summarized and reported within the time periods specified in the SEC’s rules and forms and is accumulated and communicated to our management, including the CEO and CFO, as appropriate to allow timely decisions regarding required disclosure.
Changes in Internal Control Over Financial Reporting
There were no changes in our internal control over financial reporting during the fiscal quarter ended January 1, 2022 that materially affected, or are reasonably likely to materially affect, our internal control over financial reporting.
Inherent Limitations on Effectiveness of Controls
Our management, including our CEO and CFO, does not expect that our disclosure controls and procedures or our internal control over financial reporting will prevent or detect all errors and all fraud. Internal control over financial reporting, no matter how well conceived and operated, can provide only reasonable, not absolute, assurance that the objectives of internal control are met. Further, the design of internal control must reflect the fact that there are resource constraints, and the benefits of the control must be considered relative to their costs. While our disclosure controls and procedures and internal control over financial reporting are designed to provide reasonable assurance of their effectiveness, because of the inherent limitations in all control systems, no evaluation of controls can provide absolute assurance that all control issues and instances of fraud, if any, within Cadence, have been detected.
Management’s Report on Internal Control Over Financial Reporting
Our management is responsible for establishing and maintaining adequate internal control over financial reporting (as defined in Rule 13a-15(f) under the Exchange Act). Our management assessed the effectiveness of our internal control over financial reporting as of January 1, 2022. In making this assessment, our management used the criteria established in Internal Control-Integrated Framework (2013) issued by the Committee of Sponsoring Organizations of the Treadway Commission (“COSO”). Our management has concluded that, as of January 1, 2022, our internal control over financial reporting is effective based on these criteria. Our independent registered public accounting firm, PricewaterhouseCoopers LLP, has issued an attestation report on our internal control over financial reporting, which is included in Part IV, Item 15, “Exhibits and Financial Statement Schedules.”
Item 9B. Other Information
None.
Item 9C. Disclosure Regarding Foreign Jurisdictions that Prevent Inspections
None.
PART III.
Item 10. Directors, Executive Officers and Corporate Governance
The information required by Item 10 as to directors is incorporated herein by reference from the sections entitled “Proposal 1 - Election of Directors” and, as applicable, “Security Ownership of Certain Beneficial Owners and Management - Delinquent Section 16(a) Reports” in Cadence’s definitive proxy statement for its 2022 Annual Meeting of Stockholders. The executive officers of Cadence are listed at the end of Item 1 of Part I of this Annual Report on Form 10-K.
The information required by Item 10 as to Cadence’s code of ethics is incorporated herein by reference from the section entitled “Corporate Governance - Code of Business Conduct” in Cadence’s definitive proxy statement for its 2022 Annual Meeting of Stockholders.
The information required by Item 10 as to the director nomination process and Cadence’s Audit Committee is incorporated by reference from the section entitled “Board of Directors - Committees of the Board” in Cadence’s definitive proxy statement for its 2022 Annual Meeting of Stockholders.
Item 11. Executive Compensation
The information required by Item 11 is incorporated herein by reference from the sections entitled “Board of Directors - Components of Director Compensation,” “Board of Directors - Director Compensation for Fiscal 2021,” “Compensation Discussion and Analysis,” “Compensation Committee Report,” “Compensation Committee Interlocks and Insider Participation,” “Compensation of Executive Officers,” “Potential Payments Upon Termination or Change In Control,” and “Pay Ratio Disclosure” in Cadence’s definitive proxy statement for its 2022 Annual Meeting of Stockholders.
Item 12. Security Ownership of Certain Beneficial Owners and Management and Related Stockholder Matters
The information required by Item 12 is incorporated herein by reference from the sections entitled “Security Ownership of Certain Beneficial Owners and Management” and “Equity Compensation Plan Information” in Cadence’s definitive proxy statement for its 2022 Annual Meeting of Stockholders.
Item 13. Certain Relationships and Related Transactions and Director Independence
The information required by Item 13 is incorporated herein by reference from the sections entitled “Certain Transactions” and “Board of Directors - Director Independence” in Cadence’s definitive proxy statement for its 2022 Annual Meeting of Stockholders.
Item 14. Principal Accountant Fees and Services
The information required by Item 14 is incorporated herein by reference from the section entitled “Fees Billed to Cadence by the Independent Registered Public Accounting Firm During Fiscal 2021 and 2020” in Cadence’s definitive proxy statement for its 2022 Annual Meeting of Stockholders.
PART IV.
Item 15. Exhibits and Financial Statement Schedules | | | | | | | | |
| Page |
| (a) 1. Financial Statements | |
| | |
| | |
| | |
| | |
| | |
| | |
| | |
| | |
| | |
| | |
| | |
| | |
| | |
| | |
| | |
| (a) 2. Financial Statement Schedules | |
| | |
| | |
| | |
| All financial statement schedules are omitted because they are not applicable, not required or the required information is shown in the consolidated financial statements or notes thereto. | |
| | |
| |
| | |
The exhibits listed in the accompanying Exhibit Index are filed or incorporated by reference as part of this Annual Report on Form 10-K.
The exhibits filed or incorporated by reference as part of this Annual Report on Form 10-K contain agreements to which Cadence is a party. These agreements are included to provide information regarding their terms and are not intended to provide any other factual or disclosure information about Cadence or the other parties to the agreements. Certain of the agreements contain representations and warranties by each of the parties to the applicable agreement, and any such representations and warranties have been made solely for the benefit of the other parties to the applicable agreement as of specified dates, may apply materiality standards that are different than those applied by investors, and may be subject to important qualifications and limitations that are not necessarily reflected in the agreement. Accordingly, these representations and warranties may not describe the actual state of affairs as of the date they were made or at any other time, and should not be relied upon as statements of factual information.
_____________
© 2022 Cadence Design Systems, Inc. All rights reserved worldwide. Cadence, the Cadence logo, and the other Cadence marks found at www.cadence.com/go/trademarks are trademarks or registered trademarks of Cadence Design Systems, Inc. All other trademarks are the property of their respective holders.
Report of Independent Registered Public Accounting Firm
To the Board of Directors and Stockholders of Cadence Design Systems, Inc.
Opinions on the Financial Statements and Internal Control over Financial Reporting
We have audited the accompanying consolidated balance sheets of Cadence Design Systems, Inc. and its subsidiaries (the “Company”) as of January 1, 2022 and January 2, 2021, and the related consolidated statements of income, of comprehensive income, of stockholders’ equity and of cash flows for the years then ended, including the related notes (collectively referred to as the “consolidated financial statements”). We also have audited the Company’s internal control over financial reporting as of January 1, 2022, based on criteria established in Internal Control - Integrated Framework (2013) issued by the Committee of Sponsoring Organizations of the Treadway Commission (COSO).
In our opinion, the consolidated financial statements referred to above present fairly, in all material respects, the financial position of the Company as of January 1, 2022 and January 2, 2021, and the results of its operations and its cash flows for the years then ended in conformity with accounting principles generally accepted in the United States of America. Also in our opinion, the Company maintained, in all material respects, effective internal control over financial reporting as of January 1, 2022, based on criteria established in Internal Control - Integrated Framework (2013) issued by the COSO.
Basis for Opinions
The Company’s management is responsible for these consolidated financial statements, for maintaining effective internal control over financial reporting, and for its assessment of the effectiveness of internal control over financial reporting, included in Management’s Report on Internal Control Over Financial Reporting appearing under Item 9A. Our responsibility is to express opinions on the Company’s consolidated financial statements and on the Company’s internal control over financial reporting based on our audits. We are a public accounting firm registered with the Public Company Accounting Oversight Board (United States) (PCAOB) and are required to be independent with respect to the Company in accordance with the U.S. federal securities laws and the applicable rules and regulations of the Securities and Exchange Commission and the PCAOB.
We conducted our audits in accordance with the standards of the PCAOB. Those standards require that we plan and perform the audits to obtain reasonable assurance about whether the consolidated financial statements are free of material misstatement, whether due to error or fraud, and whether effective internal control over financial reporting was maintained in all material respects.
Our audits of the consolidated financial statements included performing procedures to assess the risks of material misstatement of the consolidated financial statements, whether due to error or fraud, and performing procedures that respond to those risks. Such procedures included examining, on a test basis, evidence regarding the amounts and disclosures in the consolidated financial statements. Our audits also included evaluating the accounting principles used and significant estimates made by management, as well as evaluating the overall presentation of the consolidated financial statements. Our audits of internal control over financial reporting included obtaining an understanding of internal control over financial reporting, assessing the risk that a material weakness exists, and testing and evaluating the design and operating effectiveness of internal control based on the assessed risk. Our audits also included performing such other procedures as we considered necessary in the circumstances. We believe that our audits provide a reasonable basis for our opinions.
Definition and Limitations of Internal Control over Financial Reporting
A company’s internal control over financial reporting is a process designed to provide reasonable assurance regarding the reliability of financial reporting and the preparation of financial statements for external purposes in accordance with generally accepted accounting principles. A company’s internal control over financial reporting includes those policies and procedures that (i) pertain to the maintenance of records that, in reasonable detail, accurately and fairly reflect the transactions and dispositions of the assets of the company; (ii) provide reasonable assurance that transactions are recorded as necessary to permit preparation of financial statements in accordance with generally accepted accounting principles, and that receipts and expenditures of the company are being made only in accordance with authorizations of management and directors of the company; and (iii) provide reasonable assurance regarding prevention or timely detection of unauthorized acquisition, use, or disposition of the company’s assets that could have a material effect on the financial statements.
Because of its inherent limitations, internal control over financial reporting may not prevent or detect misstatements. Also, projections of any evaluation of effectiveness to future periods are subject to the risk that controls may become inadequate because of changes in conditions, or that the degree of compliance with the policies or procedures may deteriorate.
Critical Audit Matters
The critical audit matter communicated below is a matter arising from the current period audit of the consolidated financial statements that was communicated or required to be communicated to the audit committee and that (i) relates to accounts or disclosures that are material to the consolidated financial statements and (ii) involved our especially challenging, subjective, or complex judgments. The communication of critical audit matters does not alter in any way our opinion on the consolidated financial statements, taken as a whole, and we are not, by communicating the critical audit matter below, providing a separate opinion on the critical audit matter or on the accounts or disclosures to which it relates.
Revenue Recognition – Identifying and Evaluating Terms and Conditions in Contracts
As described in Note 2 and Note 5 to the consolidated financial statements, the Company enters into contracts that can include various combinations of licenses, products, and services, some of which are distinct and are accounted for as separate performance obligations. For contracts with multiple performance obligations, management allocates the transaction price of the contract to each performance obligation and recognizes revenue upon transfer of control of promised products or services to customers. Management applies judgment in identifying and evaluating any terms and conditions in contracts which may impact revenue recognition. For the year ended January 1, 2022, the Company’s total revenue was $2.988 billion.
The principal considerations for our determination that performing procedures relating to revenue recognition, specifically the identification and evaluation of terms and conditions in contracts, is a critical audit matter are the significant judgment by management in identifying and evaluating terms and conditions in contracts that impact revenue recognition, which in turn led to a high degree of auditor judgment, subjectivity and effort in performing procedures and evaluating whether terms and conditions in contracts were appropriately identified and evaluated by management.
Addressing the matter involved performing procedures and evaluating audit evidence in connection with forming our overall opinion on the consolidated financial statements. These procedures included testing the effectiveness of controls relating to the revenue recognition process, including controls related to the identification and evaluation of terms and conditions in contracts that impact revenue recognition. These procedures also included, among others (i) testing management’s process of identifying and evaluating the terms and conditions in contracts, including management’s determination of the impact of those terms and conditions on revenue recognition and (ii) testing the completeness and accuracy of management’s identification and evaluation of the terms and conditions in contracts by examining revenue arrangements on a test basis.
/s/ PricewaterhouseCoopers LLP
San Jose, California
February 22, 2022
We have served as the Company’s auditor since 2020.
Report of Independent Registered Public Accounting Firm
To the Stockholders and Board of Directors
Cadence Design Systems, Inc.:
Opinion on the Consolidated Financial Statements
We have audited the accompanying consolidated statements of income, comprehensive income, stockholders’ equity, and cash flows for the year ended December 28, 2019, and the related notes (collectively, the consolidated financial statements) of Cadence Design Systems, Inc. and subsidiaries (the Company). In our opinion, the consolidated financial statements referred to above present fairly, in all material respects, the results of the Company’s operations and its cash flows for the year ended December 28, 2019, in conformity with U.S. generally accepted accounting principles.
Basis for Opinion
These consolidated financial statements are the responsibility of the Company’s management. Our responsibility is to express an opinion on the Company’s consolidated financial statements based on our audit. We are a public accounting firm registered with the Public Company Accounting Oversight Board (United States) (PCAOB) and are required to be independent with respect to the Company in accordance with the U.S. federal securities laws and the applicable rules and regulations of the Securities and Exchange Commission and the PCAOB.
We conducted our audit in accordance with the standards of the PCAOB. Those standards require that we plan and perform the audit to obtain reasonable assurance about whether the consolidated financial statements are free of material misstatement, whether due to error or fraud. Our audit of the consolidated financial statements included performing procedures to assess the risks of material misstatement of the consolidated financial statements, whether due to error or fraud, and performing procedures that respond to those risks. Such procedures included examining, on a test basis, evidence regarding the amounts and disclosures in the consolidated financial statements. Our audit also included evaluating the accounting principles used and significant estimates made by management, as well as evaluating the overall presentation of the consolidated financial statements. Our audit also included performing such other procedures as we considered necessary in the circumstances. We believe that our audit provided a reasonable basis for our opinion.
/s/ KPMG LLP
We served as the Company’s auditor from 2002 to 2020.
Santa Clara, California
February 24, 2020
CADENCE DESIGN SYSTEMS, INC.
CONSOLIDATED BALANCE SHEETS
January 1, 2022 and January 2, 2021
(In thousands, except par value)
| | | | | | | | | | | |
| As of |
| January 1,
2022 | | January 2,
2021 |
| ASSETS |
| Current assets: | | | |
| Cash and cash equivalents | $ | 1,088,940 | | | $ | 928,432 | |
| Receivables, net | 337,596 | | | 338,487 | |
| Inventories | 115,721 | | | 75,956 | |
| Prepaid expenses and other | 173,512 | | | 135,712 | |
| Total current assets | 1,715,769 | | | 1,478,587 | |
| Property, plant and equipment, net | 305,911 | | | 311,125 | |
| Goodwill | 928,358 | | | 782,087 | |
| Acquired intangibles, net | 233,265 | | | 210,590 | |
| Deferred taxes | 763,770 | | | 732,290 | |
| Other assets | 439,226 | | | 436,106 | |
| Total assets | $ | 4,386,299 | | | $ | 3,950,785 | |
| LIABILITIES AND STOCKHOLDERS’ EQUITY |
| Current liabilities: | | | |
| | | |
| Accounts payable and accrued liabilities | $ | 417,283 | | | $ | 349,951 | |
| Current portion of deferred revenue | 553,942 | | | 446,857 | |
| Total current liabilities | 971,225 | | | 796,808 | |
| Long-term liabilities: | | | |
| Long-term portion of deferred revenue | 101,148 | | | 107,064 | |
| Long-term debt | 347,588 | | | 346,793 | |
| Other long-term liabilities | 225,663 | | | 207,102 | |
| Total long-term liabilities | 674,399 | | | 660,959 | |
| Commitments and contingencies (Notes 8, 12 and 18) | | | |
| Stockholders’ equity: | | | |
Preferred stock – $0.01 par value; authorized 400 shares, none issued or outstanding | — | | | — | |
Common stock – $0.01 par value; authorized 600,000 shares; issued and outstanding shares: 276,796 and 278,941, respectively | 2,467,701 | | | 2,217,939 | |
Treasury stock, at cost; 52,363 shares and 50,219 shares, respectively | (2,740,003) | | | (2,057,829) | |
| Retained earnings | 3,046,288 | | | 2,350,333 | |
| Accumulated other comprehensive loss | (33,311) | | | (17,425) | |
| Total stockholders’ equity | 2,740,675 | | | 2,493,018 | |
| Total liabilities and stockholders’ equity | $ | 4,386,299 | | | $ | 3,950,785 | |
See notes to consolidated financial statements.
CADENCE DESIGN SYSTEMS, INC.
CONSOLIDATED INCOME STATEMENTS
For the three fiscal years ended January 1, 2022
(In thousands, except per share amounts)
| | | | | | | | | | | | | | | | | |
| | 2021 | | 2020 | | 2019 |
| Revenue: | | | | | |
| Product and maintenance | $ | 2,812,947 | | | $ | 2,536,617 | | | $ | 2,204,615 | |
| Services | 175,297 | | | 146,274 | | | 131,704 | |
| Total revenue | 2,988,244 | | | 2,682,891 | | | 2,336,319 | |
| Costs and expenses: | | | | | |
| Cost of product and maintenance | 222,647 | | | 231,026 | | | 189,146 | |
| Cost of services | 84,359 | | | 74,472 | | | 77,211 | |
| Marketing and sales | 560,262 | | | 516,460 | | | 481,673 | |
| Research and development | 1,134,277 | | | 1,033,732 | | | 935,938 | |
| General and administrative | 189,018 | | | 154,425 | | | 139,806 | |
| Amortization of acquired intangibles | 19,640 | | | 18,009 | | | 12,128 | |
| Restructuring | (1,048) | | | 9,215 | | | 8,621 | |
| Total costs and expenses | 2,209,155 | | | 2,037,339 | | | 1,844,523 | |
| Income from operations | 779,089 | | | 645,552 | | | 491,796 | |
| Interest expense | (16,980) | | | (20,749) | | | (18,829) | |
| Other income, net | 6,326 | | | 7,945 | | | 6,001 | |
| Income before provision (benefit) for income taxes | 768,435 | | | 632,748 | | | 478,968 | |
| Provision (benefit) for income taxes | 72,480 | | | 42,104 | | | (510,011) | |
| Net income | $ | 695,955 | | | $ | 590,644 | | | $ | 988,979 | |
| Net income per share – basic | $ | 2.54 | | | $ | 2.16 | | | $ | 3.62 | |
| Net income per share – diluted | $ | 2.50 | | | $ | 2.11 | | | $ | 3.53 | |
| Weighted average common shares outstanding – basic | 273,504 | | | 273,728 | | | 273,239 | |
| Weighted average common shares outstanding – diluted | 278,858 | | | 279,641 | | | 280,515 | |
See notes to consolidated financial statements.
CADENCE DESIGN SYSTEMS, INC.
CONSOLIDATED STATEMENTS OF COMPREHENSIVE INCOME
For the three fiscal years ended January 1, 2022
(In thousands)
| | | | | | | | | | | | | | | | | |
| | 2021 | | 2020 | | 2019 |
| Net income | $ | 695,955 | | | $ | 590,644 | | | $ | 988,979 | |
| Other comprehensive income (loss), net of tax effects: | | | | | |
| Foreign currency translation adjustments | (15,423) | | | 18,373 | | | (8,642) | |
| Changes in defined benefit plan liabilities | (463) | | | 1,128 | | | (3,504) | |
| Total other comprehensive income (loss), net of tax effects | (15,886) | | | 19,501 | | | (12,146) | |
| Comprehensive income | $ | 680,069 | | | $ | 610,145 | | | $ | 976,833 | |
See notes to consolidated financial statements.
CADENCE DESIGN SYSTEMS, INC.
CONSOLIDATED STATEMENTS OF STOCKHOLDERS’ EQUITY
For the three fiscal years ended January 1, 2022
(In thousands) | | | | | | | | | | | | | | | | | | | | | | | | | | | | | | | | | | | |
| Common Stock | | | | | | | | |
| | | Par Value | | | | | | Accumulated | | |
| | | and Capital | | | | | | Other | | |
| | | in Excess | | Treasury | | Retained | | Comprehensive | | |
| Shares | | of Par | | Stock | | Earnings | | Income (Loss) | | Total |
| Balance, December 29, 2018 | 280,015 | | | $ | 1,936,124 | | | $ | (1,395,652) | | | $ | 772,709 | | | $ | (24,780) | | | $ | 1,288,401 | |
Net income | — | | | — | | | — | | | 988,979 | | | — | | | $ | 988,979 | |
| Other comprehensive loss, net of taxes | — | | | — | | | — | | | — | | | (12,146) | | | $ | (12,146) | |
Purchase of treasury stock | (4,841) | | | — | | | (306,148) | | | — | | | — | | | $ | (306,148) | |
Issuance of common stock and reissuance of treasury stock under equity incentive plans, net of forfeitures | 5,923 | | | (57,763) | | | 110,604 | | | — | | | — | | | $ | 52,841 | |
Stock received for payment of employee taxes on vesting of restricted stock | (1,242) | | | (13,671) | | | (76,909) | | | — | | | — | | | $ | (90,580) | |
Stock-based compensation expense | — | | | 181,547 | | | — | | | — | | | — | | | $ | 181,547 | |
| Balance, December 28, 2019 | 279,855 | | | $ | 2,046,237 | | | $ | (1,668,105) | | | $ | 1,761,688 | | | $ | (36,926) | | | $ | 2,102,894 | |
Cumulative effect adjustment | | | | | | | (1,999) | | | | | $ | (1,999) | |
Net income | — | | | — | | | — | | | 590,644 | | | — | | | $ | 590,644 | |
| Other comprehensive income, net of taxes | — | | | — | | | — | | | — | | | 19,501 | | | $ | 19,501 | |
Purchase of treasury stock | (4,247) | | | — | | | (380,064) | | | — | | | — | | | $ | (380,064) | |
Issuance of common stock and reissuance of treasury stock under equity incentive plans, net of forfeitures | 4,352 | | | (7,934) | | | 82,736 | | | — | | | — | | | $ | 74,802 | |
Stock received for payment of employee taxes on vesting of restricted stock | (1,019) | | | (17,632) | | | (92,396) | | | — | | | — | | | $ | (110,028) | |
Stock-based compensation expense | — | | | 197,268 | | | — | | | — | | | — | | | $ | 197,268 | |
| Balance, January 2, 2021 | 278,941 | | | $ | 2,217,939 | | | $ | (2,057,829) | | | $ | 2,350,333 | | | $ | (17,425) | | | $ | 2,493,018 | |
Net income | — | | | — | | | — | | | 695,955 | | | — | | | $ | 695,955 | |
| Other comprehensive loss, net of taxes | — | | | — | | | — | | | — | | | (15,886) | | | $ | (15,886) | |
Purchase of treasury stock | (4,401) | | | — | | | (612,297) | | | — | | | — | | | $ | (612,297) | |
Issuance of common stock and reissuance of treasury stock under equity incentive plans, net of forfeitures | 2,978 | | | 55,505 | | | 32,272 | | | — | | | — | | | $ | 87,777 | |
Stock received for payment of employee taxes on vesting of restricted stock | (722) | | | (15,833) | | | (102,149) | | | — | | | — | | | $ | (117,982) | |
Stock-based compensation expense | — | | | 210,090 | | | — | | | — | | | — | | | $ | 210,090 | |
| Balance, January 1, 2022 | 276,796 | | | $ | 2,467,701 | | | $ | (2,740,003) | | | $ | 3,046,288 | | | $ | (33,311) | | | $ | 2,740,675 | |
See notes to consolidated financial statements.
CADENCE DESIGN SYSTEMS, INC.
CONSOLIDATED STATEMENTS OF CASH FLOWS
For the three fiscal years ended January 1, 2022
(In thousands) | | | | | | | | | | | | | | | | | |
| | 2021 | | 2020 | | 2019 |
| Cash and cash equivalents at beginning of year | $ | 928,432 | | | $ | 705,210 | | | $ | 533,298 | |
| Cash flows from operating activities: | | | | | |
| Net income | 695,955 | | | 590,644 | | | 988,979 | |
| Adjustments to reconcile net income to net cash provided by operating activities: | | | | | |
| Depreciation and amortization | 142,308 | | | 145,653 | | | 122,789 | |
| Amortization of debt discount and fees | 1,219 | | | 1,053 | | | 1,001 | |
| Stock-based compensation | 210,090 | | | 197,268 | | | 181,547 | |
| (Gain) loss on investments, net | (580) | | | 4,954 | | | 4,090 | |
| Deferred income taxes | (43,178) | | | (26,117) | | | (576,738) | |
| Provisions for losses on receivables | 525 | | | 1,628 | | | 632 | |
| ROU asset amortization and change in operating lease liabilities | (11,606) | | | 4,483 | | | 562 | |
| Other non-cash items | 427 | | | 773 | | | 428 | |
| Changes in operating assets and liabilities, net of effect of acquired businesses: | | | | | |
| Receivables | 2,014 | | | (25,934) | | | (4,718) | |
| Inventories | (39,027) | | | (25,685) | | | (33,024) | |
| Prepaid expenses and other | (34,342) | | | (31,167) | | | (11,031) | |
| Other assets | (7,133) | | | (71,606) | | | (8,011) | |
| Accounts payable and accrued liabilities | 67,356 | | | 18,394 | | | 33,915 | |
| Deferred revenue | 100,731 | | | 110,173 | | | 27,498 | |
| Other long-term liabilities | 16,199 | | | 10,408 | | | 1,681 | |
| Net cash provided by operating activities | 1,100,958 | | | 904,922 | | | 729,600 | |
| Cash flows from investing activities: | | | | | |
| Purchases of non-marketable investments | — | | | — | | | (33,717) | |
| Proceeds from the sale of non-marketable investments | 128 | | | 217 | | | 2,952 | |
| Purchases of property, plant and equipment | (65,298) | | | (94,813) | | | (74,605) | |
| Purchases of intangible assets | (1,583) | | | — | | | — | |
| Cash paid in business combinations and asset acquisitions, net of cash acquired | (226,201) | | | (197,562) | | | (338) | |
| Net cash used for investing activities | (292,954) | | | (292,158) | | | (105,708) | |
| Cash flows from financing activities: | | | | | |
| Proceeds from revolving credit facility | — | | | 350,000 | | | 150,000 | |
| Payment on revolving credit facility | — | | | (350,000) | | | (250,000) | |
| Payment of debt issuance costs | (1,285) | | | — | | | — | |
| Proceeds from issuance of common stock | 87,772 | | | 74,803 | | | 52,842 | |
| Stock received for payment of employee taxes on vesting of restricted stock | (117,982) | | | (110,028) | | | (90,580) | |
| Payments for repurchases of common stock | (612,297) | | | (380,064) | | | (306,148) | |
| Net cash used for financing activities | (643,792) | | | (415,289) | | | (443,886) | |
| Effect of exchange rate changes on cash and cash equivalents | (3,704) | | | 25,747 | | | (8,094) | |
| Increase in cash and cash equivalents | 160,508 | | | 223,222 | | | 171,912 | |
| Cash and cash equivalents at end of year | $ | 1,088,940 | | | $ | 928,432 | | | $ | 705,210 | |
| | | | | |
| Supplemental cash flow information: | | | | | |
| Cash paid for interest | $ | 15,950 | | | $ | 19,778 | | | $ | 17,842 | |
| Cash paid for income taxes, net | 146,424 | | | 105,917 | | | 41,946 | |
See notes to consolidated financial statements.
CADENCE DESIGN SYSTEMS, INC.
NOTES TO CONSOLIDATED FINANCIAL STATEMENTS
For the three fiscal years ended January 1, 2022
NOTE 1. BUSINESS OVERVIEW
Cadence Design Systems, Inc. (“Cadence”) provides solutions that enable its customers to design complex and innovative products. Cadence’s solutions are designed to give its customers a competitive edge in their development of integrated circuits (“ICs”), systems-on-chip (“SoCs”) and increasingly sophisticated electronic devices and systems by optimizing performance, minimizing power consumption, shortening the time required for customers to bring their products to market, improving engineering productivity and reducing their design, development and manufacturing costs. Cadence’s product offerings include software, hardware, services and reusable IC design blocks, which are commonly referred to as intellectual property (“IP”). Cadence also provides maintenance for its software, hardware, and IP product offerings.
NOTE 2. SUMMARY OF SIGNIFICANT ACCOUNTING POLICIES
Principles of Consolidation and Basis of Presentation
The consolidated financial statements include the accounts of Cadence and its subsidiaries after elimination of intercompany accounts and transactions. All consolidated subsidiaries are wholly owned by Cadence.
Cadence’s fiscal years are 52- or 53-week periods ending on the Saturday closest to December 31. Fiscal 2021 and 2019 were 52- week fiscal years, while 2020 was a 53-week fiscal year.
Use of Estimates
Preparation of the consolidated financial statements in conformity with United States generally accepted accounting principles requires management to make estimates and assumptions that affect the reported amounts of assets and liabilities and disclosure of contingent assets and liabilities at the date of the consolidated financial statements and the reported amounts of revenue and expenses during the reporting period. Actual results could differ from those estimates.
Recently Adopted Accounting Standards
Accounting for Income Taxes
In December 2019, the Financial Accounting Standards Board (“FASB”) issued Accounting Standards Update (“ASU”) 2019-12, “Simplifying the Accounting for Income Taxes,” which simplifies the accounting for income taxes, eliminates certain exceptions within Accounting Standards Codification 740, Income Taxes, and clarifies certain aspects of the current guidance to promote consistency among reporting entities. Cadence adopted the standard on January 3, 2021, the first day of fiscal 2021. The adoption of this standard did not impact Cadence’s consolidated financial statements during fiscal 2021.
New Accounting Standards Not Yet Adopted
Lessors - Certain Leases with Variable Lease Payments
In July 2021, the FASB issued ASU 2021-05, “Lessors - Certain Leases with Variable Lease Payments,” which allows lessors to classify and account for a lease with variable payments that do not depend on a reference index or a rate as an operating lease if both of the following criteria are met: (1) the lease would have been classified as a sales-type lease or a direct financing lease in accordance with the classification criteria as defined in ASC Topic 842 and (2) the lessor would have otherwise recognized a day-one loss on the lease arrangement. This standard better aligns the accounting with the underlying economics of these arrangements as lessors are not permitted to include most variable payments which do not depend on a reference index or a rate in the lease receivable while assets are derecognized at lease commencement. This standard is effective for fiscal years beginning after December 15, 2021, including interim periods within those fiscal years. Cadence adopted this standard on January 2, 2022, the first day of fiscal 2022, on a prospective basis. This standard is not expected to have a material impact on Cadence’s consolidated financial statements and related disclosures.
Business Combinations
In October 2021, the FASB issued ASU 2021-08, “Accounting for Contract Assets and Contract Liabilities from Contracts with Customers,” which that requires contract assets and contract liabilities acquired in a business combination to be recognized and measured by the acquirer on the acquisition date in accordance with “Revenue from Contracts with Customers (Topic 606)” as if the acquiring entity had originated the contracts. This approach differs from the current requirement to measure contract assets and contract liabilities acquired in a business combination at fair value. The standard is effective for fiscal years beginning after December 15, 2022, including interim periods within those fiscal years, and early adoption is permitted. Cadence adopted this standard on January 2, 2022, the first day of fiscal 2022. The impact of the standard on Cadence’s consolidated financial statements is dependent on the size and frequency of future acquisitions and does not affect contract assets or contract liabilities related to acquisitions completed prior to the adoption date.
Foreign Operations
Cadence transacts business in various foreign currencies. The United States dollar is the functional currency of Cadence’s consolidated entities operating in the United States and certain of its consolidated subsidiaries operating outside the United States. The functional currency for Cadence’s other consolidated entities operating outside of the United States is generally the country’s local currency.
Cadence translates the financial statements of consolidated entities whose functional currency is not the United States dollar into United States dollars. Cadence translates assets and liabilities at the exchange rate in effect as of the financial statement date and translates income statement accounts using an average exchange rate for the period. Cadence includes adjustments from translating assets and liabilities into United States dollars, and the effect of exchange rate changes on intercompany transactions of a long-term investment nature in stockholders’ equity as a component of accumulated other comprehensive income. Cadence reports gains and losses from foreign exchange rate changes related to intercompany receivables and payables that are not of a long-term investment nature, as well as gains and losses from foreign currency transactions of a monetary nature in other income, net, in the consolidated income statements.
Concentrations of Credit Risk
Financial instruments, including derivative financial instruments, that may potentially subject Cadence to concentrations of credit risk, consist principally of cash and cash equivalents, accounts receivable, investments and forward contracts. Credit exposure related to Cadence’s foreign currency forward contracts is limited to the realized and unrealized gains on these contracts.
Cash and Cash Equivalents
Cadence considers all highly liquid investments with original maturities of three months or less on the date of purchase to be cash equivalents.
Receivables
Cadence’s receivables, net includes invoiced accounts receivable and the current portion of unbilled receivables. Unbilled receivables represent amounts Cadence has recorded as revenue for which payments from a customer are due over time and Cadence has an unconditional right to the payment. Cadence’s accounts receivable and unbilled receivables were initially recorded at the transaction value. Cadence’s long-term receivables balance includes receivable balances to be invoiced more than one year after each balance sheet date.
Allowances for Doubtful Accounts
Cadence assesses its ability to collect outstanding receivables and provides customer-specific allowances, allowances for credit losses and general allowances for the portion of its receivables that are estimated to be uncollectible. The allowances are based on the current creditworthiness of its customers, historical experience, expected credit losses, changes in customer demand and the overall economic climate in the industries that Cadence serves. Provisions for these allowances are recorded in general and administrative expense in Cadence’s consolidated income statements.
Inventories
Inventories are computed at standard costs which approximate actual costs and are valued at the lower of cost or net realizable value based on the first-in, first-out method. Cadence’s inventories include high technology parts and components for complex emulation and prototyping hardware systems. These parts and components are specialized in nature and may be subject to rapid technological obsolescence. While Cadence has programs to manage the required inventories on hand and considers technological obsolescence when estimating required reserves to reduce recorded amounts to market values, it is reasonably possible that such estimates could change in the near term. Cadence’s policy is to reserve for inventory in excess of 12-month demand or for other known obsolescence or realization issues.
Property, Plant and Equipment
Property, plant and equipment is stated at historical cost. Depreciation and amortization are generally provided over the estimated useful lives, using the straight-line method, as follows:
| | | | | |
| Computer equipment and related software | 2-7 years |
| Buildings | 25-32 years |
| Leasehold improvements | Shorter of the lease term or the estimated useful life |
| Building improvements and land improvements | Up to 32 years |
| Furniture and fixtures | 3-5 years |
| Equipment | 3-5 years |
Cadence capitalizes certain costs of software developed for internal use. Capitalization of software developed for internal use begins at the application development phase of the project. Amortization begins when the computer software is substantially complete and ready for its intended use. Amortization is recorded on a straight-line basis over the estimated useful life. Capitalized costs were not material during fiscal 2021, 2020 or 2019.
Cadence recorded depreciation and amortization expense of $71.2 million, $67.6 million and $63.3 million during fiscal 2021, 2020 and 2019, respectively, for property, plant and equipment.
Software Development Costs
Software development costs are capitalized beginning when a product’s technological feasibility has been established by completion of a working model of the product and amortization begins when a product is available for general release to customers. The period between the achievement of technological feasibility and the general release of Cadence’s products has typically been of short duration. Costs incurred during fiscal 2021, 2020 and 2019 were not material.
Deferred Sales Commissions
Cadence records an asset for the incremental costs of obtaining a contract with a customer, including direct sales commissions that are earned upon execution of the contract. Cadence uses the portfolio method to recognize the amortization expense related to these capitalized costs related to initial contracts and renewals and such expense is recognized over a period associated with the revenue of the related portfolio, which is generally two to three years for Cadence’s software arrangements and upon delivery for its hardware and IP arrangements. Incremental costs related to initial contracts and renewals are amortized over the period of the arrangement in each case because Cadence pays the same commission rate for both new contracts and renewals. Deferred sales commissions are tested for impairment on an ongoing basis when events or changes in circumstances indicate that the carrying amount may not be recoverable. An impairment is recognized to the extent that the amount of deferred sales commission exceeds the remaining expected gross margin (remaining revenue less remaining direct costs) on the goods and services to which the deferred sales commission relates. Total capitalized costs were $43.9 million and $36.7 million as of January 1, 2022, and January 2, 2021, respectively, and are included in other assets in Cadence’s consolidated balance sheet. Amortization of these assets was $40.1 million, $34.6 million and $29.4 million during fiscal 2021, 2020 and 2019, respectively, and is included in sales and marketing expense in Cadence’s consolidated income statement.
Goodwill
Cadence conducts a goodwill impairment analysis annually and as necessary if changes in facts and circumstances indicate that the fair value of Cadence’s single reporting unit may be less than its carrying amount. To assess for impairment, Cadence compares the estimated fair value of its single reporting unit to the carrying value of the reporting unit’s net assets, including goodwill. If the fair value of the reporting unit is greater than the carrying value of its net assets, goodwill is not considered to be impaired and no further analysis is required. If the fair value of the reporting unit is less than the carrying value of its net assets, Cadence would be required to record an impairment charge.
Long-Lived Assets, Including Acquired Intangibles
Cadence’s long-lived assets consist of property, plant and equipment, and acquired intangibles. Acquired intangibles consist of acquired technology, certain contract rights, customer relationships, trademarks and trade names, capitalized software, and in-process research and development. These acquired intangibles are acquired through business combinations or direct purchases. Acquired intangibles with definite lives are amortized on a straight-line basis over the estimated economic life of the underlying products and technologies, which range from three years to fifteen years. Acquired intangibles with indefinite lives, or in-process technology, consists of projects that had not reached technological feasibility by the date of acquisition. Upon completion of the project, the assets are amortized over their estimated useful lives. If the project is abandoned rather than completed, the asset is written off. In-process technology is tested for impairment annually and as necessary if changes in facts and circumstances indicate that the assets might be impaired.
Cadence reviews its long-lived assets, including acquired intangibles, for impairment whenever events or changes in circumstances indicate that the carrying amount of a long-lived asset or asset group may not be recoverable. Recoverability of an asset or asset group is measured by comparison of its carrying amount to the expected future undiscounted cash flows that the asset or asset group is expected to generate. If it is determined that the carrying amount of an asset group is not recoverable, an impairment loss is recorded in the amount by which the carrying amount of the asset or asset group exceeds its fair value.
Leases
Lessee Considerations
Cadence has operating leases primarily consisting of facilities with remaining lease terms of approximately one year to fourteen years. Cadence has options to terminate many of its leases early. The lease term represents the period up to the early termination date unless it is reasonably certain that Cadence will not exercise the early termination option. For certain leases, Cadence has options to extend the lease term for additional periods ranging from one year to ten years. Renewal options are not considered in the remaining lease term unless it is reasonably certain that Cadence will exercise such options.
At inception of a contract, Cadence determines an arrangement contains a lease if the arrangement conveys the right to use an identified asset and Cadence obtains substantially all of the economic benefits from the asset and has the ability to direct the use of the asset. Leases with an initial term of twelve months or less are not recorded on the balance sheet. For lease agreements entered into or reassessed after the adoption of Topic 842, Cadence combines the lease and non-lease components in determining the lease liabilities and right-of-use (“ROU”) assets. Non-lease components primarily include common-area maintenance and other management fees.
Operating lease expense is generally recognized evenly over the term of the lease. Payments under Cadence's lease agreements are primarily fixed; however, certain agreements contain rental payments that are adjusted periodically based on changes in consumer price and other indices. Changes to payments resulting from changes in indices are expensed as incurred and not included in the measurement of lease liabilities and ROU assets. Cadence’s lease agreements do not provide an implicit borrowing rate, therefore an internal incremental borrowing rate is determined based on information available at lease commencement date for purposes of determining the present value of lease payments. The incremental borrowing rate represents a comparable rate to borrow on a collateralized basis over a similar term and in the economic environment where the leased asset is located. Cadence used the incremental borrowing rate on the effective date of adoption of Topic 842 for all leases that commenced prior to that date.
Lessor Considerations
Although most of Cadence’s revenue from its hardware business comes from sales of hardware, Cadence also leases its hardware products to some customers. Cadence determines the existence of a lease when the customer controls the use of the identified hardware for a period of time defined in the lease agreement.
Cadence’s leases range in duration up to three years with payments generally collected in equal quarterly installments. Cadence’s leases do not include termination rights or variable pricing and typically do not include purchase rights at the end of the lease. Short-term leases are usually less than two years and are classified as operating leases with revenue recognized and depreciation expensed on a straight-line basis over the term of the lease. Long-term leases are typically for three years and are classified as sales-type leases with revenue and cost of sales recognized upon installation.
Cadence’s operating leases and sales-type leases contain both lease and non-lease components. Because the pattern of revenue recognition is the same for both the lease and non-lease components in Cadence’s operating leases, Cadence has elected the practical expedient to not separate lease and related non-lease components and accounts for both components under Topic 842. Cadence allocates value to the lease and non-lease components in its sales-type leases using standalone selling prices (“SSPs”) similar to those used under ASU 2014-09, “Revenue from Contracts with Customers (Topic 606),” the current accounting standard governing revenue recognition. When Cadence leases its hardware in the same arrangement as software or IP, Cadence allocates value to each performance obligation using SSPs.
Investments in Equity Securities
Cadence’s investments in marketable equity securities are carried at fair value as a component of prepaid expenses and other in the consolidated balance sheets. Cadence records realized and unrealized holding gains or losses as part of other income, net in the consolidated income statements.
Cadence’s non-marketable investments include its investments in privately held companies. These investments are initially recorded at cost and are included in other assets in the consolidated balance sheets. Cadence accounts for these investments using the measurement alternative when the fair value of the investment is not readily determinable and Cadence does not have the ability to exercise significant influence or the equity method of accounting when it is determined that Cadence has the ability to exercise significant influence. For investments accounted for using the equity method of accounting, Cadence records its proportionate share of the investee’s income or loss, net of the effects of any basis differences, to other income, net on a one-quarter lag in Cadence’s consolidated income statements.
Cadence reviews its non-marketable investments on a regular basis to determine whether its investments in these companies are impaired. Cadence considers investee financial performance and other information received from the investee companies, as well as any other available estimates of the fair value of the investee companies in its review. If Cadence determines the carrying value of an investment exceeds its fair value, the book value of the investment is adjusted to its fair value. Cadence records investment write-downs in other income, net, in the consolidated income statements.
Derivative Financial Instruments
Cadence enters into foreign currency forward exchange contracts with financial institutions to protect against currency exchange risks associated with existing assets and liabilities. A foreign currency forward exchange contract acts as a hedge by increasing in value when underlying assets decrease in value or underlying liabilities increase in value due to changes in foreign exchange rates. Conversely, a foreign currency forward exchange contract decreases in value when underlying assets increase in value or underlying liabilities decrease in value due to changes in foreign exchange rates. The forward contracts are not designated as accounting hedges and, therefore, the unrealized gains and losses are recognized in other income, net, in advance of the actual foreign currency cash flows. The fair value of these forward contracts is recorded in accrued liabilities or in other current assets. These forward contracts generally have maturities of 90 days or less.
Nonqualified Deferred Compensation Trust
Executive officers, senior management and members of Cadence’s Board of Directors may elect to defer compensation payable to them under Cadence’s Nonqualified Deferred Compensation Plan (“NQDC”). Deferred compensation payments are held in investment accounts and the values of the accounts are adjusted each quarter based on the fair value of the investments held in the NQDC.
The selected investments held in the NQDC accounts are carried at fair value, with the unrealized gains and losses recognized in the consolidated income statements as other income, net. These securities are classified in other assets in the consolidated balance sheets because they are not available for Cadence’s use in its operations.
Cadence’s obligation with respect to the NQDC trust is recorded in other long-term liabilities on the consolidated balance sheets. Increases and decreases in the NQDC trust liability are recorded as compensation expense in the consolidated income statements.
Treasury Stock
Cadence generally issues shares related to its stock-based compensation plans from shares held in treasury. When treasury stock is reissued at an amount higher than its cost, the difference is recorded as a component of capital in excess of par in the consolidated statements of stockholders’ equity. When treasury stock is reissued at an amount lower than its cost, the difference is recorded as a component of capital in excess of par to the extent that gains exist to offset the losses. If there are no accumulated treasury stock gains in capital in excess of par, the losses upon reissuance of treasury stock are recorded as a component of retained earnings in the consolidated statements of stockholders’ equity. There were no losses recorded as a component of retained earnings by Cadence on the reissuance of treasury stock during fiscal 2021, 2020 or 2019.
Revenue Recognition
Revenue is recognized upon transfer of control of promised products or services to customers in an amount that reflects the consideration to which Cadence expects to be entitled in exchange for promised goods or services. Cadence’s performance obligations are satisfied either over time or at a point in time. In any fiscal year, between 85% and 90% of revenue is characterized as recurring revenue. Revenue characterized as recurring includes revenue recognized over time from Cadence’s software arrangements, services, royalties, maintenance on IP licenses and hardware, and operating leases of hardware and revenue recognized at varying points in time over the term of our IP Access Agreements (“IPAA”) that include non-cancellable commitments from customers. The remainder of Cadence’s revenue is recognized at a point in time and is characterized as up-front revenue. Up-front revenue is primarily generated by sales of emulation and prototyping hardware and individual IP licenses.
Product and maintenance revenue includes Cadence’s licenses of software and IP, sales of emulation hardware and the related maintenance on these licenses and sales.
Services revenue includes revenue received for performing engineering services (which are generally not related to the functionality of other licensed products), customized IP on a fixed fee basis, and sales from cloud-based solutions that provide customers with software and services over a period of time.
Cadence enters into contracts that can include various combinations of licenses, products and services, some of which are distinct and are accounted for as separate performance obligations. For contracts with multiple performance obligations, Cadence allocates the transaction price of the contract to each performance obligation, generally on a relative basis using its SSP. Cadence generates revenue from contracts with customers and applies judgement in identifying and evaluating any terms and conditions in contracts which may impact revenue recognition. Revenue is recognized net of any taxes collected from customers that are subsequently remitted to governmental authorities.
Software Revenue Recognition
Cadence’s time-based license arrangements grant customers the right to access and use all of the licensed products at the outset of an arrangement and updates are generally made available throughout the entire term of the arrangement, which is generally two to three years. Cadence’s updates provide continued access to evolving technology as customers’ designs migrate to more advanced nodes and as its customers’ technological requirements evolve. In addition, certain time-based license arrangements include remix rights and unspecified additional products that become commercially available during the term of the agreement. Payments are generally received in equal or near equal installments over the term of the agreement.
Multiple software licenses, related updates, and technical support in these time-based arrangements constitute a single, combined performance obligation and revenue is recognized over the term of the license, commencing upon the later of the effective date of the arrangement or transfer of the software license. Remix rights are not an additional promised good or service in the contract, and where unspecified additional software product rights are part of the contract with the customer, such rights are accounted for as part of the single performance obligation that includes the licenses, updates, and technical support because such rights are provided for the same period of time and have the same time-based pattern of transfer to the customer.
Hardware Revenue Recognition
Cadence generally has two performance obligations in arrangements involving the sale or lease of hardware products. The first performance obligation is to transfer the hardware product (which includes software integral to the functionality of the hardware product). The second performance obligation is to provide maintenance on hardware and its embedded software, which includes rights to technical support, hardware repairs and software updates that are all provided over the same term and have the same time-based pattern of transfer to the customer. The transaction price allocated to the hardware product is generally recognized as revenue at the time of delivery because the customer obtains control of the product at that point in time. Cadence has concluded that control generally transfers at that point in time because the customer has title to the hardware, physical possession, and a present obligation to pay for the hardware. The transaction price allocated to maintenance is recognized as revenue ratably over the maintenance term. Payments for hardware contracts are generally received upon delivery of the hardware product. Shipping and handling costs are considered fulfillment costs and are included in cost of product and maintenance in Cadence’s consolidated income statements.
IP Revenue Recognition
Cadence generally licenses IP under nonexclusive license agreements that provide usage rights for specific designs. In addition, for certain of Cadence’s IP license agreements, royalties are collected as customers ship their own products that incorporate Cadence IP. These arrangements generally have two performance obligations—transferring the licensed IP and associated maintenance, which includes rights to technical support, and software updates that are all provided over the maintenance term and have a time-based pattern of transfer to the customer.
Some customers enter into a non-cancellable IPAA whereby the customer commits to a fixed dollar amount over a specified period of time that can be used to purchase from a list of IP products or services. These arrangements do not meet the definition of a revenue contract until the customer executes a separate selection form to identify the products and services that they are purchasing. Each separate selection form under the IPAA is treated as an individual contract and accounted for based on the respective performance obligations.
Revenue allocated to the IP license is recognized at a point in time upon the later of the delivery of the IP or the beginning of the license period and revenue allocated to the maintenance is recognized over the maintenance term. Royalties are recognized as revenue in the quarter in which the applicable Cadence customer ships its products that incorporate Cadence IP. Payments for IP contracts are generally received upon delivery of the IP. Cadence customizes certain IP and revenue related to this customization is recognized as services revenue as described below.
Services Revenue Recognition
Revenue from service contracts is recognized over time, generally using costs incurred or hours expended to measure progress. Cadence has a history of accurately estimating project status and the costs necessary to complete projects. A number of internal and external factors can affect these estimates, including labor rates, utilization and efficiency variances and specification and testing requirement changes. Payments for services are generally due upon milestones in the contract or upon consumption of the hourly resources.
Stock-Based Compensation
Cadence recognizes the cost of awards of equity instruments granted to employees in exchange for their services as stock-based compensation expense. Stock-based compensation expense is measured at the grant date based on the value of the award and is recognized as expense over the requisite service period, which is typically the vesting period. Cadence recognizes stock-based compensation expense on the straight-line method for awards that only contain a service condition and on the graded-vesting method for awards that contain both a service and performance condition. Cadence recognizes the impact of forfeitures on stock-based compensation expense as they occur.
The fair value of stock options and purchase rights issued under Cadence’s Employee Stock Purchase Plan (“ESPP”) are calculated using the Black-Scholes option pricing model. The computation of the expected volatility assumption used for new awards is based on a weighting of historical and implied volatilities. When determining the expected term, Cadence reviews historical employee exercise behavior from options having similar vesting periods. The risk-free interest rate for the period within the expected term of the option is based on the yield of United States Treasury notes for the comparable term in effect at the time of grant. The expected dividend yield used in the calculation is zero because Cadence has not historically paid and currently does not expect to pay dividends in the foreseeable future.
Advertising
Cadence expenses the costs of advertising as incurred. Total advertising expense, including marketing programs and events, was $7.5 million, $7.1 million and $8.4 million during fiscal 2021, 2020 and 2019, respectively, and is included in marketing and sales in the consolidated income statements.
Restructuring
Cadence records personnel-related restructuring charges with termination benefits when the costs are both probable and estimable. Cadence records personnel-related restructuring charges with non-customary termination benefits when the plan has been communicated to the affected employees. Cadence records facilities-related restructuring charges in the period in which the affected facilities are vacated. In connection with facilities-related restructuring plans, Cadence has made a number of estimates and assumptions related to losses on excess facilities that have been vacated or consolidated, particularly the timing of subleases and sublease terms. Closure and space reduction costs included in the restructuring charges include payments required under leases less any applicable estimated sublease income after the facilities are abandoned, lease buyout costs and certain contractual costs to maintain facilities during the period after abandonment.
Cadence records estimated provisions for termination benefits and outplacement costs along with other personnel-related restructuring costs, asset impairments related to abandoned assets and other costs associated with the restructuring plan. Cadence regularly evaluates the adequacy of its restructuring liabilities and adjusts the balances based on actual costs incurred or changes in estimates and assumptions. Subsequent adjustments to restructuring accruals are classified as restructuring in the consolidated income statements.
Accounting for Income Taxes
Cadence accounts for the effect of income taxes in its consolidated financial statements using the asset and liability method. This process involves estimating actual current tax liabilities together with assessing carryforwards and temporary differences resulting from differing treatment of items, such as depreciation, for tax and accounting purposes. These differences result in deferred tax assets and liabilities, measured using enacted tax rates expected to apply to taxable income in the years when those temporary differences are expected to be recovered or settled. Cadence accounts for the United States global intangible low-taxed income as a period expense.
Cadence then records a valuation allowance to reduce the deferred tax assets to the amount that Cadence believes is more likely than not to be realized based on its judgment of all available positive and negative evidence. The weight given to the potential effect of negative and positive evidence is commensurate with the extent to which the strength of the evidence can be objectively verified. This assessment, which is completed on a taxing jurisdiction basis, takes into account a number of types of evidence, including the following:
•the nature and history of current or cumulative financial reporting income or losses;
•sources of future taxable income;
•the anticipated reversal or expiration dates of the deferred tax assets; and
•tax planning strategies.
Cadence takes a two-step approach to recognizing and measuring the financial statement benefit of uncertain tax positions. The first step is to evaluate the tax position for recognition by determining whether the weight of available evidence indicates that it is more likely than not that the tax position will be sustained on audit, including resolution of any related appeals or litigation processes. The second step is to measure the tax benefit as the largest amount that is more than 50% likely of being realized upon settlement of the audit. Cadence classifies interest and penalties on unrecognized tax benefits as income tax expense or benefit.
For additional discussion of income taxes, see Note 8 in the notes to the consolidated financial statements.
NOTE 3. DEBT
Cadence’s outstanding debt as of January 1, 2022 and January 2, 2021 was as follows:
| | | | | | | | | | | | | | | | | | | | | | | | | | | | | | | | | | | |
| | January 1, 2022 | | January 2, 2021 |
| | (In thousands) |
| Principal | | Unamortized Discount | | Carrying Value | | Principal | | Unamortized Discount | | Carrying Value |
| Revolving Credit Facility | $ | — | | | $ | — | | | $ | — | | | $ | — | | | $ | — | | | $ | — | |
| 2024 Notes | 350,000 | | | (2,412) | | | 347,588 | | | 350,000 | | | (3,207) | | | 346,793 | |
| Total outstanding debt | $ | 350,000 | | | $ | (2,412) | | | $ | 347,588 | | | $ | 350,000 | | | $ | (3,207) | | | $ | 346,793 | |
Revolving Credit Facility
In June 2021, Cadence terminated its existing revolving credit facility, dated January 30, 2017, and entered into a five-year senior unsecured revolving credit facility with a group of lenders led by Bank of America, N.A., as administrative agent (the “2021 Credit Facility”). The 2021 Credit Facility provides for borrowings up to $700 million, with the right to request increased capacity up to an additional $350 million upon the receipt of lender commitments, for total maximum borrowings of $1.05 billion. The 2021 Credit Facility expires on June 30, 2026. Any outstanding loans drawn under such credit facility are due at maturity on June 30, 2026, subject to an option to extend the maturity date. Outstanding borrowings may be repaid at any time prior to maturity. Debt issuance costs of $1.3 million were recorded to other assets in Cadence’s consolidated balance sheet at the inception of the agreement and are being amortized to interest expense over the term of the 2021 Credit Facility.
Interest accrues on borrowings under the 2021 Credit Facility at a rate equal to, at Cadence’s option, either (1) LIBOR plus a margin between 0.750% and 1.250% per annum, determined by reference to the credit rating of Cadence’s unsecured debt, or (2) the base rate plus a margin between 0.000% and 0.250% per annum, determined by reference to the credit rating of Cadence’s unsecured debt. Interest is payable quarterly. A commitment fee ranging from 0.070% to 0.175% is assessed on the daily average undrawn portion of revolving commitments. The 2021 Credit Facility also includes provisions addressing the potential transition from LIBOR to a new replacement benchmark.
The 2021 Credit Facility contains customary negative covenants that, among other things, restrict Cadence’s ability to incur additional indebtedness and grant liens. In addition, the 2021 Credit Facility contains financial covenants that require Cadence to maintain a funded debt to EBITDA ratio not greater than 3.25 to 1, with a step up to 3.75 to 1 for one year following an acquisition by Cadence of at least $250 million that results in a pro forma leverage ratio between 3.00 to 1 and 3.50 to 1. As of January 1, 2022, Cadence was in compliance with all financial covenants associated with the 2021 Credit Facility.
2024 Notes
In October 2014, Cadence issued $350.0 million aggregate principal amount of 4.375% Senior Notes due October 15, 2024 (the “2024 Notes”). Cadence received net proceeds of $342.4 million from the issuance of the 2024 Notes, net of a discount of $1.4 million and issuance costs of $6.2 million. Both the discount and issuance costs are being amortized to interest expense over the term of the 2024 Notes using the effective interest method. Interest is payable in cash semi-annually in April and October. The 2024 Notes are unsecured and rank equal in right of payment to all of Cadence’s existing and future senior indebtedness. The fair value of the 2024 Notes was approximately $376.4 million as of January 1, 2022.
Cadence may redeem the 2024 Notes, in whole or in part, at a redemption price equal to the greater of (a) 100% of the principal amount of the notes to be redeemed and (b) the sum of the present values of the remaining scheduled payments of principal and interest, plus any accrued and unpaid interest, as more particularly described in the indenture governing the 2024 Notes.
The indenture governing the 2024 Notes includes customary representations, warranties and restrictive covenants, including, but not limited to, restrictions on Cadence’s ability to grant liens on assets, enter into sale and lease-back transactions, or merge, consolidate or sell assets, and also includes customary events of default.
NOTE 4. RECEIVABLES, NET
Cadence’s current and long-term receivables balances as of January 1, 2022 and January 2, 2021 were as follows:
| | | | | | | | | | | |
| | As of |
| | January 1,
2022 | | January 2,
2021 |
| | (In thousands) |
| Accounts receivable | $ | 185,599 | | | $ | 196,990 | |
| Unbilled accounts receivable | 155,689 | | | 144,364 | |
| Long-term receivables | 5,098 | | | 3,655 | |
| Total receivables | 346,386 | | | 345,009 | |
| Less allowance for doubtful accounts | (3,692) | | | (2,867) | |
| Total receivables, net | $ | 342,694 | | | $ | 342,142 | |
Cadence’s customers are primarily concentrated within the semiconductor and electronics systems industries. As of January 1, 2022 and January 2, 2021, no customer accounted for 10% or more of Cadence’s total receivables.
Allowance for doubtful accounts
Cadence’s provisions for losses on its accounts receivable during fiscal 2021, 2020 and 2019 were as follows:
| | | | | | | | | | | | | | | | | | | | | | | | | | | | | | | | |
| | Balance at Beginning of Period* | | Charged to Costs and Expenses | | Charged to Other Accounts | | Uncollectible Accounts Written Off, Net | | Balance at End of Period |
| | | | | | | | | | |
| Year ended January 1, 2022 | | $ | 2,867 | | | $ | 525 | | | $ | 780 | | | $ | (480) | | | $ | 3,692 | |
| Year ended January 2, 2021 | | 2,868 | | | 1,628 | | | 225 | | | (1,854) | | | 2,867 | |
| Year ended December 28, 2019 | | $ | 3,936 | | | $ | 632 | | | $ | — | | | $ | (3,699) | | | $ | 869 | |
_____________
* Beginning balance for the year ended January 2, 2021 reflects the cumulative-effect adjustment recorded in connection with the adoption of ASU 2016-13, “Measurement of Credit Losses on Financial Instruments” on the first day of fiscal 2020.
NOTE 5. REVENUE
Cadence groups its products into five categories related to major design activities. The following table shows the percentage of product and related maintenance revenue contributed by each of Cadence’s five product categories and services for fiscal 2021, 2020 and 2019:
| | | | | | | | | | | | | | | | | |
| | 2021 | | 2020 | | 2019 |
| Custom IC Design and Simulation | 23 | % | | 25 | % | | 25 | % |
| Digital IC Design and Signoff | 29 | % | | 29 | % | | 30 | % |
| Functional Verification, including Emulation and Prototyping Hardware* | 24 | % | | 22 | % | | 23 | % |
| IP | 13 | % | | 14 | % | | 13 | % |
| System Design and Analysis | 11 | % | | 10 | % | | 9 | % |
| Total | 100 | % | | 100 | % | | 100 | % |
_____________
* Includes immaterial amount of revenue accounted for under leasing arrangements.
Cadence generates revenue from contracts with customers and applies judgment in identifying and evaluating any terms and conditions in contracts which may impact revenue recognition. Certain of Cadence’s licensing arrangements allow customers the ability to remix among software products. Cadence also has arrangements with customers that include a combination of products, with the actual product selection and number of licensed users to be determined at a later date. For these arrangements, Cadence estimates the allocation of the revenue to product categories based upon the expected usage of products. Revenue by product category fluctuates from period to period based on demand for products and services, and Cadence’s available resources to deliver them. No one customer accounted for 10% or more of total revenue during fiscal 2021, 2020 or 2019.
Significant Judgments
Cadence’s contracts with customers often include promises to transfer to a customer multiple software and/or IP licenses and services, including professional services, technical support services, and rights to unspecified updates. Determining whether licenses and services are distinct performance obligations that should be accounted for separately, or not distinct and thus accounted for together, requires significant judgment. In some arrangements, such as most of Cadence’s IP license arrangements, Cadence has concluded that the licenses and associated services are distinct from each other. In others, like Cadence’s time-based software arrangements, the licenses and certain services are not distinct from each other. Cadence’s time-based software arrangements include multiple software licenses and updates to the licensed software products, as well as technical support, and Cadence has concluded that these promised goods and services are a single, combined performance obligation.
The accounting for contracts with multiple performance obligations requires the contract’s transaction price to be allocated to each distinct performance obligation based on relative SSP. Judgment is required to determine SSP for each distinct performance obligation because Cadence rarely licenses or sells products on a standalone basis. In instances where the SSP is not directly observable because Cadence does not sell the license, product or service separately, Cadence determines the SSP using information that maximizes the use of observable inputs and may include market conditions. Cadence typically has more than one SSP for individual performance obligations due to the stratification of those items by classes of customers and circumstances. In these instances, Cadence may use information such as the size of the customer and geographic region of the customer in determining the SSP.
Revenue is recognized over time for Cadence’s combined performance obligations that include software licenses, updates, technical support and maintenance that are separate performance obligations with the same term. For Cadence’s professional services, revenue is recognized over time, generally using costs incurred or hours expended to measure progress. Judgment is required in estimating project status and the costs necessary to complete projects. A number of internal and external factors can affect these estimates, including labor rates, utilization and efficiency variances and specification and testing requirement changes. For Cadence’s other performance obligations recognized over time, revenue is generally recognized using a time-based measure of progress reflecting generally consistent efforts to satisfy those performance obligations throughout the arrangement term.
If a group of agreements are so closely related that they are, in effect, part of a single arrangement, such agreements are deemed to be one arrangement for revenue recognition purposes. Cadence exercises significant judgment to evaluate the relevant facts and circumstances in determining whether the separate agreements should be accounted for separately or as, in substance, a single arrangement. Cadence’s judgments about whether a group of contracts comprise a single arrangement can affect the allocation of consideration to the distinct performance obligations, which could have an effect on results of operations for the periods involved.
Cadence is required to estimate the total consideration expected to be received from contracts with customers. In limited circumstances, the consideration expected to be received is variable based on the specific terms of the contract or based on Cadence’s expectations of the term of the contract. Generally, Cadence has not experienced significant returns or refunds to customers. These estimates require significant judgment and the change in these estimates could have an effect on its results of operations during the periods involved.
Contract Balances
The timing of revenue recognition may differ from the timing of invoicing to customers, and these timing differences result in receivables, contract assets, or contract liabilities (deferred revenue) on Cadence’s consolidated balance sheets. For certain software, hardware and IP agreements with payment plans, Cadence records an unbilled receivable related to revenue recognized upon transfer of control because it has an unconditional right to invoice and receive payment in the future related to those transferred products or services. Cadence records a contract asset when revenue is recognized prior to invoicing and Cadence does not have the unconditional right to invoice or retains performance risk with respect to that performance obligation. Cadence records deferred revenue when revenue is recognized subsequent to invoicing. For Cadence’s time-based software agreements, customers are generally invoiced in equal, quarterly amounts, although some customers prefer to be invoiced in single or annual amounts.
The contract assets indicated below are included in prepaid expenses and other in the consolidated balance sheet and primarily relate to Cadence’s rights to consideration for work completed but not billed as of the balance sheet date on services and customized IP contracts. The contract assets are transferred to receivables when the rights become unconditional, usually upon completion of a milestone.
Cadence’s contract balances as of January 1, 2022 and January 2, 2021 were as follows:
| | | | | | | | | | | |
| | As of |
| | January 1,
2022 | | January 2,
2021 |
| | (In thousands) |
| Contract assets | $ | 6,811 | | | $ | 9,709 | |
| Deferred revenue | 655,090 | | | 553,921 | |
Cadence recognized revenue of $430.2 million, $345.9 million and $311.8 million during fiscal 2021, 2020 and 2019, respectively, that was included in the deferred revenue balance at the beginning of each fiscal year. All other activity in deferred revenue is due to the timing of invoices in relation to the timing of revenue as described above.
Payment terms and conditions vary by contract type, although terms generally include a requirement of payment within 30 to 60 days. In instances where the timing of revenue recognition differs from the timing of invoicing, Cadence has determined that its contracts generally do not include a significant financing component. The primary purpose of invoicing terms is to provide customers with simplified and predictable ways of purchasing Cadence’s products and services, and not to facilitate financing arrangements.
Some customers enter into a non-cancellable IPAAs whereby the customer commits to a fixed dollar amount over a specified period of time that can be used to purchase from a list of IP products or services. These arrangements do not meet the definition of a revenue contract until the customer executes a separate selection form to identify the products and services that they are purchasing. Each separate selection form under the IPAA is treated as an individual contract and accounted for based on the respective performance obligations. Cadence records a customer deposit liability for amounts received from customers prior to the arrangement meeting the definition of a revenue contract.
Remaining Performance Obligations
Revenue allocated to remaining performance obligations represents the transaction price allocated to the performance obligations that are unsatisfied, or partially unsatisfied, which includes unearned revenue and amounts that will be invoiced and recognized as revenue in future periods. Cadence has elected to exclude the potential future royalty receipts from the remaining performance obligations. Contracted but unsatisfied performance obligations were approximately $4.4 billion as of January 1, 2022, which included $119.5 million of non-cancellable IPAA commitments from customers where actual product selection and quantities of specific products or services are to be determined by customers at a later date. As of January 1, 2022, Cadence expected to recognize approximately 55% of the contracted but unsatisfied performance obligations, excluding non-cancellable IPAA commitments, as revenue over the next 12 months and the remainder thereafter.
Cadence recognized revenue of $47.1 million, $51.2 million and $40.4 million during fiscal 2021, 2020 and 2019, respectively, from performance obligations satisfied in previous periods. These amounts represent royalties earned during the period and exclude contracts with nonrefundable prepaid royalties. Nonrefundable prepaid royalties are recognized upon delivery of the IP because Cadence’s right to the consideration is not contingent upon customers’ future shipments.
NOTE 6. ACQUISITIONS
2021 Acquisitions
On February 23, 2021, Cadence acquired all of the outstanding equity of Belgium-based Numerical Mechanics Applications International SA (“NUMECA”). The addition of NUMECA’s technologies and talent supports Cadence’s Intelligent System Design™ strategy, servicing the computational fluid dynamics (“CFD”) market segment as part of System Design and Analysis. The aggregate cash consideration for Cadence’s acquisition of NUMECA, net of cash acquired of $9.6 million, was $188.6 million. Cadence expects to recognize expense for consideration paid to certain former NUMECA shareholders that is subject to service and other conditions, through the first quarter of fiscal 2023.
The total purchase consideration was allocated to the assets acquired and liabilities assumed with Cadence’s acquisition of NUMECA based on their respective estimated fair values on the acquisition date as follows:
| | | | | |
| | Acquisition Date Fair Value |
| | (In thousands) |
| Current assets | $ | 16,423 | |
| Goodwill | 133,077 | |
| Acquired intangibles | 72,200 | |
| Other long-term assets | 6,928 | |
| Total assets acquired | 228,628 | |
| Current liabilities | 9,951 | |
| Long-term liabilities | 20,475 | |
| Total liabilities assumed | 30,426 | |
| Total purchase consideration | $ | 198,202 | |
The recorded goodwill is attributed to intangible assets that do not qualify for separate recognition, including the acquired assembled workforce and expected synergies from combining operations of NUMECA with Cadence. Cadence expects all of the goodwill related to the acquisition of NUMECA to be deductible for tax purposes.
On April 14, 2021, Cadence acquired all of the outstanding equity of Pointwise, Inc. (“Pointwise”), a leader in mesh generation for CFD for cash consideration of approximately $31.4 million, net of cash acquired. The addition of Pointwise’s technologies and experienced team supports Cadence’s Intelligent System Design strategy and further broadens its System Design and Analysis portfolio, complementing its acquisition of NUMECA. The total purchase consideration was allocated to the assets acquired and liabilities assumed based on their respective estimated fair values on the acquisition dates. Cadence recorded $16.7 million of definite-lived intangible assets and $16.7 million of goodwill with its acquisition of Pointwise. All of the goodwill related to Cadence’s acquisition of Pointwise is expected to be deductible for tax purposes.
Cadence completed two additional acquisitions during fiscal 2021. These acquisitions are not material to the consolidated financial statements.
Definite-lived intangible assets acquired with Cadence’s fiscal 2021 acquisitions were as follows:
| | | | | | | | | | | |
| | Acquisition Date Fair Value | | Weighted Average Amortization Period |
| | (In thousands) | | (in years) |
| Existing technology | $ | 59,100 | | | 13.7 years |
| Agreements and relationships | 28,900 | | | 13.7 years |
| Tradenames, trademarks and patents | 4,600 | | | 14.3 years |
| Total acquired intangibles with definite lives | $ | 92,600 | | | 13.7 years |
| | | |
| | | |
2020 Acquisitions
In fiscal 2020, Cadence acquired all of the outstanding equity of AWR Corporation (“AWR”) and Integrand Software, Inc. (“Integrand”). These acquisitions enhanced Cadence’s technology portfolio to address growing radio frequency design activity, driven by expanding use of 5G communications.
The aggregate cash consideration for these acquisitions was $195.6 million, after taking into account cash acquired of $1.5 million. The total purchase consideration was allocated to the assets acquired and liabilities assumed based on their respective estimated fair values on the acquisition dates. Cadence will also make payments to certain employees, subject to continued employment and other performance-based conditions, through the first quarter of fiscal 2023.
With its acquisitions of AWR and Integrand, Cadence recorded $101.3 million of definite-lived intangible assets with a weighted average amortization period of approximately nine years. The definite-lived intangible assets related primarily to existing technology and customer agreements and relationships. Cadence also recorded $119.4 million of goodwill and $25.1 million of net liabilities, consisting primarily of deferred tax liabilities, assumed deferred revenue and trade accounts receivable. The recorded goodwill was primarily related to the acquired assembled workforce and expected synergies from combining operations of the acquired companies with Cadence. None of the goodwill related to the acquisitions of AWR and Integrand is deductible for tax purposes.
Cadence completed one additional acquisition during fiscal 2020 that was not material to the consolidated financial statements.
Pro Forma Financial Information
Cadence has not presented pro forma financial information for any of the businesses it acquired during fiscal 2021 and fiscal 2020 because the results of operations for these businesses are not material to Cadence’s consolidated financial statements.
Acquisition-Related Transaction Costs
Transaction costs associated with acquisitions, which consist of professional fees and administrative costs, were not material during fiscal 2021, 2020 or 2019 and were expensed as incurred in Cadence’s consolidated income statements.
NOTE 7. GOODWILL AND ACQUIRED INTANGIBLES
Goodwill
The changes in the carrying amount of goodwill during fiscal 2021 and 2020 were as follows:
| | | | | |
| | Gross Carrying
Amount |
| | (In thousands) |
| Balance as of December 28, 2019 | $ | 661,856 | |
| Goodwill resulting from acquisitions | 120,564 | |
| Effect of foreign currency translation | (333) | |
| Balance as of January 2, 2021 | 782,087 | |
| Goodwill resulting from acquisitions | 154,362 | |
| |
| Effect of foreign currency translation | (8,091) | |
| Balance as of January 1, 2022 | $ | 928,358 | |
Cadence completed its annual goodwill impairment test during the third quarter of fiscal 2021 and determined that the fair value of Cadence’s single reporting unit exceeded the carrying amount of its net assets and that no impairment existed.
Acquired Intangibles, Net
Acquired intangibles as of January 1, 2022 were as follows, excluding intangibles that were fully amortized as of January 2, 2021:
| | | | | | | | | | | | | | | | | |
| Gross Carrying
Amount | | Accumulated
Amortization | | Acquired
Intangibles, Net |
| | (In thousands) |
| Existing technology | $ | 405,481 | | | $ | (254,599) | | | $ | 150,882 | |
| Agreements and relationships | 205,057 | | | (130,187) | | | 74,870 | |
| Tradenames, trademarks and patents | 10,666 | | | (3,153) | | | 7,513 | |
| | | | | |
| | | | | |
| Total acquired intangibles | $ | 621,204 | | | $ | (387,939) | | | 233,265 | |
Acquired intangibles as of January 2, 2021 were as follows, excluding intangibles that were fully amortized as of December 28, 2019:
| | | | | | | | | | | | | | | | | |
| Gross Carrying
Amount | | Accumulated
Amortization | | Acquired
Intangibles, Net |
| | (In thousands) |
| Existing technology | $ | 370,838 | | | $ | (230,654) | | | $ | 140,184 | |
| Agreements and relationships | 180,023 | | | (113,629) | | | 66,394 | |
| Tradenames, trademarks and patents | 10,590 | | | (6,578) | | | 4,012 | |
| | | | | |
| | | | | |
| Total acquired intangibles | $ | 561,451 | | | $ | (350,861) | | | $ | 210,590 | |
Amortization expense from existing technology and maintenance agreements is included in cost of product and maintenance. Amortization expense for fiscal 2021, 2020 and 2019, by consolidated income statement caption, was as follows:
| | | | | | | | | | | | | | | | | |
| 2021 | | 2020 | | 2019 |
| | (In thousands) |
| Cost of product and maintenance | $ | 47,576 | | | $ | 46,184 | | | $ | 40,951 | |
| Amortization of acquired intangibles | 19,640 | | | 18,009 | | | 12,128 | |
| Total amortization of acquired intangibles | $ | 67,216 | | | $ | 64,193 | | | $ | 53,079 | |
As of January 1, 2022, the estimated amortization expense for intangible assets with definite lives was as follows for the following five fiscal years and thereafter:
| | | | | |
| | (In thousands) |
| 2022 | $ | 50,673 | |
| 2023 | 35,142 | |
| 2024 | 33,383 | |
| 2025 | 22,741 | |
| 2026 | 17,661 | |
| Thereafter | 73,665 | |
| Total estimated amortization expense | $ | 233,265 | |
NOTE 8. INCOME TAXES
Cadence’s income before provision (benefit) for income taxes included income from the United States and from foreign subsidiaries for fiscal 2021, 2020 and 2019, was as follows:
| | | | | | | | | | | | | | | | | |
| 2021 | | 2020 | | 2019 |
| (In thousands) |
| United States | $ | 376,037 | | | $ | 256,032 | | | $ | 139,306 | |
| Foreign subsidiaries | 392,398 | | | 376,716 | | | 339,662 | |
| Total income before provision (benefit) for income taxes | $ | 768,435 | | | $ | 632,748 | | | $ | 478,968 | |
Cadence’s provision (benefit) for income taxes was comprised of the following items for fiscal 2021, 2020 and 2019:
| | | | | | | | | | | | | | | | | |
| 2021 | | 2020 | | 2019 |
| (In thousands) |
| Current: | | | | | |
| Federal | $ | 19,957 | | | $ | 15,083 | | | $ | 15,282 | |
| State and local | 25,246 | | | 6,401 | | | 2,716 | |
| Foreign | 70,455 | | | 46,737 | | | 48,729 | |
| Total current | 115,658 | | | 68,221 | | | 66,727 | |
| | | | | |
| Deferred: | | | | | |
| Federal | (16,415) | | | (11,155) | | | (9,001) | |
| State and local | (30,406) | | | (24,186) | | | 6,593 | |
| Foreign | 3,643 | | | 9,224 | | | (574,330) | |
| Total deferred | (43,178) | | | (26,117) | | | (576,738) | |
| | | | | |
| Total provision (benefit) for income taxes | $ | 72,480 | | | $ | 42,104 | | | $ | (510,011) | |
During the fourth quarter of fiscal 2021, Cadence recognized a tax benefit of approximately $10.5 million due to a release of the valuation allowance on our Massachusetts research and development tax credit deferred tax assets. Cadence expects to utilize these tax credits prior to expiration based on strong current earnings and future taxable income projections.
During the third quarter of fiscal 2020, Cadence recognized a tax benefit of approximately $22.2 million due to a partial release of the valuation allowance on our California research and development tax credit deferred tax assets as a result of certain tax elections made in Cadence’s 2019 California tax return.
During the fourth quarter of fiscal 2019, Cadence completed intercompany transfers of certain intangible property rights to its Irish subsidiary, which resulted in the establishment of a deferred tax asset and the recognition of an income tax benefit of $575.6 million. Cadence expected to realize the Irish deferred tax asset in future years and did not provide for a valuation allowance. Cadence considered all available positive and negative evidence, including its past operating results, forecasted earnings, future taxable income, and any prudent and feasible tax planning strategies in making this determination.
The provision for income taxes differs from the amount estimated by applying the United States statutory federal income tax rates of 21% to income before provision (benefit) for income taxes for fiscal 2021, 2020, and 2019 as follows:
| | | | | | | | | | | | | | | | | |
| 2021 | | 2020 | | 2019 |
| (In thousands) |
| Provision computed at federal statutory income tax rate | $ | 161,880 | | | $ | 132,877 | | | $ | 100,583 | |
| State and local income tax, net of federal tax effect | 24,640 | | | 20,936 | | | 23,221 | |
| Intercompany transfers of intangible property rights | — | | | — | | | (575,618) | |
| Foreign income tax rate differential | (26,887) | | | (32,589) | | | (37,786) | |
| | | | | |
| | | | | |
| Foreign-derived intangible income deduction | (22,050) | | | (3,762) | | | (1,201) | |
| U.S. tax on foreign entities | 51,112 | | | 43,615 | | | 57,225 | |
| Stock-based compensation | (55,091) | | | (51,226) | | | (29,785) | |
| Change in deferred tax asset valuation allowance | (8,262) | | | (9,101) | | | 16,796 | |
| Tax credits | (90,054) | | | (89,684) | | | (87,793) | |
| Non-deductible research and development expense | 4,443 | | | 5,163 | | | 4,363 | |
| | | | | |
| | | | | |
| Withholding taxes | 23,495 | | | 17,189 | | | 15,865 | |
| | | | | |
| | | | | |
| Other | 9,254 | | | 8,686 | | | 4,119 | |
| Provision (benefit) for income taxes | $ | 72,480 | | | $ | 42,104 | | | $ | (510,011) | |
| Effective tax rate | 9 | % | | 7 | % | | (106) | % |
The components of deferred tax assets and liabilities consisted of the following as of January 1, 2022 and January 2, 2021:
| | | | | | | | | | | |
| As of |
| January 1,
2022 | | January 2,
2021 |
| (In thousands) |
| Deferred tax assets: | | | |
| Tax credit carryforwards | $ | 147,248 | | | $ | 197,436 | |
| Reserves and accruals | 72,287 | | | 60,272 | |
| Intangible assets | 568,199 | | | 578,267 | |
| Capitalized research and development expense for income tax purposes | 34,467 | | | 39,427 | |
| Operating loss carryforwards | 6,630 | | | 5,935 | |
| Deferred income | 42,753 | | | 21,170 | |
| Capital loss carryforwards | 16,957 | | | 16,944 | |
| Stock-based compensation costs | 17,690 | | | 14,656 | |
| Depreciation and amortization | 5,005 | | | 4,402 | |
| Investments | 6,833 | | | 2,521 | |
| Lease liability | 27,362 | | | 31,278 | |
| Prepaid expenses | 53,893 | | | — | |
| Total deferred tax assets | 999,324 | | | 972,308 | |
| Valuation allowance | (108,158) | | | (116,419) | |
| Net deferred tax assets | 891,166 | | | 855,889 | |
| | | |
| Deferred tax liabilities: | | | |
| Intangible assets | (55,178) | | | (44,549) | |
| Undistributed foreign earnings | (45,460) | | | (41,957) | |
| ROU assets | (27,362) | | | (31,278) | |
| Other | (8,528) | | | (10,749) | |
| Total deferred tax liabilities | (136,528) | | | (128,533) | |
| Total net deferred tax assets | $ | 754,638 | | | $ | 727,356 | |
During fiscal 2021, 2020 and 2019 Cadence maintained valuation allowances of $108.2 million, $116.4 million, and $125.5 million, respectively, on certain federal, state and foreign deferred tax assets because the realization of these deferred tax assets require future income of a specific character or amount that Cadence considered uncertain. The valuation allowance primarily relates to the following:
•Tax credits in certain states that are accumulating at a rate greater than Cadence’s capacity to utilize the credits and tax credits in certain states where it is likely the credits will expire unused;
•Federal, state and foreign deferred tax assets related to investments and capital losses that can only be utilized against gains that are capital in nature; and
•Foreign tax credits that can only be fully utilized if Cadence has sufficient income of a specific character in the future.
The valuation allowance decreased by $8.3 million during fiscal 2021, decreased by $9.1 million during fiscal 2020 and increased by $16.8 million during fiscal 2019. The valuation allowance activity was primarily related to state research and development tax credits and certain foreign tax credits.
As of January 1, 2022, Cadence’s operating loss carryforwards were as follows:
| | | | | | | | | | | |
| Amount | | Expiration Periods |
| (In thousands) | | |
| Federal | $ | 428 | | | from 2027 through 2033 |
| California | 27,044 | | | from 2025 through 2038 |
| Other states (tax effected, net of federal benefit) | 1,174 | | | from 2022 through 2037 |
| Foreign (tax effected) | 3,478 | | | from 2030 through indefinite |
As of January 1, 2022, Cadence had tax credit carryforwards of:
| | | | | | | | | | | |
| Amount | | Expiration Periods |
| (In thousands) | | |
| Federal* | $ | 46,743 | | | from 2029 through 2041 |
| California | 77,651 | | | indefinite |
| Other states | 14,361 | | | from 2025 through indefinite |
| Foreign | 27,814 | | | from 2037 through indefinite |
_____________
*Certain of Cadence’s foreign tax credits have yet to be realized and as a result do not yet have an expiration period.
Examinations by Tax Authorities
Taxing authorities regularly examine Cadence’s income tax returns. As of January 1, 2022, Cadence’s earliest tax years that remain open to examination and the assessment of additional tax include:
| | | | | | | | |
| Jurisdiction | | Earliest Tax Year Open to Examination |
| | |
| United States – Federal | | 2017 |
| United States – California | | 2015 |
| Ireland | | 2017 |
| Israel | | 2016 |
| Korea | | 2016 |
Unrecognized Tax Benefits
The changes in Cadence’s gross amount of unrecognized tax benefits during fiscal 2021, 2020 and 2019 are as follows:
| | | | | | | | | | | | | | | | | |
| 2021 | | 2020 | | 2019 |
| (In thousands) |
| Unrecognized tax benefits at the beginning of the fiscal year | $ | 113,021 | | | $ | 106,041 | | | $ | 101,857 | |
| Gross amount of the increases (decreases) in unrecognized tax benefits of tax positions taken during a prior year* | 15,414 | | | 5,037 | | | (3,143) | |
| Gross amount of the increases in unrecognized tax benefits as a result of tax positions taken during the current year | 5,100 | | | 3,344 | | | 8,951 | |
| Amount of decreases in unrecognized tax benefits relating to settlements with taxing authorities, including the utilization of tax attributes | (270) | | | (1,316) | | | (380) | |
| Reductions to unrecognized tax benefits resulting from the lapse of the applicable statute of limitations | (2,778) | | | (676) | | | (1,692) | |
| Effect of foreign currency translation | 43 | | | 591 | | | 448 | |
| Unrecognized tax benefits at the end of the fiscal year | $ | 130,530 | | | $ | 113,021 | | | $ | 106,041 | |
| | | | | |
| Total amounts of unrecognized tax benefits that, if upon resolution of the uncertain tax positions would reduce Cadence’s effective tax rate | $ | 79,654 | | | $ | 66,010 | | | $ | 61,527 | |
_____________
* Includes unrecognized tax benefits of tax positions recorded in connection with acquisitions
Cadence is currently under examination or contesting proposed adjustments by various domestic and international taxing authorities. It is reasonably possible that the amount of unrecognized tax positions could decrease by approximately $20.6 million during the next 12 months. The potential decrease could be primarily driven by settlements with tax authorities. The actual amount could vary significantly depending on the ultimate timing and nature of any settlements.
The total amounts of interest, net of tax, and penalties recognized in the consolidated income statements as provision (benefit) for income taxes for fiscal 2021, 2020 and 2019 were as follows:
| | | | | | | | | | | | | | | | | |
| 2021 | | 2020 | | 2019 |
| (In thousands) |
| Interest | $ | 1,171 | | | $ | 473 | | | $ | 490 | |
| Penalties | (11) | | | (3) | | | 19 | |
The total amounts of gross accrued interest and penalties recognized in the consolidated balance sheets as of January 1, 2022 and January 2, 2021 were as follows:
| | | | | | | | | | | |
| As of |
| January 1,
2022 | | January 2,
2021 |
| (In thousands) |
| Interest | $ | 4,921 | | | $ | 3,555 | |
| Penalties | — | | | 12 | |
NOTE 9. STOCK COMPENSATION PLANS AND STOCK-BASED COMPENSATION
Equity Incentive Plans
Cadence’s Omnibus Plan provides for the issuance of both incentive and non-qualified options, restricted stock awards, restricted stock units, stock bonuses and the rights to acquire restricted stock to both executive and non-executive employees. During fiscal 2020, Cadence’s stockholders approved an amendment to the Omnibus Plan to increase the number of shares of common stock authorized for issuance by 9.0 million. As of January 1, 2022, the total number of shares available for future issuance under the Omnibus Plan was 14.4 million. Options granted under the Omnibus Plan have an exercise price not less than the fair market value of the stock on the date of grant. Options and restricted stock generally vest over a period of three years to four years. Options granted under the Omnibus Plan expire seven years from the date of grant. Vesting of restricted stock awards granted under the Omnibus Plan may require the attainment of specified performance criteria.
Cadence’s 1995 Directors Stock Incentive Plan (the “Directors Plan”) provides for the issuance of non-qualified options, restricted stock awards and restricted stock units to its non-employee directors. Options granted under the Directors Plan have an exercise price not less than the fair market value of the stock on the date of grant. As of January 1, 2022, the total number of shares available for future issuance under the Directors Plan was 0.5 million. Options granted under the Directors Plan expire after ten years, and options, restricted stock awards and restricted stock units vest one year from the date of grant.
Cadence has assumed certain options granted to employees of acquired companies (“Acquired Options”). The Acquired Options were assumed by Cadence outside of its stock option plans, and each option is administered under the terms of the respective original plans of the acquired companies. All of the Acquired Options have been adjusted for the price conversion under the terms of the acquisition agreement between Cadence and the relevant acquired company. If the Acquired Options are canceled, forfeited or expire, they do not become available for future grant.
Stock-Based Compensation
Stock-based compensation expense and the related income tax benefit recognized in connection with stock options, restricted stock and the ESPP during fiscal 2021, 2020 and 2019 were as follows:
| | | | | | | | | | | | | | | | | |
| 2021 | | 2020 | | 2019 |
| (In thousands) |
| Stock options | $ | 9,051 | | | $ | 8,062 | | | $ | 6,806 | |
| Restricted stock | 181,946 | | | 173,193 | | | 164,078 | |
| ESPP | 19,093 | | | 16,013 | | | 10,663 | |
| Total stock-based compensation expense | $ | 210,090 | | | $ | 197,268 | | | $ | 181,547 | |
| | | | | |
| Income tax benefit | $ | 33,958 | | | $ | 31,857 | | | $ | 30,118 | |
Stock-based compensation expense is reflected in Cadence’s consolidated income statements during fiscal 2021, 2020 and 2019 as follows:
| | | | | | | | | | | | | | | | | |
| 2021 | | 2020 | | 2019 |
| (In thousands) |
| Cost of product and maintenance | $ | 4,161 | | | $ | 2,922 | | | $ | 2,759 | |
| Cost of services | 3,375 | | | 3,720 | | | 3,510 | |
| Marketing and sales | 43,264 | | | 42,096 | | | 39,088 | |
| Research and development | 131,247 | | | 124,999 | | | 114,656 | |
| General and administrative | 28,043 | | | 23,531 | | | 21,534 | |
| Total stock-based compensation expense | $ | 210,090 | | | $ | 197,268 | | | $ | 181,547 | |
Stock Options
The exercise price of each stock option granted under Cadence’s employee equity incentive plans is equal to or greater than the closing price of Cadence’s common stock on the date of grant. The fair value of each option grant is estimated on the date of grant using the Black-Scholes option pricing model. The weighted average grant date fair value of options granted and the weighted average assumptions used in the model for fiscal 2021, 2020 and 2019 were as follows:
| | | | | | | | | | | | | | | | | |
| 2021 | | 2020 | | 2019 |
| Dividend yield | None | | None | | None |
| Expected volatility | 31.7 | % | | 25.1 | % | | 24.4 | % |
| Risk-free interest rate | 1.02 | % | | 1.36 | % | | 2.47 | % |
| Expected term (in years) | 4.8 | | 4.8 | | 4.8 |
| Weighted average fair value of options granted | $ | 46.10 | | | $ | 19.38 | | | $ | 14.58 | |
A summary of the changes in stock options outstanding under Cadence’s equity incentive plans during fiscal 2021 is presented below:
| | | | | | | | | | | | | | | | | | | | | | | |
| | | Weighted Average | | Weighted Average Remaining Contractual Terms | |
Aggregate Intrinsic |
| Shares | | Exercise Price | | (Years) | | Value |
| (In thousands) | | | | | | (In thousands) |
| Options outstanding as of January 2, 2021 | 3,934 | | | $ | 36.72 | | | | | |
| Granted | 612 | | | 159.25 | | | | | |
| Exercised | (1,066) | | | 22.37 | | | | | |
| Forfeited | (61) | | | 61.38 | | | | | |
| Options outstanding as of January 1, 2022 | 3,419 | | | $ | 62.69 | | | 3.5 | | $ | 422,830 | |
| Options vested as of January 1, 2022 | 2,425 | | | $ | 39.16 | | | 2.7 | | $ | 356,981 | |
Cadence had total unrecognized compensation expense related to stock option grants of $32.8 million as of January 1, 2022, which will be recognized over the remaining vesting period. The remaining weighted average vesting period of unvested awards is 2.7 years.
The total intrinsic value of and cash received from options exercised during fiscal 2021, 2020 and 2019 was:
| | | | | | | | | | | | | | | | | |
| 2021 | | 2020 | | 2019 |
| (In thousands) |
| Intrinsic value of options exercised | $ | 129,403 | | | $ | 109,193 | | | $ | 51,625 | |
| Cash received from options exercised | 23,844 | | | 26,474 | | | 14,553 | |
Restricted Stock
Generally, restricted stock, which includes restricted stock awards and restricted stock units, vests over three years to four years and is subject to the employee’s continuing service to Cadence. Stock-based compensation expense is recognized ratably over the vesting term. The vesting of certain restricted stock grants is subject to attainment of specified performance criteria. Each fiscal quarter, Cadence estimates the probability of the achievement of these performance goals and recognizes any related stock-based compensation expense using the graded-vesting method. The amount of stock-based compensation expense recognized in any one period can vary based on the attainment or expected attainment of the various performance goals. If such performance goals are not ultimately met, no compensation expense is recognized and any previously recognized compensation expense is reversed.
Certain long-term, market-based performance stock awards granted to executives vest over three to five years and are subject to certain market conditions and the executive’s continuing service to Cadence. Stock-based compensation expense is recognized straight-line over the vesting term. If the market-based performance conditions are not ultimately met, compensation expense previously recognized is not reversed. As of January 1, 2022, Cadence had 1.3 million shares of unvested long-term, market-based performance stock awards outstanding.
Stock-based compensation expense related to performance-based and market-based performance restricted stock grants for fiscal 2021, 2020 and 2019 was as follows:
| | | | | | | | | | | | | | | | | |
| 2021 | | 2020 | | 2019 |
| (In thousands) |
| Stock-based compensation expense related to performance-based restricted stock | $ | 16,225 | | | $ | 14,859 | | | $ | 12,640 | |
| Stock-based compensation expense related to market-based performance stock awards | 6,453 | | | 8,335 | | | 7,019 | |
A summary of the changes in restricted stock outstanding under Cadence’s equity incentive plans during fiscal 2021 is presented below:
| | | | | | | | | | | | | | | | | | | | | | | |
| | | Weighted Average Grant Date | | Weighted Average Remaining Vesting Terms | |
Aggregate Intrinsic |
| Shares | | Fair Value | | (Years) | | Value |
| (In thousands) | | | | | | (In thousands) |
| Unvested shares as of January 2, 2021 | 6,239 | | | $ | 63.12 | | | | | |
| Granted | 1,688 | | | 141.97 | | | | | |
| Vested | (2,570) | | | 61.61 | | | | | |
| Forfeited | (426) | | | 75.92 | | | | | |
| Unvested shares as of January 1, 2022 | 4,931 | | | $ | 89.91 | | | 1.2 | | $ | 918,769 | |
Cadence had total unrecognized compensation expense related to restricted stock grants of $341.0 million as of January 1, 2022, which will be recognized over the remaining vesting period. The remaining weighted average vesting period of unvested awards is 2.0 years.
The total fair value realized by employees upon vesting of restricted stock during fiscal 2021, 2020 and 2019 was:
| | | | | | | | | | | | | | | | | |
| 2021 | | 2020 | | 2019 |
| (In thousands) |
| Fair value of restricted stock realized upon vesting | $ | 365,298 | | | $ | 358,261 | | | $ | 298,320 | |
Employee Stock Purchase Plan
Cadence provides an ESPP that enables eligible employees to purchase shares of its common stock. Offering periods under the plan last a duration of six months beginning on either February 1 or August 1, with the purchase dates falling on the last day of the six-month offering period. For the offering periods that commenced February 1, 2021 and August 1, 2021, eligible employees may purchase Cadence’s common stock at a price equal to 85% of the lower of the fair market value at the beginning or the end of the applicable offering period, in an amount not to exceed 12% of their annual base earnings plus bonuses and commissions, and subject to a limit in any calendar year of $15,000. The ESPP may be amended from time to time. As of January 1, 2022, the total number of shares available for future issuance under the ESPP was 4.6 million.
Compensation expense is calculated using the fair value of the employees’ purchase rights under the Black-Scholes option pricing model. The weighted average grant date fair value of purchase rights granted under the ESPP and the weighted average assumptions used in the model for fiscal 2021, 2020 and 2019 were as follows:
| | | | | | | | | | | | | | | | | |
| 2021 | | 2020 | | 2019 |
| Dividend yield | None | | None | | None |
| Expected volatility | 31.5 | % | | 32.6 | % | | 27.9 | % |
| Risk-free interest rate | 0.07 | % | | 0.80 | % | | 2.23 | % |
| Expected term (in years) | 0.5 | | 0.5 | | 0.5 |
| Weighted average fair value of options granted | $ | 33.77 | | | $ | 23.08 | | | $ | 14.37 | |
Shares of common stock issued under the ESPP for fiscal 2021, 2020 and 2019 were as follows:
| | | | | | | | | | | | | | | | | |
| 2021 | | 2020 | | 2019 |
| (In thousands, except per share amounts) |
| Cadence shares purchased under the ESPP | 624 | | | 785 | | | 988 | |
| Cash received for the purchase of shares under the ESPP | $ | 63,932 | | | $ | 48,328 | | | $ | 38,290 | |
| Weighted average purchase price per share | $ | 102.41 | | | $ | 61.55 | | | $ | 38.74 | |
Reserved for Future Issuance
As of January 1, 2022, Cadence had reserved the following shares of authorized but unissued common stock for future issuance:
| | | | | |
| Shares |
| (In thousands) |
| Employee equity incentive plans* | 19,006 | |
| Employee stock purchase plans | 4,630 | |
| Directors stock plans* | 622 | |
| Total | 24,258 | |
_____________
*Includes shares reserved for: (i) issuance upon exercise of future option grants, (ii) issuance upon vesting of future restricted stock grants, (iii) outstanding but unexercised options to purchase common stock, or (iv) unvested restricted stock units.
NOTE 10. STOCK REPURCHASE PROGRAMS
At the end of fiscal 2020, approximately $739 million remained available under Cadence’s previously announced authorization to repurchase shares of its common stock. In August 2021, Cadence’s Board of Directors increased the prior authorization to repurchase shares of Cadence common stock by authorizing an additional $1 billion. The actual timing and amount of repurchases are subject to business and market conditions, corporate and regulatory requirements, stock price, acquisition opportunities and other factors. As of January 1, 2022, approximately $1.1 billion of the share repurchase authorization remained available to repurchase shares of Cadence common stock.
The shares repurchased under Cadence’s repurchase authorizations and the total cost of repurchased shares, including commissions, during fiscal 2021, 2020 and 2019 were as follows:
| | | | | | | | | | | | | | | | | |
| 2021 | | 2020 | | 2019 |
| (In thousands) |
| Shares repurchased | 4,401 | | | 4,247 | | | 4,841 | |
| Total cost of repurchased shares | $ | 612,297 | | | $ | 380,064 | | | $ | 306,148 | |
NOTE 11. NET INCOME PER SHARE
Basic net income per share is computed by dividing net income during the period by the weighted average number of shares of common stock outstanding during that period, less unvested restricted stock awards. Diluted net income per share is impacted by equity instruments considered to be potential common shares, if dilutive, computed using the treasury stock method of accounting.
The calculations for basic and diluted net income per share for fiscal 2021, 2020 and 2019 are as follows:
| | | | | | | | | | | | | | | | | |
| | 2021 | | 2020 | | 2019 |
| | (In thousands, except per share amounts) |
| Net income | $ | 695,955 | | | $ | 590,644 | | | $ | 988,979 | |
| Weighted average common shares used to calculate basic net income per share | 273,504 | | | 273,728 | | | 273,239 | |
| Stock-based awards | 5,354 | | | 5,913 | | | 7,276 | |
| Weighted average common shares used to calculate diluted net income per share | 278,858 | | | 279,641 | | | 280,515 | |
| Net income per share – basic | $ | 2.54 | | | $ | 2.16 | | | $ | 3.62 | |
| Net income per share – diluted | $ | 2.50 | | | $ | 2.11 | | | $ | 3.53 | |
The following table presents shares of Cadence’s common stock outstanding for fiscal 2021, 2020 and 2019 that were excluded from the computation of diluted net income per share because the effect of including these shares in the computation of diluted net income per share would have been anti-dilutive:
| | | | | | | | | | | | | | | | | |
| | 2021 | | 2020 | | 2019 |
| | (In thousands) |
| | | | | |
| Long-term market-based awards | — | | | 383 | | | 1,097 | |
| Options to purchase shares of common stock | 214 | | | 201 | | | 359 | |
| Non-vested shares of restricted stock | 41 | | | 58 | | | 727 | |
| Total potential common shares excluded | 255 | | | 642 | | | 2,183 | |
NOTE 12. LEASES
Operating lease expense, which includes immaterial amounts of short-term leases, variable lease costs and sublease income, was as follows during fiscal 2021, 2020 and 2019:
| | | | | | | | | | | | | | | | | |
| 2021 | | 2020 | | 2019 |
| (In thousands) |
| Operating lease expense | $ | 43,210 | | | $ | 39,731 | | | $ | 34,709 | |
Additional activity related to Cadence’s leases during fiscal 2021 and 2020 was as follows:
| | | | | | | | | | | |
| | | |
| 2021 | | 2020 |
| (In thousands) |
| Cash paid for amounts included in the measurement of operating lease liabilities | $ | 50,151 | | | $ | 34,723 | |
| ROU assets obtained in exchange for operating lease obligations | 31,813 | | | 63,057 | |
ROU lease assets and lease liabilities for Cadence’s operating leases were recorded in the consolidated balance sheet as follows:
| | | | | | | | | | | |
| As of |
| January 1,
2022 | | January 2,
2021 |
| (In thousands) |
| Other assets | $ | 130,124 | | | $ | 133,354 | |
| | | |
| Accounts payable and accrued liabilities | 25,271 | | | 33,920 | |
| Other long-term liabilities | 107,121 | | | 113,916 | |
| Total lease liabilities | $ | 132,392 | | | $ | 147,836 | |
| | | |
| Weighted average remaining lease term (in years) | 6.5 | | 6.7 |
| Weighted average discount rate | 3.6 | % | | 3.8 | % |
Future lease payments included in the measurement of lease liabilities on the consolidated balance sheet as of January 1, 2022, for the following five fiscal years and thereafter were as follows:
| | | | | | | | | |
| Operating | | | | |
| Leases | | | | |
| (In thousands) |
| 2022 | $ | 28,471 | | | | | |
| 2023 | 26,828 | | | | | |
| 2024 | 23,271 | | | | | |
| 2025 | 19,715 | | | | | |
| 2026 | 13,298 | | | | | |
| Thereafter | 36,770 | | | | | |
| Total future lease payments | 148,353 | | | | | |
| Less imputed interest | (15,961) | | | | | |
| Total lease liability balance | $ | 132,392 | | | | | |
As of January 1, 2022, Cadence had additional operating lease obligations of approximately $22.7 million for facility leases that will commence in fiscal 2022.
NOTE 13. BALANCE SHEET COMPONENTS
A summary of certain balance sheet components as of January 1, 2022 and January 2, 2021 is as follows: | | | | | | | | | | | |
| As of |
| January 1,
2022 | | January 2,
2021 |
| (In thousands) |
| Inventories: | | | |
| Raw materials | $ | 88,629 | | | $ | 63,647 | |
| Finished goods | 27,092 | | | 12,309 | |
| Inventories | $ | 115,721 | | | $ | 75,956 | |
| | | |
| Prepaid expenses and other: | | | |
| Prepaid income taxes | $ | 85,320 | | | $ | 55,366 | |
| Other prepaid expenses and other assets | 88,192 | | | 80,346 | |
| Prepaid expenses and other | $ | 173,512 | | | $ | 135,712 | |
| | | |
| Property, plant and equipment: | | | |
| Computer equipment and related software | $ | 636,069 | | | $ | 616,836 | |
| Buildings | 126,557 | | | 126,666 | |
| Land | 55,842 | | | 55,848 | |
| Leasehold, building and land improvements | 137,778 | | | 129,155 | |
| Furniture and fixtures | 27,798 | | | 27,064 | |
| Equipment | 40,603 | | | 38,732 | |
| In-process capital assets | 13,830 | | | 10,774 | |
| Total cost | 1,038,477 | | | 1,005,075 | |
| Less: Accumulated depreciation and amortization | (732,566) | | | (693,950) | |
| Property, plant and equipment, net | $ | 305,911 | | | $ | 311,125 | |
| | | |
| Other assets: | | | |
| Non-marketable investments | $ | 127,501 | | | $ | 132,226 | |
| ROU lease assets | 130,124 | | | 133,354 | |
| Other long-term assets | 181,601 | | | 170,526 | |
| Other assets | $ | 439,226 | | | $ | 436,106 | |
| | | |
| Accounts payable and accrued liabilities: | | | |
| Payroll and payroll-related accruals | $ | 254,090 | | | $ | 219,289 | |
| | | |
| | | |
| Customer deposits | 64,117 | | | 27,888 | |
| Other accrued operating liabilities | 99,076 | | | 102,774 | |
| Accounts payable and accrued liabilities | $ | 417,283 | | | $ | 349,951 | |
| | | |
| Other long-term liabilities: | | | |
| Operating lease liabilities | $ | 107,121 | | | $ | 113,916 | |
| Other accrued liabilities | 118,542 | | | 93,186 | |
| Other long-term liabilities | $ | 225,663 | | | $ | 207,102 | |
NOTE 14. INVESTMENTS
Cadence has a portfolio of equity investments that includes investments in both marketable and non-marketable securities. These investments primarily consist of cash investments in companies with technologies or services that are potentially strategically important to Cadence.
Marketable Equity Investments
Cadence’s investment in marketable equity securities consists of purchased shares of a publicly held company and is included in prepaid expenses and other in Cadence’s consolidated balance sheets. Changes in the fair value of these investments is recorded to other income, net in Cadence’s consolidated income statements.
Non-Marketable Equity Investments
Cadence’s investments in non-marketable equity securities generally consist of stock, convertible debt or other instruments of privately held entities and are included in other assets on Cadence’s consolidated balance sheets. Cadence holds a 16% interest in a privately held company that is accounted for using the equity method of accounting. The carrying value of this investment was $125.9 million and $130.7 million as of January 1, 2022 and January 2, 2021, respectively. During fiscal 2021 and fiscal 2020, Cadence recorded losses of $1.1 million and $4.6 million, respectively, to other income, net in Cadence’s consolidated income statements, which represented Cadence’s proportionate share of net income from the investee, offset by amortization of basis differences.
Cadence also holds other non-marketable investments in privately held companies where Cadence does not have the ability to exercise significant influence and the fair value of the investments is not readily determinable. The carrying value of these investments was $1.6 million and $1.6 million as of January 1, 2022 and January 2, 2021, respectively. Gains and losses on these investments are recorded to other income, net in Cadence’s consolidated income statements and were not material to Cadence’s consolidated financial statements for fiscal 2021, 2020 or 2019.
NOTE 15. FAIR VALUE
Inputs to valuation techniques are observable or unobservable. Observable inputs reflect market data obtained from independent sources, while unobservable inputs reflect Cadence’s market assumptions. These two types of inputs have created the following fair value hierarchy:
•Level 1 – Quoted prices for identical instruments in active markets;
•Level 2 – Quoted prices for similar instruments in active markets, quoted prices for identical or similar instruments in markets that are not active, and model-derived valuations in which all significant inputs and significant value drivers are observable in active markets; and
•Level 3 – Valuations derived from valuation techniques in which one or more significant inputs or significant value drivers are unobservable.
This hierarchy requires Cadence to minimize the use of unobservable inputs and to use observable market data, if available, when determining fair value. Cadence recognizes transfers between levels of the hierarchy based on the fair values of the respective financial instruments at the end of the reporting period in which the transfer occurred. There were no transfers between levels of the fair value hierarchy during fiscal 2021.
On a quarterly basis, Cadence measures at fair value certain financial assets and liabilities. The fair value of financial assets and liabilities was determined using the following levels of inputs as of January 1, 2022 and January 2, 2021:
| | | | | | | | | | | | | | | | | | | | | | | |
| | Fair Value Measurements as of January 1, 2022: |
| | Total | | Level 1 | | Level 2 | | Level 3 |
| | (In thousands) |
| Assets | |
| Cash equivalents: | | | | | | | |
| Money market funds | $ | 658,474 | | | $ | 658,474 | | | $ | — | | | $ | — | |
| Marketable equity securities | 5,956 | | | 5,956 | | | — | | | — | |
| Securities held in NQDC trust | 56,165 | | | 56,165 | | | — | | | — | |
| | | | | | | |
| Total Assets | $ | 720,595 | | | $ | 720,595 | | | $ | — | | | $ | — | |
| | | | | | | |
| | | | | | | | | | | | | | | | | | | | | | | |
| | Total | | Level 1 | | Level 2 | | Level 3 |
| | (In thousands) |
| Liabilities | |
| Foreign currency exchange contracts | 306 | | | — | | | 306 | | | — | |
| Total Liabilities | $ | 306 | | | $ | — | | | $ | 306 | | | $ | — | |
| | | | | | | | | | | | | | | | | | | | | | | |
| | Fair Value Measurements as of January 2, 2021: |
| | Total | | Level 1 | | Level 2 | | Level 3 |
| | (In thousands) |
| Assets | |
| Cash equivalents: | | | | | | | |
| Money market funds | $ | 541,386 | | | $ | 541,386 | | | $ | — | | | $ | — | |
| Marketable equity securities | 4,452 | | | 4,452 | | | — | | | — | |
| Securities held in NQDC trust | 42,769 | | | 42,769 | | | — | | | — | |
| Foreign currency exchange contracts | 8,868 | | | — | | | 8,868 | | | — | |
| Total Assets | $ | 597,475 | | | $ | 588,607 | | | $ | 8,868 | | | $ | — | |
| | | | | | | |
| As of January 2, 2021, Cadence did not have any financial liabilities requiring a recurring fair value measurement. |
| | | | | | | |
| |
| |
| | | | | | | |
| | | | | | | |
Level 1 Measurements
Cadence’s cash equivalents held in money market funds, marketable equity securities and the trading securities held in Cadence’s NQDC trust are measured at fair value using level 1 inputs.
Level 2 Measurements
The valuation techniques used to determine the fair value of Cadence’s foreign currency forward exchange contracts and 2024 Notes are classified within Level 2 of the fair value hierarchy. For additional information relating to Cadence’s debt arrangements, see Note 3 in the notes to consolidated financial statements.
Level 3 Measurements
During fiscal 2021, Cadence acquired intangible assets of $88.9 million with its acquisition of NUMECA and Pointwise. The fair value of the definite-lived intangible assets acquired with these acquisitions was determined using variations of the income approach and level 3 inputs.
For acquired existing technology, the fair value was determined by applying the relief-from-royalty method. This method is based on the application of a royalty rate to forecasted revenue to quantify the benefit of owning the intangible asset rather than paying a royalty for use of the asset. To estimate royalty savings over time, Cadence projected revenue from the acquired existing technology over the estimated remaining life of the technology, including the effect of assumed technological obsolescence, before applying an assumed royalty rate. For NUMECA, Cadence assumed technological obsolescence at a rate of 6.7% annually, before applying an assumed royalty rate of 22%. For Pointwise, Cadence assumed technological obsolescence at a rate of 10.0% annually, before applying an assumed royalty rate of 25%. The present value of after-tax royalty savings were determined using discount rates ranging from 10.5% to 12.0%.
The fair value for acquired agreements and relationships was determined by using the multi-period excess earnings method. This method reflects the present value of the projected cash flows that are expected to be generated from existing customers, less charges representing the contribution of other assets to those cash flows. Projected income from existing customer relationships considered a customer retention rate of 95% for both NUMECA and Pointwise. The present value of operating cash flows from existing customers was determined using discount rates ranging from 10.5% to 12.0%.
During fiscal 2020, Cadence acquired intangible assets of $101.3 million during the first quarter of fiscal 2020 with its acquisition of AWR and Integrand. The fair value of the definite-lived intangible assets acquired with these acquisitions was determined using variations of the income approach, which include level 3 inputs.
For existing technology, the fair value was determined by applying the relief-from-royalty method. This method is based on the application of a royalty rate to forecasted revenue to quantify the benefit of owning the intangible asset rather than paying a royalty for use of the asset. To estimate royalty savings over time, Cadence projected revenue from existing technology over the estimated remaining life of the technology, including the effect of technological obsolescence which was estimated at a rate between 5% and 7.5% annually, before applying an assumed royalty rate of 20%. The present value of after-tax royalty savings were determined using discount rates ranging from 10% to 11.5%.
The fair value for acquired agreements and relationships was determined by using the multi-period excess earnings method. This method reflects the present value of the projected cash flows that are expected to be generated from existing customers, less charges representing the contribution of other assets to those cash flows. Projected income from existing customer relationships considered customer retention rates ranging between 85% and 95%. The present value of operating cash flows from existing customers was determined using discount rates 10% and 11.5%.
Cadence also assumed obligations related to deferred revenue of $6.9 million during fiscal 2020 with its acquisition of AWR. The fair value of these obligations was estimated using the cost build-up approach. The cost build-up approach determines fair value using estimates of the costs required to fulfill the contracted obligations plus an assumed profit margin, which approximates the amount that AWR would be required to pay a third party to assume the obligation.
Cadence believes that its estimates and assumptions related to the fair value of its acquired intangible assets and assumed liabilities are reasonable, but significant judgment is involved.
NOTE 16. RESTRUCTURING AND OTHER CHARGES
Cadence has initiated restructuring plans, most recently in fiscal 2020, in an effort to better align its resources with its business strategy. The charges associated with these restructuring plans have primarily been comprised of severance payments and termination benefits related to headcount reductions and charges related to impacted facilities and are included in restructuring and other charges on Cadence’s consolidated income statements.
The following table presents activity for Cadence’s restructuring plans during fiscal 2021, 2020 and 2019:
| | | | | | | | | | | | | | | | | |
| Severance and Benefits | | Excess Facilities | | Total |
| (In thousands) |
| Balance, December 29, 2018 | $ | 11,176 | | | $ | 848 | | | $ | 12,024 | |
| Restructuring | 8,649 | | | (28) | | | 8,621 | |
| Cash payments | (10,714) | | | (420) | | | (11,134) | |
| Effect of foreign currency translation | 118 | | | 9 | | | 127 | |
| Balance, December 28, 2019 | $ | 9,229 | | | $ | 409 | | | $ | 9,638 | |
| Restructuring | 7,476 | | | 1,739 | | | 9,215 | |
| Cash payments | (9,424) | | | (773) | | | (10,197) | |
| Effect of foreign currency translation | 40 | | | (3) | | | 37 | |
| Balance, January 2, 2021 | $ | 7,321 | | | $ | 1,372 | | | $ | 8,693 | |
| Restructuring | (1,480) | | | 432 | | | (1,048) | |
| Cash payments | (5,774) | | | (1,761) | | | (7,535) | |
| Effect of foreign currency translation | (67) | | | — | | | (67) | |
| Balance, January 1, 2022 | $ | — | | | $ | 43 | | | $ | 43 | |
All remaining liabilities for Cadence’s restructuring plans represent liabilities from vacated facilities and are included in accounts payable and accrued liabilities on Cadence’s consolidated balance sheet as of January 1, 2022. Restructuring liabilities included in other long-term liabilities represent liabilities from vacated facilities, and Cadence expects to make cash payments to settle these liabilities through fiscal 2022.
Other Termination Benefits
During the second quarter of fiscal 2021, Cadence offered a voluntary retirement program to eligible employees in the United States. This program resulted in a one-time charge of $26.8 million for voluntary termination and post-employment benefits. These charges are included in each category of costs and expenses on Cadence’s consolidated income statements. As of January 1, 2022, liabilities related to the voluntary retirement program were $17.5 million and were included in accounts payable and accrued liabilities and other long-term liabilities on Cadence’s consolidated balance sheet. Cadence expects to make cash payments to settle these liabilities through fiscal 2023, including $17.0 million that is expected to be paid within the next twelve months.
NOTE 17. OTHER INCOME, NET
Cadence’s other income, net, for fiscal 2021, 2020 and 2019 was as follows:
| | | | | | | | | | | | | | | | | |
| | 2021 | | 2020 | | 2019 |
| | (In thousands) |
| Interest income | $ | 2,634 | | | $ | 3,817 | | | $ | 9,509 | |
| Gains (losses) on marketable equity investments | 1,504 | | | (148) | | | 713 | |
| Losses on non-marketable equity investments | (924) | | | (4,806) | | | (4,802) | |
| Gains on securities in NQDC trust | 6,163 | | | 4,881 | | | 5,402 | |
| Gains (losses) on foreign exchange | (2,789) | | | 4,429 | | | (4,111) | |
| Other expense, net | (262) | | | (228) | | | (710) | |
| Total other income, net | $ | 6,326 | | | $ | 7,945 | | | $ | 6,001 | |
NOTE 18. COMMITMENTS AND CONTINGENCIES
Purchase Obligations
Cadence had purchase obligations of $62.4 million as of January 1, 2022 that were associated with agreements or commitments for purchases of goods or services. Cadence expects to settle $50.9 million of these obligations within the next 12 months.
Legal Proceedings
From time to time, Cadence is involved in various disputes and litigation that arise in the ordinary course of business. These include disputes and legal proceedings related to intellectual property, indemnification obligations, mergers and acquisitions, licensing, contracts, customers, products, distribution and other commercial arrangements and employee relations matters. At least quarterly, Cadence reviews the status of each significant matter and assesses its potential financial exposure. If the potential loss from any claim or legal proceeding is considered probable and the amount or the range of loss can be estimated, Cadence accrues a liability for the estimated loss. Legal proceedings are subject to uncertainties, and the outcomes are difficult to predict. Because of such uncertainties, accruals are based on Cadence’s judgments using the best information available at the time. As additional information becomes available, Cadence reassesses the potential liability related to pending claims and litigation matters and may revise estimates.
Other Contingencies
Cadence provides its customers with a warranty on sales of hardware products, generally for a 90-day period. Cadence did not incur any significant costs related to warranty obligations during fiscal 2021, 2020 or 2019.
Cadence’s product license and services agreements typically include a limited indemnification provision for claims from third parties relating to Cadence’s intellectual property. If the potential loss from any indemnification claim is considered probable and the amount or the range of loss can be estimated, Cadence accrues a liability for the estimated loss. The indemnification is generally limited to the amount paid by the customer. Cadence did not incur any significant losses from indemnification claims during fiscal 2021, 2020 or 2019.
NOTE 19. EMPLOYEE AND DIRECTOR BENEFIT PLANS
Cadence maintains various defined contribution plans for its eligible U.S. and non-U.S. employees. For employees in the United States, Cadence maintains a 401(k) savings plan to provide retirement benefits through tax-deferred salary deductions and may make discretionary contributions, as determined by the Board of Directors, which cannot exceed a specified percentage of the annual aggregate salaries of those employees eligible to participate. Cadence’s total contributions made to these plans during fiscal 2021, 2020 and 2019 were as follows:
| | | | | | | | | | | | | | | | | |
| 2021 | | 2020 | | 2019 |
| (In thousands) |
| Contributions to defined contribution plans | $ | 33,029 | | | $ | 27,152 | | | $ | 25,269 | |
Executive Officers and Directors may also elect to defer compensation payable to them under Cadence’s NQDC. Deferred compensation payments are held in investment accounts and the values of the accounts are adjusted each quarter based on the fair value of the investments held in the NQDC. These investments are classified in other assets in the consolidated balance sheets and gains and losses are recognized as other income, net in the consolidated income statements.
Certain of Cadence’s international subsidiaries sponsor defined benefit retirement plans. The unfunded projected benefit obligation for Cadence’s defined benefit retirement plans is recorded in other long-term liabilities in the consolidated balance sheets.
NOTE 20. ACCUMULATED OTHER COMPREHENSIVE LOSS
Cadence’s accumulated other comprehensive loss is comprised of the aggregate impact of foreign currency translation gains and losses and changes in defined benefit plan liabilities and is presented in Cadence’s consolidated statements of comprehensive income.
Accumulated other comprehensive loss was comprised of the following as of January 1, 2022, and January 2, 2021:
| | | | | | | | | | | |
| As of |
| January 1,
2022 | | January 2,
2021 |
| | (In thousands) |
| Foreign currency translation loss | $ | (26,553) | | | $ | (11,130) | |
| Changes in defined benefit plan liabilities | (6,758) | | | (6,295) | |
| Total accumulated other comprehensive loss | $ | (33,311) | | | $ | (17,425) | |
For fiscal 2021, 2020 and 2019, there were no significant amounts related to foreign currency translation loss or changes in defined benefit plan liabilities reclassified to net income from accumulated other comprehensive loss.
NOTE 21. SEGMENT REPORTING
Segment reporting is based on the “management approach,” following the method that management organizes the company’s reportable segments for which separate financial information is made available to, and evaluated regularly by, the chief operating decision maker in allocating resources and in assessing performance. Cadence’s chief operating decision maker is its CEO, who reviews Cadence’s consolidated results as one operating segment. In making operating decisions, the CEO primarily considers consolidated financial information, accompanied by disaggregated information about revenues by geographic region.
Outside the United States, Cadence markets and supports its products and services primarily through its subsidiaries. Revenue is attributed to geography based upon the country in which the product is used, or services are delivered. Property, plant and equipment is attributed to geography based on the country where the assets are located.
The following table presents a summary of revenue by geography for fiscal 2021, 2020 and 2019: | | | | | | | | | | | | | | | | | |
| | 2021 | | 2020 | | 2019 |
| | (In thousands) |
| Americas: | | | | | |
| United States | $ | 1,292,980 | | | $ | 1,096,263 | | | $ | 982,380 | |
| Other Americas | 42,141 | | | 43,652 | | | 43,473 | |
| Total Americas | 1,335,121 | | | 1,139,915 | | | 1,025,853 | |
| Asia: | | | | | |
| China | 378,160 | | | 406,645 | | | 241,474 | |
| Other Asia | 566,772 | | | 487,362 | | | 459,028 | |
| Total Asia | 944,932 | | | 894,007 | | | 700,502 | |
| Europe, Middle East and Africa | 523,390 | | | 469,804 | | | 433,314 | |
| Japan | 184,801 | | | 179,165 | | | 176,650 | |
| Total | $ | 2,988,244 | | | $ | 2,682,891 | | | $ | 2,336,319 | |
The following table presents a summary of property, plant and equipment by geography as of January 1, 2022, January 2, 2021 and December 28, 2019:
| | | | | | | | | | | | | | | | | |
| | As of |
| | January 1,
2022 | | January 2,
2021 | | December 28,
2019 |
| | (In thousands) |
| Americas: | | | | | |
| United States | $ | 238,263 | | | $ | 248,292 | | | $ | 220,023 | |
| Other Americas | 623 | | | 753 | | | 728 | |
| Total Americas | 238,886 | | | 249,045 | | | 220,751 | |
| Asia: | | | | | |
| China | 15,010 | | | 16,416 | | | 15,729 | |
| Other Asia | 35,458 | | | 28,668 | | | 27,890 | |
| Total Asia | 50,468 | | | 45,084 | | | 43,619 | |
| Europe, Middle East and Africa | 16,033 | | | 16,304 | | | 10,474 | |
| Japan | 524 | | | 692 | | | 1,011 | |
| Total | $ | 305,911 | | | $ | 311,125 | | | $ | 275,855 | |
EXHIBIT INDEX
| | | | | | | | | | | | | | | | | | | | | | | | | | | | | | | | | | | | | | |
| | | | | | Incorporated by Reference | | |
| Exhibit | | | | | | | | Exhibit | | Filing | | Provided |
| Number | | Exhibit Title | | Form | | File No. | | No. | | Date | | Herewith |
| | | | 10-Q | | 000-15867 | | 3.01 | | 7/22/2019 | | |
| | | | 8-K | | 000-15867 | | 3.01 | | 2/12/2021 | | |
| 4.01 | | Specimen Certificate of the Registrant’s Common Stock. | | S-4 | | 033-43400 | | 4.01 | | 10/17/1991 | | |
| | | | 8-K | | 000-15867 | | 4.01 | | 10/9/2014 | | |
| | | | 8-K | | 000-15867 | | 4.02 | | 10/9/2014 | | |
| | | | | | | | | | | | X |
| | | | 10-Q | | 001-15867 | | 10.01 | | 7/26/2012 | | |
| | | | 10-K | | 000-15867 | | 10.76 | | 2/21/2013 | | |
| | | | 10-K | | 000-15867 | | 10.77 | | 2/21/2013 | | |
| | | | S-8 | | 333-240302 | | 99.01 | | 8/3/2020 | | |
| | | | 10-K | | 000-15867 | | 10.16 | | 2/22/2021 | | |
| | | | 10-K | | 000-15867 | | 10.17 | | 2/22/2021 | | |
| | | | S-8 | | 333-195771 | | 99.04 | | 5/7/2014 | | |
| | | | S-8 | | 333-195771 | | 99.05 | | 5/7/2014 | | |
| | | | S-8 | | 333-195771 | | 99.06 | | 5/7/2014 | | |
| | | | S-8 | | 333-195771 | | 99.07 | | 5/7/2014 | | |
| | | | S-8 | | 333-188452 | | 99.01 | | 5/8/2013 | | |
| | | | S-8 | | 333-226294 | | 99.01 | | 7/23/2018 | | |
| | | | S-8 | | 333-226293 | | 99.01 | | 7/23/2018 | | |
| | | | 10-K | | 000-15867 | | 10.26 | | 2/24/2020 | | |
| | | | 8-K | | 000-15867 | | 10.01 | | 2/8/2019 | | |
| | | | 8-K | | 001-15867 | | 10.01 | | 5/11/2016 | | |
| | | | | | | | | | | | | | | | | | | | | | | | | | | | | | | | | | | | | | |
| | | | 10-Q | | 001-10606 | | 10.02 | | 4/29/2011 | | |
| | | | 10-Q | | 000-15867 | | 10.01 | | 7/25/2016 | | |
| | | | 10-K | | 001-10606 | | 10.93 | | 3/2/2009 | | |
| | | | 10-K | | 001-10606 | | 10.96 | | 3/2/2009 | | |
| | | | 10-Q | | 001-10606 | | 10.02 | | 7/31/2009 | | |
| | | | 10-K | | 001-10606 | | 10.94 | | 2/26/2010 | | |
| | | | 10-K | | 001-10606 | | 10.95 | | 2/26/2010 | | |
| | | | 10-Q | | 000-15867 | | 10.01 | | 4/25/2018 | | |
| | | | 10-K | | 000-15867 | | 10.44 | | 2/20/2014 | | |
| | | | 10-K | | 000-15867 | | 10.49 | | 2/18/2016 | | |
| | | | 8-K/A | | 000-15867 | | 10.01 | | 12/17/2021 | | |
| | | | 8-K/A | | 000-15867 | | 10.02 | | 12/17/2021 | | |
| | | | 8-K | | 000-15867 | | 10.01 | | 7/1/2021 | | |
| | | | 8-K | | 000-15867 | | 16.01 | | 3/3/2020 | | |
| | | | | | | | | | | | X |
| | | | | | | | | | | | X |
| | | | | | | | | | | | X |
| | | | | | | | | | | | X |
| | | | | | | | | | | | X |
| | | | | | | | | | | | X |
| | | | | | | | | | | | X |
| 101.INS | | Inline XBRL Instance Document. | | | | | | | | | | X |
| 101.SCH | | Inline XBRL Taxonomy Extension Schema Document. | | | | | | | | | | X |
| | | | | | | | | | | | | | | | | | | | | | | | | | | | | | | | | | | | | | |
| 101.CAL | | Inline XBRL Taxonomy Extension Calculation Linkbase Document. | | | | | | | | | | X |
| 101.DEF | | Inline XBRL Taxonomy Extension Definition Linkbase Document. | | | | | | | | | | X |
| 101.LAB | | Inline XBRL Taxonomy Extension Label Linkbase Document. | | | | | | | | | | X |
| 101.PRE | | Inline XBRL Taxonomy Extension Presentation Linkbase Document. | | | | | | | | | | X |
| 104 | | Cover Page Interactive Data File - The cover page from this Annual Report on Form 10-K is formatted in iXBRL.
| | | | | | | | | | |
* Indicates management contract or compensatory plan or arrangement covering executive officers or directors of the Registrant.
† In accordance with Item 601(b)(32)(ii) of Regulation S-K, the certifications furnished in Exhibits 32.01 and 32.02 hereto will not be deemed "filed" for purposes of Section 18 of the Exchange Act or incorporated by reference into any filings under the Securities Act or the Exchange Act (except to the extent that the registrant specifically incorporates it by reference).
Item 16. Form 10-K Summary
None.
SIGNATURES
Pursuant to the requirements of Section 13 or 15(d) of the Securities Exchange Act of 1934, the registrant has duly caused this report to be signed on its behalf by the undersigned, thereunto duly authorized.
| | | | | |
| CADENCE DESIGN SYSTEMS, INC. |
|
| /s/ Anirudh Devgan |
| Anirudh Devgan |
| President and Chief Executive Officer |
| Dated: | February 22, 2022 |
Pursuant to the requirements of the Securities Exchange Act of 1934, this report has been signed below by the following persons on behalf of the registrant and in the capacities and on the dates indicated.
| | | | | | | | |
| | |
| | |
| /s/ Anirudh Devgan | DATE: | February 22, 2022 |
| Anirudh Devgan | | |
| President and Chief Executive Officer | | |
| | |
| | |
| /s/ John M. Wall | DATE: | February 22, 2022 |
| John M. Wall | | |
| Senior Vice President and Chief Financial Officer | | |
POWER OF ATTORNEY
KNOW ALL PERSONS BY THESE PRESENTS, that each person whose signature appears below constitutes and appoints Anirudh Devgan, John M. Wall and Alinka Flaminia, and each of them, as his or her true and lawful attorneys-in-fact and agents, with full power of substitution and resubstitution, for him or her and in his or her name, place and stead, in any and all capacities, to sign any and all amendments (including post-effective amendments) to this Report on Form 10-K, and to file the same, with all exhibits thereto, and other documents in connection therewith, with the Securities and Exchange Commission, granting unto said attorneys-in-fact and agents, and each of them, full power and authority to do and perform each and every act and thing requisite and necessary to be done in connection therewith, as fully to all intents and purposes as he or she might or could do in person, hereby ratifying and confirming all that said attorneys-in-fact and agents, or any of them, or their, his or her substitute or substitutes, may lawfully do or cause to be done by virtue hereof.
Pursuant to the requirements of the Securities Exchange Act of 1934, this report has been signed below by the following persons on behalf of the registrant and in the capacities and on the dates indicated:
| | | | | | | | | | | | | | |
| | | | |
| /s/ | Lip-Bu Tan | | February 22, 2022 | |
| Lip-Bu Tan, Executive Chair | | | |
| | | | |
| /s/ | Dr. John B. Shoven | | February 22, 2022 | |
| Dr. John B. Shoven, Lead Independent Director | | | |
| | | | |
| /s/ | Mark W. Adams | | February 22, 2022 | |
| Mark W. Adams, Director | | | |
| | | | |
| /s/ | Ita Brennan | | February 22, 2022 | |
| Ita Brennan, Director | | | |
| | | | |
| /s/ | Lewis Chew | | February 22, 2022 | |
| Lewis Chew, Director | | | |
| | | | |
| /s/ | Mary Louise Krakauer | | February 22, 2022 | |
| Mary Louise Krakauer, Director | | | |
| | | | |
| /s/ | Julia Liuson | | February 22, 2022 | |
| Julia Liuson, Director | | | |
| | | | |
| /s/ | Dr. James D. Plummer | | February 22, 2022 | |
| Dr. James D. Plummer, Director | | | |
| | | | |
| /s/ | Dr. Alberto Sangiovanni-Vincentelli | | February 22, 2022 | |
| Dr. Alberto Sangiovanni-Vincentelli, Director | | | |
| | | | |
| /s/ | Young K. Sohn | | February 22, 2022 | |
| Young K. Sohn, Director | | | |