false2020FY0000812128P3YP3YP3Y00008121282019-11-012020-10-31iso4217:USD00008121282020-04-30xbrli:shares00008121282020-12-1000008121282020-10-3100008121282019-10-31iso4217:USDxbrli:shares0000812128us-gaap:SeriesAPreferredStockMember2019-10-310000812128us-gaap:SeriesAPreferredStockMember2020-10-310000812128safm:OtherPreferredStockMember2020-10-310000812128safm:OtherPreferredStockMember2019-10-3100008121282018-11-012019-10-3100008121282017-11-012018-10-310000812128us-gaap:CommonStockMember2017-10-310000812128us-gaap:AdditionalPaidInCapitalMember2017-10-310000812128us-gaap:RetainedEarningsMember2017-10-3100008121282017-10-310000812128us-gaap:RetainedEarningsMember2017-11-012018-10-310000812128us-gaap:CommonStockMember2017-11-012018-10-310000812128us-gaap:AdditionalPaidInCapitalMember2017-11-012018-10-310000812128us-gaap:CommonStockMember2018-10-310000812128us-gaap:AdditionalPaidInCapitalMember2018-10-310000812128us-gaap:RetainedEarningsMember2018-10-3100008121282018-10-310000812128us-gaap:RetainedEarningsMember2018-11-012019-10-310000812128us-gaap:CommonStockMember2018-11-012019-10-310000812128us-gaap:AdditionalPaidInCapitalMember2018-11-012019-10-310000812128us-gaap:CommonStockMember2019-10-310000812128us-gaap:AdditionalPaidInCapitalMember2019-10-310000812128us-gaap:RetainedEarningsMember2019-10-310000812128us-gaap:RetainedEarningsMember2019-11-012020-10-310000812128us-gaap:CommonStockMember2019-11-012020-10-310000812128us-gaap:AdditionalPaidInCapitalMember2019-11-012020-10-310000812128us-gaap:CommonStockMember2020-10-310000812128us-gaap:AdditionalPaidInCapitalMember2020-10-310000812128us-gaap:RetainedEarningsMember2020-10-310000812128us-gaap:DifferenceBetweenRevenueGuidanceInEffectBeforeAndAfterTopic606Memberus-gaap:AccountingStandardsUpdate201409Member2019-11-012020-10-310000812128us-gaap:DifferenceBetweenRevenueGuidanceInEffectBeforeAndAfterTopic606Memberus-gaap:AccountingStandardsUpdate201409Member2018-11-012019-10-310000812128us-gaap:DifferenceBetweenRevenueGuidanceInEffectBeforeAndAfterTopic606Memberus-gaap:AccountingStandardsUpdate201409Member2017-11-012018-10-310000812128safm:LineItemFreightRevenueMemberus-gaap:AccountingStandardsUpdate201409Member2019-11-012020-10-310000812128safm:LineItemFreightRevenueMemberus-gaap:AccountingStandardsUpdate201409Member2018-11-012019-10-310000812128safm:LineItemFreightRevenueMemberus-gaap:AccountingStandardsUpdate201409Member2017-11-012018-10-310000812128us-gaap:AccountingStandardsUpdate201409Member2019-11-012020-10-310000812128us-gaap:AccountingStandardsUpdate201409Member2018-11-012019-10-310000812128us-gaap:AccountingStandardsUpdate201409Member2017-11-012018-10-31safm:customer0000812128us-gaap:SalesMemberus-gaap:CustomerConcentrationRiskMember2019-11-012020-10-31xbrli:pure0000812128safm:CustomerAMemberus-gaap:SalesMemberus-gaap:CustomerConcentrationRiskMember2019-11-012020-10-310000812128safm:CustomerBMemberus-gaap:SalesMemberus-gaap:CustomerConcentrationRiskMember2019-11-012020-10-310000812128us-gaap:SalesMemberus-gaap:CustomerConcentrationRiskMember2018-11-012019-10-310000812128safm:CustomerAMemberus-gaap:SalesMemberus-gaap:CustomerConcentrationRiskMember2018-11-012019-10-310000812128safm:CustomerBMemberus-gaap:SalesMemberus-gaap:CustomerConcentrationRiskMember2018-11-012019-10-310000812128safm:CustomerAMemberus-gaap:SalesMemberus-gaap:CustomerConcentrationRiskMember2017-11-012018-10-310000812128safm:CustomerBMemberus-gaap:SalesMemberus-gaap:CustomerConcentrationRiskMember2017-11-012018-10-310000812128safm:ProductSixMember2019-11-012020-10-310000812128safm:ProductSixMember2018-11-012019-10-310000812128safm:ProductSixMember2017-11-012018-10-310000812128safm:OutsideUnitedStatesMember2019-11-012020-10-310000812128safm:OutsideUnitedStatesMember2018-11-012019-10-310000812128safm:OutsideUnitedStatesMember2017-11-012018-10-310000812128srt:MaximumMemberus-gaap:CashEquivalentsMember2019-11-012020-10-310000812128safm:InventoryLivePoultryBroilersAndBreedersMember2018-11-012019-10-310000812128srt:MinimumMemberus-gaap:BuildingMember2019-11-012020-10-310000812128srt:MaximumMemberus-gaap:BuildingMember2019-11-012020-10-310000812128us-gaap:MachineryAndEquipmentMembersrt:MinimumMember2019-11-012020-10-310000812128srt:MaximumMemberus-gaap:MachineryAndEquipmentMember2019-11-012020-10-310000812128safm:FreshVacuumSealedChickenMember2019-11-012020-10-310000812128safm:FreshVacuumSealedChickenMember2018-11-012019-10-310000812128safm:FreshVacuumSealedChickenMember2017-11-012018-10-310000812128safm:ChillPackChickenMember2019-11-012020-10-310000812128safm:ChillPackChickenMember2018-11-012019-10-310000812128safm:ChillPackChickenMember2017-11-012018-10-310000812128safm:FreshIcePackedChickenMember2019-11-012020-10-310000812128safm:FreshIcePackedChickenMember2018-11-012019-10-310000812128safm:FreshIcePackedChickenMember2017-11-012018-10-310000812128safm:MinimallypreparedchickenMember2019-11-012020-10-310000812128safm:MinimallypreparedchickenMember2018-11-012019-10-310000812128safm:MinimallypreparedchickenMember2017-11-012018-10-310000812128safm:FrozenchickenMember2019-11-012020-10-310000812128safm:FrozenchickenMember2018-11-012019-10-310000812128safm:FrozenchickenMember2017-11-012018-10-310000812128us-gaap:ProductAndServiceOtherMember2019-11-012020-10-310000812128us-gaap:ProductAndServiceOtherMember2018-11-012019-10-310000812128us-gaap:ProductAndServiceOtherMember2017-11-012018-10-310000812128safm:InventoryLivePoultryBroilersAndBreedersMember2020-10-310000812128safm:InventoryLivePoultryBroilersAndBreedersMember2019-10-310000812128safm:InventoryFeedEggsAndOtherMember2020-10-310000812128safm:InventoryFeedEggsAndOtherMember2019-10-310000812128safm:InventoryProcessedPoultryMember2020-10-310000812128safm:InventoryProcessedPoultryMember2019-10-310000812128safm:InventoryProcessedFoodMember2020-10-310000812128safm:InventoryProcessedFoodMember2019-10-310000812128safm:InventoryPackagingMaterialsMember2020-10-310000812128safm:InventoryPackagingMaterialsMember2019-10-310000812128us-gaap:RevolvingCreditFacilityMember2020-10-310000812128us-gaap:RevolvingCreditFacilityMember2019-10-3100008121282019-03-210000812128us-gaap:LineOfCreditMemberus-gaap:RevolvingCreditFacilityMember2019-03-210000812128us-gaap:LineOfCreditMemberus-gaap:RevolvingCreditFacilityMember2020-10-310000812128us-gaap:LineOfCreditMemberus-gaap:RevolvingCreditFacilityMemberus-gaap:SubsequentEventMember2020-12-160000812128us-gaap:LineOfCreditMemberus-gaap:LetterOfCreditMember2020-10-310000812128us-gaap:LineOfCreditMemberus-gaap:LetterOfCreditMemberus-gaap:SubsequentEventMember2020-12-160000812128us-gaap:SubsequentEventMember2020-12-160000812128us-gaap:LondonInterbankOfferedRateLIBORMemberus-gaap:RevolvingCreditFacilityMembersrt:MinimumMember2019-11-012020-10-310000812128us-gaap:LondonInterbankOfferedRateLIBORMembersrt:MaximumMemberus-gaap:RevolvingCreditFacilityMember2019-11-012020-10-310000812128safm:ScenarioLessThan25PercentMember2019-11-012020-10-310000812128safm:ScenarioMoreThan25LessThan35PercentMembersrt:MinimumMember2019-11-012020-10-310000812128safm:ScenarioMoreThan25LessThan35PercentMembersrt:MaximumMember2019-11-012020-10-310000812128safm:ScenarioMoreThan25LessThan35PercentMember2019-11-012020-10-310000812128safm:ScenarioMoreThan35LessThan45PercentMembersrt:MinimumMember2019-11-012020-10-310000812128srt:MaximumMembersafm:ScenarioMoreThan35LessThan45PercentMember2019-11-012020-10-310000812128safm:ScenarioMoreThan35LessThan45PercentMember2019-11-012020-10-310000812128safm:ScenarioMoreThan45PercentMember2019-11-012020-10-3100008121282019-08-012019-10-310000812128stpr:NC2020-10-310000812128stpr:GA2020-10-310000812128stpr:NC2019-11-012020-10-310000812128us-gaap:StateAndLocalJurisdictionMember2019-11-012020-10-310000812128us-gaap:StateAndLocalJurisdictionMember2018-11-012019-10-310000812128us-gaap:StateAndLocalJurisdictionMember2017-11-012018-10-310000812128us-gaap:InternalRevenueServiceIRSMember2019-11-012020-10-310000812128us-gaap:InternalRevenueServiceIRSMember2018-11-012019-10-310000812128us-gaap:InternalRevenueServiceIRSMember2017-11-012018-10-310000812128us-gaap:OtherPostretirementBenefitPlansDefinedBenefitMembersafm:UpToThreePercentOfEmployeeSalaryMember2019-11-012020-10-310000812128us-gaap:OtherPostretirementBenefitPlansDefinedBenefitMember2019-11-012020-10-310000812128safm:BetweenThreePercentAndFivePercentOfEmployeeSalaryMemberus-gaap:OtherPostretirementBenefitPlansDefinedBenefitMember2019-11-012020-10-310000812128srt:MinimumMemberus-gaap:OtherPostretirementBenefitPlansDefinedBenefitMember2019-11-012020-10-310000812128srt:MaximumMemberus-gaap:OtherPostretirementBenefitPlansDefinedBenefitMember2019-11-012020-10-310000812128us-gaap:OtherPostretirementBenefitPlansDefinedBenefitMember2018-11-012019-10-310000812128us-gaap:OtherPostretirementBenefitPlansDefinedBenefitMember2017-11-012018-10-3100008121282005-02-1700008121282011-02-170000812128us-gaap:RestrictedStockMember2005-02-170000812128us-gaap:RestrictedStockMember2011-02-1700008121282016-02-112016-02-1100008121282016-02-110000812128us-gaap:RestrictedStockMember2016-02-1100008121282020-02-132020-02-1300008121282020-02-130000812128us-gaap:RestrictedStockMembersrt:MinimumMember2018-11-012019-10-310000812128us-gaap:RestrictedStockMembersrt:MinimumMember2019-11-012020-10-310000812128us-gaap:RestrictedStockMembersrt:MinimumMember2017-11-012018-10-310000812128srt:MaximumMemberus-gaap:RestrictedStockMember2019-11-012020-10-310000812128srt:MaximumMemberus-gaap:RestrictedStockMember2018-11-012019-10-310000812128srt:MaximumMemberus-gaap:RestrictedStockMember2017-11-012018-10-310000812128us-gaap:RestrictedStockMember2019-11-012020-10-310000812128us-gaap:RestrictedStockMember2018-11-012019-10-310000812128us-gaap:RestrictedStockMember2017-11-012018-10-310000812128us-gaap:RestrictedStockMember2017-10-310000812128us-gaap:RestrictedStockMember2018-10-310000812128us-gaap:RestrictedStockMember2019-10-310000812128us-gaap:RestrictedStockMember2020-10-310000812128safm:OutsideDirectorsMembersafm:StockPurchasePlanMembersafm:RetainerAndMeetingFeesMember2019-11-012020-10-310000812128safm:StockPurchasePlanMembersafm:BaseSalaryCompensationMembersafm:OfficersAndKeyManagementEmployeesMember2019-11-012020-10-310000812128safm:StockPurchasePlanMemberus-gaap:DeferredBonusMembersafm:OfficersAndKeyManagementEmployeesMember2019-11-012020-10-310000812128safm:StockPurchasePlanMember2019-11-012020-10-310000812128safm:StockPurchasePlanMemberus-gaap:RestrictedStockMember2019-11-012020-10-310000812128safm:StockPurchasePlanMemberus-gaap:RestrictedStockMember2018-11-012019-10-310000812128safm:StockPurchasePlanMemberus-gaap:RestrictedStockMember2017-11-012018-10-310000812128safm:StockPurchasePlanMembersafm:MatchingRestrictedSharesMember2020-10-310000812128safm:StockPurchasePlanMembersafm:MatchingRestrictedSharesMember2019-10-310000812128safm:StockPurchasePlanMembersafm:MatchingRestrictedSharesMember2018-10-310000812128safm:StockPurchasePlanMembersafm:MatchingRestrictedSharesMember2019-11-012020-10-310000812128safm:StockPurchasePlanMembersafm:MatchingRestrictedSharesMember2018-11-012019-10-310000812128safm:StockPurchasePlanMembersafm:MatchingRestrictedSharesMember2017-11-012018-10-310000812128safm:StockPurchasePlanMemberus-gaap:RestrictedStockMember2020-10-310000812128safm:StockPurchasePlanMemberus-gaap:RestrictedStockMember2019-10-310000812128safm:StockPurchasePlanMemberus-gaap:RestrictedStockMember2018-10-310000812128safm:StockPurchasePlanMember2018-11-012019-10-310000812128safm:StockPurchasePlanMember2017-11-012018-10-310000812128safm:OutsideDirectorsMembersafm:PerformanceSharePlan2019Memberus-gaap:PerformanceSharesMembersafm:ScenarioMoreThan25LessThan35PercentMember2019-11-012020-10-310000812128safm:OutsideDirectorsMembersafm:PerformanceSharePlan2020Memberus-gaap:PerformanceSharesMembersafm:ScenarioMoreThan25LessThan35PercentMember2019-11-012020-10-310000812128safm:OutsideDirectorsMembersafm:PerformanceSharePlan2018Memberus-gaap:PerformanceSharesMembersafm:ScenarioMoreThan25LessThan35PercentMember2019-11-012020-10-310000812128safm:OutsideDirectorsMemberus-gaap:RestrictedStockMembersafm:ScenarioMoreThan25LessThan35PercentMember2019-11-012020-10-310000812128us-gaap:PerformanceSharesMember2019-11-012020-10-310000812128srt:MinimumMemberus-gaap:PerformanceSharesMember2019-11-012020-10-310000812128srt:MaximumMemberus-gaap:PerformanceSharesMember2019-11-012020-10-310000812128safm:PerformanceSharePlan2019Membersafm:OfficersAndKeyManagementEmployeesMemberus-gaap:PerformanceSharesMember2019-11-012019-11-010000812128safm:PerformanceSharePlan2019Memberus-gaap:PerformanceSharesMember2019-11-012020-10-310000812128safm:PerformanceSharePlan2018Memberus-gaap:PerformanceSharesMember2019-11-012020-10-310000812128safm:PerformanceSharePlan2017Memberus-gaap:PerformanceSharesMember2019-11-012020-10-310000812128safm:PerformanceSharePlan2017Memberus-gaap:PerformanceSharesMember2018-11-012019-10-310000812128safm:PerformanceSharePlan2017Memberus-gaap:PerformanceSharesMember2020-10-310000812128safm:PerformanceSharePlan2019Memberus-gaap:PerformanceSharesMember2020-10-310000812128safm:PerformanceSharePlan2015Memberus-gaap:PerformanceSharesMember2019-11-012020-10-310000812128safm:PerformanceSharePlan2015Memberus-gaap:PerformanceSharesMember2018-11-012019-10-310000812128safm:PerformanceSharePlan2015Memberus-gaap:PerformanceSharesMember2017-11-012018-10-310000812128safm:PerformanceSharePlan2016Memberus-gaap:PerformanceSharesMember2019-11-012020-10-310000812128safm:PerformanceSharePlan2016Memberus-gaap:PerformanceSharesMember2018-11-012019-10-310000812128safm:PerformanceSharePlan2016Memberus-gaap:PerformanceSharesMember2017-11-012018-10-310000812128safm:PerformanceSharePlan2017Memberus-gaap:PerformanceSharesMember2017-11-012018-10-310000812128safm:PerformanceSharePlan2018Memberus-gaap:PerformanceSharesMember2018-11-012019-10-310000812128safm:PerformanceSharePlan2018Memberus-gaap:PerformanceSharesMember2017-11-012018-10-310000812128safm:PerformanceSharePlan2019Memberus-gaap:PerformanceSharesMember2018-11-012019-10-310000812128safm:PerformanceSharePlan2019Memberus-gaap:PerformanceSharesMember2017-11-012018-10-310000812128us-gaap:PerformanceSharesMember2018-11-012019-10-310000812128us-gaap:PerformanceSharesMember2017-11-012018-10-31safm:employee00008121282019-10-082019-10-0800008121282019-11-012020-01-3100008121282020-02-012020-04-3000008121282020-05-012020-07-3100008121282020-08-012020-10-3100008121282018-11-012019-01-3100008121282019-02-012019-04-3000008121282019-05-012019-07-310000812128us-gaap:AllowanceForCreditLossMember2019-10-310000812128us-gaap:AllowanceForCreditLossMember2019-11-012020-10-310000812128us-gaap:AllowanceForCreditLossMember2020-10-310000812128us-gaap:AllowanceForCreditLossMember2018-10-310000812128us-gaap:AllowanceForCreditLossMember2018-11-012019-10-310000812128us-gaap:AllowanceForCreditLossMember2017-10-310000812128us-gaap:AllowanceForCreditLossMember2017-11-012018-10-31
UNITED STATES
SECURITIES AND EXCHANGE COMMISSION
Washington, D.C. 20549
___________________________
FORM 10-K
___________________________
(Mark One)
| | | | | |
| ☒ | Annual Report Pursuant to Section 13 or 15(d) of the Securities Exchange Act of 1934 |
for the fiscal year ended October 31, 2020
| | | | | |
| ☐ | Transition Report pursuant to Section 13 or 15(d) of the Securities Exchange Act of 1934 |
for the transition period from to
Commission file number: 1-14977
___________________________
SANDERSON FARMS INC.
(Exact name of registrant as specified in its charter)
___________________________
| | | | | |
| Mississippi | 64-0615843 |
(State or other jurisdiction of
incorporation or organization) | (IRS Employer
Identification No.) |
127 Flynt Road, Laurel, Mississippi 39443
(Address of principal executive offices) (Zip Code)
Registrant’s telephone number, including area code: (601) 649-4030
Securities registered pursuant to Section 12(b) of the Act:
| | | | | | | | |
| Title of each Class: | Trading Symbol | Name of exchange on which registered: |
| Common Stock, $1 par value per share | SAFM | NASDAQ |
Securities registered pursuant to Section 12(g) of the Act: None
___________________________
Indicate by check mark if the registrant is a well-known seasoned issuer, as defined in Rule 405 of the Securities Act. ☒ Yes ☐ No
Indicate by check mark if the registrant is not required to file reports pursuant to Section 13 or Section 15(d) of the Act. ☐ Yes ☒ No
Indicate by check mark whether the registrant (1) has filed all reports required to be filed by Section 13 or 15(d) of the Securities Exchange Act of 1934 during the preceding 12 months (or for such shorter period that the registrant was required to file such reports), and (2) has been subject to such filing requirements for the past 90 days. ☒ Yes ☐ No
Indicate by check mark whether the registrant has submitted electronically every Interactive Data File required to be submitted pursuant to Rule 405 of Regulation S-T during the preceding 12 months (or for such shorter period that the registrant was required to submit such files). Yes ☒ No ☐
Indicate by check mark if disclosure of delinquent filers pursuant to Item 405 of Regulation S-K is not contained herein, and will not be contained, to the best of registrant’s knowledge, in definitive proxy or information statements incorporated by reference in Part III of this Form 10-K or any amendment to this Form 10-K ☒
Indicate by check mark whether the registrant is a large accelerated filer, an accelerated filer, a non-accelerated filer, a smaller reporting company, or an emerging growth company. See the definitions of “large accelerated filer,” “accelerated filer,” “smaller reporting company” and "emerging growth company" in Rule 12b-2 of the Exchange Act. (Check one):
| | | | | | | | | | | | | | | | | | | | |
| Large accelerated filer | | ☒ | | Accelerated filer | | ☐ |
| | | | | | |
| Non-accelerated filer | | ☐ | | Smaller reporting company | | ☐ |
| | | | | | |
| | | | Emerging growth company | | ☐ |
If an emerging growth company, indicate by check mark if the registrant has elected not to use the extended transition period for complying with any new or revised financial accounting standards provided pursuant to Section 13(a) of the Exchange Act. ☐
Indicate by check mark whether the registrant has filed a report on and attestation to its management's assessment of the effectiveness of its internal control over financial reporting under Section 404(b) of the Sarbanes-Oxley Act (15 U.S.C. 7262(b)) by the registered public accounting firm that prepared or issued its audit report. ☒
Indicate by check mark whether the registrant is a shell company (as defined in Rule 12b-2 of the Exchange Act). ☐ Yes ☒ No
Aggregate market value of the voting and non-voting common equity held by non-affiliates of the Registrant computed by reference to the closing sales price of the common equity in The NASDAQ Stock Market on the last business day of the Registrant’s most recently completed second fiscal quarter: $2,550,803,170.
Number of shares outstanding of the Registrant’s common stock as of December 10, 2020: 22,324,562 shares of common stock, $1.00 per share par value.
DOCUMENTS INCORPORATED BY REFERENCE
Portions of the Registrant’s definitive proxy statement filed or to be filed in connection with its 2021 Annual Meeting of Stockholders are incorporated by reference into Part III.
TABLE OF CONTENTS
| | | | | | | | |
| | |
| Item 1. | | |
| Item 1A. | | |
| Item 1B. | | |
| Item 2. | | |
| Item 3. | | |
| Item 4. | | |
| Item 4A. | | |
| | |
| Item 5. | | |
| Item 6. | | |
| Item 7. | | |
| Item 7A. | | |
| Item 8. | | |
| Item 9. | | |
| Item 9A. | | |
| Item 9B. | | |
| | |
| Item 10. | | |
| Item 11. | | |
| Item 12. | | |
| Item 13. | | |
| Item 14. | | |
| | |
| Item 15. | | |
| Item 16. | | |
| |
| |
INTRODUCTORY NOTE
Definitions. This Annual Report on Form 10-K (the "Annual Report") is filed by Sanderson Farms, Inc., a Mississippi corporation. Except where the context indicates otherwise, the terms “Registrant,” “Company,” “Sanderson Farms,” “we,” “us,” or “our” refer to Sanderson Farms, Inc. and its subsidiaries and predecessor organizations. The use of these terms to refer to Sanderson Farms, Inc. and its subsidiaries collectively does not suggest that Sanderson Farms, Inc. and its subsidiaries have abandoned their separate identities or the legal protections given to them as separate legal entities. “Fiscal year” means the fiscal year ended October 31, 2020, which is the year for which this Annual Report is filed.
Presentation and Dates of Information. Except for Item 4A herein, the Item numbers and letters appearing in this Annual Report correspond with those used in Securities and Exchange Commission Form 10-K (and, to the extent that it is incorporated into Form 10-K, those used in SEC Regulation S-K) as effective on the date hereof, which specifies the information required to be included in Annual Reports to the SEC. Item 4A (“Executive Officers of the Registrant”) has been included by the Registrant in accordance with General Instruction G(3) of Form 10-K and Instruction 3 of Item 401(b) of Regulation S-K. The information contained in this Annual Report is, unless indicated to be given as of a specified date or for a specified period, given as of the date of this Annual Report, which is December 17, 2020.
PART I
Item 1. Business
(a) GENERAL DEVELOPMENT OF THE REGISTRANT’S BUSINESS
The Registrant was incorporated in Mississippi in 1955, and is a fully, vertically-integrated poultry processing company engaged in the production, processing, marketing and distribution of fresh and frozen chicken products. In addition, the Registrant is engaged in the processing, marketing and distribution of processed and minimally prepared chicken.
The Registrant sells ice-packed, chill-packed, bulk-packed and frozen chicken, in whole, cut-up and boneless form, primarily under the Sanderson Farms® brand name, to retailers, distributors, and casual dining operators in the United States and to customers who resell frozen chicken into export markets. During its fiscal year ended October 31, 2020, the Registrant processed approximately 657 million chickens, or approximately 4.8 billion dressed pounds. According to 2020 industry statistics, the Registrant was the third largest processor of dressed chicken in the United States based on average weekly processed pounds.
The Registrant's fresh and frozen chicken operations presently encompass 11 hatcheries, 9 feed mills, 12 processing plants and 1 prepared chicken plant. The Registrant has contracts with operators of approximately 823 grow-out farms and 231 breeder farms that provide it with sufficient housing capacity for its current operations.
The Company’s prepared chicken product line includes approximately 60 institutional and consumer-packaged, partially cooked or marinated chicken items that it sells nationally, primarily to distributors and food service establishments. A majority of the prepared chicken items are made to the specifications of food service users.
Since the Registrant completed the initial public offering of its common stock in May 1987, the Registrant has significantly expanded its operations by expanding existing facilities, adding second shifts and constructing new facilities to increase production capacity, product lines and marketing flexibility. Since 1992, when the Company sold approximately 361.4 million pounds of product, the Company has constructed 8 new hatcheries, 6 new feed mills and 8 new processing plants. As a result of our expansion efforts, the Company's production capacity has significantly increased, and in fiscal 2020 the Company sold approximately 4.9 billion pounds of product, which includes approximately 98.8 million pounds from its prepared chicken plant.
The Company changed its marketing strategy in 1997 to move away from growing small-sized birds serving primarily the fast food industry to concentrate its production on medium-sized and larger-sized birds serving the retail grocery and food service industries, respectively. This shift resulted in larger average bird weights of the chickens processed by the Company, and substantially increased the number of pounds processed by the Company. In addition, the Company continually evaluates internal and external expansion opportunities to continue its growth in poultry and/or related food products.
The Company is a party to a revolving credit facility dated March 21, 2019, with a maximum available borrowing capacity of $1.0 billion. Under the credit facility, the Company may not exceed a maximum debt to total capitalization ratio of 50%. The Company has a one-time right, at any time during the term of the agreement, to increase the maximum debt to total capitalization ratio then in effect by five absolute percentage points in connection with the construction of a new poultry complex for the four fiscal quarters beginning on the first day of the fiscal quarter during which the Company gives written notice of its intent to exercise this right. The Company has not exercised this right. The facility also sets a minimum net worth requirement that at October 31, 2020, was $1.0 billion. The credit is unsecured and, unless extended, will expire on March 21, 2024. As of October 31, 2020, and December 16, 2020, the Company had borrowed $25.0 million, and had approximately $25.2 million outstanding in letters of credit, leaving $949.8 million of borrowing capacity available under the facility. For more information about the facility, see Item 1.01 of our Current Report on Form 8-K filed March 27, 2019.
(c) NARRATIVE DESCRIPTION OF REGISTRANT’S BUSINESS
General
The Registrant is engaged in the production, processing, marketing and distribution of fresh and frozen chicken and the preparation, processing, marketing and distribution of processed and minimally prepared chicken items. The Registrant has one reporting segment, poultry products.
The Registrant sells chill-packed, ice-packed, bulk-packed and frozen chicken, in whole, cut-up and boneless form, primarily under the Sanderson Farms® brand name, to retailers, distributors and casual dining operators in the United States and to customers who resell frozen chicken into export markets. During its fiscal year ended October 31, 2020, the Registrant processed approximately 657 million chickens, or approximately 4.8 billion dressed pounds. According to 2020 industry statistics, the Registrant was the third largest processor of dressed chicken in the United States based on average weekly processed pounds.
The Registrant conducts its chicken operations through Sanderson Farms, Inc. (Production Division) and Sanderson Farms, Inc. (Processing Division), both of which are wholly-owned subsidiaries of Sanderson Farms, Inc. The production subsidiary, Sanderson Farms, Inc. (Production Division), which has facilities in Laurel, Collins, Hazlehurst and McComb, Mississippi; Bryan, Waco, Palestine, Freestone County, Robertson County, Lindale and Mineola, Texas; Adel, Georgia; and Kinston and Lumberton, North Carolina, is engaged in the production of chickens to the broiler stage. Sanderson Farms, Inc. (Processing Division), which has facilities in Laurel, Collins, Hazlehurst and McComb, Mississippi; Hammond, Louisiana; Bryan, Palestine, Waco and Smith County, Texas; Moultrie, Georgia; and Kinston and St. Pauls, North Carolina, is engaged in the processing, sale and distribution of chicken products.
The Registrant conducts its prepared chicken business through its wholly-owned subsidiary, Sanderson Farms, Inc. (Foods Division), which has a facility in Flowood, Mississippi. This facility is engaged in the processing, marketing and distribution of approximately 60 processed and minimally prepared chicken items, which it sells nationally, principally to distributors and national food service accounts. The facility is managed by the same senior management team that manages our Processing Division.
Products
The Registrant has the ability to produce a wide range of processed chicken products and prepared chicken items.
Processed chicken is first salable as an ice-packed, whole chicken. The Registrant adds value to its ice-packed, whole chickens by removing the giblets, cutting and deboning the product based on customer specifications, and weighing, packaging and labeling the product to specific customer requirements. The additional processing steps of giblet removal, cutting and close tolerance weighing increase the value of the product to the customer over whole, ice-packed chickens by reducing customer handling and cutting labor and capital costs, reducing the shrinkage associated with cutting, and ensuring consistently sized portions.
The Registrant adds additional value to the processed chicken by deep chilling and packaging whole chickens in bags or combinations of fresh chicken parts, including boneless product, in various sized, individual trays under the Registrant’s brand name, which then may be weighed and pre-priced, based on each customer’s needs. This chill-pack process increases the value of the product by extending shelf life, reducing customer weighing and packaging labor, and providing the customer
with a wide variety of products with uniform, well designed packaging, all of which enhance the customer’s ability to merchandise chicken products.
To satisfy some customers’ merchandising needs, the Registrant freezes the chicken product, which adds value by meeting the customers’ handling, storage, distribution and marketing needs and by permitting shipment of product overseas where transportation time may be as long as 60 days.
The following table sets forth, for the periods indicated, the contribution, as a percentage of net sales dollars, of each of the Registrant’s major product lines:
| | | | | | | | | | | | | | | | | | | | | | | | | | | | | |
| | Fiscal Year Ended October 31, |
| | 2020 | | 2019 | | 2018 | | 2017 | | 2016 |
| Registrant processed chicken: | | | | | | | | | |
| Value added: | | | | | | | | | |
| Fresh chill-packed | 39.3 | % | | 32.9 | % | | 35.6 | % | | 31.0 | % | | 34.7 | % |
| Fresh vacuum-sealed | 33.8 | | | 38.3 | | | 35.2 | | | 39.8 | | | 37.6 | |
| Fresh bulk-packed | 13.7 | | | 14.4 | | | 15.1 | | | 16.4 | | | 15.1 | |
| Frozen | 6.8 | | | 6.2 | | | 6.5 | | | 6.7 | | | 5.1 | |
| Value added subtotal | 93.6 | | | 91.8 | | | 92.4 | | | 93.9 | | | 92.5 | |
| Non-value added: | | | | | | | | | |
| Fresh ice-packed | 1.2 | | | 1.2 | | | 1.2 | | | 1.0 | | | 0.9 | |
| Non-value added subtotal | 1.2 | | | 1.2 | | | 1.2 | | | 1.0 | | | 0.9 | |
| Total processed chicken | 94.8 | | | 93.0 | | | 93.6 | | | 94.9 | | | 93.4 | |
| Minimally prepared chicken | 5.2 | | | 7.0 | | | 6.4 | | | 5.1 | | | 6.6 | |
| Total | 100.0 | % | | 100.0 | % | | 100.0 | % | | 100.0 | % | | 100.0 | % |
Markets and Pricing
The three largest customer markets in the fresh and frozen chicken industry are food service customers that purchase fresh, bulk-packed products produced from a relatively large bird; retail grocery store customers that purchase fresh, tray-packed products produced from a medium-sized bird; and quick-serve food service customers that purchase products produced from relatively small birds.
The following table sets forth, as of October 31, 2020, for each of the Company’s poultry processing plants, the general customer market to which the plant is devoted, the weekly capacity of each plant at full capacity expressed in number of head processed, and the industry's average size of birds processed in the relevant market:
| | | | | | | | | | | | | | | | | |
| Plant Location | Market | | Capacity Per Week | | Industry Bird Size |
| Laurel, Mississippi | Big Bird | | 650,000 | | | 9.11 | |
| Hammond, Louisiana | Big Bird | | 650,000 | | | 9.11 | |
| Hazlehurst, Mississippi ¹ | Big Bird | | 650,000 | | | 9.11 | |
| Collins, Mississippi | Big Bird | | 1,300,000 | | | 9.11 | |
| Waco, Texas | Big Bird | | 1,300,000 | | | 9.11 | |
| Palestine, Texas | Big Bird | | 1,300,000 | | | 9.11 | |
| St. Pauls, North Carolina | Big Bird | | 1,300,000 | | | 9.11 | |
| McComb, Mississippi | Chill-Pack Retail | | 1,300,000 | | | 6.63 | |
| Bryan, Texas | Chill-Pack Retail | | 1,300,000 | | | 6.63 | |
| Moultrie, Georgia | Chill-Pack Retail | | 1,300,000 | | | 6.63 | |
| Kinston, North Carolina | Chill-Pack Retail | | 1,300,000 | | | 6.63 | |
| Tyler, Texas | Chill-Pack Retail | | 1,300,000 | | | 6.63 | |
Note 1 - At our virtual investor day on October 16, 2020, we announced our intention to reduce the target live weight for our Hazlehurst, Mississippi plant from a big bird size to a chill-pack retail size for the purpose of meeting shifting demand needs, primarily as a result of the coronavirus pandemic and its effects on consumer buying patterns. On approximately November 23, 2020, the live birds processed at the Hazlehurst, Mississippi plant reached our target live weight for chill-pack retail customers.
Our big bird plants process a relatively large bird. The chicken products produced at these plants are generally sold as fresh, bulk-packed chicken cut into a variety of products, including boneless breast meat, chicken tenders, whole and cut wings and boneless thigh meat, and are sold primarily to food service customers and further processors at negotiated spreads from quoted commodity market prices for those products. We have long-term contracts with many of our customers for these products produced at our big bird plants, but prices for products sold pursuant to those contracts fluctuate based on quoted commodity market prices. The contracts do not require the customers to purchase, or the Company to sell, any specific quantity of product. The dark meat from these birds that is not deboned is sold primarily as leg quarters and drumsticks in the export market or as fresh whole legs to further processors. While we have long-standing relationships with many of our export partners, virtually all of our export sales are at negotiated or spot commodity prices, which prices exhibit fluctuations typical of commodity markets. We have few long-term contracts for this product.
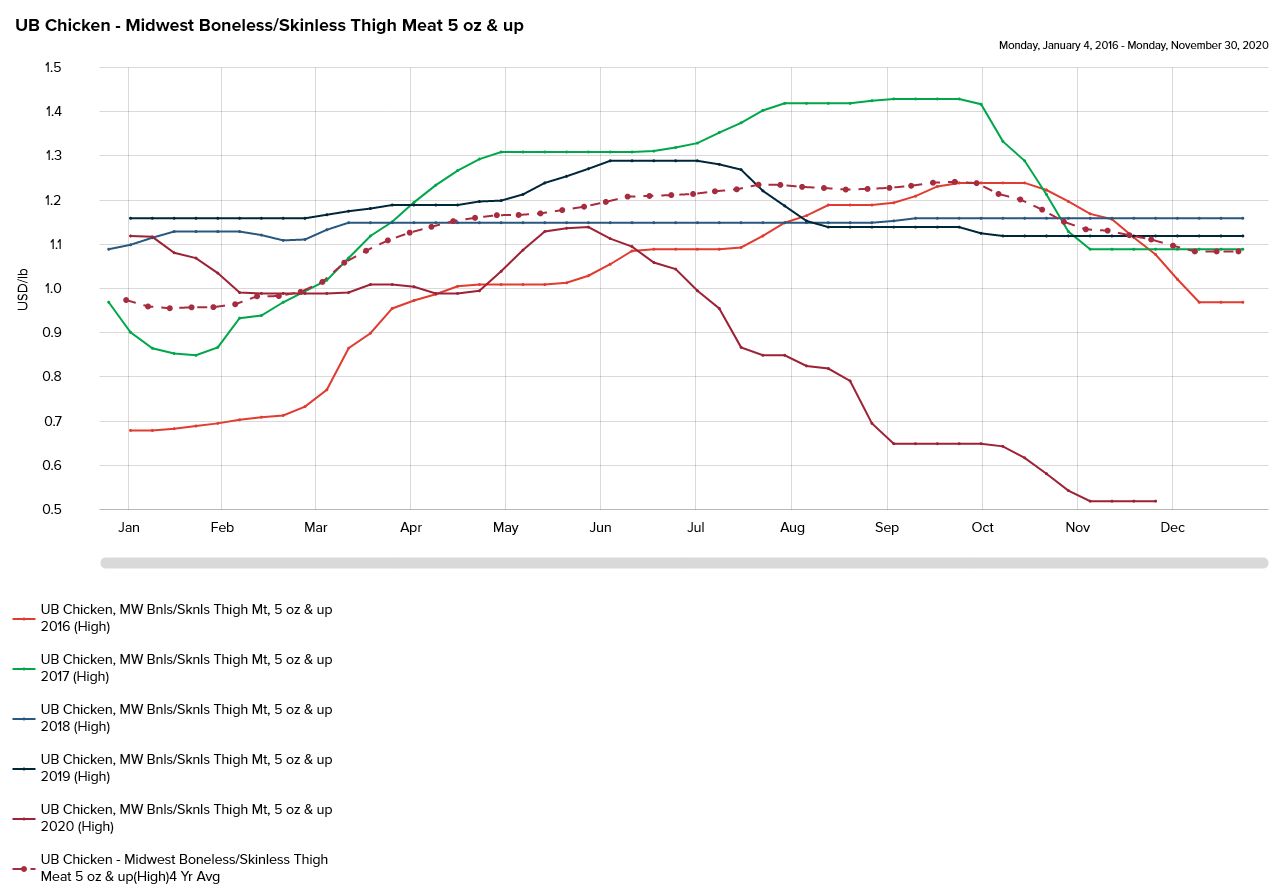
As of December 16, 2020, the Company had the capacity to process 6.5 million head per week in its big bird plants, which reflects the shift of the Hazlehurst, Mississippi plant from a big bird sized bird to a chill-pack retail sized bird. Our results from these plants are materially affected by fluctuations in the commodity market prices for boneless breast meat, chicken tenders, wings, leg quarters and boneless thigh meat as quoted by Urner Barry.
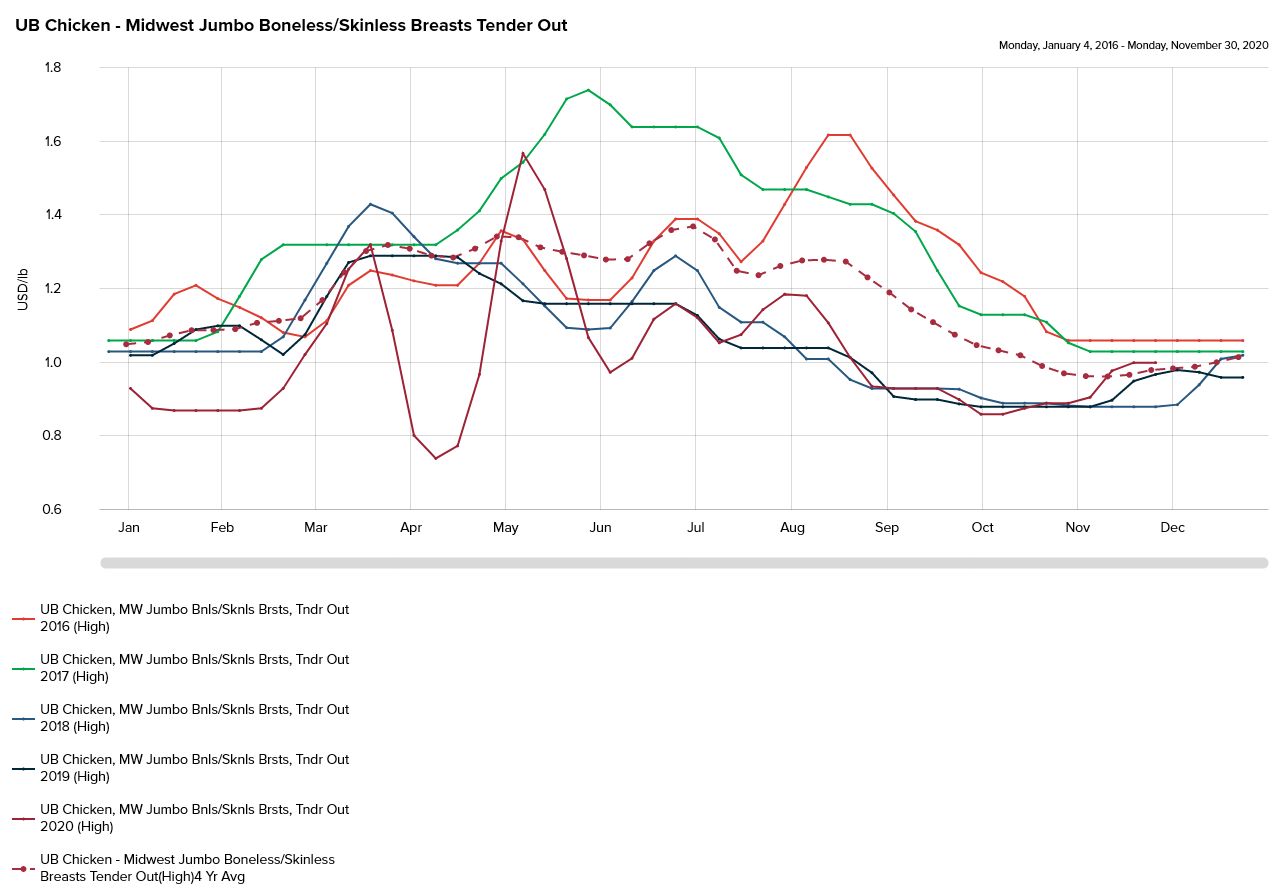
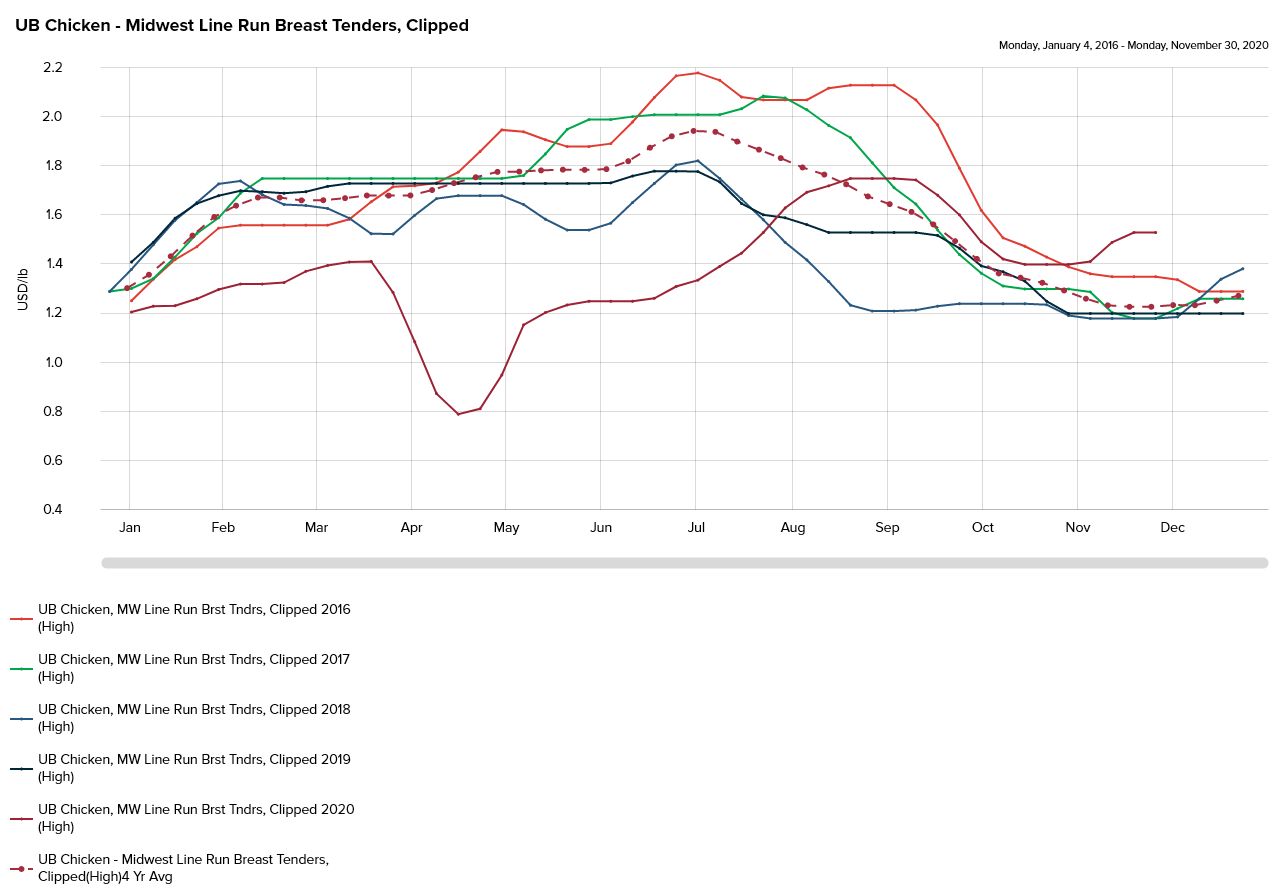
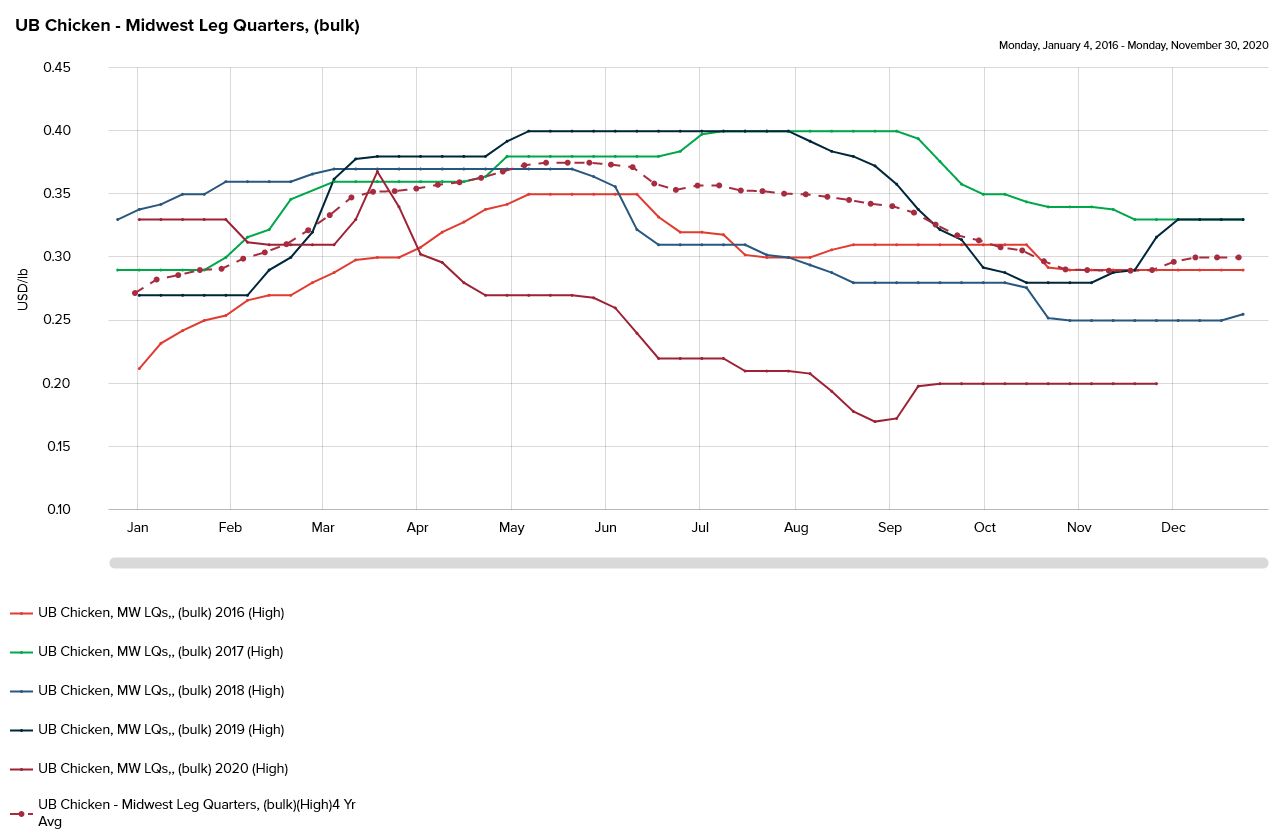
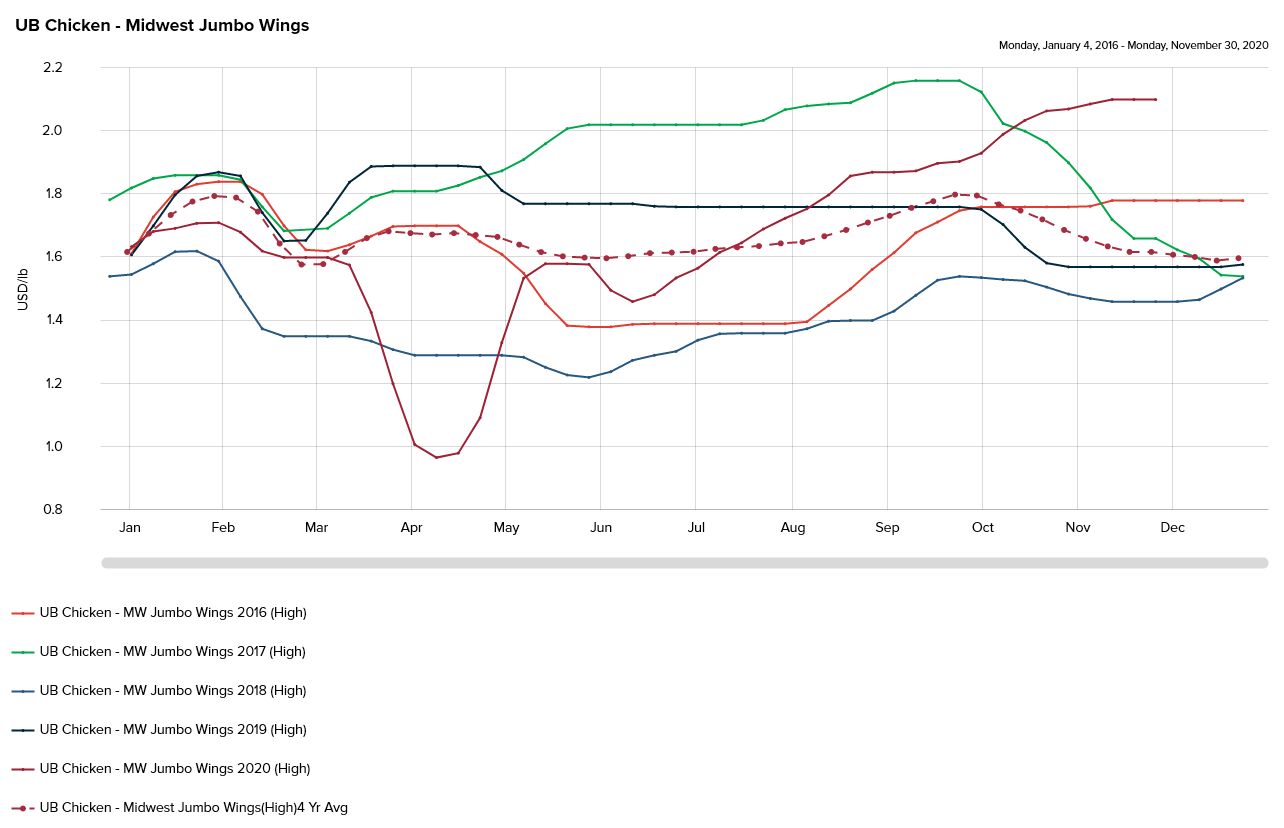
Urner Barry is an independent company specializing in the timely, accurate and independent reporting on market news and market price quotations to its customers in various food and protein industries, including poultry. The Urner Barry spot market prices for boneless breast meat, chicken tenders, leg quarters, whole wings and boneless thigh meat for the past five calendar years are set forth below and are published with Urner Barry's permission. Realized prices will not necessarily equal quoted market prices since most contracts offer negotiated discounts to quoted market prices, which discounts are negotiated on a customer by customer basis and are influenced by many factors. Selection of a particular market price benchmark is largely customer driven:
Our chill-pack plants process medium sized birds and cut and package the product in various sized individual trays to customers’ specifications. The trays are weighed and pre-priced primarily for customers to resell through retail grocery outlets. The Company sells its chill-pack products both under store brand names and under the Company’s Sanderson Farms® brand name. The Company has contracts ranging in duration from one year to three years with most of its chill-pack customers. These agreements typically provide for the pricing of product based on agreed upon, flat prices or on negotiated formulas that use an agreed upon, regularly quoted market price as the base, as well as various other guidelines for the relationship between the parties. All of our contracts with retail grocery store customers also provide for the sale of negotiated quantities of product at periodically negotiated prices, rather than the flat and formula-driven prices discussed above. None of our contracts with retail grocery store customers require the customers to purchase, or the Company to sell, any specific quantity of product. As of December 16, 2020, the Company had the capacity to process 7.15 million head per week at its chill-pack plants, which reflects the shift of the Hazlehurst, Mississippi plant from a big bird sized bird to a chill-pack retail sized bird. Our results from our chill-pack plants are materially affected by fluctuations in Urner Barry prices and other market benchmarks.
As with products produced at our big bird plants, selection of the desired methodology for pricing chill-pack products is largely customer driven. Prior to the discontinuation in November 2016 of the Georgia Dock index, which had been published by the Georgia Department of Agriculture, many of our chill-pack customers used that index as the base for pricing formulas. As new and renewing contracts have been negotiated, many of our chill-pack customers chose to negotiate flat prices for the life of the contracts, while some of our customers have chosen to use an index published by Express Markets, Inc. ("EMI").
Almost all of our products sold by our prepared chicken plant are sold under long-term contracts at fixed prices related to the spot commodity price of chicken at the time the contract is negotiated, plus a premium for additional processing.
Sales and Marketing
The Registrant’s chicken products are sold primarily to retailers (including national and regional supermarket chains and local supermarkets) and distributors within the United States. The Registrant also sells its chicken products to casual dining operators, foreign customers, and United States based customers who resell the products outside of the continental
United States. This wide range of customers, together with the Registrant’s product mix, provides the Registrant with flexibility in responding to changing market conditions in its effort to maximize profits. This flexibility also assists the Registrant in its efforts to reduce its exposure to market volatility, although its ability to do so is limited.
Sales and distribution of the Registrant’s chicken products are conducted primarily by sales personnel at the general corporate offices in Laurel, Mississippi, by customer service representatives at each of its processing plants and its prepared chicken plant and through independent food brokers. Each plant has individual on-site distribution centers and uses contract carriers for distribution of its products.
Generally, the Registrant prices much of its chicken products based upon weekly and daily market prices reported by private firms such as EMI and Urner Barry. The Registrant’s profitability is affected by such market prices, which may fluctuate substantially and exhibit cyclical and seasonal characteristics. The Registrant will adjust base prices depending upon value added, volume, product mix and other factors. While base prices may change weekly and daily, the Registrant’s adjustments to those base prices are generally negotiated from time to time with customers. The Registrant’s sales are generally made on an as-ordered basis, and the Registrant maintains sales contracts ranging in duration from one year to three years with many of its customers. These agreements, which provide the pricing structure of product, as well as various other guidelines for the relationship between the parties, do not require the customers to purchase or the Company to sell any specific quantity of product.
From time to time, the Registrant may use television, radio and newspaper advertising, point of purchase material, social media and other marketing techniques to develop consumer awareness of and brand recognition for its Sanderson Farms® products. The Registrant has achieved a high level of public awareness and acceptance of its products in its core markets. Brand awareness is an important element of the Registrant’s marketing philosophy, and it intends to continue brand name merchandising of its products. During calendar 2004, the Company launched an advertising campaign designed to distinguish the Company’s fresh chicken products from competitors’ products. The campaign noted that the Company’s product is a natural product free from salt, water and other additives that some competitors inject into their fresh chicken. The Company continues to use various media to communicate this message today. During fiscal 2016, the Company launched a multi-media advertising campaign designed to explain and support the Company's position regarding the judicious use of antibiotics to prevent illness and treat chickens that become ill. During fiscal 2017, the Company launched a multi-media advertising campaign designed to dispel many of the myths about poultry production.
While the information presented in the campaigns launched in fiscal years 2016 and 2017 is still available on our website, the Company launched a new multi-media campaign in fiscal 2018 designed to educate consumers on key attributes of our products. In fiscal year 2019, the Company's marketing efforts were primarily focused on digital campaigns that provided new, easily accessible recipes and highlighted the relatively high protein content of poultry. In fiscal 2020, the Company quickly shifted its marketing efforts to adapt to challenges that arose as a result of the COVID-19 pandemic, focusing on providing supportive and meaningful digital content for the evolving digital shopper. The Company regularly evaluates consumer trends, preferences, perception and awareness of its brand and, while not currently advertising on television, expects to continue to use extensions of previous campaigns and to develop new and relevant content in other media, at least for the near term.
The Registrant’s prepared chicken items are sold nationally, primarily to distributors and national food service accounts. Sales of such products are handled by sales personnel of the Registrant and by independent food brokers. Prepared chicken items are distributed from the Registrant’s plant in Flowood, Mississippi, through arrangements with contract carriers.
Production and Facilities
General. The Registrant is a fully, vertically-integrated producer of fresh, frozen and minimally prepared chicken products, controlling the production of hatching eggs, hatching, feed manufacturing, growing, processing and packaging of its product lines.
Breeding and Hatching. The Registrant maintains its own breeder flocks for the production of hatching eggs. The Registrant’s breeder flocks are acquired as one-day old chicks (known as pullets and cockerels) from primary breeding companies that specialize in the production of genetically designed breeder stock. As of October 31, 2020, the Registrant maintained contracts with 70 independent contract pullet producers for the grow-out of pullets (growing the pullet to the point at which it is capable of egg production, which takes approximately six months). Thereafter, the mature breeder flocks are
transported by the Registrant’s vehicles to breeder farms that are maintained, as of October 31, 2020, by 161 independent contract producers under the Registrant’s supervision. Eggs produced on the farms of independent contract breeder producers are transported to the Registrant’s hatcheries in the Registrant’s vehicles.
The Registrant owns and operates eleven hatcheries located in Mississippi, Texas, Georgia and North Carolina where eggs are incubated, vaccinated and hatched in a process requiring 21 days. The chicks are vaccinated against common poultry diseases and are transported by the Registrant’s vehicles to independent contract grow-out farms. As of October 31, 2020, the Registrant’s hatcheries were capable of producing an aggregate of approximately 14.1 million chicks per week.
Grow-out. The Registrant places its chicks on the farms of 823 independent contract broiler producers, as of October 31, 2020, located in Mississippi, Texas, Georgia and North Carolina, where broilers are grown to an age of approximately seven to nine weeks. The farms provide the Registrant with sufficient housing capacity for its operations, and are typically family-owned farms operated under contract with the Registrant. The farm owners provide facilities, utilities and labor; the Registrant supplies the day-old chicks, feed and veterinary and technical services. The independent contract poultry producers are compensated pursuant to an incentive formula designed to promote production cost efficiency.
Historically, the Registrant has been able to accommodate expansion in grow-out facilities through additional contract arrangements with independent contract producers.
Feed Mills. An important factor in the grow-out of chickens is the rate at which chickens convert feed into body weight. The Registrant purchases primary feed ingredients on the open market. Ingredients include corn and soybean meal, which are the largest cost components of the Registrant’s total feed costs. The quality and composition of the feed are critical to the conversion rate, and accordingly, the Registrant formulates and produces its own feed. As of October 31, 2020, the Registrant operated nine feed mills, four of which are located in Mississippi, three in Texas, one in Georgia and one in North Carolina. The Registrant’s annual feed requirements for fiscal 2020 were approximately 5.1 million tons, and it has the capacity to produce approximately 6.6 million tons of finished feed annually under current configurations.
Feed grains are commodities subject to volatile price changes caused by weather, size of harvest, transportation and storage costs, domestic and export demand and the agricultural and energy policies of the United States and foreign governments. On October 31, 2020, the Registrant had the capacity to store approximately 4.4 million bushels of corn at its feed mills, which was sufficient to store approximately one week's requirements for corn. Generally, the Registrant purchases its corn and other feed ingredients at current prices from suppliers and, to a limited extent, directly from farmers. Feed grains are available from an adequate number of sources. Although the Registrant has not experienced and does not anticipate problems in securing adequate supplies of feed grains, price fluctuations of feed grains have a direct and material effect upon the Registrant’s profitability. Although the Registrant attempts to manage the risk of volatile price changes in grain markets by sometimes purchasing grain at current prices for future delivery, it cannot eliminate the potentially adverse effect of grain price increases.
Processing. Once broilers reach processing weight, they are transported in the Registrant's vehicles to the Registrant’s processing plants. These plants use modern, highly automated equipment to process and package the chickens. The Registrant’s McComb and Collins, Mississippi; Moultrie, Georgia; Kinston and St. Pauls, North Carolina and Bryan, Waco, Palestine and Tyler, Texas processing plants operate two processing lines on a double shift basis with the capacity to process approximately 1,300,000 chickens per week as of October 31, 2020. The Registrant’s Laurel and Hazlehurst, Mississippi and Hammond, Louisiana processing plants operate on a double shift basis with the capacity to process approximately 650,000 chickens per week as of October 31, 2020. At October 31, 2020, the Company’s deboning facilities had the capacity to produce approximately 20.2 million pounds of big bird boneless breast and tenders finished product and 12.4 million pounds of chill-pack boneless breast and tenders finished product each week.
Prepared Chicken. The Company's prepared chicken plant is located in Flowood, Mississippi and has approximately 85,000 square feet of refrigerated manufacturing and storage space. The plant uses highly automated equipment to prepare, process and freeze prepared chicken items.
Executive Offices; Other Facilities. The Registrant’s laboratory and corporate offices are located on separate sites in Laurel, Mississippi. The office buildings house the Company’s corporate offices, meeting facilities and computer equipment and constitute the corporate headquarters. As of October 31, 2020, the Registrant operated 16 automotive maintenance shops, which service over 1,400 over-the-road and farm vehicles used to support the Registrant's operations. In addition, the
Registrant has one child care facility located near its Collins, Mississippi processing plant, which, due to the COVID-19 pandemic, was temporarily closed as of October 31, 2020.
Quality Control
The Registrant believes that quality control is important to its business and conducts quality control activities throughout all aspects of its operations. The Registrant believes these activities are beneficial to efficient production and in ensuring its customers receive wholesome, high quality products.
The Company's Director of Technical Services supervises the operation of a laboratory in Laurel, Mississippi which, among other things, monitors sanitation at the hatcheries, quality and purity of the Registrant’s feed ingredients and feed, the health of the Registrant’s breeder and broiler flocks, and conducts microbiological tests on live chickens, facilities and finished products. The Registrant conducts on-site quality control activities at each of its twelve processing plants and the prepared chicken plant.
Regulation
The Registrant’s facilities and operations are subject to regulation by various federal and state agencies, including, but not limited to, the Federal Food and Drug Administration (“FDA”), the United States Department of Agriculture (“USDA”), the Environmental Protection Agency ("EPA"), the Occupational Safety and Health Administration (“OSHA”) and corresponding state agencies. The Registrant’s chicken processing plants are subject to continuous on-site inspection by the USDA. The Registrant's prepared chicken plant operates under the USDA’s Total Quality Control Program, which is a strict self-inspection plan written in cooperation with and monitored by the USDA. The FDA inspects the production at the Registrant’s feed mills.
Compliance with existing regulations has not had a material adverse effect upon the Registrant’s earnings or competitive position in the past. Management believes that the Registrant is in substantial compliance with existing laws and regulations relating to the operation of its facilities and does not know of any major capital expenditures necessary to comply with such statutes and regulations.
The Registrant takes extensive precautions to ensure that its flocks are healthy and that its processing plants and other facilities operate in a healthy and environmentally sound manner. Events beyond the control of the Registrant, however, such as an outbreak of disease in its flocks or the adoption by governmental agencies of more stringent regulations, could materially and adversely affect its operations.
Competition
The Registrant is subject to significant competition from regional and national firms in all markets in which it competes. Some of the Registrant’s competitors have greater financial and marketing resources than the Registrant.
The primary methods of competition are price, product quality, number of products offered, brand awareness and customer service. The Registrant has emphasized product quality and brand awareness through its advertising strategy. See “Business — Sales and Marketing.” Although poultry is relatively inexpensive in comparison with other meats, the Registrant competes indirectly with the producers of other meats and fish, since changes in the relative prices of these foods may alter consumer buying patterns.
Customers
Two customers each accounted for more than 10% of the Registrant’s consolidated sales for the years ended October 31, 2020, October 31, 2019, and October 31, 2018. Sales to the two customers in fiscal 2020 accounted for 14.9% and 12.7%, respectively, of the Company's consolidated net sales, in 2019 accounted for 15.8% and 11.8%, respectively, of the Company's consolidated net sales, and in fiscal 2018 accounted for 14.3% and 10.5%, respectively, of the Company’s consolidated net sales. The Company does not believe the loss of these or any other single customer would have a material adverse effect on the Company because it could sell poultry earmarked for any single customer to alternative customers at market prices.
Sources of Supply
During fiscal 2020, the Registrant purchased its pullets and cockerels from a single major breeder. The Registrant has found the genetic breeds or cross breeds supplied by this company produce chickens most suitable to the Registrant’s purposes. The Registrant has no written contracts with this breeder for the supply of breeder stock. Other sources of breeder stock are available, and the Registrant continually evaluates these sources of supply.
Should breeder stock from its present supplier not be available for any reason, the Registrant believes that it could obtain adequate breeder stock from other suppliers.
Other major raw materials used by the Registrant include feed grains and other feed ingredients, cooking ingredients and packaging materials. The Registrant purchases these materials from a number of vendors and believes that its sources of supply are adequate for its present needs. The Registrant does not anticipate any difficulty in obtaining these materials in the future.
Seasonality
The demand for the Registrant’s chicken products generally is greatest during the spring and summer months and lowest during the winter months.
Trademarks
The Registrant has registered with the United States Patent and Trademark Office the trademark Sanderson Farms®, which it uses in connection with the distribution of its prepared chicken and premium grade chill-pack products. The Registrant considers the protection of this trademark to be important to its marketing efforts due to consumer awareness of and loyalty to the Sanderson Farms® label. The Registrant also has registered with the United States Patent and Trademark Office six other trademarks that are used in connection with the distribution of chicken and other products and for other competitive purposes.
The Registrant, over the years, has developed important non-public proprietary information regarding product-related matters. While the Registrant has internal safeguards and procedures to protect the confidentiality of such information, it does not generally seek patent protection for its technology.
Human Capital Resources
As of October 31, 2020, the Registrant had 17,445 employees. Of these, 1,980 employees were salaried and 15,465 were hourly. A collective bargaining agreement with the United Food and Commercial Workers International Union (UFCWIU) covers 625 hourly employees at our processing plant in Hammond, Louisiana and expires on November 30, 2022. A collective bargaining agreement with UFCWIU covers 1,540 production, maintenance and clean-up employees at our Bryan, Texas processing facility and expires on December 31, 2023. We believe our overall relations with our workforce are very good.
Our Culture and Values. Our company culture is the cornerstone of all our human capital programs. We believe our culture, which is based upon our core value of respect for the inherent dignity, equality and worth of every human being, is a key reason for our success. It is enshrined in our corporate Statement of Philosophy, first drafted in 1969, and in our Company Vision, Statement on Human Rights and Corporate Code of Conduct. In particular, our Company Vision calls upon our team to treat all persons with absolute respect and integrity and to be devoted to the success of everyone in our organization in fulfilling their potential in all aspects of life.
Safety and Health. The safety, health and welfare of our employees are paramount to our company. Our occupational health and safety programs are overseen by our President’s safety committee, which meets quarterly to set specific goals for workplace safety and measure attainment of those goals. Even though we have built more poultry complexes than any other company in the U.S. since 1993 and hired an additional 13,000 employees, our OSHA injury rates have declined by 67% during that time. For fiscal year 2019, we set a goal to reduce our OSHA injury rates by 10% compared to 2018, and we exceeded that goal, with rates declining by over 21%. In fiscal 2020, our OSHA injury rates declined another 6.3% compared to 2019. Cumulatively for the five years ended October 31, 2020, we had the fewest OSHA citations per 1,000 employees of any company in our industry having more than 5,000 employees.
We work closely with ergonomists to continuously monitor our employees’ working conditions and implement measures to ensure their wellness. For example, we have set our processing line speeds at the lowest rate of any company in our industry to reduce employee stress and injuries. This also contributes to favorable yields and product quality. We have numerous programs to promote the overall good health and wellness of our workforce. In response to the coronavirus pandemic, we implemented extensive safety measures throughout our company during fiscal 2020 to protect our employees from COVID-19. These are described in detail in this report in "Part II, Item 7, Management’s Discussion and Analysis of Financial Condition and Results of Operations."
Diversity, Equity and Inclusion ("DEI"). We strive to foster a work environment that includes and embraces racial, ethnic and gender diversity and other individual differences. As of the end of fiscal year 2020, 48% of our total workforce were women and 87% were minorities. Additionally, 22% of our management team were women and 48% were minorities. During fiscal year 2020, 45% of our new hires were women and 88% of our new hires were minorities. Our management diversity committee, which was established in 2011, oversees and strategically plans for diversity and inclusion within our company. For example, the committee has expanded our long-standing recruitment program targeted at Historically Black Colleges and Universities ("HBCUs"), and in fiscal 2019, 23% of the company’s summer interns were recruited from HBCUs. In fiscal 2020, the committee formed a new steering committee as a grassroots, action-oriented team to champion positive change. Additionally, our board of directors formed a special board committee on DEI, whose initial task is to engage an independent DEI consultant to perform a top to bottom review of our goals, strategy, policies, practices and messaging on DEI. We have a zero-tolerance policy on discrimination and harassment and have several systems under which employees can report incidents confidentially or anonymously and without fear of reprisal.
Recruitment, Retention and Development. The primary way we recruit and retain employees is by ensuring that our compensation and benefits are the most competitive in our industry. In fiscal 2019 and fiscal 2020, we awarded our hourly workforce across-the-board pay increases that place them at the top of the wage scale in the poultry industry. Our progressive pay scale begins at $15.45 per hour after the first 90 days of employment. After one year of employment, employees participate in our employee stock ownership plan at no cost to them and we match 100% of their contributions to our 401(k) plan for the first 3% of salary contributed and 50% for the next 2% of salary contributed. We pay 75% of the premium cost of our health insurance plan for employees and their families. We also have an extensive training program that provides both hourly and management training and other opportunities for professional and personal development and mentorship. Our training program is a critical part of our focus on employee safety, operational efficiency, employee wellness and welfare and our corporate culture. We invested $3.3 million in our employee training and development programs in fiscal 2020.
(e) AVAILABLE INFORMATION
The Company's website is http://www.sandersonfarms.com. The information on our website is not a part of this document. Our annual reports on Form 10-K, our quarterly reports on Form 10-Q, our current reports on Form 8-K, and all amendments to those reports are available, free of charge, through our website as soon as reasonably practicable after they are filed with the SEC. Our corporate code of conduct, information concerning corporate governance matters and our corporate responsibility report are also available, free of charge, through our website.
Item 1A. Risk Factors
In addition to the other information set forth in this report, you should carefully consider the following factors, which could materially affect our business, financial condition or results of operations in future periods. The risks described below are not the only risks facing our Company. Additional risks not currently known to us or that we currently consider immaterial also may materially adversely affect our business, financial condition or results of operations in future periods.
Risks Related to the COVID-19 Pandemic and Other Events
The COVID-19 pandemic has had, and may continue to have, a negative effect on our business.
The public health crisis caused by the COVID-19 pandemic and the measures taken by governments, businesses, including us, and the public at large to limit the spread of the disease have had, and may continue to have, a negative effect on our business including, without limitation, the following:
•We have experienced a decrease in demand and commodity prices for products from our plants that serve food service customers, restaurants, and other customers who sell food for consumption away from home. These customers have been significantly negatively affected by stay-at-home restrictions or recommendations, closings of restaurants, social distancing requirements and cancellations of major sporting and other events. This negative trend may continue to some degree even though government restrictions are reduced or lifted because restaurants and other venues may be required to operate at reduced capacities and consumers may fear gathering in public places. In addition, resurgences of COVID-19 infections after restrictions are lifted are causing and could continue to cause governments to impose new or stricter closure, capacity or social distancing requirements. This could cause consumer demand for food away from home to worsen. While we have experienced increased demand for products from our plants that serve retail grocery store customers, that increase in demand cannot entirely offset the decrease in demand from our food service customers. We also cannot predict whether and to what extent changes in consumer food purchasing behavior will persist even after the threat of the pandemic has been eliminated or how those changes would affect our business.
•Deteriorating economic and political conditions caused by the COVID-19 pandemic, such as increased unemployment, decreases in disposable income and consumer spending, declines in consumer confidence, changes in consumer buying patterns, or economic slowdowns or recessions, may contribute to lower demand for our products, especially products from our plants that serve food service customers.
•We have experienced some disruption in our operations due to the pandemic, including higher than normal absenteeism related to COVID-19 among our hourly employees and inefficiencies from a significant number of new hires. While we have been able to operate despite these disruptions, a higher level of disruption could materially and adversely affect our operations. For example, although we are taking measures to protect our employees and prevent the spread of coronavirus in our facilities, these measures may not be sufficient to prevent an outbreak of infections among our employees. Government restrictions like social distancing regulations or limits on the number of persons who can be present in our facilities could also impair operations. The absence of a significant number of employees to staff our plants could cause a material reduction in our production volumes and could also hurt our ability to make certain products that require more labor to produce. If an outbreak at any of our facilities is severe, we could even be forced to close the facility, which in turn would constrain our ability to meet customer orders, increase our costs and reduce our revenues.
•We have incurred additional expenses directly related to COVID-19, which consist primarily of additional wage expense to pay our $1 per hour attendance bonus, paid time off for employees who are not working for reasons related to COVID-19 and overtime expense to run our plants that produce product for retail grocery store customers on Saturdays to meet increased demand. We have also incurred costs for personal protective equipment, cleaning, on-site medical clinics and other measures we have taken in our facilities to protect against the spread of disease. These expenses may be ongoing for an uncertain period of time and could increase if we are required to take additional measures to ensure we can continue to operate during the pandemic.
•Some meat producers in the United States have experienced significant outbreaks of COVID-19 among their employees, which has caused some meat processing plants to close. This has led to public and media criticism of companies and the meat packing industry in general, including the poultry industry, for their management of the pandemic and working conditions for their employees. We could be affected by negative public perception of our industry resulting from the pandemic.
•If the pandemic worsens in countries where we ship our products, we could face more significant delays than we have experienced to date in the delivery of our product in the export markets due to, among other things, additional safety requirements imposed by port authorities, closures of or congestion at ports, and other capacity constraints. Additionally, while we have so far not experienced significant delays in the distribution of our products to our customers within the United States, higher rates of infection or illness among truck drivers could create domestic shipping delays.
•Declining oil prices, which have been caused in part by the contraction of commercial activity worldwide due to the pandemic, have limited and may continue to limit the ability of some of our export customers to purchase our products because their domestic economies depend on oil. Additionally, the value of the U.S. dollar versus some foreign currencies has increased. This has led and may continue to lead to weaker demand and prices for our products in the export markets.
•If the effects of the pandemic continue to cause market prices for our products to fall, then as further explained below, we may have to record adjustments to write down the carrying values of our live inventories in future quarters.
•As a result of the COVID-19 pandemic, we have permitted some office-based employees who are at high risk for severe illness from COVID-19 to work remotely. Our information technology systems may be more vulnerable to cyber attacks or other disruptions as a result of team members accessing our networks and systems from off-site.
•Actions we have taken or may take, or decisions we have made or may make, as a consequence of the COVID-19 pandemic may result in legal claims or litigation against us.
•We rely on third-party service providers and business partners, such as independent contract poultry producers, cloud data storage and other information technology service providers, suppliers (particularly suppliers of feed grains), distributors, and other external business partners, for certain functions or services that support key portions of our operations. These third-party service providers and business partners are subject to risks and uncertainties related to the COVID-19 pandemic, which may interfere with their ability to fulfill their respective commitments and responsibilities to us in a timely manner and in accordance with the agreed-upon terms.
•We may experience an increase in working capital needs and/or an increase in trade accounts receivable write-offs (and associated reserves) as a result of increased financial pressures on our suppliers or customers who are not able to pay in a timely manner or at all.
•Depending on the duration of the pandemic and market conditions for our products, we may need to preserve liquidity, which could result in a reduction or suspension of our quarterly dividend or delays in implementing or an inability to implement our strategic planning initiatives.
•The resumption of normal business operations after the disruptions caused by the COVID-19 pandemic may be delayed or constrained by its lingering effects on our customers, consumers, independent contract poultry producers or third-party service providers.
•Governmental authorities in the United States may increase or impose new income taxes or indirect taxes, or revise interpretations of existing tax rules and regulations, as a means of financing the costs of stimulus and other measures enacted or taken, or that may be enacted or taken in the future, to protect the United States economy from the impact of the pandemic. Such actions could have a material adverse effect on our results of operations, financial condition and cash flows.
Any of the negative impacts of the COVID-19 pandemic, including those described above, may have a material adverse effect on our results of operations, financial condition and cash flows. Any of these negative impacts could exacerbate the other risk factors discussed below. The full extent to which the COVID-19 pandemic will negatively affect our results of operations, financial condition and cash flows will depend on future developments that are highly uncertain and that we cannot predict, including the scope and duration of the pandemic and actions by governmental authorities and other third parties in response to the pandemic.
Our operations, or those of our business partners, independent contract poultry producers and customers, and demand for our products could be adversely affected by events outside of our control such as natural disasters, terrorist attacks, epidemics, pandemics, war, or the fear of these events.
We may be affected by natural disasters, terrorist attacks, epidemics, pandemics like COVID-19, war or other events outside of our control. These events may impact our operations directly, or may disrupt the operations of our business partners, feed grain and other suppliers, independent contract poultry producers and customers in ways that can adversely
affect our results of operations, financial condition or cash flows. Fear of such events might also alter consumer confidence, behavior and spending patterns, which could decrease demand for protein, including our products.
Risks Related to Industry Volatility
Industry volatility can affect our earnings, especially due to fluctuations in commodity prices of feed ingredients and chicken.
Profitability in the poultry industry is materially affected by the commodity prices of feed ingredients, chicken, and, to a lesser extent, alternative proteins. These prices are determined by supply and demand factors, and supply and demand factors related to feed ingredients and chicken may not correlate. As a result, the poultry industry is subject to wide fluctuations in profitability. Typically we do well when chicken prices are high and feed prices are low. We are less profitable, and sometimes have losses, when chicken prices are low and feed prices are high. For example, grain prices during 2011 were high, while prices for chicken products did not increase proportionally, and the Company recorded a net loss. During 2012 and 2013, grain prices remained high, but market prices for chicken also increased, and the Company was profitable. During fiscal 2014 and fiscal 2015, grain prices declined while market prices for chicken increased, and the Company earned near record-high margins.
Various factors that are beyond our control can affect the supply of corn and soybean meal, our primary feed ingredients. In particular, global weather patterns, including adverse weather conditions that may result from climate change, the global level of supply inventories and demand for feed ingredients, currency fluctuations and the agricultural and energy policies of the United States and foreign governments all affect the supply and demand of feed ingredients. Weather patterns often change agricultural conditions in an unpredictable manner. A sudden and significant change in weather patterns could affect supplies of feed ingredients, as well as both the industry’s and our ability to obtain feed ingredients, grow chickens or deliver products. Additionally, an increase in ethanol producers' demand for corn has historically resulted in increases in the costs for corn and other grains.
Increases in the prices of feed ingredients will result in increases in raw material costs and operating costs. Because prices for our products are related to the commodity prices of chickens, which depend on the supply and demand dynamics of fresh chicken, we typically are not able to increase our product prices to offset increased grain costs. Although we periodically enter into contracts to purchase feed ingredients at current prices for future delivery to manage our feed ingredient costs, this practice does not eliminate the risk of increased operating costs from commodity price increases. In addition, if we are unsuccessful in our grain buying strategy, we could actually pay a higher cost for feed ingredients than we would if we purchased at current prices for current delivery.
It is very difficult to predict how the chicken and grain markets will perform. The exposure of our business to the cyclical nature and volatility of commodities markets for raw materials and poultry could adversely affect our profitability, financial condition and results of operations.
We may be required to write down the value of our inventories if the net realizable value of our inventories is less than their accumulated cost at the end of a fiscal period.
Prepared chicken and poultry inventories, and inventories of feed, eggs, medication, packaging supplies and live chickens, are stated on our balance sheet at the lower of cost (average method) or net realizable value. Our cost of sales is calculated during a period by adding the value of our inventories at the beginning of the period to the cost of growing, processing and distributing products produced during the period and subtracting the value of our inventories at the end of the period. If the net realizable values of our inventories are below the accumulated cost of those inventories at the end of a period, we record adjustments to write down the carrying value of the inventory from cost to net realizable value. These write-downs directly increase our cost of sales by the amount of the write-downs. This risk is greatest when the costs of feed ingredients are high and the market value for finished poultry products is declining.
Any such adjustment we may make in one period effectively absorbs into that period a portion of the costs to grow, process and distribute chickens that we would have otherwise incurred in the next fiscal period, thereby benefiting the next period. Any such adjustments that we make in the future could be material, and could materially adversely affect our financial condition and results of operations. The Company recorded a charge of $2.8 million at October 31, 2019 and $9.6 million at October 31, 2018 to reduce the values of live inventories on hand at those dates from cost to net realizable value. The Company recorded no such charge at October 31, 2020.
A decrease in demand for our products in the export markets could materially and adversely affect our results of operations, financial condition and cash flows.
Nearly all of our customers are based in the United States, but we sell some of our product to foreign customers and some to United States based customers who resell the product in the export markets. Approximately 8.5% of our gross sales in fiscal 2020 were to foreign customers or customers based in the United States who resell product in other countries, including approximately $143.8 million to customers who resell product in Mexico and $79.8 million to customers who resell product in China. Any disruption in the export markets could materially adversely affect our revenues or create an oversupply of poultry in the United States, which would cause domestic poultry prices to decline. Disruptions could include, for example:
•trade embargoes, tariffs, import bans, duties, or quotas;
•currency fluctuations;
•adverse political, social or economic conditions in countries to which we export our products;
•disruptions in shipping channels; and
•changes in governmental trade policies or agreements with countries to which we sell products.
Any of these conditions could materially and adversely affect our revenues, results of operations, financial condition or cash flows.
For example, the outbreak of African swine fever in China in 2019 affected the worldwide supply of pork. In November 2019, China lifted its nearly five-year ban on the import of United States poultry, and we resumed shipments almost immediately. The deficit of protein available to consumers in China as a result of African swine fever in that country had been widely expected to create additional demand for protein produced in the United States. However, the spread of COVID-19 in China and the government's actions to limit the spread of the virus depressed Chinese demand for protein during our 2020 fiscal year because quarantines limited travel within the country and restaurants were closed. Demand for our products other than chicken paws softened during the second half of fiscal 2020 as China rebuilt its cold storage inventories and consumers in China did not return to restaurants in the same numbers as before the COVID-19 outbreak. Similar conditions have occurred in other countries to which we export our product as COVID-19 has spread. We do not know how long and to what extent the pandemic will impact demand for our products in export markets.
Our stock price may be volatile.
The market price of our common stock could be subject to wide fluctuations in response to factors such as the following, many of which are beyond our control:
•market volatility and fluctuations in the price of feed grains and chicken products, as described above;
•quarterly variations in our operating results, or results that vary from the expectations of securities analysts and investors;
•changes in investor perceptions of the poultry industry in general, including our competitors; and
•general economic and competitive conditions.
In addition, purchases or sales of large quantities of our stock, or significant short positions in our stock, could have an unusual or adverse effect on our market price.
Operational Risks
Inclement weather, such as excessive heat or storms, or other natural disasters, could have a material adverse effect on our results of operations.
Extreme weather in the areas where we operate or where our feed grains are grown, such as extreme temperatures, drought, hurricanes or other storms, or other natural disasters, could increase our costs, impair the health or growth of our flocks or interfere with our hatching, production or shipping operations. For example, historic drought conditions in the Midwestern United States in 2012 had a significant adverse effect on the supply and price of feed grains in fiscal 2012 and the first three quarters of 2013. Scientists believe that climate change could increase the frequency and severity of adverse weather events. Extreme weather, regardless of its cause, or other adverse events, could affect our business by causing, among other things:
•shortages or high prices of corn, soybeans or other grains we use to make feed;
•power outages;
•fuel shortages;
•damage to infrastructure or our facilities;
•damage or destruction of live, raw material, or finished goods inventories;
•water shortages;
•disruption of shipping channels;
•less efficient or non-routine operating practices necessitated by adverse events; or
•increased costs of insurance coverage in the aftermath of such events.
Any of these factors could materially and adversely affect our results of operations. We may not be able to recover through insurance all of the damages, losses or costs that may result from such adverse events, including those that may be caused by climate change.
Outbreaks of avian disease, such as avian influenza, or the perception that outbreaks may occur, can significantly restrict our ability to conduct our operations and can significantly affect demand for our products.
Events beyond our control, such as the outbreak of avian disease or the perception that an outbreak may occur, even if it does not affect our flocks, could significantly restrict our ability to conduct our operations or our sales. An outbreak of disease could result in governmental restrictions on the import and export of fresh and frozen chicken, including our fresh and frozen chicken products, or other products to or from our suppliers, facilities or customers, or require us to destroy one or more of our flocks. This could result in the cancellation of orders by our customers and create adverse publicity that may have a material adverse effect on our business, reputation and prospects. In addition, world-wide fears about avian disease, such as avian influenza, have, in the past, depressed demand for fresh chicken, which adversely affected our sales during and around that time.
In past years there has been substantial publicity regarding a highly pathogenic Asian strain of avian influenza, or AI, known as H5N1, which has affected Asia since 2002 and which has been found in Europe, the Middle East and Africa. It is widely believed that this strain of AI is spread by migratory birds, such as ducks and geese. There have also been some cases where this strain of AI is believed to have passed from birds to humans as humans came into contact with live birds that were infected with the disease.
Although the Asian strains of AI described above have not been identified in North America, there have been outbreaks of both low and high pathogenic strains of non-Asian avian influenza in recent years in North America, including in the U.S. and Mexico.
Until 2015, the outbreaks in North America had not generated the same level of concern, or received the same level of publicity, or been accompanied by the same reduction in demand for poultry products in certain countries, as that associated with the Asian strains. Beginning in January 2015, however, the United States experienced what some industry observers believe was the worst avian influenza outbreak in United States history. According to the United States Animal and Plant Health Inspection Service (APHIS), approximately 7.8 million turkeys and 40.3 million chickens were affected in the United States by this avian influenza outbreak, and the last reported case was in June 2015. The affected chickens were almost all hens that lay eggs for the table egg industry, and not broiler chickens such as those we raise.
We have a high degree of confidence in our industry’s biosecurity program, but we cannot be certain our flocks or others in our industry will not be affected by AI. Given our high degree of confidence in our biosecurity programs, we believe the primary risks associated with domestic outbreaks of avian influenza are market risks, as many countries to which our industry sells product imposed partial or total bans on the import of broiler meat produced in the United States as a result of the 2015 outbreak.
All AI related bans that were imposed following the 2015 outbreak in the United States have been lifted, the last of which was lifted by China on November 14, 2019. While these bans were in place, the market price for leg quarters fell significantly below historical averages. For more information on the impact of this outbreak on exports, please see the risk factor above entitled “A decrease in demand for our products in the export markets could materially and adversely affect our results of operations.”
While domestic demand for broiler meat was not materially affected by the 2015 outbreak, we cannot assure you that further spread of AI or the outbreak of the Asian strains of AI either in other countries or in the United States will not materially adversely affect both domestic and international demand for poultry products produced in the United States. Because the virus is carried by migratory water fowl, it is possible the virus could be spread to domestic poultry flocks during any seasonal migration of those water fowl. If AI were to affect a significant number of our flocks, or materially reduce domestic demand for our products, either or both of these events could have a material adverse effect on our business, reputation or prospects.
Failure of our information technology infrastructure or software could adversely affect our day-to-day operations and decision making processes and have an adverse effect on our performance.
We depend on accurate and timely information and numerical data from key software applications to aid our day-to-day business, financial reporting and decision-making and, in many cases, proprietary and custom-designed software is necessary to operate equipment in our feed mills, hatcheries and processing plants. In our day-to-day business, we depend on information technology for, among other things, electronic communications between our facilities, personnel, customers and suppliers, and for digital marketing and public information.
We have put in place disaster recovery plans for our critical systems. However, any disruption caused by the failure of these systems, the underlying equipment, or communication networks could delay or otherwise adversely impact our day-to-day business and decision making, could make it impossible for us to operate critical equipment, and could have a materially adverse effect on our performance, if our disaster recovery plans do not mitigate the disruption. Disruptions could be caused by a variety of factors, such as catastrophic events or weather, natural disasters, power or telecommunications outages, viruses, terrorist attacks, or unauthorized access or cyber-attacks on our systems by outside parties. In addition, a breach of our cyber-security measures could result in the loss, destruction or theft of confidential or proprietary data or other consequences, and could expose us to material losses or liability to third parties. Similar risks exist with respect to third parties who may possess our confidential data, such as our IT support providers, third party benefit and other administrators, professional advisors and consultants, and our financial institutions.
Cyber-attacks and other cyber incidents are occurring more frequently, and are constantly evolving in nature and sophistication. Our failure to maintain our cyber-security measures and keep abreast of new and evolving threats may make our systems vulnerable. The vulnerability of our systems and our failure to identify or respond timely to cyber incidents could have an adverse effect on our operations and reputation and expose us to liability or regulatory enforcement actions.
We depend on the availability of, and good relations with, our employees and contract growers.
We have approximately 17,445 employees, approximately 2,165 of which are covered by collective bargaining agreements. In addition, we contract with approximately 1,054 independent contract poultry producers in Mississippi, Texas, North Carolina and Georgia for the grow-out of our breeder and broiler stock and the production of broiler eggs. Our operations depend on the availability of labor and contract growers and maintaining good relations with these persons and with labor unions. If we fail to maintain good relations with our employees or with the unions, we may experience labor strikes or work stoppages. If we do not attract and maintain contracts with our growers, including new growers for our new poultry complexes, our production operations could be negatively impacted and/or our growth could be constrained.
We rely heavily on the services of key personnel.
We depend substantially on the leadership of a small number of executive officers and other key employees. We have employment agreements with only three of these persons (our Chairman of the Board and Chief Executive Officer; our President and Chief Operating Officer; and our Treasurer, Chief Financial Officer, and Chief Legal Officer), and those with whom we have no agreement would not be bound by non-competition agreements or non-solicitation agreements if they were to leave us. The loss of the services of these persons could deplete our institutional knowledge and could have a material adverse effect on our business, results of operations and financial condition. In addition, we may not be able to attract, retain and train the new management personnel we need for our new complexes, or do so at the pace necessary to sustain our significant company growth.
Marketing and Sales Risks
The loss of our major customers could have a material adverse effect on our results of operations.
Our sales to our top ten customers represented approximately 52.0% of our net sales during fiscal 2020. Our contracts with our customers provide pricing structures, but do not require customers to purchase any specific quantity of product. Therefore, our customers could significantly reduce or cease their purchases from us with little or no advance notice, which could materially and adversely affect our sales and results of operations.
We must identify changing consumer preferences, trends and purchasing behaviors, and offer food products that consumers want.
Our success depends, in part, on our ability to offer products that appeal to our customers and to respond to evolving consumer preferences, trends and purchasing behaviors. Consumer behavior is influenced by factors such as, among other things:
•perceptions about the health and social implications of food products;
•safety and quality of food products;
•price; and
•distribution channels.
Consumers are sometimes influenced by negative publicity about food production, including stories that are inaccurate or misleading. The expanding role of social and digital media has increased the speed and extent to which people can share information (whether or not accurate) and opinions about our products. If we do not identify and react timely to negative publicity, or inaccurate or misleading stories, we may experience reduced demand and pricing for our products. Prolonged negative perceptions about our products, our brand or our Company, or a loss of confidence by consumers in our products, could materially and adversely affect our reputation, sales, financial condition and results of operations.
We may also introduce new products and improved products from time to time to satisfy evolving consumer preferences, trends and purchasing behaviors, and may incur significant development and marketing costs in doing so. If our products fail to meet evolving consumer preferences, trends and purchasing behaviors, then these products and our marketing strategy will be less successful. Additionally, because we produce only chicken products, we may be limited in our ability to respond to changes in consumer preferences towards other animal proteins or away from animal proteins entirely.
We have devoted significant resources to marketing and public relations programs that inform consumers about the safety and quality of our products and our production practices, including our use of antibiotics in raising live chickens. However, we are subject to legal and regulatory restrictions on the marketing and labeling of our products, which may hamper our marketing efforts. We must also keep pace with a rapidly changing media environment and advertising and marketing channels. If our marketing and public relations efforts are not effective, if consumers believe we have acted irresponsibly, or we are not successful in developing and marketing new products, then our competitive position, reputation and market share may suffer. This, in turn, could lead to lower sales and profits, which could materially and adversely affect our results of operations and financial condition.
The poultry industry is highly competitive.
In general, the competitive factors in the U.S. poultry industry include:
•price;
•product quality;
•brand identification;
•innovation;
•breadth of product line; and
•customer service.
Competitive factors vary by major customer markets. Some of our competitors have greater financial and marketing resources than we have. In the food service market, competition is based on consistent quality, product development, customer service and price. In the U.S. retail grocery market, we believe that competition is based on product quality, brand awareness, price and customer service. Our success depends in part on our ability to manage costs and be efficient in the highly competitive poultry industry.
Risks Related to Our Growth Strategy
We would be adversely affected if we expand our business by acquiring other businesses or by building new facilities, but fail to successfully integrate the acquired business or run a new facility efficiently.
We regularly evaluate expansion opportunities such as acquiring other businesses or building new facilities. Significant expansion involves risks such as:
•the availability and terms of additional debt or equity financing and its effect on our financial condition;
•increases in our expenses and working capital needs;
•integrating the acquired business or new facilities into our operations;
•attracting and retaining growers;
•streamlining overlapping supply chains;
•identifying customers for additional product we produce and retaining existing customers; and
•identifying and training key managers and employees to run the new business or facility, while continuing to operate our existing facilities efficiently.
Additional risks related to acquisition transactions may include:
•difficulty identifying suitable candidates for acquisitions or consummating transactions on terms that are favorable;
•implementing and maintaining consistent standards, controls, procedures and information systems;
•potential loss of key employees or customers of any acquired business;
•managing the geographic distance of an acquired business from our other facilities; and
•exposure to unforeseen or undisclosed liabilities of any acquired business.
Successful expansion depends on our ability to timely integrate the acquired business or efficiently operate the new facility, to devote significant management attention to the project and its integration in our business, and to manage a larger overall company efficiently. If we are unable to do this, expansion could adversely affect our operations, financial results and prospects, and we might not realize the cost savings and synergies we expected from the expansion. Additionally, the diversion of management’s attention from day-to-day business operations and the execution of our strategic plan could adversely impact our performance.
The construction and potential benefits of our new facilities are subject to risks and uncertainties.
For any new facility that we build, our ability to complete construction on a timely basis and within budget is subject to a number of risks and uncertainties described below. In addition, when a new facility becomes operational, it may not generate the benefits we expect if demand for the products to be produced by the facility is different from what we expect or we do not operate the facility efficiently.
In order to complete construction of a new facility, we need to take a significant number of steps and obtain a number of approvals and permits, none of which we can assure you will be obtained. For example, for each new fresh and frozen chicken complex, we need to:
•identify a site and purchase or lease such site;
•obtain a number of licenses and permits;
•enter into construction contracts;
•identify and enter into contracts with a sufficient number of independent contract poultry producers;
•complete construction on time; and
•hire and train our workforce.
If we are unable to complete construction on schedule, attract independent contract poultry producers, find customers for the additional product produced by the new facility, run the facility efficiently, or otherwise achieve the expected benefits of our new facilities, our business could be negatively affected.
Legal and Regulatory Risks
Immigration legislation and enforcement may affect our ability to hire hourly workers.
Immigration reform continues to attract significant attention in the public arena and the United States Congress. If new immigration legislation is enacted at the federal level or in states in which we do business, such legislation may contain provisions that could make it more difficult or costly for us to hire United States citizens and/or legal immigrant workers. In such case, we may incur additional costs to run our business or may have to change the way we conduct our operations, either of which could have a material adverse effect on our business, operating results and financial condition. Also, despite our past and continuing efforts to hire only United States citizens and/or persons legally authorized to work in the United States, increased enforcement efforts with respect to existing immigration laws by governmental authorities may disrupt a portion of our workforce or our operations at one or more of our facilities, thereby negatively affecting our business. Officials with the Bureau of Immigration and Customs Enforcement have informally indicated intent to focus their enforcement efforts on meat and poultry processors.
If our poultry products become contaminated, we may be subject to product liability claims and product recalls.
Poultry products may contain disease-producing organisms, or pathogens, such as Listeria monocytogenes, Salmonella and generic E. coli. These pathogens are generally found in the environment and, as a result, there is a risk that they could be present in our processed poultry products as a result of food processing. In addition, it is possible foreign material such as metal, plastic or other material used in our processing plants could contaminate product during processing. Pathogens or foreign material can also be introduced as a result of improper handling by our customers, consumers or third parties after we have shipped the products. We control these risks through careful processing and testing of our finished product, but we cannot entirely eliminate them. We have little, if any, control over proper handling once the product has been shipped. Nevertheless, contamination that results from improper handling by our customers, consumers or third parties, or tampering
with our products by those persons, may be blamed on us. Any publicity regarding product contamination or resulting illness or death, even if we did not cause the contamination, could lead to increased scrutiny by regulators and could have a material adverse effect on our business, reputation and future prospects.
If our products are contaminated or damaged, we could also be required to recall our products or close our plants, and product liability claims could be asserted against us. A widespread product recall could be costly and could cause significant losses, the destruction of product inventory, lost sales or customers due to the unavailability of product, adverse publicity, damage to our reputation, and a loss of consumer confidence in our products.
We are exposed to risks relating to product liability, product recalls, property damage and injuries to persons, for which insurance coverage is expensive, limited and potentially inadequate.
Our business operations entail a number of risks, including risks relating to product liability claims, product recalls, property damage and injuries to persons. The insurance we maintain with respect to certain of these risks, including product liability and recall insurance, property insurance, workers compensation insurance and general liability insurance, is expensive and difficult to obtain. We cannot assure you that we can maintain on reasonable terms sufficient coverage to protect us against losses due to any of these events.
Governmental regulation and litigation are constant factors affecting our business.
The poultry industry is subject to federal, state, local and foreign governmental regulation relating to production of food animals and the processing, packaging, storage, distribution, advertising, labeling, quality and safety of food products. We are also subject to laws and regulations affecting businesses and public companies generally, including domestic and foreign regulations that affect our export activity, such as the Foreign Corrupt Practices Act. Unknown matters, new laws and regulations, or stricter interpretations of existing laws or regulations may materially affect or restrict our business and operations or increase our costs in the future. Our failure to comply with applicable laws and regulations could subject us to administrative, civil and criminal penalties, including fines, injunctions and recalls of our products. Our loss or failure to obtain necessary permits and registrations could delay or prevent us from meeting customer demand, introducing new products, or implementing our growth plan.
Our operations are also subject to extensive regulations administered by the Environmental Protection Agency, which, among other things, pertain to the discharge of materials into the environment and the handling and disposition of wastes. Failure to comply with these regulations can have serious consequences, including civil and administrative penalties and negative publicity. Future discovery of contamination of property underlying or in the vicinity of our present or former facilities could require us to incur additional expenses. Any of these events could adversely affect our financial results.
In addition to the risk of regulatory enforcement actions, we are subject to risk of private legal claims arising out of our or our employees' failure or alleged failure to comply with applicable laws and regulations, including claims such as those described in "Part II, Item 8, Notes to Consolidated Financial Statements, Note 12 - Commitments and Contingencies" of this report. Trends in litigation may include class actions by consumers, shareholders, employees or injured persons, and claims relating to commercial, labor, employment, antitrust, securities or environmental matters.
Although we believe we have implemented strict compliance programs and policies, along with effective internal controls to guard against intentional and unintentional violations of law by our personnel, contractors and agents, we cannot assure you that such persons will not violate our policies or the law, or be alleged to have done so. Our failure to maintain effective control processes or to strictly enforce our policies may prevent us from detecting and preventing violations of law. Defending regulatory enforcement actions and private litigation may be costly, and any adverse outcomes of actions or litigation against us could materially and adversely affect our reputation, results of operation and financial condition.
We are, and in the future may become, involved in legal proceedings related to our alleged violations of antitrust, securities fraud, and unfair competition and false advertising laws and, as a result, may incur substantial costs in connection with those proceedings.
We are involved in the legal proceedings that are described in detail in "Part II, Item 8, Notes to Consolidated Financial Statements, Note 12 - Commitments and Contingencies." In general, those proceedings involve class actions and/or individual actions against us concerning:
•allegations that we and other poultry producers conspired to fix the price of broiler chickens in violation of state and federal antitrust laws, federal and state RICO laws, and other state laws;
•allegations that we and other poultry producers unlawfully conspired to suppress the compensation of broiler growers below competitive levels and to not solicit or hire broiler growers providing services for other poultry producers;
•allegations that we and other poultry producers unlawfully conspired to fix and depress the compensation paid to certain broiler chicken processing plant employees; and
•allegations that we are violating California unfair competition and false advertising laws by, among other things, representing that our poultry products are “100% Natural” and that our chickens were raised in “natural” conditions.
Additionally, we are complying with a grand jury subpoena from the United States Department of Justice, Antitrust Division, and a civil investigative demand from the Attorney General of the State of Washington, in each case related to the antitrust litigation mentioned above, and a civil investigative demand from the Attorney General of the State of Florida related to the Georgia Dock price index for poultry products. We have also received a demand from a putative shareholder that we take action against current and former officers and directors for alleged breaches of their fiduciary duties related to the antitrust and securities fraud allegations described above.
An adverse resolution of any proceedings related to the matters summarized above and described in more detail in "Part II, Item 8, Notes to Consolidated Financial Statements, Note 12 - Commitments and Contingencies" could subject us to significant monetary damages and other penalties, which could have a material adverse effect on our results of operations, financial condition, and liquidity.
For additional information regarding the nature and status of these and other material legal proceedings, see "Part II, Item 8, Notes to Consolidated Financial Statements, Note 12 - Commitments and Contingencies."
Economic Risk
Weak or unstable national or global economic conditions could negatively impact our business.
Our business may be adversely affected by:
•weak or volatile national or global economic conditions, including inflation;
•unfavorable currency exchange rates and interest rates;
•the lack of availability of credit on reasonable terms;
•restricted access to capital markets;
•changes in consumer spending rates and habits;
•unemployment and underemployment; and
•a tight energy supply and high energy costs.
Our business could be negatively affected if efforts and initiatives of the governments of the United States and other countries to manage and stimulate the economy fail or result in worsening economic conditions. Deteriorating economic conditions could negatively affect consumer demand for protein generally or our products specifically, consumers’ ability to afford our products, consumer habits with respect to how they spend their food dollars, and the cost and availability of raw materials we need.
Disruptions in credit and other financial markets caused by deteriorating or weak national and international economic conditions could, among other things:
•make it more difficult for us, our customers or our growers or prospective growers to obtain financing and credit on reasonable terms;
•cause lenders to change their practice with respect to the industry generally or our company specifically in terms of granting credit extensions and terms;
•impair the financial condition of our customers, suppliers or growers making it difficult for them to meet their obligations and supply raw material; or
•impair the financial condition of our insurers, making it difficult or impossible for them to meet their obligations to us.
Corporate Governance Risks
Our business could be negatively impacted as a result of the actions of activist stockholders and others.
We occasionally receive shareholder proposals and voting recommendations from proxy advisory firms requesting changes to our business operations. Additionally, we are occasionally the target of media campaigns requesting changes to our business operations. Responding to such proposals and campaigns is costly and time-consuming, and may divert the attention of our Board of Directors and senior management from the pursuit of our current business strategies. Additionally, implementing any changes in response could have the effect of increasing our operating costs, and result in capital expenditures to modify our facilities. We cannot assure you that we would be able to pass any such costs onto our customers. Accordingly, such activism could adversely affect our profitability, financial condition and results of operations.
Anti-takeover provisions in our charter and by-laws, as well as certain provisions of Mississippi law, may make it difficult for anyone to acquire us without approval of our board of directors.
Our articles of incorporation and by-laws contain provisions that may discourage attempts to acquire control of our company without the approval of our board of directors. These provisions, among others, include a classified board of directors, advance notification requirements for stockholders to nominate persons for election to the board and to make stockholder proposals, and special stockholder voting requirements. These measures, and any others we may adopt in the future, as well as applicable provisions of Mississippi law, may discourage offers to acquire us and may permit our board of directors to choose not to entertain offers to purchase us, even offers that are at a substantial premium to the market price of our stock. Our stockholders may therefore be deprived of opportunities to profit from a sale of control of our company, and as a result, the marketability and market price of our common stock may be adversely affected.
Item 1B. Unresolved Staff Comments
Not applicable.
Item 2. Properties
The Registrant’s principal properties are as follows:
| | | | | |
| Use | Location (City, State) |
| Poultry processing plant, hatchery and feed mill | Laurel, Mississippi |
| Poultry processing plant, hatchery and feed mill | McComb, Mississippi |
| Poultry processing plant, hatchery and feed mill | Hazlehurst and Gallman, Mississippi |
| Poultry processing plant, hatchery and feed mill | Bryan and Robertson Counties, Texas |
| Poultry processing plant, hatchery and feed mill | Moultrie and Adel, Georgia |
| Poultry processing plant, hatchery and feed mill | Kinston and Lenoir County, North Carolina |
| Poultry processing plant, hatchery and feed mill | Palestine and Freestone County, Texas |
| Poultry processing plant, hatchery and feed mill | Smith County, Lindale and Mineola, Texas |
| Poultry processing plant and hatchery | Waco, Texas |
| Poultry processing plant and hatchery | Lumberton and St. Pauls, North Carolina |
| Poultry processing plant | Hammond, Louisiana |
| Poultry processing plant, hatchery, child care facility and feed mill | Collins, Mississippi |
| Prepared chicken plant | Flowood, Mississippi |
| Corporate general offices and technical laboratory | Laurel, Mississippi |
There are no material encumbrances on the major operating facilities owned by the Registrant, except that, under the terms of the Company’s revolving credit agreement, the Registrant may not pledge any additional assets as collateral other than fixed assets not to exceed $5.0 million at any one time.
Management believes that the Company’s facilities are suitable for its current purposes, and believes that current renovations and expansions will enhance present operations and allow for future internal growth.
Item 3. Legal Proceedings
For information regarding our legal proceedings, refer to "Litigation" within "Part II, Item 8, Notes to Consolidated Financial Statements, Note 12 - Commitments and Contingencies," which is incorporated herein by reference.
Item 4. Mine Safety Disclosures
Not Applicable
Item 4A. Executive Officers of the Registrant
| | | | | | | | | | | | | | | | | | | | |
| Name | Age | | Office | | Executive
Officer Since | |
| Joe F. Sanderson, Jr. | 73 | | Chairman of the Board of Directors and Chief Executive Officer | | 1984 | (1) |
| Lampkin Butts | 69 | | President and Chief Operating Officer, Director | | 1996 | (2) |
| Mike Cockrell | 63 | | Treasurer, Chief Financial Officer and Chief Legal Officer, Director | | 1993 | (3) |
| Tim Rigney | 56 | | Secretary and Chief Accounting Officer | | 2012 | (4) |
_________________
(1)Joe F. Sanderson, Jr. has served as Chief Executive Officer of the Registrant since November 1, 1989, and as Chairman of the Board since January 8, 1998. Mr. Sanderson served as President from November 1, 1989, to October 21, 2004. From January 1984 to November 1989, Mr. Sanderson served as Vice-President, Processing and Marketing of the Registrant.
(2)Lampkin Butts was elected President and Chief Operating Officer of the Registrant effective October 21, 2004. From November 1, 1996, to October 21, 2004, Mr. Butts served as Vice President — Sales and was elected to the Board of Directors on February 19, 1998. Prior to that time, Mr. Butts served the Registrant in various capacities since 1973.
(3)Mike Cockrell became Treasurer and Chief Financial Officer of the Registrant effective November 1, 1993, and was elected to the Board of Directors on February 19, 1998. Prior to that time, for more than five years, Mr. Cockrell was a member and shareholder of the Jackson, Mississippi law firm of Wise Carter Child & Caraway, Professional Association.
(4)Tim Rigney became Secretary of the Registrant effective November 1, 2012. Mr. Rigney also began service as Chief Accounting Officer on that date. Prior to that time, Mr. Rigney served the Registrant in various capacities since 1990.
The Company entered into employment agreements with Messrs. Sanderson, Butts and Cockrell dated as of September 15, 2009. Each of these agreements was amended and restated on November 1, 2015. The term of the agreements ends when the officers' employment terminates under the provisions of the agreement. The agreements provide for severance payments to be paid to the officers if their employment is terminated in certain circumstances, as well as provisions prohibiting them from engaging in certain competitive activity with the Company during their employment and for the two years after their employment with the Company terminates for any reason other than poor performance.
PART II
Item 5. Market for the Registrant’s Common Equity, Related Stockholder Matters and Issuer Purchases of Equity Securities.
The Company’s common stock is traded on the NASDAQ Stock Market LLC under the symbol SAFM.
The number of stockholders of record as of December 10, 2020, was 2,608. The number of beneficial owners of our stock is greater than the number of holders of record, and the exact number is unknown.
The amount of future common stock dividends will depend on our earnings, financial condition, capital requirements, the effect a dividend would have on the Company's compliance with financial covenants and other factors, which will be considered by the Board of Directors on a quarterly basis.
During its fourth fiscal quarter, the Company repurchased shares of its common stock as follows:
| | | | | | | | | | | | | | | | | | | | | | | |
| Period | (a) Total Number of Shares Purchased(1) | | (b) Average Price
Paid per Share | | (c) Total Number of Shares Purchased as Part of Publicly Announced Plans or Programs(2) | | (d) Maximum Number (or Approximate Dollar Value) of Shares that May Yet Be Purchased Under the Plans or Programs(2) (3) |
| Aug. 1 - Aug. 31, 2020 | — | | | $ | — | | | — | | | 2,000,000 | |
| Sep. 1 - Sep. 30, 2020 | 485 | | | $ | 119.24 | | | 485 | | | 2,000,000 | |
| Oct. 1 - Oct. 31, 2020 | 3,559 | | | $ | 127.97 | | | 3,559 | | | 2,000,000 | |
| Total | 4,044 | | | $ | 126.92 | | | 4,044 | | | 2,000,000 | |
1All purchases were made pursuant to the Company's Stock Incentive Plan, as amended and restated on February 13, 2020, under which shares were withheld to satisfy tax withholding obligations.
2On October 22, 2020, the Company’s Board of Directors expanded and extended the share repurchase program originally approved on October 22, 2009, under which the Company was originally authorized to purchase up to one million shares of its common stock and is now authorized to purchase up to two million shares of its common stock in open market transactions or negotiated purchases, subject to market conditions, share price and other considerations. The authorization will expire on October 22, 2023. The Company’s repurchases of vested restricted stock to satisfy tax withholding obligations of its Stock Incentive Plan participants are not made under the general repurchase plan.
3Does not include vested restricted shares that may yet be repurchased under the Stock Incentive Plan as described in Note 1.
Item 6. Selected Financial Data
| | | | | | | | | | | | | | | | | | | | | | | | | | | | | |
| Year Ended October 31, |
| 2020 | | 2019 | | 2018 | | 2017 | | 2016 |
| (In thousands, except per share data) |
| Net sales | $ | 3,564,267 | | | $ | 3,440,258 | | | $ | 3,236,004 | | | $ | 3,342,226 | | | $ | 2,816,057 | |
| Operating income (loss) | (11,594) | | | 67,994 | | | 29,700 | | | 425,239 | | | 294,111 | |
| Net income | 28,274 | | | 53,294 | | | 61,431 | | | 279,745 | | | 188,961 | |
| Basic earnings per share | 1.27 | | | 2.41 | | | 2.70 | | | 12.30 | | | 8.37 | |
| Diluted earnings per share | 1.27 | | | 2.41 | | | 2.70 | | | 12.30 | | | 8.37 | |
| Working capital | 354,028 | | | 365,430 | | | 367,600 | | | 650,817 | | | 465,135 | |
| Total assets | 1,849,031 | | | 1,774,134 | | | 1,659,440 | | | 1,733,243 | | | 1,422,700 | |
| Long-term debt, less current maturities | 25,000 | | | 55,000 | | | — | | | — | | | — | |
| Stockholders’ equity | 1,419,273 | | | 1,417,675 | | | 1,387,893 | | | 1,432,862 | | | 1,190,262 | |
| Cash dividends declared per share | $ | 1.40 | | | $ | 1.28 | | | $ | 1.28 | | | $ | 2.04 | | | $ | 1.90 | |
Various factors affecting the comparability of the information included in the table above are discussed in Management’s Discussion and Analysis of Financial Condition and Results of Operations.
Item 7. Management’s Discussion and Analysis of Financial Condition and Results of Operations
CAUTIONARY STATEMENT REGARDING RISKS AND UNCERTAINTIES THAT MAY AFFECT FUTURE PERFORMANCE
This Annual Report, and other periodic reports filed by the Company under the Securities Exchange Act of 1934, as amended (the "Exchange Act"), and other written or oral statements made by it or on its behalf, may include forward-looking statements within the meaning of the "Safe Harbor" provisions of Section 27A of the Securities Act of 1933, as amended, and Section 21E of the Exchange Act. These forward-looking statements are based on a number of assumptions about future events and are subject to various risks, uncertainties and other factors that may cause actual results to differ materially from the views, beliefs and estimates expressed in such statements. These risks, uncertainties and other factors include, but are not limited to, the risks described in the "Risk Factors" section of this Annual Report, and to the following:
(1)Changes in the market price for the Company’s finished products and feed grains, both of which may fluctuate substantially and exhibit cyclical characteristics typically associated with commodity markets.
(2)Changes in economic and business conditions, monetary and fiscal policies or the amount of growth, stagnation or recession in the global or U.S. economies, any of which may affect the value of inventories, the collectability of accounts receivable or the financial integrity of customers, and the ability of the end user or consumer to afford protein.
(3)Changes in the political or economic climate, trade policies, laws and regulations or the domestic poultry industry of countries to which the Company or other companies in the poultry industry ship product, and other changes that might limit the Company’s or the industry’s access to foreign markets.
(4)Changes in laws, regulations, and other activities in government agencies and similar organizations applicable to the Company and the poultry industry and changes in laws, regulations and other activities in government agencies and similar organizations related to food safety.
(5)Various inventory risks due to changes in market conditions, including, but not limited to, the risk that net realizable values of live and processed poultry inventories might be lower than the cost of such inventories, requiring a downward adjustment to record the value of such inventories at the lower of cost or net realizable value as required by generally accepted accounting principles.
(6)Changes in and effects of competition, which is significant in all markets in which the Company competes, and the effectiveness of marketing and advertising programs. The Company competes with regional and national firms, some of which have greater financial and marketing resources than the Company.
(7)Changes in accounting policies and practices adopted voluntarily by the Company or required to be adopted by accounting principles generally accepted in the United States.
(8)Disease outbreaks affecting the production, performance and/or marketability of the Company’s poultry products, or the contamination of its products.
(9)Changes in the availability and cost of labor and growers.
(10)The loss of any of the Company’s major customers.
(11)Inclement weather that could hurt Company flocks or otherwise adversely affect the Company's operations, or changes in global weather patterns that could affect the supply and price of feed grains.
(12)Failure to respond to changing consumer preferences and negative or competitive media campaigns.
(13)Failure to successfully and efficiently start up and run a new plant or integrate any business the Company might acquire.
(14)Unfavorable results from currently pending litigation and proceedings, or litigation and proceedings that could arise in the future.
(15)Changes resulting from the COVID-19 pandemic, which could exacerbate any of the risks described above, and could include: high absentee rates that have prevented and may continue to prevent the Company from running some of its facilities at full capacity, or could in the future cause facility closures; an inability of contract poultry producers to manage their flocks; supply chain disruptions for feed grains; further changes in customer orders due to shifting consumer patterns; disruptions in logistics and the distribution chain for the Company's products; liquidity challenges; and a continued or worsening decline in global commercial activity, among other unfavorable conditions.
Readers are cautioned not to place undue reliance on forward-looking statements made by or on behalf of Sanderson Farms. Each such statement speaks only as of the day it was made. The Company undertakes no obligation to update or to revise any forward-looking statements. The factors described above cannot be controlled by the Company. When used in this annual report, the words “believes,” “estimates,” “plans,” “expects,” “should,” “outlook,” and “anticipates” and similar expressions as they relate to the Company or its management are intended to identify forward-looking statements. Examples of forward-looking statements include statements about management's beliefs about future growth plans, future earnings, production levels, capital expenditures, grain prices, global economic conditions, supply and demand factors and other industry conditions.
GENERAL
The Company’s poultry operations are fully, vertically-integrated through its control of all functions relative to the production of its chicken products, including hatching egg production, hatching, feed manufacturing, raising chickens to marketable age (“grow-out”), processing and marketing. Consistent with the poultry industry, the Company’s profitability is substantially affected by the market price for its finished products and feed grains, both of which may fluctuate substantially and independent of each other, and exhibit cyclical characteristics typically associated with commodity markets. Other costs, excluding feed grains, related to the profitability of the Company’s poultry operations, including hatching egg production, hatching, growing, and processing cost, are responsive to efficient cost containment programs and management practices. Over the past three fiscal years, these other normal production costs have averaged approximately 61.3% of the Company’s total production costs.
The Company believes that value-added products are subject to less price volatility and generate higher, more consistent profit margin than whole chickens ice-packed and shipped in bulk form. To reduce its exposure to market cycles that have historically characterized commodity chicken market prices, the Company has increasingly concentrated on the production and marketing of value-added product lines with emphasis on product quality, customer service, and brand recognition. However, the Company cannot eliminate its exposure to fluctuations in commodity market prices for chicken since market prices for value-added products also exhibit cycles. The Company adds value to its poultry products by performing one or more processing steps beyond the stage where the whole chicken is first salable as a finished product, such as cutting, deboning, deep chilling, packaging and labeling the product.
The Company’s prepared chicken product line includes approximately 60 institutional and consumer-packaged chicken items that it sells nationally, primarily to distributors and food service establishments. A majority of the prepared chicken items are made to the specifications of food service users.
RECENT DEVELOPMENTS
In the first quarter of fiscal 2019, the Company began initial operations at its new poultry processing complex in and around Tyler, Texas. The completed complex consists of a hatchery, feed mill, processing plant and waste water treatment facility, with the capacity to process 1.3 million chickens per week. The facility steadily increased production throughout fiscal 2019 and 2020 and is currently operating at near-full capacity. During fiscal 2020, the Tyler processing plant processed approximately 376.3 million pounds of dressed poultry meat, as compared to approximately 139.2 million pounds during fiscal 2019.
The Company recently announced the planned reduction of the target live weight for birds at our Hazlehurst, Mississippi plant from a big bird size to a chill-pack retail size for the purpose of meeting shifting demand needs, primarily as a result of the coronavirus pandemic and its effects on consumer patterns. On approximately November 23, 2020, the live birds processed at the Hazlehurst, Mississippi plant reached our target live weight for chill-pack retail customers.
COVID-19
During the second quarter of fiscal 2020, the World Health Organization declared COVID-19 a pandemic. The effects of the pandemic and the related governmental actions to contain the spread of the novel coronavirus have materially affected our business, including our labor force, revenues, expenses, production levels, and senior management's time, among other things.
In late February 2020, we formed a COVID-19 response team of senior managers, including our CEO, President and CFO, to coordinate our Company's response to the pandemic and manage and mitigate related risks. From late February to late September, the team met twice daily to discuss COVID-19 developments affecting our business and the communities in which we operate. Beginning in late September, the team began meeting once daily, rather than twice. Additionally, our Board of Directors has actively overseen our management of the crisis. Between March 13, 2020 and early June, the Board met weekly to receive updates and discuss our response to the pandemic with our executive leadership. In early June, the Board began meeting generally every two weeks, or more frequently if circumstances warranted, and in August, the Board began meeting on an as needed basis. Throughout the pandemic, regardless of meeting frequency, the Board has received weekly materials providing operational and COVID-19-related updates.
Our top priority throughout the crisis has been protecting the health, safety and welfare of our employees. In consultation with infectious disease specialists and epidemiologists, including an infectious disease expert who toured our facilities, we have taken a number of steps to promote health and safety in our operations. We also frequently communicate with state and local officials and health departments regarding our practices. Some of our practices are more stringent than those recommended by the Centers for Disease Control and Prevention. Our practices include, but are not limited to:
•We implemented strict personal and work-related travel and public gathering restrictions for all of our employees, contractors and members of their households.
•At each of our processing plants, we set up on-site medical clinics, which are staffed by third-party medical providers. At these clinics, services including telemedicine visits, flu and coronavirus tests and flu vaccinations are provided at no cost for our employees.
•We are providing information about the novel coronavirus and measures to mitigate the risk of contracting and transmitting the virus on video displays throughout our facilities and on our employee mobile app. We have also provided live training sessions about the virus to our hourly employees. Each of these communications is provided in the languages spoken by our employee population.
•We have created an internal hotline monitored by our nurses at our general corporate offices that employees may call to ask questions or voice concerns about the virus.
•Non-essential visitors may not enter our facilities.
•We are taking the temperature of each person attempting to enter our facilities. Anyone with a temperature of 100°F or higher is denied entry. Employees denied entry are sent home with pay and are asked to contact their healthcare provider.
•Our Company nurses have received specialized training on identifying COVID-19 symptoms. Employees exhibiting symptoms while at work are immediately sent home with pay and are asked to contact a healthcare provider immediately.
•Employees who test positive for COVID-19, those who live in the same household as someone who has tested positive, and those who work in close proximity to an employee who has tested positive are sent home to self-quarantine with pay. The specific quarantine period varies based on individual circumstances and generally ranges from a minimum of 10 days, with clearance from a doctor, for an employee who tests positive, up to 24 days for an employee who lives in the same household as someone who has tested positive.
•We continuously look for commonalities among our employees who test positive, including geographic concentrations in their places of residence, so we can reduce or prevent the spread of the virus in our facilities.
•We sent home for 14 days, with pay, approximately 400 employees who work in our Moultrie, Georgia facility and are residents of a nearby county that experienced a high rate of community infections.
•We are providing and requiring employees, United States Department of Agriculture inspectors and essential visitors to wear face masks and face shields. Anyone on the premises of our processing plants, feed mills, hatcheries and vehicle maintenance shops is required to wear this equipment. Where an employee's job function does not permit him or her to wear a face shield, we require the employee to wear safety glasses. In areas of our
facilities where space allows, we have implemented social distancing measures, and in areas where equipment configurations allow, we have installed physical barriers between work stations. In areas where social distancing or the installation of physical barriers is not achievable, the use of face shields is mandatory. Additionally, we have optimized ventilation throughout our facilities to mitigate the risk of exposure to the virus. We are also providing and requiring employees and essential visitors at our general corporate offices and our laboratory to wear face masks while in common areas and in instances where social distancing is not achievable.
•Our nurses have N95 respirator masks, gowns, gloves and goggles appropriate for contact with potentially infected people.
•We require employees to practice social distancing on breaks and have staggered break times to reduce the number of people in break areas at any one time. We have installed physical partitions in our break rooms to provide barriers between employees and have erected tents outside of our facilities to provide employees with more space during breaks.
•We have installed additional hand sanitizer stations appropriate for use in food processing facilities at all our facilities.
•A third-party sanitation service provider performs an antiviral sanitation process at each of our facilities at least weekly, and we have increased the frequency of cleaning common areas and frequently touched surfaces.
•Salaried employees who are considered to be at high risk for severe illness from COVID-19 are permitted to work from home, provided their job duties allow for remote work.
•In November 2020, we adopted a practice to send home for two weeks, with pay, employees ages 65 or older who work at Company locations at which the number of positive coronavirus cases as a percentage of total employees at that location reaches a certain threshold. This has been triggered at only one location since the practice was adopted, and it affected two employees.
•We have closed our Company-owned childcare facility in Collins, Mississippi until further notice.
•In certain of our facilities that are located in communities that experienced high infection rates, we cooperated with local health authorities or determined on our own to test all our employees at the facility for coronavirus. Employees who tested positive were sent home with pay for the periods described above. To date, we have performed five facility-wide tests resulting in positivity rates per employee tested of 3.3%, 0.5%, 5.8%, 3.3% and 7.3%.
During the COVID-19 pandemic, we have also provided assistance to our employees including, but not limited to, the following:
•As a food producer, we have been designated by the federal government as part of the United States' critical infrastructure with a special responsibility to continue operations. Therefore, from late-March 2020 through mid-September 2020, we paid our hourly employees who worked all of their scheduled hours during a week an attendance bonus equal to $1.00 per hour.
•We enhanced our health plan to provide for 100% coverage of testing and treatment of COVID-19 at no cost to plan participants.
•We provided detailed guidance to our employees on the steps to take to ensure timely receipt of the stimulus payment provided under the Coronavirus Aid, Relief, and Economic Security Act (the "CARES Act").
•We have distributed written materials to our employees in all languages appropriate for our employee population to inform them about COVID-19 risks and encourage good personal hygiene, cleaning and social distancing practices away from work and when carpooling to work to protect themselves and their families.
•We have given our employees free bottles of hand sanitizer which they may refill from supplies at our facilities.
•In appreciation for our employees' dedication and hard work in supporting the nation's food supply, we gave ten pounds of fresh chicken to each hourly employee who worked on Good Friday, ten pounds of fresh chicken to each hourly and salaried employee who worked on the Friday before Mother's Day, ten pounds of fresh chicken to each hourly and salaried employee who worked on the Friday before Father's Day, ten pounds of fresh chicken to each hourly and salaried employee who worked on the Friday before Labor Day, and ten pounds of fresh chicken to each hourly and salaried employee who worked on the Tuesday before Thanksgiving.
•Because demand for the products we produce at our prepared chicken facility significantly decreased during the early stages of the pandemic, we ran fewer shifts at that facility. We assisted our employees at the plant in filing for unemployment benefits due to their reduced work hours.
•On Friday, September 4, 2020, we gave each employee a washable, reusable mask screen-printed with the slogan "Hero at Work." Employees were also able to take additional washable, reusable masks home to their family members.
We have continued to serve our customers and support our communities:
•As a result of the COVID-19 pandemic, most of the nation's restaurants have been forced to operate at significantly reduced capacity or to close completely. As a result, our retail grocery store customers experienced a surge in demand for food to be prepared at home. Because of the significant decrease in demand from our food service customers, during the second quarter we were able to divert approximately 4.3 million head of chickens from our big bird program to be processed at our plants that serve retail grocery store customers. To accomplish this, we increased the number of shifts at our plants that process retail product, and we have not experienced any significant delays or other hindrances in our shipment of products to our retail grocery store customers.
•Since the beginning of the pandemic, we have donated over 1.2 million pounds of chicken to employees, food banks and other relief organizations.
•Since the beginning of the pandemic, we have donated 23,740 N95 and KN95 masks, approximately 20,000 disposable masks and approximately 250 washable, reusable masks to a number of hospitals in need of personal protective equipment for their front-line healthcare workers.
On March 27, 2020, the CARES Act was enacted. The CARES Act affects the Company in several areas including, but not limited to, the following:
•It allows for the deferral of the employer portion of social security payroll tax payments that would have otherwise been paid between the enactment date and December 31, 2020. We are using this provision to increase our available liquidity. As of October 31, 2020, we have deferred approximately $20.7 million that would have been a cash outflow in the absence of the CARES Act, and we currently estimate this provision will result in a total of approximately $26 million of payroll tax payments being deferred, with 50% due during calendar year 2021 and 50% due during calendar year 2022. We intend to remit approximately $20.7 million of the deferred payroll taxes on or before June 15, 2021 and the remaining $5.3 million on or before June 15, 2022, so that we are able to deduct the corresponding payroll tax expenses on our fiscal 2020 and 2021 income tax returns, respectively.
•The Employee Retention Credit, a refundable, wage-related tax credit, was made available to eligible employers. We recognized a $3.5 million benefit, before income taxes, related to this credit during our fourth quarter of fiscal 2020.
•The Tax Cuts and Jobs Act enacted in December 2017 disallowed the carrying back of taxable net operating losses to offset prior years' taxable income. The CARES Act allows us to carry those losses back to offset taxable income recognized during prior years. We elected to use that provision, which provided additional liquidity in the form of an income tax refund of approximately $84.4 million, which we received during our third quarter of fiscal 2020 and subsequently used to reduce the amount of outstanding borrowings under our revolving credit facility. Additionally, during fiscal 2020 we recorded a net discrete income tax benefit of approximately $39.1 million related to the carry-back provisions of the CARES Act. For more information regarding the income tax effects of the CARES Act, refer to "Part II, Item 8, Notes to Consolidated Financial Statements, Note 8 - Income Taxes."
EXECUTIVE OVERVIEW OF RESULTS — 2020
For fiscal 2020, we reported net income of $28.3 million, or $1.27 per share, as compared to net income of $53.3 million, or $2.41 per share, during fiscal 2019. Our financial results for fiscal 2020 were significantly affected by the COVID-19 pandemic. The primary impacts were:
•Orders from food service customers declined dramatically during the second quarter of fiscal 2020 due to widespread closures or significant reductions in operating capacity of restaurants and other venues where food is consumed away from home. During our third and fourth quarters, demand from our largest food service
customers fluctuated from week to week, coinciding with the fluctuating governmental restrictions placed on the restaurant industry. The average weekly volume sold to our largest food service customers during the second half of fiscal 2020 ranged from approximately 68% to 97% of levels seen before the pandemic. The impact of fluctuating demand is evidenced by the Urner Barry quote for jumbo boneless breast meat. In mid-May, the quoted price reached $1.58 per pound before falling to $0.97 per pound in mid-June and recovering to $1.19 per pound by August 5, 2020. The quoted price fell to $0.86 per pound by October 5, 2020 and has now recovered to $0.96 per pound as of December 16, 2020.
•The Company announced during its second fiscal quarter that, in response to reduced demand from food service customers caused by the COVID-19 pandemic, it would reduce production at plants processing a larger bird for food service customers. The Company processed 4.8 billion pounds of dressed poultry during fiscal 2020, up 4.9% from the 4.6 billion pounds processed during fiscal 2019. The increase reflects additional production at the Company's new Tyler, Texas facility, partially offset by the COVID-19 production cuts. The 4.8 billion pounds processed during fiscal 2020 is approximately 122.9 million, or 2.5%, fewer pounds than we estimated we would produce prior to the pandemic's effects being known.
•The demand shift to food prepared at home caused demand from our retail grocery store customers to surge during the early stages of the pandemic, and that demand remains strong as a result of the reduced options available for dining away from home.
•Demand for our products from our traditional export partners was soft following the onset of the pandemic. Many countries to which we export our products faced myriad issues ranging from lack of liquidity to logistical challenges as a result of COVID-19. These challenges created volatility in most export markets, although demand and pricing for chicken paws sold to China remained strong. Demand from China for chicken product other than paws was strong during our second quarter of fiscal 2020 due in part to the country's protein deficit caused by African swine fever; however, China now has ample supplies of chicken products stored in freezers, and demand for products other than paws has slowed considerably.
•Our top priority throughout the crisis has been protecting the health, safety and welfare of our employees. As a result, fiscal 2020 includes approximately $36.4 million in direct COVID-19 costs for payroll expenses for employees who were quarantined, payroll expenses for attendance bonuses paid to hourly employees, and items and services related to workplace safety, including personal protective equipment, thermometers, barriers and other social-distancing measures, professional cleaning, on-site medical clinics, and additional nursing staff, among other things.
•As discussed above, the CARES Act, which was enacted in March as a result of the pandemic, provided additional liquidity for the Company in the form of an income tax refund of approximately $84.4 million, which we received during our third quarter of fiscal 2020 and subsequently used to reduce the amount of outstanding borrowings under our revolving credit facility. Additionally, during fiscal 2020 we recorded a net discrete income tax benefit of approximately $39.1 million related to the taxable net operating loss carry-back provisions of the CARES Act.
Our higher average cost of goods sold during fiscal 2020 as compared to fiscal 2019 reflects a 5.8% increase in non-feed related costs, details of which are described in the "Results of Operations - 2020" section below, partially offset by a 3.4% decrease in feed costs per pound of chicken processed. When combined, the average cash prices paid by the Company for corn and soybean meal were lower during fiscal 2020 as compared to fiscal 2019, which resulted in the lower feed costs per pound of chicken processed. Unfavorable growing conditions and weather events in certain areas of the United States during the late summer and fall of 2020 caused the USDA to lower its estimate of corn and soybean production in the United States. As a result, current quoted market prices for feed grains are significantly higher than prices paid by the Company during fiscal 2020. The Company has priced approximately one week's supply of its January 2021 soybean meal needs, but has not priced any other grain needs past December 31, 2020. Had we priced our remaining fiscal 2021 needs at December 16, 2020 cash market prices quoted on the Chicago Board of Trade, the Company estimates our costs of feed grains based on fiscal 2020 volumes would be approximately $193.2 million higher during fiscal 2021 as compared to fiscal 2020.
The outbreak of African swine fever in China in 2019 reduced the worldwide supply of pork, which was expected to create a worldwide protein deficit. However, the COVID-19 pandemic has reduced demand for protein around the world. In November 2019, during our first quarter of fiscal 2020, China lifted its nearly five-year ban on the import of United States poultry, and we resumed shipments to China almost immediately. During fiscal 2020, we sold approximately 50.7 million pounds of chicken paws to customers who resold the product in China. When the ban was in place, we would have rendered
the chicken paws for significantly lower returns. Demand from China for products other than chicken paws softened considerably during the second half of fiscal 2020 as cold storage inventories were rebuilt and consumers in China have been slow to return to restaurants in the same numbers as before the COVID-19 outbreak.
Looking ahead to fiscal 2021, it currently appears that our overall cost structure will be higher than in fiscal 2020, primarily because of higher grain prices. We believe that demand for our products from retail grocery store customers will continue to be strong as consumers continue to prepare more food at home than prior to the pandemic. We believe this trend will continue to some extent because we expect, among other factors:
•people will continue to work from home in higher numbers than before the pandemic;
•some restaurants will remain closed, there will be reduced capacity at open restaurants due to social distancing restrictions and some consumers will continue to choose not to dine in restaurants for safety reasons; and
•consumers will have lower levels of disposable income due to unemployment and other financial constraints caused by the pandemic.
We also believe that market prices and demand for the products we produce at our plants that serve food service customers will continue to be volatile as our customers and the food service industry as a whole continue to navigate the effects of the pandemic and the related openings and closings of restaurants and other venues where food is consumed away from home.
While demand for our retail grocery products is currently favorable and demand from our food service customers remains volatile, it is uncertain how long these conditions will persist. How long current conditions will last and the future effect of the pandemic on our business will depend on many factors, including:
•the timing of the development of effective COVID-19 vaccines and the subsequent mass production and distribution of those vaccines;
•the duration of the current resurgences in COVID-19 infections, which makes people fearful of dining out and has caused state, local and foreign governments to reimpose stay-at-home restrictions, as well as varying restrictions on restaurants;
•the ability of restaurants to survive financially in depressed business conditions, and the extent to which the volume of food sold by restaurants is affected by required social distancing measures that reduce the number of customers they can serve;
•whether other venues where people eat food away from home, such as sporting events and hotels, resume or increase operations;
•the extent to which unemployment levels and possible recessionary conditions affect the amount of disposable income consumers have to spend on food and how consumers allocate their food dollars;
•with respect to our export sales, the condition of the oil market, the relative strength of foreign currencies versus the U.S. dollar and political uncertainty that could affect trade relations with other countries, especially with China; and
•the effect of the pandemic on our operations, including labor shortages we could experience as a result of infections among our employees.
RESULTS OF OPERATIONS — 2020
Net sales for fiscal 2020 were $3,564.3 million as compared to $3,440.3 million for fiscal 2019, an increase of $124.0 million or 3.6%. Net sales of poultry products for fiscal 2020 and fiscal 2019 were $3,378.6 million and $3,198.2 million, respectively, an increase of $180.4 million or 5.6%. The increase in net sales of poultry products resulted from a 6.0% increase in the pounds of poultry products sold, partially offset by a 0.4% decrease in the average sales price of poultry products sold. During fiscal 2020, the Company sold 4,805.3 million pounds of poultry products, up from 4,531.6 million pounds during fiscal 2019. The additional pounds of poultry products sold primarily resulted from a 5.4% increase in the number of chickens sold, partially offset by a decrease in average bird weights of 0.9%. The new Tyler, Texas processing facility, which began initial operations during the first quarter of fiscal 2019, processed approximately 60.5 million head during fiscal 2020, or approximately 9.2% of the total head processed by the Company during the period, and sold approximately 388.0 million pounds of poultry products during fiscal 2020, or approximately 8.1% of the total poultry
pounds sold by the Company during the period. By comparison, the Tyler, Texas processing facility processed approximately 22.3 million head during fiscal 2019, or approximately 3.6% of the total head processed by the Company during the period, and sold approximately 147.9 million pounds of poultry products during fiscal 2019, or approximately 3.3% of the total poultry pounds sold by the Company during the period.
Overall, market prices for poultry products decreased during fiscal 2020 as compared to fiscal 2019. Urner Barry average market prices for bulk leg quarters, boneless thigh meat, tenders, jumbo wings and boneless breast meat decreased during fiscal 2020 compared to fiscal 2019 by 20.6%, 19.3%, 14.9%, 6.6% and 4.3%, respectively. The Company's average realized prices for chicken products sold to retail grocery store customers, when factoring in both price and improved product mix, increased by 1.1% during fiscal 2020 as compared to fiscal 2019 and continue to reflect strong demand.
Net sales of prepared chicken products during fiscal 2020 and 2019 were $185.6 million and $242.1 million, respectively, a decrease of 23.3%, resulting from a 24.0% decrease in the pounds of prepared chicken products sold, partially offset by a 0.9% increase in the average sales price of prepared chicken products sold. During fiscal 2020, the Company sold 98.8 million pounds of prepared chicken products, down from 129.9 million pounds sold during fiscal 2019. The decrease in pounds of prepared chicken products sold resulted from the decrease in demand from our food service customers due to the COVID-19 pandemic, as described above.
Cost of sales for fiscal 2020 was $3,370.1 million as compared to $3,158.3 million during fiscal 2019, an increase of $211.8 million, or 6.7%. Cost of sales of poultry products during fiscal 2020 and fiscal 2019 were $3,195.3 million and $2,935.4 million, respectively, which represents a 2.7% increase in the average cost of sales of poultry products. As illustrated in the table below, which for comparative purposes includes poultry products sold to the Company's prepared chicken plant, the increase resulted primarily from a $0.0234 per pound increase, or 5.8%, in other costs of sales of poultry products, partially offset by a decrease in the cost of feed per pound of broilers processed of $0.0087, or 3.4%.
Poultry Cost of Sales
(In thousands, except per pound data)
| | | | | | | | | | | | | | | | | | | | | | | | | | | | | | | | | | | |
| | Fiscal Year 2020 | | Fiscal Year 2019 | | Incr/(Decr) |
| Description | Dollars | | Per lb. | | Dollars | | Per lb. | | Dollars | | Per lb. |
| Beginning Inventory | $ | 35,121 | | | $ | 0.3868 | | | $ | 30,973 | | | $ | 0.3686 | | | $ | 4,148 | | | $ | 0.0182 | |
| Feed in broilers processed | 1,181,456 | | | 0.2443 | | | 1,167,953 | | | 0.2530 | | | 13,503 | | | (0.0087) | |
| | | | | | | | | | | |
| All other cost of sales | 2,065,935 | | | 0.4272 | | | 1,864,516 | | | 0.4038 | | | 201,419 | | | 0.0234 | |
| Reversal of prior-period inventory write-down | (2,800) | | | (0.0006) | | | (9,600) | | | (0.0021) | | | 6,800 | | | 0.0015 | |
| | | | | | | | | | | |
| | | | | | | | | | | |
| Less: Ending Inventory | 32,952 | | | 0.4701 | | | 35,121 | | | 0.3868 | | | (2,169) | | | 0.0833 | |
| Total poultry cost of sales | $ | 3,246,760 | | (1) | $ | 0.6684 | | | $ | 3,018,721 | | (1) | $ | 0.6548 | | | $ | 228,039 | | | $ | 0.0136 | |
| | | | | | | | | | | |
| Pounds: | | | | | | | | | | | |
| Beginning Inventory | 90,805 | | | | | 84,020 | | | | | | | |
| | | | | | | | | | | |
| | | | | | | | | | | |
| Poultry processed/other | 4,836,514 | | | | | 4,617,065 | | | | | | | |
| Poultry sold | 4,857,215 | | (1) | | | 4,610,280 | | (1) | | | | | |
| Ending Inventory | 70,103 | | | | | 90,805 | | | | | | | |
Note (1) - For comparative purposes, includes the costs and pounds of product sold to the Company's prepared chicken plant.
Other costs of sales of poultry products consist primarily of labor, packaging, freight, maintenance and repairs, utilities, antimicrobial interventions, contract grower pay, chick costs and certain fixed costs. These non-feed related costs of poultry products sold increased by $0.0234 per pound processed, or 5.8%, during fiscal 2020 as compared to fiscal 2019. Part of this increase is attributable to inefficiencies at the Company's new Tyler, Texas facilities, which began initial operations during the last month of the first quarter of fiscal 2019. A new facility's other costs of sales per pound processed will be higher compared to similar complexes until the new complex reaches full capacity. Excluding the Tyler facilities, other costs of sales would have increased by $0.0212 per pound processed, or 5.4%. This increase is primarily attributable to higher labor and certain fixed costs, as well as expenses incurred in response to the COVID-19 pandemic, and is partially offset by lower freight costs. The COVID-19-related expenses included in other costs of sales during fiscal 2020 total approximately $23.7
million, and include payroll expenses for employees who are quarantined, payroll expenses for attendance bonuses paid to hourly employees, and expenses related to various items and services including personal protective equipment, thermometers, barriers and other social-distancing measures and additional nursing staff to protect the health and safety of our employees. Excluding the COVID-19-related expenses not attributable to our Tyler facilities, other costs of sales, excluding Tyler facilities, increased by $0.0165 per pound processed, or 4.2%.
During fiscal 2020, costs of sales of the Company’s prepared chicken products were $174.8 million as compared to $222.9 million during fiscal 2019, a decrease of $48.1 million, or 21.6%. This decrease was primarily attributable to a 24.0% decrease in the pounds of prepared chicken sold, which is the result of reduced demand for prepared chicken products from our food service customers due to the COVID-19 pandemic.
The Company recorded the value of live broiler inventories on hand at October 31, 2020 at cost. In periods where the Company estimates that the cost to grow live birds in inventory to a marketable age and then process and distribute those birds will be lower in the aggregate than the anticipated sales proceeds, the Company values the broiler inventories on hand at cost and accumulates costs as the birds are grown to a marketable age subsequent to the balance sheet date. In periods where the Company estimates that the cost to grow live birds in inventory to a marketable age and then process and distribute those birds will be higher in the aggregate than the anticipated sales proceeds, the Company will make an adjustment to lower the value of live birds in inventory to the net realizable value. The Company recorded a charge of $2.8 million at October 31, 2019 to reduce the value of live broiler inventories on hand from cost to net realizable value.
Selling, general and administrative ("SG&A") costs during fiscal 2020 were $205.8 million, a decrease of $5.4 million compared to the $211.1 million during fiscal 2019. The following table shows the components of SG&A costs for the twelve months ended October 31, 2020 and 2019.
Selling, General and Administrative Costs
(in thousands)
| | | | | | | | | | | | | | | | | |
| Description | Twelve months ended October 31, 2020 | | Twelve months ended October 31, 2019 | | Increase/(Decrease) |
| Start-up expense (Tyler, Texas complex) | $ | — | | | $ | 9,361 | | | $ | (9,361) | |
| Trainee expense | 12,078 | | | 16,254 | | | (4,176) | |
| Employee Stock Ownership Plan ("ESOP") expense | — | | | 3,000 | | | (3,000) | |
| Stock compensation expense | 8,930 | | | 11,786 | | | (2,856) | |
| Sanderson Farms Championship expense | 8,294 | | | 8,817 | | | (523) | |
| Advertising expense | 10,748 | | | 11,071 | | | (323) | |
| Legal expense | 26,146 | | | 25,102 | | | 1,044 | |
| Broker commissions | 12,897 | | | 10,922 | | | 1,975 | |
| Administrative salaries | 48,260 | | | 45,108 | | | 3,152 | |
| COVID-19-related expense | 12,706 | | | — | | | 12,706 | |
| All other SG&A | 65,691 | | | 69,720 | | | (4,029) | |
| Total SG&A | $ | 205,750 | | | $ | 211,141 | | | $ | (5,391) | |
Regarding the table above, the change in start-up expense in any particular period relates to the stage of the start-up process in which a facility under construction is in during the period. Non-construction related expenses, such as labor, training and office-related expenses for a facility under construction are recorded as start-up expense until the facility begins operations. As a facility moves closer to start-up, the expenses incurred for labor, training, etc. increase. As a result, amounts classified as start-up expenses will increase period over period until the facility begins production. Once production begins, the expenses from that point forward are recorded as costs of goods sold. The decrease in trainee expense is primarily the result of a reduction in the number of trainee positions filled. The decrease in ESOP expense, payout of which is based on profitability, is the result of fiscal 2020 earnings being less than fiscal 2019 earnings. The decrease in stock compensation expense is primarily the result of lower accruals related to the outstanding performance share agreements described in "Part II, Item 8, Notes to Consolidated Financial Statements, Note 11 - Stock Compensation Plans" of this Form 10-K. The increase in COVID-19-related expense is the result of direct expenses for items and services related to the health, safety and welfare of our employees during the COVID-19 pandemic.
The Company’s operating loss during fiscal 2020 was $11.6 million as compared to an operating income during fiscal 2019 of $68.0 million. The decrease resulted primarily from lower average selling prices and higher average costs of goods sold, primarily attributable to the COVID-19 pandemic.
The Company recognized interest income of $0.5 million during fiscal 2020, as compared to no interest income during fiscal 2019. Interest expense during fiscal 2020 and fiscal 2019 was $5.2 million and $4.2 million, respectively. The increase in interest expense during fiscal 2020, as compared to fiscal 2019, is the result of the Company's higher outstanding debt levels during fiscal 2020, partially offset by lower average interest rates.
The Company’s effective tax rate for fiscal 2020 was 273.3% as compared to 16.5% for fiscal 2019. During fiscal 2020, the Company recorded a net discrete income tax benefit of approximately $39.1 million related to the carry-back provisions allowed by the CARES Act, in addition to other smaller discrete items. Excluding the effects of discrete items recognized during fiscal 2020, primarily related to the CARES Act, the Company's effective tax rate would have been approximately 21.3%, as compared to an effective tax rate in fiscal 2019, exclusive of discrete items, of approximately 23.6%. The Company’s effective tax rate differs from the statutory federal rate due to discrete items, state income taxes, certain nondeductible expenses for federal income tax purposes and certain state and federal tax credits.
As of October 31, 2020, the Company's long-term deferred income tax liability was $141.7 million as compared to $74.1 million at October 31, 2019, an increase of $67.6 million. The increase is primarily attributable to the carry-back provisions discussed above, as well as bonus depreciation taken on qualifying assets placed in service during fiscal 2020.
The Company’s net income during fiscal 2020 was $28.3 million, or $1.27 per share, as compared to net income during fiscal 2019 of $53.3 million or $2.41 per share. The decrease in net income for fiscal 2020 as compared to fiscal 2019 is primarily attributable to lower average selling prices and higher average costs of goods sold, partially offset by the income tax benefits recognized as a result of the CARES Act. Details related to each of the aforementioned drivers of the change in net income have been discussed above.
EXECUTIVE OVERVIEW OF RESULTS — 2019
The Company's volume of poultry products sold increased 2.0% in fiscal 2019 compared to fiscal 2018, as the Company began processing chickens at its new Tyler, Texas poultry complex in early calendar 2019. As of the end of fiscal 2019, the complex was operating at seventy-five percent capacity. Average operating margins per pound of poultry products sold improved slightly during fiscal 2019, as compared to fiscal 2018, as the average sales price of poultry products sold increased by 3.5% and feed-related costs remained relatively flat. However, similar to fiscal 2018, the Company's financial results for the year ended October 31, 2019 reflect relatively weak market prices for boneless, skinless breast meat produced at the Company's plants that process a larger bird for food service customers. In addition, the Company's non-feed related cost of sales increased $0.0272 per pound and was negatively impacted by inefficiencies at the Tyler, Texas complex, as that complex ramped up toward full production, and inefficiencies at other plants that experienced planned down time to replace and upgrade equipment. The impact of these factors is discussed in more detail in the "Results of Operations" section below.
The average feed cost in broiler flocks processed was lower by 0.5% in fiscal 2019, as compared to fiscal 2018, which resulted primarily from combined lower prices paid for feed grains and improved broiler performance.
RESULTS OF OPERATIONS — 2019
Net sales for fiscal 2019 were $3,440.3 million as compared to $3,236.0 million for fiscal 2018, an increase of $204.3 million or 6.3%. Net sales of poultry products for fiscal 2019 and fiscal 2018 were $3,198.2 million and $3,028.5 million, respectively, an increase of $169.7 million or 5.6%. The increase in net sales of poultry products resulted from a 3.5% increase in the average sales price of poultry products sold and a 2.0% increase in the pounds of poultry products sold. During fiscal 2019, the Company sold 4,531.6 million pounds of poultry products, up from 4,443.4 million pounds during fiscal 2018. The additional pounds of poultry products sold primarily resulted from a 2.8% increase in the number of chickens sold and an increase in average bird weights of 1.2%. The new Tyler, Texas processing facility, which began initial operations during the first quarter of fiscal 2019, processed approximately 22.3 million head during fiscal 2019, or approximately 3.6% of the total head processed by the Company during the period, and sold approximately 147.9 million pounds of poultry products during fiscal 2019, or approximately 3.3% of the total poultry pounds sold by the Company during the period. Overall, market prices for poultry products increased during fiscal 2019 as compared to fiscal 2018. Urner
Barry average market prices for jumbo wings, tenders, boneless thigh meat and bulk leg quarters increased during fiscal 2019 compared to fiscal 2018 by 19.9%, 5.7%, 4.5% and 1.3%, respectively, and boneless breast meat prices decreased during fiscal 2019 compared to fiscal 2018 by 3.4%. The Company's average selling prices for chicken products sold to retail grocery store customers decreased slightly during fiscal 2019 as compared to fiscal 2018, but continued to reflect good demand. Net sales of prepared chicken products during fiscal 2019 and 2018 were $242.1 million and $207.5 million, respectively, an increase of 16.6%, resulting from a 22.6% increase in the pounds of prepared chicken products sold, partially offset by a 4.9% decrease in the average sales price of prepared chicken products sold. During fiscal 2019, the Company sold 129.9 million pounds of prepared chicken products, up from 106.0 million pounds sold during fiscal 2018.
Cost of sales for fiscal 2019 was $3,158.3 million as compared to $2,974.7 million during fiscal 2018, an increase of $183.6 million, or 6.2%. Excluding poultry products sold to the Company's prepared chicken plant, cost of sales of poultry products sold during fiscal 2019 and fiscal 2018 were $2,935.4 million and $2,784.7 million, respectively, which represents a 3.3% increase in the average cost of sales of poultry products. As illustrated in the table below, which for comparative purposes includes poultry products sold to the Company's prepared chicken plant, and excludes poultry products processed and sold under our agreement with House of Raeford Farms as described in "Note (2)," the increase resulted primarily from a $0.0272 per pound increase, or 7.3%, in other costs of sales of poultry products, partially offset by a decrease in the cost of feed per pound of broilers processed of $0.0012, or 0.5%.
Poultry Cost of Sales
(In thousands, except percentages and per pound data)
| | | | | | | | | | | | | | | | | | | | | | | | | | | | | | | | | | | |
| | Fiscal Year 2019 | | Fiscal Year 2018 | | Incr/(Decr) |
| Description | Dollars | | Per lb. | | Dollars | | Per lb. | | Dollars | | Per lb. |
| Beginning inventory | $ | 30,973 | | | $ | 0.3686 | | | $ | 37,769 | | | $ | 0.4437 | | | $ | (6,796) | | | $ | (0.0751) | |
| Feed in broilers processed | 1,167,953 | | | 0.2530 | | | 1,141,866 | | | 0.2549 | | | 26,087 | | | (0.0019) | |
| | | | | | | | | | | |
| All other cost of sales | 1,864,516 | | | 0.4038 | | | 1,682,657 | | | 0.3756 | | | 181,859 | | | 0.0282 | |
| Reversal of prior-period inventory write-down | (9,600) | | | (0.0021) | | | — | | | — | | | (9,600) | | | (0.0021) | |
| | | | | | | | | | | |
| | | | | | | | | | | |
| Less: Ending inventory | 35,121 | | | 0.3868 | | | 30,973 | | | 0.3686 | | | 4,148 | | | 0.0182 | |
| Total poultry cost of sales | $ | 3,018,721 | | (1) | $ | 0.6548 | | | $ | 2,831,319 | | (1)(2) | $ | 0.6318 | | | $ | 187,402 | | | $ | 0.0230 | |
| | | | | | | | | | | |
| Pounds: | | | | | | | | | | | |
| Beginning inventory | 84,020 | | | | | 85,120 | | | | | | | |
| | | | | | | | | | | |
| | | | | | | | | | | |
| Poultry processed/other | 4,617,065 | | | | | 4,480,359 | | (2) | | | | | |
| Poultry sold | 4,610,280 | | (1) | | | 4,481,459 | | (1)(2) | | | | | |
| Ending Inventory | 90,805 | | | | | 84,020 | | | | | | | |
Note (1) - For comparative purposes, includes the costs and pounds of product sold to the Company's prepared chicken plant.
Note (2) - On April 17, 2017, the Company announced that it had agreed to process chickens grown by House of Raeford Farms at the Company's processing facility located in St. Pauls, North Carolina. House of Raeford Farms, a private company headquartered in Rose Hill, North Carolina, operates poultry grow-out operations and processing facilities in four southeastern states. The House of Raeford Farms Teachey, North Carolina, facility was severely damaged by a fire in late February 2017. Under the terms of the agreement, the Company purchased, processed and sold chickens grown by House of Raeford Farms through mid-December 2017. During fiscal 2018, the Company processed and sold approximately 14.2 million pounds as a result of this agreement. For comparative purposes, those pounds and the associated direct and indirect costs have been excluded from the fiscal 2018 data set forth in this table.
Other costs of sales of poultry products consist primarily of labor, packaging, freight, maintenance and repairs, utilities, antimicrobial interventions, contract grower pay, chick costs and certain fixed costs. These non-feed related costs of poultry products sold increased by $0.0282 per pound processed, or 7.5%, during fiscal 2019 as compared to fiscal 2018. Part of this increase is attributable to inefficiencies at the Company's new Tyler, Texas facilities, which began initial operations during January 2019. A new facility's other costs of sales per pound processed will be higher compared to similar complexes until reaching full capacity. Excluding the Tyler facilities other costs of sales would have increased by $0.0190 per pound
processed, or 5.1%. This increase is primarily attributable to higher labor and antimicrobial intervention expenses, in addition to higher recognized freight expenses. The increase in amounts recognized as freight expense is attributable to the Company's adoption of Accounting Standards Update ("ASU") 2014-09, Revenue from Contracts with Customers. While adoption of the standard had no effect on the Company's net income during fiscal 2019, freight expense was negatively impacted during the period, and that negative impact to freight expense was offset by a corresponding increase to revenue. For more information regarding the Company's adoption of ASU 2014-09 in relation to freight expense, refer to "Part II, Item 8, Notes to Consolidated Financial Statements, Note 1 - Significant Accounting Policies."
During fiscal 2019, costs of sales of the Company’s prepared chicken products were $222.9 million as compared to $190.0 million during fiscal 2018, an increase of $32.9 million, or 17.3%, primarily attributable to a 22.6% increase in the pounds of prepared chicken products sold.
The Company recorded a charge of $2.8 million to reduce the value of live broiler inventories on hand at October 31, 2019 from cost to net realizable value. In periods where the Company estimates that the cost to grow live birds in inventory to a marketable age and then process and distribute those birds will be lower in the aggregate than the anticipated sales proceeds, the Company values the broiler inventories on hand at cost and accumulates costs as the birds are grown to a marketable age subsequent to the balance sheet date. In periods where the Company estimates that the cost to grow live birds in inventory to a marketable age and then process and distribute those birds will be higher in the aggregate than the anticipated sales proceeds, the Company will make an adjustment to lower the value of live birds in inventory to the net realizable value. The Company recorded a charge of $9.6 million at October 31, 2018 to reduce the value of live broiler inventories on hand from cost to net realizable value.
SG&A costs during fiscal 2019 were $211.1 million, a decrease of $10.8 million compared to the $222.0 million of SG&A costs during fiscal 2018. The following table shows the components of SG&A costs for the twelve months ended October 31, 2019 and 2018.
Selling, General and Administrative Costs
(in thousands)
| | | | | | | | | | | | | | | | | |
| Description | Twelve months ended October 31, 2019 | | Twelve months ended October 31, 2018 | | Increase/(Decrease) |
| Advertising expense | $ | 11,071 | | | $ | 32,624 | | | $ | (21,553) | |
| Trainee expense | 16,254 | | | 21,553 | | | (5,299) | |
| Start-up expense (Tyler, Texas complex) | 9,361 | | | 13,394 | | | (4,033) | |
| Stock compensation expense | 11,786 | | | 15,702 | | | (3,916) | |
| Employee Stock Ownership Plan ("ESOP") expense | 3,000 | | | 2,000 | | | 1,000 | |
| Depreciation expense - machinery and equipment | 7,067 | | | 5,801 | | | 1,266 | |
| Sanderson Farms Championship expense | 8,817 | | | 6,325 | | | 2,492 | |
| Administrative salaries | 45,108 | | | 42,288 | | | 2,820 | |
| Legal expense | 25,102 | | | 17,573 | | | 7,529 | |
| Third-party sales commissions | 10,922 | | | — | | | 10,922 | |
| All other SG&A expenses | 62,653 | | | 64,705 | | | (2,052) | |
| Total SG&A | $ | 211,141 | | | $ | 221,965 | | | $ | (10,824) | |
Regarding the table above, the decrease in advertising expense is the result of the Company's decision to scale back its television and radio advertising during fiscal 2019. The change in start-up expense in any particular period relates to the stage of the start-up process in which a facility under construction is in during the period. Non-construction related expenses, such as labor, training and office-related expenses for a facility under construction are recorded as start-up expense until the facility begins operations. As a facility moves closer to actual start-up, the expenses incurred for labor, training, etc. increase. As a result, amounts classified as start-up expenses will increase period over period until the facility begins production. Once production begins, the expenses from that point forward are recorded as costs of goods sold. The decrease in stock compensation expense is the result of the number of shares earned for the performance shares granted on November 1, 2017, being lower as compared to the number of shares earned for the performance shares granted on November 1, 2016. Stock compensation is further described in "Part II, Item 8, Notes to Consolidated Financial Statements, Note 11 - Stock Compensation Plans." The increase in legal expenses is primarily attributable to our ongoing defense of the litigation
described in "Part II, Item 8, Notes to Consolidated Financial Statements, Note 12 - Commitments and Contingencies." The increase in third-party sales commissions is attributable to the Company's adoption of ASU 2014-09, Revenue from Contracts with Customers. While adoption of the standard had no effect on the Company's net income during fiscal 2019, SG&A expenses were negatively impacted during the period, and the negative impact to SG&A expenses was offset by a corresponding increase to revenue. For more information regarding the Company's adoption of ASU 2014-09 and the relation to SG&A expenses, refer to "Part II, Item 8, Notes to Consolidated Financial Statements, Note 1 - Significant Accounting Policies."
The Company’s operating income during fiscal 2019 was $68.0 million as compared to an operating income during fiscal 2018 of $29.7 million. The increase in operating income resulted primarily from higher average selling prices and a 2.5% increase in pounds sold, partially offset by a 3.6% increase in average costs of goods sold.
The Company recorded no interest income during fiscal 2019, as compared to $2.9 million in interest income during fiscal 2018. Interest expense during fiscal 2019 and fiscal 2018 was $4.2 million and $2.1 million, respectively. The decrease in interest income during fiscal 2019, as compared to fiscal 2018, is the result of the Company not having excess cash to invest during fiscal 2019 as it did in fiscal 2018. The increase in interest expense during fiscal 2019, as compared to fiscal 2018, resulted from higher outstanding debt during fiscal 2019, as compared to fiscal 2018.
The Company’s effective tax rate for fiscal 2019 was 16.5% as compared to (101.0)% for fiscal 2018. The Company's effective tax rate differs from the statutory federal rate due to discrete items, state income taxes, certain nondeductible expenses for federal income tax purposes and certain state and federal tax credits. As a result of the Tax Cuts and Jobs Act of 2017 ("TCJA"), which was enacted during the Company's first quarter of fiscal 2018, the Company revalued its deferred taxes using the newly enacted tax, resulting in a $37.5 million discrete income tax benefit recognized during the first quarter of fiscal 2018. During fiscal 2019, the Company recognized an approximately $2.1 million discrete income tax benefit due to certain income tax credits. There were no other material discrete items affecting the comparative periods, with the exception of discrete adjustments related to stock-based compensation. Excluding the effects of discrete items, the Company's effective tax rate for fiscal 2019 and 2018 would have been approximately 23.6% and 33.0%, respectively.
As of October 31, 2019, the Company's long-term deferred income tax liability was $74.1 million as compared to $62.8 million at October 31, 2018, an increase of $11.3 million. The increase is primarily attributable to the Company's decision to take bonus depreciation on qualifying assets placed in service during fiscal 2019.
The Company’s net income during fiscal 2019 was $53.3 million, or $2.41 per share, as compared to net income during fiscal 2018 of $61.4 million or $2.70 per share. The decrease in net income for fiscal 2019 as compared to fiscal 2018 is primarily attributable to a higher effective tax rate and higher average costs of goods sold, partially offset by higher average selling prices and an increase in pounds sold. Details related to each of the aforementioned drivers of the changes in net income have been discussed above.
LIQUIDITY AND CAPITAL RESOURCES
The Company’s working capital, calculated by subtracting current liabilities from current assets, at October 31, 2020, was $354.0 million, and its current ratio, calculated by dividing current assets by current liabilities, was 2.6 to 1. The Company’s working capital and current ratio at October 31, 2019, were $365.4 million and 2.7 to 1, respectively. These measures reflect the Company’s ability to meet its short term obligations and are included here as a measure of the Company’s short term market liquidity. The Company’s principal sources of liquidity available during fiscal 2020 included cash on hand, cash flows from operations, and funds available under the Company’s revolving credit facility. As described below, the Company is a party to a revolving credit facility dated March 21, 2019 with a maximum available borrowing capacity of $1.0 billion. As of October 31, 2020, and December 16, 2020, the Company had borrowed $25.0 million and had approximately $25.2 million outstanding in letters of credit, leaving $949.8 million of borrowing capacity available under the facility.
The Company’s cash position at October 31, 2020 and October 31, 2019, consisted of $49.1 million and $95.4 million, respectively, in cash and cash equivalents. The Company’s ability to invest cash is limited by covenants in its revolving credit agreement to short term investments. All of the Company’s cash at October 31, 2020 and October 31, 2019, was held in bank accounts and highly-liquid investment accounts. There were no restrictions on the Company’s access to its cash, and such cash and cash investments were available to the Company on demand to fund its operations.
Cash flows provided by operating activities during fiscal 2020 and fiscal 2019 were $222.0 million and $206.8 million, respectively. Cash flows from operating activities increased by $15.2 million, resulting primarily from the change in cash received for income taxes in fiscal 2020, as compared to fiscal 2019, partially offset by a decrease in average realized margins in fiscal 2020, compared to fiscal 2019. In fiscal 2020, the Company's net cash receipts from income taxes totaled approximately $83.2 million, as compared to approximately $25.6 million in net cash receipts during fiscal 2019.
Cash flows provided by operating activities during fiscal 2019 and fiscal 2018 were $206.8 million and $131.4 million, respectively. Cash flows from operating activities increased by $75.4 million, resulting from three primary factors. First, during fiscal 2019, the Company realized higher margins due to an increase in average selling prices, as compared to fiscal 2018, which more than offset the increase in average costs of goods sold during the same comparative periods. Secondly, the change in cash bonuses paid by the Company, which totaled approximately $36.0 million during fiscal 2018, as compared to no cash bonuses paid during fiscal 2019, caused cash flows from operating activities to increase. The bonuses paid during fiscal 2018 related to fiscal 2017 performance. Lastly, the change in cash paid or received for income taxes during fiscal 2019, as compared to fiscal 2018, caused an increase in cash flows from operating activities. During fiscal 2019, the Company's net cash receipts from income taxes totaled approximately $25.6 million, as compared to approximately $40.0 million in net cash paid for income taxes during fiscal 2018. Offsetting the increases described above is the additional funding required for inventories, largely attributable to the Company's new Tyler, Texas facilities. During fiscal 2019, inventory levels increased by approximately $49.9 million, as compared to a decrease of approximately $3.1 million during fiscal 2018.
Cash flows used in investing activities during fiscal 2020, 2019 and 2018, were $202.0 million, $248.5 million and $306.7 million, respectively. The Company’s capital expenditures during fiscal 2020 of $202.4 million included approximately $47.9 for multiple large-scale equipment and building upgrades at multiple complexes, approximately $11.4 to purchase new vehicles that in previous years would have been leased and approximately $9.3 million for construction of a new hatchery to replace the hatchery currently in service in Laurel, Mississippi. These vehicles primarily consist of semi-tractors and trailers that are used to haul the Company's live birds and feed. The Company’s capital expenditures during fiscal 2019 were $249.5 million and included approximately $67.1 million related to construction at the Tyler, Texas complex and approximately $9.4 million related to final payments made under purchase agreements for delivery of new aircraft. The Company's capital expenditures during fiscal 2018 were $308.9 million and included approximately $156.5 million related to construction at the Tyler, Texas complex, $29.3 million related to progress or final payments made under the aircraft purchase agreements and approximately $4.7 million for expansion of the prepared chicken facility in Flowood, Mississippi. Excluding expenditures for the items specifically mentioned above, the Company's capital expenditures for fiscal 2020, 2019 and 2018 were $133.8 million, $173.0 million and $118.4 million, respectively.
Cash flows provided by or (used in) financing activities during fiscal 2020, 2019 and 2018 were $(66.4) million, $15.9 million and $(122.8) million, respectively. During fiscal 2020, the Company reduced the outstanding balance under its revolving credit facility by a net of $30.0 million, purchased shares valued at $6.5 million pursuant to the Company's Stock Incentive Plan, which was amended and restated on February 13, 2020, under which shares were withheld to satisfy tax withholding obligations, and paid approximately $31.1 million in dividends to its shareholders. During fiscal 2019, the Company borrowed a net of $55.0 million under its revolving credit facility, purchased shares valued at $9.4 million pursuant to the Company's Stock Incentive Plan, and paid approximately $28.4 million in dividends to its shareholders. During fiscal 2018, the Company repurchased and canceled 823,385 shares of its common stock in open-market transactions at an average price of $101.37 per share, resulting in a total cash outflow of $83.5 million, and purchased shares valued at $11.7 million pursuant to the Company's Stock Incentive Plan. Additionally, the Company paid approximately $29.0 million in dividends to its shareholders.
As of December 7, 2020, the Company’s fiscal 2021 capital budget is approximately $163.8 million. The Company expects the 2021 capital budget to be funded by cash on hand, internally generated working capital, cash flows from operations and, as needed, borrowings under the Company’s revolving credit facility. The Company had $949.8 million available under the revolving line of credit as of December 16, 2020. The fiscal 2021 capital budget includes an aggregate of approximately $28.5 million for multiple large-scale equipment and building upgrades at multiple complexes, $12.4 million to purchase new vehicles that in previous years would have been leased, and $10.1 million for construction of a new hatchery to replace the hatchery currently in service in Laurel, Mississippi. Excluding the budgeted amounts for the items detailed above, the fiscal 2021 capital budget is approximately $112.8 million. These amounts are estimates and are subject to change as we move through fiscal 2021.
On October 2, 2020, the Company filed a shelf registration statement on Form S-3 to register for possible future sale shares of the Company's common and/or preferred stock. An indeterminate amount of common stock and preferred stock may be offered by the Company in amounts, at prices and on terms to be determined by the board of directors if and when shares are issued. The registration statement became automatically effective upon filing with the SEC on October 2, 2020.
The Company regularly evaluates both internal and external growth opportunities, including acquisition opportunities and the possible construction of new assets, and conducts due diligence activities in connection with such opportunities. The cost and terms of any financing to be raised in conjunction with any growth opportunity, including the Company’s ability to raise debt or equity capital on terms and at costs satisfactory to the Company, and the effect of such opportunities on the Company’s balance sheet, are critical considerations in any such evaluation.
Revolving Credit Facility
The Company is a party to a revolving credit facility dated March 21, 2019, with a maximum available borrowing capacity of $1.0 billion. Under the credit facility, the Company may not exceed a maximum debt to total capitalization ratio of 50%. The Company has a one-time right, at any time during the term of the agreement, to increase the maximum debt to total capitalization ratio then in effect by five percentage points in connection with the construction of a new poultry complex for the four fiscal quarters beginning on the first day of the fiscal quarter during which the Company gives written notice of its intent to exercise this right. The Company has not exercised this right. The facility also sets a minimum net worth requirement that at October 31, 2020, was $1.0 billion. The credit is unsecured and, unless extended, will expire on March 21, 2024. As of October 31, 2020, and December 16, 2020, the Company had borrowed $25.0 million under the facility, and had approximately $25.2 million outstanding in letters of credit, leaving $949.8 million of borrowing capacity available under the facility. For more information about the facility, see Item 1.01 of our Current Report on Form 8-K filed March 27, 2019.
Contractual Obligations
Obligations under long-term debt; non-cancelable operating leases; purchase obligations relating to feed grains, other feed ingredients and packaging supplies; construction contracts and claims payable relating to the Company’s workers’ compensation insurance policy at October 31, 2020, were as follows:
| | | | | | | | | | | | | | | | | | | | | | | | | | | | | |
| | Payments Due By Period (in thousands) |
| Contractual Obligations | Total | | Less than
1 Year | | 1-3
Years | | 3-5
Years | | More than
5 Years |
| Operating leases | $ | 36,750 | | | $ | 13,194 | | | $ | 18,853 | | | $ | 2,391 | | | $ | 2,312 | |
| Long-term debt | 25,000 | | | — | | | — | | | 25,000 | | | — | |
| Purchase obligations: | | | | | | | | | |
| | | | | | | | | |
| Feed grains, feed ingredients and packaging supplies | 98,613 | | | 98,613 | | | — | | | | | |
| Construction contracts and other | 9,869 | | | 9,869 | | | — | | | — | | | — | |
| Claims payable | 21,523 | | | 9,996 | | | 11,527 | | | — | | | — | |
| Total | $ | 191,755 | | | $ | 131,672 | | | $ | 30,380 | | | $ | 27,391 | | | $ | 2,312 | |
Off-balance Sheet Arrangements
The Company does not have any off-balance sheet arrangements material to our financial position or results of operations as of October 31, 2020.
CRITICAL ACCOUNTING POLICIES AND ESTIMATES
The preparation of financial statements in accordance with United States generally accepted accounting principles ("U.S. GAAP") requires management to make estimates and assumptions that affect the reported amounts of assets and liabilities at the date of the financial statements and the reported amounts of revenues and expenses during the reporting period. Actual results could differ from these estimates and assumptions, and the differences could be material. Descriptions of accounting estimates the Company considers critical follow.
Inventories
Processed and prepared inventories and inventories of feed, eggs, medication and packaging supplies are stated at the lower of cost (average method) or net realizable value. When market prices for poultry are low and feed grains are high, the Company may be required to write down the carrying values of processed poultry and live inventories to net realizable value, which would increase the Company’s cost of sales.
Live poultry inventories of broilers are stated at the lower of cost or net realizable value and breeders at cost less accumulated amortization. The costs associated with broiler inventories, consisting principally of chicks, feed, and medicine, are accumulated during the growing period. The costs associated with breeder inventories, consisting principally of breeder chicks, feed, medicine and grower payments are accumulated during the growing period. Capitalized breeder costs are then amortized over nine months using the straight-line method. Mortality of broilers and breeders is charged to cost of sales as incurred. If market prices for chicks, feed or medicine or if grower payments increase (or decrease) during the period, the Company could have an increase (or decrease) in the market value of its inventory as well as an increase (or decrease) in cost of sales. Should the Company decide that the nine month amortization period used to amortize the breeder costs is no longer appropriate as a result of operational changes, a shorter (or longer) amortization period could increase (or decrease) the cost of sales recorded in future periods. High mortality from disease or extreme temperatures would result in abnormal charges to cost of sales to write-down live poultry inventories.
In periods where the Company estimates that the cost to grow live birds in inventory to a marketable age, including estimates of payments to the independent contract producers who raise the chicks for us, and then process and distribute those birds will be lower in the aggregate than the anticipated sales proceeds, the Company values the broiler inventories on hand at cost and accumulates costs as the birds are grown to a marketable age subsequent to the balance sheet date. In periods where the Company estimates that the cost to grow live birds in inventory to a marketable age, including estimates of payments to the independent contract producers who raise the chicks for us, and then process and distribute those birds will be higher in the aggregate than the anticipated sales proceeds, the Company will make an adjustment to lower the value of live birds in inventory to the net realizable value. The significant judgments that management makes in order to assess the net realizable value of its broiler inventory include estimating future selling prices of finished products and the related cost of sales, primarily feed costs, to complete. The Company recorded a charge of $2.8 million to reduce the value of live broiler inventories on hand at October 31, 2019 from cost to net realizable value. The Company also recorded a charge of $9.6 million to reduce the value of live broiler inventories on hand at October 31, 2018 from cost to net realizable value. No such charge was required at October 31, 2020. Breeders are generally not subject to lower of cost or net realizable value reserves due to their longer production lives.
Accrued Self Insurance
Insurance expense and the related reserve for workers’ compensation benefits and employee-related health care benefits are estimated using historical experience and actuarial estimates. The Company utilizes an outside third party specialist to assist management in estimating the reserve ultimately recorded in the financial statements. The Company accrues expenses in its workers’ compensation and employee benefit plans for both known claims as well as claims incurred but not reported. Stop-loss coverage is maintained with third party insurers to limit the Company’s total exposure. Management regularly reviews the assumptions used, such as estimated claims incurred but not reported and the estimated development of reported claims, to recognize periodic expenses. Any resulting adjustments to accrued claims are reflected in current operating results. There are no material adjustments to expenses accrued in prior periods in current expenses. If historical experience proves not to be a good indicator of future expenses, if the third-party actuaries with which management engages were to use different actuarial assumptions, if there is a negative trend in the Company’s claims history, or if changes are made to the assumptions used to calculate the reserves, there could be a significant increase or decrease in cost of sales depending on whether these expenses increased or decreased, respectively.
Performance Share Plans
The Company enters into performance share agreements that grant certain officers and key employees the right to receive shares of the Company’s common stock, subject to the Company’s achievement of certain performance measures. The performance measures in each outstanding agreement relate to the Company’s average return on equity and average return on sales over a two year performance period. There is an additional one-year service-based vesting period during which the holder must be employed by the Company to be eligible to receive the shares that met the performance measures. The Company must estimate, at the end of each reporting period, the probability that all or some portion of the shares will be
earned at the end of the total three year vesting period. In making this estimate, the Company considers, among other factors, the current and projected grain costs and chicken volumes and pricing, as well as the amount of commitments to procure grain at a fixed price throughout the performance period. Due to the high level of volatility of these commodity prices and the impact that the change in pricing can have on the Company’s results, the Company’s assessment of probability can change from period to period and can result in a significant revision to the amounts accrued related to the awards. The accounting for these awards requires the Company to accrue over the three year vesting period the estimated amounts that will be earned with adjustments made during the service period using the cumulative catch up method. With respect to the fiscal 2018 awards, which vested and were issued effective October 31, 2020, the Company expensed a total of approximately $1.9 million, of which $1.3 million was recorded during fiscal 2019 and $0.6 million was recorded during fiscal 2020. With respect to the performance share agreements entered into on November 1, 2018, the performance period ended as of October 31, 2020, and the performance measures were not achieved. Because of the volatility of the factors previously discussed and considering actual operating results through October 31, 2020, which were below the threshold level, as of October 31, 2020 the Company was unable to determine that it was probable that awards from outstanding agreements entered into on November 1, 2019 would be earned, and therefore has not accrued any amount for those awards. Had the Company determined that it was probable that the maximum amount of those outstanding awards would be earned, an additional $6.0 million would have been accrued as of October 31, 2020.
Income Taxes
The Company determines its effective tax rate by estimating its permanent differences resulting from differing treatment of items for financial and income tax purposes. The Company is periodically audited by taxing authorities and considers any adjustments made as a result of the audits in computing the Company’s income tax expense. Any audit adjustments affecting permanent differences could have an impact on the Company’s effective tax rate.
Deferred income taxes are accounted for using the liability method and relate principally to depreciation expense, stock based compensation programs and self-insurance programs accounted for differently for financial and income tax purposes.
Valuation allowances are recorded when it is more likely than not some portion or all of a deferred tax asset will not be realized.
Contingencies
The Company recognizes the costs of legal defense for the legal proceedings to which it is a party in the periods incurred. After a considerable analysis of each case, the Company determines the amount of reserves required, if any. At this time, the Company has not accrued any reserve for any legal proceedings. Future reserves may be required if losses are deemed reasonably estimable and probable due to changes in the Company’s assumptions, the effectiveness of legal strategies, or other factors beyond the Company’s control. Future results of operations may be materially affected by the creation of reserves or by accruals of losses to reflect any adverse determinations in these legal proceedings.
NEW ACCOUNTING PRONOUNCEMENTS
In February 2016, the Financial Accounting Standards Board ("FASB") issued Accounting Standards Update ("ASU") 2016-02, Leases. The guidance is intended to increase transparency and comparability among companies by requiring an entity that is a lessee to recognize on the balance sheet the right-of-use assets and lease liabilities arising from all leases with terms, as defined by the guidance, of greater than twelve months. The guidance also requires disclosure of key information about leasing arrangements. The Company adopted this guidance during the first quarter of fiscal 2020, and we used the transition method that requires a cumulative-effect adjustment to the beginning balance of retained earnings during the period of adoption, rather than restating prior-period financial statements; however no such cumulative-effect adjustment was required under our circumstances. This guidance also provides certain practical expedients, including a practical expedient package during transition. We elected to use this package, which allowed the Company to carry forward its determination of whether a lease exists, the classification of a lease, and whether initial direct lease costs exist for purposes of transition to the new standard. We did not utilize the hindsight practical expedient. As of October 31, 2020, we recognized right-of-use assets and lease liabilities of approximately $40.8 million, primarily related to transportation equipment. Adoption did not have a material effect on our consolidated statements of operations and cash flows. For further information regarding the Company's leases, refer to "Part II, Item 8, Notes to Consolidated Financial Statements, Note 15 - Leases."
In June 2016, the FASB issued ASU 2016-13, Financial Instruments - Credit Losses, to provide financial statement users with more decision-useful information about the expected credit losses on financial instruments and other commitments to extend credit held by a reporting entity at each reporting date. The guidance is effective for annual periods, and interim periods within those annual periods, beginning after December 15, 2019, our fiscal 2021. Early adoption is permitted. We do not expect adoption to have a material effect on our consolidated financial statements.
In December 2019, the FASB issued ASU 2019-12, Income Taxes (Topic 740): Simplifying the Accounting for Income Taxes, which is intended to simplify various aspects related to accounting for income taxes. ASU 2019-12 removes certain exceptions to the general principles in Accounting Standards Codification 740 and also clarifies and amends existing guidance to improve consistent application. This guidance is effective for annual periods, and interim periods within those annual periods, beginning after December 15, 2020, our fiscal 2022. We are currently evaluating the impact of this new guidance on our consolidated financial statements.
In March 2020, the FASB issued ASU 2020-04, Reference Rate Reform (Topic 848): Facilitation of the Effects of Reference Rate Reform on Financial Reporting, which provides optional expedients and exceptions for applying U.S. GAAP to contract modifications and hedging relationships, subject to meeting certain criteria, that reference LIBOR or another reference rate expected to be discontinued. This options guidance, which became effective on March 12, 2020, and can be applied through December 31, 2022, has not affected our consolidated financial statements. We have a revolving credit facility that references LIBOR, and we are assessing how this standard may be applied to specific contract modifications through December 31, 2022.
Item 7A. Quantitative and Qualitative Disclosure About Market Risk.
The Company is a purchaser of certain commodities, primarily corn and soybean meal, for use in manufacturing feed for its chickens. As a result, the Company’s earnings are affected by changes in the price and availability of such feed ingredients. Feed grains are subject to volatile price changes caused by factors described below that include weather, size of harvest, transportation and storage costs and the agricultural policies of the United States and foreign governments. The price fluctuations of feed grains have a direct and material effect on the Company’s profitability.
Generally, the Company commits to purchase feed ingredients for deferred delivery from one month to nine months after the time of the commitment. The grain purchases are made directly with our usual grain suppliers, which are companies in the business of regularly supplying grain to end users, and do not involve options to purchase. Such purchases occur when our chief operating decision maker concludes that market factors indicate that prices at the time the grain is needed are likely to be higher than current prices, or where, based on current and expected market prices for the Company’s poultry products, our chief operating decision maker believes he can purchase feed ingredients at prices that will allow the Company to earn a reasonable return for its shareholders. The Company sometimes purchases its feed ingredients for prompt delivery to its feed mills at market prices at the time of such purchases. Market factors considered by our chief operating decision maker in determining whether or not and to what extent to buy grain for deferred delivery include:
•Current market prices;
•Current and predicted weather patterns in the United States, South America, China and other grain producing areas, as such weather patterns might affect the planting, growing, harvesting and yield of feed grains;
•The expected size of the harvest of feed grains in the United States and other grain producing areas of the world as reported by governmental and private sources;
•Current and expected changes to the agricultural policies of the United States and foreign governments;
•The relative strength of United States currency and expected changes therein as it might impact the ability of foreign countries to buy United States feed grain commodities;
•The current and expected volumes of export of feed grain commodities as reported by governmental and private sources;
•The current and expected use of available feed grains for uses other than as livestock feed grains (such as the use of corn for the production of ethanol, which use is impacted by the price of crude oil); and
•Current and expected market prices for the Company’s poultry products.
The Company purchases physical grain, not financial instruments such as puts, calls or straddles that derive their value from the value of physical grain. Thus, the Company does not use derivative financial instruments as defined in ASC 815, “Accounting for Derivatives for Instruments and Hedging Activities,” or any market risk sensitive instruments of the type contemplated by Item 305 of Regulation S-K. The Company does not enter into any derivative transactions or purchase any grain-related contracts other than the physical grain contracts described above.
Although the Company does not use derivative financial instruments as defined in ASC 815 or purchase market risk sensitive instruments of the type contemplated by Item 305 of Regulation S-K, the commodities that the Company does purchase for physical delivery, primarily corn and soybean meal, are subject to price fluctuations that have a direct and material effect on the Company’s profitability as mentioned above. During fiscal 2020, the Company purchased approximately 124.7 million bushels of corn and approximately 1.2 million tons of soybean meal for use in manufacturing feed for its live chickens. A $1.00 change in the average market price paid per bushel for corn would have impacted the Company’s cash outlays for corn by approximately $124.7 million in fiscal 2020. Likewise, a $10.00 change in the price paid per ton for soybean meal would impact the Company’s cash outlays by approximately $12.0 million.
Although changes in the market price paid for feed grains impact cash outlays at the time the Company purchases the grain, such changes do not immediately impact cost of sales. The cost of feed grains is recognized in cost of sales at the same time that the sales of the chickens that consume the feed grains are recognized. Thus, there is a lag between the time cash is paid for feed ingredients and the time the cost of such feed ingredients is reported in cost of goods sold. For example, corn delivered to a feed mill and paid for one week might be used to manufacture feed the following week. However, the chickens that eat that feed might not be processed and sold for another 48-65 days, and only at that time will the costs of the feed consumed by the chicken become included in cost of goods sold.
During fiscal 2020, the Company’s average feed cost per pound of broilers processed totaled $0.2443 per pound. Feed costs per pound of broilers processed consist primarily of feed grains, but also include other feed ingredients such as vitamins, fat and mineral feed supplements. The average feed cost per pound is influenced not only by the price of feed ingredients, but also by the efficiency with which live chickens convert feed into body weight. Factors such as weather, poultry husbandry, quality of feed ingredients and the quality and health of the bird, among others, affect the quantity of feed necessary to mature chickens to the target live weight and the efficiency of that process. Generally, however, a $1.00 change in the average price paid per bushel of corn fed to a chicken during its life would have affected average feed cost per pound of broilers processed by $0.0258, based on the quantity of grain used during fiscal 2020. Similarly, a $10.00 change in the average price paid per ton of soybean meal would have influenced the average feed cost per pound of broilers processed by $0.0025 during fiscal 2020.
The following table shows the impact of hypothetical changes in the price of corn and soybean meal on both the Company’s cash flow and cost of goods sold, based on quantities actually purchased in fiscal 2020:
| | | | | | | | | | | | | | | | | | | | | | | |
| Feed Ingredient | Quantity Purchased
during Fiscal 2020 | | Hypothetical Price
Change | | Impact on Cash
Outlay | | Ultimate Impact on
Feed Cost per
Pound of broilers
Processed |
| Corn | 124.7 million bushels | | $1.00 per bushel | | $124.7 million | | $0.0258 / lb processed |
| Soybean meal | 1.2 million tons | | $10.00 per ton | | $12.0 million | | $0.0025 / lb processed |
The Company’s interest expense is sensitive to changes in the general level of interest rates in the United States, and when the Company is indebted, it typically maintains certain of its debt as fixed rate in nature to mitigate the impact of fluctuations in interest rates. Although the Company had no fixed-rate debt on its balance sheet at October 31, 2020, management believes the potential effects of near-term changes in interest rates on the Company's debt are not material.
The Company is a party to no other market risk sensitive instruments requiring disclosure.
Item 8. Financial Statements and Supplementary Data
Report of Independent Registered Public Accounting Firm
To the Stockholders and Board of Directors of Sanderson Farms, Inc.
Opinion on the Financial Statements
We have audited the accompanying consolidated balance sheets of Sanderson Farms, Inc. and Subsidiaries (the Company) as of October 31, 2020 and 2019, the related consolidated statements of operations, stockholders' equity and cash flows for each of the three years in the period ended October 31, 2020, and the related notes and financial statement schedule listed in the Index at Item 15(a) (collectively referred to as the “consolidated financial statements”). In our opinion, the consolidated financial statements present fairly, in all material respects, the financial position of the Company at October 31, 2020 and 2019, and the results of its operations and its cash flows for each of the three years in the period ended October 31, 2020, in conformity with U.S. generally accepted accounting principles.
We also have audited, in accordance with the standards of the Public Company Accounting Oversight Board (United States) (PCAOB), the Company's internal control over financial reporting as of October 31, 2020, based on criteria established in Internal Control-Integrated Framework issued by the Committee of Sponsoring Organizations of the Treadway Commission (2013 framework) and our report dated December 17, 2020, expressed an unqualified opinion thereon.
Basis for Opinion
These financial statements are the responsibility of the Company's management. Our responsibility is to express an opinion on the Company’s financial statements based on our audits. We are a public accounting firm registered with the PCAOB and are required to be independent with respect to the Company in accordance with the U.S. federal securities laws and the applicable rules and regulations of the Securities and Exchange Commission and the PCAOB.
We conducted our audits in accordance with the standards of the PCAOB. Those standards require that we plan and perform the audit to obtain reasonable assurance about whether the financial statements are free of material misstatement, whether due to error or fraud. Our audits included performing procedures to assess the risks of material misstatement of the financial statements, whether due to error or fraud, and performing procedures that respond to those risks. Such procedures included examining, on a test basis, evidence regarding the amounts and disclosures in the financial statements. Our audits also included evaluating the accounting principles used and significant estimates made by management, as well as evaluating the overall presentation of the financial statements. We believe that our audits provide a reasonable basis for our opinion.
Critical Audit Matter
The critical audit matter communicated below is a matter arising from the current period audit of the financial statements that was communicated or required to be communicated to the audit committee and that: (1) relates to accounts or disclosures that are material to the financial statements and (2) involved our especially challenging, subjective or complex judgments. The communication of the critical audit matter does not alter in any way our opinion on the consolidated financial statements, taken as a whole, and we are not, by communicating the critical audit matter below, providing a separate opinion on the critical audit matter or on the account or disclosure to which it relates.
| | | | | |
| Workers' Compensation Reserve |
| |
| Description of the Matter | The workers’ compensation reserve totaled $21.5 million at October 31, 2020. As discussed in Note 1 to the consolidated financial statements, the Company’s reserve for workers’ compensation is based on both known claims and estimates for claims incurred but not reported (“IBNR”). The Company utilizes various actuarial methodologies and analysis that contemplate known claims and IBNR claims to estimate the reserve. The IBNR portion of the reserve is based on an analysis performed by management’s external actuarial specialist and considers a variety of factors, including the frequency and severity of losses, changes in claims reporting and resolution patterns, third-party recoveries, insurance industry practices, the regulatory environment and legal precedent.
Auditing the workers’ compensation reserve is complex and required the involvement of specialists due to the actuarial methodologies used in the measurement of the reserve. These methodologies have a significant effect on the workers’ compensation reserve. |
| How We Addressed the Matter in Our Audit | We tested controls that address the risks of material misstatement relating to the measurement of the workers’ compensation reserve. For example, we tested controls over management’s review of the actuarial analysis of the workers’ compensation reserve, including the assessment of the appropriateness of the actuarial methodologies used and the data inputs provided to the actuaries.
To test the workers’ compensation reserve, our audit procedures included, among others, evaluating the actuarial methodologies and analysis used and the underlying claims data provided by management to its actuaries. We involved our actuarial specialist to assist in our evaluation of the methodologies and analysis applied by management’s actuary in determining the reserve. For example, we performed an independent calculation of a range of reasonable reserve balances using the Company’s historical claims data and similar actuarial methodologies, and compared the Company’s recorded reserve to the range developed by our actuarial specialist. In addition, we tested the completeness and accuracy of the underlying claim data provided by the Company to its actuarial specialist. |
/s/ Ernst & Young LLP
We have served as the Company's auditor since 1986.
New Orleans, Louisiana
December 17, 2020
Sanderson Farms, Inc. and Subsidiaries
CONSOLIDATED BALANCE SHEETS
| | | | | | | | | | | |
| | October 31, |
| | 2020 | | 2019 |
| (In thousands,
except share data) |
| Assets | | | |
| Current assets: | | | |
| Cash and cash equivalents | $ | 49,061 | | | $ | 95,417 | |
Accounts receivable, less allowance of $1,260 in 2020 and $1,260 in 2019 | 147,546 | | | 131,778 | |
| Receivable from insurance companies | — | | | 445 | |
| Inventories | 290,007 | | | 289,928 | |
| Refundable income taxes | 33,977 | | | 6,612 | |
| | | |
| Prepaid expenses | 57,544 | | | 56,931 | |
| Total current assets | 578,135 | | | 581,111 | |
| Property, plant and equipment, net | 1,224,746 | | | 1,185,860 | |
| Right-of-use assets | 40,785 | | | — | |
| Other assets | 5,365 | | | 7,163 | |
| Total assets | $ | 1,849,031 | | | $ | 1,774,134 | |
| Liabilities and Stockholders’ Equity | | | |
| Current liabilities: | | | |
| Accounts payable | $ | 111,463 | | | $ | 132,741 | |
| Accrued expenses | 98,663 | | | 82,940 | |
| | | |
| | | |
| Lease liabilities | 13,981 | | | — | |
| | | |
| Total current liabilities | 224,107 | | | 215,681 | |
| Long-term debt, less current maturities | 25,000 | | | 55,000 | |
| Claims payable and other liabilities | 12,175 | | | 11,646 | |
| Deferred income taxes | 141,672 | | | 74,132 | |
| Long-term lease liabilities | 26,804 | | | — | |
| Commitments and contingencies | | | |
| Stockholders’ equity: | | | |
| Preferred Stock: | | | |
Series A Junior Participating Preferred Stock, $100 par value: authorized 500,000 shares, none issued | | | |
Par value to be determined by the Board of Directors: authorized 4,500,000 shares; none issued | | | |
Common Stock, $1 par value: authorized 100,000,000 shares; issued and outstanding shares - 22,251,071 at October 31, 2020 and 22,203,920 at October 31, 2019, respectively | 22,251 | | | 22,204 | |
| Paid-in capital | 90,420 | | | 86,010 | |
| Retained earnings | 1,306,602 | | | 1,309,461 | |
| Total stockholders’ equity | 1,419,273 | | | 1,417,675 | |
| Total liabilities and stockholders’ equity | $ | 1,849,031 | | | $ | 1,774,134 | |
See accompanying notes.
Sanderson Farms, Inc. and Subsidiaries
CONSOLIDATED STATEMENTS OF OPERATIONS
| | | | | | | | | | | | | | | | | |
| Years ended October 31, |
| 2020 | | 2019 | | 2018 |
| (In thousands, except per share data) |
| Net sales | $ | 3,564,267 | | | $ | 3,440,258 | | | $ | 3,236,004 | |
| Cost and expenses: | | | | | |
| Cost of sales | 3,370,111 | | | 3,158,323 | | | 2,974,739 | |
| Live inventory adjustment | — | | | 2,800 | | | 9,600 | |
| Selling, general and administrative | 205,750 | | | 211,141 | | | 221,965 | |
| 3,575,861 | | | 3,372,264 | | | 3,206,304 | |
| Operating income (loss) | (11,594) | | | 67,994 | | | 29,700 | |
| Other income (expense): | | | | | |
| Interest income | 482 | | | — | | | 2,911 | |
| Interest expense | (5,207) | | | (4,156) | | | (2,066) | |
| Other | 8 | | | 9 | | | 12 | |
| (4,717) | | | (4,147) | | | 857 | |
| Income (loss) before income taxes | (16,311) | | | 63,847 | | | 30,557 | |
| Income tax expense (benefit) | (44,585) | | | 10,553 | | | (30,874) | |
| Net income | $ | 28,274 | | | $ | 53,294 | | | $ | 61,431 | |
| Earnings per share: | | | | | |
| Basic | $ | 1.27 | | | $ | 2.41 | | | $ | 2.70 | |
| Diluted | $ | 1.27 | | | $ | 2.41 | | | $ | 2.70 | |
| Dividends per share | $ | 1.40 | | | $ | 1.28 | | | $ | 1.28 | |
See accompanying notes.
Sanderson Farms, Inc. and Subsidiaries
CONSOLIDATED STATEMENTS OF STOCKHOLDERS’ EQUITY
| | | | | | | | | | | | | | | | | | | | | | | | | | | | | |
| Common Stock | | Paid-In
Capital | | Retained
Earnings | | Total
Stockholders’
Equity |
| Shares | | Amount | | | |
| (In thousands, except shares and per share amounts) |
| Balance at October 31, 2017 | 22,802,690 | | | $ | 22,803 | | | $ | 134,999 | | | $ | 1,275,060 | | | $ | 1,432,862 | |
| Net income - Fiscal 2018 | — | | | — | | | — | | | 61,431 | | | 61,431 | |
Cash dividends ($1.28 per share) | — | | | — | | | — | | | (28,966) | | | (28,966) | |
Purchase of common stock | (823,385) | | | (823) | | | (59,639) | | | (23,001) | | | (83,463) | |
Stock compensation plan transactions | 120,475 | | | 120 | | | (8,862) | | | — | | | (8,742) | |
| Amortization of unearned compensation | — | | | — | | | 14,771 | | | — | | | 14,771 | |
| Balance at October 31, 2018 | 22,099,780 | | | 22,100 | | | 81,269 | | | 1,284,524 | | | 1,387,893 | |
| Net income - Fiscal 2019 | — | | | — | | | — | | | 53,294 | | | 53,294 | |
Cash dividends ($1.28 per share) | — | | | — | | | — | | | (28,357) | | | (28,357) | |
Stock compensation plan transactions | 104,140 | | | 104 | | | (5,594) | | | — | | | (5,490) | |
| Amortization of unearned compensation | — | | | — | | | 10,335 | | | — | | | 10,335 | |
| Balance at October 31, 2019 | 22,203,920 | | | 22,204 | | | 86,010 | | | 1,309,461 | | | 1,417,675 | |
| Net income - Fiscal 2020 | — | | | — | | | — | | | 28,274 | | | 28,274 | |
Cash dividends ($1.40 per share) | — | | | — | | | — | | | (31,133) | | | (31,133) | |
| Stock compensation plan transactions | 47,151 | | | 47 | | | (3,683) | | | — | | | (3,636) | |
| Amortization of unearned compensation | — | | | — | | | 8,093 | | | — | | | 8,093 | |
| Balance at October 31, 2020 | 22,251,071 | | | $ | 22,251 | | | $ | 90,420 | | | $ | 1,306,602 | | | $ | 1,419,273 | |
See accompanying notes.
Sanderson Farms, Inc. and Subsidiaries
CONSOLIDATED STATEMENTS OF CASH FLOWS
| | | | | | | | | | | | | | | | | |
| Years ended October 31, |
| 2020 | | 2019 | | 2018 |
| (In thousands) |
| | | | | |
| Operating activities | | | | | |
| Net income | $ | 28,274 | | | $ | 53,294 | | | $ | 61,431 | |
Adjustments to reconcile net income to net cash provided by operating activities: | | | | | |
| Depreciation and amortization | 156,754 | | | 135,420 | | | 110,896 | |
| Amortization of share-based compensation | 9,875 | | | 12,552 | | | 16,371 | |
| Live inventory adjustment (net of prior period reversal) | (2,800) | | | (6,800) | | | 9,600 | |
| Provision for losses (recoveries) on accounts receivable | — | | | (2,000) | | | — | |
| Deferred income taxes | 67,540 | | | 11,339 | | | (29,105) | |
| Loss on asset disposals | 728 | | | 1,175 | | | — | |
| Change in assets and liabilities: | | | | | |
| Accounts receivable - trade | (15,768) | | | (7,846) | | | 16,936 | |
| Accounts receivable - insurance | 445 | | | 6,649 | | | (7,094) | |
| Inventories | 2,721 | | | (43,072) | | | 3,109 | |
| Income taxes | (27,365) | | | 26,362 | | | (39,623) | |
| Prepaid expenses and other assets | 95 | | | (14,338) | | | (4,132) | |
| Right of use assets | 13,860 | | | — | | | — | |
| Lease liabilities | (13,860) | | | — | | | — | |
| Accounts payable | (14,600) | | | 18,517 | | | 24,077 | |
| Accrued expenses, claims payable and other liabilities | 16,110 | | | 15,548 | | | (31,053) | |
| Total adjustments | 193,735 | | | 153,506 | | | 69,982 | |
| Net cash provided by operating activities | 222,009 | | | 206,800 | | | 131,413 | |
| | | | | |
| Investing activities | | | | | |
| Capital expenditures | (202,437) | | | (249,503) | | | (308,875) | |
| Net proceeds from sale of property and equipment | 481 | | | 996 | | | 2,201 | |
| Net cash used in investing activities | (201,956) | | | (248,507) | | | (306,674) | |
| | | | | |
| Financing activities | | | | | |
| Borrowings from revolving line of credit | 145,000 | | | 125,000 | | | — | |
| Payments on revolving line of credit | (175,000) | | | (70,000) | | | — | |
| | | | | |
| | | | | |
| Payments for debt issuance costs | — | | | (2,225) | | | — | |
| Dividends paid | (31,133) | | | (28,357) | | | (28,966) | |
| Repurchase of common stock | — | | | — | | | (83,463) | |
| Proceeds from issuance of restricted stock under stock compensation plans | 1,175 | | | 942 | | | 1,320 | |
| Payments from issuance of common stock under stock compensation plans | (6,451) | | | (9,429) | | | (11,722) | |
| Net cash provided by (used in) financing activities | (66,409) | | | 15,931 | | | (122,831) | |
| Net change in cash and cash equivalents | (46,356) | | | (25,776) | | | (298,092) | |
| Cash and cash equivalents at beginning of year | 95,417 | | | 121,193 | | | 419,285 | |
| Cash and cash equivalents at end of year | $ | 49,061 | | | $ | 95,417 | | | $ | 121,193 | |
| | | | | |
| | | | | | | | | | | | | | | | | |
| Supplemental disclosure of cash flow information: | | | | | |
| Income taxes paid | $ | 1,415 | | | $ | 3,106 | | | $ | 40,090 | |
| Interest paid, net | $ | 5,299 | | | $ | 4,043 | | | $ | 2,054 | |
| Non-cash investing activities: | | | | | |
| Capital expenditures included in accounts payable | $ | 3,531 | | | $ | 10,209 | | | $ | 24,921 | |
See accompanying notes.
Sanderson Farms, Inc. and Subsidiaries
NOTES TO CONSOLIDATED FINANCIAL STATEMENTS
1. Significant Accounting Policies
Basis of Presentation: The consolidated financial statements include the accounts of Sanderson Farms, Inc. (the “Company”) and its wholly-owned subsidiaries. All significant intercompany transactions and accounts have been eliminated in consolidation.
Business: The Company is engaged in the production, processing, marketing and distribution of fresh and frozen chicken and other prepared chicken items. The Company’s net sales and cost of sales are significantly affected by market price fluctuations of its principal products sold and of its principal feed ingredients, corn and soybean meal.
Revenue Recognition: The Company sells to retailers, distributors and casual dining operators primarily in the southeastern, southwestern, northeastern and western United States. Management periodically performs credit evaluations of its customers’ financial condition and generally does not require collateral. The Company recognizes revenue in connection with a contract in which the Company has agreed to sell, and a customer has agreed to purchase, specific quantities of product at agreed-upon prices and when the Company's performance obligation related to that contract has been satisfied. In the majority of its contracts with customers, the Company's performance obligation is satisfied when delivery of the product has occurred, either at the customer's facility or the Company's facility, depending on the terms of each contract. In a small number of contracts, ownership of the product passes from the Company to the customer at some point during transit, at which time the performance obligation is satisfied and revenue is recognized. Gross revenue and related receivables are recognized based on the transaction price within the contract and are reduced by estimated or known amounts for items such as rebates, discounts, cooperative advertising allowances and other various items to arrive at net revenue. During fiscal 2020, 2019 and 2018, these reductions to revenue totaled approximately $59.6 million, $66.5 million and $79.2 million, respectively.
The cost incurred for shipping and handling activities to deliver the product to the customer is recognized in cost of sales during the period in which the corresponding revenue is recognized. Where shipping and handling activities occur after the customer has obtained control of the product, the Company has elected to account for those expenses as fulfillment costs in cost of sales, rather than an additional promised service. This accounting treatment is the same as the accounting treatment prior to the Company's adoption of ASU 2014-09, Revenue from Contracts with Customers. The Company has, prior to the adoption of ASU 2014-09, accounted for freight one of two ways. First, when the Company's agreement with its customer did not authorize the Company to invoice the customer separately for freight, the Company attempted to negotiate a higher price, and paid freight costs associated with the sale. In these instances, that cost was booked as an expense in cost of sales. In some instances, the Company's agreements with its customers authorize the Company to invoice the customer for freight costs separately on its invoice to the customer. Under these arrangements, the Company has previously accounted for freight by recognizing revenue net of the freight costs. Subsequent to the adoption of ASU 2014-09, both arrangements are accounted for in the same manner. That is, in both instances, revenue is reported gross of any freight charge, and all freight costs are accounted for as cost of sales. Because we adopted ASU 2014-09 using the modified-retrospective transition method, we did not restate prior-period financial statements, and the separately-invoiced freight costs from periods prior to fiscal 2019 remain presented as a reduction to cost of sales. During fiscal 2020 and 2019, we recognized revenue of approximately $20.4 million and $24.9 million, respectively, related to those freight charges, as compared to approximately $20.0 million recognized as a reduction to cost of sales during fiscal 2018.
Due to the nature of our contracts, commissions associated with such contracts provide only a short-term benefit (i.e. less than one year); therefore, with our adoption of ASU 2014-09, we recognize costs of commissions paid to third-party brokers as selling, general and administrative expenses effective as of November 1, 2018. Prior to our adoption of ASU 2014-09, those commissions were recognized as a reduction of revenue. Because we transitioned using the modified-retrospective method, we did not restate prior-period financial statements, and those commissions from periods prior to fiscal 2019 remain presented as a reduction to revenue. During fiscal 2020 and 2019, we recognized approximately $12.9 million and $10.9 million, respectively, in commissions as selling, general and administrative expenses, as compared to approximately $11.0 million recognized as a reduction to revenue during fiscal 2018.
Two customers each accounted for more than 10% of consolidated sales for the year ended October 31, 2020. Sales to those customers accounted for 14.9% and 12.7%, respectively, of the Company's net sales during fiscal 2020. Sales to the same two customers accounted for 15.8% and 11.8%, respectively, of the Company's net sales during fiscal 2019 and 14.3% and 10.5%, respectively, of the Company's net sales during fiscal 2018.
Sales of offal are considered by-products; accordingly, these amounts reduce cost of sales and totaled $24.8 million, $31.1 million and $34.4 million in fiscal 2020, 2019 and 2018, respectively.
The Company sells certain of its products either directly to foreign markets or to U.S. based customers who resell the product in foreign markets. These foreign markets for fiscal 2020 were primarily Mexico, China and Cuba, and for fiscal 2019 and 2018 were primarily Mexico, Cuba, Central Asia and the Middle East. These export sales for fiscal years 2020, 2019 and 2018 totaled approximately $308.9 million, $284.5 million and $215.8 million, respectively. The Company does not believe that the amount of sales attributable to any single foreign country is material to its total sales during any of the periods presented. The Company’s export sales are facilitated through independent food brokers located in the United States and the Company’s internal sales staff.
Use of Estimates: The preparation of the consolidated financial statements in conformity with U.S. generally accepted accounting principles requires management to make estimates and assumptions that affect the amounts reported in the consolidated financial statements and accompanying notes. Actual results could differ from those estimates.
Cash Equivalents: The Company considers all highly liquid investments with maturities of ninety days or less when purchased to be cash equivalents.
Allowance for Doubtful Accounts: In the normal course of business, the Company extends credit to its customers on a short-term basis, generally less than twenty-one days. Although credit risks associated with our customers are considered minimal, the Company routinely reviews its accounts receivable balances and records provisions for probable doubtful accounts based on an individual assessment of a customer’s credit quality as well as subjective factors and trends, including the aging of receivable balances. In circumstances where management is aware of a specific customer’s inability to meet its financial obligations to the Company, a specific reserve is recorded to reduce the receivable to the amount expected to be collected. If circumstances change (i.e., higher than expected defaults or an unexpected material adverse change in a major customer’s ability to meet its financial obligations to us), our estimates of the recoverability of amounts due us could be reduced by a material amount and the allowance for doubtful accounts and related bad debt expense would increase by the same amount.
Inventories: Processed and prepared inventories and inventories of feed, eggs, medication and packaging supplies are stated at the lower of cost (average method) or net realizable value.
Live poultry inventories of broilers are stated at the lower of cost or net realizable value, and breeders at cost less accumulated amortization. The costs associated with breeders, including breeder chicks, feed, medicine and grower pay, are accumulated up to the production stage and amortized over nine months using the straight-line method.
The costs associated with broiler inventories, consisting principally of chicks, feed, and medicine, are accumulated during the growing period. In periods where the Company estimates that the cost to grow live birds in inventory to a marketable age, including estimates of payments to the independent contract producers who raise the chicks for us, and then process and distribute those birds will be lower in the aggregate than the anticipated sales proceeds, the Company values the broiler inventories on hand at cost and accumulates costs as the birds are grown to a marketable age subsequent to the balance sheet date. In periods where the Company estimates that the cost to grow live birds in inventory to a marketable age, including estimates of payments to the independent contract producers who raise the chicks for us, and then process and distribute those birds will be higher in the aggregate than the anticipated sales proceeds, the Company will make an adjustment to lower the value of live birds in inventory to the net realizable value. The significant judgments that management makes in order to assess the net realizable value of its broiler inventory include estimating future selling prices of finished products and the related cost of sales, primarily feed costs, to complete. The Company's live broiler inventories were recorded at cost at October 31, 2020, because the estimated net realizable value for all broiler flocks in inventory was higher than the estimated cost to complete those live broiler inventories. The Company recorded a charge of $2.8 million at October 31, 2019 to reduce the values of live broiler inventories on hand at those dates from cost to net realizable value.
Property, Plant and Equipment: Property, plant and equipment is stated at cost. Depreciation of property, plant and equipment is provided by the straight-line method over the estimated useful lives of 15 to 39 years for buildings and 3 to 12 years for machinery and equipment.
Impairment of Long-Lived Assets: The Company continually reevaluates the carrying value of its long-lived assets based on events or changes in circumstances which indicate that the carrying value may not be recoverable. As part of this reevaluation and when indicators are present, the Company estimates the future cash flows expected to result from the use of the asset and
its eventual disposal. If the sum of the expected future cash flows (undiscounted and without interest charges) is less than the carrying amount of the asset, an impairment loss, based on the fair value of the assets, is recognized through a charge to operations.
Self-Insurance Programs: Insurance expense for workers’ compensation benefits and employee-related health care benefits are estimated using historical experience and actuarial estimates. The Company utilizes an outside third party specialist to assist management in estimating the reserve ultimately recorded in the financial statements. The Company accrues expenses in its workers’ compensation and employee benefit plans for both known claims as well as claims incurred but not reported. Stop-loss coverage is maintained with third party insurers to limit the Company’s total exposure. Management regularly reviews the assumptions used to recognize periodic expenses. Any resulting adjustments to accrued claims are reflected in current operating results. There are no material adjustments to expenses accrued in prior periods in current expenses. The total amounts recorded for the Company's reserve for workers' compensation benefits as of October 31, 2020 and October 31, 2019 are $21.5 million and $20.6 million, respectively.
Advertising and Marketing Costs: The Company expenses advertising costs as incurred. Advertising costs are included in selling, general and administrative expenses and totaled $19.0 million, $19.9 million and $38.9 million for fiscal 2020, 2019 and 2018, respectively.
Income Taxes: Deferred income taxes are accounted for using the liability method and relate principally to depreciation expense, stock based compensation programs and self-insurance programs accounted for differently for financial and income tax purposes.
Valuation allowances are recorded when it is more likely than not some or all of a deferred tax asset will not be realized.
The Company is periodically audited by taxing authorities and considers any adjustments, interest, and penalties incurred as a result of the audits in computing and reporting income tax expense. Any audit adjustments could have a material impact on the Company’s effective tax rate. Tax periods for fiscal years 2016 through 2020 remain open to examination by federal and state taxing jurisdictions to which the Company is subject.
Share-Based Compensation: The Company accounts for all share-based payments to employees, including grants of restricted stock and performance-based shares, in the statement of operations based on their fair values. For performance-based shares, the Company recognizes expense when management determines the performance criteria are probable of being met. The Company recognizes forfeitures of share-based payments during the period in which the forfeitures occur.
Earnings Per Share: Basic earnings per share is based upon the weighted average number of common shares outstanding during the year. Share-based payment awards entitling holders to receive non-forfeitable dividends before vesting are considered participating securities and thus included in the calculation of basic earnings per share. These awards are included in the calculation of basic earnings per share under the two-class method. The two-class method allocates earnings for the period between common shareholders and other security holders. The participating awards receiving dividends are allocated the same amount of income as if they were outstanding shares. Diluted earnings per share includes any dilutive effects of options, warrants, restricted stock and convertible securities.
Fair Value of Financial Instruments: The Company holds certain items that are required to be disclosed at fair value, primarily debt instruments. Fair value is defined as the price that would be received to sell an asset or paid to transfer a liability (an exit price) in the principal or most advantageous market for the asset or liability in an orderly transaction between market participants on the measurement date. A three-level hierarchy is followed for disclosure to show the extent and level of judgment used to estimate fair value measurements:
Level 1 – Inputs used to measure fair value are unadjusted quoted prices that are available in active markets for the identical assets or liabilities as of the reporting date.
Level 2 – Inputs used to measure fair value, other than quoted prices included in Level 1, are either directly or indirectly observable as of the reporting date through correlation with market data, including quoted prices for similar assets and liabilities in active markets and quoted prices in markets that are not active. Level 2 also includes assets and liabilities that are valued using models or other pricing methodologies that do not require significant judgment since the input assumptions used in the models, such as interest rates and volatility factors, are corroborated by readily observable data from actively quoted markets for substantially the full term of the financial instrument.
Level 3 – Inputs used to measure fair value are unobservable inputs that are supported by little or no market activity and reflect the use of significant management judgment. These values are generally determined using pricing models for which the assumptions utilize management’s estimates of market participant assumptions.
Fair values for debt are based on quoted market prices or published forward interest rate curves and were categorized as Level 2 measurements. As of October 31, 2020 and October 31, 2019, the fair values of the Company's borrowings under its revolving credit facility approximate the carrying value.
Impact of Recently Issued Accounting Standards: In February 2016, the FASB issued ASU 2016-02, Leases. The guidance is intended to increase transparency and comparability among companies by requiring an entity that is a lessee to recognize on the balance sheet the right-of-use assets and lease liabilities arising from all leases with terms, as defined by the guidance, of greater than twelve months. The guidance also requires disclosure of key information about leasing arrangements. The Company adopted this guidance during the first quarter of fiscal 2020, and we used the transition method that requires a cumulative-effect adjustment to the beginning balance of retained earnings during the period of adoption, rather than restating prior-period financial statements; however no such cumulative-effect adjustment was required. This guidance also provides certain practical expedients, including a practical expedient package during transition. We elected to use this package, which allowed the Company to carry forward its determination of whether a lease exists, the classification of a lease, and whether initial direct lease costs exist for purposes of transition to the new standard. We did not utilize the hindsight practical expedient. As of October 31, 2020, we recognized right-of-use assets and lease liabilities of approximately $40.8 million, primarily related to transportation equipment. Adoption did not have a material effect on our consolidated statements of operations and cash flows. For further information regarding the Company's leases, refer to "Part II, Item 8, Notes to Consolidated Financial Statements, Note 15 - Leases."
In June 2016, the FASB issued ASU 2016-13, Financial Instruments - Credit Losses, to provide financial statement users with more decision-useful information about the expected credit losses on financial instruments and other commitments to extend credit held by a reporting entity at each reporting date. The guidance is effective for annual periods, and interim periods within those annual periods, beginning after December 15, 2019, our fiscal 2021. Early adoption is permitted. We do not expect adoption to have a material effect on our consolidated financial statements.
In December 2019, the FASB issued ASU 2019-12, Income Taxes (Topic 740): Simplifying the Accounting for Income Taxes, which is intended to simplify various aspects related to accounting for income taxes. ASU 2019-12 removes certain exceptions to the general principles in Accounting Standards Codification 740 and also clarifies and amends existing guidance to improve consistent application. This guidance is effective for annual periods, and interim periods within those annual periods, beginning after December 15, 2020, our fiscal 2022. We are currently evaluating the impact of this new guidance on our consolidated financial statements.
In March 2020, the FASB issued ASU 2020-04, Reference Rate Reform (Topic 848): Facilitation of the Effects of Reference Rate Reform on Financial Reporting, which provides optional expedients and exceptions for applying U.S. GAAP to contract modifications and hedging relationships, subject to meeting certain criteria, that reference LIBOR or another reference rate expected to be discontinued. This options guidance, which became effective on March 12, 2020, and can be applied through December 31, 2022, has not affected our consolidated financial statements. We have a revolving credit facility that references LIBOR, and we are assessing how this standard may be applied to specific contract modifications through December 31, 2022.
2. Disaggregation of Revenue
The following table disaggregates our net sales by product category:
| | | | | | | | | | | | | | | | | |
| Fiscal Year 2020 | | Fiscal Year 2019 | | Fiscal Year 2018 |
| Product Category | (in thousands) |
| Fresh, chill-packed chicken | $ | 1,408,564 | | | $ | 1,137,679 | | | $ | 1,158,320 | |
| Fresh, vacuum-sealed chicken | 1,200,343 | | | 1,310,157 | | | 1,139,386 | |
| Fresh, ice-packed chicken | 509,481 | | | 511,480 | | | 503,562 | |
| Frozen chicken | 240,806 | | | 213,024 | | | 211,465 | |
| Prepared chicken | 184,662 | | | 240,811 | | | 207,548 | |
| Other | 20,411 | | | 27,107 | | | 15,723 | |
| Total net sales | $ | 3,564,267 | | | $ | 3,440,258 | | | $ | 3,236,004 | |
3. Inventories
Inventories consisted of the following:
| | | | | | | | | | | |
| October 31, |
| 2020 | | 2019 |
| Description | (in thousands) |
| Live poultry-broilers (net of reserve) and breeders | $ | 180,013 | | | $ | 179,870 | |
| Feed, eggs and other | 53,318 | | | 47,417 | |
| Processed poultry | 32,952 | | | 35,121 | |
| Prepared chicken | 16,142 | | | 20,032 | |
| Packaging materials | 7,582 | | | 7,488 | |
| Total inventories | $ | 290,007 | | | $ | 289,928 | |
4. Property, Plant and Equipment
Property, plant and equipment, net, consisted of the following:
| | | | | | | | | | | |
| October 31, |
| 2020 | | 2019 |
| Description | (in thousands) |
| Land and buildings | $ | 931,674 | | | $ | 892,089 | |
| Machinery and equipment | 1,350,725 | | | 1,236,095 | |
| Work-in-process | 16,914 | | | 11,149 | |
| Subtotal | 2,299,313 | | | 2,139,333 | |
| Less accumulated depreciation | (1,074,567) | | | (953,473) | |
| Property, plant and equipment, net | $ | 1,224,746 | | | $ | 1,185,860 | |
5. Prepaid expenses
Prepaid expenses consisted of the following:
| | | | | | | | | | | |
| October 31, |
| 2020 | | 2019 |
| (in thousands) |
| Parts and supplies | $ | 36,109 | | | $ | 33,617 | |
| Prepaid insurance | 10,675 | | | 8,859 | |
| Other prepaid expenses | 10,760 | | | 14,455 | |
| Total prepaid expenses | $ | 57,544 | | | $ | 56,931 | |
6. Accrued expenses
Accrued expenses consisted of the following:
| | | | | | | | | | | |
| October 31, |
| 2020 | | 2019 |
| (In thousands) |
| Workers’ compensation claims | $ | 9,996 | | | $ | 9,687 | |
| Accrued wages | 11,282 | | | 19,525 | |
| Accrued rebates | 17,977 | | | 13,529 | |
| Accrued vacation | 12,207 | | | 10,592 | |
| Accrued property taxes | 12,606 | | | 11,331 | |
Accrued payroll taxes 1 | 22,939 | | | 8,290 | |
| Other accrued expenses | 11,656 | | | 9,986 | |
| Total accrued expenses | $ | 98,663 | | | $ | 82,940 | |
Note 1 - Included in fiscal year 2020 accrued payroll taxes is an approximately $20.7 million deferral of payroll taxes allowed by the CARES Act.
7. Long-Term debt obligations
Long-term debt obligations consisted of the following:
| | | | | | | | | | | |
| October 31, |
| 2020 | | 2019 |
| (In thousands) |
Revolving credit facility (weighted average interest rates of 1.4% at October 31, 2020 and 3.3% at October 31, 2019) | $ | 25,000 | | | $ | 55,000 | |
| Less current maturities of long-term debt | — | | | — | |
| Total long-term debt | $ | 25,000 | | | $ | 55,000 | |
The Company is a party to a revolving credit facility dated March 21, 2019, with a maximum available borrowing capacity of $1.0 billion. Under the credit facility, the Company may not exceed a maximum debt to total capitalization ratio of 50%. The Company has a one-time right, at any time during the term of the agreement, to increase the maximum debt to total capitalization ratio then in effect by five percentage points in connection with the construction of a new poultry complex for the four fiscal quarters beginning on the first day of the fiscal quarter during which the Company gives written notice of its intent to exercise this right. The Company has not exercised this right. The facility also sets a minimum net worth requirement that at October 31, 2020, was $1.0 billion. The credit is unsecured and, unless extended, will expire on March 21, 2024. As of October 31, 2020, and December 16, 2020, the Company had borrowed $25.0 million, and had approximately $25.2 million outstanding in letters of credit, leaving $949.8 million of borrowing capacity available under the facility.
The Company has the option to borrow funds under the revolving line of credit based on the Prime interest rate or the Libor interest rate plus a spread ranging from 0.25% to 1.50%. The spread on Libor borrowings and the commitment fee for the unused balance of the revolving credit agreement are determined based upon the Company’s leverage ratio as follows:
| | | | | | | | | | | | | | | | | |
| Level | Leverage Ratio | | Spread | | Commitment Fee |
| 1 | < 25% | | 0.25 | % | | 0.20 | % |
| 2 | ≥ 25% and < 35% | | 0.50 | % | | 0.25 | % |
| 3 | ≥ 35% and < 45% | | 1.00 | % | | 0.30 | % |
| 4 | ≥ 45% | | 1.50 | % | | 0.35 | % |
The aggregate annual maturities of long-term debt at October 31, 2020 are as follows (in thousands):
| | | | | | | | | | | |
| Fiscal Year | | | Amount |
| 2024 | | | $ | 25,000 | |
| | | $ | 25,000 | |
8. Income Taxes
On March 27, 2020, the CARES Act was enacted. The CARES Act contains several income tax provisions, as well as other measures, that are intended to assist businesses impacted by the economic effects of the COVID-19 pandemic. The most significant provisions of the CARES Act that materially affect our accounting for income taxes include, but are not limited to, a five-year carry-back allowance for taxable net operating losses generated in tax years 2018 through 2020, our fiscal years 2019 through 2021, and a technical correction to the Tax Cut and Jobs Act, enacted on December 22, 2017, that provides a two-year carry-back allowance for our taxable net operating loss generated in fiscal year 2018.
Our fiscal 2020 financial statements were materially affected by the changes enacted by the CARES Act. U.S. GAAP requires that the effects from changes in tax laws be recognized in the period in which the new law is enacted, which for the CARES Act was our second quarter of fiscal 2020. As a result of the applicable accounting guidance and the provisions within the CARES Act, our income tax provision for fiscal 2020 reflects the carry-back of taxable net operating losses generated during periods in which the statutory federal income tax rate was 21.0% to periods in which the statutory federal income tax rate was 35.0%. Due to the difference in statutory rates, during fiscal 2020 we recorded a $50.4 million discrete income tax benefit related to the carry-back provisions. Because the net operating losses were carried back to years in which we initially reduced our taxable income using the Domestic Production Activities Deduction, we recorded a partially offsetting $11.3 million discrete income tax expense during fiscal 2020 to account for the reduced taxable income.
On December 22, 2017, during our fiscal 2018, the Tax Cuts and Jobs Act of 2017 ("the TCJA") was enacted, which reduced the corporate income tax rate from 35.0% to 21.0%. Section 15 of the Internal Revenue Code stipulated that our fiscal 2018 was subject to a blended statutory tax rate of 23.3%, which was based on a calculation of the number of days during fiscal 2018 that were subject to a 35.0% statutory rate and the number of days during fiscal 2018 that were subject to a 21.0% statutory rate. Fiscal years 2020 and 2019 were each subject to a 21.0% statutory rate for the entire year. When the TCJA was enacted during fiscal 2018, we were required by U.S. GAAP to remeasure our deferred tax assets and liabilities using the enacted tax rate expected to apply when the temporary differences from which the deferred taxes arose were expected to be settled. This revaluation of our deferred taxes resulted in a $37.5 million discrete income tax benefit.
Our effective tax rates for fiscal 2020, 2019 and 2018 were 273.3%, 16.5% and (101.0)%, respectively. Excluding the effects of discrete items, the Company's effective tax rates for fiscal 2020, 2019 and 2018 would have been approximately 21.3%, 23.6% and 33.0%, respectively. During the periods presented, income tax expense (benefit) consisted of the following:
| | | | | | | | | | | | | | | | | |
| Years Ended October 31, |
| 2020 | | 2019 | | 2018 |
| (In thousands) |
| Current expense (benefit): | | | | | |
| Federal | $ | (114,734) | | | $ | (735) | | | $ | (600) | |
| State | 2,609 | | | (51) | | | (1,169) | |
| (112,125) | | | (786) | | | (1,769) | |
| Deferred expense (benefit): | | | | | |
| Federal | 71,214 | | | 13,966 | | | (28,845) | |
| State | (489) | | | 2,753 | | | 2,146 | |
| Change in valuation allowance | (3,185) | | | (5,380) | | | (2,406) | |
| 67,540 | | | 11,339 | | | (29,105) | |
| Income tax expense (benefit) | $ | (44,585) | | | $ | 10,553 | | | $ | (30,874) | |
Significant components of the Company’s deferred tax assets and liabilities are outlined below.
| | | | | | | | | | | |
| October 31, |
| 2020 | | 2019 |
| (In thousands) |
| Deferred tax liabilities: | | | |
| Property, plant and equipment | $ | 167,257 | | | $ | 148,505 | |
| Prepaid and other assets | 2,299 | | | 1,911 | |
| Total deferred tax liabilities | 169,556 | | | 150,416 | |
| Deferred tax assets: | | | |
| Accrued expenses and accounts receivable | 8,311 | | | 8,172 | |
| Inventory | 1,441 | | | 1,155 | |
| Compensation on restricted stock | 4,543 | | | 7,528 | |
| State income tax credits | 8,576 | | | 9,333 | |
| Federal credits | 3,184 | | | 600 | |
| Other | 1,004 | | | 672 | |
| Valuation allowance | (2,452) | | | (5,637) | |
| Net operating loss | 3,277 | | | 54,461 | |
| Total deferred tax assets | 27,884 | | | 76,284 | |
| Net deferred tax liabilities | $ | 141,672 | | | $ | 74,132 | |
The increase in the Company's deferred tax liability is primarily attributable to the carry-back provisions within the CARES Act, as well as Company's decision to take bonus depreciation on qualifying assets placed in service during fiscal 2020.
Included in the deferred tax assets are North Carolina Investing in Business Property Credit and North Carolina Jobs Credits totaling $1.3 million, as well as Georgia Job Tax Credits totaling $2.3 million. The North Carolina Investing in Business Property Credit provides a 7% investment tax credit for property located in a North Carolina development area, the North Carolina Creating Jobs Credit provides a tax credit for increased employment in North Carolina, and the Georgia Job Tax Credit provides a tax credit for creation and retention of qualifying jobs in Georgia. It is management’s opinion that the majority of the North Carolina and Georgia income tax credits will not be utilized before they expire, and a $2.5 million valuation allowance has been recorded as of October 31, 2020. The North Carolina credits began to expire during fiscal 2018, and the remaining credits expire between fiscal years 2021 and 2023.
At the end of each reporting period, the Company evaluates all available information at that time to determine if it is more likely than not that some or all of these credits will be utilized. As of October 31, 2020, 2019, and 2018, the Company
determined that a total of $1.1 million, $1.8 million, and $0.7 million, respectively, would be recovered. Accordingly, those amounts were released from the valuation allowance and benefited deferred tax expense in the respective periods.
The differences between the consolidated effective income tax rate and the federal statutory rate effective during the applicable year presented are as follows:
| | | | | | | | | | | | | | | | | |
| Years Ended October 31, |
| 2020 | | 2019 | | 2018 |
| (In thousands) |
| Income taxes at statutory rate | $ | (3,425) | | | $ | 13,408 | | | $ | 7,132 | |
| Discrete benefit resulting from CARES Act | (39,086) | | | — | | | — | |
| Discrete benefit resulting from TCJA | — | | | — | | | (37,505) | |
| State income taxes | 1,188 | | | 1,189 | | | 1,014 | |
| State income tax credits | (3,926) | | | (2,139) | | | (804) | |
| Expiration of state income tax credits | 4,858 | | | 4,121 | | | 4,117 | |
| Federal income tax credits | (1,904) | | | (474) | | | (460) | |
| Excess tax benefits | (1,284) | | | (1,388) | | | (1,638) | |
| Nondeductible expenses | 2,303 | | | 1,786 | | | 1,890 | |
| Change in valuation allowance | (3,185) | | | (5,380) | | | (5,297) | |
| Other | (124) | | | (570) | | | 677 | |
| Income tax expense (benefit) | $ | (44,585) | | | $ | 10,553 | | | $ | (30,874) | |
As of October 31, 2020, the Company had $2.4 million of unrecognized tax benefits, as compared to no unrecognized tax benefits as of October 31, 2019. If recognized, the $2.4 million would reduce the Company's effective tax rate. The Company recognizes interest and penalties related to unrecognized tax benefits in its provision for income taxes. As of October 31, 2020, of the Company's recorded liability, $1.1 million relates to interest and penalties.
9. Earnings Per Share
Certain share-based payment awards entitling holders to receive non-forfeitable dividends before vesting are considered participating securities and thus included in the calculation of basic earnings per share, to the extent they are dilutive. These awards are included in the calculation of basic earnings per share under the two-class method. The two-class method allocates earnings for the period between common shareholders and other security holders. The participating awards receiving dividends are allocated the same amount of income as if they were outstanding shares.
The following table presents earnings per share (in thousands).
| | | | | | | | | | | | | | | | | |
| For the years ended |
| October 31, 2020 | | October 31, 2019 | | October 31, 2018 |
| Net income | $ | 28,274 | | | $ | 53,294 | | | $ | 61,431 | |
Distributed and undistributed (earnings) to unvested restricted stock | (372) | | | (778) | | | (878) | |
Distributed and undistributed earnings to common shareholders — Basic | 27,902 | | | 52,516 | | | 60,553 | |
| Weighted average shares outstanding — Basic | 21,943 | | | 21,829 | | | 22,429 | |
| Weighted average shares outstanding — Diluted | 21,943 | | | 21,829 | | | 22,429 | |
| Earnings per common share — Basic | $ | 1.27 | | | $ | 2.41 | | | $ | 2.70 | |
| Earnings per common share — Diluted | $ | 1.27 | | | $ | 2.41 | | | $ | 2.70 | |
10. Employee Benefit Plans
The Company has an Employee Stock Ownership Plan (“ESOP”) covering substantially all employees after one year of service. Contributions to the ESOP are made in cash at the discretion of the Company’s Board of Directors. The Company
made no contribution to the ESOP during fiscal 2020. In fiscal 2019 and 2018, total contributions to the ESOP were $3.0 million and $2.0 million, respectively. Contributions to the ESOP vary in amount, as the contributions are based on profitability.
The Company has a 401(k) Plan which covers substantially all employees after one year of service. Participants in the Plan may contribute up to the maximum allowed by Internal Revenue Service regulations. The Company matches 100% of employee contributions to the 401(k) Plan up to 3% of each employee’s salary, and 50% of employee contributions between 3% and 5% of each employee’s salary. The Company’s contributions to the 401(k) Plan totaled $12.2 million in fiscal 2020; $10.9 million in fiscal 2019; and $10.1 million in fiscal 2018.
11. Stock Compensation Plans
On February 17, 2005, the shareholders of the Company approved the Sanderson Farms, Inc. and Affiliates Stock Incentive Plan (the “Plan”). The Plan allows the Company’s Board of Directors to grant certain incentive awards including stock options, stock appreciation rights, restricted stock, and other similar awards. The Company was authorized to award up to 2,250,000 shares under the Plan. On February 17, 2011, the shareholders approved changes to the plan to increase the shares that may be issued under the plan from 2,250,000 to 3,500,000 shares and to increase the number of shares that may be granted in the form of restricted stock from 562,500 to 1,562,500 shares. On February 11, 2016, the shareholders approved the authorization of an additional 700,000 shares issuable under the plan, for a total of 4,200,000 authorized shares. The shareholders also approved an increase in the number of shares issuable as restricted stock from 1,562,500 to 2,112,500 shares. On February 13, 2020, the shareholders approved the authorization of an additional 600,000 shares issuable under the plan, for a total of 4,800,000 authorized shares, while the number of shares issuable as restricted stock remained stable.
Pursuant to the Plan, the Company’s Board of Directors approves agreements for the issuance of restricted stock to directors, executive officers and other key employees. Restricted stock granted in fiscal 2020, 2019 and 2018, vests three to four years from the date of grant. The vesting schedule is accelerated upon death, disability, the participant’s termination of employment after reaching retirement eligibility by reason of retirement, or upon a change in control, as defined in the Plan. Restricted stock grants are valued based upon the closing market price of the Company’s common stock on the date of grant and are recognized as compensation expense over the vesting period. Compensation expense related to restricted stock grants totaled $9.0 million, $8.4 million and $7.5 million during fiscal 2020, 2019 and 2018, respectively.
A summary of the Company’s restricted stock activity and related information is as follows:
| | | | | | | | | | | |
| Number of
Shares | | Weighted
Average Grant
Price |
| Outstanding at October 31, 2017 | 301,229 | | | $ | 77.86 | |
| Granted during fiscal 2018 | 65,250 | | | $ | 145.33 | |
| Vested during 2018 | (84,696) | | | $ | 68.82 | |
| Forfeited during 2018 | (2,352) | | | $ | 108.31 | |
| Outstanding at October 31, 2018 | 279,431 | | | $ | 96.10 | |
| Granted during fiscal 2019 | 88,334 | | | $ | 105.01 | |
| Vested during 2019 | (77,031) | | | $ | 88.37 | |
| Forfeited during 2019 | (6,464) | | | $ | 104.95 | |
| Outstanding at October 31, 2019 | 284,270 | | | $ | 100.76 | |
| Granted during fiscal 2020 | 68,675 | | | $ | 155.71 | |
| Vested during 2020 | (89,089) | | | $ | 76.06 | |
| Forfeited during 2020 | (3,378) | | | $ | 131.74 | |
| Outstanding at October 31, 2020 | 260,478 | | | $ | 123.29 | |
The Company had $13.3 million in unrecognized share-based compensation costs related to the 260,478 unvested shares as of October 31, 2020, that will be recognized over a weighted average period of 1 year, 6 months.
Also pursuant to the Plan, the Company’s Board of Directors approves Management Share Purchase Plan agreements (the “Purchase Plan”) that authorize the issuance of shares of restricted stock to the Company’s directors, executive officers and
other key employees. Pursuant to the Purchase Plan, non-employee directors may elect to receive up to 100 percent of their annual retainer and meeting fees in the form of restricted stock. Other participants may elect to receive up to 15 percent of their salary and up to 75 percent of any bonus earned in the form of restricted stock. The purchase price of the restricted stock is the closing market price of the Company’s common stock on the date of purchase. The Company makes matching contributions of 25 percent of the restricted shares purchased by participants. Restricted stock issued pursuant to the Purchase Plan vests after three years or immediately upon death, disability, or change in control, as defined. If an employee terminates employment after attaining eligibility for retirement, or a non-employee director retires upon the expiration of his or her board term, the participant’s Purchase Plan shares vest immediately. If a participant’s employment or service as a director is terminated for any other reason prior to the three-year vesting period, the participant forfeits the matching contribution and the Company may, at its option, repurchase restricted stock purchased by the participant at the price paid by the participant. Matching contributions are recognized as compensation expense over the vesting period. During fiscal 2020, 2019 and 2018, the participants purchased a total of 9,134; 7,350; and 10,697 shares of restricted stock pursuant to the Purchase Plan, valued at an average price of $128.70, $128.20, and $123.45, per share, respectively, and the Company issued 2,185; 1,741; and 2,565 matching shares, valued at an average price of $128.70, $128.20, and $123.45 per share, respectively. During fiscal 2020, 2019 and 2018, the participants vested in a total of 12,206; 17,142; and 17,040 shares of restricted stock pursuant to the Purchase Plan, valued at an average price of $116.20, $89.08, and $80.38, per share, respectively. During fiscal 2020, 2019 and 2018, the participants forfeited a total of 68; 321; and 259 shares of restricted stock pursuant to the Purchase Plan, respectively. Compensation expense related to the Company’s matching contribution totaled approximately $229,000, $351,000 and $289,000 in fiscal 2020, 2019 and 2018, respectively.
During fiscal 2020, 2019 and 2018, the Company entered into performance share agreements that grant certain officers and key employees the right to receive shares of the Company’s common stock, subject to the Company’s achievement of certain performance measures. The performance share agreements specify a target number of shares that a participant can receive based upon the Company’s average return on equity and average return on sales, as defined, during a two-year performance period beginning November 1 of each performance period. Although the performance share agreements have a two-year performance period, they are subject to an additional one year period during which the participant must remain employed by the Company before they are paid out. If the Company’s average return on equity and average return on sales meet or exceed certain threshold amounts for the performance period, participants will receive 50 percent to 200 percent of the target number of shares, depending upon the Company’s level of performance. Accruals for performance shares begin during the period management determines that achievement of the applicable performance based criteria is probable at some level. In estimating the probability of the number of shares that will be awarded, the Company considers, among other factors, current and projected grain costs and chicken volumes and pricing, as well as the amount of the Company's commitments to procure grain at a fixed price throughout the performance period. Due to the high level of volatility of these commodity prices and the impact that the change in pricing can have on the Company’s results, the Company’s assessment of probability can change from period to period and can result in a significant revision to the amounts accrued related to the arrangements, as the accruals are adjusted using the cumulative catch-up method of accounting.
The target number of shares specified in the performance share agreements entered into on November 1, 2019 totaled 56,575. As of October 31, 2020, the Company could not determine that achievement of the applicable performance based criteria is probable due to actual operating results for the first year of the two-year performance period falling below threshold levels, and the uncertainties discussed above, and therefore recorded no compensation expense related to those agreements.
The Company also has performance share agreements in place with certain officers and key employees that were entered into on November 1, 2018. The two-year performance period for those agreements has ended, and the Company's operating results during the period did not meet the threshold levels; therefore, no compensation expense was recorded related to those agreements.
The Compensation Committee of the Company's Board of Directors determined that the performance share agreements entered into on November 1, 2017, were earned at a level between the threshold and target levels for the return on sales criterion and that the threshold level for the return on equity criterion was not achieved. Accordingly, fiscal 2020 includes compensation expense of $0.7 million, related to those agreements, as compared to $1.3 million during fiscal 2019. Because management's initial determination of probability was made during fiscal 2019, and because the accrual is made using the cumulative catch up method, the compensation expense recorded during fiscal 2019 related to the agreements entered into on November 1, 2017, was greater than that recorded during fiscal 2020. On October 31, 2020, a total of 13,055 shares from the agreements entered into on November 1, 2017 vested, and those shares were issued on November 2, 2020.
Had the Company determined that it was probable that the maximum amount of those outstanding awards from the agreements entered into on November 1, 2019 would be earned, an additional $6.0 million would have been accrued as of October 31, 2020.
A summary of the Company's compensation cost related to performance share agreements is as follows (in thousands):
| | | | | | | | | | | | | | | | | | | | | | | |
| Number of shares issued (actual (a) or estimated (e)) | | For the years ended |
| Date of Performance Share Agreement | | October 31, 2020 | | October 31, 2019 | | October 31, 2018 |
| November 1, 2015 | 145,197 | (a) | | $ | — | | | $ | — | | | $ | 3,341 | |
| November 1, 2016 | 84,511 | (a) | | — | | | 2,504 | | | 5,238 | |
| November 1, 2017 | 13,055 | (a) | | 665 | | | 1,270 | | | — | |
| November 1, 2018 | — (a) | | — | | | — | | | — | |
| November 1, 2019 (1) | — (e) | | — | | | — | | | — | |
| Total compensation cost | | | $ | 665 | | | $ | 3,774 | | | $ | 8,579 | |
Note (1) - As of October 31, 2020, the Company could not determine that achievement of the applicable performance-based criteria is probable for the agreements entered into on November 1, 2019 due to operating results to date and the uncertainties discussed above, and therefore recorded no compensation expense related to those agreements.
12. Commitments and Contingencies
Labor Relations
The Company has approximately 17,445 employees as of October 31, 2020, approximately 2,165 of whom are covered by collective bargaining agreements. Each collective bargaining agreement has a grievance procedure and no strike-no lockout clauses that should assist in maintaining stable labor relations at the applicable facility.
Purchase Obligations
At October 31, 2020, the Company’s estimated outstanding contractual obligations for feed grains, feed ingredients, packaging supplies, construction projects and new equipment totaled $108.5 million, with the entire amount due in fiscal 2020.
The timing of expenditures related to the obligations discussed above is subject to change as the contracts mature.
Litigation
In re Broiler Chicken Antitrust Litigation
Between September 2, 2016 and October 13, 2016, Sanderson Farms, Inc. and our subsidiaries were named as defendants, along with 13 other poultry producers and certain of their affiliated companies, in multiple putative class action lawsuits filed by direct and indirect purchasers of broiler chickens in the United States District Court for the Northern District of Illinois. The complaints allege that the defendants conspired to unlawfully fix, raise, maintain, and stabilize the price of broiler chickens, thereby violating federal and certain states’ antitrust laws, and also allege certain related state-law claims. The complaints also allege that the defendants fraudulently concealed the alleged anticompetitive conduct in furtherance of the conspiracy. The complaints seek damages, including treble damages for the antitrust claims, injunctive relief, costs, and attorneys’ fees. As detailed below, the Court has consolidated all of the direct purchaser complaints into one case, and the indirect purchaser complaints into two cases, one on behalf of commercial and institutional indirect purchaser plaintiffs and one on behalf of end-user consumer plaintiffs. The cases are part of a coordinated proceeding captioned In re Broiler Chicken Antitrust Litigation.
On October 28, 2016, the direct and indirect purchaser plaintiffs filed consolidated, amended complaints, and on November 23, 2016, the direct and indirect purchaser plaintiffs filed second amended complaints. On December 16, 2016, the indirect purchaser plaintiffs separated into two cases. On that date, the commercial and institutional indirect purchaser plaintiffs filed a third amended complaint, and the end-user consumer plaintiffs filed an amended complaint.
On January 27, 2017, the defendants filed motions to dismiss the amended complaints in all of the cases, and on November 20, 2017, the motions to dismiss were denied. On February 7, 2018, the direct purchaser plaintiffs filed their third amended complaint, adding three additional poultry producers as defendants. On February 12, 2018, the end-user consumer plaintiffs filed their second amended complaint, in which they also added three additional poultry producers as defendants, along with Agri Stats, Inc. On February 20, 2018, the commercial and institutional indirect purchaser plaintiffs filed their fourth amended complaint. On November 13, 2018, the commercial and institutional indirect purchaser plaintiffs filed their fifth amended complaint, adding three additional poultry producers as defendants. On November 28, 2018, the end-user consumer plaintiffs filed their third amended complaint. On January 15, 2019, the direct purchaser plaintiffs filed their fourth amended complaint, and the commercial and institutional indirect purchaser plaintiffs filed their sixth amended complaint. Both the direct purchaser plaintiffs and the commercial and institutional indirect purchaser plaintiffs added two new poultry producers as defendants, as well as Agri Stats, Inc. On August 6, 2020, the end-user consumer plaintiffs filed a motion for leave to file a fifth amended complaint. The Court granted the end-user consumer plaintiffs’ motion on September 22, 2020 and deemed the version of the complaint filed on August 7, 2020 operative on October 19, 2020. On October 23, 2020, the direct purchaser plaintiffs filed their fifth amended complaint and the commercial and institutional indirect purchaser plaintiffs filed their seventh amended complaint.
Between December 8, 2017 and December 4, 2020, additional purported direct-purchaser entities individually brought fifty-five separate suits against 20 poultry producers, including Sanderson Farms and Agri Stats, Inc., in the United States District Court for the Northern District of Illinois, the United States District Court for the District of Kansas, the United States District Court for the Western District of Arkansas, and the United States District Court for the District of Puerto Rico. These suits allege substantially similar claims to the direct purchaser class complaint described above; certain of the suits additionally allege related state-law and common-law claims, and related claims under federal and Georgia RICO statutes. Four complaints filed on June 12, 2020 and another complaint amended on July 24, 2020, also plead allegations of federal bid rigging. Those suits filed in the Northern District of Illinois are now pending in front of the same judge as the putative class action lawsuits. On June 26, 2018, the defendants filed a motion to transfer the case filed in the District of Kansas to the Northern District of Illinois, and that motion was granted on September 13, 2018. On June 7, 2019, the plaintiffs filed a motion to transfer the case filed in the Western District of Arkansas to the Northern District of Illinois, and that motion was granted on June 11, 2019. On July 24, 2019, one of the defendants filed a motion to transfer the case filed in the District of Puerto Rico to the Northern District of Illinois, and that motion was granted on July 25, 2019. On July 22, 2019, the Company moved to dismiss in part those direct-purchaser complaints that allege claims under federal and Georgia RICO statutes against it. The motion was fully briefed on September 20, 2019, and the Court heard argument on the motion on December 18, 2019. On March 3, 2020, the Court denied the Company's motion. On October 18, 2019, defendants moved to dismiss the case filed by the Commonwealth of Puerto Rico on its behalf and on behalf of its citizens. The motion was fully briefed on January 21, 2020. On July 15, 2020, the Court dismissed Puerto Rico's claims on behalf of its citizens. On July 2, 2020 and August 6, 2020, certain defendants, including the Company, moved to exclude bid rigging allegations and claims from the consolidated In re Broiler Chicken Antitrust Litigation. Plaintiffs filed oppositions on August 6, 2020 and August 20, 2020. Defendants filed replies on August 20, 2020 and September 3, 2020. On September 22, 2020, the Court ordered that plaintiffs’ bid-rigging allegations are bifurcated and any discovery on such claims is stayed until plaintiffs’ supply reduction and Georgia Dock theories are resolved. On October 20, 2020, certain direct action plaintiffs filed a motion for leave to amend their complaints. On October 23, 2020, the direct action plaintiffs filed a consolidated complaint. Defendants filed an opposition to certain direct action plaintiffs’ motion to amend on November 4, 2020. Briefing was completed on November 16, 2020. The motion remains pending.
On October 30, 2020, direct purchaser plaintiffs, commercial and institutional indirect purchaser plaintiffs, and end-user consumer plaintiffs filed motions for class certification. Defendants' oppositions to class certification are due January 22, 2021. Class plaintiffs' replies in support of class certification are due March 15, 2021.
The parties are currently engaged in discovery, subject to the COVID-19-related delays discussed below. It is possible additional individual actions may be filed.
Since March 16, 2020, given the current COVID-19 public health emergency, the Northern District of Illinois issued three orders extending all deadlines in civil cases by 21 days, 28 days and 28 days, respectively, and five orders that did not extend any deadlines, but explained other court procedures to protect the public health and welfare. These orders apply to the litigation described above. The Northern District of Illinois will vacate, amend or extend the Eighth Amended General Order on or before January 25, 2021.
Department of Justice Antitrust Investigation
The Company is aware that certain plaintiffs’ counsel in In re Broiler Chicken Antitrust Litigation received from the United States Department of Justice, Antitrust Division, a subpoena that included a request to produce all discovery in the case to a grand jury. On June 27, 2019, the Court in In re Broiler Chicken Antitrust Litigation permitted the United States Department of Justice to intervene in the case, as well as ordered certain discovery stayed until September 27, 2019. Before the discovery stay expired on September 27, 2019, the United States Department of Justice asked the Court in In re Broiler Chicken Antitrust Litigation to extend the discovery stay for an additional six months. On September 25, 2019, the Court granted the additional stay of not less than three months. On October 16, 2019, after further consideration, the Court extended the stay until June 27, 2020. On December 18, 2019, the Court after further consideration ordered that the stay be lifted on March 31, 2020.
The Company received a grand jury subpoena in connection with the United States Department of Justice Antitrust Division investigation on September 9, 2019. The Company is complying with the subpoena and providing documents and information as requested by the Department of Justice in connection with its investigation.
State of New Mexico, ex rel. Hector Balderas v. Koch Foods Inc., et al.
On September 1, 2020, the Attorney General of the State of New Mexico filed a lawsuit in New Mexico state court against Agri Stats, Inc. and producer defendants, including the Company. The case brings claims under the New Mexico Antitrust Act and New Mexico Unfair Trade Practices Act, as well as a common law unjust enrichment claim.
We intend to continue to defend the lawsuits vigorously; however, the Company cannot predict the outcome of these actions. If the plaintiffs were to prevail or the Department of Justice were to pursue charges, the Company could be liable for damages or other sanctions, which could have a material, adverse effect on our financial position and results of operations.
In re Broiler Chicken Grower Litigation
On January 27, 2017, Sanderson Farms, Inc. and our subsidiaries were named as defendants, along with four other poultry producers and certain of their affiliated companies, in a putative class action lawsuit filed in the United States District Court for the Eastern District of Oklahoma. On March 27, 2017, Sanderson Farms, Inc. and our subsidiaries were named as defendants, along with four other poultry producers and certain of their affiliated companies, in a second putative class action lawsuit filed in the United States District Court for the Eastern District of Oklahoma. The Court ordered the suits consolidated into one proceeding, and on July 10, 2017, the plaintiffs filed a consolidated amended complaint. The consolidated amended complaint alleges that the defendants unlawfully conspired by sharing data on compensation paid to broiler farmers, with the purpose and effect of suppressing the farmers’ compensation below competitive levels. The consolidated amended complaint also alleges that the defendants unlawfully conspired to not solicit or hire the broiler farmers who were providing services to other defendants. The consolidated amended complaint seeks treble damages, costs and attorneys’ fees. On September 8, 2017, the defendants filed a motion to dismiss the amended complaint, on October 23, 2017, the plaintiffs filed their response, and on November 22, 2017, the defendants filed a reply. On January 19, 2018, the Court granted the Sanderson Farms defendants’ motion to dismiss for lack of personal jurisdiction.
On February 21, 2018, the plaintiffs filed a substantially similar lawsuit in the United States District Court for the Eastern District of North Carolina against Sanderson Farms and our subsidiaries and another poultry producer. The plaintiffs subsequently moved to consolidate this action with the Eastern District of Oklahoma action in the Eastern District of Oklahoma for pre-trial proceedings, with the defendants in support thereof. That motion was denied. On July 13, 2018, the defendants moved to dismiss the lawsuit in the Eastern District of North Carolina, and briefing was completed on September 4, 2018. On January 15, 2019, the Court granted in part the defendants’ motion to dismiss and stayed the action in the Eastern District of North Carolina pending resolution of the action in the Eastern District of Oklahoma. On January 6, 2020, the Court in the Eastern District of Oklahoma denied defendants’ motion to dismiss. On January 27, 2020, plaintiffs in the Oklahoma case moved for leave to amend their complaint. The Court in the Eastern District of Oklahoma granted the plaintiffs' motion, and the plaintiffs filed a consolidated amended complaint on February 21, 2020. The Oklahoma case is ongoing. On May 27, 2020, the Company moved to dismiss the action in the Eastern District of North Carolina under the first-to-file rule. Plaintiffs filed their opposition on June 17, 2020, and the Company filed its reply on July 1, 2020. The motion is fully briefed and awaiting the Court's decision.
On September 11, 2020, additional named grower plaintiffs filed an identical putative class action in the District Court of Colorado against Sanderson Farms, Inc. and its Foods, Production, and Processing Divisions, as well as the other poultry producer defendants in the Oklahoma action. On October 14, 2020, Defendants moved to dismiss the case under the first-to-file doctrine because it is substantively identical to the earlier-filed cases pending in Oklahoma and North Carolina. Briefing on that motion was completed on December 16, 2020.
On September 18, 2020, another named grower plaintiff filed another duplicate class action in the District Court of Kansas against the same defendants as the Colorado action. On October 13, 2020, Defendants moved to dismiss the case under the first-to-file doctrine because it is substantively identical to the earlier-filed cases pending in Oklahoma, North Carolina, and Colorado. Briefing on that motion was completed on December 15, 2020.
On October 8, 2020, new named grower plaintiffs filed another duplicate class action in the Northern District of California against the same defendants as the Colorado and Kansas actions. The Company waived service of the Complaint on December 11, 2020.
On October 23, 2020, the District Court of Kansas stayed proceedings in that action (other than those related to the first-to-file motion) pending resolution of the first-to-file motion and the multi-district litigation ("MDL") consolidation motion discussed below. On November 12, 2020, the District Court of Colorado stayed proceeding in that action (other than those related to the first-to-file motion) pending resolution of the first-to-file motion and the MDL consolidation motion discussed below.
On October 6, 2020, Plaintiffs in the Oklahoma action moved to consolidate all of these duplicative cases into a MDL before the judge presiding over the Oklahoma case. Briefing on that motion was completed on November 6, 2020, and oral argument on the motion occurred on December 3, 2020. On December 15, 2020, the panel ordered that all actions be consolidated in the Eastern District of Oklahoma for pretrial proceedings. Given the panel's ruling on consolidation, the Company does not expect rulings on the first-to-file motions in the various actions described above.
We intend to defend these cases vigorously; however, the Company cannot predict the outcome of these actions. If the plaintiffs were to prevail, the Company could be liable for damages, which could have a material, adverse effect on our financial position and results of operations.
Antitrust Civil Investigative Demands
On February 21, 2017, Sanderson Farms, Inc. received an antitrust civil investigative demand from the Office of the Attorney General, Department of Legal Affairs, of the State of Florida. Among other things, the demand seeks information related to the Georgia Dock Index and other information on poultry and poultry products published by the Georgia Department of Agriculture and its Poultry Market News division. The Company is cooperating fully with the investigative demand, and we have responded to all requests received to date; however, we are unable to predict its outcome at this time. Separately, the Company has become aware that certain plaintiffs’ counsel in In re Broiler Chicken Antitrust Litigation received from the Office of the Attorney General, Department of Legal Affairs, of the State of Florida, an antitrust civil investigative demand that includes a request to produce all documents submitted by the recipients to the Department of Justice relating to In re Broiler Chicken Antitrust Litigation.
The Company is also aware that certain plaintiffs’ counsel in In re Broiler Chicken Antitrust Litigation received from the Louisiana Department of Justice - Office of the Attorney General a Civil Investigation Demand that included a request to produce all deposition transcripts from the civil litigation.
On August 6, 2020, the Company received a Civil Investigative Demand from the Office of the Attorney General for the State of Washington seeking information in connection with its investigation of possible violations of the Washington Consumer Protection Act and/or the Sherman Act concerning contracts, combinations, or conspiracies in restraint of trade or commerce in the market for Broiler Chicken. The Company is cooperating with the investigative demand and providing documents and information as requested by the Office of the Attorney General. The Company is unable to predict the outcome of the investigation at this time.
Friends of the Earth, et al v. Sanderson Farms, Inc.
On June 22, 2017, the Company was named as a defendant in a lawsuit filed in the United States District Court for the Northern District of California. The complaint, which was brought by three non-profit organizations (the Organic Consumers Association, Friends of the Earth, and Center for Food Safety) alleged that the Company is violating the California Unfair Competition Law and the California False Advertising Law by representing that its poultry products are “100% Natural” products raised with “100% Natural” farming procedures. Among other things, the plaintiffs alleged that the Company’s products contain residues of human and animal antibiotics, other pharmaceuticals, hormones, steroids, and pesticides. Plaintiffs sought an order enjoining the Company from continuing its allegedly unlawful marketing program and requiring the Company to conduct a corrective advertising campaign; an accounting of the Company’s profits derived from the allegedly unlawful marketing practices; and attorneys’ fees, costs and interest. On August 2, 2017, the Company moved to dismiss the lawsuit on various grounds. On August 23, 2017, the plaintiffs filed an amended complaint, which included substantially similar allegations as the original complaint, and the Company filed a motion to dismiss the amended complaint on September 13, 2017. On February 9, 2018, the Court denied the Company’s motion to dismiss. An initial scheduling conference was held on March 1, 2018, and discovery started thereafter. On June 25, 2018, the plaintiffs amended their complaint for a second time, including to remove allegations that the USDA had found the Company’s chicken samples to contain residues of antibiotics or other substances. On July 9, 2018, the Company filed a motion to dismiss the second amended complaint. On July 18, 2018, during the pendency of that motion, the parties stipulated to the voluntary dismissal of one of the plaintiff organizations (the Organic Consumers Association). The other two plaintiffs continued to prosecute their claims. On September 11, 2018, the Court granted the motion to dismiss the second amended complaint with leave to amend the complaint, and on October 2, 2018, the remaining plaintiffs filed a third amended complaint. The third amended complaint alleged that the Company misleads consumers with regard to (1) the presence of unnatural residues in its chicken products; (2) the fact that it uses antibiotics in raising its chickens; (3) the conditions in which it raises its chickens; and (4) the risks of human antibiotic resistance caused by the Company’s use of antibiotics. On October 16, 2018, the Company filed a motion to dismiss the third amended complaint, and on December 3, 2018, the Court denied that motion. Fact discovery concluded on March 18, 2019. On April 1, 2019, the Company filed a motion to dismiss for lack of subject matter jurisdiction on grounds that the remaining plaintiffs lacked standing. The Court held a hearing on the Company’s motion on May 30, 2019. On July 31, 2019, the Court granted the Company’s motion without prejudice, stating that dismissal for lack of standing must be without prejudice, but denied the plaintiffs leave to amend their complaint. On October 8, 2019, the Court taxed $12,701 in costs in favor of the Company as the prevailing party.
On August 30, 2019, plaintiffs filed a notice of appeal of the District Court’s order of dismissal before the United States Court of Appeals for the Ninth Circuit. Plaintiffs’ filed their opening brief on appeal on January 8, 2020, the Company filed its response brief on March 9, 2020, and Plaintiffs filed their reply brief on April 29, 2020. The Court held oral argument on October 13, 2020. We intend to vigorously defend the appeal. However, the Company cannot predict the outcome of this action. If the plaintiffs were to prevail, the Company’s reputation and marketing program could be materially, adversely affected, which could have a material, adverse effect on our financial position and results of operations.
Judy Jien v. Perdue Farms, Inc., et al.
On August 30, 2019, Sanderson Farms, Inc. and its Foods and Processing Divisions, as well as seventeen other poultry producers and their affiliates; Agri Stats, Inc.; and Webber, Meng, Sahl and Company, Inc. (“WMS”), were named in a putative class action filed in the United States District Court for the District of Maryland. Three other nearly identical putative class action complaints, each seeking to represent the same putative class, also were filed. The complaints, brought on behalf of non-supervisory production and maintenance employees at broiler chicken processing plants, alleged that the defendants unlawfully conspired by agreeing to fix and depress the compensation paid to them, including hourly wages and compensation benefits, from January 1, 2009 to the present. The plaintiffs claim that broiler producers shared competitively sensitive wage and benefits compensation information in three ways: (1) attending in-person meetings in Destin, Florida; (2) receiving Agri Stats reports, as well as surveys taken and published by WMS; and (3) directly exchanging wage and benefits information with plant managers at other defendant broiler producers. Plaintiffs allege that this conduct violated the Sherman Antitrust Act.
On November 12, 2019, the Court ordered that the four putative class action complaints would be consolidated for all pretrial purposes. The Court ordered plaintiffs to file their consolidated complaint on or before November 14, 2019. Defendants’ motions to dismiss the consolidated complaint were filed on November 22, 2019. Briefing was scheduled to be completed on or before February 28, 2020; however, after the defendants filed their motions to dismiss, on November 26, 2019, plaintiffs notified defendants that they intended to file an amended consolidated complaint. Plaintiffs filed an amended consolidated complaint on December 20, 2019. Plaintiffs name as defendants Sanderson Farms, Inc. and its Foods and Processing
Divisions, as well as ten other broiler chicken producers and their affiliates; three turkey producers and their affiliates; Agri Stats, Inc.; and WMS. Plaintiffs bring their amended consolidated complaint on behalf of employees at broiler chicken and turkey processing plants and allege that the defendants unlawfully conspired by agreeing to fix and depress the compensation paid to them. On January 9, 2020 and January 27, 2020, the court approved the voluntary dismissal without prejudice of two of the three nearly identical putative class action lawsuits. On March 12, 2020, the Court approved the voluntary dismissal without prejudice of the third nearly identical putative class action lawsuit.
On March 2, 2020, defendants moved to dismiss the amended consolidated complaint. The Company also filed an individual motion to dismiss plaintiffs’ claims against the Company. Plaintiffs’ oppositions were originally due on April 24, 2020 and defendants’ replies were due on May 21, 2020. However, on March 20, 2020, the District of Maryland issued Second Amended Standing Order 2020-02, extending all filing deadlines set to fall between March 16, 2020 and April 24, 2020 by 42 days. On April 10, 2020, the District of Maryland issued Standing Order 2020-07, extending all filing deadlines set to fall between March 16, 2020 and June 5, 2020 by 84 days. On May 22, 2020, the District of Maryland issued Standing Order 2020-11, which affirmed the prior Order's 84-day extension but did not extend deadlines further. Pursuant to Standing Order 2020-07, plaintiffs’ filed their omnibus opposition to defendants’ motion to dismiss on July 17, 2020. Defendants filed replies on August 13, 2020. On September 16, 2020, the court granted in part and denied in part defendants’ motion without prejudice, finding that plaintiffs’ allegations against certain defendant corporate families, including the Company, were deficient. On October 16, 2020, plaintiffs moved for leave to file a second amended complaint. Defendants must answer or move to dismiss the second amended complaint by December 18, 2020. Briefing on motions to dismiss the second amended complaint will be complete by February 25, 2021. No discovery has taken place to date. We intend to defend this case vigorously; however, the Company cannot predict the outcome of these actions. If the plaintiffs were to prevail, the Company could be liable for damages, which could have a material, adverse effect on our financial position and results of operations.
La Fosse, et al. v. Sanderson Farms, Inc.
On October 11, 2019, three named plaintiffs (Daniel Lentz, Pam La Fosse, and Marybeth Norman) filed, in the United States District Court for the Northern District of California, a nationwide class action against the Company on behalf of a putative class of all individuals and businesses throughout the United States who purchased one or more of the Company's chicken products in the prior four years. The lawsuit alleges that the named plaintiffs and other class members purchased the Company's chicken products based on misleading representations in the Company’s advertising. Specifically, the plaintiffs in this case allege that the Company’s advertising (including, but not limited to, on its website, television commercials, radio advertisements, social media, print magazines, billboards, and trucks) misleads consumers into believing that (i) the Company’s chickens were not given antibiotics or other pharmaceuticals, (ii) the chickens were raised in a “natural” environment, (iii) there is no evidence that the use of antibiotics or other pharmaceuticals in poultry contributes to the evolution of antibiotic-resistant bacteria, and (iv) the Company’s chicken products do not contain antibiotic or pharmaceutical residues. Plaintiffs allege that (i) the Company “routinely” feeds antibiotics and pharmaceuticals to its chickens, (ii) the Company raises its chickens indoors in “unnatural” indoor conditions amounting to “intensive confinement” and without natural light (iii) there is “extensive” reliable evidence that the use of antibiotics in poultry contributes to antibiotic-resistant bacteria, and (iv) the Company’s chickens have been found to contain antibiotic and pharmaceutical residue. The original Complaint asserted five causes of action under California and North Carolina law. The plaintiffs sought injunctive relief directing the Company to correct its practices and to comply with consumer protection laws nationwide. The plaintiffs also sought monetary damages, as well as fees and costs. On December 20, 2019, the Company filed a motion to dismiss. On February 10, 2020, the Court granted the motion to dismiss in part, denied it in part, and granted the plaintiffs leave to amend the Complaint. On March 23, 2020, two of the three original plaintiffs (Pam La Fosse and Marybeth Norman) filed a First Amended Complaint in which they were joined by five additional named plaintiffs purporting to assert claims on behalf of a putative nationwide class of consumers and businesses who purchased the Company's chicken products in the prior four years. The core allegations and theories set forth in the First Amended Complaint are the same as in the original complaint. The First Amended Complaint asserted one cause of action under federal law and sixteen causes of action under the laws of various states. The plaintiffs again sought injunctive relief directing the Company to correct its practices and to comply with consumer protection laws nationwide, as well as monetary damages, fees and costs. On May 6, 2020, the Company filed a partial motion to dismiss the First Amended Complaint, which the Court granted on July 2, 2020 with leave to amend. On July 23, 2020, plaintiffs Pam La Fosse and Sharon Manier filed a Second Amended Complaint on behalf of a putative class of consumers who purchased the Company's chicken in California in the prior four years. Like the earlier iterations of the complaint, the Second Amended Complaint alleges that the remaining plaintiffs and other class members purchased the Company's chicken products based on misleading representations in the Company's advertising, including for the reasons set forth in their prior complaints. The plaintiffs again seek injunctive relief, monetary damages, fees and costs. On August 6,
2020, the Company moved to dismiss the Second Amended Complaint in part, requesting dismissal of plaintiffs' new implied warranty of merchantability claim. On August 20, 2020, plaintiffs voluntarily agreed to withdraw their new implied warranty claim. Discovery commenced in October 2020. We intend to defend this case vigorously; however, the Company cannot predict the outcome of these actions. If the plaintiffs were to prevail, the Company could be liable for damages, which could have a material, adverse effect on our financial position and results of operations.
In Defense of Animals, et al. v. Sanderson Farms, Inc.
On July 31, 2020, two non-profit organizations (In Defense of Animals and Friends of the Earth) filed a complaint against the Company in the United States District Court for the Northern District of California. The complaint asserts substantially similar (and in many cases identical) allegations and claims against the Company as the prior case brought by Friends of the Earth and other organizations, which the court dismissed in July 2019 and which is currently on appeal to the United States Court of Appeals for the Ninth Circuit. Specifically, the plaintiffs assert that the Company violates the California Unfair Competition Law and the California False Advertising Law by representing that its poultry products are “100% Natural” products raised with “100% Natural” farming procedures. Plaintiffs allege that the Company’s advertising (including, but not limited to, on its website, television commercials, radio advertisements, social media, print magazines, billboards, and trucks) misleads consumers into believing that (i) the Company’s chickens were not given antibiotics or other pharmaceuticals, (ii) the chickens were raised in a “natural” environment, (iii) there is no evidence that the use of antibiotics or other pharmaceuticals in poultry contributes to the evolution of antibiotic-resistant bacteria, and (iv) the Company’s chicken products do not contain antibiotic or pharmaceutical residues. Plaintiffs allege that (i) the Company “routinely” feeds antibiotics and pharmaceuticals to its chickens, (ii) the Company raises its chickens indoors in “unnatural” indoor conditions amounting to “intensive confinement” and without natural light, (iii) there is “extensive” reliable evidence that the use of antibiotics in poultry contributes to antibiotic-resistant bacteria, and (iv) the Company’s chickens have been found to contain antibiotic and pharmaceutical residue. The plaintiffs seek injunctive relief directing the Company to correct its practices and to comply with consumer protection laws nationwide as well as in the form of a corrective advertising campaign. The plaintiffs also seek fees and costs. On August 12, 2020, the Company agreed to waive service of the complaint. The parties have agreed to stay the case at least through the earlier of April 2, 2021, or the United States Court of Appeals for the Ninth Circuit's decision in the pending appeal in the prior case brought by Friends of the Earth and other organizations. No discovery has taken place to date. We intend to defend this case vigorously; however, the Company cannot predict the outcome of these actions. If the plaintiffs were to prevail, the Company could be liable for damages, which could have a material, adverse effect on our financial position and results of operations.
Other
On January 30, 2017, the Company received a letter from an attorney representing a putative shareholder demanding that the Company take action against current and/or former officers and directors of the Company for alleged breach of their fiduciary duties. The shareholder asserted that the officers and directors (i) failed to take any action to stop the alleged antitrust conspiracy described above, despite their alleged knowledge of the conspiracy, and (ii) made and/or caused the Company to make materially false and misleading statements by failing to disclose the alleged conspiracy. The shareholder also asserted that certain directors engaged in “insider sales” from which they improperly benefited. In addition to demanding that the officers and directors be sued, the shareholder also demanded that the Company adopt unspecified corporate governance improvements. On February 9, 2017, pursuant to statutory procedures available in connection with demands of this type, the Company’s board of directors appointed a special committee of qualified directors to determine, after conducting a reasonable inquiry, whether it was in the Company’s best interests to pursue any of the actions demanded in the shareholder’s letter. On April 26, 2017, the special committee reported to the Company’s board of directors its determination that it was not in the Company’s best interests to take any of the demanded actions at that time, and that no governance improvements related to the subject matter of the demand were needed. On May 5, 2017, the special committee’s counsel informed the shareholder’s counsel of the committee’s determination. As of the date of filing of this report, and to the Company’s knowledge, no legal proceedings related to the shareholder’s demand have been filed.
The Company is involved in various other claims and litigation incidental to its business. Although the outcome of these matters cannot be determined with certainty, management, upon the advice of counsel, is of the opinion that the final outcome of currently pending matters, other than those discussed above, should not have a material effect on the Company’s consolidated results of operations or financial position.
The Company recognizes the costs of legal defense for the legal proceedings to which it is a party in the periods incurred. After a considerable analysis of each case, the Company has determined that no accrual is required for any of the foregoing matters as of October 31, 2020. Future reserves may be required if losses are deemed reasonably estimable and probable due to changes in the Company’s assumptions, the effectiveness of legal strategies, or other factors beyond the Company’s control. Future results of operations may be materially affected by the creation of reserves or by accruals of losses to reflect any adverse determinations in these legal proceedings.
13. Quarterly Financial Data (unaudited)
| | | | | | | | | | | | | | | | | | | | | | | |
| Fiscal Year 2020 |
| First
Quarter | | Second
Quarter | | Third
Quarter | | Fourth
Quarter |
| (In thousands, except per share data) |
| | | (Unaudited) | | |
| Net sales | $ | 823,078 | | | $ | 844,711 | | | $ | 956,455 | | | $ | 940,023 | |
| Gross profit (loss) | (446) | | | 12,428 | | | 90,458 | | | 91,716 | |
| Net income (loss) | (38,576) | | | 6,118 | | | 32,810 | | | 27,922 | |
| Diluted earnings (loss) per share | $ | (1.76) | | | $ | 0.28 | | | $ | 1.48 | | | $ | 1.26 | |
| | | | | | | | | | | | | | | | | | | | | | | |
| Fiscal Year 2019 |
| First
Quarter | | Second
Quarter | | Third
Quarter | | Fourth
Quarter |
| (In thousands, except per share data) |
| | | (unaudited) | | |
| Net sales | $ | 743,388 | | | $ | 845,229 | | | $ | 945,152 | | | $ | 906,489 | |
| Gross profit | 34,988 | | | 104,396 | | | 121,008 | | | 18,743 | |
| Net income (loss) | (17,833) | | | 40,636 | | | 53,362 | | | (22,871) | |
| Diluted earnings (loss) per share | $ | (0.82) | | | $ | 1.83 | | | $ | 2.41 | | | $ | (1.05) | |
During the second quarter of fiscal 2020, when the CARES Act was enacted, the Company recognized a net discrete income tax benefit of approximately $37.5 million related to net operating loss carry-back provisions, which affects the comparability of the net income (loss) lines in the tables above. For a more detailed discussion of the Company's income taxes, refer to "Part II, Item 8, Notes to Consolidated Financial Statements, Note 8 - Income Taxes."
14. Common Stock Repurchases
During fiscal 2018, the Company purchased 823,385 shares of its common stock in open-market transactions at an average price of $101.37 per share. In accordance with ASC 505-30, the Company elected to allocate the excess of the repurchase price over par value between paid-in capital and retained earnings. As a result, approximately $59.6 million of the excess repurchase price over par value was allocated to paid-in capital and approximately $23.0 million was allocated to retained earnings. The Company made no common stock repurchases during fiscal 2019 or fiscal 2020, except for those made pursuant to the Company's Stock Incentive Plan, as amended and restated on February 13, 2020, under which shares were withheld from plan participants to satisfy tax withholding obligations.
15. Leases
The Company, using the guidance in Accounting Standards Codification ("ASC") 842, Leases, determines if an agreement is a lease at the inception of the agreement, and when a lease exists, we follow the guidance in ASC 842 to determine whether the lease is an operating or finance lease. The Company is a party to certain agreements that are classified as operating leases, and those are recorded on our consolidated balance sheet as right-of-use assets, current lease liabilities, and long-term lease liabilities. The Company is not a party to any finance lease arrangements. The Company has elected not to record short-term leases with initial terms of twelve months or less in our consolidated balance sheet. Lease expenses related to those short-term leases are recognized on a straight-line basis over the term of the lease.
The initial assets and corresponding liabilities recorded at commencement of our operating leases are based on the present value of the future minimum lease payments over the lease term. In determining the present value, we use the implicit interest rate in the agreement, if provided. If an implicit interest rate is not provided, we determine the present value of the future minimum lease payments using our incremental borrowing rate based on available information at the lease commencement. When lease agreements contain residual value guarantees that are considered probable, those are included in calculating the amount of lease liabilities to record. Operating lease expense is recognized on a straight-line basis over the lease term with a corresponding reduction to the right-of-use asset and the applicable lease liability. Lease expense is classified as cost of sales or selling, general and administrative in our consolidated statement of operations based on the use of the leased item.
The operating leases to which the Company is a party are primarily related to transportation equipment, equipment used in production processes and the assets of independent contract producers who house our live birds. A significant portion of the costs associated with leases related to the use of assets of independent contract poultry producers who house and care for our live birds are for non-lease components of our agreements with such producers. Non-lease components of payments made to independent contract poultry producers include those related to the operating costs of, and services provided by, such producers. For costs associated with such leases, we elected to account for the lease and non-lease components as a single lease component, and all costs associated with such leases are disclosed as variable lease costs in the table below. The following table presents the components of our lease costs (in thousands) paid during fiscal year 2020.
| | | | | |
| Description | Fiscal Year 2020 |
| Operating lease cost | $ | 15,673 | |
| Short-term lease cost | 3,342 | |
Variable lease cost (1) | 421,900 | |
| Total lease cost | $ | 440,915 | |
(1) Variable lease costs are attributable to payments made to independent contract poultry producers and are based on or influenced by output received from contract producers, birds placed, poultry house size and relative performance.
Other information regarding our operating leases includes the following:
| | | | | |
| Description | Amount |
| Cash outflows for operating leases included in the measurement of lease liabilities during fiscal year 2020 (in thousands) | $ | 13,860 |
Non-cash amount of right of use assets and lease liabilities recorded upon adoption (in thousands) (1) | $ | 54,665 |
| Weighted-average remaining lease term as of October 31, 2020 (years) | 3.8 |
| Weighted-average discount rate as of October 31, 2020 | 2.49% |
(1) There were no material right-of-use assets obtained in exchange for lease liabilities during fiscal year 2020.
The future maturities of obligations under non-cancelable operating leases at October 31, 2020 were as follows (in thousands):
| | | | | |
| Fiscal Year | Amount |
| 2021 | $ | 14,944 | |
| 2022 | 12,546 | |
| 2023 | 8,915 | |
| 2024 | 4,842 | |
| Thereafter | 2,396 | |
| Total undiscounted operating lease payments | 43,643 | |
| Less: imputed interest | (2,858) | |
| Present value of lease liabilities | $ | 40,785 | |
Sanderson Farms, Inc. and Subsidiaries
Valuation and Qualifying Accounts
Schedule II
| | | | | | | | | | | | | | | | | | | | | | | | | | | | | |
| Classification | Balance at
Beginning
of Period | | Charged (Credited) to
Costs and
Expenses | | Charged to
Other
Accounts | | Deductions
Describe | | Balance at
End of
Period |
| | (In Thousands) |
| Year Ended October 31, 2020 | | | | | | | | | |
| Deducted from accounts receivable: | | | | | | | | | |
| Allowance for doubtful accounts | | | | | | | | | |
| Totals - Fiscal 2020 | $ | 1,260 | | | $ | — | | | | | $ | — | | | $ | 1,260 | |
| Year Ended October 31, 2019 | | | | | | | | | |
| Deducted from accounts receivable: | | | | | | | | | |
| Allowance for doubtful accounts | | | | | | | | | |
| Totals - Fiscal 2019 | $ | 3,260 | | | $ | (2,000) | | | | | $ | — | | | $ | 1,260 | |
| Year Ended October 31, 2018 | | | | | | | | | |
| Deducted from accounts receivable: | | | | | | | | | |
| Allowance for doubtful accounts | | | | | | | | | |
| Totals - Fiscal 2018 | $ | 3,260 | | | $ | — | | | | | $ | — | | | $ | 3,260 | |
_________________
Item 9. Changes in and Disagreements With Accountants on Accounting and Financial Disclosure
Not applicable.
Item 9A. Controls and Procedures
Disclosure Controls
The Company maintains disclosure controls and procedures that are designed to ensure that information required to be disclosed in the Company’s Securities Exchange Act reports is recorded, processed, summarized and reported within the time periods specified in the SEC’s rules and forms, and that such information is accumulated and communicated to the Company’s management, including its Chief Executive Officer and Chief Financial Officer, as appropriate, to allow timely decisions regarding required disclosure.
As of October 31, 2020, an evaluation was performed under the supervision and with the participation of the Company’s management, including the Chief Executive Officer and Chief Financial Officer, of the effectiveness of the design and operation of the Company’s disclosure controls and procedures. Based on that evaluation, the Company’s management, including the Chief Executive Officer and Chief Financial Officer, concluded that the Company’s disclosure controls and procedures were effective as of October 31, 2020.
Changes in Internal Control over Financial Reporting
There have been no changes in the Company’s internal control over financial reporting during the fourth quarter ended October 31, 2020, that have materially affected, or are reasonably likely to materially affect, the Company’s internal control over financial reporting.
Management’s Report on Internal Control Over Financial Reporting
The Company’s management, with the participation of the Company’s Chief Executive Officer and Chief Financial Officer, is responsible for establishing and maintaining adequate internal control over financial reporting. The Company’s management has assessed the effectiveness of the Company’s internal control over financial reporting as of October 31, 2020. In making this assessment, we used the criteria set forth by the Committee of Sponsoring Organizations of the Treadway Commission (COSO) in Internal Control — Integrated Framework (2013 framework). Based on our assessment we have concluded that, as of October 31, 2020, the Company’s internal control over financial reporting is effective based on those criteria.
Attestation Report of the Registered Public Accounting Firm
Our independent registered public accounting firm, Ernst & Young LLP, has provided an attestation report on the Company’s internal control over financial reporting as of October 31, 2020.
Item 9B. Other Information
Not applicable.
Report of Independent Registered Public Accounting Firm
To the Stockholders and Board of Directors of Sanderson Farms, Inc.
Opinion on Internal Control over Financial Reporting
We have audited Sanderson Farms, Inc. and Subsidiaries’ internal control over financial reporting as of October 31, 2020, based on criteria established in Internal Control—Integrated Framework issued by the Committee of Sponsoring Organizations of the Treadway Commission (2013 framework) (the COSO criteria). In our opinion, Sanderson Farms, Inc. and subsidiaries (the Company) maintained, in all material respects, effective internal control over financial reporting as of October 31, 2020, based on the COSO criteria.
We also have audited, in accordance with the standards of the Public Company Accounting Oversight Board (United States) (PCAOB), the consolidated balance sheets of the Company as of October 31, 2020 and 2019, the related consolidated statements of operations, stockholders’ equity and cash flows for each of the three years in the period ended October 31, 2020, and the related notes and schedule and our report dated December 17, 2020, expressed an unqualified opinion thereon.
Basis for Opinion
The Company’s management is responsible for maintaining effective internal control over financial reporting and for its assessment of the effectiveness of internal control over financial reporting included in the accompanying Management’s Report on Internal Control Over Financial Reporting. Our responsibility is to express an opinion on the Company’s internal control over financial reporting based on our audit. We are a public accounting firm registered with the PCAOB and are required to be independent with respect to the Company in accordance with the U.S. federal securities laws and the applicable rules and regulations of the Securities and Exchange Commission and the PCAOB.
We conducted our audit in accordance with the standards of the PCAOB. Those standards require that we plan and perform the audit to obtain reasonable assurance about whether effective internal control over financial reporting was maintained in all material respects.
Our audit included obtaining an understanding of internal control over financial reporting, assessing the risk that a material weakness exists, testing and evaluating the design and operating effectiveness of internal control based on the assessed risk, and performing such other procedures as we considered necessary in the circumstances. We believe that our audit provides a reasonable basis for our opinion.
Definition and Limitations of Internal Control Over Financial Reporting
A company’s internal control over financial reporting is a process designed to provide reasonable assurance regarding the reliability of financial reporting and the preparation of financial statements for external purposes in accordance with generally accepted accounting principles. A company’s internal control over financial reporting includes those policies and procedures that (1) pertain to the maintenance of records that, in reasonable detail, accurately and fairly reflect the transactions and dispositions of the assets of the company; (2) provide reasonable assurance that transactions are recorded as necessary to permit preparation of financial statements in accordance with generally accepted accounting principles, and that receipts and expenditures of the company are being made only in accordance with authorizations of management and directors of the company; and (3) provide reasonable assurance regarding prevention or timely detection of unauthorized acquisition, use, or disposition of the company’s assets that could have a material effect on the financial statements.
Because of its inherent limitations, internal control over financial reporting may not prevent or detect misstatements. Also, projections of any evaluation of effectiveness to future periods are subject to the risk that controls may become inadequate because of changes in conditions, or that the degree of compliance with the policies or procedures may deteriorate.
/s/ Ernst & Young LLP
New Orleans, Louisiana
December 17, 2020
PART III
Item 10. Directors, Executive Officers and Corporate Governance
As permitted by General Instruction G(3) to Form 10-K, reference is made to the information concerning the Directors of the Registrant and the nominees for election as Directors appearing in the Registrant’s definitive proxy statement filed or to be filed with the Commission pursuant to Rule 14a-6(b). Such information is incorporated herein by reference to the definitive proxy statement.
Information concerning the executive officers of the Registrant is set forth in Item 4A of Part I of this Annual Report.
The Registrant also incorporates by reference, as permitted by General Instruction G(3) to Form 10-K, information appearing in its definitive proxy statement filed or to be filed with the Commission pursuant to Rule 14a-6(b) related to the filing of reports under Section 16 of the Securities Exchange Act of 1934.
The Registrant has a standing audit committee established in accordance with Section 3(a)(58)(A) of the Exchange Act, whose members are Suzanne T. Mestayer (Chair), Phil K. Livingston, (Vice Chair), John H. Baker, III, Fred Banks, Jr., David Barksdale, Edith Kelly-Green, and Gail J. Pittman. All members of the audit committee are independent directors under the listing standards of the NASDAQ Stock Market LLC. The Registrant’s Board of Directors has determined that Edith Kelly-Green, Phil K. Livingston and Suzanne T. Mestayer are audit committee financial experts.
The Registrant has adopted a code of ethics that applies to its senior financial personnel, including its chief executive officer, chief financial officer and chief accounting officer. The Registrant will provide a copy of the code of ethics free of charge to any person upon request to:
Sanderson Farms, Inc.
P.O. Box 988
Laurel, Mississippi 39441
Attn.: Chief Financial Officer
Requests can also be made by phone at (601) 649-4030.
Item 11. Executive Compensation
As permitted by General Instruction G(3) to Form 10-K, reference is made to the information concerning remuneration of Directors and executive officers of the Registrant appearing in the Registrant’s definitive proxy statement filed or to be filed with the Commission pursuant to Rule 14a-6(b). Such information is incorporated herein by reference to the definitive proxy statement.
Item 12. Security Ownership of Certain Beneficial Owners and Management and Related Stockholder Matters
As permitted by General Instruction G(3) to Form 10-K, reference is made to the information concerning beneficial ownership of the Registrant’s Common Stock, which is the only class of the Registrant’s voting securities, appearing in the Registrant’s definitive proxy statement filed or to be filed with the Commission pursuant to Rule 14a-6(b). Such information is incorporated herein by reference to the definitive proxy statement.
The following table provides information as of October 31, 2020, with respect to compensation plans (including individual compensation arrangements) under which equity securities of the Registrant are authorized for issuance. The Registrant has no equity compensation plan not approved by security holders. All outstanding awards were issued under the Registrant’s Stock Incentive Plan approved by shareholders on February 17, 2005, as most recently amended and approved by shareholders on February 13, 2020. No further options or other awards may be granted under the Stock Option Plan. There are 4,800,000 shares of common stock authorized for issuance under the Stock Incentive Plan.
| | | | | | | | | | | |
| Plan category | (a) Number of
securities to be issued
upon exercise of
outstanding options,
warrants and
rights (1) | | (b) Number of
securities remaining
available for future
issuance under equity
compensation plans
(excluding securities
reflected in column
(a)(2) |
| Equity compensation plans approved by security holders | 110,814 | | | 931,537 | |
| Equity compensation plans not approved by security holders | — | | | — | |
| Total | 110,814 | | | 931,537 | |
_________________
(1)This column reflects 110,814 unearned performance shares at October 31, 2020, at the maximum level. However, management could not determine that achievement of the applicable performance based criteria is probable for those unearned performance shares. This column does not include the 13,055 fiscal 2018 performance shares that were issued on October 31, 2020.
(2)This column reflects the 1,444,816 shares of restricted stock granted to participants under the Stock Incentive Plan, the 314,596 shares of restricted stock purchased by or granted to participants under the MSPP provisions of the Stock Incentive Plan, the 920,613 earned performance shares that have been issued or are expected to be issued under the Stock Incentive Plan, and the 110,814 unearned outstanding performance shares that could be earned as described in footnote (1) above, in each case since the inception of the plan and net of forfeitures, but including shares withheld to satisfy tax withholding obligations.
Item 13. Certain Relationships and Related Transactions and Director Independence
As permitted by General Instruction G(3) to Form 10-K, information, if any, required to be reported by Item 13 of Form 10-K, with respect to transactions with management and others, certain business relationships, indebtedness of management, and transactions with promoters, is set forth in the Registrant’s definitive proxy statement filed or to be filed with the Commission pursuant to Rule 14a-6(b). Such information, if any, is incorporated herein by reference to the definitive proxy statement.
Item 14. Principal Accounting Fees and Services
As permitted by General Instruction G(3) to Form 10-K, information required to be reported by Item 14 of Form 10-K is set forth in the Registrant’s definitive proxy statement filed or to be filed with the Commission pursuant to Rule 14a-6(b). That information is incorporated by reference into this Form 10-K.
PART IV
Item 15. Exhibits and Financial Statement Schedules
(a)The following documents are filed as a part of this report:
1. FINANCIAL STATEMENTS:
The following consolidated financial statements of the Registrant are included in Item 8:
Consolidated Balance Sheets — October 31, 2020 and 2019
Consolidated Statements of Operations — Years ended October 31, 2020, 2019 and 2018
Consolidated Statements of Stockholders’ Equity — Years ended October 31, 2020, 2019 and 2018
Consolidated Statements of Cash Flows — Years ended October 31, 2020, 2019 and 2018
Notes to Consolidated Financial Statements — October 31, 2020
2. FINANCIAL STATEMENT SCHEDULES:
The following consolidated financial statement schedules of the Registrant are included in Item 8:
Schedule II — Valuation and Qualifying Accounts
All other schedules are omitted as they are not required, are not applicable or the required information is set forth in the Financial Statements or notes thereto.
3. EXHIBITS:
The following exhibits are filed with this Annual Report or are incorporated herein by reference:
| | | | | | | | |
Exhibit Number | | Description |
| | |
| 3.1 | | Restated Articles of Incorporation of the Registrant. (Incorporated by reference to Exhibit 3.1 filed with the Registrant’s Quarterly Report on Form 10-Q for the Quarter ended on July 31, 2015.) |
| | |
| 3.2 | | By-Laws of the Registrant, amended and restated as of October 24, 2017. (Incorporated by reference to Exhibit 3 filed with the Registrant’s Current Report on Form 8-K on October 24, 2017.) |
| | |
| 4.1 | | Description of capital stock. (Incorporated by reference to Exhibit 4.1 filed with the Registrant's Annual Report on Form 10-K for the year ended October 31, 2019.) |
| | |
| 10.1+ | | Sanderson Farms, Inc. and Affiliates Employee Stock Ownership Plan, as amended and restated effective November 1, 2013. (Incorporated by reference to Exhibit 10.5 to the Registrant’s Annual Report on Form 10-K for the year ended October 31, 2013.) |
| | |
| 10.2+ | | First Amendment to the Sanderson Farms, Inc. and Affiliates Employee Stock Ownership Plan dated as of July 23, 2014. (Incorporated by reference to Exhibit 10.6 to the Registrant's Annual Report on Form 10-K for the year ended October 31, 2016.) |
| | |
| 10.3+ | | Second Amendment to the Sanderson Farms, Inc. and Affiliates Employee Stock Ownership Plan dated as of May 2, 2016. (Incorporated by reference to Exhibit 10.7 to the Registrant's Annual Report on Form 10-K for the year ended October 31, 2016.) |
| | |
| 10.4+ | | Third Amendment to the Sanderson Farms, Inc. and Affiliates Employee Stock Ownership Plan dated as of October 20, 2016. (Incorporated by reference to Exhibit 10.8 to the Registrant's Annual Report on Form 10-K for the year ended October 31, 2016.) |
| | |
| 10.5+ | | Fourth Amendment to the Sanderson Farms, Inc. and Affiliates Employee Stock Ownership Plan dated as of January 19, 2017. (Incorporated by reference to Exhibit 10.2 to the Registrant's Quarterly Report on Form 10-Q for the quarter ended January 31, 2017.) |
| | |
| 10.6+ | | Fifth Amendment to the Sanderson Farms, Inc. and Affiliates Employee Stock Ownership Plan dated as of October 19, 2017. (Incorporated by reference to Exhibit 10.6 to the Registrant's Annual Report on Form 10-K for the year ended October 31, 2017.) |
| | |
| | | | | | | | |
Exhibit Number | | Description |
| 10.7+ | | Sixth Amendment to the Sanderson Farms, Inc. and Affiliates Employee Stock Ownership Plan dated as of January 16, 2020. (Incorporated by reference to Exhibit 10.1 to the Registrant's Quarterly Report on Form 10-Q for the quarter ended July 31, 2020.) |
| | |
| 10.8+* | | Seventh Amendment to the Sanderson Farms, Inc. and Affiliates Employee Stock Ownership Plan dated as of October 29, 2020. |
| | |
| 10.9+ | | Eighth Amendment to the Sanderson Farms, Inc. and Affiliates Employee Stock Ownership Plan dated as of July 16, 2020. (Incorporated by reference to Exhibit 10.2 to the Registrant's Quarterly Report on Form 10-Q for the quarter ended July 31, 2020.) |
| | |
| 10.10+ | | Sanderson Farms, Inc. and Affiliates Stock Incentive Plan, as amended and restated on February 13, 2020. (Incorporated by reference to Exhibit 4.3 to the Registrant's registration statement on Form S-8 filed by the Registrant on February 27, 2020, Registration No. 333-236686.) |
| | |
| 10.11+ | | Sanderson Farms, Inc. Bonus Award Program Effective November 1, 2019. (Incorporated by reference to Exhibit 10.1 filed with the Registrant’s Current Report on Form 8-K on February 18, 2020.) |
| | |
| 10.12+ | | Sanderson Farms, Inc. Supplemental Disability Plan effective September 1, 2008. (Incorporated by reference to Exhibit 10 to the Current Report on Form 8-K filed by the Registrant on October 1, 2008). |
| | |
| 10.13+ | | Form of Share Purchase Agreement between the Registrant and its non-employee directors who participate in its management share purchase plan, as amended. (Incorporated by reference to Exhibit 10.2 filed with the Registrant’s Quarterly Report on Form 10-Q for the quarter ended April 30, 2007.) |
| | |
| 10.14+ | | Form of Share Purchase Agreement between the Registrant and its officers and employees who participate in its management share purchase plan, as amended. (Incorporated by reference to Exhibit 10.1 filed with the Registrant’s Quarterly Report on Form 10-Q for the Quarter ended April 30, 2008.) |
| | |
| 10.15+ | | Form of Restricted Stock Agreement between the Registrant and its officers and employees who are granted restricted stock with a four-year vesting period (for awards granted on or after November 1, 2013). (Incorporated by reference to Exhibit 10.14 to the Registrant’s Annual Report on Form 10-K for the year ended October 31, 2013.) |
| | |
| 10.16+ | | Form of Restricted Stock Agreement between the Registrant and its non-employee directors who are granted restricted stock, as amended. (Incorporated by reference to Exhibit 10.4 filed with the Registrant’s Quarterly Report on Form 10-Q for the quarter ended April 30, 2007.) |
| | |
| 10.17+ | | Form of Performance Share Agreement between the Registrant and its employees who are granted performance shares (for fiscal 2018). (Incorporated by reference to Exhibit 10.20 to the Registrant's Annual Report on Form 10-K for the year ended October 31, 2017.) |
| | |
| 10.18+ | | Form of Performance Share Agreement between the Registrant and its employees who are granted performance shares (for fiscal 2019). (Incorporated by reference to Exhibit 10.20 to the Registrant's Annual Report on Form 10-K for the year ended October 31, 2018.) |
| | |
| 10.19+ | | Form of Performance Share Agreement between the Registrant and its employees who are granted performance shares (for fiscal 2020). (Incorporated by reference to Exhibit 10.17 to the Registrant's Annual Report on Form 10-K for the year ended October 31, 2019.) |
| | |
| 10.20+* | | Form of Performance Share Agreement between the Registrant and its employees who are granted performance shares (for fiscal 2021). |
| | |
| 10.21+ | | Employment Agreement dated as of November 1, 2015 between the Registrant and Joe F. Sanderson, Jr. (Incorporated by reference to Exhibit 10.1 filed with the Registrant’s Current Report on Form 8-K/A on January 13, 2016.) |
| | |
| 10.22+ | | Employment Agreement dated as of November 1, 2015 between the Registrant and Lampkin Butts. (Incorporated by reference to Exhibit 10.2 filed with the Registrant’s Current Report on Form 8-K/A on January 13, 2016.) |
| | |
| 10.23+ | | Employment Agreement dated as of November 1, 2015 between the Registrant and D. Michael Cockrell. (Incorporated by reference to Exhibit 10.3 filed with the Registrant’s Current Report on Form 8-K on November 2, 2015.) |
| | |
| | | | | | | | |
Exhibit Number | | Description |
| 10.24 | | Lease Agreement dated as of December 1, 2004, between Moultrie-Colquitt County Development Authority, as Lessor, and Sanderson Farms, Inc. (Processing Division) as Lessee. (Incorporated by reference to Exhibit 10.1 to the Registrant’s Quarterly Report on Form 10-Q for the quarter ended July 31, 2005.) |
| | |
| 10.25 | | Bond Purchase Loan Agreement between Moultrie-Colquitt County Development Authority, as Issuer, and Sanderson Farms, Inc. (Processing Division), as Purchaser. (Incorporated by reference to Exhibit 10.2 to the Registrant’s Quarterly Report on Form 10-Q for the quarter ended July 31, 2005.) |
| | |
| 10.26 | | Credit Agreement, dated March 21, 2019, by and among Sanderson Farms, Inc., BMO Harris Bank, N.A. as agent for the Banks defined therein, and the Banks party thereto. (Incorporated by reference to Exhibit 10.1 filed with the Registrant’s Current Report on Form 8-K on March 27, 2019.) |
| | |
| 10.27 | | Guaranty Agreement dated March 21, 2019 of Sanderson Farms, Inc. (Foods Division), Sanderson Farms, Inc. (Production Division) and Sanderson Farms, Inc. (Processing Division). (Incorporated by reference to Exhibit 10.2 filed with the Registrant’s Current Report on Form 8-K on March 27, 2019.) |
| | |
| 10.28 | | Lease Agreement dated as of July 1, 2006, between Adel Industrial Development Authority as Lessor, and Sanderson Farms, Inc. (Production Division) as Lessee. (Incorporated by reference to Exhibit 10.1 filed with the Registrant’s Quarterly Report on Form 10-Q for the quarter ended July 31, 2006.) |
| | |
| 10.29 | | Bond Purchase Agreement dated as of July 31, 2006, between Sanderson Farms, Inc. (Production Division) as Purchaser and Adel Industrial Development Authority as Issuer. (Incorporated by reference to Exhibit 10.2 filed with the Registrant’s Quarterly Report on Form 10-Q for the quarter ended July 31, 2006.) |
| | |
| 21 | | List of Subsidiaries of the Registrant. (Incorporated by reference to Exhibit 21 to the Registrant’s Annual Report on Form 10-K for the year ended October 31, 2002.) |
| | |
| 23* | | Consent of Independent Registered Public Accounting Firm. |
| | |
| 31.1* | | Certification of Chief Executive Officer. |
| | |
| 31.2* | | Certification of Chief Financial Officer. |
| | |
| 32.1** | | Section 1350 Certification. |
| | |
| 32.2** | | Section 1350 Certification. |
| | |
| 101.INS | | XBRL Instance Document - the instance document does not appear in the Interactive Data File because its XBRL tags are embedded within the Inline XBRL document. |
| | |
| 101.SCH | | XBRL Taxonomy Extension Schema |
| | |
| 101.CAL | | XBRL Taxonomy Extension Calculation Linkbase |
| | |
| 101.DEF | | XBRL Taxonomy Extension Definition Linkbase |
| | |
| 101.LAB | | XBRL Taxonomy Extension Label Linkbase |
| | |
| 101.PRE | | XBRL Taxonomy Extension Presentation Linkbase |
| | |
| 104 | | Cover Page Interactive Data File (embedded within the Inline XBRL document). |
* Filed herewith.
** Furnished herewith.
+ Management contract or compensatory plan or arrangement.
QUALIFICATION BY REFERENCE
Any statement contained in this Annual Report concerning the contents of any contract or other document filed as an exhibit to this Annual Report or incorporated herein by reference is not necessarily complete, and in each instance reference is made to the copy of the document filed.
Item 16. Form 10-K Summary
None.
INDEX TO EXHIBITS:
The following exhibits are filed with this Annual Report or are incorporated herein by reference:
| | | | | | | | |
Exhibit Number | | Description |
| | |
| 3.1 | | |
| | |
| 3.2 | | |
| | |
| 4.1 | | |
| | |
| 10.1+ | | |
| | |
| 10.2+ | | |
| | |
| 10.3+ | | |
| | |
| 10.4+ | | |
| | |
| 10.5+ | | |
| | |
| 10.6+ | | |
| | |
| 10.7+ | | |
| | |
| 10.8+* | | |
| | |
| 10.9+ | | |
| | |
| 10.10+ | | |
| | |
| 10.11+ | | |
| | |
| 10.12+ | | |
| | |
| 10.13+ | | |
| | |
| 10.14+ | | |
| | |
| 10.15+ | | |
| | | | | | | | |
| | |
| 10.16+ | | |
| | |
| 10.17+ | | |
| | |
| 10.18+ | | |
| | |
| 10.19+ | | |
| | |
| 10.20+* | | |
| | |
| 10.21+ | | |
| | |
| 10.22+ | | |
| | |
| 10.23+ | | |
| | |
| 10.24 | | |
| | |
| 10.25 | | |
| | |
| 10.26 | | |
| | |
| 10.27 | | |
| | |
| 10.28 | | |
| | |
| 10.29 | | |
| | |
| 21 | | |
| | |
| 23* | | |
| | |
| 31.1* | | |
| | |
| 31.2* | | |
| | |
| 32.1** | | |
| | |
| 32.2** | | |
| | |
| | | | | | | | |
| 101.INS | | XBRL Instance Document - the instance document does not appear in the Interactive Data File because its XBRL tags are embedded within the Inline XBRL document. |
| | |
| 101.SCH | | XBRL Taxonomy Extension Schema |
| | |
| 101.CAL | | XBRL Taxonomy Extension Calculation Linkbase |
| | |
| 101.DEF | | XBRL Taxonomy Extension Definition Linkbase |
| | |
| 101.LAB | | XBRL Taxonomy Extension Label Linkbase |
| | |
| 101.PRE | | XBRL Taxonomy Extension Presentation Linkbase |
| | |
| 104 | | Cover Page Interactive Data File (embedded within the Inline XBRL document). |
_________________
* Filed herewith.
** Furnished herewith.
+ Management contract or compensatory plan or arrangement.
SIGNATURES
Pursuant to the requirements of Section 13 or 15(d) of the Securities Exchange Act of 1934, the Registrant has duly caused this report to be signed on its behalf by the undersigned, thereunto duly authorized.
| | | | | | | | |
| SANDERSON FARMS, INC. |
| | |
| By: | | /s/ Joe F. Sanderson, Jr. |
| | Chairman of the Board and Chief Executive Officer |
Date: December 17, 2020
Pursuant to the requirements of the Securities Exchange Act of 1934, this report has been signed below by the following persons on behalf of the Registrant and in the capacities and as of the dates indicated.
| | | | | |
| /s/ Joe F. Sanderson, Jr. | 12/17/2020 |
| Joe F. Sanderson, Jr., | |
| Chairman of the Board and Chief Executive Officer | |
| (Principal Executive Officer) | |
| |
| /s/ Lampkin Butts | 12/17/2020 |
| Lampkin Butts, Director, | |
| President and Chief Operating Officer | |
| |
| /s/ D. Michael Cockrell | 12/17/2020 |
| D. Michael Cockrell, | |
| Director, Treasurer, Chief Financial Officer and Chief Legal Officer | |
| (Principal Financial Officer) | |
| |
| /s/ Tim Rigney | 12/17/2020 |
| Tim Rigney, | |
| Secretary and Chief Accounting Officer | |
| (Principal Accounting Officer) | |
| |
| /s/ John H. Baker, III | 12/17/2020 |
| John H. Baker, III, | |
| Director | |
| |
| /s/ Fred Banks, Jr. | 12/17/2020 |
| Fred Banks, Jr., | |
| Director | |
| |
| /s/ David Barksdale | 12/17/2020 |
| David Barksdale, | |
| Director | |
| |
| /s/ John Bierbusse | 12/17/2020 |
| John Bierbusse, | |
| Director | |
| |
| /s/ Toni Cooley | 12/17/2020 |
| Toni Cooley, | |
| Director | |
| |
| /s/ Beverly Wade Hogan | 12/17/2020 |
| Beverly Wade Hogan, | |
| | | | | |
| Director | |
| |
| /s/ Edith Kelly-Green | 12/17/2020 |
| Edith Kelly-Green, | |
| Director | |
| |
| /s/ Phil K. Livingston | 12/17/2020 |
| Phil K. Livingston, | |
| Director | |
| |
| /s/ Suzanne T. Mestayer | 12/17/2020 |
| Suzanne T. Mestayer, | |
| Director | |
| |
| /s/ Sonia Pérez | 12/17/2020 |
| Sonia Pérez, | |
| Director | |
| |
| /s/ Gail Jones Pittman | 12/17/2020 |
| Gail Jones Pittman, | |
| Director | |