UNITED STATES
SECURITIES AND EXCHANGE COMMISSION
Washington, D.C. 20549
SECURITIES AND EXCHANGE COMMISSION
Washington, D.C. 20549
FORM N-CSR
CERTIFIED SHAREHOLDER REPORT OF REGISTERED
MANAGEMENT INVESTMENT COMPANIES
Investment Company Act file number (811-05037)
Professionally Managed Portfolios
(Exact name of registrant as specified in charter)
(Exact name of registrant as specified in charter)
615 East Michigan Street
Milwaukee, WI 53202
(Address of principal executive offices) (Zip code)
(Address of principal executive offices) (Zip code)
Jason Hadler
Professionally Managed Portfolios
c/o U.S. Bank Global Fund Services
777 E. Wisconsin Avenue
Milwaukee, WI 53202
(Name and address of agent for service)
777 E. Wisconsin Avenue
Milwaukee, WI 53202
(Name and address of agent for service)
(414) 516-1523
Registrant's telephone number, including area code
Date of fiscal year end: December 31
Date of reporting period: December 31, 2023
Item 1. Report to Stockholders.
|
(a)
|
|
Muzinich & Co.
Muzinich Credit Opportunities Fund
Muzinich Flexible U.S. High Yield Income Fund
Muzinich Low Duration Fund
ANNUAL REPORT
December 31, 2023
Muzinich Funds
|
TABLE OF CONTENTS
|
|
A Message to our Shareholders
|
1
|
||
|
Sector Allocations
|
6
|
||
|
Historical Performance
|
9
|
||
|
Schedules of Investments
|
14
|
||
|
Statements of Assets and Liabilities
|
41
|
||
|
Statements of Operations
|
42
|
||
|
Statements of Changes in Net Assets
|
43
|
||
|
Financial Highlights
|
46
|
||
|
Notes to Financial Statements
|
51
|
||
|
Report of Independent Registered Public Accounting Firm
|
62
|
||
|
Expense Examples
|
63
|
||
|
Approval of Investment Advisory Agreement
|
65
|
||
|
Trustees and Executive Officers
|
68
|
||
|
Additional Information
|
71
|
||
|
Privacy Notice
|
72
|
(This Page Intentionally Left Blank.)
Muzinich Funds
Dear Investors:
The Muzinich Credit Opportunities Fund (“Credit Opportunities Fund”) finished the year with assets of $261,100,983, reduced from $296,812,303 at the start
of the year reflecting net outflows and a net investment return of +7.48% for the Supra Institutional units and +7.40% for the Institutional units. The Fund underperformed the broad global corporate credit markets as reflected by the +9.54% return of
the ICE BofA Global Corporate and High Yield Index (GI00) hedged to USD, which is the Fund’s primary benchmark. Since inception from January 3, 2013 the Credit Opportunities Fund’s Supra Institutional units have gained an annualized net return of
+3.64%, outperforming the benchmark which has returned +3.15% annualized.
|
Performance as of December 31, 2023
|
1 Year
|
3 Year
|
5 Year
|
Since Inception
|
|
Credit Opportunities Fund (Supra Institutional)
|
7.48%
|
-0.16%
|
3.22%
|
3.64%
|
|
ICE BofAML Global Corporate & High Yield Index (USD 100% Hedged)
|
9.54%
|
-1.88%
|
2.85%
|
3.15%
|
Periods greater than one year are average annual returns.
Performance data quoted represents past performance; past performance does not guarantee future results. The investment return and principal value of an
investment will fluctuate so that an investor's shares, when redeemed, may be worth more or less than their original cost. Current performance of the Fund may be lower or higher than the performance quoted. Performance data currency to the most
recent month end may be obtained by calling 855-689-4642. The Fund imposes a 1.00% redemption fee on shares held for 90 days or less. Performance data quoted does not reflect the redemption fee. If reflected, total returns would be less.
Expense Ratios1
Gross Expense Ratio: 0.80%
Net Expense Ratio: 0.60%2
|
1
|
Expense ratios are from the Fund's most recent prospectus dated April 30, 2023 (Supra Institutional Class). See the Financial Highlights in this report for the most current expense ratios.
|
|
2
|
The Advisor has contractually agreed to waive its fees and reimburse certain expenses through April 30, 2024.
|
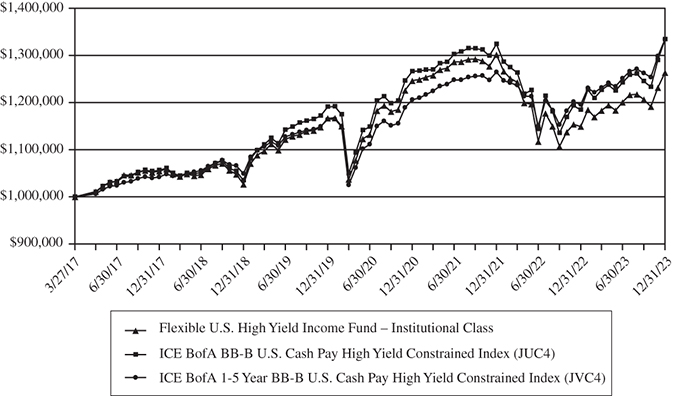
The Muzinich Flexible U.S. High Yield Income Fund (“Flexible U.S. High Income Fund,” formerly the Muzinich U.S. High Yield Credit Fund) ended the year with
assets of $47,415,107, increased from $33,061,022, on net inflows and good investment performance. The Fund’s Supra Institutional units returned +9.98% net over this year, underperforming the +11.56% return of the benchmark, the ICE BofA 1-5 Year
BB-B US Cash Pay High Yield Constrained Index (JVC4)1. Institutional units also had a net return of +9.98%. Since inception on March 31, 2016, the Flexible U.S. High
Income Fund has underperformed the benchmark, delivering an annualized net return for the Supra Institutional units of +4.20% vs. the benchmark’s +5.23% return.
|
Performance as of December 31, 2023
|
1 Year
|
3 Year
|
5 Year
|
Since Inception
|
|
Flexible U.S. High Yield Fund (Supra Institutional)
|
9.98%
|
0.50%
|
4.28%
|
4.20%
|
|
ICE BofA BB-B U.S. Cash Pay High Yield Constrained Index (JUC4)
|
12.63%
|
1.76%
|
5.21%
|
5.40%
|
|
ICE BofA 1-5 Year BB-B US Cash Pay High Yield Constrained Index (JVC4)
|
11.56% |
3.43% |
4.92% |
4.35% |
Periods greater than one year are average annual returns.
Performance data quoted represents past performance; past performance does not guarantee future results. The investment return and principal value of an
investment will fluctuate so that an investor's shares, when redeemed, may be worth more or less than their original cost. Current performance of the Fund may be lower or higher than the performance quoted. Performance data currency to the most
recent month end may be obtained by calling 855-689-4642. The Fund imposes a 1.00% redemption fee on shares held for 90 days or less. Performance data quoted does not reflect the redemption fee. If reflected, total returns would be less.
Expense Ratios1
Gross Expense Ratio: 1.37%
Net Expense Ratio: 0.58%2
|
1
|
Expense ratios are from the Fund's most recent prospectus dated April 30, 2023 (Supra Institutional Class). See the Financial Highlights in this report for the most current expense ratios.
|
|
2
|
The Advisor has contractually agreed to waive its fees and reimburse certain expenses through April 30, 2024.
|
|
1
|
Effective October 1, 2023, the primary benchmark index for the Muzinich Flexible U.S. High Yield Income Fund will change from the ICE BofA BB-B U.S. Cash Pay High
Yield Constrained Index to the ICE BofA 1-5 Year BB-B US Cash Pay High Yield Constrained Index based on the Adviser’s determination that the ICE BofA 1-5 Year BB-B US Cash Pay High Yield Constrained Index is more closely aligned with the
Fund’s principal investment strategies and portfolio holdings.
|
1
Muzinich Funds
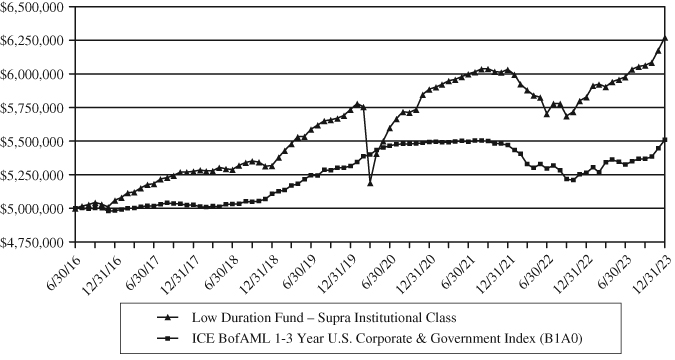
The Muzinich Low Duration Fund (“Low Duration Fund”) expanded from its year end-starting balance of $843,684,244, to end the reporting period with assets
of $982,339,552, reflecting net inflows and positive investment performance well ahead of the benchmark. The Supra Institutional units produced a return of +7.63%, comfortably outperforming the return of +4.66% for the index, ICE BofA 1-3 year U.S.
Corporate and Government Index (B1A0), which serves as this Fund’s primary benchmark. Since inception on June 30, 2016, the Supra Institutional class has produced an annualized net return of +3.07% per annum vs. the +1.30% average annualized
benchmark return.
|
Performance as of December 31, 2023
|
1 Year
|
3 Year
|
5 Year
|
Since Inception
|
|
Low Duration Fund – Supra Institutional
|
7.63%
|
2.14%
|
3.36%
|
3.07%
|
|
ICE BofA Merrill Lynch 1-3 Year U.S. Corporate
|
||||
|
& Government Index (B1A0)
|
4.66%
|
0.10%
|
1.53%
|
1.30%
|
Periods greater than one year are average annual returns.
Performance data quoted represents past performance; past performance does not guarantee future results. The investment return and principal value of an
investment will fluctuate so that an investor's shares, when redeemed, may be worth more or less than their original cost. Current performance of the Fund may be lower or higher than the performance quoted. Performance data currency to the most
recent month end may be obtained by calling 855-689-4642. The Fund imposes a 1.00% redemption fee on shares held for 90 days or less. Performance data quoted does not reflect the redemption fee. If reflected, total returns would be less.
Expense Ratios1
Gross Expense Ratio: 0.61%
Net Expense Ratio: 0.50%2
|
1
|
Expense ratios are from the Fund's most recent prospectus dated April 30, 2023 (Supra Institutional Class). See the Financial Highlights in this report for the most current expense ratios.
|
|
2
|
The Advisor has contractually agreed to waive its fees and reimburse certain expenses through April 30, 2024.
|
Market
Global credit delivered strong positive returns in 2023, with much of those returns generated in the last two months of the year. Market movements were
largely driven by expectations of an imminent pivot in monetary policy of major Central Banks. Lower than expected inflation over the last few months of the year also fueled market pricing. The soft-landing scenario anticipated by
investors—particularly for the US—combined with nice and steady disinflation, boosted market valuations through the end of the reporting period. We do not expect much change to the narrative of lower policy rates in 2024. Consequently, we believe any
significant rise in yields or subsequent spread widening presents an opportunity to add some risk in portfolios. Looking ahead, we remain committed to the higher carry opportunity in credit, including high-yielding assets. We are cognizant of high
valuations, but with the average price for high yield (HY) assets in the US and Europe still below par, in our view this is the time to put money to work to capture the carry from credit markets.
Performance Factors
Muzinich Credit Opportunities Fund
Over the course of the year, the Fund benefitted from tactical management that demonstrated its ability to navigate pressures from higher interest rates.
We maintained a defensive posture given rising rates and volatility related to macro headlines and economic data for much of the reporting period, while adding positions when attractive opportunities have presented themselves.
In this environment, the Fund generated positive returns year-to-date, strongly delivering its targeted “meaningful outperformance of the US 3 Month
Treasury Bill.” The Fund underperformed its indicative reference index, the ICE BofA Global Corporate and High Yield (GI00). Over the reporting period, we focused on improving credit quality and liquidity within the high yield sleeve of the
portfolio, and duration management against a backdrop of higher interest rates for most of the year. We have continued to maintain diversification within the portfolio, concentrating on more liquid parts of global credit.
The 10-year US Treasury interest rate rose slightly during H1 2023 but exhibited a wide intra-period range. The average duration of the portfolio for the
first half of the year was slightly higher than the duration level at the end of 2022, suggesting some detraction from performance due to increased rates. However, during H2 2023, interest rates rose significantly through October before falling
significantly in November and December to end 2023 nearly unchanged from the beginning the year. The portfolio’s duration was actively and effectively managed; we maintained lower durations during the most significant rate rises in September and
October and higher durations in November and December 2023. We ended the year with the Fund’s duration at close to the highest level for the entire year. The portfolio benefitted from active duration management as our tactical moves were synchronized
with the movement in rates during the reporting period.
2
Muzinich Funds
Furthermore, while our US Treasury exposure seemed poised to be the laggard for the year, the November and December move lower in rates allowed our US
Treasury allocation to perform just as well as the US investment grade allocation.
Muzinich Flexible U.S. High Yield Income Fund
In this environment, the Muzinich Flexible U.S. High Yield Income Fund generated strong positive returns but underperformed its benchmark, net of fees.
Over the reporting period, credit spreads tightened across the quality spectrum while rates were materially less impactful than in 2022. We remained fully invested to capture the benefits of the higher yield and potential price gains for high yield
bonds given positive economic growth. We maintained focus on credits that can perform in a variety of economic scenarios.
Nearly all rating cohorts contributed positively on an absolute basis, led by BB- and B+ rated credits, while on a relative basis, Fund performance
benefitted from strong credit selection of CCC+ rated bonds. Strong credit selection of containers and energy bonds bolstered performance, while exposure to select paper sector bonds acted as a drag. Strong credit selection across the core 3-5 years
duration segment benefitted relative returns, as did an underweight of 1-3 years duration bonds.
Looking at historical performance of the high yield asset class, we believe high yield is poised to produce a positive return in 2024, albeit not as robust
as in 2023. US Treasury volatility is expected to remain elevated until the market is convinced that the Federal Reserve (Fed) is cutting rates consistently and that the economy is not cratering. Given these assumptions, we believe that exposure to
high yield is warranted and that investors may meaningfully benefit by deploying capital and buying the dips associated with either rate increases or risk-off periods. In our view, such a strategy allows for participation in the asset class if the
economy continues to move forward, while locking in higher yields and potential capital gains around selloffs. This cycle may prove to be elongated given some of the structural changes that have occurred in the market post-COVID and the return of
yields back to pre-GFC (Great Financial Crisis) levels due to a “higher-for-longer” Fed.
Muzinich Low Duration Fund
Year to date, the Fund produced strong positive returns and comfortably outperformed its indicative index, the ICE BofA 1-3 year US Corporate and
Government Index (B1A0). During the reporting period, we have continued to focus on an issuer’s ability to repay short-dated bonds. This focus has allowed us to look through various macro headwinds, sector concerns, and market headlines. Our
approach, coupled with deep fundamental credit research, has allowed us to stake positions in broadly out-of-favor issuers and sectors, subsequently reaping the benefit of higher yields as bonds are repaid.
In 2023, we maintained our confidence in the Fund’s banking exposure (despite March’s banking crisis) and were rewarded later. Active portfolio management
decisions also helped drive performance in 2023. Our preference for BBBs over single A rated credit in the investment grade market, along with our preference for more cyclical sectors (e.g., automotives & auto parts and diversified financial
services) led to some of the strongest performance in the portfolio. We also maintained a decent exposure in high yield credit. While we significantly reduced our single-B exposure throughout the year—which cost the Fund performance during the
year-end market rally—we felt this was a prudent decision as risks remain elevated for highly levered businesses in an environment of higher funding costs.
In addition, active management of our USD and EUR credit exposure also proved beneficial. We started the year overweight EUR credit as we saw a clear
premium in terms of spreads and yields after currency hedging costs—despite concerns about a more significant slowdown in the Eurozone region relative to other developed markets. Later in the year, as valuations between the two markets shifted back
to fair value, we unwound our EUR bias and moved to a slight overweight in USD credit. This decision was based on the relative difference in rate curves and our belief that the U.S. Treasury curve could rally more than the German Bund curve. We
continue to believe that this Fund should appeal to investors wanting limited interest rate and credit risk, while benefiting from active management and credit selection in a global strategy.
Outlook
We believe credit markets in 2024 will benefit from the relatively high carry in bond yields on their way to delivering mid-to-high single digit total
returns—maybe more if an added optimistic yield scenario materializes. We see potential dispersion of returns based on credit quality and refinancing risk—an environment of opportunities for an active manager. High yield markets are expected to
outperform investment grade markets, and we expect technical factors to be supportive in general, which could leave spreads around their historical averages in a low growth economic scenario. Furthermore, we do not believe there are sectors to avoid
vs. sectors to love, as we see potential for both positive and negative idiosyncratic situations developing in various industries, generating alpha opportunities in 2024. As we have been saying, corporate credit balance sheets entered this cycle in
good fundamental shape with low leverage and high coverage, and with a relatively benign maturity profile.
3
Muzinich Funds
We appreciate the confidence and trust you have placed in Muzinich.
Sincerely,
 |
 |
 |
|
Anthony DeMeo
|
Stuart Fuller
|
Joe Galzerano
|
 |
 |
 |
|
Tatjana Greil-Castro
|
Warren Hyland
|
Ian Horn
|
 |
 |
 |
|
Michael McEachern
|
Sam McGairl
|
Brian Nold
|
 |
 |
 |
|
Bryan Petermann
|
Torben Ronberg
|
Thomas Samson
|
 |
 |
|
|
Eric Schure
|
Kevin Ziets
|
Opinions expressed are subject to change at any time, are not guaranteed and should not be considered investment advice.
Past performance does not guarantee future results. Short-term performance, in particular, is not a good indication of the Funds’ future performance, and
an investment should not be made solely on returns.
Fund holdings and/or sector allocations are subject to change at any time and are not recommendations to buy or sell any security. Please see the Schedules
of Investments for a complete list of holdings.
Mutual fund investing involves risk. Principal loss is possible. Investments in debt securities typically decrease in value when interest rates rise. This
risk is usually greater for longer-term debt securities. Investment by the Funds in lower-rated and non-rated securities presents a greater risk of loss to principal and interest than higher-rated securities. Investments in foreign securities involve
greater volatility and political, economic and currency risks and differences in accounting methods. These risks are greater for emerging markets. Derivatives involve risks different from, and in certain cases, greater than the risks presented by
more traditional investments. These risks are fully disclosed in the prospectus. Floating rate loans may not be fully collateralized and therefore may decline significantly in value. Each Fund will bear its share of the fees and expenses of
investments in underlying funds or exchange-traded funds (ETFs). Shareholders will pay higher expenses than would be the case if making direct investments in underlying funds or ETFs. Because the Funds invest in ETFs, they are subject to additional
risks that do not apply to conventional mutual funds, including the risks that the market price of an ETF’s shares may trade at a discount to its net asset value (“NAV”), an active secondary trading market may not develop or be maintained, or trading
may be halted by the exchange in which they trade, which may impact a Fund’s ability to sell its shares. The Funds invest in high yield debt instruments which tend to be less liquid than higher quality debt instruments. The Funds may make short sales
of securities, which involves the risk that losses may exceed the original amount invested. Please note that while the Funds’ prospectus states that the Funds may use leverage, and that they may make short sales of securities, which involve the risk
that losses may exceed the original amount invested, the Funds’ portfolio managers do not anticipate engaging in either practice. The Funds will endeavor to limit price fluctuations caused by the changing relative value of currencies in which the
Funds invest but hedging involves costs and there can be no guarantee that the Funds will be perfectly hedged or that the hedging will work as anticipated.
Diversification does not assure a profit, nor does it protect against a loss in a declining market.
4
Muzinich Funds
Must be preceded or accompanied by a prospectus.
Bond ratings are grades given to bonds that indicate their credit quality as determined by a private independent rating service. The firm evaluates a bond issuer’s financial
strength, or its ability to pay a bond’s principal and interest in a timely fashion. Ratings are expressed as letters ranging from ‘AAA’ which is the highest grade to ‘D,’ which is the lowest grade. In limited situations when the rating agency has
not issued a formal rating, the Advisor will classify the security as non-rated.
Index Definitions:
The ICE BofA Global Corporate & High Yield Index (GI00) is an unmanaged index tracking the performance of fixed-rate investment grade and below investment grade corporate
debt publicly issued in the major domestic and Eurobond markets. Qualifying currencies include AUD, CAD, EUR, JPY, GBP, and USD. Qualifying issues must meet minimum size requirements denominated in the currency of issue and must have a remaining term
of at least one year to maturity.
The ICE BofA BB-B US Cash Pay High Yield Constrained Index (JUC4) contains all securities in The BofA Merrill Lynch US Cash Pay High Yield Index rated BB1 through B3, based
on an average of Moody’s, S&P and Fitch, but caps issuer exposure at 2%. Index constituents are capitalization-weighted, based on their current amount outstanding, provided the total allocation to an individual issuer does not exceed 2%.
The ICE BofA 1-5 Year BB-B US Cash Pay High Yield Constrained Index (JVC4) contains all securities in the ICE BofA US Cash Pay High Yield Index that are rated BB1 through B3,
based on an average of Moody’s, S&P and Fitch, with a maturity less than five years, but caps issuer exposure at 2%.
The ICE BofA 1-3 Year US Corporate & Government Index (B1A0) is a subset of The BofA Merrill Lynch US Corporate & Government Index including all securities with a
remaining term to final maturity less than 3 years.
Glossary:
Duration is a measure of the expected life of a fixed income security that is used to determine the sensitivity of a security’s price to changes in interest rates.
Spreads are the difference between the interest rate received on a bond and the interest rate that would be received at the same time on a similar-duration U.S. government
debt security.
The US Treasury and German Bund yield curves plot the relationship of yield to length of time to maturity for the respective governments’ bonds. When the yield curve rallies,
yields decline as bond prices rise.
Muzinich & Co. is a registered investment adviser. The Muzinich Funds are distributed by Quasar Distributors, LLC.
5
Muzinich Credit Opportunities Fund
(“Credit Opportunities Fund”)
|
SECTOR ALLOCATIONS at December 31, 2023 (Unaudited)
|
|
Sector
|
% of Net Assets
|
|||
|
Energy
|
11.4
|
%
|
||
|
Diversified Financial Services
|
7.5
|
%
|
||
|
Banking
|
7.3
|
%
|
||
|
Homebuilders/Real Estate
|
5.4
|
%
|
||
|
Telecommunications
|
5.3
|
%
|
||
|
Healthcare
|
4.9
|
%
|
||
|
Automotive & Auto Parts
|
4.8
|
%
|
||
|
Food/Beverage/Tobacco
|
4.8
|
%
|
||
|
Transportation Excluding Air/Rail
|
3.5
|
%
|
||
|
Airlines
|
3.2
|
%
|
||
|
Chemicals
|
3.0
|
%
|
||
|
Technology
|
2.8
|
%
|
||
|
Utilities
|
2.4
|
%
|
||
|
Services
|
2.4
|
%
|
||
|
Capital Goods
|
2.1
|
%
|
||
|
Super Retail
|
1.8
|
%
|
||
|
Containers
|
1.8
|
%
|
||
|
Cable/Satellite TV
|
1.5
|
%
|
||
|
Food & Drug Retail
|
1.2
|
%
|
||
|
Hotels
|
1.2
|
%
|
||
|
Restaurants
|
1.1
|
%
|
||
|
Broadcasting
|
1.0
|
%
|
||
|
Metals/Mining
|
0.8
|
%
|
||
|
Steel
|
0.7
|
%
|
||
|
Leisure
|
0.7
|
%
|
||
|
Paper
|
0.6
|
%
|
||
|
Building Materials
|
0.5
|
%
|
||
|
Diversified Media
|
0.4
|
%
|
||
|
Environmental
|
0.3
|
%
|
||
|
Publishing/Printing
|
0.3
|
%
|
||
|
Aerospace/Defense
|
0.2
|
%
|
||
|
Gaming
|
0.1
|
%
|
||
|
Cash & Equivalents1
|
15.0
|
%
|
||
|
Total
|
100.0
|
%
|
||
|
1
|
Represents cash, short-term securities and other assets in excess of liabilities.
|
6
Muzinich Flexible U.S. High Yield Income Fund
(“Flexible U.S. High Yield Income Fund”)
|
SECTOR ALLOCATIONS at December 31, 2023 (Unaudited)
|
|
Sector
|
% of Net Assets
|
|||
|
|
||||
|
Energy
|
12.0
|
%
|
||
|
Diversified Financial Services
|
7.3
|
%
|
||
|
Healthcare
|
7.3
|
%
|
||
|
Homebuilders/Real Estate
|
7.2
|
%
|
||
|
Telecommunications
|
6.3
|
%
|
||
|
Services
|
5.8
|
%
|
||
|
Cable/Satellite TV
|
5.0
|
%
|
||
|
Technology
|
4.7
|
%
|
||
|
Gaming
|
4.2
|
%
|
||
|
Leisure
|
3.9
|
%
|
||
|
Super Retail
|
3.2
|
%
|
||
|
Containers
|
2.9
|
%
|
||
|
Broadcasting
|
2.7
|
%
|
||
|
Metals/Mining
|
2.7
|
%
|
||
|
Utilities
|
2.7
|
%
|
||
|
Restaurants
|
2.2
|
%
|
||
|
Aerospace/Defense
|
2.1
|
%
|
||
|
Chemicals
|
2.0
|
%
|
||
|
Automotive & Auto Parts
|
1.9
|
%
|
||
|
Building Materials
|
1.8
|
%
|
||
|
Airlines
|
1.7
|
%
|
||
|
Hotels
|
1.4
|
%
|
||
|
Food/Beverage/Tobacco
|
1.2
|
%
|
||
|
Capital Goods
|
1.1
|
%
|
||
|
Diversified Media
|
1.0
|
%
|
||
|
Transportation Excluding Air/Rail
|
0.8
|
%
|
||
|
Consumer-Products
|
0.6
|
%
|
||
|
Food & Drug Retail
|
0.6
|
%
|
||
|
Insurance
|
0.6
|
%
|
||
|
Publishing/Printing
|
0.6
|
%
|
||
|
Environmental
|
0.4
|
%
|
||
|
Cash & Equivalents1
|
2.1
|
%
|
||
|
Total
|
100.0
|
%
|
||
|
1
|
Represents cash and other assets in excess of liabilities.
|
7
Muzinich Low Duration Fund
(“Low Duration Fund”)
|
SECTOR ALLOCATIONS at December 31, 2023 (Unaudited)
|
|
Sector
|
% of Net Assets
|
|||
|
Banking
|
22.5
|
%
|
||
|
Diversified Financial Services
|
15.3
|
%
|
||
|
Homebuilders/Real Estate
|
8.9
|
%
|
||
|
Automotive & Auto Parts
|
8.4
|
%
|
||
|
Healthcare
|
4.4
|
%
|
||
|
Technology
|
4.3
|
%
|
||
|
Telecommunications
|
4.3
|
%
|
||
|
Transportation Excluding Air/Rail
|
3.2
|
%
|
||
|
Services
|
2.9
|
%
|
||
|
Food/Beverage/Tobacco
|
2.8
|
%
|
||
|
Chemicals
|
2.5
|
%
|
||
|
Capital Goods
|
2.5
|
%
|
||
|
Hotels
|
2.0
|
%
|
||
|
Energy
|
2.0
|
%
|
||
|
Airlines
|
1.8
|
%
|
||
|
Broadcasting
|
1.5
|
%
|
||
|
Super Retail
|
1.4
|
%
|
||
|
Utilities
|
1.1
|
%
|
||
|
Containers
|
1.0
|
%
|
||
|
Cable/Satellite TV
|
0.9
|
%
|
||
|
Agency
|
0.8
|
%
|
||
|
Metals/Mining
|
0.8
|
%
|
||
|
Gaming
|
0.8
|
%
|
||
|
Consumer-Products
|
0.7
|
%
|
||
|
Building Materials
|
0.6
|
%
|
||
|
Railroads
|
0.5
|
%
|
||
|
Supranational
|
0.5
|
%
|
||
|
Paper
|
0.5
|
%
|
||
|
Steel
|
0.5
|
%
|
||
|
Leisure
|
0.4
|
%
|
||
|
Insurance
|
0.4
|
%
|
||
|
Diversified Media
|
0.3
|
%
|
||
|
Publishing/Printing
|
0.3
|
%
|
||
|
Food & Drug Retail
|
0.2
|
%
|
||
|
Cash & Equivalents1
|
-1.0
|
%
|
||
|
Total
|
100.0
|
%
|
||
|
1
|
Represents cash, short-term securities and other assets in excess of liabilities.
|
8
Credit Opportunities Fund
|
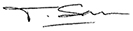
HISTORICAL PERFORMANCE – SUPRA INSTITUTIONAL CLASS
|
Value of $5,000,000 vs. ICE BofAML Global Corporate &
High Yield Index (USD 100% Hedged)
(Unaudited)
|
Average Annual
|
Since Inception
|
Ending Value
|
||||
|
Returns for the Year Ended December 31, 2023
|
1 Year
|
3 Year
|
5 Year
|
10 Year
|
(1/3/2013)
|
(12/31/2023)
|
|
Credit Opportunities Fund (Supra Institutional)
|
7.48%
|
-0.16%
|
3.22%
|
3.19%
|
3.64%
|
$7,406,434
|
|
ICE BofAML Global Corporate &
|
||||||
|
High Yield Index (USD 100% Hedged)
|
9.54%
|
-1.88%
|
2.85%
|
3.30%
|
3.15%
|
$6,766,787
|
This chart illustrates the performance of a hypothetical $5,000,000 investment made on January 3, 2013, and is not intended to imply any future performance. The returns shown do not reflect the deduction of taxes that
a shareholder would pay on Fund distributions or the redemption of Fund shares. The returns reflect fee waivers in effect. In the absence of such waivers, total return would be reduced. The chart assumes reinvestment of capital gains, dividends
and return of capital, if applicable, for the Fund and dividends for the index.
Performance data quoted represents past performance; past performance does not guarantee future results. The investment return and principal value of an investment will fluctuate so that an
investor’s shares, when redeemed, may be worth more or less than their original cost. Current performance of the Fund may be lower or higher than the performance quoted. Performance data current to the most recent month end may be obtained by
calling 855-689-4642. The Fund imposes a 1.00% redemption fee on shares held for 90 days or less. Performance data quoted does not reflect the redemption fee. If reflected, total returns would be less.
9
Credit Opportunities Fund
|
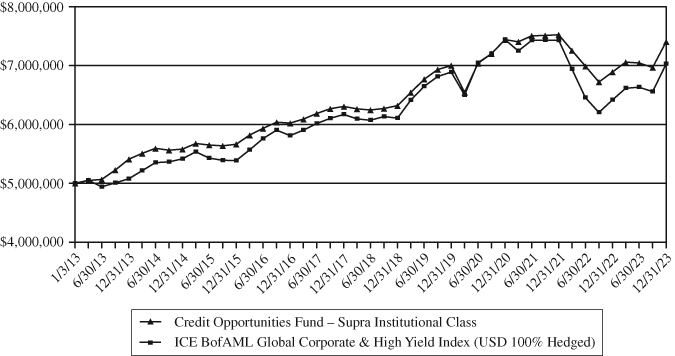
HISTORICAL PERFORMANCE – INSTITUTIONAL CLASS
|
Value of $1,000,000 vs. ICE BofAML Global Corporate &
High Yield Index (USD 100% Hedged)
(Unaudited)
|
Average Annual
|
Since Inception
|
Ending Value
|
|||
|
Returns for the Year Ended December 31, 2023
|
1 Year
|
3 Year
|
5 Year
|
(10/15/2014)
|
(12/31/2023)
|
|
Credit Opportunities Fund (Institutional)
|
7.40%
|
-0.20%
|
3.15%
|
3.07%
|
$1,321,466
|
|
ICE BofAML Global Corporate &
|
|||||
|
High Yield Index (USD 100% Hedged)
|
9.54%
|
-1.88%
|
2.85%
|
3.15%
|
$1,248,262
|
This chart illustrates the performance of a hypothetical $1,000,000 investment made on October 15, 2014, and is not intended to imply any future performance. The returns shown do not reflect the deduction of taxes
that a shareholder would pay on Fund distributions or the redemption of Fund shares. The returns reflect fee waivers in effect. In the absence of such waivers, total return would be reduced. The chart assumes reinvestment of capital gains,
dividends and return of capital, if applicable, for the Fund and dividends for the index.
Performance data quoted represents past performance; past performance does not guarantee future results. The investment return and principal value of an investment will fluctuate so that an
investor’s shares, when redeemed, may be worth more or less than their original cost. Current performance of the Fund may be lower or higher than the performance quoted. Performance data current to the most recent month end may be obtained by
calling 855-689-4642. The Fund imposes a 1.00% redemption fee on shares held for 90 days or less. Performance data quoted does not reflect the redemption fee. If reflected, total returns would be less.
10
Flexible U.S. High Yield Income Fund
|
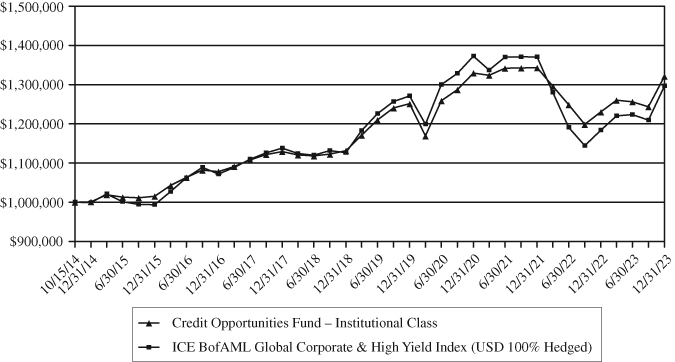
HISTORICAL PERFORMANCE – SUPRA INSTITUTIONAL CLASS
|
Value of $5,000,000 vs. ICE BofA BB-B U.S. Cash Pay High Yield Constrained Index (JUC4)
and ICE BofA 1-5 Year BB-B U.S. Cash Pay High Yield Constrained Index (JVC4)
(Unaudited)
|
Average Annual
|
Since Inception
|
Ending Value
|
|||
|
Returns for the Year Ended December 31, 2023
|
1 Year
|
3 Year
|
5 Year
|
(3/31/2016)
|
(12/31/2023)
|
|
Flexible U.S. High Yield Fund (Supra Institutional)
|
9.98%
|
0.50%
|
4.28%
|
4.20%
|
$6,877,372
|
|
ICE BofA BB-B U.S. Cash
|
|||||
|
Pay High Yield Constrained Index (JUC4)
|
12.63%
|
1.76%
|
5.21%
|
5.40%
|
$7,514,746
|
|
ICE BofA 1-5 Year BB-B U.S. Cash
Pay High Yield Constrained Index (JVC4)
|
11.56%
|
3.43%
|
4.92%
|
5.23%
|
$7,425,004
|
This chart illustrates the performance of a hypothetical $5,000,000 investment made on March 31, 2016, and is not intended to imply any future performance. The returns shown do not reflect the deduction of taxes that a
shareholder would pay on Fund distributions or the redemption of Fund shares. The returns reflect fee waivers in effect. In the absence of such waivers, total return would be reduced. The chart assumes reinvestment of capital gains, dividends and
return of capital, if applicable, for the Fund and dividends for the index.
Performance data quoted represents past performance; past performance does not guarantee future results. The investment return and principal value of an investment will fluctuate so that an
investor’s shares, when redeemed, may be worth more or less than their original cost. Current performance of the Fund may be lower or higher than the performance quoted. Performance data current to the most recent month end may be obtained by
calling 855-689-4642. The Fund imposes a 1.00% redemption fee on shares held for 90 days or less. Performance data quoted does not reflect the redemption fee. If reflected, total returns would be less.
11
Flexible U.S. High Yield Income Fund
|
HISTORICAL PERFORMANCE – INSTITUTIONAL CLASS
|
Value of $1,000,000 vs. ICE BofA BB-B U.S. Cash Pay High Yield Constrained Index (JUC4)
and ICE BofA 1-5 Year BB-B U.S. Cash Pay High Yield Constrained Index (JVC4)
(Unaudited)
|
Average Annual
|
Since Inception
|
Ending Value
|
|||
|
Returns for the Year Ended December 31, 2023
|
1 Year
|
3 Year
|
5 Year
|
(3/27/2017)
|
(12/31/2023)
|
|
Flexible U.S. High Yield Fund (Institutional)
|
9.98%
|
0.46%
|
4.24%
|
3.52%
|
$1,263,711
|
|
ICE BofA BB-B U.S. Cash
|
|||||
|
Pay High Yield Constrained Index (JUC4)
|
12.63%
|
1.76%
|
5.21%
|
4.35%
|
$1,333,923
|
|
ICE BofA 1-5 Year BB-B U.S. Cash
Pay High Yield Constrained Index (JVC4)
|
11.56% |
3.43% |
4.92% |
4.35% |
$1,334,110 |
This chart illustrates the performance of a hypothetical $1,000,000 investment made on March 27, 2017, and is not intended to imply any future performance. The returns shown do not reflect the deduction of taxes that a
shareholder would pay on Fund distributions or the redemption of Fund shares. The returns reflect fee waivers in effect. In the absence of such waivers, total return would be reduced. The chart assumes reinvestment of capital gains, dividends and
return of capital, if applicable, for the Fund and dividends for the index.
Performance data quoted represents past performance; past performance does not guarantee future results. The investment return and principal value of an investment will fluctuate so that an
investor’s shares, when redeemed, may be worth more or less than their original cost. Current performance of the Fund may be lower or higher than the performance quoted. Performance data current to the most recent month end may be obtained by
calling 855-689-4642. The Fund imposes a 1.00% redemption fee on shares held for 90 days or less. Performance data quoted does not reflect the redemption fee. If reflected, total returns would be less.
12
Low Duration Fund
|
HISTORICAL PERFORMANCE – SUPRA INSTITUTIONAL CLASS
|
Value of $5,000,000 vs. ICE BofAML
1-3 Year U.S. Corporate & Government Index (B1A0)
(Unaudited)
|
Average Annual
|
Since Inception
|
Ending Value
|
|||
|
Returns for the Year Ended December 31, 2023
|
1 Year
|
3 Year
|
5 Year
|
(6/30/2016)
|
(12/31/2023)
|
|
Low Duration Fund (Supra Institutional)
|
7.63%
|
2.14%
|
3.36%
|
3.07%
|
$6,272,569
|
|
ICE BofA Merrill Lynch 1-3 Year U.S. Corporate
|
|||||
|
& Government Index (B1A0)
|
4.66%
|
0.10%
|
1.53%
|
1.30%
|
$5,509,222
|
This chart illustrates the performance of a hypothetical $5,000,000 investment made on June 30, 2016, and is not intended to imply any future performance. The returns shown do not reflect the deduction of taxes that a
shareholder would pay on Fund distributions or the redemption of Fund shares. The returns reflect fee waivers in effect. In the absence of such waivers, total return would be reduced. The chart assumes reinvestment of capital gains, dividends and
return of capital, if applicable, for the Fund and dividends for the index.
Performance data quoted represents past performance; past performance does not guarantee future results. The investment return and principal value of an investment will fluctuate so that an
investor’s shares, when redeemed, may be worth more or less than their original cost. Current performance of the Fund may be lower or higher than the performance quoted. Performance data current to the most recent month end may be obtained by
calling 855-689-4642. The Fund imposes a 1.00% redemption fee on shares held for 90 days or less. Performance data quoted does not reflect the redemption fee. If reflected, total returns would be less.
13
Credit Opportunities Fund
|
SCHEDULE OF INVESTMENTS at December 31, 2023
|
|
Principal
|
|||||||
|
Amount†
|
Value
|
||||||
|
CORPORATE BONDS: 76.7%
|
|||||||
|
Aerospace/Defense: 0.2%
|
|||||||
|
Rolls-Royce PLC
|
|||||||
|
$
|
525,000
|
1.625%, 05/09/2028
|
$
|
536,191
|
|||
|
Airlines: 2.8%
|
|||||||
|
American Airlines Inc/
|
|||||||
|
AAdvantage Loyalty IP Ltd
|
|||||||
|
458,333
|
5.500%, 04/20/2026 1
|
455,372
|
|||||
|
425,000
|
5.750%, 04/20/2029 1
|
414,633
|
|||||
|
Delta Air Lines Inc
|
|||||||
|
1,250,000
|
7.375%, 01/15/2026
|
1,293,021
|
|||||
|
easyJet FinCo BV
|
|||||||
|
900,000
|
1.875%, 03/03/2028
|
929,997
|
|||||
|
Emirates Airline
|
|||||||
|
322,818
|
4.500%, 02/06/2025
|
319,772
|
|||||
|
Korean Air Lines Co Ltd
|
|||||||
|
620,000
|
4.750%, 09/23/2025
|
614,916
|
|||||
|
Mileage Plus Holdings LLC / Mileage
|
|||||||
|
Plus Intellectual Property Assets Ltd
|
|||||||
|
630,000
|
6.500%, 06/20/2027
|
632,278
|
|||||
|
Singapore Airlines Ltd
|
|||||||
|
1,836,000
|
3.000%, 07/20/2026
|
1,750,508
|
|||||
|
Wizz Air Finance Co BV
|
|||||||
|
550,000
|
1.350%, 01/19/2024
|
606,508
|
|||||
|
650,000
|
1.000%, 01/19/2026
|
661,611
|
|||||
|
7,678,616
|
|||||||
|
Automotive & Auto Parts: 4.0%
|
|||||||
|
Autoliv Inc
|
|||||||
|
500,000
|
4.250%, 03/15/2028
|
566,937
|
|||||
|
Ford Motor Credit Co LLC
|
|||||||
|
1,500,000
|
7.122%, 11/07/2033
|
1,619,733
|
|||||
|
General Motors Financial Co Inc
|
|||||||
|
1,325,000
|
6.100%, 01/07/2034
|
1,365,392
|
|||||
|
Hyundai Capital America
|
|||||||
|
1,698,000
|
1.650%, 09/17/2026 1
|
1,544,628
|
|||||
|
IHO Verwaltungs GmbH
|
|||||||
|
400,000
|
3.750%, 4.50, 09/15/2026
|
436,618
|
|||||
|
Kia Corp
|
|||||||
|
470,000
|
3.250%, 04/21/2026
|
450,746
|
|||||
|
Magna International Inc
|
|||||||
|
500,000
|
4.375%, 03/17/2032
|
589,775
|
|||||
|
Nissan Motor Acceptance Co LLC
|
|||||||
|
400,000
|
7.050%, 09/15/2028
|
422,355
|
|||||
|
Nissan Motor Co Ltd
|
|||||||
|
850,000
|
4.810%, 09/17/2030 1
|
796,469
|
|||||
|
Stellantis NV
|
|||||||
|
975,000
|
4.250%, 06/16/2031
|
1,118,632
|
|||||
|
500,000
|
2.750%, 04/01/2032
|
517,399
|
|||||
|
Volkswagen International Finance NV
|
|||||||
|
200,000
|
4.625% (10 Year Swap Rate
|
||||||
|
EUR + 3.982%), 2
|
214,475
|
||||||
|
200,000
|
7.500% (5 Year Swap Rate
|
||||||
|
EUR + 4.292%), 2
|
240,609
|
||||||
|
ZF North America Capital Inc
|
|||||||
|
|
650,000
|
4.750%, 04/29/2025
|
643,001
|
||||
|
10,526,769
|
|||||||
|
Banking: 5.2%
|
|||||||
|
AIB Group PLC
|
|||||||
|
900,000
|
3.625% (1 Year EUR Swap
|
||||||
|
Rate + 2.000%), 07/04/2026 2
|
994,224
|
||||||
|
Banco Santander SA
|
|||||||
|
800,000
|
9.625% (5 Year CMT
|
||||||
|
Rate + 5.298%), 02/21/2172 2
|
876,000
|
||||||
|
Bancolombia SA
|
|||||||
|
500,000
|
6.909% (5 Year CMT
|
||||||
|
Rate + 2.929%), 10/18/2027 2
|
500,383
|
||||||
|
Bank of America Corp
|
|||||||
|
1,275,000
|
1.898% (US Secured Overnight
|
||||||
|
Financing Rate + 1.530%), 07/23/2031 2
|
1,045,460
|
||||||
|
Bank of Ireland Group PLC
|
|||||||
|
800,000
|
1.875% (EURIBOR ICE Swap
|
||||||
|
Rate + 1.100%), 06/05/2026 2
|
859,368
|
||||||
|
Barclays PLC
|
|||||||
|
1,000,000
|
2.852% (US Secured Overnight
|
||||||
|
Financing Rate + 2.714%), 05/07/2026 2
|
964,985
|
||||||
|
800,000
|
9.625% (USISSO05 + 5.775%),
|
||||||
|
03/15/2172 2
|
836,320
|
||||||
|
BPCE SA
|
|||||||
|
700,000
|
1.652% (US Secured Overnight
|
||||||
|
Financing Rate + 1.520%), 10/06/2026 1,2
|
652,074
|
||||||
|
Deutsche Bank AG
|
|||||||
|
900,000
|
7.079% (US Secured Overnight
|
||||||
|
Financing Rate + 3.650%), 02/10/2034 2
|
927,353
|
||||||
|
First Abu Dhabi Bank PJSC
|
|||||||
|
750,000
|
6.320% (5 Year CMT Rate + 1.700%),
|
||||||
|
04/04/2034 2
|
773,644
|
||||||
|
HSBC Holdings PLC
|
|||||||
|
250,000
|
3.000%, 06/30/2025
|
273,406
|
|||||
|
800,000
|
6.905% (US Secured Overnight
|
||||||
|
Financing Rate + 1.570%), 08/14/2027 2
|
804,289
|
||||||
|
NatWest Group PLC
|
|||||||
|
900,000
|
1.750% (3 Month EURIBOR + 1.080%),
|
||||||
|
03/02/2026 2
|
967,748
|
||||||
|
Permanent TSB Group Holdings PLC
|
|||||||
|
800,000
|
6.625% (EURIBOR ICE Swap
|
||||||
|
Rate + 3.500%), 04/25/2028 2
|
933,064
|
||||||
|
Societe Generale SA
|
|||||||
|
800,000
|
10.000% (5 Year CMT Rate + 5.448%),
|
||||||
|
05/14/2172 1,2
|
856,923
|
||||||
|
Standard Chartered PLC
|
|||||||
|
800,000
|
7.202% (US Secured Overnight
|
||||||
|
Financing Rate + 1.930%), 07/06/2027 2
|
803,977
|
||||||
|
United Overseas Bank Ltd
|
|||||||
|
900,000
|
3.863% (5 Year CMT Rate + 1.450%),
|
||||||
|
10/07/2032 2
|
861,715
|
||||||
|
13,930,933
|
|||||||
The accompanying notes are an integral part of these financial statements.
14
Credit Opportunities Fund
|
SCHEDULE OF INVESTMENTS at December 31, 2023 (Continued)
|
|
Principal
|
|||||||
|
Amount†
|
Value
|
||||||
|
CORPORATE BONDS: 76.7% (Continued)
|
|||||||
|
Broadcasting: 1.0%
|
|||||||
|
Sirius XM Radio Inc
|
|||||||
|
$
|
700,000
|
3.125%, 09/01/2026 1
|
$
|
658,568
|
|||
|
TEGNA Inc
|
|||||||
|
1,125,000
|
4.750%, 03/15/2026
|
1,095,808
|
|||||
|
Universal Music Group NV
|
|||||||
|
575,000
|
4.000%, 06/13/2031
|
664,670
|
|||||
|
2,419,046
|
|||||||
|
Building Materials: 0.5%
|
|||||||
|
Builders FirstSource Inc
|
|||||||
|
500,000
|
4.250%, 02/01/2032 1
|
451,714
|
|||||
|
Standard Industries Inc
|
|||||||
|
900,000
|
5.000%, 02/15/2027 1
|
878,037
|
|||||
|
1,329,751
|
|||||||
|
Cable/Satellite TV: 1.3%
|
|||||||
|
CCO Holdings LLC /
|
|||||||
|
CCO Holdings Capital Corp
|
|||||||
|
2,075,000
|
5.500%, 05/01/2026
|
2,062,606
|
|||||
|
700,000
|
5.125%, 05/01/2027 1
|
675,951
|
|||||
|
Grupo Televisa SAB
|
|||||||
|
400,000
|
6.625%, 01/15/2040
|
420,384
|
|||||
|
Telenet Finance Luxembourg
|
|||||||
|
Notes SARL
|
|||||||
|
100,000
|
3.500%, 03/01/2028
|
105,589
|
|||||
|
UPCB Finance VII Ltd
|
|||||||
|
225,000
|
3.625%, 06/15/2029
|
238,089
|
|||||
|
3,502,619
|
|||||||
|
Capital Goods: 2.1%
|
|||||||
|
AGCO International Holdings BV
|
|||||||
|
275,000
|
0.800%, 10/06/2028
|
266,547
|
|||||
|
Carrier Global Corp
|
|||||||
|
225,000
|
5.900%, 03/15/2034 1
|
244,029
|
|||||
|
Ingersoll Rand Inc
|
|||||||
|
1,625,000
|
5.700%, 08/14/2033
|
1,721,078
|
|||||
|
Parker-Hannifin Corp
|
|||||||
|
950,000
|
3.250%, 03/01/2027
|
912,495
|
|||||
|
Regal Rexnord Corp
|
|||||||
|
1,350,000
|
6.050%, 04/15/2028 1
|
1,368,790
|
|||||
|
Traton Finance Luxembourg SA
|
|||||||
|
400,000
|
4.125%, 11/22/2025
|
445,262
|
|||||
|
Vestas Wind Systems AS
|
|||||||
|
450,000
|
4.125%, 06/15/2031
|
513,342
|
|||||
|
5,471,543
|
|||||||
|
Chemicals: 2.8%
|
|||||||
|
Alpek SAB de CV
|
|||||||
|
868,000
|
4.250%, 09/18/2029
|
801,367
|
|||||
|
Celanese US Holdings LLC
|
|||||||
|
900,000
|
6.050%, 03/15/2025
|
906,243
|
|||||
|
1,025,000
|
6.550%, 11/15/2030
|
1,086,304
|
|||||
|
1,025,000
|
6.700%, 11/15/2033
|
1,116,553
|
|||||
|
IMCD NV
|
|||||||
|
325,000
|
4.875%, 09/18/2028
|
376,363
|
|||||
|
Orbia Advance Corp SAB de CV
|
|||||||
|
1,400,000
|
4.000%, 10/04/2027
|
1,330,270
|
|||||
|
Sherwin-Williams Co
|
|||||||
|
2,100,000
|
2.950%, 08/15/2029
|
1,936,174
|
|||||
|
7,553,274
|
|||||||
|
Containers: 1.8%
|
|||||||
|
Ball Corp
|
|||||||
|
1,125,000
|
6.000%, 06/15/2029
|
1,150,262
|
|||||
|
DS Smith PLC
|
|||||||
|
525,000
|
0.875%, 09/12/2026
|
541,603
|
|||||
|
Graphic Packaging International LLC
|
|||||||
|
1,525,000
|
0.821%, 04/15/2024 1
|
1,504,754
|
|||||
|
Sealed Air Corp/Sealed Air Corp US
|
|||||||
|
225,000
|
6.125%, 02/01/2028 1
|
227,000
|
|||||
|
SIG Combibloc PurchaseCo SARL
|
|||||||
|
775,000
|
2.125%, 06/18/2025
|
840,137
|
|||||
|
Verallia SA
|
|||||||
|
600,000
|
1.875%, 11/10/2031
|
583,711
|
|||||
|
4,847,467
|
|||||||
|
Diversified Financial Services: 6.9%
|
|||||||
|
AerCap Ireland Capital DAC /
|
|||||||
|
AerCap Global Aviation Trust
|
|||||||
|
900,000
|
6.150%, 09/30/2030
|
950,098
|
|||||
|
AXA Logistics Europe Master SCA
|
|||||||
|
500,000
|
0.375%, 11/15/2026
|
502,383
|
|||||
|
CA Auto Bank SPA
|
|||||||
|
850,000
|
4.375%, 06/08/2026
|
953,968
|
|||||
|
725,000
|
6.000%, 12/06/2026
|
943,016
|
|||||
|
DAE Funding LLC
|
|||||||
|
1,400,000
|
3.375%, 03/20/2028
|
1,292,222
|
|||||
|
Fidelity National Info Service
|
|||||||
|
800,000
|
2.000%, 05/21/2030
|
821,127
|
|||||
|
Goldman Sachs Group Inc
|
|||||||
|
1,900,000
|
4.223% (CME Term SOFR 3 Month
|
||||||
|
+ 1.563%), 05/01/2029 2
|
1,841,148
|
||||||
|
Grupo de Inversiones Suramericana SA
|
|||||||
|
1,500,000
|
5.500%, 04/29/2026
|
1,473,801
|
|||||
|
GTCR W-2 Merger Sub LLC
|
|||||||
|
400,000
|
7.500%, 01/15/2031 1
|
422,949
|
|||||
|
ICD Funding Ltd
|
|||||||
|
1,900,000
|
3.223%, 04/28/2026
|
1,792,732
|
|||||
|
Macquarie Airfinance Holdings Ltd
|
|||||||
|
725,000
|
8.375%, 05/01/2028
|
759,923
|
|||||
|
MDGH GMTN RSC Ltd
|
|||||||
|
880,000
|
2.875%, 11/07/2029
|
804,104
|
|||||
|
790,000
|
3.700%, 11/07/2049
|
635,330
|
|||||
|
Morgan Stanley
|
|||||||
|
450,000
|
5.250% (US Secured Overnight
|
||||||
|
Financing Rate + 1.870%), 04/21/2034 2
|
451,259
|
||||||
The accompanying notes are an integral part of these financial statements.
15
Credit Opportunities Fund
|
SCHEDULE OF INVESTMENTS at December 31, 2023 (Continued)
|
|
Principal
|
|||||||
|
Amount†
|
Value
|
||||||
|
CORPORATE BONDS: 76.7% (Continued)
|
|||||||
|
Diversified Financial Services: 6.9% (Continued)
|
|||||||
|
Nasdaq Inc
|
|||||||
|
$
|
1,125,000
|
5.550%, 02/15/2034
|
$
|
1,171,786
|
|||
|
1,500,000
|
6.100%, 06/28/2063
|
1,630,796
|
|||||
|
UBS Group AG
|
|||||||
|
1,500,000
|
9.250% (5 Year CMT Rate + 4.758%),
|
||||||
|
05/13/2172 1,2
|
1,666,152
|
||||||
|
18,112,794
|
|||||||
|
Diversified Media: 0.4%
|
|||||||
|
Match Group Holdings II LLC
|
|||||||
|
1,025,000
|
5.625%, 02/15/2029 1
|
996,397
|
|||||
|
Energy: 10.4%
|
|||||||
|
Cheniere Corpus Christi Holdings LLC
|
|||||||
|
1,800,000
|
5.125%, 06/30/2027
|
1,811,255
|
|||||
|
Cheniere Energy Partners LP
|
|||||||
|
1,000,000
|
4.500%, 10/01/2029
|
955,739
|
|||||
|
1,875,000
|
5.950%, 06/30/2033 1
|
1,925,925
|
|||||
|
Chesapeake Energy Corp
|
|||||||
|
600,000
|
5.500%, 02/01/2026 1
|
595,549
|
|||||
|
Crescent Energy Finance LLC
|
|||||||
|
200,000
|
7.250%, 05/01/2026 1
|
201,356
|
|||||
|
Ecopetrol SA
|
|||||||
|
670,000
|
8.875%, 01/13/2033
|
728,849
|
|||||
|
EQT Corp
|
|||||||
|
609,000
|
6.125%, 02/01/2025
|
612,091
|
|||||
|
Galaxy Pipeline Assets Bidco Ltd
|
|||||||
|
1,400,000
|
2.625%, 03/31/2036
|
1,160,430
|
|||||
|
Kinder Morgan Inc
|
|||||||
|
1,600,000
|
4.300%, 03/01/2028
|
1,580,680
|
|||||
|
1,300,000
|
5.200%, 06/01/2033
|
1,295,304
|
|||||
|
Leviathan Bond Ltd
|
|||||||
|
775,000
|
6.125%, 06/30/2025 1
|
753,378
|
|||||
|
Lion/Polaris Lux 4 SA
|
|||||||
|
959,000
|
3.250%, 09/30/2040
|
754,067
|
|||||
|
Oleoducto Central SA
|
|||||||
|
924,000
|
4.000%, 07/14/2027
|
859,426
|
|||||
|
ONEOK Inc
|
|||||||
|
700,000
|
6.050%, 09/01/2033
|
742,183
|
|||||
|
1,075,000
|
6.625%, 09/01/2053
|
1,208,945
|
|||||
|
Plains All American Pipeline LP /
|
|||||||
|
PAA Finance Corp
|
|||||||
|
1,950,000
|
3.550%, 12/15/2029
|
1,798,869
|
|||||
|
Qatar Energy
|
|||||||
|
500,000
|
3.300%, 07/12/2051
|
366,315
|
|||||
|
QatarEnergy
|
|||||||
|
900,000
|
2.250%, 07/12/2031
|
767,303
|
|||||
|
Repsol International Finance BV
|
|||||||
|
875,000
|
2.500% (5 Year Swap Rate
|
||||||
|
EUR + 2.769%), 2
|
906,037
|
||||||
|
200,000
|
3.750% (5 Year Swap Rate
|
||||||
|
EUR + 4.000%), 06/11/2171 2
|
216,650
|
||||||
|
Rockies Express Pipeline LLC
|
|||||||
|
2,425,000
|
3.600%, 05/15/2025 1
|
2,348,903
|
|||||
|
Targa Resources Corp
|
|||||||
|
700,000
|
6.500%, 03/30/2034
|
758,134
|
|||||
|
TotalEnergies SE
|
|||||||
|
1,475,000
|
2.625% (5 Year Swap Rate
|
||||||
|
EUR + 2.148%), 02/26/2171 2
|
1,593,721
|
||||||
|
Venture Global LNG Inc
|
|||||||
|
1,400,000
|
8.125%, 06/01/2028
|
1,415,070
|
|||||
|
Williams Cos Inc
|
|||||||
|
775,000
|
5.300%, 08/15/2028
|
794,393
|
|||||
|
Wintershall Dea Finance 2 BV
|
|||||||
|
1,500,000
|
2.499% (5 Year Swap Rate
|
||||||
|
EUR + 2.924%), 07/20/2170 2
|
1,507,717
|
||||||
|
27,658,289
|
|||||||
|
Environmental: 0.3%
|
|||||||
|
GFL Environmental Inc
|
|||||||
|
800,000
|
3.750%, 08/01/2025
|
781,683
|
|||||
|
Food & Drug Retail: 1.2%
|
|||||||
|
Albertsons Cos Inc / Safeway Inc /
|
|||||||
|
New Albertsons LP / Albertsons LLC
|
|||||||
|
1,825,000
|
7.500%, 03/15/2026
|
1,859,635
|
|||||
|
750,000
|
6.500%, 02/15/2028
|
758,188
|
|||||
|
Roadster Finance DAC
|
|||||||
|
525,000
|
1.625%, 12/09/2024
|
563,254
|
|||||
|
3,181,077
|
|||||||
|
Food/Beverage/Tobacco: 4.8%
|
|||||||
|
Bacardi Ltd / Bacardi-Martini BV
|
|||||||
|
750,000
|
5.250%, 01/15/2029 1
|
750,403
|
|||||
|
1,125,000
|
5.400%, 06/15/2033 1
|
1,135,046
|
|||||
|
Bimbo Bakeries USA Inc
|
|||||||
|
1,500,000
|
6.400%, 01/15/2034
|
1,665,930
|
|||||
|
Constellation Brands Inc
|
|||||||
|
1,550,000
|
4.900%, 05/01/2033
|
1,563,179
|
|||||
|
Indofood BCP Sukses
|
|||||||
|
1,510,000
|
3.398%, 06/09/2031
|
1,308,366
|
|||||
|
Keurig Dr Pepper Inc
|
|||||||
|
2,100,000
|
3.950%, 04/15/2029
|
2,050,887
|
|||||
|
Kraft Heinz Foods Co
|
|||||||
|
625,000
|
4.875%, 10/01/2049
|
594,416
|
|||||
|
McCormick & Co Inc
|
|||||||
|
1,425,000
|
4.950%, 04/15/2033
|
1,434,172
|
|||||
|
Minerva Luxembourg SA
|
|||||||
|
543,000
|
8.875%, 09/13/2033
|
575,061
|
|||||
|
Sigma Alimentos SA de CV
|
|||||||
|
1,048,000
|
4.125%, 05/02/2026
|
1,022,120
|
|||||
|
Sysco Corp
|
|||||||
|
925,000
|
3.150%, 12/14/2051
|
666,399
|
|||||
|
12,765,979
|
|||||||
The accompanying notes are an integral part of these financial statements.
16
Credit Opportunities Fund
|
SCHEDULE OF INVESTMENTS at December 31, 2023 (Continued)
|
|
Principal
|
|||||||
|
Amount†
|
Value
|
||||||
|
CORPORATE BONDS: 76.7% (Continued)
|
|||||||
|
Healthcare: 4.9%
|
|||||||
|
Amgen Inc
|
|||||||
|
$
|
500,000
|
5.750%, 03/02/2063
|
$
|
527,732
|
|||
|
Bayer AG
|
|||||||
|
400,000
|
4.500% (5 Year Swap Rate
|
||||||
|
EUR + 3.751%), 03/25/2082 2
|
421,227
|
||||||
|
800,000
|
6.625% (5 Year Swap Rate
|
||||||
|
EUR + 3.432%), 09/25/2083 2
|
902,261
|
||||||
|
Centene Corp
|
|||||||
|
375,000
|
4.625%, 12/15/2029
|
360,016
|
|||||
|
Cheplapharm Arzneimittel GmbH
|
|||||||
|
800,000
|
4.375%, 01/15/2028
|
863,371
|
|||||
|
GN Store Nord AS
|
|||||||
|
500,000
|
0.875%, 11/25/2024
|
529,089
|
|||||
|
HCA Inc
|
|||||||
|
2,000,000
|
5.375%, 02/01/2025
|
1,998,322
|
|||||
|
1,950,000
|
3.625%, 03/15/2032
|
1,746,690
|
|||||
|
1,050,000
|
5.500%, 06/01/2033
|
1,068,655
|
|||||
|
1,525,000
|
5.250%, 06/15/2049
|
1,424,811
|
|||||
|
IQVIA Inc
|
|||||||
|
300,000
|
6.500%, 05/15/2030 1
|
308,727
|
|||||
|
Service Corp International
|
|||||||
|
600,000
|
3.375%, 08/15/2030
|
523,507
|
|||||
|
600,000
|
4.000%, 05/15/2031
|
537,930
|
|||||
|
Tenet Healthcare Corp
|
|||||||
|
550,000
|
4.875%, 01/01/2026
|
544,309
|
|||||
|
UnitedHealth Group Inc
|
|||||||
|
991,000
|
5.050%, 04/15/2053
|
1,006,275
|
|||||
|
Werfen SA
|
|||||||
|
300,000
|
0.500%, 10/28/2026
|
304,499
|
|||||
|
13,067,421
|
|||||||
|
Homebuilders/Real Estate: 4.8%
|
|||||||
|
Aldar Investment Properties Sukuk Ltd
|
|||||||
|
200,000
|
4.875%, 05/24/2033
|
195,243
|
|||||
|
American Tower Corp
|
|||||||
|
1,025,000
|
5.250%, 07/15/2028
|
1,042,990
|
|||||
|
Aroundtown SA
|
|||||||
|
700,000
|
0.625%, 07/09/2025
|
717,756
|
|||||
|
300,000
|
0.375%, 04/15/2027
|
267,249
|
|||||
|
Balder Finland Oyj
|
|||||||
|
975,000
|
1.000%, 01/18/2027
|
913,375
|
|||||
|
Blackstone Property Partners
|
|||||||
|
Europe Holdings SARL
|
|||||||
|
625,000
|
2.000%, 02/15/2024
|
687,735
|
|||||
|
900,000
|
1.000%, 10/20/2026
|
891,764
|
|||||
|
Castellum Helsinki Finance Holding Abp
|
|||||||
|
800,000
|
2.000%, 03/24/2025
|
853,242
|
|||||
|
CTP NV
|
|||||||
|
225,000
|
2.125%, 10/01/2025
|
239,007
|
|||||
|
1,025,000
|
0.625%, 09/27/2026
|
1,018,842
|
|||||
|
Fastighets AB Balder
|
|||||||
|
400,000
|
1.875%, 03/14/2025
|
422,343
|
|||||
|
Heimstaden Bostad Treasury BV
|
|||||||
|
400,000
|
0.250%, 10/13/2024
|
416,661
|
|||||
|
800,000
|
1.000%, 04/13/2028
|
636,263
|
|||||
|
Logicor Financing SARL
|
|||||||
|
1,000,000
|
0.750%, 07/15/2024
|
1,078,475
|
|||||
|
200,000
|
1.500%, 07/13/2026
|
207,109
|
|||||
|
MasTec Inc
|
|||||||
|
925,000
|
4.500%, 08/15/2028 1
|
870,521
|
|||||
|
Tritax EuroBox PLC
|
|||||||
|
975,000
|
0.950%, 06/02/2026
|
980,325
|
|||||
|
VIA Outlets BV
|
|||||||
|
1,375,000
|
1.750%, 11/15/2028
|
1,352,263
|
|||||
|
12,791,163
|
|||||||
|
Hotels: 0.9%
|
|||||||
|
Hilton Domestic Operating Co Inc
|
|||||||
|
900,000
|
5.375%, 05/01/2025 1
|
899,798
|
|||||
|
IHG Finance LLC
|
|||||||
|
400,000
|
4.375%, 11/28/2029
|
458,215
|
|||||
|
Whitbread Group PLC
|
|||||||
|
700,000
|
3.375%, 10/16/2025
|
864,008
|
|||||
|
2,222,021
|
|||||||
|
Leisure: 0.7%
|
|||||||
|
Expedia Group Inc
|
|||||||
|
825,000
|
5.000%, 02/15/2026
|
824,810
|
|||||
|
1,100,000
|
4.625%, 08/01/2027
|
1,096,012
|
|||||
|
1,920,822
|
|||||||
|
Metals/Mining: 0.8%
|
|||||||
|
Corp Nacional del Cobre de Chile
|
|||||||
|
700,000
|
5.950%, 01/08/2034
|
711,459
|
|||||
|
Gold Fields Orogen Holdings BVI Ltd
|
|||||||
|
1,185,000
|
6.125%, 05/15/2029
|
1,218,782
|
|||||
|
1,930,241
|
|||||||
|
Paper: 0.6%
|
|||||||
|
Inversiones CMPC SA
|
|||||||
|
1,515,000
|
4.375%, 04/04/2027
|
1,471,592
|
|||||
|
Publishing/Printing: 0.3%
|
|||||||
|
Informa PLC
|
|||||||
|
700,000
|
2.125%, 10/06/2025
|
751,767
|
|||||
|
Restaurants: 0.8%
|
|||||||
|
1011778 BC ULC / New Red Finance Inc
|
|||||||
|
1,200,000
|
5.750%, 04/15/2025
|
1,196,780
|
|||||
|
Starbucks Corp
|
|||||||
|
1,325,000
|
3.500%, 11/15/2050
|
1,033,725
|
|||||
|
2,230,505
|
|||||||
|
Services: 2.4%
|
|||||||
|
Eurofins Scientific SE
|
|||||||
|
700,000
|
6.750% (3 Month
|
||||||
|
EURIBOR + 4.241%), 2
|
805,878
|
||||||
The accompanying notes are an integral part of these financial statements.
17
Credit Opportunities Fund
|
SCHEDULE OF INVESTMENTS at December 31, 2023 (Continued)
|
|
Principal
|
|||||||
|
Amount†
|
Value
|
||||||
|
CORPORATE BONDS: 76.7% (Continued)
|
|||||||
|
Services: 2.4% (Continued)
|
|||||||
|
ISS Finance BV
|
|||||||
|
$
|
525,000
|
1.250%, 07/07/2025
|
$
|
557,918
|
|||
|
ISS Global A/S
|
|||||||
|
850,000
|
0.875%, 06/18/2026
|
880,544
|
|||||
|
Loxam SAS
|
|||||||
|
275,000
|
6.375%, 05/31/2029
|
315,264
|
|||||
|
Ritchie Bros Holdings Inc
|
|||||||
|
150,000
|
7.750%, 03/15/2031 1
|
160,104
|
|||||
|
United Rentals North America Inc
|
|||||||
|
775,000
|
5.250%, 01/15/2030
|
765,390
|
|||||
|
Verisure Holding AB
|
|||||||
|
1,300,000
|
3.875%, 07/15/2026
|
1,412,608
|
|||||
|
WESCO Distribution Inc
|
|||||||
|
1,525,000
|
7.125%, 06/15/2025
|
1,537,458
|
|||||
|
6,435,164
|
|||||||
|
Steel: 0.7%
|
|||||||
|
ABJA Investment Co Pte Ltd
|
|||||||
|
812,000
|
5.450%, 01/24/2028
|
810,693
|
|||||
|
GUSAP III LP
|
|||||||
|
1,200,000
|
4.250%, 01/21/2030
|
1,142,025
|
|||||
|
1,952,718
|
|||||||
|
Super Retail: 1.7%
|
|||||||
|
Lowe’s Cos Inc
|
|||||||
|
1,275,000
|
3.750%, 04/01/2032
|
1,195,895
|
|||||
|
1,500,000
|
5.150%, 07/01/2033
|
1,545,034
|
|||||
|
REWE International Finance BV
|
|||||||
|
700,000
|
4.875%, 09/13/2030
|
820,341
|
|||||
|
Tractor Supply Co
|
|||||||
|
1,025,000
|
5.250%, 05/15/2033
|
1,051,437
|
|||||
|
4,612,707
|
|||||||
|
Technology: 2.0%
|
|||||||
|
Broadcom Inc
|
|||||||
|
1,525,000
|
4.150%, 04/15/2032 1
|
1,442,054
|
|||||
|
750,000
|
3.469%, 04/15/2034 1
|
653,985
|
|||||
|
Cellnex Finance Co SA
|
|||||||
|
400,000
|
2.250%, 04/12/2026
|
429,306
|
|||||
|
LG Energy Solution Ltd
|
|||||||
|
270,000
|
5.750%, 09/25/2028
|
278,499
|
|||||
|
Oracle Corp
|
|||||||
|
725,000
|
3.600%, 04/01/2050
|
539,986
|
|||||
|
SK Hynix Inc
|
|||||||
|
200,000
|
6.375%, 01/17/2028
|
206,717
|
|||||
|
600,000
|
6.500%, 01/17/2033
|
635,065
|
|||||
|
SK On Co Ltd
|
|||||||
|
1,250,000
|
5.375%, 05/11/2026
|
1,258,644
|
|||||
|
5,444,256
|
|||||||
|
Telecommunications: 5.0%
|
|||||||
|
A1 Towers Holding GmbH
|
|||||||
|
700,000
|
5.250%, 07/13/2028
|
818,298
|
|||||
|
America Movil SAB de CV
|
|||||||
|
|
340,000
|
4.375%, 04/22/2049
|
|
304,358
|
|||
|
AT&T Inc
|
|||||||
|
1,150,000
|
3.500%, 09/15/2053
|
839,295
|
|||||
|
Bharti Airtel Ltd
|
|||||||
|
1,100,000
|
3.250%, 06/03/2031
|
970,817
|
|||||
|
PPF Telecom Group BV
|
|||||||
|
195,000
|
3.250%, 09/29/2027
|
209,852
|
|||||
|
SES SA
|
|||||||
|
650,000
|
3.500%, 01/14/2029
|
707,891
|
|||||
|
Sitios Latinoamerica SAB de CV
|
|||||||
|
1,783,000
|
5.375%, 04/04/2032
|
1,658,357
|
|||||
|
Telefonica Europe BV
|
|||||||
|
1,200,000
|
3.875% (8 Year EUR Swap
|
||||||
|
Rate + 2.967%), 09/22/2170 2
|
1,285,287
|
||||||
|
T-Mobile USA Inc
|
|||||||
|
1,125,000
|
2.250%, 02/15/2026
|
1,066,742
|
|||||
|
1,025,000
|
3.875%, 04/15/2030
|
973,096
|
|||||
|
1,800,000
|
2.550%, 02/15/2031
|
1,553,056
|
|||||
|
1,100,000
|
5.050%, 07/15/2033
|
1,111,038
|
|||||
|
Vodafone Group PLC
|
|||||||
|
700,000
|
2.625% (5 Year Swap Rate
|
||||||
|
EUR + 3.002%), 08/27/2080 2
|
736,323
|
||||||
|
Ziggo BV
|
|||||||
|
900,000
|
2.875%, 01/15/2030
|
887,560
|
|||||
|
13,121,970
|
|||||||
|
Transportation Excluding Air/Rail: 3.3%
|
|||||||
|
Australia Pacific Airports
|
|||||||
|
Melbourne Pty Ltd
|
|||||||
|
1,000,000
|
4.375%, 05/24/2033
|
1,170,732
|
|||||
|
Autostrade per l’Italia SPA
|
|||||||
|
1,000,000
|
1.750%, 02/01/2027
|
1,046,542
|
|||||
|
875,000
|
5.125%, 06/14/2033
|
1,013,712
|
|||||
|
DP World Ltd
|
|||||||
|
1,395,000
|
2.375%, 09/25/2026
|
1,482,063
|
|||||
|
330,000
|
6.850%, 07/02/2037
|
365,102
|
|||||
|
FedEx Corp
|
|||||||
|
875,000
|
5.250%, 05/15/2050
|
875,774
|
|||||
|
Gatwick Funding Ltd
|
|||||||
|
250,000
|
6.125%, 03/02/2026
|
326,057
|
|||||
|
Heathrow Funding Ltd
|
|||||||
|
325,000
|
7.125%, 02/14/2024
|
414,718
|
|||||
|
Holding d’Infrastructures
|
|||||||
|
de Transport SASU
|
|||||||
|
500,000
|
1.625%, 09/18/2029
|
497,267
|
|||||
|
International Distributions Services PLC
|
|||||||
|
575,000
|
5.250%, 09/14/2028
|
659,326
|
|||||
|
Q-Park Holding I BV
|
|||||||
|
350,000
|
2.000%, 03/01/2027
|
358,178
|
|||||
|
Stagecoach Group Ltd
|
|||||||
|
505,000
|
4.000%, 09/29/2025
|
623,530
|
|||||
|
8,833,001
|
|||||||
The accompanying notes are an integral part of these financial statements.
18
Credit Opportunities Fund
|
SCHEDULE OF INVESTMENTS at December 31, 2023 (Continued)
|
|
Principal
|
|||||||
|
Amount†
|
Value
|
||||||
|
CORPORATE BONDS: 76.7% (Continued)
|
|||||||
|
Utilities: 2.1%
|
|||||||
|
Acquirente Unico SPA
|
|||||||
|
$
|
850,000
|
2.800%, 02/20/2026
|
$
|
921,968
|
|||
|
Calpine Corp
|
|||||||
|
298,000
|
5.250%, 06/01/2026
|
294,000
|
|||||
|
Enel SPA
|
|||||||
|
850,000
|
6.375% (5 Year Swap Rate
|
||||||
|
EUR + 3.486%), 07/16/2171 2
|
983,713
|
||||||
|
Eversource Energy
|
|||||||
|
1,275,000
|
5.450%, 03/01/2028
|
1,312,204
|
|||||
|
Italgas SPA
|
|||||||
|
600,000
|
4.125%, 06/08/2032
|
686,345
|
|||||
|
National Central Cooling Co PJSC
|
|||||||
|
1,600,000
|
2.500%, 10/21/2027
|
1,432,792
|
|||||
|
5,631,022
|
|||||||
|
TOTAL CORPORATE BONDS
|
|||||||
|
(Cost $201,136,844)
|
203,708,797
|
||||||
|
U.S. GOVERNMENT NOTES/BONDS: 14.3%
|
|||||||
|
United States Treasury Note/Bond
|
|||||||
|
17,700,000
|
3.875%, 08/15/2033
|
17,716,594
|
|||||
|
5,500,000
|
4.500%, 11/15/2033
|
5,786,601
|
|||||
|
14,251,800
|
4.125%, 08/15/2053
|
14,477,825
|
|||||
|
TOTAL U.S. GOVERNMENT NOTES/BONDS
|
|||||||
|
(Cost $35,227,740)
|
37,981,020
|
||||||
|
FOREIGN GOVERNMENT NOTE/BOND: 4.2%
|
|||||||
|
Airlines: 0.4%
|
|||||||
|
Air France-KLM
|
|||||||
|
900,000
|
7.250%, 05/31/2026
|
1,062,307
|
|||||
|
Automotive & Auto Parts: 0.8%
|
|||||||
|
RCI Banque SA
|
|||||||
|
490,000
|
1.625%, 05/26/2026
|
518,029
|
|||||
|
Schaeffler AG
|
|||||||
|
900,000
|
2.875%, 03/26/2027
|
981,084
|
|||||
|
Valeo SE
|
|||||||
|
800,000
|
1.000%, 08/03/2028
|
775,669
|
|||||
|
2,274,782
|
|||||||
|
Banking: 1.2%
|
|||||||
|
Argenta Spaarbank NV
|
|||||||
|
500,000
|
1.000% (1 Year EUR Swap
|
||||||
|
Rate + 1.550%), 10/13/2026 2
|
521,427
|
||||||
|
400,000
|
5.375% (1 Year EUR Swap
|
||||||
|
Rate + 2.750%), 11/29/2027 2
|
457,219
|
||||||
|
Banco Comercial Portugues SA
|
|||||||
|
400,000
|
5.625% (3 Month EURIBOR +
|
||||||
|
1.900%), 10/02/2026 2
|
454,066
|
||||||
|
BPCE SA
|
|||||||
|
600,000
|
4.000%, 11/29/2032
|
693,365
|
|||||
|
Commerzbank AG
|
|||||||
|
|
700,000
|
4.000% (5 Year Swap Rate
|
|||||
|
EUR + 4.350%), 12/05/2030 2
|
|
760,277
|
|||||
|
KBC Group NV
|
|||||||
|
300,000
|
4.375% (3 Month EURIBOR +
|
||||||
|
1.700%), 11/23/2027 2
|
339,320
|
||||||
|
3,225,674
|
|||||||
|
Diversified Financial Services: 0.3%
|
|||||||
|
Arval Service Lease SA
|
|||||||
|
700,000
|
4.750%, 05/22/2027
|
803,035
|
|||||
|
Homebuilders/Real Estate: 0.5%
|
|||||||
|
VGP NV
|
|||||||
|
900,000
|
1.625%, 01/17/2027
|
874,488
|
|||||
|
Vonovia SE
|
|||||||
|
300,000
|
5.000%, 11/23/2030
|
350,705
|
|||||
|
1,225,193
|
|||||||
|
Technology: 0.5%
|
|||||||
|
TDF Infrastructure SASU
|
|||||||
|
700,000
|
5.625%, 07/21/2028
|
812,678
|
|||||
|
Teleperformance SE
|
|||||||
|
500,000
|
5.250%, 11/22/2028
|
577,954
|
|||||
|
1,390,632
|
|||||||
|
Telecommunications: 0.2%
|
|||||||
|
iliad SA
|
|||||||
|
400,000
|
5.375%, 02/15/2029
|
454,163
|
|||||
|
Utilities: 0.3%
|
|||||||
|
Elia Transmission Belgium SA
|
|||||||
|
600,000
|
3.625%, 01/18/2033
|
685,397
|
|||||
|
TOTAL FOREIGN GOVERNMENT NOTE/BOND
|
|||||||
|
(Cost $10,552,377)
|
11,121,183
|
||||||
|
BANK LOANS: 2.4%
|
|||||||
|
Aerospace/Defense: 0.0%
|
|||||||
|
TransDigm Inc TL
|
|||||||
|
92,500
|
8.597% (CME Term SOFR 1
|
||||||
|
Month + 3.250%), 02/28/2031 2,3
|
93,025
|
||||||
|
Cable/Satellite TV: 0.2%
|
|||||||
|
Charter Communications
|
|||||||
|
Operating LLC TL
|
|||||||
|
274,284
|
7.074% (CME Term SOFR 1
|
||||||
|
Month + 1.750%), 02/01/2027 2,3
|
274,628
|
||||||
|
Directv Financing LLC TL
|
|||||||
|
243,140
|
10.650% (CME Term SOFR 1
|
||||||
|
Month + 5.000%), 08/02/2027 2,3
|
243,582
|
||||||
|
518,210
|
|||||||
The accompanying notes are an integral part of these financial statements.
19
Credit Opportunities Fund
|
SCHEDULE OF INVESTMENTS at December 31, 2023 (Continued)
|
|
Principal
|
|||||||
|
Amount†
|
Value
|
||||||
|
BANK LOANS: 2.4% (Continued)
|
|||||||
|
Chemicals: 0.2%
|
|||||||
|
Axalta Coating Systems US
|
|||||||
|
Holdings Inc TL
|
|||||||
|
$
|
491,840
|
7.890% (CME Term SOFR 1
|
|||||
|
Month + 2.500%), 12/20/2029 2,3
|
$
|
494,144
|
|||||
|
Diversified Financial Services: 0.3%
|
|||||||
|
GTCR W MERGER SUB TL B TL
|
|||||||
|
250,000
|
3.750% (CME Term SOFR 1
|
||||||
|
Month + 3.000%), 09/20/2030 2,3
|
251,406
|
||||||
|
Nuvei Technologies Corp TL
|
|||||||
|
270,000
|
7.939% (CME Term SOFR 1
|
||||||
|
Month + 2.500%), 09/29/2025 2,3
|
270,296
|
||||||
|
Trans Union TL B6 TL
|
|||||||
|
250,000
|
7.713% (CME Term SOFR 1
|
||||||
|
Month + 2.250%), 12/01/2028 2,3
|
251,141
|
||||||
|
772,843
|
|||||||
|
Energy: 0.2%
|
|||||||
|
Alison US TL B-2 (Alstom)
|
|||||||
|
(Arvos Midco SARL) TL
|
|||||||
|
6,027
|
11.131% (CME Term SOFR 3
|
||||||
|
Month + 5.500%), 08/29/2024 2,3
|
2,360
|
||||||
|
Arvos BidCo SARL TL
|
|||||||
|
6,027
|
10.325% (CME Term SOFR 3
|
||||||
|
Month + 5.500%), 08/29/2024 2,3
|
2,361
|
||||||
|
Pilot Travel Centers LLC TL
|
|||||||
|
500,000
|
7.424% (CME Term SOFR 1
|
||||||
|
Month + 2.000%), 08/06/2028 2,3
|
502,135
|
||||||
|
506,856
|
|||||||
|
Gaming: 0.1%
|
|||||||
|
Flutter Financing BV TL
|
|||||||
|
104,296
|
8.902% (CME Term SOFR 1
|
||||||
|
Month + 3.250%), 07/04/2028 2,3
|
104,788
|
||||||
|
150,000
|
7.598% (CME Term SOFR 1
|
||||||
|
Month + 2.250%), 11/25/2030 2,3
|
150,563
|
||||||
|
255,351
|
|||||||
|
Homebuilders/Real Estate: 0.1%
|
|||||||
|
Starwood Property Mortgage LLC TL
|
|||||||
|
249,370
|
8.598% (CME Term SOFR 1
|
||||||
|
Month + 3.250%), 11/18/2027 2,3
|
249,370
|
||||||
|
Hotels: 0.3%
|
|||||||
|
Hilton Grand Vacations Borrower LLC TL
|
|||||||
|
499,298
|
8.213% (CME Term SOFR 1
|
||||||
|
Month + 3.000%), 08/02/2028 2,3
|
500,235
|
||||||
|
Hilton Hotels (10/23) TL B4 TL
|
|||||||
|
113,650
|
7.455%, 11/08/2030 2,3
|
114,188
|
|||||
|
TRAVEL + LEISURE TL B (12/23)
|
|||||||
|
100,000
|
3.250%, 12/14/2029 2,3
|
100,288
|
|||||
|
714,711
|
|||||||
|
Restaurants: 0.3%
|
|||||||
|
1011778 BC ULC TL
|
|||||||
|
|
375,000
|
7.598% (CME Term SOFR 1
|
|||||
|
Month + 2.250%), 09/23/2030 2,3
|
375,602
|
||||||
|
KFC Holding Co TL
|
|||||||
|
498,718
|
7.196% (CME Term SOFR 1
|
||||||
|
Month + 1.750%), 03/15/2028 2,3
|
499,912
|
||||||
|
875,514
|
|||||||
|
Super Retail: 0.1%
|
|||||||
|
Hanesbrands Inc TL
|
|||||||
|
249,372
|
9.098% (CME Term SOFR 1
|
||||||
|
Month + 3.750%), 03/08/2030 2,3
|
249,372
|
||||||
|
Technology: 0.3%
|
|||||||
|
Coherent Corp TL
|
|||||||
|
363,719
|
8.213% (CME Term SOFR 1
|
||||||
|
Month + 2.750%), 07/02/2029 2,3
|
365,765
|
||||||
|
Constant Contact TL
|
|||||||
|
12
|
9.561% (CME Term SOFR 1
|
||||||
|
Month + 4.000%), 02/10/2028 2,3
|
12
|
||||||
|
Open Text TL B (08/23) TARGET TL
|
|||||||
|
488,201
|
8.198% (CME Term SOFR 1
|
||||||
|
Month + 2.750%), 01/31/2030 2,3
|
489,912
|
||||||
|
855,689
|
|||||||
|
Telecommunications: 0.1%
|
|||||||
|
Virgin Media Bristol LLC TL
|
|||||||
|
200,000
|
8.790% (CME Term SOFR 1
|
||||||
|
Month + 3.250%), 03/31/2031 2,3
|
199,625
|
||||||
|
Transportation Excluding Air/Rail: 0.2%
|
|||||||
|
XPO Inc TL
|
|||||||
|
250,000
|
7.348% (CME Term SOFR 1
|
||||||
|
Month + 2.000%), 05/24/2028 2,3
|
251,360
|
||||||
|
XPO TL B (12/23) TL
|
|||||||
|
250,000
|
7.360%, 02/01/2031 2,3
|
250,677
|
|||||
|
502,037
|
|||||||
|
TOTAL BANK LOANS
|
|||||||
|
(Cost $6,266,644)
|
6,286,747
|
||||||
|
CONVERTIBLE BONDS: 0.9%
|
|||||||
|
Banking: 0.9%
|
|||||||
|
Bank Leumi Le-Israel BM
|
|||||||
|
1,330,000
|
3.275% (5 Year CMT Rate + 1.631%),
|
||||||
|
01/29/2031 1,2
|
1,205,578
|
||||||
|
Swedbank AB
|
|||||||
|
900,000
|
4.625% (1 Year EUR Swap
|
||||||
|
Rate + 1.100%), 05/30/2026 2
|
1,004,358
|
||||||
|
Virgin Money UK PLC
|
|||||||
|
275,000
|
4.625% (1 Year EUR Swap
|
||||||
|
Rate + 1.750%), 10/29/2028 2
|
303,369
|
||||||
|
2,513,305
|
|||||||
|
TOTAL CONVERTIBLE BONDS
|
|||||||
|
(Cost $2,576,027)
|
2,513,305
|
||||||
The accompanying notes are an integral part of these financial statements.
20
Credit Opportunities Fund
|
SCHEDULE OF INVESTMENTS at December 31, 2023 (Continued)
|
|
Principal
|
|||||||
|
Amount†
|
Value
|
||||||
|
FOREIGN GOVERNMENT AGENCY ISSUE: 0.4%
|
|||||||
|
Energy: 0.4%
|
|||||||
|
Pertamina Persero PT
|
|||||||
|
$
|
700,000
|
3.650%, 07/30/2029
|
$
|
661,374
|
|||
|
550,000
|
4.150%, 02/25/2060
|
434,738
|
|||||
|
TOTAL FOREIGN GOVERNMENT AGENCY ISSUE
|
|||||||
|
(Cost $1,017,801)
|
1,096,112
|
||||||
|
Shares
|
|||||||
|
SHORT-TERM INVESTMENTS: 1.3%
|
|||||||
|
Money Market Funds: 1.3%
|
|||||||
|
3,507,679
|
First American Treasury Obligations
|
||||||
|
Fund – Class X, 5.285% 4
|
3,507,679
|
||||||
|
TOTAL SHORT-TERM INVESTMENTS
|
|||||||
|
(Cost $3,507,679)
|
3,507,679
|
||||||
|
TOTAL INVESTMENTS IN SECURITIES: 100.2%
|
|||||||
|
(Cost $260,285,114)
|
266,214,843
|
||||||
|
Liabilities in Excess of Other Assets: (0.2)%
|
(501,119
|
) | |||||
|
TOTAL NET ASSETS: 100.0%
|
$ |
265,713,724
|
|||||
PIK – Payment In Kind – represents the security may pay interest in additional par
|
†
|
In USD unless otherwise indicated.
|
|
1
|
Security exempt from registration under Rule 144A of the Securities Act of 1933. These securities may be resold in transactions exempt from registration to qualified institutional buyers. These securities are
determined to be liquid by the Adviser, unless otherwise noted, under procedures established by the Trust’s Board of Trustees.
|
|
2
|
Variable rate security; rate shown is the rate in effect on December 31, 2023. An index may have a negative rate. Interest rate may also be subject to a cap or floor.
|
|
3
|
Bank loans generally pay interest at rates which are periodically determined by reference to a base lending rate plus a premium. All loans carry a variable rate of interest. These base lending rates are
generally (i) the Prime Rate offered by one or more European banks such as the London Interbank Offered Rate (“LIBOR”) or (iii) the Certificate of Deposit rate. Bank Loans, while exempt from registration, under the Securities Act of 1933,
contain certain restrictions on resale and cannot be sold publicly. Floating rate bank loans often require prepayments from excess cash flow or permit the borrower to repay at its election. The degree to which borrowers repay, whether as a
contractual requirement or at their election, cannot be predicted with accuracy.
|
|
4
|
Annualized seven-day effective yield as of December 31, 2023.
|
|
SCHEDULE OF FORWARD FOREIGN CURRENCY EXCHANGE CONTRACTS at December 31, 2023
|
The Muzinich Credit Opportunities Fund had the following forward foreign currency exchange contracts outstanding with the U.S. Bancorp Investments, Inc..
|
U.S. Dollar Value at
|
U.S. Dollar Value at
|
Unrealized Appreciation
|
||||||||||||||||||
|
Settlement Date
|
Currency to be Delivered
|
December 31, 2023
|
Currency to be Received
|
December 31, 2023
|
(Depreciation)
|
|||||||||||||||
|
3/18/2024
|
EUR |
65,600,000
|
$
|
(72,653,974
|
)
|
USD |
(71,113,155)
|
$
|
(71,113,155
|
)
|
$
|
(1,540,819
|
)
|
|||||||
|
3/18/2024
|
EUR |
3,600,000
|
3,987,108
|
USD |
3,921,533
|
3,921,533
|
65,575
|
|||||||||||||
|
3/18/2024
|
GBP |
2,500,000
|
(3,187,881
|
)
|
USD |
(3,149,208)
|
(3,149,208
|
)
|
(38,673
|
)
|
||||||||||
|
$
|
(71,854,747
|
)
|
|
$
|
(70,340,830
|
)
|
$
|
(1,513,917
|
)
|
|||||||||||
The accompanying notes are an integral part of these financial statements.
21
Flexible U.S. High Yield Income Fund
|
SCHEDULE OF INVESTMENTS at December 31, 2023
|
|
Principal
|
|||||||
|
Amount
|
Value
|
||||||
|
CORPORATE BONDS: 72.4%
|
|||||||
|
Aerospace/Defense: 1.8%
|
|||||||
|
Bombardier Inc
|
|||||||
|
$
|
250,000
|
7.875%, 04/15/2027 1
|
$
|
250,292
|
|||
|
Spirit AeroSystems Inc
|
|||||||
|
250,000
|
9.375%, 11/30/2029 1
|
273,828
|
|||||
|
TransDigm Inc
|
|||||||
|
250,000
|
6.250%, 03/15/2026 1
|
249,806
|
|||||
|
100,000
|
7.125%, 12/01/2031 1
|
104,875
|
|||||
|
878,801
|
|||||||
|
Airlines: 1.7%
|
|||||||
|
American Airlines Inc/
|
|||||||
|
AAdvantage Loyalty IP Ltd
|
|||||||
|
235,833
|
5.500%, 04/20/2026 1
|
234,310
|
|||||
|
375,000
|
5.750%, 04/20/2029 1
|
365,853
|
|||||
|
VistaJet Malta Finance PLC /
|
|||||||
|
Vista Management Holding Inc
|
|||||||
|
125,000
|
7.875%, 05/01/2027 1
|
107,748
|
|||||
|
125,000
|
9.500%, 06/01/2028 1
|
105,944
|
|||||
|
813,855
|
|||||||
|
Automotive & Auto Parts: 0.9%
|
|||||||
|
Benteler International AG
|
|||||||
|
200,000
|
10.500%, 05/15/2028 1
|
210,845
|
|||||
|
Dana Inc
|
|||||||
|
100,000
|
4.500%, 02/15/2032
|
87,119
|
|||||
|
ZF North America Capital Inc
|
|||||||
|
150,000
|
7.125%, 04/14/2030 1
|
160,077
|
|||||
|
458,041
|
|||||||
|
Broadcasting: 2.3%
|
|||||||
|
AMC Networks Inc
|
|||||||
|
100,000
|
4.750%, 08/01/2025
|
97,436
|
|||||
|
Belo Corp
|
|||||||
|
75,000
|
7.750%, 06/01/2027
|
76,249
|
|||||
|
Gray Escrow II Inc
|
|||||||
|
250,000
|
5.375%, 11/15/2031 1
|
189,660
|
|||||
|
Nexstar Media Inc
|
|||||||
|
100,000
|
5.625%, 07/15/2027
|
96,769
|
|||||
|
150,000
|
4.750%, 11/01/2028 1
|
138,350
|
|||||
|
Sirius XM Radio Inc
|
|||||||
|
150,000
|
4.000%, 07/15/2028 1
|
138,724
|
|||||
|
TEGNA Inc
|
|||||||
|
118,000
|
4.625%, 03/15/2028
|
110,368
|
|||||
|
Univision Communications Inc
|
|||||||
|
125,000
|
8.000%, 08/15/2028 1
|
129,068
|
|||||
|
125,000
|
4.500%, 05/01/2029 1
|
111,991
|
|||||
|
1,088,615
|
|||||||
|
Building Materials: 1.8%
|
|||||||
|
Camelot Return Merger Sub Inc
|
|||||||
|
250,000
|
8.750%, 08/01/2028 1
|
254,081
|
|||||
|
Cornerstone Building Brands Inc
|
|||||||
|
125,000
|
6.125%, 01/15/2029 1
|
102,628
|
|||||
|
Masonite International Corp
|
|||||||
|
|
125,000
|
3.500%, 02/15/2030 1
|
|
108,503
|
|||
|
New Enterprise Stone & Lime Co Inc
|
|||||||
|
125,000
|
5.250%, 07/15/2028 1
|
119,402
|
|||||
|
Smyrna Ready Mix Concrete LLC
|
|||||||
|
250,000
|
8.875%, 11/15/2031 1
|
263,103
|
|||||
|
847,717
|
|||||||
|
Cable/Satellite TV: 3.2%
|
|||||||
|
CCO Holdings LLC /
|
|||||||
|
CCO Holdings Capital Corp
|
|||||||
|
250,000
|
5.000%, 02/01/2028 1
|
239,479
|
|||||
|
25,000
|
5.375%, 06/01/2029 1
|
23,608
|
|||||
|
300,000
|
4.750%, 03/01/2030 1
|
274,509
|
|||||
|
CSC Holdings LLC
|
|||||||
|
400,000
|
4.125%, 12/01/2030 1
|
304,768
|
|||||
|
Directv Financing LLC /
|
|||||||
|
Directv Financing Co-Obligor Inc
|
|||||||
|
125,000
|
5.875%, 08/15/2027
|
117,630
|
|||||
|
DISH DBS Corp
|
|||||||
|
50,000
|
5.250%, 12/01/2026 1
|
42,931
|
|||||
|
50,000
|
5.750%, 12/01/2028 1
|
39,974
|
|||||
|
DISH Network Corp
|
|||||||
|
250,000
|
11.750%, 11/15/2027 1
|
261,939
|
|||||
|
Midcontinent Communications /
|
|||||||
|
Midcontinent Finance Corp
|
|||||||
|
125,000
|
5.375%, 08/15/2027 1
|
121,949
|
|||||
|
Videotron Ltd
|
|||||||
|
125,000
|
3.625%, 06/15/2029 1
|
113,568
|
|||||
|
1,540,355
|
|||||||
|
Capital Goods: 0.6%
|
|||||||
|
Dornoch Debt Merger Sub Inc
|
|||||||
|
125,000
|
6.625%, 10/15/2029 1
|
112,852
|
|||||
|
GrafTech Global Enterprises Inc
|
|||||||
|
250,000
|
9.875%, 12/15/2028
|
193,125
|
|||||
|
305,977
|
|||||||
|
Chemicals: 1.1%
|
|||||||
|
NOVA Chemicals Corp
|
|||||||
|
200,000
|
5.000%, 05/01/2025 1
|
195,451
|
|||||
|
Olympus Water US Holding Corp
|
|||||||
|
200,000
|
9.750%, 11/15/2028
|
212,411
|
|||||
|
Rain Carbon Inc
|
|||||||
|
125,000
|
12.250%, 09/01/2029 1
|
122,344
|
|||||
|
530,206
|
|||||||
|
Consumer-Products: 0.6%
|
|||||||
|
Central Garden & Pet Co
|
|||||||
|
50,000
|
4.125%, 10/15/2030
|
45,532
|
|||||
|
75,000
|
4.125%, 04/30/2031 1
|
66,373
|
|||||
|
Coty Inc/HFC Prestige Products Inc/
|
|||||||
|
HFC Prestige International US LLC
|
|||||||
|
75,000
|
6.625%, 07/15/2030 1
|
77,197
|
|||||
The accompanying notes are an integral part of these financial statements.
22
Flexible U.S. High Yield Income Fund
|
SCHEDULE OF INVESTMENTS at December 31, 2023 (Continued)
|
|
Principal
|
|||||||
|
Amount
|
Value
|
||||||
|
CORPORATE BONDS: 72.4% (Continued)
|
|||||||
|
Consumer-Products: 0.6% (Continued)
|
|||||||
|
Kronos Acquisition Holdings Inc /
|
|||||||
|
KIK Custom Products Inc
|
|||||||
|
$
|
100,000
|
5.000%, 12/31/2026 1
|
$
|
97,592
|
|||
|
286,694
|
|||||||
|
Containers: 2.2%
|
|||||||
|
Ball Corp
|
|||||||
|
125,000
|
6.000%, 06/15/2029
|
127,807
|
|||||
|
Canpack SA / Canpack US LLC
|
|||||||
|
200,000
|
3.875%, 11/15/2029 1
|
171,657
|
|||||
|
Graphic Packaging International LLC
|
|||||||
|
125,000
|
3.750%, 02/01/2030 1
|
112,669
|
|||||
|
Mauser Packaging Solutions Holding Co
|
|||||||
|
125,000
|
7.875%, 08/15/2026 1
|
127,312
|
|||||
|
125,000
|
9.250%, 04/15/2027
|
122,826
|
|||||
|
Trivium Packaging Finance BV
|
|||||||
|
200,000
|
5.500%, 08/15/2026 1
|
196,431
|
|||||
|
200,000
|
8.500%, 08/15/2027 1
|
196,392
|
|||||
|
1,055,094
|
|||||||
|
Diversified Financial Services: 4.7%
|
|||||||
|
Bread Financial Holdings Inc
|
|||||||
|
250,000
|
7.000%, 01/15/2026 1
|
248,707
|
|||||
|
125,000
|
9.750%, 03/15/2029 1
|
129,193
|
|||||
|
Burford Capital Global Finance LLC
|
|||||||
|
200,000
|
6.250%, 04/15/2028 1
|
192,196
|
|||||
|
Icahn Enterprises LP /
|
|||||||
|
Icahn Enterprises Finance Corp
|
|||||||
|
125,000
|
6.375%, 12/15/2025
|
122,830
|
|||||
|
125,000
|
6.250%, 05/15/2026
|
119,359
|
|||||
|
125,000
|
9.750%, 01/15/2029 1
|
127,681
|
|||||
|
Macquarie Airfinance Holdings Ltd
|
|||||||
|
150,000
|
8.375%, 05/01/2028
|
157,225
|
|||||
|
Nationstar Mortgage Holdings Inc
|
|||||||
|
125,000
|
6.000%, 01/15/2027
|
124,191
|
|||||
|
100,000
|
5.750%, 11/15/2031 1
|
93,393
|
|||||
|
Navient Corp
|
|||||||
|
100,000
|
5.000%, 03/15/2027
|
96,629
|
|||||
|
OneMain Finance Corp
|
|||||||
|
125,000
|
3.875%, 09/15/2028
|
110,711
|
|||||
|
125,000
|
7.875%, 03/15/2030
|
128,798
|
|||||
|
PennyMac Financial Services Inc
|
|||||||
|
125,000
|
7.875%, 12/15/2029
|
128,867
|
|||||
|
PRA Group Inc
|
|||||||
|
250,000
|
8.375%, 02/01/2028 1
|
240,835
|
|||||
|
United Wholesale Mortgage LLC
|
|||||||
|
125,000
|
5.750%, 06/15/2027
|
122,642
|
|||||
|
Williams Scotsman International Inc
|
|||||||
|
125,000
|
4.625%, 08/15/2028 1
|
118,043
|
|||||
|
2,261,300
|
|||||||
|
Diversified Media: 0.5%
|
|||||||
|
Clear Channel Outdoor Holdings Inc
|
|||||||
|
|
125,000
|
5.125%, 08/15/2027 1
|
|
119,407
|
|||
|
Match Group Holdings II LLC
|
|||||||
|
100,000
|
5.625%, 02/15/2029 1
|
97,210
|
|||||
|
216,617
|
|||||||
|
Energy: 12.0%
|
|||||||
|
Ascent Resources Utica Holdings
|
|||||||
|
LLC / ARU Finance Corp
|
|||||||
|
125,000
|
7.000%, 11/01/2026 1
|
126,065
|
|||||
|
125,000
|
5.875%, 06/30/2029 1
|
116,225
|
|||||
|
Baytex Energy Corp
|
|||||||
|
250,000
|
8.500%, 04/30/2030 1
|
258,876
|
|||||
|
Blue Racer Midstream LLC /
|
|||||||
|
Blue Racer Finance Corp
|
|||||||
|
106,000
|
6.625%, 07/15/2026 1
|
105,459
|
|||||
|
CITGO Petroleum Corp
|
|||||||
|
125,000
|
7.000%, 06/15/2025 1
|
124,872
|
|||||
|
Civitas Resources Inc
|
|||||||
|
375,000
|
8.625%, 11/01/2030 1
|
397,993
|
|||||
|
Crescent Energy Finance LLC
|
|||||||
|
125,000
|
7.250%, 05/01/2026 1
|
125,848
|
|||||
|
250,000
|
9.250%, 02/15/2028 1
|
259,584
|
|||||
|
CrownRock LP / CrownRock Finance Inc
|
|||||||
|
250,000
|
5.625%, 10/15/2025 1
|
249,824
|
|||||
|
EQM Midstream Partners LP
|
|||||||
|
75,000
|
7.500%, 06/01/2027
|
77,197
|
|||||
|
75,000
|
6.500%, 07/01/2027 1
|
76,404
|
|||||
|
75,000
|
7.500%, 06/01/2030 1
|
80,718
|
|||||
|
125,000
|
4.750%, 01/15/2031 1
|
116,497
|
|||||
|
Gulfport Energy Corp
|
|||||||
|
125,000
|
8.000%, 05/17/2026 1
|
126,492
|
|||||
|
Harvest Midstream I LP
|
|||||||
|
500,000
|
7.500%, 09/01/2028 1
|
497,783
|
|||||
|
Hilcorp Energy I LP / Hilcorp Finance Co
|
|||||||
|
375,000
|
6.000%, 02/01/2031 1
|
363,117
|
|||||
|
Northern Oil and Gas Inc
|
|||||||
|
200,000
|
8.125%, 03/01/2028 1
|
202,708
|
|||||
|
250,000
|
8.750%, 06/15/2031 1
|
260,414
|
|||||
|
Range Resources Corp
|
|||||||
|
250,000
|
8.250%, 01/15/2029
|
258,958
|
|||||
|
Rockies Express Pipeline LLC
|
|||||||
|
175,000
|
4.950%, 07/15/2029 1
|
167,400
|
|||||
|
Tallgrass Energy Partners LP /
|
|||||||
|
Tallgrass Energy Finance Corp
|
|||||||
|
125,000
|
7.500%, 10/01/2025
|
125,756
|
|||||
|
125,000
|
6.000%, 12/31/2030 1
|
116,400
|
|||||
|
USA Compression Partners LP /
|
|||||||
|
USA Compression Finance Corp
|
|||||||
|
150,000
|
6.875%, 04/01/2026
|
149,528
|
|||||
|
Venture Global Calcasieu Pass LLC
|
|||||||
|
50,000
|
3.875%, 08/15/2029 1
|
45,458
|
|||||
|
75,000
|
6.250%, 01/15/2030
|
74,688
|
|||||
|
50,000
|
4.125%, 08/15/2031 1
|
44,109
|
|||||
The accompanying notes are an integral part of these financial statements.
23
Flexible U.S. High Yield Income Fund
|
SCHEDULE OF INVESTMENTS at December 31, 2023 (Continued)
|
|
Principal
|
|||||||
|
Amount
|
Value
|
||||||
|
CORPORATE BONDS: 72.4% (Continued)
|
|||||||
|
Energy: 12.0% (Continued)
|
|||||||
|
Venture Global LNG Inc
|
|||||||
|
$
|
250,000
|
8.125%, 06/01/2028
|
$
|
252,691
|
|||
|
250,000
|
9.500%, 02/01/2029
|
264,634
|
|||||
|
250,000
|
8.375%, 06/01/2031 1
|
250,435
|
|||||
|
Vital Energy Inc
|
|||||||
|
125,000
|
10.125%, 01/15/2028
|
128,540
|
|||||
|
250,000
|
9.750%, 10/15/2030
|
259,626
|
|||||
|
5,704,299
|
|||||||
|
Food & Drug Retail: 0.6%
|
|||||||
|
Albertsons Cos Inc / Safeway Inc /
|
|||||||
|
New Albertsons LP / Albertsons LLC
|
|||||||
|
125,000
|
6.500%, 02/15/2028
|
126,365
|
|||||
|
175,000
|
3.500%, 03/15/2029 1
|
159,183
|
|||||
|
285,548
|
|||||||
|
Food/Beverage/Tobacco: 1.0%
|
|||||||
|
BellRing Brands Inc
|
|||||||
|
125,000
|
7.000%, 03/15/2030 1
|
129,844
|
|||||
|
Post Holdings Inc
|
|||||||
|
125,000
|
4.625%, 04/15/2030 1
|
115,132
|
|||||
|
Simmons Foods Inc/Simmons Prepared
|
|||||||
|
Foods Inc/Simmons Pet Food Inc/
|
|||||||
|
Simmons Feed
|
|||||||
|
250,000
|
4.625%, 03/01/2029 1
|
216,735
|
|||||
|
461,711
|
|||||||
|
Gaming: 3.3%
|
|||||||
|
Boyd Gaming Corp
|
|||||||
|
250,000
|
4.750%, 06/15/2031 1
|
229,896
|
|||||
|
Caesars Entertainment Inc
|
|||||||
|
375,000
|
6.250%, 07/01/2025 1
|
376,331
|
|||||
|
125,000
|
8.125%, 07/01/2027
|
128,257
|
|||||
|
125,000
|
4.625%, 10/15/2029 1
|
112,872
|
|||||
|
125,000
|
7.000%, 02/15/2030 1
|
128,210
|
|||||
|
Churchill Downs Inc
|
|||||||
|
125,000
|
5.500%, 04/01/2027
|
123,781
|
|||||
|
125,000
|
4.750%, 01/15/2028 1
|
119,940
|
|||||
|
Light & Wonder International Inc
|
|||||||
|
100,000
|
7.500%, 09/01/2031 1
|
104,354
|
|||||
|
Ontario Gaming GTA LP
|
|||||||
|
125,000
|
8.000%, 08/01/2030 1
|
128,996
|
|||||
|
Station Casinos LLC
|
|||||||
|
100,000
|
4.500%, 02/15/2028 1
|
94,277
|
|||||
|
1,546,914
|
|||||||
|
Healthcare: 6.2%
|
|||||||
|
AdaptHealth LLC
|
|||||||
|
125,000
|
6.125%, 08/01/2028 1
|
108,021
|
|||||
|
AMN Healthcare Inc
|
|||||||
|
250,000
|
4.625%, 10/01/2027 1
|
236,800
|
|||||
|
Catalent Pharma Solutions Inc
|
|||||||
|
75,000
|
3.125%, 02/15/2029 1
|
65,719
|
|||||
|
CHS/Community Health Systems Inc
|
|||||||
|
|
250,000
|
5.625%, 03/15/2027 1
|
|
232,635
|
|||
|
125,000
|
8.000%, 12/15/2027 1
|
120,756
|
|||||
|
125,000
|
5.250%, 05/15/2030 1
|
104,997
|
|||||
|
DaVita Inc
|
|||||||
|
125,000
|
4.625%, 06/01/2030 1
|
109,209
|
|||||
|
125,000
|
3.750%, 02/15/2031 1
|
102,844
|
|||||
|
Fortrea Holdings Inc
|
|||||||
|
100,000
|
7.500%, 07/01/2030 1
|
102,870
|
|||||
|
Legacy LifePoint Health LLC
|
|||||||
|
125,000
|
4.375%, 02/15/2027
|
115,683
|
|||||
|
Medline Borrower LP
|
|||||||
|
125,000
|
3.875%, 04/01/2029 1
|
113,151
|
|||||
|
ModivCare Inc
|
|||||||
|
100,000
|
5.875%, 11/15/2025
|
98,862
|
|||||
|
MPH Acquisition Holdings LLC
|
|||||||
|
125,000
|
5.500%, 09/01/2028 1
|
112,069
|
|||||
|
MPT Operating Partnership LP /
|
|||||||
|
MPT Finance Corp
|
|||||||
|
250,000
|
4.625%, 08/01/2029
|
179,993
|
|||||
|
Prestige Brands Inc
|
|||||||
|
250,000
|
3.750%, 04/01/2031 1
|
219,348
|
|||||
|
Prime Healthcare Services Inc
|
|||||||
|
250,000
|
7.250%, 11/01/2025 1
|
244,024
|
|||||
|
Select Medical Corp
|
|||||||
|
100,000
|
6.250%, 08/15/2026
|
100,593
|
|||||
|
Tenet Healthcare Corp
|
|||||||
|
250,000
|
4.875%, 01/01/2026
|
247,413
|
|||||
|
150,000
|
5.125%, 11/01/2027
|
146,736
|
|||||
|
175,000
|
4.250%, 06/01/2029
|
163,237
|
|||||
|
2,924,960
|
|||||||
|
Homebuilders/Real Estate: 5.9%
|
|||||||
|
Ashton Woods USA LLC /
|
|||||||
|
Ashton Woods Finance Co
|
|||||||
|
125,000
|
6.625%, 01/15/2028 1
|
121,924
|
|||||
|
Brookfield Residential Properties Inc /
|
|||||||
|
Brookfield Residential US LLC
|
|||||||
|
125,000
|
6.250%, 09/15/2027 1
|
121,273
|
|||||
|
Century Communities Inc
|
|||||||
|
125,000
|
6.750%, 06/01/2027
|
126,629
|
|||||
|
Cushman & Wakefield US Borrower LLC
|
|||||||
|
250,000
|
8.875%, 09/01/2031 1
|
265,131
|
|||||
|
Global Infrastructure Solutions Inc
|
|||||||
|
187,000
|
5.625%, 06/01/2029 1
|
170,993
|
|||||
|
HAT Holdings I LLC /
|
|||||||
|
HAT Holdings II LLC
|
|||||||
|
125,000
|
6.000%, 04/15/2025 1
|
124,778
|
|||||
|
100,000
|
3.375%, 06/15/2026 1
|
94,049
|
|||||
|
25,000
|
8.000%, 06/15/2027 1
|
26,063
|
|||||
|
125,000
|
3.750%, 09/15/2030 1
|
105,399
|
|||||
|
Iron Mountain Inc
|
|||||||
|
250,000
|
5.250%, 07/15/2030 1
|
239,195
|
|||||
The accompanying notes are an integral part of these financial statements.
24
Flexible U.S. High Yield Income Fund
|
SCHEDULE OF INVESTMENTS at December 31, 2023 (Continued)
|
|
Principal
|
|||||||
|
Amount
|
Value
|
||||||
|
CORPORATE BONDS: 72.4% (Continued)
|
|||||||
|
Homebuilders/Real Estate: 5.9% (Continued)
|
|||||||
|
Ladder Capital Finance Holdings LLLP /
|
|||||||
|
Ladder Capital Finance Corp
|
|||||||
|
$
|
125,000
|
5.250%, 10/01/2025 1
|
$
|
123,423
|
|||
|
125,000
|
4.750%, 06/15/2029 1
|
112,858
|
|||||
|
LGI Homes Inc
|
|||||||
|
75,000
|
8.750%, 12/15/2028 1
|
79,828
|
|||||
|
M/I Homes Inc
|
|||||||
|
125,000
|
3.950%, 02/15/2030
|
111,375
|
|||||
|
MasTec Inc
|
|||||||
|
75,000
|
6.625%, 08/15/2029 1
|
67,971
|
|||||
|
Service Properties Trust
|
|||||||
|
125,000
|
7.500%, 09/15/2025
|
126,525
|
|||||
|
250,000
|
5.250%, 02/15/2026
|
243,025
|
|||||
|
Starwood Property Trust Inc
|
|||||||
|
50,000
|
3.750%, 12/31/2024 1
|
49,103
|
|||||
|
125,000
|
3.625%, 07/15/2026
|
118,520
|
|||||
|
Uniti Group LP / Uniti Group Finance
|
|||||||
|
Inc / CSL Capital LLC
|
|||||||
|
250,000
|
10.500%, 02/15/2028 1
|
253,640
|
|||||
|
VICI Properties LP / VICI Note Co Inc
|
|||||||
|
125,000
|
4.125%, 08/15/2030 1
|
113,994
|
|||||
|
2,795,696
|
|||||||
|
Hotels: 0.2%
|
|||||||
|
Hilton Grand Vacations Borrower
|
|||||||
|
Escrow LLC / Hilton Grand
|
|||||||
|
Vacations Borrower Esc
|
|||||||
|
125,000
|
4.875%, 07/01/2031 1
|
110,767
|
|||||
|
Insurance: 0.6%
|
|||||||
|
Acrisure LLC / Acrisure Finance Inc
|
|||||||
|
150,000
|
4.250%, 02/15/2029 1
|
135,595
|
|||||
|
Alliant Holdings Intermediate LLC /
|
|||||||
|
Alliant Holdings Co-Issuer
|
|||||||
|
125,000
|
6.750%, 04/15/2028 1
|
127,957
|
|||||
|
263,552
|
|||||||
|
Leisure: 3.5%
|
|||||||
|
Carnival Corp
|
|||||||
|
500,000
|
5.750%, 03/01/2027 1
|
488,624
|
|||||
|
Carnival Holdings Bermuda Ltd
|
|||||||
|
125,000
|
10.375%, 05/01/2028 1
|
136,094
|
|||||
|
Life Time Inc
|
|||||||
|
125,000
|
5.750%, 01/15/2026 1
|
124,156
|
|||||
|
Royal Caribbean Cruises Ltd
|
|||||||
|
200,000
|
5.500%, 08/31/2026
|
198,237
|
|||||
|
375,000
|
11.625%, 08/15/2027 1
|
408,323
|
|||||
|
125,000
|
8.250%, 01/15/2029 1
|
132,921
|
|||||
|
Six Flags Entertainment Corp
|
|||||||
|
75,000
|
7.250%, 05/15/2031 1
|
75,280
|
|||||
|
VOC Escrow Ltd
|
|||||||
|
125,000
|
5.000%, 02/15/2028 1
|
119,979
|
|||||
|
1,683,614
|
|||||||
|
Metals/Mining: 2.4%
|
|||||||
|
ERO Copper Corp
|
|||||||
|
|
250,000
|
6.500%, 02/15/2030 1
|
221,035
|
||||
|
Kaiser Aluminum Corp
|
|||||||
|
250,000
|
4.500%, 06/01/2031 1
|
215,914
|
|||||
|
Mineral Resources Ltd
|
|||||||
|
250,000
|
9.250%, 10/01/2028 1
|
266,255
|
|||||
|
Perenti Finance Pty Ltd
|
|||||||
|
400,000
|
6.500%, 10/07/2025 1
|
393,000
|
|||||
|
1,096,204
|
|||||||
|
Publishing/Printing: 0.3%
|
|||||||
|
Cimpress PLC
|
|||||||
|
150,000
|
7.000%, 06/15/2026
|
146,729
|
|||||
|
Restaurants: 1.9%
|
|||||||
|
1011778 BC ULC / New Red Finance Inc
|
|||||||
|
125,000
|
4.375%, 01/15/2028 1
|
119,587
|
|||||
|
Brinker International Inc
|
|||||||
|
100,000
|
8.250%, 07/15/2030 1
|
104,707
|
|||||
|
IRB Holding Corp
|
|||||||
|
250,000
|
7.000%, 06/15/2025
|
250,195
|
|||||
|
Raising Cane’s Restaurants LLC
|
|||||||
|
250,000
|
9.375%, 05/01/2029 1
|
267,120
|
|||||
|
Yum! Brands Inc
|
|||||||
|
125,000
|
5.375%, 04/01/2032
|
122,979
|
|||||
|
864,588
|
|||||||
|
Services: 3.9%
|
|||||||
|
Avis Budget Car Rental LLC /
|
|||||||
|
Avis Budget Finance Inc
|
|||||||
|
250,000
|
8.000%, 02/15/2031 1
|
249,856
|
|||||
|
EquipmentShare.com Inc
|
|||||||
|
125,000
|
9.000%, 05/15/2028 1
|
129,075
|
|||||
|
Garda World Security Corp
|
|||||||
|
100,000
|
4.625%, 02/15/2027
|
96,337
|
|||||
|
75,000
|
7.750%, 02/15/2028
|
77,672
|
|||||
|
Graham Holdings Co
|
|||||||
|
125,000
|
5.750%, 06/01/2026
|
124,164
|
|||||
|
Maxim Crane Works
|
|||||||
|
Holdings Capital LLC
|
|||||||
|
125,000
|
11.500%, 09/01/2028 1
|
129,686
|
|||||
|
Ritchie Bros Holdings Inc
|
|||||||
|
100,000
|
6.750%, 03/15/2028 1
|
103,082
|
|||||
|
25,000
|
7.750%, 03/15/2031 1
|
26,684
|
|||||
|
TriNet Group Inc
|
|||||||
|
125,000
|
3.500%, 03/01/2029 1
|
112,412
|
|||||
|
125,000
|
7.125%, 08/15/2031 1
|
128,868
|
|||||
|
United Rentals North America Inc
|
|||||||
|
350,000
|
3.750%, 01/15/2032
|
311,211
|
|||||
|
WESCO Distribution Inc
|
|||||||
|
125,000
|
7.250%, 06/15/2028 1
|
128,541
|
|||||
|
ZipRecruiter Inc
|
|||||||
|
250,000
|
5.000%, 01/15/2030 1
|
219,049
|
|||||
|
1,836,637
|
|||||||
The accompanying notes are an integral part of these financial statements.
25
Flexible U.S. High Yield Income Fund
|
SCHEDULE OF INVESTMENTS at December 31, 2023 (Continued)
|
|
Principal
|
|||||||
|
Amount
|
Value
|
||||||
|
CORPORATE BONDS: 72.4% (Continued)
|
|||||||
|
Super Retail: 2.0%
|
|||||||
|
Evergreen Acqco 1 LP / TVI Inc
|
|||||||
|
$
|
375,000
|
9.750%, 04/26/2028 1
|
$
|
399,669
|
|||
|
Hanesbrands Inc
|
|||||||
|
125,000
|
9.000%, 02/15/2031 1
|
122,619
|
|||||
|
LCM Investments Holdings II LLC
|
|||||||
|
125,000
|
4.875%, 05/01/2029 1
|
116,251
|
|||||
|
125,000
|
8.250%, 08/01/2031 1
|
130,591
|
|||||
|
Macy’s Retail Holdings LLC
|
|||||||
|
125,000
|
5.875%, 04/01/2029 1
|
120,095
|
|||||
|
Michaels Cos Inc
|
|||||||
|
125,000
|
7.875%, 05/01/2029 1
|
78,832
|
|||||
|
968,057
|
|||||||
|
Technology: 0.8%
|
|||||||
|
NCR Corp
5.125%, 04/15/2029 1
|
|||||||
|
125,000
|
118,952
|
||||||
|
Open Text Corp
3.875%, 02/15/2028 1
|
|||||||
|
125,000
|
116,295
|
||||||
|
Seagate HDD Cayman
|
|||||||
|
75,000
|
8.250%, 12/15/2029 1
|
80,945
|
|||||
|
75,000
|
8.500%, 07/15/2031 1
|
81,460
|
|||||
|
397,652
|
|||||||
|
Telecommunications: 4.8%
|
|||||||
|
Cogent Communications Group Inc
7.000%, 06/15/2027 1
|
|||||||
|
125,000
|
125,742
|
||||||
|
Connect Finco SARL /
|
|||||||
|
Connect US Finco LLC
6.750%, 10/01/2026 1
|
|||||||
|
400,000
|
398,010
|
||||||
|
Frontier Communications Holdings LLC
8.750%, 05/15/2030 1
|
|||||||
|
250,000
|
257,377
|
||||||
|
250,000
|
8.625%, 03/15/2031 1
|
255,032
|
|||||
|
GCI LLC
4.750%, 10/15/2028 1
|
|||||||
|
250,000
|
231,480
|
||||||
|
Hughes Satellite Systems Corp
6.625%, 08/01/2026
|
|||||||
|
75,000
|
59,202
|
||||||
|
Iliad Holding SASU
6.500%, 10/15/2026
|
|||||||
|
200,000
|
199,752
|
||||||
|
Intelsat Jackson Holdings SA
6.500%, 03/15/2030 1
|
|||||||
|
250,000
|
238,796
|
||||||
|
Level 3 Financing Inc
3.400%, 03/01/2027 1
|
|||||||
|
125,000
|
116,361
|
||||||
|
150,000
|
4.250%, 07/01/2028 1
|
74,402
|
|||||
|
Qwest Corp
|
|||||||
|
125,000
|
7.250%, 09/15/2025
|
122,622
|
|||||
|
Zayo Group Holdings Inc
|
|||||||
|
250,000
|
4.000%, 03/01/2027
|
200,716
|
|||||
|
2,279,492
|
|||||||
|
Utilities: 1.6%
|
|||||||
|
Calpine Corp
|
|||||||
|
125,000
|
5.250%, 06/01/2026
|
123,322
|
|||||
|
125,000
|
4.625%, 02/01/2029 1
|
116,085
|
|||||
|
125,000
|
5.000%, 02/01/2031 1
|
114,772
|
|||||
|
75,000
|
3.750%, 03/01/2031 1
|
65,969
|
|||||
|
Clearway Energy Operating LLC
|
|||||||
|
|
250,000
|
3.750%, 02/15/2031 1
|
|
220,319
|
|||
|
Sunnova Energy Corp
|
|||||||
|
125,000
|
5.875%, 09/01/2026 1
|
106,518
|
|||||
|
746,985
|
|||||||
|
TOTAL CORPORATE BONDS
|
|||||||
|
(Cost $34,193,212)
|
34,396,677
|
||||||
|
BANK LOANS: 25.5%
|
|||||||
|
Aerospace/Defense: 0.3%
|
|||||||
|
TransDigm Inc TL
|
|||||||
|
150,000
|
8.597% (CME Term SOFR 1
|
||||||
|
Month + 3.250%), 02/28/2031 2,3
|
150,851
|
||||||
|
Automotive & Auto Parts: 1.0%
|
|||||||
|
American Axle & Manufacturing
|
|||||||
|
TL B (12/22) TL
|
|||||||
|
144,000
|
8.921% (CME Term SOFR 1
|
||||||
|
Month + 3.500%), 12/13/2029 2,3
|
144,720
|
||||||
|
First Brands Group LLC TL
|
|||||||
|
348,592
|
10.881% (CME Term SOFR 6
|
||||||
|
Month + 5.000%), 03/30/2027 2,3
|
346,414
|
||||||
|
491,134
|
|||||||
|
Broadcasting: 0.4%
|
|||||||
|
Century DE Buyer LLC TL
|
|||||||
|
170,000
|
9.577% (CME Term SOFR 1
|
||||||
|
Month + 4.000%), 10/30/2030 2,3
|
170,744
|
||||||
|
Cable/Satellite TV: 1.8%
|
|||||||
|
Cogeco Communications USA II LP TL
|
|||||||
|
250,000
|
8.598% (CME Term SOFR 1
|
||||||
|
Month + 3.250%), 09/29/2030 2,3
|
246,980
|
||||||
|
Directv Financing LLC TL
|
|||||||
|
243,140
|
10.650% (CME Term SOFR 1
|
||||||
|
Month + 5.000%), 08/02/2027 2,3
|
243,582
|
||||||
|
Telenet Financing USD LLC TL
|
|||||||
|
200,000
|
7.437% (CME Term SOFR 1
|
||||||
|
Month + 2.000%), 04/28/2028 2,3
|
199,275
|
||||||
|
UPC Financing Partnership
|
|||||||
|
TL (4/21) (NewCo) TL
|
|||||||
|
150,000
|
8.437% (CME Term SOFR 1
|
||||||
|
Month + 2.925%), 01/31/2029 2,3
|
149,734
|
||||||
|
839,571
|
|||||||
|
Capital Goods: 0.5%
|
|||||||
|
Chart Industries Inc TL
|
|||||||
|
136,680
|
8.670% (CME Term SOFR 1
|
||||||
|
Month + 3.250%), 03/18/2030 2,3
|
137,135
|
||||||
|
DexKo Global TL (9/21) TL
|
|||||||
|
99,494
|
9.253% (CME Term SOFR 3
|
||||||
|
Month + 3.750%), 10/04/2028 2,3
|
99,121
|
||||||
|
236,256
|
|||||||
The accompanying notes are an integral part of these financial statements.
26
Flexible U.S. High Yield Income Fund
|
SCHEDULE OF INVESTMENTS at December 31, 2023 (Continued)
|
|
Principal
|
|||||||
|
Amount
|
Value
|
||||||
|
BANK LOANS: 25.5% (Continued)
|
|||||||
|
Chemicals: 0.9%
|
|||||||
|
Bakelite TL (US Holdco / Fusion) TL
|
|||||||
|
$
|
149,242
|
9.392% (CME Term SOFR 3
|
|||||
|
Month + 4.000%), 05/29/2029 2,3
|
$
|
149,150
|
|||||
|
Nouryon USA LLC TL
|
|||||||
|
149,624
|
9.434% (CME Term SOFR 1
|
||||||
|
Month + 4.000%), 04/03/2028 2,3
|
150,395
|
||||||
|
Pearls (Netherlands) BidCo
|
|||||||
|
TL (USD) (Caldic) (02/22) TL
|
|||||||
|
148,116
|
9.119% (CME Term SOFR 1
|
||||||
|
Month + 3.750%), 03/01/2029 2,3
|
147,005
|
||||||
|
446,550
|
|||||||
|
Containers: 0.7%
|
|||||||
|
Berry Global Inc TL
|
|||||||
|
199,500
|
7.222% (CME Term SOFR 1
|
||||||
|
Month + 1.750%), 07/01/2029 2,3
|
199,978
|
||||||
|
Pactiv Evergreen Group Holdings Inc TL
|
|||||||
|
147,727
|
8.713% (CME Term SOFR 1
|
||||||
|
Month + 3.500%), 09/24/2028 2,3
|
148,306
|
||||||
|
348,284
|
|||||||
|
Diversified Financial Services: 2.6%
|
|||||||
|
Citadel Securities LP TL
|
|||||||
|
74,817
|
7.963% (CME Term SOFR 1
|
||||||
|
Month + 2.500%), 07/29/2030 2,3
|
75,082
|
||||||
|
CLUE OPCO TL B TL
|
|||||||
|
150,000
|
9.856%, 09/20/2030 2,3
|
142,625
|
|||||
|
DRW Holdings LLC TL
|
|||||||
|
200,000
|
9.213% (CME Term SOFR 1
|
||||||
|
Month + 3.750%), 03/01/2028 2,3
|
200,000
|
||||||
|
GBT Group Services
|
|||||||
|
(Global Business Travel) TL
|
|||||||
|
250,000
|
7.654% (CME Term SOFR 1
|
||||||
|
Month + 2.500%), 07/21/2025 2,3
|
249,750
|
||||||
|
GTCR W MERGER SUB TL B TL
|
|||||||
|
100,000
|
3.750% (CME Term SOFR 1
|
||||||
|
Month + 3.000%), 09/20/2030 2,3
|
100,562
|
||||||
|
Jane Street Group LLC TL
|
|||||||
|
198,974
|
8.213% (CME Term SOFR 1
|
||||||
|
Month + 2.750%), 01/26/2028 2,3
|
200,053
|
||||||
|
Nuvei Technologies Corp TL
|
|||||||
|
250,000
|
7.939% (CME Term SOFR 1
|
||||||
|
Month + 2.500%), 09/29/2025 2,3
|
250,274
|
||||||
|
1,218,346
|
|||||||
|
Diversified Media: 0.5%
|
|||||||
|
Advantage Sales & Marketing Inc TL
|
|||||||
|
248,881
|
9.760% (CME Term SOFR 1
|
||||||
|
Month + 4.500%), 10/28/2027 2,3
|
247,676
|
||||||
|
Environmental: 0.4%
|
|||||||
|
Covanta Holding Corp TL
|
|||||||
|
199,535
|
8.360% (CME Term SOFR 1
|
||||||
|
Month + 3.000%), 11/30/2028 2,3
|
200,034
|
||||||
|
Food/Beverage/Tobacco: 0.2%
|
|||||||
|
Chobani LLC TL
|
|||||||
|
|
91,000
|
4.250% (CME Term SOFR 1
|
|||||
|
Month + 3.750%), 10/25/2027 2,3
|
|
91,265
|
|||||
|
Gaming: 0.9%
|
|||||||
|
Flutter Financing BV TL
|
|||||||
|
200,000
|
7.598% (CME Term SOFR 1
|
||||||
|
Month + 2.250%), 11/25/2030 2,3
|
200,750
|
||||||
|
Station Casinos LLC TL
|
|||||||
|
198,954
|
7.698% (CME Term SOFR 1
|
||||||
|
Month + 2.250%), 02/08/2027 2,3
|
199,623
|
||||||
|
400,373
|
|||||||
|
Healthcare: 1.1%
|
|||||||
|
Elanco Animal Health Inc TL
|
|||||||
|
298,892
|
7.170% (CME Term SOFR 1
|
||||||
|
Month + 1.750%), 08/02/2027 2,3
|
297,440
|
||||||
|
Grifols Worldwide Operations
|
|||||||
|
TL B (11/19) TL
|
|||||||
|
199,481
|
7.424% (CME Term SOFR 3
|
||||||
|
Month + 2.000%), 11/15/2027 2,3
|
199,730
|
||||||
|
497,170
|
|||||||
|
Homebuilders/Real Estate: 1.3%
|
|||||||
|
Cushman & Wakefield US
|
|||||||
|
Borrower LLC TL
|
|||||||
|
250,000
|
9.348% (CME Term SOFR 1
|
||||||
|
Month + 4.000%), 01/31/2030 2,3
|
250,313
|
||||||
|
Iron Mountain Inc TL
|
|||||||
|
200,000
|
7.843% (CME Term SOFR 1
|
||||||
|
Month + 2.250%), 01/31/2031 2,3
|
200,313
|
||||||
|
Starwood Property Mortgage LLC TL
|
|||||||
|
149,246
|
8.598% (CME Term SOFR 1
|
||||||
|
Month + 3.250%), 11/18/2027 2,3
|
149,246
|
||||||
|
599,872
|
|||||||
|
Hotels: 1.2%
|
|||||||
|
Hilton Grand Vacations Borrower LLC TL
|
|||||||
|
198,982
|
8.213% (CME Term SOFR 1
|
||||||
|
Month + 3.000%), 08/02/2028 2,3
|
199,355
|
||||||
|
HILTON HOTELS (10/23) TL B4 TL
|
|||||||
|
150,000
|
7.455%, 11/08/2030 2,3
|
150,710
|
|||||
|
TRAVEL + LEISURE TL B (12/23)
|
|||||||
|
250,000
|
3.250%, 12/14/2029 2,3
|
250,719
|
|||||
|
600,784
|
|||||||
|
Leisure: 0.4%
|
|||||||
|
Delta 2 Lux SARL TL
|
|||||||
|
200,000
|
7.598% (CME Term SOFR 1
|
||||||
|
Month + 3.000%), 01/15/2030 2,3
|
200,782
|
||||||
|
Metals/Mining: 0.3%
|
|||||||
|
Grinding Media B (09/21) TL
|
|||||||
|
150,000
|
9.684% (CME Term SOFR 3
|
||||||
|
Month + 4.000%), 10/12/2028 2,3
|
150,000
|
||||||
The accompanying notes are an integral part of these financial statements.
27
Flexible U.S. High Yield Income Fund
|
SCHEDULE OF INVESTMENTS at December 31, 2023 (Continued)
|
|
Principal
|
|||||||
|
Amount
|
Value
|
||||||
|
BANK LOANS: 25.5% (Continued)
|
|||||||
|
Publishing/Printing: 0.3%
|
|||||||
|
Cimpress USA Inc TL
|
|||||||
|
$
|
149,616
|
8.963% (CME Term SOFR 1
|
|||||
|
Month + 3.500%), 05/17/2028 2,3
|
$
|
149,803
|
|||||
|
Restaurants: 0.3%
|
|||||||
|
1011778 BC ULC TL
|
|||||||
|
150,000
|
7.598% (CME Term SOFR 1
|
||||||
|
Month + 2.250%), 09/23/2030 2,3
|
150,241
|
||||||
|
Services: 1.9%
|
|||||||
|
DXP Enterprises Inc/TX TL
|
|||||||
|
99,750
|
10.291% (CME Term SOFR 1
|
||||||
|
Month + 4.750%), 10/07/2030 2,3
|
100,373
|
||||||
|
Kingpin Intermediate Holdings LLC TL
|
|||||||
|
199,499
|
8.848% (CME Term SOFR 1
|
||||||
|
Month + 3.500%), 02/08/2028 2,3
|
199,748
|
||||||
|
Neptune BidCo US TL B TL
|
|||||||
|
99,500
|
10.398% (CME Term SOFR 1
|
||||||
|
Month + 5.000%), 04/11/2029 2,3
|
91,153
|
||||||
|
Peraton Corp TL
|
|||||||
|
248,786
|
9.198% (CME Term SOFR 1
|
||||||
|
Month + 3.750%), 02/01/2028 2,3
|
249,719
|
||||||
|
Sitel Worldwide (USD) (7/21) TL
|
|||||||
|
250,000
|
9.213% (CME Term SOFR 1
|
||||||
|
Month + 3.750%), 08/28/2028 2,3
|
240,844
|
||||||
|
881,837
|
|||||||
|
Super Retail: 1.2%
|
|||||||
|
Birkenstock US BidCo Inc TL
|
|||||||
|
84,598
|
8.877% (CME Term SOFR 1
|
||||||
|
Month + 3.750%), 04/28/2028 2,3
|
84,959
|
||||||
|
Leslie’s Poolmart Inc TL
|
|||||||
|
250,000
|
8.213% (CME Term SOFR 1
|
||||||
|
Month + 2.750%), 03/09/2028 2,3
|
246,954
|
||||||
|
Upbound Group Inc TL
|
|||||||
|
249,328
|
9.119% (CME Term SOFR 1
|
||||||
|
Month + 3.250%), 02/17/2028 2,3
|
249,795
|
||||||
|
581,708
|
|||||||
|
Technology: 3.9%
|
|||||||
|
Adeia Inc TL
|
|||||||
|
190,759
|
8.966% (CME Term SOFR 1
|
||||||
|
Month + 3.500%), 06/08/2028 2,3
|
190,950
|
||||||
|
Ahead DB Holdings TL (04/21) TL
|
|||||||
|
97,500
|
9.240% (CME Term SOFR 3
|
||||||
|
Month + 3.750%), 10/16/2027 2,3
|
97,286
|
||||||
|
AppLovin Corp TL
|
|||||||
|
250,000
|
8.548% (CME Term SOFR 1
|
||||||
|
Month + 3.000%), 08/19/2030 2,3
|
250,504
|
||||||
|
Connectwise B (9/21) TL
|
|||||||
|
200,000
|
8.963% (CME Term SOFR 1
|
||||||
|
Month + 3.500%), 09/30/2028 2,3
|
200,000
|
||||||
|
Constant Contact Inc TL
|
|||||||
|
199,599
|
9.561% (CME Term SOFR 1
|
||||||
|
Month + 4.000%), 02/10/2028 2,3
|
195,607
|
||||||
|
Dawn Acquisition TL
|
|||||||
|
|
145,260
|
9.402% (CME Term SOFR 3
|
|||||
|
Month + 3.750%), 12/31/2025 2,3
|
|
140,540
|
|||||
|
DTI Holdco Inc TL
|
|||||||
|
199,495
|
9.795% (CME Term SOFR 1
|
||||||
|
Month + 4.750%), 04/26/2029 2,3
|
197,679
|
||||||
|
Indy US Holdco LLC TL
|
|||||||
|
200,000
|
11.598% (CME Term SOFR 1
|
||||||
|
Month + 6.250%), 03/06/2028 2,3
|
196,125
|
||||||
|
MeridianLink Inc TL
|
|||||||
|
249,365
|
5.877% (CME Term SOFR 1
|
||||||
|
Month + 3.000%), 11/10/2028 2,3
|
249,895
|
||||||
|
Open Text TL B (08/23) TARGET TL
|
|||||||
|
145,362
|
8.198% (CME Term SOFR 1
|
||||||
|
Month + 2.750%), 01/31/2030 2,3
|
145,871
|
||||||
|
1,864,457
|
|||||||
|
Telecommunications: 1.5%
|
|||||||
|
Altice France (Numericable) TL B14 TL
|
|||||||
|
99,500
|
10.894% (CME Term SOFR 1
|
||||||
|
Month + 5.500%), 08/31/2028 2,3
|
89,674
|
||||||
|
Crown Subsea TL (4/21) (SubCom) TL
|
|||||||
|
100,547
|
10.457% (CME Term SOFR 1
|
||||||
|
Month + 4.750%), 04/27/2027 2,3
|
101,302
|
||||||
|
Iridium Satellite LLC TL
|
|||||||
|
200,000
|
7.848% (CME Term SOFR 1
|
||||||
|
Month + 2.500%), 09/20/2030 2,3
|
200,806
|
||||||
|
Voyage TL B (Vocus Group) (USD) TL
|
|||||||
|
149,237
|
9.088% (CME Term SOFR 3
|
||||||
|
Month + 3.500%), 07/20/2028 2,3
|
149,610
|
||||||
|
Ziggo Financing Partnership TL
|
|||||||
|
150,000
|
7.937% (CME Term SOFR 1
|
||||||
|
Month + 2.500%), 04/30/2028 2,3
|
149,839
|
||||||
|
691,231
|
|||||||
|
Transportation Excluding Air/Rail: 0.8%
|
|||||||
|
First Student Bidco TL B TL
|
|||||||
|
239,194
|
9.490% (CME Term SOFR 3
|
||||||
|
Month + 4.000%), 07/21/2028 2,3
|
239,044
|
||||||
|
XPO TL B (12/23) TL
|
|||||||
|
150,000
|
7.360%, 02/01/2031 2,3
|
150,406
|
|||||
|
389,450
|
|||||||
|
Utilities: 1.1%
|
|||||||
|
Calpine Construction Finance Co LP TL
|
|||||||
|
149,625
|
7.598% (CME Term SOFR 1
|
||||||
|
Month + 2.250%), 07/20/2030 2,3
|
149,831
|
||||||
|
Constellation Renewables LLC TL
|
|||||||
|
150,000
|
8.184% (CME Term SOFR 3
|
||||||
|
Month + 2.500%), 12/15/2027 2,3
|
150,163
|
||||||
|
Edgewater Generation LLC TL
|
|||||||
|
245,849
|
9.213% (CME Term SOFR 1
|
||||||
|
Month + 3.750%), 12/15/2025 2,3
|
241,925
|
||||||
|
541,919
|
|||||||
|
TOTAL BANK LOANS
|
|||||||
|
(Cost $12,036,324)
|
12,140,337
|
||||||
The accompanying notes are an integral part of these financial statements.
28
Flexible U.S. High Yield Income Fund
|
SCHEDULE OF INVESTMENTS at December 31, 2023 (Continued)
|
|
Shares
|
Value
|
||||||
|
SHORT-TERM INVESTMENTS: 6.6%
|
|||||||
|
Money Market Funds: 6.6%
|
|||||||
|
3,150,548
|
First American Treasury Obligations
|
||||||
|
Fund – Class X, 5.285% 4
|
$
|
3,150,548
|
|||||
|
TOTAL SHORT-TERM INVESTMENTS
|
|||||||
|
(Cost $3,150,548)
|
3,150,548
|
||||||
|
TOTAL INVESTMENTS IN SECURITIES: 104.5%
|
|||||||
|
(Cost $49,380,084)
|
49,687,562
|
||||||
|
Liabilities in Excess of Other Assets: (4.5)%
|
(2,141,496
|
)
|
|||||
|
TOTAL NET ASSETS: 100.0%
|
$
|
47,546,066
|
|||||
|
1
|
Security exempt from registration under Rule 144A of the Securities Act of 1933. These securities may be resold in transactions exempt from registration to qualified institutional buyers. These securities are
determined to be liquid by the Adviser, unless otherwise noted, under procedures established by the Trust’s Board of Trustees.
|
|
2
|
Bank loans generally pay interest at rates which are periodically determined by reference to a base lending rate plus a premium. All loans carry a variable rate of interest. These base lending rates are
generally (i) the Prime Rate offered by one or more European banks such as the London Interbank Offered Rate (“LIBOR”) or (iii) the Certificate of Deposit rate. Bank Loans, while exempt from registration, under the Securities Act of 1933,
contain certain restrictions on resale and cannot be sold publicly. Floating rate bank loans often require prepayments from excess cash flow or permit the borrower to repay at its election. The degree to which borrowers repay, whether as a
contractual requirement or at their election, cannot be predicted with accuracy.
|
|
3
|
Variable rate security; rate shown is the rate in effect on December 31, 2023. An index may have a negative rate. Interest rate may also be subject to a cap or floor.
|
|
4
|
Annualized seven-day effective yield as of December 31, 2023.
|
The accompanying notes are an integral part of these financial statements.
29
Low Duration Fund
|
SCHEDULE OF INVESTMENTS at December 31, 2023
|
|
Principal
|
|||||||
|
Amount†
|
Value
|
||||||
|
CORPORATE BONDS: 88.7%
|
|||||||
|
Agency: 0.3%
|
|||||||
|
Istituto per il Credito Sportivo
|
|||||||
|
$
|
2,800,000
|
5.250%, 10/31/2025
|
$
|
3,171,310
|
|||
|
Airlines: 1.3%
|
|||||||
|
American Airlines Inc/
|
|||||||
|
AAdvantage Loyalty IP Ltd
|
|||||||
|
1,704,167
|
5.500%, 04/20/2026 1
|
1,693,156
|
|||||
|
Cathay Pacific MTN Financing HK Ltd
|
|||||||
|
2,440,000
|
4.875%, 08/17/2026
|
2,385,416
|
|||||
|
Delta Air Lines Inc
|
|||||||
|
1,110,000
|
7.000%, 05/01/2025 1
|
1,130,525
|
|||||
|
Delta Air Lines Inc / SkyMiles IP Ltd
|
|||||||
|
1,572,895
|
4.500%, 10/20/2025 1
|
1,549,945
|
|||||
|
Korean Air Lines Co Ltd
|
|||||||
|
900,000
|
4.750%, 09/23/2025
|
892,620
|
|||||
|
Mileage Plus Holdings LLC / Mileage
|
|||||||
|
Plus Intellectual Property Assets Ltd
|
|||||||
|
927,500
|
6.500%, 06/20/2027
|
930,854
|
|||||
|
Singapore Airlines Ltd
|
|||||||
|
1,100,000
|
3.000%, 07/20/2026
|
1,048,779
|
|||||
|
Wizz Air Finance Co BV
|
|||||||
|
2,300,000
|
1.350%, 01/19/2024
|
2,536,305
|
|||||
|
625,000
|
1.000%, 01/19/2026
|
636,164
|
|||||
|
12,803,764
|
|||||||
|
Automotive & Auto Parts: 7.1%
|
|||||||
|
Aptiv PLC / Aptiv Corp
|
|||||||
|
3,000,000
|
2.396%, 02/18/2025
|
2,903,284
|
|||||
|
Benteler International AG
|
|||||||
|
1,400,000
|
9.375%, 05/15/2028
|
1,654,910
|
|||||
|
Ford Motor Credit Co LLC
|
|||||||
|
600,000
|
3.810%, 01/09/2024
|
599,735
|
|||||
|
850,000
|
3.250%, 09/15/2025
|
927,297
|
|||||
|
3,650,000
|
3.375%, 11/13/2025
|
3,495,654
|
|||||
|
2,500,000
|
4.867%, 08/03/2027
|
2,840,739
|
|||||
|
Forvia SE
|
|||||||
|
1,100,000
|
2.625%, 06/15/2025
|
1,194,202
|
|||||
|
1,900,000
|
7.250%, 06/15/2026
|
2,228,741
|
|||||
|
1,100,000
|
2.750%, 02/15/2027
|
1,165,448
|
|||||
|
General Motors Financial Co Inc
|
|||||||
|
1,150,000
|
5.100%, 01/17/2024
|
1,149,600
|
|||||
|
2,000,000
|
3.950%, 04/13/2024
|
1,988,313
|
|||||
|
600,000
|
2.250%, 09/06/2024
|
747,305
|
|||||
|
1,170,000
|
4.350%, 04/09/2025
|
1,153,369
|
|||||
|
2,000,000
|
2.750%, 06/20/2025
|
1,924,299
|
|||||
|
Genuine Parts Co
|
|||||||
|
200,000
|
1.750%, 02/01/2025
|
192,219
|
|||||
|
Harley-Davidson Financial Services Inc
|
|||||||
|
3,000,000
|
5.125%, 04/05/2026
|
3,418,912
|
|||||
|
Hyundai Capital America
|
|||||||
|
3,000,000
|
5.800%, 06/26/2025
|
3,017,590
|
|||||
|
3,500,000
|
6.000%, 07/11/2025 1
|
3,529,345
|
|||||
|
1,825,000
|
1.650%, 09/17/2026 1
|
1,660,157
|
|||||
|
IHO Verwaltungs GmbH
|
|||||||
|
1,600,000
|
3.750%, 4.50, 09/15/2026
|
|
1,746,470
|
||||
|
2,250,000
|
8.750%, 9.50, 05/15/2028
|
2,712,002
|
|||||
|
Jaguar Land Rover Automotive PLC
|
|||||||
|
900,000
|
2.200%, 01/15/2024
|
992,784
|
|||||
|
2,200,000
|
5.875%, 11/15/2024
|
2,452,377
|
|||||
|
1,100,000
|
7.750%, 10/15/2025
|
1,113,355
|
|||||
|
1,625,000
|
4.500%, 07/15/2028
|
1,757,274
|
|||||
|
Kia Corp
|
|||||||
|
650,000
|
1.000%, 04/16/2024
|
641,288
|
|||||
|
1,990,000
|
2.375%, 02/14/2025
|
1,928,296
|
|||||
|
1,200,000
|
3.250%, 04/21/2026
|
1,150,841
|
|||||
|
3,000,000
|
1.750%, 10/16/2026
|
2,740,141
|
|||||
|
Mercedes-Benz Finance
|
|||||||
|
North America LLC
|
|||||||
|
550,000
|
4.950%, 03/30/2025 1
|
550,640
|
|||||
|
550,000
|
4.800%, 03/30/2026 1
|
550,652
|
|||||
|
Nissan Motor Acceptance Co LLC
|
|||||||
|
3,000,000
|
1.125%, 09/16/2024 1
|
2,894,885
|
|||||
|
1,000,000
|
6.950%, 09/15/2026
|
1,034,009
|
|||||
|
Nissan Motor Co Ltd
|
|||||||
|
4,784,000
|
3.522%, 09/17/2025 1
|
4,608,960
|
|||||
|
700,000
|
2.652%, 03/17/2026
|
754,956
|
|||||
|
Toyota Motor Credit Corp
|
|||||||
|
3,000,000
|
3.000%, 04/01/2025
|
2,935,363
|
|||||
|
ZF Europe Finance BV
|
|||||||
|
800,000
|
2.500%, 10/23/2027
|
828,807
|
|||||
|
ZF Finance GmbH
|
|||||||
|
3,200,000
|
3.000%, 09/21/2025
|
3,459,401
|
|||||
|
70,643,620
|
|||||||
|
Banking: 17.5%
|
|||||||
|
AIB Group PLC
|
|||||||
|
1,700,000
|
1.875% (5 Year Swap Rate
|
||||||
|
EUR + 2.150%), 11/19/2029 2
|
1,825,616
|
||||||
|
7,100,000
|
2.875% (5 Year Swap Rate
|
||||||
|
EUR + 3.300%), 05/30/2031 2
|
7,524,711
|
||||||
|
Australia & New Zealand
|
|||||||
|
Banking Group Ltd
|
|||||||
|
2,700,000
|
2.950% (5 Year CMT
|
||||||
|
Rate + 1.288%), 07/22/2030 1,2
|
2,566,095
|
||||||
|
Banco de Sabadell SA
|
|||||||
|
900,000
|
2.500% (5 Year Swap Rate
|
||||||
|
EUR + 2.950%), 04/15/2031 2
|
942,608
|
||||||
|
Bank of America Corp
|
|||||||
|
1,100,000
|
4.000%, 01/22/2025
|
1,086,084
|
|||||
|
450,000
|
3.841% (US Secured Overnight
|
||||||
|
Financing Rate + 1.110%), 04/25/2025 2
|
447,211
|
||||||
|
1,945,000
|
4.827% (US Secured Overnight
|
||||||
|
Financing Rate + 1.750%), 07/22/2026 2
|
1,931,669
|
||||||
|
900,000
|
4.376% (US Secured Overnight
|
||||||
|
Financing Rate + 1.580%), 04/27/2028 2
|
880,550
|
||||||
The accompanying notes are an integral part of these financial statements.
30
Low Duration Fund
|
SCHEDULE OF INVESTMENTS at December 31, 2023 (Continued)
|
|
Principal
|
|||||||
|
Amount†
|
Value
|
||||||
|
CORPORATE BONDS: 88.7% (Continued)
|
|||||||
|
Banking: 17.5% (Continued)
|
|||||||
|
Bank of Ireland Group PLC
|
|||||||
|
$
|
1,650,000
|
4.875% (1 Year EUR Swap
|
|||||
|
Rate + 2.050%), 07/16/2028 2
|
$
|
1,906,668
|
|||||
|
1,050,000
|
2.375% (5 Year Swap Rate
|
||||||
|
EUR + 2.800%), 10/14/2029 2
|
1,134,624
|
||||||
|
3,910,000
|
1.375% (5 Year Swap Rate
|
||||||
|
EUR + 1.650%), 08/11/2031 2
|
4,031,490
|
||||||
|
Barclays PLC
|
|||||||
|
2,000,000
|
7.325% (1 Year CMT
|
||||||
|
Rate + 3.050%), 11/02/2026 2
|
2,067,765
|
||||||
|
1,400,000
|
5.829% (US Secured Overnight
|
||||||
|
Financing Rate + 2.210%), 05/09/2027 2
|
1,413,420
|
||||||
|
1,100,000
|
1.125% (5 Year Swap Rate
|
||||||
|
EUR + 1.550%), 03/22/2031 2
|
1,120,629
|
||||||
|
BBVA Bancomer SA
|
|||||||
|
5,150,000
|
4.375%, 04/10/2024
|
5,122,965
|
|||||
|
BNP Paribas SA
|
|||||||
|
3,000,000
|
2.591% (US Secured Overnight
|
||||||
|
Financing Rate + 1.228%), 01/20/2028 2
|
2,779,692
|
||||||
|
BPCE SA
|
|||||||
|
2,510,000
|
5.150%, 07/21/2024 1
|
2,488,928
|
|||||
|
6,200,000
|
4.500%, 03/15/2025 1
|
6,087,376
|
|||||
|
CaixaBank SA
|
|||||||
|
2,375,000
|
6.684% (US Secured Overnight
|
||||||
|
Financing Rate + 2.080%),
|
|||||||
|
09/13/2027 1,2
|
2,437,355
|
||||||
|
3,000,000
|
2.250% (5 Year Swap Rate
|
||||||
|
EUR + 1.680%), 04/17/2030 2
|
3,200,308
|
||||||
|
1,800,000
|
6.250% (5 Year Swap Rate
|
||||||
|
EUR + 3.550%), 02/23/2033 2
|
2,100,174
|
||||||
|
Ceska sporitelna AS
|
|||||||
|
1,200,000
|
6.693% (3 Month EURIBOR +
|
||||||
|
3.700%), 11/14/2025 2
|
1,352,227
|
||||||
|
1,700,000
|
5.943% (3 Month EURIBOR +
|
||||||
|
2.400%), 06/29/2027 2
|
1,948,712
|
||||||
|
Citigroup Inc
|
|||||||
|
900,000
|
4.140% (US Secured Overnight
|
||||||
|
Financing Rate + 1.372%), 05/24/2025 2
|
894,855
|
||||||
|
Commonwealth Bank of Australia
|
|||||||
|
2,500,000
|
1.936% (5 Year Swap Rate
|
||||||
|
EUR + 1.450%), 10/03/2029 2
|
2,691,642
|
||||||
|
Cooperatieve Rabobank UA
|
|||||||
|
3,800,000
|
4.000% (5 Year Swap Rate
|
||||||
|
USD + 1.892%), 04/10/2029 2
|
3,774,863
|
||||||
|
Credit Agricole SA
|
|||||||
|
5,500,000
|
1.907% (US Secured Overnight
|
||||||
|
Financing Rate + 1.676%),
|
|||||||
|
06/16/2026 1,2
|
5,221,674
|
||||||
|
Danske Bank A/S
|
|||||||
|
2,400,000
|
6.259% (1 Year CMT Rate +
|
||||||
|
1.180%), 09/22/2026 1,2
|
2,443,422
|
||||||
|
2,200,000
|
4.000% (1 Year EUR Swap
|
||||||
|
Rate + .950%), 01/12/2027 2
|
2,448,793
|
||||||
|
Danske Bank A/S (Continued)
|
|||||||
|
1,500,000
|
2.500% (5 Year Swap Rate
|
||||||
|
EUR + 2.500%), 06/21/2029 2
|
|
1,638,660
|
|||||
|
3,200,000
|
1.500% (5 Year Swap Rate
|
||||||
|
EUR + 1.900%), 09/02/2030 2
|
3,372,899
|
||||||
|
2,000,000
|
1.000% (5 Year Swap Rate
|
||||||
|
EUR + 1.400%), 05/15/2031 2
|
2,062,271
|
||||||
|
Deutsche Bank AG
|
|||||||
|
200,000
|
1.000% (3 Month EURIBOR +
|
||||||
|
1.600%), 11/19/2025 2
|
214,786
|
||||||
|
2,700,000
|
3.961% (US Secured Overnight
|
||||||
|
Financing Rate + 2.581%), 11/26/2025 2
|
2,656,633
|
||||||
|
2,500,000
|
6.119% (US Secured Overnight
|
||||||
|
Financing Rate + 3.190%), 07/14/2026 2
|
2,525,746
|
||||||
|
1,650,000
|
7.146% (US Secured Overnight
|
||||||
|
Financing Rate + 2.520%), 07/13/2027 2
|
1,714,023
|
||||||
|
HSBC USA Inc
|
|||||||
|
3,325,000
|
5.625%, 03/17/2025
|
3,344,103
|
|||||
|
ING Groep NV
|
|||||||
|
2,700,000
|
2.500% (5 Year Swap Rate
|
||||||
|
EUR + 2.150%), 02/15/2029 2
|
2,973,365
|
||||||
|
900,000
|
1.625% (5 Year Swap Rate
|
||||||
|
EUR + 1.250%), 09/26/2029 2
|
969,414
|
||||||
|
Intesa Sanpaolo SPA
|
|||||||
|
7,300,000
|
5.017%, 06/26/2024 1
|
7,226,629
|
|||||
|
1,600,000
|
3.250%, 09/23/2024 1
|
1,571,251
|
|||||
|
1,000,000
|
4.375% (5 Year Swap Rate
|
||||||
|
EUR + 4.750%), 07/12/2029 2
|
1,100,057
|
||||||
|
Islandsbanki HF
|
|||||||
|
1,625,000
|
7.375%, 05/17/2026
|
1,890,216
|
|||||
|
KBC Group NV
|
|||||||
|
3,300,000
|
5.796% (1 Year CMT Rate +
|
||||||
|
2.100%), 01/19/2029 1,2
|
3,361,309
|
||||||
|
1,600,000
|
1.625% (5 Year Swap Rate
|
||||||
|
EUR + 1.250%), 09/18/2029 2
|
1,722,837
|
||||||
|
Landsbankinn HF
|
|||||||
|
1,950,000
|
0.500%, 05/20/2024
|
2,116,466
|
|||||
|
1,600,000
|
0.375%, 05/23/2025
|
1,659,343
|
|||||
|
Lloyds Banking Group PLC
|
|||||||
|
5,500,000
|
5.985% (1 Year CMT Rate +
|
||||||
|
1.480%), 08/07/2027 2
|
5,602,663
|
||||||
|
Nationwide Building Society
|
|||||||
|
2,000,000
|
1.500% (3 Month EURIBOR +
|
||||||
|
.930%), 03/08/2026 2
|
2,149,667
|
||||||
|
625,000
|
4.000%, 09/14/2026 1
|
600,589
|
|||||
|
3,550,000
|
2.000% (5 Year Swap Rate
|
||||||
|
EUR + 1.500%), 07/25/2029 2
|
3,846,336
|
||||||
|
NatWest Group PLC
|
|||||||
|
200,000
|
5.847% (1 Year CMT
|
||||||
|
Rate + 1.350%), 03/02/2027 2
|
201,904
|
||||||
|
2,325,000
|
3.754% (5 Year CMT
|
||||||
|
Rate + 2.100%), 11/01/2029 2
|
2,268,551
|
||||||
|
NBK SPC Ltd
|
|||||||
|
750,000
|
1.625% (US Secured Overnight
|
||||||
|
Financing Rate + 1.050%), 09/15/2027 2
|
680,012
|
||||||
The accompanying notes are an integral part of these financial statements.
31
Low Duration Fund
|
SCHEDULE OF INVESTMENTS at December 31, 2023 (Continued)
|
|
Principal
|
|||||||
|
Amount†
|
Value
|
||||||
|
CORPORATE BONDS: 88.7% (Continued)
|
|||||||
|
Banking: 17.5% (Continued)
|
|||||||
|
Nordea Bank Abp
|
|||||||
|
$
|
2,000,000
|
1.000% (5 Year Swap Rate
|
|||||
|
EUR + 1.300%), 06/27/2029 2
|
$
|
2,162,609
|
|||||
|
Nova Ljubljanska Banka dd
|
|||||||
|
2,100,000
|
6.000% (1 Year EUR Swap
|
||||||
|
Rate + 4.835%), 07/19/2025 2
|
2,332,921
|
||||||
|
1,100,000
|
7.125% (1 Year EUR Swap
|
||||||
|
Rate + 3.606%), 06/27/2027 2
|
1,282,268
|
||||||
|
Permanent TSB Group Holdings PLC
|
|||||||
|
2,525,000
|
6.625% (EURIBOR ICE Swap
|
||||||
|
Rate + 3.500%), 04/25/2028 2
|
2,944,982
|
||||||
|
Raiffeisen Bank International AG
|
|||||||
|
900,000
|
4.125%, 09/08/2025
|
999,528
|
|||||
|
900,000
|
1.500% (5 Year Swap Rate
|
||||||
|
EUR + 2.150%), 03/12/2030 2
|
929,059
|
||||||
|
Santander UK Group Holdings PLC
|
|||||||
|
1,500,000
|
0.391% (EURIBOR ICE Swap
|
||||||
|
Rate + .730%), 02/28/2025 2
|
1,646,431
|
||||||
|
SNB Funding Ltd
|
|||||||
|
2,000,000
|
2.750%, 10/02/2024
|
1,953,636
|
|||||
|
Societe Generale SA
|
|||||||
|
1,160,000
|
5.000%, 01/17/2024
|
1,159,343
|
|||||
|
Standard Chartered PLC
|
|||||||
|
4,690,000
|
6.170% (1 Year CMT Rate +
|
||||||
|
2.050%), 01/09/2027 2
|
4,764,100
|
||||||
|
1,400,000
|
3.516% (5 Year CMT Rate +
|
||||||
|
1.850%), 02/12/2030 2
|
1,346,467
|
||||||
|
705,000
|
2.500% (5 Year Swap Rate
|
||||||
|
EUR + 2.800%), 09/09/2030 2
|
753,773
|
||||||
|
State Bank of India
|
|||||||
|
3,450,000
|
4.375%, 01/24/2024
|
3,447,775
|
|||||
|
UniCredit SPA
|
|||||||
|
450,000
|
2.000% (5 Year Swap Rate
|
||||||
|
EUR + 2.400%), 09/23/2029 2
|
485,791
|
||||||
|
1,600,000
|
2.731% (5 Year Swap Rate
|
||||||
|
EUR + 2.800%), 01/15/2032 2
|
1,660,249
|
||||||
|
Virgin Money UK PLC
|
|||||||
|
2,000,000
|
2.875% (1 Year EUR Swap
|
||||||
|
Rate + 3.250%), 06/24/2025 2
|
2,194,454
|
||||||
|
2,050,000
|
5.125% (UK Government Bonds
|
||||||
|
5 Year Note Generic Bid
|
|||||||
|
Yield + 5.250%), 12/11/2030 2
|
2,508,121
|
||||||
|
Volksbank Wien AG
|
|||||||
|
2,800,000
|
5.192% (5 Year Swap Rate
|
||||||
|
EUR + 2.550%), 10/06/2027 2
|
3,098,546
|
||||||
|
Westpac Banking Corp
|
|||||||
|
5,245,000
|
2.894% (5 Year CMT Rate +
|
||||||
|
1.350%), 02/04/2030 2
|
5,054,271
|
||||||
|
172,066,180
|
|||||||
|
Broadcasting: 1.5%
|
|||||||
|
Netflix Inc
|
|||||||
|
|
2,000,000
|
3.625%, 06/15/2025 1
|
|
1,964,460
|
|||
|
4,000,000
|
4.875%, 04/15/2028
|
4,057,224
|
|||||
|
Pinewood Finance Co Ltd
|
|||||||
|
500,000
|
3.250%, 09/30/2025
|
621,214
|
|||||
|
Take-Two Interactive Software Inc
|
|||||||
|
206,000
|
5.000%, 03/28/2026
|
207,076
|
|||||
|
Warnermedia Holdings Inc
|
|||||||
|
7,968,000
|
3.638%, 03/15/2025
|
7,800,897
|
|||||
|
14,650,871
|
|||||||
|
Building Materials: 0.6%
|
|||||||
|
James Hardie International Finance DAC
|
|||||||
|
2,655,000
|
3.625%, 10/01/2026
|
2,897,058
|
|||||
|
922,000
|
5.000%, 01/15/2028 1
|
892,966
|
|||||
|
Standard Industries Inc
|
|||||||
|
2,000,000
|
2.250%, 11/21/2026
|
2,094,650
|
|||||
|
5,884,674
|
|||||||
|
Cable/Satellite TV: 0.9%
|
|||||||
|
CCO Holdings LLC / CCO
|
|||||||
|
Holdings Capital Corp
|
|||||||
|
3,250,000
|
5.500%, 05/01/2026
|
3,230,587
|
|||||
|
DISH Network Corp
|
|||||||
|
2,200,000
|
11.750%, 11/15/2027 1
|
2,305,059
|
|||||
|
United Group BV
|
|||||||
|
1,400,000
|
3.125%, 02/15/2026
|
1,485,576
|
|||||
|
1,360,000
|
7.252% (3 Month EURIBOR +
|
||||||
|
3.250%), 02/15/2026 2
|
1,503,346
|
||||||
|
8,524,568
|
|||||||
|
Capital Goods: 2.2%
|
|||||||
|
Carrier Global Corp
|
|||||||
|
2,725,000
|
5.800%, 11/30/2025 1
|
2,762,594
|
|||||
|
Daimler Truck Finance
|
|||||||
|
North America LLC
|
|||||||
|
2,475,000
|
1.625%, 12/13/2024 1
|
2,385,609
|
|||||
|
1,150,000
|
3.500%, 04/07/2025 1
|
1,125,599
|
|||||
|
Ingersoll Rand Inc
|
|||||||
|
1,475,000
|
5.400%, 08/14/2028
|
1,522,244
|
|||||
|
Regal Rexnord Corp
|
|||||||
|
1,640,000
|
6.050%, 02/15/2026
|
1,659,189
|
|||||
|
Traton Finance Luxembourg SA
|
|||||||
|
4,200,000
|
0.125%, 11/10/2024
|
4,484,227
|
|||||
|
4,400,000
|
0.125%, 03/24/2025
|
4,646,341
|
|||||
|
800,000
|
4.125%, 11/22/2025
|
890,524
|
|||||
|
Westinghouse Air Brake
|
|||||||
|
Technologies Corp
|
|||||||
|
2,525,000
|
4.150%, 03/15/2024
|
2,514,690
|
|||||
|
21,991,017
|
|||||||
|
Chemicals: 2.5%
|
|||||||
|
Celanese US Holdings LLC
|
|||||||
|
1,950,000
|
6.350%, 11/15/2028
|
2,048,362
|
|||||
The accompanying notes are an integral part of these financial statements.
32
Low Duration Fund
|
SCHEDULE OF INVESTMENTS at December 31, 2023 (Continued)
|
|
Principal
|
|||||||
|
Amount†
|
Value
|
||||||
|
CORPORATE BONDS: 88.7% (Continued)
|
|||||||
|
Chemicals: 2.5% (Continued)
|
|||||||
|
INEOS Finance PLC
|
|||||||
|
$
|
3,900,000
|
2.875%, 05/01/2026
|
$
|
4,182,490
|
|||
|
1,775,000
|
6.625%, 05/15/2028
|
2,015,745
|
|||||
|
INEOS Quattro Finance 2 PLC
|
|||||||
|
2,400,000
|
2.500%, 01/15/2026
|
2,573,180
|
|||||
|
International Flavors & Fragrances Inc
|
|||||||
|
4,400,000
|
1.750%, 03/14/2024
|
4,833,482
|
|||||
|
600,000
|
1.230%, 10/01/2025 1
|
555,881
|
|||||
|
Nutrien Ltd
|
|||||||
|
2,000,000
|
5.900%, 11/07/2024
|
2,006,483
|
|||||
|
Orbia Advance Corp SAB de CV
|
|||||||
|
1,020,000
|
4.000%, 10/04/2027
|
969,197
|
|||||
|
Sinochem Offshore Capital Co Ltd
|
|||||||
|
4,500,000
|
1.500%, 11/24/2024
|
4,346,975
|
|||||
|
23,531,795
|
|||||||
|
Consumer-Products: 0.7%
|
|||||||
|
Haleon UK Capital PLC
|
|||||||
|
4,370,000
|
3.125%, 03/24/2025
|
4,271,019
|
|||||
|
Haleon US Capital LLC
|
|||||||
|
381,000
|
3.375%, 03/24/2027
|
367,022
|
|||||
|
Kenvue Inc
|
|||||||
|
675,000
|
5.500%, 03/22/2025
|
681,184
|
|||||
|
Kimberly-Clark de Mexico SAB de CV
|
|||||||
|
1,791,000
|
3.250%, 03/12/2025
|
1,750,613
|
|||||
|
7,069,838
|
|||||||
|
Containers: 0.8%
|
|||||||
|
Amcor Flexibles North America Inc
|
|||||||
|
850,000
|
4.000%, 05/17/2025
|
836,085
|
|||||
|
Ball Corp
|
|||||||
|
3,000,000
|
0.875%, 03/15/2024
|
3,287,551
|
|||||
|
Berry Global Inc
|
|||||||
|
350,000
|
5.500%, 04/15/2028 1
|
354,825
|
|||||
|
Crown European Holdings SA
|
|||||||
|
2,950,000
|
2.875%, 02/01/2026
|
3,203,471
|
|||||
|
Trivium Packaging Finance BV
|
|||||||
|
500,000
|
7.752% (3 Month EURIBOR +
|
||||||
|
3.750%), 08/15/2026 2
|
553,533
|
||||||
|
8,235,465
|
|||||||
|
Diversified Financial Services: 13.6%
|
|||||||
|
AerCap Ireland Capital DAC /
|
|||||||
|
AerCap Global Aviation Trust
|
|||||||
|
1,000,000
|
4.875%, 01/16/2024
|
999,387
|
|||||
|
1,801,000
|
3.150%, 02/15/2024
|
1,794,006
|
|||||
|
857,000
|
1.650%, 10/29/2024
|
827,485
|
|||||
|
2,039,000
|
2.450%, 10/29/2026
|
1,889,051
|
|||||
|
800,000
|
6.100%, 01/15/2027
|
817,830
|
|||||
|
2,181,000
|
6.450%, 04/15/2027 1
|
2,261,087
|
|||||
|
Air Lease Corp
|
|||||||
|
3,800,000
|
4.250%, 02/01/2024
|
3,794,140
|
|||||
|
2,560,000
|
2.200%, 01/15/2027
|
2,347,002
|
|||||
|
AIR Lease Corp Sukuk Ltd
|
|||||||
|
|
1,025,000
|
5.850%, 04/01/2028
|
|
1,035,798
|
|||
|
Aircastle Ltd
|
|||||||
|
3,897,000
|
4.125%, 05/01/2024
|
3,867,049
|
|||||
|
4,430,000
|
5.250%, 08/11/2025
|
4,370,184
|
|||||
|
Ares Capital Corp
|
|||||||
|
1,680,000
|
4.200%, 06/10/2024
|
1,664,268
|
|||||
|
1,525,000
|
4.250%, 03/01/2025
|
1,491,851
|
|||||
|
200,000
|
3.250%, 07/15/2025
|
191,389
|
|||||
|
3,875,000
|
7.000%, 01/15/2027
|
3,990,109
|
|||||
|
Aviation Capital Group LLC
|
|||||||
|
1,500,000
|
5.500%, 12/15/2024 1
|
1,492,589
|
|||||
|
1,000,000
|
4.125%, 08/01/2025 1
|
971,533
|
|||||
|
4,500,000
|
3.500%, 11/01/2027 1
|
4,152,974
|
|||||
|
Avolon Holdings Funding Ltd
|
|||||||
|
2,130,000
|
5.500%, 01/15/2026 1
|
2,118,228
|
|||||
|
1,425,000
|
4.250%, 04/15/2026 1
|
1,377,931
|
|||||
|
AXA Logistics Europe Master SCA
|
|||||||
|
575,000
|
0.375%, 11/15/2026
|
577,740
|
|||||
|
Blackstone Private Credit Fund
|
|||||||
|
2,500,000
|
1.750%, 09/15/2024
|
2,425,538
|
|||||
|
Blue Owl Capital Corp
|
|||||||
|
2,705,000
|
4.000%, 03/30/2025
|
2,630,482
|
|||||
|
1,115,000
|
3.750%, 07/22/2025
|
1,068,704
|
|||||
|
BOC Aviation Ltd
|
|||||||
|
3,000,000
|
6.929% (3 Month LIBOR
|
||||||
|
USD + 1.300%), 05/21/2025 2
|
2,994,154
|
||||||
|
BOC Aviation USA Corp
|
|||||||
|
1,000,000
|
1.625%, 04/29/2024
|
987,408
|
|||||
|
CA Auto Bank SPA
|
|||||||
|
4,250,000
|
6.000%, 12/06/2026
|
5,528,028
|
|||||
|
Credit Suisse AG
|
|||||||
|
6,300,000
|
5.500%, 08/20/2026
|
7,314,785
|
|||||
|
DAE Funding LLC
|
|||||||
|
3,850,000
|
1.550%, 08/01/2024
|
3,748,952
|
|||||
|
5,192,000
|
2.625%, 03/20/2025
|
4,986,391
|
|||||
|
DAE Sukuk Difc Ltd
|
|||||||
|
280,000
|
3.750%, 02/15/2026
|
269,498
|
|||||
|
doValue SPA
|
|||||||
|
1,750,000
|
5.000%, 08/04/2025
|
1,892,961
|
|||||
|
1,050,000
|
3.375%, 07/31/2026
|
1,048,020
|
|||||
|
Encore Capital Group Inc
|
|||||||
|
1,750,000
|
4.875%, 10/15/2025
|
1,934,949
|
|||||
|
775,000
|
5.375%, 02/15/2026
|
945,454
|
|||||
|
Garfunkelux Holdco 3 SA
|
|||||||
|
2,870,000
|
6.750%, 11/01/2025
|
2,529,246
|
|||||
|
500,000
|
7.750%, 11/01/2025
|
493,142
|
|||||
|
Goldman Sachs Group Inc
|
|||||||
|
2,400,000
|
3.000%, 03/15/2024
|
2,386,772
|
|||||
|
1,931,000
|
5.798% (US Secured Overnight
|
||||||
|
Financing Rate + 1.075%), 08/10/2026 2
|
1,950,933
|
||||||
|
GTCR W-2 Merger Sub LLC /
|
|||||||
|
GTCR W Dutch Finance Sub BV
|
|||||||
|
625,000
|
8.500%, 01/15/2031
|
863,774
|
|||||
The accompanying notes are an integral part of these financial statements.
33
Low Duration Fund
|
SCHEDULE OF INVESTMENTS at December 31, 2023 (Continued)
|
|
Principal
|
|||||||
|
Amount†
|
Value
|
||||||
|
CORPORATE BONDS: 88.7% (Continued)
|
|||||||
|
Diversified Financial Services: 13.6% (Continued)
|
|||||||
|
ICD Funding Ltd
|
|||||||
|
$
|
1,850,000
|
4.625%, 05/21/2024
|
$
|
1,838,741
|
|||
|
Intrum AB
|
|||||||
|
2,700,000
|
4.875%, 08/15/2025
|
2,796,231
|
|||||
|
150,000
|
3.500%, 07/15/2026
|
141,014
|
|||||
|
Jerrold Finco PLC
|
|||||||
|
1,075,000
|
4.875%, 01/15/2026
|
1,326,780
|
|||||
|
Macquarie Bank Ltd
|
|||||||
|
2,100,000
|
4.875%, 06/10/2025 1
|
2,075,879
|
|||||
|
Macquarie Group Ltd
|
|||||||
|
5,000,000
|
6.207%, 11/22/2024 1
|
5,032,206
|
|||||
|
Mirae Asset Securities Co Ltd
|
|||||||
|
4,780,000
|
2.625%, 07/30/2025
|
4,547,573
|
|||||
|
Mitsubishi HC Capital UK PLC
|
|||||||
|
425,000
|
0.000%, 10/29/2024
|
453,273
|
|||||
|
Morgan Stanley
|
|||||||
|
600,000
|
4.679% (US Secured Overnight
|
||||||
|
Financing Rate + 1.669%), 07/17/2026 2
|
594,724
|
||||||
|
2,500,000
|
6.138% (US Secured Overnight
|
||||||
|
Financing Rate + 1.770%), 10/16/2026 2
|
2,547,446
|
||||||
|
Nasdaq Inc
|
|||||||
|
850,000
|
5.350%, 06/28/2028
|
875,607
|
|||||
|
Park Aerospace Holdings Ltd
|
|||||||
|
5,320,000
|
5.500%, 02/15/2024 1
|
5,310,550
|
|||||
|
Power Finance Corp Ltd
|
|||||||
|
2,000,000
|
3.250%, 09/16/2024
|
1,968,930
|
|||||
|
REC Ltd
|
|||||||
|
2,300,000
|
3.375%, 07/25/2024
|
2,272,446
|
|||||
|
200,000
|
2.250%, 09/01/2026
|
184,914
|
|||||
|
2,840,000
|
2.750%, 01/13/2027
|
2,648,186
|
|||||
|
Sherwood Financing PLC
|
|||||||
|
1,520,000
|
8.627% (3 Month EURIBOR +
|
||||||
|
4.625%), 11/15/2027 2
|
1,657,025
|
||||||
|
Shriram Finance Ltd
|
|||||||
|
900,000
|
4.150%, 07/18/2025
|
862,875
|
|||||
|
SoftBank Group Corp
|
|||||||
|
750,000
|
3.125%, 01/06/2025
|
723,656
|
|||||
|
1,475,000
|
4.000%, 07/06/2026
|
1,388,186
|
|||||
|
Synchrony Financial
|
|||||||
|
3,000,000
|
4.250%, 08/15/2024
|
2,968,174
|
|||||
|
3,750,000
|
4.875%, 06/13/2025
|
3,689,690
|
|||||
|
133,934,928
|
|||||||
|
Diversified Media: 0.3%
|
|||||||
|
Prosus NV
|
|||||||
|
3,600,000
|
3.257%, 01/19/2027
|
3,326,796
|
|||||
|
Energy: 2.0%
|
|||||||
|
Blue Racer Midstream LLC /
|
|||||||
|
Blue Racer Finance Corp
|
|||||||
|
2,100,000
|
7.625%, 12/15/2025 1
|
2,129,511
|
|||||
|
CrownRock LP / CrownRock Finance Inc
|
|||||||
|
2,170,000
|
5.625%, 10/15/2025 1
|
2,168,470
|
|||||
|
Energy Transfer LP
|
|||||||
|
|
1,000,000
|
4.250%, 04/01/2024
|
|
996,352
|
|||
|
MPLX LP
|
|||||||
|
2,308,000
|
4.875%, 12/01/2024
|
2,296,018
|
|||||
|
ONEOK Inc
|
|||||||
|
775,000
|
5.550%, 11/01/2026
|
788,993
|
|||||
|
Plains All American Pipeline LP /
|
|||||||
|
PAA Finance Corp
|
|||||||
|
2,176,000
|
4.650%, 10/15/2025
|
2,153,602
|
|||||
|
Sabine Pass Liquefaction LLC
|
|||||||
|
126,000
|
5.750%, 05/15/2024
|
125,961
|
|||||
|
3,000,000
|
5.625%, 03/01/2025
|
3,008,056
|
|||||
|
USA Compression Partners LP /
|
|||||||
|
USA Compression Finance Corp
|
|||||||
|
1,180,000
|
6.875%, 09/01/2027
|
1,167,515
|
|||||
|
Williams Cos Inc
|
|||||||
|
3,000,000
|
4.550%, 06/24/2024
|
2,984,412
|
|||||
|
1,375,000
|
5.400%, 03/02/2026
|
1,389,822
|
|||||
|
19,208,712
|
|||||||
|
Food & Drug Retail: 0.2%
|
|||||||
|
Bellis Acquisition Co PLC
|
|||||||
|
575,000
|
3.250%, 02/16/2026
|
681,952
|
|||||
|
Roadster Finance DAC
|
|||||||
|
800,000
|
1.625%, 12/09/2024
|
858,291
|
|||||
|
1,540,243
|
|||||||
|
Food/Beverage/Tobacco: 2.8%
|
|||||||
|
Bacardi Ltd / Bacardi-Martini BV
|
|||||||
|
500,000
|
5.250%, 01/15/2029 1
|
500,269
|
|||||
|
Bright Food Singapore Holdings Pte Ltd
|
|||||||
|
200,000
|
1.375%, 06/19/2024
|
217,558
|
|||||
|
4,150,000
|
1.750%, 07/22/2025
|
4,343,962
|
|||||
|
Campbell Soup Co
|
|||||||
|
3,500,000
|
3.950%, 03/15/2025
|
3,448,539
|
|||||
|
Coca-Cola Europacific Partners PLC
|
|||||||
|
1,600,000
|
1.500%, 01/15/2027 1
|
1,445,755
|
|||||
|
Coca-Cola Icecek AS
|
|||||||
|
900,000
|
4.215%, 09/19/2024
|
889,299
|
|||||
|
Conagra Brands Inc
|
|||||||
|
1,425,000
|
5.300%, 10/01/2026
|
1,443,785
|
|||||
|
Constellation Brands Inc
|
|||||||
|
225,000
|
3.600%, 05/09/2024
|
223,373
|
|||||
|
175,000
|
4.350%, 05/09/2027
|
173,734
|
|||||
|
Kraft Heinz Foods Co
|
|||||||
|
2,250,000
|
3.000%, 06/01/2026
|
2,163,542
|
|||||
|
Louis Dreyfus Co Finance BV
|
|||||||
|
1,825,000
|
2.375%, 11/27/2025
|
1,968,832
|
|||||
|
Mondelez International
|
|||||||
|
Holdings Netherlands BV
|
|||||||
|
1,500,000
|
0.750%, 09/24/2024 1
|
1,446,684
|
|||||
|
Sigma Alimentos SA de CV
|
|||||||
|
2,150,000
|
2.625%, 02/07/2024
|
2,368,695
|
|||||
The accompanying notes are an integral part of these financial statements.
34
Low Duration Fund
|
SCHEDULE OF INVESTMENTS at December 31, 2023 (Continued)
|
|
Principal
|
|||||||
|
Amount†
|
Value
|
||||||
|
CORPORATE BONDS: 88.7% (Continued)
|
|||||||
|
Food/Beverage/Tobacco: 2.8% (Continued)
|
|||||||
|
Sysco Corp
|
|||||||
|
$
|
2,700,000
|
3.300%, 07/15/2026
|
$
|
2,608,831
|
|||
|
Viterra Finance BV
|
|||||||
|
4,075,000
|
0.375%, 09/24/2025
|
4,251,048
|
|||||
|
27,493,906
|
|||||||
|
Gaming: 0.8%
|
|||||||
|
Caesars Entertainment Inc
|
|||||||
|
1,000,000
|
6.250%, 07/01/2025 1
|
1,003,549
|
|||||
|
International Game Technology PLC
|
|||||||
|
2,400,000
|
3.500%, 06/15/2026
|
2,639,012
|
|||||
|
MGM Resorts International
|
|||||||
|
1,250,000
|
6.750%, 05/01/2025
|
1,254,776
|
|||||
|
Playtech PLC
|
|||||||
|
3,000,000
|
4.250%, 03/07/2026
|
3,251,879
|
|||||
|
8,149,216
|
|||||||
|
Healthcare: 4.0%
|
|||||||
|
Amgen Inc
|
|||||||
|
800,000
|
1.900%, 02/21/2025
|
772,846
|
|||||
|
500,000
|
5.250%, 03/02/2025
|
501,405
|
|||||
|
500,000
|
5.507%, 03/02/2026
|
500,257
|
|||||
|
Baxter International Inc
|
|||||||
|
1,250,000
|
1.322%, 11/29/2024
|
1,204,181
|
|||||
|
Cheplapharm Arzneimittel GmbH
|
|||||||
|
2,800,000
|
4.375%, 01/15/2028
|
3,021,799
|
|||||
|
CVS Health Corp
|
|||||||
|
1,250,000
|
5.000%, 01/30/2029
|
1,274,502
|
|||||
|
Ephios Subco 3 SARL
|
|||||||
|
1,075,000
|
7.875%, 01/31/2031
|
1,230,404
|
|||||
|
GE HealthCare Technologies Inc
|
|||||||
|
2,500,000
|
5.550%, 11/15/2024
|
2,501,841
|
|||||
|
GN Store Nord AS
|
|||||||
|
2,070,000
|
0.875%, 11/25/2024
|
2,190,431
|
|||||
|
Grifols SA
|
|||||||
|
2,000,000
|
1.625%, 02/15/2025
|
2,164,744
|
|||||
|
Gruenenthal GmbH
|
|||||||
|
2,900,000
|
3.625%, 11/15/2026
|
3,167,833
|
|||||
|
HCA Inc
|
|||||||
|
1,900,000
|
5.375%, 02/01/2025
|
1,898,406
|
|||||
|
2,980,000
|
5.875%, 02/15/2026
|
3,007,269
|
|||||
|
2,104,000
|
5.200%, 06/01/2028
|
2,128,770
|
|||||
|
IQVIA Inc
|
|||||||
|
1,675,000
|
5.700%, 05/15/2028 1
|
1,702,597
|
|||||
|
5,000,000
|
6.250%, 02/01/2029 1
|
5,230,495
|
|||||
|
MPT Operating Partnership LP /
|
|||||||
|
MPT Finance Corp
|
|||||||
|
2,300,000
|
3.325%, 03/24/2025
|
2,302,450
|
|||||
|
1,300,000
|
2.500%, 03/24/2026
|
1,351,385
|
|||||
|
Pfizer Investment Enterprises Pte Ltd
|
|||||||
|
350,000
|
4.450%, 05/19/2026
|
349,243
|
|||||
|
Phoenix PIB Dutch Finance BV
|
|||||||
|
400,000
|
2.375%, 08/05/2025
|
431,368
|
|||||
|
Tenet Healthcare Corp
|
|||||||
|
|
3,000,000
|
4.875%, 01/01/2026
|
|
2,968,957
|
|||
|
39,901,183
|
|||||||
|
Homebuilders/Real Estate: 8.4%
|
|||||||
|
Akelius Residential Property AB
|
|||||||
|
4,300,000
|
1.125%, 03/14/2024
|
4,719,087
|
|||||
|
Aldar Sukuk Ltd
|
|||||||
|
1,200,000
|
4.750%, 09/29/2025
|
1,190,998
|
|||||
|
American Tower Corp
|
|||||||
|
1,000,000
|
0.450%, 01/15/2027
|
1,010,705
|
|||||
|
2,200,000
|
5.250%, 07/15/2028
|
2,238,613
|
|||||
|
Aroundtown SA
|
|||||||
|
1,400,000
|
0.625%, 07/09/2025
|
1,435,512
|
|||||
|
Assemblin Group AB
|
|||||||
|
1,900,000
|
8.964% (3 Month EURIBOR +
|
||||||
|
5.000%), 07/05/2029 2
|
2,133,955
|
||||||
|
Balder Finland Oyj
|
|||||||
|
3,380,000
|
1.000%, 01/18/2027
|
3,166,366
|
|||||
|
Blackstone Property Partners
|
|||||||
|
Europe Holdings SARL
|
|||||||
|
3,600,000
|
2.000%, 02/15/2024
|
3,961,351
|
|||||
|
CTP NV
|
|||||||
|
2,700,000
|
0.500%, 06/21/2025
|
2,810,776
|
|||||
|
DIC Asset AG
|
|||||||
|
600,000
|
2.250%, 09/22/2026
|
227,463
|
|||||
|
Digital Dutch Finco BV
|
|||||||
|
2,100,000
|
0.625%, 07/15/2025
|
2,197,730
|
|||||
|
Fastighets AB Balder
|
|||||||
|
1,350,000
|
1.875%, 03/14/2025
|
1,425,409
|
|||||
|
1,100,000
|
1.875%, 01/23/2026
|
1,109,322
|
|||||
|
Globalworth Real Estate Investments Ltd
|
|||||||
|
1,100,000
|
3.000%, 03/29/2025
|
1,112,398
|
|||||
|
GLP Capital LP / GLP Financing II Inc
|
|||||||
|
1,410,000
|
3.350%, 09/01/2024
|
1,392,580
|
|||||
|
5,500,000
|
5.250%, 06/01/2025
|
5,480,418
|
|||||
|
Hammerson PLC
|
|||||||
|
1,434,000
|
3.500%, 10/27/2025
|
1,764,370
|
|||||
|
2,100,000
|
6.000%, 02/23/2026
|
2,671,301
|
|||||
|
Heimstaden Bostad Treasury BV
|
|||||||
|
1,075,000
|
4.235% (3 Month EURIBOR +
|
||||||
|
.550%), 01/19/2024 2
|
1,185,824
|
||||||
|
2,800,000
|
0.250%, 10/13/2024
|
2,916,628
|
|||||
|
Ladder Capital Finance Holdings
|
|||||||
|
LLLP / Ladder Capital Finance Corp
|
|||||||
|
3,130,000
|
5.250%, 10/01/2025 1
|
3,090,513
|
|||||
|
Logicor Financing SARL
|
|||||||
|
4,500,000
|
0.750%, 07/15/2024
|
4,853,136
|
|||||
|
MasTec Inc
|
|||||||
|
1,180,000
|
4.500%, 08/15/2028 1
|
1,110,502
|
|||||
|
NE Property BV
|
|||||||
|
2,700,000
|
1.750%, 11/23/2024
|
2,887,415
|
|||||
|
1,400,000
|
1.875%, 10/09/2026
|
1,415,076
|
|||||
The accompanying notes are an integral part of these financial statements.
35
Low Duration Fund
|
SCHEDULE OF INVESTMENTS at December 31, 2023 (Continued)
|
|
Principal
|
|||||||
|
Amount†
|
Value
|
||||||
|
CORPORATE BONDS: 88.7% (Continued)
|
|||||||
|
Homebuilders/Real Estate: 8.4% (Continued)
|
|||||||
|
P3 Group SARL
|
|||||||
|
$
|
1,000,000
|
0.875%, 01/26/2026
|
$
|
1,031,856
|
|||
|
Tritax EuroBox PLC
|
|||||||
|
600,000
|
0.950%, 06/02/2026
|
603,277
|
|||||
|
Trust Fibra Uno
|
|||||||
|
350,000
|
5.250%, 12/15/2024
|
346,531
|
|||||
|
4,550,000
|
5.250%, 01/30/2026
|
4,457,449
|
|||||
|
VICI Properties LP / VICI Note Co Inc
|
|||||||
|
6,200,000
|
5.625%, 05/01/2024
|
6,182,494
|
|||||
|
2,800,000
|
4.500%, 09/01/2026
|
2,712,293
|
|||||
|
210,000
|
4.250%, 12/01/2026
|
202,310
|
|||||
|
WEA Finance LLC / Westfield
|
|||||||
|
UK & Europe Finance PLC
|
|||||||
|
1,300,000
|
3.750%, 09/17/2024 1
|
1,276,964
|
|||||
|
Webuild SPA
|
|||||||
|
2,425,000
|
5.875%, 12/15/2025
|
2,735,704
|
|||||
|
200,000
|
3.875%, 07/28/2026
|
217,445
|
|||||
|
1,300,000
|
7.000%, 09/27/2028
|
1,509,480
|
|||||
|
Weyerhaeuser Co
|
|||||||
|
4,325,000
|
4.750%, 05/15/2026
|
4,308,475
|
|||||
|
83,091,726
|
|||||||
|
Hotels: 1.7%
|
|||||||
|
Hyatt Hotels Corp
|
|||||||
|
3,985,000
|
1.800%, 10/01/2024
|
3,868,010
|
|||||
|
2,550,000
|
5.375%, 04/23/2025
|
2,555,333
|
|||||
|
1,750,000
|
5.750%, 01/30/2027
|
1,789,110
|
|||||
|
Marriott International Inc
|
|||||||
|
1,975,000
|
3.600%, 04/15/2024
|
1,965,383
|
|||||
|
900,000
|
5.450%, 09/15/2026
|
916,334
|
|||||
|
725,000
|
4.900%, 04/15/2029
|
730,887
|
|||||
|
Pterosaur Capital Co Ltd
|
|||||||
|
2,000,000
|
1.000%, 09/25/2024
|
2,119,580
|
|||||
|
Whitbread Group PLC
|
|||||||
|
2,000,000
|
3.375%, 10/16/2025
|
2,468,593
|
|||||
|
16,413,230
|
|||||||
|
Insurance: 0.4%
|
|||||||
|
Athora Holding Ltd
|
|||||||
|
1,900,000
|
6.625%, 06/16/2028
|
2,170,546
|
|||||
|
Galaxy Bidco Ltd
|
|||||||
|
900,000
|
6.500%, 07/31/2026
|
1,113,342
|
|||||
|
Rothesay Life PLC
|
|||||||
|
450,000
|
8.000%, 10/30/2025
|
591,785
|
|||||
|
3,875,673
|
|||||||
|
Leisure: 0.4%
|
|||||||
|
CPUK Finance Ltd
|
|||||||
|
375,000
|
3.588%, 08/28/2025
|
462,715
|
|||||
|
510,000
|
6.500%, 08/28/2026
|
630,063
|
|||||
|
Expedia Group Inc
|
|||||||
|
1,500,000
|
6.250%, 05/01/2025 1
|
1,515,519
|
|||||
|
1,225,000
|
5.000%, 02/15/2026
|
1,224,718
|
|||||
|
3,833,015
|
|||||||
|
Metals/Mining: 0.8%
|
|||||||
|
Gold Fields Orogen Holdings BVI Ltd
|
|||||||
|
|
4,400,000
|
5.125%, 05/15/2024
|
|
4,375,889
|
|||
|
Novelis Corp
|
|||||||
|
3,000,000
|
3.250%, 11/15/2026 1
|
2,825,917
|
|||||
|
7,201,806
|
|||||||
|
Paper: 0.5%
|
|||||||
|
Suzano Austria GmbH
|
|||||||
|
2,100,000
|
6.000%, 01/15/2029
|
2,148,489
|
|||||
|
SUZANO INTL FIN B V
|
|||||||
|
SR GLBL NT5.5% 27
|
|||||||
|
2,400,000
|
5.500%, 01/17/2027
|
2,431,800
|
|||||
|
4,580,289
|
|||||||
|
Publishing/Printing: 0.3%
|
|||||||
|
Informa PLC
|
|||||||
|
2,800,000
|
2.125%, 10/06/2025
|
3,007,070
|
|||||
|
Railroads: 0.5%
|
|||||||
|
Canadian Pacific Railway Co
|
|||||||
|
2,000,000
|
1.350%, 12/02/2024
|
1,927,313
|
|||||
|
Getlink SE
|
|||||||
|
2,725,000
|
3.500%, 10/30/2025
|
2,984,935
|
|||||
|
4,912,248
|
|||||||
|
Services: 2.9%
|
|||||||
|
Almaviva-The Italian Innovation Co SPA
|
|||||||
|
2,400,000
|
4.875%, 10/30/2026
|
2,623,109
|
|||||
|
Aramark International Finance SARL
|
|||||||
|
1,500,000
|
3.125%, 04/01/2025
|
1,652,249
|
|||||
|
Arena Luxembourg Finance SARL
|
|||||||
|
2,000,000
|
1.875%, 02/01/2028
|
1,979,802
|
|||||
|
Arrow Electronics Inc
|
|||||||
|
1,055,000
|
6.125%, 03/01/2026
|
1,056,369
|
|||||
|
Brink’s Co
|
|||||||
|
3,200,000
|
5.500%, 07/15/2025
|
3,187,346
|
|||||
|
Kapla Holding SAS
|
|||||||
|
1,800,000
|
9.465% (3 Month EURIBOR +
|
||||||
|
5.500%), 07/15/2027 2
|
2,029,580
|
||||||
|
Leasys SPA
|
|||||||
|
5,925,000
|
4.375%, 12/07/2024
|
6,555,364
|
|||||
|
3,330,000
|
4.625%, 02/16/2027
|
3,774,029
|
|||||
|
Loxam SAS
|
|||||||
|
425,000
|
4.500%, 02/15/2027
|
469,844
|
|||||
|
1,050,000
|
6.375%, 05/31/2029
|
1,203,737
|
|||||
|
PeopleCert Wisdom Issuer PLC
|
|||||||
|
1,500,000
|
5.750%, 09/15/2026
|
1,645,821
|
|||||
|
Techem Verwaltungsgesellschaft
|
|||||||
|
675 mbH
|
|||||||
|
1,500,000
|
2.000%, 07/15/2025
|
1,623,949
|
|||||
|
Zenith Finco PLC
|
|||||||
|
450,000
|
6.500%, 06/30/2027
|
468,192
|
|||||
|
28,269,391
|
|||||||
The accompanying notes are an integral part of these financial statements.
36
Low Duration Fund
|
SCHEDULE OF INVESTMENTS at December 31, 2023 (Continued)
|
|
Principal
|
|||||||
|
Amount†
|
Value
|
||||||
|
CORPORATE BONDS: 88.7% (Continued)
|
|||||||
|
Steel: 0.5%
|
|||||||
|
ArcelorMittal SA
|
|||||||
|
$
|
2,550,000
|
4.875%, 09/26/2026
|
$
|
2,907,063
|
|||
|
thyssenkrupp AG
|
|||||||
|
2,100,000
|
2.875%, 02/22/2024
|
2,310,712
|
|||||
|
5,217,775
|
|||||||
|
Super Retail: 1.4%
|
|||||||
|
Alibaba Group Holding Ltd
|
|||||||
|
3,000,000
|
3.600%, 11/28/2024
|
2,943,811
|
|||||
|
B&M European Value Retail SA
|
|||||||
|
850,000
|
8.125%, 11/15/2030
|
1,156,449
|
|||||
|
Dufry One BV
|
|||||||
|
3,000,000
|
2.000%, 02/15/2027
|
3,106,512
|
|||||
|
John Lewis PLC
|
|||||||
|
1,550,000
|
6.125%, 01/21/2025
|
1,971,759
|
|||||
|
Tapestry Inc
|
|||||||
|
1,700,000
|
5.350%, 11/27/2025
|
1,916,066
|
|||||
|
1,000,000
|
7.050%, 11/27/2025
|
1,023,503
|
|||||
|
VF Corp
|
|||||||
|
2,500,000
|
2.400%, 04/23/2025
|
2,389,742
|
|||||
|
14,507,842
|
|||||||
|
Supranational: 0.5%
|
|||||||
|
Africa Finance Corp
|
|||||||
|
1,000,000
|
3.875%, 04/13/2024
|
993,143
|
|||||
|
Eastern & Southern African Trade
|
|||||||
|
& Development Bank
|
|||||||
|
4,200,000
|
4.875%, 05/23/2024
|
4,155,774
|
|||||
|
5,148,917
|
|||||||
|
Technology: 4.1%
|
|||||||
|
ams-OSRAM AG
|
|||||||
|
2,575,000
|
10.500%, 03/30/2029
|
3,092,217
|
|||||
|
Cellnex Finance Co SA
|
|||||||
|
3,800,000
|
2.250%, 04/12/2026
|
4,078,410
|
|||||
|
Clarios Global LP / Clarios US Finance Co
|
|||||||
|
1,500,000
|
4.375%, 05/15/2026
|
1,647,582
|
|||||
|
Competition Team Technologies Ltd
|
|||||||
|
3,000,000
|
3.750%, 03/12/2024
|
2,988,675
|
|||||
|
Dell International LLC / EMC Corp
|
|||||||
|
1,199,000
|
6.020%, 06/15/2026
|
1,227,715
|
|||||
|
Gen Digital Inc
|
|||||||
|
1,625,000
|
5.000%, 04/15/2025
|
1,610,204
|
|||||
|
Hewlett Packard Enterprise Co
|
|||||||
|
5,440,000
|
5.900%, 10/01/2024
|
5,456,997
|
|||||
|
IPD 3 BV
|
|||||||
|
1,100,000
|
8.000%, 06/15/2028
|
1,299,911
|
|||||
|
LG Energy Solution Ltd
|
|||||||
|
1,830,000
|
5.750%, 09/25/2028
|
1,887,602
|
|||||
|
Microchip Technology Inc
|
|||||||
|
1,350,000
|
0.972%, 02/15/2024
|
1,342,013
|
|||||
|
Oracle Corp
|
|||||||
|
2,000,000
|
2.950%, 05/15/2025
|
1,942,796
|
|||||
|
2,500,000
|
5.800%, 11/10/2025
|
2,540,382
|
|||||
|
Qorvo Inc
|
|||||||
|
1,450,000
|
1.750%, 12/15/2024
|
|
1,390,753
|
||||
|
SK Hynix Inc
|
|||||||
|
2,000,000
|
6.250%, 01/17/2026
|
2,022,060
|
|||||
|
2,000,000
|
6.375%, 01/17/2028
|
2,067,172
|
|||||
|
VMware Inc
|
|||||||
|
450,000
|
1.000%, 08/15/2024
|
437,211
|
|||||
|
1,800,000
|
4.500%, 05/15/2025
|
1,783,773
|
|||||
|
3,500,000
|
3.900%, 08/21/2027
|
3,392,047
|
|||||
|
40,207,520
|
|||||||
|
Telecommunications: 3.9%
|
|||||||
|
Altice Financing SA
|
|||||||
|
1,500,000
|
2.250%, 01/15/2025
|
1,612,553
|
|||||
|
AT&T Inc
|
|||||||
|
1,780,000
|
5.539%, 02/20/2026
|
1,780,476
|
|||||
|
Bharti Airtel International Netherlands BV
|
|||||||
|
2,206,000
|
5.350%, 05/20/2024
|
2,204,455
|
|||||
|
Bharti Airtel Ltd
|
|||||||
|
4,100,000
|
4.375%, 06/10/2025
|
4,044,751
|
|||||
|
eircom Finance DAC
|
|||||||
|
1,600,000
|
2.625%, 02/15/2027
|
1,666,263
|
|||||
|
Global Switch Holdings Ltd
|
|||||||
|
2,625,000
|
1.500%, 01/31/2024
|
2,890,943
|
|||||
|
iliad SA
|
|||||||
|
1,000,000
|
2.375%, 06/17/2026
|
1,059,072
|
|||||
|
Matterhorn Telecom SA
|
|||||||
|
1,600,000
|
3.125%, 09/15/2026
|
1,714,426
|
|||||
|
PLT VII Finance SARL
|
|||||||
|
475,000
|
4.625%, 01/05/2026
|
522,747
|
|||||
|
PPF Telecom Group BV
|
|||||||
|
5,100,000
|
2.125%, 01/31/2025
|
5,524,247
|
|||||
|
RCS & RDS SA
|
|||||||
|
2,400,000
|
3.250%, 02/05/2028
|
2,374,618
|
|||||
|
Rogers Communications Inc
|
|||||||
|
844,000
|
2.950%, 03/15/2025
|
819,509
|
|||||
|
Sprint Spectrum Co LLC / Sprint
|
|||||||
|
Spectrum Co II LLC /
|
|||||||
|
Sprint Spectrum Co III LLC
|
|||||||
|
179,688
|
4.738%, 03/20/2025 1
|
178,239
|
|||||
|
TDC Net A/S
|
|||||||
|
1,500,000
|
5.056%, 05/31/2028
|
1,724,187
|
|||||
|
Telecom Italia SPA
|
|||||||
|
1,430,000
|
5.303%, 05/30/2024 1
|
1,424,408
|
|||||
|
T-Mobile USA Inc
|
|||||||
|
3,000,000
|
3.500%, 04/15/2025
|
2,938,833
|
|||||
|
2,510,000
|
2.250%, 02/15/2026
|
2,380,021
|
|||||
|
Verizon Communications Inc
|
|||||||
|
2,600,000
|
4.125%, 03/16/2027
|
2,564,742
|
|||||
|
37,424,490
|
|||||||
|
Transportation Excluding Air/Rail: 2.2%
|
|||||||
|
DP World Ltd
|
|||||||
|
4,200,000
|
2.375%, 09/25/2026
|
4,462,125
|
|||||
The accompanying notes are an integral part of these financial statements.
37
Low Duration Fund
|
SCHEDULE OF INVESTMENTS at December 31, 2023 (Continued)
|
|
Principal
|
|||||||
|
Amount†
|
Value
|
||||||
|
CORPORATE BONDS: 88.7% (Continued)
|
|||||||
|
Transportation Excluding Air/Rail: 2.2% (Continued)
|
|||||||
|
Firstgroup PLC
|
|||||||
|
$
|
1,375,000
|
6.875%, 09/18/2024
|
$
|
1,763,501
|
|||
|
Gatwick Funding Ltd
|
|||||||
|
1,700,000
|
5.250%, 01/23/2024
|
2,166,141
|
|||||
|
200,000
|
6.125%, 03/02/2026
|
260,846
|
|||||
|
GXO Logistics Inc
|
|||||||
|
2,175,000
|
1.650%, 07/15/2026
|
1,962,714
|
|||||
|
Heathrow Funding Ltd
|
|||||||
|
1,125,000
|
7.125%, 02/14/2024
|
1,435,563
|
|||||
|
Mundys SPA
|
|||||||
|
4,000,000
|
1.875%, 07/13/2027
|
4,139,181
|
|||||
|
Pelabuhan Indonesia Persero PT
|
|||||||
|
200,000
|
4.250%, 05/05/2025
|
196,333
|
|||||
|
Penske Truck Leasing Co Lp /
|
|||||||
|
PTL Finance Corp
|
|||||||
|
775,000
|
5.550%, 05/01/2028 1
|
788,222
|
|||||
|
Q-Park Holding I BV
|
|||||||
|
1,500,000
|
1.500%, 03/01/2025
|
1,626,463
|
|||||
|
1,800,000
|
2.000%, 03/01/2027
|
1,842,057
|
|||||
|
Stagecoach Group Ltd
|
|||||||
|
650,000
|
4.000%, 09/29/2025
|
802,563
|
|||||
|
21,445,709
|
|||||||
|
Utilities: 1.1%
|
|||||||
|
Adani Green Energy Up
|
|||||||
|
950,000
|
6.250%, 12/10/2024
|
939,927
|
|||||
|
Drax Finco PLC
|
|||||||
|
4,000,000
|
2.625%, 11/01/2025
|
4,283,604
|
|||||
|
EEW Energy from Waste GmbH
|
|||||||
|
1,100,000
|
0.361%, 06/30/2026
|
1,110,081
|
|||||
|
Tabreed Sukuk Spc Ltd
|
|||||||
|
750,000
|
5.500%, 10/31/2025
|
751,998
|
|||||
|
Vena Energy Capital Pte Ltd
|
|||||||
|
3,300,000
|
3.133%, 02/26/2025
|
3,200,815
|
|||||
|
10,286,425
|
|||||||
|
TOTAL CORPORATE BONDS
|
|||||||
|
(Cost $856,938,760)
|
871,551,212
|
||||||
|
FOREIGN GOVERNMENT NOTE/BOND: 8.7%
|
|||||||
|
Airlines: 0.5%
|
|||||||
|
Air France-KLM
|
|||||||
|
2,000,000
|
7.250%, 05/31/2026
|
2,360,682
|
|||||
|
2,600,000
|
3.875%, 07/01/2026
|
2,852,210
|
|||||
|
5,212,892
|
|||||||
|
Automotive & Auto Parts: 1.3%
|
|||||||
|
RCI Banque SA
|
|||||||
|
4,500,000
|
4.625%, 07/13/2026
|
5,083,518
|
|||||
|
1,675,000
|
4.625%, 10/02/2026
|
1,897,975
|
|||||
|
Schaeffler AG
|
|||||||
|
1,100,000
|
2.750%, 10/12/2025
|
1,193,844
|
|||||
|
Valeo SE
|
|||||||
|
|
700,000
|
1.500%, 06/18/2025
|
|
747,881
|
|||
|
3,600,000
|
5.375%, 05/28/2027
|
4,134,710
|
|||||
|
13,057,928
|
|||||||
|
Banking: 4.2%
|
|||||||
|
Abanca Corp Bancaria SA
|
|||||||
|
2,500,000
|
5.500% (1 Year EUR Swap
|
||||||
|
Rate + 2.250%), 05/18/2026 2
|
2,806,189
|
||||||
|
500,000
|
4.625% (5 Year Swap Rate
|
||||||
|
EUR + 5.014%), 04/07/2030 2
|
544,345
|
||||||
|
2,100,000
|
8.375% (5 Year Swap Rate
|
||||||
|
EUR + 5.245%), 09/23/2033 2
|
2,502,942
|
||||||
|
Argenta Spaarbank NV
|
|||||||
|
2,600,000
|
5.375% (1 Year EUR Swap
|
||||||
|
Rate + 2.750%), 11/29/2027 2
|
2,971,926
|
||||||
|
Banco Comercial Portugues SA
|
|||||||
|
600,000
|
3.871% (5 Year Swap Rate
|
||||||
|
EUR + 4.231%), 03/27/2030 2
|
644,236
|
||||||
|
BNP Paribas SA
|
|||||||
|
1,600,000
|
2.375% (5 Year Swap Rate
|
||||||
|
EUR + 1.850%), 11/20/2030 2
|
1,717,207
|
||||||
|
Commerzbank AG
|
|||||||
|
5,600,000
|
4.000% (5 Year Swap Rate
|
||||||
|
EUR + 4.350%), 12/05/2030 2
|
6,082,217
|
||||||
|
Credit Agricole SA
|
|||||||
|
2,300,000
|
1.625% (5 Year Swap Rate
|
||||||
|
EUR + 1.900%), 06/05/2030 2
|
2,455,513
|
||||||
|
Hamburg Commercial Bank AG
|
|||||||
|
3,600,000
|
6.250%, 11/18/2024
|
3,985,948
|
|||||
|
2,300,000
|
0.500% (3 Month
|
||||||
|
EURIBOR + .900%), 09/22/2026 2
|
2,341,553
|
||||||
|
KBC Group NV
|
|||||||
|
200,000
|
4.375% (3 Month
|
||||||
|
EURIBOR + 1.700%), 11/23/2027 2
|
226,213
|
||||||
|
La Banque Postale SA
|
|||||||
|
3,100,000
|
0.875% (5 Year Swap Rate
|
||||||
|
EUR + 1.380%), 01/26/2031 2
|
3,197,642
|
||||||
|
Societe Generale SA
|
|||||||
|
8,500,000
|
1.000% (5 Year Swap Rate
|
||||||
|
EUR + 1.550%), 11/24/2030 2
|
8,808,846
|
||||||
|
2,200,000
|
1.125% (5 Year Swap Rate
|
||||||
|
EUR + 1.600%), 06/30/2031 2
|
2,235,563
|
||||||
|
Tatra Banka as
|
|||||||
|
900,000
|
5.952% (3 Month EURIBOR +
|
||||||
|
2.650%), 02/17/2026 2
|
1,009,265
|
||||||
|
41,529,605
|
|||||||
|
Capital Goods: 0.3%
|
|||||||
|
Traton Finance Luxembourg SA
|
|||||||
|
2,200,000
|
4.125%, 01/18/2025
|
2,437,834
|
|||||
|
Containers: 0.2%
|
|||||||
|
ProGroup AG
|
|||||||
|
2,000,000
|
3.000%, 03/31/2026
|
2,152,698
|
|||||
The accompanying notes are an integral part of these financial statements.
38
Low Duration Fund
|
SCHEDULE OF INVESTMENTS at December 31, 2023 (Continued)
|
|
Principal
|
|||||||
|
Amount†
|
Value
|
||||||
|
FOREIGN GOVERNMENT NOTE/BOND: 8.7% (Continued)
|
|||||||
|
Diversified Financial Services: 0.8%
|
|||||||
|
Aareal Bank AG
|
|||||||
|
$
|
2,100,000
|
4.500%, 07/25/2025
|
$
|
2,326,822
|
|||
|
ALD SA
|
|||||||
|
3,700,000
|
4.612% (3 Month
|
||||||
|
EURIBOR + .650%), 10/06/2025 2
|
4,093,736
|
||||||
|
Arval Service Lease SA
|
|||||||
|
700,000
|
4.625%, 12/02/2024
|
776,888
|
|||||
|
7,197,446
|
|||||||
|
Homebuilders/Real Estate: 0.5%
|
|||||||
|
HOWOGE
|
|||||||
|
Wohnungsbaugesellschaft mbH
|
|||||||
|
4,500,000
|
0.000%, 11/01/2024
|
4,800,818
|
|||||
|
Hotels: 0.3%
|
|||||||
|
Accor SA
|
|||||||
|
2,900,000
|
3.000%, 02/04/2026
|
3,085,188
|
|||||
|
Technology: 0.2%
|
|||||||
|
Teleperformance SE
|
|||||||
|
1,600,000
|
5.250%, 11/22/2028
|
1,849,452
|
|||||
|
Telecommunications: 0.4%
|
|||||||
|
iliad SA
|
|||||||
|
2,200,000
|
5.375%, 06/14/2027
|
2,500,533
|
|||||
|
1,200,000
|
5.375%, 02/15/2029
|
1,362,489
|
|||||
|
TOTAL FOREIGN GOVERNMENT NOTE/BOND
|
|||||||
|
(Cost $80,505,983)
|
85,186,883
|
||||||
|
CONVERTIBLE BONDS: 2.1%
|
|||||||
|
Banking: 0.8%
|
|||||||
|
ABN AMRO Bank NV
|
|||||||
|
500,000
|
4.750%, 07/28/2025
|
490,480
|
|||||
|
Alpha Bank SA
|
|||||||
|
3,050,000
|
7.500% (1 Year EUR Swap
|
||||||
|
Rate + 5.084%), 06/16/2027 2
|
3,576,982
|
||||||
|
Australia & New Zealand
|
|||||||
|
Banking Group Ltd
|
|||||||
|
800,000
|
1.125% (5 Year Swap Rate
|
||||||
|
EUR + 1.400%), 11/21/2029 2
|
853,275
|
||||||
|
ING Groep NV
|
|||||||
|
700,000
|
2.125% (5 Year Swap Rate
|
||||||
|
EUR + 2.400%), 05/26/2031 2
|
738,024
|
||||||
|
National Australia Bank Ltd
|
|||||||
|
500,000
|
1.699% (UK Government Bonds
|
||||||
|
5 Year Note Generic Bid
|
|||||||
|
Yield + 1.400%), 09/15/2031 2
|
568,847
|
||||||
|
Standard Chartered PLC
|
|||||||
|
2,310,000
|
5.200%, 01/26/2024
|
2,307,559
|
|||||
|
8,535,167
|
|||||||
|
Diversified Financial Services: 0.9%
|
|||||||
|
UBS AG
|
|||||||
|
|
8,475,000
|
5.125%, 05/15/2024
|
8,415,599
|
||||
|
Healthcare: 0.4%
|
|||||||
|
Organon & Co / Organon Foreign
|
|||||||
|
Debt Co-Issuer BV
|
|||||||
|
4,000,000
|
2.875%, 04/30/2028
|
4,067,354
|
|||||
|
TOTAL CONVERTIBLE BONDS
|
|||||||
|
(Cost $20,762,061)
|
21,018,120
|
||||||
|
FOREIGN GOVERNMENT AGENCY ISSUE: 1.0%
|
|||||||
|
Agency: 0.5%
|
|||||||
|
Airport Authority
|
|||||||
|
2,000,000
|
4.875%, 01/12/2026
|
2,010,140
|
|||||
|
Indian Railway Finance Corp Ltd
|
|||||||
|
2,750,000
|
3.730%, 03/29/2024
|
2,738,120
|
|||||
|
4,748,260
|
|||||||
|
Transportation Excluding Air/Rail: 0.5%
|
|||||||
|
Pelabuhan Indonesia Persero PT
|
|||||||
|
5,100,000
|
4.875%, 10/01/2024
|
5,065,422
|
|||||
|
TOTAL FOREIGN GOVERNMENT AGENCY ISSUE
|
|||||||
|
(Cost $9,819,353)
|
9,813,682
|
||||||
|
Shares
|
|||||||
|
SHORT-TERM INVESTMENTS: 0.4%
|
|||||||
|
Money Market Funds: 0.4%
|
|||||||
|
3,816,132
|
First American Treasury Obligations
|
||||||
|
Fund – Class X, 5.285% 3
|
3,816,132
|
||||||
|
TOTAL SHORT-TERM INVESTMENTS
|
|||||||
|
(Cost $3,816,132)
|
3,816,132
|
||||||
|
TOTAL INVESTMENTS IN SECURITIES: 100.9%
|
|||||||
|
(Cost $971,842,289)
|
991,386,029
|
||||||
|
Liabilities in Excess of Other Assets: (0.9)%
|
(8,531,348
|
)
|
|||||
|
TOTAL NET ASSETS: 100.0%
|
$
|
982,854,681
|
|||||
PIK – Payment In Kind - represents the security may pay interest in additional par
|
†
|
In USD unless otherwise indicated.
|
|
1
|
Security exempt from registration under Rule 144A of the Securities Act of 1933. These securities may be resold in transactions exempt from registration to qualified institutional buyers. These securities are
determined to be liquid by the Adviser, unless otherwise noted, under procedures established by the Trust’s Board of Trustees.
|
|
2
|
Variable rate security; rate shown is the rate in effect on December 31, 2023. An index may have a negative rate. Interest rate may also be subject to a cap or floor.
|
|
3
|
Annualized seven-day effective yield as of December 31, 2023.
|
The accompanying notes are an integral part of these financial statements.
39
Low Duration Fund
|
SCHEDULE OF FORWARD FOREIGN CURRENCY EXCHANGE CONTRACTS at December 31, 2023
|
The Muzinich Low Duration Fund had the following forward foreign currency exchange contracts outstanding with the U.S. Bancorp Investments, Inc.
U.S. Dollar Value at
|
U.S. Dollar Value at
|
Unrealized Appreciation
|
||||||||||||||||||
|
Settlement Date
|
Currency to be Delivered
|
December 31, 2023
|
Currency to be Received
|
December 31, 2023
|
(Depreciation)
|
|||||||||||||||
|
1/17/2024
|
EUR |
33,000,000
|
$
|
36,459,666
|
USD |
35,073,989
|
$
|
35,073,989
|
$
|
1,385,667
|
||||||||||
|
1/17/2024
|
EUR |
242,500,000
|
(267,923,300
|
)
|
USD |
(256,279,570)
|
(256,279,570
|
)
|
(11,643,730
|
)
|
||||||||||
|
3/19/2024
|
EUR |
199,000,000
|
(220,407,643
|
)
|
USD |
(215,519,985)
|
(215,519,985
|
)
|
(4,887,658
|
)
|
||||||||||
|
1/17/2024
|
GBP |
28,800,000
|
(36,713,968
|
)
|
USD |
(35,270,765)
|
(35,270,765
|
)
|
(1,443,203
|
)
|
||||||||||
|
$
|
(488,585,245
|
)
|
$
|
(471,996,331
|
)
|
$
|
(16,588,914
|
)
|
||||||||||||
The accompanying notes are an integral part of these financial statements.
40
Muzinich Funds
|
STATEMENTS OF ASSETS AND LIABILITIES at December 31, 2023
|
|
|
Credit
|
Flexible U.S.
|
||||||||||
|
|
Opportunities
|
High Yield
|
Low
|
|||||||||
|
|
Fund
|
Income Fund
|
Duration Fund
|
|||||||||
|
ASSETS
|
||||||||||||
|
Investments in unaffiliated securities, at value
|
||||||||||||
|
(Cost $260,285,114, $49,380,084, and $971,842,289) (Note 2)
|
$
|
266,214,843
|
$
|
49,687,562
|
$
|
991,386,029
|
||||||
|
Deposits at broker
|
639,768
|
—
|
3,338,860
|
|||||||||
|
Cash
|
40,946
|
34,616
|
1,971
|
|||||||||
|
Foreign currency, at value
|
222,407
|
2,898
|
18,745,840
|
|||||||||
|
(Cost $219,360, $2,833, and $18,445,876)
|
||||||||||||
|
Receivables:
|
||||||||||||
|
Fund shares sold
|
1,233,811
|
—
|
1,578,124
|
|||||||||
|
Investment securities sold
|
1,378
|
282,729
|
—
|
|||||||||
|
Interest receivable
|
3,468,916
|
729,877
|
12,422,124
|
|||||||||
|
Unrealized appreciation on forward foreign currency exchange contracts
|
65,575
|
—
|
1,385,677
|
|||||||||
|
Unrealized appreciation on swap contracts
|
—
|
—
|
—
|
|||||||||
|
Upfront discount paid
|
—
|
—
|
—
|
|||||||||
|
Due from advisor, net
|
—
|
214
|
—
|
|||||||||
|
Prepaid expenses
|
28,881
|
9,282
|
25,515
|
|||||||||
|
Total assets
|
271,916,525
|
50,747,178
|
1,028,884,140
|
|||||||||
|
LIABILITIES
|
||||||||||||
|
Payables
|
||||||||||||
|
Investment securities purchased
|
1,819,475
|
3,024,578
|
—
|
|||||||||
|
Due to broker
|
—
|
—
|
—
|
|||||||||
|
Fund shares redeemed
|
949,567
|
—
|
27,526,783
|
|||||||||
|
Fund shares purchased
|
—
|
—
|
—
|
|||||||||
|
Distribution to shareholders
|
1,619,513
|
124,578
|
41,932
|
|||||||||
|
Unrealized depreciation on forward foreign currency exchange contracts
|
1,579,492
|
—
|
17,974,591
|
|||||||||
|
Unrealized depreciation on swap contracts
|
—
|
—
|
—
|
|||||||||
|
Investment advisory fees, net
|
135,614
|
—
|
316,799
|
|||||||||
|
Fund accounting fees
|
11,406
|
6,272
|
31,866
|
|||||||||
|
Administration fees
|
11,629
|
3,005
|
38,180
|
|||||||||
|
Transfer agent fees
|
4,678
|
701
|
14,840
|
|||||||||
|
Audit fees
|
26,889
|
25,260
|
25,259
|
|||||||||
|
Chief Compliance Officer fees
|
1,561
|
1,562
|
1,562
|
|||||||||
|
Custody fees
|
11,555
|
1,735
|
34,068
|
|||||||||
|
Trustee fees
|
3,955
|
2,729
|
6,066
|
|||||||||
|
Shareholder service fees - Institutional Class
|
10,344
|
400
|
—
|
|||||||||
|
Other accrued expenses
|
17,123
|
10,292
|
17,513
|
|||||||||
|
Total liabilities
|
6,202,801
|
3,201,112
|
46,029,459
|
|||||||||
|
NET ASSETS
|
$
|
265,713,724
|
$
|
47,546,066
|
$
|
982,854,681
|
||||||
|
COMPONENTS OF NET ASSETS
|
||||||||||||
|
Paid-in capital
|
$
|
290,844,990
|
$
|
50,606,159
|
$
|
1,011,082,342
|
||||||
|
Total distributable (accumulated) earnings (losses)
|
(25,131,266
|
)
|
(3,060,093
|
)
|
(28,227,661
|
)
|
||||||
|
Net assets
|
$
|
265,713,724
|
$
|
47,546,066
|
$
|
982,854,681
|
||||||
|
COMPONENTS OF NET ASSET VALUE (UNLIMITED SHARES AUTHORIZED)
|
||||||||||||
|
Supra Institutional Class:
|
||||||||||||
|
Net assets
|
$
|
172,046,177
|
$
|
44,890,794
|
$
|
982,854,681
|
||||||
|
Shares of beneficial interest issued and outstanding
|
17,548,624
|
5,671,642
|
105,943,532
|
|||||||||
|
Net asset value, offering and redemption price per share
|
$
|
9.80
|
$
|
7.91
|
$
|
9.28
|
||||||
|
Institutional Class:
|
||||||||||||
|
Net assets
|
$
|
93,667,547
|
$
|
2,655,272
|
$
|
—
|
||||||
|
Shares of beneficial interest issued and outstanding
|
9,558,903
|
335,523
|
—
|
|||||||||
|
Net asset value, offering and redemption price per share
|
$
|
9.80
|
$
|
7.91
|
$
|
—
|
||||||
The accompanying notes are an integral part of these financial statements.
41
Muzinich Funds
|
STATEMENTS OF OPERATIONS For the Year Ended December 31, 2023
|
|
|
Credit
|
Flexible U.S.
|
||||||||||
|
|
Opportunities
|
High Yield
|
Low
|
|||||||||
|
|
Fund
|
Income Fund
|
Duration Fund
|
|||||||||
|
INVESTMENT INCOME
|
||||||||||||
|
Interest
|
$
|
12,767,007
|
$
|
2,607,324
|
$
|
48,492,778
|
||||||
|
Consent income
|
45,814
|
325
|
9,664
|
|||||||||
|
Other income
|
1,597
|
605
|
8,963
|
|||||||||
|
Total investment income
|
12,814,418
|
2,608,254
|
48,511,405
|
|||||||||
|
EXPENSES
|
||||||||||||
|
Investment advisory fees
|
1,718,171
|
198,552
|
4,655,683
|
|||||||||
|
Administration fees
|
110,466
|
29,519
|
397,036
|
|||||||||
|
Fund accounting fees
|
106,768
|
61,670
|
322,646
|
|||||||||
|
Custody fees
|
69,439
|
31,888
|
191,682
|
|||||||||
|
Shareholder service fees – Institutional Class
|
69,364
|
—
|
—
|
|||||||||
|
Registration fees
|
40,175
|
35,437
|
95,164
|
|||||||||
|
Transfer agent fees
|
37,537
|
6,200
|
150,770
|
|||||||||
|
Miscellaneous expenses
|
35,990
|
16,308
|
94,887
|
|||||||||
|
Audit fees
|
28,534
|
26,784
|
26,785
|
|||||||||
|
Trustees fees
|
17,757
|
16,681
|
38,178
|
|||||||||
|
Chief Compliance Officer fees
|
15,918
|
15,926
|
15,910
|
|||||||||
|
Legal fees
|
11,966
|
11,185
|
11,159
|
|||||||||
|
Broker interest expense
|
5,813
|
—
|
3,259
|
|||||||||
|
Insurance expense
|
7,220
|
5,871
|
11,592
|
|||||||||
|
Reports to shareholders
|
5,038
|
1,019
|
192
|
|||||||||
|
Interest expense
|
143
|
—
|
—
|
|||||||||
|
Total expenses
|
2,280,299
|
457,040
|
6,014,943
|
|||||||||
|
Less: advisory fees waived and expenses absorbed
|
(486,807
|
)
|
(247,658
|
)
|
(838,624
|
)
|
||||||
|
Net expenses
|
1,793,492
|
209,382
|
5,176,319
|
|||||||||
|
Net investment income (loss)
|
11,020,926
|
2,398,872
|
43,335,086
|
|||||||||
|
REALIZED AND UNREALIZED GAIN (LOSS) ON INVESTMENTS
|
||||||||||||
|
Realized gain (loss) on:
|
||||||||||||
|
Unaffiliated investments
|
(10,618,199
|
)
|
(1,834,241
|
)
|
(1,435,313
|
)
|
||||||
|
Foreign currency and foreign currency transactions
|
176,260
|
(7
|
)
|
1,585,596
|
||||||||
|
Forward foreign currency exchange contracts
|
(1,788,449
|
)
|
—
|
(13,470,724
|
)
|
|||||||
|
Futures contracts
|
53,650
|
—
|
(2,605,830
|
)
|
||||||||
|
Swap contracts
|
(456,343
|
)
|
—
|
(2,107,829
|
)
|
|||||||
|
Net realized gain (loss)
|
(12,633,081
|
)
|
(1,834,248
|
)
|
(18,034,100
|
)
|
||||||
|
Change in net unrealized appreciation/depreciation on:
|
||||||||||||
|
Unaffiliated investments
|
22,073,227
|
3,144,623
|
43,756,604
|
|||||||||
|
Foreign currency and foreign currency translation
|
(8,842
|
)
|
65
|
329,405
|
||||||||
|
Forward foreign currency exchange contracts
|
(323,473
|
)
|
—
|
6,060,022
|
||||||||
|
Futures contracts
|
(313,227
|
)
|
—
|
(1,613,859
|
)
|
|||||||
|
Swap contracts
|
—
|
—
|
775,024
|
|||||||||
|
Change in net unrealized appreciation/depreciation
|
21,427,685
|
3,144,688
|
49,307,196
|
|||||||||
|
Net realized and unrealized gain (loss) on investments
|
8,794,604
|
1,310,440
|
31,273,096
|
|||||||||
|
Net increase (decrease) in net assets resulting from operations
|
$
|
19,815,530
|
$
|
3,709,312
|
$
|
74,608,182
|
||||||
The accompanying notes are an integral part of these financial statements.
42
Credit Opportunities Fund
|
STATEMENTS OF CHANGES IN NET ASSETS
|
|
|
||||||||
|
|
Year Ended
|
Year Ended
|
||||||
|
|
December 31, 2023
|
December 31, 2022
|
||||||
|
INCREASE (DECREASE) IN NET ASSETS FROM:
|
||||||||
|
OPERATIONS
|
||||||||
|
Net investment income (loss)
|
$
|
11,020,926
|
$
|
9,206,728
|
||||
|
Net realized gain (loss) on investments, forward foreign currency exchange contracts,
|
||||||||
|
foreign currency, foreign currency translation, futures contracts and swap contracts
|
(12,633,081
|
)
|
(24,387,211
|
)
|
||||
|
Change in unrealized appreciation/depreciation on investments, forward foreign currency
|
||||||||
|
exchange contracts, foreign currency, foreign currency translation, and futures contracts
|
21,427,685
|
(16,500,303
|
)
|
|||||
|
Net increase (decrease) in net assets resulting from operations
|
19,815,530
|
(31,680,786
|
)
|
|||||
|
DISTRIBUTIONS TO SHAREHOLDERS
|
||||||||
|
From earnings:
|
||||||||
|
Supra Institutional Class
|
(7,416,404
|
)
|
(2,954,246
|
)
|
||||
|
Institutional Class
|
(3,734,658
|
)
|
(1,235,062
|
)
|
||||
|
Total distributions to shareholders
|
(11,151,062
|
)
|
(4,189,308
|
)
|
||||
|
CAPITAL SHARE TRANSACTIONS
|
||||||||
|
Net increase (decrease) in net assets derived from net change in outstanding shares –
|
||||||||
|
Supra Institutional Class 1
|
(43,290,782
|
)
|
(18,319,186
|
)
|
||||
|
Net increase (decrease) in net assets derived from net change in outstanding shares –
|
||||||||
|
Institutional Class 1
|
1,789,766
|
(26,383,408
|
)
|
|||||
|
Total increase (decrease) in net assets from capital share transactions
|
(41,501,016
|
)
|
(44,702,594
|
)
|
||||
|
Total increase (decrease) in net assets
|
(32,836,548
|
)
|
(80,572,688
|
)
|
||||
|
NET ASSETS
|
||||||||
|
Beginning of period/year
|
298,550,272
|
379,122,960
|
||||||
|
End of period/year
|
$
|
265,713,724
|
$
|
298,550,272
|
||||
|
1
|
Summary of share transactions is as follows:
|
|
Year Ended
|
Year Ended
|
||||||||||||||||
|
December 31, 2023
|
December 31, 2022
|
||||||||||||||||
|
Supra Institutional Class:
|
Shares
|
Value
|
Shares
|
Value
|
|||||||||||||
|
Shares sold
|
2,292,038
|
$
|
22,150,163
|
5,066,580
|
$
|
50,495,038
|
|||||||||||
|
Shares issued in reinvestment of distributions
|
507,585
|
4,927,786
|
190,238
|
1,843,100
|
|||||||||||||
|
Shares redeemed 2
|
(7,290,502
|
)
|
(70,368,731
|
)
|
(7,211,365
|
)
|
(70,657,324
|
)
|
|||||||||
|
Net increase (decrease)
|
(4,490,879
|
)
|
$
|
(43,290,782
|
)
|
(1,954,547
|
)
|
$
|
(18,319,186
|
)
|
|||||||
|
2
|
Net of redemption fees of $24,052 and $18,708, respectively.
|
|
Year Ended
|
Year Ended
|
||||||||||||||||
|
December 31, 2023
|
December 31, 2022
|
||||||||||||||||
|
Institutional Class:
|
Shares
|
Value
|
Shares
|
Value
|
|||||||||||||
|
Shares sold
|
2,751,721
|
$
|
26,606,552
|
3,655,430
|
$
|
35,790,465
|
|||||||||||
|
Shares issued in reinvestment of distributions
|
334,533
|
3,248,634
|
105,847
|
1,026,949
|
|||||||||||||
|
Shares redeemed 3
|
(2,914,677
|
)
|
(28,065,420
|
)
|
(6,465,646
|
)
|
(63,200,822
|
)
|
|||||||||
|
Net increase (decrease)
|
171,577
|
$
|
1,789,766
|
(2,704,369
|
)
|
$
|
(26,383,408
|
)
|
|||||||||
|
3
|
Net of redemption fees of $12,085 and $8,528, respectively.
|
The accompanying notes are an integral part of these financial statements.
43
Flexible U.S. High Yield Income Fund
|
STATEMENTS OF CHANGES IN NET ASSETS
|
|
|
Year Ended
|
Year Ended
|
||||||
|
|
December 31, 2023
|
December 31, 2022
|
||||||
|
INCREASE (DECREASE) IN NET ASSETS FROM:
|
||||||||
|
OPERATIONS
|
||||||||
|
Net investment income (loss)
|
$
|
2,398,872
|
$
|
1,610,898
|
||||
|
Net realized gain (loss) on investments
|
(1,834,248
|
)
|
(1,552,344
|
)
|
||||
|
Net change in unrealized appreciation/depreciation on investments
|
3,144,688
|
(3,528,347
|
)
|
|||||
|
Net increase (decrease) in net assets resulting from operations
|
3,709,312
|
(3,469,793
|
)
|
|||||
|
DISTRIBUTIONS TO SHAREHOLDERS
|
||||||||
|
From earnings:
|
||||||||
|
Supra Institutional Class
|
(2,238,150
|
)
|
(1,456,056
|
)
|
||||
|
Institutional Class
|
(162,200
|
)
|
(165,401
|
)
|
||||
|
Total distributions to shareholders
|
(2,400,350
|
)
|
(1,621,457
|
)
|
||||
|
CAPITAL SHARE TRANSACTIONS
|
||||||||
|
Net increase (decrease) in net assets derived from net change in outstanding shares –
|
||||||||
|
Supra Institutional Class 1
|
13,391,700
|
9,545,078
|
||||||
|
Net increase (decrease) in net assets derived from net change in outstanding shares –
|
||||||||
|
Institutional Class 1
|
(304,880
|
)
|
(772,476
|
)
|
||||
|
Total increase (decrease) in net assets from capital share transactions
|
13,086,820
|
8,772,602
|
||||||
|
Total increase (decrease) in net assets
|
14,395,782
|
3,681,352
|
||||||
|
NET ASSETS
|
||||||||
|
Beginning of period/year
|
33,150,284
|
29,468,932
|
||||||
|
End of period/year
|
$
|
47,546,066
|
$
|
33,150,284
|
||||
|
1
|
Summary of share transactions is as follows:
|
|
Year Ended
|
Year Ended
|
||||||||||||||||
|
December 31, 2023
|
December 31, 2022
|
||||||||||||||||
|
Supra Institutional Class:
|
Shares
|
Value
|
Shares
|
Value
|
|||||||||||||
|
Shares sold
|
2,352,575
|
$
|
18,286,607
|
1,200,467
|
$
|
9,520,837
|
|||||||||||
|
Shares issued in reinvestment of distributions
|
137,516
|
1,068,424
|
77,660
|
618,326
|
|||||||||||||
|
Shares redeemed
|
(766,999
|
)
|
(5,963,331
|
)
|
(76,937
|
)
|
(594,085
|
)
|
|||||||||
|
Net increase (decrease)
|
1,723,092
|
$
|
13,391,700
|
1,201,190
|
$
|
9,545,078
|
|||||||||||
|
Year Ended
|
Year Ended
|
||||||||||||||||
|
December 31, 2023
|
December 31, 2022
|
||||||||||||||||
|
Institutional Class:
|
Shares
|
Value
|
Shares
|
Value
|
|||||||||||||
|
Shares sold
|
154,839
|
$
|
1,200,000
|
141,026
|
$
|
1,100,000
|
|||||||||||
|
Shares issued in reinvestment of distributions
|
19,506
|
151,482
|
18,848
|
153,649
|
|||||||||||||
|
Shares redeemed
|
(208,209
|
)
|
(1,656,362
|
)
|
(252,842
|
)
|
(2,026,125
|
)
|
|||||||||
|
Net increase (decrease)
|
(33,864
|
)
|
$
|
(304,880
|
)
|
(92,968
|
)
|
$
|
(772,476
|
)
|
|||||||
The accompanying notes are an integral part of these financial statements.
44
Low Duration Fund
|
STATEMENTS OF CHANGES IN NET ASSETS
|
|
|
Year Ended
|
Year Ended
|
||||||
|
|
December 31, 2023
|
December 31, 2022
|
||||||
|
INCREASE (DECREASE) IN NET ASSETS FROM:
|
||||||||
|
OPERATIONS
|
||||||||
|
Net investment income (loss)
|
$
|
43,335,086
|
$
|
14,772,823
|
||||
|
Net realized gain (loss) on investments, forward foreign currency exchange contracts,
|
||||||||
|
foreign currency, and foreign currency translation
|
(18,034,100
|
)
|
19,486,337
|
|||||
|
Change in unrealized appreciation/depreciation on investments, forward foreign currency
|
||||||||
|
exchange contracts, foreign currency, and foreign currency translation
|
49,307,196
|
(45,051,838
|
)
|
|||||
|
Net increase (decrease) in net assets resulting from operations
|
74,608,182
|
(10,792,678
|
)
|
|||||
|
DISTRIBUTIONS TO SHAREHOLDERS
|
||||||||
|
From earnings:
|
||||||||
|
Supra Institutional Class
|
(48,879,002
|
)
|
(30,455,928
|
)
|
||||
|
Institutional Class 1
|
—
|
(6,296
|
)
|
|||||
|
Total distributions to shareholders
|
(48,879,002
|
)
|
(30,462,224
|
)
|
||||
|
CAPITAL SHARE TRANSACTIONS
|
||||||||
|
Net increase (decrease) in net assets derived from net change in outstanding shares –
|
||||||||
|
Supra Institutional Class 2
|
15,874,717
|
612,902,252
|
||||||
|
Net increase (decrease) in net assets derived from net change in outstanding shares –
|
||||||||
|
Institutional Class 2
|
—
|
(1,387,291
|
)
|
|||||
|
Total increase (decrease) in net assets from capital share transactions
|
15,874,717
|
611,514,961
|
||||||
|
Total increase (decrease) in net assets
|
41,603,897
|
570,260,059
|
||||||
|
|
||||||||
|
NET ASSETS
|
||||||||
|
Beginning of period/year
|
941,250,784
|
370,990,725
|
||||||
|
End of period/year
|
$
|
982,854,681
|
$
|
941,250,784
|
||||
|
1
|
Low Duration Fund – Institutional Class shares converted into Supra Institutional Class shares on close of business November 25, 2022.
|
|
2
|
Summary of share transactions is as follows:
|
|
Year Ended
|
Year Ended
|
||||||||||||||||
|
December 31, 2023
|
December 31, 2022
|
||||||||||||||||
|
Supra Institutional Class:
|
Shares
|
Value
|
Shares
|
Value
|
|||||||||||||
|
Shares sold
|
35,068,403
|
$
|
322,905,124
|
80,598,114
|
$
|
748,908,580
|
|||||||||||
|
Shares sold in connection with the conversion of
|
|||||||||||||||||
|
Institutional Class shares into Supra Institutional Class shares
|
—
|
—
|
142,567
|
1,327,298
|
|||||||||||||
|
Shares issued in reinvestment of distributions
|
5,257,472
|
48,801,266
|
3,352,014
|
30,414,315
|
|||||||||||||
|
Shares redeemed 3
|
(38,374,770
|
)
|
(355,831,673
|
)
|
(18,068,126
|
)
|
(167,747,941
|
)
|
|||||||||
|
Net increase (decrease)
|
1,951,105
|
$
|
15,874,717
|
66,024,569
|
$
|
612,902,252
|
|||||||||||
|
3
|
Net of redemption fees of $249 and $86, respectively.
|
The accompanying notes are an integral part of these financial statements.
45
Credit Opportunities Fund
|
FINANCIAL HIGHLIGHTS For a capital share outstanding throughout each year
|
|
|
Year Ended December 31,
|
|||||||||||||||||||
|
Supra Institutional Class
|
2023
|
2022
|
2021
|
2020
|
2019
|
|||||||||||||||
|
Net asset value, beginning of year
|
$
|
9.50
|
$
|
10.51
|
$
|
11.23
|
$
|
10.90
|
$
|
10.49
|
||||||||||
|
INCOME (LOSS) FROM INVESTMENT OPERATIONS:
|
||||||||||||||||||||
|
Net investment income (loss) 1
|
0.37
|
0.27
|
0.32
|
0.30
|
0.35
|
|||||||||||||||
|
Net realized and unrealized gain (loss) on investments
|
0.33
|
(1.15
|
)
|
(0.20
|
)
|
0.37
|
0.77
|
|||||||||||||
|
Total from investment operations
|
0.70
|
(0.88
|
)
|
0.12
|
0.67
|
1.12
|
||||||||||||||
|
Redemption fee proceeds
|
0.00
|
2
|
0.00
|
2
|
0.00
|
0.00
|
2
|
0.00
|
2
|
|||||||||||
|
LESS DISTRIBUTIONS:
|
||||||||||||||||||||
|
From net investment income
|
(0.40
|
)
|
(0.06
|
)
|
(0.42
|
)
|
(0.27
|
)
|
(0.31
|
)
|
||||||||||
|
From return of capital
|
—
|
—
|
—
|
—
|
—
|
|||||||||||||||
|
From net realized gain
|
—
|
(0.07
|
)
|
(0.42
|
)
|
(0.07
|
)
|
(0.40
|
)
|
|||||||||||
|
Total distributions
|
(0.40
|
)
|
(0.13
|
)
|
(0.84
|
)
|
(0.34
|
)
|
(0.71
|
)
|
||||||||||
|
Net asset value, end of year
|
$
|
9.80
|
$
|
9.50
|
$
|
10.51
|
$
|
11.23
|
$
|
10.90
|
||||||||||
|
Total return
|
7.48
|
%
|
(8.41
|
)%
|
1.11
|
%
|
6.30
|
%
|
10.77
|
%
|
||||||||||
|
SUPPLEMENTAL DATA:
|
||||||||||||||||||||
|
Net assets, end of year (millions)
|
$
|
172.0
|
$
|
209.4
|
$
|
252.1
|
$
|
321.3
|
$
|
261.9
|
||||||||||
|
Portfolio turnover rate
|
135
|
%
|
168
|
%
|
139
|
%
|
174
|
%
|
293
|
%
|
||||||||||
|
RATIO OF EXPENSES TO AVERAGE NET ASSETS:
|
||||||||||||||||||||
|
Before fees waived and expenses absorbed
|
0.77
|
%
|
0.80
|
%
|
0.76
|
%
|
0.75
|
%
|
0.76
|
%
|
||||||||||
|
After fees waived and expenses absorbed
|
0.60
|
%
|
0.60
|
%
|
0.59
|
%
|
0.59
|
%
|
0.59
|
%
|
||||||||||
|
RATIO OF NET INVESTMENT INCOME TO AVERAGE NET ASSETS:
|
||||||||||||||||||||
|
Before fees waived and expenses absorbed
|
3.70
|
%
|
2.55
|
%
|
2.73
|
%
|
2.61
|
%
|
3.01
|
%
|
||||||||||
|
After fees waived and expenses absorbed
|
3.87
|
%
|
2.74
|
%
|
2.90
|
%
|
2.77
|
%
|
3.18
|
%
|
||||||||||
|
1
|
Calculated using the average shares outstanding method.
|
|
2
|
Does not round to $0.01 or $(0.01), as applicable.
|
The accompanying notes are an integral part of these financial statements.
46
Credit Opportunities Fund
|
FINANCIAL HIGHLIGHTS For a capital share outstanding throughout each year
|
|
|
Year Ended December 31,
|
|||||||||||||||||||
|
Institutional Class
|
2023
|
2022
|
2021
|
2020
|
2019
|
|||||||||||||||
|
Net asset value, end of year
|
$
|
9.50
|
$
|
10.50
|
$
|
11.22
|
$
|
10.89
|
$
|
10.49
|
||||||||||
|
INCOME (LOSS) FROM INVESTMENT OPERATIONS:
|
||||||||||||||||||||
|
Net investment income (loss) 1
|
0.37
|
0.26
|
0.31
|
0.30
|
0.34
|
|||||||||||||||
|
Net realized and unrealized gain (loss) on investments
|
0.32
|
(1.14
|
)
|
(0.20
|
)
|
0.36
|
0.76
|
|||||||||||||
|
Total from investment operations
|
0.69
|
(0.88
|
)
|
0.11
|
0.66
|
1.10
|
||||||||||||||
|
Redemption fee proceeds
|
0.00
|
2
|
0.00
|
2
|
0.00
|
2
|
0.00
|
2
|
0.00
|
2
|
||||||||||
|
LESS DISTRIBUTIONS:
|
||||||||||||||||||||
|
From net investment income
|
(0.39
|
)
|
(0.05
|
)
|
(0.41
|
)
|
(0.26
|
)
|
(0.30
|
)
|
||||||||||
|
From return of capital
|
—
|
—
|
—
|
—
|
—
|
|||||||||||||||
|
From net realized gain
|
—
|
(0.07
|
)
|
(0.42
|
)
|
(0.07
|
)
|
(0.40
|
)
|
|||||||||||
|
Total distributions
|
(0.39
|
)
|
(0.12
|
)
|
(0.83
|
)
|
(0.33
|
)
|
(0.70
|
)
|
||||||||||
|
Net asset value, end of year
|
$
|
9.80
|
$
|
9.50
|
$
|
10.50
|
$
|
11.22
|
$
|
10.89
|
||||||||||
|
Total return
|
7.40
|
%
|
(8.39
|
)%
|
1.02
|
%
|
6.24
|
%
|
10.60
|
%
|
||||||||||
|
SUPPLEMENTAL DATA:
|
||||||||||||||||||||
|
Net assets, end of year (millions)
|
$
|
93.7
|
$
|
89.1
|
$
|
127.0
|
$
|
219.8
|
$
|
155.5
|
||||||||||
|
Portfolio turnover rate
|
135
|
%
|
168
|
%
|
139
|
%
|
174
|
%
|
293
|
%
|
||||||||||
|
RATIO OF EXPENSES TO AVERAGE NET ASSETS:
|
||||||||||||||||||||
|
Before fees waived and expenses absorbed
|
0.85
|
%
|
0.87
|
%
|
0.84
|
%
|
0.81
|
%
|
0.82
|
%
|
||||||||||
|
After fees waived and expenses absorbed
|
0.68
|
%
|
0.67
|
%
|
0.66
|
%
|
0.65
|
%
|
0.65
|
%
|
||||||||||
|
RATIO OF NET INVESTMENT INCOME TO AVERAGE NET ASSETS:
|
||||||||||||||||||||
|
Before fees waived and expenses absorbed
|
3.64
|
%
|
2.45
|
%
|
2.64
|
%
|
2.55
|
%
|
2.95
|
%
|
||||||||||
|
After fees waived and expenses absorbed
|
3.81
|
%
|
2.65
|
%
|
2.81
|
%
|
2.71
|
%
|
3.12
|
%
|
||||||||||
|
1
|
Calculated using the average shares outstanding method.
|
|
2
|
Does not round to $0.01 or $(0.01), as applicable.
|
The accompanying notes are an integral part of these financial statements.
47
Flexible U.S. High Yield Income Fund
|
FINANCIAL HIGHLIGHTS For a capital share outstanding throughout each year
|
|
|
Year Ended December 31,
|
|||||||||||||||||||
|
Supra Institutional Class
|
2023
|
2022
|
2021
|
2020
|
2019
|
|||||||||||||||
|
Net asset value, beginning of year
|
$
|
7.68
|
$
|
9.18
|
$
|
9.96
|
$
|
9.83
|
$
|
9.11
|
||||||||||
|
|
||||||||||||||||||||
|
INCOME (LOSS) FROM INVESTMENT OPERATIONS:
|
||||||||||||||||||||
|
Net investment income (loss) 1
|
0.52
|
0.44
|
0.51
|
0.51
|
0.51
|
|||||||||||||||
|
Net realized and unrealized gain (loss) on investments
|
0.22
|
(1.49
|
)
|
(0.08
|
)
|
0.12
|
0.72
|
|||||||||||||
|
Total from investment operations
|
0.74
|
(1.05
|
)
|
0.43
|
0.63
|
1.23
|
||||||||||||||
|
|
||||||||||||||||||||
|
LESS DISTRIBUTIONS:
|
||||||||||||||||||||
|
From net investment income
|
(0.51
|
)
|
(0.44
|
)
|
(0.53
|
)
|
(0.50
|
)
|
(0.51
|
)
|
||||||||||
|
From net realized gain
|
—
|
(0.01
|
)
|
(0.68
|
)
|
—
|
—
|
|||||||||||||
|
Total distributions
|
(0.51
|
)
|
(0.45
|
)
|
(1.21
|
)
|
(0.50
|
)
|
(0.51
|
)
|
||||||||||
|
Net asset value, end of year
|
$
|
7.91
|
$
|
7.68
|
$
|
9.18
|
$
|
9.96
|
$
|
9.83
|
||||||||||
|
Total return
|
9.98
|
%
|
(11.61
|
)%
|
4.43
|
%
|
6.60
|
%
|
13.71
|
%
|
||||||||||
|
|
||||||||||||||||||||
|
SUPPLEMENTAL DATA:
|
||||||||||||||||||||
|
Net assets, end of year (millions)
|
$
|
44.9
|
$
|
30.3
|
$
|
25.2
|
$
|
62.9
|
$
|
43.5
|
||||||||||
|
Portfolio turnover rate
|
76
|
%
|
59
|
%
|
96
|
%
|
113
|
%
|
89
|
%
|
||||||||||
|
|
||||||||||||||||||||
|
RATIO OF EXPENSES TO AVERAGE NET ASSETS:
|
||||||||||||||||||||
|
Before fees waived and expenses absorbed
|
1.27
|
%
|
1.37
|
%
|
1.19
|
%
|
0.98
|
%
|
1.21
|
%
|
||||||||||
|
After fees waived and expenses absorbed
|
0.58
|
%
|
0.58
|
%
|
0.58
|
%
|
0.58
|
%
|
0.58
|
%
|
||||||||||
|
|
||||||||||||||||||||
|
RATIO OF NET INVESTMENT INCOME TO AVERAGE NET ASSETS:
|
||||||||||||||||||||
|
Before fees waived and expenses absorbed
|
5.96
|
%
|
4.66
|
%
|
4.50
|
%
|
4.97
|
%
|
4.68
|
%
|
||||||||||
|
After fees waived and expenses absorbed
|
6.65
|
%
|
5.46
|
%
|
5.11
|
%
|
5.37
|
%
|
5.30
|
%
|
||||||||||
|
1
|
Calculated using the average shares outstanding method.
|
The accompanying notes are an integral part of these financial statements.
48
Flexible U.S. High Yield Income Fund
|
FINANCIAL HIGHLIGHTS For a capital share outstanding throughout each year
|
|
|
Year Ended December 31,
|
|||||||||||||||||||
|
Institutional Class
|
2023
|
2022
|
2021
|
2020
|
2019
|
|||||||||||||||
|
Net asset value, beginning of year
|
$
|
7.68
|
$
|
9.19
|
$
|
9.97
|
$
|
9.84
|
$
|
9.12
|
||||||||||
|
INCOME (LOSS) FROM INVESTMENT OPERATIONS:
|
||||||||||||||||||||
|
Net investment income (loss) 1
|
0.51
|
0.44
|
0.50
|
0.52
|
0.51
|
|||||||||||||||
|
Net realized and unrealized gain (loss) on investments
|
0.23
|
(1.50
|
)
|
(0.07
|
)
|
0.11
|
0.72
|
|||||||||||||
|
Total from investment operations
|
0.74
|
(1.06
|
)
|
0.43
|
0.63
|
1.23
|
||||||||||||||
|
LESS DISTRIBUTIONS:
|
||||||||||||||||||||
|
From net investment income
|
(0.51
|
)
|
(0.44
|
)
|
(0.53
|
)
|
(0.50
|
)
|
(0.51
|
)
|
||||||||||
|
From net realized gain
|
—
|
(0.01
|
)
|
(0.68
|
)
|
—
|
—
|
|||||||||||||
|
Total distributions
|
(0.51
|
)
|
(0.45
|
)
|
(1.21
|
)
|
(0.50
|
)
|
(0.51
|
)
|
||||||||||
|
Net asset value, end of year
|
$
|
7.91
|
$
|
7.68
|
$
|
9.19
|
$
|
9.97
|
$
|
9.84
|
||||||||||
|
Total return
|
9.98
|
%
|
(11.71
|
)%
|
4.42
|
%
|
6.81
|
%
|
13.68
|
%
|
||||||||||
|
SUPPLEMENTAL DATA:
|
||||||||||||||||||||
|
Net assets, end of year (millions)
|
$
|
2.7
|
$
|
2.8
|
$
|
4.2
|
$
|
5.9
|
$
|
1.6
|
||||||||||
|
Portfolio turnover rate
|
76
|
%
|
59
|
%
|
96
|
%
|
113
|
%
|
89
|
%
|
||||||||||
|
RATIO OF EXPENSES TO AVERAGE NET ASSETS:
|
||||||||||||||||||||
|
Before fees waived and expenses absorbed
|
1.26
|
%
|
1.37
|
%
|
1.25
|
%
|
0.97
|
%
|
1.17
|
%
|
||||||||||
|
After fees waived and expenses absorbed
|
0.58
|
%
|
0.58
|
%
|
0.59
|
%
|
0.58
|
%
|
0.59
|
%
|
||||||||||
|
RATIO OF NET INVESTMENT INCOME TO AVERAGE NET ASSETS:
|
||||||||||||||||||||
|
Before fees waived and expenses absorbed
|
5.91
|
%
|
4.54
|
%
|
4.40
|
%
|
4.97
|
%
|
4.74
|
%
|
||||||||||
|
After fees waived and expenses absorbed
|
6.59
|
%
|
5.34
|
%
|
5.06
|
%
|
5.36
|
%
|
5.32
|
%
|
||||||||||
|
1
|
Calculated using the average shares outstanding method.
|
The accompanying notes are an integral part of these financial statements.
49
Low Duration Fund
|
FINANCIAL HIGHLIGHTS For a capital share outstanding throughout each year
|
|
|
Year Ended December 31,
|
|||||||||||||||||||
|
Supra Institutional Class
|
2023
|
2022
|
2021
|
2020
|
2019
|
|||||||||||||||
|
Net asset value, beginning of year
|
$
|
9.05
|
$
|
9.73
|
$
|
10.10
|
$
|
10.05
|
$
|
9.53
|
||||||||||
|
|
||||||||||||||||||||
|
INCOME (LOSS) FROM INVESTMENT OPERATIONS:
|
||||||||||||||||||||
|
Net investment income (loss) 1
|
0.39
|
0.26
|
0.25
|
0.27
|
0.26
|
|||||||||||||||
|
Net realized and unrealized gain (loss) on investments
|
0.29
|
(0.59
|
)
|
—
|
(0.01
|
)
|
0.48
|
|||||||||||||
|
Total from investment operations
|
0.68
|
(0.33
|
)
|
0.25
|
0.26
|
0.74
|
||||||||||||||
|
Redemption fee proceeds
|
0.00
|
2
|
0.00
|
2
|
—
|
—
|
—
|
|||||||||||||
|
|
||||||||||||||||||||
|
LESS DISTRIBUTIONS:
|
||||||||||||||||||||
|
From net investment income
|
(0.45
|
)
|
(0.10
|
)
|
(0.62
|
)
|
(0.21
|
)
|
(0.13
|
)
|
||||||||||
|
From net realized gain
|
—
|
(0.25
|
)
|
—
|
—
|
(0.09
|
)
|
|||||||||||||
|
Total distributions
|
(0.45
|
)
|
(0.35
|
)
|
(0.62
|
)
|
(0.21
|
)
|
(0.22
|
)
|
||||||||||
|
Net asset value, end of year
|
$
|
9.28
|
$
|
9.05
|
$
|
9.73
|
$
|
10.10
|
$
|
10.05
|
||||||||||
|
Total return
|
7.63
|
%
|
(3.41
|
)%
|
2.50
|
%
|
2.64
|
%
|
7.86
|
%
|
||||||||||
|
|
||||||||||||||||||||
|
SUPPLEMENTAL DATA:
|
||||||||||||||||||||
|
Net assets, end of year (millions)
|
$
|
982.9
|
$
|
941.3
|
$
|
369.5
|
$
|
592.5
|
$
|
732.0
|
||||||||||
|
Portfolio turnover rate
|
49
|
%
|
26
|
%
|
69
|
%
|
75
|
%
|
47
|
%
|
||||||||||
|
|
||||||||||||||||||||
|
RATIO OF EXPENSES TO AVERAGE NET ASSETS:
|
||||||||||||||||||||
|
Before fees waived and expenses absorbed
|
0.58
|
%
|
0.61
|
%
|
0.62
|
%
|
0.62
|
%
|
0.59
|
%
|
||||||||||
|
After fees waived and expenses absorbed
|
0.50
|
%
|
0.50
|
%
|
0.49
|
%
|
0.49
|
%
|
0.49
|
%
|
||||||||||
|
|
||||||||||||||||||||
|
RATIO OF NET INVESTMENT INCOME TO AVERAGE NET ASSETS:
|
||||||||||||||||||||
|
Before fees waived and expenses absorbed
|
4.11
|
%
|
2.71
|
%
|
2.32
|
%
|
2.66
|
%
|
2.50
|
%
|
||||||||||
|
After fees waived and expenses absorbed
|
4.19
|
%
|
2.83
|
%
|
2.46
|
%
|
2.77
|
%
|
2.60
|
%
|
||||||||||
|
1
|
Calculated using the average shares outstanding method.
|
|
2
|
Does not round to $0.01 or $(0.01), as applicable.
|
The accompanying notes are an integral part of these financial statements.
50
Muzinich Funds
|
NOTES TO FINANCIAL STATEMENTS December 31, 2023
|
|
NOTE 1 – ORGANIZATION
|
The Muzinich Credit Opportunities Fund (“Credit Opportunities Fund”), Muzinich Flexible U.S. High Yield Income Fund (“Flexible U.S. High Yield Income Fund”), and Muzinich Low
Duration Fund (“Low Duration Fund”) (each a “Fund,” collectively the “Funds”) are diversified series of shares of beneficial interest of Professionally Managed Portfolios (the “Trust”), which is registered under the Investment Company Act of 1940, as
amended (the “1940 Act”) as an open-end management investment company. The Funds are investment companies and accordingly follow the investment company accounting and reporting guidance of the Financial Accounting Standards Board (FASB) Accounting
Standard Codification Topic 946 “Financial Services—Investment Companies.” The performance history of the Fund commenced on January 3, 2013, March 27, 2017, and June 30, 2016, respectively.
The Funds offer two classes of shares: Institutional shares, and Supra Institutional shares (Class A shares are not available for purchase). Each class of shares has equal rights
as to earnings and assets except that each class bears different distribution and shareholder servicing expenses. Each class of shares has exclusive voting rights with respect to matters that affect just that class. Income, expenses (other than
expenses attributable to a specific class), and realized and unrealized gains/losses on investments are allocated to each class of shares based on its relative net assets. Currently, the Credit Opportunities Fund offers Supra Institutional and
Institutional Class shares, the Flexible U.S. High Yield Income Fund offers Supra Institutional and Institutional Class shares, and the Low Duration Fund offers Supra Institutional shares.
The investment objective of the Credit Opportunities Fund is primarily to provide a high level of income and capital appreciation. The investment objective of the Flexible U.S.
High Yield Income Fund is to provide a high level of income on a risk-adjusted basis over a full market cycle. The investment objective of the Low Duration Fund is to protect capital and generate positive returns under most market conditions.
|
NOTE 2 – SIGNIFICANT ACCOUNTING POLICIES
|
The following is a summary of significant accounting policies consistently followed by the Funds. These policies are in conformity with accounting principles generally accepted in
the United States of America (“U.S. GAAP”).
|
A.
|
Security Valuation. All equity securities, which may include Real Estate Investment Trusts (“REITs”), Business Development Companies (“BDCs”) and Master Limited
Partnerships (“MLPs”), that are traded on U.S. national or foreign securities exchanges are valued either at the last reported sale price on the exchange on which the security is principally traded or the exchange’s official closing price.
If, on a particular day, an exchange-traded security does not trade, then the mean between the most recent quoted bid and asked prices will be used. All equity securities, which may include REITs, BDCs and MLPs that are not traded on a listed
exchange are valued at the last sale price in the over-the- counter market. If a non-exchange traded security does not trade on a particular day, then the mean between the last quoted closing bid and asked price will be used.
|
|
|
Debt securities are valued by using an evaluated mean of the bid and asked prices provided by an independent pricing service. The independent pricing service may use various valuation methodologies including
matrix pricing and other analytical pricing models as well as market transactions and dealer quotations. These models generally consider such factors as yields or prices of bonds of comparable quality, type of issue, coupon, maturity, ratings
and general market conditions. In the absence of a price from a pricing service, securities are valued at their respective fair values as determined in good faith by the Valuation Committee.
|
|
Exchange traded options are valued at the composite price, using the National Best Bid and Offer quotes (“NBBO”). NBBO consists of the highest bid price and lowest ask price across any of the exchanges on which
an option is quoted, thus providing a view across the entire U.S. options marketplace. Composite option pricing calculates the mean of the highest bid price and lowest ask price across the exchanges where the option is traded.
|
||
|
Forward foreign currency exchange contracts are presented at fair value measured by the difference between the forward exchange rates (“forward rates”) at the dates of entry into the contracts and the forward
rates at the reporting date, and such differences are included in the Statements of Assets and Liabilities.
|
||
|
Swap contracts, such as credit default swaps, total return swaps, interest rate swaps and currency swaps, are priced by an approved independent pricing service. The independent pricing service includes
observable market data inputs in an evaluated valuation methodology.
|
||
|
Futures contracts are priced by an approved independent pricing service. Futures contracts are valued at the settlement price on the exchange on which they are principally traded.
|
51
Muzinich Funds
|
NOTES TO FINANCIAL STATEMENTS December 31, 2023 (Continued)
|
|
Pursuant to Rule 2a-5 under the 1940 Act, the Board has adopted a Valuation Policy designating Muzinich & Co., Inc. (the “Adviser”) as the Funds’ Valuation Designee. Under Rule 2a-5, the Valuation Designee
shall determine the fair value of securities for which readily available market quotes are not available in accordance with procedures approved by the Board.
|
||
|
As described above, the Funds utilize various methods to measure the fair value of their investments on a recurring basis. U.S. GAAP establishes a hierarchy that prioritizes inputs to valuation methods. The
three levels of inputs are:
|
|
Level 1 –
|
Unadjusted quoted prices in active markets for identical assets or liabilities that the Funds have the ability to access.
|
|
|
Level 2 –
|
Observable inputs other than quoted prices included in Level 1 that are observable for the asset or liability, either directly or indirectly. These inputs may include quoted prices for the identical instrument
on an inactive market, prices for similar instruments, interest rates, prepayment speeds, credit risk, yield curves, default rates and similar data.
|
|
|
Level 3 –
|
Unobservable inputs for the asset or liability, to the extent relevant observable inputs are not available; representing the Funds’ own assumptions about the assumptions a market participant would use in
valuing the asset or liability, and would be based on the best information available.
|
|
The availability of observable inputs can vary from security to security and is affected by a wide variety of factors, including, for example, the type of security, whether the security is new and not yet
established in the marketplace, the liquidity of markets, and other characteristics particular to the security. To the extent that valuation is based on models or inputs that are less observable or unobservable in the market, the
determination of fair value requires more judgment. Accordingly, the degree of judgment exercised in determining fair value is greatest for instruments categorized in Level 3.
|
||
|
The inputs used to measure fair value may fall into different levels of the fair value hierarchy. In such cases, for disclosure purposes, the level in the fair value hierarchy within which the fair value
measurement falls in its entirety, is determined based on the lowest level input that is significant to the fair value measurement in its entirety.
|
|
Credit Opportunities Fund
|
|||||||||||||||||
|
Description
|
Level 1
|
Level 2
|
Level 3
|
Total
|
|||||||||||||
|
Assets:
|
|||||||||||||||||
|
Corporate Bonds
|
$
|
—
|
$
|
203,708,797
|
$
|
—
|
$
|
203,708,797
|
|||||||||
|
U.S. Government Note/Bond
|
—
|
37,981,020
|
—
|
37,981,020
|
|||||||||||||
|
Foreign Government Note/ Bond
|
—
|
11,121,183
|
—
|
11,121,183
|
|||||||||||||
|
Bank Loans
|
—
|
6,286,747
|
—
|
6,286,747
|
|||||||||||||
|
Convertible Bonds
|
—
|
2,513,305
|
—
|
2,513,305
|
|||||||||||||
|
Foreign Government Agency Issue
|
—
|
1,096,112
|
—
|
1,096,112
|
|||||||||||||
|
Money Market Fund
|
3,507,679
|
—
|
—
|
3,507,679
|
|||||||||||||
|
Total Assets
|
$
|
3,507,679
|
$
|
262,707,164
|
$
|
—
|
$
|
266,214,843
|
|||||||||
|
Other Financial Instruments1:
|
|||||||||||||||||
|
Forward Foreign Currency Exchange Contracts
|
$
|
—
|
$
|
(1,513,917
|
)
|
$
|
—
|
$
|
(1,513,917
|
)
|
|||||||
|
$
|
—
|
$
|
(1,513,917
|
)
|
$
|
—
|
$
|
(1,513,917
|
)
|
||||||||
|
1
|
Other Financial Instruments are derivative instruments not reflected in the Schedule of Investments and are presented at the net unrealized appreciation/(depreciation) on the instruments.
|
52
Muzinich Funds
|
NOTES TO FINANCIAL STATEMENTS December 31, 2023 (Continued)
|
|
Flexible U.S. High Yield Income Fund
|
|||||||||||||||||
|
Description
|
Level 1
|
Level 2
|
Level 3
|
Total
|
|||||||||||||
|
Assets:
|
|||||||||||||||||
|
Corporate Bonds
|
$
|
—
|
$
|
34,396,677
|
$
|
—
|
$
|
34,396,677
|
|||||||||
|
Bank Loans
|
—
|
12,140,337
|
—
|
12,140,337
|
|||||||||||||
|
Money Market Fund
|
3,150,548
|
—
|
—
|
3,150,548
|
|||||||||||||
|
Total Assets
|
$
|
3,150,548
|
$
|
46,537,014
|
$
|
—
|
$
|
49,687,562
|
|||||||||
|
Low Duration Fund
|
|||||||||||||||||
|
Description
|
Level 1
|
Level 2
|
Level 3
|
Total
|
|||||||||||||
|
Assets:
|
|||||||||||||||||
|
Corporate Bonds
|
$
|
—
|
$
|
871,551,212
|
$
|
—
|
$
|
871,551,212
|
|||||||||
|
Foreign Government Note/Bond
|
—
|
85,186,883
|
—
|
85,186,883
|
|||||||||||||
|
Convertible Bonds
|
—
|
21,018,120
|
—
|
21,018,120
|
|||||||||||||
|
Foreign Government Agency Issue
|
—
|
9,813,682
|
—
|
9,813,682
|
|||||||||||||
|
Money Market Fund
|
3,816,132
|
—
|
—
|
3,816,132
|
|||||||||||||
|
Total Assets
|
$
|
3,816,132
|
$
|
987,569,897
|
$
|
—
|
$
|
991,386,029
|
|||||||||
|
Other Financial Instruments1:
|
|||||||||||||||||
|
Forward Foreign Currency Exchange Contracts
|
$
|
—
|
$
|
(16,588,914
|
)
|
$
|
—
|
$
|
(16,588,914
|
)
|
|||||||
|
$
|
—
|
$
|
(16,588,914
|
)
|
$
|
—
|
$
|
(16,588,914
|
)
|
||||||||
|
1
|
Other Financial Instruments are derivative instruments not reflected in the Schedule of Investments and are presented at the net unrealized appreciation/(depreciation) on the instruments.
|
|
Significant increases (decreases) in any of those inputs in isolation would result in a significantly higher (lower) fair value measurement. Increases in the adjustment to yield would decrease price and
decreases in the adjustment to yield would increase price.
|
||
|
The Advisor, as the Funds’ Valuation Designee, oversees valuation techniques.
|
||
|
The Funds have provided additional disclosures below regarding derivatives and hedging activity intending to improve financial reporting by enabling investors to understand how and why the Funds use forward
contracts and swap contracts (types of derivatives), how they are accounted for, and how they affect an entity’s results of operations and financial position. The Funds may use derivatives in various ways. The Funds may, but are not required
to, use derivatives for risk management purposes or as part of its investment strategies. Derivatives are financial contracts whose values depend on, or are derived from, the value of an underlying asset, reference rate or index. The Funds
may use derivatives to earn income and enhance returns, to hedge or adjust the risk profile of its portfolio, to replace more traditional direct investments and to obtain exposure to otherwise inaccessible markets.
|
||
|
The average notional value of forward foreign currency exchange contracts outstanding during the year ended December 31, 2023 for the Credit Opportunities Fund, and Low Duration Fund was $85,316,274, and
$605,625,626, respectively. Forward foreign currency exchange contracts entered into during the year ended December 31, 2023 were with the U.S. Bank NA for the Credit Opportunities Fund, and the Low Duration Fund. The Credit Opportunities
Fund’s average notional value when in use of exchange traded futures contracts outstanding during the year ended December 31, 2023 was $14,610,176 and were entered into with Morgan Stanley. The Credit Opportunities Fund entered into swap
contract transactions with Bank of America N.A., Barclay Investments Ltd., BNP Paribas Brokerage Services Inc., Deutsche Bank Trust Co., Goldman Sachs & Co., and J.P. Morgan Chase during the year ended December 31, 2023, at an average
transaction notional value of $8,250,000, $5,966,667, $7,510,714, $5,350,000, $6,025,000, and $8,200,000, respectively. The Low Duration Fund entered into swap contract transactions with Banc/America Secur.LLC Montgomey Div, Barclay
Investments Ltd, Citigroup, and Merrill Lynch Inc. during the year ended December 31, 2023, at an average transaction notional value of $13,500,000, $3,515,500, $3,375,000, and $9,000,500, respectively.
|
||
|
The notional amount for forward foreign currency exchange contracts is calculated based on the currency being sold converted to U.S. dollars. The average notional amount for forward foreign currency exchange
contracts is calculated by the dollar value of open contracts at the end of the previous fiscal year and at each quarter end in the current fiscal year. The notional
|
53
Muzinich Funds
|
NOTES TO FINANCIAL STATEMENTS December 31, 2023 (Continued)
|
|
amount for futures contracts represents the U.S. dollar value of the contract as of the day of opening the transaction or latest contract reset date. The notional amount for swap contracts is the principal
value. The average notional amounts are based on the notional amounts at each month end during the period for futures and the daily notional amounts for swaps.
|
||
|
The following tables show the effects of derivative instruments on the financial statements.
|
||
|
Statements of Assets and LiabilitiesFair values of derivative instruments as of December 31, 2023:
|
|
Credit Opportunities Fund
|
|
Asset Derivatives as of December 31, 2023
|
Liability Derivatives as of December 31, 2023
|
|||||||||||
|
Instrument
|
Balance Sheet Location
|
Fair Value
|
Balance Sheet Location
|
Fair Value
|
||||||||
|
Forward Foreign Currency
|
Unrealized Appreciation on
|
|
Unrealized Depreciation on
|
|||||||||
|
Exchange Contracts
|
Forward Foreign Currency
|
|
Forward Foreign Currency
|
|||||||||
|
|
Exchange Contracts
|
$
|
65,575
|
Exchange Contracts
|
$
|
1,579,492
|
||||||
|
$
|
65,575
|
$
|
1,579,492
|
|||||||||
|
Credit Default –
|
Unrealized Appreciation on
|
|
Unrealized Depreciation on
|
|||||||||
|
Swap Contracts
|
Swap Contracts
|
$
|
—
|
Swap Contracts
|
$
|
—
|
||||||
|
$
|
—
|
$
|
—
|
|||||||||
|
Low Duration Fund
|
||||||||||||
|
Asset Derivatives as of December 31, 2023
|
Liability Derivatives as of December 31, 2023
|
|||||||||||
|
Instrument
|
Balance Sheet Location
|
Fair Value
|
Balance Sheet Location
|
Fair Value
|
||||||||
|
Forward Foreign Currency
|
Unrealized Appreciation on
|
Unrealized Depreciation on
|
||||||||||
|
Exchange Contracts
|
Forward Foreign Currency
|
Forward Foreign Currency
|
||||||||||
|
|
Exchange Contracts
|
$
|
1,385,677
|
Exchange Contracts
|
$
|
17,974,591
|
||||||
|
$
|
1,385,677
|
$
|
17,974,591
|
|||||||||
|
Credit Default –
|
Unrealized Appreciation on
|
Unrealized Depreciation on
|
||||||||||
|
Swap Contracts
|
Swap Contracts
|
$
|
—
|
Swap Contracts
|
$
|
—
|
||||||
|
$
|
—
|
$
|
—
|
|||||||||
Statements of Operations
The effect of derivative instruments on the Statements of Operations for the year ended December 31, 2023:
Credit Opportunities Fund
|
Location of Gain (Loss)
|
Realized Gain (Loss)
|
Change in Unrealized
|
|||||||||||
|
on Derivatives
|
on Derivatives
|
Appreciation/Depreciation on
|
|||||||||||
|
Instrument
|
Recognized in Income
|
Recognized in Income
|
Derivatives Recognized in Income
|
||||||||||
|
Forward Foreign Currency
|
Net realized and unrealized
|
||||||||||||
|
Exchange Contracts
|
gain (loss) on forward foreign
|
||||||||||||
|
currency exchange contracts
|
$
|
(1,788,449
|
)
|
$
|
(323,473
|
)
|
|||||||
|
Credit Default –
|
Net realized and unrealized
|
||||||||||||
|
Swap Contracts
|
gain (loss) on swap contracts
|
(456,343
|
)
|
—
|
|||||||||
|
Futures Contracts
|
Net realized and unrealized
|
||||||||||||
|
gain (loss) on futures contracts
|
53,650
|
(313,227
|
)
|
||||||||||
|
$
|
(2,191,142
|
)
|
$
|
(636,700
|
)
|
||||||||
54
Muzinich Funds
|
NOTES TO FINANCIAL STATEMENTS December 31, 2023 (Continued)
|
|
Low Duration Fund
|
|||||||||||||
|
Location of Gain (Loss)
|
Realized Gain (Loss)
|
Change in Unrealized
|
|||||||||||
|
on Derivatives
|
on Derivatives
|
Appreciation/Depreciation on
|
|||||||||||
|
Instrument
|
Recognized in Income
|
Recognized in Income
|
Derivatives Recognized in Income
|
||||||||||
|
Forward Foreign Currency
|
Net realized and unrealized
|
||||||||||||
|
Exchange Contracts
|
gain (loss) on forward foreign
|
||||||||||||
|
currency exchange contracts
|
$
|
(13,470,724
|
)
|
$
|
6,060,022
|
||||||||
|
Credit Default –
|
Net realized and unrealized
|
||||||||||||
|
Swap Contracts
|
gain (loss) on swap contracts
|
(2,107,829
|
)
|
775,024
|
|||||||||
|
Futures Contracts
|
Net realized and unrealized
|
||||||||||||
|
gain (loss) on futures contracts
|
(2,605,830
|
)
|
(1,613,859
|
)
|
|||||||||
|
$
|
(18,184,383
|
)
|
$
|
5,221,187
|
|||||||||
|
The Flexible U.S. High Yield Income Fund did not have derivatives activity during the year ended December 31, 2023.
|
||
|
B.
|
Swap Contracts. A swap, which may be a customized and privately negotiated agreement or a standardized and exchange- traded contract, obligates two parties to exchange
a series of cash flows at specified intervals (payment dates) based upon, or calculated by, reference to changes in specified prices or rates for a specified amount of an underlying asset (the “notional” principal amount). Swaps are entered
into on a net basis (i.e., the two payment streams are netted out, with a fund receiving or paying, as applicable, only the net amount of the two payments). Examples of such swaps may include, but are not limited to, currency swaps, interest
rate swaps, total return swaps, and credit default swaps. Payments received by the Funds from swap agreements will result in taxable income, either as ordinary income or capital gains. Except for currency swaps, the notional principal amount
is used solely to calculate the payment streams but is not exchanged. With respect to currency swaps, actual principal amounts of currencies may be exchanged by the counterparties at the initiation, and again upon the termination, of the
transaction. The swap market has grown substantially in recent years, with a large number of banks and investment banking firms acting both as principals and as agents utilizing standardized swap documentation. As a result, the swap market
has become well-established and relatively liquid. The Credit Opportunities Fund and Low Duration Fund had swap contracts activity during the year ended December 31, 2023. Realized and unrealized gains and losses are included in the
Statements of Operations. The Flexible U.S. High Yield Income Fund did not have swap contracts activity during the year ended December 31, 2023.
|
|
|
C.
|
Futures Contracts. Each Fund may purchase or sell futures contracts and options thereon to hedge against changes in interest rates, securities (through index futures or
options) or currencies. The purchase of futures contracts may be more efficient or cost effective than actually buying the underlying securities or assets. A futures contract is an agreement that obligates the buyer to buy and the seller to
sell a specified quantity of an underlying asset (or settle for cash the value of a contract based on an underlying asset, rate or index) at a specific price on the contract maturity date. Upon entering into a futures contract, each Fund is
required to pledge to the counterparty an amount of cash, U.S. Government securities or other high quality debt securities equal to the minimum “initial margin” requirements of the exchange or the broker. Pursuant to a contract entered into
with a futures commission merchant, each Fund agrees to receive from or pay to the firm an amount of cash equal to the cumulative daily fluctuation in the value of the contract. Such receipts or payments are known as “variation margin” and
are recorded by the Funds as unrealized gains or losses. When the contract is closed, the Funds record a gain or loss equal to the difference between the value of the contract at the time it was opened and the value at the time it was closed.
Each Fund will cover its current obligations under futures contracts by the segregation of liquid assets or by entering into offsetting transactions or owning positions covering its obligations. The Funds’ use of futures contracts may involve
risks that are different from, or possibly greater than, the risks associated with investing directly in securities or other more traditional instruments. These risks include the risk that the value of the futures contracts may not correlate
perfectly, or at all, with the value of the assets, reference rates, or indexes that they are designed to track. Other risks include: an illiquid secondary market for a particular instrument and possible exchange- imposed price fluctuation
limits, either of which may make it difficult or impossible to close out a position when desired; the risk that adverse price movements in an instrument can result in a loss substantially greater than the Funds’ initial investment in that
instrument (in some cases, the potential loss is unlimited); and the risk that a counterparty will not perform its obligations. The Credit Opportunities Fund and Low Duration Fund had futures contracts activity during the year ended December
31, 2023. Realized and unrealized
|
55
Muzinich Funds
|
NOTES TO FINANCIAL STATEMENTS December 31, 2023 (Continued)
|
|
gains and losses are included in the Statements of Operations. The Flexible U.S. High Yield Income Fund did not have futures contracts activity during the year ended December 31, 2023.
|
||
|
D.
|
Forward Foreign Currency Exchange Contracts. During the year ended December 31, 2023, the Credit Opportunities Fund and Low Duration Fund entered into transactions to
purchase or sell foreign currencies to protect the U.S. dollar value of the underlying non-U.S. portfolio securities against the effect of possible adverse movements in foreign exchange rates. When entering into a forward foreign currency
exchange contract, the Funds agree to receive or deliver a fixed quantity of foreign currency for an agreed-upon price on an agreed future date. The unrealized gain or loss on the contracts and the forward rates at the reporting date is
included in the Statements of Assets and Liabilities. Realized and unrealized gains and losses are included in the Statements of Operations. The Flexible U.S. High Yield Income Fund did not have forward foreign currency exchange contract
activity during the year ended December 31, 2023.
|
|
|
E.
|
Foreign Currency. Foreign currency amounts, other than the cost of investments, are translated into U.S. dollar values based upon the spot exchange rate prior to the
close of regular trading. The cost of investments is translated at the rates of exchange prevailing on the dates the portfolio securities were acquired. The Funds include foreign exchange gains and losses from interest receivable and other
foreign currency denominated payables and receivables in “Change in net unrealized appreciation/depreciation on foreign currency translation” and “Net realized gain (loss) on foreign currency.” The Funds do not isolate that portion of
realized and unrealized gain (loss) on investments resulting from changes in foreign exchange rates on investments from fluctuations arising from changes in the market price of securities for financial reporting purposes. Fluctuations in
foreign exchange rates on investments are thus included in “Change in net unrealized appreciation/depreciation on investments” and “Net realized gain (loss) on investments” as shown in the Statements of Operations.
|
|
|
F.
|
Federal Income Taxes. Each Fund has elected to be taxed as a “regulated investment company” and intends to distribute substantially all taxable income to its
shareholders and otherwise comply with the provisions of the Internal Revenue Code applicable to regulated investment companies. Therefore, no provision for federal income taxes or excise taxes has been made.
|
|
|
In order to avoid imposition of the excise tax applicable to regulated investment companies, each Fund intends to declare each year as dividends in each calendar year at least 98.0% of its net investment income
(earned during the calendar year) and at least 98.2% of its net realized capital gains (earned during the twelve months ended October 31) plus undistributed amounts, if any, from prior years.
|
||
|
Net capital losses incurred after October 31, and within the taxable year, are deemed to arise on the first business day of each Fund’s next taxable year.
|
||
|
As of December 31, 2023, the Credit Opportunities Fund, Flexible U.S. High Yield Income Fund, and Low Duration Fund, did not defer any post-October losses as of December 31, 2023.
|
||
|
As of December 31, 2023, the Funds had the following capital loss carryovers, which do not expire and retain their original character.
|
|
Credit Opportunities Fund
|
Flexible U.S. High Yield Income Fund
|
Low Duration Fund
|
|||||||||||||
|
Short-Term Capital Loss Carryovers
|
$
|
23,526,074
|
$
|
1,140,618
|
$
|
18,172,752
|
|||||||||
|
Long-Term Capital Loss Carryovers
|
9,549,093
|
2,238,817
|
31,125,044
|
||||||||||||
|
Total
|
$
|
33,075,167
|
$
|
3,379,435
|
$
|
49,297,796
|
|||||||||
|
As of December 31, 2023, the Funds did not have any tax positions that did not meet the “more likely-than-not” threshold of being sustained by the applicable tax authority. Generally, tax authorities can
examine all the tax returns filed for the last three years. The Funds identify their major tax jurisdictions as U.S. Federal and the Commonwealth of Massachusetts; however, the Funds are not aware of any tax positions for which it is
reasonably possible that the total amounts of unrecognized tax benefits will change materially.
|
||
|
G.
|
Securities Transactions and Investment Income. Investment securities transactions are accounted for on the trade date. Gains and losses realized on sales of securities
are determined on a specific identification basis. Discounts/premiums on debt securities purchased are accreted/amortized over the life of the respective securities using the effective interest method. Dividend income is recorded on the
ex-dividend date. Interest income is recorded on an accrual basis. Other non-cash dividends are recognized as investment income at the fair value of the property received. Withholding taxes on foreign dividends and interest have been provided
for in accordance with the Trust’s understanding of the applicable country’s tax rules and rates.
|
56
Muzinich Funds
|
NOTES TO FINANCIAL STATEMENTS December 31, 2023 (Continued)
|
|
H.
|
Distributions to Shareholders. Distributions to shareholders from net investment income for the Credit Opportunities Fund normally are declared and paid on a quarterly
basis. Distributions to shareholders from net investment income for the Flexible U.S. High Yield Income Fund, and Low Duration Fund normally are declared and paid on a monthly basis. Distributions are recorded on the ex-dividend date.
Distributions to shareholders from net realized gains for the Funds normally are declared and paid on an annual basis, if applicable.
|
|
|
I.
|
Use of Estimates. The preparation of financial statements in conformity with U.S. GAAP requires management to make estimates and assumptions that affect the reported
amounts of assets and liabilities at the date of the financial statements and the reported amount of revenue and expenses during the reporting period. Actual results could differ from those estimates.
|
|
|
J.
|
Share Valuation. The net asset value (“NAV”) per share of each Fund is calculated by dividing the sum of the value of the securities held by each Fund, plus cash or
other assets, minus all liabilities (including estimated accrued expenses) by the total number of shares outstanding for each Fund, rounded to the nearest cent. The Funds’ shares will not be priced on the days on which the NYSE is closed for
trading. The offering and redemption price per share for each Fund is equal to each Fund’s net asset value per share. The Funds charge a 1% redemption fee on shares held less than 90 days. The fee is deducted from the redemption proceeds
otherwise payable to the shareholder. The Funds will retain the fee charged as paid-in capital and such fees become part of that Funds’ daily NAV calculation.
|
|
|
K.
|
Guarantees and Indemnifications. In the normal course of business, the Funds enter into contracts with service providers that contain general indemnification clauses.
The Funds’ maximum exposure under these arrangements is unknown as this would involve future claims that may be made against the Funds that have not yet occurred. However, based on experience, the Funds expect the risk of loss to be remote.
|
|
|
L.
|
Illiquid Securities. Pursuant to Rule 22e-4 under the 1940 Act, the Funds have adopted a Board approved liquidity risk management program that requires, among other
things, that the Funds limit their illiquid investments that are assets to no more than 15% of net assets. An illiquid investment is any investment that each Fund reasonably expects cannot be sold or disposed of in current market conditions
in seven calendar days or less without the sale or disposition significantly changing the market value of the investment.
|
|
|
M.
|
Variable and Floating Rate Securities. The Funds may invest in variable and floating rate securities. Fixed income securities that have variable or floating rates of
interest may, under certain limited circumstances, have varying principal amounts. These securities pay interest at rates that are adjusted periodically according to a specified formula, usually with reference to one or more interest rate
indices or market interest rates (the “underlying index”). The interest paid on these securities is a function primarily of the underlying index upon which the interest rate adjustments are based. These adjustments minimize changes in the
market value of the obligation. Similar to fixed rate debt instruments, variable and floating rate instruments are subject to changes in value based on changes in market interest rates or changes in the issuer’s creditworthiness. The rate of
interest on securities may be tied to U.S. Government Securities or indices on those securities as well as any other rate of interest or index.
|
|
|
Variable and floating rate demand notes of corporations are redeemable upon a specified period of notice. These obligations include master demand notes that permit investment of fluctuating amounts at varying
interest rates under direct arrangements with the issuer of the instrument. The issuer of these obligations often has the right, after a given period, to prepay the outstanding principal amount of the obligations upon a specified number of
days’ notice.
|
||
|
Certain securities may have an initial principal amount that varies over time based on an interest rate index, and, accordingly, a Fund might be entitled to less than the initial principal amount of the
security upon the security’s maturity. A Fund intends to purchase these securities only when the Advisor believes the interest income from the instrument justifies any principal risks associated with the instrument. The Advisor may attempt to
limit any potential loss of principal by purchasing similar instruments that are intended to provide an offsetting increase in principal. There can be no assurance that the Advisor will be able to limit the effects of principal fluctuations
and, accordingly, a Fund may incur losses on those securities even if held to maturity without issuer default.
|
||
|
N.
|
When-Issued Securities and Forward Commitments. The Funds may purchase securities offered on a “when-issued” and “forward commitment” basis (including a delayed
delivery basis). Securities purchased on a “when-issued” or “forward commitment basis” are securities not available for immediate delivery despite the fact that a market exists for those securities. A purchase is made on a “delayed delivery”
basis when the transaction is structured to occur sometime in the future.
|
57
Muzinich Funds
|
NOTES TO FINANCIAL STATEMENTS December 31, 2023 (Continued)
|
|
When these transactions are negotiated, the price, which is generally expressed in yield terms, is fixed at the time the commitment is made, but delivery and payment for the securities take place at a later
date. Normally, the settlement date occurs within two months after the transaction, but delayed settlements beyond two months may be negotiated. During the period between a commitment and settlement, no payment is made for the securities
purchased by the purchaser and, thus, no interest accrues to the purchaser from the transaction. At the time a Fund makes the commitment to purchase securities on a when-issued basis or forward commitment, the Fund will record the transaction
as a purchase and thereafter reflect the value each day of such securities in determining its NAV. No when-issued or forward commitments will be made by a Fund if, as a result, more than 5% of the Fund’s total assets would be committed to
such transactions.
|
||
|
O.
|
Deposits at Broker. Deposits at broker represents amounts that are held by third parties under certain of the Funds’ derivative transactions. Such deposits are excluded
from cash and equivalents in the Statements of Assets and Liabilities. Interest income earned on such deposits is recorded in “Other income” on the Statements of Operations, if applicable.
|
|
|
P.
|
Offsetting Agreements. The Funds may be subject to netting arrangements, which govern the terms of certain transactions with counterparties. The arrangements allow the
Funds to close out and net its total exposure to a counterparty in the event of a default with respect to all transactions governed under a single agreement with a counterparty.
|
|
|
The following table presents derivative financial instruments that are subject to enforceable netting arrangements, collateral arrangements or other similar agreements as of December 31, 2023:
|
|
Credit Opportunities Fund
|
||||||||||||||||||||
|
Gross Amounts Offset
|
Net Amounts Presented
|
Cash Collateral
|
||||||||||||||||||
|
in the Statements
|
in the Statements
|
Financial
|
Pledged
|
|||||||||||||||||
|
Description
|
Gross Amounts
|
of Assets and Liabilities
|
of Assets and Liabilities
|
Instruments
|
(Received)
|
Net Amount
|
||||||||||||||
|
Assets
|
||||||||||||||||||||
|
Forward foreign
|
||||||||||||||||||||
|
currency exchange
|
||||||||||||||||||||
|
contracts
|
$
|
65,575
|
$
|
—
|
$
|
65,575
|
$
|
(65,575
|
)
|
$
|
—
|
$
|
—
|
|||||||
|
Liabilities
|
||||||||||||||||||||
|
Forward foreign
|
||||||||||||||||||||
|
currency exchange
|
||||||||||||||||||||
|
contracts
|
1,579,492
|
—
|
1,579,492
|
(65,575
|
)
|
—
|
1,513,917
|
|||||||||||||
|
Low Duration Fund
|
||||||||||||||||||||
|
Gross Amounts Offset
|
Net Amounts Presented
|
Cash Collateral
|
||||||||||||||||||
|
in the Statements
|
in the Statements
|
Financial
|
Pledged
|
|||||||||||||||||
|
Description
|
Gross Amounts
|
of Assets and Liabilities
|
of Assets and Liabilities
|
Instruments
|
(Received)
|
Net Amount
|
||||||||||||||
|
Assets
|
||||||||||||||||||||
|
Forward foreign
|
||||||||||||||||||||
|
currency exchange
|
||||||||||||||||||||
|
contracts
|
$
|
1,385,677
|
$
|
—
|
$
|
1,385,677
|
$
|
(1,385,677
|
)
|
$
|
—
|
$
|
—
|
|||||||
|
Liabilities
|
||||||||||||||||||||
|
Forward foreign
|
||||||||||||||||||||
|
currency exchange
|
||||||||||||||||||||
|
contracts
|
17,974,591
|
—
|
17,974,591
|
(1,385,677
|
)
|
—
|
16,588,914
|
|||||||||||||
|
The above forward foreign currency exchange contracts had Bank of New as their counterparty.
|
||
|
Q.
|
Recently Issued Accounting Pronouncements. In June 2022, the FASB issued Accounting Standards Update 2022-03, which amends Fair Value Measurement (Topic 820): Fair
Value Measurement of Equity Securities Subject to Contractual Sale Restrictions (“ASU 2022-03”). ASU 202203 clarifies guidance for fair value measurement of an equity security subject to a contractual sale restriction and establishes new
disclosure requirements for such equity securities. ASU 2022-03 is effective for fiscal years beginning after December 15, 2023 and for interim periods within those fiscal years, with early adoption permitted. Management is currently
evaluating the impact of these amendments on their financial statements.
|
58
Muzinich Funds
|
NOTES TO FINANCIAL STATEMENTS December 31, 2023 (Continued)
|
|
R.
|
Reclassification of Capital Accounts. U.S. GAAP requires that certain components of net assets relating to permanent differences be reclassified between financial and
tax reporting. These reclassifications have no effect on net assets or net asset value per share. For the year ended December 31, 2023, the following adjustments were made:
|
|
Distributable (Accumulated)
|
||||||||||
|
Earnings (Losses)
|
Paid-In Capital
|
|||||||||
|
Credit Opportunities Fund
|
$
|
—
|
$
|
—
|
||||||
|
U.S. High Yield Fund
|
—
|
—
|
||||||||
|
Low Duration Fund
|
—
|
—
|
||||||||
|
For the year ended December 31, 2023, there were no adjustments made.
|
||
|
S.
|
Subsequent Events. In preparing these financial statements, the Funds have evaluated events and transactions for potential recognition or disclosure through the date
the financial statements were issued. The Funds have determined that there were no subsequent events that would need to be disclosed in the Funds’ financial statements.
|
|
NOTE 3 – COMMITMENTS AND OTHER RELATED PARTY TRANSACTIONS
|
Muzinich & Co., Inc. (the “Advisor”) provides the Funds with investment management services under an Investment Advisory Agreement (the “Advisory Agreement”). Under the
Advisory Agreement, the Advisor furnishes all investment advice, office space, facilities, and most of the personnel needed by each Fund. As compensation for its services, the Advisor is entitled to receive a monthly fee. For the Credit Opportunities
Fund, the Advisor is entitled to a monthly fee at the annual rate of 0.60% based upon the average daily net assets of the Fund. For the Flexible U.S. High Yield Income Fund, the Advisor is entitled to a monthly fee at the annual rate of 0.55% based
upon the average daily net assets of the Fund. For the Low Duration Fund, the Advisor is entitled to a monthly fee at the annual rate of 0.45% based upon the average daily net assets of the Fund. The investment advisory fees incurred by the Funds for
the year ended December 31, 2023, are disclosed in the Statements of Operations. The investment advisory fees incurred are paid monthly to the Advisor, net of any monthly waiver or reimbursement discussed below.
The Advisor has contractually agreed to waive its fees and reimburse certain expenses (excluding taxes, interest expenses, interest on short positions, portfolio transaction
expenses, acquired fund fees and expenses, extraordinary expenses, Rule 12b-1 fees, shareholder servicing fees and any other class specific expenses) to limit total expenses to 0.60%, 0.58%, and 0.50% of the Credit Opportunities Fund’s, Flexible U.S.
High Yield Income Fund’s, and Low Duration Fund’s average daily net assets, respectively. The Operating Expenses Limitation Agreements have an indefinite term and may be terminated at any time, and without payment of any penalty, by the Board, on
behalf of the Funds, upon sixty (60) days’ written notice to the Advisor. Any fees waived and/or Fund expenses absorbed by the Advisor pursuant to an agreed-upon expense cap shall be reimbursed by the Funds to the Advisor, if so requested by the
Advisor, any time before the end of the third year following the fee waiver and/or expense absorption, provided the aggregate amount of the Funds’ current operating expenses for such year does not exceed the lesser expense cap in place at the time of
waiver or at the time of reimbursement. The Funds must pay their current ordinary operating expenses before the Advisor is entitled to any reimbursement of fees and/or expenses. Any such reimbursement is also contingent upon the Board’s review and
approval. The amounts of fees waived and expenses absorbed by the Advisor during the year ended December 31, 2023, are disclosed in the Statements of Operations. Any amount due from the Advisor is paid monthly to the Funds, if applicable.
As of December 31, 2023, the remaining cumulative amounts that may be recouped by the Advisor on behalf of the Funds are shown in the following tables. The Advisor may recapture a
portion of the unreimbursed amounts no later than the dates as stated.
|
Expiration
|
Credit Opportunities Fund
|
Flexible U.S. High Yield Income Fund
|
Low Duration Fund
|
||||||||||||
|
December 31, 2024
|
$
|
759,811
|
$
|
221,222
|
$
|
453,932
|
|||||||||
|
December 31, 2025
|
666,995
|
233,047
|
596,208
|
||||||||||||
|
December 31, 2026
|
486,807
|
247,658
|
838,624
|
||||||||||||
|
Total
|
$
|
1,913,613
|
$
|
701,927
|
$
|
1,888,764
|
|||||||||
U.S. Bancorp Fund Services, LLC, doing business as U.S. Bank Global Fund Services (“Fund Services”), acts as the Funds’ administrator, fund accountant and transfer agent. In those
capacities Fund Services maintains the Funds’ books and records, calculates the Funds’ NAV, prepares various federal and state regulatory filings, coordinates the payment of fund expenses, reviews expense accruals and prepares materials supplied to
the Board. The officers of the Trust and the Chief Compliance Officer are also employees of Fund Services. Fees paid by the Funds to Fund Services for these services for the year ended December 31, 2023, are disclosed in the Statements of Operations.
59
Muzinich Funds
|
NOTES TO FINANCIAL STATEMENTS December 31, 2023 (Continued)
|
The Distributor acts as the Funds’ principal underwriter in a continuous public offering of the Funds’ shares. U.S. Bank N.A. serves as custodian to the Funds. U.S. Bank N.A. is
an affiliate of Fund Services.
The Funds have adopted a Distribution Plan in accordance with Rule 12b-1 under the 1940 Act with respect to Class A shares. The Distribution Plan provides that each Fund may pay a
fee to the Distributor, at an annual rate of up to 0.25% of the average daily net assets of Class A shares. No distribution fees are paid by Supra Institutional or Institutional Class shares. These fees may be used by the Distributor to provide
compensation for sales support, distribution activities, or shareholder servicing activities. As of December 31, 2023, Class A shares are not offered for the Flexible U.S. High Yield Income Fund and Low Duration Fund.
Pursuant to a Shareholder Service Plan adopted by the Trust and established by the Funds with respect to the Class A shares and Institutional Class shares of the Funds, the
Advisor is authorized to provide, or arrange for others to provide, personal shareholder services relating to the servicing and maintenance of shareholder accounts not otherwise provided to the Funds (“Shareholder Servicing Activities”). Under the
Shareholder Service Plan, the Advisor may enter into shareholder service agreements with securities broker- dealers and other securities professionals who provide Shareholder Servicing Activities for their clients invested in the Funds. The
shareholder servicing fees incurred by the Funds for the year ended December 31, 2023, are disclosed in the Statements of Operations. As of December 31, 2023, Class A shares are not offered for the Flexible U.S. High Yield Income Fund, and Low
Duration Fund.
|
NOTE 4 – PURCHASES AND SALES OF SECURITIES
|
For the year ended December 31, 2023, the cost of purchases and proceeds from the sales and maturities of securities, excluding short-term investments, were as follows:
|
Purchases
|
Sales/Maturities
|
||||||||
|
Credit Opportunities Fund
|
$
|
365,611,969
|
$
|
405,168,935
|
|||||
|
Flexible U.S. High Yield Income Fund
|
39,315,421
|
26,674,266
|
|||||||
|
Low Duration Fund
|
530,869,323
|
466,445,112
|
|||||||
For the year ended December 31, 2023, the cost of purchases and proceeds from the sales and maturities of long-term U.S. Government obligations included in the above, were as
follows:
|
Purchases
|
Sales/Maturities
|
||||||||
|
Credit Opportunities Fund
|
$
|
136,520,622
|
$
|
152,816,600
|
|||||
There were no purchases or sales/maturities of long-term U.S. Government securities for the Flexible U.S. High Yield Income Fund, and Low Duration Fund during the year ended
December 31, 2023.
|
NOTE 5 – DISTRIBUTIONS TO SHAREHOLDERS
|
The tax character of distributions paid during the year ended December 31, 2023, and the year ended December 31, 2022, was as follows:
|
Ordinary Income
|
|||||||||
|
December 31, 2023
|
December 31, 2022
|
||||||||
|
Credit Opportunities Fund
|
$
|
11,151,062
|
$
|
2,492,808
|
|||||
|
Flexible U.S. High Yield Income Fund
|
2,400,350
|
1,594,661
|
|||||||
|
Low Duration Fund
|
48,879,002
|
15,860,634
|
|||||||
|
Long-Term Capital Gains1
|
|||||||||
|
December 31, 2023
|
December 31, 2022
|
||||||||
|
Credit Opportunities Fund
|
$
|
—
|
$
|
1,696,500
|
|||||
|
Flexible U.S. High Yield Income Fund
|
—
|
26,796
|
|||||||
|
Low Duration Fund
|
—
|
14,601,590
|
|||||||
|
1
|
Designated as long-term capital gain dividend, pursuant to Internal Revenue Code Section 852(b)(3).
|
The Funds also designate as distributions of long-term gains, to the extent necessary to fully distribute such capital gains, earnings and profits distributed to shareholders on
the redemption of shares.
60
Muzinich Funds
|
NOTES TO FINANCIAL STATEMENTS December 31, 2023 (Continued)
|
The cost basis of investments for federal income tax purposes as of the most recent fiscal year ended December 31, 2023, was as follows:
|
Credit
|
Flexible U.S.
|
||||||||||||
|
Opportunities
|
High Yield
|
Low
|
|||||||||||
|
Fund
|
Income Fund
|
Duration Fund
|
|||||||||||
|
Cost of Investments
|
$
|
260,285,114
|
$
|
49,387,231
|
$
|
971,842,289
|
|||||||
|
Gross tax unrealized appreciation
|
9,904,838
|
982,072
|
33,637,648
|
||||||||||
|
Gross tax unrealized depreciation
|
(3,975,109
|
)
|
(681,741
|
)
|
(14,093,908
|
)
|
|||||||
|
Net tax unrealized appreciation (depreciation)
|
5,929,729
|
300,331
|
19,543,740
|
||||||||||
|
Undistributed ordinary income (loss)
|
1,989,759
|
18,946
|
1,105,814
|
||||||||||
|
Undistributed long-term capital gains (losses)
|
—
|
—
|
—
|
||||||||||
|
Total distributable earnings
|
1,989,759
|
18,946
|
1,105,814
|
||||||||||
|
Other distributable (accumulated) gains (losses)
|
(33,050,754
|
)
|
(3,379,370
|
)
|
(48,877,215
|
)
|
|||||||
|
Total distributable (accumulated) earnings (losses)
|
$
|
(25,131,266
|
)
|
$
|
(3,060,093
|
)
|
$
|
(28,227,661
|
)
|
||||
|
NOTE 6 – CREDIT FACILITY
|
U.S. Bank N.A. has made available to the Credit Opportunities Fund, Flexible U.S. High Yield Income Fund, and Low Duration Fund credit facilities pursuant to a separate Loan and
Security Agreement for temporary or extraordinary purposes. Credit facility details for the year ended December 31, 2023, are as follows:
|
Credit Opportunities Fund
|
|||||
|
Maximum available credit
|
$
|
15,000,000
|
|||
|
Largest amount outstanding on an individual day
|
—
|
||||
|
Average daily loan outstanding when in use
|
—
|
||||
|
Credit facility outstanding as of December 31, 2023
|
—
|
||||
|
Average interest rate when in use
|
0.00
|
%
|
|||
|
Flexible U.S. High Yield Income Fund
|
|||||
|
Maximum available credit
|
$
|
4,000,000
|
|||
|
Largest amount outstanding on an individual day
|
—
|
||||
|
Average daily loan outstanding when in use
|
—
|
||||
|
Credit facility outstanding as of December 31, 2023
|
—
|
||||
|
Average interest rate when in use
|
0.00
|
%
|
|||
|
Low Duration Fund
|
|||||
|
Maximum available credit
|
$
|
75,000,000
|
|||
|
Largest amount outstanding on an individual day
|
10,657,000
|
||||
|
Average daily loan outstanding when in use
|
1,699,933
|
||||
|
Credit facility outstanding as of December 31, 2023
|
—
|
||||
|
Average interest rate when in use
|
8.30
|
%
|
|||
Interest expense for the year ended December 31, 2023, is disclosed in the Statements of Operations, if applicable.
|
NOTE 7 – RISKS ASSOCIATED WITH THE DISCONTINUATION OF THE LONDON INTERBANK OFFERED RATE (“LIBOR”)
|
Several of the Funds invest in corporate bonds that have interest rate provisions linked to LIBOR. LIBOR is used extensively in the U.S. and globally as a “benchmark” or
“reference rate” for such loans. It is expected that a number of private-sector banks currently reporting information used to set LIBOR will stop doing so after 2021 when their current reporting commitment ends, which could either cause LIBOR to stop
publication immediately or cause LIBOR’s regulator to determine that its quality has degraded to the degree that it is no longer representative of its underlying market. The expected discontinuation of LIBOR may impact the functioning, liquidity, and
value of these.
61
Muzinich Funds
|
REPORT OF INDEPENDENT REGISTERED PUBLIC ACCOUNTING FIRM
|
To the Shareholders of Muzinich Funds and
The Board of Trustees of Professionally Managed Portfolios
Opinion on the Financial Statements
We have audited the accompanying statement of assets and liabilities of Muzinich Credit Opportunities Fund, Muzinich Flexible U.S. High Yield Income Fund, and Muzinich Low Duration Fund
(collectively, the “Funds”), each a series of Professionally Managed Portfolios, including the schedule of investments, as of December 31, 2023, the related statement of operations for the year then ended, the statements of changes in net assets for
each of the two years in the period then ended, the financial highlights for each of the five years in the period then ended, and the related notes (collectively referred to as the “financial statements”). In our opinion, the financial statements
present fairly, in all material respects, the financial position of the Funds as of December 31, 2023, the results of their operations for the year then ended, the changes in their net assets for each of the two years in the period then ended, and
financial highlights for each of the five years in the period then ended, in conformity with accounting principles generally accepted in the United States of America.
Basis for Opinion
These financial statements are the responsibility of the Funds’ management. Our responsibility is to express an opinion on the Funds’ financial statements based on our audits. We are a public
accounting firm registered with the Public Company Accounting Oversight Board (United States) (“PCAOB”) and are required to be independent with respect to the Funds in accordance with the U.S. federal securities laws and the applicable rules and
regulations of the Securities and Exchange Commission and the PCAOB. We have served as the auditor of one or more of the funds in the Trust since 1995.
We conducted our audits in accordance with the standards of the PCAOB. Those standards require that we plan and perform the audit to obtain reasonable assurance about whether the financial
statements are free of material misstatement, whether due to error or fraud. The Funds are not required to have, nor were we engaged to perform, an audit of its internal control over financial reporting. As part of our audits, we are required to
obtain an understanding of internal control over financial reporting, but not for the purpose of expressing an opinion on the effectiveness of the Funds’ internal control over financial reporting. Accordingly, we express no such opinion.
Our audits included performing procedures to assess the risks of material misstatement of the financial statements, whether due to error or fraud, and performing procedures that respond to those
risks. Such procedures included examining, on a test basis, evidence regarding the amounts and disclosures in the financial statements. Our audits also included evaluating the accounting principles used and significant estimates made by management,
as well as evaluating the overall presentation of the financial statements. Our procedures included confirmation of securities owned as of December 31, 2023 by correspondence with the custodian and brokers or through other appropriate auditing
procedures where replies from brokers were unable to be obtained. We believe that our audits provide a reasonable basis for our opinion.
 |
|
|
TAIT, WELLER & BAKER LLP
|
Philadelphia, Pennsylvania
February 29, 2024
62
Muzinich Funds
|
EXPENSE EXAMPLES For the Six Months Ended December 31, 2023 (Unaudited)
|
As a shareholder of the Funds, you incur two types of costs: (1) transaction costs and (2) ongoing costs, including investment advisory fees, service fees, and other Fund
expenses. These examples are intended to help you understand your ongoing costs (in dollars) of investing in the Funds and to compare these costs with the ongoing costs of investing in other mutual funds. These examples are based on an investment
of $1,000 invested at the beginning of the period and held for the entire period (July 1, 2023 – December 31, 2023).
Actual Expenses
The “Actual” lines for each respective class of the following tables provide information about actual account values based on actual returns and actual expenses. You will be
assessed fees for outgoing wire transfers, returned checks and stop payment orders at prevailing rates charged by Fund Services, the Funds’ transfer agent. If you request that a redemption be made by wire transfer, Fund Services currently charges a
$15.00 fee. The Funds charge a redemption fee equal to 1.00% of the net amount of the redemption if you redeem shares within 90 calendar days after you purchase them. To the extent the Funds invest in shares of other investment companies as part of
their strategies, you will indirectly bear your proportionate share of any fees and expenses charged by the underlying funds in which the Funds invest in addition to the expenses of the Funds. Actual expenses of the underlying funds may vary. These
expenses are not included in the following examples.
The following examples include, but are not limited to, investment advisory fees, shareholder servicing fees, fund accounting fees, fund administration fees, custody fees, and
transfer agent fees. However, the following examples do not include portfolio trading commissions and related expenses. You may use the information in this line, together with the amount you invested, to estimate the expenses that you paid over the
period. Simply divide your account value by $1,000 (for example, an $8,600 account value divided by $1,000 = 8.6), then multiply the result by the number in the first line under the heading titled “Expenses Paid During the Period” to estimate the
expenses you paid on your account during this period.
Hypothetical Example for Comparison Purposes
The “Hypothetical” line for each respective class of the following tables provides information about hypothetical account values and hypothetical expenses based on the Funds’
actual expense ratios and an assumed rate of return of 5% per year before expenses, which is not the Funds’ actual return. The hypothetical account values and expenses may not be used to estimate the actual ending account balance or expenses you
paid for the period. You may use this information to compare the ongoing costs of investing in the Funds and other funds. To do so, compare this 5% hypothetical example with the 5% hypothetical examples that appear in the shareholder reports of the
other funds. Please note that the expenses shown in the tables are meant to highlight your ongoing costs only and do not reflect any transactional costs, such as redemption fees. Therefore, each hypothetical line of the tables is useful in
comparing ongoing costs only and will not help you determine the relative total costs of owning different funds. In addition, if these transactional costs were included, your costs would have been higher.
Credit Opportunities Fund
|
Beginning
|
Ending
|
Expenses Paid
|
|
|
Account Value
|
Account Value
|
During the Period
|
|
|
7/1/2023
|
12/31/2023
|
7/1/2023 – 12/31/2023 1
|
|
|
Supra Institutional Class Actual
|
$1,000.00
|
$1,051.40
|
$3.12
|
|
Hypothetical (5% annual return before taxes)
|
$1,000.00
|
$1,022.17
|
$3.07
|
|
Beginning
|
Ending
|
Expenses Paid
|
|
|
Account Value
|
Account Value
|
During the Period
|
|
|
7/1/2023
|
12/31/2023
|
7/1/2023 – 12/31/2023 1
|
|
|
Institutional Class Actual
|
$1,000.00
|
$1,051.40
|
$3.50
|
|
Hypothetical (5% annual return before taxes)
|
$1,000.00
|
$1,021.79
|
$3.45
|
|
1
|
Expenses are equal to the annualized net expense ratio for the most recent six-month period. The annualized six-month expense ratios for Supra Institutional Class and Institutional Class shares were 0.60% and
0.67% (reflecting fee waivers in effect), respectively, multiplied by the average account value over the period multiplied by 184/365 (to reflect the one half-year period).
|
63
Muzinich Funds
|
EXPENSE EXAMPLES For the Six Months Ended December 31, 2023 (Unaudited) (Continued)
|
|
Flexible U.S. High Yield Income Fund
|
|||
|
Beginning
|
Ending
|
Expenses Paid
|
|
|
Account Value
|
Account Value
|
During the Period
|
|
|
7/1/2023
|
12/31/2023
|
7/1/2023 – 12/31/2023 2
|
|
|
Supra Institutional Class Actual
|
$1,000.00
|
$1,052.40
|
$3.00
|
|
Hypothetical (5% annual return before taxes)
|
$1,000.00
|
$1,022.28
|
$2.96
|
|
Beginning
|
Ending
|
Expenses Paid
|
|
|
Account Value
|
Account Value
|
During the Period
|
|
|
7/1/2023
|
12/31/2023
|
7/1/2023 – 12/31/2023 2
|
|
|
Institutional Class Actual
|
$1,000.00
|
$1,052.40
|
$2.98
|
|
Hypothetical (5% annual return before taxes)
|
$1,000.00
|
$1,022.30
|
$2.94
|
|
Low Duration Fund
|
|||
|
Beginning
|
Ending
|
Expenses Paid
|
|
|
Account Value
|
Account Value
|
During the Period
|
|
|
7/1/2023
|
12/31/2023
|
7/1/2023 – 12/31/2023 3
|
|
|
Supra Institutional Class Actual
|
$1,000.00
|
$1,049.40
|
$2.60
|
|
Hypothetical (5% annual return before taxes)
|
$1,000.00
|
$1,022.67
|
$2.56
|
|
2
|
Expenses are equal to the annualized net expense ratio for the most recent six-month period. The annualized six-month expense ratios for Supra Institutional Class and Institutional Class shares were 0.58% and
0.58% (reflecting fee waivers in effect), respectively, multiplied by the average account value over the period multiplied by 184/365 (to reflect the one half-year period).
|
|
3
|
Expenses are equal to the annualized net expense ratio for the most recent six-month period. The annualized six-month expense ratios for Supra Institutional Class shares were 0.50% (reflecting fee waivers in
effect), multiplied by the average account value over the period multiplied by 184/365 (to reflect the one half-year period).
|
64
Muzinich Funds
|
APPROVAL OF INVESTMENT ADVISORY AGREEMENT (Unaudited)
|
MUZINICH CREDIT OPPORTUNITIES FUND
MUZINICH U.S. HIGH YIELD CREDIT FUND
MUZINICH LOW DURATION FUND
At a meeting held on August 17-18, 2023, the Board (which is comprised of five persons, all of whom are Independent Trustees as defined under the Investment Company Act)
considered and approved the continuance of the Investment Advisory Agreement (the “Advisory Agreement”) between Professionally Managed Portfolios (the “Trust”) and Muzinich and Co., Inc. (the “Advisor”) for each of the Muzinich Credit Opportunities
Fund, the Muzinich U.S. High Yield Credit Fund and the Muzinich Low Duration Fund (each a “Fund,” and together, the “Funds”). At this meeting and at a prior meeting held on June 26, 2023, the Board received and reviewed substantial information
regarding the Funds, the Advisor and the services provided by the Advisor to the Funds under the Advisory Agreement. This information, together with the information provided to the Board throughout the course of the year, formed the primary (but not
exclusive) basis for the Board’s determinations. Below is a summary of the factors considered by the Board and the conclusions that formed the basis for the Board’s approval of the continuance of the Advisory Agreement:
|
1.
|
The nature, extent and quality of the services provided and to be provided by the Advisor under the Advisory Agreement. The Trustees considered the nature, extent and
quality of the Advisor’s overall services provided to the Funds as well as its specific responsibilities in all aspects of day-to-day investment management of the Funds. The Board considered the qualifications, experience and responsibilities
of the portfolio managers, as well as the responsibilities of other key personnel of the Advisor involved in the day-to-day activities of the Funds. The Board also considered the resources and compliance structure of the Advisor, including
information regarding its compliance program, its chief compliance officer and the Advisor’s compliance record, as well as the Advisor’s cybersecurity program, business continuity plan, and risk management process. The Board also considered
the prior relationship between the Advisor and the Trust, as well as the Board’s knowledge of the Advisor’s operations, and noted that during the course of the prior year they had met with certain personnel of the Advisor to discuss fund
performance and investment outlook, as well as, various marketing and compliance topics. The Board concluded that the Advisor had the quality and depth of personnel, resources, investment processes and compliance policies and procedures
essential to performing its duties under the Advisory Agreement and that they were satisfied with the nature, overall quality and extent of such management services.
|
|
|
2.
|
The Funds’ historical performance and the overall performance of the Advisor. In assessing the quality of the portfolio management delivered by the Advisor, the Board
reviewed the performance of each Fund on both an absolute basis, and in comparison to its peer funds utilizing Morningstar classifications, appropriate securities market benchmarks and the Advisor’s similarly managed accounts, all for periods
ended March 31, 2023. The Board also considered performance against a smaller group of peers selected by an independent third-party consultant engaged by the Board to assist it in its 15(c) review (the “Cohort”). While the Board considered
both short-term and long-term performance, it placed greater emphasis on longer term performance. When reviewing each Fund’s performance against its comparative peer group universe, the Board took into account that the investment objective
and strategies of each Fund, as well as its level of risk tolerance, may differ significantly from funds in its respective peer universe. When reviewing the Funds’ performance against broad market benchmarks, the Board took into account the
differences in portfolio construction between the Funds and such benchmarks as well as other differences between actively managed funds and passive benchmarks, such as objectives and risks. In assessing periods of relative underperformance or
outperformance, the Board took into account that relative performance can be significantly impacted by performance measurement periods and that some periods of underperformance may be transitory in nature while others may reflect more
significant underlying issues.
|
|
|
For the Muzinich Credit Opportunities Fund, the Board noted that the Fund outperformed its Morningstar peer group average for the one- and five-year periods and underperformed for the three-year period. The
Board also noted that the Fund outperformed the average of its Cohort for the one-year period and underperformed for the three- and five-year periods. The Board also considered the outperformance of the Fund against its broad-based securities
market benchmark for the one-year, three-year, and five-year periods. The Board noted the Fund’s underperformance compared to the Advisor’s similarly managed account composite for the one-, three-, and five-year periods, noting that the
difference was not significant.
|
||
|
For the Muzinich U.S. High Yield Credit Fund, the Board noted the Fund underperformed its Morningstar peer group average for the one- and three-year periods and outperformed for the five-year period. The Board
also noted that the Fund underperformed the average of its Cohort for the one-, three- and five-year periods. The Board noted that the Fund underperformed its broad-based securities market benchmark for the one-year, three-year and five-year
periods. The Board also noted the Fund’s underperformance compared to the Advisor’s similarly managed account composite for the one-year, three-year and five-year periods, noting that such differences were not significant.
|
65
Muzinich Funds
|
APPROVAL OF INVESTMENT ADVISORY AGREEMENT (Unaudited) (Continued)
|
|
For the Muzinich Low Duration Fund, the Board noted the Fund outperformed its Morningstar peer group average for the one-, three-, and five-year periods. The Board also noted that the Fund outperformed the
average of its Cohort for the one-, three-, and five-year periods. The Board noted that the Fund outperformed its broad-based securities market benchmark for the one-year, three-year and five-year periods. The Board also noted the Fund’s
outperformance compared to the Advisor’s similarly managed account composite for the one-year, three-year and five-year periods, noting that such differences were not significant.
|
||
|
3.
|
The costs of the services provided by the Advisor and the structure of the Advisor’s fees under the Advisory Agreement. In considering the advisory fee and total fees
and expenses of each Fund, the Board reviewed comparisons to the peer funds and similarly managed accounts for other types of clients advised by the Advisor, as well as all expense waivers and reimbursements. When reviewing fees charged to
other similarly managed accounts, the Board took into account the type of account and the differences in the management of that account that might be germane to the difference, if any, in the fees charged to such accounts.
|
|
|
For the Muzinich Credit Opportunities Fund, the Board noted that the Advisor had contractually agreed to maintain an annual expense ratio of 0.60% for the Fund excluding certain operating expenses and
class-level expenses (the “Expense Cap”). The Board noted that the Fund’s net expense ratio (less Rule 12b-1 fees) was below its peer group average. The Board noted that the Fund’s advisory fee was above its Cohort median and average and its
net expense ratio (less Rule 12b-1 fees) was at the Cohort median and above the average. The Board considered that the fees charged to similarly managed separate account clients and a UCITs fund were higher or lower than those charged to the
Muzinich Credit Opportunities Fund and that there were a number of factors accounting for those differences. The Board concluded that the fees paid to the Advisor were fair and reasonable in light of the comparative performance and advisory
fee information.
|
||
|
For the Muzinich U.S. High Yield Credit Fund, the Board noted that the Advisor had contractually agreed to maintain an annual expense ratio of 0.58% for the Fund excluding certain operating expenses and
class-level expenses (the “Expense Cap”). The Trustees also noted that the Fund’s net expense ratio was lower than the average of its peer group. The Board noted that the Fund’s advisory fee and net expense ratio (less Rule 12b-1 fees) were
lower than the median and average of its Cohort. The Board considered that the fees charged to similarly managed separate account clients and a UCITs fund were higher or lower than those charged to the Muzinich U.S. High Yield Credit Fund
and that there were a number of factors accounting for those differences. The Board concluded that the fees paid to the Advisor were fair and reasonable in light of the comparative performance and advisory fee information.
|
||
|
For the Muzinich Low Duration Fund, the Board noted that the Advisor had contractually agreed to maintain an annual expense ratio of 0.50% for the Fund excluding certain operating expenses and class-level
expenses (the “Expense Cap”). The Trustees also noted that the Fund’s net expense ratio (less Rule 12b-1 fees) was lower than its peer group average. The Board noted that the Fund’s advisory fee and net expense (less Rule 12b-1 fees) were
lower than the median and average of its Cohort. The Board considered that the fees charged to similarly managed separate account clients and a UCITs fund were higher or lower than those charged to the Muzinich Low Duration Fund and that
there were a number of factors accounting for those differences. The Board concluded that the fees paid to the Advisor were fair and reasonable.
|
||
|
4.
|
Economies of Scale. The Board also considered whether economies of scale were being realized by the Advisor that should be shared with shareholders. The Board noted that
the Advisor has contractually agreed to reduce its advisory fees or reimburse Fund expenses so that each Fund does not exceed its specified Expense Cap. The Board noted that at current asset levels, it did not appear that there were
additional significant economies of scale being realized by the Advisor that should be shared with shareholders and concluded that it would continue to monitor economies of scale in the future as circumstances changed and assuming asset
levels continued to increase.
|
|
|
5.
|
The profits to be realized by the Advisor and its affiliates from their relationship with the Funds. The Board reviewed the Advisor’s financial information and took
into account both the direct benefits and the indirect benefits to the Advisor from advising the Funds. The Board considered the profitability to the Advisor from its relationship with the Funds and considered any additional material benefits
derived by the Advisor from its relationship with the Funds, including Rule 12b-1 distribution fees for Class A Shares (which are not currently offered for any of the Funds) and particularly benefits to be received in exchange for shareholder
servicing fees on Class A and Institutional Class shares paid to the Advisor. After such review, the Board determined that the profitability to the Advisor with respect to the Advisory Agreement was not excessive, and that the Advisor had
maintained adequate financial resources to support the services it provides to the Funds.
|
66
Muzinich Funds
|
APPROVAL OF INVESTMENT ADVISORY AGREEMENT (Unaudited) (Continued)
|
No single factor was determinative of the Board’s decision to approve the continuance of the Advisory Agreement, but rather the Board based its determination on the total
combination of information available to them. Based on a consideration of all the factors in their totality, the Board determined that the advisory arrangements with the Advisor, including the advisory fee, were fair and reasonable. The Board
therefore determined that the continuance of the Advisory Agreement would be in the best interests of the Funds and their shareholders.
67
Muzinich Funds
|
TRUSTEES AND EXECUTIVE OFFICERS (Unaudited)
|
The Board is responsible for the overall management of the Trust, including general supervision and review of the investment activities of the Funds. The Board, in turn, elects
the officers of the Trust, who are responsible for administering the day-to-day operations of the Trust and its separate series. The current trustees and officers of the Trust, their year of birth, positions with the Trust, terms of office with the
Trust and length of time served, their principal occupations for the past five years and other directorships are set forth in the table below.
|
Number of
|
|||||
|
Portfolios
|
|||||
|
in Fund
|
Other
|
||||
|
Position
|
Term of Office2
|
Complex3
|
Directorships
|
||
|
Name, Address
|
with the
|
and Length of
|
Principal Occupation
|
Overseen
|
Held During
|
|
And Age
|
Trust1
|
Time Served
|
During Past Five Years
|
by Trustees
|
the Past 5 Years
|
|
Independent Trustees of the Trust
|
|||||
|
Kathleen T. Barr
|
Trustee
|
Indefinite Term;
|
Retired; Chair of the Governing
|
3
|
Independent Director,
|
|
(born 1955)
|
Since
|
Council, Independent Directors
|
Muzinich BDC, Inc.
|
||
|
c/o U.S. Bank
|
November 2018.
|
Council (since 2020); formerly,
|
(2019 to present);
|
||
|
Global Fund Services
|
President, owner of a registered
|
Independent Trustee
|
|||
|
615 E. Michigan Street
|
Chairperson
|
Indefinite Term;
|
investment adviser, Productive Capital
|
for the William Blair
|
|
|
Milwaukee, WI 53202
|
Since
|
Management, Inc. (2010 to 2013);
|
Funds (2013 to
|
||
|
February 2023.
|
formerly, Chief Administrative Officer,
|
present) (18 series).
|
|||
|
Senior Vice President and Senior
|
|||||
|
Managing Director of Allegiant Asset
|
|||||
|
Management Company (merged with
|
|||||
|
PNC Capital Advisors, LLC in 2009);
|
|||||
|
formerly, Chief Administrative Officer,
|
|||||
|
Chief Compliance Officer and
|
|||||
|
Senior Vice President of PNC Funds
|
|||||
|
and PNC Advantage Funds
|
|||||
|
(f/k/a Allegiant Funds) (registered
|
|||||
|
investment companies).
|
|||||
|
Eric W. Falkeis
|
Trustee
|
Indefinite Term;
|
Chief Growth Officer, Tidal Financial
|
3
|
Interested Trustee,
|
|
(born 1973)
|
Since
|
Group (2022 to present); Chief
|
Tidal ETF Trust II
|
||
|
c/o U.S. Bank
|
September 2011.
|
Executive Officer, Tidal ETF
|
(2022 to present)
|
||
|
Global Fund Services
|
Services LLC (2018 to present);
|
(7 series);
|
|||
|
615 E. Michigan Street
|
formerly, Chief Operating Officer,
|
Independent Director,
|
|||
|
Milwaukee, WI 53202
|
Direxion Funds (2013 to 2018);
|
Muzinich BDC, Inc.
|
|||
|
formerly, Senior Vice President
|
(2019 to present);
|
||||
|
and Chief Financial Officer (and
|
Interested Trustee,
|
||||
|
other positions), U.S. Bancorp
|
Tidal ETF Trust
|
||||
|
Fund Services, LLC (1997 to 2013).
|
(2018 to present)
|
||||
|
|
(36 series); Former
|
||||
|
|
Interested Trustee,
|
||||
|
|
Direxion Funds
|
||||
|
|
(22 series), Direxion
|
||||
|
|
Shares ETF Trust
|
||||
|
|
(112 series) and
|
||||
|
|
Direxion Insurance
|
||||
|
|
Trust (2013 to 2018).
|
||||
|
Steven J. Paggioli
|
Trustee
|
Indefinite Term;
|
Consultant; formerly, Executive Vice
|
3
|
Independent Director,
|
|
(born 1950)
|
Since
|
President, Investment Company
|
Muzinich BDC, Inc.
|
||
|
c/o U.S. Bank
|
May 1991.
|
Administration, LLC (mutual
|
(2019 to present);
|
||
|
Global Fund Services
|
fund administrator).
|
Independent Trustee,
|
|||
|
615 E. Michigan Street
|
|
AMG Funds (1993 to
|
|||
|
Milwaukee, WI 53202
|
|
||||
68
Muzinich Funds
|
TRUSTEES AND EXECUTIVE OFFICERS (Unaudited) (Continued)
|
|
Number of
|
|||||
|
Portfolios
|
|||||
|
in Fund
|
Other
|
||||
|
Position
|
Term of Office2
|
Complex3
|
Directorships
|
||
|
Name, Address
|
with the
|
and Length of
|
Principal Occupation
|
Overseen
|
Held During
|
|
And Age
|
Trust1
|
Time Served
|
During Past Five Years
|
by Trustees
|
the Past 5 Years
|
|
Ashi S. Parikh
|
Trustee
|
Indefinite Term;
|
Investment professional; formerly,
|
3
|
Board of Directors
|
|
(born 1966)
|
Since
|
Chief Executive and Chief
|
Member, Investment
|
||
|
c/o U.S. Bank
|
June 2020.
|
Investment Officer and various
|
Working Group, The
|
||
|
Global Fund Services
|
other positions, RidgeWorth
|
Ohio State University
|
|||
|
615 E. Michigan Street
|
Investments, LLC (global investment
|
Endowments and
|
|||
|
Milwaukee, WI 53202
|
management firm) (2006 to 2017);
|
Foundation (2016 to
|
|||
|
formerly, Chief Investment Officer
|
present); Board of
|
||||
|
Institutional Growth Equities,
|
Directors, World
|
||||
|
Eagle Asset Management
|
Methodist Council,
|
||||
|
(investment management firm);
|
Investment
|
||||
|
formerly Sr. Managing Director,
|
Committee (2018 to
|
||||
|
Growth Equities, Banc One
|
present); Independent
|
||||
|
Investment Advisors
|
Trustee, PNC Funds
|
||||
|
(investment management firm).
|
(2018 to 2019)
|
||||
|
|
(32 series); Interested
|
||||
|
|
Trustee, RidgeWorth
|
||||
|
|
Funds (2014 to 2017)
|
||||
|
|
(35 series).
|
||||
|
Cynthia M. Fornelli
|
Trustee
|
Indefinite Term;
|
Independent Director of TriplePoint
|
3
|
Independent Director,
|
|
(born 1960)
|
Since
|
Venture Growth BDC Corp.
|
TriplePoint Private
|
||
|
c/o U.S. Bank
|
January 2022.
|
(2019 to present); Retired; formerly,
|
Venture Credit, Inc.
|
||
|
Global Fund Services
|
Executive Director of the Center for
|
(2020 to present).
|
|||
|
615 E. Michigan Street
|
Audit Quality (2007-2019); formerly,
|
||||
|
Milwaukee, WI 53202
|
Senior Vice President of Regulatory
|
||||
|
Conflicts Management at Bank of
|
|||||
|
America (2005-2007); formerly,
|
|||||
|
Deputy Director, Division of
|
|||||
|
Investment Management with the
|
|||||
|
U.S. Securities and Exchange
|
|||||
|
Commission (1998-2005).
|
|||||
|
Officers of the Trust
|
|||||
|
Jason F. Hadler
|
President &
|
Indefinite Term;
|
Senior Vice President and Head of
|
Not
|
Not
|
|
(born 1975)
|
Principal
|
Since
|
Client Experience, U.S. Bank Global
|
Applicable.
|
Applicable.
|
|
c/o U.S. Bank
|
Executive
|
September 2021.
|
Fund Services, since March 2022;
|
||
|
Global Fund Services
|
Officer
|
Senior Vice President and Head of
|
|||
|
615 E. Michigan Street
|
Fund Services Fund Administration
|
||||
|
Milwaukee, WI 53202
|
Department, U.S. Bank Global Fund
|
||||
|
Services (December 2003-March 2022).
|
|||||
|
Carl G. Gee, Esq.
|
Secretary &
|
Indefinite Term;
|
Assistant Secretary of the Trust
|
Not
|
Not
|
|
(born 1990)
|
Vice
|
Since
|
(2020-2021); Assistant Vice
|
Applicable.
|
Applicable.
|
|
c/o U.S. Bank
|
President
|
February 2021.
|
President and Counsel, U.S. Bank
|
||
|
Global Fund Services
|
Global Fund Services since August 2016;
|
||||
|
615 E. Michigan Street
|
Summer Associate, Husch Blackwell
|
||||
|
Milwaukee, WI 53202
|
LLP (2015); Law Clerk, Brady
|
||||
|
Corporation (global printing systems,
|
|||||
|
labels and safety products company)
|
|||||
|
(2014-2015).
|
69
Muzinich Funds
|
TRUSTEES AND EXECUTIVE OFFICERS (Unaudited) (Continued)
|
|
Number of
|
|||||
|
Portfolios
|
|||||
|
in Fund
|
Other
|
||||
|
Position
|
Term of Office2
|
Complex3
|
Directorships
|
||
|
Name, Address
|
with the
|
and Length of
|
Principal Occupation
|
Overseen
|
Held During
|
|
And Age
|
Trust1
|
Time Served
|
During Past Five Years
|
by Trustees
|
the Past 5 Years
|
|
Craig Benton
|
Treasurer &
|
Indefinite Term;
|
Assistant Treasurer of the Trust
|
Not
|
Not
|
|
(born 1985)
|
Vice
|
Since
|
(2016-2021); Assistant Vice
|
Applicable.
|
Applicable.
|
|
c/o U.S. Bank
|
President
|
December 2021.
|
President, U.S. Bank Global Fund
|
||
|
Global Fund Services
|
Services since November 2007.
|
||||
|
615 E. Michigan Street
|
|||||
|
Milwaukee, WI 53202
|
|||||
|
Kyle J. Buscemi
|
Assistant
|
Indefinite Term;
|
Mutual Funds Administrator,
|
Not
|
Not
|
|
(born 1996)
|
Treasurer
|
Since
|
U.S. Bank Global Fund Services
|
Applicable.
|
Applicable.
|
|
c/o U.S. Bank
|
June 2022.
|
since June 2018; Business
|
|||
|
Global Fund Services
|
Administration Student, 2014-2018.
|
||||
|
615 E. Michigan Street
|
|||||
|
Milwaukee, WI 53202
|
|||||
|
Kathryn E.
|
Assistant
|
Indefinite Term;
|
Mutual Funds Administrator,
|
Not
|
Not
|
|
LaPlante Johnson
|
Treasurer
|
Since
|
U.S. Bank Global Fund Services
|
Applicable.
|
Applicable.
|
|
(born 1998)
|
November 2023.
|
since June 2020; Business
|
|||
|
c/o U.S. Bank
|
Administration Student, 2017-2021.
|
||||
|
Global Fund Services
|
|||||
|
615 E. Michigan Street
|
|||||
|
Milwaukee, WI 53202
|
|||||
|
Gazala Khan
|
Chief
|
Indefinite Term;
|
Vice President and Compliance
|
Not
|
Not
|
|
(born 1969)
|
Compliance
|
Since
|
Officer, U.S. Bank Global Fund
|
Applicable.
|
Applicable.
|
|
c/o U.S. Bank
|
Officer
|
November 2022.
|
Services since July 2022; Chief
|
||
|
Global Fund Services
|
Compliance Officer Matthews Asia
|
||||
|
615 E. Michigan Street
|
Anti-Money
|
Fund (May 2019-July 15, 2022);
|
|||
|
Milwaukee, WI 53202
|
Laundering
|
Chief Compliance Officer GS Trust/VIT
|
|||
|
Officer
|
(June 2009-May 2019); Vice
|
||||
|
President GSAM (May 2005-
|
|||||
|
June 2009); Staff Accountant, SEC
|
|||||
|
Office of Compliance Inspection
|
|||||
|
and Examination (1999-2005).
|
|
1
|
All Trustees of the Trust who are not “interested persons” of the Trust as defined under the 1940 Act (“Independent Trustees”).
|
|
2
|
Under the terms of the Board’s retirement policy, a Trustee shall retire at the end of the calendar year in which he or she reaches the age of 78.
|
|
3
|
The Trust is comprised of numerous series managed by unaffiliated investment advisers. The term “Fund Complex” applies only to the Funds. The Funds do not hold themselves out as related to any other series
within the Trust for investment purposes, nor do they share the same investment advisor with any other series.
|
70
Muzinich Funds
|
QUALIFIED DIVIDEND INCOME/DIVIDENDS RECEIVED DEDUCTION (Unaudited)
|
For the fiscal year ended December 31, 2023, certain dividends paid by the Funds may be subject to a maximum tax rate of 20%, as provided for by the Jobs and Growth Tax Relief
Reconciliation Act of 2003 and the Tax Cuts and Jobs Act of 2017. The percentage of dividends declared from ordinary income designated as qualified dividend income was as follows:
|
Credit Opportunities Fund
|
0.00%
|
|
|
Flexible U.S. High Yield Income Fund
|
0.00%
|
|
|
Low Duration Fund
|
0.00%
|
For corporate shareholders, the percent of ordinary income distributions qualifying for the corporate dividends received deduction for the period ended December 31, 2023, was as
follows:
|
Credit Opportunities Fund
|
0.00%
|
|
|
Flexible U.S. High Yield Income Fund
|
0.00%
|
|
|
Low Duration Fund
|
0.00%
|
The percentage of taxable ordinary income distributions that are designated as short-term capital gain distributions under Internal Revenue Section 871(K)(2)(C) for the Funds were
as follows:
|
Credit Opportunities Fund
|
0.00%
|
|
|
Flexible U.S. High Yield Income Fund
|
0.00%
|
|
|
Low Duration Fund
|
0.00%
|
|
INFORMATION ABOUT PROXY VOTING (Unaudited)
|
A description of the policies and procedures that the Funds use to determine how to vote proxies relating to portfolio securities is available without charge, upon request, by
calling 1-855-MUZINICH (1-855-689-4642). Furthermore, you can obtain the description on the SEC’s website at www.sec.gov.
Information regarding how the Funds voted proxies relating to portfolio securities during the most recent period ended June 30 is available without charge, upon request, by
calling 1-855-MUZINICH (1-855-689-4642). Furthermore, you can obtain the Funds’ proxy voting records on the SEC’s website at www.sec.gov.
|
INFORMATION ABOUT THE PORTFOLIO HOLDINGS (Unaudited)
|
The Funds file their complete schedule of portfolio holdings with the SEC for the first and third quarters of each fiscal year as an exhibit to their reports on Part F of Form
N-PORT. The Funds’ Form N-PORT is available on the SEC’s website at www.sec.gov. The Funds’ Form N-PORT may also be obtained by calling toll-free 1-855-MUZINICH (1-855-689-4642).
|
INFORMATION ABOUT HOUSEHOLDING (Unaudited)
|
Each year, you are automatically sent an updated prospectus as well as annual and semi-annual reports for the Funds, if applicable. To reduce expenses, the Funds may mail only one
copy of each Fund’s prospectus and each annual and semi-annual report to those addresses shared by two or more accounts. If you wish to receive individual copies of these documents, please call us at 1-855-MUZINICH (1-855-689-4642) (or contact your
financial institution). We will begin sending you individual copies thirty days after receiving your request.
|
INFORMATION ABOUT THE FUNDS’ TRUSTEES (Unaudited)
|
The Statement of Additional Information (“SAI”) includes additional information about the Funds’ Trustees and is available without charge, upon request, by calling 1-855-MUZINICH
(1-855-689-4642). Furthermore, you can obtain the SAI on the SEC’s web site at www.sec.gov or the Funds’ website at www.muzinichusfunds.com.
71
Muzinich Funds
|
PRIVACY NOTICE (Unaudited)
|
The Funds collect non-public information about you from the following sources:
|
•
|
Information we receive about you on applications or other forms;
|
|
•
|
Information you give us orally; and
|
|
•
|
Information about your transactions with us or others.
|
We do not disclose any non-public personal information about our shareholders or former shareholders without the shareholder’s authorization, except as permitted by law or in
response to inquiries from governmental authorities. We may share information with affiliated parties and unaffiliated third parties with whom we have contracts for servicing the Funds. We will provide unaffiliated third parties with only the
information necessary to carry out their assigned responsibility. We maintain physical, electronic and procedural safeguards to protect your non-public personal information and require third parties to treat your non-public information with the same
high degree of confidentiality.
In the event that you hold shares of a Fund through a financial intermediary, including, but not limited to, a brokerdealer, bank or trust company, the privacy policy of your
financial intermediary would govern how your non-public personal information would be shared by those entities with unaffiliated third parties.
72
(This Page Intentionally Left Blank.)
Advisor
MUZINICH & CO., INC
450 Park Avenue
New York, New York 10022
Distributor
QUASAR DISTRIBUTORS, LLC
Three Canal Plaza, Suite 100
Portland, Maine 04101
Custodian
U.S. BANK N.A.
Custody Operations
1555 North RiverCenter Drive, Suite 302
Milwaukee, Wisconsin 53212
Transfer Agent, Fund Accountant,
and Fund Administrator
U.S. BANCORP FUND SERVICES, LLC
615 East Michigan Street
Milwaukee, Wisconsin 53202
Independent Registered Public Accounting Firm
TAIT, WELLER & BAKER LLP
Two Liberty Place
50 South 16th Street, Suite 2900
Philadelphia, Pennsylvania 19102-2529
Legal Counsel
SULLIVAN & WORCESTER LLP
1633 Broadway, 32nd Floor
New York, New York 10019
|
Fund
|
Class
|
Symbol
|
CUSIP
|
|
Muzinich Credit Opportunities Fund
|
Supra Institutional Class
|
MZCSX
|
74316J532
|
|
Institutional Class
|
MZCIX
|
74316J540
|
|
|
Muzinich Flexible U.S. High Yield Income Fund
|
Supra Institutional Class
|
MZHSX
|
74316J565
|
|
Institutional Class
|
MZHIX
|
74316J573
|
|
|
Muzinich Low Duration Fund
|
Supra Institutional Class
|
MZLSX
|
74316P132
|
|
(b)
|
Not applicable.
|
Item 2. Code of Ethics.
The registrant has adopted a code of ethics that applies to the registrant’s principal executive officer and principal financial officer. The registrant has not made any amendments to its code of ethics during the
period covered by this report. The registrant has not granted any waivers from any provisions of the code of ethics during the period covered by this report.
A copy of the registrant’s Code of Ethics is filed herewith.
Item 3. Audit Committee Financial Expert.
The registrant’s Board of Trustees of the Trust has determined that there is at least one audit committee financial expert serving on its audit committee. Ms. Kathleen T. Barr, Ms. Cynthia M. Fornelli, Messrs. Eric W.
Falkeis, Steven J. Paggioli and Ashi S. Parikh are each an “audit committee financial expert” and are considered to be “independent” as each term is defined in Item 3 of Form N-CSR.
Item 4. Principal Accountant Fees and Services.
The registrant has engaged its principal accountant to perform audit services, audit-related services, tax services and other services during the past two fiscal years. “Audit services” refer to performing an audit
of the registrant's annual financial statements or services that are normally provided by the accountant in connection with statutory and regulatory filings or engagements for those fiscal years. “Audit-related services” refer to the assurance and
related services by the principal accountant that are reasonably related to the performance of the audit. “Tax services” refer to professional services rendered by the principal accountant for tax compliance, tax advice, and tax planning. There
were no “Other services” provided by the principal accountant. The following table details the aggregate fees billed or expected to be billed for each of the last two fiscal years for audit fees, audit-related fees, tax fees and other fees by the
principal accountant.
Muzinich Credit Opportunities Fund
|
FYE 12/31/2023
|
FYE 12/31/2022
|
|
|
Audit Fees
|
$24,500
|
$24,025
|
|
Audit-Related Fees
|
N/A
|
N/A
|
|
Tax Fees
|
$2,900
|
$2,800
|
|
All Other Fees
|
N/A
|
N/A
|
Muzinich Low Duration Fund
|
FYE 12/31/2023
|
FYE 12/31/2022
|
|
|
Audit Fees
|
$22,850
|
$22,400
|
|
Audit-Related Fees
|
N/A
|
N/A
|
|
Tax Fees
|
$2,900
|
$2,800
|
|
All Other Fees
|
N/A
|
N/A
|
Muzinich Flexible U.S. High Yield Income Fund
|
FYE 12/31/2023
|
FYE 12/31/2022
|
|
|
Audit Fees
|
$22,850
|
$22,400
|
|
Audit-Related Fees
|
N/A
|
N/A
|
|
Tax Fees
|
$2,900
|
$2,800
|
|
All Other Fees
|
N/A
|
N/A
|
The audit committee has adopted pre-approval policies and procedures that require the audit committee to pre‑approve all audit and non‑audit services of the registrant, including services provided to any entity
affiliated with the registrant.
The percentage of fees billed by Tait Weller & Baker LLP applicable to non-audit services pursuant to waiver of pre-approval requirement were as follows:
|
FYE 12/31/2023
|
FYE 12/31/2022
|
|
|
Audit-Related Fees
|
0%
|
0%
|
|
Tax Fees
|
0%
|
0%
|
|
All Other Fees
|
0%
|
0%
|
All of the principal accountant’s hours spent on auditing the registrant’s financial statements were attributed to work performed by full‑time permanent employees of the principal accountant.
The following table indicates the non-audit fees billed or expected to be billed by the registrant’s accountant for services to the registrant and to the registrant’s
investment adviser (and any other controlling entity, etc.—not sub-adviser) for the last two years. The audit committee of the board of trustees/directors has considered whether the provision of non-audit services that were rendered to the
registrant's investment adviser is compatible with maintaining the principal accountant's independence and has concluded that the provision of such non-audit services by the accountant has not compromised the accountant’s independence.
|
Non-Audit Related Fees
|
FYE 12/31/2023
|
FYE 12/31/2022
|
|
Registrant
|
N/A
|
N/A
|
|
Registrant’s Investment Advisor
|
N/A
|
N/A
|
Item 5. Audit Committee of Listed Registrants.
Not applicable to registrants who are not listed issuers (as defined in Rule 10A-3 under the Securities Exchange Act of 1934).
Item 6. Investments.
(a) Schedule of Investments is included as part of the report to shareholders filed under Item 1 of this Form.
(b) Not applicable.
Item 7. Disclosure of Proxy Voting Policies and Procedures for Closed-End Management Investment Companies.
Not applicable to open-end investment companies.
Item 8. Portfolio Managers of Closed-End Management Investment Companies.
Not applicable to open-end investment companies.
Item 9. Purchases of Equity Securities by Closed‑End Management Investment Company and Affiliated Purchasers.
Not applicable to open-end investment companies.
Item 10. Submission of Matters to a Vote of Security Holders.
The registrant has adopted a nominating committee charter that contains the procedures by which shareholders may recommend nominees to the registrant’s board of trustees. There have been no
material changes to the procedures by which shareholders may recommend nominees to the registrant’s board of Trustees.
Item 11. Controls and Procedures.
|
(a)
|
The Registrant’s Principal Executive Officer and Principal Financial Officer have reviewed the Registrant's disclosure controls and procedures (as defined in Rule 30a-3(c) under the Investment Company Act of 1940 (the “Act”)) as of a
date within 90 days of the filing of this report, as required by Rule 30a-3(b) under the Act and Rules 13a-15(b) or 15d‑15(b) under the Securities Exchange Act of 1934. Based on their review, such officers have concluded that the
disclosure controls and procedures are effective in ensuring that information required to be disclosed in this report is appropriately recorded, processed, summarized and reported and made known to them by others within the Registrant and
by the Registrant’s service provider.
|
|
(b)
|
There were no changes in the Registrant's internal control over financial reporting (as defined in Rule 30a-3(d) under the Act) that occurred during the period covered by this report that has materially affected, or is reasonably
likely to materially affect, the Registrant's internal control over financial reporting.
|
Item 12. Disclosure of Securities Lending Activities for Closed-End Management Investment Companies
Not applicable to open-end investment companies.
Item 13. Exhibits.
(3) Any written solicitation to purchase securities under Rule 23c‑1 under the Act sent or given during the period covered by the report by or on behalf of the registrant to 10 or
more persons. Not applicable to open-end investment companies.
(4) Change in the registrant’s independent public accountant. There was no change in the registrant’s independent public accountant for the period covered by this report.
SIGNATURES
Pursuant to the requirements of the Securities Exchange Act of 1934 and the Investment Company Act of 1940, the registrant has duly caused this report to be signed on its behalf by the undersigned, thereunto duly
authorized.
(Registrant) Professionally Managed Portfolios
By (Signature and Title) /s/Jason Hadler
Jason Hadler, President/Principal Executive Officer
Date March 8, 2024
Pursuant to the requirements of the Securities Exchange Act of 1934 and the Investment Company Act of 1940, this report has been signed below by the following persons on behalf of the registrant and in the capacities
and on the dates indicated.
By (Signature and Title) /s/Jason Hadler
Jason Hadler, President/Principal Executive Officer
Date March 8, 2024
By (Signature and Title) /s/Craig Benton
Craig Benton, Treasurer/Principal Financial Officer
Date March 8, 2024
* Print the name and title of each signing officer under his or her signature.