UNITED STATES
SECURITIES AND EXCHANGE COMMISSION
Washington, D.C. 20549
SECURITIES AND EXCHANGE COMMISSION
Washington, D.C. 20549
FORM N-CSR
CERTIFIED SHAREHOLDER REPORT OF REGISTERED
MANAGEMENT INVESTMENT COMPANIES
Investment Company Act file number (811-05037)
Professionally Managed Portfolios
(Exact name of registrant as specified in charter)
(Exact name of registrant as specified in charter)
615 East Michigan Street
Milwaukee, WI 53202
(Address of principal executive offices) (Zip code)
(Address of principal executive offices) (Zip code)
Jason Hadler
Professionally Managed Portfolios
c/o U.S. Bank Global Fund Services
777 E. Wisconsin Avenue
Milwaukee, WI 53202
(Name and address of agent for service)
777 E. Wisconsin Avenue
Milwaukee, WI 53202
(Name and address of agent for service)
(414) 516-1523
Registrant's telephone number, including area code
Date of fiscal year end: June 30
Date of reporting period: December 31, 2022
Item 1. Report to Stockholders.
TRILLIUM ESG GLOBAL EQUITY FUND
TRILLIUM ESG SMALL/MID CAP FUND
SEMI-ANNUAL REPORT
For the Six Months Ended
December 31, 2022
Disclosures
The information provided herein represents the opinion of the Portfolio Managers of the Trillium ESG Global Equity Fund and Trillium ESG Small/Mid Cap Fund (the “Funds”) and is not
intended to be a forecast of future events, a guarantee of future results, nor investment advice.
Past performance does not guarantee future results.
Mutual fund investing involves risk. Principal loss is possible. The Funds may invest in foreign securities, which are subject to the risks of currency fluctuations, political and
economic instability and differences in accounting methods. Investing in foreign securities is riskier than investing in domestic securities. The Funds invest in smaller companies, which involve additional risks such as limited liquidity and greater
volatility. The Funds’ environmental policy could cause them to make or avoid investments that could result in the portfolios underperforming similar funds that do not have an environmental policy. There are no assurances that the Funds will achieve
their objective and/or strategy.
The Funds’ holdings and sector allocations are subject to change and are not recommendations to buy or sell any security. Please see the Schedules of Investments in the report for complete portfolio
holdings.
The sectors and/or the industries, as applicable, are determined using the Global Industry Classifications Standard (GICS®).
GICS® was developed by and/or is the exclusive property of MSCI, Inc. and Standard & Poor’s (“S&P”). GICS® is a service mark of MSCI, Inc. and S&P and has been licensed for use by the Funds’ administrator, U.S. Bancorp Fund Services, LLC.
Alpha is a measure of performance on a risk-adjusted basis. Alpha takes the volatility (price risk) of a mutual fund and compares its risk-adjusted performance to a benchmark index. The excess return of
the mutual fund relative to the return of the benchmark index is a mutual fund’s alpha.
Basis points (bps) are units of measure for interest rates and other percentages, commonly used to describe the percentage change in interest rates, bond yields, and other financial instruments. One
basis point is equal to 1/100th of 1%, or 0.01% (0.0001).
The MSCI ACWI (All Country World Index) is a free float-adjusted market capitalization weighted index that is designed to measure the equity market performance of developed and emerging markets. The
MSCI ACWI consists of 46 country indices comprising 23 developed and 23 emerging market country indices. Returns reported reflect the net total return index which reinvests dividends after the deduction of withholding taxes, using a tax rate
applicable to non-resident institutional investors who do not benefit from double taxation treaties.
The S&P 1000® Index combines the S&P MidCap 400® and the S&P SmallCap 600® to form a benchmark for the mid- to small-cap segment of the U.S. equity market.
An investment cannot be made directly in an index.
Must be preceded or accompanied by a prospectus.
The Funds are distributed by Quasar Distributors, LLC.
Earnings growth is not representative of the Fund’s future performance.
Diversification does not assure a profit, nor does it protect against a loss in a declining market.
Table of Contents
|
Trillium ESG Global Equity Fund
|
|
|
A Message to Our Shareholders
|
2
|
|
Country Allocation
|
7
|
|
Performance Chart and Analysis
|
8
|
|
Schedule of Investments
|
10
|
|
Trillium ESG Small/Mid Cap Fund
|
|
|
A Message to Our Shareholders
|
15
|
|
Sector Allocation
|
19
|
|
Performance Chart and Analysis
|
20
|
|
Schedule of Investments
|
21
|
|
Statements of Assets and Liabilities
|
24
|
|
Statements of Operations
|
27
|
|
Statements of Changes in Net Assets
|
28
|
|
Financial Highlights
|
31
|
|
Notes to Financial Statements
|
34
|
|
Expense Examples
|
47
|
|
Additional Information
|
49
|
|
Privacy Notice
|
56
|
Trillium ESG Global Equity Fund
Dear Shareholders,
For the six-month period ended December 31, 2022, the Trillium ESG Global Equity Fund (the “Fund” or “Global Equity Fund”) appreciated 1.80% on a net of fees basis, versus the MSCI ACWI NR (ACWI)
benchmark, which reported an increase of 2.28%.
|
Performance as of
|
6
|
1
|
3
|
5
|
10
|
Since
|
Inception
|
|
December 31, 2022
|
Months
|
Year
|
Year
|
Year
|
Year
|
Inception
|
Date
|
|
Retail (PORTX)
|
1.64%
|
-22.91%
|
5.47%
|
6.91%
|
8.66%
|
6.19%
|
9/30/99
|
|
Institutional (PORIX)
|
1.80%
|
-22.69%
|
5.78%
|
7.21%
|
8.96%
|
5.91%
|
3/30/07
|
|
MSCI ACWI
|
2.28%
|
-18.36%
|
4.00%
|
5.23%
|
7.98%
|
5.12%
|
9/30/99
|
Periods greater than one year are average annual returns.
Performance data quoted represents past performance; past performance does not guarantee future results. The investment return and principal value of an investment will fluctuate so
that an investor’s shares, when redeemed, may be worth more or less than their original cost. Current performance of the Fund may be lower or higher than the performance quoted. Performance data current to the most recent month end may be obtained by
calling (866) 209-1962.
|
Gross Expense Ratio*
|
||
|
Class R
|
1.31%
|
|
|
Class I
|
1.03%
|
|
*
|
Gross expense ratio is from Global Equity’s prospectus dated October 31, 2022. See the Global Equity Fund’s Financial Highlights in this report for the most current expense ratios.
|
During the period, asset allocation and security selection were about equally responsible for the underperformance. From a sector perspective, Energy continued to be a meaningful headwind as our
portfolio is fossil fuel free by design and Energy delivered strong returns versus other sectors in the benchmark. The drag was mitigated to a degree by our significant underweight to the Communication Services sector and overweight to Industrials.
Stock selection was strongest in the Consumer Discretionary sector which benefited from what we didn’t own (Tesla -45% and Amazon -21%) as well as what we owned in an overweight exposure (TJX Companies +44%). Stock selection was weakest in
Industrials, where we also were impacted by what we didn’t own due to ESG considerations (aerospace & defense) as well as what we owned (Generac -52%). As the US Dollar depreciated against the Euro in the back half of the year, currency effect
turned into a tailwind given our historical, bottom-up overweight to the Western European region.
2
Performance Leaders (6 months ended 12/31/22):
TJX Companies (+43.8%) reported favorable results in this period, beating comp and margin estimates, and showing signs of continued recovery and healthier trends
than big box peers. The company is also benefitting from an improved outlook amidst one of the strongest buying environments in recent history for off-price retail. TJX could also stand to benefit from share gains and trade-down as we move into a
macro slowdown.
After underperforming many of its large biopharma company peers earlier in the year, Gilead (+41.6%) significantly outperformed in the back half, particularly
after it reported favorable third quarter 2022 operating and financial results, and because of its low forward valuation going into the quarter. After multiple years of sector relative stock return underperformance largely associated with a lack of
commercialized products that could realize sustainable profit growth, we expect that this company’s outlook is improving after several years of aggressive business development under the leadership of its CEO which should provide a foundation for
better and more sustainable growth in the future.
Performance Laggards (6 months ended 12/31/22):
The largest detractor to the portfolio over the period was electrical equipment player Generac Holdings (-52.2%). Generac’s stock suffered as an installation
partner filed for bankruptcy and product quality issues arose in the emerging, battery-based business. Further, the home generator market was oversupplied later in 2022, as installation capacity was constrained on labor/permitting and has not caught
up to Generac’s increased production. Leading indicators in the generator market remain positive and continuing power outages/energy security concerns should continue to drive demand in the future. We recently added to the position given our
conclusion that the risk/reward remains favorable.
Continuing its volatile performance swings, China’s electric vehicle market leader, BYD’s stock price had a reversal of fortunes and ended as a bottom performer
in the back half of 2022. While first half volumes remained solid, despite price increases and continued global supply chain disruptions, the stock was pressured by global slowdown concerns. In addition, recent selling by large shareholder Berkshire
Hathaway (still owns 15%+ of the Company) likely caused pause by some investors and may have spurred profit taking.
New Positions:
In terms of new positions, we added Prysmian, a global mid cap cable manufacturer and installer who engages in the design, manufacturing, and installation of
cables for the energy and telecommunications industries. Prysmian was founded in 2005 and is headquartered in Milan, Italy. The Company is benefiting from the global secular tailwinds of energy transition, electrical grid expansion/replacement,
infrastructure spend, and
3
telecommunications/ broadband network upgrade. With electricity consumption set to double and renewable capacity expected to quintuple by 2050 (BNP research 9/23/21), demand for Prysmian’s cables is
expected to be strong – especially for high voltage (HV) cables, where 80% of the U.S and European market is controlled by just 3 producers. The urgency to move to renewable energy sources has been exacerbated since the invasion of Ukraine and
countries around the world are accelerating investments in clean energy – providing a secular boost to Prysmian’s growth for years to come.
As long-term investors, we tend not to make dramatic changes, therefore, we focused our trading on adding to positions where we saw valuation dislocation or taking bigger bets in stocks we deemed well
positioned for a slowing or recessionary economy. In keeping with our investment process, we funded these purchases by trimming certain, stronger performers including LPL Financial, Novo Nordisk and selling holdings we had lost conviction in,
including specialty chemical player Novozymes A/S and UK building products player Kingspan Group. For Novozoymes, the proposed, all-stock ~$20B purchase of a competitor, Chr Hansen, is deemed too expensive (20% premium, >20x EBITDA at the
unaffected share price) as well as increasing integration and diversification risks enough to degrade our quality-led thesis there. And, in terms of UK building materials supplier Kingspan, the cyclical headwinds for residential housing and
commercial building related to the weakening economic outlook in Europe will likely more than offset market gains from energy efficiency demand.
Outlook:
2022 was a year of transitions and waiting: waiting to see if geopolitics would be totally upended by the Russian war and American elections; if Covid would continue its grip on the globe; if economies
would settle back into “normal” conditions of the recent past; if continued strength of labor would persist in developed markets; if companies, investors, and governments would be serious about attempting to limit climate changing emissions against a
more challenging economic backdrop. As we start 2023, these questions have not been definitively answered, but there are reasons to be hopeful. Equity markets had a notable rebound exiting 2022 (with a continuation in January) as market participants
began to look through the widely expected upcoming recession, rejoicing at economic data that indicated inflation had moderated and might give the Fed reason to stop raising rates earlier than anticipated. However, recent economic datapoints continue
to support further caution, particularly the still-strong labor market and the Fed’s own messaging about interest rate trajectories. The contractionary impulse seems clear, as such, there remains a significant risk that corporate earnings will need
to be meaningfully lowered from current expectations. The question now starts to be, will the economy, both in the U.S. and in Europe, have a “soft” or “hard” landing as the
4
contractionary forces take hold? And, how much is already reflected in the valuations given the double digit declines in the equity markets in 2022? Markets will likely remain volatile as investors
monitor every economic datapoint to devise the answer to these questions. As always, we remain dedicated to our longer-term investment process and discipline, with a focus on high-quality companies with proven management, strong balance sheets, and
astute management of ESG related risks.
Advocacy:
During the second half of 2022, Trillium’s Advocacy program led to many improvements in companies’ environmental, social, and governance policies, and impacts. We filed numerous shareholder proposals,
and engaged dozens of companies on critical social and environmental issues such as climate change, racial justice, toxic chemicals, and worker empowerment.
As more and more companies publicly declare their net zero by 2050 targets, Trillium is aware that, while these statements are important signals to the public and policymakers, companies need to have
concrete, substantive plans in place in order to achieve the emissions reductions needed to avoid catastrophic warming. Companies that agree to net zero by 2050 but do not have interim greenhouse gas (“GHG”) emissions targets could rely on carbon
offsets instead of actually reducing their footprints, which the global carbon budget cannot afford. That is why we are asking several portfolio companies to set short- and long-term GHG emissions reduction targets that are verified by a third-party
to be in line with no more than 1.5 degrees of warming. Throughout the latter part of 2022, we filed shareholder proposals at two companies held in the Trillium ESG Global Equity Fund, United Parcel Service and Quanta Services, to set these
science-based, GHG emissions reduction targets. These shareholder proposals will be the basis for conversations and shareholder votes through the winter and spring of 2023.
In the latter half of 2022 we continued to engage the companies where our racial equity audit shareholder proposals won strong support in the beginning of 2022. Pursuing engagements at SVB Financial
Group, Travelers Companies, and American Water Works, we urged the companies to address systemic racism through a full review of their businesses inside and out applying a racial justice lens. Trillium and other investors are increasingly seeking
assurances via third-party audits that companies understand racialized impacts in the workplace and on external stakeholders and have taken account of blind spots while implementing effective programs to address latent problems before they
5
metastasize. While we have seen some progress with some of these companies, we have re-filed our shareholder proposals for consideration at these companies’ 2023 annual meetings.
Sincerely,
 |
 |
|
Laura McGonagle
|
Matthew Patsky
|
|
Portfolio Manager
|
Portfolio Manager
|
 |
 |
|
John Quealy
|
Patrick Wollenberg
|
|
Portfolio Manager
|
Portfolio Manager
|
6
Trillium ESG Global Equity Fund
|
COUNTRY ALLOCATION at December 31, 2022 (Unaudited)
|
|
Country
|
Portfolio Value
|
Percent of Net Assets
|
|||||||
|
|
|||||||||
|
Australia
|
$
|
10,231,413
|
1.3
|
%
|
|||||
|
Belgium
|
7,073,346
|
0.9
|
%
|
||||||
|
Brazil
|
7,333,417
|
0.9
|
%
|
||||||
|
Canada
|
12,838,154
|
1.6
|
%
|
||||||
|
Colombia
|
3,142,072
|
0.4
|
%
|
||||||
|
Denmark
|
17,485,362
|
2.2
|
%
|
||||||
|
France
|
37,764,680
|
4.9
|
%
|
||||||
|
Germany
|
27,214,259
|
3.5
|
%
|
||||||
|
Hong Kong
|
11,053,517
|
1.4
|
%
|
||||||
|
India
|
6,014,744
|
0.8
|
%
|
||||||
|
Indonesia
|
4,957,068
|
0.6
|
%
|
||||||
|
Ireland
|
25,038,521
|
3.2
|
%
|
||||||
|
Italy
|
10,623,222
|
1.4
|
%
|
||||||
|
Japan
|
36,646,656
|
4.7
|
%
|
||||||
|
Kenya
|
2,553,024
|
0.3
|
%
|
||||||
|
Mexico
|
5,018,795
|
0.6
|
%
|
||||||
|
Netherlands
|
10,321,451
|
1.3
|
%
|
||||||
|
Norway
|
7,153,436
|
0.9
|
%
|
||||||
|
Peru
|
4,639,708
|
0.6
|
%
|
||||||
|
Portugal
|
4,434,309
|
0.6
|
%
|
||||||
|
Republic of Korea
|
6,110,157
|
0.8
|
%
|
||||||
|
Singapore
|
6,327,153
|
0.8
|
%
|
||||||
|
Spain
|
17,624,591
|
2.3
|
%
|
||||||
|
Sweden
|
14,750,682
|
1.9
|
%
|
||||||
|
Switzerland
|
42,330,786
|
5.4
|
%
|
||||||
|
Taiwan
|
6,170,230
|
0.8
|
%
|
||||||
|
United Kingdom
|
33,326,626
|
4.3
|
%
|
||||||
|
United States
|
400,546,705
|
51.4
|
%
|
||||||
|
Other Assets in Excess
|
|||||||||
|
of Liabilities:
|
(103,603
|
)
|
0.0
|
%
|
|||||
|
|
$
|
778,620,481
|
100.0
|
%
|
|||||
7
Trillium ESG Global Equity Fund – Retail Class
Value of $10,000 vs MSCI ACWI Index
(Unaudited)
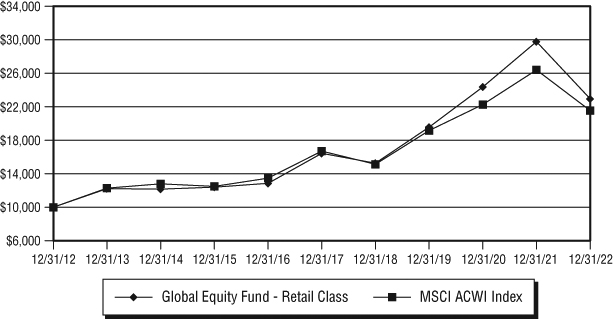
Average Annual Returns for the periods ended December 31, 2022
|
1 Year
|
5 Year
|
10 Year
|
Value
|
|
|
Global Equity Fund – Retail Class
|
-22.91%
|
6.91%
|
8.66%
|
$22,949
|
|
MSCI ACWI Index
|
-18.36%
|
5.23%
|
7.98%
|
$21,545
|
This chart illustrates the performance of a hypothetical $10,000 investment made on December 31, 2013, and is not intended to imply any future performance. The returns shown do not reflect the deduction
of taxes that a shareholder would pay on Fund distributions or the redemption of Fund shares. The returns reflect fee waivers in effect. In the absence of such waivers, total return would be reduced. The chart assumes reinvestment of capital gains,
dividends, and return of capital, if applicable for the Fund and dividends for an index.
Performance data quoted represents past performance; past performance does not guarantee future results. The investment return and principal value of an investment will fluctuate so
that an investor’s shares, when redeemed, may be worth more or less than their original cost. Current performance of the Fund may be lower or higher than the performance quoted. Performance data current to the most recent month-end may be obtained by
calling 866-209-1962.
8
Trillium ESG Global Equity Fund – Institutional Class
Value of $100,000 vs MSCI ACWI Index
(Unaudited)
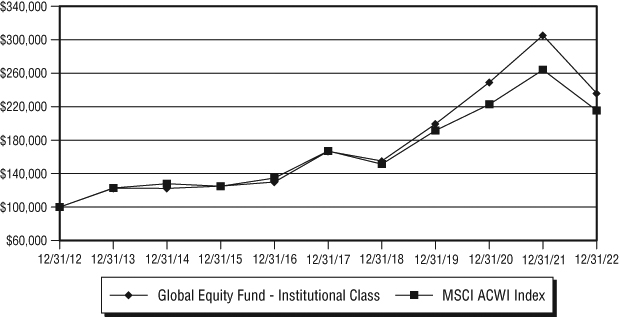
Average Annual Returns for the periods ended December 31, 2022
|
1 Year
|
5 Year
|
10 Year
|
Value
|
|
|
Global Equity Fund – Institutional Class
|
-17.70%
|
9.25%
|
10.02%
|
$235,974
|
|
MSCI ACWI Index
|
-15.75%
|
7.00%
|
8.76%
|
$215,453
|
This chart illustrates the performance of a hypothetical $100,000 investment made on December 31, 2013, and is not intended to imply any future performance. The returns shown do not reflect the
deduction of taxes that a shareholder would pay on Fund distributions or the redemption of Fund shares. The returns reflect fee waivers in effect. In the absence of such waivers, total return would be reduced. The chart assumes reinvestment of
capital gains, dividends, and return of capital, if applicable for the Fund and dividends for an index.
Performance data quoted represents past performance; past performance does not guarantee future results. The investment return and principal value of an investment will fluctuate so
that an investor’s shares, when redeemed, may be worth more or less than their original cost. Current performance of the Fund may be lower or higher than the performance quoted. Performance data current to the most recent month-end may be obtained by
calling 866-209-1962.
9
Trillium ESG Global Equity Fund
|
SCHEDULE OF INVESTMENTS at December 31, 2022
(Unaudited)
|
|
Shares
|
Value
|
||||||
|
COMMON STOCKS: 98.5%
|
|||||||
|
Automobiles & Components: 1.5%
|
|||||||
|
57,391
|
Aptiv PLC
|
||||||
|
(Ireland) (a)
|
$
|
5,344,824
|
|||||
|
221,639
|
Cie Generale des
|
||||||
|
Etablissements
|
|||||||
|
Michelin SCA
|
|||||||
|
(France)
|
6,174,242
|
||||||
|
11,519,066
|
|||||||
|
Banks: 7.2%
|
|||||||
|
15,634,958
|
Bank Rakyat
|
||||||
|
Indonesia Persero
|
|||||||
|
Tbk PT (Indonesia)
|
4,957,068
|
||||||
|
34,201
|
Credicorp Ltd. –
|
||||||
|
ADR (Peru)
|
4,639,708
|
||||||
|
362,197
|
DNB Bank ASA
|
||||||
|
(Norway)
|
7,153,436
|
||||||
|
7,082,353
|
Equity Group
|
||||||
|
Holdings Ltd.
|
|||||||
|
(Kenya)
|
2,553,024
|
||||||
|
697,367
|
Grupo Financiero
|
||||||
|
Banorte SAB
|
|||||||
|
de CV (Mexico)
|
5,018,795
|
||||||
|
234,152
|
Hang Seng Bank
|
||||||
|
Ltd. (Hong Kong)
|
3,883,749
|
||||||
|
87,922
|
HDFC Bank Ltd. –
|
||||||
|
ADR (India)
|
6,014,744
|
||||||
|
109,860
|
KBC Group NV
|
||||||
|
(Belgium)
|
7,073,346
|
||||||
|
37,788
|
PNC Financial
|
||||||
|
Services Group, Inc.
|
|||||||
|
(United States)
|
5,968,237
|
||||||
|
143,477
|
Sumitomo Mitsui
|
||||||
|
Trust Holdings, Inc.
|
|||||||
|
(Japan)
|
5,006,708
|
||||||
|
18,185
|
SVB Financial
|
||||||
|
Group (United
|
|||||||
|
States) (a)
|
4,185,096
|
||||||
|
56,453,911
|
|||||||
|
Capital Goods: 8.0%
|
|||||||
|
256,091
|
Assa Abloy AB –
|
||||||
|
Class B (Sweden)
|
5,508,330
|
||||||
|
457,960
|
Atlas Copco AB
|
||||||
|
(Sweden)
|
5,426,093
|
||||||
|
62,980
|
Ferguson PLC
|
||||||
|
(Switzerland)
|
7,906,792
|
||||||
|
41,125
|
Generac Holdings,
|
||||||
|
Inc. (United
|
|||||||
|
States) (a)
|
4,139,642
|
||||||
|
124,875
|
Kurita Water
|
||||||
|
Industries Ltd.
|
|||||||
|
(Japan)
|
5,157,930
|
||||||
|
98,182
|
Nidec Corp. (Japan)
|
5,052,362
|
|||||
|
145,229
|
Prysmian SpA
|
||||||
|
(Italy)
|
5,396,041
|
||||||
|
48,966
|
Quanta Services,
|
||||||
|
Inc. (United States)
|
6,977,655
|
||||||
|
21,438
|
Rockwell
|
||||||
|
Automation, Inc.
|
|||||||
|
(United States)
|
5,521,786
|
||||||
|
35,786
|
Trane Technologies
|
||||||
|
PLC – ADR
|
|||||||
|
(Ireland)
|
6,015,269
|
||||||
|
46,046
|
Xylem, Inc.
|
||||||
|
(United States)
|
5,091,306
|
||||||
|
62,193,206
|
|||||||
|
Commercial & Professional Services: 2.2%
|
|||||||
|
57,224
|
Intertek Group
|
||||||
|
(United Kingdom)
|
2,784,087
|
||||||
|
202,954
|
Recruit Holdings
|
||||||
|
Co. Ltd. (Japan)
|
6,352,861
|
||||||
|
52,136
|
Waste Management,
|
||||||
|
Inc. (United
|
|||||||
|
States)
|
8,179,096
|
||||||
|
17,316,044
|
|||||||
|
Consumer Durables & Apparel: 2.8%
|
|||||||
|
34,368
|
EssilorLuxottica
|
||||||
|
SA (France)
|
6,219,544
|
||||||
|
7,841
|
Kering SA (France)
|
3,990,489
|
|||||
|
235,406
|
Levi Strauss &
|
||||||
|
Co. – Class A
|
|||||||
|
(United States)
|
3,653,501
|
||||||
|
71,739
|
Nike, Inc. – Class B
|
||||||
|
(United States)
|
8,394,181
|
||||||
|
22,257,715
|
|||||||
The accompanying notes are an integral part of these financial statements.
10
Trillium ESG Global Equity Fund
|
SCHEDULE OF INVESTMENTS at December 31, 2022
(Unaudited), Continued
|
|
Shares
|
Value
|
||||||
|
Consumer Services: 2.0%
|
|||||||
|
46,811
|
Bright Horizons
|
||||||
|
Family Solutions,
|
|||||||
|
Inc. (United
|
|||||||
|
States) (a)
|
$
|
2,953,774
|
|||||
|
35,418
|
Marriott
|
||||||
|
International,
|
|||||||
|
Inc. – Class A
|
|||||||
|
(United States)
|
5,273,386
|
||||||
|
72,156
|
Starbucks Corp.
|
||||||
|
(United States)
|
7,157,875
|
||||||
|
15,385,035
|
|||||||
|
Diversified Financials: 3.7%
|
|||||||
|
137,972
|
Bank of New York
|
||||||
|
Mellon Corp.
|
|||||||
|
(United States)
|
6,280,485
|
||||||
|
115,794
|
Hannon Armstrong
|
||||||
|
Sustainable
|
|||||||
|
Infrastructure
|
|||||||
|
Capital, Inc. –
|
|||||||
|
REIT
|
|||||||
|
(United States)
|
3,355,710
|
||||||
|
60,311
|
Intercontinental
|
||||||
|
Exchange, Inc.
|
|||||||
|
(United States)
|
6,187,306
|
||||||
|
26,360
|
LPL Financial
|
||||||
|
Holdings, Inc.
|
|||||||
|
(United States)
|
5,698,241
|
||||||
|
15,349
|
MSCI, Inc.
|
||||||
|
(United States)
|
7,139,894
|
||||||
|
28,661,636
|
|||||||
|
Food & Staples Retailing: 1.3%
|
|||||||
|
204,956
|
Jeronimo Martins,
|
||||||
|
SGPS, SA
|
|||||||
|
(Portugal)
|
4,434,309
|
||||||
|
217,552
|
Koninklijke Ahold
|
||||||
|
Delhaize NV
|
|||||||
|
(Netherlands)
|
6,254,877
|
||||||
|
10,689,186
|
|||||||
|
Food, Beverage & Tobacco: 3.9%
|
|||||||
|
81,319
|
Darling Ingredients,
|
||||||
|
Inc. (United
|
|||||||
|
States) (a)
|
5,089,756
|
||||||
|
67,151
|
Kerry Group
|
||||||
|
PLC – Class A
|
|||||||
|
(Ireland)
|
6,065,750
|
||||||
|
87,755
|
McCormick &
|
||||||
|
Co., Inc.
|
|||||||
|
(United States)
|
7,274,012
|
||||||
|
101,435
|
Nestle SA
|
||||||
|
(Switzerland)
|
11,716,700
|
||||||
|
30,146,218
|
|||||||
|
Health Care Equipment & Services: 4.7%
|
|||||||
|
39,456
|
Cochlear Ltd.
|
||||||
|
(Australia)
|
5,449,175
|
||||||
|
45,713
|
Coloplast A/S –
|
||||||
|
Class B (Denmark)
|
5,355,402
|
||||||
|
106,273
|
CVS Health Corp.
|
||||||
|
(United States)
|
9,903,581
|
||||||
|
76,660
|
Edwards
|
||||||
|
Lifesciences Corp.
|
|||||||
|
(United States) (a)
|
5,719,603
|
||||||
|
43,210
|
Straumann
|
||||||
|
Holding AG
|
|||||||
|
(Switzerland)
|
4,954,942
|
||||||
|
84,752
|
Sysmex Corp.
|
||||||
|
(Japan)
|
5,116,529
|
||||||
|
36,499,232
|
|||||||
|
Household & Personal Products: 3.5%
|
|||||||
|
145,730
|
Essity AB – Class B
|
||||||
|
(Sweden)
|
3,816,259
|
||||||
|
119,036
|
Kao Corp. (Japan)
|
4,725,783
|
|||||
|
18,007
|
L’Oreal (France)
|
6,448,242
|
|||||
|
3,283
|
L’Oreal SA (France)
|
1,175,631
|
|||||
|
222,974
|
Unilever PLC
|
||||||
|
(United Kingdom)
|
11,188,080
|
||||||
|
27,353,995
|
|||||||
|
Insurance: 3.6%
|
|||||||
|
649,236
|
AIA Group Ltd.
|
||||||
|
(Hong Kong)
|
7,169,768
|
||||||
|
34,284
|
Allianz SE
|
||||||
|
(Germany)
|
7,321,589
|
||||||
|
949,287
|
Aviva PLC
|
||||||
|
(United Kingdom)
|
5,035,656
|
||||||
The accompanying notes are an integral part of these financial statements.
11
Trillium ESG Global Equity Fund
|
SCHEDULE OF INVESTMENTS at December 31, 2022
(Unaudited), Continued
|
|
Shares
|
Value
|
||||||
|
Insurance: 3.6% (Continued)
|
|||||||
|
45,462
|
The Travelers
|
||||||
|
Companies, Inc.
|
|||||||
|
(United States)
|
$
|
8,523,670
|
|||||
|
28,050,683
|
|||||||
|
Materials: 5.2%
|
|||||||
|
50,638
|
Air Liquide SA
|
||||||
|
(France)
|
7,187,300
|
||||||
|
142,222
|
Ball Corp.
|
||||||
|
(United States)
|
7,273,233
|
||||||
|
86,003
|
Croda International
|
||||||
|
PLC (United
|
|||||||
|
Kingdom)
|
6,844,031
|
||||||
|
45,546
|
Ecolab, Inc.
|
||||||
|
(United States)
|
6,629,676
|
||||||
|
874,462
|
Klabin SA – (Brazil)
|
3,303,442
|
|||||
|
33,117
|
Koninklijke DSM
|
||||||
|
NV (Netherlands)
|
4,066,574
|
||||||
|
20,854
|
Sika AG
|
||||||
|
(Switzerland)
|
5,013,369
|
||||||
|
40,317,625
|
|||||||
|
Media & Entertainment: 3.3%
|
|||||||
|
225,226
|
Alphabet, Inc. –
|
||||||
|
Class A (United
|
|||||||
|
States) (a)
|
19,871,690
|
||||||
|
66,113
|
The Walt Disney
|
||||||
|
Co. (United
|
|||||||
|
States) (a)
|
5,743,898
|
||||||
|
25,615,588
|
|||||||
|
Pharmaceuticals, Biotechnology &
|
|||||||
|
Life Sciences: 9.3%
|
|||||||
|
24,525
|
CSL Ltd.
|
||||||
|
(Australia)
|
4,782,238
|
||||||
|
125,543
|
Dechra
|
||||||
|
Pharmaceuticals
|
|||||||
|
PLC (United
|
|||||||
|
Kingdom)
|
3,957,112
|
||||||
|
89,423
|
Gilead Sciences, Inc.
|
||||||
|
(United States)
|
7,676,964
|
||||||
|
107,274
|
Merck & Co., Inc.
|
||||||
|
(United States)
|
11,902,050
|
||||||
|
41,208
|
Merck KGaA
|
||||||
|
(Germany)
|
7,950,658
|
||||||
|
89,312
|
Novo-Nordisk
|
||||||
|
A/S – Class B
|
|||||||
|
(Denmark)
|
12,129,960
|
||||||
|
15,015
|
Thermo Fisher
|
||||||
|
Scientific, Inc.
|
|||||||
|
(United States)
|
8,268,610
|
||||||
|
26,777
|
Roche Holdings AG
|
||||||
|
(Switzerland)
|
8,414,339
|
||||||
|
20,771
|
Waters Corp.
|
||||||
|
(United States) (a)
|
7,115,729
|
||||||
|
72,197,660
|
|||||||
|
Real Estate: 3.0%
|
|||||||
|
34,618
|
American Tower
|
||||||
|
Corp. – REIT
|
|||||||
|
(United States)
|
7,334,170
|
||||||
|
2,289,383
|
Capitaland Ltd.
|
||||||
|
(Singapore)
|
6,327,153
|
||||||
|
227,228
|
Daiwa House
|
||||||
|
Industry Co. Ltd.
|
|||||||
|
(Japan)
|
5,234,483
|
||||||
|
29,613
|
Jones Lang
|
||||||
|
LaSalle, Inc.
|
|||||||
|
(United States) (a)
|
4,719,424
|
||||||
|
23,615,230
|
|||||||
|
Retailing: 5.0%
|
|||||||
|
273,358
|
Industria de Diseno
|
||||||
|
Textil SA (Spain)
|
7,260,649
|
||||||
|
68,544
|
Target Corp.
|
||||||
|
(United States)
|
10,215,798
|
||||||
|
122,039
|
The TJX
|
||||||
|
Companies, Inc.
|
|||||||
|
(United States)
|
9,714,304
|
||||||
|
35,369
|
Tractor Supply Co.
|
||||||
|
(United States)
|
7,956,964
|
||||||
|
197,782
|
WH Smith PLC
|
||||||
|
(United Kingdom)
|
3,517,660
|
||||||
|
38,665,375
|
|||||||
|
Semiconductors & Semiconductor
|
|||||||
|
Equipment: 5.1%
|
|||||||
|
83,667
|
Applied
|
||||||
|
Materials, Inc.
|
|||||||
|
(United States)
|
8,147,492
|
||||||
The accompanying notes are an integral part of these financial statements.
12
Trillium ESG Global Equity Fund
|
SCHEDULE OF INVESTMENTS at December 31, 2022
(Unaudited), Continued
|
|
Shares
|
Value
|
||||||
|
Semiconductors & Semiconductor
|
|||||||
|
Equipment: 5.1% (Continued)
|
|||||||
|
249,834
|
Infineon
|
||||||
|
Technologies AG
|
|||||||
|
(Germany)
|
$
|
7,592,909
|
|||||
|
58,225
|
NVIDIA Corp.
|
||||||
|
(United States)
|
8,509,002
|
||||||
|
82,833
|
Taiwan
|
||||||
|
Semiconductor
|
|||||||
|
Manufacturing
|
|||||||
|
Co. Ltd. SA –
|
|||||||
|
ADR (Taiwan)
|
6,170,230
|
||||||
|
54,722
|
Texas
|
||||||
|
Instruments, Inc.
|
|||||||
|
(United States)
|
9,041,169
|
||||||
|
39,460,802
|
|||||||
|
Software & Services: 9.6%
|
|||||||
|
28,529
|
Accenture PLC –
|
||||||
|
Class A (Ireland)
|
7,612,678
|
||||||
|
25,275
|
Adobe Systems,
|
||||||
|
Inc. (United
|
|||||||
|
States) (a)
|
8,505,796
|
||||||
|
84,835
|
Amadeus IT
|
||||||
|
Holding SA
|
|||||||
|
(Spain) (a)
|
4,401,034
|
||||||
|
182,684
|
Dassault Systemes
|
||||||
|
SE (France)
|
6,569,232
|
||||||
|
117,118
|
Microsoft Corp.
|
||||||
|
(United States)
|
28,087,239
|
||||||
|
66,567
|
PayPal Holdings,
|
||||||
|
Inc. (United
|
|||||||
|
States) (a)
|
4,740,902
|
||||||
|
42,126
|
SAP SE
|
||||||
|
(Germany)
|
4,349,103
|
||||||
|
50,384
|
Visa, Inc. – Class A
|
||||||
|
(United States)
|
10,467,780
|
||||||
|
74,733,764
|
|||||||
|
Technology Hardware & Equipment: 6.6%
|
|||||||
|
261,930
|
Apple, Inc.
|
||||||
|
(United States)
|
34,032,565
|
||||||
|
135,887
|
Cisco Systems, Inc.
|
||||||
|
(United States)
|
6,473,657
|
||||||
|
50,780
|
IPG Photonics
|
||||||
|
Corp. (United
|
|||||||
|
States) (a)
|
4,807,342
|
||||||
|
13,013
|
Samsung SDI Co.
|
||||||
|
Ltd. (Republic
|
|||||||
|
of Korea)
|
6,110,157
|
||||||
|
51,423,721
|
|||||||
|
Telecommunication Services: 1.5%
|
|||||||
|
138,472
|
BCE, Inc. (Canada)
|
6,083,973
|
|||||
|
136,888
|
Verizon
|
||||||
|
Communications,
|
|||||||
|
Inc. (United
|
|||||||
|
States)
|
5,393,387
|
||||||
|
11,477,360
|
|||||||
|
Transportation: 2.8%
|
|||||||
|
90,591
|
Canadian Pacific
|
||||||
|
Railway Ltd.
|
|||||||
|
(Canada)
|
6,754,181
|
||||||
|
18,602
|
Kuehne + Nagel
|
||||||
|
International AG
|
|||||||
|
(Switzerland)
|
4,324,644
|
||||||
|
60,311
|
United Parcel
|
||||||
|
Service, Inc. –
|
|||||||
|
Class B
|
|||||||
|
(United States)
|
10,484,464
|
||||||
|
21,563,289
|
|||||||
|
Utilities: 2.7%
|
|||||||
|
46,745
|
American Water
|
||||||
|
Works Co., Inc.
|
|||||||
|
(United States)
|
7,124,873
|
||||||
|
270,605
|
EDP Renovaveis
|
||||||
|
SA (Spain)
|
5,962,908
|
||||||
|
718,222
|
Interconexion
|
||||||
|
Electrica SA ESP
|
|||||||
|
(Colombia)
|
3,142,072
|
||||||
|
707,794
|
Terna Rete Elettrica
|
||||||
|
Nazionale SpA
|
|||||||
|
(Italy)
|
5,227,181
|
||||||
|
21,457,034
|
|||||||
|
TOTAL COMMON STOCKS
|
|||||||
|
(Cost $569,049,048)
|
767,053,375
|
||||||
The accompanying notes are an integral part of these financial statements.
13
Trillium ESG Global Equity Fund
|
SCHEDULE OF INVESTMENTS at December 31, 2022
(Unaudited), Continued
|
|
Shares
|
Value
|
||||||
|
PREFERRED STOCKS: 0.5%
|
|||||||
|
Banks: 0.5%
|
|||||||
|
855,621
|
Itau Unibanco
|
||||||
|
Holding SA –
|
|||||||
|
ADR (Brazil) (b)
|
$
|
4,029,975
|
|||||
|
TOTAL PREFERRED STOCKS
|
|||||||
|
(Cost $4,406,508)
|
4,029,975
|
||||||
|
SHORT-TERM INVESTMENTS: 1.0%
|
|||||||
|
Money Market Funds: 1.0%
|
|||||||
|
7,640,734
|
Invesco –
|
||||||
|
Government &
|
|||||||
|
Agency Portfolio –
|
|||||||
|
Institutional Class
|
|||||||
|
(United States)
4.220% (c)
|
|||||||
|
7,640,734
|
|||||||
|
TOTAL SHORT-TERM
|
|||||||
|
INVESTMENTS
|
|||||||
|
(Cost $7,640,734)
|
7,640,734
|
||||||
|
TOTAL INVESTMENTS
|
|||||||
|
IN SECURITIES: 100.0%
|
|||||||
|
(Cost $581,096,290)
|
778,724,084
|
||||||
|
Liabilities in Excess
|
|||||||
|
of Other Assets: 0.0% (d)
|
(103,603
|
)
|
|||||
|
TOTAL NET ASSETS: 100.0%
|
$
|
778,620,481
|
|||||
|
(a)
|
Non-income producing security.
|
|
(b)
|
There is currently no dividend rate available.
|
|
(c)
|
Annualized seven-day effective yield as of December 31, 2022.
|
|
(d)
|
Does not round to 0.1% or (0.1%) as applicable.
|
ADR American Depositary Receipt
REIT Real Estate Investment Trust
The accompanying notes are an integral part of these financial statements.
14
Trillium ESG Small/Mid Cap Fund
Dear Shareholders,
For the six-month period ended December 31, 2022, the Trillium ESG Small/Mid Cap Fund (the “Fund” or “SMID Fund”) appreciated 4.80% on a net of fees basis, versus the S&P 1000 benchmark, which
reported an increase of 6.70%.
|
Performance as of
|
6
|
1
|
3
|
5
|
Since Inception
|
|
December 31, 2022
|
Months
|
Year
|
Year
|
Year
|
August 31, 2015
|
|
Institutional (TSMDX)
|
4.81%
|
-17.67%
|
5.55%
|
5.03%
|
7.22%
|
|
S&P 1000®
|
6.67%
|
-13.98%
|
6.80%
|
6.46%
|
9.32%
|
Periods greater than one year are average annual returns.
Performance data quoted represents past performance; past performance does not guarantee future results. The investment return and principal value of an investment will fluctuate so
that an investor’s shares, when redeemed, may be worth more or less than their original cost. Current performance of the Fund may be lower or higher than the performance quoted. Performance data current to the most recent month end may be obtained by
calling (866) 209-1962.
|
Expense Ratio*
|
||
|
Gross
|
1.42%
|
|
|
Net
|
0.98%
|
|
*
|
Gross expense ratio is from SMID Fund’s prospectus dated October 31, 2022. See the SMID Fund’s Financial Highlights in this report for the most current expense ratios. The Adviser has
contractually agreed to waive certain fees through October 31, 2023. The net expense ratio is applicable to investors.
|
We had noted during 2022 that we expected economic growth to slow throughout the year, reflecting both decreases in fiscal stimulus and the ongoing tightening in financial conditions. During the fourth
quarter, market participants began to look through the widely expected slowing financial conditions, rejoicing at economic data that indicated inflation had peaked and might give the Fed reason to stop raising rates earlier than anticipated. Economic
data, however, continues to support further caution, particularly the still-strong labor market and the Fed’s own messaging about interest rate trajectories. We conclude that our focus on long-term company financial and sustainability fundamentals
including management quality, and lower leverage, consistent with our historical investment process, will be the appropriate positioning.
One very bright spot in August 2022 was the surprise mid-quarter passage of the climate change-fighting Inflation Reduction Act (IRA), which drove very strong returns for companies involved in renewable
energy, clean technology, and the energy transition. While this legislation will not halt the devastation of climate change on its own, providing long-term regulatory stability and support
15
for domestic renewable energy supplies will help ensure that the buildout of renewable energy continues, providing a strong backdrop for many of our portfolio companies.
Relative to the S&P 1000, the contribution from sector weighting was neutral for the second half of 2022. Our underweight position in the Energy sector, one of the strongest sector performers during
the period, had a negative impact (-46 basis points) while our overweight to Industrials and underweight to Real Estate and Healthcare sectors were positive contributors. All other sectors were mostly neutral. Overall, stock selection hurt the
strategy during this period. Positive selection contributions from Consumer Discretionary, Information Technology, Industrials, and Communication Services were not enough to offset the negative effects from Healthcare, Materials and Financials.
Performance Leaders:
Deckers Outdoors Corporation (+56.32%) reported strong results in the period, beating expectations and demonstrating continued momentum. Even with a slowing
retail backdrop, the stock is well positioned in premium footwear, with notable growth from its HOKA brand and continued expansion opportunities in its UGG brand, both internationally and through the direct-to-consumer channel.
First Solar Inc (+119.86%) is primarily a utility-scale solar powered project developer and one of the largest beneficiaries of the Inflation Reduction Act (IRA).
Not only does the IRA give incentives for building solar generation capacity, it also gives a large credit to US-made solar panels, a segment where FSLR is essentially the only manufacturer of scale. The company has a strong pipeline of orders and is
sold out of capacity through 2025. We have taken advantage of the strength in the stock to trim our position.
Performance Laggards:
Omnicell (-55.67%) has been negatively impacted by hospital capital expenditure budget freezes and delays, as well as hospital labor availability challenges. We
continue to favor Omnicell as a long-term investment opportunity as its medication management and pharmacy automation equipment and services help their hospital customers improve their productivity, patient safety, and reduce their dependency on
labor.
Syneos Health (-48.83%), a clinical research organization, announced disappointing financial results given order postponements by its biopharma company customers.
While we continue to like the company’s end market, we are paying especially close attention to this company’s end market and operations to determine if there are company specific issues associated with this investment opportunity.
16
New Positions/Trades
Although improving, supply chain disruptions continue to exist in the market. The macroeconomic outlook remains cloudy, with the prospect of tepid economic growth, at best. The ultimate effect of the
Russian invasion of Ukraine on climate policy remains unknown, although higher perceived supply risks and higher fossil-fuel energy prices appear to be accelerating the adoption of clean energy technologies. On the heels of the remarkably rapid
increase in the Federal Funds rate, we are still cautious, although this is offset by a rise in opportunities stemming from more attractive valuations. We believe that we are adequately positioned for a more risk-off market.
Given the ongoing volatility in the markets, we continued to carefully review our portfolio characteristics and proposed trades. As long-term investors, we tend not to make dramatic changes, but rather
seek companies we have long term conviction in and we believe will demonstrate greater earnings stability as we go into a slowdown. Therefore, we pursue trading that will improve characteristics that would be beneficial during times of economic
stress, while not changing the overall complexion of the portfolio. The sharp pressure on the valuation of certain stocks, that we believe have been de-risked, has provided us with the opportunity to add some new names to the portfolio with solid
secular growth characteristics over our longer-term investment horizon.
New positions include Etsy, an online marketplace offering diverse products, giving us exposure to economic empowerment and pureplay ecommerce, a channel we
believe is gaining share despite the post pandemic lull. We conclude the company has a solid management team and a strong sustainability commitment that differentiates it from its peers. Ball Corp, is a global
market share leader in aluminum beverage cans. Global growth of beverage cans remains resilient, and aluminum is a more sustainable substrate that continues to see potential share gains from plastics and glass. Intercontinental
Hotels is the third largest, lodging brands company globally and gives us exposure to a rebound in business related travel.
We added to existing positions in Burlington Stores, Omnicell and AMN Healthcare
Services as well as MSA Safety, Trimble and Solar Edge Technologies. We funded these purchases by selling stocks that
we had either less conviction in, such as Minerals Technologies and Acadia Realty Trust, or trimming stocks where increases in valuation required reductions in Fund
positioning, which included Deckers Outdoors Corp, Lamb Weston, and LPL Holdings. We sold Zendesk
following the company’s receipt of an acquisition offer from a private equity firm and redeployed the capital within the IT sector to security software provider Cyberark Software and laser-innovator IPG Photonics. Additionally, we exited our position in West Pharmaceuticals given its appreciation to the larger end of our market cap range.
17
Relative to large cap stocks, the valuation of the S&P 1000, our benchmark, is at multi-decade lows as of this writing. We have seen pressure on valuation multiples throughout the year and we are
now seeing downward pressure on earnings. Market sentiment is variable and skewed bearish, which tends to indicate a favorable time to invest for the long term. In addition, small cap stocks tend to fare better coming out of recessions or economic
slowdowns. While it is impossible to time a bottom, nor do we try, we feel optimistic in the longer-term for our SMID portfolio holdings, given our focus on sustainable companies that demonstrate management quality and balance sheet strength,
especially as we navigate these volatile times in the market. Our belief in the importance of ESG is unabated, as we are convinced more than ever of the importance of integrating beyond-financial environmental, social and governance concerns into our
investment decisions.
Advocacy:
During the second half of 2022, Trillium’s Advocacy program led to many improvements in companies’ environmental, social, and governance policies, and impacts. We filed numerous shareholder proposals,
and engaged dozens of companies on critical social and environmental issues such as climate change, racial justice, toxic chemicals, and worker empowerment.
According to the Human Rights Campaign’s (“HRC”) Corporate Equality Index (“CEI”), automobile parts manufacturer LKQ Corporation lags other companies in providing an LGBTQ+-inclusive workplace. The
company scored 55/100 in 2022 and according to HRC does not offer equal health coverage for transgender individuals. Conversely, 67% of the Fortune 500 and 86% of all 1200 CEI-rated businesses offer transgender-inclusive health insurance coverage. We
are particularly concerned because LKQ’s employees may be especially affected by the lack of supportive corporate and state policies. Approximately 39% of LKQ’s employees are based in North America. Tennessee, considered one of the worst states for
LGBTQ+ equality with 31 anti-LGBTQ+ bills proposed in 2021, is a major operating location for LKQ. November, we filed a shareholder proposal at LKQ asking the company to adopt and publicly disclose a policy offering all employees affirmative
transgender-inclusive healthcare coverage.
Sincerely,
|
 |
 |
|
Laura McGonagle
|
Mitali Prasad
|
Elizabeth Levy
|
|
Portfolio Manager
|
Portfolio Manager
|
Portfolio Manager
|
18
Trillium ESG Small/Mid Cap Fund
|
SECTOR ALLOCATION at December 31, 2022 (Unaudited)
|
|
Sector
|
Percent of Net Assets
|
||||
|
|
|||||
|
Industrials
|
20.8
|
%
|
|||
|
Financials
|
15.1
|
%
|
|||
|
Consumer Discretionary
|
14.1
|
%
|
|||
|
Information Technology
|
13.5
|
%
|
|||
|
Health Care
|
8.5
|
%
|
|||
|
Consumer Staples
|
7.2
|
%
|
|||
|
Real Estate
|
6.4
|
%
|
|||
|
Materials
|
5.8
|
%
|
|||
|
Cash & Equivalents (a)
|
3.8
|
%
|
|||
|
Utilities
|
3.4
|
%
|
|||
|
Communication Services
|
1.4
|
%
|
|||
|
Total
|
100.0
|
%
|
|||
|
(a)
|
Represents cash, short-term securities and other assets in excess of liabilities.
|
19
Trillium ESG Small/Mid Cap Fund
Value of $100,000 vs S&P 1000® Index
(Unaudited)
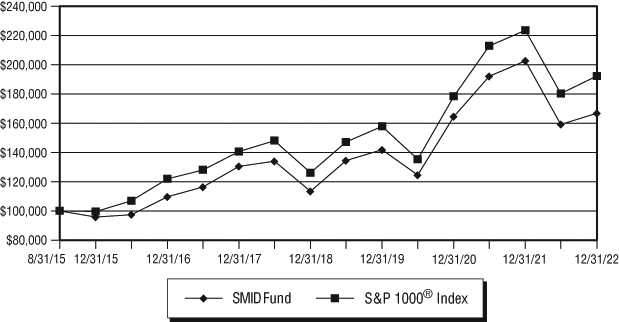
Average Annual Returns for the periods ended December 31, 2022
|
Since
|
||||
|
Inception
|
||||
|
1 Year
|
5 Year
|
8/31/2015
|
Value
|
|
|
SMID Fund
|
-17.67%
|
5.03%
|
7.22%
|
$166,799
|
|
S&P 1000® Index
|
-13.98%
|
6.46%
|
9.32%
|
$192,274
|
This chart illustrates the performance of a hypothetical $100,000 investment made on August 31, 2015, and is not intended to imply any future performance. The returns shown do not reflect the deduction
of taxes that a shareholder would pay on Fund distributions or the redemption of Fund shares. The returns reflect fee waivers in effect. In the absence of such waivers, total return would be reduced. The chart assumes reinvestment of capital gains,
dividends, and return of capital for the Fund and dividends for an index, but does not reflect redemption fees.
Performance data quoted represents past performance; past performance does not guarantee future results. The investment return and principal value of an investment will fluctuate so
that an investor’s shares, when redeemed, may be worth more or less than their original cost. Current performance of the Fund may be lower or higher than the performance quoted. Performance data current to the most recent month-end may be obtained by
calling 866-209-1962.
20
Trillium ESG Small/Mid Cap Fund
|
SCHEDULE OF INVESTMENTS at December 31, 2022
(Unaudited)
|
|
Shares
|
Value
|
||||||
|
COMMON STOCKS: 96.3%
|
|||||||
|
Banks: 7.0%
|
|||||||
|
10,455
|
East West
|
||||||
|
Bancorp, Inc.
|
$
|
688,985
|
|||||
|
6,864
|
Live Oak
|
||||||
|
Bancshares, Inc.
|
207,293
|
||||||
|
9,300
|
Sandy Spring
|
||||||
|
Bancorp, Inc.
|
327,639
|
||||||
|
32,630
|
Umpqua
|
||||||
|
Holdings Corp.
|
582,446
|
||||||
|
20,272
|
Webster
|
||||||
|
Financial Corp.
|
959,676
|
||||||
|
2,766,039
|
|||||||
|
Capital Goods: 13.7%
|
|||||||
|
6,259
|
AO Smith Corp.
|
358,266
|
|||||
|
9,898
|
Hexcel Corp.
|
582,497
|
|||||
|
5,287
|
Lincoln Electric
|
||||||
|
Holdings, Inc.
|
763,919
|
||||||
|
4,443
|
Middleby Corp. (a)
|
594,918
|
|||||
|
7,963
|
Quanta Services, Inc.
|
1,134,728
|
|||||
|
3,583
|
Trex Co, Inc. (a)
|
151,668
|
|||||
|
12,277
|
Wabtec Corp.
|
1,225,368
|
|||||
|
5,406
|
Xylem, Inc.
|
597,741
|
|||||
|
5,409,105
|
|||||||
|
Commercial & Professional Services: 4.7%
|
|||||||
|
4,801
|
ManpowerGroup, Inc.
|
399,491
|
|||||
|
5,653
|
MSA Safety, Inc.
|
815,106
|
|||||
|
4,554
|
Tetra Tech, Inc.
|
661,195
|
|||||
|
1,875,792
|
|||||||
|
Consumer Durables & Apparel: 4.6%
|
|||||||
|
2,835
|
Deckers Outdoor
|
||||||
|
Corp. (a)
|
1,131,618
|
||||||
|
18,576
|
Levi Strauss & Co. –
|
||||||
|
Class A
|
288,300
|
||||||
|
4,459
|
Meritage Homes
|
||||||
|
Corp. (a)
|
411,120
|
||||||
|
1,831,038
|
|||||||
|
Consumer Services: 2.4%
|
|||||||
|
7,022
|
Bright Horizons
|
||||||
|
Family Solutions,
|
|||||||
|
Inc. (a)
|
443,088
|
||||||
|
8,631
|
InterContinental
|
||||||
|
Hotels Group
|
|||||||
|
Plc – ADR
|
503,533
|
||||||
|
946,621
|
|||||||
|
Diversified Financials: 3.7%
|
|||||||
|
6,020
|
Hannon Armstrong
|
||||||
|
Sustainable
|
|||||||
|
Infrastructure
|
|||||||
|
Capital, Inc.
|
174,460
|
||||||
|
3,846
|
LPL Financial
|
||||||
|
Holdings, Inc.
|
831,390
|
||||||
|
7,549
|
Stifel Financial Corp.
|
440,635
|
|||||
|
1,446,485
|
|||||||
|
Food & Staples Retailing: 2.3%
|
|||||||
|
13,894
|
BJ’s Wholesale Club
|
||||||
|
Holdings, Inc. (a)
|
919,227
|
||||||
|
Food, Beverage & Tobacco: 3.8%
|
|||||||
|
5,414
|
Darling Ingredients,
|
||||||
|
Inc. (a)
|
338,862
|
||||||
|
5,176
|
Freshpet, Inc. (a)
|
273,138
|
|||||
|
9,977
|
Lamb Weston
|
||||||
|
Holdings, Inc.
|
891,544
|
||||||
|
1,503,544
|
|||||||
|
Health Care Equipment & Services: 6.4%
|
|||||||
|
4,762
|
AMN Healthcare
|
||||||
|
Services, Inc. (a)
|
489,629
|
||||||
|
2,122
|
LHC Group, Inc. (a)
|
343,106
|
|||||
|
7,931
|
Merit Medical
|
||||||
|
Systems, Inc. (a)
|
560,087
|
||||||
|
15,527
|
Omnicell, Inc. (a)
|
782,872
|
|||||
|
1,608
|
Penumbra, Inc. (a)
|
357,716
|
|||||
|
2,533,410
|
|||||||
|
Household & Personal Products: 1.0%
|
|||||||
|
5,080
|
Church & Dwight
|
||||||
|
Co., Inc.
|
409,499
|
||||||
|
Insurance: 4.4%
|
|||||||
|
5,342
|
Hanover Insurance
|
||||||
|
Group, Inc.
|
721,864
|
||||||
|
11,473
|
Horace Mann
|
||||||
|
Educators Corp.
|
428,746
|
||||||
The accompanying notes are an integral part of these financial statements.
21
Trillium ESG Small/Mid Cap Fund
|
SCHEDULE OF INVESTMENTS at December 31, 2022
(Unaudited), Continued
|
|
Shares
|
Value
|
||||||
|
Insurance: 4.4% (Continued)
|
|||||||
|
4,220
|
Reinsurance Group
|
||||||
|
America, Inc.
|
$
|
599,620
|
|||||
|
1,750,230
|
|||||||
|
Materials: 5.8%
|
|||||||
|
4,427
|
AptarGroup, Inc.
|
486,881
|
|||||
|
7,428
|
Ball Corp.
|
379,868
|
|||||
|
7,278
|
Ingevity Corp. (a)
|
512,663
|
|||||
|
4,770
|
Sensient
|
||||||
|
Technologies Corp.
|
347,828
|
||||||
|
9,228
|
Sonoco Products Co.
|
560,232
|
|||||
|
2,287,472
|
|||||||
|
Media & Entertainment: 1.4%
|
|||||||
|
16,864
|
New York Times
|
||||||
|
Co. – Class A
|
547,405
|
||||||
|
Pharmaceuticals, Biotechnology &
|
|||||||
|
Life Sciences: 2.1%
|
|||||||
|
4,936
|
Azenta, Inc. (a)
|
287,374
|
|||||
|
11,164
|
NanoString
|
||||||
|
Technologies,
|
|||||||
|
Inc. (a)
|
88,977
|
||||||
|
12,652
|
Syneos Health,
|
||||||
|
Inc. (a)
|
464,075
|
||||||
|
840,426
|
|||||||
|
Real Estate: 6.4%
|
|||||||
|
5,447
|
Camden Property
|
||||||
|
Trust – REIT
|
609,410
|
||||||
|
3,750
|
EastGroup Properties,
|
||||||
|
Inc. – REIT
|
555,225
|
||||||
|
2,181
|
Federal Realty
|
||||||
|
Investment Trust –
|
|||||||
|
REIT
|
220,368
|
||||||
|
14,357
|
Host Hotels &
|
||||||
|
Resorts, Inc. – REIT
|
230,430
|
||||||
|
3,153
|
Jones Lang
|
||||||
|
LaSalle, Inc. (a)
|
502,494
|
||||||
|
11,665
|
LTC Properties,
|
||||||
|
Inc. – REIT
|
414,457
|
||||||
|
2,532,384
|
|||||||
|
Retailing: 7.2%
|
|||||||
|
4,332
|
Burlington
|
||||||
|
Stores, Inc. (a)
|
878,356
|
||||||
|
3,504
|
Etsy, Inc. (a)
|
419,709
|
|||||
|
7,262
|
LKQ Corp.
|
387,863
|
|||||
|
5,057
|
Tractor Supply Co.
|
1,137,674
|
|||||
|
2,823,602
|
|||||||
|
Semiconductors & Semiconductor
|
|||||||
|
Equipment: 5.9%
|
|||||||
|
21,156
|
Allegro
|
||||||
|
MicroSystems,
|
|||||||
|
Inc. (a)
|
635,103
|
||||||
|
2,579
|
First Solar, Inc. (a)
|
386,308
|
|||||
|
2,150
|
SolarEdge
|
||||||
|
Technologies,
|
|||||||
|
Inc. (a)
|
609,031
|
||||||
|
10,312
|
Wolfspeed, Inc. (a)
|
711,940
|
|||||
|
2,342,382
|
|||||||
|
Software & Services: 4.1%
|
|||||||
|
7,883
|
Blackbaud, Inc. (a)
|
463,993
|
|||||
|
5,430
|
CyberArk
|
||||||
|
Software Ltd. (a)
|
704,000
|
||||||
|
2,238
|
Paylocity
|
||||||
|
Holding Corp. (a)
|
434,754
|
||||||
|
1,602,747
|
|||||||
|
Technology Hardware & Equipment: 3.6%
|
|||||||
|
6,951
|
IPG Photonics
|
||||||
|
Corp. (a)
|
658,051
|
||||||
|
1,218
|
Rogers Corp. (a)
|
145,356
|
|||||
|
11,928
|
Trimble, Inc. (a)
|
603,080
|
|||||
|
1,406,487
|
|||||||
|
Transportation: 2.4%
|
|||||||
|
5,414
|
JB Hunt Transport
|
||||||
|
Services, Inc.
|
943,985
|
||||||
|
Utilities: 3.4%
|
|||||||
|
8,225
|
Avista Corp.
|
364,697
|
|||||
|
7,022
|
Essential
|
||||||
|
Utilities, Inc.
|
335,160
|
||||||
|
7,572
|
Ormat
|
||||||
|
Technologies, Inc.
|
654,826
|
||||||
|
1,354,683
|
|||||||
|
TOTAL COMMON STOCKS
|
|||||||
|
(Cost $39,207,266)
|
38,072,563
|
||||||
The accompanying notes are an integral part of these financial statements.
22
Trillium ESG Small/Mid Cap Fund
|
SCHEDULE OF INVESTMENTS at December 31, 2022
(Unaudited), Continued
|
|
Shares
|
Value
|
||||||
|
SHORT-TERM INVESTMENTS: 2.1%
|
|||||||
|
Money Market Funds: 2.1%
|
|||||||
|
835,434
|
Invesco-
|
||||||
|
Government &
|
|||||||
|
Agency Portfolio –
|
|||||||
|
Institutional Class
4.220% (b)
|
|||||||
|
$
|
835,434
|
||||||
|
TOTAL SHORT-TERM
|
|||||||
|
INVESTMENTS
|
|||||||
|
(Cost $835,434)
|
835,434
|
||||||
|
TOTAL INVESTMENTS
|
|||||||
|
IN SECURITIES: 98.4%
|
|||||||
|
(Cost $40,042,732)
|
38,907,997
|
||||||
|
Other Assets in Excess
|
|||||||
|
of Liabilities: 1.6%
|
650,696
|
||||||
|
TOTAL NET ASSETS: 100.0%
|
$
|
39,558,693
|
|||||
|
(a)
|
Non-income producing security.
|
|
|
(b)
|
Annualized seven-day effective yield as of December 31, 2022.
|
|
|
ADR
|
American Depositary Receipt
|
|
|
REIT
|
Real Estate Investment Trust
|
The accompanying notes are an integral part of these financial statements.
23
Trillium Mutual Funds
|
STATEMENTS OF ASSETS AND LIABILITIES at December 31,
2022 (Unaudited)
|
|
|
Trillium
|
Trillium
|
||||||
|
|
ESG Global
|
ESG Small/Mid
|
||||||
|
|
Equity Fund
|
Cap Fund(a)
|
||||||
|
ASSETS
|
||||||||
|
Investments in securities, at value
|
||||||||
|
(cost $581,096,290 and $40,042,732)
|
$
|
778,724,084
|
$
|
38,907,997
|
||||
|
Cash
|
27,244
|
10
|
||||||
|
Receivables:
|
||||||||
|
Dividends and interest
|
1,932,612
|
27,754
|
||||||
|
Fund shares sold
|
1,371,596
|
659,999
|
||||||
|
Securities lending income, net
|
635
|
—
|
||||||
|
Prepaid expenses
|
20,374
|
12,117
|
||||||
|
Total assets
|
782,076,545
|
39,607,877
|
||||||
|
|
||||||||
|
LIABILITIES
|
||||||||
|
Payables:
|
||||||||
|
Fund shares redeemed
|
2,572,351
|
—
|
||||||
|
Investment advisory fees, net
|
536,275
|
9,128
|
||||||
|
Administration fees
|
88,379
|
9,667
|
||||||
|
Custody fees
|
63,036
|
2,132
|
||||||
|
Fund accounting fees
|
21,871
|
5,426
|
||||||
|
Audit fees
|
13,358
|
11,897
|
||||||
|
Distribution fees
|
29,403
|
—
|
||||||
|
Transfer agent fees
|
64,718
|
4,820
|
||||||
|
Chief Compliance Officer fees
|
2,135
|
2,064
|
||||||
|
Trustee fees
|
8,361
|
2,211
|
||||||
|
Other accrued expenses
|
56,177
|
1,839
|
||||||
|
Total liabilities
|
3,456,064
|
49,184
|
||||||
|
NET ASSETS
|
$
|
778,620,481
|
$
|
39,558,693
|
||||
|
|
||||||||
|
COMPONENTS OF NET ASSETS
|
||||||||
|
Paid-in capital
|
$
|
560,455,206
|
$
|
40,652,446
|
||||
|
Total distributable (accumulated)
|
||||||||
|
earnings (losses)
|
218,165,275
|
(1,093,753
|
)
|
|||||
|
Net assets
|
$
|
778,620,481
|
$
|
39,558,693
|
||||
The accompanying notes are an integral part of these financial statements.
24
Trillium Mutual Funds
|
STATEMENTS OF ASSETS AND LIABILITIES at December 31,
2022 (Unaudited), Continued
|
|
Trillium
|
Trillium
|
|||||||
|
ESG Global
|
ESG Small/Mid
|
|||||||
|
Equity Fund
|
Cap Fund(a)
|
|||||||
|
Retail Class
|
||||||||
|
Net assets
|
$
|
224,117,504
|
$
|
—
|
||||
|
Shares of beneficial interest issued
|
||||||||
|
and outstanding (unlimited number of
|
||||||||
|
shares authorized without par value)
|
4,391,634
|
—
|
||||||
|
Net asset value, offering price,
|
||||||||
|
and redemption price per share
|
$
|
51.03
|
$
|
—
|
||||
|
Institutional Class
|
||||||||
|
Net assets
|
$
|
554,502,977
|
$
|
39,558,693
|
||||
|
Shares of beneficial interest issued
|
||||||||
|
and outstanding (unlimited number of
|
||||||||
|
shares authorized without par value)
|
10,931,557
|
2,832,313
|
||||||
|
Net asset value, offering price,
|
||||||||
|
and redemption price per share
|
$
|
50.72
|
$
|
13.97
|
||||
|
(a)
|
Retail shares are not offered as of December 31, 2022
|
The accompanying notes are an integral part of these financial statements.
25
(This Page Intentionally Left Blank.)
26
Trillium Mutual Funds
|
STATEMENTS OF OPERATIONS For the six months ended December 31, 2022 (Unaudited)
|
|
|
Trillium
|
Trillium
|
||||||
|
|
ESG Global
|
ESG Small/Mid
|
||||||
|
|
Equity Fund
|
Cap Fund(a)
|
||||||
|
INCOME
|
||||||||
|
Dividend income (net of foreign withholding
|
||||||||
|
tax and issuance fees of $273,054 and $—)
|
$
|
5,567,764
|
$
|
205,362
|
||||
|
Interest
|
155,998
|
10,114
|
||||||
|
Income from securities lending, net
|
1,023
|
—
|
||||||
|
Total investment income
|
5,724,768
|
215,476
|
||||||
|
|
||||||||
|
EXPENSES
|
||||||||
|
Investment advisory fees
|
3,496,435
|
134,784
|
||||||
|
Distribution fees – Retail Class
|
266,897
|
—
|
||||||
|
Administration fees
|
252,618
|
28,905
|
||||||
|
Transfer agent fees
|
140,096
|
13,818
|
||||||
|
Custody fees
|
141,384
|
3,600
|
||||||
|
Fund accounting fees
|
36,729
|
15,959
|
||||||
|
Sub-transfer agent fees
|
58,021
|
—
|
||||||
|
Registration fees
|
22,621
|
17,388
|
||||||
|
Miscellaneous expenses
|
28,814
|
4,244
|
||||||
|
Reports to shareholders
|
37,777
|
1,240
|
||||||
|
Audit fees
|
13,358
|
11,897
|
||||||
|
Trustees fees
|
24,853
|
11,240
|
||||||
|
Chief Compliance Officer fees
|
6,301
|
6,367
|
||||||
|
Legal fees
|
3,804
|
3,804
|
||||||
|
Insurance expenses
|
4,817
|
2,762
|
||||||
|
Interest expenses
|
14,530
|
—
|
||||||
|
Total expenses
|
4,549,055
|
256,008
|
||||||
|
Less: fees waived and expenses absorbed
|
—
|
(79,890
|
)
|
|||||
|
Net expenses
|
4,549,055
|
176,118
|
||||||
|
Net investment income (loss)
|
1,175,713
|
39,358
|
||||||
|
|
||||||||
|
REALIZED AND UNREALIZED GAIN (LOSS) ON INVESTMENTS:
|
||||||||
|
Net realized gain (loss) on investments
|
||||||||
|
and foreign currency transactions
|
34,059,834
|
391,684
|
||||||
|
Net change in unrealized
|
||||||||
|
appreciation/depreciation on:
|
||||||||
|
Investments
|
(17,334,063
|
)
|
1,115,041
|
|||||
|
Translation of other assets and
|
||||||||
|
liabilities in foreign currency
|
(28,838
|
)
|
—
|
|||||
|
Net realized and unrealized gain (loss) on
|
||||||||
|
investments and foreign currency transactions
|
16,696,933
|
1,506,725
|
||||||
|
Net increase (decrease) in net assets
|
||||||||
|
resulting from operations
|
$
|
17,872,646
|
$
|
1,546,083
|
||||
The accompanying notes are an integral part of these financial statements.
27
Trillium ESG Global Equity Fund
|
STATEMENTS OF CHANGES IN NET ASSETS
|
|
|
Six Months Ended
|
|||||||
|
|
December 31, 2022
|
Year Ended
|
||||||
|
|
(Unaudited)
|
June 30, 2022
|
||||||
|
INCREASE (DECREASE) IN NET ASSETS FROM:
|
||||||||
|
|
||||||||
|
OPERATIONS
|
||||||||
|
Net investment income (loss)
|
$
|
1,175,713
|
$
|
5,306,574
|
||||
|
Net realized gain (loss) on investments
|
||||||||
|
and foreign currency transactions
|
34,059,834
|
23,404,366
|
||||||
|
Net change in unrealized appreciation/depreciation
|
||||||||
|
on investments and translation of other assets
|
||||||||
|
and liabilities in foreign currency
|
(17,362,901
|
)
|
(213,224,273
|
)
|
||||
|
Net increase (decrease) in net assets
|
||||||||
|
resulting from operations
|
17,872,646
|
(184,513,333
|
)
|
|||||
|
|
||||||||
|
DISTRIBUTIONS TO SHAREHOLDERS
|
||||||||
|
Net distributions to shareholders –
|
||||||||
|
Retail Class
|
(10,810,706
|
)
|
(8,396,385
|
)
|
||||
|
Net distributions to shareholders –
|
||||||||
|
Institutional Class
|
(28,695,277
|
)
|
(20,850,857
|
)
|
||||
|
Total distributions to shareholders
|
(39,505,983
|
)
|
(29,247,242
|
)
|
||||
|
|
||||||||
|
CAPITAL SHARE TRANSACTIONS
|
||||||||
|
Net increase (decrease) in net assets derived from
|
||||||||
|
net change in outstanding shares – Retail Class1
|
(1,647,167
|
)
|
(1,545,684
|
)
|
||||
|
Net increase (decrease) in net assets derived from
|
||||||||
|
net change in outstanding shares –
|
||||||||
|
Institutional Class2
|
(38,750,754
|
)
|
139,062,000
|
|||||
|
Total increase (decrease) in net assets
|
||||||||
|
from capital share transactions
|
(40,397,921
|
)
|
137,516,316
|
|||||
|
Total increase (decrease) in net assets
|
(62,031,258
|
)
|
(76,244,259
|
)
|
||||
|
|
||||||||
|
NET ASSETS
|
||||||||
|
Beginning of period/year
|
840,651,739
|
916,895,998
|
||||||
|
End of period/year
|
$
|
778,620,481
|
$
|
840,651,739
|
||||
The accompanying notes are an integral part of these financial statements.
28
Trillium ESG Global Equity Fund
|
STATEMENTS OF CHANGES IN NET ASSETS, Continued
|
|
1
|
Summary of capital share transactions for Retail Class shares is as follows:
|
|
Six Months Ended
|
|||||||||||||||||
|
December 31, 2022
|
Year Ended
|
||||||||||||||||
|
(Unaudited)
|
June 30, 2022
|
||||||||||||||||
|
Shares
|
Amount
|
Shares
|
Amount
|
||||||||||||||
|
Retail Class:
|
|||||||||||||||||
|
Shares sold
|
141,414
|
$
|
7,488,707
|
756,645
|
$
|
50,245,595
|
|||||||||||
|
Shares issued in
|
|||||||||||||||||
|
reinvestment
|
|||||||||||||||||
|
of distributions
|
204,268
|
10,444,224
|
121,384
|
8,148,498
|
|||||||||||||
|
Shares redeemed
|
(365,709
|
)
|
(19,580,098
|
)
|
(934,440
|
)
|
(59,939,777
|
)
|
|||||||||
|
Net increase (decrease)
|
(20,027
|
)
|
$
|
(1,647,167
|
)
|
(56,411
|
)
|
$
|
(1,545,684
|
)
|
|||||||
|
2
|
Summary of capital share transactions for Institutional Class shares is as follows:
|
|
Six Months Ended
|
|||||||||||||||||
|
December 31, 2022
|
Year Ended
|
||||||||||||||||
|
(Unaudited)
|
June 30, 2022
|
||||||||||||||||
|
Shares
|
Amount
|
Shares
|
Amount
|
||||||||||||||
|
Institutional Class:
|
|||||||||||||||||
|
Shares sold
|
1,459,063
|
$
|
76,727,252
|
3,420,132
|
$
|
220,091,817
|
|||||||||||
|
Shares issued in
|
|||||||||||||||||
|
reinvestment
|
|||||||||||||||||
|
of distributions
|
474,065
|
24,091,968
|
268,469
|
17,922,969
|
|||||||||||||
|
Shares redeemed
|
(2,584,384
|
)
|
(139,569,974
|
)
|
(1,574,709
|
)
|
(98,952,786
|
)
|
|||||||||
|
Net increase (decrease)
|
(651,256
|
)
|
$
|
(38,750,754
|
)
|
2,113,892
|
$
|
139,062,000
|
|||||||||
The accompanying notes are an integral part of these financial statements.
29
Trillium ESG Small/Mid Cap Fund
|
STATEMENTS OF CHANGES IN NET ASSETS
|
|
|
Six Months Ended
|
|||||||
|
|
December 31, 2022
|
Year Ended
|
||||||
|
|
(Unaudited)
|
June 30, 2022
|
||||||
|
INCREASE (DECREASE) IN NET ASSETS FROM:
|
||||||||
|
|
||||||||
|
OPERATIONS
|
||||||||
|
Net investment income (loss)
|
$
|
39,358
|
$
|
(44,027
|
)
|
|||
|
Net realized gain (loss) on investments
|
391,684
|
1,914,191
|
||||||
|
Net change in unrealized
|
||||||||
|
appreciation/depreciation on investments
|
1,115,041
|
(8,988,350
|
)
|
|||||
|
Net increase (decrease) in net assets
|
||||||||
|
resulting from operations
|
1,546,083
|
(7,118,186
|
)
|
|||||
|
|
||||||||
|
DISTRIBUTIONS TO SHAREHOLDERS
|
||||||||
|
Total distributions to shareholders
|
(1,066,880
|
)
|
(858,444
|
)
|
||||
|
|
||||||||
|
CAPITAL SHARE TRANSACTIONS
|
||||||||
|
Net increase (decrease) in net assets derived from
|
||||||||
|
net change in outstanding shares –
|
||||||||
|
Institutional Class1
|
5,902,628
|
9,442,548
|
||||||
|
Total increase (decrease) in net assets
|
||||||||
|
from capital share transactions
|
5,902,628
|
9,442,548
|
||||||
|
Total increase (decrease) in net assets
|
6,381,831
|
1,465,918
|
||||||
|
|
||||||||
|
NET ASSETS
|
||||||||
|
Beginning of period/year
|
33,176,862
|
31,710,944
|
||||||
|
End of period/year
|
$
|
39,558,693
|
$
|
33,176,862
|
||||
|
1
|
Summary of capital share transactions for Institutional Class shares is as follows:
|
|
Six Months Ended
|
|||||||||||||||||
|
December 31, 2022
|
Year Ended
|
||||||||||||||||
|
(Unaudited)
|
June 30, 2022
|
||||||||||||||||
|
Shares
|
Amount
|
Shares
|
Amount
|
||||||||||||||
|
Shares sold
|
552,760
|
$
|
7,880,825
|
800,161
|
$
|
13,374,943
|
|||||||||||
|
Shares issued in
|
|||||||||||||||||
|
reinvestment
|
|||||||||||||||||
|
of distributions
|
75,066
|
1,037,417
|
49,724
|
833,870
|
|||||||||||||
|
Shares redeemed2
|
(211,732
|
)
|
(3,015,614
|
)
|
(303,039
|
)
|
(4,766,265
|
)
|
|||||||||
|
Net increase (decrease)
|
416,094
|
$
|
5,902,628
|
546,846
|
$
|
9,442,548
|
|||||||||||
|
2
|
Net of redemption fees of $312 and $1,808, respectively.
|
The accompanying notes are an integral part of these financial statements.
30
Trillium ESG Global Equity Fund
|
FINANCIAL HIGHLIGHTS For a capital share outstanding
throughout each period/year
|
Retail Class
|
|
Period
|
|||||||||||||||||||||||
|
|
Ended
|
|||||||||||||||||||||||
|
|
December 31,
|
Year Ended June 30,
|
||||||||||||||||||||||
|
|
2022
|
|||||||||||||||||||||||
|
|
(Unaudited)
|
2022
|
2021
|
2020
|
2019
|
2018
|
||||||||||||||||||
|
Net asset value,
|
||||||||||||||||||||||||
|
beginning of period/year
|
$
|
52.71
|
$
|
65.97
|
$
|
45.99
|
$
|
44.81
|
$
|
43.21
|
$
|
39.44
|
||||||||||||
|
|
||||||||||||||||||||||||
|
INCOME (LOSS) FROM INVESTMENT OPERATIONS:
|
||||||||||||||||||||||||
|
Net investment
|
||||||||||||||||||||||||
|
income (loss)1
|
0.02
|
0.20
|
0.06
|
0.10
|
0.23
|
0.30
|
||||||||||||||||||
|
Net realized and unrealized
|
||||||||||||||||||||||||
|
gain (loss) on investments
|
0.85
|
(11.64
|
)
|
21.00
|
2.19
|
3.09
|
4.52
|
|||||||||||||||||
|
Total from
|
||||||||||||||||||||||||
|
investment operations
|
0.87
|
(11.44
|
)
|
21.06
|
2.29
|
3.32
|
4.82
|
|||||||||||||||||
|
|
||||||||||||||||||||||||
|
LESS DISTRIBUTIONS:
|
||||||||||||||||||||||||
|
Distributions from
|
||||||||||||||||||||||||
|
net investment income
|
(0.22
|
)
|
(0.03
|
)
|
(0.07
|
)
|
(0.24
|
)
|
(0.25
|
)
|
(0.17
|
)
|
||||||||||||
|
Distributions from
|
||||||||||||||||||||||||
|
net realized gain
|
(2.33
|
)
|
(1.79
|
)
|
(1.01
|
)
|
(0.87
|
)
|
(1.47
|
)
|
(0.88
|
)
|
||||||||||||
|
Total distributions
|
(2.55
|
)
|
(1.82
|
)
|
(1.08
|
)
|
(1.11
|
)
|
(1.72
|
)
|
(1.05
|
)
|
||||||||||||
|
Net asset value,
|
||||||||||||||||||||||||
|
end of period/year
|
$
|
51.03
|
$
|
52.71
|
$
|
65.97
|
$
|
45.99
|
$
|
44.81
|
$
|
43.21
|
||||||||||||
|
Total return
|
1.64
|
%
|
(17.94
|
%)
|
46.14
|
%
|
5.02
|
%
|
8.52
|
%
|
12.28
|
%
|
||||||||||||
|
|
||||||||||||||||||||||||
|
SUPPLEMENTAL DATA:
|
||||||||||||||||||||||||
|
Net assets, end of
|
||||||||||||||||||||||||
|
period/year (000’s omitted)
|
$
|
224.1
|
$
|
232.5
|
$
|
297.8
|
$
|
217.8
|
$
|
239.3
|
$
|
242.4
|
||||||||||||
|
Portfolio turnover rate
|
5
|
%
|
7
|
%
|
10
|
%
|
11
|
%
|
16
|
%
|
12
|
%
|
||||||||||||
|
|
||||||||||||||||||||||||
|
SUPPLEMENTAL DATA:
|
||||||||||||||||||||||||
|
Ratio of expenses to
|
||||||||||||||||||||||||
|
average net assets
|
1.31
|
%
|
1.30
|
%
|
1.30
|
%
|
1.30
|
%
|
1.33
|
%
|
1.34
|
%
|
||||||||||||
|
Ratio of net investment
|
||||||||||||||||||||||||
|
income to average
|
||||||||||||||||||||||||
|
net assets
|
0.08
|
%
|
0.30
|
%
|
0.11
|
%
|
0.22
|
%
|
0.55
|
%
|
0.70
|
%
|
||||||||||||
|
1
|
Calculated using the average shares outstanding method.
|
The accompanying notes are an integral part of these financial statements.
31
Trillium ESG Global Equity Fund
|
FINANCIAL HIGHLIGHTS For a capital share outstanding
throughout each period/year
|
Institutional Class
|
|
Period
|
|||||||||||||||||||||||
|
|
Ended
|
|||||||||||||||||||||||
|
|
December 31,
|
Year Ended June 30,
|
||||||||||||||||||||||
|
|
2022
|
|||||||||||||||||||||||
|
|
(Unaudited)
|
2022
|
2021
|
2020
|
2019
|
2018
|
||||||||||||||||||
|
Net asset value,
|
||||||||||||||||||||||||
|
beginning of period/year
|
$
|
52.50
|
$
|
65.70
|
$
|
45.80
|
$
|
44.61
|
$
|
43.05
|
$
|
39.34
|
||||||||||||
|
|
||||||||||||||||||||||||
|
INCOME (LOSS) FROM INVESTMENT OPERATIONS:
|
||||||||||||||||||||||||
|
Net investment
|
||||||||||||||||||||||||
|
income (loss)1
|
0.10
|
0.41
|
0.23
|
0.22
|
0.37
|
0.43
|
||||||||||||||||||
|
Net realized and unrealized
|
||||||||||||||||||||||||
|
gain (loss) on investments
|
0.84
|
(11.61
|
)
|
20.89
|
2.20
|
3.03
|
4.50
|
|||||||||||||||||
|
Total from
|
||||||||||||||||||||||||
|
investment operations
|
0.94
|
(11.20
|
)
|
21.12
|
2.42
|
3.40
|
4.93
|
|||||||||||||||||
|
|
||||||||||||||||||||||||
|
LESS DISTRIBUTIONS:
|
||||||||||||||||||||||||
|
Distributions from
|
||||||||||||||||||||||||
|
net investment income
|
(0.39
|
)
|
(0.21
|
)
|
(0.21
|
)
|
(0.36
|
)
|
(0.37
|
)
|
(0.34
|
)
|
||||||||||||
|
Distributions from
|
||||||||||||||||||||||||
|
net realized gain
|
(2.33
|
)
|
(1.79
|
)
|
(1.01
|
)
|
(0.87
|
)
|
(1.47
|
)
|
(0.88
|
)
|
||||||||||||
|
Total distributions
|
(2.72
|
)
|
(2.00
|
)
|
(1.22
|
)
|
(1.23
|
)
|
(1.84
|
)
|
(1.22
|
)
|
||||||||||||
|
Net asset value,
|
||||||||||||||||||||||||
|
end of period/year
|
$
|
50.72
|
$
|
52.50
|
$
|
65.70
|
$
|
45.80
|
$
|
44.61
|
$
|
43.05
|
||||||||||||
|
Total return
|
1.80
|
%
|
(17.16
|
%)
|
46.52
|
%
|
5.34
|
%
|
8.81
|
%
|
12.59
|
%
|
||||||||||||
|
|
||||||||||||||||||||||||
|
SUPPLEMENTAL DATA:
|
||||||||||||||||||||||||
|
Net assets, end of
|
||||||||||||||||||||||||
|
period/year (000’s omitted)
|
$
|
554.5
|
$
|
608.1
|
$
|
622.1
|
$
|
360.6
|
$
|
319.9
|
$
|
261.9
|
||||||||||||
|
Portfolio turnover rate
|
5
|
%
|
7
|
%
|
10
|
%
|
11
|
%
|
16
|
%
|
12
|
%
|
||||||||||||
|
|
||||||||||||||||||||||||
|
SUPPLEMENTAL DATA:
|
||||||||||||||||||||||||
|
Ratio of expenses to
|
||||||||||||||||||||||||
|
average net assets
|
1.03
|
%
|
1.01
|
%
|
1.02
|
%
|
1.03
|
%
|
1.05
|
%
|
1.07
|
%
|
||||||||||||
|
Ratio of net investment
|
||||||||||||||||||||||||
|
income (loss) to
|
||||||||||||||||||||||||
|
average net assets
|
0.36
|
%
|
0.65
|
%
|
0.40
|
%
|
0.49
|
%
|
0.87
|
%
|
1.00
|
%
|
||||||||||||
|
1
|
Calculated using the average shares outstanding method.
|
The accompanying notes are an integral part of these financial statements.
32
Trillium ESG Small/Mid Cap Fund
|
FINANCIAL HIGHLIGHTS For a capital share outstanding
throughout each period/year
|
Institutional Class
|
|
Period
|
|||||||||||||||||||||||
|
|
Ended
|
|||||||||||||||||||||||
|
|
December 31,
|
Year Ended June 30,
|
||||||||||||||||||||||
|
|
2022
|
|||||||||||||||||||||||
|
|
(Unaudited)
|
2022
|
2021
|
2020
|
2019
|
2018
|
||||||||||||||||||
|
Net asset value,
|
||||||||||||||||||||||||
|
beginning of period/year
|
$
|
13.73
|
$
|
16.96
|
$
|
11.01
|
$
|
12.36
|
$
|
12.97
|
$
|
11.46
|
||||||||||||
|
|
||||||||||||||||||||||||
|
INCOME (LOSS) FROM INVESTMENT OPERATIONS:
|
||||||||||||||||||||||||
|
Net investment
|
||||||||||||||||||||||||
|
income (loss)1
|
0.01
|
(0.02
|
)
|
(0.02
|
)
|
0.04
|
0.05
|
0.00
|
2
|
|||||||||||||||
|
Net realized and unrealized
|
||||||||||||||||||||||||
|
gain (loss) on investments
|
0.65
|
(2.82
|
)
|
5.99
|
(0.90
|
)
|
(0.13
|
)
|
1.73
|
|||||||||||||||
|
Total from
|
||||||||||||||||||||||||
|
investment operations
|
0.66
|
(2.84
|
)
|
5.97
|
(0.86
|
)
|
(0.08
|
)
|
1.73
|
|||||||||||||||
|
|
||||||||||||||||||||||||
|
LESS DISTRIBUTIONS:
|
||||||||||||||||||||||||
|
Distributions from
|
||||||||||||||||||||||||
|
net investment income
|
(0.01
|
)
|
—
|
(0.02
|
)
|
(0.05
|
)
|
(0.02
|
)
|
—
|
||||||||||||||
|
Distributions from
|
||||||||||||||||||||||||
|
net realized gain
|
(0.41
|
)
|
(0.39
|
)
|
—
|
(0.45
|
)
|
(0.51
|
)
|
(0.22
|
)
|
|||||||||||||
|
Total distributions
|
(0.42
|
)
|
(0.39
|
)
|
(0.02
|
)
|
(0.50
|
)
|
(0.53
|
)
|
(0.22
|
)
|
||||||||||||
|
Proceeds from
|
||||||||||||||||||||||||
|
redemption fees
|
0.00
|
2
|
0.00
|
2
|
0.00
|
2
|
0.01
|
0.00
|
2
|
0.00
|
2
|
|||||||||||||
|
Net asset value,
|
||||||||||||||||||||||||
|
end of period/year
|
$
|
13.97
|
$
|
13.73
|
$
|
16.96
|
$
|
11.01
|
$
|
12.36
|
$
|
12.97
|
||||||||||||
|
Total return
|
4.81
|
%
|
(17.16
|
%)
|
54.23
|
%
|
(7.34
|
%)
|
0.32
|
%
|
15.14
|
%
|
||||||||||||
|
|
||||||||||||||||||||||||
|
SUPPLEMENTAL DATA:
|
||||||||||||||||||||||||
|
Net assets, end of
|
||||||||||||||||||||||||
|
period/year (000’s omitted)
|
$
|
39.6
|
$
|
33.2
|
$
|
31.7
|
$
|
14.0
|
$
|
19.9
|
$
|
17.0
|
||||||||||||
|
Portfolio turnover rate
|
13
|
%
|
21
|
%
|
20
|
%
|
35
|
%
|
27
|
%
|
19
|
%
|
||||||||||||
|
|
||||||||||||||||||||||||
|
RATIO OF EXPENSES TO AVERAGE NET ASSETS
|
||||||||||||||||||||||||
|
Before fees waived/recouped
|
||||||||||||||||||||||||
|
and expenses absorbed
|
1.42
|
%
|
1.36
|
%
|
1.77
|
%
|
1.93
|
%
|
1.85
|
%
|
2.19
|
%
|
||||||||||||
|
After fees waived/recouped
|
||||||||||||||||||||||||
|
and expenses absorbed
|
0.98
|
%
|
0.98
|
%
|
0.98
|
%
|
0.98
|
%
|
0.98
|
%
|
0.98
|
%
|
||||||||||||
|
|
||||||||||||||||||||||||
|
RATIO OF NET INVESTMENT INCOME (LOSS) TO AVERAGE NET ASSETS:
|
||||||||||||||||||||||||
|
Before fees waived/recouped
|
||||||||||||||||||||||||
|
and expenses absorbed
|
(0.31
|
%)
|
(0.50
|
%)
|
(0.94
|
%)
|
(0.61
|
%)
|
(0.47
|
%)
|
(1.21
|
%)
|
||||||||||||
|
After fees waived/recouped
|
||||||||||||||||||||||||
|
and expenses absorbed
|
0.13
|
%
|
(0.12
|
%)
|
(0.15
|
%)
|
0.34
|
%
|
0.40
|
%
|
0.00
|
%3
|
||||||||||||
|
1
|
Calculated using the average shares outstanding method.
|
|
2
|
Does not round to $0.01 or $(0.01), as applicable.
|
|
3
|
Does not round to 0.01% or (0.01)%, as applicable.
|
The accompanying notes are an integral part of these financial statements.
33
Trillium Mutual Funds
|
NOTES TO FINANCIAL STATEMENTS December 31, 2022
(Unaudited)
|
|
NOTE 1 – ORGANIZATION
|
The Trillium ESG Global Equity Fund (the “Fund” or “Global Equity Fund”) and Trillium ESG Small/Mid Cap Fund (the “Fund” or “SMID Fund”) are diversified series of shares of beneficial
interest of Professionally Managed Portfolios (the “Trust”), which is registered under the Investment Company Act of 1940, as amended (the “1940 Act”) as an open-end investment management company. The Funds are investment companies and accordingly
follow the investment company accounting and reporting guidance of the Financial Accounting Standards Board (FASB) Accounting Standard Codification Topic 946 “Financial Services—Investment Companies.” The Funds commenced operations on September 30,
1999 and August 31, 2015, respectively.
The Global Equity Fund and the SMID Fund have Retail Class and Institutional Class shares (Retail Class shares are not currently offered for SMID Fund). Institutional Class are offered
primarily for direct investment by investors such as pension and profit-sharing plans, employee benefit trusts, endowments, foundation, and corporations. Each class of shares has equal rights as to earnings and assets except that the Retail Class
bears Distribution fees. Global Equity Fund Retail Class also bears Sub-Transfer Agent fees. Each class of shares has exclusive voting rights with respect to matters that affect just that class. Income, expenses (other than expenses attributable to a
specific class), and realized and unrealized gains or losses on investments are allocated to each class of shares based on its relative net assets.
The Global Equity Fund seeks long-term capital appreciation by investing primarily in common stocks of companies that it believes are leaders in managing environmental risks and
opportunities, have above average growth potential, and are reasonably valued. The investment objective of SMID Fund is to seek long-term capital appreciation by identifying companies that it believes are strategic leaders, based on business models
that it believes are superior and have the ability to create consistent earnings growth.
|
NOTE 2 – SIGNIFICANT ACCOUNTING POLICIES
|
The following is a summary of significant accounting policies consistently followed by the Funds. These policies are in conformity with accounting principles generally accepted in the
United States of America (“U.S. GAAP”).
|
A.
|
Security Valuation. All equity securities, which may include Real Estate Investment Trusts (“REITs”), Business Development Companies (“BDCs”) and Master
Limited Partnerships (“MLPs”), that are traded on U.S. national or foreign securities exchanges are valued either at the last
|
34
Trillium Mutual Funds
|
NOTES TO FINANCIAL STATEMENTS December 31, 2022
(Unaudited), Continued
|
|
reported sale price on the exchange on which the security is principally traded or the exchange’s official closing price, if applicable. If, on a particular day, an exchange-traded security does
not trade, then the mean between the most recent quoted bid and asked prices will be used. All equity securities which may include REITs, BDCs, and MLPs that are not traded on a listed exchange are valued at the last sale price in the over-
the-counter market. If a non-exchange traded security does not trade on a particular day, then the mean between the last quoted closing bid and asked price will be used.
|
||
|
For foreign securities traded on foreign exchanges the Trust has selected ICE Data Service’s Fair Value Information Services (“FVIS”) to provide pricing data with respect to foreign security
holdings held by the Global Equity Fund. The use of this third-party pricing service is designed to capture events occurring after a foreign exchange closes that may affect the value of certain holdings of the Global Equity Fund’s securities
traded on those foreign exchanges. The Global Equity Fund utilizes a confidence interval when determining the use of the FVIS provided prices. The confidence interval is a measure of the historical relationship that each foreign exchange
traded security has to movements in various indices and the price of the security’s corresponding American Depositary Receipt, if one exists. FVIS provides the confidence interval for each security for which it provides a price. If the FVIS
provided price falls within the confidence interval the Global Equity Fund will value the particular security at that price. If the FVIS provided price does not fall within the confidence interval the particular security will be valued at the
preceding closing price on its respective foreign exchange, or if there were no transactions on such day, at the mean between the bid and asked prices. The SMID Fund does not hold foreign securities traded on foreign exchanges.
|
||
|
Prior to the effectiveness of Rule 2a-5 on September 8, 2022, the Board of Trustees (the “Board”) had delegated day-to-day valuation issues to a Valuation Committee of the Trust which is
comprised of representatives from the Funds’ administrator, U.S. Bancorp Fund Services, LLC, doing business as U.S. Bank Global Fund Services (“Fund Services”).
|
||
|
The function of the Valuation Committee was to value securities where current and reliable market quotations are not readily available or the closing price does not represent fair value by
following procedures approved by the Board. These procedures considered many factors, including the type of security, size of holding, trading volume and news events. All actions taken by the Valuation Committee were subsequently
|
35
Trillium Mutual Funds
|
NOTES TO FINANCIAL STATEMENTS December 31, 2022
(Unaudited), Continued
|
|
reviewed and ratified by the Board. The Valuation Committee served until September 7, 2022. Effective September 8, 2022, the Board approved Becker Capital Management, Inc. (the “Advisor”), as
the Fund’s valuation designee under Rule 2a-5.
|
||
|
As described above, the Funds utilize various methods to measure the fair value of most of their investments on a recurring basis. U.S. GAAP establishes a hierarchy that prioritizes inputs to
valuation methods. The three levels of inputs are:
|
|
Level 1 –
|
Unadjusted quoted prices in active markets for identical assets or liabilities that the Funds have the ability to access.
|
|
|
Level 2 –
|
Observable inputs other than quoted prices included in Level 1 that are observable for the asset or liability, either directly or indirectly. These inputs may include quoted prices for the
identical instrument on an inactive market, prices for similar instruments, interest rates, prepayment speeds, credit risk, yield curves, default rates and similar data.
|
|
|
Level 3 –
|
Unobservable inputs for the asset or liability, to the extent relevant observable inputs are not available; representing the Funds’ own assumptions about the assumptions a market participant
would use in valuing the asset or liability and would be based on the best information available.
|
|
The availability of observable inputs can vary from security to security and is affected by a wide variety of factors, including, for example, the type of security whether the security is new
and not yet established in the marketplace, the liquidity of markets, and other characteristics particular to the security. To the extent that valuation is based on models or inputs that are less observable or unobservable in the market, the
determination of fair value requires more judgment. Accordingly, the degree of judgment exercised in determining fair value is greatest for instruments categorized in Level 3.
|
||
|
The inputs used to measure fair value may fall into different levels of the fair value hierarchy. In such cases, for disclosure purposes, the level in the fair value hierarchy within which the
fair value measurement falls in its entirety, is determined based on the lowest level input that is significant to the fair value measurement in its entirety.
|
36
Trillium Mutual Funds
|
NOTES TO FINANCIAL STATEMENTS December 31, 2022
(Unaudited), Continued
|
|
The following is a summary of the inputs used to value the Funds’ investments as of December 31, 2022:
|
||
|
Global Equity Fund
|
|
Level 1
|
Level 2
|
Level 3
|
Total
|
||||||||||||||
|
Common Stocks
|
|||||||||||||||||
|
Automobiles & Components
|
$
|
5,344,824
|
$
|
6,174,242
|
$
|
—
|
$
|
11,519,066
|
|||||||||
|
Banks
|
25,826,580
|
30,627,331
|
—
|
56,453,911
|
|||||||||||||
|
Capital Goods
|
27,745,658
|
34,447,548
|
—
|
62,193,206
|
|||||||||||||
|
Commercial &
|
|||||||||||||||||
|
Professional Services
|
8,179,096
|
9,136,948
|
—
|
17,316,044
|
|||||||||||||
|
Consumer Durables & Apparel
|
12,047,682
|
10,210,033
|
—
|
22,257,715
|
|||||||||||||
|
Consumer Services
|
15,385,035
|
—
|
—
|
15,385,035
|
|||||||||||||
|
Diversified Financials
|
28,661,636
|
—
|
—
|
28,661,636
|
|||||||||||||
|
Food & Staples Retailing
|
—
|
10,689,186
|
—
|
10,689,186
|
|||||||||||||
|
Food, Beverage & Tobacco
|
12,363,768
|
17,782,450
|
—
|
30,146,218
|
|||||||||||||
|
Health Care Equipment
|
|||||||||||||||||
|
& Services
|
15,623,184
|
20,876,048
|
—
|
36,499,232
|
|||||||||||||
|
Household & Personal Products
|
—
|
27,353,995
|
—
|
27,353,995
|
|||||||||||||
|
Insurance
|
8,523,670
|
19,527,013
|
—
|
28,050,683
|
|||||||||||||
|
Materials
|
13,902,909
|
26,414,716
|
—
|
40,317,625
|
|||||||||||||
|
Media & Entertainment
|
25,615,588
|
—
|
—
|
25,615,588
|
|||||||||||||
|
Pharmaceuticals, Biotechnology
|
|||||||||||||||||
|
& Life Sciences
|
34,963,353
|
37,234,307
|
—
|
72,197,660
|
|||||||||||||
|
Real Estate
|
12,053,594
|
11,561,636
|
—
|
23,615,230
|
|||||||||||||
|
Retailing
|
27,887,066
|
10,778,309
|
—
|
38,665,375
|
|||||||||||||
|
Semiconductors &
|
|||||||||||||||||
|
Semiconductor Equipment
|
31,867,893
|
7,592,909
|
—
|
39,460,802
|
|||||||||||||
|
Software & Services
|
59,414,395
|
15,319,369
|
—
|
74,733,764
|
|||||||||||||
|
Technology Hardware
|
|||||||||||||||||
|
& Equipment
|
45,313,564
|
6,110,157
|
—
|
51,423,721
|
|||||||||||||
|
Telecommunication Services
|
11,477,360
|
—
|
—
|
11,477,360
|
|||||||||||||
|
Transportation
|
17,238,645
|
4,324,644
|
—
|
21,563,289
|
|||||||||||||
|
Utilities
|
7,124,873
|
14,332,161
|
—
|
21,457,034
|
|||||||||||||
|
Total Common Stocks
|
446,560,373
|
320,493,002
|
—
|
767,053,375
|
|||||||||||||
|
Preferred Stocks
|
|||||||||||||||||
|
Banks
|
4,029,975
|
—
|
—
|
4,029,975
|
|||||||||||||
|
Total Preferred Stocks
|
4,029,975
|
—
|
—
|
4,029,975
|
|||||||||||||
|
Short-Term Investments
|
7,640,734
|
—
|
—
|
7,640,734
|
|||||||||||||
|
Total Investments in Securities
|
$
|
458,231,082
|
$
|
320,493,002
|
$
|
—
|
$
|
778,724,084
|
|||||||||
37
Trillium Mutual Funds
|
NOTES TO FINANCIAL STATEMENTS December 31, 2022
(Unaudited), Continued
|
|
Small/Mid Cap Fund
|
|
Level 1
|
Level 2
|
Level 3
|
Total
|
||||||||||||||
|
Common Stocks
|
$
|
38,072,563
|
$
|
—
|
$
|
—
|
$
|
38,072,563
|
|||||||||
|
Short-Term Investments
|
835,434
|
—
|
—
|
835,434
|
|||||||||||||
|
Total Investments in Securities
|
$
|
38,907,997
|
$
|
—
|
$
|
—
|
$
|
38,907,997
|
|||||||||
|
(a) See Schedule of Investments for industry breakout.
|
|||||||||||||||||
|
B.
|
Foreign Currency. Investment securities and other assets and liabilities denominated in foreign currencies are translated into U.S. dollar amounts at the
date of valuation. Purchases and sales of investment securities and income and expense items denominated in foreign currencies are translated into U.S. dollar amounts on the respective dates of such transactions.
|
|
|
The Funds do not isolate that portion of the results of operations resulting from changes in foreign exchange rates on investments from the fluctuations arising from changes in market prices of
securities held. Such fluctuations are included with the net realized and unrealized gain or loss from investments.
|
||
|
The Funds report net realized foreign exchange gains or losses that arise from sales of foreign currencies, currency gains or losses realized between the trade and settlement dates on securities
transactions, and the difference between the amounts of dividends, interest, and foreign withholding taxes recorded on the Funds’ books and the U.S. dollar equivalent of the amounts actually received or paid. Net unrealized foreign exchange
gains and losses arise from changes in the fair values of assets and liabilities, other than investments in securities at period end, resulting from changes in exchange rates.
|
||
|
C.
|
Federal Income Taxes. Each Fund has elected to be taxed as a “regulated investment company” and intends to distribute substantially all taxable income to
its shareholders and otherwise comply with the provisions of the Internal Revenue Code applicable to regulated investment companies. Therefore, no provision for federal income taxes or excise taxes has been made.
|
|
|
In order to avoid imposition of the excise tax applicable to regulated investment companies, the Funds intend to declare each year as dividends in each calendar year at least 98.0% of their net
investment income (earned during the calendar year) and 98.2% of their net realized capital gains (earned during the twelve months ended October 31) plus undistributed amounts, if any, from prior years.
|
38
Trillium Mutual Funds
|
NOTES TO FINANCIAL STATEMENTS December 31, 2022
(Unaudited), Continued
|
|
Net capital losses incurred after October 31, and within the taxable year, are deemed to arise on the first business day of each Fund’s next taxable year. Net investment losses incurred after
December 31, and within the taxable year, are deemed to arise on the first business day of each Fund’s next taxable year. As of fiscal year end June 30, 2022, there were no post-October losses for the Global Equity Fund. The SMID Fund had a
post-October loss of $88,867.
|
||
|
As of the most recent fiscal year end June 30, 2022, there were no late year losses or capital loss carryovers for the Funds.
|
||
|
As of December 31, 2022, the Funds did not have any tax positions that did not meet the “more-likely-than-not” threshold of being sustained by the applicable tax authority. Generally, tax
authorities can examine all the tax returns filed for the last three years. The Funds identify their major tax jurisdictions as U.S. Federal and the Commonwealth of Massachusetts. As of December 31, 2022, the Funds are not aware of any tax
positions for which it is reasonably possible that the total amounts of unrecognized tax benefits will change materially.
|
||
|
D.
|
Security Transactions and Investment Income. Investment securities transactions are accounted for on the trade date. Gains and losses realized on sales
of securities are determined on a specific identification basis. Discounts/premiums on debt securities purchased are accreted/amortized over the life of the respective securities using the effective interest method. Dividend income is
recorded on the ex-dividend date. Dividends received from REITs generally are comprised of ordinary income, capital gains, and may include return of capital. Interest income is recorded on an accrual basis. Withholding taxes on foreign
dividends have been provided for in accordance with the Trust’s understanding of the applicable country’s tax rules and rates. Withholding tax reclaims are filed in certain countries to recover a portion of the amounts previously withheld.
The Funds record a reclaim receivable based on, among other things, a jurisdiction’s legal obligation to pay reclaims as well as payment history and market convention.
|
|
|
E.
|
Distributions to Shareholders. Distributions to shareholders from net investment income and net realized gains on securities, which are determined in
accordance with income tax regulations, normally are declared and paid on an annual basis. Distributions are recorded on the ex- dividend date.
|
39
Trillium Mutual Funds
|
NOTES TO FINANCIAL STATEMENTS December 31, 2022
(Unaudited), Continued
|
|
F.
|
Use of Estimates. The preparation of financial statements in conformity with U.S. GAAP requires management to make estimates and assumptions that affect
the reported amounts of assets and liabilities at the date of the financial statements and the reported amount of revenue and expenses during the reporting period. Actual results could differ from those estimates.
|
|
|
G.
|
Share Valuation. The net asset value (“NAV”) per share of the Funds are calculated by dividing the sum of the value of the securities held by each Fund,
plus cash and other assets, minus all liabilities including estimated accrued expenses by the total number of shares outstanding for the Funds, rounded to the nearest cent. The Funds’ shares will not be priced on the days on which the New
York Stock Exchange is closed for trading. The offering and redemption price per share for the Funds are equal to each Fund’s net asset value per share. The SMID Fund charges a 2% redemption fee on shares held less than 90 days. The fee is
deducted from the redemption proceeds otherwise payable to the shareholder. The SMID Fund will retain the fee charged as paid-in-capital and such fees become part of the SMID Fund’s daily NAV calculation.
|
|
|
H.
|
Guarantees and Indemnifications. In the normal course of business, the Funds enter into contracts with service providers that contain general
indemnification clauses. The Funds’ maximum exposure under these arrangements is unknown as this would involve future claims that may be made against the Funds that have not yet occurred. However, based on experience, the Funds expect the
risk of loss to be remote.
|
|
|
I.
|
Illiquid Securities. Pursuant to Rule 22e-4 under the 1940 Act, the Fund has adopted a Board approved Liquidity Risk management Program (“LRMP”) that
requires, among other things, that the Funds limit its illiquid investments that are assets to no more than 15% of net assets. An illiquid investment is any security which may not reasonably be expected to be sold or disposed of in current
market conditions in seven calendar days or less without the sale or disposition significantly changing the market value of the investment.
|
|
|
J.
|
Recently Issued Accounting Pronouncement. In June 2022, the FASB issued Accounting Standards Update 2022-03, which amends Fair Value Measurement (Topic
820): Fair Value Measurement of Equity Securities Subject to Contractual Sale Restrictions (“ASU 2022-03”). ASU 2022-03 clarifies guidance for fair value measurement of an equity security subject to a contractual sale restriction and
establishes new disclosure
|
40
Trillium Mutual Funds
|
NOTES TO FINANCIAL STATEMENTS December 31, 2022
(Unaudited), Continued
|
|
requirements for such equity securities. ASU 2022-03 is effective for fiscal years beginning after December 15, 2023 and for interim periods within those fiscal years, with early adoption
permitted. Management is currently evaluating the impact of these amendments.
|
||
|
K.
|
Subsequent Events. In preparing these financial statements, the Fund have evaluated events and transactions for potential recognition or disclosure
through the date the financial statements were issued. The Funds have determined that there were no subsequent events that would need to be disclosed in the Funds’ financial statements.
|
|
NOTE 3 – COMMITMENTS AND OTHER RELATED PARTY TRANSACTIONS
|
The Adviser provides the Funds with investment management services under an Investment Advisory Agreement (the “Advisory Agreement”). Under the Advisory Agreement, the Adviser provides
all investment advice, office space, certain administrative services, and provides most of the personnel needed by each Fund. As compensation for its services, the Adviser is entitled to a monthly fee at the annual rate of 0.85% on daily net assets
up to $1 billion and 0.75% on daily net assets greater than $1 billion for the Global Equity Fund. The Adviser is entitled to a monthly fee at the annual rate of 0.75% based upon the average daily net assets of the SMID Fund, net of any monthly
waiver or reimbursement discussed below. The investment advisory fees incurred by the Funds for the six months ended December 31, 2022, are disclosed in the Statements of Operations. The investment advisory fees incurred are paid monthly to the
Adviser, net of any monthly waiver or reimbursement discussed below.
The Adviser has contractually agreed to limit expenses for the SMID Fund by reducing all or a portion of its fees and reimbursing Fund expenses so that the Fund’s ratio of expenses to
average net assets will not exceed 0.98% for the Institutional Class. The Operating Expenses Limitation Agreement has an indefinite term and may be terminated at any time, and without payment of any penalty, by the Board on behalf of the SMID Fund,
upon sixty (60) days’ written notice to the Adviser. Any fees waived and/or Fund expenses absorbed by the Adviser pursuant to an agreed-upon expense cap shall be reimbursed by the Fund to the Adviser, if so requested by the Adviser, any time before
the end of the third year following the fee waiver and/or expense absorption, provided the aggregate amount of the Fund’s current operating expenses for such year does not exceed the lesser expense cap in place at the time of waiver or at the time of
reimbursement. SMID Fund must pay its current ordinary operating expenses before the Adviser is entitled to any reimbursement of fees and/or expenses. Any such reimbursement is also contingent upon the Board’s review and approval. The amount of fees
waived and expenses absorbed by the Adviser
41
Trillium Mutual Funds
|
NOTES TO FINANCIAL STATEMENTS December 31, 2022
(Unaudited), Continued
|
during the six months ended December 31, 2022, is disclosed in the Statements of Operations. Any amount due from the Adviser is paid monthly to the Fund, if applicable.
As of December 31, 2022, the remaining cumulative amount the Adviser may be reimbursed is $480,059, as shown in the following table. The Adviser may recapture a portion of the above no
later than the dates as stated.
|
Date of Expiration
|
Amount
|
|||
|
June 30, 2023
|
$
|
99,857
|
||
|
June 30, 2024
|
165,893
|
|||
|
June 30, 2025
|
134,419
|
|||
|
June 30, 2026
|
79,890
|
|||
|
Total
|
$
|
480,059
|
||
U.S. Bancorp Fund Services, LLC, doing business as U.S. Bank Global Fund Services (“Fund Services”), acts as the Funds’ administrator, fund accountant, and transfer agent. In those
capacities Fund Services maintains the Funds’ books and records, calculates the Funds’ NAV, prepares various federal and state regulatory filings, coordinates the payment of fund expenses, reviews expense accruals and prepares materials supplied to
the Board. The officers of the Trust and the Chief Compliance Officer are also employees of Fund Services. Fees paid by the Funds to Fund Services for these services for the six months ended December 31, 2022, are disclosed in the Statements of
Operations.
Quasar Distributors, LLC (the “Distributor”) acts as the Funds’ principal underwriter in a continuous public offering of each Fund’s shares. U.S. Bank N.A. serves as custodian to the
Funds. U.S. Bank N.A. is an affiliate of Fund Services.
The Funds have adopted a Distribution Plan (the “Plan”) in accordance with Rule 12b-1 under the 1940 Act with respect to Retail shares. The Plan provides that each Fund may pay a fee
to the Distributor, at an annual rate of up to 0.25% of the average daily net assets of Retail Class shares. No distribution fees are paid by Institutional Class shares. These fees may be used by the Distributor to provide compensation for sales
support, distribution activities, or shareholder servicing activities. Distribution fees incurred by the Funds during the six months ended December 31, 2022, are disclosed in the Statements of Operations.
The Funds have entered into Sub-Transfer Agent Arrangements (the “Arrangements”) with respect to the Retail Class. All Arrangements must be approved by the Board. The transfer agent
fees and sub-transfer agent fees incurred by the Funds for the six months ended December 31, 2022, are disclosed in the Statements of Operations.
42
Trillium Mutual Funds
|
NOTES TO FINANCIAL STATEMENTS December 31, 2022
(Unaudited), Continued
|
|
NOTE 4 – SECURITIES LENDING
|
The Global Equity Fund may lend up to 33 1/3% of the securities in its portfolio to brokers, dealers and financial institutions (but not individuals) under terms of participation in a
securities lending program administered by U.S. Bank N.A. The securities lending agreement requires that loans are collateralized at all times in an amount equal to at least 100% of the market value of any loaned securities at the time of the loan,
plus accrued interest.
The Global Equity Fund receives compensation in the form of fees and earn interest on the cash collateral. The amount of fees depends on a number of factors, including the type of
security and length of the loan. The Funds continue to receive interest payments or dividends on the securities loaned during the borrowing period. The Global Equity Fund has the right under the terms of the securities lending agreement to recall the
securities from the borrower on demand.
As of December 31, 2022, the Global Equity Fund has loaned securities that were collateralized by cash equivalents. The cash collateral is invested by U.S. Bank N.A. in accordance with
approved investment guidelines. Those guidelines require the cash collateral to be invested in readily marketable, high quality, short-term obligations; however, such investments are subject to risk of payment delays or default on the part of the
issuer or counterparty or otherwise may not generate sufficient interest to support the costs associated with securities lending. The Global Equity Fund could also experience delays in recovering its securities and possible loss of income or value if
the borrower fails to return the borrowed securities, although the Fund is indemnified from this risk by contract with the securities lending agent.
As of December 31, 2022, the market value of the securities on loan and payable collateral received for securities lending were as follows:
|
Market Value of
|
Payable on
|
||
|
Securities on Loan
|
Collateral Received
|
||
|
Global Equity Fund
|
$ —
|
$ —
|
The Global Equity Fund receives cash as collateral in return for securities lent as part of the securities lending program. The collateral is invested in the First American Government
Obligations Fund (a money market fund subject to Rule 2a-7 under the 1940 Act). The Schedule of Investments for the Global Equity Fund includes the particular cash collateral holding as of December 31, 2022. The remaining contractual maturity of all
securities lending transactions is overnight and continuous.
43
Trillium Mutual Funds
|
NOTES TO FINANCIAL STATEMENTS December 31, 2022
(Unaudited), Continued
|
The net fee and interest income earned by the Global Equity Fund on investments of cash collateral received from borrowers for the securities loaned are reflected in the Statement of
Operations.
Due to the absence of a master netting agreement related to the Global Equity Fund’s participation in securities lending, no additional offsetting disclosures have been made on behalf
of the Global Equity Fund for the total borrowings listed above.
|
NOTE 5 – PURCHASES AND SALES OF SECURITIES
|
For the six months ended December 31, 2022, the cost of purchases and the proceeds from the sale and maturity of securities, excluding short-term investments, were as follows:
|
Purchases
|
Sales
|
||||||||
|
Global Equity Fund
|
$
|
39,455,583
|
$
|
97,636,368
|
|||||
|
SMID Fund
|
8,649,422
|
4,662,675
|
|||||||
There were no purchases, sales or maturities of long-term U.S. Government securities during the six months ended December 31, 2022.
|
NOTE 6 – DISTRIBUTIONS TO SHAREHOLDERS
|
The tax character of distributions paid during the year ended June 30, 2022 and the six months ended December 31, 2022, was as follows:
|
Ordinary Income
|
|||||||||
|
December 31, 2022
|
June 30, 2022
|
||||||||
|
Global Equity Fund
|
$
|
5,085,048
|
$
|
2,603,679
|
|||||
|
SMID Fund
|
20,699
|
41,346
|
|||||||
|
Short-Term Capital Gains
|
|||||||||
|
December 31, 2022
|
June 30, 2022
|
||||||||
|
Global Equity Fund
|
$
|
44,502
|
$
|
—
|
|||||
|
SMID Fund
|
—
|
—
|
|||||||
|
Long-Term Capital Gains
|
|||||||||
|
December 31, 2022
|
June 30, 2022
|
||||||||
|
Global Equity Fund
|
$
|
34,376,433
|
$
|
26,643,563
|
|||||
|
SMID Fund
|
1,046,181
|
817,098
|
|||||||
44
Trillium Mutual Funds
|
NOTES TO FINANCIAL STATEMENTS December 31, 2022
(Unaudited), Continued
|
As of the most recent fiscal year ended June 30, 2022, the components of distributable (accumulated) earnings (losses) for income tax purposes were as follows:
|
Global Equity Fund
|
|||||
|
Tax cost of Investments
|
$
|
627,845,675
|
|||
|
Unrealized appreciation
|
274,337,573
|
||||
|
Unrealized depreciation
|
(59,375,716
|
)
|
|||
|
Net unrealized appreciation (depreciation)
|
214,961,857
|
||||
|
Undistributed ordinary income
|
4,160,950
|
||||
|
Undistributed long-term capital gain
|
20,675,805
|
||||
|
Distributable earnings
|
24,836,755
|
||||
|
Other accumulated gain (loss)
|
—
|
||||
|
Total distributable (accumulated) earnings (loss)
|
$
|
239,798,612
|
|||
|
SMID Fund
|
|||||
|
Tax cost of Investments
|
$
|
35,735,786
|
|||
|
Unrealized appreciation
|
3,727,068
|
||||
|
Unrealized depreciation
|
(6,257,323
|
)
|
|||
|
Net unrealized appreciation (depreciation)
|
(2,530,255
|
)
|
|||
|
Undistributed ordinary income
|
—
|
||||
|
Undistributed long-term capital gain
|
1,046,166
|
||||
|
Distributable earnings
|
1,046,166
|
||||
|
Other accumulated gain (loss)
|
(88,867
|
)
|
|||
|
Total distributable (accumulated) earnings (loss)
|
$
|
(1,572,956
|
)
|
||
The difference between components of distributable earnings on a tax basis and the amounts reflected in the Statements of Assets and Liabilities is primarily due to the tax deferral of
losses on wash sales adjustments and deferral of post-October losses.
45
Trillium Mutual Funds
|
NOTES TO FINANCIAL STATEMENTS December 31, 2022
(Unaudited), Continued
|
|
NOTE 7 – CREDIT FACILITY
|
U.S. Bank N.A. has made available to the Funds credit facilities pursuant to separate Loan and Security Agreements for temporary or extraordinary purposes. Credit facility details for
the six months ended December 31, 2022, are as follows:
|
Global Equity Fund
|
SMID Fund
|
||||||||
|
Maximum available credit
|
$
|
20,000,000
|
$
|
2,000,000
|
|||||
|
Largest amount outstanding
|
|||||||||
|
on an individual day
|
20,000,000
|
—
|
|||||||
|
Average balance when in use
|
4,993,167
|
—
|
|||||||
|
Credit facility outstanding
|
|||||||||
|
as of December 31, 2022
|
—
|
—
|
|||||||
|
Average interest rate when in use
|
7.06%
|
|
—
|
||||||
Interest expense for the six months ended December 31, 2022, is disclosed in the Statements of Operations.
|
NOTE 8 – (COVID-19) PANDEMIC
|
The global outbreak of COVID-19 (commonly referred to as “coronavirus”) has disrupted economic markets and the prolonged economic impact is uncertain. Although vaccines for COVID-19
are becoming more widely available, the ultimate economic fallout from the pandemic, amid the spread of COVID-19 variants, and the long-term impact on economies, markets, industries and individual companies are not known. The operational and
financial performance of individual companies and the market in general depends on future developments, including the duration and spread of any future outbreaks and the pace of recovery which may vary from market to market, and such uncertainty may
in turn adversely affect the value and liquidity of the Fund’s investments, impair the Fund’s ability to satisfy redemption requests, and negatively impact the Fund’s performance.
46
Trillium Mutual Funds
|
EXPENSE EXAMPLES For the six months ended December 31,
2022 (Unaudited)
|
As a shareholder of the Funds, you incur two types of costs: (1) transaction costs and (2) ongoing costs, including investment advisory fees, distribution fees (12b-1), and other Fund
expenses. These examples are intended to help you understand your ongoing costs (in dollars) of investing in the Funds and to compare these costs with the ongoing costs of investing in other mutual funds. These examples are based on an investment of
$1,000 invested at the beginning of the period and held for the entire period (July 1, 2022 – December 31, 2022).
Actual Expenses
The “Actual” line for each respective class of the following tables provides information about actual account values based on actual returns and actual expenses. Although the Funds
charge no sales load, you will be assessed fees for outgoing wire transfers, returned checks and stop payment orders at prevailing rates charged by Fund Services, the Funds’ transfer agent. If you request that a redemption be made by wire transfer,
the Funds’ transfer agent currently charges a $15.00 fee. The SMID Fund charges a redemption fee equal to 2.00% of the net amount of the redemption if you redeem shares within 90 calendar days after you purchase them. An Individual Retirement Account
will be charged an annual maintenance fee. To the extent the Funds invest in shares of other investment companies as part of their strategies, you will indirectly bear your proportionate share of any fees and expenses charged by the underlying funds
in which the Funds invest in addition to the expenses of the Funds. Actual expenses of the underlying funds may vary. These expenses are not included in the following examples.
The following examples include, but are not limited to, investment advisory fees, shareholder servicing fees, distribution fees, fund accounting fees, fund administration fees, custody
fees, and transfer agent fees. However, the following examples do not include portfolio trading commissions and related expenses. You may use the information in this line, together with the amount you invested, to estimate the expenses that you paid
over the period. Simply divide your account value by $1,000 (for example, an $8,600 account value divided by $1,000 = 8.6), then multiply the result by the number in the first line under the heading titled “Expenses Paid During the Period” to
estimate the expenses you paid on your account during this period.
Hypothetical Example for Comparison Purposes
The “Hypothetical” line for each respective class of the following tables provides information about hypothetical account values and hypothetical expenses based on the Funds’ actual
expense ratios and an assumed rate of return of 5% per year before expenses, which is not the Funds’ actual return. The hypothetical account values and expenses may not be used to estimate the
47
Trillium Mutual Funds
|
EXPENSE EXAMPLES For the six months ended December 31,
2022 (Unaudited), Continued
|
actual ending account balance or expenses you paid for the period. You may use this information to compare the ongoing costs of investing in the Funds and other funds. To do so, compare this 5%
hypothetical example with the 5% hypothetical examples that appear in the shareholder reports of the other funds. Please note that the expenses shown in the tables are meant to highlight your ongoing costs only and do not reflect any transactional
costs, such as redemption fees. Therefore, each hypothetical line of the tables is useful in comparing ongoing costs only and will not help you determine the relative total costs of owning different funds. In addition, if these transactional costs
were included, your costs would have been higher.
|
Global Equity Fund
|
|||
|
Beginning
|
Ending
|
Expenses Paid
|
|
|
Account Value
|
Account Value
|
During the Period
|
|
|
7/1/22
|
12/31/22
|
7/1/2022 – 12/31/20221
|
|
|
Retail Class Actual
|
$1,000.00
|
$1,016.40
|
$6.66
|
|
Hypothetical (5% annual
|
|||
|
return before taxes)
|
$1,000.00
|
$1,018.60
|
$6.67
|
|
Beginning
|
Ending
|
Expenses Paid
|
|
|
Account Value
|
Account Value
|
During the Period
|
|
|
7/1/22
|
12/31/22
|
7/1/2022 – 12/31/20221
|
|
|
Institutional Class Actual
|
$1,000.00
|
$1,018.00
|
$5.24
|
|
Hypothetical (5% annual
|
|||
|
return before taxes)
|
$1,000.00
|
$1,020.01
|
$5.24
|
|
SMID Fund
|
|||
|
Beginning
|
Ending
|
Expenses Paid
|
|
|
Account Value
|
Account Value
|
During the Period
|
|
|
7/1/22
|
12/31/22
|
7/1/2022 – 12/31/20222
|
|
|
Institutional Class Actual
|
$1,000.00
|
$1,048.10
|
$5.06
|
|
Hypothetical (5% annual
|
|||
|
return before taxes)
|
$1,000.00
|
$1,020.27
|
$4.99
|
|
1
|
Expenses are equal to the annualized net expense ratio for the most recent six-month period. The annualized six-month expense ratios for Retail and Institutional Class shares were 1.31% and
1.03%, respectively, multiplied by the average account value over the period multiplied by 184/365 (to reflect the one half-year period).
|
|
2
|
Expenses are equal to the annualized net expense ratio for the most recent six-month period. The annualized six-month expense ratios for Institutional Class shares was 0.98% (reflecting fee
waivers in effect), multiplied by the average account value over the period multiplied by 184/365 (to reflect the one half-year period).
|
48
Trillium Mutual Funds
|
APPROVAL OF INVESTMENT ADVISORY AGREEMENT (Unaudited)
|
At a meeting held on August 17-18, 2022, the Board (which is comprised of five persons, all of whom are Independent Trustees as defined under the Investment Company Act of 1940)
considered and approved the continuance of the Investment Advisory Agreement (the “Advisory Agreement”) between Professionally Managed Portfolios (the “Trust”) and Trillium Asset Management, LLC (the “Adviser”) for each of the Trillium ESG Global
Equity Fund and the Trillium ESG Small/Mid Cap Fund (each a “Fund” and together, the “Funds”). At this meeting and at a prior meeting held on June 16, 2022, the Board received and reviewed substantial information regarding the Funds, the Adviser and
the services provided by the Adviser to the Funds under the Advisory Agreement. This information, together with the information provided to the Board throughout the course of the year, formed the primary (but not exclusive) basis for the Board’s
determinations. The Board noted that Trillium has informed the Trust and Board that it was considering a potential transaction that could involve a recommendation for the reorganization of the Funds outside of the Trust’s umbrella. . In that
regard, the Board noted that any such potential recommendation was not yet certain. Below is a summary of the factors considered by the Board and the conclusions that formed the basis for the Board’s approval of the continuance of the Advisory
Agreement:
|
1.
|
The nature, extent and quality of the services provided and to be provided by the Adviser under the Advisory Agreement. The Trustees considered the
nature, extent and quality of the Adviser’s overall services provided to the Funds as well as its specific responsibilities in all aspects of day-to-day investment management of the Funds. The Board considered the qualifications, experience
and responsibilities of the portfolio managers, as well as the responsibilities of other key personnel of the Adviser involved in the day-to-day activities of the Funds. The Board also considered the resources and compliance structure of the
Adviser, including information regarding its compliance program, its chief compliance officer and the Adviser’s compliance record, as well as the Adviser’s cybersecurity program, business continuity plan, and risk management process. The
Board also considered the prior relationship between the Adviser and the Trust, as well as the Board’s knowledge of the Adviser’s operations, and noted that during the course of the prior year they had met with certain personnel of the
Adviser to discuss fund performance and investment outlook, as well as, various marketing and compliance topics. The Board concluded that the Adviser had the quality and depth of personnel, resources, investment processes and compliance
policies and procedures essential to performing its duties under the Advisory Agreement and that they were satisfied with the nature, overall quality and extent of such management services.
|
49
Trillium Mutual Funds
|
APPROVAL OF INVESTMENT ADVISORY AGREEMENT (Unaudited)
(Continued)
|
|
2.
|
The Funds’ historical performance and the overall performance of the Adviser. In assessing the quality of the portfolio management delivered by the
Adviser, the Board reviewed the short-term and long-term performance of each Fund on both an absolute basis, and in comparison to its peer funds utilizing Morningstar classifications and appropriate securities market benchmarks and the
Adviser’s similarly managed accounts, all for periods ended March 31, 2022. The Board also considered performance against a smaller group of peers selected by an independent third-party consultant engaged by the Board to assist it in its
15(c) review (the “Cohort”). While the Board considered both short-term and long-term performance, it placed greater emphasis on longer term performance. When reviewing each Fund’s performance against its comparative peer group universe,
the Board took into account that the investment objective and strategy of each Fund, as well as its level of risk tolerance, may differ significantly from funds in its respective peer universe. When reviewing each Fund’s performance against
broad market benchmarks, the Board took into account the differences in portfolio construction between the Funds and such benchmarks, as well as other differences between actively managed funds and passive benchmarks, such as objectives and
risks. In assessing periods of relative underperformance or outperformance, the Board took into account that relative performance can be significantly impacted by performance measurement periods and that some periods of underperformance may
be transitory in nature while others may reflect more significant underlying issues. The Board also recognized that each Fund’s investments are subject to the Advisor’s ESG investment criteria as set forth in its prospectus, and that
shareholders investing in the Fund accept and desire a fund employing such criteria, even if it may impact performance to a greater extent than other funds.
|
|
|
For the Trillium ESG Global Equity Fund, the Board noted that the Fund outperformed its peer group median for the one-year, three-year, and five-year periods. The Board also noted that the Fund
outperformed the average of its Cohort for the one-year, three-year and five-year periods. The Board also considered that the Fund underperformed its broad-based securities market benchmark for the one-year period and outperformed for the
three- and five-year periods. The Board noted that the Adviser represented it does not have other accounts managed similarly to the Trillium ESG Global Equity Fund.
|
||
|
For the Trillium ESG Small/Mid Cap Fund, the Board noted that the Fund underperformed its peer group median for the one- and three-year periods and outperformed for the five-year period. The
Board also noted
|
50
Trillium Mutual Funds
|
APPROVAL OF INVESTMENT ADVISORY AGREEMENT (Unaudited)
(Continued)
|
|
that the Fund underperformed the average of its Cohort for the one-and three-year periods and outperformed for the five-year period. The Board also considered that the Fund underperformed its
broad-based securities market benchmark for the one-year, three-year, and five-year periods. The Board also considered the Fund’s underperformance compared to the Adviser’s similarly managed composite for the one-year, three-year, and
five-year periods, noting that such differences were not significant.
|
||
|
3.
|
The costs of the services provided by the Adviser and the structure of the Adviser’s fees under the Advisory Agreement. In considering the advisory fee
and total fees and expenses of the Funds, the Board reviewed comparisons to the peer funds and similarly managed separate accounts for other types of clients advised by the Adviser, as well as all expense waivers and reimbursements. When
reviewing fees charged to other similarly managed accounts, the Board took into consideration the type of account and the differences in the management of that account that might be germane to the difference, if any, in the fees charged to
such accounts.
|
|
|
For the Trillium ESG Global Equity Fund, the Board noted that the Fund’s advisory fee was higher than its peer group median and average and that the net expense ratio (less Rule 12b-1 fees) was
higher than its peer group median and average. The Board noted that the Fund’s net expense ratio (less Rule 12b-1 fees) was higher than the average of its Cohort. The Board considered that the Advisor recently implemented breakpoints to the
advisory fee in order to share economies of scale with the Fund. The Board concluded that the fees paid to the Adviser were fair and reasonable in light of the comparative performance and advisory fee information.
|
||
|
For the Trillium ESG Small/Mid Cap Fund, the Board noted that the Adviser had contractually agreed to maintain an annual expense ratio of 0.98% for the Fund, excluding certain operating expenses
and class-level expenses (“Expense Cap”). The Board noted that the Fund’s advisory fee and net expense ratio (less Rule 12b-1 fees) were higher than its peer group median and average. The Board noted that the Fund’s net expense ratio (less
Rule 12b-1 fees) was higher than the average of its Cohort. The Board concluded that the fees paid to the Adviser were fair and reasonable in light of the comparative performance and advisory fee information.
|
||
|
The Trustees also took into consideration the services the Adviser provided to its similarly managed separate account clients, comparing the fees charged for those management services to the
fees charged to the Trillium ESG Small/Mid Cap Fund. The Trustees noted that the Adviser
|
51
Trillium Mutual Funds
|
APPROVAL OF INVESTMENT ADVISORY AGREEMENT (Unaudited)
(Continued)
|
|
does not replicate the Trillium ESG Global Equity Fund’s investment style in separately managed accounts. The Trustees noted that the fees charged to the Trillium ESG Small/Mid Cap Fund as
compared to the fees charged by the Adviser to its similarly managed separate account clients differed due to a number of factors.
|
||
|
4.
|
Economies of Scale. The Board also considered whether economies of scale were being realized by the Adviser that should be shared with shareholders.
The Board noted that the Advisory Agreement for the Trillium ESG Global Equity Fund contains breakpoints in the advisory fee. The Board also noted that the Adviser has contractually agreed to reduce its advisory fees or reimburse expenses so
that the Trillium ESG Small/Mid Cap Fund does not exceed its specified Expense Cap. The Board noted that at current asset levels, it did not appear that there were additional significant economies of scale being realized by the Adviser that
should be shared with shareholders and concluded that it would continue to monitor economies of scale in the future as circumstances changed and assuming asset levels increase.
|
|
|
5.
|
The profits to be realized by the Adviser and its affiliates from their relationship with the Funds. The Board reviewed the Adviser’s financial
information and took into account both the direct benefits and the indirect benefits to the Adviser from advising the Funds. The Board considered the profitability to the Adviser from its relationship with the Funds and considered any
additional benefits derived by the Adviser from its relationship with the Funds, particularly benefits received in exchange for “soft dollars” paid to the Adviser. After such review, the Board determined that the profitability to the Adviser
with respect to the Advisory Agreement was not excessive, and that the Adviser had maintained adequate financial resources to support the services it provides to the Funds.
|
No single factor was determinative of the Board’s decision to approve the Advisory Agreement, but rather, the Board based its determination on the total mix of information available to
them. Based on a consideration of all the factors in their totality, the Board determined that the advisory arrangements with the Adviser, including the advisory fees, were fair and reasonable. The Board therefore determined that the continuation
of the Advisory Agreement would be in the best interests of the Funds and their shareholders.
52
Trillium Mutual Funds
|
STATEMENT REGARDING LIQUIDITY RISK MANAGEMENT PROGRAM
(Unaudited)
|
Each Fund has adopted a liquidity risk management program (the “program”). The Funds’ Board has designated a committee of the Adviser to serve as the administrator of the program.
Personnel of Trillium conduct the day-to-day operation of the program pursuant to policies and procedures administered by the committee.
Under the program, the committee manages each Fund’s liquidity risk, which is the risk that the Fund could not meet shareholder redemption requests without significant dilution of
remaining shareholders’ interests in the Fund. This risk is managed by monitoring the degree of liquidity of each Fund’s investments, limiting the amount of each Fund’s illiquid investments, and utilizing various risk management tools and facilities
available to each Fund for meeting shareholder redemptions, among other means. The committee’s process of determining the degree of liquidity of each Fund’s investments is supported by one or more third-party liquidity assessment vendors.
The Funds’ Board reviewed a report prepared by the committee regarding the operation and effectiveness of the program for the period January 1, 2022 through December 31, 2022. No
significant liquidity events impacting any of the Funds were noted in the report. In addition, the committee provided its assessment that the program had been effective in managing each Fund’s liquidity risk.
53
Trillium Mutual Funds
|
NOTICE TO SHAREHOLDERS (Unaudited)
|
For the six months ended December 31, 2022, certain dividends paid by the Funds may be subject to a maximum tax rate of 15%, as provided for by the Jobs and Growth Tax Relief
Reconciliation Act of 2003 and the Tax Cuts and Jobs Act of 2017. The percentage of dividends declared from the net investment income designated as the qualified dividend income was as follows:
|
Global Equity Fund
|
100.00%
|
||
|
SMID Fund
|
100.00%
|
For corporate shareholders, the percentage of ordinary income distributions qualifying for the corporate dividends received deduction for the six months ended December 31, 2022, was as
follows:
|
Global Equity Fund
|
100.00%
|
||
|
SMID Fund
|
100.00%
|
The percentage of taxable ordinary income distributions that are designated as short-term capital gain distributions under Internal Revenue Section 871(k)(2)(C) for the six months
ended December 31, 2022, was as follows:
|
Global Equity Fund
|
100.00%
|
||
|
SMID Fund
|
100.00%
|
|
INFORMATION ABOUT PROXY VOTING (Unaudited)
|
A description of the policies and procedures that the Funds use to determine how to vote proxies relating to portfolio securities is available upon request without charge by calling
866-209-1962. Furthermore, you can obtain the description on the SEC’s web site at www.sec.gov.
Information regarding how the Funds voted proxies relating to portfolio securities during the most recent 12-month period ended June 30 is available upon request without charge by
calling 866-209-1962. Furthermore, you can obtain the Funds’ proxy voting records on the SEC’s web site at www.sec.gov.
|
INFORMATION ABOUT THE PORTFOLIO HOLDINGS (Unaudited)
|
The Funds’ quarterly holdings for the most recent fiscal year can be obtained by accessing the Funds’ website at www.trilliummutualfunds.com. The Funds file their complete schedule of
portfolio holdings with the SEC for the first and third quarters of each fiscal year as an exhibit to their reports on Form N-PORT. The Funds’ Form N-PORT is available on the SEC’s website at www.sec.gov. The Fund’s Form N-PORT may also be obtained
by calling 866-209-1962.
54
Trillium Mutual Funds
|
INFORMATION ABOUT THE FUND’S TRUSTEES (Unaudited)
|
The Statement of Additional Information (“SAI”) includes additional information about the Funds’ Trustees and is available without charge, upon request, by calling 866-209-1962.
Furthermore, you can obtain the SAI on the SEC’s web site at www.sec.gov or the Funds’ web site at www.trilliummutualfunds.com.
|
INFORMATION ABOUT HOUSEHOLDING (Unaudited)
|
Each year, you are automatically sent an updated prospectus as well as annual and semi-annual reports for the Funds, if applicable. In an effort to decrease costs, the Funds intend to
reduce the number of duplicate prospectuses, proxy statements, and annual and semi-annual reports you receive by sending only one copy of each to those addresses shared by two or more accounts and to shareholders we reasonably believe are from the
same family or household. Please call the Transfer Agent (or your financial institution) without charge at 866-209-1962 to request individual copies of these documents. The Funds will begin sending individual copies 30 days after receiving your
request. This policy does not apply to account statements.
|
INFORMATION ABOUT ELECTRONIC DELIVERY OF DOCUMENTS (Unaudited)
|
The Funds are pleased to offer the convenience of viewing shareholder communications, including the Funds’ prospectus, annual and semi-annual reports, and proxy statements online.
Please go to www.trilliummutualfunds.com for more information or to sign up for this service.
55
Trillium Mutual Funds
|
PRIVACY NOTICE (Unaudited)
|
The Funds collect non-public information about you from the following sources:
• Information we
receive about you on applications or other forms;
• Information
you give us orally; and
• Information
about your transactions with us or others.
We do not disclose any non-public personal information about our shareholders or former shareholders without the shareholder’s authorization, except as permitted by
law or in response to inquiries from governmental authorities. We may share information with affiliated parties and unaffiliated third parties with whom we have contracts for servicing the Funds. We will provide unaffiliated third parties with only
the information necessary to carry out their assigned responsibility. We maintain physical, electronic and procedural safeguards to protect your non-public personal information and require third parties to treat your non-public information with the
same high degree of confidentiality.
In the event that you hold shares of a Fund through a financial intermediary, including, but not limited to, a broker-dealer, bank or trust company, the privacy
policy of your financial intermediary would govern how your non- public personal information would be shared by those entities with unaffiliated third parties.
56
(This Page Intentionally Left Blank.)
Adviser
TRILLIUM ASSET MANAGEMENT, LLC
Two Financial Center
60 South Street, Suite 1100
Boston, Massachusetts 02111
Distributor
QUASAR DISTRIBUTORS, LLC
111 East Kilbourn Avenue, Suite 2200
Milwaukee, Wisconsin 53202
Custodian
U.S. BANK N.A.
Custody Operations
1555 North RiverCenter Drive, Suite 302
Milwaukee, Wisconsin 53212
Transfer Agent, Fund Accountant and Fund Administrator
U.S. BANCORP FUND SERVICES, LLC
615 East Michigan Street
Milwaukee, Wisconsin 53202
Independent Registered Public Accounting Firm
TAIT, WELLER & BAKER LLP
Two Liberty Place
50 South 16th Street, Suite 2900
Philadelphia, Pennsylvania 19102
Legal Counsel
SULLIVAN & WORCESTER LLP
1663 Broadway
New York, New York 10019
|
Fund
|
Class
|
Symbol
|
CUSIP
|
|||
|
Trillium
|
Retail Class
|
PORTX
|
742935588
|
|||
|
ESG Global Equity Fund
|
Institutional Class
|
PORIX
|
742935356
|
|||
|
Trillium
|
||||||
|
ESG Small/Mid Cap Fund
|
Institutional Class
|
TSMDX
|
74316P785
|
(b) Not applicable.
Item 2. Code of Ethics.
Not applicable for semi-annual reports.
Item 3. Audit Committee Financial Expert.
Not applicable for semi-annual reports.
Item 4. Principal Accountant Fees and Services.
Not applicable for semi-annual reports.
Item 5. Audit Committee of Listed Registrants.
Not applicable to open-end investment companies.
Item 6. Investments.
(a) Schedule of Investments is included as part of the report to shareholders filed under Item 1 of this Form.
(b) Not applicable.
Item 7. Disclosure of Proxy Voting Policies and Procedures for Closed-End Management Investment Companies.
Not applicable to open-end investment companies.
Item 8. Portfolio Managers of Closed-End Management Investment Companies.
Not applicable to open-end investment companies.
Item 9. Purchases of Equity Securities by Closed‑End Management Investment Company and Affiliated Purchasers.
Not applicable to open-end investment companies.
Item 10. Submission of Matters to a Vote of Security Holders.
The registrant has adopted a nominating committee charter that contains the procedures by which shareholders may recommend nominees to the registrant’s board of trustees. There have been no material changes to the procedures by which
shareholders may recommend nominees to the registrant’s board of trustees for the period.
Item 11. Controls and Procedures.
|
(a)
|
The Registrant’s Principal Executive Officer and Principal Financial Officer have reviewed the Registrant's disclosure controls and procedures (as defined in Rule 30a-3(c) under the Investment Company Act of 1940 (the “Act”)) as of a
date within 90 days of the filing of this report, as required by Rule 30a-3(b) under the Act and Rules 13a-15(b) or 15d‑15(b) under the Securities Exchange Act of 1934. Based on their review, such officers have concluded that the
disclosure controls and procedures are effective in ensuring that information required to be disclosed in this report is appropriately recorded, processed, summarized and reported and made known to them by others within the Registrant and
by the Registrant’s service provider.
|
|
(b)
|
There were no changes in the Registrant's internal control over financial reporting (as defined in Rule 30a-3(d) under the Act) that occurred during the quarter of the period covered by this report that has materially affected, or is
reasonably likely to materially affect, the Registrant's internal control over financial reporting.
|
Item 12. Disclosure of Securities Lending Activities for Closed-End Management Investment Companies.
Not applicable to open-end investment companies.
Item 13. Exhibits.
|
(a)
|
(1) Any code of ethics or amendment thereto, that is subject of the disclosure required by Item 2, to the extent that the registrant intends to satisfy Item 2 requirements through filing an exhibit.
Incorporated by reference to previous Form N-CSR filing.
|
(3) Any written solicitation to purchase securities under Rule 23c‑1 under the Act sent or given during the period covered by the report by or on behalf of the registrant to 10 or
more persons. Not applicable to open-end investment companies.
(4) Change in the registrant’s independent public accountant. There was no change in the registrant’s independent public accountant for the period covered by this report.
SIGNATURES
Pursuant to the requirements of the Securities Exchange Act of 1934 and the Investment Company Act of 1940, the registrant has duly caused this report to be signed on its behalf by the undersigned, thereunto duly
authorized.
(Registrant) Professionally Managed Portfolios
By (Signature and Title) /s/Jason Hadler
Jason Hadler, President/Principal Executive Officer
Date March 10, 2023
Pursuant to the requirements of the Securities Exchange Act of 1934 and the Investment Company Act of 1940, this report has been signed below by the following persons on behalf of the registrant and in the capacities
and on the dates indicated.
By (Signature and Title) /s/Jason Hadler
Jason Hadler, President/Principal Executive Officer
Date March 10, 2023
By (Signature and Title) /s/Craig Benton
Craig Benton, Treasurer/Principal Financial Officer
Date March 10, 2023
* Print the name and title of each signing officer under his or her signature.