| Rational Trend Aggregation VA Fund | ||||||||||||||||||||||||||||
| <p style="margin: 0px"><b>FUND SUMMARY – RATIONAL TREND AGGREGATION VA FUND (formerly RATIONAL DIVIDEND CAPTURE VA FUND)</b></p> | ||||||||||||||||||||||||||||
| <p style="margin: 0px"><b>Investment Objective:</b></p> | ||||||||||||||||||||||||||||
The Fund’s investment objective is to seek total return on investment, with dividend income as an important component of that return. | ||||||||||||||||||||||||||||
| <p style="margin: 0px"><b>Fees and Expenses:</b></p> | ||||||||||||||||||||||||||||
This table describes the fees and expenses that you may pay if you buy and hold shares of the Fund. The table below and the Example that follows DO NOT reflect variable insurance contract or separate account fees and charges. If these were included, your costs would be higher. | ||||||||||||||||||||||||||||
| <p style="margin: 0px"><b>Annual Fund Operating Expenses</b></p> <p style="margin: 0px"><b>(expenses that you pay each year as a percentage of the value of your investment)</b></p> | ||||||||||||||||||||||||||||
| ||||||||||||||||||||||||||||
| <p style="margin: 0px"><b>Example</b></p> | ||||||||||||||||||||||||||||
This Example is intended to help you compare the cost of investing in the Fund with the cost of investing in other mutual funds. | ||||||||||||||||||||||||||||
| <p style="margin: 0px">The Example assumes that you invest $10,000 in the Fund for the time periods indicated. The Example also assumes that your investment has a 5% return each year, the Fund’s operating expenses remain the same and that the expense reduction/reimbursement remains in place for the contractual period only. You would incur these hypothetical expenses whether or not you redeem your investment at the end of the given period. Although your actual costs may be higher or lower, based on these assumptions your costs would be:</p> | ||||||||||||||||||||||||||||
| ||||||||||||||||||||||||||||
| <p style="margin: 0px"><b>Portfolio Turnover:</b></p> | ||||||||||||||||||||||||||||
The Fund pays transaction costs, such as commissions, when it buys and sells securities (or “turns over” its portfolio). A higher portfolio turnover rate may indicate higher transaction costs. These costs, which are not reflected in annual fund operating expenses or in the Example, affect the Fund’s performance. During the most recent fiscal year, the Fund’s portfolio turnover rate was 261% of the average value of its portfolio. | ||||||||||||||||||||||||||||
| <p style="margin: 0px"><b>Principal Investment Strategies</b></p> | ||||||||||||||||||||||||||||
The Fund seeks to achieve its investment objective by employing a tactical approach to obtain exposure to U.S. equity markets. Under normal market conditions, the Fund expects to invest primarily in common stock of companies (a significant portion of which pay dividends) traded on U.S. exchanges, including American Depository Receipts; however, depending on the Fund’s tactical trading models, the Fund may invest all or a significant portion of its assets in cash and cash equivalents, including short-term treasury ETFs. The Fund may also invest in inverse ETFs and/or volatility Exchange Traded Notes (“ETNs”) for hedging purposes. Inverse ETFs are designed to produce daily returns, before the effect of fees and expenses, that are the opposite of the daily returns of a reference index. Volatility ETNs are debt instruments with payments designed to track (before the effect of fees and expenses) the daily returns of an index of security market volatility, such as the Chicago Board of Options Exchange's Volatility Index Futures.
The common stock held by the Fund may be of any market capitalization but is expected to be primarily invested in large capitalization companies. The Fund defines large capitalization as at least $10 billion. From time to time the Fund may invest more than 15% of its total assets in one or more particular sectors, including the industrial, consumer discretionary, consumer staples, utility, REITs, health care, energy, and financial sectors.
Tuttle Tactical Management, LLC (the “Sub-Advisor”), the investment sub-adviser of the Fund, utilizes a proprietary quantitative processes to create a basket of securities for investment by the Fund. To select stocks, the Sub-Advisor seeks to identify companies within the Nasdaq 100 Index and the S&P 500 Index that exhibit strong price momentum and earnings growth, or that are undervalued. Tactical models are then applied to those securities within the basket and these models either direct for investment in the securities or direct for investment in cash and cash equivalents. Three tactical models implemented by the Sub-Advisor are:
• Trend Following --- The trend following models seeks to identify strong sectors to buy and weak sectors to sell. Trend following is based on the idea that strong areas of the market will remain strong and weak areas will remain weak.
• Mean Reversion --- The mean reversion models look for strong sectors that appear overbought to sell and weak sectors that appear oversold to buy. Mean reversion is based on the idea that market sectors often become overextended on the upside and downside before ultimately moving back to equilibrium.
• Intermarket Analysis --- These models will analyze market sectors that are correlated or uncorrelated and look for divergences. These divergences often signal major market turning points.
The Fund actively trades its portfolio investments, which may lead to higher transaction costs that may affect the Fund’s performance. | ||||||||||||||||||||||||||||
| <p style="margin: 0px"><b>Principal Investment Risks</b></p> | ||||||||||||||||||||||||||||
As with any mutual fund, there is no guarantee that the Fund will achieve its objective. Investment markets are unpredictable and there will be certain market conditions where the Fund will not meet its investment objective and will lose money. The Fund’s net asset value and returns will vary and you could lose money on your investment in the Fund and those losses could be significant.
The following summarizes the principal risks of investing in the Fund. These risks could adversely affect the net asset value, total return and the value of the Fund and your investment.
• Cash and Cash Equivalents Risk. At any time, the Fund may have significant investments in cash or cash equivalents. When a substantial portion of a portfolio is held in cash or cash equivalents, there is the risk that the value of the cash account, including interest, will not keep pace with inflation, thus reducing purchasing power over time.
• Consumer Discretionary Sector Risk. The success of consumer product manufacturers and retailers is tied closely to the performance of domestic and international economies, interest rates, exchange rates, competition, consumer confidence, changes in demographics and consumer preferences. Companies in the consumer discretionary sector depend heavily on disposable household income and consumer spending, and may be strongly affected by social trends and marketing campaigns. These companies may be subject to severe competition, which may have an adverse impact on their profitability.
• Consumer Staples Sector Risk. The consumer staples sector may be affected by the regulation of various product components and production methods, marketing campaigns and other factors affecting consumer demand. Tobacco companies, in particular, may be adversely affected by new laws, regulations and litigation. The consumer staples sector may also be adversely affected by changes or trends in commodity prices, which may be influenced by unpredictable factors.
• Energy Sector Risk. Energy related entities are subject to supply and demand fluctuations in the markets they serve which will be impacted by a wide range of factors, including fluctuating commodity prices, weather, increased conservation or use of alternative fuel sources, increased governmental or environmental regulation, depletion, rising interest rates, declines in domestic or foreign production, accidents or catastrophic events, and economic conditions, among others. The financial performance of energy related securities may be adversely affected if a company is unable to cost-effectively acquire additional energy reserves. Various governmental authorities have the power to enforce compliance with regulations and the permits issued under them, and violators are subject to administrative, civil and criminal penalties, including civil fines, injunctions or both. Stricter laws, regulations or enforcement policies could be enacted in the future which would likely increase compliance costs and may adversely affect the financial performance of energy related securities.
• Equity Securities Risk. The price of common stock will fluctuate and can decline, reducing the value of the Fund. The price of equity securities fluctuates based on changes in a company’s financial condition and overall market and economic conditions. The value of equity securities purchased by the Fund could decline if the financial condition of the companies in which the Fund is invested in declines or if overall market and economic conditions deteriorate.
• Exchange-Traded Fund (ETF) Risk. Like an open-end investment company (mutual fund), the value of an ETF can fluctuate based on the prices of the securities owned by the ETF, and ETFs are also subject to the following additional risks: (i) the ETF’s market price may be less than its net asset value; (ii) an active market for the ETF may not develop; and (iii) market trading in the ETF may be halted under certain circumstances. Because the Fund may invest its assets in ETFs that have their own fees and expenses in addition to those charged directly by the Fund, the Fund may bear higher expenses than the Fund that invests directly in individual securities.
• Exchange Traded Note Risk. Similar to ETFs, owning an ETN generally reflects the risks of owning the assets that comprise the underlying market benchmark or strategy that the ETN is designed to reflect. ETNs also are subject to issuer and fixed-income risk. In addition, ETNs are subject to counterparty risk, which is the risk that the broker-dealer or bank that issues the notes will not fulfill its contractual obligation to complete the transaction with the Fund. ETNs constitute general unsecured contractual obligations of the banks or broker-dealers that issue them, and the Fund is relying on the creditworthiness of such banks or broker-dealers.
• Financials Sector Risk. Performance of companies in the financials sector may be adversely impacted by many factors, including, among others, government regulations, economic conditions, credit rating downgrades, changes in interest rates, and decreased liquidity in credit markets. The impact of more stringent capital requirements, recent or future regulation of any individual financial company, or recent or future regulation of the financials sector as a whole cannot be predicted.
• Fixed Income Securities Risk. When the Fund invests in ETNs and fixed income ETFs, the value of your investment in the Fund will fluctuate with changes in interest rates. Typically, a rise in interest rates causes a decline in the value of fixed income securities owned by the Fund. In general, the market price of fixed income securities with longer maturities will increase or decrease more in response to changes in interest rates than shorter-term securities. Other risk factors include credit risk (the debtor may default), extension risk (an issuer may exercise its right to repay principal on a fixed rate obligation held by the Fund later than expected), and prepayment risk (the debtor may pay its obligation early, reducing the amount of interest payments). These risks could affect the value of a particular investment by the Fund, possibly causing the Fund’s share price and total return to be reduced and fluctuate more than other types of investments.
• Foreign Securities/Investment Risk. Since the Fund’s investments may include American Depository Receipts (“ADRs”), the Fund is subject to risks beyond those associated with investing in domestic securities. The value of foreign securities is subject is subject to currency fluctuations. Foreign companies are generally not subject to the same regulatory requirements of U.S. companies thereby resulting in less publicly available information about these companies. In addition, foreign accounting, auditing and financial reporting standards generally differ from those applicable to U.S. companies.
• Healthcare Sector Risk. The healthcare sector may be affected by government regulations and government healthcare programs, increases or decreases in the cost of medical products and services and product liability claims, among other factors. Many healthcare companies are heavily dependent on patent protection, and the expiration of a company’s patent may adversely affect that company’s profitability. Healthcare companies are subject to competitive forces that may result in price discounting, and may be thinly capitalized and susceptible to product obsolescence.
• Hedging Risk. Hedging is a strategy in which the Fund uses an instrument to offset the risks associated with other Fund holdings. There can be no assurance that the Fund’s hedging strategy will reduce risk or that hedging transactions will be either available or cost effective. The Fund is not required to use hedging and may choose not to do so.
• Industrials Sector Risk. The value of securities issued by companies in the industrials sector may be adversely affected by supply and demand related to their specific products or services and industrials sector products in general. The products of manufacturing companies may face obsolescence due to rapid technological developments and frequent new product introduction. Government regulations, world events, economic conditions and exchange rates may adversely affect the performance of companies in the industrials sector. Companies in the industrials sector may be adversely affected by liability for environmental damage and product liability claims. Companies in the industrials sector, particularly aerospace and defense companies, may also be adversely affected by government spending policies because companies involved in this sector rely to a significant extent on government demand for their products and services.
• Inverse ETF Risk. Investments in inverse ETFs will prevent the Fund from participating in market-wide or sector-wide gains and may not prove to be an effective hedge. During periods of increased volatility, inverse ETFs may not perform in the manner they are designed.
• Issuer-Specific Risk. The value of a specific security can be more volatile than the market as a whole and can perform differently from the value of the market as a whole. The value of securities of smaller issuers can be more volatile than those of larger issuers. The value of certain types of securities can be more volatile due to increased sensitivity to adverse issuer, political, regulatory, market, or economic developments. The value of the Fund’s portfolio will be dependent on the success of the strategies used by the Sub-Advisor.
• Large Capitalization Stock Risk. Large-capitalization companies may be less able than smaller capitalization companies to adapt to changing market conditions. Large-capitalization companies may be more mature and subject to more limited growth potential compared with smaller capitalization companies. During different market cycles, the performance of large capitalization companies has trailed the overall performance of the broader securities markets.
• Management Risk. This is the risk that investment strategies employed by the Sub-Advisor in selecting investments and asset allocations for the Fund may not result in an increase in the value of your investment or in overall performance equal to other similar investment vehicles having similar investment strategies. There is also the risk that investment strategies and models employed by the Sub-Advisor in selecting investments and asset allocations for the Fund may not result in an increase in the value of your investment or in overall performance equal to other similar investment vehicles having similar investment strategies.
• Market Risk. The value of securities in the Fund’s portfolio will fluctuate and, as a result, the Fund’s share price may decline suddenly or over a sustained period of time.
• Medium (Mid) Capitalization Stock Risk. The earnings and prospects of mid-capitalization companies are more volatile than larger companies, they may experience higher failure rates than larger companies and normally have a lower trading volume than larger companies, which may tend to make their market price fall more disproportionately than larger companies in response to selling pressures. Mid-sized companies may also have limited markets, product lines or financial resources and may lack management experience.
• Model and Data Risk. Like all quantitative analysis, the investment models utilized by the Sub-Advisor carry the risk that the ranking system, valuation results and predictions might be based on one or more incorrect assumptions, insufficient historical data, inadequate design, or may not be suitable for the purpose intended. In addition, models may not perform as intended for many reasons including errors, omissions, imperfections or malfunctions. Because the use of models are usually constructed based on data supplied by third parties, the success of the Sub-Advisor’s use of such models is dependent on the accuracy and reliability of the supplied data. Historical data inputs may be subject to revision or corrections, which may diminish data reliability and quality of predictive results. Changing and unforeseen market dynamics could also lead to a decrease in the short-term or long-term effectiveness of a model. Models may lose their predictive validity and incorrectly forecast future market behavior and asset prices, leading to potential losses. No assurance can be given that a model will be successful under all or any market conditions.
• Real Estate/REIT Risk. The Fund’s investments in REITs are subject to the same risks as direct investments in real estate. The real estate industry is particularly sensitive to economic downturns. The value of REITs and other real estate-related investments is sensitive to changes in real estate values and rental income, property taxes, interest rates, tax and regulatory requirements, overbuilding, extended vacancies of properties and the issuer’s management skills. In the event of a default by an underlying tenant or borrower, a REIT could experience delays in enforcing its rights as a lessor or mortgagee and may incur substantial costs associated with protecting its investments. In addition, the value of a REIT can depend on the structure of and cash flow generated by the REIT. Also, REITs may have limited financial resources, may trade less frequently and in limited volume and may be more volatile than other securities.
• Sector Focus Risk. The Fund may focus its investments in securities of a particular sector. Economic, legislative or regulatory developments may occur that significantly affect the sector. This may cause the Fund’s net asset value to fluctuate more than that of the Fund that does not focus in a particular sector.
• Smaller Capitalization Stock Risk. To the extent the Fund invests in the stocks of smaller-sized companies, the Fund may be subject to additional risks, including the risk that earnings and prospects of these companies are more volatile than larger companies.
• Turnover Risk. The Fund may have portfolio turnover rates significantly in excess of 100%. Increased portfolio turnover causes the Fund to incur higher brokerage costs, which may adversely affect the Fund’s performance.
• Underlying Fund Risk. Other investment companies including ETFs (“Underlying Funds”) in which the Fund invests are subject to investment advisory and other expenses, which will be indirectly paid by the Fund. As a result, the cost of investing in the Fund will be higher than the cost of investing directly in the Underlying Funds and may be higher than other mutual funds that invest directly in stocks and bonds. Each of the Underlying Funds is subject to its own specific risks, but the Sub-Adviser expects the principal investment risks of such Underlying Funds will be similar to the risks of investing in the Fund.
• U.S. Government Obligations Risk. U.S. Treasury obligations are backed by the “full faith and credit” of the U.S. government and generally have negligible credit risk. Securities issued or guaranteed by federal agencies or authorities and U.S. government-sponsored instrumentalities or enterprises may or may not be backed by the full faith and credit of the U.S. government.
• Utilities Sector Risk. Deregulation may subject utility companies to greater competition and may adversely affect their profitability. As deregulation allows utility companies to diversify outside of their original geographic regions and their traditional lines of business, utility companies may engage in riskier ventures. In addition, deregulation may eliminate restrictions on the profits of certain utility companies, but may also subject these companies to greater risk of loss. Companies in the utilities industry may have difficulty obtaining an adequate return on invested capital, raising capital, or financing large construction projects during periods of inflation or unsettled capital markets; face restrictions on operations and increased cost and delays attributable to environmental considerations and regulation; find that existing plants, equipment or products have been rendered obsolete by technological innovations; or be subject to increased costs because of the scarcity of certain fuels or the effects of man-made or natural disasters. Existing and future regulations or legislation may make it difficult for utility companies to operate profitably. Government regulators monitor and control utility revenues and costs, and therefore may limit utility profits. There is no assurance that regulatory authorities will grant rate increases in the future, or that such increases will be adequate to permit the payment of dividends on stocks issued by a utility company. Energy conservation and changes in climate policy may also have a significant adverse impact on the revenues and expenses of utility companies.
• Volatility ETN Risk. ETNs that are linked to market volatility are subject to default risk of the issuer; may not provide an effective hedge as historical correlation trends between the reference volatility index or measure and other asset classes may not continue or may reverse, limiting or eliminating any potential hedging effect; may become mispriced or improperly valued when compared to expectations and may not produce the desired investment results; may have tracking risk if the ETN does not move in step with its reference index; and may become illiquid. | ||||||||||||||||||||||||||||
| <p style="margin: 0px"><b>Performance</b></p> | ||||||||||||||||||||||||||||
The bar chart and accompanying table shown below provide an indication of the risks of investing in the Fund by showing its total return for each full calendar year, and by showing how its average annual returns compare over time with those of a broad measure of market performance. How the Fund has performed in the past is not necessarily an indication of how it will perform in the future. Updated performance information is available at no cost by calling 1-800-253-0412.
Performance information for the period prior to November 1, 2018 does not reflect the Fund’s current strategy and the Fund’s portfolio was not managed by the Fund’s current Sub-Advisor.
The returns in the bar chart and the table below DO NOT reflect variable insurance separate account and contract fees and charges. If these fees and charges were included, the returns would be lower than those shown. | ||||||||||||||||||||||||||||
| <p style="margin: 0px"><b>Performance Bar Chart and Table</b></p> | ||||||||||||||||||||||||||||
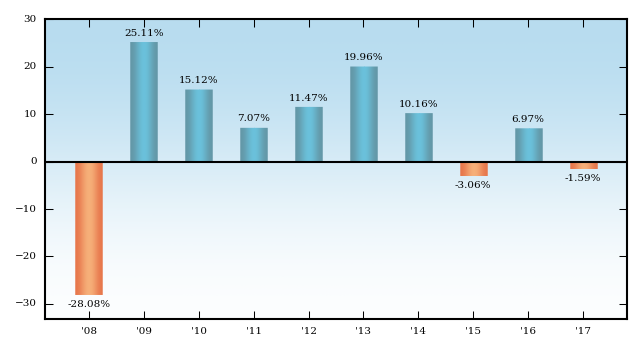
| ||||||||||||||||||||||||||||
During the period shown in the bar chart, the highest return for a quarter was 23.47% (quarter ended June 30, 2009), and the lowest return for a quarter was (17.07)% (quarter ended March 31, 2009). The Fund’s year-to-date return for the period ended September 30, 2018 was 1.95%. | ||||||||||||||||||||||||||||
| <p style="margin: 0px"><b>Average Annual Total Returns</b></p> <p style="margin: 0px"><b>(for the periods ended, December 31, 2017)</b></p> | ||||||||||||||||||||||||||||
| ||||||||||||||||||||||||||||
Return before taxes is shown. | ||||||||||||||||||||||||||||