UNITED STATES
SECURITIES AND EXCHANGE COMMISSION
Washington, D.C. 20549
FORM 10-K
ANNUAL REPORT PURSUANT TO SECTION 13 OR 15(d) OF THE SECURITIES EXCHANGE ACT OF 1934 | |
FOR THE FISCAL YEAR ENDED September 29, 2019
TRANSITION REPORT PURSUANT TO SECTION 13 OR 15(d) OF THE SECURITIES EXCHANGE ACT OF 1934 | |
FOR THE TRANSITION PERIOD FROM ________ TO ________.
COMMISSION FILE NUMBER 1-9390
_______________________________________________________________
(Exact name of registrant as specified in its charter)
_______________________________________________________________
(State of Incorporation) | (I.R.S. Employer Identification No.) | |
(Address of principal executive offices)
Registrant’s telephone number, including area code (858 ) 571-2121
Securities registered pursuant to Section 12(b) of the Act:
Title of each class | Trading Symbol(s) | Name of each exchange on which registered |
Securities registered pursuant to Section 12(g) of the Act: None
Indicate by check mark whether the registrant is a well-known seasoned issuer, as defined in Rule 405 of the Securities Act. Yes þ No ¨
Indicate by check mark if the registrant is not required to file reports pursuant to Section 13 or 15(d) of the Act. Yes ¨ No þ
Indicate by check mark if the registrant (1) has filed all reports required to be filed by Section 13 or 15(d) of the Securities Exchange Act of 1934 during the preceding 12 months (or for such shorter period that the registrant was required to file such reports), and (2) has been subject to such filing requirements for the past 90 days. Yes þ No ¨
Indicate by check mark whether the registrant has submitted electronically every Interactive Data File required to be submitted pursuant to Rule 405 of Regulations S-T (§232.405 of this chapter) during the preceding 12 months (or for such shorter period that the registrant was required to submit such files). Yes þ No ¨
Indicate by check mark whether the registrant is a large accelerated filer, an accelerated filer, a non-accelerated filer, a smaller reporting company, or an emerging growth company. See the definitions of “large accelerated filer,” “accelerated filer,” “smaller reporting company,” and “emerging growth company” in Rule 12b-2 of the Exchange Act.
If an emerging growth company, indicate by check mark if the registrant has elected not to use the extended transition period for complying with any new or revised financial accounting standards provided pursuant to Section 13(a) of the Exchange Act. ¨
Indicate by check mark whether the registrant is a shell company (as defined in Rule 12b-2 of the Exchange Act).Yes ☐ No ☑
The aggregate market value of the common stock held by non-affiliates of the registrant as of the last business day of the registrant’s most recently completed second fiscal quarter, computed by reference to the closing price reported on the NASDAQ Global Select Market — Composite Transactions as of April 12, 2019, was approximately $2.0 billion.
Number of shares of common stock, $0.01 par value, outstanding as of the close of business on November 15, 2019 — 23,651,991 .
DOCUMENTS INCORPORATED BY REFERENCE
Portions of the Proxy Statement to be filed with the Securities and Exchange Commission in connection with the 2020 Annual Meeting of Stockholders are incorporated by reference into Part III hereof.
JACK IN THE BOX INC.
TABLE OF CONTENTS
Page | ||
PART I | ||
Item 1. | ||
Item 1A. | ||
Item 1B. | ||
Item 2. | ||
Item 3. | ||
Item 4. | ||
PART II | ||
Item 5. | ||
Item 6. | ||
Item 7. | ||
Item 7A. | ||
Item 8. | ||
Item 9. | ||
Item 9A. | ||
Item 9B. | ||
PART III | ||
Item 10. | ||
Item 11. | ||
Item 12. | ||
Item 13. | ||
Item 14. | ||
PART IV | ||
Item 15. | ||
Item 16. | ||
FORWARD-LOOKING STATEMENTS
From time to time, we make oral and written forward-looking statements that reflect our current expectations regarding future results of operations, economic performance, financial condition, and achievements of Jack in the Box Inc. (the “Company”). A forward-looking statement is neither a prediction nor a guarantee of future events or results. In some cases, forward-looking statements can be identified by words such as “anticipate,” “assume,” “believe,” “estimate,” “expect,” “forecast,” “goals,” “guidance,” “intend,” “plan,” “project,” “may,” “should,” “will,” “would,” and similar expressions. Certain forward-looking statements are included in this Form 10-K, principally in the sections captioned “Business,” “Legal Proceedings,” “Consolidated Financial Statements,” and “Management’s Discussion and Analysis of Financial Condition and Results of Operations,” including statements regarding our strategic plans and operating strategies. Although we believe that the expectations reflected in our forward-looking statements are based on reasonable assumptions, such expectations and forward-looking statements may prove to be materially incorrect due to known and unknown risks and uncertainties.
In some cases, information regarding certain important factors that could cause our actual results to differ materially from any forward-looking statement appears together with such statement. In addition, the factors described under “Risk Factors” and “Discussion of Critical Accounting Estimates” in this Form 10-K, as well as other possible factors not listed, could cause our actual results, economic performance, financial condition or achievements to differ materially from those expressed in any forward-looking statements. As a result, investors should not place undue reliance on such forward-looking statements, which speak only as of the date of this report. The Company is under no obligation to update forward-looking statements, whether as a result of new information or otherwise.
1
PART I
ITEM 1. | BUSINESS |
The Company
Overview. Jack in the Box Inc., based in San Diego, California, operates and franchises 2,243 Jack in the Box® quick-service restaurants (“QSRs”). References to the Company throughout this Annual Report on Form 10-K are made using the first person notations of “we,” “us,” and “our.”
Jack in the Box opened its first restaurant in 1951 and has since become one of the nation’s largest hamburger chains. Based on number of restaurants, our top 10 major markets comprise approximately 70% of the total system, and Jack in the Box is at least the second largest QSR hamburger chain in eight of those major markets. As of the end of our fiscal year on September 29, 2019, the Jack in the Box system included 2,243 restaurants in 21 states and Guam, of which 137 were company-operated and 2,106 were franchise-operated.
Through the execution of our refranchising strategy over the last five years, we have increased franchise ownership of the Jack in the Box system from 81% at the end of fiscal 2014 to 94% at the end of fiscal 2019 as we completed our refranchising program. In fiscal 2019, our franchisees developed 19 new franchise restaurants, and we expect the majority of new unit growth will be through franchise restaurants.
Our long-term goals are focused on meeting evolving customer needs, with emphasis on improving operations consistency and targeted investments designed to maximize our returns. The key initiatives of our long-term goals include:
• | Simplifying Restaurant Operations - We will continue focusing on redefining and elevating the guest experience to drive consistency through the following: |
– | Back-of-the-house simplification, including kitchen equipment / technology that can drive higher throughput, improved quality, and labor cost benefits. |
– | Reduction of redundant SKUs. |
• | Differentiating Through Innovation - We will continue focusing on what makes us different by balancing premium and value innovation and leveraging our unique brand personality to differentiate creatively and focus on our core customer. |
• | Expanding our Brand Footprint - We are focused on growing units in existing, developing and new markets, primarily through franchise restaurants. |
• | Enhancing the Guest Experience - We are focused on targeted investments designed to maximize our returns while meeting the evolving needs of our customers to drive a consistent experience and brand image in our restaurants and across digital platforms through the following: |
– | Leveraging technology such as our mobile application to meet the evolving needs of our customers and improve in-store efficiencies. |
– | Elevating the image of our restaurants, with a focus on the drive-thru, through which approximately 70% of our sales occur. |
Segments
As of September 29, 2019, the Company is comprised of a single operating segment.
2
Restaurant Concept
Jack in the Box restaurants offer a broad selection of distinctive products including classic burgers like our Jumbo Jack® and innovative product lines such as Buttery Jack® burgers. We also offer quality products such as breakfast sandwiches with freshly cracked eggs, and craveable favorites such as tacos and curly fries, along with specialty sandwiches, salads, and real ice cream shakes, among other items. We allow our guests to customize their meals to their tastes and order any product when they want it, including breakfast items any time of day (or night). We are known for variety and innovation, which has led to the development of four strong dayparts: breakfast, lunch, dinner, and late-night.
The Jack in the Box restaurant chain was the first major hamburger chain to develop and expand the concept of drive-thru restaurants. In addition to drive-thru windows, most of our restaurants have seating capacities ranging from 20 to 100 people and are open 18-24 hours a day. Drive-thru sales currently account for approximately 70% of sales at company-operated restaurants. The average check in fiscal year 2019 was $8.34 for company-operated restaurants.
With a presence in only 21 states and one territory, we believe Jack in the Box is a brand with significant growth opportunities. In fiscal 2019, franchisees continued to expand in existing markets.
The following table summarizes the changes in the number of company-operated and franchise restaurants over the past five years:
Fiscal Year | |||||||||||||||
2019 | 2018 | 2017 | 2016 | 2015 | |||||||||||
Company-operated restaurants: | |||||||||||||||
Beginning of period | 137 | 276 | 417 | 413 | 431 | ||||||||||
New | — | 1 | 2 | 4 | 2 | ||||||||||
Refranchised | — | (135 | ) | (178 | ) | (1 | ) | (21 | ) | ||||||
Closed | — | (5 | ) | (15 | ) | — | (6 | ) | |||||||
Acquired from franchisees | — | — | 50 | 1 | 7 | ||||||||||
End of period total | 137 | 137 | 276 | 417 | 413 | ||||||||||
% of system | 6 | % | 6 | % | 12 | % | 18 | % | 18 | % | |||||
Franchise restaurants: | |||||||||||||||
Beginning of period | 2,100 | 1,975 | 1,838 | 1,836 | 1,819 | ||||||||||
New | 19 | 11 | 18 | 12 | 16 | ||||||||||
Refranchised | — | 135 | 178 | 1 | 21 | ||||||||||
Closed | (13 | ) | (21 | ) | (9 | ) | (10 | ) | (13 | ) | |||||
Sold to company | — | — | (50 | ) | (1 | ) | (7 | ) | |||||||
End of period total | 2,106 | 2,100 | 1,975 | 1,838 | 1,836 | ||||||||||
% of system | 94 | % | 94 | % | 88 | % | 82 | % | 82 | % | |||||
System end of period total | 2,243 | 2,237 | 2,251 | 2,255 | 2,249 | ||||||||||
Site Selection and Design
Site selections for all new company-operated restaurants are made after an economic analysis and a review of demographic data and other information relating to population density, traffic, competition, restaurant visibility and access, available parking, surrounding businesses, and opportunities for market penetration. Restaurants developed by franchisees are built to brand specifications on sites we have approved.
Our company-operated restaurants have multiple restaurant models with different seating capacities to improve our flexibility in selecting locations. Management believes that this flexibility enables the Company to match the restaurant configuration with the specific economic, demographic, geographic, or physical characteristics of a particular site.
Typical costs to develop a traditional restaurant, excluding the land value, range from approximately $1.4 million to $2.0 million. The majority of our corporate restaurants are constructed on leased land or on land that we purchase and subsequently sell, along with the improvements, in sale and leaseback transactions. Upon completion of a sale and leaseback transaction, the Company’s initial cash investment is reduced to the cost of equipment, which ranges from approximately $0.4 million to $0.5 million.
3
Franchising Program
The franchise agreement generally provides for an initial franchise fee of $50,000 per restaurant for a 20-year term, and royalty payments and marketing fees generally set at 5.0% of gross sales. Royalty rates are typically 5.0% of gross sales but may range as high as 10.0% of gross sales. Some existing agreements provide for lower royalties for a limited time and may have variable rates. We may offer development agreements to franchisees (referred to in this context as “Developers”) for construction of one or more new restaurants over a defined period of time and in a defined geographic area. Developers may be required to pay fees for certain company-sourced new sites. Developers may lose their rights to future development if they do not maintain the required opening schedule. To stimulate growth, we have offered a waiver of development fees for new sites, in addition to lower royalty rates or a development loan, to franchisees who open restaurants within a specified time frame.
As a general matter, when we sell a company-operated restaurant to a franchisee, the sale has included the restaurant equipment and the right to do business at that location for a specified term. The aggregate price has been based upon the value of the restaurant as a going concern, which depends on various factors, including the historical sales and cash flows of the restaurant, as well as its location. In addition, the land and building are generally leased or subleased to the franchisee at a negotiated rent, typically equal to the greater of a minimum base rent or a percentage of gross sales. The franchisee is usually required to pay property taxes, insurance, and ancillary costs, and was responsible for maintaining the restaurant.
Restaurant Management and Operations
Jack in the Box restaurants are operated by a company manager or franchise operator who is directly responsible for the operations of the restaurant, including product quality, service, food safety, cleanliness, inventory, cash control, and the conduct and appearance of employees. We focus on attracting, selecting, engaging, and retaining employees and franchisees who share our passion for creating long-lasting, successful restaurants.
Managers of company-operated restaurant are supervised by district managers, who are overseen by directors of operations, who report to the vice president of company operations. Under our performance system, the vice president is eligible for annual incentive compensation based on achievement of goals related to company-wide performance and restaurant level margin. Directors are eligible for an annual incentive compensation based on achievement of goals related to the sales and profit of their assigned region, and a company-wide performance goal. District managers and restaurant managers are eligible for quarterly incentives based on growth in restaurant sales and profit and certain other operational performance standards.
Company-operated restaurant managers are required to complete an extensive management training program involving a combination of in-restaurant instruction and on-the-job training in specially designated training restaurants. Restaurant managers and supervisory personnel train other restaurant employees in accordance with detailed procedures and guidelines using training aids available at each location.
Customer Satisfaction
Company-operated and franchise-operated restaurants devote significant resources toward offering quality food and excellent service at all of our restaurants. One tool we have used to help us maintain a high level of customer satisfaction is our Voice of Guest program, which provides restaurant managers, district managers, and franchise operators with ongoing feedback from guests who complete a short satisfaction survey via an invitation typically provided on the register receipt. In these surveys, guests rate their satisfaction with key elements of their restaurant experience, including friendliness, food quality, cleanliness, speed of service, and order accuracy. In 2019, the Jack in the Box system received approximately 1.2 million guest survey responses. Our Guest Relations Department receives feedback that guests provide via phone and our website and communicates that feedback to restaurant managers and franchise operators. We also collect and respond to guest feedback through social media, restaurant reviews and other feedback sources.
Food Safety
Our “farm-to-fork” food safety program is designed to maintain high standards for the food products and food preparation procedures used by our vendors and in our restaurants. We maintain product specifications for our ingredients and our Food Safety and Regulatory Compliance Department must approve all suppliers of food products to our restaurants. We use third-party and internal audits to review the food safety management programs of our vendors. We manage food safety in our restaurants through a comprehensive food safety management program that is based on the Food and Drug Administration (“FDA”) Food Code requirements. The food safety management program includes employee training, ingredient testing, documented restaurant practices, and attention to product safety at each stage of the food preparation cycle. In addition, our food safety management program uses American National Standards Institute certified food safety training programs to train our company and franchise restaurant management employees on food safety practices for our restaurants.
4
Supply Chain
All of our company-operated restaurants and franchisees have a long-term contract with a third-party distributor. Under this contract, the distributor will provide distribution services to our Jack in the Box restaurants through August 2022 through seven distribution centers in the continental United States.
The primary commodities purchased by our restaurants are beef, poultry, pork, cheese, and produce. We monitor and purchase commodities in order to minimize the impact of fluctuations in price and supply. Contracts are entered into and commodity market positions may be secured when we consider them to be advantageous. However, certain commodities remain subject to price fluctuations. Most, if not all essential food and beverage products are available or can be made available upon short notice from alternative qualified suppliers.
Information Systems
At our corporate support center, we have financial accounting systems, human resources and payroll systems, and a communications and network infrastructure that supports corporate functions. Our restaurant software allows for daily polling of sales, inventory, and other data from the restaurants directly. Our company restaurants and traditional-site franchise restaurants use standardized Windows-based touch screen point-of-sale (“POS”) platforms. These platforms allow the restaurants to accept cash, credit cards, and our re-loadable gift cards. The single POS system for all restaurants helps franchisees and brand managers adapt more quickly to meet consumer demands and introduce new products, pricing, promotions, and technologies such as the Jack in the Box mobile app, third party delivery, or any other business-driving initiative while maintaining a secure, PCI compliant payment system.
We have business intelligence systems that provide us with visibility to the key metrics in the operation of company and franchise restaurants. These systems play an integral role in enabling us to accumulate and analyze market information. Our company restaurants use labor scheduling systems to assist managers in managing labor hours based on forecasted sales volumes. We also have inventory management systems that enable timely and accurate deliveries of food and packaging to our restaurants. To support order accuracy and speed of service, our drive-thru restaurants use order confirmation screens.
Advertising and Promotion
We build brand awareness through our marketing and advertising programs and activities. These activities are supported primarily by financial contributions to a marketing fund from all company and franchise restaurants based on a percentage of gross sales. Activities to advertise restaurant products, promote brand awareness, and attract customers include, but are not limited to, system and regional campaigns on television, radio, and print media, as well as digital and social media.
Employees
At September 29, 2019, we had approximately 5,200 employees, of whom 4,820 were restaurant employees, 340 were corporate personnel, and 40 were field management. Employees are paid on an hourly basis, except certain restaurant and operations management, and corporate personnel. We employ both full- and part-time restaurant employees in order to provide the flexibility necessary during peak periods of restaurant operations. We have not experienced any significant work stoppages, and we support our employees, including part-time workers, by offering industry competitive wages and benefits.
Executive Officers
The following table sets forth the name, age, position and years with the Company of each person who is an executive officer of Jack in the Box Inc. as of September 29, 2019:
Name | Age | Positions | Years with the Company | |||
Leonard A. Comma | 50 | Chairman of the Board and Chief Executive Officer | 18 | |||
Mark H. Blankenship, Ph.D. | 58 | Executive Vice President, Chief of Staff and Strategy | 22 | |||
Phillip H. Rudolph | 61 | Executive Vice President, Chief Legal and Risk Officer and Corporate Secretary | 12 | |||
Lance Tucker | 50 | Executive Vice President and Chief Financial Officer | 2 | |||
Paul D. Melancon | 63 | Senior Vice President of Finance, Controller and Treasurer | 14 | |||
Melissa Corrigan, Ph.D. | 49 | Vice President and Chief Human Resources Officer | 22 | |||
Vanessa C. Fox | 46 | Vice President, Chief Development Officer | 22 | |||
Dean C. Gordon | 57 | Vice President, Chief Supply Chain Officer | 10 | |||
Drew T. Martin | 55 | Vice President, Chief Information Officer | 3 | |||
Marcus D. Tom | 62 | Vice President and Chief Operating Officer | 2 | |||
5
The following sets forth the business experience of each executive officer for at least the last five years:
Mr. Comma has been Chairman of the Board and Chief Executive Officer since January 2014. From May 2012 until October 2014, he served as President, and from November 2010 through January 2014, as Chief Operating Officer. Mr. Comma served as Senior Vice President and Chief Operating Officer from February 2010 to November 2010, Vice President Operations Division II from February 2007 to February 2010, Regional Vice President of the Company’s Southern California region from May 2006 to February 2007, and Director of Convenience-Store & Fuel Operations for the Company’s proprietary chain of Quick Stuff convenience stores from August 2001 to May 2006. Mr. Comma has more than 25 years of retail and franchise experience.
Dr. Blankenship has been Executive Vice President, Chief of Staff and Strategy since October 2018. From November 2013 through October 2018 he served as Executive Vice President, Chief People, Culture and Corporate Strategy Officer. He was previously Senior Vice President and Chief Administrative Officer from October 2010 to November 2013, Vice President, Human Resources and Operational Services from October 2005 to October 2010, and Division Vice President, Human Resources from October 2001 to September 2005. Dr. Blankenship has 22 years of experience with the Company in various human resource and training positions. As the Company announced in September 2019, Dr. Blankenship is expected to leave the Company in January 2020.
Mr. Rudolph has been Chief Legal and Risk Officer since October 2014, Executive Vice President since February 2010, and Corporate Secretary since November 2007. Before becoming Chief Legal and Risk Officer, he was General Counsel since November 2007. Prior to joining the Company, Mr. Rudolph was Vice President and General Counsel for Ethical Leadership Group. He was previously a partner in the Washington, D.C. office of Foley Hoag, LLP, and a Vice President at McDonald’s Corporation where, among other roles, he served as U.S. and International General Counsel. Before joining McDonald’s, Mr. Rudolph spent 15 years with the law firm of Gibson, Dunn & Crutcher, LLP, the last six of which he spent as a litigation partner in the firm’s Washington, D.C. office. Mr. Rudolph has more than 35 years of legal experience. As the Company announced in September 2019, Mr. Rudolph is expected to leave the Company in February 2020.
Mr. Tucker has been Executive Vice President and Chief Financial Officer since March 2018. Prior to joining the Company in March, Mr. Tucker held several senior leadership positions at Papa John’s International, Inc. From February 2011 to February 2018, Mr. Tucker served as Senior Vice President, Chief Financial Officer and Treasurer and added Chief Administrative Officer in February 2012. From June 2010 to February 2011, he was Chief of Staff and Senior Vice President, Strategic Planning for Papa John’s International. Prior to that, he served as its Chief of Staff and Vice President, Strategic Planning from June 2009 to June 2010. Prior to joining Papa John’s, Mr. Tucker served as the Chief Financial Officer of Evergreen Real Estate, from 2003 to 2009; and held leadership positions with several finance companies from 1999 to 2003. Previously, from 1994 to 1999, he served as the Director of Finance for Papa John’s International, Inc. Mr. Tucker has more than 20 years of corporate finance experience.
Mr. Melancon has been Senior Vice President of Finance, Controller and Treasurer since November 2013. He was previously Vice President of Finance, Controller and Treasurer from September 2008 to November 2013 and Vice President and Controller from July 2005 to September 2008. Before joining the Company, Mr. Melancon held senior financial positions at several major companies, including Guess?, Inc., Hyper Entertainment, Inc. (a subsidiary of Sony Corporation of America) and Sears, Roebuck and Co. Mr. Melancon has more than 35 years of experience in accounting and finance, including 11 years with Price Waterhouse. As the Company announced in September 2019, Mr. Melancon is expected to leave the Company in January 2020.
Dr. Corrigan has been Vice President and Chief Human Resources Officer since November 2018. She previously served as its Vice President of Human Resources and Total Rewards from 2015 to 2018. Dr. Corrigan was Vice President of Human Resources from 2013 to 2015, and she was Director of Human Resources from 2011 to 2013. She previously held several positions of increasing responsibility in Learning and Development since joining the Company in 1997 as a Training and Development Program Manager and has more than 20 years of experience with the Company in human resources related roles.
Ms. Fox has been Vice President and Chief Development Officer since June 2016. She has overseen development for the Jack in the Box brand since March 2014 (and supervised development at the Company’s two brands, Jack in the Box and Qdoba, from June 2016 until the sale of Qdoba in March 2018). Previously, she held numerous positions for the Jack in the Box brand, including: Division Vice President of Franchise Business Development since September 2013 and Division Vice President of Franchise Sales and Development since June 2011. From February 2011 to June 2011, she was Director of Franchise Business Development, and she previously had the same title in Franchise Sales since October 2010. Ms. Fox served in other capacities since joining the Company in 1997. Before joining Jack in the Box Inc., she was a licensed real estate agent and worked for several companies in the residential real estate industry. Ms. Fox has 27 years of real estate and development experience.
6
Mr. Gordon has been Vice President and Chief Supply Chain Officer since July 2017. He was previously Vice President of Supply Chain Services since October 2012, and Division Vice President of Purchasing from February 2009 to October 2012. Prior to joining the Company in February 2009, Mr. Gordon was Vice President of Supply Chain Management for Potbelly Sandwich Works from December 2005 to February 2009, and he held various positions with Applebee’s International from August 2000 to December 2005, most recently as Executive Director of Procurement. Mr. Gordon also held a number of positions at Prandium, Inc., an operator of multiple restaurant concepts, from October 1994 to August 2000. Mr. Gordon has over 20 years of Supply Chain Management experience.
Mr. Martin has been Vice President and Chief Information Officer since November 2016. He was previously Executive Vice President and Chief Information Officer for Lytx Inc. (formerly DriveCam) from October 2011 to December 2014. He previously held IT leadership positions with Sony Electronics and PepsiCo, and from January 2015 until November 2016, was owner and a principal in Silicon Beach Advisors, a technology strategy consulting firm. Mr. Martin has over 25 years of experience in corporate IT and innovation.
Mr. Tom joined the company as Vice President and Chief Operating Officer in February 2018. Prior to joining the Company in February, Mr. Tom served as the Senior Vice President of Operations for JAB Beech Inc.’s Einstein Bros. Bagels brand from July 2015 to December 2016, and its Caribou Coffee brand from January 2017 to December 2017. From March 2006 to June 2015, Mr. Tom held several positions at Starbucks Coffee Company. From January 2014 to June 2015, he served as Director of Business Operations for all licensed stores in the U.S. and Canada. From May 2012 to December 2013, he served as the Director of Licensed Stores, and from 2006 to 2012 as the Director of Company Stores. Prior to joining Starbucks, Mr. Tom held several positions with YUM Brands International from 1991 to 2006. Mr. Tom has more than 15 years of experience in operation leadership positions in the restaurant industry.
Trademarks and Service Marks
The JACK IN THE BOX® name and logos are of material importance to us and are registered trademarks and service marks in the United States and elsewhere. In addition, we have registered or applied to register numerous service marks and trade names for use in our businesses, including the Jack in the Box design marks and various product names and designs.
Seasonality
Restaurant sales and profitability are subject to seasonal fluctuations because of factors such as vacation and holiday travel, seasonal weather conditions, and weather crises, all of which affect the public’s dining habits.
Competition and Markets
The restaurant business is highly competitive and is affected by local and national economic conditions, including unemployment levels, population and socioeconomic trends, traffic patterns, local and national competitive changes, changes in consumer dining habits and preferences, and new information regarding diet, nutrition, and health, all of which may affect consumer spending habits. Key elements of competition in the industry are the quality and innovation in the food products offered, price and perceived value, quality of service experience (including technological and other innovations), speed of service, personnel, advertising and other marketing efforts, name identification, restaurant location, and image and attractiveness of the facilities.
Each restaurant competes directly and indirectly with a large number of national and regional restaurant chains, some of which have significantly greater financial resources, as well as with locally-owned or independent restaurants in the quick-service and the fast-casual segments, and with other consumer options including grocery and specialty stores, catering, and delivery services. In selling franchises, we compete with many other restaurant franchisors and franchisors generally, some of whom have substantially greater financial resources than we do.
Available Information
The Company’s primary website can be found at www.jackinthebox.com. We make available free of charge at this website (under the caption “Investors — SEC Filings”) all of our reports filed or furnished pursuant to Section 13(a) or 15(d) of the Securities Exchange Act of 1934, including our Annual Report on Form 10-K, our Quarterly Reports on Form 10-Q, our Current Reports on Form 8-K, and amendments to those reports. These reports are made available on the website as soon as reasonably practicable after their filing with, or furnishing to, the Securities and Exchange Commission (“SEC”). You may read and copy any materials we file with the SEC at the SEC’s Public Reference Room at 100 F Street, NE, Washington, DC 20549. You may obtain information on the operation of the Public Reference Room by calling the SEC at 1-800-SEC-0330. The SEC also maintains an Internet site (www.sec.gov) that contains our reports, proxy and information statements, and other information.
7
Regulation
Each restaurant is subject to regulation by federal agencies, as well as licensing and regulation by state and local health, sanitation, safety, fire, zoning, building, consumer protection, taxing, and other agencies and departments. Restaurants are also subject to rules and regulations imposed by owners and operators of shopping centers, airports, or other locations where a restaurant is located. Difficulties or failures in obtaining and maintaining any required permits, licenses or approvals, or difficulties in complying with applicable rules and regulations, could result in restricted operations, closures of existing restaurants, delays or cancellations in the opening of new restaurants, increased cost of operations, or the imposition of fines and other penalties.
We are subject to federal, state, and local laws governing restaurant menu labeling, as well as laws restricting the use of, or requiring disclosures about, certain ingredients used in food sold at our restaurants.
We are also subject to federal and state laws regulating the offer and sale of franchises, as well as judicial and administrative interpretations of such laws. Such laws impose registration and disclosure requirements on franchisors in the offer and sale of franchises and may also apply substantive standards to the relationship between franchisor and franchisee, including limitations on the ability of franchisors to terminate franchises and alter franchise arrangements.
We are subject to the federal Fair Labor Standards Act and various state laws governing such matters as minimum wages, exempt status classification, overtime, breaks and other working conditions for company employees. Our franchisees are subject to these same laws. Many of our food service personnel are paid at rates set in relation to the federal and state minimum wage laws and, accordingly, changes in the minimum wage requirements may increase labor costs for us and our franchisees. Federal and state laws may also require us to provide paid and unpaid leave, or healthcare or other employee benefits to our employees, which could result in significant additional expense to us and our franchisees. We are also subject to federal immigration laws requiring compliance with work authorization documentation and verification procedures.
We are subject to certain guidelines under the Americans with Disabilities Act of 1990 and various state codes and regulations, which require restaurants and our brand to provide full and equal access to persons with physical disabilities.
Our collection or use of personal information about our employees or our guests is regulated at the federal and state levels, including the California Consumer Privacy Act that is due to take effect January 1, 2020.
We are also subject to various federal, state, and local laws regulating the discharge of materials into the environment. The cost of complying with these laws increases the cost of operating existing restaurants and developing new restaurants. Additional costs relate primarily to the necessity of obtaining more land, landscaping, storm drainage control, and the cost of more expensive equipment necessary to decrease the amount of effluent emitted into the air, ground, and surface waters.
In addition to laws and regulations governing restaurant businesses directly, there are also regulations, such as the Food Safety Modernization Act, that govern the practices of food manufacturers and distributors, including our suppliers.
We have processes in place to monitor compliance with applicable laws and regulations governing our company operations.
ITEM 1A. RISK FACTORS
We caution you that our business and operations are subject to a number of risks and uncertainties. The factors listed below are important factors that could cause our actual results to differ materially from our historical results and from projections in the forward-looking statements contained in this report, in our other filings with the SEC, in our news releases, and in oral statements by our representatives. However, other factors that we do not anticipate or that we do not consider significant based on currently available information may also have an adverse effect on our results.
Risks Related to Operating in the Restaurant Industry
We face significant competition in the food service industry and our inability to compete may adversely affect our business.
The food service industry is highly competitive with respect to price, service, location, product offering, image and attractiveness of the facilities, personnel, advertising, brand identification, and food quality. Our competition includes a large number of national and regional restaurant chains, as well as locally owned and independent businesses. In particular, we operate in the quick service restaurant chain segment, in which we face a number of established competitors, as well as frequent new entrants to the segment nationally and in regional markets. Some of our competitors have significantly greater financial, marketing, technological, personnel, and other resources than we do. In addition, many of our competitors have greater name recognition nationally or in some of the local or regional markets in which we have restaurants.
8
Additionally, the trend toward convergence in grocery, deli, delivery, and restaurant services is increasing the number of our competitors. For example, competitive pressures can come from deli sections and in-store cafes of major grocery store chains, including those targeted at customers who desire high-quality food and convenience, as well as from convenience stores and other dining outlets. These competitors may have, among other things, a more diverse menu, lower operating costs and prices, better locations, better facilities, more effective marketing, and more efficient operations than we do. Such increased competition could decrease the demand for our products and negatively affect our sales, operating results, profits, business and financial position, and prospects (collectively, our “financial results”).
While we continue to make improvements to our facilities, to implement new service, technology, and training initiatives, and to introduce new products, there can be no assurance that such efforts will generate increased sales or sufficient customer interest. Many of our competitors are remodeling their facilities, implementing service improvements, introducing a variety of new products and service offerings, and advertising that their ingredients are healthier or locally-sourced. Such competing products and health- or environmental-focused claims may hurt our competitive positioning as existing or potential customers could seek out other dining options.
Changes in demographic trends and in customer tastes and preferences could cause sales and the royalties that we receive from franchisees to decline.
Changes in customer preferences, demographic trends, and the number, type, and location of competing restaurants have great impact in the restaurant industry. Our sales and the revenue that we receive from franchisees could be impacted by changes in customer preferences related to dietary concerns, such as preferences regarding calories, sodium content, carbohydrates, fat, additives, and sourcing, or in response to environmental and animal welfare concerns. Such preference changes could result in customers favoring other foods to the exclusion of our menu items. If we fail to adapt to changes in customer preferences and trends, we may lose customers and our sales and the rents, royalties and marketing fees we receive from franchisees may deteriorate.
Changes in consumer confidence and declines in general economic conditions could negatively impact our financial results.
The restaurant industry depends on consumer discretionary spending. We are impacted by consumer confidence, which is, in turn, influenced by general economic conditions and discretionary income levels. A material decline in consumer confidence or a decline in family “food away from home” spending could cause our financial results to decline. If economic conditions worsen, customer traffic could be adversely impacted if our customers choose to dine out less frequently or reduce the amount they spend on meals while dining out, which could cause our company and our franchised average restaurant sales to decline. An economic downturn may be caused by a variety of factors, such as macro-economic changes, increased unemployment rates, increased taxes, interest rates, or other changes in government fiscal policy. High gasoline prices, increased healthcare costs, declining home prices, and political unrest, foreign or domestic, may potentially contribute to an economic downturn, as may regional or local events, including natural disasters or local regulation. The impact of these factors may be exacerbated by the geographic profile of our brand. Specifically, nearly 70% of our restaurants are located in the states of California and Texas. Economic conditions, state and local laws, or government regulations affecting those states may therefore more greatly impact our results than would similar occurrences in other locations.
In addition, if economic conditions deteriorate or are uncertain for a prolonged period of time, or if our operating results decline unexpectedly, we may be required to record impairment charges, which will negatively impact our results of operations for the periods in which they are recorded. Due to the foregoing or other factors, results for any one quarter are not necessarily indicative of results to be expected for any other quarter or for a full fiscal year. These fluctuations may cause our operating results to be below the expectations of public market analysts and investors and may adversely impact our stock price.
Increases in food and commodity costs could decrease our profit margins or result in a modified menu, which could adversely affect our financial results.
We and our franchisees are subject to volatility in food and commodity costs and availability. Accordingly, our profitability depends in part on our ability to anticipate and react to changes in food costs and availability. As is true of all companies in the restaurant industry, we are susceptible to increases in food costs that are outside of our control. Factors that can impact food and commodity costs include general economic conditions, seasonal fluctuations, weather and climate conditions, global demand, trade protections and subsidies, food safety issues, infectious diseases, possible terrorist activity, currency fluctuations, product recalls, and government regulatory schemes. Additionally, some of our produce, meats, and restaurant supplies are sourced from outside the United States. Any new or increased import duties, tariffs, or taxes, or other changes in U.S. trade or tax policy, could result in higher food and commodity costs that would adversely impact our financial results.
9
Weather and climate related issues, such as freezes or drought, may lead to temporary or even longer-term spikes in the prices of some ingredients such as produce and meats, or of livestock feed. Increasing weather volatility or other long-term changes in global weather patterns, including any changes associated with global climate change, could have a significant impact on the price or availability of some of our ingredients. Any increase in the prices of the ingredients most critical to our menu, such as beef, chicken, pork, tomatoes, lettuce, dairy products, and potatoes could adversely affect our financial results. In the event of cost increases with respect to one or more of our raw ingredients, we may choose to change our pricing or suspend serving a menu item rather than paying the increased cost for the particular ingredient.
We seek to manage food and commodity costs, including through extended fixed price contracts, strong category and commodity management, and purchasing fundamentals. However, certain commodities such as beef and pork, which currently represent approximately 18% and 7%, respectively, of our consolidated commodity spend, do not lend themselves to fixed price contracts. We cannot assure you that we will successfully enter into fixed price contracts on a timely basis or on commercially favorable pricing terms. In addition, although our produce contracts contain pre-determined price limits, we are subject to force majeure clauses resulting from weather or acts of God that may result in temporary spikes in costs.
Further, we cannot assure you that we or our franchisees will be able to successfully anticipate and react effectively to changing food and commodity costs by adjusting purchasing practices or menu offerings. We and our franchisees also may not be able to pass along price increases to our customers as a result of adverse economic conditions, competitive pricing, or other factors. Therefore, variability of food and other commodity costs could adversely affect our profitability and results of operations.
Failure to receive scheduled deliveries of high quality food ingredients and other supplies could harm our operations and reputation.
Dependence on frequent deliveries of fresh produce and other food products subjects food service businesses such as ours to the risk that shortages or interruptions in supply could adversely affect the availability, quality or cost of ingredients or require us to incur additional costs to obtain adequate supplies. Deliveries of supplies may be affected by adverse weather conditions, natural disasters, labor shortages, or financial or solvency issues of our distributors or suppliers, product recalls, or other issues. Further, increases in fuel prices could result in increased distribution costs. In addition, if any of our distributors, suppliers, vendors, or other contractors fail to meet our quality or safety standards or otherwise do not perform adequately, or if any one or more of them seeks to terminate its agreement or fails to perform as anticipated, or if there is any disruption in any of our distribution or supply relationships or operations for any reason, our business reputation, financial condition, and results of operations may be materially affected.
We have a limited number of suppliers for our major products and rely on a distribution network with a limited number of distribution partners for the majority of our national distribution program in the United States. If our suppliers or distributors are unable to fulfill their obligations under their contracts, it could harm our operations.
We contract with a distribution network with a limited number of distribution partners located throughout the nation to provide the majority of our food distribution services in the United States. Through these arrangements, our food supplies are largely distributed through several primary distributors. If any of these relationships are interrupted or terminated, or if one or more supply or distribution partners are unable or unwilling to fulfill their obligations for whatever reasons, product availability to our restaurants may be interrupted, and business and financial results may be negatively impacted. Although we believe that alternative supply and distribution sources are available, there can be no assurance that we will be able to identify or negotiate with such sources on terms that are commercially reasonable to us.
Food safety and food-borne illness concerns may have an adverse effect on our business by reducing demand and increasing costs.
Food safety is a top priority for our company, and we expend significant resources on food safety programs to ensure that our customers are able to enjoy safe and high quality food products. These include a daily, structured food safety assessment and documentation process at our restaurants, and periodic third-party and internal audits to review the food safety performance of our vendors, distributors and restaurants. Nonetheless, food safety risks cannot be completely eliminated, and food safety and food-borne illness issues do occur in the food service industry. Any report or publicity linking us to instances of food-borne illness or other food safety issues, including issues involving food tampering, natural or foreign objects, or other contaminants or adulterants in our food, could adversely affect our reputation, as well as our financial results. Furthermore, our reliance on food suppliers and distributors increases the risk that food-borne illness incidents could be introduced by third-party vendors outside our direct control. Although we test and audit these activities, we cannot guarantee that all food items are safely and properly maintained during transport or distribution throughout the supply chain.
10
Additionally, past reports linking nationwide or regional incidents of food-borne illnesses such as salmonella, E. coli, and listeria to certain products such as produce and proteins, or human-influenced illness such as hepatitis A or norovirus, have resulted in consumers avoiding certain products and restaurant concepts for a period of time. Similarly, reaction to media-influenced reports of avian flu, incidents of “mad cow” disease, or similar concerns have also caused some consumers to avoid products that are, or are suspected of being, affected and could have an adverse effect on the price and availability of affected ingredients. Further, if we react to these problems by changing our menu or other key aspects of the brand experience, we may lose customers who do not accept those changes, and we may not be able to attract enough new customers to generate sufficient revenue to make our restaurants profitable.
Our restaurants currently have an ingredient mix that can be exposed to one or more food allergens, such as eggs, wheat, milk, fish, shellfish, tree nuts, peanuts, and soy. We employ precautionary allergen training steps for food handlers in order to minimize risk of allergen cross contamination and we post allergen information on nutritional posters in our restaurants or otherwise make such information available to guests upon request. Even with such precautionary measures, the potential risk of allergen cross contamination exists in a restaurant environment. A potentially serious allergic reaction by a guest may result in adverse public communication, media coverage, a decline in restaurant sales, and a material decline in our financial results.
Negative publicity relating to our business or industry could adversely impact our reputation.
Our business can be materially and adversely affected by widespread negative publicity of any type, particularly regarding food quality, food safety, nutritional content, safety or public health issues (such as outbreaks, epidemics, or the prospect of a pandemic), obesity or other health concerns, animal welfare issues, and employee relations issues, among other things. Adverse publicity in these areas could damage the trust customers place in our brand. The increasingly widespread use of mobile communications and social media platforms has amplified the speed and scope of adverse publicity and could hamper our ability to promptly correct misrepresentations or otherwise respond effectively to negative publicity, whether or not accurate. Any widespread negative publicity regarding the company, our brand, our vendors and suppliers, and our franchisees, or negative publicity about the restaurant industry in general, whether or not accurate, could cause a decline in restaurant sales, and could have a material adverse effect on our financial results.
Additionally, employee or customer claims against us or our franchisees based on, among other things, wage and hour violations, discrimination, harassment, or wrongful termination may also create negative publicity that could adversely affect us and divert financial and management resources that would otherwise be focused on the future performance of our operations. Consumer demand for our products could decrease significantly if any such incidents or other matters create negative publicity or otherwise erode consumer confidence in us, our brand or our products, or in the restaurant industry in general.
We are also subject to the risk of negative publicity associated with animal welfare regulations and campaigns. Our restaurants utilize ingredients manufactured from beef, poultry, and pork. Our policies require that our approved food suppliers and their raw material providers engage in proper animal welfare practices. Despite our policies and efforts, media reports and portrayals of inhumane acts toward animals by participants in the food supply chain, whether by our suppliers or not, can create a negative opinion or perception of the food industry’s animal welfare efforts. Such media reports and negative publicity could impact guest perception of our brand or industry, and can have a material adverse effect on our financial results.
Our business could be adversely affected by increased labor costs.
Labor is a primary component of our operating costs. Increased labor costs due to factors such as competition for workers, labor market pressures, increased minimum wage requirements, paid sick leave or vacation accrual mandates, or other legal or regulatory changes, such as predictive scheduling, may adversely impact operating costs for us and our franchisees. Additional taxes or requirements to incur additional employee benefit costs, including the requirements of the Patient Protection and Affordable Care Act (the “Affordable Care Act”) or any new or replacement healthcare requirements, could also adversely impact our operating costs. Moreover, if restaurant managers do not schedule our restaurant crews efficiently, our restaurants may be overstaffed at some times, which adversely impacts our labor costs as a percentage of sales, decreasing our operating margins.
The enactment of additional state or local minimum wage increases above federal wage rates or regulations related to non-exempt employees has increased and could continue to increase labor costs for employees across our system-wide operations, especially considering our concentration of restaurants in California.
11
Inability to attract, train and retain top-performing personnel could adversely impact our financial results or business.
We believe that our continued success will depend, in part, on our ability to attract and retain the services of skilled personnel, from our senior management to our restaurant employees. The loss of the services of, or our inability to attract and retain, such personnel could have a material adverse effect on our business. We believe good managers and crew are a key part of our success, and we devote significant resources to recruiting and training our restaurant managers and crew. We aim to reduce turnover among our restaurant crews and managers in an effort to retain top performing employees and better realize our investment in training new employees. Any failure to do so may adversely impact our operating results by increasing training costs and making it more difficult to deliver outstanding customer service, which could have a material adverse effect on our financial results. In addition, we previously announced that key members of executive management will be leaving the Company in early 2020. The loss of these key executives or any additional members of our executive management team or an inability to effectively plan for and implement a succession plan for key management could negatively impact our business.
We may not have the same resources as our competitors for marketing, advertising, and promotion.
Some of our competitors have greater financial resources, which enable them to: invest significantly more than us in advertising, particularly television and radio ads, as well as endorsements and sponsorships; have a presence across more media channels; and support multiple system and regional product launches at one time. Should our competitors increase spending on marketing, advertising, and promotion, or should the cost of advertising increase or our advertising funds decrease for any reason (including reduced sales, implementation of reduced spending strategies, or a decrease in the percentage contribution to the marketing fund for any reason), our results of operations and financial condition may be materially impacted.
In addition, our financial results may be harmed if our marketing, advertising, and promotional programs are less effective than those of our competitors. The growing prevalence and importance of social media platforms, behavioral advertising, and mobile technology also pose challenges and risks for our marketing, advertising, and promotional strategies; and failure to effectively use and gain traction on these platforms or technologies could cause our advertising to be less effective than our competitors. Moreover, improper or damaging use of social media or mobile technology, including by our employees, franchisees, or guests could increase our costs, lead to litigation, or result in negative publicity, all of which could have a material adverse effect on our financial results.
We may be adversely impacted by severe weather conditions, natural disasters, terrorist acts, or civil unrest that could result in property damage, injury to employees and staff, and lost restaurant sales.
Food service businesses such as ours can be materially and adversely affected by severe weather conditions, such as severe storms, hurricanes, flooding, prolonged drought, or protracted heat or cold waves, and by natural disasters, such as earthquakes and wild fires, or “man-made” calamities such as terrorist incidents or civil unrest, and their aftermath. Such occurrences could result in lost restaurant sales, property damage, lost products, interruptions in supply, and increased costs.
If systemic or widespread adverse changes in climate or weather patterns occur, we could experience more severe impact, which could have a material adverse effect on our financial results. The impact of these factors may be exacerbated by our geographic profile, as nearly 70% of the restaurants in our Jack in the Box system are located in the states of California and Texas.
12
Risks Related to Our Business Strategy
We may not achieve our development goals.
We intend to grow the brand primarily through new restaurant development by franchisees, both in existing markets and in new markets. Development involves substantial risks, including the risk of:
• | the inability to identify suitable franchisees; |
• | limited availability of financing for the Company and for franchisees at acceptable rates and terms; |
• | development costs exceeding budgeted or contracted amounts; |
• | delays in completion of construction; |
• | the inability to identify, or the unavailability of suitable sites at acceptable cost and other leasing or purchase terms; |
• | developed properties not achieving desired revenue or cash flow levels once opened; |
• | the negative impact of a new restaurant upon sales at nearby existing restaurants; |
• | the challenge of developing in areas where competitors are more established or have greater penetration or access to suitable development sites; |
• | incurring substantial unrecoverable costs in the event a development project is abandoned prior to completion; |
• | impairment charges resulting from underperforming restaurants or decisions to curtail or cease investment in certain locations or markets; |
• | in new geographic markets where we have limited or no existing locations, the inability to successfully expand or acquire critical market presence for our brand, acquire name recognition, successfully market our products or attract new customers; |
• | operating cost levels that reduce the demand for, or raise the cost of, developing new restaurants; |
• | the challenge of identifying, recruiting, and training qualified franchisees or company restaurant management; |
• | the inability to obtain all required permits; |
• | changes in laws, regulations, and interpretations, including interpretations of the requirements of the Americans with Disabilities Act; |
• | unique regulations or challenges applicable to operating in non-traditional locations, such as airports, and military or government facilities; and |
• | general economic and business conditions. |
Although we manage our growth and development activities to help reduce such risks, we cannot assure that our present or future growth and development activities will perform in accordance with our expectations. Our inability to expand in accordance with our plans or to manage the risks associated with our growth could have a material adverse effect on our results of operations and financial condition.
Our highly franchised business model presents a number of risks, and the failure of our franchisees to operate successful and profitable restaurants could negatively impact our business.
As of September 29, 2019, approximately 94% of our operating restaurant properties were franchised restaurants; therefore, our success increasingly relies on the financial success and cooperation of our franchisees, yet we have limited influence over their operations. Our income arises from two sources: fees from franchised restaurants (e.g., rent and royalties based on a percentage of sales) and, to a lesser degree, sales from our remaining Company-operated restaurants. Our franchisees manage their businesses independently, and therefore are responsible for the day-to-day operation of their restaurants. The revenues we realize from franchised restaurants are largely dependent on the ability of our franchisees to grow their sales. If our franchisees do not experience sales growth, our revenues and margins could be negatively affected as a result. Also, if sales trends worsen for franchisees, their financial results may deteriorate, which could result in, among other things, restaurant closures, or delayed or reduced payments to us. Our refranchising strategy has increased that dependence and the potential effect of those factors.
13
Our success also increasingly depends on the willingness and ability of our independent franchisees to implement shared strategies and major initiatives, which may include financial investment, and to remain aligned with us on operating and promotional plans. Franchisees’ ability to contribute to the achievement of our plans is dependent in large part on the availability to them of funding at reasonable interest rates and may be negatively impacted by the financial markets in general or by the credit worthiness of our franchisees or the Company. As small businesses, some of our franchise operators may be negatively and disproportionately impacted by strategic initiatives, capital requirements, inflation, labor costs, employee relations issues, or other causes. In addition, franchisees’ business obligations may not be limited to the operation of Jack in the Box restaurants, making them subject to business and financial risks unrelated to the operation of our restaurants. These unrelated risks could adversely affect a franchisee’s ability to make payments to us or to make payments on a timely basis. We cannot assure you that our franchisees will successfully participate in our strategic or marketing initiatives or operate their restaurants in a manner consistent with our requirements, standards, and expectations. As compared to some of our competitors, our brand has relatively fewer franchisees who, on average, operate more restaurants per franchisee. There are significant risks to our business if a franchisee, particularly one who operates a large number of restaurants, encounters financial difficulties, including bankruptcy, or fails to adhere to our standards, projecting an image inconsistent with our brand or negatively impacting our financial results.
Our operating performance could also be negatively affected if our franchisees experience food safety or other operational problems or project an image inconsistent with our brand and values, particularly if our contractual and other rights and remedies are limited, costly to exercise, or subjected to litigation and potential delays. If franchisees do not successfully operate restaurants in a manner consistent with our required standards, our brand’s image and reputation could be harmed, which in turn could hurt our business and operating results.
Our ownership mix also affects our results and financial condition. With an increase in the proportion of Jack in the Box franchised restaurants, the percentage of our revenues derived from royalties and rents at franchise restaurants has increased as has the risk that earnings could be negatively impacted by defaults in the payment of royalties and rents. The decision to own restaurants or to operate under franchise agreements is driven by many factors whose interrelationship is complex and changing. Our ability to achieve the benefits of our strategy, of owning a significant higher percentage of franchised restaurants and less company owned restaurants, depends on various factors. Those factors include whether we have effectively selected franchisees that meet our rigorous standards, and whether their performance and the resulting ownership mix supports our brand and financial objectives.
We are subject to financial and regulatory risks associated with our owned and leased properties and real estate development projects.
We own or lease the real properties on which most of our restaurants are located and lease or sublease to the franchisee a majority of our franchised restaurant sites. While we have announced our plan to sell our principal executive offices and consolidate our headquarters into our Innovation Center, we currently still own our principal executives offices and expect to continue to own our Innovation Center and approximately four acres of undeveloped land directly adjacent to the Innovation Center. We have engaged and continue to engage in real estate development projects. As is the case with any owner or operator of real property, we are subject to eminent domain proceedings that can impact the value of investments we have made in real property, and we are subject to other potential liabilities, cost and damages arising out of owning, operating, leasing, or otherwise having interests in real property.
Changes to estimates related to our property, fixtures, and equipment or operating results that are lower than our current estimates at certain restaurant locations may cause us to incur impairment charges on certain long-lived assets, which may adversely affect our results of operations.
In accordance with accounting guidance as it relates to the impairment of long-lived assets, we make certain estimates and projections with regard to individual restaurant operations, as well as our overall performance, in connection with our impairment analyses for long-lived assets. We evaluate our long-lived assets, such as property and equipment, for impairment on an annual basis or whenever events or changes in circumstances indicate that their carrying value may not be recoverable. Impairment evaluations for individual restaurants take into consideration a restaurant’s operating cash flows, the period of time since a restaurant has been opened or remodeled, and the maturity of the related market. The projections of future cash flows used in these analyses require the use of judgment and a number of estimates and projections of future operating results. If actual results differ from our estimates, additional charges for asset impairments may be required in the future. If future impairment charges are significant, our financial results would be adversely affected.
Our tax provision may fluctuate due to changes in expected earnings.
Our income tax provision is sensitive to expected earnings and, as those expectations change, our income tax provisions may vary from quarter-to-quarter and year-to-year. In addition, we may occasionally take positions on our tax returns that differ from their treatment for financial reporting purposes. The difference in treatment of such positions could have an adverse impact on our effective tax rate.
14
Activities related to our sale of Qdoba, and our refranchising, restructuring, and cost savings initiatives entail various risks and may negatively impact our financial results.
We are continuously seeking the most cost-effective means and structure to serve our customers, protect our shareholders, and respond to changes in our markets. Over the past several years, we have refranchised a substantial portion of our Jack in the Box restaurants and during 2018 completed the sale of our Qdoba brand. Consistent with these changes, we engaged in restructuring the remaining organization in an effort to reduce overhead costs. As a result, we incurred significant restructuring costs and additional restructuring costs could be incurred, which may vary significantly from year to year depending on the scope of such activities. Such restructuring costs and expenses could adversely impact our financial results.
Moreover, as we continue with those cost saving initiatives, the existing risks we face in our business may be intensified. These also depend upon a variety of factors, including our ability to achieve efficiencies. If these various initiatives are not successful, take longer to complete than initially projected, or are not well executed, or if our cost reduction efforts adversely impact our effectiveness, our business operations, financial results, and results of operations could be adversely affected.
General Business Risks
We are subject to the risk of cybersecurity breaches, intrusions, data loss, or other data security incidents.
We and our franchisees rely on computer systems and information technology to conduct our business. We have instituted controls, including information security governance controls that are intended to protect our computer systems, our point of sale (“POS”) systems, and our information technology systems and networks; and adhere to payment card industry data security standards and limit third party access for vendors that require access to our restaurant networks. We also have business continuity plans that attempt to anticipate and mitigate failures. However, we cannot control or prevent every cybersecurity risk.
A material failure or interruption of service, or a breach in the security of our computer systems caused by malware, ransomware or other attack, could cause reduced efficiency in operations, or other business interruptions; could negatively impact delivery of food to restaurants, or financial functions such as vendor payment, employee payroll, franchise operations reporting, or our ability to receive customer payments through our POS or other systems, or could result in the loss or misappropriation of customer or employee data. Such events could negatively impact cash flows or require significant capital investment to rectify; result in damage to our business or reputation or loss of consumer or employee confidence; and lead to potential costs, fines and litigation. These risks may be magnified by increased and changing regulations. The costs of compliance and risk mitigation planning, including increased investment in technology or personnel in order to protect valuable business or consumer information, have increased significantly in recent years, and may also negatively impact our financial results.
Restaurants and other retailers have faced, and we could in the future become subject to, claims for purportedly fraudulent transactions arising out of the actual or alleged theft of credit or debit card information or the loss of personally identifiable information, and we may also be subject to lawsuits or other proceedings in the future relating to these types of incidents. Any such proceedings could distract our management from running our business and cause us to incur significant unplanned losses and expenses. Consumer perception of our brand could also be negatively affected by these events, which could further adversely affect our financial results.
We collect and maintain personal information about our employees and our guests, and are seeking to provide our guests with new digital experiences. These digital experiences will require us to open up access into our Point of Sale systems to allow for capabilities like mobile order and pay, third party delivery, and digital menu boards. The collection and use of personal information is regulated at the federal and state levels; such regulations include the California Consumer Privacy Act that is due to take effect January 1, 2020 and which will require our instituting new processes and protections. We increasingly rely on cloud computing and other technologies that result in third parties holding significant amounts of customer or employee information on our behalf. There has been an increase over the past several years in the frequency and sophistication of attempts to compromise the security of these types of systems. If the security and information systems that we or our outsourced third-party providers use to store or process such information are compromised or if we, or such third parties, otherwise fail to comply with applicable laws and regulations, we could face litigation and the imposition of penalties that could adversely affect our financial performance. Our reputation as a brand or as an employer could also be adversely affected by these types of security breaches or regulatory violations, which could impair our ability to attract and retain qualified employees.
15
If we fail to maintain an effective system of internal controls, we may not be able to accurately determine our financial results or prevent fraud. As a result, the Company’s stockholders could lose confidence in our financial results, which could harm our business and the value of the Company’s common shares.
Effective internal controls are necessary for us to provide reliable financial reports and effectively prevent fraud. Section 404 of the Sarbanes-Oxley Act of 2002 requires us to evaluate and report on our internal controls over financial reporting. During the fourth quarter of fiscal 2019, management identified a material weakness in internal control related to ineffective information technology general controls (ITGCs) as further disclosed in Part II, Item 9A. As a result, management concluded that our internal control over financial reporting was not effective as of the end of our fiscal year 2019. We are implementing remedial measures and, while there can be no assurance that our efforts will be successful, we plan to remediate the material weakness during fiscal 2020. We cannot be certain that we will be successful in maintaining adequate internal controls over our financial reporting and financial processes in the future. We may in the future discover areas of our internal controls that need improvement. Furthermore, to the extent our business grows or significantly changes, our internal controls may become more complex, and we would require significantly more resources to ensure our internal controls remain effective. If we or our independent auditors discover a material weakness, the disclosure of that fact, even if quickly remedied, could reduce the market value of the Company’s common stock. Additionally, the existence of any material weakness may require management to devote significant time and incur significant expense to remediate any such material weaknesses and management may not be able to remediate any such material weaknesses in a timely manner.
We may not be able to adequately protect our intellectual property, which could harm the value of our brand and adversely affect our business.
Our ability to successfully implement our business strategy depends, in part, on our ability to further build brand recognition using our trademarks, service marks, trade dress, and other proprietary intellectual property, including our name and logos, our strategy, and the ambiance of our restaurants. If our efforts to protect our intellectual property are inadequate, or if any third party misappropriates or infringes our intellectual property, either in print or on the Internet or a social media platform, the value of our brand may be harmed, which could have a material adverse effect on our business and might prevent our brand from achieving or maintaining market acceptance.
We franchise our brand to various franchisees. While we try to ensure that the quality of our brand is maintained by all franchisees, we cannot assure that all franchisees will uphold brand standards so as not to harm the value of our intellectual property or our reputation.
Jack in the Box may be subject to risk associated with disagreements with key stakeholders, such as franchisees.
In addition to its shareholders, Jack in the Box has several key stakeholders, including its independent franchise operators. Third parties such as franchisees are not subject to the control of the Company and may take actions or behave in ways that are adverse to the Company. Because the ultimate interests of franchisees and the Company are largely aligned around maximizing restaurant profits, the Company does not believe that any areas of disagreement between the company and franchisees are likely to create material risk to the Company or its shareholders. Nevertheless, it is possible that conflict and disagreements with these or other critical stakeholders could distract management or otherwise have a material adverse effect on the Company’s business.
16
The securitized debt instruments issued by certain of our wholly-owned subsidiaries have restrictive terms, and any failure to comply with such terms could result in default, which could harm the value of our brand and adversely affect our business.
The Series 2019-1 Senior Notes are subject to a series of covenants and restrictions customary for transactions of this type, including (i) that the Master Issuer maintains specified reserve accounts to be used to make required payments in respect of the Series 2019-1 Senior Notes, (ii) provisions relating to optional and mandatory prepayments and the related payment of specified amounts, including specified make-whole payments in the case of the Series 2019-1 Class A-2 Notes under certain circumstances, (iii) certain indemnification payments in the event, among other things, the assets pledged as collateral for the Series 2019-1 Senior Notes are in stated ways defective or ineffective and (iv) covenants relating to record keeping, access to information and similar matters. The Series 2019-1 Senior Notes are also subject to customary rapid amortization events provided for in the Indenture, including events tied to failure to maintain stated debt service coverage ratios, the sum of global gross sales for specified restaurants being below certain levels on certain measurement dates, certain manager termination events, an event of default, and the failure to repay or refinance the Series 2019-1 Class A-2 Notes on the applicable scheduled maturity date. The Series 2019-1 Senior Notes are also subject to certain customary events of default, including events relating to non-payment of required interest, principal, or other amounts due on or with respect to the Series 2019-1 Senior Notes, failure to comply with covenants within certain time frames, certain bankruptcy events, breaches of specified representations and warranties, failure of security interests to be effective, and certain judgments.
In the event that a rapid amortization event occurs under the Indenture (including, without limitation, upon an event of default under the Indenture or the failure to repay the securitized debt at the end of the applicable term) which would require repayment of the Series 2019-1 Senior Notes, the funds available to us would be reduced or eliminated, which would in turn reduce our ability to operate and/or grow our business. If our subsidiaries are not able to generate sufficient cash flow to service their debt obligations, they may need to refinance or restructure debt, sell assets, reduce or delay capital investments, or seek to raise additional capital. If our subsidiaries are unable to implement one or more of these alternatives, they may not be able to meet debt payment and other obligations which could have a material adverse effect on our financial condition.
We have a significant amount of debt outstanding. Such indebtedness, along with the other contractual commitments of our Company or its subsidiaries, could adversely affect our business, financial condition and results of operations, as well as the ability of certain of our subsidiaries to meet debt payment obligations.
Under the Indenture, the Master Issuer has $1.3 billion of outstanding debt as of September 29, 2019. Additionally, the Master Issuer has the ability to borrow amounts from time to time on a revolving basis, up to an aggregate principal amount of $150.0 million pursuant to the Series 2019-1 Class A-1 Notes.
This level of debt could have certain material adverse effects on the Company, including but not limited to:
• | our available cash flow in the future to fund working capital, capital expenditures, acquisitions, and general corporate or other purposes could be impaired, and our ability to obtain additional financing for such purposes is limited; |
• | a substantial portion of our cash flows could be required for debt service and, as a result, might not be available for our operations or other purposes; |
• | any substantial decrease in net operating cash flows or any substantial increase in expenses could make it difficult for us to meet our debt service requirements or could force us to modify our operations or sell assets; |
• | our ability to operate our business and our ability to repurchase stock or pay cash dividends to our stockholders may be restricted by the financial and other covenants set forth in the Indenture. |
• | our ability to withstand competitive pressures may be decreased; and |
• | our level of indebtedness may make us more vulnerable to economic downturns and reduce our flexibility in responding to changing business, regulatory, and economic conditions. |
The ability to meet payment and other obligations under the debt instruments of our subsidiaries depends on our ability to generate significant cash flow in the future. Our business may not generate cash flow from operations, and there can be no assurances that future borrowings will be available to us in an amount sufficient to enable our subsidiaries to meet our debt payment obligations and to fund other liquidity needs. If our subsidiaries are not able to generate sufficient cash flow to service our debt obligations, our subsidiaries may need to refinance or restructure debt, sell assets, reduce or delay capital investments, or seek to raise additional capital. If our subsidiaries are unable to implement one or more of these alternatives, they may not be able to meet debt payment and other obligations, which could have a material adverse effect on our financial condition.
In addition, we may incur additional indebtedness in the future. If new debt or other liabilities are added to our current consolidated debt levels, the related risks that it now faces could intensify.
17
The securitization transaction documents impose certain restrictions on our activities or the activities of our subsidiaries, and the failure to comply with such restrictions could adversely affect our business.
The Indenture and the management agreement entered into between certain of our subsidiaries and the Indenture trustee (the “Management Agreement”) contain various covenants that limit our and our subsidiaries’ ability to engage in specified types of transactions. For example, the Indenture and the Management Agreement contain covenants that, among other things, restrict, subject to certain exceptions, the ability of certain subsidiaries to:
• | incur or guarantee additional indebtedness; |
• | sell certain assets; |
• | alter the business conducted by our subsidiaries; |
• | create or incur liens on certain assets; or |
• | consolidate, merge, sell or otherwise dispose of all or substantially all of the assets held within the securitization entities. |
As a result of these restrictions, we may not have adequate resources or the flexibility to continue to manage the business and provide for growth of the Jack in the Box system, including product development and marketing for the Jack in the Box brand, which could adversely affect our future growth prospects, financial condition, results of operations and liquidity.
Changes in accounting standards may negatively impact our results of operations.
Changes in accounting standards, policies, or related interpretations by accountants or regulatory entities may negatively impact our financial results. In fiscal 2020 we will adopt a new lease accounting standard that will significantly impact our balance sheet by increasing both our assets and liabilities. Furthermore, the liabilities will have a short-term and long-term component, while the related asset will all be classified as long-term. See Note 1, Nature of Operations and Summary of Significant Accounting Policies, of the notes to the consolidated financial statements for further discussion regarding the effect of new accounting pronouncements to be adopted in future periods. Many accounting standards require management to make subjective assumptions and estimates, such as those required for long-lived assets, retirement benefits, self-insurance, restaurant closing costs, goodwill and other intangibles, legal accruals, and income taxes. Changes in those underlying assumptions and estimates could significantly change our results.
We are subject to increasing legal complexity and may be subject to claims or lawsuits that are costly to defend and could result in our payment of substantial damages or settlement costs.
We are subject to complaints or litigation brought by current or former employees, customers, current or former franchisees, vendors, landlords, shareholders, competitors, government agencies, or others. We assess contingencies to determine the degree of probability and range of possible losses for potential accrual in our financial statements. An estimated loss contingency is accrued if it is probable that a liability has been incurred and the amount of loss can be reasonably estimated. Because lawsuits are inherently unpredictable and unfavorable resolutions could occur, assessing contingencies is highly subjective and requires judgments about future events. We regularly review contingencies to determine the adequacy of the accruals and related disclosures. However, the amount of ultimate loss may differ from these estimates. A judgment that is not covered by insurance or that is significantly in excess of our insurance coverage for any claims could materially adversely affect our financial results. In addition, regardless of whether any claims against us are valid or whether we are found to be liable, claims may be expensive to defend, and may divert management’s attention away from our operations and hurt our performance. Further, adverse publicity resulting from claims against us or our franchisees may harm our business or that of our franchisees.
Unionization activities or labor disputes may disrupt our operations and affect our profitability.
Some or all of our employees or our franchisees’ employees may elect to be represented by labor unions in the future. If a significant number of these employees were to become unionized and collective bargaining agreement terms were significantly different from current compensation arrangements, this could adversely affect our business and financial results or the business and financial results of our franchisees. In addition, a labor dispute or organizing effort involving some or all of our employees or our franchisees’ employees may harm our brand and reputation. Resolution of such disputes may be costly and time-consuming, and thus increase our costs and distract management resources.
Increasing regulatory and legal complexity may adversely affect restaurant operations and our financial results.
Our regulatory environment exposes us to complex compliance and similar risks that could affect our operations and results in material ways. In many of our markets, we are subject to increasing regulation, which has increased our cost of doing business. We are affected by the cost, compliance and other risks associated with the often conflicting and highly prescriptive regulations, including where inconsistent standards imposed by multiple governmental authorities can adversely affect our business and increase our exposure to litigation or governmental investigations or proceedings.
18
Our success depends in part on our ability to manage the impact of new, potential or changing regulations that can affect our business plans and operations. These include regulations affecting product packaging, marketing, the nutritional content and safety of our food and other products, labeling and other disclosure practices. Compliance efforts with those regulations may be affected by the need to comply with different, potentially conflicting laws in different jurisdictions, and the need to rely on the accuracy and completeness of information from third-party suppliers (particularly given varying requirements and practices for testing and disclosure).
Regulatory bodies may enact new laws or promulgate new regulations that are adverse to our business, or they may view matters or interpret laws and regulations differently than they have in the past or in a manner adverse to our business. For example, a recently-enacted law in California purports to codify an employment classification test set forth by the California Supreme Court that established a new standard for determining employee or independent contractor status. Although we would argue that the law does not change the status of franchisees or their employees, it has been suggested that the law could be read to, for example, make franchisors legally liable for the conduct of franchisee employees. Acceptance of this or similar arguments by the courts in California or elsewhere could impact our financial results or affect restaurant operations.
Our insurance may not provide adequate levels of coverage against claims.
We believe that we maintain insurance policies customary for businesses of our size, type, and experience. Historically, through the use of deductibles or self-insurance retentions, we retained a portion of expected losses for our workers’ compensation, general liability, certain employee medical and dental, employment, property, and other claims. However, there are types of losses that we may incur that cannot be insured against or that we believe are not economically reasonable to insure. Such losses could have a material adverse effect on our business and results of operations.
Risks Related to Our Common Stock
Our quarterly results and, as a result, the price of our common stock, may fluctuate significantly and could fall below the expectations of securities analysts and investors due to various factors.
Our quarterly results and the price of our common stock may each fluctuate significantly and could fail to meet the expectations of securities analysts and investors because of factors including:
• | actual or anticipated fluctuations in our operating results; |
• | changes in earnings estimated by securities analysts or our ability to meet those estimates; |
• | the operating and stock price performance of comparable companies; |
• | changes in our stockholder base; |
• | volatility of the stock market in general; |
• | changes to the regulatory and legal environment in which we operate; and |
• | general domestic and worldwide economic conditions. |
As a result of these factors, results for any one quarter are not necessarily indicative of results to be expected for any other quarter or for any year. Same-store sales, system-wide sales, and earnings from continuing operations per share in any particular future period may decrease, or commodity, labor, or other operating costs and selling, general, and administrative expenses may increase. In the future, operating results may fall below the expectations of securities analysts and investors, which could cause the price of our common stock to fall. In addition, the stock market has historically experienced significant price and volume fluctuations. These fluctuations may be unrelated to the operating performance of particular companies. These broad market fluctuations may cause declines in the price of our common stock. The price of our common stock could fluctuate based upon factors that have little or nothing to do with our financial results, and those fluctuations could materially reduce the price of our common stock.
Actions of activist stockholders could cause us to incur substantial costs, divert management’s attention and resources, and have an adverse effect on our business.
From time to time, we may be subject to proposals by stockholders urging us to take certain corporate actions. If activist stockholder activities ensue, our business could be adversely affected because responding to proxy contests and reacting to other actions by activist stockholders can be costly and time-consuming, disrupt our operations and divert the attention of management and our employees. For example, we may be required to retain the services of various professionals to advise us on activist stockholder matters, including legal, financial, and communications advisers, the costs of which may negatively impact our future financial results. In addition, perceived uncertainties as to our future direction, strategy or leadership created as a consequence of activist stockholder initiatives may result in the loss of potential business opportunities, harm our ability to attract new investors, customers, employees, and joint venture partners, and cause our stock price to experience periods of volatility or stagnation.
19
Risks Related to Government Regulations
Governmental regulation, including in one or more of the following areas, may adversely affect our existing and future operations and results, including by harming our ability to profitably operate our restaurants.
Americans with Disabilities Act and Similar State Laws
We are subject to the Americans with Disabilities Act (“ADA”) and similar state laws that give civil rights protections to individuals with disabilities in the context of employment, public accommodations, and other areas. The expenses associated with any modifications we may be required to undertake with respect to our restaurants or services, or any damages, legal fees, and costs associated with litigating or resolving claims under the ADA or similar state laws, could be material.
Food Regulation
The Food Safety Modernization Act signed into law in January 2011, granted the FDA new authority regarding the safety of the entire food system, including through increased inspections and mandatory food recalls. Although restaurants are not directly implicated by these requirements, our suppliers may initiate or otherwise be subject to food recalls or other consequences impacting the availability of certain products, which could result in adverse publicity, or require us to take actions that could be costly for us or otherwise impact our business and financial results.
Local Licensure, Zoning, and Other Regulation
Each of our restaurants is subject to state and local licensing and regulation by health, sanitation, food, and workplace safety and other agencies. We may experience material difficulties, delays, or failures in obtaining the necessary licenses or approvals for new restaurants, which could delay planned restaurant openings. In addition, stringent and varied requirements of local regulators with respect to zoning, land use, and environmental factors could delay or prevent development of new restaurants in particular locations.
Environmental Laws
We are subject to federal, state, and local environmental laws and regulations concerning the discharge, storage, handling, release, and disposal of hazardous or toxic substances, as well as local ordinances restricting the types of packaging we can use in our restaurants. If and to the extent any hazardous or toxic substances are present on or adjacent to any of our restaurant locations, we believe any such contamination would be the responsibility of one or more third parties, and would have been or should be addressed by the responsible party. If the relevant third parties have not or do not address the identified contamination properly or completely, then under certain environmental laws, we could be held liable as an owner or operator to address any remaining contamination, sometimes without regard to whether we knew of, or were responsible for, the release or presence of hazardous or toxic substances. Any such liability could be material. Further, we may not have identified all of the potential environmental liabilities at our properties, and any such liabilities could have a material adverse effect on our financial results. We also cannot predict what environmental laws or laws regarding packaging will be enacted in the future, how existing or future environmental or packaging laws will be administered or interpreted, or the amount of future expenditures that we may need to make to comply with, or to satisfy claims relating to, such laws.
Employment and Immigration Laws
We and our franchisees are subject to the federal labor laws, including the Fair Labor Standards Act, as well as various state and local laws governing such matters as minimum wages, exempt status classification, overtime, breaks, schedules, and other working conditions for employees. Federal, state, and local laws may also require us to provide paid and unpaid leave, healthcare, or other benefits to our employees. Changes in the law, or penalties associated with any failure on our part to comply with legal requirements, could increase our labor costs or result in significant additional expense to us and our franchisees.
20
States in which we operate may adopt new immigration laws or enforcement programs, and the U.S. Congress and the Department of Homeland Security from time to time consider and may implement changes to federal immigration laws, regulations, or enforcement programs. Such changes and enforcement programs may increase our obligations for compliance and oversight, which could subject us to additional costs and make our hiring process more cumbersome. Although we require all workers to provide us with government-specified documentation evidencing their employment eligibility, some of our employees may, without our knowledge, be unauthorized workers. All of our Company employees currently participate in the “E-Verify” program, an Internet-based, free program run by the United States government to verify employment eligibility. However, use of the “E-Verify” program does not guarantee that we will successfully identify all applicants who are ineligible for employment. Unauthorized workers are subject to deportation and may subject us to fines or penalties, and if any of our employees or our franchisees’ employees are found to be unauthorized, we could experience adverse publicity that negatively impacts our brand and may make it more difficult to hire and keep qualified employees. Termination of a significant number of employees who are found to be unauthorized workers may disrupt operations, cause temporary increases in labor costs to train new employees, and result in additional adverse publicity. We could also become subject to fines, penalties, and other costs related to claims that we did not fully comply with all record keeping obligations of federal and state immigration compliance laws. These factors could materially adversely affect our financial results.
Franchising Activities
Our franchising activities are subject to federal regulations administered by the U.S. Federal Trade Commission, laws enacted by a number of states, and rules and regulations promulgated by the U.S. Federal Trade Commission. In particular, we are subject to federal and state laws regulating the offer and sale of franchises, as well as judicial and administrative interpretations of such laws. Such laws impose registration and disclosure requirements on franchisors in the offer and sale of franchises, and may also apply substantive standards to the relationship between franchisor and franchisee, including limitations on the ability of franchisors to terminate franchises and alter franchise arrangements. Failure to comply with new or existing franchise laws, rules, and regulations in any jurisdiction or to obtain required government approvals could negatively affect our ability to grow or expand our franchise business and sell franchises.
The proliferation of federal, state, and local regulations increases our compliance risks, which in turn could adversely affect our business.
The restaurant and retail industries are subject to extensive federal, state, and local laws and regulations, including regulations relating to:
• | the preparation, ingredients, labeling, packaging, advertising, and sale of food and beverages; |
• | building and zoning requirements; |
• | sanitation and safety standards; |
• | employee healthcare, including the implementation and legal, regulatory, and cost implications of the Affordable Care Act; |
• | labor and employment, including minimum wage adjustments, overtime, working conditions, employment eligibility and documentation, sick leave, and other employee benefit and fringe benefit requirements, and changing judicial, administrative, or regulatory interpretations of federal or state labor laws; |
• | the registration, offer, sale, termination, and renewal of franchises; |
• | Americans with Disabilities Act; |
• | payment cards; |
• | climate change, including regulations related to the potential impact of greenhouse gases, water consumption, or taxes on carbon emissions; and |
• | privacy obligations, including the recently passed California Consumer Privacy Act and other new or proposed federal and state regulations. |
The increasing amount and complexity of regulations and their interpretation may increase the costs to us and our franchisees of labor and compliance, and increase our exposure to legal and regulatory claims which, in turn, could have a material adverse effect on our business. While we strive to comply with all applicable existing rules and regulations, we cannot predict the effect on our operations from modifications to the language or interpretations of existing requirements, or to the issuance of new or additional requirements in the future.
21
Legislation and regulations regarding our products and ingredients, including the nutritional content of our products, could impact customer preferences and negatively impact our financial results.
Changes in government regulation and consumer eating habits may impact the ingredients and nutritional content of our menu offerings, or require us to disclose the nutritional content of our menu offerings. For example, a number of states, counties, and cities have enacted menu labeling laws requiring multi-unit restaurant operators to disclose certain nutritional information to customers, or have enacted legislation restricting the use of certain types of ingredients in restaurants. Furthermore, the Affordable Care Act requires chain restaurants to publish calorie information on their menus and menu boards. These and other requirements may increase our expenses, slow customers’ ordering process, or negatively influence the demand for our offerings; all of which can impact sales and profitability.
Compliance with current and future laws and regulations in a number of areas, including with respect to ingredients, nutritional content of our products, and packaging and serviceware may be costly and time-consuming. Additionally, if consumer health regulations change significantly, we may be required to modify our menu offerings or packaging, and as a result, may experience higher costs or reduced demand associated with such changes. Some government authorities are increasing regulations regarding trans-fats and sodium. While we have removed all artificial or “added during manufacturing” trans fats from our ingredients, some ingredients have naturally occurring trans-fats. Future requirements limiting trans-fats or sodium content may require us to change our menu offerings or switch to higher cost ingredients. These actions may hinder our ability to operate in some markets or to offer our full menu in these markets, which could have a material adverse effect on our business. If we fail to comply with such laws and regulations, our business could also experience a material adverse effect.
Failure to obtain and maintain required licenses and permits or to comply with food control regulations could lead to the loss of our food service licenses and, thereby, harm our business.
We are required, as a restaurant business, under state and local government regulations to obtain and maintain licenses, permits, and approvals to operate our businesses. Such regulations are subject to change from time to time. Any failure by us or our franchisees to obtain and maintain these licenses, permits, and approvals could adversely affect our financial results.
ITEM 1B. UNRESOLVED STAFF COMMENTS
None.
ITEM 2. | PROPERTIES |
The following table sets forth information regarding our operating restaurant properties as of September 29, 2019:
Company- Operated | Franchise | Total | |||||||
Company-owned restaurant buildings: | |||||||||
On company-owned land | 9 | 200 | 209 | ||||||
On leased land | 54 | 581 | 635 | ||||||
Subtotal | 63 | 781 | 844 | ||||||
Company-leased restaurant buildings on leased land | 74 | 1,054 | 1,128 | ||||||
Franchise directly-owned or directly-leased restaurant buildings | — | 271 | 271 | ||||||
Total restaurant buildings | 137 | 2,106 | 2,243 | ||||||
22
Our restaurant leases generally provide for fixed rental payments (with cost-of-living index adjustments) plus real estate taxes, insurance, and other expenses. In addition, approximately 14% of our leases provide for contingent rental payments between 1% and 15% of the restaurant’s gross sales once certain thresholds are met. We have generally been able to renew our restaurant leases as they expire at then-current market rates. The remaining terms of ground leases range from less than one year to 49 years, including optional renewal periods. The remaining lease terms of our other leases range from less than one year to 56 years, including optional renewal periods.
As of September 29, 2019, our restaurant leases had initial terms expiring as follows:
Number of Restaurants | ||||||
Fiscal Year | Ground Leases | Land and Building Leases | ||||
2020 – 2024 | 381 | 697 | ||||
2025 – 2029 | 198 | 270 | ||||
2030 – 2034 | 40 | 135 | ||||
2035 and later | 16 | 26 | ||||
Our principal executive offices are located in San Diego, California in an owned facility of approximately 150,000 square feet. We also own our 70,000 square foot Innovation Center and approximately four acres of undeveloped land directly adjacent to it. We plan to sell our principal executive offices and consolidate our headquarters in the Innovation Center, which we believe will be suitable and adequate for our purposes.
ITEM 3. | LEGAL PROCEEDINGS |
See Note 16, Commitments, Contingencies and Legal Matters, of the notes to the consolidated financial statements for a discussion of our legal proceedings.
ITEM 4. | MINE SAFETY DISCLOSURES |
Not applicable.
23
PART II
ITEM 5. | MARKET FOR REGISTRANT’S COMMON EQUITY, RELATED STOCKHOLDER MATTERS, AND ISSUER PURCHASES OF EQUITY SECURITIES |
Market Information. Our common stock is traded on the NASDAQ Global Select Market under the symbol “JACK.” The following table sets forth the high and low sales prices for our common stock during the fiscal quarters indicated, as reported on the NASDAQ Composite:
12 Weeks Ended | 16 Weeks Ended | |||||||||||||||
September 29, 2019 | July 7, 2019 | April 14, 2019 | January 20, 2019 | |||||||||||||
High | $ | 91.30 | $ | 87.84 | $ | 85.32 | $ | 90.49 | ||||||||
Low | $ | 70.77 | $ | 75.80 | $ | 75.80 | $ | 74.19 | ||||||||
12 Weeks Ended | 16 Weeks Ended | |||||||||||||||
September 30, 2018 | July 8, 2018 | April 15, 2018 | January 21, 2018 | |||||||||||||
High | $ | 93.98 | $ | 92.46 | $ | 95.99 | $ | 108.55 | ||||||||
Low | $ | 81.87 | $ | 79.23 | $ | 79.30 | $ | 90.59 | ||||||||
Dividends. In fiscal 2019 and 2018, the Board of Directors declared four cash dividends of $0.40 per share each. Our dividend is subject to the discretion and approval of our Board of Directors and our compliance with applicable law, and depends upon, among other things, our results of operations, financial condition, level of indebtedness, capital requirements, contractual restrictions, and other factors that our Board of Directors may deem relevant.
Stock Repurchases. During fiscal 2019, we repurchased 1.4 million shares of our common stock at an aggregate cost of $125.3 million during the fourth quarter. As of September 29, 2019, there was approximately $175.7 million remaining under the Board-authorized stock-buyback program, which expires in November 2020.
Total number of shares purchased | Average price paid per share | Total number of shares purchased as part of publicly announced programs | Maximum dollar value that may yet be purchased under these programs | |||||||||||
$ | 301,019,892 | |||||||||||||
July 8, 2019 - August 4, 2019 | — | — | — | $ | 301,019,892 | |||||||||
August 5, 2019 - September 1, 2019 | 852,718 | $ | 86.95 | 852,718 | $ | 226,917,560 | ||||||||
September 2, 2019 - September 29, 2019 | 582,223 | $ | 88.89 | 582,223 | $ | 175,702,860 | ||||||||
Total | 1,434,941 | 1,434,941 | ||||||||||||
Stockholders. As of November 15, 2019, there were 485 stockholders of record.
Securities Authorized for Issuance Under Equity Compensation Plans. The following table summarizes the equity compensation plans under which Company common stock may be issued as of September 29, 2019. Stockholders of the Company have approved all plans requiring such approval.
(a) Number of securities to be issued upon exercise of outstanding options, warrants and rights (1) | (b) Weighted-average exercise price of outstanding options (1) | (c) Number of securities remaining for future issuance under equity compensation plans (excluding securities reflected in column (a)) | ||||
Equity compensation plans approved by security holders (2) | 787,141 | $89.54 | 1,821,105 | |||
____________________________
(1) | Includes shares issuable in connection with our outstanding stock options, performance share awards, nonvested stock awards and units, and non-management director deferred stock equivalents. The weighted-average exercise price in column (b) includes the weighted-average exercise price of stock options. |
(2) | For a description of our equity compensation plans, refer to Note 13, Share-Based Employee Compensation, of the notes to the consolidated financial statements. |
24
Performance Graph. The following graph compares the cumulative return to holders of the Company’s common stock at September 30th of each year to the yearly weighted cumulative return of a Peer Group Index and to the Standard & Poor’s (“S&P”) 500 Index for the same period. The below comparison assumes $100 was invested on September 30, 2014 in the Company’s common stock and in the comparison groups and assumes reinvestment of dividends. The Company paid dividends beginning in fiscal 2014. The Company uses a Peer Group to assess the competitive pay levels of our senior executives, and to evaluate program design elements. In light of the Company becoming a single brand following the sale of Qdoba and with our refranchising strategy now complete, the Compensation Committee of our Board of Directors, in consultation with the Committee’s independent compensation consultant, changed its 2019 Peer Group to include companies that have more comparable metrics to us.
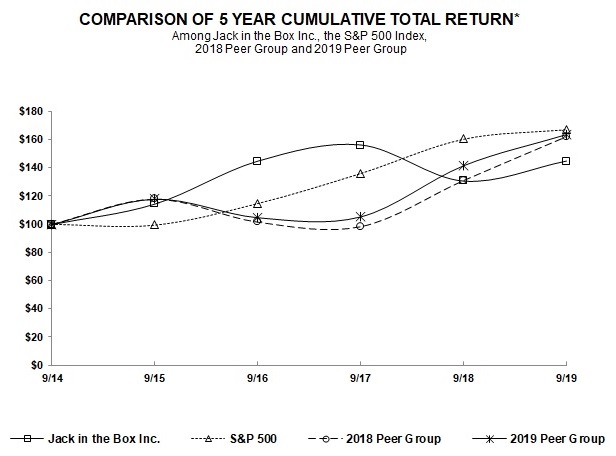
2014 | 2015 | 2016 | 2017 | 2018 | 2019 | |
Jack in the Box Inc. | $100 | $114 | $145 | $156 | $131 | $145 |
S&P 500 Index | $100 | $99 | $115 | $136 | $160 | $167 |
2018 Peer Group (1) | $100 | $118 | $102 | $98 | $131 | $162 |
2019 Peer Group (2) | $100 | $118 | $105 | $105 | $141 | $163 |
____________________________
(1) | The 2018 Peer Group Index comprises the following companies: Brinker International, Inc.; Chipotle Mexican Grill Inc.; Cracker Barrel Old Country Store, Inc.; Dine Brands Global Inc.; Domino’s Pizza, Inc.; Papa John's Int'l, Inc.; Sonic Corp.; The Cheesecake Factory Inc.; and The Wendy’s Company. |
(2) | The 2019 Peer Group Index comprises the following companies: BJ’s Restaurants, Inc.; Bloomin’ Brands, Inc.; Brinker International, Inc.; Chipotle Mexican Grill Inc.; Cracker Barrel Old Country Store, Inc.; Denny’s Corp.; Dine Brands Global Inc.; Domino’s Pizza, Inc.; Dunkin’ Brands Group, Inc.; Papa John's Int'l, Inc.; Red Robin Gourmet Burgers, Inc.; The Cheesecake Factory Inc.; Texas Roadhouse, Inc.; and The Wendy’s Company. |
25
ITEM 6. | SELECTED FINANCIAL DATA |
Our fiscal year is 52 or 53 weeks, ending the Sunday closest to September 30. All years presented below include 52-weeks, except for 2016, which includes 53-weeks. The selected financial data reflects Qdoba Restaurant Corporation as discontinued operations for all fiscal years presented below. This selected financial data should be read in conjunction with our audited consolidated financial statements and accompanying notes and Management’s Discussion and Analysis of Financial Condition and Results of Operations included elsewhere in this Annual Report on Form 10-K. Our consolidated financial information may not be indicative of our future performance.
Fiscal Year | ||||||||||||||||||||
2019 | 2018 | 2017 | 2016 | 2015 | ||||||||||||||||
(dollars and shares in thousands, except per share data) | ||||||||||||||||||||
Statements of Earnings Data (1): | ||||||||||||||||||||
Total revenues (2) | $ | 950,107 | $ | 869,690 | $ | 1,097,291 | $ | 1,162,258 | $ | 1,145,176 | ||||||||||
Operating costs and expenses (2), (3) | $ | 749,250 | $ | 682,407 | $ | 889,912 | $ | 971,995 | $ | 990,178 | ||||||||||
(Gains) losses on the sale of company-operated restaurants | (1,366 | ) | (46,164 | ) | (38,034 | ) | (1,230 | ) | 3,139 | |||||||||||
Total operating costs and expenses, net (2), (3) | $ | 747,884 | $ | 636,243 | $ | 851,878 | $ | 970,765 | $ | 993,317 | ||||||||||
Earnings from continuing operations | $ | 91,747 | $ | 104,339 | $ | 128,573 | $ | 106,473 | $ | 88,001 | ||||||||||
Earnings per Share and Share Data: | ||||||||||||||||||||
Earnings per share from continuing operations (1): | ||||||||||||||||||||
Basic | $ | 3.55 | $ | 3.66 | $ | 4.20 | $ | 3.16 | $ | 2.34 | ||||||||||
Diluted | $ | 3.52 | $ | 3.62 | $ | 4.16 | $ | 3.12 | $ | 2.30 | ||||||||||
Cash dividends declared per common share (1) | $ | 1.60 | $ | 1.60 | $ | 1.60 | $ | 1.20 | $ | 1.00 | ||||||||||
Weighted-average shares outstanding — Basic (1)(4) | 25,823 | 28,499 | 30,630 | 33,735 | 37,587 | |||||||||||||||
Weighted-average shares outstanding — Diluted (1)(4) | 26,068 | 28,807 | 30,914 | 34,146 | 38,215 | |||||||||||||||
Market price at year-end | $ | 90.45 | $ | 83.83 | $ | 101.92 | $ | 95.94 | $ | 79.71 | ||||||||||
Other Operating Data: | ||||||||||||||||||||
Company-operated average unit volume (6) | $ | 2,465 | $ | 2,193 | $ | 1,874 | $ | 1,870 | $ | 1,858 | ||||||||||
Franchise-operated average unit volume (5)(6) | $ | 1,523 | $ | 1,488 | $ | 1,475 | $ | 1,454 | $ | 1,429 | ||||||||||
System average unit volume (5)(6) | $ | 1,614 | $ | 1,553 | $ | 1,543 | $ | 1,530 | $ | 1,510 | ||||||||||
Change in fiscal basis company-operated same-store sales (5) | 1.7 | % | 0.6 | % | (1.3 | )% | — | % | 5.1 | % | ||||||||||
Change in fiscal basis franchise-operated same-store sales (5) | 1.3 | % | 0.1 | % | 0.9 | % | 1.6 | % | 7.0 | % | ||||||||||
Change in fiscal basis system same-store sales (5) | 1.3 | % | 0.1 | % | 0.5 | % | 1.2 | % | 6.5 | % | ||||||||||
Capital expenditures from continuing operations (1) (7) | $ | 47,649 | $ | 37,842 | $ | 38,970 | $ | 52,761 | $ | 57,058 | ||||||||||
Balance Sheet Data (at end of period) (1): | ||||||||||||||||||||
Total assets | $ | 958,483 | $ | 823,397 | $ | 1,234,745 | $ | 1,345,012 | $ | 1,303,979 | ||||||||||
Long-term debt, net of current maturities | $ | 1,274,374 | $ | 1,037,927 | $ | 1,079,982 | $ | 934,972 | $ | 688,579 | ||||||||||
Stockholders’ (deficit) equity (8) | $ | (737,584 | ) | $ | (591,699 | ) | $ | (388,130 | ) | $ | (217,206 | ) | $ | 15,953 | ||||||
____________________________
(1) | Financial data was extracted or derived from our audited consolidated financial statements. |
(2) | Amounts in 2019 include transactions presented gross in our revenues and expenses such as franchise advertising and other services revenue and costs in accordance with ASC 606. |
(3) | Amounts in 2019, 2018, and 2017 exclude all non-service cost components of defined benefit expense. Upon our adoption of ASU 2017-07, these amounts have been presented in a separate caption below “Earnings from operations.” |
(4) | Weighted-average shares reflect the impact of common stock repurchases under Board-approved programs. |
(5) | Changes in same-store sales and average unit volumes are presented for franchise restaurants and on a system-wide basis, which includes company and franchise restaurants. Franchise sales represent sales at franchise restaurants and are revenues of our franchisees. We do not record franchise sales as revenues; however, our royalty revenues and percentage rent revenues are calculated based on a percentage of franchise sales. We believe franchise and system sales growth and average unit volume information is useful to investors as a significant indicator of the overall strength of our business as it incorporates our significant revenue drivers, which are company and franchise same-store sales as well as net unit development. Company, franchise, and system changes in same-store sales include the results of all restaurants that have been open more than one year. |
(6) | 2016 average unit volume is adjusted to exclude the 53rd week for comparison purposes. |
(7) | Amounts in 2016 and 2015 have been recast to include ‘Purchases of assets intended for sale and leaseback’ to conform to all other periods above. |
(8) | In 2016, the Company began to accumulate a stockholders’ deficit related to the execution of our share repurchase programs authorized by our Board of Directors. |
26
ITEM 7. | MANAGEMENT’S DISCUSSION AND ANALYSIS OF FINANCIAL CONDITION AND RESULTS OF OPERATIONS |
GENERAL
For an understanding of the significant factors that influenced our performance during the fiscal year, we believe our Management’s Discussion and Analysis of Financial Condition and Results of Operations (“MD&A”) should be read in conjunction with the consolidated financial statements and related notes included in this annual report as indexed on page F-1.
Comparisons under this heading refer to the 52-week period ended September 29, 2019 and September 30, 2018 for fiscal years 2019 and 2018 respectively, unless otherwise indicated.
Our MD&A consists of the following sections:
• | Overview — a general description of our business and fiscal 2019 highlights. |
• | Financial reporting — a discussion of changes in presentation, if any. |
• | Results of operations — an analysis of our consolidated statements of earnings for fiscal 2019 compared to fiscal 2018. For a comparison of our results of operations for the fiscal 2018 compared to fiscal 2017 can be found under “Item 7. Management’s Discussion and Analysis of Financial Condition and Results of Operations” in our Annual Report on Form 10-K for the fiscal year ended September 30, 2018, filed with the SEC on November 21, 2018. |
• | Liquidity and capital resources — an analysis of our cash flows including pension and postretirement health contributions, capital expenditures, sale of company-operated restaurants, franchise tenant improvement allowance distributions, long-term debt activities, share repurchase activity, dividends, known trends that may impact liquidity, and the impact of inflation, if applicable. |
• | Discussion of critical accounting estimates — a discussion of accounting policies that require critical judgments and estimates. |
• | New accounting pronouncements — a discussion of new accounting pronouncements, dates of implementation, and the impact on our consolidated financial position or results of operations, if any. |
We have included in our MD&A certain performance metrics that management uses to assess company performance and which we believe will be useful in analyzing and understanding our results of operations. These metrics include:
• | Changes in sales at restaurants open more than one year (“same-store sales”), system restaurant sales, franchised restaurant sales, and average unit volumes (“AUVs”). Same-store sales, restaurant sales, and AUVs are presented for franchised restaurants and on a system-wide basis, which includes company and franchise restaurants. Franchise sales represent sales at franchise restaurants and are revenues of our franchisees. We do not record franchise sales as revenues; however, our royalty revenues and percentage rent revenues are calculated based on a percentage of franchise sales. We believe franchise and system same-store sales, franchised and system restaurant sales, and AUV information are useful to investors as they have a direct effect on the Company’s profitability. |
• | Adjusted EBITDA, which represents net earnings on a generally accepted accounting principles (“GAAP”) basis excluding gains or losses from discontinued operations, income taxes, interest expense, net, gains on the sale of company-operated restaurants, impairment and other charges, net, depreciation and amortization, and the amortization of tenant improvement allowances and other. We are presenting Adjusted EBITDA because we believe that it provides a meaningful supplement to net earnings of the Company's core business operating results, as well as a comparison to those of other similar companies. Management believes that Adjusted EBITDA, when viewed with the Company's results of operations in accordance with GAAP and the accompanying reconciliations within MD&A, provides useful information about operating performance and period-over-period change, and provides additional information that is useful for evaluating the operating performance of the Company's core business without regard to potential distortions. Additionally, management believes that Adjusted EBITDA permits investors to gain an understanding of the factors and trends affecting our ongoing cash earnings, from which capital investments are made and debt is serviced. |
Same-store sales, system restaurant sales, franchised restaurant sales, AUVs, and Adjusted EBITDA are not measurements determined in accordance with GAAP and should not be considered in isolation, or as an alternative to earnings from operations, or other similarly titled measures of other companies.
27
OVERVIEW
As of September 29, 2019, we operated and franchised 2,243 Jack in the Box quick-service restaurants, primarily in the western and southern United States, including one in Guam.
We derive revenue from retail sales at Jack in the Box company-operated restaurants and rental revenue, royalties (based upon a percent of sales), franchise fees and contributions for advertising and other services from franchise restaurants. In addition, we recognize gains or losses from the sale of company-operated restaurants to franchisees, which are included as a line item within operating costs and expenses, net, in the accompanying consolidated statements of earnings.
The following summarizes the most significant events occurring in fiscal 2019, and certain trends compared to the prior year:
• | Same-Store and System Sales — System same-store sales increased 1.3%, and system sales increased $38.6 million, or 1.1%, compared with a year ago. Menu price increases and favorable product mix more than offset a decrease in traffic at both company-operated and franchise-operated restaurants. |
• | Company Restaurant Operations — Company restaurant costs as a percentage of company restaurant sales increased to 73.8% from 73.6% in the prior year primarily due to higher labor costs. |
• | Franchise Operations — Excluding the impacts of the adoption of ASC 606 further described below, franchise costs as a percentage of franchise revenues were largely flat compared to prior year. |
• | Securitized Refinancing Transaction — On July 8, 2019, we completed a refinancing of our existing senior credit facility with a new securitized financing facility, comprised of $1.3 billion of senior fixed-rate term notes and $150.0 million of variable funding notes. |
• | Return of Cash to Shareholders — We returned cash to shareholders in the form of share repurchases and quarterly cash dividends. We repurchased 1.4 million shares of our common stock at an average price of $87.33 per share, totaling $125.3 million, including the cost of brokerage fees. We also declared dividends of $1.60 per share totaling $41.4 million. |
• | Restructuring Costs — In 2019, we have continued with our plan to reduce our general and administrative costs by revamping our organization and cost structures. Additionally, in the first quarter of fiscal 2019, we undertook an evaluation of strategic alternatives for the Company (the “Strategic Alternatives Evaluation”) which was concluded on in the third quarter of fiscal 2019. In connection with these activities, we have recorded $8.5 million of restructuring charges, which includes $7.2 million related to severance costs, and $1.3 million related to strategic alternatives. These costs are included in “Impairment and other charges, net,” in the accompanying consolidated statements of earnings. |
• | Adjusted EBITDA — Adjusted EBITDA increased in 2019 to $269.0 million from $264.2 million in 2018. |
FINANCIAL REPORTING
In fiscal 2019, we adopted ASU 2014-09, Revenue Recognition - Revenue from Contracts with Customers (Topic 606) (“ASC 606”), using the modified retrospective method, whereby the cumulative effect of initially adopting the guidance was recognized as an adjustment to beginning retained earnings at October 1, 2018. The comparative information has not been restated and continues to be reported under the accounting standards in effect for those periods. The most significant effects of this transition that affect comparability of our results of operations between 2019 and 2018 include the following:
• | Franchise fee revenue for franchise services will be recognized over the franchise term beginning in 2019 compared to upfront recognition under the previous revenue guidance. |
• | Franchise contributions for advertising and other services are reflected on a gross basis in 2019 compared to a net basis in 2018. Newly created captions “Franchise contributions for advertising and other services” and “Franchise advertising and other services expenses” include the gross-up of respective revenues and expenses; however, the 2018 results have not been restated to conform to current year presentation. |
28
RESULTS OF OPERATIONS FOR FISCAL 2019 AND 2018
The following table presents certain income and expense items included in our consolidated statements of earnings as a percentage of total revenues, unless otherwise indicated. Percentages may not add due to rounding.
Fiscal Year | ||||||
2019 | 2018 | |||||
Revenues: | ||||||
Company restaurant sales | 35.4 | % | 51.5 | % | ||
Franchise rental revenues | 28.7 | % | 29.8 | % | ||
Franchise royalties and other | 17.9 | % | 18.7 | % | ||
Franchise contributions for advertising and other services | 18.0 | % | — | % | ||
Total revenues | 100.0 | % | 100.0 | % | ||
Operating costs and expenses, net: | ||||||
Company restaurant costs (excluding depreciation and amortization): | ||||||
Food and packaging (1) | 29.0 | % | 28.8 | % | ||
Payroll and employee benefits (1) | 29.7 | % | 28.8 | % | ||
Occupancy and other (1) | 15.0 | % | 16.0 | % | ||
Total company restaurant costs (excluding depreciation and amortization) (1) | 73.8 | % | 73.6 | % | ||
Franchise occupancy expenses (excluding depreciation and amortization) (2) | 61.1 | % | 61.1 | % | ||
Franchise support and other costs (3) | 7.1 | % | 7.1 | % | ||
Franchise advertising and other services expenses (4) | 104.3 | % | — | % | ||
Selling, general and administrative expenses | 8.0 | % | 12.1 | % | ||
Depreciation and amortization | 5.8 | % | 6.8 | % | ||
Impairment and other charges, net | 1.3 | % | 2.1 | % | ||
Gains on the sale of company-operated restaurants | (0.1 | )% | (5.3 | )% | ||
Earnings from operations | 21.3 | % | 26.8 | % | ||
Income tax rate (5) | 20.8 | % | 43.9 | % | ||
____________________________
(1) | As a percentage of company restaurant sales. |
(2) | As a percentage of franchise rental revenues. |
(3) | As a percentage of franchise royalties and other. |
(4) | As a percentage of franchise contributions for advertising and other services. |
(5) | As a percentage of earnings from continuing operations and before income taxes. |
The following table summarizes changes in same-store sales for company-owned, franchised, and system-wide restaurants:
2019 | 2018 | |||||
Company | 1.7 | % | 0.6 | % | ||
Franchise | 1.3 | % | 0.1 | % | ||
System | 1.3 | % | 0.1 | % | ||
The following table summarizes the changes in the number and mix of company and franchise restaurants in each fiscal year:
2019 | 2018 | |||||||||||||||||
Company | Franchise | Total | Company | Franchise | Total | |||||||||||||
Beginning of year | 137 | 2,100 | 2,237 | 276 | 1,975 | 2,251 | ||||||||||||
New | — | 19 | 19 | 1 | 11 | 12 | ||||||||||||
Refranchised | — | — | — | (135 | ) | 135 | — | |||||||||||
Closed | — | (13 | ) | (13 | ) | (5 | ) | (21 | ) | (26 | ) | |||||||
End of year | 137 | 2,106 | 2,243 | 137 | 2,100 | 2,237 | ||||||||||||
% of system | 6 | % | 94 | % | 100 | % | 6 | % | 94 | % | 100 | % | ||||||
29
The following table summarizes the restaurant sales for company-owned, franchised, and total system-wide restaurants (in thousands):
2019 | 2018 | ||||||
Company-owned restaurant sales | $ | 336,807 | $ | 448,058 | |||
Franchised restaurant sales (1) | 3,167,920 | 3,018,067 | |||||
System sales (1) | $ | 3,504,727 | $ | 3,466,125 | |||
____________________________
(1) | Franchised restaurant sales represent sales at franchised restaurants and are revenues of our franchisees. System sales include company and franchised restaurant sales. We do not record franchised sales as revenues; however, our royalty revenues, marketing fees and percentage rent revenues are calculated based on a percentage of franchised sales. We believe franchised and system restaurant sales information is useful to investors as they have a direct effect on the Company's profitability. |
Below is a reconciliation of Non-GAAP Adjusted EBITDA to the most directly comparable GAAP measure, net earnings (in thousands):
2019 | 2018 | ||||||
Net earnings - GAAP | $ | 94,437 | $ | 121,371 | |||
Earnings from discontinued operations, net of income taxes | (2,690 | ) | (17,032 | ) | |||
Income taxes | 24,025 | 81,728 | |||||
Interest expense, net | 84,967 | 45,547 | |||||
Gains on the sale of company-operated restaurants | (1,366 | ) | (46,164 | ) | |||
Impairment and other charges, net | 12,455 | 18,418 | |||||
Depreciation and amortization | 55,181 | 59,422 | |||||
Amortization of franchise tenant improvement allowances and other | 1,983 | 862 | |||||
Adjusted EBITDA - Non-GAAP | $ | 268,992 | $ | 264,152 | |||
Company Restaurant Operations
The following table presents company restaurant sales, costs, and restaurant costs as a percentage of the related sales in each fiscal year. Percentages may not add due to rounding (dollars in thousands):
2019 | 2018 | |||||||||||||
Company restaurant sales | $ | 336,807 | $ | 448,058 | ||||||||||
Company restaurant costs: | ||||||||||||||
Food and packaging | 97,699 | 29.0 | % | 128,947 | 28.8 | % | ||||||||
Payroll and employee benefits | 100,158 | 29.7 | % | 129,089 | 28.8 | % | ||||||||
Occupancy and other | 50,613 | 15.0 | % | 71,803 | 16.0 | % | ||||||||
Total company restaurant costs | $ | 248,470 | 73.8 | % | $ | 329,839 | 73.6 | % | ||||||
Company restaurant sales decreased $111.3 million in 2019 as compared with the prior year. In 2019, the decrease was primarily driven by a decrease in the average number of company restaurants resulting from the execution of our refranchising strategy and, to a lesser extent, a decrease in traffic, which was more than offset by menu price increases and favorable changes in product mix. The following table presents the approximate impact of these (decreases) increases on company restaurant sales (in millions):
2019 vs. 2018 | ||||
Decrease in the average number of restaurants | $ | (117.0 | ) | |
AUV increase | 5.7 | |||
Total decrease in company restaurant sales | $ | (111.3 | ) | |
30
Same-store sales at company-operated restaurants increased 1.7% in 2019 compared with 2018 primarily due to menu price increases and favorable product mix, partially offset by a decline in transactions. The following table summarizes the increases (decreases) in company-operated same-store sales:
2019 vs. 2018 | |||
Transactions | (1.4 | )% | |
Average check (1) | 3.1 | % | |
Change in same-store sales | 1.7 | % | |
____________________________
(1) | Includes price increases of approximately 2.5% in 2019. |
Food and packaging costs as a percentage of company restaurant sales increased to 29.0% in 2019 from 28.8% a year ago due primarily to changes in product mix and higher costs for ingredients, partially offset by menu price increases. Commodity costs increased by approximately 2% compared to a year ago, due to increases across the majority of our ingredient costs.
Payroll and employee benefit costs as a percentage of company restaurant sales increased to 29.7% in 2019 compared with 28.8% a year ago due primarily to higher average wages resulting from wage inflation and a highly competitive labor market, and a change in the mix of restaurants due to refranchising.
Occupancy and other costs decreased $21.2 million in 2019 compared to the prior year primarily driven by a decrease in the average number of restaurants impacting occupancy and other costs by approximately $23.0 million. As a percentage of company restaurant sales, occupancy and other costs decreased to 15.0% from 16.0% a year ago due primarily to refranchising and a decrease in maintenance and repair expenses, partially offset by higher costs for insurance, information technology, and delivery fees at the restaurants we continue to operate.
Franchise Operations
The following table presents franchise revenues and costs in each fiscal year and other information we believe is useful in analyzing the change in franchise operating results (dollars in thousands):
2019 | 2018 | |||||||
Franchise rental revenues | $ | 272,815 | $ | 259,047 | ||||
Royalties | 163,047 | 155,939 | ||||||
Franchise fees and other | 6,764 | 6,646 | ||||||
Franchise royalties and other | 169,811 | 162,585 | ||||||
Franchise contributions for advertising and other services | 170,674 | — | ||||||
Total franchise revenues | $ | 613,300 | $ | 421,632 | ||||
Franchise occupancy expenses (excluding depreciation and amortization) | $ | 166,584 | $ | 158,319 | ||||
Franchise support and other costs | 12,110 | 11,593 | ||||||
Franchise advertising and other services expenses | 178,093 | — | ||||||
Total franchise costs | $ | 356,787 | $ | 169,912 | ||||
Franchise costs as a % of total franchise revenues | 58.2 | % | 40.3 | % | ||||
Average number of franchise restaurants | 2,081 | 2,028 | ||||||
% increase | 2.6 | % | ||||||
Franchised restaurant sales | $ | 3,167,920 | $ | 3,018,067 | ||||
Franchise restaurant AUV | $ | 1,523 | $ | 1,488 | ||||
Increase in franchise-operated same-store sales | 1.3 | % | 0.1 | % | ||||
Royalties as a percentage of total franchise restaurant sales | 5.1 | % | 5.2 | % | ||||
Franchise rental revenues increased $13.8 million, or 5.3%, in 2019 versus a year ago due primarily to an increase in the number of franchised restaurants and, to a lesser extent, an increase in franchise same-store sales. The increase in the number of restaurants leased or subleased from the Company due to our refranchising strategy, contributed additional rental revenues of $12.4 million in 2019.
31
Franchise royalties and other increased $7.2 million, or 4.4%, in 2019 compared with the prior year due to an increase in the number of franchised restaurants contributing additional royalties of $7.2 million and, to a lesser extent, an increase in franchise same-store sales. These increases were partially offset by $0.8 million related to quarterly franchise sales incentives provided in the current year and recorded as a reduction of franchise royalties. Upon adoption of ASC 606 in 2019, franchise fees are now recognized over the franchise term compared to upfront recognition in the prior year.
In years prior to 2019, franchise contributions for advertising and other services were shown net with the related disbursements within “Selling, general, and administrative expenses” in our consolidated statement of earnings. In the first quarter of 2019, we adopted ASC 606, which requires these revenues and expenses to be presented gross on our consolidated statement of earnings. Excluding this presentation change, franchise costs as a percentage of total franchise revenues in 2019 would have been 40.4%, compared to 58.2% reported under ASC 606. Refer to Note 1, Nature of Operations and Summary of Significant Accounting Policies, for additional information related to the adoption of this new accounting standard.
Franchise occupancy expenses increased $8.3 million in 2019 versus a year ago due primarily to a net increase in the average number of franchise-operated restaurants resulting from our refranchising strategy. Restaurants refranchised in the prior year contributed additional costs of approximately $7.0 million in 2019.
Franchise support and other costs increased $0.5 million due primarily to an increase of $1.3 million in bad debt expense, partially offset by a $0.9 million decrease in costs associated with franchise remodels.
Depreciation and Amortization
Depreciation and amortization decreased $4.2 million in 2019 as compared with the prior year, primarily due to a decrease in equipment depreciation driven by a decrease in the average number of company-operated restaurants resulting from our refranchising activities in 2018. A decline in depreciation resulting from our franchise building assets becoming fully depreciated also contributed to the decrease.
Selling, General and Administrative (“SG&A”) Expenses
The following table presents the increase (decrease) in SG&A expenses in 2019 compared with the prior year (in thousands):
2019 vs. 2018 | ||||
Advertising | $ | (9,757 | ) | |
Technology fees | (5,804 | ) | ||
Insurance | (5,557 | ) | ||
Cash surrender value of COLI policies, net | (3,364 | ) | ||
Region administration | (2,756 | ) | ||
Legal fees | 1,558 | |||
Other (includes transition services income and savings related to our restructuring plan) | (2,779 | ) | ||
$ | (28,459 | ) | ||
Advertising costs represent company contributions to our marketing fund and are generally determined as a percentage of company-operated restaurant sales. Advertising costs in 2019 decreased primarily due to a decrease in the number of company-operated restaurants resulting from our refranchising efforts. Additionally, discretionary marketing fund contributions decreased by $4.2 million compared to the prior year.
Upon adoption of ASC 606 in 2019, technology fees and costs are recorded on a gross basis within our consolidated statements of earnings within “Franchise contributions for advertising and other services” and “Franchise advertising and other services expenses.”
Insurance costs decreased in 2019 as compared to 2018 primarily due to favorable development factors related to prior year workers’ compensation and general liability claims.
The cash surrender value of our Company-owned life insurance (“COLI”) policies, net of changes in our non-qualified deferred compensation obligation supported by these policies, are subject to market fluctuations. The changes in market values had a positive impact of $3.3 million and was not material in 2018.
Region administration costs decreased in 2019 primarily to workforce reductions related to our refranchising efforts.
32
Impairment and Other Charges, Net
The following table presents the components of impairment and other charges, net, in each fiscal year (in thousands):
2019 | 2018 | |||||||
Restructuring costs | $ | 8,455 | $ | 10,647 | ||||
Costs of closed restaurants and other | 8,628 | 4,803 | ||||||
(Gains) losses on disposition of property and equipment, net | (6,244 | ) | 1,627 | |||||
Accelerated depreciation | 1,616 | 1,130 | ||||||
Operating restaurant impairment charges | — | 211 | ||||||
$ | 12,455 | $ | 18,418 | |||||
Restructuring costs decreased by $2.2 million as a result of lower severance expenses, as our general and administrative cost reduction initiative came to its conclusion as planned. Costs of closed restaurants and other increased by $3.8 million, primarily due to a $3.5 million charge recorded in 2019 related to the write-off of software development costs associated with a discontinued technology project. Gains on disposition of property and equipment, net, increased by $7.9 million, primarily due to a $5.7 million gain related to a sale of property and a $0.8 million gain related to an eminent domain transaction in 2019.
Refer to Note 9, Impairment and Other Charges, Net, of the notes to the consolidated financial statements for additional information regarding these charges.
Gains on the Sale of Company-Operated Restaurants
The following table presents the gains on the sale of company-operated restaurants to franchisees, net, in each fiscal year (dollars in thousands):
2019 | 2018 | |||||||
Number of restaurants sold to Jack in the Box franchisees | — | 135 | ||||||
Gains on the sale of company-operated restaurants | $ | 1,366 | $ | 46,164 | ||||
Gains and losses are impacted by the number of restaurants sold and changes in average gains or losses recognized, which relate to specific sales and cash flows of those restaurants. In 2019, gains on the sale of company-operated restaurants were related to the extension of the underlying franchise and lease agreements from restaurants sold in prior years. Refer to Note 3, Summary of Refranchisings, Franchisee Development and Acquisitions, of the notes to our consolidated financial statements for further information regarding these gains.
Interest Expense, Net
Interest expense, net, is comprised of the following in each fiscal year (in thousands):
2019 | 2018 | |||||||
Interest expense | $ | 86,027 | $ | 46,525 | ||||
Interest income | (1,060 | ) | (978 | ) | ||||
Interest expense, net | $ | 84,967 | $ | 45,547 | ||||
Interest expense, net, increased $39.4 million in 2019 as compared to a year ago primarily due to a charge of $23.6 million from the early termination of our interest rate swaps, as well as an increase in average interest rates and outstanding borrowings, resulting in higher interest costs of approximately $8.4 million and $3.1 million, respectively. Additionally, as a result of our retirement of our credit facility in 2019, we recorded a $2.8 million loss on early extinguishment of debt, primarily consisting of the write-off of unamortized deferred financing costs. Refer to Note 7, Indebtedness, of the notes to our consolidated financial statements for further information regarding our refinancing transaction.
Income Taxes
Our tax rate for our fiscal year ended September 29, 2019 was impacted by the Tax Cuts and Jobs Act (the “Tax Act”), which was enacted into law on December 22, 2017. As a fiscal year taxpayer, the corporate federal rate reduction from 35% to 21% was phased in, resulting in a statutory federal tax rate of 24.5% for our fiscal year ended September 30, 2018, and 21.0% for our fiscal year ended September 29, 2019 and subsequent fiscal years.
33
The income tax provisions reflect effective tax rates of 20.8% and 43.9% of pretax earnings from continuing operations in 2019 and 2018, respectively. In 2019, the major components of the year-over-year change in tax rates were the one-time, non-cash impact of the enactment of the Tax Act in fiscal year 2018, a decrease in the federal statutory tax rate, the impact of the termination of interest rate swap agreements, and the release of a federal tax liability due to expiration of statute of limitations.
Earnings from Discontinued Operations, Net
As described in Note 10, Discontinued Operations, of the notes to our consolidated financial statements, the results of operations from Qdoba have been reported as discontinued operations for all periods presented. Refer to Note 10 for additional information regarding discontinued operations.
LIQUIDITY AND CAPITAL RESOURCES
General
Our primary sources of short-term and long-term liquidity are expected to be cash flows from operations and available financing in place. On July 8, 2019, we completed a refinancing of our existing senior credit facility with a new securitized financing facility, comprised of $1.3 billion of senior fixed-rate term notes and $150.0 million of variable funding notes as further described below.
We generally reinvest available cash flows from operations to enhance existing restaurants, to reduce debt, to repurchase shares of our common stock, and to pay cash dividends. Our cash requirements consist principally of:
• | working capital; |
• | capital expenditures; |
• | income tax payments; |
• | debt service requirements; |
• | franchise tenant improvement allowance distributions; and |
• | obligations related to our benefit plans. |
Based upon current levels of operations and anticipated growth, we expect that cash flows from operations, combined with our new securitized financing facility including our variable funding notes, will be sufficient to meet our capital expenditure, working capital, and debt service requirements for at least the next twelve months and the foreseeable future.
As is common in the restaurant industry, we maintain relatively low levels of accounts receivable and inventories, and our vendors grant trade credit for purchases such as food and supplies. We also continually invest in our business through the addition of new units and refurbishment of existing units, which are reflected as long-term assets and not as part of working capital. As a result, we may at times maintain current liabilities in excess of current assets, which results in a working capital deficit.
Cash Flows
The table below summarizes our cash flows from continuing operations activities for each of the last two fiscal years (in thousands):
2019 | 2018 | |||||||
Total cash provided by (used in) continuing operations: | ||||||||
Operating activities | $ | 168,405 | $ | 104,055 | ||||
Investing activities | (13,819 | ) | 65,661 | |||||
Financing activities | (5,730 | ) | (445,529 | ) | ||||
Net increase (decrease) in cash from continuing operations | $ | 148,856 | $ | (275,813 | ) | |||
Operating Activities. Operating cash flows increased $64.4 million in 2019 compared with 2018 primarily due to favorable changes in working capital of $37.0 million, primarily due to lower income tax payments of $41.3 million, and higher net income adjusted for non-cash items of $27.3 million.
Pension and Postretirement Contributions — Our policy is to fund our pension plans at or above the minimum required by law. As of January 1, 2019, the date of our last actuarial funding valuation for our qualified pension plan, there was no minimum contribution funding requirement. In 2019 and 2018, we contributed $6.2 million and $5.5 million, respectively, to our pension and postretirement plans. We do not anticipate making any contributions to our qualified defined benefit pension plan in fiscal 2020. For additional information, refer to Note 12, Retirement Plans, of the notes to the consolidated financial statements.
34
Investing Activities. Cash flows (used in) provided by investing activities changed from a source of $65.7 million in 2018 to a use of $13.8 million in 2019. This change of $79.5 million primarily resulted from a decrease of $62.9 million in cash proceeds from the sale of company-operated restaurants, including repayments of notes issued in connection with 2018 refranchising transactions, and an increase of $9.8 million in capital expenditures.
Capital Expenditures — The composition of capital expenditures in each fiscal year is summarized in the table below (in thousands):
2019 | 2018 | |||||||
Restaurants: | ||||||||
Restaurant facility expenditures | $ | 9,202 | $ | 17,949 | ||||
Purchases of assets intended for sale or sale and leaseback | 21,660 | 5,497 | ||||||
New restaurants | 1,381 | 2,088 | ||||||
Other, including information technology | 3,597 | 7,572 | ||||||
35,840 | 33,106 | |||||||
Corporate Services: | ||||||||
Information technology | 9,405 | 4,584 | ||||||
Other, including facility improvements | 2,404 | 152 | ||||||
11,809 | 4,736 | |||||||
Total capital expenditures | $ | 47,649 | $ | 37,842 | ||||
Our capital expenditure program includes, among other things, restaurant remodeling, information technology enhancements, and investments in new locations and equipment. In 2019, capital expenditures increased by $9.8 million primarily due to an increase of $16.2 million in purchases of assets intended for sale or sale and leaseback, partially offset by a $8.7 million decrease in restaurant capital maintenance and facility improvement spending mainly from a decrease in the average number of company-operated restaurants compared to the prior year. The increase in purchases of assets intended for sale or sale and leaseback was primarily due to the Company’s purchase of a commercial property in Los Angeles, California, on which an existing company restaurant and another retail tenant are located. The purchase price was $17.3 million, and we currently intend to sell the entire property and lease back the parcel on which our company operated restaurant is located within the next 12 months.
We use sale and leaseback financing to lower the initial cash investment in our restaurants to the cost of the equipment, whenever possible. In addition to the purchase described above, during 2019 and 2018 we exercised our right of first refusal related to four and two leased properties, respectively, which we intend to sell and leaseback within the next 12 months. The following table summarizes the cash flow activity related to these transactions in each fiscal year (dollars in thousands):
2019 | 2018 | |||||||
Number of restaurants sold and leased back | 3 | 5 | ||||||
Proceeds from sale and leaseback of assets | $ | 4,447 | $ | 9,336 | ||||
Purchases of assets intended for sale or sale and leaseback | $ | 21,660 | $ | 5,497 | ||||
Financing Activities. Cash used in financing activities decreased $439.8 million in 2019 compared with 2018, primarily due to higher net borrowings of $303.6 million, primarily due to net proceeds of $255.4 million received in our securitized refinancing transaction, and lower stock repurchases of $188.0 million. These cash proceeds were partially offset by a $23.6 million payment upon the termination of our interest rate swap agreements as a result of the retirement of our senior credit facility.
Securitized financing transaction - On July 8, 2019, Jack in the Box Funding, LLC (the “Master Issuer”), a limited-purpose, bankruptcy-remote, wholly owned indirect subsidiary of the Company, completed its securitization transaction and issued $575.0 million of its Series 2019-1 3.982% Fixed Rate Senior Secured Notes, Class A-2-I (the “Class A-2-I Notes”), $275.0 million of its Series 2019-1 4.476% Fixed Rate Senior Secured Notes, Class A-2-II (the “Class A-2-II Notes”) and $450.0 million of its Series 2019-1 4.970% Fixed Rate Senior Secured Notes, Class A-2-III (the “Class A-2-III Notes”) and together with the Class A-2-I Notes and the Class A-2-II Notes, (the “Class A-2 Notes”), in an offering exempt from registration under the Securities Act of 1933, as amended. In connection with the issuance of the Class A-2 Notes, the Master Issuer also entered into a revolving financing facility of Series 2019-1 Variable Funding Senior Secured Notes, Class A-1 (the “Variable Funding Notes”), which allows for the drawing of up to $150.0 million under the Variable Funding Notes and the issuance of letters of credit. The Class A-2 Notes and the Variable Funding Notes are referred to collectively as the “Notes.”
35
The Notes were issued in a privately placed securitization transaction pursuant to which certain of the Company’s revenue-generating assets, consisting principally of franchise-related agreements, real estate assets, and intellectual property and license agreements for the use of intellectual property, are held by the Master Issuer and certain other limited-purpose, bankruptcy remote, wholly owned indirect subsidiaries of the Company that act as Guarantors (as defined below) of the Notes and that have pledged substantially all of their assets, excluding certain real estate assets and subject to certain limitations, to secure the Notes.
The net proceeds of the sale of the Class A-2 Notes were used to retire the Company’s existing senior credit facility and to pay transaction costs related to the transaction. The Company intends to use remaining proceeds for working capital purposes and general corporate purposes, including a return of capital to our equity holders.
Class A-2 Notes - Interest and principal payments on the Class A-2 Notes are payable on a quarterly basis. In general, no principal payments will be required if a specified leverage ratio, which is a measure of outstanding debt to earnings before interest, taxes, depreciation, and amortization, adjusted for certain items (as defined in the Indenture), is less than or equal to 5.0x. As of September 29, 2019, the Company’s actual leverage ratio was under 5.0x; accordingly, no principal payment on the Class A-2 Notes was required. The legal final maturity date of the Class A-2 Notes is in August 2049, but it is expected that, unless earlier prepaid to the extent permitted under the Indenture, the anticipated repayment dates of the Class A-2-I Notes, the Class A-2-II Notes and the Class A-2-III Notes will be August 2023, August 2026 and August 2029, respectively (the “Anticipated Repayment Dates”). If the Master Issuer has not repaid or refinanced the Class A-2 Notes prior to the respective anticipated repayment date, additional interest will accrue pursuant to the Indenture. The Class A-2 Notes are secured by the collateral described below under “Guarantees and Collateral.”
Variable Funding Notes - The Variable Funding Notes were issued under the Indenture and allow for drawings on a revolving basis and the issuance of letters of credit. Depending on the type of borrowing under the Variable Funding Notes, interest on the Variable Funding Notes will be based on (i) the prime rate, (ii) overnight federal funds rates, (iii) the London interbank offered rate for U.S. Dollars or (iv) the lenders’ commercial paper funding rate plus any applicable margin, as set forth in the Variable Funding Note Purchase Agreement. There is a scaled commitment fee on the unused portion of the Variable Funding Notes facility of between 50 and 100 basis points. It is anticipated that the principal and interest on the Variable Funding Notes will be repaid in full on or prior to August 2024, subject to two one-year extensions at the option of the Company. Following the anticipated repayment date (and any extensions thereof), additional interest will accrue equal to 5.00% per annum. As of September 29, 2019, $45.6 million of letters of credit were outstanding against the Variable Funding Notes, which relate primarily to interest reserves required under the Indenture. The Variable Funding Notes were undrawn at September 29, 2019.
Guarantees and collateral - Pursuant to the Guarantee and Collateral Agreement, dated July 8, 2019 (the “Guarantee and Collateral Agreement”), among the Guarantors, in favor of the trustee, the Guarantors guarantee the obligations of the Master Issuer under the Indenture and related documents and secure the guarantee by granting a security interest in substantially all of their assets. The Notes are secured by a security interest in substantially all of the assets of the Master Issuer and the Guarantors (collectively, the “Securitization Entities”). The assets of the Securitization Entities include most of the revenue-generating assets of the Company and its subsidiaries, which principally consist of franchise-related agreements, certain company-operated restaurants, intellectual property and license agreements for the use of intellectual property. Upon certain trigger events, mortgages will be required to be prepared and recorded on the real estate assets.
Covenants and restrictions - The Notes are subject to a series of covenants and restrictions customary for transactions of this type, including (i) that the Master Issuer maintains specified reserve accounts to be used to make required payments in respect of the Notes, (ii) provisions relating to optional and mandatory prepayments and the related payment of specified amounts, including specified make-whole payments in the case of the Class A-2 Notes under certain circumstances, (iii) certain indemnification payments in the event, among other things, the assets pledged as collateral for the Notes are in stated ways defective or ineffective and (iv) covenants relating to recordkeeping, access to information and similar matters. The Notes are also subject to customary rapid amortization events provided for in the Indenture, including events tied to failure to maintain stated debt service coverage ratios, the sum of global gross sales for specified restaurants being below certain levels on certain measurement dates, certain manager termination events, an event of default, and the failure to repay or refinance the Class A-2 Notes on the applicable scheduled maturity date. The Notes are also subject to certain customary events of default, including events relating to non-payment of required interest, principal, or other amounts due on or with respect to the Notes, failure to comply with covenants within certain time frames, certain bankruptcy events, breaches of specified representations and warranties, failure of security interests to be effective, and certain judgments. As of September 29, 2019, we were in compliance with all of our debt covenant requirements and were not subject to any rapid amortization events.
In accordance with the Indenture, certain cash accounts have been established with the Indenture trustee for the benefit of the note holders, and are restricted in their use. As of September 29, 2019, the Master Issuer had restricted cash of $26.0 million, which primarily represented cash collections and cash reserves held by the trustee to be used for payments of principal, interest and commitment fees required for the Notes.
36
Amended credit facility — On May 1, 2019, we entered into the Fifth Amendment to the Credit Agreement (the “Fifth Amendment”). The Fifth Amendment extended the maturity date of both our term loan and revolving credit facility from March 19, 2020 to March 19, 2021. Fees of $1.3 million were paid to third parties in connection with the Fifth Amendment.
Repurchases of Common Stock — During fiscal 2019, we repurchased 1.4 million shares at an aggregate cost of $125.3 million. As of September 29, 2019, there was approximately $175.7 million remaining under a stock buyback program, which expires in November 2020.
Repurchases of common stock included in our consolidated statement of cash flows for fiscal 2019 includes $14.4 million related to repurchase transactions traded in the prior fiscal year that settled in 2019 and excludes $2.0 million that will be settled in 2020. For additional information, refer to Note 14, Stockholders’ Deficit, of the notes to the consolidated financial statements and Item 5, Market for Registrant’s Common Equity, Related Stockholder Matters and Issuer Purchases of Equity Securities, of this Report.
Dividends — In fiscal 2019 and 2018, the Board of Directors declared four cash dividends of $0.40 per share totaling $41.4 million and $45.7 million, respectively. Future dividends are subject to approval by our Board of Directors.
Off-Balance Sheet Arrangements
We have entered into certain off-balance sheet contractual obligations and commitments in the ordinary course of business, which are recognized in our consolidated financial statements in accordance with U.S. generally accepted accounting principles. The off-balance sheet arrangements that will have a material impact on our future results from operations are disclosed in the Contractual Obligations and Commitments table below. We are not a party to any other off-balance sheet arrangements that have, or are reasonably likely to have, a current or future material effect on our financial condition, changes in financial condition, results of operations, liquidity, capital expenditures or capital resources.
Contractual Obligations and Commitments
The following is a summary of our contractual obligations and commercial commitments as of September 29, 2019 (in thousands):
Payments Due by Fiscal Year | ||||||||||||||||||||
Total | Less than 1 year | 1-3 years | 3-5 years | After 5 years | ||||||||||||||||
Contractual Obligations: | ||||||||||||||||||||
Long-term debt obligations (1) | 1,708,916 | 65,087 | 115,141 | 667,245 | 861,443 | |||||||||||||||
Capital lease obligations | 3,937 | 879 | 1,758 | 1,260 | 40 | |||||||||||||||
Operating lease obligations | 1,094,011 | 193,313 | 332,020 | 205,173 | 363,505 | |||||||||||||||
Purchase commitments (2) | 1,906,900 | 854,100 | 722,900 | 308,400 | 21,500 | |||||||||||||||
Benefit obligations (3) | 74,714 | 15,068 | 13,499 | 13,533 | 32,614 | |||||||||||||||
Total contractual obligations | $ | 4,788,478 | $ | 1,128,447 | $ | 1,185,318 | $ | 1,195,611 | $ | 1,279,102 | ||||||||||
Other Commercial Commitments: | ||||||||||||||||||||
Stand-by letters of credit (4) | $ | 45,600 | $ | 45,600 | $ | — | $ | — | $ | — | ||||||||||
____________________________
(1) | Includes mandatory principal and interest payments on our Class A-2 Notes. Amounts are reflected through the anticipated repayment dates as described further above in “Liquidity and capital resources.” |
(2) | Includes purchase commitments for food, beverage, and packaging items to support system-wide restaurant operations. |
(3) | Includes expected payments associated with our non-qualified defined benefit plan, postretirement healthcare plans and our non-qualified deferred compensation plan through fiscal 2029. |
(4) | Consists primarily of letters of credit for interest reserves required under the Indenture and insurance. |
We maintain a noncontributory defined benefit pension plan (“Qualified Plan”) covering substantially all full-time employees hired before January 1, 2011. Our policy is to fund our Qualified Plan at amounts necessary to satisfy the minimum amount required by law, plus additional amounts as determined by management to improve the plan’s funded status. Contributions beyond fiscal 2019 will depend on pension asset performance, future interest rates, future tax law changes, and future changes in regulatory funding requirements. Based on the funding status of our Qualified Plan as of our last measurement date, there was no minimum contribution required in 2019. For additional information related to our pension plans, refer to Note 12, Retirement Plans, of the notes to the consolidated financial statements.
37
DISCUSSION OF CRITICAL ACCOUNTING ESTIMATES
We have identified the following as our most critical accounting estimates, which are those that are most important to the portrayal of the Company’s financial condition and results, and that require management’s most subjective and complex judgments. Information regarding our other significant accounting estimates and policies are disclosed in Note 1, Nature of Operations and Summary of Significant Accounting Policies, of the notes to the consolidated financial statements.
Long-lived Assets — Property, equipment, and certain other assets, including amortized intangible assets, are reviewed for impairment on an annual basis or whenever events or changes in circumstances indicate that their carrying value may not be recoverable. This review generally includes a restaurant-level analysis, except when we are actively selling a group of restaurants, in which case we perform our impairment evaluations at the group level. Impairment evaluations for individual restaurants take into consideration a restaurant’s operating cash flows, the period of time since a restaurant has been opened or remodeled, refranchising expectations, and the maturity of the related market. Impairment evaluations for a group of restaurants take into consideration the group’s expected future cash flows and sales proceeds from bids received, if any, or fair market value based on, among other considerations, the specific sales and cash flows of those restaurants. If the assets of a restaurant or group of restaurants subject to our impairment evaluation are not recoverable based upon the forecasted, undiscounted cash flows, we recognize an impairment loss as the amount by which the carrying value of the assets exceeds fair value. Our estimates of cash flows used to assess impairment are subject to a high degree of judgment and may differ from actual cash flows due to, among other things, economic conditions or changes in operating performance.
Self-Insurance — We are self-insured for a portion of our losses related to workers’ compensation, general liability and other legal claims, and health benefits. In estimating our self-insurance accruals, we utilize independent actuarial estimates of expected losses, which are based on statistical analysis of historical data. These assumptions are closely monitored and adjusted when warranted by changing circumstances. Should a greater number of claims occur compared to what was estimated, or should medical costs increase beyond what was expected, accruals might not be sufficient, and additional expense may be recorded.
Legal Accruals — The Company is subject to claims and lawsuits in the ordinary course of its business. A determination of the amount accrued, if any, for these contingencies is made after analysis of each matter. We continually evaluate such accruals and may increase or decrease accrued amounts as we deem appropriate. Because lawsuits are inherently unpredictable, and unfavorable resolutions could occur, assessing contingencies is highly subjective and requires judgment about future events. As a result, the amount of ultimate loss may differ from those estimates.
NEW ACCOUNTING PRONOUNCEMENTS
See Note 1, Nature of Operations and Summary of Significant Accounting Policies, of the notes to the consolidated financial statements for a discussion of the impact of new accounting pronouncements on our consolidated financial statements.
ITEM 7A. | QUANTITATIVE AND QUALITATIVE DISCLOSURES ABOUT MARKET RISK |
In connection with the securitized refinancing completed on July 8, 2019, we are only exposed to interest rate risk on borrowings under our $150.0 million variable funding notes. As of September 29, 2019, we had no outstanding borrowings under our variable funding notes. Our fixed rate securitized debt exposes the Company to changes in market interest rates reflected in the fair value of the debt and to the risk that the Company may need to refinance maturing debt with new debt at a higher rate.
We are also exposed to the impact of commodity and utility price fluctuations. Many of the ingredients we use are commodities or ingredients that are affected by the price of other commodities, weather, seasonality, production, availability and various other factors outside our control. In order to minimize the impact of fluctuations in price and availability, we monitor the primary commodities we purchase and may enter into purchasing contracts and pricing arrangements when considered to be advantageous. However, certain commodities remain subject to price fluctuations. We are exposed to the impact of utility price fluctuations related to unpredictable factors such as weather and various other market conditions outside our control. Our ability to recover increased costs for commodities and utilities through higher prices is limited by the competitive environment in which we operate.
ITEM 8. | FINANCIAL STATEMENTS AND SUPPLEMENTARY DATA |
The consolidated financial statements, related financial information, and the Report of Independent Registered Public Accounting Firm required to be filed are indexed on page F-1 and are incorporated herein.
ITEM 9. | CHANGES IN AND DISAGREEMENTS WITH ACCOUNTANTS ON ACCOUNTING AND FINANCIAL DISCLOSURE |
None.
38
ITEM 9A. | CONTROLS AND PROCEDURES |
a. | Conclusion Regarding the Effectiveness of Disclosure Controls and Procedures |
Based on an evaluation of the Company’s disclosure controls and procedures (as defined in Rule 13(a)-15(e) of the Securities Exchange Act of 1934, as amended), as of the end of the Company’s fiscal year ended September 29, 2019, the Company’s Chief Executive Officer and Chief Financial Officer (its principal executive officer and principal financial officer, respectively) have concluded that the Company’s disclosure controls and procedures were not effective due to a material weakness in internal control over financial reporting, identified during the fourth quarter of 2019, described below.
Notwithstanding the material weakness in internal control over financial reporting, management, including the Company’s Chief Executive Officer and Chief Financial Officer, concluded that our consolidated financial statements present fairly, in all material respects, the financial position of the Company as of September 29, 2019 and September 30, 2018, and the results of its operations and its cash flows for the fifty-two weeks ended September 29, 2019, September 30, 2018, and October 1, 2017, in conformity with U.S. generally accepted accounting principles.
b. | Changes in Internal Control Over Financial Reporting |
Except for the material weakness described below, there have been no significant changes in the Company’s internal control over financial reporting that occurred during the Company’s fiscal quarter ended September 29, 2019 that have materially affected, or are reasonably likely to materially affect, the Company’s internal control over financial reporting.
c. | Management’s Report on Internal Control Over Financial Reporting |
Management, including our principal executive officer and principal financial officer, is responsible for establishing and maintaining adequate internal control over financial reporting (as defined in Rule 13a-15(f) under the Exchange Act). The Company’s internal control over financial reporting is designed to provide reasonable assurance regarding the preparation and fair presentation of published financial statements in accordance with U.S. GAAP and includes those policies and procedures that:
• | Pertain to the maintenance of records that, in reasonable detail, accurately and fairly reflect our transactions and the dispositions of our assets; |
• | Provide reasonable assurance that our transactions are recorded as necessary to permit preparation of financial statements in accordance with generally accepted accounting principles, and that our receipts and expenditures are being made in accordance with appropriate authorizations; and |
• | Provide reasonable assurance regarding prevention or timely detection of unauthorized acquisition, use, or disposition of our assets that could have a material effect on our financial statements. |
Because of its inherent limitations, internal control over financial reporting may not prevent or detect misstatements. Therefore, even those systems determined to be effective can provide only reasonable assurance with respect to financial statement preparation and presentation.
Management, under the oversight of our principal executive officer, principal financial officer, and Audit Committee, assessed the effectiveness of the Company’s internal control over financial reporting as of September 29, 2019. In making this assessment, management used the criteria set forth in 2013 by the Committee of Sponsoring Organizations of the Treadway Commission (“COSO”) in Internal Control-Integrated Framework. Based on this assessment, management has concluded that, as of September 29, 2019, the Company’s internal control over financial reporting was not effective because of the effect of the material weakness described below.
A material weakness is a deficiency, or a combination of deficiencies, in internal control over financial reporting, such that there is a reasonable possibility that a material misstatement will not be prevented or detected on a timely basis.
Management identified the following deficiencies in our internal control over financial reporting.
• | We did not maintain effective risk assessment, oversight and monitoring controls over changes in the Company’s information technology (“IT”) environment in connection with the restructuring and outsourcing of certain IT support functions to third party contractors. |
• | We were overly dependent on the knowledge and actions of certain individuals with IT expertise without providing sufficient training and documentation to support other personnel with control responsibilities. |
• | As a consequence, the Company did not maintain effective controls over IT change management for systems that support the Company’s financial reporting process to ensure that program and data changes were tested, approved and implemented appropriately. Automated process-level controls and manual controls dependent upon the accuracy and completeness of information derived from IT systems were also rendered ineffective. |
39
These control deficiencies did not result in any misstatements to our annual consolidated financial statements as of and for the year ended September 29, 2019. However, because they created a reasonable possibility that material misstatements to the consolidated financial statements would not be prevented or detected on a timely basis, we concluded they represented a material weakness and our internal control over financial reporting was not effective as of September 29, 2019.
The Company’s independent registered public accounting firm, KPMG LLP, has issued an adverse opinion on the effectiveness of our internal control over financial reporting, which follows.
d. | Remediation Plan |
We have initiated a remediation plan to address the control deficiencies that led to the material weaknesses. The remediation plan includes:
(i) | developing enhanced risk assessment procedures and controls related to changes in IT systems; |
(ii) | enhancing governance by management of significant and/or unusual changes to the IT environment; |
(iii) | developing and conducting a mandatory annual program addressing IT general controls and policies, including educating control owners concerning the principles and requirements of each control, with a focus on those related to change-management over IT systems; and |
(iv) | implementing an annual requirement for IT personnel to review and acknowledge their understanding of change control policies and procedures. |
40
Report of Independent Registered Public Accounting Firm
To the Stockholders and Board of Directors
Jack in the Box Inc.:
Opinion on Internal Control Over Financial Reporting
We have audited Jack in the Box Inc. and subsidiaries’ (the Company) internal control over financial reporting as of September 29, 2019, based on criteria established in Internal Control – Integrated Framework (2013) issued by the Committee of Sponsoring Organizations of the Treadway Commission. In our opinion, because of the effect of the material weakness, described below, on the achievement of the objectives of the control criteria, the Company has not maintained effective internal control over financial reporting as of September 29, 2019, based on criteria established in Internal Control – Integrated Framework (2013) issued by the Committee of Sponsoring Organizations of the Treadway Commission.
We also have audited, in accordance with the standards of the Public Company Accounting Oversight Board (United States) (PCAOB), the consolidated balance sheets of the Company as of September 29, 2019 and September 30, 2018, the related consolidated statements of earnings, comprehensive income, stockholders’ deficit, and cash flows for each of the fifty-two weeks ended September 29, 2019, September 30, 2018, and October 1, 2017, and the related notes (collectively, the consolidated financial statements), and our report dated November 21, 2019 expressed an unqualified opinion on those consolidated financial statements.
A material weakness is a deficiency, or a combination of deficiencies, in internal control over financial reporting, such that there is a reasonable possibility that a material misstatement of the company’s annual or interim financial statements will not be prevented or detected on a timely basis. The following material weakness has been identified and included in management’s assessment:
The Company did not maintain effective controls over information technology (IT) change management for systems that support the Company’s financial reporting process to ensure that program and data changes were tested, approved and implemented appropriately. Automated process-level controls and manual controls dependent upon the accuracy and completeness of information derived from IT systems were also rendered ineffective. These control deficiencies were a result of ineffective risk assessment, oversight and monitoring controls over changes in the Company’s IT environment in connection with the restructuring and outsourcing of certain IT support functions to third party contractors, and over dependence on the knowledge and actions of certain individuals with IT expertise without providing sufficient training and documentation to support other personnel with control responsibilities.
The material weakness was considered in determining the nature, timing, and extent of audit tests applied in our audit of the fiscal year 2019 consolidated financial statements, and this report does not affect our report on those consolidated financial statements.
Basis for Opinion
The Company’s management is responsible for maintaining effective internal control over financial reporting and for its assessment of the effectiveness of internal control over financial reporting, included in the accompanying Management’s Report on Internal Control Over Financial Reporting (Item 9A(b)). Our responsibility is to express an opinion on the Company’s internal control over financial reporting based on our audit. We are a public accounting firm registered with the PCAOB and are required to be independent with respect to the Company in accordance with the U.S. federal securities laws and the applicable rules and regulations of the Securities and Exchange Commission and the PCAOB.
We conducted our audit in accordance with the standards of the PCAOB. Those standards require that we plan and perform the audit to obtain reasonable assurance about whether effective internal control over financial reporting was maintained in all material respects. Our audit of internal control over financial reporting included obtaining an understanding of internal control over financial reporting, assessing the risk that a material weakness exists, and testing and evaluating the design and operating effectiveness of internal control based on the assessed risk. Our audit also included performing such other procedures as we considered necessary in the circumstances. We believe that our audit provides a reasonable basis for our opinion.
Definition and Limitations of Internal Control Over Financial Reporting
A company’s internal control over financial reporting is a process designed to provide reasonable assurance regarding the reliability of financial reporting and the preparation of financial statements for external purposes in accordance with generally accepted accounting principles. A company’s internal control over financial reporting includes those policies and procedures that (1) pertain to the maintenance of records that, in reasonable detail, accurately and fairly reflect the transactions and dispositions of the assets of the company; (2) provide reasonable assurance that transactions are recorded as necessary to permit preparation of financial statements in accordance with generally accepted accounting principles, and that receipts and expenditures of the company are being made only in accordance with authorizations of management and directors of the company; and (3) provide reasonable assurance regarding prevention or timely detection of unauthorized acquisition, use, or disposition of the company’s assets that could have a material effect on the financial statements.
41
Because of its inherent limitations, internal control over financial reporting may not prevent or detect misstatements. Also, projections of any evaluation of effectiveness to future periods are subject to the risk that controls may become inadequate because of changes in conditions, or that the degree of compliance with the policies or procedures may deteriorate.
/s/ KPMG LLP
San Diego, California
November 21, 2019
42
ITEM 9B. | OTHER INFORMATION |
None.
PART III
ITEM 10. | DIRECTORS, EXECUTIVE OFFICERS AND CORPORATE GOVERNANCE |
That portion of our definitive Proxy Statement appearing under the captions “Election of Directors,” “Director Qualifications and Biographical Information,” “Committees of the Board,” and “Section 16(a) Beneficial Ownership Reporting Compliance” to be filed with the Commission pursuant to Regulation 14A within 120 days after September 29, 2019 and to be used in connection with our 2020 Annual Meeting of Stockholders is hereby incorporated by reference.
Information regarding our executive officers is set forth in Item 1 of Part I of this Report under the caption “Executive Officers.”
That portion of our definitive Proxy Statement appearing under the caption “Committees of the Board - Audit Committee,” relating to the members of the Company’s Audit Committee and the members of the Audit Committee who qualify as financial experts, is also incorporated herein by reference.
That portion of our definitive Proxy Statement appearing under the caption “Stockholder Recommendations and Board Nominations,” relating to the procedures by which stockholders may recommend candidates for director to the Nominating and Governance Committee of the Board of Directors, is also incorporated herein by reference.
We have adopted a Code of Ethics, which applies to all Jack in the Box Inc. directors, officers, and employees, including the Chief Executive Officer, Chief Financial Officer, Controller, and all of the financial team. The Code of Ethics is posted on the Company’s website, www.jackinthebox.com (under the “Investors — Corporate Governance — Code of Conduct” caption) and is available in print free of charge to any stockholder upon request. We intend to satisfy the disclosure requirement regarding any amendment to, or waiver of, a provision of the Code of Ethics for the Chief Executive Officer, Chief Financial Officer, and Controller or persons performing similar functions, by posting such information on our website. No such waivers have been issued during fiscal 2019.
We have also adopted a set of Corporate Governance Principles and Practices for our Board of Directors and charters for all of our Board Committees, including the Audit, Compensation, and Nominating and Governance Committees. The Corporate Governance Principles and Practices and committee charters are available on our website at www.jackinthebox.com and in print free of charge to any shareholder who requests them. Written requests for our Code of Business Conduct and Ethics, Corporate Governance Principles and Practices and committee charters should be addressed to Jack in the Box Inc., 9330 Balboa Avenue, San Diego, California 92123, Attention: Corporate Secretary.
ITEM 11. | EXECUTIVE COMPENSATION |
That portion of our definitive Proxy Statement appearing under the caption “Executive Compensation,” “Director Compensation,” “Compensation Committee Interlocks and Insider Participation,” and “Compensation Committee Report” to be filed with the Commission pursuant to Regulation 14A within 120 days after September 29, 2019 and to be used in connection with our 2020 Annual Meeting of Stockholders is hereby incorporated by reference.
ITEM 12. | SECURITY OWNERSHIP OF CERTAIN BENEFICIAL OWNERS AND MANAGEMENT AND RELATED STOCKHOLDER MATTERS |
That portion of our definitive Proxy Statement appearing under the caption “Security Ownership of Certain Beneficial Owners and Management” to be filed with the Commission pursuant to Regulation 14A within 120 days after September 29, 2019 and to be used in connection with our 2020 Annual Meeting of Stockholders is hereby incorporated by reference. Information regarding equity compensation plans under which Company common stock may be issued as of September 29, 2019 is set forth in Item 5 of this Report.
43
ITEM 13. | CERTAIN RELATIONSHIPS AND RELATED TRANSACTIONS, AND DIRECTOR INDEPENDENCE |
That portion of our definitive Proxy Statement appearing under the caption “Certain Relationships and Related Transactions” and “Directors’ Independence,” if any, to be filed with the Commission pursuant to Regulation 14A within 120 days after September 29, 2019 and to be used in connection with our 2020 Annual Meeting of Stockholders is hereby incorporated by reference.
ITEM 14. | PRINCIPAL ACCOUNTING FEES AND SERVICES |
That portion of our definitive Proxy Statement appearing under the caption “Independent Registered Public Accounting Fees and Services” to be filed with the Commission pursuant to Regulation 14A within 120 days after September 29, 2019 and to be used in connection with our 2020 Annual Meeting of Stockholders is hereby incorporated by reference.
PART IV
ITEM 15. | EXHIBITS, FINANCIAL STATEMENT SCHEDULES |
ITEM 15(a) (1) | Financial Statements. See Index to Consolidated Financial Statements on page F-1 of this Report. |
ITEM 15(a) (2) | Financial Statement Schedules. None. |
ITEM 15(a) (3) Exhibits.
Number | Description | Form | Filed with SEC | |||
3.1 | 8-K | 9/24/2007 | ||||
3.2 | 10-Q | 8/8/2019 | ||||
3.3 | 8-K | 12/20/2017 | ||||
4.1 | 8-K | 7/8/2019 | ||||
4.2 | 8-K | 7/8/2019 | ||||
10.1.1 | 8-K | 7/1/2010 | ||||
10.1.2 | 8-K | 7/1/2010 | ||||
10.1.3 | 8-K | 7/1/2010 | ||||
10.1.4 | 10-Q | 2/23/2012 | ||||
10.1.7 | 8-K | 3/20/2014 | ||||
10.1.8 | 8-K | 3/20/2014 | ||||
44
Number | Description | Form | Filed with SEC | |||
10.1.9 | 8-K | 3/20/2014 | ||||
10.1.10 | 8-K | 7/7/2015 | ||||
10.1.11 | 8-K | 9/22/2016 | ||||
10.1.12 | 8-K | 9/22/2016 | ||||
10.1.13 | 8-K | 3/21/2018 | ||||
10.1.14 | 8-K | 10/26/2018 | ||||
10.1.15 | 8-K | 10/29/2018 | ||||
10.1.16 | 8-K | 1/4/2019 | ||||
10.1.17 | 8-K | 1/4/2019 | ||||
10.1.18 | 8-K | 1/4/2019 | ||||
10.1.19 | 8-K | 5/2/2019 | ||||
10.1.20 | 8-K | 7/8/2019 | ||||
10.1.21 | 8-K | 7/8/2019 | ||||
10.1.22 | 8-K | 7/8/2019 | ||||
10.2* | 10-Q | 2/20/2008 | ||||
10.2.1* | 10-Q | 5/17/2012 | ||||
10.2.2* | 10-K | 11/21/2014 | ||||
10.2.3* | 10-K | 11/30/2017 | ||||
45
Number | Description | Form | Filed with SEC | |||
10.2.4* | 10-K | 11/30/2017 | ||||
10.2.6* | 8-K | 1/16/2018 | ||||
10.2.7* | 8-K | 1/26/2018 | ||||
10.2.8* | 10-Q | 5/17/2018 | ||||
10.2.9* | 10-K | 11/21/2018 | ||||
10.2.10* | _____ | Filed herewith | ||||
10.3* | 10-Q | 2/18/2009 | ||||
10.3.1 * | 8-K | 9/22/2015 | ||||
10.4* | 10-Q | 2/18/2009 | ||||
10.4.1 * | 8-K | 9/22/2015 | ||||
10.5* | 10-K | 11/22/2006 | ||||
10.8* | DEF 14A | 1/25/2017 | ||||
10.8.1* | 10-Q | 8/5/2009 | ||||
10.8.3* | 8-K | 11/15/2005 | ||||
10.8.4* | 10-K | 11/20/2009 | ||||
10.8.6* | 10-Q | 5/14/2015 | ||||
10.8.9* | 10-K | 11/22/2013 | ||||
10.8.10* | 10-K | 11/22/2013 | ||||
10.8.11* | 10-Q | 2/19/2015 | ||||
10.8.12* | 10-Q | 2/19/2015 | ||||
10.8.13* | 10-Q | 2/18/2016 | ||||
10.8.14* | 10-Q | 2/18/2016 | ||||
10.8.15* | 10-Q | 5/12/2016 | ||||
10.8.16* | 10-Q | 2/21/2019 | ||||
10.10.2* | DEF 14A | 1/11/2016 | ||||
46
Number | Description | Form | Filed with SEC | |||
10.11* | 10-Q | 8/10/2012 | ||||
21.1 | _____ | Filed herewith | ||||
23.1 | _____ | Filed herewith | ||||
31.1 | _____ | Filed herewith | ||||
31.2 | _____ | Filed herewith | ||||
32.1 | _____ | Filed herewith | ||||
32.2 | _____ | Filed herewith | ||||
101.INS | XBRL Instance Document | |||||
101.SCH | XBRL Taxonomy Extension Schema Document | |||||
101.CAL | XBRL Taxonomy Extension Calculation Linkbase Document | |||||
101.DEF | XBRL Taxonomy Extension Definition Linkbase Document | |||||
101.LAB | XBRL Taxonomy Extension Label Linkbase Document | |||||
101.PRE | XBRL Taxonomy Extension Presentation Linkbase Document | |||||
* Management contract or compensatory plan.
ITEM 15(b) All required exhibits are filed herein or incorporated by reference as described in Item 15(a)(3).
ITEM 15(c) All schedules have been omitted as the required information is inapplicable, immaterial or the information is presented in the consolidated financial statements or related notes.
ITEM 16. | FORM 10-K SUMMARY |
Not applicable.
47
SIGNATURES
Pursuant to the requirements of Section 13 or 15(d) of the Securities Exchange Act of 1934, the registrant has duly caused this report to be signed on its behalf by the undersigned, thereunto duly authorized.
JACK IN THE BOX INC. | ||
By: | /s/ LANCE TUCKER | |
Lance Tucker Executive Vice President and Chief Financial Officer (principal financial officer) | ||
November 21, 2019 | ||
Pursuant to the requirements of the Securities Exchange Act of 1934, this report has been signed below by the following persons on behalf of the registrant and in the capacities and on the dates indicated.
Each person whose signature appears below constitutes and appoints Leonard A. Comma and Lance Tucker, jointly and severally, his attorneys-in-fact, each with the power of substitution, for him or her in any and all capacities, to sign any amendments to this report, and to file the same, with exhibits thereto and other documents in connection therewith with the Securities and Exchange Commission, hereby ratifying and confirming all that each of said attorneys-in-fact, or his substitute or substitutes may do or cause to be done by virtue hereof.
Signature | Title | Date | ||
/s/ LEONARD A. COMMA | Chairman of the Board and Chief Executive Officer (principal executive officer) | November 21, 2019 | ||
Leonard A. Comma | ||||
/s/ LANCE TUCKER | Executive Vice President and Chief Financial Officer (principal financial officer and principal accounting officer) | November 21, 2019 | ||
Lance Tucker | ||||
/s/ JEAN M. BIRCH | Director | November 21, 2019 | ||
Jean M. Birch | ||||
/s/ JOHN P. GAINOR | Director | November 21, 2019 | ||
John P. Gainor | ||||
/s/ DAVID L. GOEBEL | Director | November 21, 2019 | ||
David L. Goebel | ||||
/s/ SHARON P. JOHN | Director | November 21, 2019 | ||
Sharon P. John | ||||
/s/ MADELEINE A. KLEINER | Director | November 21, 2019 | ||
Madeleine A. Kleiner | ||||
/s/ MICHAEL W. MURPHY | Director | November 21, 2019 | ||
Michael W. Murphy | ||||
/s/ JAMES M. MYERS | Director | November 21, 2019 | ||
James M. Myers | ||||
/s/ DAVID M. TEHLE | Director | November 21, 2019 | ||
David M. Tehle | ||||
/s/ JOHN T. WYATT | Director | November 21, 2019 | ||
John T. Wyatt | ||||
/s/ VIVIEN M. YEUNG | Director | November 21, 2019 | ||
Vivien M. Yeung | ||||
48
INDEX TO CONSOLIDATED FINANCIAL STATEMENTS
Page | ||
Schedules not filed: All schedules have been omitted as the required information is inapplicable, immaterial, or the information is presented in the consolidated financial statements or related notes.
F-1
Report of Independent Registered Public Accounting Firm
To the Stockholders and Board of Directors
Jack in the Box Inc.:
Opinion on the Consolidated Financial Statements
We have audited the accompanying consolidated balance sheets of Jack in the Box Inc. and subsidiaries (the Company) as of September 29, 2019 and September 30, 2018, the related consolidated statements of earnings, comprehensive income, stockholders’ deficit, and cash flows for each of the fifty-two weeks ended September 29, 2019, September 30, 2018, and October 1, 2017 and the related notes (collectively, the consolidated financial statements). In our opinion, the consolidated financial statements present fairly, in all material respects, the financial position of the Company as of September 29, 2019 and September 30, 2018, and the results of its operations and its cash flows for the fifty-two weeks ended September 29, 2019, September 30, 2018, and October 1, 2017, in conformity with U.S. generally accepted accounting principles.
We also have audited, in accordance with the standards of the Public Company Accounting Oversight Board (United States) (PCAOB), the Company’s internal control over financial reporting as of September 29, 2019, based on criteria established in Internal Control – Integrated Framework (2013) issued by the Committee of Sponsoring Organizations of the Treadway Commission, and our report dated November 21, 2019, expressed an adverse opinion on the effectiveness of the Company’s internal control over financial reporting.
Change in Accounting Principle
As discussed in Note 1 to the consolidated financial statements, the Company has changed its method of accounting for revenue from contracts with customers in 2019 due to the adoption of Accounting Standards Codification Topic 606, Revenue from Contracts with Customers.
Basis for Opinion
These consolidated financial statements are the responsibility of the Company’s management. Our responsibility is to express an opinion on these consolidated financial statements based on our audits. We are a public accounting firm registered with the PCAOB and are required to be independent with respect to the Company in accordance with the U.S. federal securities laws and the applicable rules and regulations of the Securities and Exchange Commission and the PCAOB.
We conducted our audits in accordance with the standards of the PCAOB. Those standards require that we plan and perform the audit to obtain reasonable assurance about whether the consolidated financial statements are free of material misstatement, whether due to error or fraud. Our audits included performing procedures to assess the risks of material misstatement of the consolidated financial statements, whether due to error or fraud, and performing procedures that respond to those risks. Such procedures included examining, on a test basis, evidence regarding the amounts and disclosures in the consolidated financial statements. Our audits also included evaluating the accounting principles used and significant estimates made by management, as well as evaluating the overall presentation of the consolidated financial statements. We believe that our audits provide a reasonable basis for our opinion.
Critical Audit Matter
The critical audit matter communicated below is a matter arising from the current period audit of the consolidated financial statements that was communicated or required to be communicated to the audit committee and that: (1) relates to accounts or disclosures that are material to the consolidated financial statements and (2) involved our especially challenging, subjective, or complex judgment. The communication of a critical audit matter does not alter in any way our opinion on the consolidated financial statements, taken as a whole, and we are not, by communicating the critical audit matter below, providing a separate opinion on the critical audit matter or on the accounts or disclosures to which it relates.
Assessment of self-insurance liabilities related to workers’ compensation and general liability
As discussed in Note 1 to the consolidated financial statements, the Company establishes its undiscounted insurance liability and reserves using assistance from independent actuaries to estimate expected losses based on a statistical analysis of historical claims data. As of September 29, 2019, the Company has recorded an estimated self-insurance liability of $27.5 million.
We identified the assessment of self-insurance liabilities related to workers’ compensation and general liability as a critical audit matter. Evaluating the Company’s judgments regarding the use of actuarial estimates and assumptions related to the loss development factors and expected loss rates involved a high degree of complex and subjective auditor judgment. Changes in the loss development factors and expected loss rates could have a significant impact on the liability recognized.
F-2
The primary procedures we performed to address this critical audit matter included the following. We tested, with the involvement of actuarial professionals when appropriate, certain internal controls over the Company’s process to develop the estimate of self-insurance liabilities, including controls related to the review of the loss development factors and expected loss rates applied in the actuarial report. We tested the claims paid and claims reported (not paid) data used in the actuarial models for consistency with the actual claims paid and claims reported (not paid) records of the Company. We involved actuarial professionals with specialized skills and knowledge, who assisted in evaluating the Company’s actuarial estimates and assumptions related to the loss development factors and expected loss rates, by comparing them to generally accepted actuarial methodologies, the Company’s historical data, and industry and regulatory trends.
/s/ KPMG LLP
We have served as the Company’s auditor since 1986.
San Diego, California
November 21, 2019
F-3
JACK IN THE BOX INC. AND SUBSIDIARIES
CONSOLIDATED BALANCE SHEETS
(In thousands, except share and per share data)
September 29, 2019 | September 30, 2018 | |||||||
ASSETS | ||||||||
Current assets: | ||||||||
Cash | $ | $ | ||||||
Restricted cash | ||||||||
Accounts and other receivables, net | ||||||||
Inventories | ||||||||
Prepaid expenses | ||||||||
Current assets held for sale | ||||||||
Other current assets | ||||||||
Total current assets | ||||||||
Property and equipment, at cost: | ||||||||
Land | ||||||||
Buildings | ||||||||
Restaurant and other equipment | ||||||||
Construction in progress | ||||||||
Less accumulated depreciation and amortization | ( | ) | ( | ) | ||||
Property and equipment, net | ||||||||
Other assets: | ||||||||
Intangible assets, net | ||||||||
Goodwill | ||||||||
Deferred tax assets | ||||||||
Other assets, net | ||||||||
Total other assets | ||||||||
$ | $ | |||||||
LIABILITIES AND STOCKHOLDERS’ DEFICIT | ||||||||
Current liabilities: | ||||||||
Current maturities of long-term debt | $ | $ | ||||||
Accounts payable | ||||||||
Accrued liabilities | ||||||||
Total current liabilities | ||||||||
Long-term liabilities: | ||||||||
Long-term debt, net of current maturities | ||||||||
Other long-term liabilities | ||||||||
Total long-term liabilities | ||||||||
Stockholders’ deficit: | ||||||||
Preferred stock $0.01 par value, 15,000,000 shares authorized, none issued | ||||||||
Common stock $0.01 par value, 175,000,000 shares authorized, 82,159,002 and 82,061,661 issued, respectively | ||||||||
Capital in excess of par value | ||||||||
Retained earnings | ||||||||
Accumulated other comprehensive loss | ( | ) | ( | ) | ||||
Treasury stock, at cost, 57,760,573 and 56,325,632 shares, respectively | ( | ) | ( | ) | ||||
Total stockholders’ deficit | ( | ) | ( | ) | ||||
$ | $ | |||||||
See accompanying notes to consolidated financial statements.
F-4
JACK IN THE BOX INC. AND SUBSIDIARIES
CONSOLIDATED STATEMENTS OF EARNINGS
(In thousands, except per share data)
Fiscal Year | ||||||||||||
2019 | 2018 | 2017 | ||||||||||
Revenues: | ||||||||||||
Company restaurant sales | $ | $ | $ | |||||||||
Franchise rental revenues | ||||||||||||
Franchise royalties and other | ||||||||||||
Franchise contributions for advertising and other services | ||||||||||||
Operating costs and expenses, net: | ||||||||||||
Company restaurant costs (excluding depreciation and amortization): | ||||||||||||
Food and packaging | ||||||||||||
Payroll and employee benefits | ||||||||||||
Occupancy and other | ||||||||||||
Total company restaurant costs | ||||||||||||
Franchise occupancy expenses (excluding depreciation and amortization) | ||||||||||||
Franchise support and other costs | ||||||||||||
Franchise advertising and other services expenses | ||||||||||||
Selling, general, and administrative expenses | ||||||||||||
Depreciation and amortization | ||||||||||||
Impairment and other charges, net | ||||||||||||
Gains on the sale of company-operated restaurants | ( | ) | ( | ) | ( | ) | ||||||
Earnings from operations | ||||||||||||
Other pension and post-retirement expenses, net | ||||||||||||
Interest expense, net | ||||||||||||
Earnings from continuing operations and before income taxes | ||||||||||||
Income taxes | ||||||||||||
Earnings from continuing operations | ||||||||||||
Earnings from discontinued operations, net of income taxes | ||||||||||||
Net earnings | $ | $ | $ | |||||||||
Net earnings per share — basic: | ||||||||||||
Earnings from continuing operations | $ | $ | $ | |||||||||
Earnings from discontinued operations | ||||||||||||
Net earnings per share (1) | $ | $ | $ | |||||||||
Net earnings per share — diluted: | ||||||||||||
Earnings from continuing operations | $ | $ | $ | |||||||||
Earnings from discontinued operations | ||||||||||||
Net earnings per share (1) | $ | $ | $ | |||||||||
Cash dividends declared per common share | $ | $ | $ | |||||||||
________________________
(1) Earnings per share may not add due to rounding.
See accompanying notes to consolidated financial statements.
F-5
JACK IN THE BOX INC. AND SUBSIDIARIES
CONSOLIDATED STATEMENTS OF COMPREHENSIVE INCOME
(In thousands)
Fiscal Year | ||||||||||||
2019 | 2018 | 2017 | ||||||||||
Net earnings | $ | $ | $ | |||||||||
Cash flow hedges: | ||||||||||||
Net change in fair value of derivatives | ( | ) | ||||||||||
Net loss reclassified to earnings | ||||||||||||
Tax effect | ( | ) | ( | ) | ( | ) | ||||||
( | ) | |||||||||||
Unrecognized periodic benefit costs: | ||||||||||||
Actuarial (losses) gains arising during the period | ( | ) | ||||||||||
Actuarial losses and prior service cost reclassified to earnings | ||||||||||||
( | ) | |||||||||||
Tax effect | ( | ) | ( | ) | ||||||||
( | ) | |||||||||||
Other: | ||||||||||||
Foreign currency translation adjustments | ( | ) | ||||||||||
Tax effect | ( | ) | ||||||||||
Derecognition of foreign currency translation adjustments due to sale | ||||||||||||
( | ) | |||||||||||
Other comprehensive (loss) income, net of taxes | ( | ) | ||||||||||
Comprehensive income | $ | $ | $ | |||||||||
See accompanying notes to consolidated financial statements.
F-6
JACK IN THE BOX INC. AND SUBSIDIARIES
CONSOLIDATED STATEMENTS OF CASH FLOWS
(In thousands)
Fiscal Year | ||||||||||||
2019 | 2018 | 2017 | ||||||||||
Cash flows from operating activities: | ||||||||||||
Net earnings | $ | $ | $ | |||||||||
Earnings from discontinued operations | ||||||||||||
Earnings from continuing operations | ||||||||||||
Adjustments to reconcile net earnings to net cash provided by operating activities: | ||||||||||||
Depreciation and amortization | ||||||||||||
Franchise tenant improvement allowance amortization and other | ||||||||||||
Amortization of debt issuance costs | ||||||||||||
Loss on debt extinguishment | ||||||||||||
Loss on interest rate swap termination | ||||||||||||
Excess tax benefits from share-based compensation arrangements | ( | ) | ( | ) | ( | ) | ||||||
Deferred income taxes | ( | ) | ||||||||||
Share-based compensation expense | ||||||||||||
Pension and postretirement expense | ||||||||||||
Gains on cash surrender value of company-owned life insurance | ( | ) | ( | ) | ( | ) | ||||||
Gains on the sale of company-operated restaurants | ( | ) | ( | ) | ( | ) | ||||||
(Gains) losses on the disposition of property and equipment | ( | ) | ||||||||||
Impairment charges and other | ||||||||||||
Changes in assets and liabilities, excluding acquisitions and dispositions: | ||||||||||||
Accounts and other receivables | ( | ) | ||||||||||
Inventories | ||||||||||||
Prepaid expenses and other current assets | ( | ) | ||||||||||
Accounts payable | ( | ) | ||||||||||
Accrued liabilities | ( | ) | ( | ) | ( | ) | ||||||
Pension and postretirement contributions | ( | ) | ( | ) | ( | ) | ||||||
Franchise tenant improvement allowance disbursements | ( | ) | ( | ) | ||||||||
Other | ( | ) | ( | ) | ( | ) | ||||||
Cash flows provided by operating activities | ||||||||||||
Cash flows from investing activities: | ||||||||||||
Purchases of property and equipment | ( | ) | ( | ) | ( | ) | ||||||
Proceeds from the sale and leaseback of assets | ||||||||||||
Proceeds from the sale of company-operated restaurants | ||||||||||||
Collections on notes receivable | ||||||||||||
Proceeds from the sale of property and equipment | ||||||||||||
Other | ( | ) | ||||||||||
Cash flows (used in) provided by investing activities | ( | ) | ||||||||||
Cash flows from financing activities: | ||||||||||||
Borrowings on revolving credit facilities | ||||||||||||
Repayments of borrowings on revolving credit facilities | ( | ) | ( | ) | ( | ) | ||||||
Proceeds from issuance of debt | ||||||||||||
Principal repayments on debt | ( | ) | ( | ) | ( | ) | ||||||
Debt issuance costs | ( | ) | ( | ) | ||||||||
Payments related to termination of interest rate swaps | ( | ) | ||||||||||
Dividends paid on common stock | ( | ) | ( | ) | ( | ) | ||||||
Proceeds from issuance of common stock | ||||||||||||
Repurchases of common stock | ( | ) | ( | ) | ( | ) | ||||||
Excess tax benefits from share-based compensation arrangements | ||||||||||||
Payroll tax payments for equity award issuances | ( | ) | ( | ) | ( | ) | ||||||
Change in book overdraft | ( | ) | ||||||||||
Cash flows used in financing activities | ( | ) | ( | ) | ( | ) | ||||||
Cash flows provided by (used in) continuing operations | ( | ) | ( | ) | ||||||||
Net cash provided by operating activities of discontinued operations | ||||||||||||
Net cash provided by (used in) investing activities of discontinued operations | ( | ) | ||||||||||
Net cash used in financing activities of discontinued operations | ( | ) | ( | ) | ||||||||
Net cash provided by discontinued operations | ||||||||||||
Effect of exchange rate changes on cash | ( | ) | ||||||||||
Cash and restricted cash at beginning of year | ||||||||||||
Cash and restricted cash at end of year | $ | $ | $ | |||||||||
See accompanying notes to consolidated financial statements.
F-7
JACK IN THE BOX INC. AND SUBSIDIARIES
CONSOLIDATED STATEMENTS OF STOCKHOLDERS’ DEFICIT
(Dollars in thousands)
Number of Shares | Amount | Capital in Excess of Par Value | Retained Earnings | Accumulated Other Comprehensive Loss | Treasury Stock | Total | |||||||||||||||||||||
Balance at October 2, 2016 | $ | $ | $ | $ | ( | ) | $ | ( | ) | $ | ( | ) | |||||||||||||||
Shares issued under stock plans, including tax benefit | — | — | — | ||||||||||||||||||||||||
Share-based compensation | — | — | — | — | — | ||||||||||||||||||||||
Dividends declared | — | — | ( | ) | — | — | ( | ) | |||||||||||||||||||
Purchases of treasury stock | — | — | — | — | — | ( | ) | ( | ) | ||||||||||||||||||
Net earnings | — | — | — | — | — | ||||||||||||||||||||||
Foreign currency translation adjustment | — | — | — | — | ( | ) | — | ( | ) | ||||||||||||||||||
Effect of interest rate swaps, net | — | — | — | — | — | ||||||||||||||||||||||
Effect of actuarial gains and prior service cost, net | — | — | — | — | — | ||||||||||||||||||||||
Other | — | — | ( | ) | — | — | — | ( | ) | ||||||||||||||||||
Balance at October 1, 2017 | ( | ) | ( | ) | ( | ) | |||||||||||||||||||||
Shares issued under stock plans, including tax benefit | — | — | — | ||||||||||||||||||||||||
Share-based compensation | — | — | — | — | — | ||||||||||||||||||||||
Dividends declared | — | — | ( | ) | — | — | ( | ) | |||||||||||||||||||
Purchases of treasury stock | — | — | — | — | — | ( | ) | ( | ) | ||||||||||||||||||
Net earnings | — | — | — | — | — | ||||||||||||||||||||||
Foreign currency translation adjustment | — | — | — | — | — | ||||||||||||||||||||||
Effect of interest rate swaps, net | — | — | — | — | — | ||||||||||||||||||||||
Effect of actuarial gains and prior service cost, net | — | — | — | — | — | ||||||||||||||||||||||
Other | — | — | — | ( | ) | — | — | ( | ) | ||||||||||||||||||
Balance at September 30, 2018 | ( | ) | ( | ) | ( | ) | |||||||||||||||||||||
Shares issued under stock plans, including tax benefit | — | — | — | ||||||||||||||||||||||||
Share-based compensation | — | — | — | — | — | ||||||||||||||||||||||
Dividends declared | — | — | ( | ) | — | — | ( | ) | |||||||||||||||||||
Purchases of treasury stock | — | — | — | — | — | ( | ) | ( | ) | ||||||||||||||||||
Net earnings | — | — | — | — | — | ||||||||||||||||||||||
Effect of interest rate swaps, net | — | — | — | — | ( | ) | — | ( | ) | ||||||||||||||||||
Effect of actuarial losses and prior service cost, net | — | — | — | — | ( | ) | — | ( | ) | ||||||||||||||||||
Cumulative-effect from a change in accounting principle | — | — | — | ( | ) | — | — | ( | ) | ||||||||||||||||||
Balance at September 29, 2019 | $ | $ | $ | $ | ( | ) | $ | ( | ) | $ | ( | ) | |||||||||||||||
See accompanying notes to consolidated financial statements.
F-8
JACK IN THE BOX INC. AND SUBSIDIARIES
NOTES TO CONSOLIDATED FINANCIAL STATEMENTS
1. NATURE OF OPERATIONS AND SUMMARY OF SIGNIFICANT ACCOUNTING POLICIES
2019 | 2018 | 2017 | ||||
Company-operated | ||||||
Franchise | ||||||
Total system | ||||||
References to the Company throughout these notes to the consolidated financial statements are made using the first person notations of “we,” “us,” and “our.”
Basis of presentation — The accompanying consolidated financial statements have been prepared in accordance with U.S. generally accepted accounting principles (“U.S. GAAP”) and the rules and regulations of the Securities and Exchange Commission (“SEC”).
On December 19, 2017, we entered into a definitive agreement to sell Qdoba Restaurant Corporation (“Qdoba”), a wholly owned subsidiary of the Company that operates and franchises more than 700 Qdoba Mexican Eats® fast-casual restaurants, to certain funds managed by affiliates of Apollo Global Management, LLC (together with its consolidated subsidiaries, the “Buyer”). The sale was completed on March 21, 2018. For all periods presented in our consolidated statements of earnings, all sales, costs, expenses and income taxes attributable to Qdoba, except as related to the impact of the decrease in the federal statutory tax rate (see Note 11, Income Taxes), have been aggregated under the caption “Earnings from discontinued operations, net of income taxes.” Refer to Note 10, Discontinued Operations, for additional information.
Unless otherwise noted, amounts and disclosures throughout these notes to consolidated financial statements relate to our continuing operations.
Principles of consolidation — The consolidated financial statements include the accounts of the Company, its wholly-owned subsidiaries, and the accounts of any variable interest entities (“VIEs”) where we are deemed the primary beneficiary. All significant intercompany accounts and transactions are eliminated.
The Financial Accounting Standards Board (“FASB”) authoritative guidance on consolidation requires the primary beneficiary of a VIE to consolidate that entity. The primary beneficiary of a VIE is an enterprise that has a controlling financial interest in the VIE. Controlling financial interest exists when an enterprise has both the power to direct the activities that most significantly impact the VIE’s economic performance and the obligation to absorb losses or the right to receive benefits of the VIE that could potentially be significant to the VIE.
The primary entities in which we possess a variable interest are franchise entities, which operate our franchise restaurants. We do not possess any ownership interests in franchise entities. We have reviewed these franchise entities and determined that we are not the primary beneficiary of the entities and therefore, these entities have not been consolidated.
Use of estimates — In preparing the consolidated financial statements in conformity with U.S. GAAP, management is required to make certain assumptions and estimates that affect reported amounts of assets, liabilities, revenues, expenses, and the disclosure of contingencies. In making these assumptions and estimates, management may from time to time seek advice and consider information provided by actuaries and other experts in a particular area. Actual amounts could differ materially from these estimates.
Restricted cash is comprised of certain cash balances required to be held in trust in connection with the Company’s securitized financing facility. Such restricted cash primarily represents cash collections and cash reserves held by the trustee to be used for payments of principal, interest and commitments fees required for the Class A-2 Notes. Refer to Note 7, Indebtedness, for additional information.
F-9
JACK IN THE BOX INC. AND SUBSIDIARIES
NOTES TO CONSOLIDATED FINANCIAL STATEMENTS
Accounts and other receivables, net, is primarily comprised of receivables from franchisees, tenants, and credit card processors. Franchisee receivables primarily include rents, royalties, and marketing, sourcing and technology support fees associated with lease and franchise agreements, and notes issued in connection with refranchising transactions. Tenant receivables relate to subleased properties where we are on the master lease agreement. We accrue interest on notes receivable based on the contractual terms. The allowance for doubtful accounts is based on historical experience and a review of existing receivables. Changes in accounts and other receivables are classified as an operating activity in the consolidated statements of cash flows, except for changes in notes related to refranchising transactions, which are classified as an investing activity.
Inventories consist principally of food, packaging, and supplies, and are valued at the lower of cost or market on a first-in, first-out basis.
Property and equipment, net — Expenditures for new facilities and equipment, and those that substantially increase the useful lives of the property, are capitalized. Facilities leased under capital leases are stated at the present value of minimum lease payments at the beginning of the lease term, not to exceed fair value. Maintenance and repairs are expensed as incurred. When property and equipment are retired or otherwise disposed of, the related cost and accumulated depreciation are removed from the accounts, and gains or losses on the dispositions are reflected in results of operations.
Buildings, equipment and leasehold improvements are generally depreciated using the straight-line method based on the estimated useful lives of the assets, over the initial lease term for certain assets acquired in conjunction with the lease commencement for leased properties, or the remaining lease term for certain assets acquired after the commencement of the lease for leased properties. In certain situations, one or more option periods may be used in determining the depreciable life of assets related to leased properties if we deem that an economic penalty would be incurred otherwise. In either circumstance, our policy requires lease term consistency when calculating the depreciation period, in classifying the lease and in computing straight-line rent expense. Building, leasehold improvement assets and equipment are assigned lives that range from 1 to 35 years. Depreciation expense related to property and equipment was $55.2 million, $59.4 million, and $67.4 million in fiscal year 2019, 2018, and 2017, respectively.
Impairment of long-lived assets — We evaluate our long-lived assets, such as property and equipment, for impairment on an annual basis or whenever events or changes in circumstances indicate that their carrying value may not be recoverable. This review generally includes a restaurant-level analysis, except when we are actively selling a group of restaurants, in which case we perform our impairment evaluations at the group level. Impairment evaluations for individual restaurants may take into consideration a restaurant’s operating cash flows, the period of time since a restaurant has been opened or remodeled, refranchising expectations, if any, and the maturity of the related market, which are all significant unobservable inputs (“Level 3 Inputs”). Impairment evaluations for a group of restaurants take into consideration the group’s expected future cash flows and sales proceeds from bids received, if any, or fair market value based on, among other considerations, the specific sales and cash flows of those restaurants. If the assets of a restaurant or group of restaurants subject to our impairment evaluation are not recoverable based upon the forecasted, undiscounted cash flows, we recognize an impairment loss by the amount that the carrying value of the assets exceeds fair value. Refer to Note 9, Impairment and Other Charges, Net, for additional information.
F-10
JACK IN THE BOX INC. AND SUBSIDIARIES
NOTES TO CONSOLIDATED FINANCIAL STATEMENTS
Goodwill and intangible assets — Goodwill is the excess of the purchase price over the fair value of identifiable net assets acquired, if any. We generally record goodwill in connection with the acquisition of restaurants from franchisees. Likewise, upon the sale of restaurants to franchisees, goodwill is decremented. The amount of goodwill written-off is determined as the fair value of the business disposed of as a percentage of the fair value of the reporting unit retained. If the business disposed of was never fully integrated into the reporting unit after its acquisition, and thus the benefits of the acquired goodwill were never realized, the current carrying amount of the acquired goodwill is written off. Goodwill and our other indefinite-lived intangible assets are evaluated for impairment annually during the fourth quarter, or more frequently if indicators of impairment are present. We first assess qualitative factors to determine whether the existence of events or circumstances lead to a determination that it is more likely than not that the fair value of a reporting unit or indefinite-lived asset is less than its carrying amount. If the qualitative factors indicate that it is more likely than not that the fair value is less than the carrying amount, we perform a single-step impairment test. To perform our impairment analysis, we estimate the fair value of the reporting unit or indefinite-lived asset using Level 3 Inputs and compare it to the carrying value. If the carrying value exceeds the fair value, an impairment loss is recognized equal to the excess.
Lease acquisition costs primarily represent the fair values of acquired lease contracts having contractual rents lower than fair market rents and are amortized on a straight-line basis over the remaining initial lease term. Reacquired franchise rights are recorded in connection with our acquisition of franchised restaurants and are amortized over the remaining contractual period of the franchise contract in which the right was granted.
Refer to Note 4, Goodwill and Intangible Assets, Net, for additional information.
Company-owned life insurance — We have purchased company-owned life insurance (“COLI”) policies to support our non-qualified benefit plans. The cash surrender values of these policies were $112.8 million and $109.9 million as of September 29, 2019 and September 30, 2018, respectively, and are included in “Other assets, net”, in the accompanying consolidated balance sheets. Changes in cash surrender values are included in “Selling, general and administrative expenses” in the accompanying consolidated statements of earnings. These policies reside in an umbrella trust for use only to pay plan benefits to participants or to pay creditors if the Company becomes insolvent.
Leases — We review all leases for capital or operating classification at their inception under the FASB authoritative guidance for leases. Our operations are primarily conducted under operating leases. Within the provisions of certain leases, there are rent holidays and escalations in payments over the base lease term, as well as renewal periods. The effects of the holidays and escalations have been reflected in rent expense on a straight-line basis over the expected lease term. Differences between amounts paid and amounts expensed are recorded as deferred rent. The lease term commences on the date when we have the right to control the use of the leased property. Certain leases also include contingent rent provisions based on sales levels, which are accrued at the point in time we determine that it is probable such sales levels will be achieved. Refer to Note 8, Leases, for additional information.
Revenue recognition — “Company restaurant sales” include revenue recognized upon delivery of food and beverages to the customer at company-operated restaurants, which is when our obligation to perform is satisfied. Company restaurant sales exclude taxes collected from the Company’s customers. Company restaurant sales also include income for gift cards. Gift cards, upon customer purchase, are recorded as deferred income and are recognized in revenue as they are redeemed.
“Franchise rental revenues” received from franchised restaurants based on fixed rental payments are recognized as revenue over the term of the lease. Rental revenue from properties owned and leased by the Company and leased or subleased to franchisees is recognized on a straight-line basis over the respective term of the lease. Certain franchise rents, which are contingent upon sales levels, are recognized in the period in which the contingency is met.
“Franchise royalties and other” includes royalties and franchise and other fees received from franchisees. Royalties are based upon a percentage of sales of the franchised restaurant and are recognized as earned. Franchise royalties are billed on a monthly basis. Franchise fees when a new restaurant opens or at the start of a new franchise term are recorded as deferred revenue when received and recognized as revenue over the term of the franchise agreement.
“Franchise contributions for advertising and other services” includes franchisee contributions to our marketing fund billed on a monthly basis and sourcing and technology fees, as required under the franchise agreements. Contributions to our marketing fund are based on a percentage of sales and recognized as earned. Sourcing and technology services are recognized when the goods or services are transferred to the franchisee.
Gift cards — We sell gift cards to our customers in our restaurants and through selected third parties. The gift cards sold to our customers have no stated expiration dates and are subject to actual or potential escheatment rights in several of the jurisdictions in which we operate. We recognize income from gift cards when redeemed by the customer.
F-11
JACK IN THE BOX INC. AND SUBSIDIARIES
NOTES TO CONSOLIDATED FINANCIAL STATEMENTS
While we will continue to honor all gift cards presented for payment, we may determine the likelihood of redemption to be remote for certain card balances due to, among other things, long periods of inactivity. In these circumstances, to the extent we determine there is no requirement for remitting balances to government agencies under unclaimed property laws, card balances may be recognized as a reduction to “Selling, general and administrative expenses” in the accompanying consolidated statements of earnings.
Amounts recognized on unredeemed gift card balances was $0.5 million, $0.6 million, and $0.5 million in fiscal 2019, 2018, and 2017, respectively.
Pre-opening costs associated with the opening of a new restaurant consist primarily of property rent and employee training costs. Pre-opening costs associated with the opening of a restaurant that was closed upon acquisition consist primarily of labor costs, maintenance and repair costs, and property rent. Pre-opening costs are expensed as incurred in “Selling, general and administrative expenses” in the accompanying consolidated statements of earnings.
Restaurant closure costs — All costs associated with exit or disposal activities are recognized when they are incurred. Restaurant closure costs, which are included in “Impairment and other charges, net”, and “Gains on the sale of company-operated restaurants” in the accompanying consolidated statements of earnings, primarily consist of future lease commitments, net, of anticipated sublease rentals, and expected ancillary costs.
Self-insurance — We are self-insured for a portion of our workers’ compensation, general liability, employee medical and dental, and automotive claims. We utilize a paid-loss plan for our workers’ compensation, general liability, and automotive programs, which have predetermined loss limits per occurrence and in the aggregate. We establish our insurance liability (undiscounted) and reserves using independent actuarial estimates of expected losses for determining reported claims and as the basis for estimating claims incurred, but not reported. As of September 29, 2019 and September 30, 2018, our estimated liability for general liability and workers’ compensation claims exceeded our self-insurance retention limits by $3.6 million and $3.7 million, respectively, which we expect our insurance providers to pay on our behalf in accordance with the contractual terms of our insurance policies.
Advertising costs — We administer a marketing fund that includes contractual contributions. In fiscal 2019, 2018, and 2017 the marketing fund contributions from franchise and company-operated restaurants were approximately 5.0 % of gross revenues, and the Company made incremental contributions to the marketing fund of $2.0 million, $6.2 million, and $0.5 million, respectively.
Production costs of commercials, programming, and other marketing activities are charged to the marketing funds when the advertising is first used for its intended purpose, and the costs of advertising are charged to operations as incurred. When contributions of the marketing fund exceed the related advertising expenses, advertising costs are accrued up to the amount of revenues on an annual basis. Total contributions made by the Company, including incremental contributions, are included in “Selling, general, and administrative expenses” in the accompanying consolidated statements of earnings. In fiscal 2019, 2018, and 2017 advertising costs were $19.0 million, $28.8 million, and $36.5 million, respectively.
Share-based compensation — We account for our share-based compensation under the FASB authoritative guidance on stock compensation, which generally requires, among other things, that all employee share-based compensation be measured using a fair value method and that the resulting compensation cost be recognized in the financial statements. Compensation expense for our share-based compensation awards is generally recognized on a straight-line basis over the shorter of the vesting period or the period from the date of grant to the date the employee becomes eligible to retire. Refer to Note 13, Share-based Employee Compensation, for additional information.
Income taxes — Deferred tax assets and liabilities are recognized for the future tax consequences attributable to differences between the financial statement carrying amounts of existing assets and liabilities and their respective tax bases, as well as tax loss and credit carryforwards. Deferred tax assets and liabilities are measured using enacted tax rates expected to apply to taxable income in the years in which those temporary differences are expected to be recovered or settled. We recognize interest and, when applicable, penalties related to unrecognized tax benefits as a component of our income tax provision.
Authoritative guidance issued by the FASB prescribes a minimum probability threshold that a tax position must meet before a financial statement benefit is recognized. The minimum threshold is defined as a tax position that is more likely than not to be sustained upon examination by the applicable taxing authority, including resolution of any related appeals or litigation processes, based on the technical merits of the position. Refer to Note 11, Income Taxes, for additional information.
F-12
JACK IN THE BOX INC. AND SUBSIDIARIES
NOTES TO CONSOLIDATED FINANCIAL STATEMENTS
Contingencies — We recognize liabilities for contingencies when we have an exposure that indicates it is probable that an asset has been impaired or that a liability has been incurred and the amount of impairment or loss can be reasonably estimated. Our ultimate legal and financial liability with respect to such matters cannot be estimated with certainty and requires the use of estimates. When the reasonable estimate is a range, the recorded loss will be the best estimate within the range. We record legal settlement costs when those costs are probable and reasonably estimable. Refer to Note 16, Commitments, Contingencies and Legal Matters, for additional information.
Effect of new accounting pronouncements adopted in fiscal 2019 — In May 2014, the FASB issued Accounting Standards Update (“ASU”) 2014-09, Revenue Recognition - Revenue from Contracts with Customers (Topic 606), which provides a comprehensive new revenue recognition model that requires an entity to recognize revenue in an amount that reflects the consideration the entity expects to receive for the transfer of promised goods or services to its customers. The standard also requires additional disclosure regarding the nature, amount, timing and uncertainty of revenue and cash flows arising from contracts with customers. We adopted the new standard on October 1, 2018 using the modified retrospective method, whereby the cumulative effect of this transition to applicable contracts with customers that were not completed as of October 1, 2018 was recorded as an adjustment to beginning retained earnings as of this date. The comparative information has not been restated and continues to be reported under the accounting standards in effect for those periods.
The new revenue recognition standard did not impact our recognition of restaurant sales, rental revenues, or royalties from franchisees. The new pronouncement changed the way initial fees from franchisees for new restaurant openings or new franchise terms are recognized. Under the previous revenue recognition guidance, initial franchise fees were recognized as revenue at the time when a new restaurant opened or at the start of a new franchise term. In accordance with the new guidance, the initial franchise services are not distinct from the continuing rights and services offered during the term of the franchise agreement and will therefore be treated as a single performance obligation together with the continuing rights and services. As such, initial fees received will be recognized over the franchise term and any unamortized portion will be recorded as deferred revenue in our consolidated balance sheet. An adjustment to opening retained earnings and a corresponding contract liability of approximately $50.3 million (of which $5.0 million was current and $45.3 million was long-term) was established on the date of adoption. A deferred tax asset of approximately $13.0 million related to this contract liability was also established on the date of adoption.
The new standard also had an impact on transactions presented net and not included in our revenues and expenses such as franchisee contributions to and expenditures from our advertising fund, and sourcing and technology fee contributions from franchisees and the related expenses. We determined that we are the principal in these arrangements, and as such, contributions to and expenditures from the advertising fund, and sourcing and technology fees and expenditures are now reported on a gross basis within our consolidated statements of earnings. While this change materially impacted our gross amount of reported revenues and expenses, the impact was largely offsetting with no material impact to our reported net earnings.
F-13
JACK IN THE BOX INC. AND SUBSIDIARIES
NOTES TO CONSOLIDATED FINANCIAL STATEMENTS
The following table summarizes the impacts of adopting ASC 606 on our consolidated financial statements as of and for the period ended September 29, 2019 (in thousands):
Adjustments | |||||||||||||||||||
As Reported | Franchise Fees | Marketing and Sourcing Fees | Technology Support Fees | Balances without Adoption | |||||||||||||||
Consolidated Statement of Earnings | |||||||||||||||||||
Fiscal Year Ended September 29, 2019 | |||||||||||||||||||
Franchise royalties and other | $ | $ | ( | ) | $ | — | $ | — | $ | ||||||||||
Franchise contributions for advertising and other services | $ | $ | — | $ | ( | ) | $ | ( | ) | $ | |||||||||
Total revenues | $ | $ | ( | ) | $ | ( | ) | $ | ( | ) | $ | ||||||||
Franchise advertising and other services expenses | $ | $ | — | $ | ( | ) | $ | ( | ) | $ | |||||||||
Selling, general and administrative expenses | $ | $ | — | $ | — | $ | $ | ||||||||||||
Total operating costs and expenses, net | $ | $ | — | $ | ( | ) | $ | ( | ) | $ | |||||||||
Earnings from operations | $ | $ | ( | ) | $ | — | $ | — | $ | ||||||||||
Earnings from continuing operations and before income taxes | $ | $ | ( | ) | $ | — | $ | — | $ | ||||||||||
Income tax expense | $ | $ | ( | ) | $ | — | $ | — | $ | ||||||||||
Earnings from continuing operations | $ | $ | ( | ) | $ | — | $ | — | $ | ||||||||||
Net earnings | $ | $ | ( | ) | $ | — | $ | — | $ | ||||||||||
Consolidated Balance Sheet | |||||||||||||||||||
September 29, 2019 | |||||||||||||||||||
Prepaid expenses | $ | $ | $ | — | $ | — | $ | ||||||||||||
Total current assets | $ | $ | $ | — | $ | — | $ | ||||||||||||
Deferred tax assets | $ | $ | ( | ) | $ | — | $ | — | $ | ||||||||||
Other assets, net | $ | $ | $ | — | $ | — | $ | ||||||||||||
Total other assets | $ | $ | ( | ) | $ | — | $ | — | $ | ||||||||||
Total assets | $ | $ | ( | ) | $ | — | $ | — | $ | ||||||||||
Accrued liabilities | $ | $ | ( | ) | $ | — | $ | — | $ | ||||||||||
Total current liabilities | $ | $ | ( | ) | $ | — | $ | — | $ | ||||||||||
Other long-term liabilities | $ | $ | ( | ) | $ | — | $ | — | $ | ||||||||||
Total long-term liabilities | $ | $ | ( | ) | $ | — | $ | — | $ | ||||||||||
Retained earnings | $ | $ | $ | — | $ | — | $ | ||||||||||||
Total stockholders’ deficit | $ | ( | ) | $ | $ | — | $ | — | $ | ( | ) | ||||||||
Total liabilities and stockholders’ deficit | $ | $ | ( | ) | $ | — | $ | — | $ | ||||||||||
The adoption of ASC 606 had no impact on our cash provided by or used in operating, investing or financing activities as previously reported in the accompanying consolidated statement of cash flows.
In March 2017, the FASB issued ASU 2017-07, Compensation - Retirement Benefits (Topic 715): Improving the Presentation of Net Periodic Pension Cost and Net Periodic Postretirement Benefit Cost. This standard requires the presentation of the service cost component of net benefit cost to be in the same line item as other compensation costs arising from services rendered by the pertinent employees during the period. All other components of net benefit cost should be presented separately from the service cost component and outside of a subtotal of earnings from operations, or separately disclosed. We adopted this standard in the first quarter of fiscal 2019 applying the retrospective method. As a result of the adoption, 2018 and 2017 amounts of $1.8 million and $3.4 million, respectively, previously reported within “Selling, general, and administrative expenses” have been reclassified to a separate line under earnings from operations to conform to current year presentation.
F-14
JACK IN THE BOX INC. AND SUBSIDIARIES
NOTES TO CONSOLIDATED FINANCIAL STATEMENTS
Effect of new accounting pronouncements to be adopted in future periods — In February 2016, the FASB issued ASU 2016-02, Leases (Topic 842) (as subsequently amended by ASU 2018-01, ASU 2018-10, ASU 2018-11, ASU 2018-20 and ASU 2019-01) which requires a lessee to recognize assets and liabilities on the balance sheet for those leases classified as operating leases under previous guidance. Substantially all the Company’s operating lease commitments will be subject to the new guidance and recognized as operating lease liabilities and right of use assets upon adoption, resulting in a significant increase in the assets and liabilities on our consolidated balance sheets. We do not expect the adoption of this guidance to have a material impact on our consolidated statements of earnings and statements of cash flows.
We are required to adopt this standard in the first quarter of fiscal 2020 and have elected to utilize the alternative transition method, whereby an entity records a cumulative adjustment to opening retained earnings in the year of adoption without restating prior periods. We will elect the transition package of three practical expedients, which, among other items, permits us not to reassess under the new standard our prior conclusions about lease identification, lease classification and initial direct costs. We will also elect the short-term lease recognition exemption for all leases that qualify, permitting us to not apply the recognition requirements of this standard to leases with a term of 12 months or less and an accounting policy to not separate lease and non-lease components for certain classes of assets. We will not elect the use-of-hindsight practical expedient, and therefore will continue to utilize lease terms determined under the existing lease guidance.
We are in the final phase of our adoption plan. We are substantially complete with our scoping analysis, data gathering process to ensure the completeness and accuracy of our current leasing portfolio, and testing of our existing leasing system for compliance with Topic 842, and are in the process of finalizing our accounting policies, processes, disclosures and internal controls over financial reporting.
For our real estate operating leases, we expect the adoption of the new guidance will result in the recognition of approximately $950 million of operating lease liabilities based on the present value of the remaining minimum rental payments using discount rates as of the effective date. We expect to record corresponding right of use assets of approximately $900 million, based on the operating lease liabilities adjusted for certain lease related assets and liabilities and the impairment of certain right of use assets recognized as a cumulative effect adjustment in retained earnings as of the adoption date. We do not expect operating lease liabilities and right of use assets related to our other contracts to be material.
The accounting guidance for lessors remains largely unchanged from previous guidance, except for the presentation of certain lease costs that the Company passes through to lessees, including but not limited to, property taxes and maintenance. These costs are generally paid by the Company and reimbursed by the lessee. Historically, these costs have been recorded on a net basis in the consolidated statements of operations but will be presented gross upon adoption of the new guidance. As a result, we expect an increase in our annual revenues and expenses of approximately $5.0 million after adoption.
We reviewed all other recently issued accounting pronouncements and concluded that they were either not applicable or not expected to have a significant impact on our consolidated financial statements.
2. REVENUE
Nature of products and services — We derive revenue from retail sales at Jack in the Box company-operated restaurants and rental revenue, royalties, advertising, and franchise and other fees from franchise-operated restaurants.
Our franchise arrangements generally provide for an initial franchise fee of $50,000 per restaurant and generally require that franchisees pay royalty and marketing fees at 5 % of gross sales. The agreement also requires franchisees to pay sourcing, technology support and other miscellaneous fees.
F-15
JACK IN THE BOX INC. AND SUBSIDIARIES
NOTES TO CONSOLIDATED FINANCIAL STATEMENTS
Disaggregation of revenue — The following table disaggregates revenue by primary source for the fiscal year ended September 29, 2019 (in thousands):
2019 | ||||
Sources of revenue: | ||||
Company restaurant sales | $ | |||
Franchise rental revenues | ||||
Franchise royalties | ||||
Marketing fees | ||||
Technology and sourcing fees | ||||
Franchise fees and other services | ||||
Total revenue | $ | |||
Contract liabilities — Our contract liabilities consist of deferred revenue resulting from initial fees received from franchisees for new restaurant openings or new franchise terms, which are generally recognized over the franchise term. We classify these contract liabilities as “Accrued liabilities” and “Other long-term liabilities” in our consolidated balance sheets.
A summary of significant changes in our contract liabilities between the date of adoption (October 1, 2018) and September 29, 2019 is presented below (in thousands):
Deferred Franchise Fees | ||||
Deferred franchise fees at October 1, 2018 | $ | |||
Revenue recognized during the period | ( | ) | ||
Additions during the period | ||||
Deferred franchise fees at September 29, 2019 | $ | |||
The following table reflects the estimated franchise fees to be recognized in the future related to performance obligations that are unsatisfied at the end of the period (in thousands):
2020 | $ | |||
2021 | ||||
2022 | ||||
2023 | ||||
2024 | ||||
Thereafter | ||||
$ | ||||
F-16
JACK IN THE BOX INC. AND SUBSIDIARIES
NOTES TO CONSOLIDATED FINANCIAL STATEMENTS
3. SUMMARY OF REFRANCHISINGS, FRANCHISEE DEVELOPMENT AND ACQUISITIONS
Refranchisings and franchisee development — The following table summarizes the number of restaurants sold to franchisees, the number of restaurants developed by franchisees, and gains recognized in each fiscal year ( dollars in thousands):
2019 | 2018 | 2017 | ||||||||||
Restaurants sold to franchisees | ||||||||||||
New restaurants opened by franchisees | ||||||||||||
Proceeds from the sale of company-operated restaurants: | ||||||||||||
Cash (1) | $ | $ | $ | |||||||||
Notes receivable | ||||||||||||
$ | $ | $ | ||||||||||
Net assets sold (primarily property and equipment) | $ | $ | ( | ) | $ | ( | ) | |||||
Lease commitment charges (2) | ( | ) | ||||||||||
Goodwill related to the sale of company-operated restaurants | ( | ) | ( | ) | ( | ) | ||||||
Other (3) | ( | ) | ( | ) | ||||||||
Gains on the sale of company-operated restaurants | $ | $ | $ | |||||||||
____________________________
(1) | Amounts in 2019, 2018, and 2017 include additional proceeds of $ |
(2) | Charges are for operating restaurant leases with lease commitments in excess of our sublease rental income. |
(3) | Amounts in 2018 primarily represent $ |
Franchise acquisitions — In 2019 and 2018 we did not acquire any franchise restaurants. In 2017 we acquired 50 franchise restaurants. Of the 50 restaurants acquired, we took over 31 restaurants as a result of an agreement with an underperforming franchisee who was in violation of franchise and lease agreements with the Company. Under this agreement, the franchisee voluntarily agreed to turn over the restaurants. The acquisition of the additional 19 restaurants in 2017 was the result of a legal action filed in September 2013 against a franchisee, from which legal action we obtained a judgment in January 2017 granting us possession of the restaurants. Of the 50 restaurants acquired in 2017, we closed eight and sold 42 to franchisees.
4. GOODWILL AND INTANGIBLE ASSETS, NET
The changes in the carrying amount of goodwill during fiscal 2019 and 2018 were as follows (in thousands):
Balance at October 1, 2017 | $ | ||
Sale of company-operated restaurants to franchisees | ( | ) | |
Balance at September 30, 2018 | |||
Sale of company-operated restaurants to franchisees | ( | ) | |
Balance at September 29, 2019 | $ | ||
Intangible assets, net, consist of the following as of the end of each fiscal year (in thousands):
2019 | 2018 | |||||||
Gross carrying amount | $ | $ | ||||||
Less accumulated amortization | ( | ) | ( | ) | ||||
Net carrying amount | $ | $ | ||||||
Amortized intangible assets include lease acquisition costs and reacquired franchise rights. Total amortization expense related to intangible assets was $0.1 million in fiscal 2019, and $0.2 million in fiscal 2018 and 2017.
F-17
JACK IN THE BOX INC. AND SUBSIDIARIES
NOTES TO CONSOLIDATED FINANCIAL STATEMENTS
The following table summarizes, as of September 29, 2019, the estimated amortization expense for each of the next five fiscal years (in thousands):
2020 | $ | ||
2021 | $ | ||
2022 | $ | ||
2023 | $ | ||
2024 | $ | ||
5. FAIR VALUE MEASUREMENTS
Financial assets and liabilities — The following table presents the financial assets and liabilities measured at fair value on a recurring basis ( in thousands):
Total | Quoted Prices in Active Markets for Identical Assets (3) (Level 1) | Significant Other Observable Inputs (3) (Level 2) | Significant Unobservable Inputs (3) (Level 3) | |||||||||||||
Fair value measurements as of September 29, 2019: | ||||||||||||||||
Non-qualified deferred compensation plan (1) | $ | $ | $ | $ | ||||||||||||
Total liabilities at fair value | $ | $ | $ | $ | ||||||||||||
Fair value measurements as of September 30, 2018: | ||||||||||||||||
Non-qualified deferred compensation plan (1) | $ | $ | $ | $ | ||||||||||||
Interest rate swaps (Note 6) (2) | ||||||||||||||||
Total liabilities at fair value | $ | $ | $ | $ | ||||||||||||
____________________________
(1) | We maintain an unfunded defined contribution plan for key executives and other members of management. The fair value of this obligation is based on the closing market prices of the participants’ elected investments. The obligation is included in “Accrued liabilities” and “Other long-term liabilities” on our consolidated balance sheets. |
(2) | We entered into interest rate swaps to reduce our exposure to rising interest rates on our variable rate debt. The fair values of our interest rate swaps are based upon Level 2 inputs, which include valuation models as reported by our counterparties. These valuation models use a discounted cash flow analysis on the cash flows of each derivative. The key inputs for the valuation models are quoted market prices, discount rates, and forward yield curves. The Company also considered its own nonperformance risk and the respective counter-party’s nonperformance risk in the fair value measurements. As further described in Note 6, Derivatives, the Company’s interest rate swaps were terminated on July 2, 2019 and settled in connection with our securitization transaction on July 8, 2019. |
At September 29, 2019, the fair value of our Class A-2 Notes was $1,344.3 million. The fair value of the Class A-2 Notes was estimated using Level 2 inputs based on quoted market prices in markets that are not considered active markets. The estimated fair values of our capital lease obligations approximated their carrying values as of September 29, 2019.
Non-financial assets and liabilities — Our non-financial instruments, which primarily consist of property and equipment, goodwill, and intangible assets, are reported at carrying value and are not required to be measured at fair value on a recurring basis. However, whenever events or changes in circumstances indicate that their carrying value may not be recoverable, non-financial instruments are assessed for impairment. If the carrying values are not fully recoverable, they are written down to fair value.
In connection with management’s decision to discontinue a long-term technology project, an impairment charge of $3.5 million was recorded in the fourth quarter of 2019. Refer to Note 9, Impairment and Other Charges, Net, for additional information regarding impairment charges.
6. DERIVATIVE INSTRUMENTS
Interest rate swaps — We have used interest rate swaps to mitigate interest rate volatility with regard to variable rate borrowings under our senior credit facility. In June 2015, we entered into forward-starting interest rate swap agreements that effectively converted $500.0 million of our variable rate borrowings to a fixed rate from October 2018 through October 2022. These agreements were designated as cash flow hedges under the terms of the FASB authoritative guidance for derivatives and hedging. To the extent that they are effective in offsetting the variability of the hedged cash flows, changes in the fair values of the derivatives are not
F-18
JACK IN THE BOX INC. AND SUBSIDIARIES
NOTES TO CONSOLIDATED FINANCIAL STATEMENTS
included in earnings, but are included in OCI. These changes in fair value were subsequently reclassified into net earnings as a component of interest expense as the hedged interest payments were made on our variable rate debt.
Effective July 2, 2019, the Company terminated all interest rate swap agreements in anticipation of the securitization transaction and related retirement of our senior credit facility (see Note 7, Indebtedness). The fair value of the interest rate swaps at the termination date was $23.6 million, which was required to be paid in full on July 8, 2019. As a result of the decision to extinguish the senior credit facility, forecasted cash flows associated with the variable-rate debt interest payments were no longer considered to be probable. Consequently, unrealized losses in other comprehensive income at the termination date were immediately reclassified to “Interest expense, net” in the accompanying consolidated statement of earnings.
Financial position — The following derivative instruments were outstanding as of the end of each fiscal year ( in thousands):
Balance Sheet Location | Fair Value | |||||||||
2019 | 2018 | |||||||||
Derivatives designated as hedging instruments: | ||||||||||
Interest rate swaps | Accrued liabilities | $ | $ | ( | ) | |||||
Interest rate swaps | Other long-term liabilities | ( | ) | |||||||
Interest rate swaps | Other assets, net | |||||||||
Total derivatives (Note 5) | $ | $ | ( | ) | ||||||
Financial performance — The following table summarizes the accumulated OCI activity related to our interest rate swap derivative instruments in each fiscal year ( in thousands):
Location in Income | 2019 | 2018 | 2017 | |||||||||||
(Loss) gain recognized in OCI | N/A | $ | ( | ) | $ | $ | ||||||||
Loss reclassified from accumulated OCI into net earnings | Interest expense, net | $ | $ | $ | ||||||||||
Amounts reclassified from accumulated OCI into interest expense represent payments made to the counterparty for the effective portions of the interest rate swaps. During the fiscal years presented, our interest rate swaps had no hedge ineffectiveness.
7. INDEBTEDNESS
The detail of our long-term debt at the end of each fiscal year is as follows (in thousands):
2019 | 2018 | |||||||
Class A-2-I Notes | $ | $ | ||||||
Class A-2-II Notes | ||||||||
Class A-2-III Notes | ||||||||
Revolving credit facility | ||||||||
Term loans | ||||||||
Capital lease obligations | ||||||||
Total debt | ||||||||
Less current maturities of long-term debt, net of $0 and $1,008 of debt issuance costs, respectively | ( | ) | ( | ) | ||||
Less unamortized debt issuance costs | ( | ) | ( | ) | ||||
Long-term debt | $ | $ | ||||||
Securitized financing transaction — On July 8, 2019, Jack in the Box Funding, LLC (the “Master Issuer”), a limited-purpose, bankruptcy-remote, wholly owned indirect subsidiary of the Company, completed its securitization transaction and issued $575.0 million of its Series 2019-1 3.982 % Fixed Rate Senior Secured Notes, Class A-2-I (the “Class A-2-I Notes”), $275.0 million of its Series 2019-1 4.476 % Fixed Rate Senior Secured Notes, Class A-2-II (the “Class A-2-II Notes”) and $450.0 million of its Series 2019-1 4.970 % Fixed Rate Senior Secured Notes, Class A-2-III (the “Class A-2-III Notes”) and together with the Class A-2-I Notes and the Class A-2-II Notes, (the “Class A-2 Notes”), in an offering exempt from registration under the Securities Act of 1933, as amended. In connection with the issuance of the Class A-2 Notes, the Master Issuer also entered into a revolving financing facility of Series 2019-1 Variable Funding Senior Secured Notes, Class A-1 (the “Variable Funding Notes”), which allows for the drawing of up to $150.0 million under the Variable Funding Notes and the issuance of letters of credit. The Class A-2 Notes and the Variable Funding Notes are referred to collectively as the “Notes.”
F-19
JACK IN THE BOX INC. AND SUBSIDIARIES
NOTES TO CONSOLIDATED FINANCIAL STATEMENTS
The Notes were issued in a privately placed securitization transaction pursuant to which certain of the Company’s revenue-generating assets, consisting principally of franchise-related agreements, real estate assets, and intellectual property and license agreements for the use of intellectual property, are held by the Master Issuer and certain other limited-purpose, bankruptcy remote, wholly owned indirect subsidiaries of the Company that act as Guarantors (as defined below) of the Notes and that have pledged substantially all of their assets, excluding certain real estate assets and subject to certain limitations, to secure the Notes.
Class A-2 Notes — Interest and principal payments on the Class A-2 Notes are payable on a quarterly basis. In general, no principal payments will be required if a specified leverage ratio, which is a measure of outstanding debt to earnings before interest, taxes, depreciation, and amortization, adjusted for certain items (as defined in the Indenture), is less than or equal to 5.0 x. As of September 29, 2019, the Company’s actual leverage ratio was under 5.0 x; accordingly, no principal payment on the Class A-2 Notes was required. The legal final maturity date of the Class A-2 Notes is in August 2049, but it is expected that, unless earlier prepaid to the extent permitted under the Indenture, the anticipated repayment dates of the Class A-2-I Notes, the Class A-2-II Notes and the Class A-2-III Notes will be August 2023, August 2026 and August 2029, respectively (the “Anticipated Repayment Dates”). If the Master Issuer has not repaid or refinanced the Class A-2 Notes prior to the respective anticipated repayment date, additional interest will accrue pursuant to the Indenture. The Class A-2 Notes are secured by the collateral described below under “Guarantees and Collateral.”
Variable Funding Notes — The Variable Funding Notes were issued under the Indenture and allow for drawings on a revolving basis and the issuance of letters of credit. Depending on the type of borrowing under the Variable Funding Notes, interest on the Variable Funding Notes will be based on (i) the prime rate, (ii) overnight federal funds rates, (iii) the London interbank offered rate for U.S. Dollars or (iv) the lenders’ commercial paper funding rate plus any applicable margin, as set forth in the Variable Funding Note Purchase Agreement. There is a scaled commitment fee on the unused portion of the Variable Funding Notes facility of between 50 and 100 basis points. It is anticipated that the principal and interest on the Variable Funding Notes will be repaid in full on or prior to August 2024, subject to two one-year extensions at the option of the Company. Following the anticipated repayment date (and any extensions thereof), additional interest will accrue equal to 5.00 % per annum. As of September 29, 2019, $45.6 million of letters of credit were outstanding against the Variable Funding Notes, which relate primarily to interest reserves required under the Indenture. The Variable Funding Notes were undrawn at September 29, 2019.
Guarantees and collateral — Pursuant to the Guarantee and Collateral Agreement, dated July 8, 2019 (the “Guarantee and Collateral Agreement”), among the Guarantors, in favor of the trustee, the Guarantors guarantee the obligations of the Master Issuer under the Indenture and related documents and secure the guarantee by granting a security interest in substantially all of their assets. The Notes are secured by a security interest in substantially all of the assets of the Master Issuer and the Guarantors (collectively, the “Securitization Entities”). The assets of the Securitization Entities include most of the revenue-generating assets of the Company and its subsidiaries, which principally consist of franchise-related agreements, certain company-operated restaurants, intellectual property and license agreements for the use of intellectual property. Upon certain trigger events, mortgages will be required to be prepared and recorded on the real estate assets.
Covenants and restrictions — The Notes are subject to a series of covenants and restrictions customary for transactions of this type, including (i) that the Master Issuer maintains specified reserve accounts to be used to make required payments in respect of the Notes, (ii) provisions relating to optional and mandatory prepayments and the related payment of specified amounts, including specified make-whole payments in the case of the Class A-2 Notes under certain circumstances, (iii) certain indemnification payments in the event, among other things, the assets pledged as collateral for the Notes are in stated ways defective or ineffective and (iv) covenants relating to recordkeeping, access to information and similar matters. The Notes are also subject to customary rapid amortization events provided for in the Indenture, including events tied to failure to maintain stated debt service coverage ratios, the sum of global gross sales for specified restaurants being below certain levels on certain measurement dates, certain manager termination events, an event of default, and the failure to repay or refinance the Class A-2 Notes on the applicable scheduled maturity date. The Notes are also subject to certain customary events of default, including events relating to non-payment of required interest, principal, or other amounts due on or with respect to the Notes, failure to comply with covenants within certain time frames, certain bankruptcy events, breaches of specified representations and warranties, failure of security interests to be effective, and certain judgments.
In accordance with the Indenture, certain cash accounts have been established with the Indenture trustee for the benefit of the note holders, and are restricted in their use. As of September 29, 2019, the Master Issuer had restricted cash of $26.0 million, which primarily represented cash collections and cash reserves held by the trustee to be used for payments of principal, interest and commitment fees required for the Notes.
F-20
JACK IN THE BOX INC. AND SUBSIDIARIES
NOTES TO CONSOLIDATED FINANCIAL STATEMENTS
Deferred financing costs — The Company incurred costs of approximately $33.0 million in connection with the securitization transaction. The costs related to our Class A-2 Notes are presented as a reduction in “Long-term debt, net of current maturities” and are being amortized over the Anticipated Repayment Dates, utilizing the effective interest rate method. The costs related to our Variable Funding Notes are presented within “Other assets, net” and are being amortized over the Anticipated Repayment Date of August 2026 using the straight-line method. As of September 29, 2019, the effective interest rates, including the amortization of debt issuance costs, were 4.541 %, 4.798 %, and 5.196 % for the Class A-2-I Notes, Class A-2-II, Notes and Class A-2-III Notes, respectively.
Amended credit facility — On May 1, 2019, we entered into the Fifth Amendment to the Credit Agreement (the “Fifth Amendment”). The Fifth Amendment extended the maturity date of both our term loan and revolving credit facility from March 19, 2020 to March 19, 2021. Fees of $1.3 million paid to third parties in connection with the Fifth Amendment were capitalized as deferred loan costs during the third quarter.
The proceeds from the issuance of the Class A-2 Notes, were used to repay the remaining principal outstanding on the term loans and revolving credit facility. As a result, a loss on early extinguishment of debt of $2.8 million was recorded in fiscal 2019, primarily consisting of the write-off of unamortized deferred financing costs related to the Credit Agreement, and is reflected in “Interest expense, net” in the consolidated statement of earnings.
Maturities of long-term debt — Assuming repayment by the Anticipated Repayment Dates and based on the leverage ratio as of September 29, 2019, principal payments on our long-term debt outstanding at September 29, 2019 for each of the next five fiscal years and thereafter are as follows (in thousands):
2020 | $ | |||
2021 | ||||
2022 | ||||
2023 | ||||
2024 | ||||
Thereafter | ||||
$ | ||||
8. LEASES
As lessee — We lease restaurants and other facilities, which generally have renewal clauses of 1 to 20 years exercisable at our option. In some instances, these leases have provisions for contingent rentals based upon a percentage of defined revenues. Many of our restaurant and other facility leases also have rent escalation clauses and require the payment of property taxes, insurance, and maintenance costs. We also lease certain restaurant and office equipment. Minimum rental obligations are accounted for on a straight-line basis over the term of the initial lease, plus lease option terms for certain locations.
The components of rent expense were as follows in each fiscal year (in thousands):
2019 | 2018 | 2017 | ||||||||||
Minimum rentals | $ | $ | $ | |||||||||
Contingent rentals | ||||||||||||
Total rent expense | ||||||||||||
Less rental expense on subleased properties | ( | ) | ( | ) | ( | ) | ||||||
Net rent expense | $ | $ | $ | |||||||||
F-21
JACK IN THE BOX INC. AND SUBSIDIARIES
NOTES TO CONSOLIDATED FINANCIAL STATEMENTS
The following table presents as of September 29, 2019, future minimum lease payments under capital and operating leases, including leases recorded as lease obligations (in thousands):
Fiscal Year | Capital Leases | Operating Leases | ||||||
2020 | $ | $ | ||||||
2021 | ||||||||
2022 | ||||||||
2023 | ||||||||
2024 | ||||||||
Thereafter | ||||||||
Total minimum lease payments | $ | |||||||
Less amount representing interest, 3.40% weighted-average interest rate | ( | ) | ||||||
Present value of obligations under capital leases | ||||||||
Less current portion | ( | ) | ||||||
Long-term capital lease obligations | $ | |||||||
Assets recorded under capital leases are included in property and equipment, and consisted of the following at each fiscal year-end (in thousands):
2019 | 2018 | |||||||
Buildings | $ | $ | ||||||
Equipment | ||||||||
Less accumulated amortization | ( | ) | ( | ) | ||||
$ | $ | |||||||
Amortization of assets under capital leases is included in depreciation and amortization expense in the consolidated statements of earnings.
As lessor — We lease or sublease restaurants to certain franchisees and others under agreements that generally provide for the payment of percentage rentals in excess of stipulated minimum rentals, usually for a period up to 20 years. Most of our leases have rent escalation clauses and renewal clauses of 5 to 20 years. The following table summarizes rents received under these agreements in each fiscal year ( in thousands):
2019 | 2018 | 2017 | ||||||||||
Total rental income (1) | $ | $ | $ | |||||||||
Contingent rentals | $ | $ | $ | |||||||||
(1) |
The minimum rents receivable expected to be received under these non-cancelable operating leases and subleases, including leases recorded as lease obligations relating to continuing and discontinuing operations, and excluding contingent rentals, as of September 29, 2019 are as follows (in thousands):
Fiscal Year | |||
2020 | $ | ||
2021 | |||
2022 | |||
2023 | |||
2024 | |||
Thereafter | |||
Total minimum future rent receivable | $ | ||
F-22
JACK IN THE BOX INC. AND SUBSIDIARIES
NOTES TO CONSOLIDATED FINANCIAL STATEMENTS
Assets held for lease and included in property and equipment consisted of the following at each fiscal year-end (in thousands):
2019 | 2018 | |||||||
Land | $ | $ | ||||||
Buildings | ||||||||
Equipment | ||||||||
Less accumulated depreciation | ( | ) | ( | ) | ||||
$ | $ | |||||||
9. IMPAIRMENT AND OTHER CHARGES, NET
Impairment and other charges, net, in the accompanying consolidated statements of earnings is comprised of the following in each fiscal year (in thousands):
2019 | 2018 | 2017 | ||||||||||
Restructuring costs | $ | $ | $ | |||||||||
Costs of closed restaurants and other | ||||||||||||
(Gains) losses on disposition of property and equipment, net | ( | ) | ||||||||||
Accelerated depreciation | ||||||||||||
Operating restaurant impairment charges | ||||||||||||
$ | $ | $ | ||||||||||
Restructuring costs — Restructuring charges include costs resulting from the exploration of strategic alternatives (the “Strategic Alternatives Evaluation”) in 2019, and a plan that management initiated to reduce our general and administrative costs. Restructuring charges in 2018 also include costs related to the evaluation of potential alternatives with respect to the Qdoba brand (the “Qdoba Evaluation”), which resulted in the Qdoba Sale. Refer to Note 10, Discontinued Operations, for information regarding the Qdoba Sale.
The following is a summary of the costs incurred in connection with these activities during each fiscal year (in thousands):
2019 | 2018 | 2017 | ||||||||||
Employee severance and related costs | $ | $ | $ | |||||||||
Strategic Alternatives Evaluation (1) | ||||||||||||
Qdoba Evaluation (2) | ||||||||||||
Other | ||||||||||||
$ | $ | $ | ||||||||||
___________________________________________
(1) | Strategic Alternative Evaluation costs are primarily related to third party advisory services. |
(2) | Qdoba Evaluation consulting costs are primarily related to third party advisory services and retention compensation. |
Total accrued severance costs related to our restructuring activities are included in “Accrued liabilities” and changed as follows during fiscal 2019 (in thousands):
Balance as of September 30, 2018 | $ | |||
Costs incurred | ||||
Accruals released | ( | ) | ||
Cash payments | ( | ) | ||
Balance as of September 29, 2019 | $ | |||
F-23
JACK IN THE BOX INC. AND SUBSIDIARIES
NOTES TO CONSOLIDATED FINANCIAL STATEMENTS
Costs of closed restaurants and other — Costs of closed restaurants in all years include future lease commitment charges and expected ancillary costs, net of anticipated sublease rentals, impairment and other costs associated with closed restaurants, and canceled project costs. During the fourth quarter of 2019, the Company recorded a charge of $3.5 million related to the write-off of software development costs as a result of management’s decision to discontinue a long-term technology project.
Accrued restaurant closing costs included in “Accrued liabilities” and “Other long-term liabilities” changed as follows during fiscal 2019 (in thousands):
Balance as of September 30, 2018 | $ | |||
Adjustments (1) | ||||
Interest expense | ||||
Cash payments | ( | ) | ||
Balance as of September 29, 2019 (2) (3) | $ | |||
___________________________________________
(1) | Adjustments relate primarily to revisions of certain sublease and cost assumptions. Our estimates related to our future lease obligations, primarily the sublease income we anticipate, are subject to a high degree of judgment and may differ from actual sublease income due to changes in economic conditions, desirability of the sites, and other factors. |
(2) |
(3) | This balance excludes $ |
Accelerated depreciation — When a long-lived asset will be replaced or otherwise disposed of prior to the end of its estimated useful life, the useful life of the asset is adjusted based on the estimated disposal date and accelerated depreciation is recognized. In fiscal 2019, accelerated depreciation primarily related to information technology and facility improvements. In fiscal 2018, accelerated depreciation was primarily related to the replacement of computer hardware, restaurant remodels, and exterior enhancements at our company-operated restaurants. In fiscal 2017, accelerated depreciation primarily related to restaurant remodels and the anticipated closure of three company-owned restaurants.
10. DISCONTINUED OPERATIONS
Qdoba — On December 19, 2017, we entered into a stock purchase agreement (the “Qdoba Purchase Agreement”) with the Buyer to sell all issued and outstanding shares of Qdoba (the “Shares”). The Buyer completed the acquisition of Qdoba on March 21, 2018 (the “Qdoba Sale”) for an aggregate purchase price of approximately $298.5 million.
We also entered into a Transition Services Agreement with the Buyer pursuant to which the Buyer received certain services (the “Services”) to enable it to operate the Qdoba business after the closing of the Qdoba Sale. The Services included information technology, finance and accounting, human resources, supply chain and other corporate support services. Under the Agreement, the Services were provided at cost for a period of up to 12 months, with two 3 -month extensions available for certain services. As of September 21, 2019, we are no longer providing transition services to Qdoba. In fiscal 2019 and 2018 we recorded $7.0 million and $7.9 million, respectively, related to the Services as a reduction of “Selling, general, and administrative expenses” in the consolidated statements of earnings.
Further, in 2018, we entered into an Employee Agreement with the Buyer pursuant to which we continued to employ all Qdoba employees who work for the Buyer (the “Qdoba Employees”) from the date of closing of the Qdoba Sale through December 31, 2018. During the term of the Employee Agreement, we paid all wages and benefits of the Qdoba Employees and received reimbursement of these costs from the Buyer. From October 1, 2018 to December 31, 2018, we paid $35.4 million of Qdoba wages and benefits pursuant to the Employee Agreement.
As the Qdoba Sale represented a strategic shift that had a major effect on our operations and financial results, in accordance with the provisions of FASB authoritative guidance on the presentation of financial statements, Qdoba results are classified as discontinued operations in our consolidated statements of earnings and our consolidated statements of cash flows for all periods presented.
Income taxes — In fiscal 2019, the Company entered into a bilateral California election with Quidditch Acquisition, Inc. to retroactively treat the divestment of Qdoba Restaurant Corporation on March 21, 2018 as a sale of assets instead of a stock sale for income tax purposes. This election reduced the Company’s fiscal year 2018 California tax liability on the divestment by $2.8 million.
F-24
JACK IN THE BOX INC. AND SUBSIDIARIES
NOTES TO CONSOLIDATED FINANCIAL STATEMENTS
The following table summarizes the Qdoba results for each period (in thousands, except per share data):
2019 | 2018 | 2017 | ||||||||||
Company restaurant sales | $ | $ | $ | |||||||||
Franchise revenues | ||||||||||||
Company restaurant costs (excluding depreciation and amortization) | ( | ) | ( | ) | ||||||||
Franchise costs (excluding depreciation and amortization) | ( | ) | ( | ) | ||||||||
Selling, general and administrative expenses | ( | ) | ( | ) | ||||||||
Depreciation and amortization | ( | ) | ( | ) | ||||||||
Impairment and other charges, net | ( | ) | ( | ) | ( | ) | ||||||
Interest expense, net | ( | ) | ( | ) | ||||||||
Operating (loss) earnings from discontinued operations before income taxes | ( | ) | ||||||||||
(Loss) gain on Qdoba Sale | ( | ) | ||||||||||
(Loss) earnings from discontinued operations before income taxes | ( | ) | ||||||||||
Income tax benefit (expense) | ( | ) | ( | ) | ||||||||
Earnings from discontinued operations, net of income taxes | $ | $ | $ | |||||||||
Net earnings per share from discontinued operations: | ||||||||||||
Basic | $ | $ | $ | |||||||||
Diluted | $ | $ | $ | |||||||||
Selling, general and administrative expenses presented in the table above include corporate costs directly in support of Qdoba operations. All other corporate costs were classified in results of continuing operations. Our credit facility required us to make a mandatory prepayment (“Qdoba Prepayment”) on our term loan upon the closing of the Qdoba Sale, which was $260.0 million. Interest expense associated with our credit facility was allocated to discontinued operations based on our estimate of the mandatory prepayment that was made upon closing of the Qdoba Sale.
Lease guarantees — While all operating leases held in the name of Qdoba were part of the Qdoba Sale, some of the leases remain guaranteed by the Company pursuant to one or more written guarantees (the “Guarantees”). In the event Qdoba fails to meet its payment and performance obligations under such guaranteed leases, we may be required to make rent and other payments to the landlord under the requirements of the Guarantees. Should we, as guarantor of the lease obligations, be required to make any lease payments due for the remaining term of the subject lease(s) subsequent to March 21, 2018, the maximum amount we may be required to pay is approximately $32.1 million as of September 29, 2019. The lease terms extend for a maximum of approximately 16 more years as of September 29, 2019, and we would remain a guarantor of the leases in the event the leases are extended for any established renewal periods. In the event that we are obligated to make payments under the Guarantees, we believe the exposure is limited due to contractual protections and recourse available in the lease agreements, as well as the Qdoba Purchase Agreement, including a requirement of the landlord to mitigate damages by re-letting the properties in default, and indemnity from the Buyer. Qdoba continues to meet its obligations under these leases and there have not been any events that would indicate that Qdoba will not continue to meet the obligations of the leases. As such, we have not recorded a liability for the Guarantees as of September 29, 2019 as the likelihood of Qdoba defaulting on the assigned agreements was deemed to be less than probable.
F-25
JACK IN THE BOX INC. AND SUBSIDIARIES
NOTES TO CONSOLIDATED FINANCIAL STATEMENTS
11. INCOME TAXES
Income taxes consist of the following in each fiscal year (in thousands):
2019 | 2018 | 2017 | ||||||||||
Current: | ||||||||||||
Federal | $ | $ | $ | |||||||||
State | ||||||||||||
Deferred: | ||||||||||||
Federal | ( | ) | ||||||||||
State | ( | ) | ||||||||||
( | ) | |||||||||||
Income tax expense from continuing operations | $ | $ | $ | |||||||||
Income tax expense (benefit) from discontinued operations | $ | ( | ) | $ | $ | ( | ) | |||||
A reconciliation of the federal statutory income tax rate to our effective tax rate for continuing operations is as follows:
2019 | 2018 | 2017 | |||||||
Income tax expense at federal statutory rate | % | % | % | ||||||
State income taxes, net of federal tax benefit | % | % | % | ||||||
One-time, non-cash impact of the Tax Act | % | % | % | ||||||
Stock compensation excess tax benefit | ( | )% | ( | )% | % | ||||
Benefit of jobs tax credits, net of valuation allowance | ( | )% | ( | )% | ( | )% | |||
Release of federal tax liability | ( | )% | % | % | |||||
Adjustment to state tax provision | ( | )% | % | % | |||||
Benefit related to COLIs | ( | )% | ( | )% | ( | )% | |||
Termination of interest rate swaps | ( | )% | % | % | |||||
Other, net | % | ( | )% | ( | )% | ||||
% | % | % | |||||||
F-26
JACK IN THE BOX INC. AND SUBSIDIARIES
NOTES TO CONSOLIDATED FINANCIAL STATEMENTS
The tax effects of temporary differences that give rise to significant portions of deferred tax assets and deferred tax liabilities at each fiscal year-end are presented below (in thousands):
2019 | 2018 | |||||||
Deferred tax assets: | ||||||||
Accrued defined benefit pension and postretirement benefits | $ | $ | ||||||
Deferred income | ||||||||
Impairment | ||||||||
Accrued insurance | ||||||||
Share-based compensation | ||||||||
Tax loss and tax credit carryforwards | ||||||||
Lease commitments related to closed or refranchised locations | ||||||||
Deferred interest deduction | ||||||||
Other reserves and allowances | ||||||||
Accrued incentive compensation | ||||||||
Accrued compensation expense | ||||||||
Interest rate swaps | ||||||||
Other, net | ||||||||
Total gross deferred tax assets | ||||||||
Valuation allowance | ( | ) | ( | ) | ||||
Total net deferred tax assets | ||||||||
Deferred tax liabilities: | ||||||||
Intangible assets | ( | ) | ( | ) | ||||
Leasing transactions | ( | ) | ( | ) | ||||
Property and equipment, principally due to differences in depreciation | ( | ) | ( | ) | ||||
Other | ( | ) | ( | ) | ||||
Total gross deferred tax liabilities | ( | ) | ( | ) | ||||
Net deferred tax assets | $ | $ | ||||||
The Tax Act was enacted into law on December 22, 2017. The Tax Act included a reduction in the U.S. federal statutory corporate income tax rate (the “Tax Rate”) from 35% to 21% and introduced new limitations on certain business deductions. As a result, for the fiscal year ended September 30, 2018, we recognized a year-to-date, non-cash $32.5 million tax provision expense impact primarily related to the re-measurement of our deferred tax assets and liabilities due to the reduced Tax Rate.
Deferred tax assets as of September 29, 2019 include state net operating loss carry-forwards of approximately $27.4 million expiring at various times between 2020 and 2038. At September 29, 2019, we recorded a valuation allowance of $2.5 million related to losses and state tax credits, which decreased from the $3.6 million at September 30, 2018 primarily due to the release of the valuation allowance on prior year net operating losses. We believe that it is more likely than not that these net operating loss and credit carry-forwards will not be realized and that all other deferred tax assets will be realized through future taxable income or alternative tax strategies.
The major jurisdictions in which the Company files income tax returns include the United States and states in which we operate that impose an income tax. The federal statutes of limitations have not expired for fiscal years 2016 and forward. The statutes of limitations for California and Texas, which constitute the Company’s major state tax jurisdictions, have not expired for fiscal years 2015 and forward.
F-27
JACK IN THE BOX INC. AND SUBSIDIARIES
NOTES TO CONSOLIDATED FINANCIAL STATEMENTS
12. RETIREMENT PLANS
We sponsor programs that provide retirement benefits to our employees. These programs include defined contribution plans, defined benefit pension plans, and postretirement healthcare plans.
Defined contribution plans — We maintain a qualified savings plan pursuant to Section 401(k) of the Internal Revenue Code (“IRC”). The plan allows all employees who have satisfied the service requirements and reached age 21 to defer a percentage of their pay on a pre-tax basis. Beginning January 1, 2016, we match 100 % of the first 4 % of compensation deferred by the participant. A participant’s right to Company contributions vest immediately. Our contributions under this plan were $1.7 million in fiscal 2019, and $2.2 million and $1.9 million in fiscal 2018 and 2017, respectively.
We also maintain an unfunded, non-qualified deferred compensation plan for key executives and other members of management whose compensation deferrals or company matching contributions to the qualified savings plan are limited due to IRC rules. Effective January 1, 2016, this non-qualified plan was amended to replace the company matching contribution with an annual restoration match that is intended to “restore” up to the full match for participants whose elective deferrals (and related company matching contributions) to the qualified savings plan were limited due to IRC rules. A participant’s right to the Company restoration match vests immediately. This plan allows participants to defer up to 50 % of their salary and 85 % of their bonus, on a pre-tax basis. In addition, to compensate executives who were hired or promoted into an eligible position prior to May 7, 2015 and who may no longer participate in our supplemental defined benefit pension plan, we also contribute a supplemental amount equal to 4 % of an eligible employee’s salary and bonus for a period of 10 years in such eligible position. Our contributions under the non-qualified deferred compensation plan were $0.2 million in fiscal 2019, and $0.2 million, and $0.5 million in fiscal 2018 and 2017, respectively.
Defined benefit pension plans — We sponsor two defined benefit pension plans, a “Qualified Plan” covering substantially all full-time employees hired prior to January 1, 2011, and an unfunded supplemental executive retirement plan (“SERP”) that provides certain employees additional pension benefits and was closed to new participants effective January 1, 2007. In fiscal 2011, the Board of Directors approved changes to our Qualified Plan whereby participants will no longer accrue benefits effective December 31, 2015. Benefits under both plans are based on the employees’ years of service and compensation over defined periods of employment.
In the fourth quarter of 2019, the Company amended its Qualified Plan to add a limited lump sum payment window whereby certain terminated participants with a vested pension benefit could elect to receive an immediate lump sum or monthly annuity payment of their accrued benefit. The offering period began September 16, 2019 and ended on or around October 31, 2019. The participants that elect a lump sum benefit under the program will be paid in December 2019. The estimated impact of the bulk lump sum offering was taken into consideration in connection with the Qualified Plan’s fiscal year-end pension benefit obligation (“PBO”) measurement. The Company assumed a 40 % participant acceptance rate which resulted in a $25.6 million reduction in the Company’s PBO as of September 29, 2019. In accordance with the FASB authoritative guidance for pension plans, the expected settlement loss related to the offering will be recorded in the period the lump sum payments are made (the first quarter of fiscal 2020).
Postretirement healthcare plans — We also sponsor two healthcare plans, closed to new participants, that provide postretirement medical benefits to certain employees who have met minimum age and service requirements. The plans are contributory, with retiree contributions adjusted annually, and contain other cost-sharing features such as deductibles and coinsurance.
F-28
JACK IN THE BOX INC. AND SUBSIDIARIES
NOTES TO CONSOLIDATED FINANCIAL STATEMENTS
Obligations and funded status — The following table provides a reconciliation of the changes in benefit obligations, plan assets, and funded status of our retirement plans for each fiscal year ( in thousands):
Qualified Plan | SERP | Postretirement Health Plans | ||||||||||||||||||||||
2019 | 2018 | 2019 | 2018 | 2019 | 2018 | |||||||||||||||||||
Change in benefit obligation: | ||||||||||||||||||||||||
Obligation at beginning of year | $ | $ | $ | $ | $ | $ | ||||||||||||||||||
Service cost | ||||||||||||||||||||||||
Interest cost | ||||||||||||||||||||||||
Participant contributions | ||||||||||||||||||||||||
Actuarial loss (gain) | ( | ) | ( | ) | ( | ) | ||||||||||||||||||
Benefits paid | ( | ) | ( | ) | ( | ) | ( | ) | ( | ) | ( | ) | ||||||||||||
Settlements | ( | ) | ( | ) | ||||||||||||||||||||
Other | ||||||||||||||||||||||||
Obligation at end of year | $ | $ | $ | $ | $ | $ | ||||||||||||||||||
Change in plan assets: | ||||||||||||||||||||||||
Fair value at beginning of year | $ | $ | $ | $ | $ | $ | ||||||||||||||||||
Actual return on plan assets | ||||||||||||||||||||||||
Participant contributions | ||||||||||||||||||||||||
Employer contributions | ||||||||||||||||||||||||
Benefits paid | ( | ) | ( | ) | ( | ) | ( | ) | ( | ) | ( | ) | ||||||||||||
Settlements | ( | ) | ( | ) | ||||||||||||||||||||
Other | ||||||||||||||||||||||||
Fair value at end of year | $ | $ | $ | $ | $ | $ | ||||||||||||||||||
Funded status at end of year | $ | ( | ) | $ | ( | ) | $ | ( | ) | $ | ( | ) | $ | ( | ) | $ | ( | ) | ||||||
Amounts recognized on the balance sheet: | ||||||||||||||||||||||||
Current liabilities | $ | $ | $ | ( | ) | $ | ( | ) | $ | ( | ) | $ | ( | ) | ||||||||||
Noncurrent liabilities | ( | ) | ( | ) | ( | ) | ( | ) | ( | ) | ( | ) | ||||||||||||
Total liability recognized | $ | ( | ) | $ | ( | ) | $ | ( | ) | $ | ( | ) | $ | ( | ) | $ | ( | ) | ||||||
Amounts in AOCI not yet reflected in net periodic benefit cost: | ||||||||||||||||||||||||
Unamortized actuarial loss (gain), net | $ | $ | $ | $ | $ | $ | ( | ) | ||||||||||||||||
Unamortized prior service cost | ||||||||||||||||||||||||
Total | $ | $ | $ | $ | $ | $ | ( | ) | ||||||||||||||||
Other changes in plan assets and benefit obligations recognized in OCI: | ||||||||||||||||||||||||
Net actuarial loss (gain) | $ | $ | ( | ) | $ | $ | ( | ) | $ | $ | ( | ) | ||||||||||||
Amortization of actuarial (loss) gain | ( | ) | ( | ) | ( | ) | ( | ) | ||||||||||||||||
Amortization of prior service cost | ( | ) | ( | ) | ||||||||||||||||||||
Total recognized in OCI | ( | ) | ( | ) | ( | ) | ||||||||||||||||||
Net periodic benefit (credit) cost and other losses | ( | ) | ( | ) | ||||||||||||||||||||
Total recognized in comprehensive income | $ | $ | ( | ) | $ | $ | ( | ) | $ | $ | ( | ) | ||||||||||||
Amounts in AOCI expected to be amortized in fiscal 2020 net periodic benefit cost: | ||||||||||||||||||||||||
Net actuarial loss | $ | $ | $ | |||||||||||||||||||||
Prior service cost | ||||||||||||||||||||||||
Total | $ | $ | $ | |||||||||||||||||||||
Additional year-end pension plan information — The PBO is the actuarial present value of benefits attributable to employee service rendered to date, including the effects of estimated future pay increases. The accumulated benefit obligation (“ABO”) also reflects the actuarial present value of benefits attributable to employee service rendered to date but does not include the effects of estimated future pay increases. Therefore, the ABO as compared to plan assets is an indication of the assets currently available to fund vested and nonvested benefits accrued through the end of the fiscal year. The funded status is measured as the difference between the fair value of a plan’s assets and its PBO.
F-29
JACK IN THE BOX INC. AND SUBSIDIARIES
NOTES TO CONSOLIDATED FINANCIAL STATEMENTS
As of September 29, 2019 and September 30, 2018, the Qualified Plan’s ABO exceeded the fair value of its plan assets. The SERP is an unfunded plan and, as such, had no plan assets as of September 29, 2019 and September 30, 2018. The following sets forth the PBO, ABO, and fair value of plan assets of our pension plans as of the measurement date in each fiscal year ( in thousands):
2019 | 2018 | |||||||
Qualified Plan: | ||||||||
Projected benefit obligation | $ | $ | ||||||
Accumulated benefit obligation | $ | $ | ||||||
Fair value of plan assets | $ | $ | ||||||
SERP: | ||||||||
Projected benefit obligation | $ | $ | ||||||
Accumulated benefit obligation | $ | $ | ||||||
Fair value of plan assets | $ | $ | ||||||
Net periodic benefit cost — The components of the fiscal year net periodic benefit cost were as follows ( in thousands):
2019 | 2018 | 2017 | ||||||||||
Qualified Plan: | ||||||||||||
Interest cost | $ | $ | $ | |||||||||
Expected return on plan assets | ( | ) | ( | ) | ( | ) | ||||||
Actuarial loss | ||||||||||||
Net periodic benefit credit | $ | ( | ) | $ | ( | ) | $ | ( | ) | |||
SERP: | ||||||||||||
Service cost | $ | $ | $ | |||||||||
Interest cost | ||||||||||||
Actuarial loss | ||||||||||||
Amortization of unrecognized prior service cost | ||||||||||||
Net periodic benefit cost | $ | $ | $ | |||||||||
Postretirement health plans: | ||||||||||||
Interest cost | $ | $ | $ | |||||||||
Actuarial (gain) loss | ( | ) | ( | ) | ||||||||
Net periodic benefit cost | $ | $ | $ | |||||||||
Changes in presentation —As discussed in Note 1, Nature of Operations and Summary of Significant Accounting Policies, we adopted ASU 2017-07 during the first quarter of 2019 using the retrospective method, which changed the financial statement presentation of service costs and the other components of net periodic benefit cost. The service cost component continues to be included in operating income; however, the other components are now presented in a separate line below earnings from operations captioned “Other pension and post-retirement expenses, net” in our consolidated statements of earnings. Further, in connection with the adoption, plan administrative expenses historically presented as a component of service cost are now presented as a component of expected return on plan assets. The prior year components of net periodic benefit costs and assumptions on the long-term rate of return on assets have been recast to conform to current year presentation.
Prior service costs are amortized on a straight-line basis from date of participation to full eligibility. Unrecognized gains or losses are amortized using the “corridor approach” under which the net gain or loss in excess of 10% of the greater of the PBO or the market-related value of the assets, if applicable, is amortized. For our Qualified Plan, actuarial losses are amortized over the average future expected lifetime of all participants expected to receive benefits. For our SERP, actuarial losses are amortized over the expected remaining future lifetime for inactive participants, and for our postretirement health plans, actuarial losses are amortized over the expected remaining future lifetime of inactive participants expected to receive benefits.
F-30
JACK IN THE BOX INC. AND SUBSIDIARIES
NOTES TO CONSOLIDATED FINANCIAL STATEMENTS
Assumptions — We determine our actuarial assumptions on an annual basis. In determining the present values of our benefit obligations and net periodic benefit costs as of and for the fiscal years ended September 29, 2019, September 30, 2018, and October 1, 2017, we used the following weighted-average assumptions:
2019 | 2018 | 2017 | ||||
Assumptions used to determine benefit obligations (1): | ||||||
Qualified Plan: | ||||||
Discount rate | ||||||
SERP: | ||||||
Discount rate | ||||||
Rate of future pay increases | ||||||
Postretirement health plans: | ||||||
Discount rate | ||||||
Assumptions used to determine net periodic benefit cost (2): | ||||||
Qualified Plan: | ||||||
Discount rate | ||||||
Long-term rate of return on assets | ||||||
SERP: | ||||||
Discount rate | ||||||
Rate of future pay increases | ||||||
Postretirement health plans: | ||||||
Discount rate | ||||||
____________________________
(1) |
(2) |
The assumed discount rates were determined by considering the average of pension yield curves constructed of a population of high-quality bonds with a Moody’s or Standard and Poor’s rating of “AA” or better whose cash flow from coupons and maturities match the year-by-year projected benefit payments from the plans. As benefit payments typically extend beyond the date of the longest maturing bond, cash flows beyond 30 years were discounted back to the 30th year and then matched like any other payment.
The assumed expected long-term rate of return on assets is the weighted-average rate of earnings expected on the funds invested or to be invested to provide for the pension obligations. The long-term rate of return on assets was determined taking into consideration our projected asset allocation and economic forecasts prepared with the assistance of our actuarial consultants.
The assumed discount rate and expected long-term rate of return on assets have a significant effect on amounts reported for our pension and postretirement plans. A quarter percentage point decrease in the discount rate and long-term rate of return used would have decreased fiscal 2019 earnings before income taxes by $0.5 million and $1.1 million, respectively.
The assumed average rate of compensation increase is the average annual compensation increase expected over the remaining employment periods for the participating employees. For our Qualified Plan, no future pay increases were included in our benefit obligation assumptions as, effective December 31, 2015, our plan participants no longer accrue benefits.
For measurement purposes, the weighted-average assumed health care cost trend rates for our postretirement health plans were as follows for each fiscal year:
2019 | 2018 | 2017 | ||||
Healthcare cost trend rate for next year: | ||||||
Participants under age 65 | ||||||
Participants age 65 or older | ||||||
Rate to which the cost trend rate is assumed to decline: | ||||||
Participants under age 65 | ||||||
Participants age 65 or older | ||||||
Year the rate reaches the ultimate trend rate: | ||||||
Participants under age 65 | ||||||
Participants age 65 or older | ||||||
F-31
JACK IN THE BOX INC. AND SUBSIDIARIES
NOTES TO CONSOLIDATED FINANCIAL STATEMENTS
The assumed healthcare cost trend rate represents our estimate of the annual rates of change in the costs of the healthcare benefits currently provided by our postretirement plans. The healthcare cost trend rate implicitly considers estimates of healthcare inflation, changes in healthcare utilization and delivery patterns, technological advances and changes in the health status of the plan participants. The healthcare cost trend rate assumption has a significant effect on the amounts reported. For example, a 1.0% change in the assumed healthcare cost trend rate would have the following effect on the fiscal 2019 net periodic benefit cost and end of year PBO (in thousands):
1% Point Increase | 1% Point Decrease | |||||||
Total interest and service cost | $ | $ | ( | ) | ||||
Postretirement benefit obligation | $ | $ | ( | ) | ||||
Plan assets — Our investment philosophy is to (1) protect the corpus of the fund; (2) establish investment objectives that will allow the market value to exceed the present value of the vested and unvested liabilities over time; while (3) obtaining adequate investment returns to protect benefits promised to the participants and their beneficiaries. Our asset allocation strategy utilizes multiple investment managers in order to maximize the plan’s return while minimizing risk. We regularly monitor our asset allocation, and senior financial management and the Finance Committee of the Board of Directors review performance results quarterly. We continually review our target asset allocation for our Qualified Plan and when changes are made, we reallocate our plan assets over a period of time, as deemed appropriate by senior financial management, to achieve our target asset allocation. Our plan asset allocation at the end of fiscal 2019 and target allocations were as follows:
2019 | Target | Minimum | Maximum | |||||
Cash & cash equivalents | ||||||||
Domestic Equities | ||||||||
International equity | ||||||||
Core fixed funds | ||||||||
High yield | ||||||||
Alternative investments | ||||||||
Real estate | ||||||||
Real return bonds | ||||||||
F-32
JACK IN THE BOX INC. AND SUBSIDIARIES
NOTES TO CONSOLIDATED FINANCIAL STATEMENTS
The Company measures its defined benefit plan assets and obligations as of the month-end date closest to its fiscal year end, which is a practical expedient under FASB authoritative guidance. The fair values of the Qualified Plan’s assets by asset category are as follows ( in thousands):
Total | Quoted Prices in Active Markets for Identical (Level 1) | Significant Other Observable Inputs (Level 2) | Significant Unobservable Inputs (Level 3) | |||||||||||||||
Items Measured at Fair Value at September 30, 2019: | ||||||||||||||||||
Asset Category: | ||||||||||||||||||
Cash and cash equivalents | (1) | $ | $ | $ | $ | |||||||||||||
Equity: | ||||||||||||||||||
U.S | (2) | |||||||||||||||||
International | (3),(4) | |||||||||||||||||
Fixed income: | ||||||||||||||||||
Investment grade | (5) | |||||||||||||||||
High yield | (6) | |||||||||||||||||
Alternatives | (4),(7) | |||||||||||||||||
Real estate | (4),(8) | |||||||||||||||||
$ | $ | $ | $ | |||||||||||||||
Items Measured at Fair Value at September 30, 2018: | ||||||||||||||||||
Asset Category: | ||||||||||||||||||
Cash and cash equivalents | (1) | $ | $ | $ | $ | |||||||||||||
Equity: | ||||||||||||||||||
U.S | (2) | |||||||||||||||||
International | (3),(4) | |||||||||||||||||
Fixed income: | ||||||||||||||||||
Investment grade | (5) | |||||||||||||||||
High yield | (6) | |||||||||||||||||
Alternatives | (4),(7) | |||||||||||||||||
Real estate | (4),(8) | |||||||||||||||||
$ | $ | $ | $ | |||||||||||||||
(1) | Cash and cash equivalents are comprised of commercial paper, short-term bills and notes, and short-term investment funds, which are valued at quoted prices in active markets for similar securities. |
(2) | U.S. equity securities are comprised of investments in common stock of U.S. companies for total return purposes. These investments are valued by the trustee at closing prices from national exchanges on the valuation date. |
(3) | International equity securities are comprised of investments in common stock of companies located outside of the U.S for total return purposes. These investments are valued by the trustee at closing prices from national exchanges on the valuation date, or the values are adjusted as a result of market movements following the close of local trading using inputs to models that are observable either directly or indirectly. The portion of these investments that are measured at fair value using the net asset value per share practical expedient (see note 4 below) can be redeemed on a monthly basis. |
(4) | Certain investments that are measured at fair value using the net asset value per share (or its equivalent) practical expedient have not been categorized in the fair value hierarchy. The fair value amounts presented in this table are intended to permit reconciliation of the fair value hierarchy to the amounts presented in the statement of financial position. |
(5) | Investment grade fixed income consists of debt obligations either issued by the US government or have a rating of BBB- / Baa or higher assigned by a major credit rating agency. These investments are valued based on unadjusted quoted market prices (Level 1), or based on quoted prices in inactive markets, or whose values are based on models, but the inputs to those models are observable either directly or indirectly (Level 2). |
(6) | High yield fixed income consists primarily of debt obligations that have a rating of below BBB- / Baa or lower assigned by a major credit rating agency. These investments are valued based on unadjusted quoted market prices. |
(7) | Alternative investments consist primarily of an investment in asset classes other than stocks, bonds, and cash. Alternative investments can include commodities, hedge funds, private equity, managed futures, and derivatives. These investments are valued based on unadjusted quoted market prices and can be redeemed on a bi-monthly basis. |
(8) | Real estate is investments in a real estate collective trust for purposes of total return. These investments are valued based on prices or valuation techniques that require inputs that are both unobservable and significant to the overall fair value measurement. These investments can be redeemed on a quarterly basis. |
F-33
JACK IN THE BOX INC. AND SUBSIDIARIES
NOTES TO CONSOLIDATED FINANCIAL STATEMENTS
Future cash flows — Our policy is to fund our plans at or above the minimum required by law. As of the date of our last actuarial funding valuation, there was no minimum requirement. We do not anticipate making any contributions to our Qualified Plan in fiscal 2020. Contributions expected to be paid in the next fiscal year, the projected benefit payments for each of the next five fiscal years, and the total aggregate amount for the subsequent five fiscal years are as follows ( in thousands):
Defined Benefit Pension Plans | Postretirement Health Plans | |||||||
Estimated net contributions during fiscal 2020 | $ | $ | ||||||
Estimated future year benefit payments during fiscal years: | ||||||||
2020 | $ | $ | ||||||
2021 | $ | $ | ||||||
2022 | $ | $ | ||||||
2023 | $ | $ | ||||||
2024 | $ | $ | ||||||
2025-2029 | $ | $ | ||||||
13. SHARE-BASED EMPLOYEE COMPENSATION
Stock incentive plans — We offer share-based compensation plans to attract, retain, and motivate key officers, employees, and non-employee directors to work toward the financial success of the Company.
Our stock incentive plans are administered by the Compensation Committee of the Board of Directors and have been approved by the stockholders of the Company. The terms and conditions of our share-based awards are determined by the Compensation Committee for each award date and may include provisions for the exercise price, expirations, vesting, restriction on sales, and forfeitures, as applicable. We issue new shares to satisfy stock issuances under our stock incentive plans.
Our Amended and Restated 2004 Stock Incentive Plan authorizes the issuance of up to 11,600,000 common shares in connection with the granting of stock options, stock appreciation rights, restricted stock purchase rights, restricted stock bonuses, restricted stock units, or performance units to key employees, directors, and other designated employees. There were 1,677,983 shares of common stock available for future issuance under this plan as of September 29, 2019.
We also maintain a deferred compensation plan for non-management directors under which those who are eligible to receive fees or retainers may choose to defer receipt of their compensation. The deferred amounts are converted to stock equivalents. The plan requires settlement in shares of our common stock based on the number of stock equivalents and dividend equivalents at the time of a participant’s separation from the Board of Directors. This plan provides for the issuance of up to 350,000 shares of common stock in connection with the crediting of stock equivalents. There were 143,122 shares of common stock available for future issuance under this plan as of September 29, 2019.
Compensation expense — The components of share-based compensation expense, included within “Selling, general, and administrative expenses” in our consolidated statement of earnings, in each fiscal year are as follows ( in thousands):
2019 | 2018 | 2017 | ||||||||||
Nonvested stock units | $ | $ | $ | |||||||||
Stock options | ||||||||||||
Performance share awards | ||||||||||||
Nonvested restricted stock awards | ||||||||||||
Non-management directors’ deferred compensation | ||||||||||||
Total share-based compensation expense | $ | $ | $ | |||||||||
Nonvested restricted stock units — Nonvested restricted stock units (“RSUs”) are generally issued to executives, non-management directors and certain other members of management and employees. Prior to fiscal 2011, RSUs were granted to certain Executive and Senior Vice Presidents pursuant to our share ownership guidelines. These awards vest upon retirement or termination based on years of service. There were 60,272 of such RSUs outstanding as of September 29, 2019.
F-34
JACK IN THE BOX INC. AND SUBSIDIARIES
NOTES TO CONSOLIDATED FINANCIAL STATEMENTS
Beginning fiscal 2011, we replaced the ownership share grants with time-vested RSUs for certain Vice Presidents and Officers that vest ratably over four to five years and have a 50 % or 100 % holding requirement on settled shares, which must be held until termination. There were 146,268 of such RSUs outstanding as of September 29, 2019. RSUs issued to non-management directors and certain other employees vest 12 months from the date of grant, or upon termination of board service if the director or employee elects to defer receipt, and totaled 69,411 units outstanding as of September 29, 2019. RSUs issued to certain other employees either cliff vest or vest ratably over three years and totaled 35,864 units outstanding as of September 29, 2019. These awards are amortized to compensation expense over the estimated vesting period based upon the fair value of our common stock on the award date discounted by the present value of the expected dividend stream over the vesting period.
The following is a summary of RSU activity for fiscal 2019:
Shares | Weighted- Average Grant Date Fair Value | ||||||
RSUs outstanding at September 30, 2018 | $ | ||||||
Granted | $ | ||||||
Released | ( | ) | $ | ||||
Forfeited | ( | ) | $ | ||||
RSUs outstanding at September 29, 2019 | $ | ||||||
As of September 29, 2019, there was approximately $7.4 million of total unrecognized compensation cost related to RSUs, which is expected to be recognized over a weighted-average period of 2.2 years. The weighted-average grant date fair value of awards granted was $86.08 , $94.93 , and $102.42 in fiscal years 2019, 2018, and 2017, respectively. In fiscal years 2019, 2018, and 2017, the total fair value of RSUs that vested and were released was $4.7 million, $4.4 million, and $4.4 million, respectively.
Stock options — Option grants have contractual terms of seven years and employee options vest over a three-year period. Options may vest sooner upon retirement from the Company for employees meeting certain age and years of service thresholds. All option grants provide for an option exercise price equal to the closing market value of the common stock on the date of grant.
The following is a summary of stock option activity for fiscal 2019:
Shares | Weighted- Average Exercise Price | Weighted- Average Remaining Contractual Term (Years) | Aggregate Intrinsic Value (in thousands) | ||||||||||
Options outstanding at September 30, 2018 | $ | ||||||||||||
Granted | N/A | ||||||||||||
Exercised | ( | ) | $ | ||||||||||
Forfeited | ( | ) | $ | ||||||||||
Expired | ( | ) | $ | ||||||||||
Options outstanding at September 29, 2019 | $ | $ | |||||||||||
Options exercisable at September 29, 2019 | $ | $ | |||||||||||
Options exercisable and expected to vest at September 29, 2019 | $ | $ | |||||||||||
The aggregate intrinsic value in the table above is the amount by which the current market price of our stock on September 29, 2019 exceeds the weighted-average exercise price.
We use a valuation model to determine the fair value of options granted that requires the input of highly subjective assumptions, including the expected volatility of the stock price. The following table presents the weighted-average assumptions used for stock option grants in each fiscal year, along with the related weighted-average grant date fair value:
2019 | 2018 | 2017 | ||||
Risk-free interest rate | N/A | |||||
Expected dividends yield | N/A | |||||
Expected stock price volatility | N/A | |||||
Expected life of options (in years) | N/A | |||||
Weighted-average grant date fair value | N/A | $ | $ | |||
F-35
JACK IN THE BOX INC. AND SUBSIDIARIES
NOTES TO CONSOLIDATED FINANCIAL STATEMENTS
The risk-free interest rate was determined by a yield curve of risk-free rates based on published U.S. Treasury spot rates in effect at the time of grant and has a term equal to the expected life of the related options. The dividend yield assumption is based on the Company’s history and expectations of dividend payouts at the grant date. The expected stock price volatility in all years represents the Company’s historical volatility. The expected life of the options represents the period of time the options are expected to be outstanding and is based on historical trends.
As of September 29, 2019, there was approximately $0.6 million of total unrecognized compensation cost related to stock options grants that is expected to be recognized over a weighted-average period of 1 year. The total intrinsic value of stock options exercised was $0.5 million, $2.3 million, and $6.9 million in fiscal years 2019, 2018, and 2017, respectively.
Performance share awards — Performance share awards, granted in the form of stock units, represent a right to receive a certain number of shares of common stock based on the achievement of corporate performance goals and continued employment during the vesting period. Performance share awards issued to executives vest at the end of a three-year period and vested amounts may range from 0 % to a maximum of 150 % of targeted amounts depending on the achievement of performance measures at the end of a three-year period. If the awardee ceases to be employed by the Company prior to the last day of the performance period due to retirement, disability, or death, the performance share awards become vested pro-rata based on the number of full accounting periods the awardee was continuously employed by the Company. The expected cost of the shares is based on the fair value of our stock on the date of grant and is reflected over the vesting period with a reduction for estimated forfeitures. These awards may be settled in cash or shares of common stock at the election of the Company on the date of grant. It is our intent to settle these awards with shares of common stock.
The following is a summary of performance share award activity for fiscal 2019:
Shares | Weighted- Average Grant Date Fair Value | ||||||
Performance share awards outstanding at September 30, 2018 | $ | ||||||
Granted | $ | ||||||
Issued | ( | ) | $ | ||||
Forfeited | ( | ) | $ | ||||
Performance adjustments | ( | ) | $ | ||||
Performance share awards outstanding at September 29, 2019 | $ | ||||||
As of September 29, 2019, there was approximately $2.0 million of total unrecognized compensation cost related to performance share awards, which is expected to be recognized over a weighted-average period of 1.8 years. The weighted-average grant date fair value of awards granted was $84.60 , $97.02 , and $95.33 in fiscal years 2019, 2018, and 2017, respectively. The total fair value of awards that became fully vested during fiscal years 2019, 2018, and 2017 was $2.1 million, $1.6 million, and $3.2 million, respectively.
Nonvested stock awards — We previously issued nonvested stock awards (“RSAs”) to certain executives under our share ownership guidelines. Effective fiscal 2009, we no longer issue RSA awards and replaced them with grants of RSUs. The RSAs vest, subject to the discretion of our Board of Directors in certain circumstances, upon retirement or termination based upon years of service. These awards are amortized to compensation expense over the estimated vesting period based upon the fair value of our common stock on the award date. As of September 29, 2019, RSAs outstanding totaled 33,243 shares with a weighted-average grant date fair value of $26.47 per share.
In fiscal 2019, there were no releases of RSAs. Compensation cost related to RSAs was fully recognized during the prior year.
Non-management directors’ deferred compensation — All awards outstanding under our directors’ deferred compensation plan are accounted for as equity-based awards and deferred amounts are converted into stock equivalents based on a per share price equal to the average of the closing price of our common stock for the 10 trading days immediately preceding the date the deferred compensation is credited to the director’s account. During fiscal years 2019, 2018, and 2017 no common stock was issued in connection with director retirements.
F-36
JACK IN THE BOX INC. AND SUBSIDIARIES
NOTES TO CONSOLIDATED FINANCIAL STATEMENTS
The following is a summary of the stock equivalent activity for fiscal 2019:
Stock Equivalents | Weighted- Average Grant Date Fair Value | ||||||
Stock equivalents outstanding at September 30, 2018 | $ | ||||||
Deferred directors’ compensation | $ | ||||||
Dividend equivalents | $ | ||||||
Stock equivalents outstanding at September 29, 2019 | $ | ||||||
14. STOCKHOLDERS’ DEFICIT
Repurchases of common stock — As of September 29, 2019, there was approximately $175.7 million remaining under a Board-authorized stock buyback program, which expires in November 2020. During fiscal 2019, we repurchased 1.4 million shares at an aggregate cost of $125.3 million. Repurchases of common stock included in our consolidated statements of cash flows for fiscal 2019 and 2018 exclude $2.0 million and $14.4 million, respectively, related to repurchase transactions traded in the respective fiscal year that settled in the next applicable fiscal year. Repurchases of common stock for fiscal 2017 includes $7.2 million related to repurchase transactions traded in the prior fiscal year that settled in fiscal year 2017.
15. AVERAGE SHARES OUTSTANDING
Our basic earnings per share calculation is computed based on the weighted-average number of common shares outstanding. Our diluted earnings per share calculation is computed based on the weighted-average number of common shares outstanding adjusted by the number of additional shares that would have been outstanding had the potentially dilutive common shares been issued. Potentially dilutive common shares include nonvested stock awards and units, stock options, and non-management director stock equivalents. Performance share awards are included in the average diluted shares outstanding each period if the performance criteria have been met at the end of the respective periods.
The following table reconciles basic weighted-average shares outstanding to diluted weighted-average shares outstanding in each fiscal year (in thousands):
2019 | 2018 | 2017 | |||||||
Weighted-average shares outstanding — basic | |||||||||
Effect of potentially dilutive securities: | |||||||||
Nonvested stock awards and units | |||||||||
Stock options | |||||||||
Performance share awards | |||||||||
Weighted-average shares outstanding — diluted | |||||||||
Excluded from diluted weighted-average shares outstanding: | |||||||||
Antidilutive | |||||||||
Performance conditions not satisfied at the end of the period | |||||||||
16. COMMITMENTS, CONTINGENCIES AND LEGAL MATTERS
Commitments — As of September 29, 2019, we had unconditional purchase obligations during the next five fiscal years as follows (in thousands):
2020 | $ | |||
2021 | ||||
2022 | ||||
2023 | ||||
2024 | ||||
Total | $ | |||
F-37
JACK IN THE BOX INC. AND SUBSIDIARIES
NOTES TO CONSOLIDATED FINANCIAL STATEMENTS
These obligations primarily represent amounts payable under purchase contracts for goods related to system-wide restaurant operations.
Legal matters — We assess contingencies, including litigation contingencies, to determine the degree of probability and range of possible loss for potential accrual in our financial statements. An estimated loss contingency is accrued in the financial statements if it is probable that a liability has been incurred and the amount of the loss can be reasonably estimated. Because litigation is inherently unpredictable, assessing contingencies is highly subjective and requires judgments about future events. When evaluating litigation contingencies, we may be unable to provide a meaningful estimate due to a number of factors, including the procedural status of the matter in question, the availability of appellate remedies, insurance coverage related to the claim or claims in question, the presence of complex or novel legal theories, and the ongoing discovery and development of information important to the matter. In addition, damage amounts claimed in litigation against us may be unsupported, exaggerated, or unrelated to possible outcomes, and as such are not meaningful indicators of our potential liability or financial exposure. We regularly review contingencies to determine the adequacy of the accruals and related disclosures. The ultimate amount of loss may differ from these estimates.
Gessele v. Jack in the Box Inc. — In August 2010, five former employees instituted litigation in federal court in Oregon alleging claims under the federal Fair Labor Standards Act and Oregon wage and hour laws. The plaintiffs alleged that the Company failed to pay non-exempt employees for certain meal breaks and improperly made payroll deductions for shoe purchases and for workers’ compensation expenses, and later added additional claims relating to timing of final pay and related wage and hour claims involving employees of a franchisee. In 2016, the court dismissed the federal claims and those relating to franchise employees. In June 2017, the court granted class certification with respect to state law claims of improper deductions and late payment of final wages. In February 2019, plaintiff’s counsel reduced their earlier demand from $62.0 million to $42.0 million. We have accrued an amount that is not material to our consolidated financial statements relating to claims for which we believe a loss is both probable and estimable. We continue to believe that no additional losses are probable beyond this accrual and we cannot estimate a possible loss contingency or range of reasonably possible loss contingencies beyond this accrual. We plan to vigorously defend against this lawsuit. Nonetheless, an unfavorable resolution of this matter in excess of our current accrued loss contingencies could have a material adverse effect on our business, results of operations, liquidity, or financial condition.
Ramirez v. Jack in the Box Inc. — On June 11, 2019, an unfavorable jury verdict was delivered in a wrongful termination lawsuit against the Company in Los Angeles Superior Court. The plaintiff in the case was a restaurant employee who was terminated in 2013. The jury’s verdict included $5.4 million in compensatory damages and $10.0 million in punitive damages. The Company filed post-trial motions with the trial judge for the purpose of setting aside or significantly reducing damages. These motions were granted, resulting in a reduction of damages from $15.4 million to $3.2 million. The plaintiff accepted the reduction. In October 2019, the plaintiff’s counsel filed a motion for attorney’s fees in the amount of $5.1 million. We intend to file an opposition to the motion in December 2019, and the hearing on the motions is scheduled for January 2020. As of September 29, 2019, we have recorded an accrual for legal settlement of $8.3 million within “Accrued liabilities” and a litigation insurance recovery receivable of $8.3 million, which represents the expected payment of the settlement by the Company’s insurance carriers, within “Accounts and other receivable, net” in our consolidated balance sheet.
Other legal matters — In addition to the matter described above, we are subject to normal and routine litigation brought by former or current employees, customers, franchisees, vendors, landlords, shareholders or others. We intend to defend ourselves in any such matters. Some of these matters may be covered, at least in part, by insurance or other third party indemnity obligation. We record receivables from third party insurers when recovery has been determined to be probable. We believe that the ultimate determination of liability in connection with legal claims pending against us, if any, in excess of amounts already provided for such matters in the consolidated financial statements, will not have a material adverse effect on our business, our annual results of operations, liquidity or financial position; however, it is possible that our business, results of operations, liquidity, or financial condition could be materially affected in a particular future reporting period by the unfavorable resolution of one or more matters or contingencies during such period.
F-38
JACK IN THE BOX INC. AND SUBSIDIARIES
NOTES TO CONSOLIDATED FINANCIAL STATEMENTS
17. SUPPLEMENTAL CONSOLIDATED CASH FLOW INFORMATION ( in thousands)
2019 | 2018 | 2017 | ||||||||||
Cash paid during the year for: | ||||||||||||
Income tax payments | $ | $ | $ | |||||||||
Interest, net of amounts capitalized | $ | $ | $ | |||||||||
Non-cash investing and financing transactions: | ||||||||||||
Increase in notes receivable from the sale of company-operated restaurants | $ | $ | $ | |||||||||
Increase in dividends accrued or converted to common stock equivalents | $ | $ | $ | |||||||||
Decrease in equipment capital lease obligations from the sale of company-operated restaurants, closure of stores, and termination of equipment leases | $ | $ | $ | |||||||||
Decrease in capital lease obligations from the termination of building leases | $ | $ | $ | |||||||||
Equipment capital lease obligations incurred | $ | $ | $ | |||||||||
Consideration for franchise acquisitions | $ | $ | $ | |||||||||
(Decrease) increase in obligations for purchases of property and equipment | $ | ( | ) | $ | $ | |||||||
(Decrease) increase in obligations for treasury stock repurchases | $ | ( | ) | $ | $ | ( | ) | |||||
F-39
JACK IN THE BOX INC. AND SUBSIDIARIES
NOTES TO CONSOLIDATED FINANCIAL STATEMENTS
18. SUPPLEMENTAL CONSOLIDATED FINANCIAL STATEMENT INFORMATION ( in thousands)
September 29, 2019 | September 30, 2018 | |||||||
Accounts and other receivables, net: | ||||||||
Trade | $ | $ | ||||||
Notes receivable | ||||||||
Income tax receivable | ||||||||
Other | ||||||||
Allowance for doubtful accounts | ( | ) | ( | ) | ||||
$ | $ | |||||||
Prepaid expenses: | ||||||||
Prepaid income taxes | $ | $ | ||||||
Prepaid advertising | ||||||||
Other | ||||||||
$ | $ | |||||||
Other assets, net: | ||||||||
Company-owned life insurance policies | $ | $ | ||||||
Deferred rent receivable | ||||||||
Franchise tenant improvement allowance | ||||||||
Other | ||||||||
$ | $ | |||||||
Accrued liabilities: | ||||||||
Insurance | $ | $ | ||||||
Payroll and related taxes | ||||||||
Sales and property taxes | ||||||||
Gift card liability | ||||||||
Percentage rent accrual | ||||||||
Deferred franchise fees | ||||||||
Other | ||||||||
$ | $ | |||||||
Other long-term liabilities: | ||||||||
Defined benefit pension plans | $ | $ | ||||||
Deferred franchise fees | ||||||||
Straight-line rent accrual | ||||||||
Other | ||||||||
$ | $ | |||||||
F-40
JACK IN THE BOX INC. AND SUBSIDIARIES
NOTES TO CONSOLIDATED FINANCIAL STATEMENTS
19. UNAUDITED QUARTERLY RESULTS OF OPERATIONS (in thousands, except per share data)
16 Weeks Ended | 12 Weeks Ended | |||||||||||||||
Fiscal Year 2019 | January 20, 2019 | April 14, 2019 | July 7, 2019 | September 29, 2019 | ||||||||||||
Revenues | $ | $ | $ | $ | ||||||||||||
Earnings from operations | $ | $ | $ | $ | ||||||||||||
Net earnings | $ | $ | $ | $ | ||||||||||||
Net earnings per share: | ||||||||||||||||
Basic | $ | $ | $ | $ | ||||||||||||
Diluted | $ | $ | $ | $ | ||||||||||||
16 Weeks Ended | 12 Weeks Ended | |||||||||||||||
Fiscal Year 2018 | January 21, 2018 | April 15, 2018 | July 8, 2018 | September 30, 2018 | ||||||||||||
Revenues | $ | $ | $ | $ | ||||||||||||
Earnings from operations | $ | $ | $ | $ | ||||||||||||
Net earnings | $ | $ | $ | $ | ||||||||||||
Net earnings per share: | ||||||||||||||||
Basic | $ | $ | $ | $ | ||||||||||||
Diluted | $ | $ | $ | $ | ||||||||||||
20. SUBSEQUENT EVENTS
On November 15, 2019, the Board of Directors declared a cash dividend of $0.40 per share, to be paid on December 20, 2019 to shareholders of record as of the close of business on December 5, 2019. Future dividends will be subject to approval by our Board of Directors.
F-41