Table of Contents
UNITED STATES
SECURITIES AND EXCHANGE COMMISSION
Washington, D.C. 20549
FORM N-CSR
CERTIFIED SHAREHOLDER REPORT OF REGISTERED
MANAGEMENT INVESTMENT COMPANIES
Investment Company Act file number: 811-05526
J.P. Morgan Mutual Fund Investment Trust
(Exact name of registrant as specified in charter)
270 Park Avenue
New York, NY 10017
(Address of principal executive offices) (Zip code)
Frank J. Nasta
270 Park Avenue
New York, NY 10017
(Name and Address of Agent for Service)
Registrant’s telephone number, including area code: (800) 480-4111
Date of fiscal year end: June 30
Date of reporting period: July 1, 2015 to December 31, 2015
Form N-CSR is to be used by management investment companies to file reports with the Commission not later than 10 days after the transmission to stockholders of any report that is required to be transmitted to stockholders under Rule 30e-1 under the Investment Company Act of 1940 (17 CFR 270.30e-1). The Commission may use the information provided on Form N-CSR in its regulatory, disclosure review, inspection, and policymaking roles.
A registrant is required to disclose the information specified by Form N-CSR, and the Commission will make this information public. A registrant is not required to respond to the collection of information contained in Form N-CSR unless the Form displays a currently valid Office of Management and Budget (“OMB”) control number. Please direct comments concerning the accuracy of the information collection burden estimate and any suggestions for reducing the burden to Secretary, Securities and Exchange Commission, 450 Fifth Street, NW, Washington, DC 20549-0609. The OMB has reviewed this collection of information under the clearance requirements of 44 U.S.C. Section 3507.
Table of Contents
| ITEM 1. | REPORTS TO STOCKHOLDERS. |
The following is a copy of the report transmitted to shareholders pursuant to Rule 30e-1 under the Investment Company Act of 1940 (17 CFR 270.30e-1).
Table of Contents
Semi-Annual Report
J.P. Morgan Mid Cap/Multi-Cap Funds
December 31, 2015 (Unaudited)
JPMorgan Growth Advantage Fund
JPMorgan Mid Cap Equity Fund
JPMorgan Mid Cap Growth Fund
JPMorgan Mid Cap Value Fund
JPMorgan Multi-Cap Market Neutral Fund
JPMorgan Value Advantage Fund

Table of Contents
Investments in a Fund are not deposits or obligations of, or guaranteed or endorsed by, any bank and are not insured or guaranteed by the FDIC, the Federal Reserve Board or any other government agency. You could lose money if you sell when the Fund’s share price is lower than when you invested.
Past performance is no guarantee of future performance. The general market views expressed in this report are opinions based on market and other conditions through the end of the reporting period and are subject to change without notice. These views are not intended to predict the future performance of a Fund or the securities markets. References to specific securities and their issuers are for illustrative purposes only and are not intended to be, and should not be interpreted as, recommendations to purchase or sell such securities. Such views are not meant as investment advice and may not be relied on as an indication of trading intent on behalf of any Fund.
Prospective investors should refer to the Funds’ prospectus for a discussion of the Funds’ investment objectives, strategies and risks. Call J.P. Morgan Funds Service Center at 1-800-480-4111 for a prospectus containing more complete information about a Fund, including management fees and other expenses. Please read it carefully before investing.
Table of Contents
January 29, 2016 (Unaudited)


| DECEMBER 31, 2015 | J.P. MORGAN MID CAP/MULTI-CAP FUNDS | 1 | ||||||
Table of Contents
J.P. Morgan Mid Cap/Multi-Cap Funds
SIX MONTHS ENDED DECEMBER 31, 2015 (Unaudited)
U.S. equities financial markets provided slim returns for the second half of 2015. Global weakness in commodities prices, slowing economic growth in China, anxiety over U.S. interest rate policy and slowing growth in corporate earnings combined to put pressure on equity prices during the summer months.
In mid-August, Chinese authorities devalued the yuan by 2% amid declines in the Shanghai and Shenzhen equity markets. A global sell-off followed on August 24th, dragging down the Standard & Poor’s 500 Index (“S&P 500”) by 3.9% for the day.
However, U.S. equity markets rebounded in October as China’s central bank undertook further actions to bolster domestic financial markets and the U.S. Federal Reserve held interest rates at historically low levels. The S&P 500 turned in its best one-month performance since October 2011.
In general, the U.S. equities market for the six month reporting period was marked by large gains in a few select stocks, especially technology sector stocks, while most other stocks ended the period lower or essentially flat. The energy, materials and industrials sectors underperformed the broader market, while the consumer discretionary, consumer staples and health care sectors outperformed the broader market. Over the reporting period, growth stocks generally outperformed value stocks and small cap stocks generally underperformed both mid cap and large cap stocks. For the six months ended December 31, 2015, the S&P 500 returned 0.15% and the Russell Mid Cap Index returned -4.68%.
| 2 | J.P. MORGAN MID CAP/MULTI-CAP FUNDS | DECEMBER 31, 2015 | ||||
Table of Contents
JPMorgan Growth Advantage Fund
SIX MONTHS ENDED DECEMBER 31, 2015 (Unaudited)
| REPORTING PERIOD RETURN: | ||||
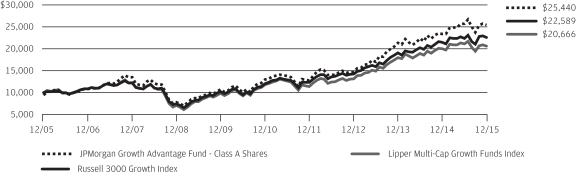
| Fund (Class A Shares, without a sales charge)* | -1.19% | |||
| Russell 3000 Growth Index | 0.73% | |||
| Net Assets as of 12/31/2015 (In Thousands) | $6,474,576 | |||
| DECEMBER 31, 2015 | J.P. MORGAN MID CAP/MULTI-CAP FUNDS | 3 | ||||||
Table of Contents
JPMorgan Growth Advantage Fund
SIX MONTHS ENDED DECEMBER 31, 2015 (Unaudited) (continued)
| AVERAGE ANNUAL TOTAL RETURNS AS OF DECEMBER 31, 2015 |
||||||||||||||||||
| INCEPTION DATE OF CLASS |
6 MONTH* | 1 YEAR | 5 YEAR | 10 YEAR | ||||||||||||||
| CLASS A SHARES |
October 29, 1999 | |||||||||||||||||
| Without Sales Charge |
(1.19 | )% | 8.54 | % | 14.34 | % | 10.38 | % | ||||||||||
| With Sales Charge** |
(6.36 | ) | 2.86 | 13.13 | 9.79 | |||||||||||||
| CLASS C SHARES |
May 1, 2006 | |||||||||||||||||
| Without CDSC |
(1.46 | ) | 8.04 | 13.80 | 9.79 | |||||||||||||
| With CDSC*** |
(2.46 | ) | 7.04 | 13.80 | 9.79 | |||||||||||||
| CLASS R5 SHARES |
January 8, 2009 | (0.96 | ) | 9.03 | 14.82 | 10.77 | ||||||||||||
| CLASS R6 SHARES |
December 23, 2013 | (0.90 | ) | 9.16 | 14.86 | 10.79 | ||||||||||||
| SELECT CLASS SHARES |
May 1, 2006 | (1.10 | ) | 8.71 | 14.56 | 10.61 | ||||||||||||
| * | Not annualized. |
| ** | Sales Charge for Class A Shares is 5.25%. |
| *** | Assumes a 1% CDSC (contingent deferred sales charge) for the one year period and 0% CDSC thereafter. |
TEN YEAR PERFORMANCE (12/31/05 TO 12/31/15)
| 4 | J.P. MORGAN MID CAP/MULTI-CAP FUNDS | DECEMBER 31, 2015 | ||||
Table of Contents
FUND COMMENTARY
SIX MONTHS ENDED DECEMBER 31, 2015 (Unaudited)
| REPORTING PERIOD RETURN: | ||||
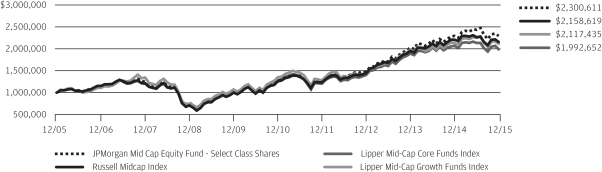
| Fund (Select Class Shares)* | -5.43% | |||
| Russell Midcap Index | -4.68% | |||
| Net Assets as of 12/31/2015 (In Thousands) | $ | 3,215,761 | ||
| DECEMBER 31, 2015 | J.P. MORGAN MID CAP/MULTI-CAP FUNDS | 5 | ||||||
Table of Contents
FUND COMMENTARY
SIX MONTHS ENDED DECEMBER 31, 2015 (Unaudited) (continued)
| AVERAGE ANNUAL TOTAL RETURNS AS OF DECEMBER 31, 2015 |
||||||||||||||||||
| INCEPTION DATE OF CLASS |
6 MONTH* | 1 YEAR | 5 YEAR | 10 YEAR | ||||||||||||||
| CLASS A SHARES |
November 2, 2009 | |||||||||||||||||
| Without Sales Charge |
(5.60 | )% | (0.22 | )% | 11.98 | % | 8.46 | % | ||||||||||
| With Sales Charge** |
(10.55 | ) | (5.46 | ) | 10.78 | 7.87 | ||||||||||||
| CLASS C SHARES |
November 2, 2009 | |||||||||||||||||
| Without CDSC |
(5.84 | ) | (0.70 | ) | 11.43 | 8.12 | ||||||||||||
| With CDSC*** |
(6.84 | ) | (1.70 | ) | 11.43 | 8.12 | ||||||||||||
| CLASS R2 SHARES |
March 14, 2014 | (5.72 | ) | (0.47 | ) | 11.88 | 8.41 | |||||||||||
| CLASS R5 SHARES |
March 14, 2014 | (5.39 | ) | 0.24 | 12.42 | 8.71 | ||||||||||||
| CLASS R6 SHARES |
March 14, 2014 | (5.37 | ) | 0.29 | 12.44 | 8.72 | ||||||||||||
| SELECT CLASS SHARES |
January 1, 1997 | (5.43 | ) | 0.15 | 12.38 | 8.69 | ||||||||||||
| * | Not annualized. |
| ** | Sales Charge for Class A Shares is 5.25%. |
| *** | Assumes a 1% CDSC (contingent deferred sales charge) for the one year period and 0% CDSC thereafter. |
TEN YEAR PERFORMANCE (12/31/05 TO 12/31/15)
| 6 | J.P. MORGAN MID CAP/MULTI-CAP FUNDS | DECEMBER 31, 2015 | ||||
Table of Contents
FUND COMMENTARY
SIX MONTHS ENDED DECEMBER 31, 2015 (Unaudited)
| REPORTING PERIOD RETURN: | ||||
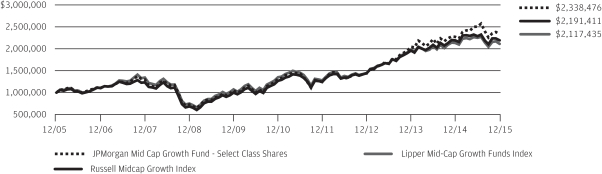
| Fund (Select Class Shares)* | -6.86% | |||
| Russell Midcap Growth Index | -4.20% | |||
| Net Assets as of 12/31/2015 (In Thousands) | $ | 2,866,011 | ||
| DECEMBER 31, 2015 | J.P. MORGAN MID CAP/MULTI-CAP FUNDS | 7 | ||||||
Table of Contents
FUND COMMENTARY
SIX MONTHS ENDED DECEMBER 31, 2015 (Unaudited) (continued)
| AVERAGE ANNUAL TOTAL RETURNS AS OF DECEMBER 31, 2015 |
||||||||||||||||||
| INCEPTION DATE OF CLASS |
6 MONTH* | 1 YEAR | 5 YEAR | 10 YEAR | ||||||||||||||
| CLASS A SHARES |
February 18, 1992 | |||||||||||||||||
| Without Sales Charge |
(6.99 | )% | 2.51 | % | 11.80 | % | 8.55 | % | ||||||||||
| With Sales Charge** |
(11.89 | ) | (2.86 | ) | 10.60 | 7.97 | ||||||||||||
| CLASS C SHARES |
November 4, 1997 | |||||||||||||||||
| Without CDSC |
(7.23 | ) | 1.97 | 11.25 | 7.95 | |||||||||||||
| With CDSC*** |
(8.23 | ) | 0.97 | 11.25 | 7.95 | |||||||||||||
| CLASS R2 SHARES |
June 19, 2009 | (7.07 | ) | 2.32 | 11.63 | 8.38 | ||||||||||||
| CLASS R5 SHARES |
November 1, 2011 | (6.81 | ) | 2.94 | 12.29 | 8.93 | ||||||||||||
| CLASS R6 SHARES |
November 1, 2011 | (6.76 | ) | 3.01 | 12.34 | 8.96 | ||||||||||||
| SELECT CLASS SHARES |
March 2, 1989 | (6.85 | ) | 2.81 | 12.15 | 8.87 | ||||||||||||
| * | Not annualized. |
| ** | Sales Charge for Class A Shares is 5.25%. |
| *** | Assumes a 1% CDSC (contingent deferred sales charge) for the one year period and 0% CDSC thereafter. |
TEN YEAR PERFORMANCE (12/31/05 TO 12/31/15)
| 8 | J.P. MORGAN MID CAP/MULTI-CAP FUNDS | DECEMBER 31, 2015 | ||||
Table of Contents
FUND COMMENTARY
SIX MONTHS ENDED DECEMBER 31, 2015 (Unaudited)
| REPORTING PERIOD RETURN: | ||||
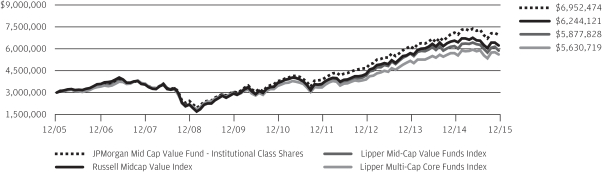
| Fund (Institutional Class Shares)* | -3.93% | |||
| Russell Midcap Value Index | -5.17% | |||
| Net Assets as of 12/31/2015 (In Thousands) | $ | 14,700,150 | ||
| DECEMBER 31, 2015 | J.P. MORGAN MID CAP/MULTI-CAP FUNDS | 9 | ||||||
Table of Contents
FUND COMMENTARY
SIX MONTHS ENDED DECEMBER 31, 2015 (Unaudited) (continued)
| AVERAGE ANNUAL TOTAL RETURNS AS OF DECEMBER 31, 2015 |
||||||||||||||||||
| INCEPTION DATE OF CLASS |
6 MONTH* | 1 YEAR | 5 YEAR | 10 YEAR | ||||||||||||||
| CLASS A SHARES |
April 30, 2001 | |||||||||||||||||
| Without Sales Charge |
(4.16 | )% | (2.82 | )% | 12.31 | % | 8.24 | % | ||||||||||
| With Sales Charge** |
(9.19 | ) | (7.92 | ) | 11.10 | 7.65 | ||||||||||||
| CLASS C SHARES |
April 30, 2001 | |||||||||||||||||
| Without CDSC |
(4.41 | ) | (3.33 | ) | 11.73 | 7.69 | ||||||||||||
| With CDSC*** |
(5.41 | ) | (4.33 | ) | 11.73 | 7.69 | ||||||||||||
| CLASS R2 SHARES |
November 3, 2008 | (4.28 | ) | (3.06 | ) | 12.01 | 8.03 | |||||||||||
| INSTITUTIONAL CLASS SHARES |
November 13, 1997 | (3.93 | ) | (2.35 | ) | 12.86 | 8.77 | |||||||||||
| SELECT CLASS SHARES |
October 31, 2001 | (4.05 | ) | (2.59 | ) | 12.58 | 8.50 | |||||||||||
| * | Not annualized. |
| ** | Sales Charge for Class A Shares is 5.25%. |
| *** | Assumes a 1% CDSC (contingent deferred sales charge) for the one year period and 0% CDSC thereafter. |
TEN YEAR PERFORMANCE (12/31/05 TO 12/31/15)
| 10 | J.P. MORGAN MID CAP/MULTI-CAP FUNDS | DECEMBER 31, 2015 | ||||
Table of Contents
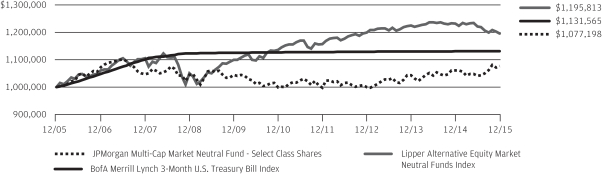
JPMorgan Multi-Cap Market Neutral Fund
FUND COMMENTARY
SIX MONTHS ENDED DECEMBER 31, 2015 (Unaudited)
| REPORTING PERIOD RETURN: | ||||
| Fund (Select Class Shares)* | 3.48% | |||
| BofA Merrill Lynch 3-Month U.S. Treasury Bill Index | 0.04% | |||
| Net Assets as of 12/31/15 (In Thousands) | $ | 272,017 | ||
| DECEMBER 31, 2015 | J.P. MORGAN MID CAP/MULTI-CAP FUNDS | 11 | ||||||
Table of Contents
JPMorgan Multi-Cap Market Neutral Fund
FUND COMMENTARY
SIX MONTHS ENDED DECEMBER 31, 2015 (Unaudited) (continued)
| SHORT POSITION PORTFOLIO COMPOSITION BY SECTOR**** |
||||
| Information Technology | 27.5 | % | ||
| Industrials | 19.2 | |||
| Health Care | 12.6 | |||
| Consumer Discretionary | 12.4 | |||
| Consumer Staples | 9.5 | |||
| Materials | 5.3 | |||
| Energy | 5.1 | |||
| Financials | 4.4 | |||
| Utilities | 2.4 | |||
| Telecommunication Services | 1.6 | |||
| * | The return shown is based on net asset values calculated for shareholder transactions and may differ from the return shown in the financial highlights, which reflects adjustments made to the net asset values in accordance with accounting principles generally accepted in the United States of America. |
| ** | The adviser seeks to achieve the Fund’s objective. There can be no guarantee it will be achieved. |
| *** | Percentages indicated are based on total long investments as of December 31, 2015. The Fund’s portfolio composition is subject to change. |
| **** | Percentages indicated are based on total short investments as of December 31, 2015. The Fund’s portfolio composition is subject to change. |
| 12 | J.P. MORGAN MID CAP/MULTI-CAP FUNDS | DECEMBER 31, 2015 | ||||
Table of Contents
| AVERAGE ANNUAL TOTAL RETURNS AS OF DECEMBER 31, 2015 |
||||||||||||||||||
| INCEPTION DATE OF CLASS |
6 MONTH* | 1 YEAR | 5 YEAR | 10 YEAR | ||||||||||||||
| CLASS A SHARES |
May 23, 2003 | |||||||||||||||||
| Without Sales Charge |
3.24 | % | 1.19 | % | 1.24 | % | 0.49 | % | ||||||||||
| With Sales Charge** |
(2.21 | ) | (4.14 | ) | 0.16 | (0.05 | ) | |||||||||||
| CLASS C SHARES |
May 23, 2003 | |||||||||||||||||
| Without CDSC |
3.11 | 0.73 | 0.66 | (0.19 | ) | |||||||||||||
| With CDSC*** |
2.11 | (0.27 | ) | 0.66 | (0.19 | ) | ||||||||||||
| SELECT CLASS SHARES |
May 23, 2003 | 3.48 | 1.46 | 1.51 | 0.75 | |||||||||||||
| * | Not annualized. |
| ** | Sales Charge for Class A Shares is 5.25%. |
| *** | Assumes a 1% CDSC (contingent deferred sales charge) for the one year period and 0% CDSC thereafter. |
TEN YEAR PERFORMANCE (12/31/05 TO 12/31/15)
| DECEMBER 31, 2015 | J.P. MORGAN MID CAP/MULTI-CAP FUNDS | 13 | ||||||
Table of Contents
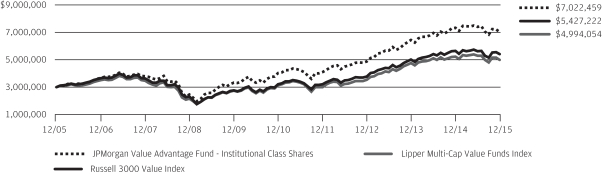
FUND COMMENTARY
SIX MONTHS ENDED DECEMBER 31, 2015 (Unaudited)
| REPORTING PERIOD RETURN: | ||||
| Fund (Institutional Class Shares)* | -5.04% | |||
| Russell 3000 Value Index | -3.64% | |||
| Net Assets as of 12/31/2015 (In Thousands) | $ | 11,154,765 | ||
| 14 | J.P. MORGAN MID CAP/MULTI-CAP FUNDS | DECEMBER 31, 2015 | ||||
Table of Contents
| AVERAGE ANNUAL TOTAL RETURNS AS OF DECEMBER 31, 2015 |
||||||||||||||||||
| INCEPTION DATE OF CLASS |
6 MONTH* | 1 YEAR | 5 YEAR | 10 YEAR | ||||||||||||||
| CLASS A SHARES |
February 28, 2005 | |||||||||||||||||
| Without Sales Charge |
(5.28 | )% | (4.73 | )% | 11.19 | % | 8.32 | % | ||||||||||
| With Sales Charge** |
(10.24 | ) | (9.72 | ) | 9.99 | 7.74 | ||||||||||||
| CLASS C SHARES |
February 28, 2005 | |||||||||||||||||
| Without CDSC |
(5.49 | ) | (5.17 | ) | 10.64 | 7.79 | ||||||||||||
| With CDSC*** |
(6.49 | ) | (6.17 | ) | 10.64 | 7.79 | ||||||||||||
| INSTITUTIONAL CLASS SHARES |
February 28, 2005 | (5.04 | ) | (4.24 | ) | 11.75 | 8.88 | |||||||||||
| SELECT CLASS SHARES |
February 28, 2005 | (5.13 | ) | (4.46 | ) | 11.47 | 8.60 | |||||||||||
| * | Not annualized. |
| ** | Sales Charge for Class A Shares is 5.25%. |
| *** | Assumes a 1% CDSC (contingent deferred sales charge) for the one year period and 0% CDSC thereafter. |
TEN YEAR PERFORMANCE (12/31/05 TO 12/31/15)
| DECEMBER 31, 2015 | J.P. MORGAN MID CAP/MULTI-CAP FUNDS | 15 | ||||||
Table of Contents
JPMorgan Growth Advantage Fund
SCHEDULE OF PORTFOLIO INVESTMENTS
AS OF DECEMBER 31, 2015 (Unaudited)
(Amounts in thousands)
SEE NOTES TO FINANCIAL STATEMENTS.
| 16 | J.P. MORGAN MID CAP/MULTI-CAP FUNDS | DECEMBER 31, 2015 | ||||
Table of Contents
SEE NOTES TO FINANCIAL STATEMENTS.
| DECEMBER 31, 2015 | J.P. MORGAN MID CAP/MULTI-CAP FUNDS | 17 | ||||||
Table of Contents
JPMorgan Mid Cap Equity Fund
SCHEDULE OF PORTFOLIO INVESTMENTS
AS OF DECEMBER 31, 2015 (Unaudited)
(Amounts in thousands)
SEE NOTES TO FINANCIAL STATEMENTS.
| 18 | J.P. MORGAN MID CAP/MULTI-CAP FUNDS | DECEMBER 31, 2015 | ||||
Table of Contents
SEE NOTES TO FINANCIAL STATEMENTS.
| DECEMBER 31, 2015 | J.P. MORGAN MID CAP/MULTI-CAP FUNDS | 19 | ||||||
Table of Contents
JPMorgan Mid Cap Equity Fund
SCHEDULE OF PORTFOLIO INVESTMENTS
AS OF DECEMBER 31, 2015 (Unaudited) (continued)
(Amounts in thousands)
SEE NOTES TO FINANCIAL STATEMENTS.
| 20 | J.P. MORGAN MID CAP/MULTI-CAP FUNDS | DECEMBER 31, 2015 | ||||
Table of Contents
SEE NOTES TO FINANCIAL STATEMENTS.
| DECEMBER 31, 2015 | J.P. MORGAN MID CAP/MULTI-CAP FUNDS | 21 | ||||||
Table of Contents
JPMorgan Mid Cap Growth Fund
SCHEDULE OF PORTFOLIO INVESTMENTS
AS OF DECEMBER 31, 2015 (Unaudited)
(Amounts in thousands)
SEE NOTES TO FINANCIAL STATEMENTS.
| 22 | J.P. MORGAN MID CAP/MULTI-CAP FUNDS | DECEMBER 31, 2015 | ||||
Table of Contents
SEE NOTES TO FINANCIAL STATEMENTS.
| DECEMBER 31, 2015 | J.P. MORGAN MID CAP/MULTI-CAP FUNDS | 23 | ||||||
Table of Contents
JPMorgan Mid Cap Growth Fund
SCHEDULE OF PORTFOLIO INVESTMENTS
AS OF DECEMBER 31, 2015 (Unaudited) (continued)
(Amounts in thousands)
SEE NOTES TO FINANCIAL STATEMENTS.
| 24 | J.P. MORGAN MID CAP/MULTI-CAP FUNDS | DECEMBER 31, 2015 | ||||
Table of Contents
JPMorgan Mid Cap Value Fund
SCHEDULE OF PORTFOLIO INVESTMENTS
AS OF DECEMBER 31, 2015 (Unaudited)
(Amounts in thousands)
SEE NOTES TO FINANCIAL STATEMENTS.
| DECEMBER 31, 2015 | J.P. MORGAN MID CAP/MULTI-CAP FUNDS | 25 | ||||||
Table of Contents
JPMorgan Mid Cap Value Fund
SCHEDULE OF PORTFOLIO INVESTMENTS
AS OF DECEMBER 31, 2015 (Unaudited) (continued)
(Amounts in thousands)
SEE NOTES TO FINANCIAL STATEMENTS.
| 26 | J.P. MORGAN MID CAP/MULTI-CAP FUNDS | DECEMBER 31, 2015 | ||||
Table of Contents
SEE NOTES TO FINANCIAL STATEMENTS.
| DECEMBER 31, 2015 | J.P. MORGAN MID CAP/MULTI-CAP FUNDS | 27 | ||||||
Table of Contents
JPMorgan Multi-Cap Market Neutral Fund
SCHEDULE OF PORTFOLIO INVESTMENTS
AS OF DECEMBER 31, 2015 (Unaudited)
(Amounts in thousands)
SEE NOTES TO FINANCIAL STATEMENTS.
| 28 | J.P. MORGAN MID CAP/MULTI-CAP FUNDS | DECEMBER 31, 2015 | ||||
Table of Contents
SEE NOTES TO FINANCIAL STATEMENTS.
| DECEMBER 31, 2015 | J.P. MORGAN MID CAP/MULTI-CAP FUNDS | 29 | ||||||
Table of Contents
JPMorgan Multi-Cap Market Neutral Fund
SCHEDULE OF PORTFOLIO INVESTMENTS
AS OF DECEMBER 31, 2015 (Unaudited) (continued)
(Amounts in thousands)
SEE NOTES TO FINANCIAL STATEMENTS.
| 30 | J.P. MORGAN MID CAP/MULTI-CAP FUNDS | DECEMBER 31, 2015 | ||||
Table of Contents
SEE NOTES TO FINANCIAL STATEMENTS.
| DECEMBER 31, 2015 | J.P. MORGAN MID CAP/MULTI-CAP FUNDS | 31 | ||||||
Table of Contents
JPMorgan Multi-Cap Market Neutral Fund
SCHEDULE OF PORTFOLIO INVESTMENTS
AS OF DECEMBER 31, 2015 (Unaudited) (continued)
(Amounts in thousands)
SEE NOTES TO FINANCIAL STATEMENTS.
| 32 | J.P. MORGAN MID CAP/MULTI-CAP FUNDS | DECEMBER 31, 2015 | ||||
Table of Contents
SEE NOTES TO FINANCIAL STATEMENTS.
| DECEMBER 31, 2015 | J.P. MORGAN MID CAP/MULTI-CAP FUNDS | 33 | ||||||
Table of Contents
JPMorgan Multi-Cap Market Neutral Fund
SCHEDULE OF PORTFOLIO INVESTMENTS
AS OF DECEMBER 31, 2015 (Unaudited) (continued)
(Amounts in thousands, except number of Futures contracts)
| Futures Contracts | ||||||||||||||||||||
| NUMBER OF CONTRACTS |
DESCRIPTION | EXPIRATION DATE |
TRADING CURRENCY |
NOTIONAL VALUE AT DECEMBER 31, 2015 |
NET UNREALIZED APPRECIATION (DEPRECIATION) |
|||||||||||||||
| Short Futures Outstanding |
||||||||||||||||||||
| (9 | ) | E-mini S&P 500 |
03/18/16 | USD | $ | (916 | ) | $ | — | (h) | ||||||||||
| (13 | ) | S&P Mid Cap 400 |
03/18/16 | USD | (1,811 | ) | 1 | |||||||||||||
|
|
|
|||||||||||||||||||
| $ | 1 | |||||||||||||||||||
|
|
|
|||||||||||||||||||
SEE NOTES TO FINANCIAL STATEMENTS.
| 34 | J.P. MORGAN MID CAP/MULTI-CAP FUNDS | DECEMBER 31, 2015 | ||||
Table of Contents
JPMorgan Value Advantage Fund
SCHEDULE OF PORTFOLIO INVESTMENTS
AS OF DECEMBER 31, 2015 (Unaudited)
(Amounts in thousands)
SEE NOTES TO FINANCIAL STATEMENTS.
| DECEMBER 31, 2015 | J.P. MORGAN MID CAP/MULTI-CAP FUNDS | 35 | ||||||
Table of Contents
JPMorgan Value Advantage Fund
SCHEDULE OF PORTFOLIO INVESTMENTS
AS OF DECEMBER 31, 2015 (Unaudited) (continued)
(Amounts in thousands)
SEE NOTES TO FINANCIAL STATEMENTS.
| 36 | J.P. MORGAN MID CAP/MULTI-CAP FUNDS | DECEMBER 31, 2015 | ||||
Table of Contents
SEE NOTES TO FINANCIAL STATEMENTS.
| DECEMBER 31, 2015 | J.P. MORGAN MID CAP/MULTI-CAP FUNDS | 37 | ||||||
Table of Contents
J.P. Morgan Mid Cap/Multi-Cap Funds
NOTES TO SCHEDULES OF PORTFOLIO INVESTMENTS
AS OF DECEMBER 31, 2015 (Unaudited)
SEE NOTES TO FINANCIAL STATEMENTS.
| 38 | J.P. MORGAN MID CAP/MULTI-CAP FUNDS | DECEMBER 31, 2015 | ||||
Table of Contents
THIS PAGE IS INTENTIONALLY LEFT BLANK
| DECEMBER 31, 2015 | J.P. MORGAN MID CAP/MULTI-CAP FUNDS | 39 | ||||||
Table of Contents
STATEMENTS OF ASSETS AND LIABILITIES
AS OF DECEMBER 31, 2015 (Unaudited)
(Amounts in thousands, except per share amounts)
| Growth Advantage Fund |
Mid Cap Equity Fund |
Mid Cap Growth Fund |
||||||||||
| ASSETS: |
||||||||||||
| Investments in non-affiliates, at value |
$ | 6,276,762 | $ | 3,129,525 | $ | 2,774,905 | ||||||
| Investments in affiliates, at value |
170,071 | 85,656 | 94,931 | |||||||||
|
|
|
|
|
|
|
|||||||
| Total investment securities, at value |
6,446,833 | 3,215,181 | 2,869,836 | |||||||||
| Cash |
— | 57 | 39 | |||||||||
| Receivables: |
||||||||||||
| Investment securities sold |
5,054 | 1,350 | 1,883 | |||||||||
| Fund shares sold |
31,673 | 6,358 | 12,578 | |||||||||
| Dividends from non-affiliates |
1,359 | 2,665 | 611 | |||||||||
| Dividends from affiliates |
16 | 11 | 14 | |||||||||
|
|
|
|
|
|
|
|||||||
| Total Assets |
6,484,935 | 3,225,622 | 2,884,961 | |||||||||
|
|
|
|
|
|
|
|||||||
| LIABILITIES: |
||||||||||||
| Payables: |
||||||||||||
| Investment securities purchased |
— | 5,871 | 10,042 | |||||||||
| Fund shares redeemed |
4,740 | 1,568 | 6,371 | |||||||||
| Accrued liabilities: |
||||||||||||
| Investment advisory fees |
3,479 | 1,663 | 1,485 | |||||||||
| Administration fees |
443 | 211 | 175 | |||||||||
| Distribution fees |
703 | 72 | 288 | |||||||||
| Shareholder servicing fees |
616 | 12 | 175 | |||||||||
| Custodian and accounting fees |
57 | 35 | 21 | |||||||||
| Trustees’ and Chief Compliance Officer’s fees |
1 | 1 | 1 | |||||||||
| Other |
320 | 428 | 392 | |||||||||
|
|
|
|
|
|
|
|||||||
| Total Liabilities |
10,359 | 9,861 | 18,950 | |||||||||
|
|
|
|
|
|
|
|||||||
| Net Assets |
$ | 6,474,576 | $ | 3,215,761 | $ | 2,866,011 | ||||||
|
|
|
|
|
|
|
|||||||
SEE NOTES TO FINANCIAL STATEMENTS.
| 40 | J.P. MORGAN MID CAP/MULTI-CAP FUNDS | DECEMBER 31, 2015 | ||||
Table of Contents
| Growth Advantage Fund |
Mid Cap Equity Fund |
Mid Cap Growth Fund |
||||||||||
| NET ASSETS: |
||||||||||||
| Paid-in-Capital |
$ | 5,179,887 | $ | 2,605,097 | $ | 2,324,318 | ||||||
| Accumulated undistributed (distributions in excess of) net investment income |
(22,367 | ) | (1,425 | ) | (15,461 | ) | ||||||
| Accumulated net realized gains (losses) |
(64,169 | ) | 5,370 | 194,979 | ||||||||
| Net unrealized appreciation (depreciation) |
1,381,225 | 606,719 | 362,175 | |||||||||
|
|
|
|
|
|
|
|||||||
| Total Net Assets |
$ | 6,474,576 | $ | 3,215,761 | $ | 2,866,011 | ||||||
|
|
|
|
|
|
|
|||||||
| Net Assets: |
||||||||||||
| Class A |
$ | 1,735,538 | $ | 268,940 | $ | 1,007,816 | ||||||
| Class C |
567,051 | 26,425 | 101,493 | |||||||||
| Class R2 |
— | 780 | 30,702 | |||||||||
| Class R5 |
77,931 | 2,939 | 218,610 | |||||||||
| Class R6 |
2,636,336 | 1,312,265 | 492,194 | |||||||||
| Select Class |
1,457,720 | 1,604,412 | 1,015,196 | |||||||||
|
|
|
|
|
|
|
|||||||
| Total |
$ | 6,474,576 | $ | 3,215,761 | $ | 2,866,011 | ||||||
|
|
|
|
|
|
|
|||||||
| Outstanding units of beneficial interest (shares) ($0.0001 par value; unlimited number of shares authorized): |
||||||||||||
| Class A |
115,583 | 6,357 | 41,492 | |||||||||
| Class C |
42,083 | 639 | 5,128 | |||||||||
| Class R2 |
— | 18 | 1,164 | |||||||||
| Class R5 |
5,013 | 69 | 7,905 | |||||||||
| Class R6 |
169,222 | 30,735 | 17,749 | |||||||||
| Select Class |
94,992 | 37,590 | 36,979 | |||||||||
| Net Asset Value (a): |
||||||||||||
| Class A — Redemption price per share |
$ | 15.02 | $ | 42.31 | $ | 24.29 | ||||||
| Class C — Offering price per share (b) |
13.47 | 41.32 | 19.79 | |||||||||
| Class R2 — Offering and redemption price per share |
— | 42.15 | 26.37 | |||||||||
| Class R5 — Offering and redemption price per share |
15.55 | 42.69 | 27.66 | |||||||||
| Class R6 — Offering and redemption price per share |
15.58 | 42.70 | 27.73 | |||||||||
| Select Class — Offering and redemption price per share |
15.35 | 42.68 | 27.45 | |||||||||
| Class A maximum sales charge |
5.25 | % | 5.25 | % | 5.25 | % | ||||||
| Class A maximum public offering price per share |
$ | 15.85 | $ | 44.65 | $ | 25.64 | ||||||
|
|
|
|
|
|
|
|||||||
| Cost of investments in non-affiliates |
$ | 4,895,537 | $ | 2,522,806 | $ | 2,412,730 | ||||||
| Cost of investments in affiliates |
170,071 | 85,656 | 94,931 | |||||||||
| (a) | Per share amounts may not recalculate due to rounding of net assets and/or shares outstanding. |
| (b) | Redemption price for Class C Shares varies based upon length of time the shares are held. |
SEE NOTES TO FINANCIAL STATEMENTS.
| DECEMBER 31, 2015 | J.P. MORGAN MID CAP/MULTI-CAP FUNDS | 41 | ||||||
Table of Contents
STATEMENTS OF ASSETS AND LIABILITIES
AS OF DECEMBER 31, 2015 (Unaudited) (continued)
(Amounts in thousands, except per share amounts)
| Mid Cap Value Fund |
Multi-Cap Market Neutral Fund |
Value Advantage Fund |
||||||||||
| ASSETS: |
||||||||||||
| Investments in non-affiliates, at value |
$ | 14,585,101 | $ | 243,199 | $ | 10,847,906 | ||||||
| Investments in affiliates, at value |
180,998 | 27,308 | 306,638 | |||||||||
|
|
|
|
|
|
|
|||||||
| Total investment securities, at value |
14,766,099 | 270,507 | 11,154,544 | |||||||||
| Cash |
— | 187 | 24 | |||||||||
| Deposits at broker for futures contracts |
— | 740 | — | |||||||||
| Deposits at broker for securities sold short |
— | 243,083 | — | |||||||||
| Receivables: |
||||||||||||
| Investment securities sold |
— | — | 4,004 | |||||||||
| Fund shares sold |
29,071 | 38 | 31,174 | |||||||||
| Dividends from non-affiliates |
22,462 | 240 | 11,567 | |||||||||
| Dividends from affiliates |
25 | 4 | 42 | |||||||||
|
|
|
|
|
|
|
|||||||
| Total Assets |
14,817,657 | 514,799 | 11,201,355 | |||||||||
|
|
|
|
|
|
|
|||||||
| LIABILITIES: |
||||||||||||
| Payables: |
||||||||||||
| Due to custodian |
57 | — | — | |||||||||
| Securities sold short, at value |
— | 241,707 | — | |||||||||
| Dividend expense to non-affiliates on securities sold short |
— | 102 | — | |||||||||
| Investment securities purchased |
1,183 | 55 | 19,366 | |||||||||
| Interest expense to non-affiliates on securities sold short |
— | 51 | — | |||||||||
| Fund shares redeemed |
102,576 | 40 | 17,675 | |||||||||
| Variation margin on futures contracts |
— | 559 | — | |||||||||
| Accrued liabilities: |
||||||||||||
| Investment advisory fees |
7,404 | 153 | 5,796 | |||||||||
| Administration fees |
655 | — | 542 | |||||||||
| Distribution fees |
875 | 6 | 925 | |||||||||
| Shareholder servicing fees |
770 | 56 | 869 | |||||||||
| Custodian and accounting fees |
201 | 16 | 90 | |||||||||
| Trustees’ and Chief Compliance Officer’s fees |
1 | 1 | 1 | |||||||||
| Other |
3,785 | 36 | 1,326 | |||||||||
|
|
|
|
|
|
|
|||||||
| Total Liabilities |
117,507 | 242,782 | 46,590 | |||||||||
|
|
|
|
|
|
|
|||||||
| Net Assets |
$ | 14,700,150 | $ | 272,017 | $ | 11,154,765 | ||||||
|
|
|
|
|
|
|
|||||||
SEE NOTES TO FINANCIAL STATEMENTS.
| 42 | J.P. MORGAN MID CAP/MULTI-CAP FUNDS | DECEMBER 31, 2015 | ||||
Table of Contents
| Mid Cap Value Fund |
Multi-Cap Market Neutral Fund |
Value Advantage Fund |
||||||||||
| NET ASSETS: |
||||||||||||
| Paid-in-Capital |
$ | 10,243,119 | $ | 281,889 | $ | 10,171,102 | ||||||
| Accumulated undistributed (distributions in excess of) net investment income |
(5,151 | ) | (1,429 | ) | (1,830 | ) | ||||||
| Accumulated net realized gains (losses) |
83,869 | (32,895 | ) | (60,691 | ) | |||||||
| Net unrealized appreciation (depreciation) |
4,378,313 | 24,452 | 1,046,184 | |||||||||
|
|
|
|
|
|
|
|||||||
| Total Net Assets |
$ | 14,700,150 | $ | 272,017 | $ | 11,154,765 | ||||||
|
|
|
|
|
|
|
|||||||
| Net Assets: |
||||||||||||
| Class A |
$ | 2,329,955 | $ | 7,161 | $ | 2,180,257 | ||||||
| Class C |
545,458 | 6,761 | 720,642 | |||||||||
| Class R2 |
64,927 | — | — | |||||||||
| Institutional Class |
9,626,398 | — | 6,831,402 | |||||||||
| Select Class |
2,133,412 | 258,095 | 1,422,464 | |||||||||
|
|
|
|
|
|
|
|||||||
| Total |
$ | 14,700,150 | $ | 272,017 | $ | 11,154,765 | ||||||
|
|
|
|
|
|
|
|||||||
| Outstanding units of beneficial interest (shares) ($0.0001 par value; unlimited number of shares authorized): |
||||||||||||
| Class A |
69,927 | 702 | 78,404 | |||||||||
| Class C |
16,923 | 704 | 25,977 | |||||||||
| Class R2 |
2,019 | — | — | |||||||||
| Institutional Class |
283,377 | — | 244,562 | |||||||||
| Select Class |
63,425 | 24,764 | 50,859 | |||||||||
| Net Asset Value (a): |
||||||||||||
| Class A — Redemption price per share |
$ | 33.32 | $ | 10.20 | $ | 27.81 | ||||||
| Class C — Offering price per share (b) |
32.23 | 9.60 | 27.74 | |||||||||
| Class R2 — Offering and redemption price per share |
32.16 | — | — | |||||||||
| Institutional Class — Offering and redemption price per share |
33.97 | — | 27.93 | |||||||||
| Select Class — Offering and redemption price per share |
33.64 | 10.42 | 27.97 | |||||||||
| Class A maximum sales charge |
5.25 | % | 5.25 | % | 5.25 | % | ||||||
| Class A maximum public offering price per share |
$ | 35.17 | $ | 10.77 | $ | 29.35 | ||||||
|
|
|
|
|
|
|
|||||||
| Cost of investments in non-affiliates |
$ | 10,206,788 | $ | 242,384 | $ | 9,801,722 | ||||||
| Cost of investments in affiliates |
180,998 | 27,308 | 306,638 | |||||||||
| Proceeds from securities sold short |
— | 265,343 | — | |||||||||
| (a) | Per share amounts may not recalculate due to rounding of net assets and/or shares outstanding. |
| (b) | Redemption price for Class C Shares varies based upon length of time the shares are held. |
SEE NOTES TO FINANCIAL STATEMENTS.
| DECEMBER 31, 2015 | J.P. MORGAN MID CAP/MULTI-CAP FUNDS | 43 | ||||||
Table of Contents
STATEMENTS OF OPERATIONS
FOR THE SIX MONTHS ENDED DECEMBER 31, 2015 (Unaudited)
(Amounts in thousands)
| Growth Advantage Fund |
Mid Cap Equity Fund |
Mid Cap Growth Fund |
||||||||||
| INVESTMENT INCOME: |
||||||||||||
| Dividend income from non-affiliates |
$ | 17,724 | $ | 18,541 | $ | 8,165 | ||||||
| Dividend income from affiliates |
71 | 45 | 56 | |||||||||
|
|
|
|
|
|
|
|||||||
| Total investment income |
17,795 | 18,586 | 8,221 | |||||||||
|
|
|
|
|
|
|
|||||||
| EXPENSES: |
||||||||||||
| Investment advisory fees |
18,983 | 10,569 | 10,005 | |||||||||
| Administration fees |
2,390 | 1,331 | 1,260 | |||||||||
| Distribution fees: |
||||||||||||
| Class A |
1,822 | 305 | 1,257 | |||||||||
| Class C |
1,646 | 97 | 337 | |||||||||
| Class R2 |
— | 2 | 47 | |||||||||
| Shareholder servicing fees: |
||||||||||||
| Class A |
1,822 | 305 | 1,257 | |||||||||
| Class C |
548 | 32 | 113 | |||||||||
| Class R2 |
— | 1 | 23 | |||||||||
| Class R5 |
17 | 1 | 43 | |||||||||
| Select Class |
1,696 | 2,112 | 1,782 | |||||||||
| Custodian and accounting fees |
82 | 46 | 39 | |||||||||
| Professional fees |
61 | 25 | 42 | |||||||||
| Trustees’ and Chief Compliance Officer’s fees |
23 | 13 | 13 | |||||||||
| Printing and mailing costs |
138 | 170 | 104 | |||||||||
| Registration and filing fees |
171 | 68 | 108 | |||||||||
| Transfer agent fees (See Note 2.E) |
78 | 27 | 207 | |||||||||
| Sub-transfer agent fees (See Note 2.E.) |
1,275 | 1,654 | 1,275 | |||||||||
| Other |
57 | 12 | 25 | |||||||||
|
|
|
|
|
|
|
|||||||
| Total expenses |
30,809 | 16,770 | 17,937 | |||||||||
|
|
|
|
|
|
|
|||||||
| Less fees waived |
(950 | ) | (2,516 | ) | (2,203 | ) | ||||||
| Less expense reimbursements |
— | (159 | ) | (23 | ) | |||||||
|
|
|
|
|
|
|
|||||||
| Net expenses |
29,859 | 14,095 | 15,711 | |||||||||
|
|
|
|
|
|
|
|||||||
| Net investment income (loss) |
(12,064 | ) | 4,491 | (7,490 | ) | |||||||
|
|
|
|
|
|
|
|||||||
| REALIZED/UNREALIZED GAINS (LOSSES): |
||||||||||||
| Net realized gain (loss) on transactions from Investments in non-affiliates |
10,611 | 40,702 | 218,864 | |||||||||
| Change in net unrealized appreciation/depreciation on Investments in non-affiliates |
(49,510 | ) | (225,538 | ) | (426,232 | ) | ||||||
|
|
|
|
|
|
|
|||||||
| Net realized/unrealized gains (losses) |
(38,899 | ) | (184,836 | ) | (207,368 | ) | ||||||
|
|
|
|
|
|
|
|||||||
| Change in net assets resulting from operations |
$ | (50,963 | ) | $ | (180,345 | ) | $ | (214,858 | ) | |||
|
|
|
|
|
|
|
|||||||
SEE NOTES TO FINANCIAL STATEMENTS.
| 44 | J.P. MORGAN MID CAP/MULTI-CAP FUNDS | DECEMBER 31, 2015 | ||||
Table of Contents
| Mid Cap Value Fund |
Multi-Cap Market Neutral Fund |
Value Advantage Fund |
||||||||||
| INVESTMENT INCOME: |
||||||||||||
| Dividend income from non-affiliates |
$ | 136,944 | $ | 2,874 | $ | 114,349 | ||||||
| Dividend income from affiliates |
138 | 16 | 237 | |||||||||
|
|
|
|
|
|
|
|||||||
| Total investment income |
137,082 | 2,890 | 114,586 | |||||||||
|
|
|
|
|
|
|
|||||||
| EXPENSES: |
||||||||||||
| Investment advisory fees |
50,222 | 1,352 | 36,959 | |||||||||
| Administration fees |
6,323 | 116 | 4,654 | |||||||||
| Distribution fees: |
||||||||||||
| Class A |
3,112 | 8 | 2,843 | |||||||||
| Class C |
2,148 | 25 | 2,689 | |||||||||
| Class R2 |
173 | — | — | |||||||||
| Shareholder servicing fees: |
||||||||||||
| Class A |
3,112 | 8 | 2,843 | |||||||||
| Class C |
716 | 8 | 896 | |||||||||
| Class R2 |
87 | — | — | |||||||||
| Institutional Class |
5,039 | — | 3,141 | |||||||||
| Select Class |
2,804 | 337 | 2,624 | |||||||||
| Custodian and accounting fees |
207 | 23 | 132 | |||||||||
| Interest expense to non-affiliates |
— | 1 | — | |||||||||
| Interest expense to affiliates |
— | 2 | — | |||||||||
| Professional fees |
95 | 27 | 93 | |||||||||
| Trustees’ and Chief Compliance Officer’s fees |
65 | 2 | 45 | |||||||||
| Printing and mailing costs |
489 | 3 | 294 | |||||||||
| Registration and filing fees |
232 | 25 | 284 | |||||||||
| Transfer agent fees (See Note 2.E) |
517 | 4 | 111 | |||||||||
| Sub-transfer agent fees (See Note 2.E.) |
7,181 | 17 | 3,527 | |||||||||
| Other |
68 | 5 | 51 | |||||||||
| Dividend expense to non-affiliates on securities sold short |
— | 1,628 | — | |||||||||
| Interest expense to non-affiliates on securities sold short |
— | 269 | — | |||||||||
|
|
|
|
|
|
|
|||||||
| Total expenses |
82,590 | 3,860 | 61,186 | |||||||||
|
|
|
|
|
|
|
|||||||
| Less fees waived |
(12,608 | ) | (430 | ) | (7,000 | ) | ||||||
| Less earnings credits |
— | (a) | — | — | ||||||||
| Less expense reimbursements |
(525 | ) | — | (336 | ) | |||||||
|
|
|
|
|
|
|
|||||||
| Net expenses |
69,457 | 3,430 | 53,850 | |||||||||
|
|
|
|
|
|
|
|||||||
| Net investment income (loss) |
67,625 | (540 | ) | 60,736 | ||||||||
|
|
|
|
|
|
|
|||||||
| REALIZED/UNREALIZED GAINS (LOSSES): |
||||||||||||
| Net realized gain (loss) on transactions from: |
||||||||||||
| Investments in non-affiliates |
223,102 | 17,641 | (38,418 | ) | ||||||||
| Futures |
— | 159 | — | |||||||||
| Securities sold short |
— | 7,326 | — | |||||||||
| Foreign currency transactions |
— | 1 | — | |||||||||
|
|
|
|
|
|
|
|||||||
| Net realized gain (loss) |
223,102 | 25,127 | (38,418 | ) | ||||||||
|
|
|
|
|
|
|
|||||||
| Change in net unrealized appreciation/depreciation on: |
||||||||||||
| Investments in non-affiliates |
(926,118 | ) | (37,918 | ) | (605,225 | ) | ||||||
| Futures |
— | (35 | ) | — | ||||||||
| Securities sold short |
— | 22,928 | — | |||||||||
|
|
|
|
|
|
|
|||||||
| Change in net unrealized appreciation/depreciation |
(926,118 | ) | (15,025 | ) | (605,225 | ) | ||||||
|
|
|
|
|
|
|
|||||||
| Net realized/unrealized gains (losses) |
(703,016 | ) | 10,102 | (643,643 | ) | |||||||
|
|
|
|
|
|
|
|||||||
| Change in net assets resulting from operations |
$ | (635,391 | ) | $ | 9,562 | $ | (582,907 | ) | ||||
|
|
|
|
|
|
|
|||||||
| (a) | Amount rounds to less than $1,000. |
SEE NOTES TO FINANCIAL STATEMENTS.
| DECEMBER 31, 2015 | J.P. MORGAN MID CAP/MULTI-CAP FUNDS | 45 | ||||||
Table of Contents
STATEMENTS OF CHANGES IN NET ASSETS
FOR THE PERIODS INDICATED
(Amounts in thousands)
| Growth Advantage Fund | Mid Cap Equity Fund | |||||||||||||||
| Six Months Ended December 31, 2015 (Unaudited) |
Year Ended June 30, 2015 |
Six Months Ended December 31, 2015 (Unaudited) |
Year Ended June 30, 2015 |
|||||||||||||
| CHANGE IN NET ASSETS RESULTING FROM OPERATIONS: |
||||||||||||||||
| Net investment income (loss) |
$ | (12,064 | ) | $ | (17,194 | ) | $ | 4,491 | $ | 9,702 | ||||||
| Net realized gain (loss) |
10,611 | 172,792 | 40,702 | 165,578 | ||||||||||||
| Change in net unrealized appreciation/depreciation |
(49,510 | ) | 461,167 | (225,538 | ) | 134,637 | ||||||||||
|
|
|
|
|
|
|
|
|
|||||||||
| Change in net assets resulting from operations |
(50,963 | ) | 616,765 | (180,345 | ) | 309,917 | ||||||||||
|
|
|
|
|
|
|
|
|
|||||||||
| DISTRIBUTIONS TO SHAREHOLDERS: |
||||||||||||||||
| Class A |
||||||||||||||||
| From net investment income |
— | — | (183 | ) | (81 | ) | ||||||||||
| From net realized gains |
(57,173 | ) | (32,469 | ) | (12,309 | ) | (8,089 | ) | ||||||||
| Class B (a) |
||||||||||||||||
| From net realized gains |
— | (98 | ) | — | — | |||||||||||
| Class C |
||||||||||||||||
| From net realized gains |
(20,218 | ) | (7,969 | ) | (1,246 | ) | (990 | ) | ||||||||
| Class R2 |
||||||||||||||||
| From net investment income |
— | — | — | (b) | — | |||||||||||
| From net realized gains |
— | — | (39 | ) | (30 | ) | ||||||||||
| Class R5 |
||||||||||||||||
| From net investment income |
— | — | (6 | ) | (2 | ) | ||||||||||
| From net realized gains |
(2,457 | ) | (1,758 | ) | (147 | ) | (26 | ) | ||||||||
| Class R6 |
||||||||||||||||
| From net investment income |
— | — | (3,099 | ) | (3,446 | ) | ||||||||||
| From net realized gains |
(86,200 | ) | (73,271 | ) | (61,528 | ) | (46,736 | ) | ||||||||
| Select Class |
||||||||||||||||
| From net investment income |
— | — | (2,603 | ) | (3,414 | ) | ||||||||||
| From net realized gains |
(48,267 | ) | (39,626 | ) | (75,744 | ) | (80,115 | ) | ||||||||
|
|
|
|
|
|
|
|
|
|||||||||
| Total distributions to shareholders |
(214,315 | ) | (155,191 | ) | (156,904 | ) | (142,929 | ) | ||||||||
|
|
|
|
|
|
|
|
|
|||||||||
| CAPITAL TRANSACTIONS: |
||||||||||||||||
| Change in net assets resulting from capital transactions |
1,551,574 | 1,161,499 | 249,717 | 363,135 | ||||||||||||
|
|
|
|
|
|
|
|
|
|||||||||
| NET ASSETS: |
||||||||||||||||
| Change in net assets |
1,286,296 | 1,623,073 | (87,532 | ) | 530,123 | |||||||||||
| Beginning of period |
5,188,280 | 3,565,207 | 3,303,293 | 2,773,170 | ||||||||||||
|
|
|
|
|
|
|
|
|
|||||||||
| End of period |
$ | 6,474,576 | $ | 5,188,280 | $ | 3,215,761 | $ | 3,303,293 | ||||||||
|
|
|
|
|
|
|
|
|
|||||||||
| Accumulated undistributed (distributions in excess of) net investment income |
$ | (22,367 | ) | $ | (10,303 | ) | $ | (1,425 | ) | $ | (25 | ) | ||||
|
|
|
|
|
|
|
|
|
|||||||||
| (a) | All remaining Class B Shares converted to Class A Shares on June 19, 2015 for Growth Advantage Fund. |
| (b) | Amount rounds to less than $1,000. |
SEE NOTES TO FINANCIAL STATEMENTS.
| 46 | J.P. MORGAN MID CAP/MULTI-CAP FUNDS | DECEMBER 31, 2015 | ||||
Table of Contents
| Mid Cap Growth Fund | Mid Cap Value Fund | |||||||||||||||
| Six Months Ended December 31, 2015 (Unaudited) |
Year Ended June 30, 2015 |
Six Months Ended December 31, 2015 (Unaudited) |
Year Ended June 30, 2015 |
|||||||||||||
| CHANGE IN NET ASSETS RESULTING FROM OPERATIONS: |
||||||||||||||||
| Net investment income (loss) |
$ | (7,490 | ) | $ | (11,970 | ) | $ | 67,625 | $ | 137,103 | ||||||
| Net realized gain (loss) |
218,864 | 173,141 | 223,102 | 1,096,684 | ||||||||||||
| Change in net unrealized appreciation/depreciation |
(426,232 | ) | 150,704 | (926,118 | ) | (12,168 | ) | |||||||||
|
|
|
|
|
|
|
|
|
|||||||||
| Change in net assets resulting from operations |
(214,858 | ) | 311,875 | (635,391 | ) | 1,221,619 | ||||||||||
|
|
|
|
|
|
|
|
|
|||||||||
| DISTRIBUTIONS TO SHAREHOLDERS: |
||||||||||||||||
| Class A |
||||||||||||||||
| From net investment income |
— | — | (9,590 | ) | (15,287 | ) | ||||||||||
| From net realized gains |
(56,339 | ) | (80,615 | ) | (130,210 | ) | (197,218 | ) | ||||||||
| Class B (a) |
||||||||||||||||
| From net realized gains |
— | (608 | ) | — | (668 | ) | ||||||||||
| Class C |
||||||||||||||||
| From net investment income |
— | — | — | (1,024 | ) | |||||||||||
| From net realized gains |
(6,714 | ) | (6,222 | ) | (31,402 | ) | (45,175 | ) | ||||||||
| Class R2 |
||||||||||||||||
| From net investment income |
— | — | (113 | ) | (331 | ) | ||||||||||
| From net realized gains |
(1,533 | ) | (345 | ) | (3,769 | ) | (5,603 | ) | ||||||||
| Class R5 |
||||||||||||||||
| From net realized gains |
(8,974 | ) | (3,427 | ) | — | — | ||||||||||
| Class R6 |
||||||||||||||||
| From net realized gains |
(23,518 | ) | (7,943 | ) | — | — | ||||||||||
| Institutional Class |
||||||||||||||||
| From net investment income |
— | — | (89,774 | ) | (108,605 | ) | ||||||||||
| From net realized gains |
— | — | (526,794 | ) | (711,308 | ) | ||||||||||
| Select Class |
||||||||||||||||
| From net investment income |
— | — | (14,584 | ) | (19,269 | ) | ||||||||||
| From net realized gains |
(50,435 | ) | (119,065 | ) | (117,229 | ) | (172,337 | ) | ||||||||
|
|
|
|
|
|
|
|
|
|||||||||
| Total distributions to shareholders |
(147,513 | ) | (218,225 | ) | (923,465 | ) | (1,276,825 | ) | ||||||||
|
|
|
|
|
|
|
|
|
|||||||||
| CAPITAL TRANSACTIONS: |
||||||||||||||||
| Change in net assets resulting from capital transactions |
165,856 | 787,072 | 299,933 | 368,694 | ||||||||||||
|
|
|
|
|
|
|
|
|
|||||||||
| NET ASSETS: |
||||||||||||||||
| Change in net assets |
(196,515 | ) | 880,722 | (1,258,923 | ) | 313,488 | ||||||||||
| Beginning of period |
3,062,526 | 2,181,804 | 15,959,073 | 15,645,585 | ||||||||||||
|
|
|
|
|
|
|
|
|
|||||||||
| End of period |
$ | 2,866,011 | $ | 3,062,526 | $ | 14,700,150 | $ | 15,959,073 | ||||||||
|
|
|
|
|
|
|
|
|
|||||||||
| Accumulated undistributed (distributions in excess of) net investment income |
$ | (15,461 | ) | $ | (7,971 | ) | $ | (5,151 | ) | $ | 41,285 | |||||
|
|
|
|
|
|
|
|
|
|||||||||
| (a) | All remaining Class B Shares converted to Class A Shares on June 19, 2015. |
SEE NOTES TO FINANCIAL STATEMENTS.
| DECEMBER 31, 2015 | J.P. MORGAN MID CAP/MULTI-CAP FUNDS | 47 | ||||||
Table of Contents
STATEMENTS OF CHANGES IN NET ASSETS
FOR THE PERIODS INDICATED (continued)
(Amounts in thousands)
| Multi-Cap Market Neutral Fund | Value Advantage Fund | |||||||||||||||
| Six Months Ended December 31, 2015 (Unaudited) |
Year Ended June 30, 2015 |
Six Months Ended December 31, 2015 (Unaudited) |
Year Ended June 30, 2015 |
|||||||||||||
| CHANGE IN NET ASSETS RESULTING FROM OPERATIONS: |
||||||||||||||||
| Net investment income (loss) |
$ | (540 | ) | $ | (3,300 | ) | $ | 60,736 | $ | 87,727 | ||||||
| Net realized gain (loss) |
25,127 | 2,998 | (38,418 | ) | 148,940 | |||||||||||
| Change in net unrealized appreciation/depreciation |
(15,025 | ) | 1,106 | (605,225 | ) | 322,296 | ||||||||||
|
|
|
|
|
|
|
|
|
|||||||||
| Change in net assets resulting from operations |
9,562 | 804 | (582,907 | ) | 558,963 | |||||||||||
|
|
|
|
|
|
|
|
|
|||||||||
| DISTRIBUTIONS TO SHAREHOLDERS: |
||||||||||||||||
| Class A |
||||||||||||||||
| From net investment income |
— | — | (13,377 | ) | (18,586 | ) | ||||||||||
| From net realized gains |
— | — | (22,280 | ) | (49,085 | ) | ||||||||||
| Class C |
||||||||||||||||
| From net investment income |
— | — | (1,450 | ) | (2,882 | ) | ||||||||||
| From net realized gains |
— | — | (7,343 | ) | (12,315 | ) | ||||||||||
| Institutional Class |
||||||||||||||||
| From net investment income |
— | — | (77,515 | ) | (51,909 | ) | ||||||||||
| From net realized gains |
— | — | (69,360 | ) | (93,724 | ) | ||||||||||
| Select Class |
||||||||||||||||
| From net investment income |
— | — | (9,572 | ) | (31,036 | ) | ||||||||||
| From net realized gains |
— | — | (14,646 | ) | (67,644 | ) | ||||||||||
|
|
|
|
|
|
|
|
|
|||||||||
| Total distributions to shareholders |
— | — | (215,543 | ) | (327,181 | ) | ||||||||||
|
|
|
|
|
|
|
|
|
|||||||||
| CAPITAL TRANSACTIONS: |
||||||||||||||||
| Change in net assets resulting from capital transactions |
(28,225 | ) | (161,126 | ) | 658,708 | 3,369,281 | ||||||||||
|
|
|
|
|
|
|
|
|
|||||||||
| NET ASSETS: |
||||||||||||||||
| Change in net assets |
(18,663 | ) | (160,322 | ) | (139,742 | ) | 3,601,063 | |||||||||
| Beginning of period |
290,680 | 451,002 | 11,294,507 | 7,693,444 | ||||||||||||
|
|
|
|
|
|
|
|
|
|||||||||
| End of period |
$ | 272,017 | $ | 290,680 | $ | 11,154,765 | $ | 11,294,507 | ||||||||
|
|
|
|
|
|
|
|
|
|||||||||
| Accumulated undistributed (distributions in excess of) net investment income |
$ | (1,429 | ) | $ | (889 | ) | $ | (1,830 | ) | $ | 39,348 | |||||
|
|
|
|
|
|
|
|
|
|||||||||
SEE NOTES TO FINANCIAL STATEMENTS.
| 48 | J.P. MORGAN MID CAP/MULTI-CAP FUNDS | DECEMBER 31, 2015 | ||||
Table of Contents
| Growth Advantage Fund | Mid Cap Equity Fund | |||||||||||||||
| Six Months Ended December 31, 2015 (Unaudited) |
Year Ended June 30, 2015 |
Six Months Ended December 31, 2015 (Unaudited) |
Year Ended June 30, 2015 |
|||||||||||||
| CAPITAL TRANSACTIONS: |
||||||||||||||||
| Class A |
||||||||||||||||
| Proceeds from shares issued |
$ | 735,277 | $ | 548,977 | $ | 74,185 | $ | 93,435 | ||||||||
| Distributions reinvested |
56,255 | 31,822 | 12,454 | 8,101 | ||||||||||||
| Cost of shares redeemed |
(160,075 | ) | (222,820 | ) | (23,985 | ) | (35,536 | ) | ||||||||
| Conversion from Class B Shares |
— | 2,100 | — | — | ||||||||||||
|
|
|
|
|
|
|
|
|
|||||||||
| Change in net assets resulting from Class A capital transactions |
$ | 631,457 | $ | 360,079 | $ | 62,654 | $ | 66,000 | ||||||||
|
|
|
|
|
|
|
|
|
|||||||||
| Class B (a) |
||||||||||||||||
| Proceeds from shares issued |
$ | — | $ | 225 | $ | — | $ | — | ||||||||
| Distributions reinvested |
— | 95 | — | — | ||||||||||||
| Cost of shares redeemed |
— | (865 | ) | — | — | |||||||||||
| Conversion to Class A Shares |
— | (2,100 | ) | — | — | |||||||||||
|
|
|
|
|
|
|
|
|
|||||||||
| Change in net assets resulting from Class B capital transactions |
$ | — | $ | (2,645 | ) | $ | — | $ | — | |||||||
|
|
|
|
|
|
|
|
|
|||||||||
| Class C |
||||||||||||||||
| Proceeds from shares issued |
$ | 287,850 | $ | 182,071 | $ | 4,550 | $ | 6,417 | ||||||||
| Distributions reinvested |
18,351 | 6,954 | 1,244 | 990 | ||||||||||||
| Cost of shares redeemed |
(35,380 | ) | (32,956 | ) | (2,178 | ) | (2,929 | ) | ||||||||
|
|
|
|
|
|
|
|
|
|||||||||
| Change in net assets resulting from Class C capital transactions |
$ | 270,821 | $ | 156,069 | $ | 3,616 | $ | 4,478 | ||||||||
|
|
|
|
|
|
|
|
|
|||||||||
| Class R2 |
||||||||||||||||
| Proceeds from shares issued |
$ | — | $ | — | $ | 123 | $ | 336 | ||||||||
| Distributions reinvested |
— | — | 27 | 18 | ||||||||||||
| Cost of shares redeemed |
— | — | (108 | ) | (251 | ) | ||||||||||
|
|
|
|
|
|
|
|
|
|||||||||
| Change in net assets resulting from Class R2 capital transactions |
$ | — | $ | — | $ | 42 | $ | 103 | ||||||||
|
|
|
|
|
|
|
|
|
|||||||||
| Class R5 |
||||||||||||||||
| Proceeds from shares issued |
$ | 25,906 | $ | 77,457 | $ | 1,959 | $ | 1,637 | ||||||||
| Distributions reinvested |
2,457 | 1,758 | 153 | 28 | ||||||||||||
| Cost of shares redeemed |
(6,209 | ) | (1,506,939 | ) | (497 | ) | (186 | ) | ||||||||
|
|
|
|
|
|
|
|
|
|||||||||
| Change in net assets resulting from Class R5 capital transactions |
$ | 22,154 | $ | (1,427,724 | ) | $ | 1,615 | $ | 1,479 | |||||||
|
|
|
|
|
|
|
|
|
|||||||||
| Class R6 |
||||||||||||||||
| Proceeds from shares issued |
$ | 273,887 | $ | 1,928,585 | $ | 128,793 | $ | 369,933 | ||||||||
| Distributions reinvested |
83,297 | 70,979 | 64,380 | 49,924 | ||||||||||||
| Cost of shares redeemed |
(28,391 | ) | (53,688 | ) | (15,372 | ) | (35,342 | ) | ||||||||
|
|
|
|
|
|
|
|
|
|||||||||
| Change in net assets resulting from Class R6 capital transactions |
$ | 328,793 | $ | 1,945,876 | $ | 177,801 | $ | 384,515 | ||||||||
|
|
|
|
|
|
|
|
|
|||||||||
| Select Class |
||||||||||||||||
| Proceeds from shares issued |
$ | 473,454 | $ | 361,358 | $ | 166,319 | $ | 345,873 | ||||||||
| Distributions reinvested |
31,907 | 23,846 | 64,677 | 60,746 | ||||||||||||
| Cost of shares redeemed |
(207,012 | ) | (255,360 | ) | (227,007 | ) | (500,059 | ) | ||||||||
|
|
|
|
|
|
|
|
|
|||||||||
| Change in net assets resulting from Select Class capital transactions |
$ | 298,349 | $ | 129,844 | $ | 3,989 | $ | (93,440 | ) | |||||||
|
|
|
|
|
|
|
|
|
|||||||||
| Total change in net assets resulting from capital transactions |
$ | 1,551,574 | $ | 1,161,499 | $ | 249,717 | $ | 363,135 | ||||||||
|
|
|
|
|
|
|
|
|
|||||||||
| (a) | All remaining Class B Shares converted to Class A Shares on June 19, 2015 for Growth Advantage Fund. |
SEE NOTES TO FINANCIAL STATEMENTS.
| DECEMBER 31, 2015 | J.P. MORGAN MID CAP/MULTI-CAP FUNDS | 49 | ||||||
Table of Contents
STATEMENTS OF CHANGES IN NET ASSETS
FOR THE PERIODS INDICATED (continued)
(Amounts in thousands)
| Growth Advantage Fund | Mid Cap Equity Fund | |||||||||||||||
| Six Months Ended December 31, 2015 (Unaudited) |
Year Ended June 30, 2015 |
Six Months Ended December 31, 2015 (Unaudited) |
Year Ended June 30, 2015 |
|||||||||||||
| SHARE TRANSACTIONS: |
||||||||||||||||
| Class A |
||||||||||||||||
| Issued |
47,557 | 36,907 | 1,661 | 2,053 | ||||||||||||
| Reinvested |
3,824 | 2,270 | 298 | 188 | ||||||||||||
| Redeemed |
(10,380 | ) | (15,105 | ) | (533 | ) | (784 | ) | ||||||||
| Conversion from Class B Shares |
— | 131 | — | — | ||||||||||||
|
|
|
|
|
|
|
|
|
|||||||||
| Change in Class A Shares |
41,001 | 24,203 | 1,426 | 1,457 | ||||||||||||
|
|
|
|
|
|
|
|
|
|||||||||
| Class B (a) |
||||||||||||||||
| Issued |
— | 17 | — | — | ||||||||||||
| Reinvested |
— | 7 | — | — | ||||||||||||
| Redeemed |
— | (64 | ) | — | — | |||||||||||
| Conversion to Class A Shares |
— | (146 | ) | — | — | |||||||||||
|
|
|
|
|
|
|
|
|
|||||||||
| Change in Class B Shares |
— | (186 | ) | — | — | |||||||||||
|
|
|
|
|
|
|
|
|
|||||||||
| Class C |
||||||||||||||||
| Issued |
20,643 | 13,414 | 104 | 144 | ||||||||||||
| Reinvested |
1,389 | 547 | 30 | 23 | ||||||||||||
| Redeemed |
(2,557 | ) | (2,464 | ) | (50 | ) | (65 | ) | ||||||||
|
|
|
|
|
|
|
|
|
|||||||||
| Change in Class C Shares |
19,475 | 11,497 | 84 | 102 | ||||||||||||
|
|
|
|
|
|
|
|
|
|||||||||
| Class R2 |
||||||||||||||||
| Issued |
— | — | 2 | 7 | ||||||||||||
| Reinvested |
— | — | 1 | — | (b) | |||||||||||
| Redeemed |
— | — | (2 | ) | (6 | ) | ||||||||||
|
|
|
|
|
|
|
|
|
|||||||||
| Change in Class R2 Shares |
— | — | 1 | 1 | ||||||||||||
|
|
|
|
|
|
|
|
|
|||||||||
| Class R5 |
||||||||||||||||
| Issued |
1,627 | 5,216 | 42 | 35 | ||||||||||||
| Reinvested |
161 | 122 | 4 | 1 | ||||||||||||
| Redeemed |
(387 | ) | (101,089 | ) | (11 | ) | (4 | ) | ||||||||
|
|
|
|
|
|
|
|
|
|||||||||
| Change in Class R5 Shares |
1,401 | (95,751 | ) | 35 | 32 | |||||||||||
|
|
|
|
|
|
|
|
|
|||||||||
| Class R6 |
||||||||||||||||
| Issued |
17,149 | 128,407 | 2,819 | 8,126 | ||||||||||||
| Reinvested |
5,459 | 4,909 | 1,528 | 1,145 | ||||||||||||
| Redeemed |
(1,739 | ) | (3,544 | ) | (333 | ) | (779 | ) | ||||||||
|
|
|
|
|
|
|
|
|
|||||||||
| Change in Class R6 Shares |
20,869 | 129,772 | 4,014 | 8,492 | ||||||||||||
|
|
|
|
|
|
|
|
|
|||||||||
| Select Class |
||||||||||||||||
| Issued |
29,969 | 23,952 | 3,666 | 7,557 | ||||||||||||
| Reinvested |
2,122 | 1,668 | 1,536 | 1,396 | ||||||||||||
| Redeemed |
(13,016 | ) | (16,966 | ) | (4,978 | ) | (10,866 | ) | ||||||||
|
|
|
|
|
|
|
|
|
|||||||||
| Change in Select Class Shares |
19,075 | 8,654 | 224 | (1,913 | ) | |||||||||||
|
|
|
|
|
|
|
|
|
|||||||||
| (a) | All remaining Class B Shares converted to Class A Shares on June 19, 2015 for Growth Advantage Fund. |
| (b) | Amount rounds to less than 1,000 Shares. |
SEE NOTES TO FINANCIAL STATEMENTS.
| 50 | J.P. MORGAN MID CAP/MULTI-CAP FUNDS | DECEMBER 31, 2015 | ||||
Table of Contents
| Mid Cap Growth Fund | Mid Cap Value Fund | |||||||||||||||
| Six Months Ended December 31, 2015 (Unaudited) |
Year Ended June 30, 2015 |
Six Months Ended December 31, 2015 (Unaudited) |
Year Ended June 30, 2015 |
|||||||||||||
| CAPITAL TRANSACTIONS: |
||||||||||||||||
| Class A |
||||||||||||||||
| Proceeds from shares issued |
$ | 201,904 | $ | 274,574 | $ | 152,388 | $ | 394,792 | ||||||||
| Distributions reinvested |
54,215 | 76,907 | 127,887 | 195,292 | ||||||||||||
| Cost of shares redeemed |
(103,020 | ) | (162,077 | ) | (326,787 | ) | (1,360,678 | ) | ||||||||
| Conversion from Class B Shares |
— | 3,778 | — | 6,728 | ||||||||||||
|
|
|
|
|
|
|
|
|
|||||||||
| Change in net assets resulting from Class A capital transactions |
$ | 153,099 | $ | 193,182 | $ | (46,512 | ) | $ | (763,866 | ) | ||||||
|
|
|
|
|
|
|
|
|
|||||||||
| Class B (a) |
||||||||||||||||
| Proceeds from shares issued |
$ | — | $ | 27 | $ | — | $ | 22 | ||||||||
| Distributions reinvested |
— | 593 | — | 639 | ||||||||||||
| Cost of shares redeemed |
— | (1,919 | ) | — | (4,670 | ) | ||||||||||
| Conversion to Class A Shares |
— | (3,778 | ) | — | (6,728 | ) | ||||||||||
|
|
|
|
|
|
|
|
|
|||||||||
| Change in net assets resulting from Class B capital transactions |
$ | — | $ | (5,077 | ) | $ | — | $ | (10,737 | ) | ||||||
|
|
|
|
|
|
|
|
|
|||||||||
| Class C |
||||||||||||||||
| Proceeds from shares issued |
$ | 42,799 | $ | 37,238 | $ | 15,390 | $ | 27,636 | ||||||||
| Distributions reinvested |
5,744 | 5,274 | 25,199 | 36,724 | ||||||||||||
| Cost of shares redeemed |
(9,200 | ) | (8,786 | ) | (33,138 | ) | (72,861 | ) | ||||||||
|
|
|
|
|
|
|
|
|
|||||||||
| Change in net assets resulting from Class C capital transactions |
$ | 39,343 | $ | 33,726 | $ | 7,451 | $ | (8,501 | ) | |||||||
|
|
|
|
|
|
|
|
|
|||||||||
| Class R2 |
||||||||||||||||
| Proceeds from shares issued |
$ | 23,796 | $ | 8,894 | $ | 6,355 | $ | 16,445 | ||||||||
| Distributions reinvested |
1,494 | 345 | 3,715 | 5,637 | ||||||||||||
| Cost of shares redeemed |
(1,843 | ) | (1,635 | ) | (9,892 | ) | (21,709 | ) | ||||||||
|
|
|
|
|
|
|
|
|
|||||||||
| Change in net assets resulting from Class R2 capital transactions |
$ | 23,447 | $ | 7,604 | $ | 178 | $ | 373 | ||||||||
|
|
|
|
|
|
|
|
|
|||||||||
| Class R5 |
||||||||||||||||
| Proceeds from shares issued |
$ | 81,505 | $ | 139,213 | $ | — | $ | — | ||||||||
| Distributions reinvested |
8,974 | 3,427 | — | — | ||||||||||||
| Cost of shares redeemed |
(15,850 | ) | (10,062 | ) | — | — | ||||||||||
|
|
|
|
|
|
|
|
|
|||||||||
| Change in net assets resulting from Class R5 capital transactions |
$ | 74,629 | $ | 132,578 | $ | — | $ | — | ||||||||
|
|
|
|
|
|
|
|
|
|||||||||
| Class R6 |
||||||||||||||||
| Proceeds from shares issued |
$ | 283,930 | $ | 185,884 | $ | — | $ | — | ||||||||
| Distributions reinvested |
23,176 | 7,291 | — | — | ||||||||||||
| Cost of shares redeemed |
(32,004 | ) | (26,514 | ) | — | — | ||||||||||
|
|
|
|
|
|
|
|
|
|||||||||
| Change in net assets resulting from Class R6 capital transactions |
$ | 275,102 | $ | 166,661 | $ | — | $ | — | ||||||||
|
|
|
|
|
|
|
|
|
|||||||||
| Institutional Class |
||||||||||||||||
| Proceeds from shares issued |
$ | — | $ | — | $ | 797,849 | $ | 2,898,688 | ||||||||
| Distributions reinvested |
— | — | 515,077 | 686,825 | ||||||||||||
| Cost of shares redeemed |
— | — | (984,522 | ) | (1,786,837 | ) | ||||||||||
|
|
|
|
|
|
|
|
|
|||||||||
| Change in net assets resulting from Institutional Class capital transactions |
$ | — | $ | — | $ | 328,404 | $ | 1,798,676 | ||||||||
|
|
|
|
|
|
|
|
|
|||||||||
| (a) | All remaining Class B Shares converted to Class A Shares on June 19, 2015. |
SEE NOTES TO FINANCIAL STATEMENTS.
| DECEMBER 31, 2015 | J.P. MORGAN MID CAP/MULTI-CAP FUNDS | 51 | ||||||
Table of Contents
STATEMENTS OF CHANGES IN NET ASSETS
FOR THE PERIODS INDICATED (continued)
(Amounts in thousands)
| Mid Cap Growth Fund | Mid Cap Value Fund | |||||||||||||||
| Six Months Ended December 31, 2015 (Unaudited) |
Year Ended June 30, 2015 |
Six Months Ended December 31, 2015 (Unaudited) |
Year Ended June 30, 2015 |
|||||||||||||
| CAPITAL TRANSACTIONS: (continued) |
||||||||||||||||
| Select Class |
||||||||||||||||
| Proceeds from shares issued |
$ | 427,113 | $ | 427,509 | $ | 179,926 | $ | 1,046,215 | ||||||||
| Distributions reinvested |
41,535 | 103,039 | 119,621 | 174,083 | ||||||||||||
| Cost of shares redeemed |
(266,294 | ) | (272,150 | ) | (289,135 | ) | (1,867,549 | ) | ||||||||
| Redemptions in-kind (See Note 7) |
(602,118 | ) | — | — | — | |||||||||||
|
|
|
|
|
|
|
|
|
|||||||||
| Change in net assets resulting from Select Class capital transactions |
$ | (399,764 | ) | $ | 258,398 | $ | 10,412 | $ | (647,251 | ) | ||||||
|
|
|
|
|
|
|
|
|
|||||||||
| Total change in net assets resulting from capital transactions |
$ | 165,856 | $ | 787,072 | $ | 299,933 | $ | 368,694 | ||||||||
|
|
|
|
|
|
|
|
|
|||||||||
SEE NOTES TO FINANCIAL STATEMENTS.
| 52 | J.P. MORGAN MID CAP/MULTI-CAP FUNDS | DECEMBER 31, 2015 | ||||
Table of Contents
| Mid Cap Growth Fund | Mid Cap Value Fund | |||||||||||||||
| Six Months Ended December 31, 2015 (Unaudited) |
Year Ended June 30, 2015 |
Six Months Ended December 31, 2015 (Unaudited) |
Year Ended June 30, 2015 |
|||||||||||||
| SHARE TRANSACTIONS: |
||||||||||||||||
| Class A |
||||||||||||||||
| Issued |
7,653 | 10,468 | 4,300 | 10,652 | ||||||||||||
| Reinvested |
2,266 | 3,166 | 3,881 | 5,494 | ||||||||||||
| Redeemed |
(3,946 | ) | (6,089 | ) | (9,203 | ) | (36,773 | ) | ||||||||
| Conversion from Class B Shares |
— | 136 | — | 178 | ||||||||||||
|
|
|
|
|
|
|
|
|
|||||||||
| Change in Class A Shares |
5,973 | 7,681 | (1,022 | ) | (20,449 | ) | ||||||||||
|
|
|
|
|
|
|
|
|
|||||||||
| Class B (a) |
||||||||||||||||
| Issued |
— | 1 | — | 1 | ||||||||||||
| Reinvested |
— | 37 | — | 18 | ||||||||||||
| Redeemed |
— | (106 | ) | — | (128 | ) | ||||||||||
| Conversion to Class A Shares |
— | (202 | ) | — | (182 | ) | ||||||||||
|
|
|
|
|
|
|
|
|
|||||||||
| Change in Class B Shares |
— | (270 | ) | — | (291 | ) | ||||||||||
|
|
|
|
|
|
|
|
|
|||||||||
| Class C |
||||||||||||||||
| Issued |
1,973 | 1,668 | 461 | 779 | ||||||||||||
| Reinvested |
295 | 262 | 794 | 1,070 | ||||||||||||
| Redeemed |
(432 | ) | (396 | ) | (967 | ) | (2,021 | ) | ||||||||
|
|
|
|
|
|
|
|
|
|||||||||
| Change in Class C Shares |
1,836 | 1,534 | 288 | (172 | ) | |||||||||||
|
|
|
|
|
|
|
|
|
|||||||||
| Class R2 |
||||||||||||||||
| Issued |
843 | 310 | 186 | 458 | ||||||||||||
| Reinvested |
57 | 13 | 117 | 164 | ||||||||||||
| Redeemed |
(65 | ) | (57 | ) | (290 | ) | (607 | ) | ||||||||
|
|
|
|
|
|
|
|
|
|||||||||
| Change in Class R2 Shares |
835 | 266 | 13 | 15 | ||||||||||||
|
|
|
|
|
|
|
|
|
|||||||||
| Class R5 |
||||||||||||||||
| Issued |
2,842 | 4,578 | — | — | ||||||||||||
| Reinvested |
329 | 125 | — | — | ||||||||||||
| Redeemed |
(535 | ) | (334 | ) | — | — | ||||||||||
|
|
|
|
|
|
|
|
|
|||||||||
| Change in Class R5 Shares |
2,636 | 4,369 | — | — | ||||||||||||
|
|
|
|
|
|
|
|
|
|||||||||
| Class R6 |
||||||||||||||||
| Issued |
9,500 | 6,285 | — | — | ||||||||||||
| Reinvested |
849 | 266 | — | — | ||||||||||||
| Redeemed |
(1,087 | ) | (882 | ) | — | — | ||||||||||
|
|
|
|
|
|
|
|
|
|||||||||
| Change in Class R6 Shares |
9,262 | 5,669 | — | — | ||||||||||||
|
|
|
|
|
|
|
|
|
|||||||||
| Institutional Class |
||||||||||||||||
| Issued |
— | — | 22,039 | 75,729 | ||||||||||||
| Reinvested |
— | — | 15,274 | 18,860 | ||||||||||||
| Redeemed |
— | — | (27,266 | ) | (47,177 | ) | ||||||||||
|
|
|
|
|
|
|
|
|
|||||||||
| Change in Institutional Class Shares |
— | — | 10,047 | 47,412 | ||||||||||||
|
|
|
|
|
|
|
|
|
|||||||||
| Select Class |
||||||||||||||||
| Issued |
14,554 | 14,507 | 5,094 | 27,961 | ||||||||||||
| Reinvested |
1,536 | 3,790 | 3,589 | 4,839 | ||||||||||||
| Redeemed |
(9,115 | ) | (9,299 | ) | (8,092 | ) | (48,879 | ) | ||||||||
| Redemptions in-kind (See Note 7) |
(20,287 | ) | — | — | — | |||||||||||
|
|
|
|
|
|
|
|
|
|||||||||
| Change in Select Class Shares |
(13,312 | ) | 8,998 | 591 | (16,079 | ) | ||||||||||
|
|
|
|
|
|
|
|
|
|||||||||
| (a) | All remaining Class B Shares converted to Class A Shares on June 19, 2015. |
SEE NOTES TO FINANCIAL STATEMENTS.
| DECEMBER 31, 2015 | J.P. MORGAN MID CAP/MULTI-CAP FUNDS | 53 | ||||||
Table of Contents
STATEMENTS OF CHANGES IN NET ASSETS
FOR THE PERIODS INDICATED (continued)
(Amounts in thousands)
| Multi-Cap Market Neutral Fund | Value Advantage Fund | |||||||||||||||
| Six Months Ended December 31, 2015 (Unaudited) |
Year Ended June 30, 2015 |
Six Months Ended December 31, 2015 (Unaudited) |
Year Ended June 30, 2015 |
|||||||||||||
| CAPITAL TRANSACTIONS: |
||||||||||||||||
| Class A |
||||||||||||||||
| Proceeds from shares issued |
$ | 1,619 | $ | 558 | $ | 426,720 | $ | 1,131,012 | ||||||||
| Distributions reinvested |
— | — | 34,154 | 63,610 | ||||||||||||
| Cost of shares redeemed |
(938 | ) | (4,659 | ) | (571,134 | ) | (503,182 | ) | ||||||||
| Conversion from Class B Shares |
— | 79 | — | — | ||||||||||||
|
|
|
|
|
|
|
|
|
|||||||||
| Change in net assets resulting from Class A capital transactions |
$ | 681 | $ | (4,022 | ) | $ | (110,260 | ) | $ | 691,440 | ||||||
|
|
|
|
|
|
|
|
|
|||||||||
| Class B (a) |
||||||||||||||||
| Cost of shares redeemed |
$ | — | $ | (129 | ) | $ | — | $ | — | |||||||
| Conversion to Class A Shares |
— | (79 | ) | — | — | |||||||||||
|
|
|
|
|
|
|
|
|
|||||||||
| Change in net assets resulting from Class B capital transactions |
$ | — | $ | (208 | ) | $ | — | $ | — | |||||||
|
|
|
|
|
|
|
|
|
|||||||||
| Class C |
||||||||||||||||
| Proceeds from shares issued |
$ | 754 | $ | 522 | $ | 121,500 | $ | 341,265 | ||||||||
| Distributions reinvested |
— | — | 7,430 | 12,024 | ||||||||||||
| Cost of shares redeemed |
(952 | ) | (2,310 | ) | (60,487 | ) | (65,697 | ) | ||||||||
|
|
|
|
|
|
|
|
|
|||||||||
| Change in net assets resulting from Class C capital transactions |
$ | (198 | ) | $ | (1,788 | ) | $ | 68,443 | $ | 287,592 | ||||||
|
|
|
|
|
|
|
|
|
|||||||||
| Institutional Class |
||||||||||||||||
| Proceeds from shares issued |
$ | — | $ | — | $ | 2,575,922 | $ | 2,416,260 | ||||||||
| Distributions reinvested |
— | — | 138,428 | 134,005 | ||||||||||||
| Cost of shares redeemed |
— | — | (508,024 | ) | (641,266 | ) | ||||||||||
|
|
|
|
|
|
|
|
|
|||||||||
| Change in net assets resulting from Institutional Class capital transactions |
$ | — | $ | — | $ | 2,206,326 | $ | 1,908,999 | ||||||||
|
|
|
|
|
|
|
|
|
|||||||||
| Select Class |
||||||||||||||||
| Proceeds from shares issued |
$ | 1,223 | $ | 8,612 | $ | 368,274 | $ | 883,261 | ||||||||
| Distributions reinvested |
— | — | 17,281 | 87,369 | ||||||||||||
| Cost of shares redeemed |
(29,931 | ) | (163,720 | ) | (1,891,356 | ) | (489,380 | ) | ||||||||
|
|
|
|
|
|
|
|
|
|||||||||
| Change in net assets resulting from Select Class capital transactions |
$ | (28,708 | ) | $ | (155,108 | ) | $ | (1,505,801 | ) | $ | 481,250 | |||||
|
|
|
|
|
|
|
|
|
|||||||||
| Total change in net assets resulting from capital transactions |
$ | (28,225 | ) | $ | (161,126 | ) | $ | 658,708 | $ | 3,369,281 | ||||||
|
|
|
|
|
|
|
|
|
|||||||||
| (a) | All remaining Class B Shares converted to Class A Shares on June 19, 2015 for Multi-Cap Market Neutral Fund. |
SEE NOTES TO FINANCIAL STATEMENTS.
| 54 | J.P. MORGAN MID CAP/MULTI-CAP FUNDS | DECEMBER 31, 2015 | ||||
Table of Contents
| Multi-Cap Market Neutral Fund | Value Advantage Fund | |||||||||||||||
| Six Months Ended December 31, 2015 (Unaudited) |
Year Ended June 30, 2015 |
Six Months Ended December 31, 2015 (Unaudited) |
Year Ended June 30, 2015 |
|||||||||||||
| SHARE TRANSACTIONS: |
||||||||||||||||
| Class A |
||||||||||||||||
| Issued |
159 | 56 | 14,780 | 38,204 | ||||||||||||
| Reinvested |
— | — | 1,238 | 2,177 | ||||||||||||
| Redeemed |
(93 | ) | (468 | ) | (19,379 | ) | (16,986 | ) | ||||||||
| Conversion from Class B Shares |
— | 8 | — | — | ||||||||||||
|
|
|
|
|
|
|
|
|
|||||||||
| Change in Class A Shares |
66 | (404 | ) | (3,361 | ) | 23,395 | ||||||||||
|
|
|
|
|
|
|
|
|
|||||||||
| Class B (a) |
||||||||||||||||
| Redeemed |
— | (14 | ) | — | — | |||||||||||
| Conversion to Class A Shares |
— | (8 | ) | — | — | |||||||||||
|
|
|
|
|
|
|
|
|
|||||||||
| Change in Class B Shares |
— | (22 | ) | — | — | |||||||||||
|
|
|
|
|
|
|
|
|
|||||||||
| Class C |
||||||||||||||||
| Issued |
79 | 56 | 4,234 | 11,531 | ||||||||||||
| Reinvested |
— | — | 270 | 414 | ||||||||||||
| Redeemed |
(101 | ) | (245 | ) | (2,111 | ) | (2,215 | ) | ||||||||
|
|
|
|
|
|
|
|
|
|||||||||
| Change in Class C Shares |
(22 | ) | (189 | ) | 2,393 | 9,730 | ||||||||||
|
|
|
|
|
|
|
|
|
|||||||||
| Institutional Class |
||||||||||||||||
| Issued |
— | — | 88,843 | 81,240 | ||||||||||||
| Reinvested |
— | — | 4,985 | 4,545 | ||||||||||||
| Redeemed |
— | — | (17,556 | ) | (21,282 | ) | ||||||||||
|
|
|
|
|
|
|
|
|
|||||||||
| Change in Institutional Class Shares |
— | — | 76,272 | 64,503 | ||||||||||||
|
|
|
|
|
|
|
|
|
|||||||||
| Select Class |
||||||||||||||||
| Issued |
120 | 848 | 12,743 | 29,705 | ||||||||||||
| Reinvested |
— | — | 623 | 2,972 | ||||||||||||
| Redeemed |
(2,921 | ) | (16,074 | ) | (65,712 | ) | (16,492 | ) | ||||||||
|
|
|
|
|
|
|
|
|
|||||||||
| Change in Select Class Shares |
(2,801 | ) | (15,226 | ) | (52,346 | ) | 16,185 | |||||||||
|
|
|
|
|
|
|
|
|
|||||||||
| (a) | All remaining Class B Shares converted to Class A Shares on June 19, 2015 for Multi-Cap Market Neutral Fund. |
SEE NOTES TO FINANCIAL STATEMENTS.
| DECEMBER 31, 2015 | J.P. MORGAN MID CAP/MULTI-CAP FUNDS | 55 | ||||||
Table of Contents
FOR THE PERIODS INDICATED
|
|
Per share operating performance | |||||||||||||||||||||||||||
| Investment operations | Distributions | |||||||||||||||||||||||||||
| Net asset value, beginning of period |
Net investment income (loss) |
Net realized and unrealized gains (losses) on investments |
Total from investment operations |
Net investment income |
Net realized gain |
Total distributions |
||||||||||||||||||||||
| Growth Advantage Fund |
||||||||||||||||||||||||||||
| Class A |
||||||||||||||||||||||||||||
| Six Months Ended December 31, 2015 (Unaudited) |
$ | 15.74 | $ | (0.05 | )(f) | $ | (0.14 | ) | $ | (0.19 | ) | $ | — | $ | (0.53 | ) | $ | (0.53 | ) | |||||||||
| Year Ended June 30, 2015 |
14.24 | (0.10 | )(f) | 2.17 | 2.07 | — | (0.57 | ) | (0.57 | ) | ||||||||||||||||||
| Year Ended June 30, 2014 |
11.43 | (0.07 | )(f) | 3.52 | 3.45 | — | (0.64 | ) | (0.64 | ) | ||||||||||||||||||
| Year Ended June 30, 2013 |
9.49 | 0.01 | (f)(g) | 1.97 | 1.98 | (0.01 | ) | (0.03 | ) | (0.04 | ) | |||||||||||||||||
| Year Ended June 30, 2012 |
9.28 | (0.03 | )(f)(h) | 0.24 | 0.21 | — | — | — | ||||||||||||||||||||
| Year Ended June 30, 2011 |
6.76 | (0.04 | )(f) | 2.56 | 2.52 | — | — | — | ||||||||||||||||||||
| Class C |
||||||||||||||||||||||||||||
| Six Months Ended December 31, 2015 (Unaudited) |
14.22 | (0.08 | )(f) | (0.14 | ) | (0.22 | ) | — | (0.53 | ) | (0.53 | ) | ||||||||||||||||
| Year Ended June 30, 2015 |
12.98 | (0.15 | )(f) | 1.96 | 1.81 | — | (0.57 | ) | (0.57 | ) | ||||||||||||||||||
| Year Ended June 30, 2014 |
10.51 | (0.12 | )(f) | 3.23 | 3.11 | — | (0.64 | ) | (0.64 | ) | ||||||||||||||||||
| Year Ended June 30, 2013 |
8.77 | (0.04 | )(f)(g) | 1.81 | 1.77 | — | (0.03 | ) | (0.03 | ) | ||||||||||||||||||
| Year Ended June 30, 2012 |
8.61 | (0.07 | )(f)(h) | 0.23 | 0.16 | — | — | — | ||||||||||||||||||||
| Year Ended June 30, 2011 |
6.31 | (0.08 | )(f) | 2.38 | 2.30 | — | — | — | ||||||||||||||||||||
| Class R5 |
||||||||||||||||||||||||||||
| Six Months Ended December 31, 2015 (Unaudited) |
16.25 | (0.02 | )(f) | (0.15 | ) | (0.17 | ) | — | (0.53 | ) | (0.53 | ) | ||||||||||||||||
| Year Ended June 30, 2015 |
14.63 | (0.04 | )(f) | 2.23 | 2.19 | — | (0.57 | ) | (0.57 | ) | ||||||||||||||||||
| Year Ended June 30, 2014 |
11.68 | (0.02 | )(f) | 3.61 | 3.59 | — | (0.64 | ) | (0.64 | ) | ||||||||||||||||||
| Year Ended June 30, 2013 |
9.69 | 0.06 | (f)(g) | 2.01 | 2.07 | (0.05 | ) | (0.03 | ) | (0.08 | ) | |||||||||||||||||
| Year Ended June 30, 2012 |
9.44 | 0.01 | (f)(h) | 0.24 | 0.25 | — | — | — | ||||||||||||||||||||
| Year Ended June 30, 2011 |
6.86 | — | (f)(i) | 2.58 | 2.58 | — | — | — | ||||||||||||||||||||
| Class R6 |
||||||||||||||||||||||||||||
| Six Months Ended December 31, 2015 (Unaudited) |
16.27 | (0.01 | )(f) | (0.15 | ) | (0.16 | ) | — | (0.53 | ) | (0.53 | ) | ||||||||||||||||
| Year Ended June 30, 2015 |
14.64 | (0.03 | )(f) | 2.23 | 2.20 | — | (0.57 | ) | (0.57 | ) | ||||||||||||||||||
| December 23, 2013 (j) through June 30, 2014 |
13.86 | (0.01 | )(f) | 0.79 | 0.78 | — | — | — | ||||||||||||||||||||
| Select Class |
||||||||||||||||||||||||||||
| Six Months Ended December 31, 2015 (Unaudited) |
16.06 | (0.04 | )(f) | (0.14 | ) | (0.18 | ) | — | (0.53 | ) | (0.53 | ) | ||||||||||||||||
| Year Ended June 30, 2015 |
14.50 | (0.07 | )(f) | 2.20 | 2.13 | — | (0.57 | ) | (0.57 | ) | ||||||||||||||||||
| Year Ended June 30, 2014 |
11.60 | (0.04 | )(f) | 3.58 | 3.54 | — | (0.64 | ) | (0.64 | ) | ||||||||||||||||||
| Year Ended June 30, 2013 |
9.63 | 0.04 | (f)(g) | 1.98 | 2.02 | (0.02 | ) | (0.03 | ) | (0.05 | ) | |||||||||||||||||
| Year Ended June 30, 2012 |
9.39 | (0.02 | )(f)(h) | 0.26 | 0.24 | — | — | — | ||||||||||||||||||||
| Year Ended June 30, 2011 |
6.83 | (0.02 | )(f) | 2.58 | 2.56 | — | — | — | ||||||||||||||||||||
| (a) | Annualized for periods less than one year, unless otherwise noted. |
| (b) | Not annualized for periods less than one year. |
| (c) | Includes adjustments in accordance with accounting principles generally accepted in the United States of America and as such, the net asset values for financial reporting purposes and the returns based upon those net asset values may differ from the net asset values and returns for shareholder transactions. |
| (d) | Includes earnings credits and interest expense, if applicable, each of which is less than 0.01% unless otherwise noted. |
| (e) | Portfolio turnover is calculated by dividing the lesser of total purchases or sales of portfolio securities for the reporting period by the monthly average value of portfolio securities owned during the reporting period. Excluded from both the numerator and denominator are amounts relating to derivatives and securities whose maturities or expiration dates at the time of acquisition were one year or less. |
| (f) | Calculated based upon average shares outstanding. |
| (g) | Reflects special dividends paid out during the period by several of the Fund’s holdings. Had the Fund not received the special dividends, the net investment income (loss) per share would have been $(0.02), $(0.06), $0.03 and $0.01 for Class A, Class C, Class R5 and Select Class Shares, respectively, and the net investment income (loss) ratio would have been (0.17)%, (0.66)%, 0.27% and 0.09% for Class A, Class C, Class R5 and Select Class Shares, respectively. |
| (h) | Reflects a special dividend paid out during the period by one of the Fund’s holdings. Had the Fund not received the special dividend, the net investment ncome (loss) per share would have been $(0.05), $(0.09), $(0.01) and $(0.03) for Class A, Class C, Class R5 and Select Class Shares, respectively, and the net investment income (loss) ratio would have been (0.56)%, (1.03)%, (0.12)% and (0.37)% for Class A, Class C, Class R5 and Select Class Shares, respectively. |
| (i) | Amount rounds to less than $0.01. |
| (j) | Commencement of offering of class of shares. |
SEE NOTES TO FINANCIAL STATEMENTS.
| 56 | J.P. MORGAN MID CAP/MULTI-CAP FUNDS | DECEMBER 31, 2015 | ||||
Table of Contents
|
|
Ratios/Supplemental data | |||||||||||||||||||||||||
| Ratios to average net assets (a) | ||||||||||||||||||||||||||
| Net asset value, end of period |
Total return (excludes sales charge) (b)(c) |
Net assets, end of period (000’s) |
Net expenses (d) |
Net investment income (loss) |
Expenses without waivers, reimbursements and earnings credits |
Portfolio turnover rate (b)(e) |
||||||||||||||||||||
| $ | 15.02 | (1.12 | )% | $ | 1,735,538 | 1.25 | % | (0.63 | )% | 1.34 | % | 15 | % | |||||||||||||
| 15.74 | 14.99 | 1,174,260 | 1.24 | (0.65 | ) | 1.35 | 46 | |||||||||||||||||||
| 14.24 | 30.69 | 717,564 | 1.24 | (0.51 | ) | 1.31 | 62 | |||||||||||||||||||
| 11.43 | 20.95 | 276,670 | 1.24 | 0.11 | (g) | 1.28 | 76 | |||||||||||||||||||
| 9.49 | 2.26 | 194,911 | 1.25 | (0.37 | )(h) | 1.30 | 86 | |||||||||||||||||||
| 9.28 | 37.28 | 176,492 | 1.25 | (0.45 | ) | 1.31 | 96 | |||||||||||||||||||
| 13.47 | (1.46 | ) | 567,051 | 1.75 | (1.13 | ) | 1.82 | 15 | ||||||||||||||||||
| 14.22 | 14.43 | 321,500 | 1.74 | (1.14 | ) | 1.84 | 46 | |||||||||||||||||||
| 12.98 | 30.12 | 144,229 | 1.74 | (1.01 | ) | 1.81 | 62 | |||||||||||||||||||
| 10.51 | 20.27 | 42,655 | 1.74 | (0.38 | )(g) | 1.78 | 76 | |||||||||||||||||||
| 8.77 | 1.86 | 27,469 | 1.75 | (0.84 | )(h) | 1.80 | 86 | |||||||||||||||||||
| 8.61 | 36.45 | 20,676 | 1.75 | (0.95 | ) | 1.81 | 96 | |||||||||||||||||||
| 15.55 | (0.96 | ) | 77,931 | 0.87 | (0.26 | ) | 0.88 | 15 | ||||||||||||||||||
| 16.25 | 15.42 | 58,686 | 0.86 | (0.25 | ) | 0.87 | 46 | |||||||||||||||||||
| 14.63 | 31.25 | 1,453,864 | 0.85 | (0.11 | ) | 0.86 | 62 | |||||||||||||||||||
| 11.68 | 21.49 | 835,233 | 0.83 | 0.55 | (g) | 0.84 | 76 | |||||||||||||||||||
| 9.69 | 2.65 | 468,064 | 0.85 | 0.07 | (h) | 0.85 | 86 | |||||||||||||||||||
| 9.44 | 37.61 | 179,677 | 0.86 | (0.05 | ) | 0.86 | 96 | |||||||||||||||||||
| 15.58 | (0.90 | ) | 2,636,336 | 0.75 | (0.14 | ) | 0.75 | 15 | ||||||||||||||||||
| 16.27 | 15.48 | 2,414,333 | 0.76 | (0.17 | ) | 0.77 | 46 | |||||||||||||||||||
| 14.64 | 5.63 | 271,958 | 0.80 | (0.15 | ) | 0.82 | 62 | |||||||||||||||||||
| 15.35 | (1.04 | ) | 1,457,720 | 1.08 | (0.47 | ) | 1.08 | 15 | ||||||||||||||||||
| 16.06 | 15.14 | 1,219,501 | 1.09 | (0.48 | ) | 1.09 | 46 | |||||||||||||||||||
| 14.50 | 31.03 | 975,175 | 1.05 | (0.30 | ) | 1.06 | 62 | |||||||||||||||||||
| 11.60 | 21.14 | 842,783 | 1.03 | 0.37 | (g) | 1.03 | 76 | |||||||||||||||||||
| 9.63 | 2.56 | 662,786 | 1.05 | (0.18 | )(h) | 1.05 | 86 | |||||||||||||||||||
| 9.39 | 37.48 | 836,154 | 1.06 | (0.27 | ) | 1.06 | 96 | |||||||||||||||||||
SEE NOTES TO FINANCIAL STATEMENTS.
| DECEMBER 31, 2015 | J.P. MORGAN MID CAP/MULTI-CAP FUNDS | 57 | ||||||
Table of Contents
FINANCIAL HIGHLIGHTS
FOR THE PERIODS INDICATED (continued)
|
|
Per share operating performance | |||||||||||||||||||||||||||
| Investment operations | Distributions | |||||||||||||||||||||||||||
| Net asset value, beginning of period |
Net investment income (loss) |
Net realized and unrealized gains (losses) on investments |
Total from investment operations |
Net investment income |
Net realized gain |
Total distributions |
||||||||||||||||||||||
| Mid Cap Equity Fund |
||||||||||||||||||||||||||||
| Class A |
||||||||||||||||||||||||||||
| Six Months Ended December 31, 2015 (Unaudited) |
$ | 47.12 | $ | (0.02 | )(f) | $ | (2.65 | ) | $ | (2.67 | ) | $ | (0.03 | ) | $ | (2.11 | ) | $ | (2.14 | ) | ||||||||
| Year Ended June 30, 2015 |
44.91 | (0.03 | )(f) | 4.32 | 4.29 | (0.02 | ) | (2.06 | ) | (2.08 | ) | |||||||||||||||||
| Year Ended June 30, 2014 |
38.10 | (0.04 | )(f) | 10.25 | 10.21 | (0.02 | ) | (3.38 | ) | (3.40 | ) | |||||||||||||||||
| Year Ended June 30, 2013 |
30.97 | 0.10 | (f)(g) | 7.36 | 7.46 | (0.07 | ) | (0.26 | ) | (0.33 | ) | |||||||||||||||||
| Year Ended June 30, 2012 |
31.29 | 0.10 | (f)(h) | (0.34 | ) | (0.24 | ) | (0.08 | ) | — | (0.08 | ) | ||||||||||||||||
| Year Ended June 30, 2011 |
22.95 | 0.04 | (f) | 8.36 | 8.40 | (0.06 | ) | — | (0.06 | ) | ||||||||||||||||||
| Class C |
||||||||||||||||||||||||||||
| Six Months Ended December 31, 2015 (Unaudited) |
46.16 | (0.13 | )(f) | (2.60 | ) | (2.73 | ) | — | (2.11 | ) | (2.11 | ) | ||||||||||||||||
| Year Ended June 30, 2015 |
44.21 | (0.25 | )(f) | 4.23 | 3.98 | — | (2.03 | ) | (2.03 | ) | ||||||||||||||||||
| Year Ended June 30, 2014 |
37.71 | (0.24 | )(f) | 10.12 | 9.88 | — | (3.38 | ) | (3.38 | ) | ||||||||||||||||||
| Year Ended June 30, 2013 |
30.75 | (0.07 | )(f)(g) | 7.29 | 7.22 | — | (i) | (0.26 | ) | (0.26 | ) | |||||||||||||||||
| Year Ended June 30, 2012 |
31.16 | (0.05 | )(f)(h) | (0.35 | ) | (0.40 | ) | (0.01 | ) | — | (0.01 | ) | ||||||||||||||||
| Year Ended June 30, 2011 |
22.93 | (0.12 | )(f) | 8.37 | 8.25 | (0.02 | ) | — | (0.02 | ) | ||||||||||||||||||
| Class R2 |
||||||||||||||||||||||||||||
| Six Months Ended December 31, 2015 (Unaudited) |
46.98 | (0.08 | )(f) | (2.64 | ) | (2.72 | ) | — | (i) | (2.11 | ) | (2.11 | ) | |||||||||||||||
| Year Ended June 30, 2015 |
44.87 | (0.14 | )(f) | 4.30 | 4.16 | — | (2.05 | ) | (2.05 | ) | ||||||||||||||||||
| March 14, 2014 (j) through June 30, 2014 |
42.92 | (0.05 | )(f) | 2.01 | 1.96 | (0.01 | ) | — | (0.01 | ) | ||||||||||||||||||
| Class R5 |
||||||||||||||||||||||||||||
| Six Months Ended December 31, 2015 (Unaudited) |
47.49 | 0.09 | (f) | (2.69 | ) | (2.60 | ) | (0.09 | ) | (2.11 | ) | (2.20 | ) | |||||||||||||||
| Year Ended June 30, 2015 |
45.15 | 0.20 | (f) | 4.33 | 4.53 | (0.13 | ) | (2.06 | ) | (2.19 | ) | |||||||||||||||||
| March 14, 2014 (j) through June 30, 2014 |
43.14 | 0.04 | (f) | 2.02 | 2.06 | (0.05 | ) | — | (0.05 | ) | ||||||||||||||||||
| Class R6 |
||||||||||||||||||||||||||||
| Six Months Ended December 31, 2015 (Unaudited) |
47.49 | 0.09 | (f) | (2.67 | ) | (2.58 | ) | (0.10 | ) | (2.11 | ) | (2.21 | ) | |||||||||||||||
| Year Ended June 30, 2015 |
45.15 | 0.20 | (f) | 4.34 | 4.54 | (0.14 | ) | (2.06 | ) | (2.20 | ) | |||||||||||||||||
| March 14, 2014 (j) through June 30, 2014 |
43.14 | 0.04 | (f) | 2.02 | 2.06 | (0.05 | ) | — | (0.05 | ) | ||||||||||||||||||
| Select Class |
||||||||||||||||||||||||||||
| Six Months Ended December 31, 2015 (Unaudited) |
47.47 | 0.06 | (f) | (2.67 | ) | (2.61 | ) | (0.07 | ) | (2.11 | ) | (2.18 | ) | |||||||||||||||
| Year Ended June 30, 2015 |
45.15 | 0.13 | (f) | 4.34 | 4.47 | (0.09 | ) | (2.06 | ) | (2.15 | ) | |||||||||||||||||
| Year Ended June 30, 2014 |
38.22 | 0.11 | (f) | 10.30 | 10.41 | (0.10 | ) | (3.38 | ) | (3.48 | ) | |||||||||||||||||
| Year Ended June 30, 2013 |
31.05 | 0.20 | (f)(g) | 7.40 | 7.60 | (0.17 | ) | (0.26 | ) | (0.43 | ) | |||||||||||||||||
| Year Ended June 30, 2012 |
31.36 | 0.19 | (f)(h) | (0.33 | ) | (0.14 | ) | (0.17 | ) | — | (0.17 | ) | ||||||||||||||||
| Year Ended June 30, 2011 |
22.97 | 0.14 | (f) | 8.37 | 8.51 | (0.12 | ) | — | (0.12 | ) | ||||||||||||||||||
| (a) | Annualized for periods less than one year, unless otherwise noted. |
| (b) | Not annualized for periods less than one year. |
| (c) | Includes adjustments in accordance with accounting principles generally accepted in the United States of America and as such, the net asset values for financial reporting purposes and the returns based upon those net asset values may differ from the net asset values and returns for shareholder transactions. |
| (d) | Includes earnings credits and interest expense, if applicable, each of which is less than 0.01% unless otherwise noted. |
| (e) | Portfolio turnover is calculated by dividing the lesser of total purchases or sales of portfolio securities for the reporting period by the monthly average value of portfolio securities owned during the reporting period. Excluded from both the numerator and denominator are amounts relating to derivatives and securities whose maturities or expiration dates at the time of acquisition were one year or less. |
| (f) | Calculated based upon average shares outstanding. |
| (g) | Reflects special dividends paid out during the period by several of the Fund’s holdings. Had the Fund not received the special dividends, the net investment income (loss) per share would have been $0.03, $(0.14) and $0.14 for Class A, Class C and Select Class Shares, respectively, and the net investment income (loss) ratio would have been 0.09%, (0.39)% and 0.39% for Class A, Class C and Select Class Shares, respectively. |
| (h) | Reflects a special dividend paid out during the period by one of the Fund’s holdings. Had the Fund not received the special dividend the net investment income (loss) per share would have been $0.05, $(0.10) and $0.14 for Class A, Class C and Select Class Shares, respectively and the net investment income (loss) ratio would have been 0.18%, (0.33)% and 0.48% for Class A, Class C and Select Class Shares, respectively. |
| (i) | Amount rounds to less than $0.01. |
| (j) | Commencement of offering of class of shares. |
SEE NOTES TO FINANCIAL STATEMENTS.
| 58 | J.P. MORGAN MID CAP/MULTI-CAP FUNDS | DECEMBER 31, 2015 | ||||
Table of Contents
|
|
Ratios/Supplemental data | |||||||||||||||||||||||||
| Ratios to average net assets (a) | ||||||||||||||||||||||||||
|
end of |
Total return (excludes sales charge) (b)(c) |
Net assets, end of period (000’s) |
Net expenses (d) |
Net income |
Expenses without waivers, |
Portfolio turnover rate (b)(e) |
||||||||||||||||||||
| $ | 42.31 | (5.60 | )% | $ | 268,940 | 1.25 | % | (0.09 | )% | 1.44 | % | 17 | % | |||||||||||||
| 47.12 | 9.99 | 232,320 | 1.24 | (0.06 | ) | 1.44 | 41 | |||||||||||||||||||
| 44.91 | 27.96 | 156,016 | 1.24 | (0.08 | ) | 1.41 | 47 | |||||||||||||||||||
| 38.10 | 24.23 | 21,171 | 1.24 | 0.27 | (g) | 1.49 | 67 | |||||||||||||||||||
| 30.97 | (0.76 | ) | 6,965 | 1.24 | 0.34 | (h) | 1.54 | 55 | ||||||||||||||||||
| 31.29 | 36.60 | 2,918 | 1.24 | 0.14 | 1.53 | 88 | ||||||||||||||||||||
| 41.32 | (5.84 | ) | 26,425 | 1.75 | (0.60 | ) | 1.93 | 17 | ||||||||||||||||||
| 46.16 | 9.44 | 25,597 | 1.74 | (0.56 | ) | 1.91 | 41 | |||||||||||||||||||
| 44.21 | 27.34 | 20,018 | 1.74 | (0.57 | ) | 1.93 | 47 | |||||||||||||||||||
| 37.71 | 23.60 | 6,136 | 1.74 | (0.21 | )(g) | 2.00 | 67 | |||||||||||||||||||
| 30.75 | (1.29 | ) | 1,244 | 1.75 | (0.18 | )(h) | 2.03 | 55 | ||||||||||||||||||
| 31.16 | 35.98 | 447 | 1.74 | (0.40 | ) | 2.06 | 88 | |||||||||||||||||||
| ‘ | ||||||||||||||||||||||||||
| 42.15 | (5.72 | ) | 780 | 1.50 | (0.36 | ) | 1.76 | 17 | ||||||||||||||||||
| 46.98 | 9.71 | 823 | 1.49 | (0.31 | ) | 1.69 | 41 | |||||||||||||||||||
| 44.87 | 4.56 | 688 | 1.47 | (0.41 | ) | 1.60 | 47 | |||||||||||||||||||
| 42.69 | (5.39 | ) | 2,939 | 0.80 | 0.37 | 0.85 | 17 | |||||||||||||||||||
| 47.49 | 10.49 | 1,636 | 0.79 | 0.43 | 0.88 | 41 | ||||||||||||||||||||
| 45.15 | 4.77 | 91 | 0.78 | 0.27 | 0.91 | 47 | ||||||||||||||||||||
| 42.70 | (5.35 | ) | 1,312,265 | 0.75 | 0.41 | 0.76 | 17 | |||||||||||||||||||
| 47.49 | 10.53 | 1,268,988 | 0.74 | 0.45 | 0.80 | 41 | ||||||||||||||||||||
| 45.15 | 4.78 | 823,036 | 0.73 | 0.34 | 0.86 | 47 | ||||||||||||||||||||
| 42.68 | (5.43 | ) | 1,604,412 | 0.90 | 0.24 | 1.18 | 17 | |||||||||||||||||||
| 47.47 | 10.35 | 1,773,929 | 0.89 | 0.29 | 1.16 | 41 | ||||||||||||||||||||
| 45.15 | 28.45 | 1,773,321 | 0.89 | 0.27 | 1.18 | 47 | ||||||||||||||||||||
| 38.22 | 24.64 | 932,920 | 0.89 | 0.57 | (g) | 1.23 | 67 | |||||||||||||||||||
| 31.05 | (0.42 | ) | 813,125 | 0.89 | 0.64 | (h) | 1.30 | 55 | ||||||||||||||||||
| 31.36 | 37.09 | 568,854 | 0.89 | 0.50 | 1.27 | 88 | ||||||||||||||||||||
SEE NOTES TO FINANCIAL STATEMENTS.
| DECEMBER 31, 2015 | J.P. MORGAN MID CAP/MULTI-CAP FUNDS | 59 | ||||||
Table of Contents
FINANCIAL HIGHLIGHTS
FOR THE PERIODS INDICATED (continued)
|
|
Per share operating performance | |||||||||||||||||||
| Investment operations | Distributions | |||||||||||||||||||
| Net asset value, beginning of period |
Net investment income (loss) |
Net realized and unrealized gains (losses) on investments |
Total from investment operations |
Net realized gain |
||||||||||||||||
| Mid Cap Growth Fund |
||||||||||||||||||||
| Class A |
||||||||||||||||||||
| Six Months Ended December 31, 2015 (Unaudited) |
$ | 27.71 | $ | (0.09 | )(f) | $ | (1.87 | ) | $ | (1.96 | ) | $ | (1.46 | ) | ||||||
| Year Ended June 30, 2015 |
27.49 | (0.18 | )(f) | 3.19 | 3.01 | (2.79 | ) | |||||||||||||
| Year Ended June 30, 2014 |
22.99 | (0.13 | )(f)(g) | 7.42 | 7.29 | (2.79 | ) | |||||||||||||
| Year Ended June 30, 2013 |
19.52 | (0.04 | )(f)(h) | 4.50 | 4.46 | (0.99 | ) | |||||||||||||
| Year Ended June 30, 2012 |
23.30 | (0.05 | )(f)(i) | (1.72 | ) | (1.77 | ) | (2.01 | ) | |||||||||||
| Year Ended June 30, 2011 |
16.35 | (0.09 | )(f) | 7.04 | 6.95 | — | ||||||||||||||
| Class C |
||||||||||||||||||||
| Six Months Ended December 31, 2015 (Unaudited) |
22.93 | (0.13 | )(f) | (1.55 | ) | (1.68 | ) | (1.46 | ) | |||||||||||
| Year Ended June 30, 2015 |
23.35 | (0.26 | )(f) | 2.63 | 2.37 | (2.79 | ) | |||||||||||||
| Year Ended June 30, 2014 |
19.97 | (0.22 | )(f)(g) | 6.39 | 6.17 | (2.79 | ) | |||||||||||||
| Year Ended June 30, 2013 |
17.17 | (0.12 | )(f)(h) | 3.91 | 3.79 | (0.99 | ) | |||||||||||||
| Year Ended June 30, 2012 |
20.88 | (0.13 | )(f)(i) | (1.57 | ) | (1.70 | ) | (2.01 | ) | |||||||||||
| Year Ended June 30, 2011 |
14.73 | (0.18 | )(f) | 6.33 | 6.15 | — | ||||||||||||||
| Class R2 |
||||||||||||||||||||
| Six Months Ended December 31, 2015 (Unaudited) |
29.96 | (0.12 | )(f) | (2.01 | ) | (2.13 | ) | (1.46 | ) | |||||||||||
| Year Ended June 30, 2015 |
29.54 | (0.24 | )(f) | 3.45 | 3.21 | (2.79 | ) | |||||||||||||
| Year Ended June 30, 2014 |
24.56 | (0.20 | )(f)(g) | 7.97 | 7.77 | (2.79 | ) | |||||||||||||
| Year Ended June 30, 2013 |
20.83 | (0.07 | )(f)(h) | 4.79 | 4.72 | (0.99 | ) | |||||||||||||
| Year Ended June 30, 2012 |
24.73 | (0.07 | )(f)(i) | (1.82 | ) | (1.89 | ) | (2.01 | ) | |||||||||||
| Year Ended June 30, 2011 |
17.38 | (0.13 | )(f) | 7.48 | 7.35 | — | ||||||||||||||
| Class R5 |
||||||||||||||||||||
| Six Months Ended December 31, 2015 (Unaudited) |
31.26 | (0.04 | )(f) | (2.10 | ) | (2.14 | ) | (1.46 | ) | |||||||||||
| Year Ended June 30, 2015 |
30.52 | (0.07 | )(f) | 3.60 | 3.53 | (2.79 | ) | |||||||||||||
| Year Ended June 30, 2014 |
25.15 | (0.02 | )(f)(g) | 8.18 | 8.16 | (2.79 | ) | |||||||||||||
| Year Ended June 30, 2013 |
21.18 | 0.06 | (f)(h) | 4.90 | 4.96 | (0.99 | ) | |||||||||||||
| November 1, 2011 (j) through June 30, 2012 |
21.75 | 0.04 | (f)(i) | 1.40 | 1.44 | (2.01 | ) | |||||||||||||
| Class R6 |
||||||||||||||||||||
| Six Months Ended December 31, 2015 (Unaudited) |
31.33 | (0.03 | )(f) | (2.11 | ) | (2.14 | ) | (1.46 | ) | |||||||||||
| Year Ended June 30, 2015 |
30.57 | (0.06 | )(f) | 3.61 | 3.55 | (2.79 | ) | |||||||||||||
| Year Ended June 30, 2014 |
25.17 | — | (f)(g)(k) | 8.19 | 8.19 | (2.79 | ) | |||||||||||||
| Year Ended June 30, 2013 |
21.19 | 0.08 | (f)(h) | 4.89 | 4.97 | (0.99 | ) | |||||||||||||
| November 1, 2011 (j) through June 30, 2012 |
21.75 | 0.08 | (f)(i) | 1.37 | 1.45 | (2.01 | ) | |||||||||||||
| Select Class |
||||||||||||||||||||
| Six Months Ended December 31, 2015 (Unaudited) |
31.06 | (0.06 | )(f) | (2.09 | ) | (2.15 | ) | (1.46 | ) | |||||||||||
| Year Ended June 30, 2015 |
30.39 | (0.11 | )(f) | 3.57 | 3.46 | (2.79 | ) | |||||||||||||
| Year Ended June 30, 2014 |
25.08 | (0.06 | )(f)(g) | 8.16 | 8.10 | (2.79 | ) | |||||||||||||
| Year Ended June 30, 2013 |
21.15 | 0.03 | (f)(h) | 4.89 | 4.92 | (0.99 | ) | |||||||||||||
| Year Ended June 30, 2012 |
24.97 | 0.02 | (f)(i) | (1.83 | ) | (1.81 | ) | (2.01 | ) | |||||||||||
| Year Ended June 30, 2011 |
17.47 | (0.03 | )(f) | 7.53 | 7.50 | — | ||||||||||||||
| (a) | Annualized for periods less than one year, unless otherwise noted. |
| (b) | Not annualized for periods less than one year. |
| (c) | Includes adjustments in accordance with accounting principles generally accepted in the United States of America and as such, the net asset values for financial reporting purposes and the returns based upon those net asset values may differ from the net asset values and returns for shareholder transactions. |
| (d) | Includes earnings credits and interest expense, if applicable, each of which is less than 0.01% unless otherwise noted. |
| (e) | Portfolio turnover is calculated by dividing the lesser of total purchases or sales of portfolio securities for the reporting period by the monthly average value of portfolio securities owned during the reporting period. Excluded from both the numerator and denominator are amounts relating to derivatives and securities whose maturities or expiration dates at the time of acquisition were one year or less. |
| (f) | Calculated based upon average shares outstanding. |
| (g) | Reflects special dividends paid out during the period by several of the Fund’s holdings. Had the Fund not received the special dividends the net investment income (loss) per share would have been $(0.14), $(0.23), $(0.20), $(0.02), $(0.01) and $(0.06) for Class A, Class C, Class R2, Class R5, Class R6 and Select Class Shares, respectively, and the net investment income (loss) ratio would have been (0.53)%, (1.03)%, (0.73)%, (0.08)%, (0.03)% and (0.22)% for Class A, Class C, Class R2, Class R5, Class R6 and Select Class Shares, respectively. |
SEE NOTES TO FINANCIAL STATEMENTS.
| 60 | J.P. MORGAN MID CAP/MULTI-CAP FUNDS | DECEMBER 31, 2015 | ||||
Table of Contents
|
|
Ratios/Supplemental data | |||||||||||||||||||||||||
| Ratios to average net assets (a) | ||||||||||||||||||||||||||
| Net asset value, end of period |
Total return (excludes sales charge) (b)(c) |
Net assets, end of period (000’s) |
Net expenses (d) |
Net investment income (loss) |
Expenses without waivers, reimbursements and earnings credits |
Portfolio turnover rate (b)(e) |
||||||||||||||||||||
| $ | 24.29 | (6.99 | )% | $ | 1,007,816 | 1.24 | % | (0.70 | )% | 1.37 | % | 26 | % | |||||||||||||
| 27.71 | 12.37 | 984,262 | 1.23 | (0.68 | ) | 1.35 | 57 | |||||||||||||||||||
| 27.49 | 33.44 | 765,310 | 1.24 | (0.51 | )(g) | 1.37 | 69 | |||||||||||||||||||
| 22.99 | 23.70 | 586,787 | 1.23 | (0.17 | )(h) | 1.45 | 70 | |||||||||||||||||||
| 19.52 | (6.61 | ) | 538,323 | 1.24 | (0.23 | )(i) | 1.38 | 70 | ||||||||||||||||||
| 23.30 | 42.51 | 696,334 | 1.24 | (0.44 | ) | 1.36 | 79 | |||||||||||||||||||
| 19.79 | (7.23 | ) | 101,493 | 1.74 | (1.19 | ) | 1.87 | 26 | ||||||||||||||||||
| 22.93 | 11.78 | 75,494 | 1.73 | (1.19 | ) | 1.86 | 57 | |||||||||||||||||||
| 23.35 | 32.85 | 41,047 | 1.73 | (1.01 | )(g) | 1.86 | 69 | |||||||||||||||||||
| 19.97 | 23.03 | 23,745 | 1.73 | (0.67 | )(h) | 1.95 | 70 | |||||||||||||||||||
| 17.17 | (7.06 | ) | 22,190 | 1.75 | (0.75 | )(i) | 1.88 | 70 | ||||||||||||||||||
| 20.88 | 41.75 | 29,187 | 1.77 | (0.97 | ) | 1.86 | 79 | |||||||||||||||||||
| 26.37 | (7.04 | ) | 30,702 | 1.40 | (0.82 | ) | 1.64 | 26 | ||||||||||||||||||
| 29.96 | 12.18 | 9,868 | 1.39 | (0.85 | ) | 1.64 | 57 | |||||||||||||||||||
| 29.54 | 33.25 | 1,852 | 1.40 | (0.71 | )(g) | 1.59 | 69 | |||||||||||||||||||
| 24.56 | 23.46 | 320 | 1.39 | (0.32 | )(h) | 1.71 | 70 | |||||||||||||||||||
| 20.83 | (6.72 | ) | 230 | 1.40 | (0.35 | )(i) | 1.63 | 70 | ||||||||||||||||||
| 24.73 | 42.29 | 121 | 1.40 | (0.59 | ) | 1.60 | 79 | |||||||||||||||||||
| 27.66 | (6.77 | ) | 218,610 | 0.79 | (0.25 | ) | 0.88 | 26 | ||||||||||||||||||
| 31.26 | 12.87 | 164,713 | 0.78 | (0.25 | ) | 0.87 | 57 | |||||||||||||||||||
| 30.52 | 34.06 | 27,454 | 0.79 | (0.06 | )(g) | 0.92 | 69 | |||||||||||||||||||
| 25.15 | 24.22 | 17,848 | 0.79 | 0.28 | (h) | 1.00 | 70 | |||||||||||||||||||
| 21.18 | 7.71 | 14,837 | 0.78 | 0.31 | (i) | 0.92 | 70 | |||||||||||||||||||
| 27.73 | (6.76 | ) | 492,194 | 0.74 | (0.17 | ) | 0.76 | 26 | ||||||||||||||||||
| 31.33 | 12.92 | 265,905 | 0.73 | (0.19 | ) | 0.78 | 57 | |||||||||||||||||||
| 30.57 | 34.16 | 86,150 | 0.74 | (0.01 | )(g) | 0.86 | 69 | |||||||||||||||||||
| 25.17 | 24.26 | 47,434 | 0.74 | 0.34 | (h) | 0.98 | 70 | |||||||||||||||||||
| 21.19 | 7.76 | 13,982 | 0.73 | 0.58 | (i) | 0.87 | 70 | |||||||||||||||||||
| 27.45 | (6.85 | ) | 1,015,196 | 0.93 | (0.40 | ) | 1.11 | 26 | ||||||||||||||||||
| 31.06 | 12.68 | 1,562,284 | 0.92 | (0.37 | ) | 1.12 | 57 | |||||||||||||||||||
| 30.39 | 33.91 | 1,254,748 | 0.93 | (0.20 | )(g) | 1.12 | 69 | |||||||||||||||||||
| 25.08 | 24.06 | 894,740 | 0.93 | 0.14 | (h) | 1.20 | 70 | |||||||||||||||||||
| 21.15 | (6.31 | ) | 827,306 | 0.93 | 0.09 | (i) | 1.13 | 70 | ||||||||||||||||||
| 24.97 | 42.93 | 1,031,463 | 0.93 | (0.13 | ) | 1.10 | 79 | |||||||||||||||||||
| (h) | Reflects special dividends paid out during the period by several of the Fund’s holdings. Had the Fund not received the special dividends, the net investment income (loss) per share would have been $(0.09), $(0.17), $(0.13), $0.01, $0.02 and $(0.02) for Class A, Class C, Class R2, Class R5, Class R6 and Select Class Shares, respectively, and the net investment income (loss) ratio would have been (0.42)%, (0.92)%, (0.57)%, 0.04%, 0.09% and (0.10)% for Class A, Class C, Class R2, Class R5, Class R6 and Select Class Shares, respectively. |
| (i) | Reflects a special dividend paid out during the period by one of the Fund’s holdings. Had the Fund not received the special dividend, the net investment income (loss) per share would have been $(0.09), $(0.17), $(0.12), less than $0.01, $0.03 and $(0.03) for Class A, Class C, Class R2, Class R5, Class R6 and Select Class Shares, respectively, and the net investment income (loss) ratio would have been (0.46)%, (0.97)%, (0.57)%, (0.03)%, 0.24% and (0.14)% for Class A, Class C, Class R2, Class R5, Class R6 and Select Class Shares, respectively. |
| (j) | Commencement of offering of class of shares. |
| (k) | Amount rounds to less than $0.01. |
SEE NOTES TO FINANCIAL STATEMENTS.
| DECEMBER 31, 2015 | J.P. MORGAN MID CAP/MULTI-CAP FUNDS | 61 | ||||||
Table of Contents
FINANCIAL HIGHLIGHTS
FOR THE PERIODS INDICATED (continued)
|
|
Per share operating performance | |||||||||||||||||||||||||||
| Investment operations | Distributions | |||||||||||||||||||||||||||
| Net asset value, beginning of period |
Net investment income (loss) |
Net realized and unrealized gains (losses) on investments |
Total from investment operations |
Net investment income |
Net realized gain |
Total distributions |
||||||||||||||||||||||
| Mid Cap Value Fund |
||||||||||||||||||||||||||||
| Class A |
||||||||||||||||||||||||||||
| Six Months Ended December 31, 2015 (Unaudited) |
$ | 36.98 | $ | 0.10 | (f) | $ | (1.67 | ) | $ | (1.57 | ) | $ | (0.14 | ) | $ | (1.95 | ) | $ | (2.09 | ) | ||||||||
| Year Ended June 30, 2015 |
37.25 | 0.20 | (f) | 2.52 | 2.72 | (0.20 | ) | (2.79 | ) | (2.99 | ) | |||||||||||||||||
| Year Ended June 30, 2014 |
31.68 | 0.15 | (f)(g) | 7.02 | 7.17 | (0.15 | ) | (1.45 | ) | (1.60 | ) | |||||||||||||||||
| Year Ended June 30, 2013 |
25.80 | 0.19 | (f)(h) | 6.20 | 6.39 | (0.29 | ) | (0.22 | ) | (0.51 | ) | |||||||||||||||||
| Year Ended June 30, 2012 |
24.76 | 0.20 | (f) | 1.00 | 1.20 | (0.16 | ) | — | (0.16 | ) | ||||||||||||||||||
| Year Ended June 30, 2011 |
18.91 | 0.18 | (f) | 5.85 | 6.03 | (0.18 | ) | — | (0.18 | ) | ||||||||||||||||||
| Class C |
||||||||||||||||||||||||||||
| Six Months Ended December 31, 2015 (Unaudited) |
35.79 | — | (f)(i) | (1.61 | ) | (1.61 | ) | — | (1.95 | ) | (1.95 | ) | ||||||||||||||||
| Year Ended June 30, 2015 |
36.19 | 0.01 | (f) | 2.44 | 2.45 | (0.06 | ) | (2.79 | ) | (2.85 | ) | |||||||||||||||||
| Year Ended June 30, 2014 |
30.84 | (0.03 | )(f)(g) | 6.83 | 6.80 | — | (i) | (1.45 | ) | (1.45 | ) | |||||||||||||||||
| Year Ended June 30, 2013 |
25.14 | 0.05 | (f)(h) | 6.03 | 6.08 | (0.16 | ) | (0.22 | ) | (0.38 | ) | |||||||||||||||||
| Year Ended June 30, 2012 |
24.13 | 0.07 | (f) | 0.98 | 1.05 | (0.04 | ) | — | (0.04 | ) | ||||||||||||||||||
| Year Ended June 30, 2011 |
18.44 | 0.07 | (f) | 5.69 | 5.76 | (0.07 | ) | — | (0.07 | ) | ||||||||||||||||||
| Class R2 |
||||||||||||||||||||||||||||
| Six Months Ended December 31, 2015 (Unaudited) |
35.73 | 0.05 | (f) | (1.61 | ) | (1.56 | ) | (0.06 | ) | (1.95 | ) | (2.01 | ) | |||||||||||||||
| Year Ended June 30, 2015 |
36.14 | 0.10 | (f) | 2.43 | 2.53 | (0.15 | ) | (2.79 | ) | (2.94 | ) | |||||||||||||||||
| Year Ended June 30, 2014 |
30.81 | 0.06 | (f)(g) | 6.82 | 6.88 | (0.10 | ) | (1.45 | ) | (1.55 | ) | |||||||||||||||||
| Year Ended June 30, 2013 |
25.18 | 0.12 | (f)(h) | 6.03 | 6.15 | (0.30 | ) | (0.22 | ) | (0.52 | ) | |||||||||||||||||
| Year Ended June 30, 2012 |
24.27 | 0.14 | (f) | 0.97 | 1.11 | (0.20 | ) | — | (0.20 | ) | ||||||||||||||||||
| Year Ended June 30, 2011 |
18.63 | 0.12 | (f) | 5.76 | 5.88 | (0.24 | ) | — | (0.24 | ) | ||||||||||||||||||
| Institutional Class |
||||||||||||||||||||||||||||
| Six Months Ended December 31, 2015 (Unaudited) |
37.76 | 0.19 | (f) | (1.71 | ) | (1.52 | ) | (0.32 | ) | (1.95 | ) | (2.27 | ) | |||||||||||||||
| Year Ended June 30, 2015 |
37.99 | 0.40 | (f) | 2.56 | 2.96 | (0.40 | ) | (2.79 | ) | (3.19 | ) | |||||||||||||||||
| Year Ended June 30, 2014 |
32.26 | 0.32 | (f)(g) | 7.17 | 7.49 | (0.31 | ) | (1.45 | ) | (1.76 | ) | |||||||||||||||||
| Year Ended June 30, 2013 |
26.24 | 0.34 | (f)(h) | 6.31 | 6.65 | (0.41 | ) | (0.22 | ) | (0.63 | ) | |||||||||||||||||
| Year Ended June 30, 2012 |
25.19 | 0.32 | (f) | 1.01 | 1.33 | (0.28 | ) | — | (0.28 | ) | ||||||||||||||||||
| Year Ended June 30, 2011 |
19.22 | 0.30 | (f) | 5.95 | 6.25 | (0.28 | ) | — | (0.28 | ) | ||||||||||||||||||
| Select Class |
||||||||||||||||||||||||||||
| Six Months Ended December 31, 2015 (Unaudited) |
37.36 | 0.14 | (f) | (1.68 | ) | (1.54 | ) | (0.23 | ) | (1.95 | ) | (2.18 | ) | |||||||||||||||
| Year Ended June 30, 2015 |
37.61 | 0.28 | (f) | 2.55 | 2.83 | (0.29 | ) | (2.79 | ) | (3.08 | ) | |||||||||||||||||
| Year Ended June 30, 2014 |
31.95 | 0.23 | (f)(g) | 7.10 | 7.33 | (0.22 | ) | (1.45 | ) | (1.67 | ) | |||||||||||||||||
| Year Ended June 30, 2013 |
26.01 | 0.27 | (f)(h) | 6.24 | 6.51 | (0.35 | ) | (0.22 | ) | (0.57 | ) | |||||||||||||||||
| Year Ended June 30, 2012 |
24.97 | 0.26 | (f) | 1.01 | 1.27 | (0.23 | ) | — | (0.23 | ) | ||||||||||||||||||
| Year Ended June 30, 2011 |
19.07 | 0.24 | (f) | 5.90 | 6.14 | (0.24 | ) | — | (0.24 | ) | ||||||||||||||||||
| (a) | Annualized for periods less than one year, unless otherwise noted. |
| (b) | Not annualized for periods less than one year. |
| (c) | Includes adjustments in accordance with accounting principles generally accepted in the United States of America and as such, the net asset values for financial reporting purposes and the returns based upon those net asset values may differ from the net asset values and returns for shareholder transactions. |
| (d) | Includes earnings credits and interest expense, if applicable, each of which is less than 0.01% unless otherwise noted. |
| (e) | Portfolio turnover is calculated by dividing the lesser of total purchases or sales of portfolio securities for the reporting period by the monthly average value of portfolio securities owned during the reporting period. Excluded from both the numerator and denominator are amounts relating to derivatives and securities whose maturities or expiration dates at the time of acquisition were one year or less. |
| (f) | Calculated based upon average shares outstanding. |
| (g) | Reflects special dividends paid out during the period by several of the Fund’s holdings. Had the Fund not received the special dividends the net investment income (loss) per share would have been $0.14, $(0.03), $0.05, $0.32 and $0.23 for Class A, Class C, Class R2, Institutional Class and Select Class Shares, respectively and the net investment income (loss) ratio would have been 0.41%, (0.10)%, 0.16%, 0.90% and 0.66% for Class A, Class C, Class R2, Institutional Class and Select Class Shares, respectively. |
| (h) | Reflects special dividends paid out during the period by several of the Fund’s holdings. Had the Fund not received the special dividends the net investment income (loss) per share would have been $0.16, $0.01, $0.09, $0.31 and $0.23 for Class A, Class C, Class R2, Institutional Class and Select Class Shares, respectively and the net investment income (loss) ratio would have been 0.55%, 0.04%, 0.31%, 1.04% and 0.80% for Class A, Class C, Class R2, Institutional Class and Select Class Shares, respectively. |
| (i) | Amount rounds to less than $0.01. |
SEE NOTES TO FINANCIAL STATEMENTS.
| 62 | J.P. MORGAN MID CAP/MULTI-CAP FUNDS | DECEMBER 31, 2015 | ||||
Table of Contents
|
|
Ratios/Supplemental data | |||||||||||||||||||||||||
| Ratios to average net assets (a) | ||||||||||||||||||||||||||
| Net asset value, end of period |
Total return (excludes sales charge) (b)(c) |
Net assets, end of period (000’s) |
Net expenses (d) |
Net investment income (loss) |
Expenses without waivers, reimbursements and earnings credits |
Portfolio turnover rate (b)(e) |
||||||||||||||||||||
| $ | 33.32 | (4.16 | )% | $ | 2,329,955 | 1.24 | % | 0.54 | % | 1.40 | % | 7 | % | |||||||||||||
| 36.98 | 7.68 | 2,623,772 | 1.23 | 0.53 | 1.38 | 18 | ||||||||||||||||||||
| 37.25 | 23.25 | 3,404,974 | 1.23 | 0.42 | (g) | 1.37 | 25 | |||||||||||||||||||
| 31.68 | 25.06 | 3,157,503 | 1.23 | 0.67 | (h) | 1.38 | 23 | |||||||||||||||||||
| 25.80 | 4.92 | 1,986,930 | 1.24 | 0.83 | 1.41 | 30 | ||||||||||||||||||||
| 24.76 | 31.96 | 1,979,270 | 1.23 | 0.81 | 1.39 | 41 | ||||||||||||||||||||
| 32.23 | (4.41 | ) | 545,458 | 1.75 | 0.03 | 1.83 | 7 | |||||||||||||||||||
| 35.79 | 7.12 | 595,385 | 1.74 | 0.03 | 1.84 | 18 | ||||||||||||||||||||
| 36.19 | 22.63 | 608,283 | 1.74 | (0.09 | )(g) | 1.87 | 25 | |||||||||||||||||||
| 30.84 | 24.43 | 534,813 | 1.74 | 0.16 | (h) | 1.88 | 23 | |||||||||||||||||||
| 25.14 | 4.38 | 370,781 | 1.75 | 0.32 | 1.91 | 30 | ||||||||||||||||||||
| 24.13 | 31.29 | 373,415 | 1.74 | 0.30 | 1.89 | 41 | ||||||||||||||||||||
| 32.16 | (4.28 | ) | 64,927 | 1.50 | 0.28 | 1.74 | 7 | |||||||||||||||||||
| 35.73 | 7.38 | 71,697 | 1.49 | 0.28 | 1.71 | 18 | ||||||||||||||||||||
| 36.14 | 22.94 | 71,958 | 1.49 | 0.17 | (g) | 1.62 | 25 | |||||||||||||||||||
| 30.81 | 24.71 | 57,003 | 1.49 | 0.43 | (h) | 1.63 | 23 | |||||||||||||||||||
| 25.18 | 4.65 | 14,824 | 1.49 | 0.59 | 1.66 | 30 | ||||||||||||||||||||
| 24.27 | 31.66 | 6,500 | 1.49 | 0.50 | 1.65 | 41 | ||||||||||||||||||||
| 33.97 | (3.93 | ) | 9,626,398 | 0.75 | 1.03 | 0.94 | 7 | |||||||||||||||||||
| 37.76 | 8.19 | 10,320,516 | 0.74 | 1.05 | 0.94 | 18 | ||||||||||||||||||||
| 37.99 | 23.88 | 8,581,992 | 0.74 | 0.92 | (g) | 0.97 | 25 | |||||||||||||||||||
| 32.26 | 25.68 | 6,627,529 | 0.74 | 1.16 | (h) | 0.98 | 23 | |||||||||||||||||||
| 26.24 | 5.43 | 3,543,900 | 0.74 | 1.33 | 1.01 | 30 | ||||||||||||||||||||
| 25.19 | 32.66 | 2,812,296 | 0.74 | 1.29 | 0.99 | 41 | ||||||||||||||||||||
| 33.64 | (4.02 | ) | 2,133,412 | 0.99 | 0.79 | 1.11 | 7 | |||||||||||||||||||
| 37.36 | 7.92 | 2,347,703 | 0.98 | 0.75 | 1.10 | 18 | ||||||||||||||||||||
| 37.61 | 23.59 | 2,967,759 | 0.98 | 0.67 | (g) | 1.12 | 25 | |||||||||||||||||||
| 31.95 | 25.35 | 2,870,752 | 0.98 | 0.92 | (h) | 1.13 | 23 | |||||||||||||||||||
| 26.01 | 5.20 | 1,836,012 | 0.98 | 1.09 | 1.16 | 30 | ||||||||||||||||||||
| 24.97 | 32.29 | 1,513,926 | 0.98 | 1.05 | 1.14 | 41 | ||||||||||||||||||||
SEE NOTES TO FINANCIAL STATEMENTS.
| DECEMBER 31, 2015 | J.P. MORGAN MID CAP/MULTI-CAP FUNDS | 63 | ||||||
Table of Contents
FINANCIAL HIGHLIGHTS
FOR THE PERIODS INDICATED (continued)
|
|
Per share operating performance | |||||||||||||||
| Investment operations | ||||||||||||||||
| Net asset value, beginning of period |
Net investment income (loss) |
Net realized and unrealized gains (losses) on investments |
Total from investment operations |
|||||||||||||
| Multi-Cap Market Neutral Fund |
||||||||||||||||
| Class A |
||||||||||||||||
| Six Months Ended December 31, 2015 (Unaudited) |
$ | 9.87 | $ | (0.03 | )(g) | $ | 0.36 | $ | 0.33 | |||||||
| Year Ended June 30, 2015 |
9.91 | (0.11 | )(g) | 0.07 | (0.04 | ) | ||||||||||
| Year Ended June 30, 2014 |
9.79 | (0.13 | )(g) | 0.25 | 0.12 | |||||||||||
| Year Ended June 30, 2013 |
9.69 | (0.11 | )(g)(h) | 0.21 | 0.10 | |||||||||||
| Year Ended June 30, 2012 |
9.81 | (0.14 | )(g) | 0.02 | (0.12 | ) | ||||||||||
| Year Ended June 30, 2011 |
9.71 | (0.16 | )(g) | 0.26 | 0.10 | |||||||||||
| Class C |
||||||||||||||||
| Six Months Ended December 31, 2015 (Unaudited) |
9.31 | (0.05 | )(g) | 0.34 | 0.29 | |||||||||||
| Year Ended June 30, 2015 |
9.40 | (0.15 | )(g) | 0.06 | (0.09 | ) | ||||||||||
| Year Ended June 30, 2014 |
9.33 | (0.17 | )(g) | 0.24 | 0.07 | |||||||||||
| Year Ended June 30, 2013 |
9.30 | (0.17 | )(g)(h) | 0.20 | 0.03 | |||||||||||
| Year Ended June 30, 2012 |
9.48 | (0.20 | )(g) | 0.02 | (0.18 | ) | ||||||||||
| Year Ended June 30, 2011 |
9.46 | (0.23 | )(g) | 0.25 | 0.02 | |||||||||||
| Select Class |
||||||||||||||||
| Six Months Ended December 31, 2015 (Unaudited) |
10.07 | (0.02 | )(g) | 0.37 | 0.35 | |||||||||||
| Year Ended June 30, 2015 |
10.09 | (0.09 | )(g) | 0.07 | (0.02 | ) | ||||||||||
| Year Ended June 30, 2014 |
9.94 | (0.11 | )(g) | 0.26 | 0.15 | |||||||||||
| Year Ended June 30, 2013 |
9.82 | (0.09 | )(g)(h) | 0.21 | 0.12 | |||||||||||
| Year Ended June 30, 2012 |
9.91 | (0.12 | )(g) | 0.03 | (0.09 | ) | ||||||||||
| Year Ended June 30, 2011 |
9.79 | (0.14 | )(g) | 0.26 | 0.12 | |||||||||||
| (a) | Annualized for periods less than one year, unless otherwise noted. |
| (b) | Not annualized for periods less than one year. |
| (c) | Includes adjustments in accordance with accounting principles generally accepted in the United States of America and as such, the net asset values for financial reporting purposes and the returns based upon those net asset values may differ from the net asset values and returns for shareholder transactions. |
| (d) | Includes earnings credits and interest expense, if applicable, each of which is less than 0.01% or unless otherwise noted. |
| (e) | The net expenses and expenses without waivers, reimbursements and earnings credits (excluding dividend expense and interest expense for securities sold short) for Class A are 1.32% and 1.75% for the six months ended December 31, 2015, 1.48% and 1.95% for the year ended June 30, 2015, 1.49% and 1.91% for 2014, 1.48% and 1.88% for 2013, 1.48% and 1.94% for 2012, and 1.49% and 1.95% for 2011; for Class C are 1.82% and 2.28% for the six months ended December 31, 2015, 1.98% and 2.45% for the year ended June 30, 2015, 1.99% and 2.40% for 2014, 2.15% and 2.38% for 2013, 2.23% and 2.44% for 2012, 2.24% and 2.45% for 2011; for Select Class are 1.06% and 1.36% for the six months ended December 31, 2015, 1.23% and 1.64% for the year ended June 30, 2015, 1.23% and 1.65% for 2014, 1.23% and 1.63% for 2013, 1.23% and 1.69% for 2012, and 1.24% and 1.70% for 2011, respectively. |
| (f) | Portfolio turnover is calculated by dividing the lesser of total purchases or sales of portfolio securities for the reporting period by the monthly average value of portfolio securities owned during the reporting period. Excluded from both the numerator and denominator are amounts relating to derivatives and securities whose maturities or expiration dates at the time of acquisition were one year or less. |
| (g) | Calculated based upon average shares outstanding. |
| (h) | Reflects special dividends paid out during the period by several of the Fund’s holdings. Had the Fund not received the special dividends, the net investment income (loss) per share would have been $(0.13), $(0.19) and $(0.11) for Class A, Class C and Select Class Shares, respectively, and the net investment income (loss) ratio would have been (1.38)%, (2.06)% and (1.16)% for Class A, Class C and Select Class Shares, respectively. |
SEE NOTES TO FINANCIAL STATEMENTS.
| 64 | J.P. MORGAN MID CAP/MULTI-CAP FUNDS | DECEMBER 31, 2015 | ||||
Table of Contents
|
|
Ratios/Supplemental data | |||||||||||||||||||||||||||||
| Ratios to average net assets (a) | ||||||||||||||||||||||||||||||
| Net asset value, end of period |
Total return (excludes sales charge) (b)(c) |
Net assets, end of period (000’s) |
Net expenses (including dividend and interest expense for securities sold short) (d)(e) |
Net investment income (loss) |
Expenses without waivers, reimbursements and earnings credits (including dividend and interest expense for securities sold short) (e) |
Portfolio turnover rate (excluding securities sold short) (b)(f) |
Portfolio turnover rate (including securities sold short) (b)(f) |
|||||||||||||||||||||||
| $ | 10.20 | 3.34 | % | $ | 7,161 | 2.67 | % | (0.59 | )% | 3.10 | % | 51 | % | 106 | % | |||||||||||||||
| 9.87 | (0.40 | ) | 6,273 | 2.68 | (1.14 | ) | 3.15 | 74 | 204 | |||||||||||||||||||||
| 9.91 | 1.23 | 10,301 | 2.78 | (1.36 | ) | 3.20 | 106 | 227 | ||||||||||||||||||||||
| 9.79 | 1.03 | 14,101 | 3.04 | (1.13 | )(h) | 3.44 | 94 | 251 | ||||||||||||||||||||||
| 9.69 | (1.22 | ) | 19,759 | 2.86 | (1.42 | ) | 3.32 | 151 | 316 | |||||||||||||||||||||
| 9.81 | 1.03 | 29,216 | 2.92 | (1.65 | ) | 3.38 | 145 | 339 | ||||||||||||||||||||||
| 9.60 | 3.11 | 6,761 | 3.17 | (1.10 | ) | 3.63 | 51 | 106 | ||||||||||||||||||||||
| 9.31 | (0.96 | ) | 6,760 | 3.18 | (1.62 | ) | 3.65 | 74 | 204 | |||||||||||||||||||||
| 9.40 | 0.75 | 8,602 | 3.28 | (1.85 | ) | 3.70 | 106 | 227 | ||||||||||||||||||||||
| 9.33 | 0.32 | 11,181 | 3.69 | (1.81 | )(h) | 3.92 | 94 | 251 | ||||||||||||||||||||||
| 9.30 | (1.90 | ) | 15,677 | 3.61 | (2.17 | ) | 3.82 | 151 | 316 | |||||||||||||||||||||
| 9.48 | 0.21 | 22,094 | 3.67 | (2.46 | ) | 3.88 | 145 | 339 | ||||||||||||||||||||||
| 10.42 | 3.48 | 258,095 | 2.41 | (0.36 | ) | 2.71 | 51 | 106 | ||||||||||||||||||||||
| 10.07 | (0.20 | ) | 277,647 | 2.43 | (0.89 | ) | 2.84 | 74 | 204 | |||||||||||||||||||||
| 10.09 | 1.51 | 431,890 | 2.52 | (1.07 | ) | 2.94 | 106 | 227 | ||||||||||||||||||||||
| 9.94 | 1.22 | 317,974 | 2.78 | (0.90 | )(h) | 3.18 | 94 | 251 | ||||||||||||||||||||||
| 9.82 | (0.91 | ) | 476,803 | 2.61 | (1.17 | ) | 3.07 | 151 | 316 | |||||||||||||||||||||
| 9.91 | 1.23 | 491,653 | 2.67 | (1.39 | ) | 3.13 | 145 | 339 | ||||||||||||||||||||||
SEE NOTES TO FINANCIAL STATEMENTS.
| DECEMBER 31, 2015 | J.P. MORGAN MID CAP/MULTI-CAP FUNDS | 65 | ||||||
Table of Contents
FINANCIAL HIGHLIGHTS
FOR THE PERIODS INDICATED (continued)
|
|
Per share operating performance | |||||||||||||||||||||||||||
| Investment operations | Distributions | |||||||||||||||||||||||||||
| Net asset value, beginning of period |
Net investment income (loss) |
Net realized and unrealized gains (losses) on investments |
Total from investment operations |
Net investment income |
Net realized gain |
Total distributions |
||||||||||||||||||||||
| Value Advantage Fund |
||||||||||||||||||||||||||||
| Class A |
||||||||||||||||||||||||||||
| Six Months Ended December 31, 2015 (Unaudited) |
$ | 29.84 | $ | 0.11 | (f) | $ | (1.68 | ) | $ | (1.57 | ) | $ | (0.17 | ) | $ | (0.29 | ) | $ | (0.46 | ) | ||||||||
| Year Ended June 30, 2015 |
29.15 | 0.19 | (f) | 1.47 | 1.66 | (0.26 | ) | (0.71 | ) | (0.97 | ) | |||||||||||||||||
| Year Ended June 30, 2014 |
24.64 | 0.34 | (f) | 5.03 | 5.37 | (0.16 | ) | (0.70 | ) | (0.86 | ) | |||||||||||||||||
| Year Ended June 30, 2013 |
19.96 | 0.22 | (f) | 4.75 | 4.97 | (0.20 | ) | (0.09 | ) | (0.29 | ) | |||||||||||||||||
| Year Ended June 30, 2012 |
19.07 | 0.25 | (f) | 0.84 | 1.09 | (0.20 | ) | — | (0.20 | ) | ||||||||||||||||||
| Year Ended June 30, 2011 |
15.22 | 0.23 | (f) | 3.79 | 4.02 | (0.17 | ) | — | (0.17 | ) | ||||||||||||||||||
| Class C |
||||||||||||||||||||||||||||
| Six Months Ended December 31, 2015 (Unaudited) |
29.72 | 0.04 | (f) | (1.67 | ) | (1.63 | ) | (0.06 | ) | (0.29 | ) | (0.35 | ) | |||||||||||||||
| Year Ended June 30, 2015 |
29.08 | 0.04 | (f) | 1.47 | 1.51 | (0.16 | ) | (0.71 | ) | (0.87 | ) | |||||||||||||||||
| Year Ended June 30, 2014 |
24.61 | 0.20 | (f) | 5.02 | 5.22 | (0.05 | ) | (0.70 | ) | (0.75 | ) | |||||||||||||||||
| Year Ended June 30, 2013 |
19.91 | 0.11 | (f) | 4.74 | 4.85 | (0.06 | ) | (0.09 | ) | (0.15 | ) | |||||||||||||||||
| Year Ended June 30, 2012 |
19.01 | 0.16 | (f) | 0.84 | 1.00 | (0.10 | ) | — | (0.10 | ) | ||||||||||||||||||
| Year Ended June 30, 2011 |
15.17 | 0.14 | (f) | 3.77 | 3.91 | (0.07 | ) | — | (0.07 | ) | ||||||||||||||||||
| Institutional Class |
||||||||||||||||||||||||||||
| Six Months Ended December 31, 2015 (Unaudited) |
30.06 | 0.19 | (f) | (1.71 | ) | (1.52 | ) | (0.32 | ) | (0.29 | ) | (0.61 | ) | |||||||||||||||
| Year Ended June 30, 2015 |
29.31 | 0.34 | (f) | 1.50 | 1.84 | (0.38 | ) | (0.71 | ) | (1.09 | ) | |||||||||||||||||
| Year Ended June 30, 2014 |
24.74 | 0.48 | (f) | 5.04 | 5.52 | (0.25 | ) | (0.70 | ) | (0.95 | ) | |||||||||||||||||
| Year Ended June 30, 2013 |
19.99 | 0.34 | (f) | 4.75 | 5.09 | (0.25 | ) | (0.09 | ) | (0.34 | ) | |||||||||||||||||
| Year Ended June 30, 2012 |
19.11 | 0.35 | (f) | 0.83 | 1.18 | (0.30 | ) | — | (0.30 | ) | ||||||||||||||||||
| Year Ended June 30, 2011 |
15.24 | 0.32 | (f) | 3.79 | 4.11 | (0.24 | ) | — | (0.24 | ) | ||||||||||||||||||
| Select Class |
||||||||||||||||||||||||||||
| Six Months Ended December 31, 2015 (Unaudited) |
29.99 | 0.14 | (f) | (1.68 | ) | (1.54 | ) | (0.19 | ) | (0.29 | ) | (0.48 | ) | |||||||||||||||
| Year Ended June 30, 2015 |
29.27 | 0.27 | (f) | 1.48 | 1.75 | (0.32 | ) | (0.71 | ) | (1.03 | ) | |||||||||||||||||
| Year Ended June 30, 2014 |
24.72 | 0.42 | (f) | 5.03 | 5.45 | (0.20 | ) | (0.70 | ) | (0.90 | ) | |||||||||||||||||
| Year Ended June 30, 2013 |
20.00 | 0.28 | (f) | 4.75 | 5.03 | (0.22 | ) | (0.09 | ) | (0.31 | ) | |||||||||||||||||
| Year Ended June 30, 2012 |
19.12 | 0.30 | (f) | 0.83 | 1.13 | (0.25 | ) | — | (0.25 | ) | ||||||||||||||||||
| Year Ended June 30, 2011 |
15.27 | 0.28 | (f) | 3.79 | 4.07 | (0.22 | ) | — | (0.22 | ) | ||||||||||||||||||
| (a) | Annualized for periods less than one year, unless otherwise noted. |
| (b) | Not annualized for periods less than one year. |
| (c) | Includes adjustments in accordance with accounting principles generally accepted in the United States of America and as such, the net asset values for financial reporting purposes and the returns based upon those net asset values may differ from the net asset values and returns for shareholder transactions. |
| (d) | Includes earnings credits and interest expense, if applicable, each of which is less than 0.01% unless otherwise noted. |
| (e) | Portfolio turnover is calculated by dividing the lesser of total purchases or sales of portfolio securities for the reporting period by the monthly average value of portfolio securities owned during the reporting period. Excluded from both the numerator and denominator are amounts relating to derivatives and securities whose maturities or expiration dates at the time of acquisition were one year or less. |
| (f) | Calculated based upon average shares outstanding. |
SEE NOTES TO FINANCIAL STATEMENTS.
| 66 | J.P. MORGAN MID CAP/MULTI-CAP FUNDS | DECEMBER 31, 2015 | ||||
Table of Contents
|
|
Ratios/Supplemental data | |||||||||||||||||||||||||
| Ratios to average net assets (a) | ||||||||||||||||||||||||||
| Net asset value, end of period |
Total return (excludes sales charge) (b)(c) |
Net assets, end of period (000’s) |
Net expenses (d) |
Net investment income (loss) |
Expenses without waivers, reimbursements and earnings credits |
Portfolio turnover rate (b)(e) |
||||||||||||||||||||
| $ | 27.81 | (5.24 | )% | $ | 2,180,257 | 1.24 | % | 0.77 | % | 1.43 | % | 7 | % | |||||||||||||
| 29.84 | 5.78 | 2,440,061 | 1.24 | 0.64 | 1.41 | 17 | ||||||||||||||||||||
| 29.15 | 22.19 | 1,701,250 | 1.24 | 1.26 | 1.33 | 36 | ||||||||||||||||||||
| 24.64 | 25.09 | 784,359 | 1.24 | 0.98 | 1.33 | 22 | ||||||||||||||||||||
| 19.96 | 5.83 | 206,816 | 1.25 | 1.34 | 1.41 | 49 | ||||||||||||||||||||
| 19.07 | 26.45 | 232,103 | 1.24 | 1.28 | 1.34 | 33 | ||||||||||||||||||||
| 27.74 | (5.49 | ) | 720,642 | 1.74 | 0.28 | 1.84 | 7 | |||||||||||||||||||
| 29.72 | 5.26 | 701,023 | 1.73 | 0.14 | 1.83 | 17 | ||||||||||||||||||||
| 29.08 | 21.58 | 402,880 | 1.74 | 0.74 | 1.83 | 36 | ||||||||||||||||||||
| 24.61 | 24.45 | 212,198 | 1.74 | 0.49 | 1.83 | 22 | ||||||||||||||||||||
| 19.91 | 5.32 | 117,937 | 1.75 | 0.84 | 1.91 | 49 | ||||||||||||||||||||
| 19.01 | 25.82 | 131,743 | 1.74 | 0.78 | 1.84 | 33 | ||||||||||||||||||||
| 27.93 | (5.04 | ) | 6,831,402 | 0.74 | 1.31 | 0.88 | 7 | |||||||||||||||||||
| 30.06 | 6.36 | 5,058,172 | 0.74 | 1.15 | 0.90 | 17 | ||||||||||||||||||||
| 29.31 | 22.77 | 3,042,506 | 0.74 | 1.77 | 0.93 | 36 | ||||||||||||||||||||
| 24.74 | 25.73 | 1,455,125 | 0.74 | 1.50 | 0.93 | 22 | ||||||||||||||||||||
| 19.99 | 6.36 | 384,525 | 0.75 | 1.86 | 1.01 | 49 | ||||||||||||||||||||
| 19.11 | 27.06 | 284,433 | 0.74 | 1.79 | 0.94 | 33 | ||||||||||||||||||||
| 27.97 | (5.13 | ) | 1,422,464 | 0.99 | 0.95 | 1.03 | 7 | |||||||||||||||||||
| 29.99 | 6.05 | 3,095,251 | 0.99 | 0.89 | 1.05 | 17 | ||||||||||||||||||||
| 29.27 | 22.49 | 2,546,808 | 0.99 | 1.53 | 1.08 | 36 | ||||||||||||||||||||
| 24.72 | 25.38 | 1,245,241 | 0.99 | 1.23 | 1.08 | 22 | ||||||||||||||||||||
| 20.00 | 6.09 | 422,861 | 1.00 | 1.62 | 1.16 | 49 | ||||||||||||||||||||
| 19.12 | 26.75 | 270,562 | 0.99 | 1.53 | 1.09 | 33 | ||||||||||||||||||||
SEE NOTES TO FINANCIAL STATEMENTS.
| DECEMBER 31, 2015 | J.P. MORGAN MID CAP/MULTI-CAP FUNDS | 67 | ||||||
Table of Contents
AS OF DECEMBER 31, 2015 (Unaudited)
1. Organization
JPMorgan Trust I (“JPM I”) and JPMorgan Trust II (“JPM II”) were formed on November 12, 2004, as Delaware statutory trusts, pursuant to Declarations of Trust dated November 5, 2004 and are registered under the Investment Company Act of 1940, as amended (the “1940 Act”), as open-end management investment companies.
J.P. Morgan Mutual Fund Investment Trust (“JPMMFIT”), an open-end management investment company, was organized as a Massachusetts business trust on September 23, 1997.
J.P. Morgan Fleming Mutual Fund Group, Inc. (“JPMFMFG”, with JPM I, JPM II and JPMMFIT (collectively, the “Trusts”)), an open-end management investment company, was organized as a Maryland corporation on August 19, 1997.
The following are 6 separate funds of the Trusts (collectively, the “Funds”) covered by this report:
| Classes Offered | Trust | Diversified/Non-Diversified | ||||
| Growth Advantage Fund | Class A, Class C, Class R5, Class R6 and Select Class | JPMMFIT | Diversified | |||
| Mid Cap Equity Fund | Class A, Class C, Class R2, Class R5, Class R6 and Select Class | JPM I | Diversified | |||
| Mid Cap Growth Fund | Class A, Class C, Class R2, Class R5, Class R6 and Select Class | JPM II | Diversified | |||
| Mid Cap Value Fund | Class A, Class C, Class R2, Institutional Class and Select Class | JPMFMFG | Diversified | |||
| Multi-Cap Market Neutral Fund | Class A, Class C, and Select Class | JPM II | Diversified | |||
| Value Advantage Fund | Class A, Class C, Institutional Class and Select Class | JPM I | Diversified |
The investment objective of Growth Advantage Fund and Mid Cap Equity Fund is to seek to provide long-term capital growth.
The investment objective of Mid Cap Growth Fund is to seek growth of capital.
The investment objective of Mid Cap Value Fund is to seek growth from capital appreciation.
The investment objective of Multi-Cap Market Neutral Fund is to seek long-term capital preservation and growth by using strategies designed to produce returns which have no correlation with general domestic market performance.
The investment objective of Value Advantage Fund is to seek to provide long-term total return from a combination of income and capital gains.
Effective as of the close of business on January 3, 2014, all share classes of the Mid Cap Equity Fund are publicly offered only on a limited basis. Investors are not eligible to purchase shares of the Fund unless they meet certain requirements as described in the Fund’s prospectuses.
Effective as of the close of business on February 22, 2013, all share classes of the Mid Cap Value Fund are publicly offered only on a limited basis. Investors are not eligible to purchase shares of the Fund unless they meet certain requirements as described in the Fund’s prospectuses.
Class A Shares generally provide for a front-end sales charge while Class C Shares provide for a contingent deferred sales charge (“CDSC”). No sales charges are assessed with respect to Class R2, Class R5, Class R6, Institutional Class and Select Class Shares. All classes of shares have equal rights as to earnings, assets and voting privileges, except that each class may bear different transfer agency, sub-transfer agency, distribution and shareholder servicing fees and each class has exclusive voting rights with respect to its distribution plan and shareholder servicing agreements. Certain Class A Shares, for which front-end sales charges have been waived, may be subject to a CDSC as described in the Funds’ prospectus.
On June 19, 2015, all remaining Class B Shares converted to Class A Shares of the same Fund. Prior to June 19, 2015, Class B Shares automatically converted to Class A Shares after eight years and provided for a CDSC.
2. Significant Accounting Policies
The following is a summary of significant accounting policies followed by the Funds in the preparation of their financial statements. The Funds are investment companies and, accordingly, follow the investment company accounting and reporting guidance of the Financial Accounting Standards Board Accounting Standards Codification Topic 946 — Investment Companies, which is part of U.S. generally accepted accounting principles (“GAAP”). The preparation of financial statements in conformity with GAAP requires management to make estimates and assumptions that affect the reported amounts of assets and liabilities and disclosure of contingent assets and liabilities at the date of the financial statements and the reported amounts of increases and decreases in net assets from operations during the reporting period. Actual results could differ from those estimates.
A. Valuation of Investments — The valuation of investments is in accordance with GAAP and the Funds’ valuation policies set forth by and under the supervision and responsibility of the Board of Trustees (the “Board”), which established the following approach to valuation, as described more fully below: (i) investments for which market quotations are readily available shall be valued at such unadjusted quoted prices and (ii) all other investments for which market quotations are not readily available shall be valued at their fair value as determined in good faith by the Board.
JPMorgan Funds Management, Inc. (the “Administrator”) has established the J.P. Morgan Asset Management Americas Valuation Committee (“AVC”) to assist the Board with the oversight and monitoring of the valuation of the Funds’ investments. The Administrator implements the valuation policies of the Funds’ investments, as directed by the Board. The AVC oversees and carries out the policies for the valuation of investments held in the Funds. This includes monitoring the appropriateness of fair values based on results of ongoing valuation oversight, including but not limited to consideration of macro or security specific events, market events and pricing vendor and broker due diligence. The Administrator is responsible for discussing and assessing the potential impacts to the fair values on an ongoing basis, and at least on a quarterly basis with the AVC and the Board.
| 68 | J.P. MORGAN MID CAP/MULTI-CAP FUNDS | DECEMBER 31, 2015 | ||||
Table of Contents
Equities and other exchange-traded instruments are valued at the last sale price or official market closing price on the primary exchange on which the instrument is traded before the net asset values (“NAV”) of the Funds are calculated on a valuation date. Investments in open-end investment companies (the “Underlying Funds”), are valued at each Underlying Fund’s NAV per share as of the report date.
Futures are generally valued on the basis of available market quotations.
Valuations reflected in this report are as of the report date. As a result, changes in valuation due to market events and/or issuer related events after the report date and prior to issuance of the report are not reflected herein.
The various inputs that are used in determining the valuation of the Funds’ investments are summarized into the three broad levels listed below.
| • | Level 1 — Unadjusted inputs using quoted prices in active markets for identical investments. |
| • | Level 2 — Other significant observable inputs including, but not limited to, quoted prices for similar investments, inputs other than quoted prices that are observable for investments (such as interest rates, prepayment speeds, credit risk, etc.) or other market corroborated inputs. |
| • | Level 3 — Significant inputs based on the best information available in the circumstances, to the extent observable inputs are not available (including the Funds’ assumptions in determining the fair value of investments). |
A financial instrument’s level within the fair value hierarchy is based on the lowest level of any input, both individually and in the aggregate, that is significant to the fair value measurement. The inputs or methodology used for valuing instruments are not necessarily an indication of the risk associated with investing in those instruments.
The following tables represent each valuation input as presented on the Schedules of Portfolio Investments (“SOIs”) (amounts in thousands):
Growth Advantage Fund
| Level 1 Quoted prices |
Level 2 Other significant observable inputs |
Level 3 Significant unobservable inputs |
Total | |||||||||||||
| Total Investments in Securities (a) |
$ | 6,446,833 | $ | – | $ | – | $ | 6,446,833 | ||||||||
|
|
|
|
|
|
|
|
|
|||||||||
| Mid Cap Equity Fund | ||||||||||||||||
| Level 1 Quoted prices |
Level 2 Other significant observable inputs |
Level 3 Significant unobservable inputs |
Total | |||||||||||||
| Total Investments in Securities (a) |
$ | 3,215,181 | $ | – | $ | – | $ | 3,215,181 | ||||||||
|
|
|
|
|
|
|
|
|
|||||||||
| Mid Cap Growth Fund | ||||||||||||||||
| Level 1 Quoted prices |
Level 2 Other significant observable inputs |
Level 3 Significant unobservable inputs |
Total | |||||||||||||
| Total Investments in Securities (a) |
$ | 2,869,836 | $ | – | $ | – | $ | 2,869,836 | ||||||||
|
|
|
|
|
|
|
|
|
|||||||||
| Mid Cap Value Fund | ||||||||||||||||
| Level 1 Quoted prices |
Level 2 Other significant observable inputs |
Level 3 Significant unobservable inputs |
Total | |||||||||||||
| Total Investments in Securities (a) |
$ | 14,766,099 | $ | – | $ | – | $ | 14,766,099 | ||||||||
|
|
|
|
|
|
|
|
|
|||||||||
| Multi-Cap Market Neutral Fund | ||||||||||||||||
| Level 1 Quoted prices |
Level 2 Other significant observable inputs |
Level 3 Significant unobservable inputs |
Total | |||||||||||||
| Total Investments in Securities (a) |
$ | 270,507 | $ | – | $ | – | $ | 270,507 | ||||||||
|
|
|
|
|
|
|
|
|
|||||||||
| Total Liabilities for Securities Sold Short (a) |
$ | (241,707 | ) | $ | – | $ | – | $ | (241,707 | ) | ||||||
|
|
|
|
|
|
|
|
|
|||||||||
| Appreciation in Other Financial Instruments |
||||||||||||||||
| Futures Contracts |
$ | 1 | $ | – | $ | – | $ | 1 | ||||||||
|
|
|
|
|
|
|
|
|
|||||||||
| DECEMBER 31, 2015 | J.P. MORGAN MID CAP/MULTI-CAP FUNDS | 69 | ||||||
Table of Contents
NOTES TO FINANCIAL STATEMENTS
AS OF DECEMBER 31, 2015 (Unaudited) (continued)
| Value Advantage Fund | ||||||||||||||||
| Level 1 Quoted prices |
Level 2 Other significant observable inputs |
Level 3 Significant unobservable inputs |
Total | |||||||||||||
| Total Investments in Securities (a) |
$ | 11,154,544 | $ | – | $ | – | $ | 11,154,544 | ||||||||
|
|
|
|
|
|
|
|
|
|||||||||
| (a) | All portfolio holdings designated as Level 1 are disclosed individually on the SOIs. Please refer to the SOIs for industry specifics of portfolio holdings. There were no transfers among any levels during the six months ended December 31, 2015. |
B. Short Sales — Multi-Cap Market Neutral Fund engages in short sales as part of its normal investment activities. In a short sale, the Fund sells securities it does not own in anticipation of a decline in the market value of those securities. In order to deliver securities to the purchaser, the Fund borrows securities from a broker. To close out a short position, the Fund delivers the same securities to the broker.
The Fund is required to pledge cash or securities to the broker as collateral for the securities sold short. Collateral requirements are calculated daily based on the current market value of the short positions. Cash collateral deposited with the broker is recorded as an asset on the Statements of Assets and Liabilities. Securities segregated as collateral are denoted on the SOIs. The Fund may receive or pay the net of the following amounts: (i) a portion of the income from the investment of cash collateral; (ii) the broker’s fee on the borrowed securities (calculated daily based upon the market value of each borrowed security and a variable rate that is dependent on availability of the security); and (iii) a financing charge for the difference between the market value of the short position and cash collateral deposited with the broker. The net income or fee is reported as Interest income or Interest expense, respectively, on securities sold short on the Statements of Operations.
The Fund is obligated to pay the broker dividends declared on short positions when a position is open on the record date. Dividends on short positions are reported on ex-dividend date on the Statements of Operations as Dividend expense on securities sold short.
Liabilities for securities sold short are reported at market value on the Statements of Assets and Liabilities and the change in market value is recorded as change in net unrealized appreciation (depreciation) on the Statements of Operations. Short sale transactions may result in unlimited losses as the security’s price increases and the short position loses value. There is no upward limit on the price a borrowed security could attain. The Fund is also subject to risk of loss if the broker were to fail to perform its obligations under the contractual terms.
The Fund will record a realized loss if the price of the borrowed security increases between the date of the short sale and the date on which the Fund replaces the borrowed security. The Fund will record a realized gain if the price of the borrowed security declines between those dates.
As of December 31, 2015, the Fund had outstanding short sales as listed on the SOIs.
C. Futures Contracts — Multi-Cap Market Neutral Fund used index futures contracts to gain or reduce exposure to the stock market, maintain liquidity or minimize transaction costs. The Fund also bought futures contracts to invest incoming cash in the market or sold futures in response to cash outflows, thereby simulating an invested position in the underlying index while maintaining a cash balance for liquidity.
Futures contracts provide for the delayed delivery of the underlying instrument at a fixed price or are settled for a cash amount based on the change in the value of the underlying instrument at a specific date in the future. Upon entering into a futures contract, the Fund is required to deposit with the broker, cash or securities in an amount equal to a certain percentage of the contract amount, which is referred to as the initial margin deposit. Subsequent payments, referred to as variation margin, are made or received by the Fund periodically and are based on changes in the market value of open futures contracts. Changes in the market value of open futures contracts are recorded as Change in net unrealized appreciation/depreciation on the Statements of Operations. Realized gains or losses, representing the difference between the value of the contract at the time it was opened and the value at the time it was closed, are reported on the Statements of Operations at the closing or expiration of the futures contract. Securities deposited as initial margin are designated on the SOIs and cash deposited is recorded on the Statements of Assets and Liabilities. A receivable from and/or a payable to brokers for the daily variation margin is also recorded on the Statements of Assets and Liabilities.
The use of futures contracts exposes the Fund to equity price risk. The Fund may be subject to the risk that the change in the value of the futures contract may not correlate perfectly with the underlying instrument. Use of long futures contracts subjects the Fund to risk of loss in excess of the amounts shown on the Statements of Assets and Liabilities, up to the notional amount of the futures contracts. Use of short futures contracts subjects the Fund to unlimited risk of loss. The Fund may enter into futures contracts only on exchanges or boards of trade.
The exchange or board of trade acts as the counterparty to each futures transaction; therefore, the Fund’s credit risk is limited to failure of the exchange or board of trade. Under some circumstances, futures exchanges may establish daily limits on the amount that the price of a futures contract can vary from the previous day’s settlement price, which could effectively prevent liquidation of positions.
| 70 | J.P. MORGAN MID CAP/MULTI-CAP FUNDS | DECEMBER 31, 2015 | ||||
Table of Contents
The table below discloses the volume of the Fund’s futures contracts activity during the six months ended December 31, 2015 (amounts in thousands):
| Multi-Cap Market Neutral Fund |
||||
| Futures Contracts: |
||||
| Average Notional Balance short |
$ | 4,221 | ||
| Ending Notional Balance Short |
2,727 | |||
The Fund’s futures contracts are not subject to master netting arrangements (the right to close out all transactions traded with a counterparty and net amounts owed or due across transactions).
D. Security Transactions and Investment Income — Investment transactions are accounted for on the trade date (the date the order to buy or sell is executed). Securities gains and losses are calculated on a specifically identified cost basis. Interest income is determined on the basis of coupon interest accrued using the effective interest method which adjusts for amortization of premiums and accretion of discounts. Dividend income, net of foreign taxes withheld, if any, and dividend expense on securities sold short, are recorded on the ex-dividend date or when a Fund first learns of the dividend.
To the extent such information is publicly available, the Funds record distributions received in excess of income earned from underlying investments as a reduction of cost of investments and/or realized gain. Such amounts are based on estimates if actual amounts are not available and actual amounts of income, realized gain and return of capital may differ from the estimated amounts. The Funds adjust the estimated amounts of the components of distributions (and consequently their net investment income) as necessary once the issuers provide information about the actual composition of the distributions.
E. Allocation of Income and Expenses — Expenses directly attributable to a fund are charged directly to that fund, while the expenses attributable to more than one fund of the Trusts are allocated among the respective funds. In calculating the NAV of each class, investment income, realized and unrealized gains and losses and expenses, other than class specific expenses, are allocated daily to each class of shares based upon the proportion of net assets of each class at the beginning of each day.
Transfer agent fees and sub-transfer agent fees are class-specific expenses. The amount of the transfer agent fees and sub-transfer agent fees charged to each class of the Funds for the six months ended December 31, 2015 are as follows (amounts in thousands):
| Class A | Class C | Class R2 | Class R5 | Class R6 | Institutional Class | Select Class | Total | |||||||||||||||||||||||||
| Growth Advantage Fund |
||||||||||||||||||||||||||||||||
| Transfer agent fees |
$ | 41 | $ | 13 | n/a | $ | 2 | $ | 8 | n/a | $ | 14 | $ | 78 | ||||||||||||||||||
| Sub-transfer agent fees |
585 | 134 | n/a | 24 | — | n/a | 532 | 1,275 | ||||||||||||||||||||||||
| Mid Cap Equity Fund |
||||||||||||||||||||||||||||||||
| Transfer agent fees |
6 | 2 | $ | — | (a) | — | (a) | 5 | n/a | 14 | 27 | |||||||||||||||||||||
| Sub-transfer agent fees |
215 | 20 | 1 | — | (a) | — | n/a | 1,418 | 1,654 | |||||||||||||||||||||||
| Mid Cap Growth Fund |
||||||||||||||||||||||||||||||||
| Transfer agent fees |
178 | 6 | 2 | 2 | 5 | n/a | 14 | 207 | ||||||||||||||||||||||||
| Sub-transfer agent fees |
405 | 42 | 10 | 62 | — | n/a | 756 | 1,275 | ||||||||||||||||||||||||
| Mid Cap Value Fund |
||||||||||||||||||||||||||||||||
| Transfer agent fees |
83 | 14 | 5 | n/a | n/a | $ | 20 | 395 | 517 | |||||||||||||||||||||||
| Sub-transfer agent fees |
1,779 | 202 | 78 | n/a | n/a | 3,940 | 1,182 | 7,181 | ||||||||||||||||||||||||
| Multi-Cap Market Neutral Fund |
||||||||||||||||||||||||||||||||
| Transfer agent fees |
1 | 1 | n/a | n/a | n/a | n/a | 2 | 4 | ||||||||||||||||||||||||
| Sub-transfer agent fees |
4 | 5 | n/a | n/a | n/a | n/a | 8 | 17 | ||||||||||||||||||||||||
| Value Advantage Fund |
||||||||||||||||||||||||||||||||
| Transfer agent fees |
43 | 21 | n/a | n/a | n/a | 30 | 17 | 111 | ||||||||||||||||||||||||
| Sub-transfer agent fees |
1,999 | 288 | n/a | n/a | n/a | 989 | 251 | 3,527 | ||||||||||||||||||||||||
| (a) | Amount rounds to less than $1,000. |
F. Federal Income Taxes — Each Fund is treated as a separate taxable entity for Federal income tax purposes. Each Fund’s policy is to comply with the provisions of the Internal Revenue Code of 1986, as amended (the “Code”), applicable to regulated investment companies and to distribute to shareholders all of its distributable net investment income and net realized capital gains on investments. Accordingly, no provision for Federal income tax is necessary. Management has reviewed the Funds’ tax positions for all open tax years and has determined that as of December 31, 2015, no liability for income tax is required in the Funds’ financial statements for net unrecognized tax benefits. However, management’s conclusions may be subject to future review based on changes in, or the interpretation of, the accounting standards or tax laws and regulations. Each of the Funds’ Federal tax returns for the prior three fiscal years remains subject to examination by the Internal Revenue Service.
| DECEMBER 31, 2015 | J.P. MORGAN MID CAP/MULTI-CAP FUNDS | 71 | ||||||
Table of Contents
NOTES TO FINANCIAL STATEMENTS
AS OF DECEMBER 31, 2015 (Unaudited) (continued)
G. Distributions to Shareholders — Distributions from net investment income are generally declared and paid at least annually, except for the Mid Cap Equity Fund, Mid Cap Growth Fund and Multi-Cap Market Neutral Fund, for which distributions are generally declared and paid at least quarterly. Distributions are declared separately for each class of each Fund. No class has preferential dividend rights; differences in per share rates are due to differences in separate class expenses. Net realized capital gains, if any, are distributed by each Fund at least annually. The amount of distributions from net investment income and net realized capital gains is determined in accordance with Federal income tax regulations, which may differ from GAAP. To the extent these “book/tax” differences are permanent in nature (i.e., that they result from other than timing of recognition — “temporary differences”), such amounts are reclassified within the capital accounts based on their Federal tax-basis treatment.
3. Fees and Other Transactions with Affiliates
A. Investment Advisory Fee — Pursuant to the Investment Advisory Agreements, J.P. Morgan Investment Management Inc. (the “Adviser”), an indirect, wholly-owned subsidiary of JPMorgan Chase & Co. (“JPMorgan”), supervises the investments of each Fund and for such services is paid a fee. The fee is accrued daily and paid monthly based on each Fund’s respective average daily net assets. The annual rate for each Fund is as follows:
| Growth Advantage Fund |
0.65 | % | ||
| Mid Cap Equity Fund |
0.65 | |||
| Mid Cap Growth Fund |
0.65 | |||
| Mid Cap Value Fund |
0.65 | |||
| Multi-Cap Market Neutral Fund* |
0.80 | |||
| Value Advantage Fund |
0.65 |
| * | Prior to September 1, 2015, the investment advisory fee for Multi-Cap Market Neutral Fund was 1.25%. |
The Adviser waived Investment Advisory fees and/or reimbursed expenses as outlined in Note 3.F.
B. Administration Fee — Pursuant to an Administration Agreement, the Administrator, an indirect, wholly-owned subsidiary of JPMorgan, provides certain administration services to the Funds. In consideration of these services, the Administrator receives a fee accrued daily and paid monthly at an annual rate of 0.15% of the first $25 billion of the average daily net assets of all funds in the J.P. Morgan Funds Complex covered by the Administration Agreement (excluding certain funds of funds and money market funds) and 0.075% of the average daily net assets in excess of $25 billion of all such funds. For the six months ended December 31, 2015, the effective annualized rate was 0.08% of each Fund’s average daily net assets, notwithstanding any fee waivers and/or expense reimbursements.
The Administrator waived Administration fees as outlined in Note 3.F.
JPMorgan Chase Bank, N.A. (“JPMCB”), a wholly-owned subsidiary of JPMorgan, serves as the Funds’ sub-administrator (the “Sub-administrator”). For its services as Sub-administrator, JPMCB receives a portion of the fees payable to the Administrator.
C. Distribution Fees — Pursuant to a Distribution Agreement, JPMorgan Distribution Services, Inc. (the “Distributor”), a wholly-owned subsidiary of JPMorgan, serves as the Trusts’ exclusive underwriter and promotes and arranges for the sale of each Fund’s shares.
The Board has adopted a Distribution Plan (the “Distribution Plan”) for Class A, Class C and Class R2 Shares of the Funds, as applicable, in accordance with Rule 12b-1 under the 1940 Act. The Distribution Plan provides that each Fund shall pay distribution fees, including payments to the Distributor, at annual rates of the average daily net assets as shown in the table below:
| Class A | Class C | Class R2 | ||||||||||
| Growth Advantage Fund |
0.25 | % | 0.75 | % | n/a | |||||||
| Mid Cap Equity Fund |
0.25 | 0.75 | 0.50 | % | ||||||||
| Mid Cap Growth Fund |
0.25 | 0.75 | 0.50 | |||||||||
| Mid Cap Value Fund |
0.25 | 0.75 | 0.50 | |||||||||
| Multi-Cap Market Neutral Fund |
0.25 | 0.75 | n/a | |||||||||
| Value Advantage Fund |
0.25 | 0.75 | n/a | |||||||||
In addition, the Distributor is entitled to receive the front-end sales charges from purchases of Class A Shares and the CDSC from redemptions of Class C Shares and certain Class A Shares for which front-end sales charges have been waived. For the six months ended December 31, 2015, the Distributor retained the following (amounts in thousands):
| Front-End Sales Charge | CDSC | |||||||
| Growth Advantage Fund |
$ | 796 | $ | 2 | ||||
| Mid Cap Equity Fund |
180 | — | ||||||
| Mid Cap Growth Fund |
119 | 1 | ||||||
| Mid Cap Value Fund |
16 | — | (a) | |||||
| Multi-Cap Market Neutral Fund |
— | (a) | — | |||||
| Value Advantage Fund |
316 | 2 | ||||||
| (a) | Amount rounds to less than $1,000. |
| 72 | J.P. MORGAN MID CAP/MULTI-CAP FUNDS | DECEMBER 31, 2015 | ||||
Table of Contents
D. Shareholder Servicing Fees — The Trusts, on behalf of the Funds, have entered into Shareholder Servicing Agreements with the Distributor under which the Distributor provides certain support services to the shareholders. The Class R6 Shares do not participate in the Shareholder Servicing Agreement. For performing these services, the Distributor receives a fee that is accrued daily and paid monthly equal to a percentage of the average daily net assets as shown in the table below:
| Class A | Class C | Class R2 | Class R5 | Institutional Class | Select Class | |||||||||||||||||||
| Growth Advantage Fund |
0.25 | % | 0.25 | % | n/a | 0.05 | % | n/a | 0.25 | % | ||||||||||||||
| Mid Cap Equity Fund |
0.25 | 0.25 | 0.25 | % | 0.05 | n/a | 0.25 | |||||||||||||||||
| Mid Cap Growth Fund |
0.25 | 0.25 | 0.25 | 0.05 | n/a | 0.25 | ||||||||||||||||||
| Mid Cap Value Fund |
0.25 | 0.25 | 0.25 | n/a | 0.10 | % | 0.25 | |||||||||||||||||
| Multi-Cap Market Neutral Fund |
0.25 | 0.25 | n/a | n/a | n/a | 0.25 | ||||||||||||||||||
| Value Advantage Fund |
0.25 | 0.25 | n/a | n/a | 0.10 | 0.25 | ||||||||||||||||||
The Distributor has entered into shareholder services contracts with affiliated and unaffiliated financial intermediaries who provide shareholder services and other related services to their clients or customers who invest in the Funds under which the Distributor will pay all or a portion of such fees earned to financial intermediaries for performing such services.
The Distributor waived Shareholder Servicing fees as outlined in Note 3.F.
E. Custodian and Accounting Fees — JPMCB provides portfolio custody and accounting services to the Funds. For these services, the Funds pay JPMCB transaction and asset-based fees that vary according to the number of transactions and positions, plus out-of-pocket expenses. The amounts paid directly to JPMCB by the Funds for custody and accounting services are included in Custodian and accounting fees on the Statements of Operations. Payments to the custodian may be reduced by credits earned by each Fund, based on uninvested cash balances held by the custodian. Such earnings credits, if any, are presented separately on the Statements of Operations.
Interest expense paid to the custodian related to cash overdrafts, if any, is included in Interest expense to affiliates on the Statements of Operations.
F. Waivers and Reimbursements — The Adviser, Administrator and/or Distributor have contractually agreed to waive fees and/or reimburse the Funds to the extent that total annual operating expenses (excluding acquired fund fees and expenses other than certain money market fund fees as described below, dividend and interest expenses related to short sales, interest, taxes, expenses related to litigation and potential litigation and extraordinary expenses) exceed the percentages of the Funds’ respective average daily net assets as shown in the table below:
| Class A | Class C | Class R2 | Class R5 | Class R6 | Institutional Class | Select Class | ||||||||||||||||||||||
| Growth Advantage Fund |
1.25 | % | 1.75 | % | n/a | 0.90 | % | 0.85 | % | n/a | 1.10 | % | ||||||||||||||||
| Mid Cap Equity Fund |
1.25 | 1.75 | 1.50 | % | 0.80 | 0.75 | n/a | 0.90 | ||||||||||||||||||||
| Mid Cap Growth Fund |
1.24 | 1.74 | 1.40 | 0.79 | 0.74 | n/a | 0.93 | |||||||||||||||||||||
| Mid Cap Value Fund |
1.24 | 1.75 | 1.50 | n/a | n/a | 0.75 | % | 0.99 | ||||||||||||||||||||
| Multi-Cap Market Neutral Fund |
1.25 | * | 1.75 | * | n/a | n/a | n/a | n/a | 0.99 | * | ||||||||||||||||||
| Value Advantage Fund |
1.25 | 1.75 | n/a | n/a | n/a | 0.75 | 1.00 | |||||||||||||||||||||
| * | Prior to September 1, 2015, the contractual expense limitation for Multi-Cap Market Neutral Fund was 1.50%, 2.00% and 1.25% for Class A, Class C and Select Class Shares, respectively. |
Except as noted above, the expense limitation agreements were in effect for the six months ended December 31, 2015. The contractual expense limitation percentages in the table above are in place until at least October 31, 2016.
For the six months ended December 31, 2015, the Funds’ service providers waived fees and/or reimbursed expenses for each of the Funds as follows (amounts in thousands). None of these parties expect the Funds to repay any such waived fees and reimbursed expenses in future years.
| Contractual Waivers | ||||||||||||||||||||
| Investment Advisory |
Administration | Shareholder Servicing |
Total | Contractual Reimbursements |
||||||||||||||||
| Growth Advantage Fund |
$ | — | $ | — | $ | 774 | $ | 774 | $ | — | ||||||||||
| Mid Cap Equity Fund |
31 | 20 | 2,355 | 2,406 | 159 | |||||||||||||||
| Mid Cap Growth Fund |
149 | 96 | 1,854 | 2,099 | 23 | |||||||||||||||
| Mid Cap Value Fund |
3,355 | 2,238 | 6,610 | 12,203 | 525 | |||||||||||||||
| Multi-Cap Market Neutral Fund |
275 | 116 | 10 | 401 | — | |||||||||||||||
| Value Advantage Fund |
870 | 581 | 4,860 | 6,311 | 336 | |||||||||||||||
Additionally, the Funds may invest in one or more money market funds advised by the Adviser or its affiliates (affiliated money market funds). Effective November 1, 2015, the Adviser, Administrator and/or Distributor, as shareholder servicing agent, have contractually agreed to waive fees and/or reimburse expenses in an amount sufficient to offset the respective net fees each collects from the affiliated money market fund on the applicable Funds’ investment in such affiliated money market fund. Prior to November 1, 2015, a portion of the waiver was voluntary.
| DECEMBER 31, 2015 | J.P. MORGAN MID CAP/MULTI-CAP FUNDS | 73 | ||||||
Table of Contents
NOTES TO FINANCIAL STATEMENTS
AS OF DECEMBER 31, 2015 (Unaudited) (continued)
The amount of waivers resulting from investments in these money market funds for the six months ended December 31, 2015 was as follows (amounts in thousands):
| Growth Advantage Fund |
$ | 176 | ||
| Mid Cap Equity Fund |
110 | |||
| Mid Cap Growth Fund |
104 | |||
| Mid Cap Value Fund |
405 | |||
| Multi-Cap Market Neutral Fund |
29 | |||
| Value Advantage Fund |
689 |
G. Other — Certain officers of the Trusts are affiliated with the Adviser, the Administrator and the Distributor. Such officers, with the exception of the Chief Compliance Officer, receive no compensation from the Funds for serving in their respective roles.
The Board appointed a Chief Compliance Officer to the Funds in accordance with Federal securities regulations. Each Fund, along with other affiliated funds, makes reimbursement payments, on a pro-rata basis, to the Administrator for a portion of the fees associated with the Office of the Chief Compliance Officer. Such fees are included in Trustees’ and Chief Compliance Officer’s fees on the Statements of Operations.
The Trusts adopted a Trustee Deferred Compensation Plan (the “Plan”) which allows the Independent Trustees to defer the receipt of all or a portion of compensation related to performance of their duties as Trustees. The deferred fees are invested in various J.P. Morgan Funds until distribution in accordance with the Plan.
During the six months ended December 31, 2015, the Funds may have purchased securities from an underwriting syndicate in which the principal underwriter or members of the syndicate are affiliated with the Adviser.
The Funds may use related party broker-dealers. For the six months ended December 31, 2015, the Funds incurred brokerage commissions with broker-dealers affiliated with the Adviser as follows (amounts in thousands):
| Growth Advantage Fund |
$ | 1 | ||
| Mid Cap Equity Fund |
— | (a) | ||
| Mid Cap Growth Fund |
— | (a) | ||
| Mid Cap Value Fund |
— | (a) | ||
| Multi-Cap Market Neutral Fund |
— | (a) | ||
| Value Advantage Fund |
6 |
| (a) | Amount rounds to less than $1,000. |
The Securities and Exchange Commission (“SEC”) has granted an exemptive order permitting the Funds to engage in principal transactions with J.P. Morgan Securities, Inc., an affiliated broker, involving taxable money market instruments, subject to certain conditions.
4. Investment Transactions
During the six months ended December 31, 2015, purchases and sales of investments (excluding short-term investments and transfers in-kind) were as follows (amounts in thousands):
| Purchases U.S. Government) |
Sales (excluding U.S. Government) |
Securities Sold Short |
Covers on Securities Sold Short |
|||||||||||||
| Growth Advantage Fund |
$ | 2,106,961 | $ | 834,963 | $ | — | $ | — | ||||||||
| Mid Cap Equity Fund |
642,031 | 517,585 | — | — | ||||||||||||
| Mid Cap Growth Fund |
1,380,680 | 776,544 | — | — | ||||||||||||
| Mid Cap Value Fund |
1,084,974 | 1,146,695 | — | — | ||||||||||||
| Multi-Cap Market Neutral Fund |
135,862 | 126,344 | 148,770 | 129,458 | ||||||||||||
| Value Advantage Fund |
2,055,471 | 797,861 | — | — | ||||||||||||
During the six months ended December 31, 2015, there were no purchases or sales of U.S. Government securities.
| 74 | J.P. MORGAN MID CAP/MULTI-CAP FUNDS | DECEMBER 31, 2015 | ||||
Table of Contents
5. Federal Income Tax Matters
For Federal income tax purposes, the cost and unrealized appreciation (depreciation) in value of investment securities held at December 31, 2015 were as follows (amounts in thousands):
| Aggregate Cost |
Gross Unrealized Appreciation |
Gross Unrealized Depreciation |
Net Unrealized Appreciation (Depreciation) |
|||||||||||||
| Growth Advantage Fund |
$ | 5,065,608 | $ | 1,529,214 | $ | 147,989 | $ | 1,381,225 | ||||||||
| Mid Cap Equity Fund |
2,608,462 | 740,455 | 133,736 | 606,719 | ||||||||||||
| Mid Cap Growth Fund |
2,507,661 | 470,341 | 108,166 | 362,175 | ||||||||||||
| Mid Cap Value Fund |
10,387,786 | 4,802,709 | 424,396 | 4,378,313 | ||||||||||||
| Multi-Cap Market Neutral Fund |
269,692 | 22,215 | 21,400 | 815 | ||||||||||||
| Value Advantage Fund |
10,108,360 | 1,582,912 | 536,728 | 1,046,184 | ||||||||||||
Under the Regulated Investment Company Modernization Act of 2010 (“the “Act”), net capital losses recognized by the Funds after June 30, 2011 are carried forward indefinitely, and retain their character as short-term and/or long-term losses. Prior to the Act, net capital losses incurred by the Funds were carried forward for eight years and treated as short-term losses. The Act requires that post-enactment net capital losses be used before pre-enactment net capital losses.
At June 30, 2015, the Funds did not have any post-enactment capital loss carryforwards.
At June 30, 2015, the following Funds had pre-enactment net capital loss carryforwards, expiring during the years indicated, which are available to offset future realized gains (amounts in thousands):
| 2016 | 2017 | 2018 | Total | |||||||||||||
| Mid Cap Value Fund |
$ | — | $ | — | $ | 22,101 | * | $ | 22,101 | * | ||||||
| Multi-Cap Market Neutral Fund |
16,117 | — | — | 16,117 | ||||||||||||
| * | Amount includes capital loss carryforwards from business combinations, which are limited in future years under Internal Revenue Code Sections 381—384. Excludes approximately $5,263,000 of losses no longer available due to merger limitations. |
6. Borrowings
The Funds rely upon an exemptive order granted by the SEC (the “Order”) permitting the establishment and operation of an Interfund Lending Facility (the “Facility”). The Facility allows the Funds to directly lend and borrow money to or from any other fund relying upon the Order at rates beneficial to both the borrowing and lending funds. Advances under the Facility are taken primarily for temporary or emergency purposes, including the meeting of redemption requests that otherwise might require the untimely disposition of securities, and are subject to each Fund’s borrowing restrictions. The Interfund loan rate is determined, as specified in the Order, by averaging the current repurchase agreement rate and the current bank loan rate. The Order was granted to JPM II and may be relied upon by the Funds because the Funds and the series of JPM II are all investment companies in the same “group of investment companies” (as defined in Section 12(d)(1)(G) of the 1940 Act).
In addition, the Trusts and JPMCB have entered into a financing arrangement. Under this arrangement, JPMCB provides an unsecured, uncommitted credit facility in the aggregate amount of $100 million to certain of the J.P. Morgan Funds, including the Funds. Advances under the arrangement are taken primarily for temporary or emergency purposes, including the meeting of redemption requests that otherwise might require the untimely disposition of securities, and are subject to each Fund’s borrowing restrictions. Interest on borrowings is payable at a rate determined by JPMCB at the time of borrowing. This agreement has been extended until November 7, 2016.
The Funds had no borrowings outstanding from another fund or from the unsecured, uncommitted credit facility at December 31, 2015, or at any time during the six months then ended.
7. Redemptions in-Kind
During the six months ended December 31, 2015, certain Select Class shareholders sold their shares of Mid Cap Growth Fund. The portfolio securities were delivered primarily by means of a redemption in-kind in exchange for shares of the Fund. Cash and portfolio securities were transferred as of the close of business on the date and at the market value listed below (amounts in thousands):
| November 6, 2015 | Value | Realized Gains (Losses) |
Type | |||||||||
| Select Class |
$ | 602,118 | * | $ | 203,177 | Redemptions in-kind | ||||||
| * | This amount includes cash of approximately $25,788,000 associated with the redemption in-kind. |
| DECEMBER 31, 2015 | J.P. MORGAN MID CAP/MULTI-CAP FUNDS | 75 | ||||||
Table of Contents
NOTES TO FINANCIAL STATEMENTS
AS OF DECEMBER 31, 2015 (Unaudited) (continued)
8. Risks, Concentrations and Indemnifications
In the normal course of business, the Funds enter into contracts that contain a variety of representations which provide general indemnifications. Each Fund’s maximum exposure under these arrangements is unknown. The amount of exposure would depend on future claims that may be made against each Fund that have not yet occurred. However, based on experience, the Funds expect the risk of loss to be remote.
As of December 31, 2015, an affiliate of the Adviser had investment discretion with respect to its clients’ holdings in the Funds, which collectively represent the following percentage of each Fund’s net assets:
| % of the Fund | ||||
| Growth Advantage Fund Mid Cap Equity Fund |
|
13.0 24.8 |
%
| |
As of December 31, 2015, the J.P. Morgan Investor Funds and JPMorgan SmartRetirement Funds, which are affiliated funds of funds, owned in the aggregate, shares representing more than 10% of the net assets of certain Funds as follows:
| J.P. Morgan Investor Funds |
JPMorgan SmartRetirement Funds |
|||||||
| Growth Advantage Fund |
n/a | 35.0 | % | |||||
| Mid Cap Equity Fund |
n/a | 35.8 | ||||||
| Multi-Cap Market Neutral Fund |
90.2 | % | n/a | |||||
| Value Advantage Fund |
n/a | 18.6 | ||||||
As of December 31, 2015, Mid Cap Equity Fund, Mid Cap Value Fund and Value Advantage Fund, each had a shareholder, which is an account maintained by a financial intermediary on behalf of its clients, that collectively owned shares representing the following percentage of each applicable Fund’s net assets:
| % of the Fund | ||||
| Mid Cap Equity Fund Mid Cap Value Fund Value Advantage Fund |
|
10.8 17.0 18.7 |
%
| |
Significant shareholder transactions by these shareholders may impact the Funds’ performance.
As of December 31, 2015, the Multi-Cap Market Neutral Fund pledged a significant portion of its assets for securities sold short to Citigroup Global Markets, Inc., who also held 100% of the Multi-Cap Market Neutral Fund’s cash proceeds for securities sold short.
9. Subsequent Events
During the period December 31, 2015 through February 23, 2016, affiliated fund of funds of Multi-Cap Market Neutral Fund redeemed approximately $75,037,000. This amount represents 27.6% of the Fund’s net assets as of December 31, 2015.
During the period December 31, 2015 through February 23, 2016 certain shareholders of Mid Cap Equity Fund redeemed approximately $693,000,000. This amount represents 21.6% of the Fund’s net assets as of December 31, 2015.
| 76 | J.P. MORGAN MID CAP/MULTI-CAP FUNDS | DECEMBER 31, 2015 | ||||
Table of Contents
SCHEDULE OF SHAREHOLDER EXPENSES
(Unaudited)
Hypothetical $1,000 Investment
| Beginning Account Value July 1, 2015 |
Ending Account Value December 31, 2015 |
Expenses Paid During the Period* |
Annualized Expense Ratio |
|||||||||||||
| Growth Advantage Fund |
||||||||||||||||
| Class A |
||||||||||||||||
| Actual |
$ | 1,000.00 | $ | 988.80 | $ | 6.25 | 1.25 | % | ||||||||
| Hypothetical |
1,000.00 | 1,018.85 | 6.34 | 1.25 | ||||||||||||
| Class C |
||||||||||||||||
| Actual |
1,000.00 | 985.40 | 8.73 | 1.75 | ||||||||||||
| Hypothetical |
1,000.00 | 1,016.34 | 8.87 | 1.75 | ||||||||||||
| Class R5 |
||||||||||||||||
| Actual |
1,000.00 | 990.40 | 4.35 | 0.87 | ||||||||||||
| Hypothetical |
1,000.00 | 1,020.76 | 4.42 | 0.87 | ||||||||||||
| Class R6 |
||||||||||||||||
| Actual |
1,000.00 | 991.00 | 3.75 | 0.75 | ||||||||||||
| Hypothetical |
1,000.00 | 1,021.37 | 3.81 | 0.75 | ||||||||||||
| Select Class |
||||||||||||||||
| Actual |
1,000.00 | 989.60 | 5.40 | 1.08 | ||||||||||||
| Hypothetical |
1,000.00 | 1,019.71 | 5.48 | 1.08 | ||||||||||||
| Mid Cap Equity Fund |
||||||||||||||||
| Class A |
||||||||||||||||
| Actual |
1,000.00 | 944.00 | 6.11 | 1.25 | ||||||||||||
| Hypothetical |
1,000.00 | 1,018.85 | 6.34 | 1.25 | ||||||||||||
| Class C |
||||||||||||||||
| Actual |
1,000.00 | 941.60 | 8.54 | 1.75 | ||||||||||||
| Hypothetical |
1,000.00 | 1,016.34 | 8.87 | 1.75 | ||||||||||||
| Class R2 |
||||||||||||||||
| Actual |
1,000.00 | 942.80 | 7.33 | 1.50 | ||||||||||||
| Hypothetical |
1,000.00 | 1,017.60 | 7.61 | 1.50 | ||||||||||||
| DECEMBER 31, 2015 | J.P. MORGAN MID CAP/MULTI-CAP FUNDS | 77 | ||||||
Table of Contents
SCHEDULE OF SHAREHOLDER EXPENSES
(Unaudited) (continued)
Hypothetical $1,000 Investment
| Beginning Account Value July 1, 2015 |
Ending Account Value December 31, 2015 |
Expenses Paid During the Period* |
Annualized Expense Ratio |
|||||||||||||
| Mid Cap Equity Fund (continued) |
||||||||||||||||
| Class R5 |
||||||||||||||||
| Actual |
$ | 1,000.00 | $ | 946.10 | $ | 3.91 | 0.80 | % | ||||||||
| Hypothetical |
1,000.00 | 1,021.11 | 4.06 | 0.80 | ||||||||||||
| Class R6 |
||||||||||||||||
| Actual |
1,000.00 | 946.50 | 3.67 | 0.75 | ||||||||||||
| Hypothetical |
1,000.00 | 1,021.37 | 3.81 | 0.75 | ||||||||||||
| Select Class |
||||||||||||||||
| Actual |
1,000.00 | 945.70 | 4.40 | 0.90 | ||||||||||||
| Hypothetical |
1,000.00 | 1,020.61 | 4.57 | 0.90 | ||||||||||||
| Mid Cap Growth Fund |
||||||||||||||||
| Class A |
||||||||||||||||
| Actual |
1,000.00 | 930.10 | 6.02 | 1.24 | ||||||||||||
| Hypothetical |
1,000.00 | 1,018.90 | 6.29 | 1.24 | ||||||||||||
| Class C |
||||||||||||||||
| Actual |
1,000.00 | 927.70 | 8.43 | 1.74 | ||||||||||||
| Hypothetical |
1,000.00 | 1,016.39 | 8.82 | 1.74 | ||||||||||||
| Class R2 |
||||||||||||||||
| Actual |
1,000.00 | 929.60 | 6.79 | 1.40 | ||||||||||||
| Hypothetical |
1,000.00 | 1,018.10 | 7.10 | 1.40 | ||||||||||||
| Class R5 |
||||||||||||||||
| Actual |
1,000.00 | 932.30 | 3.84 | 0.79 | ||||||||||||
| Hypothetical |
1,000.00 | 1,021.17 | 4.01 | 0.79 | ||||||||||||
| Class R6 |
||||||||||||||||
| Actual |
1,000.00 | 932.40 | 3.59 | 0.74 | ||||||||||||
| Hypothetical |
1,000.00 | 1,021.42 | 3.76 | 0.74 | ||||||||||||
| Select Class |
||||||||||||||||
| Actual |
1,000.00 | 931.50 | 4.52 | 0.93 | ||||||||||||
| Hypothetical |
1,000.00 | 1,020.46 | 4.72 | 0.93 | ||||||||||||
| Mid Cap Value Fund |
||||||||||||||||
| Class A |
||||||||||||||||
| Actual |
1,000.00 | 958.40 | 6.10 | 1.24 | ||||||||||||
| Hypothetical |
1,000.00 | 1,018.90 | 6.29 | 1.24 | ||||||||||||
| Class C |
||||||||||||||||
| Actual |
1,000.00 | 955.90 | 8.60 | 1.75 | ||||||||||||
| Hypothetical |
1,000.00 | 1,016.34 | 8.87 | 1.75 | ||||||||||||
| Class R2 |
||||||||||||||||
| Actual |
1,000.00 | 957.20 | 7.38 | 1.50 | ||||||||||||
| Hypothetical |
1,000.00 | 1,017.60 | 7.61 | 1.50 | ||||||||||||
| Institutional Class |
||||||||||||||||
| Actual |
1,000.00 | 960.70 | 3.70 | 0.75 | ||||||||||||
| Hypothetical |
1,000.00 | 1,021.37 | 3.81 | 0.75 | ||||||||||||
| Select Class |
||||||||||||||||
| Actual |
1,000.00 | 959.80 | 4.88 | 0.99 | ||||||||||||
| Hypothetical |
1,000.00 | 1,020.16 | 5.03 | 0.99 | ||||||||||||
| Multi-Cap Market Neutral Fund |
||||||||||||||||
| Class A |
||||||||||||||||
| Actual |
1,000.00 | 1,033.40 | 13.65 | 2.67 | ||||||||||||
| Hypothetical |
1,000.00 | 1,011.71 | 13.50 | 2.67 | ||||||||||||
| Class C |
||||||||||||||||
| Actual |
1,000.00 | 1,031.10 | 16.18 | 3.17 | ||||||||||||
| Hypothetical |
1,000.00 | 1,009.20 | 16.01 | 3.17 | ||||||||||||
| Select Class |
||||||||||||||||
| Actual |
1,000.00 | 1,034.80 | 12.33 | 2.41 | ||||||||||||
| Hypothetical |
1,000.00 | 1,013.02 | 12.19 | 2.41 | ||||||||||||
| 78 | J.P. MORGAN MID CAP/MULTI-CAP FUNDS | DECEMBER 31, 2015 | ||||
Table of Contents
| Beginning Account Value July 1, 2015 |
Ending Account Value December 31, 2015 |
Expenses Paid During the Period* |
Annualized Expense Ratio |
|||||||||||||
| Multi-Cap Market Neutral Fund (continued) |
||||||||||||||||
| Value Advantage Fund |
||||||||||||||||
| Class A |
||||||||||||||||
| Actual |
$ | 1,000.00 | $ | 947.60 | $ | 6.07 | 1.24 | % | ||||||||
| Hypothetical |
1,000.00 | 1,018.90 | 6.29 | 1.24 | ||||||||||||
| Class C |
||||||||||||||||
| Actual |
1,000.00 | 945.10 | 8.51 | 1.74 | ||||||||||||
| Hypothetical |
1,000.00 | 1,016.39 | 8.82 | 1.74 | ||||||||||||
| Institutional Class |
||||||||||||||||
| Actual |
1,000.00 | 949.60 | 3.63 | 0.74 | ||||||||||||
| Hypothetical |
1,000.00 | 1,021.42 | 3.76 | 0.74 | ||||||||||||
| Select Class |
||||||||||||||||
| Actual |
1,000.00 | 948.70 | 4.85 | 0.99 | ||||||||||||
| Hypothetical |
1,000.00 | 1,020.16 | 5.03 | 0.99 | ||||||||||||
| * | Expenses are equal to each Class’ respective annualized expense ratio, multiplied by the average account value over the period, multiplied by 184/366 (to reflect the one-half year period). |
| DECEMBER 31, 2015 | J.P. MORGAN MID CAP/MULTI-CAP FUNDS | 79 | ||||||
Table of Contents
BOARD APPROVAL OF INVESTMENT ADVISORY AGREEMENTS
(Unaudited)
| 80 | J.P. MORGAN MID CAP/MULTI-CAP FUNDS | DECEMBER 31, 2015 | ||||
Table of Contents
| DECEMBER 31, 2015 | J.P. MORGAN MID CAP/MULTI-CAP FUNDS | 81 | ||||||
Table of Contents
BOARD APPROVAL OF INVESTMENT ADVISORY AGREEMENTS
(Unaudited) (continued)
| 82 | J.P. MORGAN MID CAP/MULTI-CAP FUNDS | DECEMBER 31, 2015 | ||||
Table of Contents
| DECEMBER 31, 2015 | J.P. MORGAN MID CAP/MULTI-CAP FUNDS | 83 | ||||||
Table of Contents
J.P. Morgan Funds are distributed by JPMorgan Distribution Services, Inc., which is an affiliate of JPMorgan Chase & Co. Affiliates of JPMorgan Chase & Co. receive fees for providing various services to the funds.
Contact JPMorgan Distribution Services, Inc. at 1-800-480-4111 for a fund prospectus. You can also visit us at www.jpmorganfunds.com. Investors should carefully consider the investment objectives and risk as well as charges and expenses of the mutual fund before investing. The prospectus contains this and other information about the mutual fund. Read the prospectus carefully before investing.
Investors may obtain information about the Securities Investor Protection Corporation (SIPC), including the SIPC brochure by visiting www.sipc.org or by calling SIPC at 202-371-8300.
Each Fund files a complete schedule of its fund holdings for the first and third quarters of its fiscal year with the SEC on Form N-Q. The Funds’ Forms N-Q are available on the SEC’s website at http://www.sec.gov and may be reviewed and copied at the SEC’s Public Reference Room in Washington, DC. Information on the operation of the SEC’s Public Reference Room may be obtained by calling 1-800-SEC-0330. Shareholders may request the Form N-Q without charge by calling 1-800-480-4111 or by visiting the J.P. Morgan Funds’ website at www.jpmorganfunds.com.
A description of each Fund’s policies and procedures with respect to the disclosure of each Fund’s holdings is available in the prospectus and Statement of Additional Information.
A copy of proxy policies and procedures is available without charge upon request by calling 1-800-480-4111 and on the Funds’ website at www.jpmorganfunds.com. A description of such policies and procedures is on the SEC’s website at www.sec.gov. The Trustees have delegated the authority to vote proxies for securities owned by the Funds to the Adviser. A copy of the Funds’ voting record for the most recent 12-month period ended June 30 is available on the SEC’s website at www.sec.gov or at the Funds’ website at www.jpmorganfunds.com no later than August 31 of each year. The Funds’ proxy voting record will include, among other things, a brief description of the matter voted on for each fund security, and will state how each vote was cast, for example, for or against the proposal.

Table of Contents

J.P. Morgan Asset Management is the marketing name for the asset management business of JPMorgan Chase & Co. Those businesses include, but are not limited to, J.P. Morgan Investment Management Inc., Security Capital Research & Management Incorporated and J.P. Morgan Alternative Asset Management, Inc.
| © JPMorgan Chase & Co., 2016. All rights reserved. December 2015. | SAN-MC-1215 |
Table of Contents
| ITEM 2. | CODE OF ETHICS. |
Disclose whether, as of the end of the period covered by the report, the registrant has adopted a code of ethics that applies to the registrant’s principal executive officer, principal financial officer, principal accounting officer or controller, or persons performing similar functions, regardless of whether these individuals are employed by the registrant or a third party. If the registrant has not adopted such a code of ethics, explain why it has not done so.
The registrant must briefly describe the nature of any amendment, during the period covered by the report, to a provision of its code of ethics that applies to the registrant’s principal executive officer, principal financial officer, principal accounting officer or controller, or persons performing similar functions, regardless of whether these individuals are employed by the registrant or a third party, and that relates to any element of the code of ethics definition enumerated in paragraph (b) of this Item. The registrant must file a copy of any such amendment as an exhibit pursuant to Item 12(a)(1), unless the registrant has elected to satisfy paragraph (f) of this Item by positing its code of ethics on its website pursuant to paragraph (f)(2) of this Item, or by undertaking to provide its code of ethics to any person without charge, upon request, pursuant to paragraph (f)(3) of this Item.
If the registrant has, during the period covered by the report, granted a waiver, including an implicit waiver, from a provision of the code of ethics that applies to the registrant’s principal executive officer, principal financial officer, principal accounting officer or controller, or persons performing similar functions, regardless of whether these individuals are employed by the registrant or third party, that relates to one or more items set forth in paragraph (b) of this Item, the registrant must briefly describe the nature of the waiver, the name of the person to whom the waiver was granted, and the date of the waiver.
Not applicable to a semiannual report.
| ITEM 3. | AUDIT COMMITTEE FINANCIAL EXPERT. |
(a) (1) Disclose that the registrant’s board of directors has determined that the registrant either:
(i) Has at least one audit committee financial expert serving on its audit committee; or
(ii) Does not have an audit committee financial expert serving on its audit committee.
(2) If the registrant provides the disclosure required by paragraph (a)(1)(i) of this Item, it must disclose the name of the audit committee financial expert and whether that person is “independent.” In order to be considered “independent” for purposes of this Item, a member of an audit committee may not, other than in his or her capacity as a member of the audit committee, the board of directors, or any other board committee:
(i) Accept directly or indirectly any consulting, advisory, or other compensatory fee from the issuer; or
(ii) Be an “interested person” of the investment company as defined in Section 2(a)(19) of the Act (15 U.S.C. 80a-2(a)(19)).
(3) If the registrant provides the disclosure required by paragraph (a)(1)(ii) of this Item, it must explain why it does not have an audit committee financial expert.
Not applicable to a semiannual report.
Table of Contents
| ITEM 4. | PRINCIPAL ACCOUNTANT FEES AND SERVICES. |
(a) Disclose, under the caption Audit Fees, the aggregate fees billed for each of the last two fiscal years for professional
services rendered by the principal accountant for the audit of the registrant’s annual financial statements or services that are normally provided by the accountant in connection with statutory and regulatory filings or engagements for those fiscal years.
(b) Disclose, under the caption Audit-Related Fees, the aggregate fees billed in each of the last two fiscal years for assurance and related services by the principal accountant that are reasonably related to the performance of the audit of the registrant’s financial statements and are not reported under paragraph (a) of this Item. Registrants shall describe the nature of the services comprising the fees disclosed under this category.
(c) Disclose, under the caption Tax Fees, the aggregate fees billed in each of the last two fiscal years for professional services rendered by the principal accountant for tax compliance, tax advice, and tax planning. Registrants shall describe the nature of the services comprising the fees disclosed under this category.
(d) Disclose, under the caption All Other Fees, the aggregate fees billed in each of the last two fiscal years for products and services provided by the principal accountant, other than the services reported in paragraphs (a) through (c) of this Item. Registrants shall describe the nature of the services comprising the fees disclosed under this category.
(e) (1) Disclose the audit committee’s pre-approval policies and procedures described in paragraph (c)(7) of Rule 2-01 of Regulation S-X.
(2) Disclose the percentage of services described in each of paragraphs (b) through (d) of this Item that were approved by the audit committee pursuant to paragraph (c)(7)(i)(C) of Rule 2-01 of Regulation S-X.
(f) If greater than 50 percent, disclose the percentage of hours expended on the principal accountant’s engagement to audit the registrant’s financial statements for the most recent fiscal year that were attributed to work performed by persons other than the principal accountant’s full-time, permanent employees.
(g) Disclose the aggregate non-audit fees billed by the registrant’s accountant for services rendered to the registrant, and rendered to the registrant’s investment adviser (not including any sub-adviser whose role is primarily portfolio management and is subcontracted with or overseen by another investment adviser), and any entity controlling, controlled by, or under common control with the adviser that provides ongoing services to the registrant for each of the last two fiscal years of the registrant.
(h) Disclose whether the registrant’s audit committee of the board of directors has considered whether the provision of non-audit services that were rendered to the registrant’s investment adviser (not including any subadviser whose role is primarily portfolio management and is subcontracted with or overseen by another investment adviser), and any entity controlling, controlled by, or under common control with the investment adviser that provides ongoing services to the registrant that were not pre-approved pursuant to paragraph (c)(7)(ii) of Rule 2-01 of Regulation S-X is compatible with maintaining the principal accountant’s independence.
Not applicable to a semiannual report.
| ITEM 5. | AUDIT COMMITTEE OF LISTED REGISTRANTS. |
(a) If the registrant is a listed issuer as defined in Rule 10A-3 under the Exchange Act (17CFR 240.10A-3), state whether or not the registrant has a separately-designated standing audit committee established in accordance with Section 3(a)(58)(A) of the Exchange Act (15 U.S.C. 78c(a)(58)(A)). If the registrant has such a committee, however designated, identify each committee member. If the entire board of directors is acting as the registrant’s audit committee as specified in Section 3(a)(58)(B) of the Exchange Act (15 U.S.C. 78c(a)(58)(B)), so state.
Table of Contents
(b) If applicable, provide the disclosure required by Rule 10A-3(d) under the Exchange Act (17CFR 240.10A-3(d)) regarding an exemption from the listing standards for all audit committees.
Not applicable to a semiannual report.
| ITEM 6. | SCHEDULE OF INVESTMENTS. |
File Schedule I – Investments in securities of unaffiliated issuers as of the close of the reporting period as set forth in Section 210.12-12 of Regulation S-X, unless the schedule is included as part of the report to shareholders filed under Item 1 of this Form.
Included in Item 1.
| ITEM 7. | DISCLOSURE OF PROXY VOTING POLICIES AND PROCEDURES FOR CLOSED-END MANAGEMENT INVESTMENT COMPANIES. |
A closed-end management investment company that is filing an annual report on this Form N-CSR must, unless it invests exclusively in non-voting securities, describe the policies and procedures that it uses to determine how to vote proxies relating to portfolio securities, including the procedures that the company uses when a vote presents a conflict between the interests of its shareholders, on the one hand, and those of the company’s investment adviser; principal underwriter; or any affiliated person (as defined in Section 2(a)(3) of the Investment Company Act of 1940 (15 U.S.C. 80a-2(a)(3)) and the rules thereunder) of the company, its investment adviser, or its principal underwriter, on the other. Include any policies and procedures of the company’s investment adviser, or any other third party, that the company uses, or that are used on the company’s behalf, to determine how to vote proxies relating to portfolio securities.
Not applicable.
| ITEM 8. | PORTFOLIO MANAGERS OF CLOSED-END MANAGEMENT INVESTMENT COMPANIES. |
Not applicable.
| ITEM 9. | PURCHASE OF EQUITY SECURITIES BY CLOSED-END MANAGEMENT INVESTMENT COMPANY AND AFFILIATED PURCHASERS. |
(a) If the registrant is a closed-end management investment company, provide the information specified in paragraph (b) of this Item with respect to any purchase made by or on behalf of the registrant or any “affiliated purchaser,” as defined in Rule 10b-18(a)(3) under the Exchange Act (17 CFR 240.10b-18(a)(3)), of shares or other units of any class of the registrant’s equity securities that is registered by the registrant pursuant to Section 12 of the Exchange Act (15 U.S.C. 781).
Not applicable.
| ITEM 10. | SUBMISSION OF MATTERS TO A VOTE OF SECURITY HOLDERS. |
Describe any material changes to the procedures by which shareholders may recommend nominees to the registrant’s board of directors, where those changes were implemented after the registrant last provided disclosure in response to the requirements of Item 7(d)(2)(ii)(G) of Schedule 14A (17 CFR 240.14a-101), or this Item.
No material changes to report.
| ITEM 11. | CONTROLS AND PROCEDURES. |
(a) Disclose the conclusions of the registrant’s principal executive and principal financial officers, or persons performing similar functions, regarding the effectiveness of the registrant’s disclosure controls and procedures (as defined in Rule 30a-3(c) under the Act (17 CFR 270.30a-3(c))) as of a date within 90 days of the filing date of the report that includes the disclosure required by this paragraph, based on the evaluation of these controls and procedures required by Rule 30a-3(b) under the Act (17 CFR 270.30a-3(b)) and Rules 13a-15(b) or 15d-15(b) under the Exchange Act (17 CFR 240.13a-15(b) or 240.15d-15(b)).
Table of Contents
The Registrant’s principal executive and principal financial officers have concluded, based on their evaluation of the Registrant’s disclosure controls and procedures as of a date within 90 days of the filing date of this report, that the Registrant’s disclosure controls and procedures are reasonably designed to ensure that information required to be disclosed by the Registrant on Form N-CSR is recorded, processed, summarized and reported within the required time periods and that information required to be disclosed by the Registrant in the reports that it files or submits on Form N-CSR is accumulated and communicated to the Registrant’s management, including its principal executive and principal financial officers, as appropriate to allow timely decisions regarding required disclosure.
(b) Disclose any change in the registrant’s internal control over financial reporting (as defined in Rule 30a-3(d) under the Act (17 CFR 270.30a-3(d)) that occurred during the registrant’s second fiscal quarter of the period covered by this report that has materially affected, or is reasonably likely to materially affect, the registrant’s internal control over financial reporting.
There were no changes in the Registrant’s internal control over financial reporting that occurred during the last fiscal quarter covered by this report that have materially affected, or are reasonably likely to materially affect, the Registrant’s internal control over financial reporting.
| ITEM 12. | EXHIBITS. |
(a) File the exhibits listed below as part of this Form. Letter or number the exhibits in the sequence indicated.
(a)(1) Any code of ethics, or amendment thereto, that is the subject of the disclosure required by Item 2, to the extent that the registrant intends to satisfy the Item 2 requirements through filing of an exhibit.
Not applicable.
(a)(2) A separate certification for each principal executive officer and principal financial officer of the registrant as required by Rule 30a-2(a) under the Act (17 CFR 270.30a-2).
Certifications pursuant to Rule 30a-2(a) under the Investment Company Act of 1940 are attached hereto.
(a)(3) Any written solicitation to purchase securities under Rule 23c-1 under the Act (17 CFR 270.23c-1) sent or given during the period covered by the report by or on behalf of the registrant to 10 or more persons.
Not applicable.
(b) A separate or combined certification for each principal executive officer and principal officer of the registrant as required by Rule 30a-2(b) under the Act of 1940.
Certifications pursuant to Rule 30a-2(b) under the Investment Company Act of 1940 are attached hereto.
Table of Contents
SIGNATURES
Pursuant to the requirements of the Securities Exchange Act of 1934 and the Investment Company Act of 1940, the registrant has duly caused this report to be signed on its behalf by the undersigned, thereunto duly authorized.
J.P. Morgan Mutual Fund Investment Trust
| By: | /s/ Robert L. Young | |
| Robert L. Young President and Principal Executive Officer March 4, 2016 | ||
Pursuant to the requirements of the Securities Exchange Act of 1934 and the Investment Company Act of 1940, this report has been signed below by the following persons on behalf of the registrant and in the capacities and on the dates indicated.
| By: | /s/ Robert L. Young | |
| Robert L. Young President and Principal Executive Officer March 4, 2016 | ||
| By: | /s/ Laura M. Del Prato | |
| Laura M. Del Prato Treasurer and Principal Financial Officer March 4, 2016 | ||