U.S. SECURITIES AND EXCHANGE COMMISSION
Washington, D.C. 20549
FORM 40-F
¨ Registration statement pursuant to Section 12 of the Securities Exchange Act of 1934
or
x Annual report pursuant to Section 13(a) or 15(d) of the Securities Exchange Act of 1934
For the fiscal year ended December 31, 2018 | Commission File Number 001-31722 |
New Gold Inc.
(Exact name of Registrant as specified in its charter)
British Columbia (Province or other jurisdiction of incorporation or organization) |
1000 (Primary Standard Industrial Classification Code Number) |
Not Applicable (I.R.S. Employer Identification Number) |
Suite 3510 Brookfield Place, 181 Bay Street
Toronto, Ontario, Canada M5J 2T3
(416) 324-6000
(Address and telephone number of Registrant’s principal executive offices)
CT Corporation System 28 Liberty Street, New York, NY 10005 (212) 894-8940 |
Securities registered pursuant to Section 12(b) of the Act:
Title of Each Class: | Name of Each Exchange On Which Registered: |
Common Shares, no par value | NYSE American |
Securities registered pursuant to Section 12(g) of the Act: None
Securities for which there is a reporting obligation pursuant to Section 15(d) of the Act: None
For annual reports, indicate by check mark the information filed with this form:
x Annual Information Form ¨ Audited Annual Financial Statements
Indicate the number of outstanding shares of each of the issuer’s classes of capital or common stock as of the close of the period covered by the annual report:
At December 31, 2018, the Registrant had outstanding 579,115,291 common shares without par value.
Indicate by check mark whether the Registrant: (1) has filed all reports required to be filed by Section 13 or 15(d) of the Exchange Act during the preceding 12 months (or for such shorter period that the Registrant was required to file such reports); and (2) has been subject to such filing requirements for the past 90 days. x Yes ¨ No
Indicate by check mark whether the registrant has submitted electronically every Interactive Data File required to be submitted pursuant to Rule 405 of Regulation S-T (§232.405 of this chapter) during the preceding 12 months (or for such shorter period that the Registrant was required to submit such files). x Yes ¨ No
Indicate by check mark
whether the registrant is an emerging growth company as defined in Rule 12b-2 of the Exchange Act.
Emerging
growth company ¨
If
an emerging growth company that prepares its financial statements in accordance with U.S. GAAP, indicate by check mark if the
registrant has elected not to use the extended transition period for complying with any new or revised financial accounting standards
provided pursuant to Section 13(a) of the Exchange Act. ¨
DOCUMENTS INCORPORATED BY REFERENCE
The Annual Information Form (“AIF”) of New Gold Inc. (the “Registrant”, “New Gold” or the “Company”) for the fiscal year ended December 31, 2018 is filed as Exhibit 1 to this annual report on Form 40-F.
The audited consolidated financial statements of the Company for the years ended December 31, 2018 and 2017, including the related report of independent registered public accounting firm, are filed as Exhibit 2 to this annual report on Form 40-F.
The Company’s management’s discussion and analysis (“MD&A”) for the year ended December 31, 2018 is filed as Exhibit 3 to this annual report on Form 40-F.
EXPLANATORY NOTE
The Company is a Canadian issuer eligible to file its annual report pursuant to Section 13 of the Securities Exchange Act of 1934, as amended (the “Exchange Act”), on Form 40-F. The Company is a “foreign private issuer” as defined in Rule 3b-4 under the Exchange Act. Accordingly, the Company’s equity securities are exempt from Sections 14(a), 14(b), 14(c), 14(f) and 16 of the Exchange Act pursuant to Rule 3a12-3 under the Exchange Act.
The Company is permitted, under a multi-jurisdictional disclosure system adopted by the United States, to prepare the documents incorporated by reference in this annual report on Form 40-F in accordance with Canadian disclosure requirements, which are different from those of the United States.
Information concerning the properties and operations of New Gold has been prepared in accordance with Canadian standards under applicable Canadian securities laws and may not be comparable to similar information for United States companies. The terms “Mineral Reserve”, “proven Mineral Reserve” and “probable Mineral Reserve” are Canadian mining terms defined in accordance with Canadian National Instrument 43-101 — Standards of Disclosure for Mineral Projects (“NI 43-101”) and the Canadian Institute of Mining, Metallurgy and Petroleum (the “CIM”) — CIM Definition Standards on Mineral Resources and Mineral Reserves, adopted by the CIM Council, as amended. These definitions differ from the definitions in Industry Guide 7 (“SEC Industry Guide 7”) under the U.S. Securities Act of 1933, as amended (the “U.S. Securities Act”). Under SEC Industry Guide 7 standards, mineralization may not be classified as a “reserve” unless the determination has been made that the mineralization could be economically and legally produced or extracted at the time the reserve determination is made. Also, under SEC Industry Guide 7 standards, a “final” or “bankable” feasibility study is required to report reserves, the three-year historical average price is used in any reserve or cash flow analysis to designate reserves and the primary environmental analysis or report must be filed with the appropriate governmental authority.
In addition, the terms “Mineral Resource”, “measured Mineral Resource”, “indicated Mineral Resource” and “inferred Mineral Resource” are defined in and required to be disclosed by NI 43-101; however, these terms are not defined terms under SEC Industry Guide 7 and are normally not permitted to be used in reports and registration statements filed with the United States Securities and Exchange Commission (the “SEC”). Investors are cautioned not to assume that any part or all of the mineral deposits in these categories will ever be converted into reserves. “Inferred Mineral Resources” have a great amount of uncertainty as to their existence and as to their economic and legal feasibility. It cannot be assumed that all or any part of an inferred Mineral Resource will ever be upgraded to a higher category. Under Canadian rules, estimates of inferred Mineral Resources may not form the basis of feasibility or pre-feasibility studies, except in rare cases. Investors are cautioned not to assume that all or any part of an inferred Mineral Resource exists or is economically or legally mineable. Mineral resources that are not mineral reserves do not have demonstrated economic viability. Disclosure of “contained ounces” in a resource is permitted disclosure under Canadian regulations; however, the SEC Industry Guide 7 normally only permits issuers to report mineralization that does not constitute “reserves” by SEC Industry Guide 7 standards as in place tonnage and grade without reference to unit measures.
Accordingly, information contained in this annual report on Form 40-F describes the Company’s mineral deposits may not be comparable to similar information made public by United States companies subject to reporting and disclosure requirements under United States federal securities laws and the rules and regulations thereunder.
Unless otherwise indicated, all dollar amounts are reported in U.S. dollars.
FORWARD LOOKING STATEMENTS
Certain information contained in this annual report on Form 40-F, including any information relating to New Gold’s future financial or operating performance are “forward looking”. All statements in this annual report on Form 40-F, other than statements of historical fact, which address events, results, outcomes or developments that New Gold expects to occur are “forward-looking statements” within the meaning of the U.S. Private Securities Litigation Reform Act of 1995 and applicable Canadian Securities laws. Forward-looking statements are statements that are not historical facts and are generally, but not always, identified by the use of forward-looking terminology such as “plans”, “expects”, “is expected”, “budget”, “scheduled”, “targeted”, “estimates”, “forecasts”, “intends”, “anticipates”, “projects”, “potential”, “believes” or variations of such words and phrases or statements that certain actions, events or results “may”, “could”, “would”, “should”, “might” or “will be taken”, “occur” or “be achieved” or the negative connotation of such terms. Forward-looking statements in this annual report on Form 40-F include those under the headings “General Developments of the Business”, “Description of the Business” and “Mineral Properties” and include, among others, statements with respect to: guidance for production, operating expenses per gold ounce sold, total cash costs, all-in sustaining costs and capital costs, and the factors contributing to those expected results, as well as expected capital expenditures; mine life; Mineral Reserve and Mineral Resource estimates; grades expected to be mined at the Company’s operations; the expected production, costs, economics and operating parameters of Blackwater and New Afton C-zone; planned activities for 2019 and beyond at the Company’s operations and projects, as well as planned exploration activities; and targeted timing for permits.
All forward-looking statements in this annual report on Form 40-F are based on the opinions and estimates of management as of the date such statements are made and are subject to important risk factors and uncertainties, many of which are beyond New Gold’s ability to control or predict. Certain material assumptions regarding such forward-looking statements are discussed in this annual report on Form 40-F, New Gold’s latest annual MD&A, AIF and its Technical Reports filed on SEDAR at www.sedar.com and at www.sec.gov. In addition to, and subject to, such assumptions discussed in more detail elsewhere, the forward-looking statements in this annual report on Form 40-F are also subject to the following assumptions: (1) there being no significant disruptions affecting New Gold’s operations; (2) political and legal developments in jurisdictions where New Gold operates, or may in the future operate, being consistent with New Gold’s current expectations; (3) the accuracy of New Gold’s current Mineral Reserve and Mineral Resource estimates; (4) the exchange rate between the Canadian dollar, U.S. dollar and, to a lesser extent, the Mexican peso being approximately consistent with current levels; (5) prices for diesel, natural gas, fuel oil, electricity and other key supplies being approximately consistent with current levels; (6) equipment, labour and material costs increasing on a basis consistent with New Gold’s current expectations; (7) arrangements with First Nations and other indigenous groups in respect of Rainy River and Blackwater being consistent with New Gold’s current expectations; (8) all required permits, licenses and authorizations being obtained from the relevant governments and other relevant stakeholders within the expected timelines; (9) the results of the feasibility studies for the New Afton C-zone and Blackwater being realized; (10) and in the case of production, cost and expenditure outlooks at operating mines for 2019, commodity prices and exchange rates being consistent with those estimated for the purposes of 2019 guidance.
Forward-looking statements are necessarily based on estimates and assumptions that are inherently subject to known and unknown risks, uncertainties and other factors that may cause actual results, level of activity, performance or achievements to be materially different from those expressed or implied by such forward-looking statements. Such factors include, without limitation: significant capital requirements and the availability and management of capital resources; additional funding requirements; price volatility in the spot and forward markets for metals and other commodities; fluctuations in the international currency markets and in the rates of exchange of the currencies of Canada, the United States and, to a lesser extent, Mexico; discrepancies between actual and estimated production, between actual and estimated Mineral Reserves and Mineral Resources and between actual and estimated metallurgical recoveries; changes in national and local government legislation in the countries in which New Gold does or may in the future carry on business; taxation; controls, regulations and political or economic developments in the countries in which New Gold does or may in the future carry on business; the speculative nature of mineral exploration and development, including the risks of obtaining and maintaining the validity and enforceability of the necessary licenses and permits and complying with the permitting requirements of each jurisdiction in which New Gold operates, including, but not limited to: in Canada, obtaining the necessary permits for the New Afton C-zone and Blackwater Projects; the uncertainties inherent to current and future legal challenges to which New Gold is or may become a party; diminishing quantities or grades of Mineral Reserves and Mineral Resources; competition; loss of key employees; rising costs of labour, supplies, fuel and equipment; actual results of current exploration or reclamation activities; uncertainties inherent to mining economic studies including the feasibility studies for the New Afton C-zone and Blackwater Projects; the uncertainty with respect to prevailing market conditions necessary for a positive development or construction decision for the Blackwater Project; changes in project parameters as plans continue to be refined; accidents; labour disputes; defective title to mineral claims or property or contests over claims to mineral properties; unexpected delays and costs inherent to consulting and accommodating rights of First Nations and other indigenous groups; uncertainties and unanticipated delays associated with obtaining and maintaining necessary licenses, permits and authorizations, complying with permitting requirements, and receiving the environmental assessment approval for the Blackwater Project. In addition, there are risks and hazards associated with the business of mineral exploration, development and mining, including environmental events and hazards, industrial accidents, unusual or unexpected formations, pressures, cave-ins, flooding and gold bullion losses (and, in each case, the risk of inadequate insurance or inability to obtain insurance to cover these risks) as well as “Risk Factors” included or incorporated in this annual report on Form 40-F. Forward-looking statements are not guarantees of future performance, and actual results and future events could materially differ from those anticipated in such statements. All the forward-looking statements included or incorporated in this annual report on Form 40-F are qualified by these cautionary statements. New Gold expressly disclaims any intention or obligation to update or revise any forward-looking statements whether as a result of new information, events or otherwise, except in accordance with applicable securities laws.
DISCLOSURE CONTROLS AND PROCEDURES
The Company’s President and Chief Executive Officer and Chief Financial Officer have evaluated the effectiveness of the Company’s disclosure controls and procedures (as defined in Rules 13a-15(e) and 15d-15(e) under the Exchange Act) as of December 31, 2018. Based on the evaluation, the Chief Executive Officer and Chief Financial Officer concluded that, as of December 31, 2018 the Company’s disclosure controls and procedures were effective to provide assurance that the information required to be disclosed by the Company in reports it files or submits under the Exchange Act, is recorded, processed, summarized and reported on a timely basis in accordance with applicable time periods specified by the Commission rules and forms and to ensure that information required to be disclosed by the Company in reports that it files or submits under the Exchange Act is accumulated and communicated to the Company’s management, including its principal executive and financial officers, or persons performing similar functions, as appropriate, to allow timely decisions regarding required disclosure.
MANAGEMENT’S REPORT ON INTERNAL CONTROL OVER FINANCIAL REPORTING
The Company’s management, including the President and Chief Executive Officer and the Chief Financial Officer, is responsible for establishing and maintaining adequate internal control over financial reporting. Internal control over financial reporting is defined in Rule 13a-15(f) and Rule 15d-15(f) promulgated under the Exchange Act as a process designed by, or under the supervision of, a company’s principal executive and principal financial officers and effected by the company’s board of directors, management and other personnel, to provide reasonable assurance regarding the reliability of financial reporting and the preparation of financial statements for external purposes in accordance with generally accepted accounting principles. The Company’s internal control over financial reporting includes those policies and procedures that:
· | pertain to the maintenance of records that, in reasonable detail, accurately and fairly reflect the transactions and dispositions of the assets of the Company; |
· | provide reasonable assurance that transactions are recorded as necessary to permit preparation of financial statements in accordance with generally accepted accounting principles, and that receipts and expenditures of the Company are being made only in accordance with authorizations of management and directors of the Company; and |
· | provide reasonable assurance regarding prevention or timely detection of unauthorized acquisition, use or disposition of the Company’s assets that could have a material effect on the financial statements. |
The Company’s management, under the supervision of the President and Chief Executive Officer and the Chief Financial Officer, assessed the effectiveness of the Company’s internal control over financial reporting as defined in Rule 13a-15(f) and Rule 15d-15(f) under the Exchange Act as of December 31, 2018. In making this assessment, it used the criteria set forth in the Internal Control – Integrated Framework (2013) issued by the Committee of Sponsoring Organizations of the Treadway Commission (COSO). Based on this assessment, management has concluded that, as of December 31, 2018, the Company’s internal control over financial reporting is effective based on those criteria. There are no material weaknesses that have been identified by management.
The effectiveness of the Company’s internal control over financial reporting as of December 31, 2018 has been audited by Deloitte LLP, the Company’s independent registered public accounting firm. As stated in their report immediately preceding the Company’s audited consolidated financial statements for the years ended December 31, 2018 and 2017, filed as Exhibit 2 to this annual report on Form 40-F, Deloitte LLP expressed an unqualified opinion on the effectiveness of the Company’s internal control over financial reporting.
ATTESTATION REPORT OF THE REGISTERED PUBLIC ACCOUNTING FIRM
The report immediately precedes the Company’s audited consolidated financial statements for the years ended December 31, 2018 and 2017, which are filed as Exhibit 2 to this annual report on Form 40-F.
CHANGES IN INTERNAL CONTROL OVER FINANCIAL REPORTING
During the fiscal year ended December 31, 2018, there were no changes in the Company’s internal control over financial reporting that have materially affected, or are reasonably likely to materially affect, the Company’s internal control over financial reporting.
LIMITATIONS ON DISCLOSURE CONTROLS AND PROCEDURES AND INTERNAL CONTROL OVER FINANCIAL REPORTING
The Company’s management, including the President and Chief Executive Officer and the Chief Financial Officer, believe that any disclosure controls and procedures or internal control over financial reporting, no matter how well conceived and operated, can provide only reasonable, not absolute, assurance that the objectives of the control system are met. Further, the design of a control system must reflect the fact that there are resource constraints, and the benefits of controls must be considered relative to their costs. Because of the inherent limitations in all control systems, they cannot provide absolute assurance that all control issues and instances of fraud, if any, within the Company have been prevented or detected. These inherent limitations include the realities that judgments in decision making can be faulty and breakdowns can occur because of simple error or mistake. Additionally, controls can be circumvented by the individual acts of some persons, by collusion of two or more people, or by unauthorized override control. The design of any system of controls also is based in part upon certain assumptions about the likelihood of future events, and there can be no assurance that any design will succeed in achieving its stated goals under all potential future conditions. Accordingly, because of the inherent limitations in a cost effective control system, misstatements due to error or fraud may occur and not be detected.
AUDIT COMMITTEE IDENTIFICATION AND FINANCIAL EXPERT
The Company has an Audit Committee established by its board of directors for the purpose of overseeing the accounting and financial reporting processes of the Company and audits of the financial statements of the Company, in accordance with Section 3(a)(58)(A) of the Exchange Act. The members of the Audit Committee are Marilyn Schonberner (Chair), James Gowans and Margaret Mulligan. Each of Ms. Schonberner, Mr. Gowans and Ms. Mulligan is “independent” as that term is defined under the rules of the NYSE American.
The Board has determined that Marilyn Schonberner and Margaret Mulligan are each an “Audit Committee Financial Expert” as that term is defined under Section 407 of the Sarbanes-Oxley Act of 2002 and paragraph (8) of General Instruction B of Form 40-F.
PRINCIPAL ACCOUNTANT FEES AND SERVICES
The information provided under the headings “Pre-Approval Policies and Procedures” page 62 and “External Auditor Service Fees (by category)” page 62 contained in the AIF is incorporated by reference.
CODE OF ETHICS
In connection with a comprehensive review of the Company’s corporate governance policies, on August 13, 2008, the Board of Directors of the Company (the “Board”) approved the adoption of a code of business conduct and ethics (“Code”). The Code has been reviewed and updated annually since its adoption, with the most recent review by the Board on December 7, 2018. The Code is applicable to all directors, officers and employees of the Company, including its President and Chief Executive Officer, Chief Financial Officer and principal accounting officer. The Code was adopted to, among other things, update and clarify the duties, obligations and responsibilities that are imposed upon the persons subject to its provisions. A copy of the amended Code is filed as Exhibit 4 to this annual report on Form 40-F. Additionally, on July 8, 2008, the Board approved the adoption of a Whistleblower Policy (“Whistleblower Policy”). The Whistleblower Policy has been reviewed and ratified or updated annually since its adoption, with the most recent review by the Board on December 7, 2018. The Whistleblower Policy outlines the principles and commitments that the Company has made with respect to the treatment of complaints by its personnel. Copies of the Code and the Whistleblower Policy are available on the Company’s website at www.newgold.com.
There were no waivers of the Code in the past fiscal year.
OFF-BALANCE SHEET ARRANGEMENTS
The Company has no off-balance sheet arrangements that have, or are reasonably likely to have, a current or future material effect on the Company's financial condition, changes in financial condition, revenues or expenses, results of operations, liquidity, capital expenditures or capital resources.
TABULAR DISCLOSURE OF CONTRACTUAL OBLIGATIONS
U.S. dollars in million as of December 31, 2018 |
Payments due by period | ||||
Contractual obligations |
Total | Less than 1 year | 1 - 3 years | 4 - 5 years | After 5 years |
Long-term debt | $ 800 | $ - | $ - | $ 500.0 | $ 300.0 |
Interest payable on long-term debt | $ 242.9 | $ 50.3 | $ 100.8 | $ 65.5 | $ 26.3 |
Finance lease obligations | $ 1.5 | $ 1.0 | $ 0.3 | $ 0.2 | $ - |
Operating lease commitments | $ 18.4 | $ 8.3 | $ 6.3 | $ 3.8 | $ - |
Capital expenditure commitments | $ 27.2 | $ 26.9 | $ 0.2 | $ 0.1 | $ - |
Reclamation and closure cost obligations | $ 116.6 | $ 6.6 | $ 21.8 | $ 9.8 | $ 78.4 |
Gold stream obligation | $ 267.5 | $ 19.2 | $ 43.5 | $ 55.2 | $ 149.6 |
Total contractual obligations | $ 1,474.1 | $ 112.3 | $ 172.9 | $ 634.6 | $ 554.3 |
MINE SAFETY DISCLOSURE
On October 30, 2018 the Company sold the Mesquite mine in southern California, which it indirectly held through its former subsidiary Western Mesquite Mines, Inc., to Equinox Gold Corp. The information concerning mine safety violations and other regulatory matters required by Section 1503(a) of the Dodd-Frank Wall Street Reform and Consumer Protection Act and Item 16 of General Instruction B to Form 40-F- in respect of the Mesquite Mine for the period in which it was owned by the Company is filed as Exhibit 5 to this annual report on Form 40-F.
NYSE AMERICAN CORPORATE GOVERNANCE
The Company’s common shares are listed on the NYSE American. Section 110 of the NYSE American company guide permits NYSE American to consider the laws, customs and practices of foreign issuers in relaxing certain NYSE American listing criteria, and to grant exemptions from NYSE American listing criteria based on these considerations. A company seeking relief under these provisions is required to provide written certification from independent local counsel that the non-complying practice is not prohibited by home country law. A description of the significant ways in which the Company’s governance practices differ from those followed by domestic companies pursuant to NYSE American standards is contained on the Company’s website at www.newgold.com.
UNDERTAKINGS
The Company undertakes to make available, in person or by telephone, representatives to respond to inquiries made by the Commission staff, and to furnish promptly, when requested to do so by the Commission staff, information relating to: the securities registered pursuant to Form 40-F; the securities in relation to which the obligation to file an annual report on Form 40-F arises; or transactions in said securities.
CONSENT TO SERVICE OF PROCESS
The Company has filed with the Commission a written consent to service of process and power of attorney on Form F-X and amendments thereto. Any change to the name or address of the Company’s agent for service shall be communicated promptly to the Commission by amendment to the Form F-X referencing the file number of the Company.
SIGNATURES
Pursuant to the requirements of the Exchange Act, the Registrant certifies that it meets all of the requirements for filing on Form 40-F and has duly caused this annual report to be signed on its behalf by the undersigned, thereto duly authorized.
NEW GOLD INC. | ||
By: | /s/ Robert Chausse | |
Name: | Robert Chausse | |
Title: | Executive Vice President and Chief Financial Officer | |
Date: March 29, 2019 |
EXHIBIT INDEX
The following documents are being filed with the Commission as exhibits to this annual report on Form 40-F.
Exhibit 1
Table of contents
CORPORATE STRUCTURE | 8 |
GENERAL DEVELOPMENT OF THE BUSINESS | 9 |
Developments – Mines and Projects | 9 |
Developments – Financial | 10 |
DESCRIPTION OF THE BUSINESS | 11 |
Specialized Skills and Knowledge | 11 |
Principal Products | 12 |
Competitive Conditions | 12 |
Operations | 12 |
Technical Information | 14 |
Mineral Reserve and Mineral Resource Estimates | 12 |
MINERAL PROPERTIES | 19 |
Rainy River Mine, Canada | 19 |
New Afton Mine, Canada | 25 |
Blackwater Project, Canada | 31 |
Cerro San Pedro Mine, Mexico | 33 |
RISK FACTORS | 34 |
NOTES | 53 |
DIVIDENDS | 53 |
DESCRIPTION OF CAPITAL STRUCTURE | 54 |
MARKET FOR SECURITIES | 56 |
DIRECTORS AND OFFICERS | 56 |
LEGAL PROCEEDINGS AND REGULATORY ACTIONS | 62 |
INTEREST OF MANAGEMENT AND OTHERS IN MATERIAL TRANSACTIONS | 63 |
TRANSFER AGENT AND REGISTRAR | 63 |
MATERIAL CONTRACTS | 63 |
TECHNICAL REPORTS | 63 |
SCHEDULE A Audit Committee Charter | A-1 |
SCHEDULE B DEFINITIONS | B-1 |
SCHEDULE C ABBREVIATIONS AND MEASUREMENT CONVERSION | C-1 |
SCHEDULE D EXCHANGE RATE AND METAL PRICE INFORMATION | D-1 |
2 |
Annual
information form
for the financial year ended December 31, 2018
All information in this annual information form (“Annual Information Form”) is as at December 31, 2018 unless otherwise indicated.
Cautionary Note Regarding Forward-Looking Statements
Certain information contained in this Annual Information Form, including any information relating to New Gold’s future financial or operating performance are “forward looking”. All statements in this Annual Information Form, other than statements of historical fact, which address events, results, outcomes or developments that New Gold expects to occur are “forward-looking statements”. Forward-looking statements are statements that are not historical facts and are generally, but not always, identified by the use of forward-looking terminology such as “plans”, “expects”, “is expected”, “budget”, “scheduled”, “targeted”, “estimates”, “forecasts”, “intends”, “anticipates”, “projects”, “potential”, “believes” or variations of such words and phrases or statements that certain actions, events or results “may”, “could”, “would”, “should”, “might” or “will be taken”, “occur” or “be achieved” or the negative connotation of such terms. Forward-looking statements in this Annual Information Form include those under the headings “General Developments of the Business”, “Description of the Business” and “Mineral Properties” and include, among others, statements with respect to: guidance for production, operating expenses per gold ounce sold, total cash costs, all-in sustaining costs and capital costs, and the factors contributing to those expected results, as well as expected capital expenditures; mine life; Mineral Reserve and Mineral Resource estimates; grades expected to be mined at the Company’s operations; the expected production, costs, economics and operating parameters of Blackwater and New Afton C-zone; planned activities for 2019 and beyond at the Company’s operations and projects, as well as planned exploration activities; and targeted timing for permits.
All forward-looking statements in this Annual Information Form are based on the opinions and estimates of management as of the date such statements are made and are subject to important risk factors and uncertainties, many of which are beyond New Gold’s ability to control or predict. Certain material assumptions regarding such forward-looking statements are discussed in this Annual Information Form, New Gold’s annual and quarterly management’s discussion and analysis (“MD&A”) and its Technical Reports filed on SEDAR at www.sedar.com. In addition to, and subject to, such assumptions discussed in more detail elsewhere, the forward-looking statements in this Annual Information Form are also subject to the following assumptions: (1) there being no significant disruptions affecting New Gold’s operations; (2) political and legal developments in jurisdictions where New Gold operates, or may in the future operate, being consistent with New Gold’s current expectations; (3) the accuracy of New Gold’s current Mineral Reserve and Mineral Resource estimates; (4) the exchange rate between the Canadian dollar, U.S. dollar and, to a lesser extent, the Mexican peso being approximately consistent with current levels; (5) prices for diesel, natural gas, fuel oil, electricity and other key supplies being approximately consistent with current levels; (6) equipment, labour and material costs increasing on a basis consistent with New Gold’s current expectations; (7) arrangements with First Nations and other indigenous groups in respect of Rainy River and Blackwater being consistent with New Gold’s current expectations; (8) all required permits, licenses and authorizations being obtained from the relevant governments and other relevant stakeholders within the expected timelines; (9) the results of the feasibility studies for the New Afton C-zone and Blackwater being realized; (10) and in the case of production, cost and expenditure outlooks at operating mines for 2019, commodity prices and exchange rates being consistent with those estimated for the purposes of 2019 guidance.
Forward-looking statements are necessarily based on estimates and assumptions that are inherently subject to known and unknown risks, uncertainties and other factors that may cause actual results, level of activity, performance or achievements to be materially different from those expressed or implied by such forward-looking statements. Such
3 |
factors include, without limitation: significant capital requirements and the availability and management of capital resources; additional funding requirements; price volatility in the spot and forward markets for metals and other commodities; fluctuations in the international currency markets and in the rates of exchange of the currencies of Canada, the United States and, to a lesser extent, Mexico; discrepancies between actual and estimated production, between actual and estimated Mineral Reserves and Mineral Resources and between actual and estimated metallurgical recoveries; changes in national and local government legislation in the countries in which New Gold does or may in the future carry on business; taxation; controls, regulations and political or economic developments in the countries in which New Gold does or may in the future carry on business; the speculative nature of mineral exploration and development, including the risks of obtaining and maintaining the validity and enforceability of the necessary licenses and permits and complying with the permitting requirements of each jurisdiction in which New Gold operates, including, but not limited to: in Canada, obtaining the necessary permits for the New Afton C-zone and the Blackwater Project; the uncertainties inherent to current and future legal challenges to which New Gold is or may become a party; diminishing quantities or grades of Mineral Reserves and Mineral Resources; competition; loss of key employees; rising costs of labour, supplies, fuel and equipment; actual results of current exploration or reclamation activities; uncertainties inherent to mining economic studies including the feasibility studies for New Afton C-zone and the Blackwater Project; the uncertainty with respect to prevailing market conditions necessary for a positive development or construction decision at the Blackwater Project; changes in project parameters as plans continue to be refined; accidents; labour disputes; defective title to mineral claims or property or contests over claims to mineral properties; unexpected delays and costs inherent to consulting and accommodating rights of First Nations and other indigenous groups; uncertainties and unanticipated delays associated with obtaining and maintaining necessary licenses, permits and authorizations, complying with permitting requirements, and receiving the environmental assessment approval for the Blackwater Project. In addition, there are risks and hazards associated with the business of mineral exploration, development and mining, including environmental events and hazards, industrial accidents, unusual or unexpected formations, pressures, cave-ins, flooding and gold bullion losses (and, in each case, the risk of inadequate insurance or inability to obtain insurance to cover these risks) as well as “Risk Factors” included in this Annual Information Form. Forward-looking statements are not guarantees of future performance, and actual results and future events could materially differ from those anticipated in such statements. All the forward-looking statements contained in this Annual Information Form are qualified by these cautionary statements. New Gold expressly disclaims any intention or obligation to update or revise any forward-looking statements whether as a result of new information, events or otherwise, except in accordance with applicable securities laws.
A significant portion of the historical financial information in this Annual Information Form is derived from New Gold’s audited consolidated financial statements for the year ended December 31, 2018 (a copy of which is available under the Company’s profile on SEDAR at www.sedar.com). Readers should refer to such financial statements for additional information.
Cautionary Note to U.S. Readers Concerning Estimates of Mineral Reserves and Mineral Resources
Information concerning the properties and operations of New Gold has been prepared in accordance with Canadian standards under applicable Canadian securities laws, and may not be comparable to similar information for United States companies. The terms “Mineral Reserve”, “Proven Mineral Reserve” and “Probable Mineral Reserve” are Canadian mining terms defined in accordance with Canadian National Instrument 43-101 — Standards of Disclosure for Mineral Projects (“NI 43-101”) and the Canadian Institute of Mining, Metallurgy and Petroleum (the “CIM”) — CIM Definition Standards on Mineral Resources and Mineral Reserves, adopted by the CIM Council, as amended. These definitions differ from the definitions in Industry Guide 7 (“SEC Industry Guide 7”) under the U.S. Securities Act of 1933, as amended (the “U.S. Securities Act”). Under SEC Industry Guide 7 standards, mineralization may not be classified as a “reserve” unless
4 |
the determination has been made that the mineralization could be economically and legally produced or extracted at the time the reserve determination is made. Also, under SEC Industry Guide 7 standards, a “final” or “bankable” feasibility study is required to report reserves, the three-year historical average price is used in any reserve or cash flow analysis to designate reserves and the primary environmental analysis or report must be filed with the appropriate governmental authority.
In addition, the terms “Mineral Resource”, “Measured Mineral Resource”, “Indicated Mineral Resource” and “Inferred Mineral Resource” are defined in and required to be disclosed by NI 43-101; however, these terms are not defined terms under SEC Industry Guide 7 and are normally not permitted to be used in reports and registration statements filed with the United States Securities and Exchange Commission (the “SEC”). Investors are cautioned not to assume that any part or all of the mineral deposits in these categories will ever be converted into reserves. “Inferred Mineral Resources” have a great amount of uncertainty as to their existence and as to their economic and legal feasibility. It cannot be assumed that all or any part of an inferred Mineral Resource will ever be upgraded to a higher category. Under Canadian rules, estimates of inferred Mineral Resources may not form the basis of feasibility or pre-feasibility studies, except in rare cases. Investors are cautioned not to assume that all or any part of an inferred Mineral Resource exists or is economically or legally mineable. Mineral resources that are not mineral reserves do not have demonstrated economic viability. Disclosure of “contained ounces” in a resource is permitted disclosure under Canadian regulations; however, SEC Industry Guide 7 normally only permits issuers to report mineralization that does not constitute “reserves” by SEC Industry Guide 7 standards as in place tonnage and grade without reference to unit measures.
Accordingly, information contained in this Annual Information Form describes the Company’s mineral deposits may not be comparable to similar information made public by United States companies subject to reporting and disclosure requirements under United States federal securities laws and the rules and regulations thereunder.
Non-GAAP Measures
Total Cash Costs per Gold Ounce
“Total cash costs per gold ounce” is a non-GAAP measure that is a common financial performance measure in the gold mining industry but with no standard meaning under International Financial Reporting Standards (“IFRS”). New Gold reports total cash costs on a sales basis. The Company believes that, in addition to conventional measures prepared in accordance with IFRS, certain investors use this information to evaluate the Company’s performance and ability to generate liquidity through operating cash flow to fund future capital expenditures and working capital needs. New Gold believes that this measure, along with sales, is a key indicator of a company’s ability to generate operating earnings and cash flow from its mining operations.
Total cash cost figures are calculated in accordance with a standard developed by The Gold Institute, a worldwide association of suppliers of gold and gold products that ceased operations in 2002. Adoption of the standard is voluntary and the cost measures presented may not be comparable to other similarly titled measures of other companies. Total cash costs include mine site operating costs such as mining, processing and administration costs, royalties, production taxes, but are exclusive of depreciation, amortization, reclamation, capital and exploration costs and net of by-product sales. Total cash costs are then divided by gold ounces sold to arrive at the total cash costs per ounce sold.
The Company produces copper and silver as by-products of its gold production. The calculation of total cash costs per gold ounce for Rainy River and Cerro San Pedro is net of by-product silver sales revenue, and the calculation of total cash costs per gold ounce sold for New Afton is net of by-product silver and copper sales revenue. New Gold notes that in connection with New Afton, the copper by-product revenue is sufficiently large to result in a negative total cash cost on a single mine basis. Notwithstanding this by-product contribution, as a company focused on gold production, New Gold aims to assess the economic results of its operations in relation to gold, which is the primary driver of New Gold’s business. New Gold believes this metric is of interest to its investors, who invest in the Company primarily as a gold
5 |
mining company. To determine the relevant costs associated with gold only, New Gold believes it is appropriate to reflect all operating costs, as well as any revenue related to metals other than gold that are extracted in its operations.
To provide additional information to investors, New Gold has also calculated total cash costs on a co-product basis, which removes the impact of other metal sales that are produced as a by-product of gold production and apportions the cash costs to each metal produced on a percentage of revenue basis, and subsequently divides the amount by the total gold ounces, silver ounces or pounds of copper sold, as the case may be, to arrive at per ounce or per pound figures. In 2019, in addition to reporting total cash costs on a co-product basis per gold ounce, silver ounce or pound of copper sold, the Company will also report gold equivalent total cash costs per ounce on a co-product basis. Gold equivalent ounces of copper and silver produced will be computed as pounds of copper and silver ounces produced multiplied by the ratio of the average realized copper and silver price, respectively, to the average realized gold price. Unless indicated otherwise, all total cash cost information in this Annual Information Form is net of by-product sales.
Total cash costs are intended to provide additional information only and do not have any standardized meaning under IFRS and may not be comparable to similar measures presented by other mining companies. They should not be considered in isolation or as a substitute for measures of performance prepared in accordance with IFRS. The measure is not necessarily indicative of cash flow from operations under IFRS or operating costs presented under IFRS. Further details regarding historical total cash costs and a reconciliation to the nearest IFRS measures are provided in the MD&A accompanying New Gold’s financial statements and filed at www.sedar.com.
All-in Sustaining Costs per Gold Ounce
“All-in sustaining costs per gold ounce” is a non-GAAP measure based on guidance announced by the World Gold Council (“WGC”) in September 2013. The WGC is a non-profit association of the world’s leading gold mining companies established in 1987 to promote the use of gold to industry, consumers and investors. The WGC is not a regulatory body and does not have the authority to develop accounting standards or disclosure requirements. The WGC has worked with its member companies, to develop a measure that expands on IFRS measures such as operating expenses and non-GAAP measures to provide visibility into the economics of a gold mining company. Current IFRS measures used in the gold industry, such as operating expenses, do not capture all of the expenditures incurred to discover, develop and sustain gold production. New Gold believes the all-in sustaining costs measure provides further transparency into costs associated with producing gold and will assist analysts, investors and other stakeholders of the Company in assessing its operating performance, its ability to generate free cash flow from current operations and its overall value. In addition, the Human Resources and Compensation Committee of the Board of Directors uses all-in sustaining costs, together with other measures, in the corporate scorecard to set incentive compensation goals and assess performance.
All-in sustaining costs per gold ounce is intended to provide additional information only and does not have any standardized meaning under IFRS and may not be comparable to similar measures presented by other mining companies. It should not be considered in isolation or as a substitute for measures of performance prepared in accordance with IFRS. The measure is not necessarily indicative of cash flow from operations under IFRS or operating costs presented under IFRS. Further details regarding historical all-in sustaining costs and a reconciliation to the nearest IFRS measures are provided in the MD&A accompanying New Gold’s financial statements and filed at www.sedar.com.
New Gold defines all-in sustaining costs per ounce as the sum of total cash costs, net capital expenditures that are sustaining in nature, corporate general and administrative costs, capitalized and expensed exploration costs that are sustaining in nature, and environmental reclamation costs, all divided by the total gold ounces sold to arrive at a per ounce figure. To determine sustaining capital expenditures, New Gold uses cash flow related to mining interests from its statement of cash flows and deducts any expenditures that are non-sustaining (growth). Capital expenditures to develop new operations or capital expenditures related to major projects at existing operations where these projects will materially benefit the operation are classified as non-sustaining and are excluded. The table “Sustaining Capital Expenditure Reconciliation” (in New Gold’s MD&A available under the Company’s profile on SEDAR at www.sedar.com)
6 |
reconciles New Gold’s sustaining capital to its cash flow statement. The definition of sustaining versus non-sustaining is similarly applied to capitalized and expensed exploration costs. Exploration costs to develop new operations or that relate to major projects at existing operations where these projects are expected to materially benefit the operation are classified as non-sustaining and are excluded.
Costs excluded from all-in sustaining costs are non-sustaining capital expenditures and exploration costs, financing costs, tax expense, transaction costs associated with mergers, acquisitions and divestitures, and any items that are deducted for the purposes of adjusted earnings.
To provide additional information to investors, New Gold has also calculated all-in sustaining costs per ounce on a co-product basis, which removes the impact of other metal sales that are produced as a by-product of gold production and apportions the all-in sustaining costs to each metal produced on a percentage of revenue basis, and subsequently divides the amount by the total gold ounces, silver ounces or pounds of copper sold, as the case may be, to arrive at per ounce or per pound figures. In 2019, in addition to reporting all-in sustaining costs on a co-product basis per gold ounce, silver ounce or pound of copper sold, the Company will also report gold equivalent all-in sustaining costs per ounce on a co-product basis. Gold equivalent ounces of copper and silver produced will be computed as pounds of copper and silver ounces produced multiplied by the ratio of the average realized copper and silver price, respectively, to the average realized gold price. Unless indicated otherwise, all all-in sustaining costs information in this MD&A is net of by-product sales. By including total cash costs as a component of all-in sustaining costs, the measure deducts by-product revenue from gross cash costs.
Currency Presentation and Exchange Rate Information
All dollar amounts referenced in this Annual Information Form are in United States dollars unless otherwise indicated. Canadian dollars are referred to as “Canadian dollars” or “C$”. See Schedule D of this Annual Information Form for applicable exchange rate information.
Technical Information
The scientific and technical information relating to the Mineral Reserves contained herein has been reviewed and approved by Mr. Nicholas Kwong, Director of Technical Services for the Company. The scientific and technical information relating to the Mineral Resources contained herein has been reviewed and approved by Mr. Mark A. Petersen a consultant to New Gold and its former Vice President, Exploration. All other scientific and technical information in this Annual Information Form has been reviewed and approved by Mr. Eric Vinet, Vice President, Technical Services for the Company. Mr. Kwong is a Professional Engineer and a member of the Association of Professional Engineers and Geoscientists of British Columbia. Mr. Petersen is a Professional Geoscientist (P.Geo.) and Practicing Member of the Association of Professional Geoscientists of Ontario, an SME Registered Member and an AIPG Certified Professional Geologist. Mr. Vinet is a Professional Engineer and member of the Ordre des ingénieurs du Québec. Mr. Kwong, Mr. Petersen and Mr. Vinet are "Qualified Persons" for the purposes of NI 43-101. To the Company’s knowledge, each of the aforementioned persons holds less than 1% of the outstanding securities of the Company.
The estimates of Mineral Reserves and Mineral Resources discussed in this Annual Information Form may be materially affected by environmental, permitting, legal, title, taxation, sociopolitical, marketing and other risks and relevant issues. New Gold’s current NI 43-101 Technical Reports, which are available at www.sedar.com, contain further information regarding Mineral Reserve and Mineral Resource estimates, classification, reporting parameters, key assumptions and risks for each of New Gold's material mineral properties.
7 |
Additional Information
Additional information about the Company, including, without limitation, directors’ and officers’ remuneration and indebtedness, principal holders of the Company’s securities and securities authorized for issuance under equity compensation plans, may be found in the Management Information Circular of the Company for its most recent annual meeting of shareholders and other continuous disclosure documents of the Company filed on SEDAR at www.sedar.com. Additional financial information is provided in the Company’s audited consolidated financial statements and MD&A for the three months and year ended December 31, 2018. These documents and other information about the Company are available under the Company’s profile on SEDAR at www.sedar.com.
CORPORATE STRUCTURE
The Company was incorporated on January 31, 1980 as DRC Resources Corporation under the Company Act (British Columbia) and was transitioned on May 10, 2005 under the Business Corporations Act (British Columbia). On May 4, 2005, the shareholders of the Company passed a special resolution to remove the pre-existing company provisions and adopt new articles. On June 1, 2005 the Company changed its name to New Gold Inc. Effective January 1, 2012, New Gold amalgamated with its wholly owned subsidiaries Silver Quest Resources Ltd. (“Silver Quest”), Geo Minerals Ltd. (“Geo”) and Richfield Ventures Corp. (“Richfield”). The amalgamated company continued as New Gold Inc. Effective October 1, 2014, New Gold amalgamated with its wholly owned subsidiaries Rainy River Resources Ltd. (“RRRL”) and 0608457 B.C. Ltd, with the amalgamated company continuing as New Gold Inc. On January 1, 2016, New Gold amalgamated with its wholly owned subsidiaries Peak Gold Ltd. and New Gold Bayfield Corp. The amalgamated company continued as New Gold Inc.
The registered office of the Company is Suite 610, 1100 Melville Street, Vancouver, British Columbia V6E 4A6, Canada and its head office is at Suite 3510, 181 Bay Street, Toronto, Ontario, M5J 2T3, Canada.
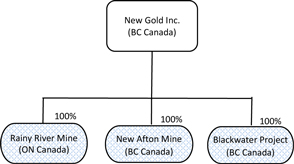
As at the date of this Annual Information Form, the Company does not have any material subsidiaries. The Rainy River Mine, New Afton Mine and Blackwater Project are all held by New Gold Inc.
In this Annual Information Form, except as otherwise required by the context, reference to “New Gold” or the “Company” means, collectively, New Gold Inc. and its subsidiaries.
8 |
GENERAL DEVELOPMENT OF THE BUSINESS
New Gold is a Canadian-focused intermediate gold mining company engaged in the acquisition, exploration, development and operation of mineral properties. New Gold currently has the following mines and development projects which are described in greater detail in the “Mineral Properties” section of this Annual Information Form:
· | 100% interest in the Rainy River gold-silver mine in Ontario, Canada (“Rainy River Mine”) |
· | 100% interest in the New Afton gold-copper mine British Columbia, Canada (“New Afton Mine”) |
· | 100% interest in the Blackwater gold-silver project in British Columbia, Canada (“Blackwater Project”) |
New Gold also owns a 100% interest in the Cerro San Pedro gold-silver mine in San Luis Potosí, Mexico (“Cerro San Pedro Mine”), which concluded active mining in June 2016 and transitioned to the reclamation phase on December 31, 2018.
New Gold has been engaged in the acquisition, exploration and development of natural resource properties since 1980. The Company’s current structure arose through two accretive business combinations in mid-2008 and mid-2009. To achieve its growth strategy, New Gold focuses on:
· | Delivering on operational targets (safety, cost, production, environment and social responsibility); |
· | Maintaining a strong financial position; |
· | Internal growth through project development and continuous improvement of existing operations; and |
· | External growth through value enhancing merger and acquisition opportunities. |
Developments – Mines and Projects
Rainy River Mine
Construction of the Rainy River Mine commenced in early 2015. In January 2017, the Company announced an increase in the expected total capital cost to build the Rainy River Mine to $1,292 million, including contingency, and that startup was scheduled for September 2017 with commercial production expected to commence November 2017. The first gold pour at the Rainy River Mine occurred on October 5, 2017 and commercial production was achieved on October 19, 2017.
New Afton Mine
In January 2016, the Company completed a Feasibility Study, which indicated positive economics for mining the C-zone consistent with a scoping study announced in February 2015. The C-zone is the down plunge extension of the B-zone block cave that is currently being mined at New Afton. In January 2019, the Company announced it would begin underground development of the C-zone in 2019. See “Exploration and Development – New Afton C-zone” on page 31.
Peak Mines
On November 20, 2017, New Gold announced that it had entered into an agreement with Aurelia Metals Limited to sell its 100% interest in the Peak gold-copper mines in New South Wales, Australia (“Peak Mines”) for cash consideration of $58 million. The transaction closed on April 10, 2018.
9 |
Mesquite Mine
On September 19, 2018, New Gold announced that it had entered into an agreement with Equinox Gold Corp. to sell its 100% interest in the Mesquite gold mine in California (“Mesquite Mine”) for cash consideration of $158 million. The transaction closed on October 30, 2018.
Cerro San Pedro Mine
The Cerro San Pedro Mine completed active mining in June 2016 and transitioned to residual leaching. The Cerro San Pedro Mine transitioned to the reclamation phase on December 31, 2018.
Blackwater Project
The Blackwater Project continues to move through the permitting phase with the Environmental Assessment (“EA”) expected in 2019. In 2019, the Company will continue to assess alternative project scenarios that may involve lower initial capital requirements and a high-grade pit configuration that would generate positive returns at current metal prices.
Sale of El Morro Stream
In November 2015, as a part of an agreement to sell New Gold’s 30% interest in the El Morro Project to an affiliate of Goldcorp Inc. (“Goldcorp”), the Company entered into an agreement to receive a 4% stream on gold production from the El Morro property, under which New Gold would pay $400 per ounce for the first 217,000 ounces of gold delivered as part of the stream, and would pay $400 per ounce plus a 1% annual inflation adjustment for subsequent ounces of gold delivered as part of the stream (the “El Morro Gold Stream”). In February 2017, New Gold sold the El Morro Gold Stream to Goldcorp for $65 million.
Developments – Financial
In August 2014, New Gold entered into a $300 million revolving secured credit facility with a syndicate of banks led by The Bank of Nova Scotia and RBC Capital Markets (the “Credit Facility”). The Credit Facility was amended in November 2015, February 2016, October 2016, May 2017, June 2017, and amended and restated in October 2018. The size of the Credit Facility is now $400 million and term extends to August 2021. The terms of the Credit Facility require the Company to satisfy various affirmative and negative covenants and to meet certain financial ratios and tests. Following the amendment and restatement of the Credit Facility in October 2018, the maximum ratio of net debt to earnings before interest, taxes, depreciation, amortization, exploration, impairment and other non-cash adjustments (“Adjusted EBITDA”) covenant (“Leverage Ratio”) for future periods (as measured on a rolling four-quarter basis at the end of every quarter) is 4.5 to 1.0 and the maximum ratio of total secured debt to Adjusted EBITDA covenant for future periods is 2.0 to 1.0.
In October 2016, New Gold purchased put options with a strike price of $1,300 per ounce covering 120,000 ounces of gold and simultaneously sold call options with a strike price of $1,400 per ounce covering 120,000 ounces of gold. These contracts covered 20,000 ounces of gold per month for the first six months of 2017. In June 2017, New Gold purchased put options with a strike price of $1,250 per ounce covering 120,000 ounces of gold and simultaneously sold call options with a strike price of $1,400 per ounce covering 120,000 ounces of gold. These contracts covered 20,000 ounces of gold per month for the last six months of 2017. In December 2018, New Gold purchased put options with a strike price of $1,230 per ounce covering 192,000 ounces of gold and simultaneously sold call options with a strike price of $1,300 per ounce covering 192,000 ounces of gold. These contracts covered 16,000 ounces of gold per month for 2019.
10 |
In November 2016, New Gold fixed the price for 31.7 million pounds of the Company's copper production in the first six months of 2017 at $2.52 per pound using swap contracts that settled against the monthly average London Metals Exchange price. The swap contracts covered 5.3 million pounds of copper per month from January through June 2017. In February 2017, New Gold fixed the price for 43.7 million pounds of the Company’s copper production in the second half of 2017 at $2.73 per pound using swap contracts that settled against the monthly average London Metals Exchange price. The swap contracts covered 7.3 million pounds of copper per month from July through December 2017. In October 2017, New Gold purchased put options with a strike price of $3.00 per pound covering 60 million pounds of its 2018 production and simultaneously sold call options with a strike price of $3.37 per ounce covering 60 million pounds of its 2018 production. In December 2018, New Gold purchased put options with a strike price of $2.50 per pound covering 21,600 tonnes of its 2018 production and simultaneously sold call options with a strike price of $3.00 per ounce covering 21,600 tonnes of its 2018 production.
On February 22, 2017, New Gold announced that it had entered into an agreement with a syndicate of underwriters (the “Underwriters”) pursuant to which they agreed to purchase, on a bought deal basis, 53,600,000 of the Company’s common shares (“Common Shares”) at a price of $2.80 per share (the “Offering”), for aggregate gross proceeds to the Company of approximately $150 million. In addition, the Company agreed to grant to the Underwriters an option to purchase up to an additional 8,040,000 Common Shares at a price of $2.80 per share, on the same terms and conditions as the Offering, which was exercised in full by the Underwriters. The Offering closed on March 10, 2017. The aggregate gross proceeds of the Offering to the Company were approximately $173 million and proceeds net of underwriting fees and expenses were approximately $164.5 million.
On May 18, 2017, New Gold announced that it had completed an offering of $300 million aggregate principal amount of 6.375% Senior Notes due 2025. The Company used the net proceeds from the offering, together with cash on hand, to fund the redemption of all of its outstanding $300 million 7.00% Senior Notes due 2020.
DESCRIPTION OF THE BUSINESS
The Company’s material operating assets consist of the Rainy River Mine and New Afton Mine in Canada. New Gold also owns the Cerro San Pedro Mine in Mexico, which transitioned to the reclamation phase on December 31, 2018. It also owns the Blackwater Project in Canada. For purposes of NI 43-101, the Company considers the Rainy River Mine and the New Afton Mine to be its material properties.
New Gold is continually working to maximize shareholder value through diversified production, maintaining an attractive risk profile and enhancing growth potential in a safe and an environmentally and socially responsible manner.
Refer to the Company’s MD&A for the year ended December 31, 2018, available under the Company’s profile on SEDAR at www.sedar.com, for a detailed description of the Company’s business, including each of its operating segments.
Specialized Skills and Knowledge
All aspects of New Gold’s business require specialized skills and knowledge. Such required areas of specialized skills and knowledge include geology, drilling, mineral resource estimation, mine planning and mineral reserve estimation,
11 |
metallurgy, engineering, construction, technology, community and public relations, regulatory compliance, legal and accounting.
Principal Products
The Company’s principal products are gold, copper and silver, which generally require refining or smelting to become marketable metal. As described in more detail with respect to each operation, the Company uses the services of refiners to refine gold doré. The refined gold is sold to bullion banks or gold trading counterparties at market prices, though in some cases the Company sells doré to such banks and counterparties with delivery to the refinery. Copper concentrate produced by the New Afton Mine is sold to various smelters or concentrate marketing firms. The Company has also entered into financial instruments, such as option or swap contracts, for the purpose of hedging gold and copper prices – see “Developments – Financial” on page 10. There are worldwide gold, copper and silver markets into which the Company can sell and, as a result, the Company is not dependent on a particular purchaser with regard to the sale of the gold, copper and silver which it produces. Further, due to the availability of alternative refineries and smelters, the Company is not dependent on the services on any one refiner or smelter.
Competitive Conditions
The precious and base mineral exploration and mining business is competitive. The Company competes with numerous other companies and individuals in the search for and the acquisition of attractive mineral properties. The ability of the Company to acquire mineral properties in the future will depend on its ability to develop its present properties, and on its ability to select and acquire suitable producing properties or prospects for development or mineral exploration.
Operations
Mineral Reserves and Mineral Resources
The Company has the following Mineral Reserves and Mineral Resources: gold and silver at the Rainy River Mine; gold, copper and silver at the New Afton Mine; and gold and silver at the Blackwater Project. See “Mineral Reserve and Mineral Resource Estimates” on page 14.
Foreign Operations
The Company currently owns 100% of the Cerro San Pedro Mine in Mexico. Any changes in regulations (or the application of regulations) or shifts in political attitudes in these foreign jurisdictions are beyond the control of the Company and may adversely affect its business. Future development and operations may be affected in varying degrees by factors such as government regulations (or changes to such regulations or the application of regulations) with respect to the restrictions on production, export controls, income taxes, expropriation of property, repatriation of profits, environmental legislation, land use, water use, operating activities, land claims of local people and mine safety. The impact of these factors cannot be accurately predicted. See “Risk Factors – Foreign Operations” on page 53.
12 |
Employees
As at December 31, 2018, the Company had the following employees:
Location | Employees |
Corporate Office | 33 |
Rainy River Mine | 682 |
New Afton Mine | 411 |
Cerro San Pedro Mine(1) | 135 |
Blackwater Project | 6 |
Total | 1267 |
(1) | As at December 31, 2018, 41 employees at the Cerro San Pedro Mine belonged to a union. |
Environmental Protection and Social and Environmental Practices
New Gold is committed to excellence in corporate social responsibility. The Company considers its ability to make a lasting and positive contribution toward sustainable development a key driver to achieving a productive and profitable business. New Gold aims to achieve these objectives through the protection of the health and well-being of its people and host communities as well as maintaining industry leading practices in the areas of environmental stewardship and community engagement and development. As a partner of the United Nations Global Compact, New Gold’s policies and practices are guided by its principles with reference to human rights, labour, environmental stewardship and anti-corruption. As a member of the Mining Association of Canada (“MAC”), New Gold’s operations adopt the MAC’s Towards Sustainable Mining protocols which form part of the New Gold Environmental Management Standards and Community Engagement and Development Management Standards.
New Gold’s corporate social responsibility objectives include promoting and protecting the welfare of its employees through safety-first work practices, upholding fair employment practices and encouraging a diverse workforce, where people are treated with respect and supported to realize their full potential. New Gold believes that people are its most valuable assets and strives to create a culture of inclusiveness that begins at the top and is reflected in its hiring, promotion and overall human resources practices. New Gold encourages tolerance and respect in worker-to-worker relationships. The Company strives to be an employer of choice through the provision of competitive wages and benefits, the implementation of policies that recognize and reward employee performance, and promotion from within wherever possible.
The Company is committed to preserving the long-term health and viability of the natural environments that host its operations. Wherever New Gold operates – in all stages of mining activity, from early exploration and planning, to commercial mining operations through to eventual closure – the Company is committed to excellence in environmental management. Prior to commencing significant construction activities, New Gold carries out comprehensive environmental studies to establish baseline measurements for flora, fauna, earth, air and water. During operations, it promotes the efficient use of raw materials and resources, works to minimize environmental impacts and maintains robust monitoring programs. After mining activities are complete, New Gold’s objective is to restore the land to a level of productivity equivalent to its pre-mining capacity or to an alternative land use determined through consultation with regulatory authorities and the communities of interest.
New Gold is committed to establishing relationships with host communities based on mutual benefit and active engagement with these communities to contribute to their sustainability. Wherever the Company’s operations interact with Indigenous peoples, New Gold promotes understanding of, and respect for, traditional values, customs and culture
13 |
and takes meaningful action to consider the interests of Indigenous peoples. New Gold aims to foster open communication with local residents and community leaders so that issues can be resolved collaboratively. The Company believes that by thoroughly understanding the people, their histories, and their needs and aspirations, it can engage in a meaningful and sustainable development process.
The Company’s mining, exploration and development activities are subject to various federal, provincial, state, county and municipal laws and regulations relating to the protection of the environment, including requirements for closure and reclamation of mining properties. In all jurisdictions where New Gold operates, specific statutory and regulatory requirements and standards must be met throughout the exploration, development and operations stages of a mining property with regard to air quality, water quality, fisheries and wildlife protection, solid and hazardous waste management and disposal, noise, land use and reclamation. Details and quantification of New Gold’s reclamation and closure costs obligations are set out in Note 17 of the Company’s audited consolidated financial statements for the year ended December 31, 2018.
Management estimates the undiscounted closure cost for all of its properties is $116.6 million as at December 31, 2018. As at December 31, 2018, the Company had posted letters of credit or other financial assurance in an aggregate amount of $110.8 million to address these liabilities.
Technical Information
CIM Standards Definitions
New Gold’s estimates of Mineral Reserves and Mineral Resources have been calculated in accordance with the CIM Definitions Standards for Mineral Reserves and Mineral Resources adopted by the Canadian Institute of Mining, Metallurgy and Petroleum ("CIM”) Council on May 10, 2014 (the “CIM Standards”).
Technical Terms and Abbreviations
Unless otherwise defined, technical terms used in this Annual Information Form are set out in Schedule B and abbreviations terms used are defined in Schedule C.
Mineral Reserve and Mineral Resource Estimates
On February 14, 2019, the Company reported consolidated Mineral Reserve and Mineral Resource estimates for its mines and development projects as at December 31, 2018. A summary of total gold, silver and copper contained within New Gold’s estimated Mineral Reserves and Mineral Resources is set out in the table below:
Contained metal | |||
Gold Koz |
Silver Koz |
Copper Mlbs | |
PROVEN AND PROBABLE RESEVES | 13,433 | 76,196 | 903 |
Rainy River | 4,186 | 12,116 | - |
New Afton | 1,077 | 3,280 | 903 |
Blackwater | 8,170 | 60,800 | - |
MEASURED AND INDICATED RSOURCES (Exclusive of Reserves) | 4,600 | 19,699 | 891 |
INFERRED RESOURCES | 1,001 | 3,860 | 132 |
Notes to the Company’s Mineral Reserve and Mineral Resource estimates are provided on pages 17-18.
Details of the Company’s Mineral Reserve and Mineral Resource estimates are presented in the following tables.
14 |
Mineral Reserves Estimates (as at December 31, 2018)
Metal grade | Contained metal | ||||||
Tonnes 000s |
Gold g/t |
Silver g/t |
Copper % |
Gold Koz |
Silver Koz |
Copper Mlbs | |
RAINY RIVER | |||||||
Direct processing reserves | |||||||
Open Pit | |||||||
Proven | 18,663 | 1.24 | 2.4 | - | 744 | 1,450 | - |
Probable | 47,670 | 1.18 | 3.0 | - | 1,810 | 4,542 | - |
Open Pit P&P (direct proc.) | 66,333 | 1.20 | 2.8 | - | 2,554 | 5,993 | - |
Underground | |||||||
Proven | - | - | - | - | - | - | - |
Probable | 8,954 | 3.55 | 9.5 | - | 1,021 | 2,728 | - |
Underground P&P (direct proc.) | 8,954 | 3.55 | 9.5 | - | 1,021 | 2,728 | - |
Low grade reserves | |||||||
Open Pit | |||||||
Proven | 8,430 | 0.36 | 2.0 | - | 97 | 541 | - |
Probable | 32,714 | 0.35 | 2.3 | - | 366 | 2,428 | - |
Open Pit P&P (low grade) | 41,145 | 0.35 | 2.2 | - | 463 | 2,969 | - |
Surface Stockpiles | |||||||
Proven | 7,307 | 0.63 | 1.8 | - | 147 | 426 | - |
Open Pit P&P (stockpile) | 7,307 | 0.63 | 1.8 | - | 147 | 426 | - |
Combined P&P | |||||||
Proven | 34,400 | 0.89 | 2.4 | - | 989 | 2,291 | - |
Probable | 89,339 | 1.11 | 3.4 | - | 3,197 | 9,825 | - |
Total Rainy River P&P | 123,739 | 1.05 | 3.0 | - | 4,186 | 12,116 | - |
NEW AFTON | |||||||
A&B Zones | |||||||
Proven | - | - | - | - | - | - | - |
Probable | 25,731 | 0.51 | 1.9 | 0.74 | 420 | 1,612 | 420 |
C-zone | |||||||
Proven | - | - | - | - | - | - | - |
Probable | 26,911 | 0.76 | 1.9 | 0.82 | 657 | 1,668 | 484 |
Total New Afton P&P | 52,642 | 0.64 | 1.9 | 0.78 | 1,077 | 3,280 | 903 |
BLACKWATER | |||||||
Direct processing reserves | |||||||
Proven | 124,500 | 0.95 | 5.5 | - | 3,790 | 22,100 | - |
Probable | 169,700 | 0.68 | 4.1 | - | 3,730 | 22,300 | - |
P&P (direct proc.) | 294,300 | 0.79 | 4.7 | - | 7,510 | 44,400 | - |
Low grade reserves | |||||||
BLACKWATER | |||||||
Direct processing reserves | |||||||
Proven | 124,500 | 0.95 | 5.5 | - | 3,790 | 22,100 | - |
Probable | 169,700 | 0.68 | 4.1 | - | 3,730 | 22,300 | - |
P&P (direct proc.) | 294,300 | 0.79 | 4.7 | - | 7,510 | 44,400 | - |
Low grade reserves | |||||||
Proven | 20,100 | 0.50 | 3.6 | - | 330 | 2,300 | - |
Probable | 30,100 | 0.34 | 14.6 | - | 330 | 14,100 | - |
P&P (low grade) | 50,200 | 0.40 | 10.2 | - | 650 | 16,400 | - |
Combined Direct proc. & Low grade | |||||||
Proven | 144,600 | 0.88 | 5.3 | - | 4,110 | 24,400 | - |
Probable | 199,800 | 0.63 | 5.7 | - | 4,050 | 36,400 | - |
Total Blackwater P&P | 344,400 | 0.74 | 5.5 | - | 8,170 | 60,800 | - |
Total Proven & Probable Reserves | 13,433 | 76,196 | 903 |
15 |
Measured & Indicated Mineral Resources Estimates (exclusive of Mineral Reserves) (as at December 31, 2018)
Metal grade | Contained metal | ||||||
Tonnes 000s |
Gold g/t |
Silver g/t |
Copper % |
Gold Koz |
Silver Koz |
Copper Mlbs | |
RAINY RIVER | |||||||
Direct processing resources | |||||||
Open Pit | |||||||
Measured | 2,990 | 1.13 | 5.6 | - | 109 | 534 | - |
Indicated | 26,370 | 1.13 | 3.3 | - | 955 | 2,759 | - |
Open Pit M&I (direct proc.) | 29,360 | 1.13 | 3.5 | - | 1,064 | 3,292 | - |
Underground | |||||||
Measured | - | - | - | - | - | - | - |
Indicated | 7,908 | 3.06 | 8.6 | - | 778 | 2,188 | - |
Underground M&I (direct proc.) | 7,908 | 3.06 | 8.6 | - | 778 | 2,188 | - |
Low grade resources | |||||||
Open Pit | |||||||
Measured | 2,465 | 0.35 | 3.1 | - | 28 | 248 | - |
Indicated | 23,135 | 0.36 | 2.1 | - | 269 | 1,592 | - |
Open Pit M&I (low grade) | 25,600 | 0.36 | 2.2 | - | 297 | 1,840 | - |
Combined M&I | |||||||
Measured | 5,455 | 0.78 | 4.5 | - | 137 | 782 | - |
Indicated | 57,412 | 1.08 | 3.5 | - | 2,002 | 6,539 | - |
Total Rainy River M&I | 62,867 | 1.06 | 3.6 | - | 2,139 | 7,321 | - |
NEW AFTON | |||||||
A&B Zones | |||||||
Measured | 15,239 | 0.64 | 2.0 | 0.86 | 315 | 972 | 289 |
Indicated | 8,530 | 0.51 | 2.8 | 0.77 | 140 | 776 | 145 |
A&B Zone M&I | 23,769 | 0.60 | 2.3 | 0.83 | 455 | 1,748 | 434 |
C-zone | |||||||
Measured | 5,711 | 0.79 | 2.0 | 0.96 | 144 | 366 | 120 |
Indicated | 11,976 | 0.72 | 2.1 | 0.87 | 279 | 809 | 230 |
C-zone M&I | 17,687 | 0.74 | 2.1 | 0.90 | 423 | 1,174 | 350 |
HW Lens | |||||||
Measured | - | - | - | - | - | - | - |
Indicated | 10,951 | 0.52 | 2.1 | 0.44 | 183 | 722 | 107 |
HW Lens M&I | 10,951 | 0.52 | 2.1 | 0.44 | 183 | 722 | 107 |
Combined M&I | |||||||
Measured | 20,950 | 0.68 | 2.0 | 0.89 | 459 | 1,338 | 410 |
Indicated | 31,457 | 0.60 | 2.3 | 0.69 | 602 | 2,307 | 481 |
Total New Afton M&I | 52,407 | 0.63 | 2.2 | 0.77 | 1,061 | 3,645 | 891 |
BLACKWATER | |||||||
Direct processing resources | |||||||
Measured | 288 | 1.39 | 6.6 | - | 13 | 61 | - |
Indicated | 45,249 | 0.84 | 4.6 | - | 1,225 | 6,692 | - |
M&I (direct proc.) | 45,537 | 0.85 | 4.6 | - | 1,238 | 6,753 | - |
Low grade resources | |||||||
Measured | - | - | - | - | - | - | - |
Indicated | 15,779 | 0.32 | 3.9 | - | 162 | 1,980 | - |
M&I (low grade) | 15,779 | 0.32 | 3.9 | - | 162 | 1,980 | - |
Total Blackwater M&I | 61,316 | 0.71 | 4.4 | - | 1,400 | 8,733 | - |
Total M&I RESOURCES | 4,600 | 19,699 | 891 |
16 |
Inferred Mineral Resources (as at December 31, 2018)
Metal grade | Contained metal | ||||||
Tonnes 000s |
Gold g/t |
Silver g/t |
Copper % |
Gold Koz |
Silver Koz |
Copper Mlbs |
|
RAINY RIVER | |||||||
Direct processing | |||||||
Open Pit | 5,883 | 1.17 | 3.1 | - | 222 | 578 | - |
Underground | 1,270 | 3.68 | 3.8 | - | 150 | 156 | - |
Total Direct Processing | 7,153 | 1.62 | 3.2 | - | 372 | 733 | - |
Low grade resources | |||||||
Open Pit | 6,049 | 0.37 | 1.4 | - | 72 | 274 | - |
Rainy River Inferred | 13,202 | 1.05 | 2.4 | - | 444 | 1,007 | - |
NEW AFTON | |||||||
A&B Zones | 6,530 | 0.35 | 1.4 | 0.38 | 74 | 295 | 54 |
C-zone | 7,034 | 0.43 | 1.4 | 0.51 | 98 | 309 | 77 |
HW Lens | - | - | - | - | - | - | - |
New Afton Inferred | 13,564 | 0.39 | 1.4 | 0.45 | 172 | 605 | 132 |
BLACKWATER | |||||||
Direct processing | 13,905 | 0.76 | 4.0 | - | 341 | 1,788 | - |
Low grade resources | 4,207 | 0.33 | 3.4 | - | 44 | 460 | - |
Blackwater Inferred | 18,112 | 0.66 | 3.9 | - | 385 | 2,248 | - |
Total Inferred | 1,001 | 3,860 | 132 |
Notes to Mineral Reserve and Resource Estimates
1. | New Gold’s Mineral Reserves and Mineral Resources have been estimated in accordance with the CIM Standards, which are incorporated by reference in NI 43-101. |
2. | All Mineral Reserve and Mineral Resource estimates for New Gold’s properties and projects are effective December 31, 2018. |
3. | New Gold’s year-end 2018 Mineral Reserves and Mineral Resources have been estimated based on the following metal prices and foreign exchange (FX) rate criteria: |
Gold $/ounce |
Silver $/ounce |
Copper $/pound |
FX CAD:USD | |
Mineral Reserves | $1,275 | $17.00 | $3.00 | 1.30 |
Mineral Resources | $1,350 | $18.00 | $3.25 | 1.30 |
4. | Lower cut-offs for the Company’s Mineral Reserves and Mineral Resources are outlined in the following table: |
Mineral Property |
Mineral Reserves Lower cut-off |
Mineral Resources Lower Cut-off | |
Rainy River | O/P direct processing: | 0.30 – 0.50 g/t AuEq | 0.30 – 0.50 g/t AuEq |
O/P low grade material: | 0.30 g/t AuEq | 0.30 g/t AuEq | |
U/G direct processing: | 2.20 g/t AuEq | 2.00 g/t AuEq | |
New Afton | Main Zone – B1 & B2 Blocks: | C$ 17.00/t | All Resources: 0.40% CuEq |
B3 Block & C-zone: | C$ 24.00/t | ||
Blackwater | O/P direct processing: | 0.26 – 0.38 g/t AuEq | All Resources: 0.40 g/t AuEq |
O/P low grade material: | 0.32 g/t AuEq |
17 |
5. | New Gold reports its measured and indicated mineral resources exclusive of mineral reserves. Measured and indicated mineral resources that are not mineral reserves do not have demonstrated economic viability. Inferred mineral resources have a greater amount of uncertainty as to their existence and technical feasibility, do not have demonstrated economic viability, and are likewise exclusive of mineral reserves. Numbers may not add due to rounding. |
6. | Mineral resources are classified as measured, indicated and inferred based on relative levels of confidence in their estimation and on technical and economic parameters consistent with the methods considered most suitable to their potential commercial extraction. For Rainy River the designators ‘open pit’ and ‘underground’ have been applied to differentiate the envisioned mining method for different portions of a resource. The designators ‘direct processing’ and ‘lower grade material’ have been applied to differentiate material envisioned to be mined and processed directly from material to be mined and stored separately for future processing. Proven mineral reserves referred to as ‘Surface Stockpiles’ represents material that has been mined and stockpiled for future processing. |
7. | Mineral reserves and mineral resources may be materially affected by environmental, permitting, legal, title, taxation, sociopolitical, marketing and other risks and relevant issues. Additional details regarding mineral reserve and mineral resource estimation, classification, reporting parameters, key assumptions and associated risks for each of New Gold’s material properties are provided in the respective NI 43-101 Technical Reports, which are available at www.sedar.com. |
8. | The preparation of New Gold's consolidated statement and estimate of mineral reserves has been completed under the oversight and review of Mr. Nicholas Kwong, Director of Technical Services for the Company. Mr. Kwong is a Professional Engineer and member of the of Professional Engineers Ontario. Preparation of the Company’s consolidated statement and estimate of mineral resources has been completed under the oversight and review of Mr. Mark Petersen, a consultant to New Gold and former Vice President, Exploration for the Company. Mr. Petersen is a Professional Geoscientist (P. Geo.) and Practising Member of the Association of Professional Geoscientists of Ontario, an SME Registered Member and an AIPG Certified Professional Geologist. Messrs. Kwong and Petersen are "Qualified Persons" as defined by NI 43-101. |
18 |
MINERAL PROPERTIES
Rainy River Mine, Canada
Project Description, Location, Access and Other Information
The Rainy River Mine is located in the southern half of Richardson Township, approximately 50 kilometres northwest of Fort Frances in northwestern Ontario, Canada. Regional population centres Kenora and Thunder Bay lie 162 kilometres to the north and 418 kilometres to the east, respectively. Access to the mine area is via secondary all-weather roads branching off Trans-Canada Highways 11 and 71. An east-west rail line is located 21 kilometres to the south, populated by a number of small towns and villages. Temperature extremes generally range from 35 degrees Celsius to minus 40 degrees Celsius. Annual precipitation averages approximately 60 centimetres rainfall and 150 centimetres snowfall. Mining activities are conducted year-round.
Terrain in the vicinity of the Rainy River Mine is dominated by a distinct northwest to southeast divide known as the Rainy Lake-Lake of the Woods Moraine. Topography is relatively gentle, with relief ranging from zero southwest of the divide to up to 90 metres northeast of the divide. In areas of low relief, bedrock typically is overlain by glacial till, thick silts and clays and, in poorly drained areas, by thick peat.
The Rainy River Mine occupies approximately 6,050 hectares, comprising 87 patented mining rights and surface rights claims (including 8 leasehold interest mining rights and/or surface rights claims). In addition, the Company has a land package of approximately 31,114 hectares surrounding the mine site, including patented mining rights and/or, surface rights and unpatented claims. The land package includes claims acquired from GoldON Resources Ltd. in January 2019 northeast of the mine site. All unpatented claims are in good standing and assessment work credits are sufficient to maintain that standing for several years.
All mineral tenures are held in the name of New Gold. The currently defined mineral reserves and mineral resources lie largely within nine patented claims, a portion of which are covered by either a 2% NSR royalty or a 10% net profits interest royalty. In addition, New Gold has agreed to financial participation in the Mine in the form of royalties in favour of certain First Nations.
In July 2015, New Gold entered into a $175 million streaming agreement with Royal Gold A.G. a wholly owned subsidiary of Royal Gold Inc. (“Royal Gold”) in which Royal Gold agreed to provide New Gold with an upfront deposit of $175 million, which was used for the development of the Rainy River Mine, in return for: (i) 6.5% of the Project’s gold production up to a total of 230,000 ounces of gold, and 3.25% of the Mine’s gold production thereafter; and (ii) 60% of the Project’s silver production up to a total of 3.1 million ounces of silver, and 30% of the Project’s silver production thereafter. In addition to the upfront deposit, Royal Gold will pay 25% of the average spot gold or silver price at the time each ounce of gold or silver is delivered under the stream. The terms of the streaming agreement also require the Company to meet a Leverage Ratio for future periods (as measured on a rolling four-quarter basis at the end of every quarter) of 3.5 to 1.0, among other covenants.
History
Exploration commenced in the Rainy River area during the period 1967 to 1989, during which time the Ontario Geological Survey conducted sporadic geologic mapping, and companies including Noranda, International Nickel Corporation of Canada, Hudson’s Bay Exploration and Development and Mingold Resources were active in the area.
19 |
Nuinsco Resources Limited (“Nuinsco”) initiated exploration of the area in 1990. During the period 1993 through 2004, Nuinsco engaged in geologic mapping, geochemical grid sampling, magnetic and IP geophysical surveys and Landsat remote sensing studies. Additionally, Nuinsco completed 597 reverse circulation holes and 217 diamond drill holes (49,515 metres) during the period. The program resulted in the discovery of three significant zones of gold mineralization (the 17, 34 and 433 Zones). Nuinsco drilled a final eight diamond drill holes (1,549 metres) in 2004 to test the depth continuity of the 34 Zone.
RRRL acquired a 100% interest in the Rainy River Mine from Nuinsco in June 2005. RRRL re-logged portions of historical core, established a GIS database, conducted petrographical studies, and carried out airborne and ground-based geophysical surveys. During the period 2005 through 2007, RRRL drilled more than 100 reverse circulation holes and 209 diamond drill holes (95,340 metres). Additional diamond drilling by RRRL from 2008 through February 2011 totaled 449 diamond drill holes (239,329 metres) and 375 diamond drill holes (181,682 metres) drilled from March to December 2011. RRRL published a Feasibility Study for the Project in May 2013 based on 1,435 diamond drill holes (662,849 metres) representing drill results through June 10, 2012.
RRRL drilled an additional 225 diamond drill holes (77,969 metres) between August 2012 and June 2013, focusing on the Intrepid Zone situated one kilometre east of the proposed open pit. By June 2013, a number of significant gold mineralized zones had been defined over a 3.5-kilometre strike length. New Gold acquired the Rainy River Mine through its purchase of RRRL in 2013. New Gold completed an updated Feasibility Study in January 2014 incorporating the previous exploration results. In 2015, New Gold acquired Bayfield Ventures Ltd. (“Bayfield”), which held a 100% interest in six patented mining rights claims and six unpatented claims totaling approximately 11 square kilometres adjacent to the Rainy River Mine.
Geological Setting and Mineralization
The Rainy River Mine lies within the Rainy River Greenstone Belt, part of the larger Late Archean age Wabigoon Subprovince of komatiitic to calc-alkaline metavolcanics overlain by clastic and chemical sediments and intruded by granitoid batholiths. The intrusions deformed their host rocks into synformal fold structures, often producing shear zones along the axial planes. Rocks within the immediate area of the mine comprise a series of tholeiitic mafic rocks structurally overlain by calc-alkalic intermediate to felsic metavolcanic rocks. Rocks of intermediate dacitic composition host most of the gold mineralization.
In much of the mine area and surrounding region the Archean metavolcanic and sedimentary rocks are overlain by a sequence of unconsolidated Mesozoic and Quaternary age glacial sediments and tills containing locally anomalous concentrations of detrital gold, auriferous pyrite and copper-zinc sulphides derived from the underlying mineralized bedrock. This sequence is in turn overlain by a younger sequence of glacially-derived clays, silts and till that are devoid of any anomalous detrital gold or sulphides.
Four main styles of gold and silver mineralization have been identified at Rainy River: gold-bearing sulphide ± quartz stringers and veins in felsic quartz-phyric rocks (ODM/17 and 34, Beaver Pond, 433 and HS Zones); quartz-ankerite-pyrite shear veins in mafic volcanic rocks (CAP/South Zone); sulphide-bearing silver-enriched quartz veinlets in dacitic tuffs and breccias (Intrepid Zone) and copper-nickel-platinum group metals mineralization hosted in a small younger mafic-ultramafic intrusion (34 Zone) situated within the main cluster of gold and silver deposits. All deposits show some degree of deformation, excepting the copper-nickel-platinum-bearing type. Most of the gold mineralization identified to date occurs in the sulphide-bearing stringers and veins within the felsic quartz-phyric rocks.
20 |
Mineralized zones hosted by the felsic rocks generally follow the regional northwesterly strike and southerly dip of stratigraphy. The largest of these is the ODM/17 Zone which extends 1600 metres along strike, 975 metres down dip, and over a true width of 200 metres.
The Rainy River mineralization is interpreted to be a hybrid deposit type consisting of early gold-rich volcanogenic sulphide mineralization overprinted by shear-hosted mesothermal gold mineralization associated with regional deformation. A final stage of hydrothermal mineralization in the main auriferous zones crosscuts both types of earlier mineralization.
Exploration and Drilling
Exploration targeting and drilling undertaken in the Rainy River project area of the mine prior to New Gold’s acquisition of the property through its acquisition of RRRL are summarized in the section entitled “History”.
Since New Gold’s acquisition of RRRL, the Company has focused its exploration efforts within a five kilometre radius of the central mine development area. From January 2014 through December 2018, a total of 96,750 metres of core drilling in 353 holes has been completed to delineate and improve estimation confidence for the classified mineral resource both laterally and at depth, and to provide geotechnical information for the mining operation. The results of this drilling in combination with the historic drilling described above provide the basis for the current mineral resource and mineral reserve estimates.
Drilling procedures conducted by Nuinsco from 1994 to 1998 are not well documented. Drilling carried out from 2005 through 2018 by RRRL, Bayfield and New Gold have utilized predominantly NQ diameter (4.76 cm) drill core. Some deeper holes have been collared in HQ diameter (6.35 cm) and later reduced to NQ diameter to attain target depths. PQ diameter (8.5 cm) drill core was utilized for certain metallurgical samples. Both RRRL and New Gold have realized excellent core recoveries and have surveyed all drill holes and collars according to accepted industry standards. The drilling procedures utilized by RRRL and New Gold are considered consistent with industry best practices and the quantity and quality of the lithological, geotechnical, collar and down-hole survey data collected in the exploration and infill drill programs completed by RRRL and New Gold are considered sufficient to support mineral resource estimation.
Sampling and Analysis
There are no records describing the sampling and analytical methods used by Nuinsco during its drilling programs. Mineralized sections of core were re-sampled and analyzed by RRRL to incorporate into the drill database.
Sampling and analysis of drill core has been conducted via industry best practices under New Gold, RRRL and Bayfield drilling programs. Sampling was typically conducted at nominal 1.5 metre intervals, though Bayfield sampling intervals vary from 0.5 to 1.5 metres in length. Core was sawn and half placed in sample bags for laboratory analysis. Certified reference standards, blanks and duplicates were systematically inserted into the sample batches to be shipped to the lab. Samples were collected on site by a Fort Frances shipping company and delivered directly to the laboratory.
RRRL used two principal accredited laboratories for analyses: ALS Vancouver, British Columbia from 2005 to 2006 and from early 2011 onward; and Accurassay Laboratories in Thunder Bay, Ontario from 2006 to 2011. Bayfield’s drill core was analyzed by Activation Laboratories (“Actlabs”), an accredited laboratory located in Thunder Bay, Ontario. New Gold uses ALS for the analysis of its exploration and resource delineation drilling at the Rainy River Mine. Since the start of commercial production in late 2017, analyses of grade control samples for the open pit (and future underground) mine have been done by an onsite analytical laboratory. All of these laboratories use standard industry analytical procedures: fire assay procedures for precious metal analyses; aqua regia digestion and atomic absorption spectrometry
21 |
for metal analyses; and ICP and graphite furnace analyses for calcium, sulfur and other elements required for waste rock characterization. Each laboratory employs an internal QA/QC program in accordance with its accreditation requirements. Additionally, the company employs a separate set of best practice QA/QC protocols for all of its exploration and resource definition sampling programs. These protocols involve a combination of routine checks and duplicate analyses on a minimum of 25 percent of the total number of samples analyzed to assure acceptable levels of sampling accuracy and precision are maintained.
Data verification includes site visits to inspect procedures, QA/QC data validation and examination of database accuracy. Since ALS’s 2011 reinstatement as the primary laboratory for mineral resource drilling at the Rainy River Mine, an overall improvement in QA/QC performance has been noted. The results of data verification as well as 2018 mine production and reconciliation data indicate the data collected for mineral resource definition at the Rainy River Mine adequately reflect deposit dimensions, style, and true widths of mineralization; adequately support the geological interpretations; and are of sufficient analytical and database quality for use in mineral resource estimation.
Mineral Processing and Metallurgical Testing
Metallurgical testing was performed to evaluate the mineralogy of the deposit and contribute to the design of the Rainy River Mine’s processing plant and tailings facility. A number of studies and tests were performed, including mineralization, comminution, gravity separation, flotation, flotation concentrate leaching, whole ore leaching, cyanidation, carbon adsorption modelling, cyanide destruction and solid-liquid separation. It was determined that whole rock leaching with gravity separation was the most economical processing alternative for the ore mainly because, among other reasons, it required less energy and cyanide inputs than other processing alternatives.
Infrastructure, Permitting and Compliance Activities
Infrastructure and local terrain are accessible, with numerous gravel/paved roads, power and water resources and areas for tailings management facilities available within close proximity. Personnel for the mine, including skilled trades and professions, have been and will continue to be sourced through a combination of local hiring and broader recruitment efforts.
Power is supplied to the mine through a connection to a provincial transmission line approximately 17 kilometres to the east. There is a supply of water in the area from the Pinewood River, and a pipeline has been constructed from the Pinewood River to the site. A site water management pond contains water for mineral processing. A water treatment plant will be constructed in 2019. Other infrastructure includes open pit infrastructure, the processing plant, assay laboratory facilities, administrative offices, storage facilities and other support infrastructure.
In 2012, RRRL (prior to its acquisition by New Gold), and six Rainy River-area First Nations entered into a Participation Agreement with respect to the development and operation of the Rainy River Mine. The Participation Agreement identifies key project milestones to be met through mutual cooperation and consultation with the First Nations. In 2014, the Company concluded an Impacts and Benefits Agreement with Naicatchewenin First Nation and Rainy River First Nations embracing commitments to environmental and sustainable development and ensuring that First Nation communities and members benefit from opportunities resulting from the Project in their traditional territory. The Company also concluded Participation Agreements with the Métis Nation of Ontario in 2014, the Big Grassy River First Nation in 2015, the Naotkamegwanning First Nation, Ojibways of Onigaming First Nation and the Anishinaabeg of Naongashing First Nation in 2017, and the Animakee Wa Zhing 37 First Nation in 2018. The Participation Agreements provide for how each of these communities will benefit from the Rainy River Mine. New Gold has ongoing dialogue with local communities and various First Nations in the area surrounding the Rainy River Mine.
22 |
During the course of construction of the water and tailings management area (“TMA”) at the Rainy River Mine, deformations were identified at one of the dams associated with such facilities. In line with best practices in Canada, the Company has established an Independent Tailings Review Board (“ITRB”), which is comprised of four independent experts, to provide input with respect to tailings management at New Gold’s operations and projects in Canada. After receiving feedback from the ITRB and the Ministry of Natural Resources and Forestry (“MNRF”) and completion of additional geotechnical drilling to further investigate the ground conditions, New Gold redesigned Rainy River’s tailings management facility. The final redesign included the use of flatter slopes, rock toe buttresses and wick drains, and New Gold also implemented enhanced construction management procedures. The Company has decided to extend aspects of the redesign across all of the water and tailings management facilities. The Company received approval to recommence construction of the TMA from MNRF in mid-November 2016. On September 28, 2017, New Gold announced that the amendment to Schedule 2 of the Metal Mining Effluent Regulations under the Fisheries Act (Canada) to close two small creeks and deposit tailings under the Fisheries Act (Canada), had become effective, which was also required to complete construction of the TMA. The TMA is made up of three cells. Cell 1 is the start-up cell, which provided capacity for mill tailings through March 2018, followed by Cells 2 and 3. Cell 2 was brought into operation in 2018.
In 2017, New Gold was subject to charges in relation to two incidents from 2016. Specifically, on July 13, 2017, New Gold was charged with five breaches of the Environmental Protection Act (Ontario) in connection with alleged effluent discharges at the Rainy River project in July 2016 in excess of permit limits. On November 9, 2017, New Gold plead guilty to discharging un-ionized ammonia above the EPA limit on July 27, 2016 and failing to report a July 20, 2016 discharge above the standard for un-ionized ammonia. The three remaining charges were withdrawn. New Gold was sentenced to a fine of C$100,000 for the July 27, 2016 discharge and C$50,000 for the failure to report the July 20, 2016 discharge. A mandatory victim surcharge of 25% applies to the fines, for a total amount owing of $187,500. In addition, on July 24, 2017, New Gold was charged with two breaches of the Lakes and Rivers Improvement Act (Ontario) in connection with water allegedly overtopping a dam on the Rainy River construction site prior to completion of construction of the dam. On July 11, 2018, New Gold pleaded guilty to one charge and was sentenced to a fine of C$100,000 (plus a mandatory surcharge of 25%); the other charge was withdrawn.
The mine closure plan was accepted by the Ontario Ministry of Energy, Northern Development and Mines (“ENDM”) on February 23, 2015. As of December 31, 2018, bonding of C$83.9 million has been posted pursuant to the closure plan. The undiscounted closure cost liability for Rainy River as at December 31, 2018 is estimated to be $68.5 million. An updated closure plan is expected to be approved by ENDM in 2019, which may affect the amount required for reclamation security.
Mineral Reserve and Mineral Resource Estimates
The Rainy River Mine Mineral Reserves, effective December 31, 2018, are presented in the “Mineral Reserve Estimates” table. The Rainy River Mine Mineral Resources, effective December 31, 2018, are presented in the “Measured and Indicated Mineral Resource Estimates (Exclusive of Mineral Reserves)” and “Inferred Mineral Resource Estimates” tables. See “Description of Business – Mineral Reserve and Mineral Resource Estimates” on page 14. The parameters, assumptions and methodologies applied in generating the mineral reserve and mineral resource estimates are considered reasonable and appropriate. Furthermore, the mining, metallurgical, infrastructure, permitting and other relevant factors relating to the Rainy River Mineral Reserves and Mineral Resources fully support these estimates.
23 |
Mining Operations
The Rainy River Mine commenced processing ore on September 14, 2017 and completed its first gold pour on October 5, 2017. Commercial production was achieved on October 19, 2017. The projected life of the Rainy River Mine extends through 2032 based on current mineral reserves and throughput levels.
The life-of-mine plan for Rainy River includes an underground mine. Development of the underground mine began in the second half of 2018 but further development has been deferred to 2020. During 2019, the Company will launch a comprehensive review that includes assessing alternative underground mining scenarios with the overall objective of reducing capital and improving the return on investment for the underground portion of the life of mine.
Mining Methods
Surface mining uses a conventional truck/shovel open-pit mining method, with 10 metre benches. The pit was designed considering the geology of the bedrock, which is considered to have a good rock mass rating and geological strength index for an open pit design. In 2019, the Company is pursuing overall equipment efficiencies with the objective of optimizing open pit mining productivity and unit cost performance.
Recovery Methods
Run-of-mine material is delivered to a common gyratory crusher for size reduction, stockpiling and delivery to the processing plant. The processing plant is a SAG/ball mill/crusher circuit feeding a whole-ore-leach gold-silver recovery plant. A portion of the coarser material will be subjected to a gravity circuit. The gravity concentrate will be sent to a cyanidation reactor and electrowinning cell for gold and silver extraction. Ground mineralized material will be thickened, passed through a leaching and carbon-in-pulp extraction circuit, and subjected to carbon stripping and electrowinning prior to being smelted into a gold-silver doré. Life-of-mine recoveries are expected to be approximately 90% for gold and approximately 55% for silver. Gold recovery for the fourth quarter of 2018 was 89%. The mill’s nameplate capacity is 21,000 tpd, or 7.7 mtpa, however, the Company has focused optimizing the milling process to increase the throughput to 24,000 tpd in 2019 and 2020. The average run rate for the fourth quarter of 2018 was 25,835 tpd.
The Company plans to make improvements to the mill in 2019 that are expected to improve mill availability and throughput rate, including the replacement of the ball mill trunnion during the first quarter, as well as several upgrades designed to correct and improve all circuits, with a particular focus on grinding, stripping and carbon regeneration. Following this, effort will be directed on maximizing the efficient use of the Semi-Autogenous Grinding (SAG) and ball mills, as well as on commissioning the pebble crusher, with the overall objective of optimizing both throughput and grind size.
Capital and Operating Costs
During 2018, the Rainy River Mine produced 227,284 ounces of gold at an operating expense per ounce of gold sold of $826 and all-in sustaining costs of $1,501 per ounce. In 2019, the Rainy River Mine is expected to produce between 245,000 and 270,000 ounces of gold with an expected operating expense per gold ounce sold of between $870 and $950 per ounce and all-in sustaining cost of between $1,690 and $1,790 per ounce. 2019 guidance assumes a foreign exchange rate of C$1.30 to one United States dollar. All-in sustaining costs per ounce is a non-GAAP measure. See “Non-GAAP Measures” on page 5. Sustaining capital expenditures at the Rainy River Mine are expected to be approximately $210 - $230 million in 2019. Below is a breakdown of expected capital expenditures and expected all-in sustaining costs at the Rainy River Mine for 2019.
24 |
2019 Expected Capital Expenditures(1) | 2019 Expected All-in Sustaining Costs/ gold oz sold | |||
Sustaining Capital(2) | $210 - $230 | Operating Expense | $870 – $950 | |
Growth Capital(2) | ~$3 | + by-product revenue and expenses(3) | ~($5) | |
Total | $213 - $233 | + sustaining expenditures(4) | ~$835 | |
Total All-in Sustaining Costs | $1,690 - $1,790 |
(1) | In millions. |
(2) | Based on the Company’s 2019 estimated capital expenditures. Sustaining capital excludes expenditures related to growth-related initiatives. Growth capital excludes sustaining capital. |
(3) | Includes revenue from the sale of copper and silver by-product and expenses related to their production and sale. |
(4) | Includes sustaining capital expenditures, capitalized mining, capitalized and expensed exploration that is sustaining in nature, environmental reclamation costs and sustaining capital leases. See “Non-GAAP Financial Performance Measures” in New Gold’s MD&A. |
Development and Exploration
Up to 72% of expected sustaining capital for the year is to complete deferred mine construction, primarily related to the tailings disposal facility, installation of wick drains to implement the engineered stabilization of the waste dumps, completion of the water treatment train, construction of a maintenance and warehouse facility, mill modifications and improvements that allow efficient operation of the gravity circuit, pebble crusher, ore classification system and camp facility. The remaining expected sustaining capital expenditure includes acquiring additional mobile equipment, mill upgrades and waste stripping.
During 2019 an exploration drilling program of up to 7,500 meters is planned as an initial test of the potential for additional gold resources in the area located immediately to the north of the Intrepid ore body and adjacent the mill processing facility. Reconnaissance level exploration is also planned in 2019 to identify new areas of potential gold mineralization within the Company’s broader regional mineral tenure.
New Afton Mine, Canada
Project Description, Location, Access and Other Information
The New Afton Mine is located approximately 350 kilometres northeast of Vancouver in the south-central interior of British Columbia. The property is 10 kilometres from the regional hub of Kamloops and is readily accessible year-round by paved road. The mine has a continental, semi-arid climate, with light winter snow and infrequent rain during the spring, summer and fall. Summer temperatures can reach 38 degrees Celsius and winter temperatures are generally at, or near, freezing.
The New Afton Mine occupies the site of the historic Afton mine and includes an open pit (currently inactive), underground workings and support facilities. The New Afton deposit extends to the southwest from immediately beneath the Afton open pit. As it is currently defined, the deposit hosts a mineral resource comprised of the A&B-zones, the C-zone and the Hanging Wall Lens. The A&B-zones host the portion of the mineral reserve currently being mined, with the C-zone hosting additional mineral reserves located immediately below the A&B-zone. The C-Zone was the subject of the C-zone Feasibility Study completed in January 2016. The Hanging Wall Lens is a satellite mineral resource located adjacent to the historic Afton open pit which is not currently part of the New Afton mineral reserve.
25 |
The Company’s holdings in the area comprise the Afton group of claims and the Ajax group of claims. The New Afton Mine lies within the Afton group. The Afton group consists of a 902-hectare mining lease issued by the Ministry of Energy, Mines and Petroleum Resources on November 29, 2006 (“Afton Mining Lease”) and 64 mineral claims totaling 13,384 hectares. The Company also holds surface rights on approximately 2,300 hectares surrounding the New Afton Mine. Sufficient surface rights have been obtained for current operations at the property.
History
The first significant mining-related activity in the Afton area commenced in 1970, when drilling by Afton Mines Ltd. intercepted 52 metres of 0.4% copper in what ultimately became the Afton deposit. During the subsequent three years, over 45,700 metres of drilling was carried out by a number of operators.
Teck Corporation and Iso Mines Ltd. acquired the Afton property in 1973 and initiated engineering and metallurgical studies. Commercial production commenced at the Afton open pit mine in late 1977. Mining took place at the Afton, Crescent, Pothook and Ajax pits. The mine closed in 1997.
In 1999, the Company acquired an option on the property, staked additional claims and in 2000 began a concerted exploration program to test the potential for additional mineralization extending beyond the Afton open pit. This work resulted in the successful delineation of the New Afton underground mineral resource.
Geological Setting and Mineralization
The New Afton deposit is a copper-gold, alkalic porphyry system situated within the Iron Mask batholith complex. The Iron Mask complex is part of the Paleozoic age island-arc assemblage known as the Quesnel Terrane. Regional-scale fault zones are believed to be the principal control to intrusion of the batholithic rocks and related copper and gold mineralization in the New Afton area.
Mineralization is characterized by discontinuous copper sulphide veinlets and disseminations (principally chalcopyrite and minor bornite) at brecciated margins between altered porphyry intrusives and volcanic rocks of the Triassic Nicola Formation. The copper sulphides are replaced by tennantite-tetrahedrite locally and along faults that transect the mineralized body. Native copper with accessory chalcocite occurs in minor amounts within highly oxidized near-surface portions of the deposit. Gold and silver generally occur as electrum grains within the chalcopyrite and bornite.
The bulk of the New Afton deposit forms a tabular, nearly vertical, southwest-plunging zone of continuous mineralization measuring 1.4 kilometres long by approximately 100 metres wide, with a down-plunge extent of over 1.5 kilometres. The deposit plunges toward the southwest where it remains open at depth.
Exploration and Drilling
The Company initiated surface drilling at New Afton in 2000, and in 2001 completed an initial scoping study which was followed by further definition drilling. A subsequent more advanced scoping study was completed in 2004.
In November 2004, an underground access portal was excavated in the former Afton open pit and a ramp driven 2,200 metres to provide access for underground sampling, infill drilling and further exploration drilling.
In late 2005 New Gold commissioned a Feasibility Study which was completed in 2007 and laid the foundation for the current mining operation. Exploration prior to and subsequent to the 2007 Feasibility Study has focused primarily on the delineating mineral resources within and immediately adjacent to the New Afton deposit. Exploration beyond the limits
26 |
of the deposit has involved preliminary scout drilling of satellite targets identified within the Afton mine lease and generative reconnaissance level exploration of the Company’s broader regional mineral tenure.
During the period from 2000 through 2018 a series of diamond bit core drilling campaigns have been conducted at New Afton to delineate the mineral resource currently being mined and additional resources located in the adjacent Hanging Wall Lens zone to the south and underlying C-zone. Additionally, reconnaissance scout drilling has been conducted to test the potential of other exploration targets located within the Afton mining lease. [Drilling completed from 2000 to 2018 comprises 557 core holes totaling 254,151 metres, the results of which have been incorporated into the Company’s mineral reserve and mineral resource estimates.
New Gold has likewise completed a series of airborne and ground-based geophysical surveys over its mineral tenure in the immediate mine area and broader region. The results of this work are being used to support ongoing exploration of the New Afton district.
Sampling and Analysis
Sampling protocols have remained generally consistent among the different drill campaigns with a few incremental improvements over time. Sampling intervals have averaged two metres in all campaigns since 2003. Routine insertion of blanks and standards into the sample stream has been conducted since 2005. Drilling protocols in place at New Afton meet or exceed common industry standards.
Sample preparation, which involves drying, crushing and pulverizing rock to produce a pulp sample sufficient for analysis, has been conducted according to accepted industry practice. Analytical work prior to July 2012 was conducted by ALS Global of Kamloops, British Columbia (formerly EcoTech Laboratories Ltd.). Since July 2012, sample preparation and analyses have been performed by Activation Labs of Kamloops, British Columbia. Analytical procedures for samples collected during the 2000-2003 drilling programs included conventional fire assay with an AA or ICP finish for gold and palladium, and AA for copper and silver. During 2005 and all subsequent drilling programs, copper and silver assays were determined using standard acid digestion followed by an AA finish. Gold and palladium were determined using fire assay followed by an AA finish. Each laboratory employs an internal QA/QC program in accordance with its accreditation requirements. Additionally, the Company employs a separate set of best practice QA/QC protocols for all of its exploration and resource definition sampling programs. These protocols involve a combination of routine checks and duplicate analyses on a minimum of 25 percent of the total number of samples analyzed to ensure acceptable levels of sampling accuracy and precision are maintained.
Sampling and analytical protocols are considered to have been appropriate and consistent with common industry practice, data quality is adequate for resource estimation, and protocols for data acquisition and management are reasonable.
Mineral Processing and Metallurgical Testing
Metallurgical testing was performed to evaluate the mineralogy of the deposit and contribute to the design of the New Afton Mine’s processing plant and tailings facility. A number of studies and tests were performed as part of the testing program, including mineralogical studies, modal analysis, grinding tests, flotation tests, gravity tests, variability tests and dewatering tests. It was determined that conventional crushing, grinding and concentration processes were appropriate given the mineralogy of the deposit.
The deposit consists primarily of primary hypogene sulphide mineralization, but some secondary supergene sulphide and native copper mineralization is also present. Localized elevated arsenic concentrations in the deposit which may pose an
27 |
economic concern for the concentrate produced are mitigated through ore blending. Supergene ore is expected to impact the New Afton mill feed in 2019 and will require an additional step in the processing circuit to recover native copper and free gold. Current metallurgical studies are investigating gravity separation, jigging, dense media separation and coarse particle flotation methods to address the requirements of the supergene ore.
Infrastructure, Permitting and Compliance Activities
Power is supplied to the New Afton Mine via its connection to the BC Hydro grid through a substation located approximately one kilometre away. Water is supplied from Kamloops Lake through an approximately four-kilometre pipeline. Other infrastructure the processing plant, maintenance shop and warehouse, administrative offices, storage facilities and other support infrastructure.
Two First Nations, the Tk’emlúps te Secwépemc and the Skeetchestn Indian Band (collectively, the “SSN”) have asserted Aboriginal rights and interests in the Mine area. A formal agreement between the SSN and New Gold dated March 20, 2008, and amended and restated November 14, 2011 (“Participation Agreement”) provides the SSN’s consent to the New Afton Mine and agreement not to challenge any New Gold interests or permits related to the mine before a court of law. New Gold has undertaken to provide the SSN with certain economic and social benefits, including education, training, employment and business opportunities. In accordance with the Participation Agreement, New Gold must make annual payments into a trust created for the benefit of SSN members. Furthermore, New Gold must pay the trust, in each year in which commercial production occurs at the mine, a percentage of net smelter returns ranging from 0.5% to 2%, depending on the price of copper and whether New Gold has recovered its development and construction costs, subject to an annual minimum amount.
On October 31, 2007, the Ministry of Energy, Mines and Petroleum Resources issued Mine Permit M-229 approving the work system and reclamation program for the New Afton Mine. The Mine Permit will need to be amended in the future to allow mining of the B3-block and C-zone. The B3 amendment is expected to be submitted 2019 with active mining of that zone scheduled to begin in 2021. The Mine Permit obligates New Gold to post reclamation security of C$9.5 million. An updated reclamation and closure plan was submitted to the Ministry in 2018, which would increase the post reclamation security of C$14.4 million if approved. As at December 31, 2018, the Company has posted this security in the form of an irrevocable standby letter of credit. The undiscounted closure cost liability for the New Afton Mine as at December 31, 2018 is estimated to be C$14.8 million based on a third party cost estimate. New Gold expects to incur this obligation between 2019 and 2047, including obligations to monitor post-closure. The site is considered a zero discharge facility with regard to liquid effluents. All waste waters are either deposited in the tailings area and recycled to the processing plant or treated offsite.
Mineral Reserve and Mineral Resource Estimates
The New Afton Mineral Reserves, effective December 31, 2018, are presented in the “Mineral Reserve Estimates” table. The New Afton Mineral Resources, effective December 31, 2018, are presented in the “Measured and Indicated Mineral Resource Estimates (Exclusive of Mineral Reserves)” and “Inferred Mineral Resource Estimates” tables. See “Description of Business – Mineral Reserve and Mineral Resource Estimates” on page 14.
The parameters, assumptions and methodologies applied in generating the mineral reserve and mineral resource estimates are considered reasonable and appropriate. Furthermore, the mining, metallurgical, infrastructure, permitting and other relevant factors relating to the New Afton mineral reserves and mineral resources fully support these estimates. It has been noted, however, that the ground subsidence that has occurred to date is slightly offset from the original mine plan design, an offset which is thought to be driven largely by a weaker rockmass located south of the underground block cave footprint. A large expansion of the existing subsidence monitoring network was implemented in
28 |
2016 and 2017 which has further improved the Company’s ability to accurately track and monitor changes in the surface subsidence profile and the rockmass at depth and to implement appropriate measures to mitigate any potential impact of such subsidence, including any impact to the mineral reserves, as appropriate. Real time monitoring that was incorporated into the in instrumentation in 2017 and has further improved the Company’s ability to accurately track and monitor changes in the surface subsidence profile and to implement appropriate measures as required. The analyses conducted from this data have indicated that there has been a reduction in the surface subsidence perimeter, largely attributed to the shift in production from the West to East cave.
Mining Operations
The New Afton Mine began commercial production on July 31, 2012 and has a current projected life extending through 2022 based on current Mineral Reserves contained within the A&B-zones and throughput levels. The C-zone could provide an additional five years of production at current throughput levels. See “Exploration and Developments - New Afton C-zone” on page 31.
Mining Methods
The New Afton Mine is a block cave mining operation. Other mining methods, including open pit mining and sublevel caving, were considered but block caving was chosen for the New Afton deposit because this method starts from the bottom and is conducive to large-scale low-cost mining. The operation is designed to produce close to 5 Mtpa of copper-gold ore for processing in a flotation plant. Each block in the block cave has an undercut and extraction level. Ore is hauled to ore passes and dropped to a tramming level, where it is hauled by trucks to the crusher level. From the crusher, the ore is conveyed from underground to the mill via a 4.5-kilometre long conveyor system.
Waste mined as part of development activities is transported to surface by conveyor and deposited in an area apart from the ore via a belt plow. The waste is then trucked to an area on the edge of the historic Afton mine pit. Less than 5% of the mined rock is treated in this manner.
Recovery Methods
The New Afton mill was originally designed to process 11,000 tpd (4 Mtpa) of ore, recovering copper, gold and silver in a concentrate. A mill expansion was completed in 2015 to enable processing of over 15,000 tpd.
The mill processes a blend of primary hypogene and secondary supergene ore types using conventional crushing, grinding and concentration processes. To address increased amounts of supergene ore in the mill feed in 2019, a two-phase mill upgrade has been undertaken to increase supergene ore recovery. The first phase was completed on time and on budget during the fourth quarter of 2018, which included the installation of pressure jigs and a magnetic separator with commissioning currently underway. The second phase of the planned upgrade is expected to launch during the first quarter of 2019 with commissioning scheduled for the third quarter. Mineral separation is by gravity concentration and differential flotation of the copper bearing minerals to recover copper, gold and silver in a sulphide concentrate. Life-of-mine recoveries are expected to total 80% for copper, 75% for gold and 68% for silver.
Capital and Operating Costs
During 2018, the New Afton Mine produced 77,329 ounces of gold at an operating expense per ounce of gold sold of $384 and all-in sustaining costs of negative $1,626 per ounce ($623 per ounce on a co-product basis). The New Afton Mine produced 85.1 million pounds of copper in 2018 at an operating expense per pound of copper sold of $0.93. In 2019, the New Afton Mine is expected to produce between 55,000 – 65,000 ounces of gold with an expected operating expense per gold ounce sold of between $480 - $520 per ounce and all-in sustaining cost of between negative ($500) – ($420) per ounce. 2019 guidance assumes a $2.75 per pound copper price and a foreign exchange rate of C$1.30 to one
29 |
United States dollar. All-in sustaining costs per ounce is a non-GAAP measure. See “Non-GAAP Measures” on page 5. Sustaining capital expenditures at the New Afton Mine are expected to be approximately $45 to $55 million in 2019. Below is a breakdown of expected capital expenditures and expected all-in sustaining costs at the New Afton Mine for 2019.
2019 Expected Capital Expenditures(1) |
2019 Expected All-in Sustaining Costs/ gold oz sold | |||
Sustaining Capital(2) | $45 - $55 | Operating Expense | $480 - $520 | |
Growth Capital(2) | $40 - $45 | + and by-product revenue and expenses(3) | ~($1,830) | |
Total | $85 - $100 | + sustaining expenditures(4) | ~$870 | |
Total All-in Sustaining Costs | ($500) – ($420) |
(1) | In millions. |
(2) | Based on the Company’s 2019 estimated capital expenditures. Sustaining capital excludes expenditures related to growth-related initiatives. Growth capital excludes sustaining capital. |
(3) | Includes revenue from the sale of copper and silver by-products and expenses related to their production and sale. |
(4) | Includes sustaining capital expenditures, capitalized mining, capitalized and expensed exploration that is sustaining in nature, environmental reclamation costs and sustaining capital leases. See “Non-GAAP Financial Performance Measures” in New Gold’s MD&A. |
Exploration and Development
New Afton C-zone
The Company is launching an internally funded development program for the C-zone in 2019. The C-zone is the down plunge extension of the B-zone block cave that is currently being mined at New Afton. It shares the same mineralogy and metallurgical characteristics as the ore currently being mined in the west cave of the B-zone. The C-zone extraction level would be approximately 550 metres below the current B-zone extraction level. The C-zone program would use the same development, production and materials handling strategies that are currently being used to mine the B-zone. The Company completed a Feasibility Study in January 2016, which confirmed the viability and positive economics for the C-zone deposit (separate from the current mining of the B-zone) determined in the 2015 scoping study described in the most recent technical report for the New Afton Mine. The C-zone is expected to have a mine life of over five years and will extend New Afton’s mine life to 2030.
Growth capital for 2019 is estimated to be between $40 and $45 million, which primarily encompasses the advancement of an exploration decline and the purchase of required mobile equipment and infrastructure. Growth capital in 2020 is expected to be consistent with 2019 and will increase substantially during the period from 2021 to 2023, with remaining capital requirements declining in 2024 and 2025.
Other Projects
During 2019 an underground exploration drilling program of up to 8,000 meters has been planned as an initial test of the down plunge extension of the mineralization below C-Zone. Reconnaissance level drilling is also planned as first a pass
30 |
evaluation in newly identified areas of prospective mineralization on the Company’s broader New Afton regional mineral tenure.
Blackwater Project, Canada
The following disclosure does not contain detailed information pertaining to the Capoose, Auro, Key, Parlane and RJK claim blocks, which are peripheral to the Blackwater deposit.
Project Description, Location, Access and Other Information
The Blackwater Project is a gold-silver project located in central British Columbia, approximately 110 kilometres southwest of Vanderhoof and 450 kilometres northeast of Vancouver. The Project site is readily accessible by forest service and mine road. A new 16-kilometre road is planned to connect the Project site with the Kluskus Forest Service Road. Helicopter access is available from bases in Prince George, Vanderhoof and, Quesnel. The climate in the project area is sub-continental, characterized by brief warm summers and long cold winters. It is expected that mining activities will be conducted year-round.
As at December 31, 2018, New Gold holds a 100% interest in 328 mineral claims covering an area of 148,688 hectares distributed among the Blackwater, Capoose, Auro, Key, Parlane and RJK claim blocks. To keep claims in good standing, a minimum value of work or cash-in-lieu is required annually. The required cash-in-lieu to maintain a mineral claim for an anniversary year is double the value of exploration and development that would be required to maintain the claim. Sixty-eight claims are due for renewal in August of 2019, with the remainder in good standing until 2022 and 2023.
The Blackwater deposit spans one Davidson claim (Tenure No. 509273), the Dave claim (Tenure No. 515809) and the Jarrit claim (Tenure No. 515810) within the greater Blackwater claim block (75 mineral claims covering 30,578 hectares). The majority of the Blackwater claims are located on Crown lands and none are known to overlap any legacy, Crown-granted mineral claims or no-staking reserves. A variety of surface use permits, licenses and authorizations have been granted across the Project area, but none are expected to significantly impact mine design and estimated costs.
New Gold’s 100% interest in the Blackwater claim block is subject to four NSR royalties ranging from 1% to 3%, two of which cover the Blackwater deposit.
Geological Setting and Mineralization
The Blackwater Project is located on the Nechako Plateau, within the Stikine terrane of the Intermontane Belt. The Stikine terrane comprises Jurassic to early Tertiary age magmatic arc and related sedimentary rocks.
The Blackwater deposit is hosted by a sequence of andesite, felsic volcaniclastic rock, breccias, and tuff interpreted to belong to the late Cretaceous age Kasalka Group. These rocks are overlain by a post-mineral sequence of felsic and mafic volcanics of the Eocene age Ootsa Lake Group and underlain by basinal clastic rocks of the late Jurassic age Bowser Lake Group. A well-developed system of north-easterly, north-westerly and northerly-striking faults cuts the entire package. Quaternary glacial, colluvial and fluvial deposits obscure most of the bedrock within the immediate Project area.
The Blackwater deposit is considered to be an example of a volcanic-hosted, intermediate sulphidation, epithermal-style gold-silver deposit. Host rocks within the deposit are pervasively hydrofractured, pyritized, and altered to a mixture of silica and sericite. Mineralization is typified by gold-bearing polymetallic sulphides (pyrite, sphalerite, marcasite, pyrrhotite) as disseminations and porosity infillings within the fragmental unit of the deposit. Mineralization is strongly
31 |
controlled by northwest-southeast-trending zones of tectonic brecciation and chloritic gouge and by northeast-trending structural discontinuities. The mineralization is bounded by graben-forming faults to the north and south. A major north-south-trending fault transects the ore body, subdividing it into two distinct geological domains integral to the mineral resource block model.
Drilling has defined the Blackwater deposit as a zone of continuous disseminated gold-silver mineralization extending at least 1,300 metres east-west and at least 950 metres north-south. The vertical thickness of the zone averages 350 metres but ranges up to 600 metres, remaining open at depth to the southwest, north and northwest.
Infrastructure, Permitting and Environmental Conditions
The deposit is located on the north slope of Mt. Davidson, and the proposed project infrastructure will be sited predominantly in the Davidson Creek watershed. There is sufficient suitable land for future mine infrastructure within the mineral claims. Personnel to support development and operation of the mine can be drawn from British Columbia’s well-developed mining industry. Water for the camp is currently obtained from groundwater wells.
The closest connection to the provincial power grid is 140 kilometres from the Blackwater Project. An overland transmission line is planned to connect to the provincial grid. Freshwater requirements will be met by pumping water from Tatelkuz Lake via a 20-kilometre long pipeline and groundwater wells. The 2013 Feasibility Study includes plans for on-site infrastructure including a 60,000 tpd process plant facility, open pit mine infrastructure, tailings facility and administrative offices.
The Blackwater Project is subject to review under the British Columbia Environmental Assessment Act and the Canadian Environmental Assessment Act, 2012. The EA process was initiated in October 2012 and technical review of the final EA report started in January 2016. Since that time, New Gold has responded to comments from the working group and the public and has participated in open houses and public comment periods on the EA report. A public comment period on the federal government’s draft EA report and proposed conditions was held in late 2018, and the Company is working with both the federal and provincial governments to finalize EA conditions. New Gold anticipates receiving EA approvals from both the federal government and British Columbia in 2019. Mine construction and operation will require a large number of federal and provincial permits, many pertaining to potential impacts on surface water and fisheries. A number of key engineering and environmental studies in support of the broader permitting effort were completed between 2015 and 2018.
The federal and provincial permitting requirements include public and First Nations consultations. New Gold consults with provincial and federal ministries and agencies about research, design, permits, and environmental assessment questions and issues as they arise. The Company continues to engage a number of First Nations groups who have interests in the project area, including discussions regarding Participation Agreements for construction and operation of the mine with key local First Nations.
There is no evidence of historic mining activities in the project area. Existing environmental liabilities are related to the exploration activities of New Gold and its predecessor companies. The post-mining reclamation objective is wildlife habitat and return of the land for traditional use by indigenous groups.
New Gold has conducted extensive environmental baseline studies and is preparing comprehensive environmental management plans for the Blackwater Project. Mitigation plans are in place for potential effects on fish due to flow reductions in Davidson Creek and for potential effects on caribou and the whitebark pine species. A fish habitat
32 |
compensation plan will be implemented to ensure no net loss of fish habitat will result from the operations. The project is located at the periphery of caribou range and a plan has been proposed to offset for potential impacts to the habitat.
New Gold has posted an irrevocable standby letter of credit totaling approximately C$1.9 million in respect of reclamation security deposits for the Blackwater Project’s Mines Act permit, gravel pit project and adjacent properties. The undiscounted reclamation liability for the Blackwater Project as at December 31, 2018 is estimated to be $13.2 million.
Mineral Reserve and Mineral Resource Estimates
The Blackwater Project Mineral Reserves estimate is presented in the “Mineral Reserve Estimates” table. The Blackwater Project Mineral Resource estimate is presented in the “Measured and Indicated Mineral Resource Estimates (Exclusive of Mineral Reserves)” and “Inferred Mineral Resource Estimates” tables. See “Description of Business –Mineral Reserve and Mineral Resource Estimates” on page 14. The parameters, assumptions and methodologies applied in generating the mineral reserve and mineral resource estimates are considered reasonable and appropriate.
Mining Operations
The mining operations described below are set out in the 2013 Feasibility Study. The Company did internal trade-off studies for the Blackwater Project in 2018 to further enhance project economics and maximize free cash flow. In 2019, the Company will continue to assess alternative project scenarios that may involve lower initial capital requirements and a high-grade pit configuration that would generate positive returns at current metal prices.
Mining and Recovery Methods
The Blackwater Project has been designed as a conventional open pit mining operation. A truck and shovel operation will operate year-round in a pit designed considering the geology, technical, economic and related environmental characteristics of mineral resource to be mined, and location of the deposit. The 2013 Feasibility Study contemplates that run-of-mine ore will be delivered to a primary crusher that feeds a whole ore leach gold-silver recovery plant, ground mineralized material from a conventional milling circuit will be thickened, passed through a leaching and carbon-in-pulp extraction circuit, and subjected to carbon stripping and electrowinning prior to being smelted into a gold-silver doré.
Capital and Operating Costs
The Blackwater Project has Proven and Probable Mineral Reserves of over 8.2 million ounces of gold and 60.8 million ounces of silver and, as designed in the 2013 Feasibility Study, is expected to have a 17-year mine life. The 2013 Feasibility Study estimated production of approximately 485,000 ounces of gold and 1,800,000 ounces of silver annually for the first nine years of full production. The 2013 Feasibility Study also estimated the life-of-mine total cash costs and all-in sustaining costs per ounce of gold to be C$609 and C$706 per ounce respectively, assuming a $1,300 per ounce gold price, $22.00 per ounce silver price and an exchange rate of C$0.95 to one United States dollar. Total cash costs per ounce and all-in sustaining costs are non-GAAP measures. See “Non-GAAP Measures” on page 5.
Cerro San Pedro Mine, Mexico
The Cerro San Pedro Mine is an open-pit gold and silver heap leach operation located in central Mexico in the state of San Luis Potosí, approximately 400 kilometres north of Mexico City and 14 kilometres east of the city of San Luis Potosí. The mine is owned by the Company’s wholly owned subsidiary, Minera San Xavier S.A. de C.V. (“MSX”). The Cerro San
33 |
Pedro Mine concluded active mining operations in June 2016. The Company has now discontinued the addition of cyanide to the heap leach pad though existing solution will continue to be recirculated. The Cerro San Pedro Mine transitioned to the reclamation phase on December 31, 2018.
Mine Closure
The schedule for completing the activities relating to the closure of Cerro San Pedro is dictated by the environmental authorization (“EIS”) for the mine. The site reclamation must be completed within four years of final processing, including residual leaching. MSX is required to post reclamation security of approximately $15.6 million with the Mexican environmental regulatory agency, SEMARNAT, under the general law for ecological balance and environmental protection. As at December 31, 2018, the Company has posted this security in the form of an irrevocable standby letter of credit. The undiscounted closure cost liability for the Cerro San Pedro Mine as at December 31, 2018 is estimated to be $23.2 million. New Gold expects to incur this obligation between 2019 and 2026.
RISK FACTORS
New Gold’s business activities are subject to significant risks, including, but not limited to, those described below. Every investor or potential investor in New Gold securities should carefully consider these risks. Any of the following risks could have a material adverse effect on the Company, its business and prospects, and could cause actual events to differ materially from those described in forward-looking statements relating to the Company. Additional risks related to our material properties are discussed in the technical reports and other documents filed by the Company from time to time on SEDAR. In addition, other risks and uncertainties not presently known by management of the Company or that management currently believes are immaterial could affect the Company, its business and prospects.
Changes in Metal Prices
The Company’s earnings, cash flows and financial condition are subject to risk due to fluctuations in the market price of gold, copper and silver. World gold prices have historically fluctuated widely. World gold prices are affected by numerous factors beyond the Company’s control, including:
· | the strength of the United States economy and the economies of other industrialized and developing nations; |
· | global and regional political and economic conditions; |
· | the relative strength of the United States dollar and other currencies; |
· | expectations with respect to the rate of inflation; |
· | interest rates; |
· | purchases and sales of gold by central banks and other large holders, including speculators; |
· | demand for jewellery containing gold; |
· | investment activity, including speculation, in gold as a commodity; and |
· | worldwide production. |
34 |
The price of gold was US$1,282 per ounce as at December 31, 2018, compared to US$1,297 as at December 31, 2017. Future metal price declines could cause continued development of, and commercial production from, the Company’s properties to be uneconomic. In addition, there is a time lag between the shipment of gold and copper and final pricing, and changes in pricing can significantly impact the Company’s revenue and working capital position. Depending on the price of gold, copper and silver, the Company’s cash flow from mining operations may be insufficient to meet its operating needs and capital expenditures, and as a result the Company could experience losses and/or may curtail or suspend some or all of its exploration, development, construction and mining activities (including residual leaching) or otherwise revise its mine plans and exploration, development and construction plans, and could lose its interest in, or be forced to sell, some or all of its properties.
Reserve calculations and mine plans that are revised using significantly lower gold, copper, silver and other metal prices could result in significant reductions in estimated mineral reserves and resources as well as revisions in the Company’s life-of-mine plans, which in turn could result in material write-downs of the Company’s investments in mining properties and increased depletion, reclamation and closure charges. Depending on the price of gold or other metals, the Company may determine that it is impractical to commence or, if commenced, to continue commercial production at a particular site. Metal price fluctuations also create adjustments to the provisional prices of sales made in previous periods that have not yet been subject to final pricing, and these adjustments could have an adverse impact on the Company’s financial results and financial condition. In addition, cash costs and all-in sustaining costs of gold production are calculated net of by-product credits, and therefore may also be impacted by downward fluctuations in the price of by-product metals. Any of these factors could result in a material adverse effect on the Company’s results of operations and financial condition.
In addition to adversely affecting the Company’s mineral reserve and mineral resource estimates and its financial condition, declining metal prices can impact operations by requiring a reassessment of the feasibility of a particular project or mine. Such a reassessment may be the result of a management decision or may be required under financing arrangements related to a particular project or mine. Even if a project or mine is ultimately determined to be economically viable, the need to conduct such a reassessment may cause substantial delays and/or may interrupt operations until the reassessment can be completed, which may have a material adverse effect on the Company’s results of operations and financial condition.
From time to time the Company engages in commodity hedging transactions intended to reduce the risk associated with fluctuations in commodity prices, but there is no assurance that any such commodity hedging transactions designed to reduce the risk associated with fluctuations in commodity prices will be successful. Hedging may not protect adequately against declines in the price of the hedged commodity. Furthermore, although hedging may protect the Company from a decline in the price of the commodity being hedged, it may also prevent the Company from benefiting from price increases.
Production Estimates
Forecasts of future production are estimates based on interpretation and assumptions, and actual production may be less than estimated. Unless otherwise noted, the Company’s production forecasts are based on full production being achieved at all of its mines. The Company’s ability to achieve and maintain full production rates at these mines is subject to a number of risks and uncertainties. The Company’s production estimates are dependent on, among other things, the accuracy of mineral reserve and mineral resource estimates, the accuracy of assumptions regarding ore grades and recovery rates, ground conditions, physical characteristics of ores, such as hardness and the presence or absence of particular metallurgical characteristics, the accuracy of estimated rates and costs of mining and processing and mill
35 |
availability, and the receipt and maintenance of permits. The Company’s actual production may vary from its estimates for a variety of reasons, including those identified under the heading “Operating Risks” below. The failure of the Company to achieve its production estimates could have a material adverse effect on the Company’s prospects, results of operations and financial condition.
Cost Estimates
The Company prepares estimates of operating costs and/or capital costs for each operation and project. The Company’s actual costs are dependent on a number of factors, including the exchange rate between the United States dollar and the Canadian dollar and, to a lesser extent, Mexican peso, smelting and refining charges, penalty elements in concentrates, royalties, the price of gold and by-product metals, the cost of inputs used in mining operations and production levels.
New Gold’s actual costs may vary from estimates for a variety of reasons, including changing waste-to-ore ratios, ore grade metallurgy, labour and other input costs, commodity prices, general inflationary pressures and currency exchange rates, as well as those risks identified under the heading “Operating Risks” below. Failure to achieve cost estimates or material increases in costs could have an adverse impact on New Gold’s future cash flows, profitability, results of operations and financial condition.
Volatility in the Market Price of the Company’s Securities
The Common Shares are listed on the TSX and NYSE American. The per share price of the Common Shares on the TSX fluctuated from a high of C$4.45 to a low of C$0.90 and on the NYSE American from a high of US$3.43 to a low of US$0.70 during the twelve-month period ending December 31, 2018. There can be no assurance that continual fluctuation in price will not occur.
Securities of mining companies have experienced substantial volatility in the past, often based on factors unrelated to the financial performance or prospects of the companies involved. These factors include macroeconomic developments in North America and globally, currency fluctuations and market perceptions of the attractiveness of particular industries. Other factors unrelated to the Company’s performance that may have an effect on the price of the Common Shares include the following: the extent of analytical coverage available to investors concerning the Company’s business may be limited if investment banks with research capabilities do not continue to follow the Company’s securities; the lessening in trading volume and general market interest in the Company’s securities may affect an investor’s ability to trade significant numbers of Common Shares; and the size of the Company’s public float may limit the ability of some institutions to invest in the Company’s securities. The price of the Common Shares is also likely to be significantly affected by short-term changes in gold, and, to a lesser extent, copper and silver, prices, by the Company’s financial condition and results of operations as reflected in its quarterly financial statements and by other operational and regulatory matters.
As a result of any of these factors, the market price of the Common Shares at any given point in time may not accurately reflect New Gold’s long-term value. Securities class action litigation often has been brought against companies following periods of volatility in the market price of their securities. New Gold may in the future be the target of similar litigation. Securities litigation could result in substantial costs and damages and divert management’s attention and resources.
36 |
Government Regulation
The mining, processing, development and exploration activities of the Company are subject to various laws governing prospecting, development, production, exports, imports, taxes, labour standards and occupational health and safety, mine safety, toxic substances, waste disposal, environmental protection and remediation, protection of endangered and protected species, land use, water use, land claims of local people and other matters. No assurance can be given that new rules and regulations will not be enacted or that existing rules and regulations will not be applied in a manner which could have a material adverse effect on the Company’s financial position and results of operations. Amendments to current laws, regulations and permits governing operations or development activities and activities of mining and exploration companies, or the application of existing laws, regulations and permits (including a more stringent or different application), could have a material adverse impact on the Company’s results of operations or financial position, or could require abandonment or delays in the development of new mining properties or the suspension or curtailment of operations at existing mines. Failure to comply with any applicable laws, regulations or permitting requirements may result in enforcement actions against the Company, including orders issued by regulatory or judicial authorities causing operations or development activities to cease or be curtailed or suspended, and may include corrective measures requiring capital expenditures, installation of additional equipment or remedial actions (see also “Permitting” below). Additionally, the Company could be forced to compensate those suffering loss or damage by reason of its mining operations or exploration or development activities and could face civil or criminal fines or penalties imposed for violations of applicable laws or regulations. Any such regulatory or judicial action could materially increase the Company’s operating costs and delay or curtail or otherwise negatively impact the Company’s operations and other activities.
Permitting
The Company’s operations, development projects and exploration activities are subject to receiving and maintaining licenses, permits and approvals, including regulatory relief or amendments, (collectively, “permits”) from appropriate governmental authorities. Before any development on any of its properties the Company must receive numerous permits, and continued operations at the Company’s mines is also dependent on maintaining, complying with and renewing required permits or obtaining additional permits.
New Gold may be unable to obtain on a timely basis or maintain in the future all necessary permits required to explore and develop its properties, commence construction or operation of mining facilities and properties or maintain continued operations. Delays may occur in connection with obtaining necessary renewals of permits for the Company’s existing operations and activities, additional permits for existing or future operations or activities, or additional permits associated with new legislation. It is possible that previously issued permits may become suspended or revoked for a variety of reasons, including through government or court action.
In October 2016, the federal and provincial governments entered into a memorandum of understanding regarding the environmental assessment process for the Blackwater Project with the Ulkatcho First Nation and the Lhoosk’uz Dené Nation to facilitate government-to-government collaboration in such process. In addition, in April 2015, the provincial government entered into an agreement with the Nadleh Whuten First Nation, Saik’uz First Nation, Stellat’en First Nation and other First Nations included in the Carrier Sekani Tribal Council to facilitate a government-to-government relationship based on collaboration in connection with natural resource development carried on in their traditional territories, including the Blackwater Project. New Gold continues to engage indigenous groups who have interests in the Blackwater Project area. New Gold anticipates receiving environmental assessment approval for the Blackwater Project in 2019, however, there can be no assurance that such approval will be obtained on such timeline or at all.
37 |
In the past there have been challenges to the Company’s permits that were temporarily successful as well as delays in the renewal of certain permits or in receiving additional required permits. There can be no assurance that the Company will receive or continue to hold all permits necessary to develop or continue operating at any particular property or to pursue the Company’s exploration activities. To the extent that required permits cannot be obtained or maintained, the Company may be curtailed or prohibited from continuing its mining operations or from proceeding with planned exploration or development of mineral properties. Even if permits or renewals are available, the terms of such permits may be unattractive to the Company and result in the applicable operations or activities being financially unattractive or uneconomic. An inability to obtain or maintain permits or to conduct mining operations pursuant to applicable permits would materially reduce the Company’s production and cash flow and could undermine its profitability.
Dependence on the Rainy River AND New Afton MineS
The Company’s operations at the Rainy River and New Afton Mines are expected to account for substantially all of the Company’s gold and copper production in 2019. Any adverse condition affecting mining or milling conditions at the Rainy River Mine or New Afton Mine could have a material adverse effect on the Company’s financial performance and results of operations.
Unless the Company acquires or develops other significant gold-producing assets, the Company will continue to be dependent on its operations at the Rainy River and New Afton Mines for a substantial portion of its cash flow provided by operating activities.
Operating Risks
Mining operations generally involve a high degree of risk. The Company’s operations are subject to all the hazards and risks normally encountered in the exploration, development and production of gold, copper and silver including unusual and unexpected ground conditions or geologic formations, seismic activity, rock bursts, rock slides, cave-ins, slope or pit wall failures, flooding, fire, metal losses, periodic interruption due to inclement or hazardous weather conditions and other conditions that would impact the drilling and removal of material. Block caving activities, including at the New Afton Mine, generally result in surface subsidence. The configuration of subsidence presently occurring above the west cave at the New Afton Mine is slightly offset from the original model, which is thought to be driven largely by the weaker rockmass located south of the cave footprint. The subsidence is being monitored and evaluated on an ongoing basis. Surface subsidence or any of the above hazards and risks could result in reduced production, damage to, or destruction of, mines and other producing facilities, damage to life or property, environmental damage and possible legal liability. In addition, production may be adversely impacted by operational problems such as a failure of a production hoist, filter press, SAG mill or other equipment, or industrial accidents, as well as other potential issues such as actual ore mined varying from estimates of grade or tonnage, dilution, block cave performance and metallurgical or other characteristics, interruptions in or shortages of electrical power or water, shortages of required inputs, labour shortages or strikes, claims by or disagreements with First Nations and other indigenous groups, restrictions or regulations imposed by government agencies or changes in the regulatory environment. The Company’s milling operations are subject to hazards such as equipment failure or failure of retaining dams around tailings disposal areas, which may result in environmental pollution and consequent liability. In addition, short-term operating factors, such as the need for orderly development of the ore bodies or the processing of new or different ore grades, may cause a mining operation to be unprofitable in any particular accounting period.
The occurrence of one or more of these events may result in the death of, or personal injury to, employees, other personnel or third parties, the loss of mining equipment, damage to or destruction of mineral properties or production facilities, monetary losses, deferral or unanticipated fluctuations in production, suspension, curtailment or termination
38 |
of operations, environmental damage and potential legal liabilities, any of which may adversely affect the Company’s business, reputation, prospects, results of operations and financial condition.
Exploration and Development Risks
The exploration for and development of mineral deposits involves significant risks, which even a combination of careful evaluation, experience and knowledge cannot eliminate. While the discovery of an ore body may result in substantial rewards, few properties that are explored are ultimately developed into producing mines. Once a site with mineralization is discovered, it may take several years from the initial phases of drilling until production is possible, during which time the economic feasibility of production may change. Major expenses may be required to locate and establish mineral reserves, to develop metallurgical processes and to construct mining and processing facilities at a particular site. It is impossible to ensure that the exploration or development programs planned by the Company will result in a profitable commercial mining operation.
Whether a mineral deposit will be commercially viable depends on a number of factors, including but not limited to: the particular attributes of the deposit, such as accuracy of estimated size, continuity of mineralization, average grade and metallurgical characteristics (see “Uncertainty in the Estimation of Mineral Reserves and Mineral Resources” below); proximity to infrastructure; metal prices, which are highly cyclical (see “Changes in Metal Prices” above); and government regulations, including regulations relating to prices, taxes, royalties, land tenure, land use, importing and exporting of minerals and environmental protection (see “Government Regulation” above). The exact effect of these factors cannot be accurately predicted, but the combination of these factors may result in the Company being unable to receive an adequate return on invested capital.
Development projects are uncertain and capital cost estimates, projected operating costs, production rates, recovery rates, mine life and other operating parameters and economic returns may differ significantly from those estimated for a project. Development projects rely on the accuracy of predicted factors including capital and operating costs, metallurgical recoveries, reserve estimates and future metal prices. In addition, there can be no assurance that gold, copper or silver recoveries in small scale laboratory tests will be duplicated in larger scale tests under on-site conditions or during production.
The Company is in the process of constructing a water treatment plant and expanding the tailings management area at Rainy River. At New Afton, the Company is commencing mine development in 2019 of the C-zone expansion. The development of the underground mine at Rainy River is expected to commence in 2020. The Blackwater Project is in the permitting stage. The Company may engage in other development and expansion activities at its operating mines from time to time. Expansion projects, including development and expansions of facilities and extensions to new ore bodies or new portions of existing ore bodies, can have risks and uncertainties similar to development projects.
A project is subject to numerous risks during development including, but not limited to, the accuracy of feasibility studies, obtaining and complying with required permits, changes in environmental or other government regulations, securing all necessary surface and land tenure rights, consulting and accommodating First Nations and other indigenous groups and financing risks. In particular, the Company is actively engaged in consultation with various First Nations and other indigenous groups in connection with the Blackwater Project. Unforeseen circumstances, including those related to the amount and nature of the mineralization at the development site, technological impediments to extraction and processing, legal challenges or restrictions or governmental intervention, infrastructure limitations, environmental issues, unexpected ground conditions or other unforeseen development challenges, commodity prices, disputes with local communities or other events, could result in one or more of New Gold’s planned developments becoming impractical or uneconomic to complete. Any such occurrence could have an adverse impact on New Gold’s growth,
39 |
financial condition and results of operations. There can be no assurance that the Company’s expansion and development projects will continue in accordance with current expectations or at all. See also “Permitting” above.
Risks Related to RAINY RIVER’s Early Years of production
The first few years of production from the Rainy River Mine are subject to a number of inherent risks. It is not unusual in the mining industry for new mining operations to experience unexpected problems during the early stages of the production phase, including failure of equipment, machinery, the processing circuit or other processes to perform as designed or intended, inadequate water, insufficient ore stockpile or grade, and failure to deliver adequate tonnes of ore to the mill, any of which could result in delays, slowdowns or suspensions and require more capital than anticipated. In addition, estimated mineral reserves and mineral resources and anticipated costs, including, without limitation, operating expenses, cash costs and all-in sustaining costs, anticipated mine life, projected production, anticipated production rates and other projected economic and operating parameters may not be realized, and the level of future metal prices needed to ensure commercial viability may deteriorate. Consequently, there is a risk that Rainy River may encounter problems or be subject to delays or suspensions during the early stages of the production phase, which may or have other material adverse consequences for the Company, including its operating results, cash flow and financial condition.
Financing Risks
The Company’s mining, processing, development and exploration activities may require additional external financing. There can be no assurance that additional capital or other types of financing will be available when needed or that, if available, the terms of such financing will be acceptable to the Company. Furthermore, if the Company raises additional capital by offering equity securities or securities convertible into equity securities, any additional financing may involve substantial dilution to existing shareholders. Failure to obtain sufficient financing could result in the delay or indefinite postponement of exploration, development, construction or production of any or all of the Company’s mineral properties. The cost and terms of such financing may significantly reduce the expected benefits from new developments or render such developments uneconomic.
Need for Additional Mineral Reserves and Mineral Resources
Because mines have limited lives based on proven and probable mineral reserves, the Company continually seeks to replace and expand its mineral reserves and mineral resources. The Company’s ability to maintain or increase its annual production of gold, copper and silver depends in significant part on its ability to find or acquire new mineral reserves and mineral resources and bring new mines into production, and to expand mineral reserves and mineral resources at existing mines. Exploration is inherently speculative. New Gold’s exploration projects involve many risks and exploration is frequently unsuccessful. See “Exploration and Development Risks” above. There is a risk that depletion of reserves will not be offset by discoveries or acquisitions. The mineral base of New Gold may decline if reserves are mined without adequate replacement.
Uncertainty in the Estimation of Mineral Reserves and Mineral Resources
Mineral reserves and mineral resources are estimates only and no assurance can be given that the anticipated tonnages and grades will be achieved, that the indicated level of recovery will be realized or that mineral reserves can be mined or processed profitably. Mineral reserve and mineral resource estimates may be materially affected by environmental, permitting, legal, title, taxation, socio-political, geotechnical factors (such as pit slope angles), marketing and other risks and relevant issues. There are numerous uncertainties inherent in estimating mineral reserves and mineral resources, including many factors beyond the Company’s control. Such estimation is a subjective process, and the accuracy of any mineral reserve or mineral resource estimate is a function of the quantity and quality of available data, the nature of the
40 |
ore body and of the assumptions made and judgments used in engineering and geological interpretation. These estimates may require adjustments or downward revisions based upon further exploration or development work, drilling or actual production experience.
Fluctuations in gold, copper and silver prices, results of drilling, metallurgical testing and production, the evaluation of mine plans after the date of any estimate, permitting requirements or unforeseen technical or operational difficulties may require revision of mineral reserve and mineral resource estimates. Prolonged declines in the market price of gold (or applicable by-product metal prices) may render mineral reserves and mineral resources containing relatively lower grades of mineralization uneconomical to recover and could materially reduce the Company’s mineral reserves and mineral resources. Mineral resource estimates for properties that have not commenced production or at deposits that have not yet been exploited are based, in most instances, on very limited and widely-spaced drill hole information, which is not necessarily indicative of conditions between and around the drill holes. There may also be outliers in the representative samples that may disproportionally skew the estimates. Accordingly, such mineral Resource estimates may require revision as more geologic and drilling information becomes available and as actual production experience is gained. Should reductions in mineral resources or mineral reserves occur, the Company may be required to take a material write-down of its investment in mining properties, reduce the carrying value of one or more of its assets or delay or discontinue production or the development of new projects, resulting in reduced net income or increased net losses and reduced cash flow. Mineral resources and mineral reserves should not be interpreted as assurances of mine life or of the profitability of current or future operations. In addition, the estimates of mineral resources, mineral reserves and economic projections rely in part on third-party reports and investigations. There is a degree of uncertainty attributable to the calculation and estimation of mineral resources and mineral reserves and corresponding grades being mined and, as a result, the volume and grade of reserves mined and processed and recovery rates may not be the same as currently anticipated. Any material reductions in estimates of mineral reserves and mineral resources, or of the Company’s ability to extract these mineral reserves and mineral resources, could have a material adverse effect on the Company’s projects, results of operations and financial condition.
Mineral resources are not mineral reserves and have a greater degree of uncertainty as to their existence and feasibility. There is no assurance that mineral resources will be upgraded to proven or probable mineral reserves.
Uncertainty Relating to Inferred Mineral Resources
Inferred mineral resources are not mineral reserves and do not have demonstrated economic viability. Due to the uncertainty which may attach to inferred mineral resources, there is no assurance that inferred mineral resources will be upgraded through further exploration to the measured and indicated resource classification level of confidence necessary for their potential conversion to proven or probable mineral reserves as a result of a pre-feasibility or feasibility level technical study.
Impairment
On a quarterly basis, the Company reviews and evaluates its mining interests for indicators of impairment. In the past, the Company has recognized material impairment losses. In 2018, a total impairment of US$836.6 million was recorded in the second and fourth quarters of 2018 in relation to the Rainy River Mine and a $218.2 million impairment was recorded in relation to the Blackwater Project. Impairment assessments are conducted at the level of cash-generating units (“CGU”). A CGU is the smallest identifiable group of assets that generates cash inflows that are largely independent of the cash inflows from other assets or groups of assets. Each operating mine, development and exploration project represents a separate CGU. If an indication of impairment exists, the recoverable amount of the CGU is estimated. An impairment loss is recognized when the carrying amount of the CGU is in excess of its recoverable amount. The
41 |
assessment for impairment is subjective and requires management to make significant judgments and assumptions in respect of a number of factors, including estimates of production levels, operating costs and capital expenditures reflected in New Gold’s life-of-mine plans, the value of in situ ounces, exploration potential and land holdings, as well as economic factors beyond management’s control, such as gold, copper and silver prices, discount rates, foreign exchange rates, and observable net asset value multiples. It is possible that the actual fair value could be significantly different than those estimates. In addition, should management’s estimate of the future not reflect actual events, further impairment charges may materialize, and the timing and amount of such impairment charges is difficult to predict.
Title Claims and Rights of Indigenous Peoples
Certain of New Gold’s properties may be subject to the rights or the asserted rights of various community stakeholders, including First Nations and other indigenous peoples. The presence of community stakeholders may impact the Company’s ability to develop or operate its mining properties and its projects or to conduct exploration activities. Accordingly, the Company is subject to the risk that one or more groups may oppose the continued operation, further development or new development or exploration of the Company’s current or future mining properties and projects. Such opposition may be directed through legal or administrative proceedings, or through protests or other campaigns against the Company’s activities.
Governments in many jurisdictions must consult with, or require the Company to consult with, indigenous peoples with respect to grants of mineral rights and the issuance or amendment of project authorizations. Consultation and other rights of indigenous peoples may require accommodation including undertakings regarding employment, royalty payments and other matters. This may affect the Company’s ability to acquire within a reasonable time frame effective mineral titles, permits or licenses in these jurisdictions, including in some parts of Canada and Mexico in which title or other rights are claimed by First Nations and other indigenous peoples, and may affect the timetable and costs of development and operation of mineral properties in these jurisdictions. The risk of unforeseen title claims by indigenous peoples also could affect existing operations as well as development projects. These legal requirements may also affect the Company’s ability to expand or transfer existing operations or to develop new projects.
Environmental Risks
The Company is subject to environmental regulation in Canada and Mexico where it operates or has exploration or development activities. In addition, the Company will be subject to environmental regulation in any other jurisdictions in which it may operate or have exploration or development properties. These regulations address, among other things, endangered and protected species, emissions, noise, air and water quality standards, land use and reclamation. They also set out limitations on the generation, transportation, storage and disposal of solid, liquid and hazardous waste.
Environmental legislation is evolving in a manner which will involve, in certain jurisdictions, stricter standards and enforcement, increased fines and penalties for non-compliance, more stringent environmental assessments of proposed projects and a heightened degree of responsibility for companies and their officers, directors and employees. No certainty exists that future changes in environmental regulation, or the application of such regulations, if any, will not adversely affect the Company’s operations or development properties or exploration activities. The Company cannot give any assurance that, notwithstanding its precautions, breaches of environmental laws (whether inadvertent or not) or environmental pollution will not materially and adversely affect its financial condition and results of operations. Environmental hazards may exist on the Company’s properties which are unknown to management at present and which have been caused by previous owners or operators of the properties. In addition, measures taken to address and mitigate known environmental hazards or risks may not be fully successful, and such hazards or risks may materialize.
42 |
New Gold may also acquire properties with known or undiscovered environmental risks. Any indemnification from the entity from which the Company acquires such properties may not be adequate to pay all the fines, penalties and costs (such as clean-up and restoration costs) incurred related to such properties. New Afton has also been used for mining and related operations for many years before the Company acquired it and was acquired as is or with assumed environmental liabilities from previous owners or operators. The Company has been required to address contamination at its properties in the past and may need to continue to do so in the future, either for existing environmental conditions or for leaks, discharges or contamination that may arise from its ongoing operations or other contingencies. The cost of addressing environmental conditions or risks, and liabilities associated with environmental damage, may be significant, and could have a material adverse effect on the Company’s business, prospects, results of operations and financial condition. Production at New Gold’s mines involves the use of various chemicals, including certain chemicals that are designated as hazardous substances. Contamination from hazardous substances, either at the Company’s own properties or other locations for which it may be responsible, may subject the Company to liability for the investigation or remediation of contamination, as well as for claims seeking to recover for related property damage, personal injury or damage to natural resources. The occurrence of any of these adverse events could have a material adverse effect on the Company’s prospects, results of operations and financial position.
Production at certain of the Company’s mines involves the use of sodium cyanide which is a toxic material. Should sodium cyanide leak or otherwise be discharged from the containment system, the Company may become subject to liability for cleanup work that may not be insured, in addition to liability for any damage caused. Such liability could be material.
Insurance and Uninsured Risks
New Gold’s business is subject to a number of risks and hazards generally including adverse environmental conditions, industrial accidents, labour disputes, unusual or unexpected geological conditions, ground or slope or wall failures, cave-ins, metallurgical or other processing problems, fires, operational problems, changes in the regulatory environment and natural phenomena, such as inclement weather conditions, floods, hurricanes and earthquakes. Such occurrences could result in damage to mineral properties or production facilities or other property, personal injury or death, environmental damage to the Company’s properties or the properties of others, delays in mining, monetary losses and possible legal liability.
Although the Company maintains insurance to protect against certain risks in such amounts as it considers reasonable, such insurance will not cover all the potential risks associated with the Company’s operations. The Company may also be unable to maintain insurance to cover these risks at economically feasible premiums. Insurance coverage may not continue to be available on acceptable terms or may not be adequate to cover any resulting liability. Moreover, insurance against risks such as loss of title to mineral property, environmental pollution, or other hazards as a result of exploration, development and production is not generally available to the Company or to other companies in the mining industry on acceptable terms. New Gold may also become subject to liability for pollution or other hazards which may not be insured against or which the Company may elect not to insure against because of premium costs or other reasons. Losses from these events may cause the Company to incur significant costs that could have a material adverse effect on results of operations and financial condition.
Reclamation Costs
The Company’s operations are subject to reclamation plans that establish its obligations to reclaim properties after minerals have been mined from a site. These obligations represent significant future costs for the Company. As at December 31, 2018, the total estimated undiscounted reclamation liability for New Gold’s operations was approximately
43 |
$116.6 million. It may be necessary to revise reclamation concepts and plans, which could increase costs. At the Rainy River Mine, the ratio of potentially acid generating rock to non-acid generating rock has increased, which may increase closure costs.
Reclamation bonds or other forms of financial assurance are often required to secure reclamation activities. Governing authorities require companies to periodically recalculate the amount of a reclamation bond and may require bond amounts to be increased. It may be necessary to revise the planned reclamation expenditures and the operating plan for a mine in order to fund an increase to a reclamation bond. In addition, reclamation bonds are generally issued under the Company’s credit facilities; increases in the amount of reclamation bonds will decrease the amount of the Credit Facility available for other purposes.
Reclamation bonds may represent only a portion of the total amount of money that will be spent on reclamation over the life of a mine operation. The actual costs of reclamation set out in mine plans are estimates only and may not represent the actual amounts that will be required to complete all reclamation activity. If actual costs are significantly higher than the Company’s estimates, then its results of operations and financial position could be materially adversely affected.
Foreign Currency Exchange Rates
New Gold’s mineral properties are located in Canada and Mexico. As a result, the Company has foreign currency exposure with respect to items not denominated in United States dollars. The three main types of foreign exchange risk the Company faces are:
· | transaction exposure: New Gold’s operations sell commodities and incur costs in different currencies. Specifically, the Company’s revenues are denominated in United States dollars while most of the Company’s expenses are currently denominated in Canadian dollars and, to a lesser extent, Mexican pesos. This creates exposure at the operational level, which may affect its profitability as exchange rates fluctuate. The appreciation of non-United States dollar currencies against the United States dollar can increase the costs of production at New Gold’s mines, making those mines less profitable; |
· | exposure to currency risk: New Gold is exposed to currency risk through a portion of the following assets and liabilities denominated in currencies other than the United States dollar: cash and cash equivalents, investments, accounts receivable, and reclamation deposits, accounts payable and accruals, reclamation and closure cost obligations; and |
· | translation exposure: New Gold’s functional and reporting currency is United States dollars. Certain of the Company’s operations have assets and liabilities denominated in currencies other than the United States dollar, with translation foreign exchange gains and losses included in these balances in the determination of profit or loss. Therefore, exchange rate movements in the Canadian dollar and, to a lesser extent, Mexican peso can have a significant impact on the Company’s consolidated operating results. |
As a result, fluctuations in currency exchange rates could significantly affect the Company’s business, financial condition, results of operations and liquidity.
Global Financial Conditions
Global financial conditions have been subject to continued volatility. Government debt, the risk of sovereign defaults, political instability and wider economic concerns in many countries have been causing significant uncertainties in the markets. Disruptions in the credit and capital markets can have a negative impact on the availability and terms of credit
44 |
and capital. Uncertainties in these markets could have a material adverse effect on the Company’s liquidity, ability to raise capital and cost of capital. High levels of volatility and market turmoil could also adversely impact commodity prices, exchange rates and interest rates and have a detrimental effect on the Company’s business.
Debt and Liquidity Risk
As at December 31, 2018, the Company had long-term debt comprised of two series of notes in an aggregate principal amount of US$800 million. In addition, the Company has a US$400 million Credit Facility. The Company’s ability to make scheduled payments of principal and interest on or to refinance its indebtedness depends on the Company’s future performance, which is subject to economic, financial, competitive and other factors many of which are not under the control of New Gold. The Company is exposed to interest rate risk on variable rate debt, if any. Liquidity risk is the risk that the Company will not be able to meet its financial obligations as they become due, including, among others, debt repayments, interest payments and contractual commitments.
In the future, the Company may not continue to generate cash flow from operations sufficient to service its debt and make necessary or planned capital expenditures. If the Company is unable to generate such cash flow, it may be required to adopt one or more alternatives, such as selling assets, borrowing additional funds, restructuring debt or obtaining additional equity capital on terms that may be onerous or highly dilutive. The Company’s ability to borrow additional funds or refinance its indebtedness will depend on the capital markets and its financial condition at such time. The Company may not be able to engage in any of these activities or engage in these activities on desirable terms, which could result in a default on its debt obligations. In addition, if New Gold is unable to maintain its indebtedness and financial ratios at levels acceptable to its credit rating agencies, or should New Gold’s business prospects deteriorate, the ratings currently assigned to New Gold by Moody’s Investor Services and Standard & Poor’s Ratings Services could be downgraded, which could adversely affect the value of New Gold’s outstanding securities and existing debt and its ability to obtain new financing on favourable terms, and increase New Gold’s borrowing costs.
If the Company’s cash flow and other sources of liquidity are not sufficient to continue operations and make necessary and planned capital expenditures, the Company may cancel or defer capital expenditures and/or suspend or curtail operations. Such an action may impact production at mining operations and/or the timelines and cost associated with development projects, which could have a material adverse effect on the Company’s prospects, results of operations and financial condition.
The terms of the Company’s Credit Facility and stream agreement with Royal Gold require the Company to satisfy various affirmative and negative covenants and to meet certain financial ratios and tests. In addition, the terms of the Company’s 2022 Unsecured Notes and 2025 Unsecured Notes require the Company to satisfy various affirmative and negative covenants. These covenants limit, among other things, the Company’s ability to incur indebtedness, create certain liens on assets or engage in certain types of transactions. There are no assurances that in future, the Company will not, as a result of these covenants, be limited in its ability to respond to changes in its business or competitive activities or be restricted in its ability to engage in mergers, acquisitions or dispositions of assets. Furthermore, a failure to comply with these covenants, including, in the case of the Credit Facility and stream agreement with Royal Gold, a failure to meet the financial tests or ratios, would likely result in an event of default under the Credit Facility and/or the 2022 Unsecured Notes and/or the 2025 Unsecured Notes and/or stream agreement and would allow the lenders or noteholders or other contractual counterparty, as the case may be, to accelerate the debt or other obligations as the case may be.
45 |
Taxation
New Gold has operations and conducts business in a number of different jurisdictions and is accordingly subject to the taxation laws of each such jurisdiction, as well as tax reviews and assessments in the ordinary course. Taxation laws are complex, subject to interpretation and subject to change. Any such changes in taxation law or reviews and assessments could result in higher taxes being payable by the Company, which could adversely affect its profitability. Taxes may also adversely affect the Company’s ability to repatriate earnings and otherwise deploy its assets.
Risks Related to Further Processing
The Company’s operations produce concentrate, doré or other products that are not refined metals (“Unrefined Product”) and generally require further processing at a smelter and/or a refinery to become marketable metal. Such Unrefined Product contains metals and other elements that require removal, some of which may limit the smelters or brokers who can or will purchase or process the Unrefined Product and the refineries who will process the Unrefined Product, or negatively impact the terms of such purchase or processing arrangements. In addition, treatment and refining charges are subject to fluctuations, which could negatively impact the Company’s revenue or expenses.
In addition, the Company is generally responsible for transporting Unrefined Products either to the smelter or refinery or to a designated point where risk of loss is transferred. The Company is exposed to risks related to the cost and availability of transportation and storage facilities associated with Unrefined Product, and the Company may not be able to make alternative transportation or storage arrangements on reasonable commercial terms or at all. The Company is dependent on the Port of Vancouver for the storage and transportation of all concentrate from New Afton; in the event the Port of Vancouver is closed, there is no commercial alternative port available. There can be no assurance that the Company will be able to continue to sell and process its Unrefined Product, including the related transportation and storage, on reasonable commercial terms or at all.
Availability and Price OF Inputs
Disruptions in the supply of products or services required for the Company’s activities could also adversely affect the Company’s operations, financial condition and results of operations. In particular, due to the limited number of suppliers of sodium cyanide in each jurisdiction in which the Company operates, a delay in supply, a force majeure event or a breach of contract by one of the Company’s sodium cyanide suppliers could result in delays in processing times which may adversely affect results of operations.
Mining operations and facilities are intensive users of electricity and carbon-based fuels. The Company is subject to price risk for fluctuations in the cost of energy, principally electricity and purchased petroleum products. Energy prices can be affected by numerous factors beyond the Company’s control, including global and regional supply and demand, political and economic conditions, and applicable regulatory regimes. The prices of various sources of energy may increase significantly from current levels. An increase in energy prices for which the Company is not hedged could materially adversely affect its results of operations and financial condition.
The Company’s costs are affected by the prices of commodities and other inputs it consumes or uses in its operations, such as lime, sodium cyanide and explosives. The prices of such commodities and inputs are influenced by supply and demand trends affecting the mining industry in general and other factors outside the Company’s control. Increases in the price for materials consumed in the Company’s mining and production activities could materially adversely affect the Company’s results of operations and financial condition.
46 |
Infrastructure
Mining, processing, development and exploration activities depend on adequate infrastructure. Reliable roads, bridges, power sources and water supply are important determinants which affect capital and operating costs. Unusual or infrequent weather phenomena, sabotage, or community, government or other interference in the maintenance or provision of such infrastructure could adversely affect the Company’s operations, financial condition and results of operations.
Community Relations, License to Operate and Reputation
The Company’s relationship with the host communities where it operates is critical to ensure the future success of its existing operations and the construction and development of its projects. There is an increasing level of public concern relating to the perceived effect of mining activities on the environment and on communities impacted by such activities. Certain non-governmental organizations (“NGOs”), some of which oppose globalization and resource development, are often vocal critics of the mining industry and its practices, including the use of cyanide and other hazardous substances in processing activities. Adverse publicity generated by such NGOs or others related to extractive industries generally, or New Gold’s operations or development activities specifically, could have an adverse effect on the Company’s reputation.
Reputation loss may result in decreased investor confidence, increased challenges in developing and maintaining community relations and an impediment to the Company’s overall ability to advance its projects, which could have a material adverse impact on the Company’s results of operations, financial condition and prospects. While New Gold is committed to operating in a socially responsible manner, there is no guarantee that the Company’s efforts in this respect will mitigate this potential risk.
Climate Change Risks
Changes in climate conditions could adversely affect the Company’s business and operations through the impact of (i) more extreme temperatures, precipitation levels and other weather events; (ii) changes to laws and regulations related to climate change; and (iii) changes in the price or availability of goods and services required by our business.
Climate change may lead to more extreme in temperatures, precipitation levels and other weather events. Extreme high or low temperatures could impact the operation of equipment and the safety of personnel at the Company’s sites, which could result in damage to equipment, injury to personnel and production disruptions. Changes in precipitation levels may impact the availability of water at the Company’s operations, which the mills require to operate, potentially leading to production disruptions. Low precipitation also increases the risk of large forest fires, as occurred in proximity to the Company’s operations in British Columbia in the summer of 2017, which could cause production disruptions or damage site infrastructure. Increases in precipitation levels could also lead to water management challenges. Extreme weather events, such as forest fires, severe storms or floods, all of which may be more probable and more extreme due to climate change, may negatively impact operations and disrupt production. Significant capital investment may be required to address these occurrences and to adapt to changes in average operating conditions caused by these changes to the climate.
Climate change may lead to new laws and regulations that affect the Company’s business and operations. Many governments are moving to enact climate change legislation and treaties at the international, national, state, provincial and local levels. Where legislation already exists, regulations relating to emission levels and energy efficiency are becoming more stringent. Some of the costs associated with meeting more stringent regulations can be offset by increased energy efficiency and technological innovation. However, if the current regulatory trend continues, meeting
47 |
more stringent regulations is anticipated to result in increased costs. For example, the Company’s operations will pay Canadian Federal and Provincial carbon taxes in 2019.
Climate change may lead to changes in the price and availability of goods and services required for the Company’s operations, which require the regular supply of consumables such as diesel, electricity, and sodium cyanide to operate efficiently. The Company’s operations also depend on service providers to transport these consumables and other goods to the operations and to transport doré and concentrate produced by the Company to refiners. The effects of extreme weather described above and changes in legislation and regulation on the Company’s suppliers and their industries may cause limited availability or higher price for these goods and services, which could result in higher costs or production disruptions.
We can provide no assurance that efforts to mitigate the risks of climate changes will be effective and that the physical risks of climate change will not have an adverse effect on the Company’s operations and profitability.
Labour and Employment Matters
Production at the Company’s mines and projects is dependent on the efforts of the Company’s employees and contractors. The Company competes with mining and other companies on a global basis to attract and retain employees at all levels with appropriate technical skills and operating experience necessary to operate its mines. The conduct of the Company’s operations is dependent on access to skilled labour. Access to skilled labour may prove particularly challenging where mining operations are conducted in remote locations. Shortages of suitably qualified personnel could have a material adverse effect on the Company’s business and results of operations. Relations between the Company and its employees may be impacted by changes in the scheme of labour relations, which may be introduced by the relevant governmental authorities in the jurisdictions where the Company carries on business. New Gold had approximately 41 employees that belong to a union at the Cerro San Pedro Mine, which ceased active mining operations in June 2016. In addition, the Company engages contractors who may have unionized employees. Adverse changes in the schemes of labour relations in different jurisdictions or in the relationship between the Company and its employees, or between the Company’s contractors and their respective employees, may have a material adverse effect on the Company’s business, results of operations and financial condition.
Litigation and Dispute Resolution
From time to time New Gold is subject to legal claims, with and without merit. These claims may commence informally and reach a commercial settlement or may progress to a more formal dispute resolution process. The causes of potential future claims cannot be known and may arise from, among other things, business activities, environmental laws, land use, contractor engagements, volatility in stock price or failure to comply with disclosure obligations. In particular, the complex activities and significant expenditures associated with construction activities, such as the construction of Rainy River, may lead to various claims, some of which may be material. Defense and settlement costs may be substantial, even with respect to claims that have no merit. Due to the inherent uncertainty of the litigation and dispute resolution process, there can be no assurance that the resolution of any particular legal proceeding or dispute will not have a material adverse effect on the Company’s future cash flows, results of operations or financial condition.
Title Risks
The acquisition of title to mineral properties is a very detailed and time-consuming process. Title to mineral concessions may be disputed. Although the Company believes it has taken reasonable measures to ensure proper title to its properties, there is no guarantee that title to any of such properties will not be challenged or impaired. Third parties may have valid claims underlying portions of the Company’s interest, including prior unregistered liens, agreements,
48 |
transfers, royalties or claims, including land claims by First Nations or other indigenous groups, and title may be affected by, among other things, undetected defects. In some cases, title to mineral rights and surface rights has been divided, and the Company may hold only surface rights or only mineral rights over a particular property, which can lead to potential conflict with the holder of the other rights. As a result of these issues, the Company may be constrained in its ability to operate its properties or unable to enforce its rights with respect to its properties, or the economics of its mineral properties may be impacted. An impairment to or defect in the Company’s title to its properties or a dispute regarding property or other related rights could have a material adverse effect on the Company’s business, financial condition or results of operations.
Competition
New Gold faces strong competition from other mining companies in connection with the identification and acquisition of properties producing, or capable of producing, precious and base metals. Many of these companies have greater financial resources, operational experience and technical capabilities than New Gold. As a result of this competition, the Company may be unable to identify, maintain or acquire attractive mining properties on acceptable terms or at all. Consequently, the Company’s prospects, revenues, operations and financial condition could be materially adversely affected.
Retention of Key Personnel
The Company’s business is dependent on retaining the services of a number of key personnel of the appropriate calibre as the business develops. New Gold’s success is, and will continue to be to a significant extent, dependent on the expertise and experience of the directors and senior management, and the loss of one or more of such persons could have a material adverse effect on the Company. The Company does not maintain any key man insurance with respect to any of its officers or directors.
Hedging
From time to time the Company uses or may use certain derivative products to hedge or manage the risks associated with changes in gold prices, copper prices, silver prices, interest rates, foreign currency exchange rates and energy prices. The use of derivative instruments involves certain inherent risks including, among other things: (i) credit risk – the risk of an unexpected loss arising if a counterparty with which the Company has entered into transactions fails to meet its contractual obligations; (ii) market liquidity risk – the risk that the Company has entered into a derivative position that cannot be closed out quickly, by either liquidating such derivative instrument or by establishing an offsetting position; and (iii) unrealized mark-to-market risk – the risk that, in respect of certain derivative products, an adverse change in market prices for commodities, currencies or interest rates will result in the Company incurring an unrealized mark-to-market loss in respect of such derivative products.
There is no assurance that any hedging program or transactions which may be adopted or utilized by New Gold designed to reduce the risk associated with changes in gold prices, copper prices, silver prices, interest rates, foreign currency exchange rates or energy prices will be successful. Although hedging may protect New Gold from an adverse price change, it may also prevent New Gold from benefiting fully from a positive price change.
Counterparty Risk
Counterparty risk is the risk to the Company that a party to a contract will default on its contractual obligations to the Company. The Company is exposed to various counterparty risks including, but not limited to: (i) financial institutions that hold the Company’s cash and short term investments; (ii) companies that have payables to the Company, including concentrate and bullion customers; (iii) providers of its risk management services, such as hedging arrangements; (iv)
49 |
shipping service providers that move the Company’s material; (iv) the Company’s insurance providers; and (v) the Company’s lenders. Although the Company makes efforts to limit its counterparty risk, the Company cannot effectively operate its business without relying, to a certain extent, on the performance of third party service providers.
Investment Risk
Investment risk is the risk that a financial instrument’s value will deviate from the expected returns as a result of changes in market conditions, whether those changes are caused by factors specific to the individual investment or factors affecting all investments traded in the market. This includes interest rate risk, which is the risk that the fair value or future cash flows of a financial instrument will fluctuate because of changes in market interest rates. Other aspects of investment risk include credit risk (the risk of unexpected loss arising if a counterparty with which the Company has entered into transactions fails to meet its contractual obligations) and liquidity risk (the risk that the Company has entered into an investment that cannot be closed out quickly). Although the factors that affect investment risk are outside the Company’s control, the Company limits investment risk by limiting its investment exposure in terms of total funds to be invested and by being selective of high quality investments.
Disclosure and Internal Controls
The Company may fail to maintain the adequacy of internal control over financial reporting as per the requirements of the U.S. Sarbanes-Oxley Act of 2002 (“SOX”). The Company documented and tested its internal control procedures in order to satisfy the requirements of Section 404 of SOX. Both SOX and Canadian legislation require an annual assessment by management of the effectiveness of the Company’s internal control over financial reporting.
The Company may fail to maintain the adequacy of its internal control over financial reporting as such standards are modified, supplemented or amended from time to time, and the Company may not be able to ensure that it can conclude on an ongoing basis that it has effective internal controls over financial reporting. The Company’s failure to satisfy the requirements of Section 404 of SOX and equivalent Canadian legislation on an ongoing, timely basis could result in the loss of investor confidence in the reliability of its financial statements, which in turn could harm the Company’s business and negatively impact the trading price of the Common Shares or market value of its other securities. In addition, any failure to implement required new or improved controls, or difficulties encountered in their implementation, could harm the Company’s operating results or cause it to fail to meet its reporting obligations.
The Company may fail to maintain the adequacy of its disclosure controls. Disclosure controls and procedures are designed to ensure that the information required to be disclosed by the Company in reports filed with securities regulatory agencies is recorded, processed, summarized and reported on a timely basis and is accumulated and communicated to the Company’s management, as appropriate, to allow timely decisions regarding required disclosure.
No evaluation can provide complete assurance that the Company’s financial and disclosure controls will detect or uncover all failures of persons within the Company to disclose material information otherwise required to be reported. A control system, no matter how well designed and operated, can provide only reasonable, not absolute, assurance with respect to the reliability of financial reporting and financial statement preparation. The effectiveness of the Company’s controls and procedures could also be limited by simple errors or faulty judgments.
Conflicts of Interest
Certain of New Gold’s directors and officers also serve as directors and/or officers of other companies involved in natural resource exploration and development, and consequently there exists the possibility for such directors and officers to have interests that conflict with the Company’s interests. Situations may arise in connection with potential investments
50 |
where the other interests of the Company’s directors conflict with its interests. As such, conflicts of interest may arise that may influence these persons in evaluating possible acquisitions or in generally acting on the Company’s behalf, as they may pursue opportunities that would then be unavailable to the Company. In the event that the Company’s directors are subject to conflicts of interest, there may be a material adverse effect on the Company’s business.
Corruption and Bribery Laws
The Company’s operations are governed by, and involve interactions with, many levels of government in numerous countries. The Company is required to comply with anti-corruption and anti-bribery laws, including the Criminal Code, the Canadian Corruption of Foreign Public Officials Act and the U.S. Foreign Corrupt Practices Act, as well as similar laws in the countries in which the Company conducts its business. In recent years, there has been a general increase in both the frequency of enforcement and the severity of penalties under such laws, resulting in greater scrutiny and punishment to companies convicted of violating anti-corruption and anti-bribery laws. Furthermore, a company may be found liable for violations not only by its employees, but also by its contractors and third party agents. Although the Company has adopted steps to mitigate such risks, such measures may not always be effective in ensuring that the Company, its employees, contractors and third party agents will comply strictly with such laws. If the Company finds itself subject to an enforcement action or is found to be in violation of such laws, this may result in significant penalties, fines and/or sanctions imposed on the Company resulting in a material adverse effect on the Company’s reputation and results of its operations.
Acquisition and Integration Risks
As part of its business strategy, New Gold has sought and will continue to seek new operating, development and exploration opportunities in the mining industry. In pursuit of such opportunities, New Gold may fail to select appropriate acquisition candidates or negotiate acceptable arrangements, including arrangements to finance acquisitions or integrate the acquired businesses and their personnel into New Gold. The Company cannot assure that it can complete any acquisition or business arrangement that it pursues, or is pursuing, on favourable terms, if at all, or that any acquisition or business arrangement completed will ultimately benefit its business. Such acquisitions may be significant in size, may change the scale of the Company’s business and may expose the Company to new geographic, political, operating, financial or geological risks. Further, any acquisition the Company makes will require a significant amount of time and attention of New Gold management, as well as resources that otherwise could be spent on the operation and development of the Company’s existing business.
Any future acquisitions would be accompanied by risks, such as a significant decline in the relevant metal price after the Company commits to complete an acquisition on certain terms; the quality of the mineral deposit acquired proving to be lower than expected; the difficulty of assimilating the operations and personnel of any acquired companies; the potential disruption of the Company’s ongoing business; the inability of management to realize anticipated synergies and maximize the Company’s financial and strategic position; the failure to maintain uniform standards, controls, procedures and policies; the impairment of relationships with employees, customers and contractors as a result of any integration of new management personnel; and the potential for unknown or unanticipated liabilities associated with acquired assets and businesses, including tax, environmental or other liabilities. In addition, the Company may need additional capital to finance an acquisition. Debt financing related to any acquisition may expose the Company to the risks related to increased leverage, while equity financing may cause existing shareholders to suffer dilution. There can be no assurance that any business or assets acquired in the future will prove to be profitable, that New Gold will be able to integrate the acquired businesses or assets successfully or that it will identify all potential liabilities during the course of due diligence. Any of these factors could have a material adverse effect on the Company’s business, prospects, results of operations and financial condition.
51 |
Foreign Operations
The Company’s mining operations and projects are currently in Canada and the Company owns a mine in Mexico that transitioned from active mining to residual leaching in 2016 and transitioned to the reclamation phase on December 31, 2018. The Company may acquire mining operations or properties in foreign jurisdictions in the future. As a result of its activities in multiple jurisdictions, the Company is exposed to various levels of political, economic and other risks and uncertainties. These risks and uncertainties vary for each country and include, but are not limited to: fluctuations in currency exchange rates; high rates of inflation; labour unrest; environmental controls and permitting; restrictions on the use of land and natural resources; renegotiation or nullification of existing concessions, licenses, permits and contracts; delays in obtaining or the inability to obtain necessary governmental licenses and permits; illegal mining; corruption; higher rates of criminality; unstable or unreliable legal systems; changes in the taxation or royalty regimes; arbitrary changes in laws or policies; restrictions on foreign exchange and repatriation; limitations on exports and imports; changing political conditions, social unrest, currency controls and governmental regulations that favour or require the awarding of contracts to local contractors or require foreign contractors to employ citizens of, or purchase supplies from, a particular jurisdiction; and other risks arising out of foreign sovereignty issues.
Changes, if any, in mining or investment laws or policies or shifts in political attitudes in these countries could adversely affect the Company’s operations or profitability. Failure to comply strictly with applicable laws, regulations and local practices relating to mineral right applications and tenure could result in loss, reduction or expropriation of entitlements. The occurrence of these various factors and uncertainties cannot be accurately predicted and could have an adverse effect on the Company’s operations or profitability. Furthermore, in the event of a dispute arising from the Company’s activities, it may be subject to the exclusive jurisdiction of courts outside of Canada and the United States or may not be successful in subjecting persons to the jurisdiction of courts in Canada and the United States, either of which could unexpectedly and adversely affect the outcome of a dispute.
Information Systems Security Threats
New Gold has entered into agreements with third parties for hardware, software, telecommunications and other information technology (“IT”) services in connection with its operations. New Gold’s operations depend, in part, on how well the Company and its suppliers protect networks, equipment, IT systems and software against damage from a number of threats, including, but not limited to, cable cuts, damage to physical plants, natural disasters, terrorism, fire, power loss, hacking, computer viruses, vandalism and theft. The Company’s operations also depend on the timely maintenance, upgrade and replacement of networks, equipment, IT systems and software, as well as pre-emptive expenses to mitigate the risks of failures. Any of these and other events could result in information systems failures, delays and/or increases in capital expenses. The failure of information systems or a component of information systems could, depending on the nature of any such failure, adversely impact the Company’s reputation and results of operations.
Although to date the Company has not experienced any material losses relating to cyber attacks or other information security breaches, there can be no assurance that New Gold will not incur such losses in the future. The Company’s risk and exposure to these matters cannot be fully mitigated because of, among other things, the evolving nature of these threats. As a result, cyber security and the continued development and enhancement of controls, processes and practices designed to protect systems, computers, software, data and networks from attack, damage or unauthorized access remain a priority. As cyber threats continue to evolve, the Company may be required to expend additional resources to continue to modify or enhance protective measures or to investigate and remediate any security vulnerabilities.
52 |
NOTES
6.25% Senior Notes due 2022
In November 2012, the Company issued an aggregate principal amount of $500 million 6.25% senior notes maturing on November 15, 2022 (“2022 Notes”). The 2022 Notes were issued pursuant to an indenture dated November 14, 2012, between the Company and Computershare Trust Company, N.A., as trustee (“2022 Note Indenture”). The 2022 Notes are direct, senior obligations of the Company and are not secured by any mortgage, pledge or charge.
Interest on the 2022 Notes is payable in arrears in equal semi-annual installments on May 15 and November 15 each year. The Company has the option to redeem the 2022 Notes at a price ranging from 102.08% to 100% of face value, with the rate decreasing based on the length of time the 2022 Notes are outstanding.
The 2022 Note Indenture provides that in the event of a change of control of the Company, as defined therein, each holder of the 2022 Notes will have the right to cause the Company to repurchase some or all of its 2022 Notes at 101% of their principal amount, plus accrued and unpaid interest to, but not including, the repurchase date. In addition, the 2022 Note Indenture requires the Company to comply with certain reporting and other covenants.
6.375% Senior Notes due 2025
In May 2017, the Company issued an aggregate principal amount of $300 million 6.375% senior notes maturing on May 15, 2025 (“2025 Notes”). The 2025 Notes were issued pursuant to an indenture dated May 18, 2017, between the Company and Computershare Trust Company, N.A., as trustee (“2025 Note Indenture”). The 2025 Notes are direct, senior obligations of the Company and are not secured by any mortgage, pledge or charge.
Interest on the 2025 Notes is payable in arrears in equal semi-annual installments on May 15 and November 15 each year. On or after May 15, 2020, the Company has the option to redeem the 2025 Notes at a price ranging from 104.781% to 100% of face value, with the rate decreasing based on the length of time the 2025 Notes are outstanding, and before May 15, 2020, the Company may redeem the 2025 Notes at 100% of face value plus a “make whole” premium.
The 2025 Note Indenture provides that in the event of a change of control of the Company, as defined therein, each holder of the 2025 Notes will have the right to cause the Company to repurchase some or all of its 2025 Notes at 101% of their principal amount, plus accrued and unpaid interest to, but not including, the repurchase date. In addition, the 2025 Note Indenture requires the Company to comply with certain reporting and other covenants.
DIVIDENDS
To date, New Gold has not paid dividends on its shares. The Company currently intends to retain future earnings, if any, for use in its business and does not, at this time, anticipate paying dividends on its shares. Any determination to pay any future dividends will remain at the discretion of the Company’s board of directors and will be made taking into account its financial condition and other factors deemed relevant by the board. Further, pursuant to debt instruments of the Company in place from time to time, the Company may, in certain circumstances, be required to obtain consent from lenders prior to declaring dividends.
53 |
DESCRIPTION OF CAPITAL STRUCTURE
Common Shares
The Company is authorized to issue an unlimited number of Common Shares without par value, of which 579,115,291 Common Shares were issued and outstanding at the close of business March 25, 2019. Holders of Common Shares are entitled to receive notice of any meetings of shareholders of the Company, and to attend and to cast one vote per Common Share at all such meetings. Holders of Common Shares do not have cumulative voting rights with respect to the election of directors and, accordingly, holders of a majority of the Common Shares entitled to vote in any election of directors may elect all directors standing for election.
Holders of Common Shares are entitled to receive on a pro-rata basis such dividends, if any, as and when declared by the Company’s board of directors at its discretion from funds legally available therefor and, on the liquidation, dissolution or winding up of the Company, are entitled to receive on a pro-rata basis the net assets of the Company after payment of debts and other liabilities, in each case subject to the rights, privileges, restrictions and conditions attaching to any other series or class of shares ranking senior in priority to or on a pro-rata basis with the holders of common shares with respect to dividends or liquidation. The common shares do not carry any pre-emptive, subscription, redemption or conversion rights.
The Company also has options and notes outstanding. See the notes to the Company’s audited consolidated financial statements for the year ended December 31, 2018 for additional information regarding the Company’s convertible securities.
Ratings
Below are the ratings for New Gold’s corporate debt as at March 25, 2019:
· | Standard & Poor’s Ratings Services: B (Recovery Rating: 3) |
· | Moody’s Investors Service: Caa1 (SGL-4) |
Credit ratings are intended to provide investors with an independent measure of the credit quality of an issue of securities; an indication of the likelihood of repayment for an issue of securities; and an indication of the capacity and willingness of the issuer to meet its financial obligations in accordance with the terms of those securities. Credit ratings are not assurances of credit quality or exact measures of the likelihood of default.
The information concerning our credit ratings relates to New Gold’s financing costs, liquidity and operations. The availability of funding options may be affected by certain factors, including the global capital market environment and outlook as well as the Company’s financial performance. New Gold’s ability to access capital markets at competitive rates is dependent on its credit rating and rating outlook, as determined by credit rating agencies such as S&P and Moody’s (both as defined below), and if the Company’s ratings were downgraded, financing costs and future debt issuances could be unfavourably impacted. A description of the rating agencies’ credit ratings listed above is set out below.
Standard & Poor’s Ratings Services (“S&P”) credit ratings are on a rating scale ranging from AAA to D, which represents the range from highest to lowest quality. The ratings from AA to CCC may be modified by the addition of a plus (+) or minus (–) sign to show relative standing within the major rating categories. S&P’s rating is a forward-looking opinion about credit risk and assesses the credit quality of the individual debt issue and the relative likelihood that the issuer
54 |
may default. The B rating is ranked sixth out of S&P’s ten major rating categories. According to the S&P rating system, an obligor of debt securities rated B has the capacity to meet its financial commitment on the debt security, however, adverse business, financial, or economic conditions will likely impair the obligor's capacity or willingness to meet its financial commitment on the obligation. In addition, S&P uses a scale of 1+ to 6 for recovery ratings, which represent the range, from high to low, of the percentage of principal and unpaid accrued interest that an investor may expect to receive in the case of default. A “3” recovery rating ranks fourth out of S&P’s seven recovery rating categories and indicates S&P’s expectation of meaningful (50% -70%) recovery in a default scenario.
Moody’s Investors Service (“Moody’s”) credit ratings are on a rating scale that ranges from Aaa to C, which represents the range from highest to lowest quality, with a rating of Caa being the seventh highest of nine major categories. The generic rating classifications from Aa through Caa may be modified by the numerical modifiers 1, 2 and 3. The modifier 1 indicates that the obligation ranks in the higher end of its generic rating category; the modifier 2 indicates a mid-range ranking; and the modifier 3 indicates a ranking in the lower end of that generic category. According to Moody’s, obligations rated Caa1 are judged to be of poor standing and are subject to high credit risk. In addition, Moody’s uses a speculative-grade loss (“SGL”) assessment scale of 1 to 4, which represents Moody’s opinion about issuers' relative abilities' to generate cash from internal resources and external sources of committed financing in relation to their cash obligations over the coming 12 months. A SGL-4 ranks fourth out of Moody’s four SGL assessment categories. Issuers rated SGL-4 possess weak liquidity. They are expected to rely on external sources of committed financing. Based on Moody's evaluation, they rely on external sources of financing and the availability of that financing is, in Moody's opinion, highly uncertain.
The credit ratings for New Gold’s corporate debt are based on, among other things, information furnished to the above ratings agencies by the Company and information obtained by the ratings agencies from publicly available sources. The credit ratings are not recommendations to buy, sell or hold securities since such ratings do not comment as to market price or suitability for a particular investor. There is no assurance that any rating will remain in effect for any given period of time or that any rating will not be revised or withdrawn entirely by a rating agency in the future if, in its judgment, circumstances so warrant. Credit ratings given to New Gold’s corporate debt may not reflect the potential impact of all risks on the value of debt instruments, including risks related to market or other factors discussed in this Annual Information Form. See also “Risk Factors”.
55 |
MARKET FOR SECURITIES
Trading Price and Volume
Common Shares
The Common Shares of the Company are listed and posted for trading on the TSX and NYSE American in each case under the symbol “NGD”. The following table contains information relating to the trading of the Common Shares in Canadian dollars on the TSX for the months indicated.
2018 | High (C$) | Low (C$) | Volume |
January | 4.45 | 3.63 | 27,333,144 |
February | 3.76 | 3.16 | 23,235,768 |
March | 3.44 | 2.98 | 17,183,752 |
April | 3.44 | 2.85 | 31,735,973 |
May | 3.22 | 2.89 | 24,728,777 |
June | 2.99 | 2.66 | 21,711,449 |
July | 2.86 | 1.54 | 42,752,248 |
August | 1.76 | 1.24 | 28,435,754 |
September | 1.47 | 0.97 | 44,322,262 |
October | 1.18 | 0.90 | 33,529,731 |
November | 1.25 | 1.00 | 18,045,000 |
December | 1.19 | 0.99 | 24,539,589 |
The price of the Common Shares as quoted by the TSX at the close of business on December 31, 2018, the last trading day prior to year-end, was C$1.05 and on March 25, 2019 was C$1.13.
DIRECTORS AND OFFICERS
The names, positions or offices held with the Company, province/state and country of residence, and principal occupation of the directors and executive officers of the Company as at March 25, 2019 are set out below. In addition, the principal occupations of each of the Company’s directors and executive officers within the past five years are disclosed in their biographies.
As at March 25, 2019, directors and executive officers of the Company, as a group, beneficially owned, directly or indirectly, or exercised control or direction over 928,764 common shares of the Company, representing approximately 0.16% of its issued and outstanding shares.
The term of each director of the Company expires at the annual general meeting of shareholders, where they can be nominated for re-election. The Company’s officers hold their respective offices at the discretion of the board, but typically on an annual basis, after the annual general meeting, the directors pass resolutions to appoint officers and committees.
56 |
RENAUD ADAMS Ontario, Canada Director since: September 12, 2018 Non-Independent Director President and Chief Executive Officer
Securities on March 25, 2019 Common Shares: 400,000 PSUs: 485,559 |
Renaud Adams has more than 25 years of experience in the mining industry. He was the President and Chief Executive Officer of Richmont Mines Inc. from 2014 until the sale of the company to Alamos Gold in November 2017. During Mr. Adams’ time at Richmont Mines, production at the company’s principal mine more than doubled, mineral reserves more than tripled, and costs were reduced to make the Island Gold Mine in Ontario one of the lowest cost operating underground mines in the Americas. From 2011 to 2014, Mr. Adams was the Chief Operating Officer at Primero Mining Corporation, and prior to that he was with IAMGOLD Corporation from 2007 to 2011 as the General Manager of the Rosebel mine in Suriname and then the Senior Vice President, Americas Operations. Prior to IAMGOLD, Mr. Adams held various senior operations positions at mining operations located in the Americas. Mr. Adams is also a director of GT Gold Corp. Mr. Adams holds a Bachelor of Engineering degree in Mining and Mineral Processing from Laval University in Quebec, Canada. |
GILLIAN DAVIDSON Edinburgh, United Kingdom Director since: April 25, 2018 Independent Director
Securities on March 25, 2019 DSUs: 29,070 |
Gillian Davidson has 20 years of experience as an internal and external advisor to companies and other organizations regarding sustainability, social license and community relations. Most recently, Dr. Davidson was the Head of Mining and Metals for the World Economic Forum from 2014 to 2017, where she led global and regional engagement and multi-stakeholder initiatives to advance responsible and sustainable mining. From 2008 to 2014, she was Director of Social Responsibility at Teck Resources Limited, supporting social and environmental commitments and performance across the mining lifecycle. Before joining Teck, Dr. Davidson held roles related to community development, environment and natural resources as a consultant and in government. Dr. Davidson presently serves as a director on the board of Lydian International Limited. Dr. Davidson has an Honours Master of Arts in Geography from the University of Glasglow, a PhD in Development Economics and Economic Geography from the University of Liverpool and is an alumnus of the Governor General of Canada’s Leadership Conference. |
JAMES GOWANS British Columbia, Canada Director since: July 9, 2018 Independent Director
Securities on March 25, 2019 DSUs: 45,907 |
James Gowans has more than 30 years of experience in mineral exploration, mine feasibility studies, mine construction and commissioning and the development of best practices in mine safety, operations and economic performance improvement. From January 2016 to August 2018, he was the President and Chief Executive Officer of Arizona Mining Inc. Previously, he was with Barrick Gold Corporation as Senior Advisor to the Chairman from August to December 2015, Co-President from July 2014 to August 2015, and Executive Vice President and Chief Operating Officer from January to July 2014. From 2011 to 2014, Mr. Gowans was the Managing Director of Debswana Diamond Company (Pty) Ltd., and prior to that he held executive positions at various companies including De Beers SA, De Beers Canada Inc., PT Inco Indonesia tbk and Placer Dome Inc. Mr. Gowans previously served as the President of the Canadian |
57 |
Institute of Mining, Metallurgy and Petroleum, the Chair of the Board of the Mining Association of Canada, and a director of the Conference Board of Canada. He is the former Chair of Detour Gold Corporation and currently serves on the boards of directors of Cameco Ltd. and Titan Mining Corporation, as well as Gedex Technologies Inc., an innovative geophysics systems company. Mr. Gowans is a Professional Engineer, holds a Bachelor of Applied Science degree in mineral engineering from the University of British Columbia, and attended the Banff School of Advanced Management. | |
MARGARET MULLIGAN Ontario, Canada Director since: April 25, 2018 Independent Director
Securities on March 25, 2019 DSUs: 29,070 |
Margaret (Peggy) Mulligan has over 35 years of experience in audit and finance. From 2008 to 2010, Ms. Mulligan was the Executive Vice President and Chief Financial Officer of Biovail Corporation and from 2005 to 2007 she was the Executive Vice President and Chief Financial Officer of Linamar Corporation. From 1994 to 2004, Ms. Mulligan was the Senior Vice President, Audit and Chief Inspector and then the Executive Vice President, Systems and Operations of The Bank of Nova Scotia. Before joining Scotiabank, she was an Audit Partner with PricewaterhouseCoopers. She holds a Bachelor of Math (Honours) from the University of Waterloo and is a Chartered Professional Accountant, FCPA, CA. Ms. Mulligan also serves as a director on the boards of Canadian Western Bank and Ontario Power Generation Inc., as well as the Ladies Professional Golf Association. |
IAN PEARCE Ontario, Canada Director since: April 27, 2016 Independent Director
Securities on March 25, 2019 Common Shares: 27,200 DSUs: 112,853 Stock options: 117,198 |
Ian Pearce is the Chair of the Board of New Gold. Mr. Pearce has over 35 years of experience in the mining industry. From 1993 to 2003, Mr. Pearce held progressively more senior engineering and project management roles with Fluor Inc., including managing numerous significant development projects in the extractive sector. From 2003 to 2006, Mr. Pearce held executive roles at Falconbridge Limited, including Chief Operating Officer, and he subsequently served as Chief Executive Officer of Xstrata Nickel, a subsidiary of Xstrata plc, from 2006 to 2013. From 2013 to 2017, Mr. Pearce was a partner of X2 Resources, a private partnership focused on building a mid-tier diversified mining and metals group. Mr. Pearce currently serves as the Chair of the Board of MineSense Technologies Ltd., a technology company seeking to improve the ore extraction and recovery process, and a director of KoBold Metals, a company that deploys digital tools to discover new cobalt deposits, as well as a director of Outotec Oyj. He also recently served as the Chair of the Board of Nevsun Resources Ltd. up to its acquisition by Zijin Mining Group Co. Ltd. in December 2018. Mr. Pearce holds a Higher National Diploma in Engineering (Mineral Processing) and a Bachelor of Science degree from the University of the Witwatersrand in South Africa. Mr. Pearce’s principal occupation is as a Corporate Director. |
MARILYN SCHONBERNER Alberta, Canada Director since: |
Marilyn Schonberner served as the Chief Financial Officer and Senior Vice President, and an Executive Director, of Nexen Energy ULC from January 2016 to June 2018. She joined Nexen in 1997 and over her 21 year career with the |
58 |
June 26, 2017 Independent Director
Securities on March 25, 2019 DSUs: 67,177 |
company held positions of increasing responsibility including General Manager of Human Resources Services; Director of Corporate Audit; Director of Business Services U.K.; and Treasurer and Vice President of Corporate Planning. Prior to joining Nexen, Ms. Schonberner spent over 15 years in finance, strategic planning and organization development in the energy sector and as a consultant. Ms. Schonberner currently serves on the board of directors of Wheaton Precious Metals Corp. and she is a member of the Executive Committee of the Calgary Chapter of the Institute of Corporate Directors. Ms. Schonberner holds a Bachelor of Commerce from the University of Alberta and a Master of Business Administration from the University of Calgary. She is a CPA, CMA and a Certified Internal Auditor. Ms. Schonberner completed the Senior Executive Development Programme at the London Business School and has obtained the ICD.D designation from the Institute of Corporate Directors. Ms. Schonberner’s principal occupation is as a Corporate Director. |
ROBERT CHAUSSE Ontario, Canada Executive Vice President and Chief Financial Officer
Securities on March 25, 2019 Common Shares: 240,000 PSUs: 283,342 |
Robert Chausse has an extensive background of more than 25 years of international finance and mining experience. Most recently, he was Chief Financial Officer of Richmont Mines Inc., prior to which he was Chief Financial Officer at Stornoway Diamonds. From 2013 to 2015, Mr. Chausse was Executive Vice President and Chief Financial Officer of AuRico Gold, and from 2009 to 2013, he served as Vice President of Finance, Operations and Projects for Kinross Gold. He also served as Chief Financial Officer for Baffinland Iron Mines Corporation from 2006 to 2009 and held increasingly senior positions with Barrick Gold from 1998 to 2006. Rob received his Chartered Accountant designation in 1990. |
LISA DAMIANI Ontario, Canada General Counsel, Executive Vice President, Government Relations and Corporate Secretary
Securities on March 25, 2019 Common Shares: 61,564 PSUs: 550,712 Stock options: 720,000
|
Lisa Damiani has been the Vice President, General Counsel and Corporate Secretary of New Gold since June 2013. Previously, she was engaged in the private practice of law at Davies Ward Phillips & Vineberg LLP from 2001 as a partner, and from 1999 to 2000 as an associate. Mr. Damiani has over 20 years' experience in corporate and securities law and mergers and acquisitions with a focus on the mining sector and has received extensive recognition in the industry. Ms. Damiani holds a Bachelor of Arts, a Bachelor of Laws and a Masters of Business Administration from the University of Toronto. |
ANNE DAY Ontario, Canada Vice President, Investor Relations
Securities on March 25, 2019 Common Shares: 100,000 PSUs: 36,245 |
Anne Day is a senior executive with more than 20 years of capital market experience that includes the development and implementation of effective global investor relations strategies, primarily in the mining sector. From 2015 to 2017, Anne was Senior Vice President, Investor Relations for Richmont Mines, where she was part of the senior executive team that led the transformation of Richmont to be one the top junior mining companies in the Americas. From 2007 to 2015, she was Vice President, Investor Relations for AuRico Gold. Anne also served on the Board of Directors of AuRico Metals from 2015 to 2017. Anne holds |
59 |
a B. Comm degree (Marketing), an MBA (Finance) from the Sobeys School of Business and an ICD.D designation from the Rotman School of Management. | |
ERIC VINET Quebec, Canada Vice President, Technical Services
Mr. Vinet did not hold any New Gold securities on March 25, 2019.
|
Eric Vinet has over 29 years of experience in the mining industry and brings with him a wealth of knowledge in numerous areas of mining production, including with various types of deposits: precious metals (Au, Ag), base metals (Cu, Zn, Ni), as well as with both underground and open pit mining operations. Mr. Vinet has been involved at various stages of mine construction and optimization, general site layout, and water and tailings facilities. Underground project experience includes backfill/pastefill systems, alimak/raisebore, ventilation, production methods and others to optimize the operations. He was General Manager for Semafo at the Mana Gold mine in Burkina Faso and also at the Samira Hill mine in Niger, both open pit mines. His open pit experience includes supervisory roles at the Jeffrey mine and at McWatters Mines Inc., both in Canada. Prior to this, he held a similar role with Scorpio Mining at the Nuestra Senora mine in Mexico, an underground mining operation. Additional underground mining experience includes: Aur Resources (Mine Louvicourt) Quebec - Project Engineer and Supervisory roles; Kahama Mining (Bulyanhulu Mine) Tanzania - Underground Production Supervisor; Canmet Laboratory - Research Engineer; Campbell Resources Inc., Chibougamau Quebec– Superintendent; Breakwater Resources (El Mochito mine), Honduras - Mine Manager; and Les Mines Sigma ltd, Val D’or Quebec - Project Engineer and Supervisory roles with narrow vein mining. In the last two years he has also worked on several studies with DRA and InnovExplo. Mr. Vinet graduated from École Polytechnique de Montreal with a Bachelor's degree in Mining Engineering in 1989. |
Standing Committees of the Board
There are currently four standing committees of the board of directors: the Audit Committee, the Compensation Committee; the Corporate Governance and Nominating Committee, and the Technical and Sustainability Committee. The following table identifies the members of each of these committees and indicates whether each committee member is considered independent or non-independent:
Board Committee | Committee Members | Status |
Audit Committee | Marilyn Schonberner (Chair) | Independent |
James Gowans | Independent | |
Margaret Mulligan | Independent | |
Human Resources and Compensation Committee | James Gowans (Chair) | Independent |
Ian Pearce | Independent | |
Marilyn Schonberner | Independent | |
Corporate Governance and Nominating Committee |
Margaret Mulligan (Chair) Gillian Davidson Ian Pearce |
Independent Independent Independent |
Technical and Sustainability Committee | Gillian Davidson (Chair) | Independent |
James Gowans | Independent | |
Ian Pearce | Independent |
60 |
Corporate Cease Trade Orders, Bankruptcies, Penalties or Sanctions
No director or executive officer of the Company is, or within ten years prior to the date of this Annual Information Form has been, a director, chief executive officer or chief financial officer of any company (including New Gold) that (i) was subject to a cease trade order, an order similar to a cease trade order or an order that denied the relevant company access to any exemption under securities legislation, and that was in effect for a period of more than 30 consecutive days, that was issued while the director or executive officer was acting in the capacity as director, chief executive officer or chief financial officer of such company; or (ii) was subject to a cease trade order, an order similar to a cease trade order or an order that denied the relevant company access to any exemption under securities legislation, that was in effect for a period of more than 30 consecutive days, that was issued after the director or executive officer ceased to be a director, chief executive officer or chief financial officer of such company and which resulted from an event that occurred while that person was acting in the capacity as director, chief executive officer or chief financial officer.
No director or executive officer of the Company, or a shareholder holding a sufficient number of securities of the Company to materially affect the control of the Company, (i) is, or within ten years prior to the date of this Annual Information Form has been, a director or executive officer of any company (including New Gold) that, while that person was acting in that capacity, or within a year of that person ceasing to act in that capacity, became bankrupt, made a proposal under any legislation relating to bankruptcy or insolvency or was subject to or instituted any proceedings, arrangement or compromise with creditors or had a receiver, receiver manager or trustee appointed to hold its assets.
No director or executive officer of the Company, or a shareholder holding a sufficient number of securities of the Company to affect materially the control of the Company, has been subject to (i) any penalties or sanctions imposed by a court relating to securities legislation or by a securities regulatory authority or has entered into a settlement agreement with a securities regulatory authority; or (ii) any other penalties or sanctions imposed by a court or regulatory body that would likely be considered important to a reasonable investor in making an investment decision.
Conflicts of Interest
Certain directors and officers of the Company also serve as directors or officers of other companies involved in natural resource exploration and development and consequently there exists the possibility for such directors and officers to be in a position of conflict. The Company has adopted a Code of Business Conduct and Ethics that addresses potential conflicts of interest.
Audit Committee
Audit Committee Charter
The Company’s Audit Committee Charter is set out in full in Schedule A.
Composition of the Audit Committee
The following directors are members of the Audit Committee as at March 25, 2019:
Marilyn Schonberner (Chair) | Independent (1) | Financially literate (2) |
James Gowans | Independent (1) | Financially literate (2) |
Margaret Mulligan | Independent (1) | Financially literate (2) |
(1) | A member of an Audit Committee is independent if the member has no direct or indirect material relationship with the Company which could, in the view of the Company’s board of directors, reasonably interfere with the exercise of the member’s independent judgment. |
61 |
(2) | An individual is financially literate if he or she has the ability to read and understand a set of financial statements that present a breadth of complexity of accounting issues that are generally comparable to the breadth and complexity of the issues that can reasonably be expected to be raised by the Company’s financial statements. |
Relevant Education and Experience
The education and experience of each Audit Committee member relevant to the performance of his responsibilities as a member of the Audit Committee is described in their respective biographies set out under the heading “Directors and Officers” on page 57.
Pre-Approval Policies and Procedures
The Committee is responsible for the pre-approval of all audit, audit-related and non-audit services provided by the independent auditor. The Committee has delegated to the Chair the authority to pre-approve proposals for non-audit related services to be provided by the Company’s auditors up to a value of C$100,000 per engagement, and to report any such approvals to the Committee as a whole at the next Committee meeting. The Chair of the Committee is responsible for proper implementation of and compliance with this policy. In accordance with this policy, 100% of external auditor services described below were pre-approved by the Audit Committee or the Chair of the Audit Committee. None of the audit-related services described below were approved by the Audit Committee pursuant to the de minimis exception provided by Section (c)(7)(i)(C) of Rule 2-01 of Regulation S-X.
External Auditor Service Fees (by category)
The aggregate fees billed by the Company’s external auditor in each of the last two fiscal years are as follows:
Financial Years Ending December 31 |
Audit Fees (1) | Audit Related Fees (2) | Tax Fees (3) | All Other Fees |
2018 | C$1,881,677 | C$24,903 | C$53,006 | C$15,000 |
2017 | C$1,989,435 | C$235,000 | C$35,505 | C$125,000 |
(1) | The aggregate fees billed for the performance of the audit or review of the Company’s financial statements. |
(2) | The aggregate fees billed for assurance and related services that are reasonably related to the performance of the audit or review of the Company’s financial statements which are not included under the heading “Audit Fees”. |
(3) | The aggregate fees billed for professional services rendered for tax compliance, tax advice and tax planning. |
Deloitte LLP is the independent registered public accounting firm that has been appointed as the external auditor of New Gold and is independent within the meaning of the Rules of Professional Conduct of the Chartered Professional Accountants of Ontario.
LEGAL PROCEEDINGS AND REGULATORY ACTIONS
The Company is, from time to time, involved in various claims, legal proceedings and complaints arising in the ordinary course of business. As of the date hereof, there are no outstanding material proceedings to which the Company is a party.
62 |
INTEREST OF MANAGEMENT AND OTHERS IN MATERIAL TRANSACTIONS
Since January 1, 2016, no director, executive officer or 10% shareholder of the Company or any associate or affiliate of any such person or company, has or had any material interest, direct or indirect, in any transaction that has materially affected or is reasonably expected to materially affect the Company.
TRANSFER AGENT AND REGISTRAR
The Company’s transfer agent and registrar is Computershare Investor Services Inc. Transfers may be effected and registration facilities are maintained at each of the following offices: (i) 510 Burrard Street, Vancouver, British Columbia, V6C 2T5; and (ii) 100 University Avenue, Toronto, Ontario, M5J 2Y1.
MATERIAL CONTRACTS
Except for contracts entered into in the ordinary course of business, the Company has not entered into any material contracts during the most recently completed financial year or prior financial year which are still in force and effect and which may reasonably be regarded as presently material other than as set out below:
· | Indenture dated as of November 14, 2012 between New Gold Inc., the Guarantors (Metallica Resources Inc., Minera San Xavier S.A. de C.V., Peak Gold Ltd., Peak Gold Mines Pty Ltd., Rockcliff Group Limited, Western Goldfields Inc. and Western Mesquite Mines, Inc.), and Computershare Trust Company, N.A. (as Trustee) relating to the 6.25% Senior Notes due 2022. See “Notes” on page 54 for more information. |
· | Indenture dated as of May 18, 2017 between New Gold Inc., the Guarantors (Minera San Xavier S.A. de C.V., New Gold Mesquite Inc., New Gold CSP Ltd., New Gold Finance Inc., Western Goldfields (USA) Inc., New Gold Netherlands Cooperatie U.A., Peak Gold Asia Pacific Pty Ltd., Peak Gold Mines Pty Ltd. and Western Mesquite Mines, Inc.), and Computershare Trust Company, N.A. (as Trustee) relating to the 6.375% Senior Notes due 2025. See “Notes” on page 54 for more information. |
· | Amended and Restated Credit Agreement dated as of October 30, 2018 between New Gold Inc. (as borrower) and The Bank of Nova Scotia and RBC Capital Markets (as Co-Lead Arrangers and Joint Book Runners) and The Bank of Nova Scotia (as Administrative Agent) and Royal Bank of Canada (as Syndication Agent) and The Bank of Nova Scotia, Royal Bank of Canada, JPMorgan Chase Bank, N.A., The Toronto-Dominion Bank, Canadian Imperial Bank of Commerce, Bank of Montreal, Export Development Canada and Bank of America, N.A., Canada Branch (as Lenders) described under the heading “General Development of the Business - Developments - Financial” on page 10. |
TECHNICAL REPORTS
Below are the titles, authors and dates of the most recent technical reports for each of New Gold’s material properties (as described under “Description of the Business” on page 11), which are all filed in accordance with NI 43-101 and available under the Company’s profile on SEDAR at www.sedar.com.
· | The most recent technical report on the Rainy River Mine that is filed on SEDAR at www.sedar.com is titled “Technical Report on the Rainy River Mine, Ontario, Canada” dated July 25, 2018 by Nicholas Kwong, P.Eng, Michele Della Libera, P.Geo., Dinara Nussipakynova, P.Geo, Andrew Paul Hampton, P.Eng., Binsar Sirait, SME Registered Member, Herbert A. Smith, P.Eng., Lee Patrick Gochnour, QP, MMSA. |
63 |
· | The most recent technical report on the New Afton Mine that is filed on SEDAR at www.sedar.com is titled “Technical Report on the New Afton Mine, British Columbia, Canada” dated March 23, 2015 by David W. Rennie, P. Eng, R. Dennis Bergen, P. Eng., and Holger Krutzelmann, P. Eng., for Roscoe Postle Associates Inc. |
To New Gold’s knowledge, the authors of the technical reports listed above held either less than one percent or no securities of the Company or of any associate or affiliate of the Company when they prepared the applicable technical report or received any securities in connection with the preparation of such report.
64 |
SCHEDULE
A
Audit Committee Charter
1. | Purpose and Authority |
The Audit Committee (“Committee”) is a committee of the Board of Directors (“the Board”). Its primary function shall be to assist the Board in fulfilling its oversight responsibilities with respect to accounting and financial reporting processes, the integrity of the financial statements of New Gold Inc. (the “Company”), compliance with legal and regulatory requirements, the overall adequacy and maintenance of the systems of internal controls that management has established and the overall responsibility for the Company's external and internal audit processes including the external auditor’s qualifications, independence and performance.
The Committee shall have access to such officers and employees of the Company, its external auditor and its legal counsel as the Committee considers to be necessary or desirable in order to perform its duties and responsibilities. In addition, the Committee shall have the authority and funding to retain independent legal, accounting and other consultants to advise the Committee. The Company shall provide for appropriate funding, as determined by the Committee, for payment of compensation to any advisers retained by the Committee and to the external auditor engaged by the Company for the purpose of rendering or issuing an audit report or performing other audit, review or attest services and ordinary administrative expenses of the Committee that are necessary or appropriate in carrying out its duties.
The Committee shall be accountable to the Board. In the course of fulfilling its specific responsibilities, the Committee shall maintain open communication between the Company's external auditor and the Board.
The responsibilities of a member of the Committee shall be in addition to such member's duties as a member of the Board.
The Committee has the duty to review and ensure that the Company's financial disclosures are complete and accurate, are in accordance with generally accepted accounting principles and fairly present the financial position and risks of the organization. The Committee should, where it deems appropriate, review compliance with laws and regulations and the Company's own policies.
The Committee will provide the Board with such recommendations and reports with respect to the financial disclosures of the Company as it deems advisable.
2. | Membership and Composition |
The Committee shall consist of at least three independent directors who shall serve on behalf of the Board. The Board, at its organizational meeting held in conjunction with each annual general meeting of the Shareholders, shall appoint the members of the Committee for the ensuing year. Each member shall meet the independence, financial literacy and experience requirements of the TSX, the NYSE American and any other exchange upon which the securities of the Company may be listed to the extent required by the rules of such exchange, National Instrument 52-110 – Audit Committees, the U.S. Sarbanes-Oxley Act of 2002, Rule 10A-3 under the Securities Exchange Act of 1934, and any other applicable regulatory bodies, as required. Each member of the Committee must not have participated in the preparation of the financial statements of the Company or any current subsidiary of the Company at any time in the preceding three years. The Board may, at any time and from time to time, remove or replace any member of the Committee, fill any vacancy in the Committee or add a member to the Committee.
Financial literacy requires that all members of the Committee shall have the ability to read and understand a set of financial statements that present the breadth and level of complexity of accounting issues that are generally comparable to the breadth and complexity of issues that can reasonably be expected to be raised by the Company’s financial statements. At least one member of the Committee shall be able to analyze and interpret a full set of financial statements, including the related notes, in accordance with International Financial Reporting Standards (“IFRS”) and at least one member of the
A-1 |
Committee shall qualify and be designated as the Audit Committee Financial Expert as determined in the judgment of the Board with reference to applicable law and stock exchange rules.
A majority of members of the Committee, present in person or by telephone or other telecommunication device that permits all persons participating in the meeting to speak and to hear each other, will constitute a quorum for a meeting of the Committee.
The Board will appoint one member of the Committee to act as the chair (“Chair”) of the Committee. In his or her absence, the Committee may appoint another person to act as chair of a meeting of the Committee provided a quorum is present. The Chair will appoint a secretary of the meeting, who need not be a member of the Committee and who will maintain the minutes of the meeting.
3. | Meetings |
At the request of the external auditor, the Chair of the Board, the President and Chief Executive Officer (“CEO”) or the Chief Financial Officer (“CFO”) of the Company or any member of the Committee, the Chair of the Committee will convene a meeting of the Committee. In advance of every meeting of the Committee, the Chair, with the assistance of the CFO, will ensure that the agenda and meeting materials are distributed in a timely manner.
The Committee shall meet regularly and at least on a quarterly basis. The Committee shall hold in camera sessions without the presence of management after each meeting.
4. | Duties and Responsibilities |
The Committee shall take charge of all responsibilities imparted on an audit committee of the Company, as they may apply from time to time, under the Business Corporations Act (British Columbia), National Instrument 52-110 – Audit Committees, the U.S. Sarbanes Oxley Act of 2002, Rule 10A-3 under the Securities Exchange Act of 1934, and stock exchange rules. The duties and responsibilities of the Committee include the following:
4.1 | Financial Reporting and Disclosure |
a. | Review and discuss with management and the external auditor at the completion of the annual examination: |
i. | the Company's audited financial statements and related notes; |
ii. | the external auditor's audit of the financial statements and their report; |
iii. | any significant changes required in the external auditor's audit plan; |
iv. | any serious difficulties or disputes with management encountered during the course of the audit; and |
v. | other matters related to the conduct of the audit which are to be communicated to the Committee under IFRS. |
b. | Review and discuss with management and the external auditor at the completion of any review engagement or other examination, the Company's quarterly financial statements. |
c. | Review and discuss with management, prior to their public disclosure, the annual reports, quarterly reports, Management’s Discussion and Analysis (“MD&A”), earnings press releases and any other material disclosure documents containing or incorporating by reference audited or unaudited financial statements of the Company and, if thought advisable, provide their recommendations on such documents to the Board. |
A-2 |
d. | Review and discuss with management any guidance being provided to shareholders on the expected earnings of the Company and, if thought advisable, provide their recommendations on such documents to the Board. |
e. | Inquire of the auditors regarding the quality and acceptability of the Company's accounting principles and estimates, including the clarity of financial disclosure and the degree of conservatism or aggressiveness of the accounting policies and estimates. |
f. | Review the Company's compliance with any policies and reports received from regulators. Discuss with management and the external auditor the effect on the Company's financial statements of significant regulatory initiatives. |
g. | Meet with the external auditor and management in separate executive sessions, as necessary or appropriate, to discuss any matters that the Committee or any of these groups believe should be discussed privately with the Committee. |
h. | Ensure that management has the proper and adequate systems and procedures in place for the review of the Company's financial statements, financial reports and other financial information including all Company disclosure of financial information extracted or derived from the Company’s financial statements, and that they satisfy all legal and regulatory requirements. The Committee shall periodically assess the adequacy of such procedures. |
i. | Review with the Company's counsel, management and the external auditor any legal or regulatory matter, including reports or correspondence, which could have a material impact on the Company's financial statements or compliance policies. |
j. | Based on discussions with the external auditor concerning the audit, the financial statement review and such other matters as the Committee deems appropriate, recommend to the Board the filing of the audited annual and unaudited quarterly financial statements and MD&A on SEDAR and the inclusion of the audited financial statements in the Annual Report on Form 40-F. |
4.2 | External Auditor |
a. | Be responsible for recommending to the Board the appointment of the Company's external auditor and for the compensation, retention and oversight of the work of the external auditor engaged by the Company. The external auditor shall report directly to the Committee. The Committee shall be responsible to resolve disagreements, if any, between management and the external auditor regarding financial reporting. |
b. | Consider, in consultation with the external auditor, the audit scope and plan of the external auditor. |
c. | Confirm with the external auditor and receive written confirmation at least once per year as to the external auditor's internal processes and quality control and disclosure of any investigations or government enquiries, reviews or investigations of the external auditor. |
d. | Take reasonable steps to confirm at least annually the independence of the external auditor, which shall include: |
i. | ensuring receipt from the external auditor of a formal written statement delineating all relationships between the external auditor and the Company, consistent with IFRS, and determine that they satisfy the requirements of all applicable securities laws, |
ii. | considering and discussing with the external auditor any disclosed relationships or services, including non-audit services, that may impact the objectivity and independence of the external auditor, and |
A-3 |
iii. | approving in advance any audit or permissible non-audit related services provided by the external auditor to the Company with a view to ensuring independence of the external auditor, and in accordance with any applicable regulatory requirements, including the requirements of all applicable securities laws with respect to approval of non-audit related serviced performed by the external auditor. |
e. | Approve the lead audit partner for the Company's external auditor, confirm that such lead partner has not performed audit services for the Company for more than five previous fiscal years, and otherwise ensure the rotation of the lead partner and other partners in accordance with all applicable securities laws. |
f. | Periodically review the performance of the Company’s external auditor and provide feedback to the extent deemed appropriate. |
g. | Review and approve the Company's hiring policies regarding partners, employees and former employees of the present and former external auditors of the Company. |
4.3 | Internal Controls and Audit |
a. | Review and assess the adequacy and effectiveness of the Company's systems of internal control and management information systems through discussion with management and the external auditor to ensure that the Company maintains appropriate systems, is able to assess the pertinent risks of the Company and that the risk of a material misstatement in the financial disclosures can be detected. |
b. | Assess the requirement for the appointment of an internal auditor for the Company and, if the appointment of an internal auditor is deemed appropriate, be responsible for (i) approving the appointment and removal of such internal auditor, and (ii) if deemed appropriate, establishing a position description for such internal auditor. |
c. | Review and approve the annual internal audit plan, and review on a periodic basis progress in executing the plan, significant changes to the plan, significant internal audit findings (including related to the adequacy of internal controls over financial reporting) and any significant internal fraud issues. |
d. | Review disclosures made to the Committee by the Company's CEO and CFO during their certification process required under applicable Canadian and United States securities laws. Review any significant deficiencies in the design and operation of internal controls over financial reporting or disclosure controls and procedures and any fraud involving management or other employees who have a significant role in the Company's internal controls. |
4.4 | Financial Risk Management |
a. | Ensure that principal areas of financial risk are identified and that plans and processes are in place to manage or mitigate these risks. |
b. | Review and report to the Board regarding the structure and adequacy of the Company’s insurance program, having regard to the Company’s business and insurable risks. |
4.5 | General |
a. | Unless otherwise delegated to another committee by the Board, conduct an ongoing review of any transaction now in effect, and review and approve in advance any proposed transaction, that could be within the scope of "related party transactions" as such term is defined in applicable securities laws, and |
A-4 |
establish appropriate procedures to receive material information about and prior notice of any such transaction. | ||
b. | Establish procedures for the receipt, retention and treatment of complaints received by the Company regarding accounting, internal accounting controls or auditing matters; and for the confidential, anonymous submission by employees of the Company of concerns regarding questionable accounting or auditing matters. |
c. | Conduct or authorize investigations into any matter within the scope of this Charter. The Committee may request that any officer or employee of the Company, its external legal counsel or its external auditor attend a meeting of the Committee or meet with any member(s) of the Committee. |
d. | Review the qualifications of the senior accounting and financial personnel. |
e. | Provide oversight of the Company’s policies, procedures and practices with respect to the maintenance of the books, records and accounts, and the filing of reports, by the Company with respect to third party payments in compliance with the Foreign Corrupt Practices Act (United States), Corruption of Foreign Public Officials Act (Canada), the Extractive Sector Transparency Measures Act (Canada) and similar applicable laws. |
f. | Perform any other activities consistent with this Charter, the Company's Articles and governing law, as the Committee or the Board deems necessary or appropriate. |
4.5 | Oversight Function |
While the Committee has the responsibilities and powers set out in this Charter, it is not the duty of the Committee to plan or conduct audits or to determine that the Company’s financial statements are complete and accurate or are in accordance with IFRS and applicable rules and regulations. These are the responsibilities of management and the external auditor. The Committee and the Chair and any members of the Committee identified as having accounting or related financial expertise are members of the Board, appointed to the Committee to provide broad oversight of the financial, risk and control related activities of the Company, and are not specifically accountable or responsible for the day to day operation or performance of such activities. Although the designation of a member as having accounting or related financial expertise for disclosure purposes is based on that individual's education and experience, which that individual will bring to bear in carrying out his or her duties on the Committee, such designation does not impose on such person any duties, obligations or liability that are greater than the duties, obligations and liability imposed on such person as a member of the Committee and the Board in the absence of such designation. Rather, the role of a member of the Committee who is identified as having accounting or related financial expertise, like the role of all members of the Committee, is to oversee the process, not to certify or guarantee the internal or external audit of the Company’s financial information or public disclosure.
5 | Chair of the Committee |
The Chair of the Committee:
a. | provides leadership to the Committee with respect to its functions as described in this Charter and as otherwise may be appropriate, including overseeing the logistics of the operations of the Committee; |
b. | chairs meetings of the Committee, unless not present, including in camera sessions, and reports to the Board following each meeting of the Committee on the findings, activities and any recommendations of the Committee; |
c. | ensures that the Committee meets on a regular basis and at least quarterly; |
A-5 |
d. | in consultation with the Chair of the Board and the Committee members, establishes a calendar for holding meetings of the Committee; |
e. | establishes the agenda for each meeting of the Committee, with input from other Committee members, the Chair of the Board and any other parties as applicable; |
f. | acts as liaison and maintains communication with the Chair of the Board and the Board to optimize and co-ordinate input from Board members, and to optimize the effectiveness of the Committee. This includes reporting to the full Board on all proceedings and deliberations of the Committee at the first meeting of the Board after each Committee meeting and at such other times and in such manner as the Committee considers advisable; |
g. | reports annually to the Board on the role of the Committee and the effectiveness of the Committee’s role in contributing to the objectives and responsibilities of the Board as a whole; |
h. | ensures that the members of the Committee understand and discharge their duties and obligations; |
i. | fosters ethical and responsible decision making by the Committee and its individual members; |
j. | together with the Corporate Governance and Nominating Committee, oversees the structure, composition, membership and activities delegated to the Committee from time to time; |
k. | ensures that resources and expertise are available to the Committee so that it may conduct its work effectively and efficiently and pre-approves work to be done for the Committee by consultants; |
l. | facilitates effective communication between members of the Committee and management; |
m. | addresses, or causes to be addressed, all concerns communicated to him or her under the Company’s Whistleblower Policy or Code of Conduct; and |
n. | performs such other duties and responsibilities as may be delegated to the Chair of the Committee by the Board from time to
time. |
This Charter will be reviewed annually and any recommended changes will be submitted to the Board for approval.
Reviewed and approved by the Board on December 7, 2018.
A-6 |
SCHEDULE
B
DEFINITIONS
Unless otherwise defined, technical terms used in this Annual Information Form have the following meanings. CIM Standards definitions are marked with an asterisk (*).
Term | Definition |
atomic absorption (AA) | A spectroanalytical procedure for the quantitative determination of chemical elements employing the absorption of optical radiation (light) by free atoms in the gaseous state. |
andesite | An extrusive igneous, volcanic rock of intermediate composition, with aphanitic to porphyritic texture. |
assay | Analysis to determine the amount or proportion of the element of interest contained within a sample. |
ball mill | A horizontal rotating steel cylinder which grinds ore to fine particles. The grinding is carried out by the pounding and rolling of a charge of steel balls carried within the cylinder. |
batholith | A very large igneous intrusion extending deep in the earth's crust. |
block cave | Used to mine massive, steeply-dipping ore bodies. An undercut with haulage access is driven under the ore body, with "drawbells" excavated between the top of the haulage level and the bottom of the undercut. The drawbells serve as a place for caving rock to fall into. The ore body is drilled and blasted above the undercut, and the ore is removed via the haulage access. |
block model | A three-dimensional model that forms the basic framework of a mineral resource estimate. |
bornite | A brittle reddish-brown crystalline mineral with an iridescent purple tarnish, consisting of a sulphide of copper and iron. |
breccia | A coarse-grained clastic rock, composed of angular broken rock fragments held together by a mineral cement or in a fine-grained matrix; it differs from conglomerate in that the fragments have sharp edges and unworn corners. |
bullion | Gold or silver in bulk before coining, or valued by weight. |
by-product | A secondary metal or mineral product that is recovered along with the primary metal or mineral product during the ore concentration process. |
calc-alkalic | Rocks are rich in alkaline earths (magnesia and calcium oxide) and alkali metals and make up a major part of the crust of the earth's continents. |
Cenozoic | The current and most recent of the three Phanerozoic geological eras, following the Mesozoic Era and covering the period from about 65 million years ago to the present. |
chalcocite | A dark gray mineral that is an important ore of copper. |
chalcopyrite | A copper mineral composed of copper, iron and sulphur. It tarnishes easily; going from bronze or brassy yellow to yellowish or grayish brown, has a dark streak, and is lighter in weight and harder than gold. |
B-1 |
Term | Definition |
concentrate | A processing product containing the valuable ore mineral from which most of the waste mineral has been eliminated. |
Core | Cylindrical rock cores produced by diamond drilling method that uses a rotating barrel and an annular-shaped, diamond-impregnated rock-cutting bit to produce cores and lift them to the surface to be examined. |
Cretaceous | A geologic period and system from circa 145 to 66 million years ago. The Cretaceous follows the Jurassic period and is followed by the Paleogene period of the Cenozoic era. It is the last period of the Mesozoic Era, and, spanning 80 million years, the longest period of the Phanerozoic Eon. |
crushing | Breaking of ore into smaller and more uniform fragments to be then fed to grinding mills or to a leach pad. |
crust | The outermost solid shell of a rocky planet, which is chemically distinct from the underlying mantle. |
cyanidation | A method of extracting exposed gold or silver grains from crushed or ground ore by dissolving the contained gold and silver in a weak cyanide solution. |
decline | A downward inclined underground tunnel. |
deformation | Change in the form or in the dimensions of a body produced by stress. |
Devonian | A geologic period and system of the Paleozoic Era spanning from the end of the Silurian Period, about 419 million years ago, to the beginning of the Carboniferous Period, about 359 million years ago. |
differential flotation | Process of separation of a complex ore into two or more mineral components and gangue by flotation. |
dilution | The effect of waste or low-grade ore being included unavoidably in the mine ore, lowering the recovered grade. |
doré | Unrefined gold and silver bullion bars, which will be further refined to almost pure metal. |
ejido | In Mexico, a piece of land farmed communally under a system supported by the state. |
electrowinning | Recovery of a metal from a solution by means of electro-chemical processes. |
Eocene | A major division of the geologic timescale and the second epoch of the Paleogene Period in the Cenozoic Era. The Eocene spans the time from the end of the Palaeocene Epoch to the beginning of the Oligocene Epoch. The start of the Eocene is marked by the emergence of the first modern mammals. |
epithermal | A hydrothermal mineral deposit formed within about one kilometre of the Earth’s surface and in the temperature range of 50 to 200 degrees Celsius, occurring mainly as veins. |
fault | A fracture in the earth’s crust accompanied by a displacement of one side of the fracture with respect to the other and in a direction parallel to the fracture. |
Feasibility Study | A comprehensive technical and economic study of the selected development option for a mineral project that includes appropriately detailed assessments of applicable Modifying Factors together with any other relevant operational factors and detailed financial |
B-2 |
Term | Definition |
analysis, that are necessary to demonstrate at the time of reporting that extraction is reasonably justified (economically mineable). The results of the study may reasonably serve as the basis for a final decision by a proponent or financial institution to proceed with, or finance, the development of the project. The confidence level of the study will be higher than that of a Pre-Feasibility Study. | |
felsic | Silicate minerals, magma, and rocks which are enriched in the lighter elements such as silicon, oxygen, aluminium, sodium, and potassium. |
fire assay | Analysis to determine the amount or proportion of the element of interest contained within a sample alloy by removal of other metals. Also known as gravimetric analysis. |
flotation | A separation process in which valuable mineral particles are induced to become attached to bubbles and float, while the non-valuable minerals sink. |
formation | Unit of sedimentary rock of characteristic composition or genesis. |
geophysical survey | Exploration activity mapping an area showing the physics of the earth. |
grade | The amount of metal in each tonne of ore, expressed as grams per tonne for precious metals. |
granite | A very hard, granular, crystalline, igneous rock consisting mainly of quartz, mica, and feldspar and often used as a building stone. |
grinding (milling) | Powdering or pulverizing of ore, by pressure or abrasion, to liberate valuable minerals for further metallurgical processing. |
hectares | A metric unit of area measuring 100 metres by 100 metres. |
hedging | Taking a buy or sell position in a futures market opposite to a position held in the cash market to minimize the risk of financial loss from an adverse price change. |
Indicated Mineral Resource* | The part of a Mineral Resource for which quantity, grade or quality, densities, shape and physical characteristics are estimated with sufficient confidence to allow the application of Modifying Factors in sufficient detail to support mine planning and evaluation of the economic viability of the deposit. Geological evidence is derived from detailed and reliable exploration, sampling and testing and is sufficient to assume geological and grade or quality continuity between points of observation. An Indicated Mineral Resource has a lower level of confidence than that applying to a Measured Mineral Resource and may only be converted to a Probable Mineral Reserve. |
Inferred Mineral Resource* | The part of a Mineral Resource for which quantity and grade or quality are estimated on the basis of limited geological evidence and sampling. Geological evidence is sufficient to imply but not verify geological and grade or quality continuity. An Inferred Mineral Resource has a lower level of confidence than that applying to an Indicated Mineral Resource and must not be converted to a Mineral Reserve. It is reasonably expected that the majority of Inferred Mineral Resources could be upgraded to Indicated Mineral Resources with continued exploration. |
infill | The collection of additional samples between existing samples, used to provide greater geological detail and to provide more closely-spaced assay data. |
B-3 |
Term | Definition |
intrusive | Igneous rock which, while molten, penetrated into or between other rocks and solidified before reaching the surface. |
lode | A mineral deposit, consisting of a zone of veins, veinlets or disseminations, in consolidated rock as opposed to a placer deposit. |
low-grade | Descriptive of ores relatively poor in the metal they are mined for; lean ore. |
mafic | A group of dark-colored minerals, composed chiefly of magnesium and iron, that occur in igneous rocks. |
Measured Mineral Resource* | The part of a Mineral Resource for which quantity, grade or quality, densities, shape, and physical characteristics are estimated with confidence sufficient to allow the application of Modifying Factors to support detailed mine planning and final evaluation of the economic viability of the deposit. Geological evidence is derived from detailed and reliable exploration, sampling and testing and is sufficient to confirm geological and grade or quality continuity between points of observation. A Measured Mineral Resource has a higher level of confidence than that applying to either an Indicated Mineral Resource or an Inferred Mineral Resource. It may be converted to a Proven Mineral Reserve or to a Probable Mineral Reserve. |
mill | A processing facility where ore is finely ground and then undergoes physical or chemical treatment to extract the valuable metals. Also, the device used to perform grinding (milling). |
mineral claim / property / concession | Authorizes the holder to prospect and mine for minerals and to carry out works in connection with prospecting and mining. |
Mineral Reserve* | The economically mineable part of a Measured and/or Indicated Mineral Resource. It includes diluting materials and allowances for losses, which may occur when the material is mined or extracted and is defined by studies at Pre-Feasibility or Feasibility level as appropriate that include application of Modifying Factors. Such studies demonstrate that, at the time of reporting, extraction could reasonably be justified. Mineral Reserves are sub-divided in order of increasing confidence into Probable Mineral Reserves and Proven Mineral Reserves. A Probable Mineral Reserve has a lower level of confidence than a Proven Mineral Reserve. |
Mineral Resource* | A concentration or occurrence of solid material of economic interest in or on the Earth’s crust in such form, grade or quality and quantity that there are reasonable prospects for eventual economic extraction. The location, quantity, grade or quality, continuity and other geological characteristics of a Mineral Resource are known, estimated or interpreted from specific geological evidence and knowledge, including sampling. Mineral Resources are sub-divided, in order of increasing geological confidence, into Inferred, Indicated and Measured categories. An Inferred Mineral Resource has a lower level of confidence than that applied to an Indicated Mineral Resource. An Indicated Mineral Resource has a higher level of confidence than an Inferred Mineral Resource but has a lower level of confidence than a Measured Mineral Resource. |
B-4 |
Term | Definition |
Modifying Factors | Modifying Factors are considerations used to convert Mineral Resources to Mineral Reserves. These include, but are not restricted to, mining, processing, metallurgical, infrastructure, economic, marketing, legal, environmental, social and governmental factors. |
open pit mine | A mine where materials are removed entirely from a working that is open to the surface. |
ore | Rock, generally containing metallic or non-metallic minerals, which can be mined and processed at a profit. |
oxidation | Reaction of a material with an oxidizer such as pure oxygen or air in order to alter the state of the material. |
oxide ore | Mineralized rock in which some of the original minerals have been oxidized. Oxidation tends to make the ore more amenable to cyanide solutions so that minute particles of gold will be readily dissolved. |
Paleozoic | An era of geologic time that includes the Cambrian, Ordovician, Silurian, Devonian, Mississippian, Pennsylvanian and Permian periods and is characterized by the appearance of marine invertebrates, primitive fishes, land plants and primitive reptiles. |
preliminary economic assessment (PEA) | A study, other than a Pre-Feasibility Study or Feasibility Study, which includes an economic analysis of the potential viability of Mineral Resources. The PEA is preliminary in nature and includes Inferred Mineral Resources that are considered too speculative geologically to have the economic considerations applied to them that would enable them to be categorized as Mineral Reserves and there is no certainty that the PEA based on these Mineral Resources will be realized. Mineral Resources that are not Mineral Reserves do not have demonstrated economic viability. |
porphyry | A variety of igneous rock consisting of large-grained crystals, such as feldspar or quartz, dispersed in a fine-grained feldspathic matrix or groundmass. |
Pre-Feasibility Study | A comprehensive study of a range of options for the technical and economic viability of a mineral project that has advanced to a stage where a preferred mining method, in the case of underground mining, or the pit configuration, in the case of an open pit, is established and an effective method of mineral processing is determined. It includes a financial analysis based on reasonable assumptions on the Modifying Factors and the evaluation of any other relevant factors which are sufficient for a Qualified Person, acting reasonably, to determine if all or part of the Mineral Resource may be converted to a Mineral Reserve at the time of reporting. A Pre-Feasibility Study is at a lower confidence level than a Feasibility Study. |
Probable Mineral Reserve* | The economically mineable part of an Indicated, and in some circumstances, a Measured Mineral Resource. The confidence in the Modifying Factors applying to a Probable Mineral Reserve is lower than that applying to a Proven Mineral Reserve. |
Proven Mineral Reserve* | The economically mineable part of a Measured Mineral Resource. A Proven Mineral Reserve implies a high degree of confidence in the Modifying Factors. |
pyrite | A yellow iron sulphide mineral, normally of little value. It is sometimes referred to as “fool’s gold.” |
B-5 |
Term | Definition |
pyroclastic | Rocks produced by explosive or aerial ejection of ash, fragments, and glassy material from a volcanic vent. |
pyrrhotite | A brownish yellow iron sulphide mineral. |
Qualified Person* | An individual who (i) is an engineer or geoscientist with a university degree, or equivalent accreditation, in an area of geosciences, or engineering, relating to mineral exploration or mining; (ii) has at least five years’ experience in mineral exploration, mine development or operation or mineral project assessment, or any combination of these, that is relevant to his or her professional degree or area of practice; (iii) has experience relevant to the subject matter of the mineral project and the technical report; (iv) is in good standing with a professional association; (v) and in the case of a professional association in a foreign jurisdiction, has a membership designation that (a) requires attainment of a position of responsibility in their profession that requires the exercise of independent judgment; and (ii) requires (1) a favourable confidential peer evaluation of the individual’s character, professional judgment, experience, and ethical fitness; or (2) a recommendation for membership by at least two peers, and demonstrated prominence or expertise in the field of mineral exploration or mining. |
quality assurance and quality control (QA/QC) | The process of measuring and assuring product quality to meet consumer expectations. |
reclamation | The restoration of a site after mining or exploration activity is completed. |
reclamation and closure costs | The cost of reclamation plus other costs, including without limitation certain personnel costs, insurance, property holding costs such as taxes, rental and claim fees, and community programs associated with closing an operating mine. |
recovered grade | Actual metal grade realized by the metallurgical process and treatment or ore, based on actual experience or laboratory testing. |
recovery | A term used in process metallurgy to indicate the proportion of valuable material obtained in the processing of an ore. It is generally stated as a percentage of valuable metal in the ore that is recovered compared to the total valuable metal present in the ore. |
refining | The final stage of metal production in which impurities are removed from the molten metal. |
reverse circulation | A drilling method that uses a rotating cutting bit within a double-walled drill pipe and produces rock chips rather than core. Air or water is circulated down to the bit between the inner and outer wall of the drill pipe. The chips are forced to the surface through the centre of the drill pipe and are collected, examined and assayed. |
run-of-mine (ROM) | Ore in its natural, unprocessed state; pertaining to ore just as it is mined. |
run rate | The total tonnes milled per mill availability divided by calendar days. |
sample | A small portion of rock, or a mineral deposit, taken so that the metal content can be determined by assaying. |
B-6 |
Term | Definition |
scoping study | A technical and economic study conducted to investigate the approximate economics and viability of various development options for the mining and treatment of a mineral deposit. |
sedimentary rocks | Secondary rocks formed from material derived from other rocks and laid down under water. Examples are limestone, shale and sandstone. |
semi-autogenous (SAG) mill | A steel cylinder with steel balls into which run-of-mine material is fed. The ore is ground with the action of large lumps of rock and steel balls. |
shear zone | A geological term used to describe a geological area in which shearing has occurred on a large scale. |
silica | The dioxide of silicon occurring in crystalline, amorphous, and impure forms (as in quartz, opal, and sand respectively). Used to manufacture a wide variety of materials, especially glass and concrete. |
sphalerite | A zinc mineral which is composed of zinc and sulphur. |
stock | A magma that has intruded into pre-existing rock in a columnar shape, typically a kilometre or more in diameter. |
stockpile | Broken ore heaped on the surface, pending treatment or shipment. |
tailings | The material that remains after all metals considered economic have been removed from ore during milling. |
tailings facility | A natural or man-made confined area suitable for depositing the material that remains after the treatment of ore. |
terrane | Area of land of a particular character, e.g., mountainous, swampy. |
tonne | Metric unit of mass equaling 1,000 kilograms or 2,240 pounds. Called a "long ton." |
ton | Unit of weight equaling 2,000 pounds. Called a "short ton." |
tuff | Rock composed of fine volcanic ash. |
vein | A fissure, fault or crack in a rock filled by minerals that have traveled upwards from some deep source. |
volcanics | A general collective term for extrusive igneous and pyroclastic material and rocks. |
B-7 |
SCHEDULE
C
ABBREVIATIONS AND MEASUREMENT CONVERSION
Unless otherwise defined, abbreviations used in this Annual Information Form have the following meanings:
m | micron |
AA | Atomic Absorption |
Ag | Silver |
Au | Gold |
°C | degree Celsius |
°F | degree Fahrenheit |
mg | microgram |
cm | centimetre |
cm2 | square centimetre |
Cu | Copper |
ft | foot |
g | gram |
G | giga (billion) |
HQ | diamond drill core measuring 2.5 inches in diameter (6.35 centimetres) |
ICP | Induction Coupled Plasmaspectrometry |
in | inch |
IRR | internal rate of return |
K | kilo (thousand) |
KWh | kilowatt-hour |
kg | kilogram |
km | kilometre |
km2 | kilometres squared |
L | litre |
lb | pound |
m | metre |
m2 | metres squared |
M | mega (million) |
mm | millimetre |
NPV | net present value. |
NQ | diamond drill core measuring 1.78 inches in diameter (4.5 centimetres) |
NSR | net smelter return |
oz/t | ounce per ton |
oz | Troy ounce/ounce (31.1035g) |
Pb | Lead |
PQ | diamond drill core measuring 3.35 inches in diameter (8.5 centimetres) |
RC | reverse circulation |
s | second |
st | short ton (one short ton equals 0.907 metric tonnes) |
t | metric tonne (one metric tonne equals 1.102 short tons) |
C-1 |
tpa | metric tonne per year |
tpd | metric tonne per day |
W | watt |
yd | yard |
Zn | Zinc |
The following table lists Imperial measurements and their equivalent value under the Metric system:
Imperial | Converts to | Metric |
1 in | = | 2.54 cm |
1 ft (12 in) | = | 0.3048 m |
1 yd (3ft) | = | 0.9144 m |
1 mile (1760 yd) | = | 1.6093 km |
1 square in (in2) | = | 6.4516 cm2 |
1 square ft (ft2) | = | 0.0929 m2 |
1 square yd (yd2) | = | 0.8361 m2 |
1 acre (4840 yd2) | = | 4046.9 m2 |
1 square mile (640 acres) | = | 2.59 km2 |
short ton | = | 0.907 metric tonnes |
C-2 |
SCHEDULE
D
EXCHANGE RATE AND METAL PRICE INFORMATION
Exchange Rate
The high, low, average and closing exchange rates for Canadian dollars in terms of the United States dollar for each of the three years ended December 31, 2018, 2017 and 2016, as quoted by the Bank of Canada, were as follows:
2018 | 2017 | 2016 | |
High | 1.3642 | 1.3743 | 1.4589 |
Low | 1.2288 | 1.2128 | 1.2544 |
Average | 1.2957 | 1.2986 | 1.3248 |
Closing | 1.3642 | 1.2545 | 1.3427 |
On March 25, 2019, the average exchange rate for Canadian dollars in terms of the United States dollar, as quoted by the Bank of Canada, was US$1 = C$1.3420 and C$1= US$0.7452.
Gold Prices
The high, low, average and closing afternoon fixing gold prices per troy ounce for each of the three years ended December 31, 2018, 2017 and 2016, as quoted by the London Bullion Market Association (“LBMA”), were as follows:
2018 ($) |
2017 ($) |
2016 ($) | |
High | 1,355 | 1,346 | 1,366 |
Low | 1,178 | 1,151 | 1,077 |
Average | 1,269 | 1,257 | 1,251 |
Closing | 1,279 | 1,291 | 1,146 |
On March 25, 2019, the closing afternoon LBMA gold price per troy ounce, as quoted by the London Bullion Market Association, was $1,320.
Silver Prices
The high, low, average and closing silver prices per troy ounce for each of the three years ended December 31, 2018, 2017 and 2016, as quoted by the London Bullion Market Association, were as follows:
2018 ($) |
2017 ($) |
2016 ($) | |
High | 17.52 | 18.56 | 20.71 |
Low | 13.97 | 15.22 | 13.58 |
Average | 15.71 | 17.05 | 17.14 |
Closing | 15.47 | 16.87 | 16.24 |
On March 25, 2019, the closing LBMA silver price per troy ounce, as quoted by the London Bullion Market Association, was $15.53.
D-1 |
Copper Prices
The high, low, average and closing official cash settlement copper prices per pound for each of the three years ended December 31, 2018, 2017 and 2016, as quoted by the London Metal Exchange, were as follows:
2018 ($) |
2017 ($) |
2016 ($) | |
High | 3.29 | 3.27 | 2.69 |
Low | 2.64 | 2.48 | 1.96 |
Average | 2.96 | 2.80 | 2.21 |
Closing | 2.71 | 3.25 | 2.50 |
On March 25, 2019, the closing official cash settlement copper price per pound, as quoted by the London Metal Exchange, was $2.87.
D-2 |
Exhibit 2
Contents | |
MANAGEMENT’S RESPONSIBILITY FOR FINANCIAL STATEMENTS | 3 |
MANAGEMENT’S REPORT ON INTERNAL CONTROL OVER FINANCIAL REPORTING | 4 |
REPORT OF INDEPENDENT REGISTERED PUBLIC ACCOUNTING FIRM | 5 |
REPORT OF INDEPENDENT REGISTERED PUBLIC ACCOUNTING FIRM | 6 |
CONSOLIDATED INCOME STATEMENTS | 8 |
CONSOLIDATED STATEMENTS OF COMPREHENSIVE INCOME | 9 |
CONSOLIDATED STATEMENTS OF FINANCIAL POSITION | 10 |
CONSOLIDATED STATEMENTS OF CHANGES IN EQUITY | 11 |
CONSOLIDATED STATEMENTS OF Cash Flow | 12 |
NOTES TO THE CONDENSED CONSOLIDATED FINANCIAL STATEMENTS | 13 |
1. Description of business and nature of operations | 13 |
2. Significant accounting policies | 13 |
3. Critical judgments and estimation uncertainties | 23 |
4. Future changes in accounting policies | 26 |
5. Expenses | 27 |
6. Trade and other receivables | 28 |
7. Trade and other payables | 28 |
8. Inventories | 29 |
9. Mining interests | 30 |
10. Impairment | 32 |
11. Long-term debt | 34 |
12. Gold stream obligation | 38 |
13. Derivative instruments | 39 |
14. Share capital | 42 |
15. Discontinued operations | 44 |
16. Income and mining taxes | 47 |
17. Reclamation and closure cost obligations | 51 |
18. Supplemental cash flow information | 52 |
19. Segmented information | 53 |
20. Capital risk management | 57 |
21. Financial risk management | 57 |
22. Fair value measurement | 63 |
1 |
23. Operating leases | 65 |
24. Compensation of key management personnel | 66 |
25. Commitments and contingencies | 66 |
2 |
MANAGEMENT’S RESPONSIBILITY FOR FINANCIAL STATEMENTS
The consolidated financial statements, the notes thereto and other financial information contained in the Management’s Discussion and Analysis have been prepared in accordance with International Financial Reporting Standards as issued by the International Accounting Standards Board and are the responsibility of the management of New Gold Inc. The financial information presented in the Management’s Discussion and Analysis is consistent with the data that is contained in the consolidated financial statements. The consolidated financial statements, where necessary, include amounts which are based on the best estimates and judgment of management.
In order to discharge management’s responsibility for the integrity of the financial statements, the Company maintains a system of internal accounting controls. These controls are designed to provide reasonable assurance that the Company’s assets are safeguarded, transactions are executed and recorded in accordance with management’s authorization, proper records are maintained and relevant and reliable financial information is produced. These controls include maintaining quality standards in hiring and training of employees, policies and procedures manuals, a corporate code of conduct and ensuring that there is proper accountability for performance within appropriate and well-defined areas of responsibility. The system of internal controls is further supported by a compliance function, which is designed to ensure that we and our employees comply with securities legislation and conflict of interest rules.
The Board of Directors is responsible for overseeing management’s performance of its responsibilities for financial reporting and internal control. The Audit Committee, which is composed of non-executive directors, meets with management as well as the external auditors to ensure that management is properly fulfilling its financial reporting responsibilities to the Directors who approve the consolidated financial statements. The external auditors have full and unrestricted access to the Audit Committee to discuss the scope of their audits, the adequacy of the system of internal controls and review financial reporting issues.
The consolidated financial statements have been audited by Deloitte LLP, the Company’s independent registered public accounting firm, in accordance with standards of the Public Company Accounting Oversight Board (United States).
(Signed) Renaud Adams | (Signed) Robert Chausse |
Renaud Adams | Robert Chausse |
President and | Executive Vice President and |
Chief Executive Officer | Chief Financial Officer |
Toronto, Canada
February 13, 2019
3 |
MANAGEMENT’S REPORT ON INTERNAL CONTROL OVER FINANCIAL REPORTING
The Company’s management, including the President and Chief Executive Officer and the Chief Financial Officer, is responsible for establishing and maintaining adequate internal control over financial reporting. Internal control over financial reporting is defined in Rule 13a-15(f) and Rule 15d-15(f) promulgated under the Securities Exchange Act of 1934, as amended (the “Exchange Act”) as a process designed by, or under the supervision of, the Company’s principal executive and principal financial officers and effected by the Company’s Board of Directors, management and other personnel, to provide reasonable assurance regarding the reliability of financial reporting and the preparation of financial statements for external purposes in accordance with International Financial Reporting Standards as issued by the International Accounting Standards Board. The Company’s internal control over financial reporting includes those policies and procedures that:
· | pertain to the maintenance of records that, in reasonable detail, accurately and fairly reflect the transactions and dispositions of the assets of the Company; | |
· | provide reasonable assurance that transactions are recorded as necessary to permit preparation of financial statements in accordance with generally accepted accounting principles, and that receipts and expenditures of the Company are being made only in accordance with authorizations of management and directors of the Company; and | |
· | provide reasonable assurance regarding prevention or timely detection of unauthorized acquisition, use or disposition of the Company’s assets that could have a material effect on the financial statements. |
The Company’s management, under the supervision of the President and Chief Executive Officer and the Chief Financial Officer, assessed the effectiveness of the Company’s internal control over financial reporting as defined in Rule 13a-15(f) and Rule 15d—15(f) under the Exchange Act as of December 31, 2018. In making this assessment, it used the criteria set forth in the Internal Control-Integrated Framework (2013) issued by the Committee of Sponsoring Organizations of the Treadway Commission (COSO). Based on this assessment, management has concluded that, as of December 31, 2018, the Company’s internal control over financial reporting is effective based on those criteria. There are no material weaknesses that have been identified by management.
The effectiveness of the Company’s internal control over financial reporting as of December 31, 2018 has been audited by Deloitte LLP, the Company’s independent registered public accounting firm, as stated in their report immediately preceding the Company’s audited consolidated financial statements for the year ended December 31, 2018.
(Signed) Renaud Adams | (Signed) Robert Chausse |
Renaud Adams | Robert Chausse |
President and | Executive Vice President and |
Chief Executive Officer | Chief Financial Officer |
Toronto, Canada
February 13, 2019
4 |
REPORT OF INDEPENDENT REGISTERED PUBLIC ACCOUNTING FIRM
To the shareholders and Board of Directors of New Gold Inc.
Opinion on the Financial Statements
We have audited the accompanying consolidated statements of financial position of New Gold Inc. and subsidiaries (the "Company") as of December 31, 2018 and 2017, the related consolidated income statements, statements of comprehensive income (loss), statements of changes in equity and statements of cash flow, for each of the two years in the period ended December 31, 2018, and the related notes (collectively referred to as the “financial statements”). In our opinion, the financial statements present fairly, in all material respects, the financial position of the Company as of December 31, 2018 and 2017, and its financial performance and its cash flows for each of the two years in the period ended December 31, 2018, in conformity with International Financial Reporting Standards as issued by the International Accounting Standards Board.
We have also audited, in accordance with the standards of the Public Company Accounting Oversight Board (United States) (PCAOB), the Company's internal control over financial reporting as of December 31, 2018, based on criteria established in Internal Control — Integrated Framework (2013) issued by the Committee of Sponsoring Organizations of the Treadway Commission and our report dated February 13, 2019, expressed an unqualified opinion on the Company's internal control over financial reporting.
Basis for Opinion
These financial statements are the responsibility of the Company's management. Our responsibility is to express an opinion on the Company's financial statements based on our audits. We are a public accounting firm registered with the PCAOB and are required to be independent with respect to the Company in accordance with the U.S. federal securities laws and the applicable rules and regulations of the Securities and Exchange Commission and the PCAOB.
We conducted our audits in accordance with the standards of the PCAOB. Those standards require that we plan and perform the audit to obtain reasonable assurance about whether the financial statements are free of material misstatement, whether due to error or fraud. Our audits included performing procedures to assess the risks of material misstatement of the financial statements, whether due to error or fraud, and performing procedures that respond to those risks. Such procedures included examining, on a test basis, evidence regarding the amounts and disclosures in the financial statements. Our audits also included evaluating the accounting principles used and significant estimates made by management, as well as evaluating the overall presentation of the financial statements. We believe that our audits provide a reasonable basis for our opinion.
“/s/ Deloitte LLP”
Chartered Professional Accountants
Licensed Public Accountants
Toronto, Canada
February 13, 2019
We have served as the Company's auditor since 2007.
5 |
REPORT OF INDEPENDENT REGISTERED PUBLIC ACCOUNTING FIRM
To the shareholders and Board of Directors of New Gold Inc.
Opinion on Internal Control over Financial Reporting
We have audited the internal control over financial reporting of New Gold Inc. and subsidiaries (the “Company”) as of December 31, 2018, based on criteria established in Internal Control — Integrated Framework (2013) issued by the Committee of Sponsoring Organizations of the Treadway Commission (COSO). In our opinion, the Company maintained, in all material respects, effective internal control over financial reporting as of December 31, 2018, based on criteria established in Internal Control — Integrated Framework (2013) issued by COSO.
We have also audited, in accordance with the standards of the Public Company Accounting Oversight Board (United States) (PCAOB), the consolidated financial statements as of and for the year ended December 31, 2018, of the Company and our report dated February 13, 2019 expressed an unqualified opinion on those financial statements.
Basis for Opinion
The Company’s management is responsible for maintaining effective internal control over financial reporting and for its assessment of the effectiveness of internal control over financial reporting, included in the accompanying Management’s Report on Internal Control over Financial Reporting. Our responsibility is to express an opinion on the Company’s internal control over financial reporting based on our audit. We are a public accounting firm registered with the PCAOB and are required to be independent with respect to the Company in accordance with the U.S. federal securities laws and the applicable rules and regulations of the Securities and Exchange Commission and the PCAOB.
We conducted our audit in accordance with the standards of the PCAOB. Those standards require that we plan and perform the audit to obtain reasonable assurance about whether effective internal control over financial reporting was maintained in all material respects. Our audit included obtaining an understanding of internal control over financial reporting, assessing the risk that a material weakness exists, testing and evaluating the design and operating effectiveness of internal control based on the assessed risk, and performing such other procedures as we considered necessary in the circumstances. We believe that our audit provides a reasonable basis for our opinion.
Definition and Limitations of Internal Control over Financial Reporting
A company’s internal control over financial reporting is a process designed to provide reasonable assurance regarding the reliability of financial reporting and the preparation of financial statements for external purposes in accordance with generally accepted accounting principles. A company’s internal control over financial reporting includes those policies and procedures that (1) pertain to the maintenance of records that, in reasonable detail, accurately and fairly reflect the transactions and dispositions of the assets of the company; (2) provide reasonable assurance that transactions are recorded as necessary to permit preparation of financial statements in accordance with generally accepted accounting principles, and that receipts and expenditures of the company are being made only in accordance with authorizations of management and directors of the company; and (3) provide reasonable assurance regarding prevention or timely detection of unauthorized acquisition, use, or disposition of the company’s assets that could have a material effect on the financial statements.
6 |
Because of its inherent limitations, internal control over financial reporting may not prevent or detect misstatements. Also, projections of any evaluation of effectiveness to future periods are subject to the risk that controls may become inadequate because of changes in conditions, or that the degree of compliance with the policies or procedures may deteriorate.
“/s/ Deloitte LLP”
Chartered Professional Accountants
Licensed Public Accountants
Toronto, Canada
February 13, 2019
7 |
CONSOLIDATED INCOME STATEMENTS
Year ended ended December 31 | |||
(in millions of U.S. dollars, except per share amounts) | Note | 2018 | 2017 |
Revenues | 604.5 | 388.7 | |
Operating expenses | 5 | 325.4 | 198.3 |
Depreciation and depletion | 239.9 | 160.1 | |
Revenue less cost of goods sold | 39.2 | 30.3 | |
Corporate administration | 23.2 | 23.7 | |
Corporate restructuring(1) | 4.1 | 4.2 | |
Share-based payment expenses | 14 | 0.7 | 5.1 |
Asset impairment | 10 | 1,054.8 | 268.4 |
Exploration and business development | 3.0 | 6.4 | |
Loss from operations | (1,046.6) | (277.5) | |
Finance income | 5 | 1.5 | 1.1 |
Finance costs | 5 | (69.0) | (12.8) |
Other gains |
5 | 18.1 | 46.6 |
Loss before taxes | (1,096.0) | (242.6) | |
Income tax recovery | 16 | 25.2 | 84.6 |
Loss from continuing operations(2) |
(1,070.8) | (158.0) | |
(Loss) earnings from discontinued operations, net of tax(2) | 15 | (154.9) | 50.0 |
Net loss | (1,225.7) | (108.0) | |
Loss from continuing operations per share | |||
Basic | 14 | (1.85) | (0.28) |
Diluted | 14 | (1.85) | (0.28) |
Net loss per share | |||
Basic | 14 | (2.12) | (0.19) |
Diluted | 14 | (2.12) | (0.19) |
Weighted average number of shares outstanding (in millions) | |||
Basic | 14 | 578.7 | 564.7 |
Diluted | 14 | 578.7 | 564.7 |
1. | In 2018, the Company recognized a restructuring charge of $4.1 million in severance and other termination benefits related to changes at the executive leadership level of the organization. In 2017, the Company recognized a restructuring charge of $4.2 million in severance and other termination benefits related to restructuring its corporate office workforce. |
2. | For the year ended December 31, 2018 and comparative periods, both Peak Mines and Mesquite have been classified as discontinued operations and accordingly earnings and cash flows from continuing operations are presented exclusive of Peak Mines and Mesquite. Peak Mines was sold in April 2018 and Mesquite was sold in October 2018. Refer to Note 15 for further details. |
See accompanying notes to the consolidated financial statements.
8 |
CONSOLIDATED STATEMENTS OF COMPREHENSIVE INCOME
Year ended December 31 | |||
(in millions of U.S. dollars) | Note | 2018 | 2017 |
Net loss | (1,225.7) | (108.0) | |
Other comprehensive income | |||
Unrealized loss on mark-to-market of diesel swap contracts | - | (0.4) | |
Reclassification of realized loss on settlement of diesel swap contracts | - | 0.3 | |
Gain (loss) on revaluation of gold stream obligation | 12 | 66.6 | (7.6) |
Deferred income tax related to derivative contracts and gold stream obligation | 12 | (21.6) | 1.8 |
Total other comprehensive income (loss) | 45.0 | (5.9) | |
Total comprehensive loss | (1,180.7) | (113.9) |
See accompanying notes to the consolidated financial statements.
9 |
CONSOLIDATED STATEMENTS OF FINANCIAL POSITION
As at December 31 |
As at December 31 | ||
(in millions of U.S. dollars) | Note | 2018 | 2017 |
Assets | |||
Current assets | |||
Cash and cash equivalents | 103.7 | 216.2 | |
Trade and other receivables | 6 | 35.9 | 27.1 |
Inventories | 8 | 141.8 | 193.2 |
Current income tax receivable | 4.3 | 12.9 | |
Prepaid expenses and other | 4.7 | 5.6 | |
Total current assets | 290.4 | 455.0 | |
Non-current inventories | 8 | 14.9 | 78.7 |
Mining interests | 9 | 1,853.4 | 3,200.4 |
Deferred tax assets | 16 | - | 171.6 |
Other | 15 | 10.9 | 2.6 |
2,169.6 | 3,908.3 | ||
Assets held for sale | 15 | - | 109.0 |
Total assets | 2,169.6 | 4,017.3 | |
Liabilities and equity | |||
Current liabilities | |||
Trade and other payables | 7 | 130.9 | 178.2 |
Deferred benefit – Peak sale prepayment | 15 | - | 3.0 |
Total current liabilities | 130.9 | 181.2 | |
Reclamation and closure cost obligations | 17 | 86.1 | 121.5 |
Gold stream obligation | 12 | 161.9 | 249.0 |
Long-term debt | 11 | 780.5 | 1,007.7 |
Deferred tax liabilities | 16 | 41.5 | 250.3 |
Other | 9.4 | 5.3 | |
1,210.3 | 1,815.0 | ||
Liabilities held for sale | 15 | - | 62.8 |
Total liabilities | 1,210.3 | 1,877.8 | |
Equity | |||
Common shares | 14 | 3,035.2 | 3,036.5 |
Contributed surplus | 105.0 | 103.2 | |
Other reserves | 6.1 | (38.9) | |
Deficit | (2,187.0) | (961.3) | |
Total equity | 959.3 | 2,139.5 | |
Total liabilities and equity | 2,169.6 | 4,017.3 |
See accompanying notes to the consolidated financial statements.
Approved and authorized by the Board of Directors on February 13, 2019
“Ian Pearce” | “Marilyn Schonberner” |
Ian Pearce, Director | Marilyn Schonberner, Director |
10 |
CONSOLIDATED STATEMENTS OF CHANGES IN EQUITY
Year ended Decemebr 31 | |||
(in millions of U.S. dollars) | Note | 2018 | 2017 |
Common shares | |||
Balance, beginning of period | 3,036.5 | 2,859.0 | |
Common share issuance | 14 | 0.3 | 176.1 |
Shares issued for exercise of options and vested PSUs | 0.3 | 1.4 | |
Reversal of deferred tax recovery | 14 | (1.9) | - |
Balance, end of period | 3,035.2 | 3,036.5 | |
Contributed surplus | |||
Balance, beginning of period | 103.2 | 100.5 | |
Exercise of options and vested PSUs | 14 | (0.3) | (0.8) |
Equity settled share-based payments | 2.1 | 3.5 | |
Balance, end of period | 105.0 | 103.2 | |
Other reserves | |||
Balance, beginning of period | (38.9) | (33.0) | |
Change in fair value of hedging instruments (net of tax) | - | (0.1) | |
Gain on revaluation of gold stream obligation (net of tax) | 12 | 45.0 | (5.8) |
Balance, end of period | 6.1 | (38.9) | |
deficit | |||
Balance, beginning of period | (961.3) | (853.3) | |
Net loss | (1,225.7) | (108.0) | |
Balance, end of period | (2,187.0) | (961.3) | |
Total equity | 959.3 | 2,139.5 |
See accompanying notes to the condensed consolidated financial statements.
11 |
CONSOLIDATED STATEMENTS OF Cash Flow
Year ended December 31 | |||
(in millions of U.S. dollars) | Note | 2018 | 2017 |
Operating activities | |||
Loss from continuing operations | (1,070.8) | (158.0) | |
Adjustments for: | |||
Foreign exchange (gains) loss | 5 | (6.6) | (43.8) |
Asset impairment | 10 | 1,054.8 | 268.4 |
Reclamation and closure costs paid | 17 | (1.2) | (1.4) |
Gain on disposal of El Morro stream | - | (33.0) | |
Depreciation and depletion | 241.2 | 160.4 | |
Other non-cash adjustments | 18 | 9.0 | 39.0 |
Income tax expense (recovery) | 16 | (25.2) | (84.6) |
Finance income | 5 | (1.5) | (1.1) |
Finance costs | 5 | 69.0 | 12.8 |
268.7 | 158.7 | ||
Change in non-cash operating working capital | 18 | (71.6) | 43.8 |
Income taxes paid | (4.1) | (5.4) | |
Operating cash flows generated from continuing operations(1) | 193.0 | 197.1 | |
Operating cash flows generated from discontinued operations | 15 | 52.1 | 145.1 |
Cash generated from operations | 245.1 | 342.2 | |
Investing activities | |||
Mining interests | (213.9) | (554.2) | |
Proceeds from the sale of Peak Mines, net of transaction costs | 15 | 42.4 | 2.6 |
Proceeds from sale of Mesquite, net of transaction costs and other adjustments | 15 | 149.8 | - |
Proceeds from the sale of the El Morro stream and other assets | 1.1 | 65.3 | |
Interest received | 1.2 | 1.0 | |
Gold price option contract investment costs | - | (0.9) | |
Investing cash flows used by continuing operations(1) | (19.4) | (486.2) | |
Investing cash flows used by discontinued operations | 15 | (12.8) | (47.4) |
Cash used by investing activities | (32.2) | (533.6) | |
Financing activities | |||
Proceeds received from exercise of options | 14 | - | 0.6 |
Net proceeds received from issuance of common shares | 14 | - | 164.7 |
(Repayment) drawdown of Credit Facility | 11 | (230.0) | 130.0 |
Finance lease payments | (4.0) | - | |
Cash settlement of gold stream obligation | 12 | (14.9) | (1.1) |
Issuance of senior unsecured notes, net of transaction costs | 11 | - | 294.6 |
Repayment of senior unsecured notes | 11 | - | (305.3) |
Financing initiation costs | (0.6) | - | |
Interest paid | (63.2) | (63.7) | |
Cash (used by) generated by financing activities | (312.7) | 219.8 | |
Effect of exchange rate changes on cash and cash equivalents | (0.5) | 1.9 | |
Cash and cash equivalents sold with the sale of Mesquite | (6.5) | - | |
Cash and cash equivalents sold with the sale of Peak Mines | (5.7) | - | |
Change in cash and cash equivalents | (112.5) | 30.3 | |
Cash and cash equivalents, beginning of period | 216.2 | 185.9 | |
Cash and cash equivalents, end of period | 103.7 | 216.2 | |
Cash and cash equivalents are comprised of: | |||
Cash | 64.3 | 161.3 | |
Short-term money market instruments | 39.4 | 54.9 | |
103.7 | 216.2 |
1. | For the year ended December 31, 2018 and comparative periods, both Peak Mines and Mesquite have been classified as discontinued operations and accordingly earnings and cash flows from continuing operations are presented exclusive of Peak Mines and Mesquite. Peak Mines was sold in April 2018 and Mesquite was sold in October 2018. Refer to Note 15 for further details. |
See accompanying notes to the condensed consolidated financial statements.
12 |
NOTES TO THE CONDENSED CONSOLIDATED FINANCIAL STATEMENTS
For the year ended December 31, 2018
(Amounts expressed in millions of U.S. dollars, except per share amounts and unless otherwise noted)
1. Description of business and nature of operations
New Gold Inc. (“New Gold” or the “Company”) is an intermediate gold mining company engaged in the development and operation of mineral properties. The assets of the Company, directly or through its subsidiaries, are comprised of the Rainy River Mine in Canada (“Rainy River”), the New Afton Mine in Canada (“New Afton”), the Cerro San Pedro Mine in Mexico (“Cerro San Pedro”). The Company also owns the Blackwater project in Canada (“Blackwater”). The Company completed the sale of the Peak Mines in Australia (“Peak Mines”) in early April 2018 and completed the sale of the Mesquite Mine in the United States (“Mesquite”) in October 2018.
The Company is a corporation governed by the Business Corporations Act (British Columbia). The Company’s shares are listed on the Toronto Stock Exchange and the NYSE American under the symbol NGD.
The Company’s registered office is located at 1100 Melville Street, Suite 610, Vancouver, British Columbia, V6E 4A6, Canada.
2. Significant accounting policies
(a) Statement of compliance
The consolidated financial statements have been prepared in accordance with International Financial Reporting Standards, as issued by the International Accounting Standards Board (“IASB”), referred to as “IFRS”.
These consolidated financial statements were approved by the Board of Directors of the Company on February 13, 2019.
(b) Basis of preparation
The consolidated financial statements have been prepared on the historical cost basis except for those assets and liabilities that are measured at fair values at the end of each reporting period. Additionally, these consolidated financial statements have been prepared using the accrual basis of accounting, except for cash flow information.
(c) Basis of consolidation
Subsidiaries
These consolidated financial statements include the financial statements of the Company and entities controlled by the Company (“Subsidiaries”). Control exists when the Company is exposed, or has rights to variable returns from its involvement with the Subsidiary and has the ability to affect those returns through its power over the Subsidiary.
13 |
The principal Subsidiaries of the Company are as follows:
Name of subsidiary/associate(2) | Principal activity | Method of accounting |
Country of incorporation and operation |
Interest as at December 31, 2018 |
Interest as at December 31, 2017 |
Minera San Xavier S.A. de C.V. | Mining | Consolidated | Mexico | 100% | 100% |
Peak Gold Mines Pty Ltd.(1) | Mining | Consolidated | Australia | 0% | 100% |
Western Mesquite Mines Inc. (1) | Mining | Consolidated | USA | 0% | 100% |
1. | The Company sold Peak Gold Mines Pty Ltd in April 2018 and sold Western Mesquite Mines Inc. in October 2018. |
2. | New Gold Inc. directly owns the assets of Rainy River, New Afton and Blackwater. |
(d) Business combinations and asset acquisitions
A business combination is an acquisition of assets and liabilities that constitute a business. A business is an integrated set of activities and assets that is capable of being conducted and managed for the purpose of providing a return to the company and its shareholders in the form of improved earnings, lower costs or other economic benefits.
Business combinations are accounted for using the acquisition method whereby identifiable assets acquired and liabilities assumed, including contingent liabilities, are recorded at 100% of their acquisition-date fair values. The acquisition date is the date the Company obtains control over the acquiree, which is generally the date that consideration is transferred and the Company acquires the assets and assumes the liabilities of the acquiree. The Company considers all relevant facts and circumstances in determining the acquisition date.
The consideration transferred in a business combination is measured at fair value, which is calculated as the sum of the acquisition-date fair values of the assets transferred by the Company, the liabilities, including contingent consideration, incurred and payable by the Company to former owners of the acquiree and the equity interests issued by the Company. The measurement date for equity interests issued by the Company is the acquisition date.
Acquisition-related costs, other than costs to issue debt or equity securities, of the Company, including investment banking fees, legal fees, accounting fees, valuation fees, and other professional or consulting fees are expensed as incurred. The costs to issue equity securities of the Company as consideration for the acquisition are reduced from share capital as share issue costs.
The Company accounts for the purchase of assets and assumption of liabilities as an acquisition of net assets when the transactions do not qualify as a business combination under IFRS 3, Business Combinations, as the significant inputs and processes that constitute a business are not identified. The purchase consideration is allocated to the fair value of the assets acquired and liabilities assumed based on management’s best estimates and available information at the time of the acquisition. Acquisition-related costs, other than costs to issue debt or equity securities, of the Company, including investment banking fees, legal fees, accounting fees, valuation fees, and other professional or consulting fees are capitalized as part of the asset acquisition.
(e) Cash and cash equivalents
The Company considers all highly liquid investments with original maturities of three months or less at the date of acquisition to be cash equivalents. These highly liquid investments only comprise short-term Canadian and United States government treasury bills and other evidences of indebtedness and treasury bills of the Canadian provinces with a minimum credit rating of R-1 mid from the Dominion Bond Rating Service or an equivalent rating from Standard & Poor’s and Moody’s. In addition, the Company invests in bankers’ acceptances and other evidences of indebtedness of certain financial institutions, including Canadian banks.
14 |
(f) Inventories
Finished goods, work-in-process, heap leach ore and stockpiled ore are valued at the lower of weighted average production cost or net realizable value. Production costs include the cost of raw materials, direct labour, mine-site overhead expenses and depreciation and depletion of mining interests. Net realizable value is calculated as the estimated price at the time of sale based on prevailing and long-term metal prices less estimated future production costs to convert the inventories into saleable form. At operations where ore extracted contains significant amount of metals other than gold, primarily copper or silver, cost is allocated between the joint products on a pro rata basis.
The recovery of gold and silver from certain ores is achieved through the heap leaching process. Under this method, ore is placed on leach pads where it is treated with a chemical solution which dissolves the gold contained in ore. The resulting “pregnant” solution is further processed in a plant where the gold is recovered. For accounting purposes, costs are added to ore on leach pads for current mining and leaching costs, including applicable depreciation, depletion and amortization relating to mining interests. Costs are removed from ore on leach pads as ounces of gold and silver are recovered based on the average cost per recoverable ounce on the leach pad.
Estimates of recoverable gold and silver on the leach pads are calculated from the quantities of ore placed on the leach pads (measured tonnes added to the leach pads), the grade of ore placed on the leach pads (based on assay data), and a recovery percentage (based on ore type). Although the quantities of recoverable gold and silver placed on each leach pad are reconciled by comparing the grades of ore placed on the leach pad to the quantities actually recovered, the nature of the leaching process inherently limits the ability to precisely monitor inventory levels. The recovery of gold and silver from the leach pad is not known until the leaching process has concluded. In the event that the Company determines, based on engineering estimates, that a quantity of gold or other metal (silver) contained in ore on leach pads is to be recovered over a period exceeding 12 months, that portion is classified as long-term.
Work-in-process inventory represents materials that are currently in the process of being converted into finished goods. The average production cost of finished goods represents the average cost of work-in-process inventories incurred prior to the refining process, plus applicable refining, selling, shipping costs and associated royalties.
Supplies are measured at weighted average cost. In the event that the net realizable value of the finished product, the production of which the supplies are held for use in, is lower than the expected cost of the finished product, the supplies are written down to net realizable value.
(g) Mining interests
Mining interests include mining properties and related plant and equipment. Capitalized costs are depreciated and depleted using either a unit-of-production method over the estimated economic life of the mine to which they relate, or for plant and equipment, using the straight-line method over their estimated useful lives, if shorter than the mine life.
Mining properties
The costs associated with mining properties include acquired interests in production, development and exploration stage properties representing the fair value at the time they were acquired.
Mining properties include costs directly attributable to bringing a mineral asset into the state where it is capable of operating in the manner intended by management. The determination of development costs to be capitalized during the production stage of a mine operation requires the use of judgments and estimates.
The Company estimates its mineral reserves and mineral resources based on information compiled by appropriately qualified persons. The estimation of recoverable reserves will be impacted by forecasted commodity prices, exchange rates, production costs and recoveries amongst other factors. Changes in the reserve or resource estimates may impact the carrying value of assets and depreciation and impairment charges recorded in the consolidated income statement.
15 |
A mining property is considered to be capable of operating in a manner intended by management when it commences commercial production. The critical judgments included in the determination of the commencement of commercial production are described in Note 3(a)(i). Upon commencement of commercial production, a mining property is depleted on a unit-of-production method. Unit-of-production depletion rates are determined based on the estimated recoverable proven and probable mineral reserves at the mine.
Costs related to property acquisitions are capitalized until the viability of the mineral property is determined. When either external or internal triggering events determine that a property is not economically recoverable, the capitalized costs are written off.
The costs associated with the acquisition of land holdings are included within mining interest and are not depleted.
Exploration and evaluation
Exploration and evaluation costs are expensed until the probability that future economic benefits will flow to the entity and the asset cost or value can be measured reliably. Management uses the following criteria to determine the economic recoverability and probability of future economic benefits:
· | The Company controls access to the benefit; |
· | Internal project economics are beneficial to the Company; |
· | The project is technically feasible; and |
· | Costs can be reliably measured. |
Further development expenditures are capitalized to the property.
Drilling and related costs incurred on sites without an existing mine and on areas outside the boundary of a known mineral deposit which contains proven and probable reserves are exploration expenditures and are expensed as incurred to the date of establishing that property costs are economically recoverable. Further development expenditures, subsequent to the establishment of economic recoverability, are capitalized to the property.
Property, plant and equipment
Property, plant and equipment consists of buildings and fixtures, processing equipment and surface and underground fixed and mobile equipment.
Depreciation and depletion rates of major categories of asset costs
Mining properties are depleted using a unit-of-production method over the estimated economic life of the mine to which they relate. Management reviews the estimated total recoverable ounces contained in depletable reserves at each financial year end, and when events and circumstances indicate that such a review should be made. Plant and equipment is depreciated using the straight-line method over their estimated useful lives, or the remaining life of the mine, if shorter.
Asset class | Estimated useful life (years) |
Plant and machinery | 3 – 17 |
Mobile equipment | 5 – 7 |
16 |
Capitalized borrowing costs
Borrowing costs directly attributable to the acquisition, construction or production of a qualifying asset that necessarily takes a substantial period of time to get ready for its intended use are capitalized until such time as the assets are substantially ready for their intended use. Other borrowing costs are recognized as an expense in the period in which they are incurred.
Where funds are borrowed specifically to finance a project, the amount capitalized represents the actual borrowing costs incurred. Where the funds used to finance a project form part of general borrowings, the amount capitalized is calculated using a weighted average of interest rates applicable to relevant general borrowings of the Company during the period, to a maximum of actual borrowing costs incurred. Capitalization of interest is suspended during extended periods in which active development is interrupted.
Stripping costs in surface mining
As part of its operations, the Company incurs stripping costs both during the development phase and production phase of its operations. Stripping costs incurred as part of development stage mining activities incurred by the Company are deferred and capitalized as part of mining properties.
Stripping costs incurred during the production stage are incurred in order to produce inventory or to improve access to ore which will be mined in the future. Where the costs are incurred to produce inventory, the production stripping costs are accounted for as a cost of producing those inventories. Where the costs are incurred to improve access to ore which will be mined in the future, the costs are deferred and capitalized to the statement of financial position as a stripping activity asset (included in mining interest) if the following criteria are met: improved access to the ore body is probable; the component of the ore body can be accurately identified; and the costs relating to the stripping activity associated with the component can be reliably measured. If these criteria are not met, the costs are expensed in the period in which they are incurred.
The stripping activity asset is subsequently depleted using the units-of-production depletion method over the life of the identified component of the ore body to which access has been improved as a result of the stripping activity.
Derecognition
Upon sale or abandonment, the cost of the asset and related accumulated depreciation or depletion are removed from the accounts and any gains or losses thereon are recognized in net earnings.
(h) Impairment of long-lived assets
The Company reviews and evaluates its mining interests for indicators of impairment at the end of each reporting period. Impairment assessments are conducted at the level of cash-generating units (“CGU”). A CGU is the smallest identifiable group of assets that generates cash inflows that are largely independent of the cash inflows from other assets or groups of assets. Each operating mine and development project represents a separate CGU as each mine site or development project has the ability or the potential to generate cash inflows that are separately identifiable and independent of each other. If an indication of impairment exists, the recoverable amount of the CGU is estimated. An impairment loss is recognized when the carrying amount of the CGU is in excess of its recoverable amount.
17 |
The recoverable amount of a mine site is the greater of its fair value less costs to dispose and value in use. In determining the recoverable amounts of the Company’s mine sites, the Company uses the fair value less costs to dispose as this will generally be greater than or equal to the value in use. When there is no binding sales agreement, fair value less costs to dispose is estimated as the discounted future after-tax cash flows expected to be derived from a mine site, less an amount for costs to dispose estimated based on similar past transactions. The inputs used in the fair value measurement constitute Level 3 inputs under the fair value hierarchy. When discounting estimated future cash flows, the Company uses an after-tax discount rate that would approximate what market participants would assign. Estimated cash flows are based on expected future production, metal selling prices, operating costs and capital costs. If the recoverable amount of a mine site is estimated to be less than its carrying amount, the carrying amount is reduced to its recoverable amount. The carrying amount of each mine site includes the carrying amounts of mining properties, plant and equipment, and certain deferred tax balances. Impairment losses are recognized as expenses in the period they are incurred. The allocation of an impairment loss, if any, for a particular mine site to its assets is based on the relative book values of these assets at the date of impairment, to the extent that the impairment allocation does not reduce the carrying values of these asset classes below their recoverable amounts.
The Company assesses at the end of each reporting period whether there is any indication that an impairment loss recognized in prior periods for a long-lived asset may no longer exist or may have decreased. If any such indication exists, the Company estimates the recoverable amount of that CGU. A reversal of an impairment loss is recognized up to the lesser of the recoverable amount or the carrying amount that would have been determined (net of amortization or depreciation) had no impairment loss been recognized for the CGU in prior years. Reversals of impairment losses are recognized in net earnings in the period the reversals occur.
(i) Reclamation and closure cost obligations
The Company’s mining and exploration activities are subject to various governmental laws and regulations relating to the protection of the environment. The Company has made, and intends to make in the future, expenditures to comply with such laws and regulations. The Company has recorded a liability and corresponding asset for the estimated future cost of reclamation and closure, including site rehabilitation and long-term treatment and monitoring costs These costs represent management’s best estimates which incorporate assumptions on the effects of inflation, movements in foreign exchange rates and the effects of country and other specific risks associated with the related liabilities. The costs are discounted to net present value using the risk free rate applicable to the future cash outflows. Such estimates are, however, subject to changes in laws and regulations or changes to market inputs to the decommissioning model.
The present value of estimated costs is recorded in the period in which the asset is installed or the environment is disturbed and a reasonable estimate of future costs and discount rates can be made. The provision is discounted using a risk-free rate and estimates of future cash flows are adjusted to reflect risk.
After the initial measurement, the obligation is adjusted to reflect the passage of time and changes in the estimated future cash flows underlying the obligation. The increase in the provision due to the passage of time is recognized in finance costs, whereas increases and decreases due to changes in the estimated future cash flows are included in inventory or capitalized and depreciated over the life of the related asset unless the amount deducted from the cost exceeds the carrying value of the asset, in which case the excess is recorded in net earnings. Actual costs incurred upon settlement of the site restoration obligation are charged against the provision to the extent the provision was established for those costs. Upon settlement of the liability, a gain or loss may be recorded in net earnings.
(j) Income taxes
The income tax expense or benefit for the period consists of two components: current and deferred.
Current Tax
The tax currently payable is based on taxable earnings for the year. Taxable earnings differ from earnings before taxes due to items of income or expense that are taxable or deductible in other years and items that are never taxable or deductible. Current tax is calculated using tax rates and laws that were enacted or substantively enacted at the statement of financial position date in each of the jurisdictions and includes any adjustments for taxes payable or recovery in respect of prior periods.
18 |
Deferred Tax
Deferred tax is recognized on temporary differences between the carrying amounts of assets and liabilities in the consolidated statement of financial position and the corresponding tax base used in the computation of taxable net earnings. Deferred tax is calculated based on the expected manner of realization or settlement of the carrying amount of assets and liabilities, using tax rates that are expected to apply in the year of realization or settlement based on tax rates and laws enacted or substantively enacted at the statement of financial position date.
Deferred tax liabilities are generally recorded for all taxable temporary differences. Deferred tax liabilities are recognized for taxable temporary differences arising on investments in Subsidiaries except where the reversal of the temporary difference can be controlled and it is probable that the difference will not reverse in the foreseeable future.
Deferred tax assets are generally recognized for all deductible temporary differences to the extent that it is probable that taxable earnings will be available against which those deductible temporary differences can be utilized. The carrying amount of the deferred tax assets are reviewed at each statement of financial position date and are reduced to the extent that it is no longer probable that sufficient taxable profit will be available to allow all or part of the asset to be recovered.
Deferred tax assets and liabilities are not recognized if the temporary difference arises from goodwill or from the initial recognition (other than in a business combination) of other assets and liabilities in a transaction that affects neither the taxable profit nor the accounting profit.
The Company records foreign exchange gains and losses representing the impacts of movements in foreign exchange rates on the tax base of non-monetary assets and liabilities which are denominated in foreign currencies. Foreign exchange gains and losses relating to deferred income taxes are included within foreign exchange gains in the consolidated income statement.
Current and deferred tax for the year
Current and deferred tax are recognized in net earnings except when they arise as a result of items recognized in other comprehensive income or directly in equity in the current or prior periods, in which case the related current and deferred income taxes are also recognized in other comprehensive income or directly in equity, respectively.
Government assistance and tax credits
Any federal or provincial tax credits received by the Company, with respect to exploration or development work conducted on any of its properties, are credited as a reduction to the carrying costs of the property to which the credits relate. The Company records these tax credits when there is reasonable assurance with regard to collections and assessments as well as reasonable assurance that the Company will comply with the conditions associated to them.
(k) Foreign currency translation
The individual financial statements of each Subsidiary are presented in the currency of the primary economic environment in which that entity operates (its functional currency). The functional currency of the Company and the presentation currency of the consolidated financial statements is the United States dollar (“U.S. dollar”).
19 |
Management determines the functional currency by examining the primary economic environment of each operating mine, development and exploration project. The Company considers the following factors in determining its functional currency:
· | The main influences of sales prices for goods and the country whose competitive forces and regulations mainly determine the sales price; |
· | The currency that mainly influences labour, material and other costs of providing goods; |
· | The currency in which funds from financing activities are generated; and |
· | The currency in which receipts from operating activities are usually retained. |
When preparing the consolidated financial statements of the Company, the Company translates non-U.S. dollar balances into U.S. dollars as follows:
· | Mining interest and equity method investments using historical exchange rates; |
· | Financial instruments measured at fair value through profit or loss using the closing exchange rate as at the statement of financial position date with translation gains and losses recorded in net earnings; |
· | Deferred tax assets and liabilities using the closing exchange rate as at the statement of financial position date with translation gains and losses recorded in net earnings; |
· | Other assets and liabilities using the closing exchange rate as at the statement of financial position date with translation gains and losses recorded in net earnings; and |
· | Income and expenses using the average exchange rate for the period, except for expenses that relate to non-monetary assets and liabilities measured at historical rates, which are translated using the same historical rate as the associated non-monetary assets and liabilities. |
(l) Earnings (loss) per share
Earnings (loss) per share calculations are based on the weighted average number of common shares and common share equivalents issued and outstanding during the year. Diluted earnings per share are calculated using the treasury stock method. This requires the calculation of diluted earnings per share by assuming that outstanding stock options with an average market price that exceeds the average exercise price of the options and warrants for the year, are exercised and the assumed proceeds are used to repurchase shares of the Company at the average market price of the common share for the year.
(m) Revenue recognition
Revenue from the sale of metals and metals in concentrate is recognized when the Company satisfies the performance obligations associated with the sale. Typically, this is accomplished when control over the metals and metals in concentrate are passed from the Company to the buyer. Factors that may indicate the point in time at which control passes include:
· | The Company has transferred to the buyer the significant risks and rewards of ownership to the purchaser; |
· | The Company has transferred legal title to the asset sold to the purchaser; |
· | The Company retains neither continuing managerial involvement to the degree usually associated with ownership nor effective control over the goods sold; |
· | The Company has transferred physical possession of the asset to the purchaser; |
· | The Company has present right to payment; and |
· | The purchaser has accepted the asset. |
20 |
Revenue from the sale of metals in concentrate may be subject to adjustment upon final settlement of estimated metal prices, weights and assays. Revenue is recognized based on the estimated fair value of the total consideration receivable. Adjustments to revenue for metal prices and other adjustments are recorded at each period end and on final settlement. Refining and treatment charges are netted against revenue for sales of metal concentrate.
(n) Financial assets
Financial assets are initially measured at fair value and are subsequently measured at either amortized cost or fair value through profit or loss, depending on the classification of the financial assets. The classification of assets is driven by the Company’s business model for managing financial assets and their contractual cash flow characteristics.
The fair value of financial instruments traded in active markets is based on quoted market prices at the date of the statement of financial position. The quoted market price used for financial assets held by the Company is the last bid price of the day.
The Company has categorized its financial assets in accordance with International Financial Reporting Standard 9, Financial Instruments (“IFRS 9”) into one of the following two categories:
Category under IFRS 9 | Description |
Fair value through profit or loss |
Includes equity investments, gold and copper price option contract assets, gold and copper swap contracts, copper forward contracts, and other financial assets designated to this category under the fair value option. The Company has assessed the contractual cash flows of its provisionally priced contracts in accordance with IFRS 9 and has classified these contracts as fair value through profit or loss (“FVTPL”).
|
Financial assets at amortized cost | Includes cash and cash equivalents, and trade receivables at amortized cost. |
(o) Financial liabilities
Financial liabilities are accounted for at amortized cost except for those at FVTPL which includes liabilities designated as FVTPL and derivatives. Financial liabilities classified as FVTPL or those which are designated as FVTPL under the fair value option are measured at fair value with unrealized gains and losses recognized in net earnings. In cases where financial liabilities are designated as FVTPL, the part of a fair value change due to an entity's own credit risk is recorded in other comprehensive income rather than the statements of operations. Financial liabilities at amortized cost are initially measured at fair value net of transaction costs, and subsequently measured at amortized cost.
The Company has classified its financial liabilities in accordance with IFRS 9 into one of the following two categories:
Category under IFRS 9 | Description |
Fair value through profit or loss | Includes provisions related to the RSU plans, DSU plans and the cash settled portion of the PSU plans, gold and copper price option contract liabilities and gold stream obligation. |
Financial liabilities at amortized cost | Includes trade and other payables and long-term debt. |
(p) Derivative instruments
Derivative instruments, including embedded derivatives, are recorded at fair value on initial recognition and at each subsequent reporting period. Any gains or losses arising from changes in fair value on derivatives that do not qualify for hedge accounting are recorded in net earnings.
21 |
Gold Stream Obligation
The Company has a gold stream agreement with RGLD Gold AG, a wholly owned subsidiary of Royal Gold Inc. (“Royal Gold”). For accounting purposes, the Company has determined that the gold stream obligation represents a financing contract with embedded derivatives. The value of the embedded derivatives changes in response to changes in metal prices and in the number of ounces expected to be delivered. As the gold stream obligation has embedded derivatives that would otherwise need to be accounted for separately at FVTPL, the Company has designated the deposit received from Royal Gold as a financial liability at FVTPL, with initial and subsequent measurement at fair value, as permitted under IFRS 9. Transaction costs directly attributable to the gold stream obligation were expensed through profit or loss.
Fair value of the gold stream obligation on initial recognition was determined by the amount of the cash advance received. Subsequent fair value is calculated on each reporting date with gains and losses recorded in net earnings. Fair value adjustments as a result of the Company’s own credit risk are recorded in the consolidated statement of comprehensive loss, as required by IFRS 9 for financial liabilities designated as at FVTPL. Components of the adjustment to fair value at each reporting date include:
· | Accretion expense due to passage of time |
· | Change in the risk-free interest rate |
· | Change in the Company specific credit spread |
· | Change in any expected ounces to be delivered |
· | Change in future metal prices |
Provisional pricing
Certain products are “provisionally priced” whereby the selling price is subject to final adjustment up to 150 days after delivery to the customer. The final price is based on the market price at the relevant quotation point stipulated in the contract. As is customary in the industry, revenue on provisionally priced sales is recognized based on estimates of the fair value of the consideration receivable based on relevant forward market prices. At each reporting date, provisionally priced metal is marked to market based on the forward selling price for the quotational period stipulated in the contract. For this purpose, the selling price can be measured reliably for those products, such as gold and copper, for which there exists active and freely traded commodity markets. The marking to market of provisionally priced sales contracts is recorded as an adjustment to revenue.
Gold and copper price option contracts
In order to increase cash flow certainty, the Company holds gold and copper price option contracts, purchasing put options and selling call options. These are treated as derivative financial instruments and marked to market at each reporting period on the consolidated statement of financial position with changes in fair value recognized in other gains and losses. Realized gains and losses as a result of the exercise of the Company’s call and put options up to an amount not exceeding the Company’s production of gold ounces or copper pounds for the reporting period are recorded as an adjustment to revenue. The exercise of options on gold ounces or copper pounds in excess of the Company’s production for the reporting period are recorded as other gains and losses.
Gold and copper swaps
In order to mitigate a portion of the metal price exposure associated with the time lag between the provisional and final determination of concentrate sales, the Company has entered into cash settled derivative gold and copper contracts to swap future contracted monthly average metal prices for fixed metal prices. At each reporting date, these gold and copper swap agreements are marked to market based on corresponding forward gold and copper prices. The marking to market of gold and copper swap agreements is recorded as an adjustment to revenue.
22 |
Copper forward contracts
The Company previously held copper swap contracts at a fixed price, settling against the London Metals Exchange (“LME”) monthly average price. These are treated as derivative financial instruments and marked to market at each reporting period on the consolidated statement of financial position with changes in fair value recognized in other gains and losses. Realized gains and losses as a result of the exercise of the Company’s copper forward contracts up to an amount not exceeding the Company’s production of copper pounds for the reporting period are recorded as an adjustment to revenue. Gains and losses in excess of the Company’s copper production for the reporting period are recorded as other gains and losses.
(q) Trade and other receivables
Trade and other receivables are carried at amortized cost less impairment. Trade and other receivables are impaired if they are determined to be uncollectible.
(r) Leases
Leases are classified as finance leases when the terms of the lease transfer substantially all the risks and rewards incidental to ownership of the leased asset to the lessee. All other leases are classified as operating leases.
Operating lease payments are recognized as an expense on a straight-line basis over the lease term, except where another systematic basis is more representative of the time pattern in which economic benefits from the leased asset are consumed.
(s) Changes in accounting policies
The Company has adopted the following new IFRS policy along with any amendments, effective January 1, 2018. These changes were made in accordance with the applicable transitional provisions.
IFRS 15 – Revenue from Contracts with Customers
On May 28, 2014, the IASB issued IFRS 15, Revenue from Contracts with Customers (“IFRS 15”). This standard outlines a single comprehensive model with prescriptive guidance for entities to use in accounting for revenue arising from contracts with its customers. IFRS 15 uses a control-based approach to recognize revenue, which is a change from the risk and reward approach under the current standard. This standard replaces IAS 18 Revenue, IAS 11 Construction Contracts and related interpretations. The Company has adopted IFRS 15 effective January 1, 2018 applying the retrospective method of transition.
The standard requires entities to apportion revenue earned from contracts to individual promises or performance obligations, on a relative standalone selling price basis. For the Company's concentrate sales, the seller may contract for and pay the shipping and insurance costs necessary to bring the goods to the named destination. Therefore, where material, a portion of the revenue earned under these contracts, representing the obligation to fulfill the shipping and insurance services, is deferred and recognized over time as the obligations are fulfilled, along with the associated costs. The impact of this change on the amount of revenue recognized in a year is not significant. As a result, there have been no changes in the amounts of the revenue recognized or a significant change in the timing of revenue recognition under the new standard.
3. Critical judgments and estimation uncertainties
The preparation of the Company’s consolidated financial statements in conformity with IFRS requires the Company’s management to make judgments, estimates and assumptions about the future events that affect the amounts reported in the consolidated financial statements and related notes to the financial statements. Estimates and assumptions are continually evaluated and are based on management’s experience and other facts and circumstances. Revisions to estimates and the resulting effects on the carrying amounts of the Company’s assets and liabilities are accounted for prospectively.
23 |
The areas which require management to make significant judgments, estimates and assumptions in determining carrying values include, but are not limited to:
(a) Critical judgments in the application of accounting policies
(i) Commencement of commercial production
Prior to the period when a mine has reached management’s intended operating levels, costs incurred as part of the development of the related mining property are capitalized and any mineral sales during the commissioning period are offset against the costs capitalized. The Company defines the commencement of commercial production as the date that a mine has achieved a consistent level of production. Depletion of capitalized costs for mining properties begins when operating levels intended by management have been reached.
There are a number of factors the Company considers when determining if conditions exist for the commencement of commercial production of an operating mine. Management examines the following when making that judgment:
· | All major capital expenditures to bring the mine to the condition necessary for it to be capable of operating in the manner intended by management have been completed; |
· | The completion of a reasonable period of testing of the mine plant and equipment has been completed; |
· | The mine or mill has reached a pre-determined percentage of design capacity; and |
· | The ability to sustain ongoing production of ore has been achieved. |
The list is not exhaustive and each specific circumstance is taken into account before making the decision.
(ii) Functional currency
The functional currency for each of the Company’s Subsidiaries is the currency of the primary economic environment in which the entity operates. The Company has determined the functional currency of each entity as the U.S. dollar. Determination of the functional currency may involve certain judgments to determine the primary economic environment and the Company reconsiders the functional currency of its entities if there is a change in events and conditions which determines the primary economic environment.
(iii) Determination of economic viability
Management has determined that exploratory drilling, evaluation, development and related costs incurred on the Blackwater project, and New Afton C-zone project have future economic benefits and are economically recoverable. In making this judgment, management has assessed various criteria including, but not limited to, the geologic and metallurgic information, history of conversion of mineral deposits to proven and probable mineral reserves, operating management expertise, existing permits, the expectation of receiving additional permits and life-of-mine (“LOM”) plans.
(iv) Carrying value of long-lived assets and impairment charges
In determining whether the impairment of the carrying value of an asset is necessary, management first determines whether there are external or internal indicators that would signal the need to test for impairment. These indicators consist of but are not limited to the prolonged significant decline in commodity prices, per ounce multiples, unfavourable changes to the legal environment in which the entity operates, significant adverse change to LOM plans and the factors which lead to the carrying amount of the Company’s net assets exceeding its market capitalization. If an impairment indicator is identified, the Company compares the carrying value of the asset against the recoverable amount. These determinations and their individual assumptions require that management make a decision based on the best available information at each reporting period.
24 |
As at December 31, 2018, indicators of impairment existed for Rainy River and Blackwater as the Company experienced a sustained and prolonged period where the carrying value of its net assets were more that its market capitalization. The results of the impairment assessment, including the significant estimates and assumptions used, are set out in Note 10.
(v) Determination of CGU
In determining a CGU, management had to examine the smallest identifiable group of assets that generates cash inflows that are largely independent of cash inflows from other assets or groups of assets. The Company has determined that each mine site and development project qualifies as an individual CGU. Each of these assets generates or will have the ability to generate cash inflows that are independent of the other assets and therefore qualifies as an individual asset for impairment testing purposes.
(vi) Classification of Gold Stream Instruments
The Company holds gold stream agreements with counterparties for the purchase and delivery of gold and silver. Management has assessed these gold stream agreements under the scope of IFRS 9, Financial Instruments as to whether or not the agreements constitute a financial instrument. As the gold stream obligation has embedded derivatives that would otherwise need to be accounted for separately at FVTPL, Management has designated the deposit received from Royal Gold as a financial liability at FVTPL, with initial and subsequent measurement at fair value, as permitted under IFRS 9.
(b) Key sources of estimation uncertainty in the application of accounting policies
(i) Revenue recognition
Revenue from sales of concentrate is recorded when control of the goods pass to the purchaser. Variations between the prices set in the contracts and final settlement prices may be caused by changes in the market prices and result in an embedded derivative in the accounts receivable. The embedded derivative is recorded at fair value each reporting period until final settlement occurs, with changes in the fair value being recorded as revenue. For changes in metal quantities upon receipt of new information and assays, the provisional sales quantities are adjusted as well, with the change being recorded as revenue.
(ii) Inventory valuation
Management values inventory at the weighted average production costs or net realizable value (“NRV”). Weighted average production costs include expenditures incurred and depreciation and depletion of assets used in mining and processing activities that are deferred and accumulated as the cost of ore in stockpiles, ore on leach pad, work-in-process and finished metals inventories. The allocation of costs to ore in stockpiles, ore on leach pads and in-process inventories and the determination of NRV involve the use of estimates. Costs are removed from the leach pad based on the average cost per recoverable ounce of gold and silver on the leach pad as gold and silver are recovered. Estimates of recoverable gold and silver on the leach pads are calculated from the quantities of ore placed on the pads, the grade of ore placed on the leach pads and an estimated percentage of recovery. Timing and ultimate recovery of gold and silver contained on leach pads can vary significantly from the estimates.
(iii) Mineral reserves and resources
The figures for mineral reserves and mineral resources are determined in accordance with National Instrument 43-101, “Standards of Disclosure for Mineral Projects”, issued by the Canadian Securities Administrators. There are numerous estimates in determining the mineral reserves and resource estimates. Such estimation is a subjective process, and the accuracy of any mineral reserve or resource estimate is a function of the quantity and quality of available data and of the assumptions made and judgments used in engineering and geological interpretation. Differences between management’s assumptions including economic assumptions, such as metal prices and market conditions, could have a material effect in the future on the Company’s financial position and results of operations.
25 |
(iv) Estimated recoverable ounces
The carrying amounts of the Company’s mining properties are depleted based on recoverable ounces. Changes to estimates of recoverable ounces and depletable costs including changes resulting from revisions to the Company’s mine plans and changes in metal price forecasts can result in a change to future depletion rates.
(v) Deferred income taxes
In assessing the probability of realizing income tax assets recognized, management makes estimates related to expectations of future taxable income, applicable tax planning opportunities, expected timing of reversals of existing temporary differences and the likelihood that tax positions taken will be sustained upon examination by applicable tax authorities. In making its assessments, management gives additional weight to positive and negative evidence that can be objectively verified. Estimates of future taxable income are based on forecasted cash flows from operations and the application of existing tax laws in each jurisdiction. Forecasted cash flows from operations are based on LOM projections internally developed and reviewed by management. The Company considers tax planning opportunities that are within the Company’s control, are feasible and implementable without significant obstacles. Examination by applicable tax authorities is supported based on individual facts and circumstances of the relevant tax position examined in light of all available evidence. Where applicable tax laws and regulations are either unclear or subject to ongoing varying interpretations, it is possible that changes in these estimates can occur that materially affect the amounts of income tax asset recognized. At the end of each reporting period, the Company reassesses unrecognized income tax assets.
(vi) Reclamation and closure cost obligations
The Company’s provision for reclamation and closure cost obligations represents management’s best estimate of the present value of the future cash outflows required to settle the liability which reflects estimates of future costs, inflation, movements in foreign exchange rates and assumptions of risks associated with the future cash outflows, and the applicable risk-free interest rates for discounting the future cash outflows. Changes in the above factors can result in a change to the provision recognized by the Company.
4. Future changes in accounting policies
Leases
On January 6, 2016, the IASB issued IFRS 16, Leases (“IFRS 16”). This standard specifies the methodology to recognize, measure, present and disclose leases. The standard provides a single lessee accounting model, requiring lessees to recognize assets and liabilities for all leases. This standard replaces IAS 17 Leases. The effective date is for reporting periods beginning on or after January 1, 2019 with early adoption permitted. The Company has developed an implementation plan to determine the impact on the consolidated financial statements. The Company has compiled all of its existing operating lease contracts and service contracts and has identified which contracts would be within scope of IFRS 16. The Company has quantified the accounting implications for all of its existing contracts within scope of IFRS 16. Although the Company expects an increase in depreciation and accretion expenses and an increase in cash flow from operating activities as any lease payments will be recorded as financing outflows in the statement of cash flows, the impact is not expected to be material, as the Company’s existing operating leases are not material.
The Company will be adopting IFRS 16 on January 1, 2019 using the modified retrospective approach. Under this approach, the cumulative effect of initially applying IFRS 16 is recognized as an adjustment to equity at the date of initial application. Comparative figures are not restated to reflect the adoption of IFRS 16. Additionally, the Company will be adopting the exemption for leases with a lease term of 12 months or less and for leases that are low value. Given that the Company’s existing operating leases are not material, no material adjustment to equity will be recognized upon IFRS 16 adoption on January 1, 2019.
26 |
5. Expenses
(a) Operating expenses by nature
Year ended December 31 | ||
(in millions of U.S. dollars) | 2018 | 2017 |
Operating expenses by nature | ||
Raw materials and consumables | 148.1 | 85.0 |
Salaries and employee benefits | 102.1 | 59.6 |
Contractors | 60.6 | 32.2 |
Repairs and maintenance | 47.7 | 15.1 |
General and administrative | 20.3 | 15.7 |
Operating leases | 4.2 | 2.3 |
Royalties | 3.5 | 2.9 |
Drilling and analytical | 2.4 | 1.3 |
Other | 5.2 | 2.5 |
Total production expenses | 394.1 | 216.6 |
Less: Production expenses capitalized | (45.3) | (22.5) |
Less: Change in inventories | (23.4) | 4.2 |
Total operating expenses | 325.4 | 198.3 |
(b) Finance costs and income
Year ended December 31 | ||
(in millions of U.S. dollars) | 2018 | 2017 |
Finance costs | ||
Interest on senior unsecured notes | 53.2 | 54.4 |
Interest on Credit Facility | 9.0 | 5.9 |
Accretion expense on decommissioning obligations (Note 17) | 2.0 | 1.0 |
Gain on modification of long-term debt | - | (3.3) |
Other finance costs | 4.8 | 6.1 |
69.0 | 64.1 | |
Less: amounts included in cost of qualifying assets | - | (51.3) |
Total finance costs | 69.0 | 12.8 |
Finance income | ||
Interest income | 1.5 | 1.1 |
27 |
(c) Other gains
Year ended December 31 | ||
(in millions of U.S. dollars) | 2018 | 2017 |
Other Gains | ||
Unrealized gain on share purchase warrants | - | 1.2 |
Gain (loss) on foreign exchange | 6.6 | 43.8 |
Gain on disposal of El Morro stream | - | 33.0 |
Other (loss) gain on disposal of assets | (0.3) | 0.3 |
Loss on revaluation of investments | (0.2) | (0.2) |
Unrealized gain (loss) on revaluation of gold stream obligation (Note 12) | 11.7 | (21.8) |
Settlement and loss on revaluation of gold price option contracts | (4.8) | (6.5) |
Gain (loss) on revaluation of copper forward contracts and copper price option contracts | 4.8 | (4.4) |
Revaluation of CSP’s reclamation and closure cost obligation(1) | (1.0) | - |
Other | 1.3 | 1.2 |
Total other gains | 18.1 | 46.6 |
1. | Cerro San Pedro has transitioned to the reclamation phase of its mine life cycle effective December 31, 2018. As a result, changes in estimate to Cerro San Pedro’s reclamation and closure cost obligation resulting from revisions to the expected cash flows will be recognized within other gains and losses. |
6. Trade and other receivables
As at December 31 |
As at December 31 | |
(in millions of U.S. dollars) | 2018 | 2017 |
Trade and other receivables | ||
Trade receivables | 9.5 | 3.8 |
Sales tax receivable | 14.0 | 22.7 |
Unsettled provisionally priced concentrate derivatives and swap contracts (Note 13) | (0.7) | (1.9) |
Proceeds due from the sale of Mesquite, excluding income tax refund receivable (Note 15) | 11.2 | - |
Other | 1.9 | 2.5 |
Total trade and other receivables | 35.9 | 27.1 |
7. Trade and other payables
As at December 31 |
As at December 31 | |
(in millions of U.S. dollars) | 2018 | 2017 |
Trade and other payables | ||
Trade payables | 47.1 | 60.9 |
Interest payable | 6.9 | 6.9 |
Accruals | 47.3 | 79.2 |
Current portion of reclamation and closure cost obligations (Note 17) | 6.5 | 2.6 |
Current portion of gold stream obligation (Note 12) | 18.3 | 24.5 |
Derivative liabilities (Note 13) | 4.8 | 4.1 |
Total trade and other payables | 130.9 | 178.2 |
28 |
8. Inventories
As at December 31 |
As at December 31 | |
(in millions of U.S. dollars) | 2018 | 2017 |
Inventories | ||
Heap leach ore(2) (3) | - | 163.1 |
Stockpile ore | 74.3 | 23.8 |
Work-in-process | 7.7 | 18.5 |
Finished goods(1) | 25.4 | 16.1 |
Supplies | 49.3 | 50.4 |
156.7 | 271.9 | |
Less: non-current inventories(2) | (14.9) | (78.7) |
Total current inventories | 141.8 | 193.2 |
1. | The amount of inventories recognized in operating expenses for the year ended December 31, 2018 was $311.6 million (2017 $186.2 million). |
2. | Non-current inventories consist of low-grade stockpiled inventories at Rainy River, of which $14.9 million are expected to be recovered after one year. As at December 31, 2017, non-current inventories of $78.7 million consisted of low-grade stockpiled inventories at Rainy River and non-current heap leach inventories at Mesquite and Cerro San Pedro. |
3. | For the year ended December 31, 2018, the Company wrote down $16.9 million of heap leach inventory at Cerro San Pedro, of which $15.8 million was included in operating expenses and $1.1 million was included in depreciation and depletion, as a result of a recoverability analysis performed earlier in the year as the Company has discontinued the addition of cyanide to the heap leach pad, and as a result of Cerro San Pedro transitioning to the reclamation phase of its mine life cycle on December 31, 2018. |
29 |
9. Mining interests
Mining Properties | ||||||
Depletable | Non- depletable |
Plant & equipment |
Construction in progress |
Exploration & evaluation |
Total | |
(in millions of U.S. dollars) | ||||||
Cost | ||||||
As at December 31, 2016 | 1,540.2 | 1,117.1 | 959.1 | 741.4 | 1.1 | 4,358.9 |
Additions | 88.8 | 65.8 | 44.5 | 529.7 | - | 728.8 |
Disposal of El Morro stream | - | (32.0) | - | - | - | (32.0) |
Disposals | - | - | (17.0) | - | - | (17.0) |
Impairment loss on assets held for sale(1) | (48.6) | - | - | - | - | (48.6) |
Assets reclassified as held for sale(1) | (178.5) | (9.8) | (161.4) | (0.3) | - | (350.0) |
Transfers(2) | 1,219.5 | (580.2) | 554.1 | (1,213.8) | - | (20.4) |
Asset impairment | (268.4) | - | - | - | - | (268.4) |
As at December 31, 2017 | 2,353.0 | 560.9 | 1,379.3 | 57.0 | 1.1 | 4,351.3 |
Additions | 70.8 | 23.8 | 48.3 | 72.0 | - | 214.9 |
Disposals | (0.4) | - | (4.8) | - | - | (5.2) |
Sale of Mesquite(1) | (323.5) | - | (232.0) | (1.8) | - | (557.3) |
Transfers | (0.6) | - | 0.6 | - | - | - |
Asset Impairment(3) | (836.6) | (218.2) | - | - | - | (1,054.8) |
As at December 31, 2018 | 1,262.7 | 366.5 | 1,191.4 | 127.2 | 1.1 | 2,948.9 |
Accumulated depreciation | ||||||
As at December 31, 2016 | 734.9 | - | 432.7 | - | - | 1,167.6 |
Depreciation for the year | 161.7 | - | 102.5 | - | - | 264.2 |
Disposals | - | - | (16.2) | - | - | (16.2) |
Reclassified as held for sale(1) | (159.3) | - | (105.4) | - | - | (264.7) |
As at December 31, 2017 | 737.3 | - | 413.6 | - | - | 1,150.9 |
Depreciation for the period | 169.1 | - | 130.7 | - | - | 299.8 |
Disposals | (0.1) | - | (3.6) | - | - | (3.7) |
Sale of Mesquite(1) | (189.3) | - | (162.2) | - | - | (351.5) |
As at December 31, 2018 | 717.0 | - | 378.5 | - | - | 1,095.5 |
CARRYING AMOUNT | ||||||
As at December 31, 2017 | 1,615.7 | 560.9 | 965.7 | 57.0 | 1.1 | 3,200.4 |
As at December 31, 2018 | 545.7 | 366.5 | 812.9 | 127.2 | 1.1 | 1,853.4 |
1. | Refer to Note 15 for further information on discontinued operations. Mesquite was classified as an asset held-for-sale in the third quarter of 2018 and was sold in October 2018. Peak Mines was classified as an asset held-for-sale in 2017 and was sold in April 2018. |
2. | Effective November 1, 2017, Rainy River achieved commercial production. As a result, the Company transferred amounts capitalized to construction in progress to depletable mining properties and plant & equipment and assets capitalized as non-depletable mining properties were transferred to depletable mining properties. Additionally, on November 1, 2017, the Company transferred $20.4 million related to inventories from construction in progress to current assets. |
3. | Refer to note 10 for further information on impairment. |
The Company capitalized interest of $51.3 million for the year ended December 31, 2017 to qualifying development projects. No interest was capitalized to qualifying development projects for the year ended December 31, 2018.
30 |
Carrying amount by property as at December 31, 2018:
As at December 31, 2018 | |||||
(in millions of U.S. dollars) | Depletable | Non- depletable |
Plant & equipment |
Construction in progress |
Total |
mining interest by site | |||||
New Afton | 421.9 | 26.1 | 191.6 | 16.4 | 656.0 |
Cerro San Pedro(2) | - | - | - | - | - |
Rainy River | 123.8 | 14.3 | 605.0 | 110.8 | 853.9 |
Blackwater | - | 326.1 | 14.2 | - | 340.3 |
Other(1) | - | 1.1 | 2.1 | - | 3.2 |
Carrying amount as at December 31, 2018 | 545.7 | 367.6 | 812.9 | 127.2 | 1,853.4 |
1. | Other includes corporate balances and exploration properties. |
2. | Cerro San Pedro transitioned to the reclamation phase of its mine life cycle on December 31, 2018. As a result, Cerro San Pedro’s mining interests are fully amortized as at December 31, 2018. |
Carrying amount by property as at December 31, 2017:
As at December 31, 2017 | |||||
(in millions of U.S. dollars) | Depletable | Non- depletable |
Plant & equipment |
Construction in progress |
Total |
mining interest by site | |||||
New Afton | 521.8 | 22.9 | 225.7 | 15.1 | 785.5 |
Mesquite | 150.0 | - | 83.5 | 2.7 | 236.2 |
Cerro San Pedro | 0.6 | - | - | - | 0.6 |
Rainy River | 948.1 | 0.5 | 633.6 | 39.2 | 1,621.4 |
Blackwater | - | 537.5 | 14.6 | - | 552.1 |
Other(1) | - | 1.1 | 3.5 | - | 4.6 |
Carrying amount as at December 31, 2017 | 1,620.5 | 562.0 | 960.9 | 57.0 | 3,200.4 |
1. | Other includes corporate balances and exploration properties. |
31 |
10. Impairment
In accordance with the Company’s accounting policies, the recoverable amount of an asset or cash-generating unit (“CGU”) is estimated when an indication of impairment exists.
During the second half of 2018, the Company experienced a significant and prolonged period where the carrying value of its net assets were more that its market capitalization. The Company identified this market capitalization deficiency as an indicator of impairment as at December 31, 2018. As a result of this impairment indicator, the Company assessed its CGUs and determined that impairments existed at Rainy River and Blackwater.
As a result, in the fourth quarter of 2018, the Company recorded an after-tax impairment loss of $671.1 million at Rainy River and Blackwater. At Rainy River, the impairment loss was largely driven by increased capital expenditures and a lower in-situ value as a result of applying a lower per ounce value to in situ ounces. At Blackwater, the Company assessed the value of the project using an in-situ metric approach for reserves and resources, rather than a discounted cash flow approach, consistent with the approach a market participant would take and also applying a lower per ounce value to in situ ounces. This approach incorporated values based on recent comparable market transactions. In the second quarter of 2018, the Company completed an updated Rainy River life-of-mine (“LOM”) plan and released an updated NI 43-101 Technical Report for Rainy River in early August 2018. The Company identified the changes to the mine plan and increased cost estimates at Rainy River as indicators of impairment as at June 30, 2018 and recorded an after-tax impairment loss of $282.1 million within net loss. For the year ended December 31, 2018, the Company recorded an after-tax impairment loss of $953.2 million, as noted below:
June 30, 2018 | December 31, 2018 |
Year ended December 31, 2018 | |
(in millions of U.S. dollars) | |||
impairment Loss | |||
Rainy River depletable mining properties | 383.7 | 452.9 | 836.6 |
Blackwater non-depletable mining properties | - | 218.2 | 218.2 |
Total impairment loss | 383.7 | 671.1 | 1,054.8 |
Tax recovery(1) | (101.6) | - | (101.6) |
Total impairment loss, net of tax | 282.1 | 671.1 | 953.2 |
1. | There was no tax recovery associated with the impairment losses at Rainy River and Blackwater recorded during the fourth quarter of 2018 as the Company has not recognized any deferred tax assets as at December 31, 2018. Refer to Note 16 for further information. |
Year ended December 31, 2017 | |
(in millions of U.S. dollars) | Rainy River |
impairment Loss | |
Rainy River depletable mining properties | 268.4 |
Tax recovery | (87.4) |
Total impairment charge after tax | 181.0 |
(i) Methodology and key assumptions
Impairment is recognized when the carrying amount of a CGU exceeds its recoverable amount. A CGU is the smallest identifiable group of assets that generates cash inflows that are largely independent of the cash inflows from other assets or groups of assets. Each operating mine and development project represents a separate CGU as each mine site or project has the ability to, or the potential to, generate cash inflows that are separately identifiable and independent of each other. The Company has the following CGUs: New Afton, Rainy River, and Blackwater. Other assets consist of corporate assets and exploration properties.
32 |
The Company uses fair value less cost of disposal to determine the recoverable amount of an asset as it believes that this will generally result in a value greater than or equal to the value in use. When there is no binding sales agreement, fair value less costs of disposal is estimated as the discounted future after-tax cash flows expected to be derived from a operating mine site, less an amount for costs to sell estimated based on similar past transactions. For development mine sites, fair value less cost of disposal is based on the valuation of in-situ ounces.
The inputs used in the fair value measurement constitute Level 3 inputs under the fair value hierarchy.
(a) Rainy River CGU:
Key estimates and judgments include production levels, operating costs and other capital expenditures reflected in the Company’s LOM plans, the value of in-situ ounces and land holdings, as well as economic factors beyond management’s control, such as gold and silver prices, discount rates and foreign exchange rates. The Company considers this approach to be consistent with the valuation approach taken by market participants.
Life-of-Mine plans
Estimated cash flows are based on LOM plans which estimate expected future production, commodity prices, foreign exchange assumptions, operating costs and capital costs. The current LOM plan is 13 years. LOM plans use proven and probable mineral reserves only and do not utilize mineral resource estimates for a CGU. When options exist for the future extraction and processing of these resources, an estimate of the value of the unmined mineral resources (also referred to as in-situ ounces) is included in the determination of fair value.
In-situ ounces
In-situ ounces are excluded from the LOM plans due to the need to continually reassess the economic returns on and timing of specific production options in the current economic environment. The value of in-situ ounces has been estimated based on an enterprise value per equivalent resource ounce, with the enterprise value based on the market capitalization of a subset of publicly traded companies.
Discount rates
When discounting estimated future cash flows, the Company uses a real after-tax discount rate that is designed to approximate what market participants would assign. This discount rate is calculated using the Capital Asset Pricing Model (“CAPM”). The CAPM includes market participants’ estimates for equity risk premium, cost of debt, target debt to equity, risk-free rates and inflation. For the December 31, 2018 impairment analysis a real discount rate of 4.00% was used (2017 - real discount rate of 4.00%). For the June 30, 2018 impairment analysis a real discount rate of 4.50% was used
Commodity prices and exchange rates
Commodity prices and exchange rates are estimated with reference to external market forecasts. The rates applied have been estimated using consensus commodity prices and exchange rate forecasts. For impairment analysis, the following commodity prices and exchange rate assumptions were used:
As at June 30, 2018 | As at December 31, 2018 | As at December 31, 2017 | ||||
(in U.S. dollars, except where noted) | 2018 - 2023 Average |
Long-term Average |
2019 - 2023 Average |
Long-term Average |
2018- 2022 Average |
Long-term Average |
Commodity prices | ||||||
Gold ($/ounce) | 1,311 | 1,300 | 1,299 | 1,300 | 1,300 | 1,300 |
Silver ($/ounce) | 18.00 | 18.17 | 17.69 | 18.17 | 19.16 | 19.25 |
Exchange rates | ||||||
CAD:USD | 1.24 | 1.23 | 1.26 | 1.25 | 1.24 | 1.24 |
33 |
Significant judgments and assumptions are required in making estimates of fair value. It should be noted that CGU valuations are subject to variability in key assumptions including, but not limited to, long-term gold prices, currency exchange rates, discount rates, production, operating and capital costs. Any variation in one or more of the assumptions used to estimate fair value could result in a change in a CGU’s fair value.
(b) Blackwater CGU:
Key estimates and judgments used in the fair value less cost of disposal calculation is the valuation of in-situ ounces. The Company considers this approach to be consistent with the valuation approach taken by market participants. For the December 31, 2018 impairment analysis, an in-situ valuation of $30 per ounce was applied.
(ii) Impact of impairment tests
The Company calculated the recoverable amount of the Rainy River and Blackwater CGUs using the fair value less cost of disposal method as noted above. For the year ended December 31, 2018, the Company recorded pre-tax impairment losses of $1,054.8 million, $953.2 million net of tax, within net loss.
(iii) Sensitivity analysis
After effecting the impairment for the Rainy River and Blackwater CGUs, the fair value of these CGUs is assessed as being equal to their respective carrying amounts as at December 31, 2018. Any variation in the key assumptions used to determine fair value would result in a change of the assessed fair value. It is estimated that changes in the key assumptions would have the following approximate impact on the fair value of the Rainy River and Blackwater CGUs at December 31, 2018:
As at December 31, 2018 | ||
(in millions of U.S. dollars) | Rainy River | Blackwater |
Impact of changes in the key assumptions used to determine fair value | ||
$100 per ounce change in gold price | 256.6 | - |
0.5% change in discount rate | 24.7 | - |
5% change in foreign exchange rate | 103.4 | - |
5% change in operating costs | 106.6 | - |
5% change in in-situ ounces or in-situ value | 10.9 | 16.4 |
11. Long-term debt
Long-term debt consists of the following:
As at December 31 |
As at December 31 | |
(in millions of U.S. dollars) | 2018 | 2017 |
Long-term debt | ||
Senior unsecured notes - due November 15, 2022 (a) | 495.3 | 494.3 |
Senior unsecured notes - due May 15, 2025 (b) | 285.2 | 283.4 |
Credit Facility (c) | - | 230.0 |
Total long-term debt | 780.5 | 1,007.7 |
34 |
(a) Senior Unsecured Notes – due November 15, 2022
In 2012, the Company issued $500.0 million of senior unsecured notes (“2022 Unsecured Notes”). As at December 31, 2018, the face value was $500.0 million. The 2022 Unsecured Notes are denominated in U.S. dollars, mature and become due and payable on November 15, 2022, and bear interest at the rate of 6.25% per annum. Interest is payable in arrears in equal semi-annual instalments on May 15 and November 15 of each year.
The Company incurred transaction costs of $9.9 million which have been offset against the carrying amount of the 2022 Unsecured Notes and are being amortized to net earnings using the effective interest method.
The 2022 Unsecured Notes are subject to a minimum interest coverage incurrence covenant of earnings before interest, taxes, depreciation, amortization, impairment, and other non-cash adjustments to interest of 2:1. The test is applied on a pro-forma basis prior to the Company incurring additional debt, entering into business combinations or acquiring significant assets, or certain other corporate actions. There are no maintenance covenants.
The 2022 Unsecured Notes are redeemable by the Company in whole or in part:
· | During the 12-month period beginning on November 15 of the years indicated at the redemption prices below, expressed as a percentage of the principal amount of the 2022 Unsecured Notes to be redeemed, plus accrued and unpaid interest, if any, to the redemption date: |
Date | Redemption prices (%) |
2018 | 102.08% |
2019 | 101.04% |
2020 and thereafter | 100.00% |
(b) Senior Unsecured Notes – due May 15, 2025
In 2017, the Company issued $300.0 million of senior unsecured notes (“2025 Unsecured Notes”). As at December 31, 2018, the face value was $300.0 million. The 2025 Unsecured Notes are denominated in U.S. dollars, mature and become due and payable on May 15, 2025, and bear interest at the rate of 6.375% per annum. Interest is payable in arrears in equal semi-annual instalments on May 15 and November 15 of each year.
The Company incurred transaction costs of $10.7 million which have been offset against the carrying amount of the 2025 Unsecured Notes and are being amortized to net earnings using the effective interest method.
The 2025 Unsecured Notes are subject to a minimum interest coverage incurrence covenant of earnings before interest, taxes, depreciation, amortization, impairment, and other non-cash adjustments to interest of 2:1. The test is applied on a pro-forma basis prior to the Company incurring additional debt, entering into business combinations or acquiring significant assets, or certain other corporate actions. There are no maintenance covenants.
The 2025 Unsecured Notes are redeemable by the Company in whole or in part:
· | At any time prior to May 15, 2020 at a redemption price of 100% of the aggregate principal amount of the 2025 Unsecured Notes, plus a make-whole premium (consisting of future interest that would have been paid up to the first call date of May 15, 2020), plus accrued and unpaid interest, if any, to the redemption date. |
· | During the 12-month period beginning on May 15 of the years indicated at the redemption prices below, expressed as a percentage of the principal amount of the 2025 Unsecured Notes to be redeemed, plus accrued and unpaid interest, if any, to the redemption date: |
35 |
Date | Redemption prices (%) |
2020 | 104.78% |
2021 | 103.19% |
2022 | 101.59% |
2023 and thereafter | 100.00% |
(c) Credit Facility
The Company holds a revolving credit facility (the “Credit Facility”) with a maturity date of August 2021 and has a borrowing limit of $400.0 million. Previously, the Credit Facility was secured by New Afton and Mesquite. The Company sold Mesquite in October 2018, which resulted in its removal as security for the Credit Facility. The Company has granted to its lenders under the Credit Facility a security interest in Rainy River; the maximum amount available to be drawn under the Credit Facility was $225.0 million until the Company completed perfection of the new Rainy River security in February 2019. In the current period, the Company extended the maturity date of the Credit Facility to August 2021 from its previous maturity date of August 2020 and as a result incurred $0.6 million in financing initiation costs.
The Credit Facility contains various covenants customary for a loan facility of this nature, including limits on indebtedness, asset sales and liens. The Credit Facility contains three covenant tests, the minimum interest coverage ratio, being earnings before interest, taxes, depreciation, amortization, exploration, impairment and other non-cash adjustments (“Adjusted EBITDA”) to interest, the maximum net debt to Adjusted EBITDA ratio (“Leverage Ratio”), and the maximum gross secured debt to Adjusted EBITDA (“Secured Leverage Ratio), all of which are measured on a rolling four-quarter basis at the end of every quarter. Significant financial covenants are as follows:
Twelve months ended December 31 |
Twelve months ended December 31 | ||
Financial Covenant | 2018 | 2017 | |
Financial covenants | |||
Minimum interest coverage ratio (Adjusted EBITDA to interest) | >3.0 : 1 | 4.5 : 1 | 4.7 : 1 |
Maximum leverage ratio (net debt to Adjusted EBITDA) | <4.5 : 1 | 2.6 : 1 | 3.1 : 1 |
Maximum secured leverage ratio (secured debt to Adjusted EBITDA) | <2.0 : 1 | 0.4 : 1 | N/A |
The interest margin on drawings under the Credit Facility ranges from 1.25% to 3.75% over LIBOR, the Prime Rate or the Base Rate, based on the Company’s Leverage Ratio and the currency and type of credit selected by the Company. Based on the Company’s Leverage Ratio, the rate is 3.25% over LIBOR as at December 31, 2018 (December 31, 2017 – 3.25%). The standby fees on undrawn amounts under the Credit Facility range from 0.51% to 0.84%, depending on the Company’s Leverage Ratio. Based on the Company’s Leverage Ratio, the rate is 0.73% as at December 31, 2018 (December 31, 2017 – 0.73%).
During the year ended December 31, 2018, the Company repaid $230.0 million under the Credit Facility, reducing the outstanding amount to $nil as at December 31, 2018. As at December 31, 2018, letters of credit amounting to $110.8 million have been issued through the Credit Facility (December 31, 2017 - $138.8 million). Letters of credit relate to reclamation bonds, and other financial assurances required with various government agencies.
36 |
The following is a summary of the changes in liabilities arising from financing activities for the year ended December 31, 2018:
As at December 31, 2017 |
Borrowings | Repayments | Fair Value changes |
Interest & Accretion |
Foreign Exchange |
As at December 31, 2018 | |
Liabilities arising from financing actvities | |||||||
Long-term debt | 1,007.7 | - | (230.0) | - | 2.8 | - | 780.5 |
Interest payable(1) | 6.9 | - | (59.4) | - | 59.4 | - | 6.9 |
Gold stream obligation | 273.5 | - | (15.0) | (78.3) | - | - | 180.2 |
Total | 1,288.1 | - | (304.4) | (78.3) | 62.2 | - | 967.6 |
1. | For the purposes of this reconciliation, interest paid for the year ended December 31, 2018 excludes $3.8 million in standby fees on the Credit Facility and |
fees on the Company’s issued letters of credit.
37 |
12. Gold stream obligation
In 2015, the Company entered into a $175 million streaming transaction with RGLD Gold AG, a wholly owned subsidiary of Royal Gold Inc. (“Royal Gold”). Under the terms of the agreement, the Company will deliver to Royal Gold 6.5% of gold production from Rainy River up to a total of 230,000 ounces of gold and then 3.25% of the mine’s gold production thereafter. The Company will also deliver to Royal Gold 60% of the mine’s silver production to a maximum of 3.1 million ounces and then 30% of silver production thereafter. Royal Gold paid $175.0 million in consideration of this transaction.
In addition to the upfront deposit, Royal Gold will pay 25% of the average spot gold or silver price at the time each ounce of gold or silver is delivered under the stream. The difference between the spot price of metal and the cash received from Royal Gold will reduce the $175.0 million deposit over the life of the mine. Upon expiry of the 40-year term of the agreement (which may be extended in certain circumstances), any balance of the $175.0 million upfront deposit remaining unpaid will be refunded to Royal Gold.
The Company has designated the gold stream obligation as a financial liability at fair value through profit or loss (“FVTPL”) under the scope of IFRS 9. Accordingly, the Company values the liability at the present value of its expected future cash flows at each reporting period with changes in fair value reflected in the consolidated income statements and consolidated statements of comprehensive income. The gold stream obligation contained a maximum leverage ratio covenant (net debt to Adjusted EBITDA) of 3.5 : 1.0 as at December 31, 2018.
The following is a summary of the changes in the Company’s gold stream obligation:
(in millions of U.S. dollars) | |
Change in Stream Obligation | |
Balance, December 31, 2016 | 246.5 |
Settlements during the period | (2.4) |
Fair value adjustments related to changes in the Company’s own credit risk(1) | 7.6 |
Other fair value adjustments(2) | 21.8 |
Balance, December 31, 2017 | 273.5 |
Less: current portion of gold stream obligation(3) | (24.5) |
Non-current portion of gold stream obligation | 249.0 |
Balance, December 31, 2017 | 273.5 |
Settlements during the period | (15.0) |
Fair value adjustments related to changes in the Company’s own credit risk(1) | (66.6) |
Other fair value adjustments(2) | (11.7) |
Balance, December 31, 2018 | 180.2 |
Less: current portion of gold stream obligation(3) | (18.3) |
Non-current portion of gold stream obligation | 161.9 |
1. | Fair value adjustments related to changes in the Company’s own credit risk are included in other comprehensive income. |
2. | Other fair value adjustments are included in the consolidated income statements. |
3. | The current portion of the gold stream obligation is included in trade and other payables on the statement of financial position. |
Fair value adjustments represent the net effect on the gold stream obligation of changes in the variables included in the Company’s valuation model between the date of receipt of deposit and the reporting date. These variables include accretion, risk-free interest rate, future metal prices, Company-specific credit spread and expected gold and silver ounces to be delivered.
38 |
13. Derivative instruments
As at December 31 |
As at December 31 | |
(in millions of U.S. dollars) | 2018 | 2017 |
DERIVATIVE ASSETS | ||
Copper price option contracts(1) | 0.7 | - |
Total derivative assets | 0.7 | - |
DERIVATIVE LIABILITIES | ||
Unsettled provisionally priced concentrate derivatives, and swap contracts(2) | 0.7 | 1.9 |
Copper price option contracts(1) | - | 4.1 |
Gold price option contracts(1) | 4.8 | - |
Total derivative liabilities | 5.5 | 6.0 |
1. | As at December 31, 2018, copper price option contracts are included within prepaids and other in the statement of financial position and gold price option contracts are included within trade and other payables in the statement of financial position. As at December 31, 2017, copper price option contracts are included within trade and other payables in the statement of financial position. |
2. | Unsettled provisionally priced concentrate derivatives are included within trade and other receivables in the statement of financial position. |
(a) Provisionally priced contracts
The Company had provisionally priced sales for which price finalization is outstanding at December 31, 2018. Realized and unrealized non-hedged derivative gains (losses) on the provisional pricing of concentrate sales are classified as revenue, with the unsettled provisionally priced concentrate derivatives included in trade and other receivables. The Company enters into gold and copper swap contracts to reduce exposure to gold and copper prices. Realized and unrealized gains (losses) are recorded in revenue, with the unsettled gold and copper swaps included in trade and other receivables.
The following tables summarize the realized and unrealized gains (losses) on provisionally priced sales:
Year ended December 31, 2018 | |||
(in millions of U.S. dollars) | Gold | Copper | Total |
(LOSS) Gain on the provisional pricing of concentrate sales | |||
Realized | (1.2) | (7.7) | (8.9) |
Unrealized | 1.1 | (2.7) | (1.6) |
Total loss | (0.1) | (10.4) | (10.5) |
Year ended December 31, 2017 | |||
(in millions of U.S. dollars) | Gold | Copper | Total |
Gain on the provisional pricing of concentrate sales | |||
Realized | 1.9 | 10.0 | 11.9 |
Unrealized | 0.1 | 4.1 | 4.2 |
Total gain | 2.0 | 14.1 | 16.1 |
39 |
The following tables summarize the realized and unrealized gains (losses) on gold and copper swap contracts:
Year ended December 31, 2018 | |||
(in millions of U.S. dollars) | Gold | Copper | Total |
gain (loss) on swap contracts | |||
Realized | 1.3 | 11.3 | 12.6 |
Unrealized | (0.8) | 1.7 | 0.9 |
Total gain | 0.5 | 13.0 | 13.5 |
Year ended December 31, 2017 | |||
(in millions of U.S. dollars) | Gold | Copper | Total |
GAIN (Loss) on swap contracts | |||
Realized | (2.0) | (16.8) | (18.8) |
Unrealized | (0.3) | (5.8) | (6.1) |
Total gain (loss) | (2.3) | (22.6) | (24.9) |
The following table summarizes the net exposure to the impact of movements in market commodity prices for provisionally priced sales:
As at December 31 | As at December 31 | |
2018 | 2017 | |
Volumes subject to final pricing net of outstanding swaps |
||
Gold ounces (000s) | 0.8 | 2.0 |
Copper pounds (millions) | 1.6 | 1.6 |
(b) Copper price option contracts
In October 2017, the Company entered into copper price option contracts by purchasing put options at a strike price of $3.00 per pound and selling call options at a strike price of $3.37 per pound for 27,600 tonnes (approximately 60 million pounds) of copper production during 2018 (“copper price option contracts”). In December 2018, the Company entered into a second tranche of copper price option contracts by purchasing put options at an average strike price of $2.50 per pound and selling call options at an average strike price of $3.00 per pound for 21,600 tonnes (approximately 47.6 million pounds) of copper production during 2019. The Company entered into these contracts at no premium and therefore incurred no investment costs upon initiation.
The call options sold and put options purchased are treated as derivative financial instruments and marked-to-market at each reporting period on the consolidated statement of financial position with changes in fair value recognized in other gains and losses. Realized gains and losses as a result of the exercise of the Company’s call and put options up to an amount not exceeding the Company’s production of copper pounds for the reporting period are recorded as an adjustment to revenue. The exercise of options on copper pounds in excess of the Company’s copper production for the reporting period are recorded as other gains and losses. For the year ended December 31, 2018, the Company exercised put options for 13,800 tonnes and recognized $6.6 million within revenue.
40 |
Quantity outstanding | Remaining term |
Exercise price |
Fair value - asset (liability) (1) | |
COPPER price option contracts outstanding | ||||
Copper call contracts - sold | 21,600 tonnes | January – December 2019 | 3.00 | (2.3) |
Copper put contracts - purchased | 21,600 tonnes | January – December 2019 | 2.50 | 3.0 |
1. | The Company presents the fair value of its put and call options on a net basis on the consolidated statements of financial position. The Company has a legally enforceable right to set off the amounts under its option contracts and intends to settle on a net basis. |
(c) Gold price option contracts
In December 2018, the Company entered into gold price option contracts by purchasing put options at an average strike price of $1,230 per ounce and selling call options at an average strike price of $1,300 per ounce for 192,000 ounces of gold production between January 2019 and December 2019 (“gold price option contracts”). The Company entered into these contracts at no premium and therefore incurred no investment costs upon initiation.
Consistent with the accounting treatment of the copper price option contracts described above, the call options sold and put options purchased are treated as derivative financial instruments and marked to market at each reporting period on the consolidated statement of financial position with changes in fair value recognized in other gains and losses. Realized gains and losses as a result of the exercise of the Company’s call and put options up to an amount not exceeding the Company’s production of gold ounces for the reporting period are recorded as an adjustment to revenue. The exercise of options on gold ounces excess of the Company’s gold production for the reporting period are recorded as other gains and losses.
Quantity outstanding |
Remaining term |
Exercise price
|
Fair value - asset (liability) (1) | |
Gold price option contracts outstanding | ||||
Gold call contracts - sold | 192,000 oz | January – December 2019 | 1,300 | (8.0) |
Gold put contracts - purchased | 192,000 oz | January – December 2019 | 1,230 | 3.2 |
1. | The Company presents the fair value of its put and call options on a net basis on the consolidated statements of financial position. The Company has a legally enforceable right to set off the amounts under its option contracts and intends to settle on a net basis. |
41 |
14. Share capital
At December 31, 2018, the Company had unlimited authorized common shares and 579.1 million common shares outstanding.
(a) No par value common shares issued
Number of shares | ||
(in millions of U.S. dollars, except where noted) | (000s) | $ |
No par value common shares issued | ||
Balance at December 31, 2016 | 513,709 | 2,859.0 |
Issuance of common shares on equity offering(1) | 61,740 | 166.6 |
Issuance of common shares under First Nations agreements | 2,767 | 9.5 |
Exercise of options and vested performance share units | 420 | 1.4 |
Balance at December 31, 2017 | 578,636 | 3,036.5 |
Issuance of common shares under First Nations agreements | 113 | 0.3 |
Exercise of options and vested performance share units | 366 | 0.3 |
Reversal of deferred tax recovery(1) | - | (1.9) |
Balance at December 31, 2018 | 579,115 | 3,035.2 |
1. | On March 10, 2017, the Company closed a bought deal financing and related agreements and issued 61.7 million common shares at a price of $2.80 per share. Proceeds of $172.9 million are included within equity net of equity issuance costs of $8.2 million and the associated deferred tax recovery of $1.9 million. This deferred tax recovery was reversed in 2018. |
(b) Share-based payment expenses
The following table summarizes share-based payment expenses:
Year ended December 31 | ||
(in millions of U.S. dollars) | 2018 | 2017 |
Share-based payment expenses | ||
Stock option expense (i) | 1.4 | 2.6 |
Performance share unit expense | 0.1 | 1.4 |
Restricted share unit expense(1) | (0.3) | 0.6 |
Deferred share unit expense | (0.8) | 1.0 |
Shares issued under First Nations agreements(1) | 0.3 | 2.1 |
Total share-based payment expenses | 0.7 | 7.7 |
1. | For the year ended December 31, 2018 $nil of share-based payment expenses were recognized in operating expenses (2017- $2.6 million). |
42 |
(i) Stock options
The following table presents changes in the Company’s stock option plan:
Number of options | Weighted average exercise price | |
(000s) | C$/share | |
Changes to the Company’s stock option plan | ||
Balance at December 31, 2016 | 14,855 | 5.84 |
Granted | 1,957 | 3.88 |
Exercised | (235) | 3.31 |
Forfeited | (985) | 5.01 |
Expired | (2,505) | 8.87 |
Balance at December 31, 2017 | 13,087 | 5.08 |
Forfeited | (1,925) | 4.13 |
Expired | (2,534) | 8.22 |
Balance at December 31, 2018 | 8,628 | 4.39 |
(c) Loss per share
The following table sets out the calculation of loss per share:
Year ended December 31 | ||
(in millions of U.S. dollars, except where noted) | 2018 | 2017 |
Calculation of EARNINGS per share | ||
Loss from continuing operations | (1,070.8) | (158.0) |
Net loss | (1,225.7) | (108.0) |
Basic weighted average number of shares outstanding (in millions) |
578.7 | 564.7 |
Dilution of securities: | ||
Stock options | - | - |
Diluted weighted average number of shares outstanding (in millions) |
578.7 | 564.7 |
Loss from continuing operations per share: | ||
Basic | (1.85) | (0.28) |
Diluted | (1.85) | (0.28) |
Net loss per share: | ||
Basic | (2.12) | (0.19) |
Diluted | (2.12) | (0.19) |
43 |
The following table lists the equity securities excluded from the calculation of diluted loss per share. Equity securities are excluded when their respective exercise prices exceeded the average market price of the Company’s common shares of C$2.32 for the year ended December 31, 2018 (2017 –C$4.22). Additionally, all stock options are excluded from the calculation of diluted earnings per share when the Company is in a net loss position.
Year ended December 31 | ||
(in millions of units) | 2018 | 2017 |
Equity securities excluded from the calculation of diluted earnings per share | ||
Stock options | 8.6 | 13.1 |
15. Discontinued operations
(a) Peak Mines
In the third quarter of 2017, Peak Mines met the criteria as a discontinued operation under IFRS 5. The Company completed the sale of Peak Mines in early April 2018.
Prior to the completion of the sale, the Company measured the asset group at the lower of carrying value and fair value less costs to sell (“FVLCS”). The net loss from discontinued operations of $0.8 million for the year ended December 31, 2018 reflects the change in estimated FVLCS as at December 31, 2017 to the final purchase consideration received, less disposal costs incurred in the period. The loss from discontinued operations can be reconciled as follows:
(in millions of U.S. dollars) | |
Reconciliation of loss from discontinued operations | |
Carrying value of net assets held for sale as at December 31, 2017 | 46.2 |
Gross proceeds from sale of Peak Mines | 58.3 |
Disposal costs incurred in the period | (2.6) |
Other closure adjustments | (10.3) |
Total FVLCS(1) | 45.4 |
Loss from discontinued operations, net of tax for the year ended December 31, 2018 | (0.8) |
1. | In the fourth quarter of 2017, in conjunction with the sale agreement, the Company received a $3.0 million prepayment from the buyer which was recorded as a deferred benefit on the statement of financial position. This deferred benefit was recognized into loss from discontinued operations upon completion of the sale. |
44 |
(b) Mesquite
In September 2018, the Company announced that it has entered into an agreement to sell Mesquite and as a result Mesquite met the criteria as a discontinued operation under IFRS 5. The Company completed the sale of Mesquite in October 2018.
For the year ended December 31, 2018 and prior-year comparative periods, the net earnings from Mesquite is reported as earnings from discontinued operations. Prior to the completion of the sale, the Company measured the asset group at the lower of carrying value and FVLCS. The change in the net loss from discontinued operations from the amount reported at September 30, 2018 reflects the change in estimated FVLCS to the final purchase consideration received, less disposal costs incurred in the period.
Upon execution of the sale, the Company received $158.0 million in cash and incurred $0.9 million in disposal costs. In addition to the net cash proceeds, the purchase consideration includes a working capital receivable of $11.2 million due from the purchaser. This working capital receivable includes $7.3 million in cash and cash equivalents which was not classified as an asset held-for-sale as at September 30, 2018, but was disposed of upon completion of the sale. As a result, the net cash received for the sale of Mesquite for the year ended December 31, 2018 was $149.8 million. This working capital receivable will be collected in Q1 2019. Additionally, the expected purchase consideration includes an estimate for a receivable from the purchaser related to income tax refunds that were recoverable by Mesquite at the date of the sale. The estimated fair value of this receivable as at December 31, 2018 is $8.5 million. The Company has recognized this receivable as a non-current financial asset and will subsequently remeasure this financial asset at fair value at each reporting period date, with changes in the fair value being presented in other gains and losses.
The loss from discontinued operations can be reconciled as follows:
(in millions of U.S. dollars) | |
Reconciliation of loss from discontinued operations | |
Loss from discontinued operations, net of tax for the nine months ended September 30, 2018 | (153.4) |
Carrying value of net assets held for sale as at September 30, 2018 | 170.2 |
Gross proceeds from sale of Mesquite | 158.0 |
Disposal costs incurred | (0.9) |
Working capital proceeds due, excluding cash and cash equivalents that were not classified as held-for-sale | 3.9 |
Proceeds due from income tax refunds at Mesquite(1) | 8.5 |
Total FVLCS | 169.5 |
Earnings from discontinued operations, net of tax for the three months ended December 31, 2018 | (0.7) |
Loss from discontinued operations, net of tax for the year ended December 31, 2018 | (154.1) |
1. | Proceeds due from income tax refunds at Mesquite are included in other non-current assets on the consolidated statement of financial position. |
45 |
The net (loss) earnings from Mesquite for the year ended December 31, 2018 and prior-year comparative periods are as follows:
Year ended December 31 | ||
(in millions of U.S. dollars, except per share amounts) | 2018 | 2017 |
Revenues | 146.1 | 215.7 |
Operating expenses | 95.6 | 122.7 |
Depreciation and depletion(1) | 35.4 | 60.2 |
Revenue less cost of goods sold | 15.1 | 32.8 |
Finance income | 0.4 | - |
Finance costs | (0.4) | (0.4) |
Other losses | - | (7.4) |
Impairment loss on held-for-sale assets | (253.1) | - |
(Loss) earnings before taxes | (238.0) | 25.0 |
Income tax recovery (expense) | 83.9 | 31.3 |
(Loss) earnings from discontinued operations
|
(154.1) | 56.3 |
1. | Depreciation and depletion relates to Mesquite prior to reclassification as a discontinued operation. |
The following table provides details of the cash flow from operating, investing and financing activities of Mesquite for the year ended December 31, 2018 and prior-year comparative periods:
Year ended December 31 | ||
(in millions of U.S. dollars) | 2018 | 2017 |
Operating activities | ||
(Loss) earnings from discontinued operations | (154.1) | 56.3 |
Adjustments for: | ||
Depreciation and depletion | 35.4 | 60.2 |
Other non-cash adjustments | - | 7.4 |
Income tax (recovery) expense | (83.9) | (31.3) |
Finance income | (0.4) | - |
Finance costs | 0.4 | 0.4 |
Impairment loss on held-for-sale assets | 253.1 | - |
50.5 | 93.0 | |
Change in non-cash operating working capital | (15.9) | (2.9) |
Income taxes received (paid) | 2.6 | (12.2) |
Cash generated from operations | 37.2 | 77.9 |
Investing activities | ||
Mining interests | (4.5) | (12.8) |
Interest received | 0.4 | - |
Cash used by investing activities | (4.1) | (12.8) |
Change in cash and cash equivalents | 33.1 | 65.1 |
46 |
16. Income and mining taxes
The following table outlines the composition of income tax expense between current tax and deferred tax:
Year ended December 31 | ||
(in millions of U.S. dollars) | 2018 | 2017 |
Current income and mining tax expense | ||
Canada | 4.2 | 2.8 |
Foreign | (0.1) | 0.9 |
Adjustments in respect of prior year | - | 0.1 |
4.1 | 3.8 | |
Deferred income and mining tax (recovery) expense | ||
Canada | (34.0) | (87.7) |
Foreign | - | 0.6 |
Adjustments in respect of prior year | 4.7 | (1.3) |
(29.3) | (88.4) | |
Total income tax (recovery) expense | (25.2) | (84.6) |
Income tax expense differs from the amount that would result from applying the Canadian federal and provincial income tax rates to earnings before taxes. The differences result from the following items:
Year ended December 31 | ||
(in millions of U.S. dollars) | 2018 | 2017 |
Loss before taxes | (1,096.0) | (242.6) |
Canadian federal and provincial income tax rates | 26.3% | 26.3% |
Income tax recovery based on above rates | (288.2) | (63.8) |
Increase (decrease) due to | ||
Permanent differences | 58.3 | 1.1 |
Different statutory tax rates on earnings of foreign subsidiaries | (4.1) | (18.1) |
Foreign exchange on non-monetary assets and liabilities | 0.4 | (7.4) |
Other foreign exchange differences | (3.2) | (0.8) |
Prior years’ adjustments relating to tax provision and tax returns | 4.7 | (1.0) |
Canadian mining tax | 11.8 | 10.9 |
Mexican special duty tax | - | 0.3 |
Withholding tax | - | 0.1 |
Change in tax rate | - | 1.1 |
Change in unrecognized deferred tax assets | 210.0 | 1.8 |
Disposal of El Morro gold stream asset | - | (8.4) |
Sale of Peak and Mesquite | (15.1) | - |
Other | 0.2 | (0.4) |
Income tax recovery | (25.2) | (84.6) |
47 |
The following tables provide analysis of the deferred tax assets and liabilities as at December 31, 2018:
As at December 31, 2018 | |||||
(in millions of U.S. dollars) | Canada | USA | Australia | Mexico | Total |
Deferred tax assets | |||||
Unused non-capital losses | - | - | - | - | - |
Capital losses | 37.0 | - | - | - | 37.0 |
Mining interests | 52.3 | - | - | - | 52.3 |
Property, plant and equipment | 39.4 | - | - | - | 39.4 |
Gold stream obligation | 7.4 | - | - | - | 7.4 |
Investment tax credits / government assistance | 46.3 | - | - | - | 46.3 |
Alternative minimum tax credits | 1.3 | - | - | - | 1.3 |
Decommissioning obligations | 19.1 | - | - | - | 19.1 |
Derivative Instruments/Hedging | (0.2) | - | - | - | (0.2) |
Ontario Mining Tax | 53.9 | - | - | - | 53.9 |
Accrued liabilities and provisions | 0.2 | - | - | - | 0.2 |
Other | 4.7 | - | - | - | 4.7 |
261.4 | - | - | - | 261.4 | |
Deferred tax liabilities | |||||
Mining interests | - | - | - | - | - |
Property, plant and equipment | - | - | - | - | - |
Investment tax credits / government assistance | - | - | - | - | - |
Decommissioning obligations | - | - | - | - | - |
British Columbia Mining Tax | (41.5) | - | - | - | (41.5) |
Mexican Mining Royalty | - | - | - | - | - |
Other | - | - | - | - | - |
(41.5) | - | - | - | (41.5) | |
Unrecognized deferred tax asset | (261.4) | - | - | - | (261.4) |
Deferred income tax liabilities, net | (41.5) | - | - | - | (41.5) |
48 |
As at December 31, 2017 | |||||
(in millions of U.S. dollars) | Canada | USA | Australia(1) | Mexico | Total |
Deferred tax assets | |||||
Unused non-capital losses | - | 3.5 | - | - | 3.5 |
Property, plant and equipment | 60.6 | - | - | - | 60.6 |
Gold stream obligation | 24.3 | - | - | - | 24.3 |
Investment tax credits / government assistance | 18.2 | - | - | - | 18.2 |
Alternative minimum tax credits | - | 27.0 | - | - | 27.0 |
Decommissioning obligations | 22.2 | - | - | - | 22.2 |
Derivative Instruments/Hedging | 2.9 | - | - | - | 2.9 |
Ontario Mining Tax | 6.1 | - | - | - | 6.1 |
Accrued liabilities and provisions | 1.3 | (0.1) | - | - | 1.2 |
Other | 5.6 | - | - | - | 5.6 |
141.2 | 30.4 | - | - | 171.6 | |
Deferred tax liabilities | |||||
Mining interests | (144.5) | (29.3) | - | - | (173.8) |
Property, plant and equipment | - | (24.0) | - | - | (24.0) |
Investment tax credits / government assistance | - | - | - | - | - |
Decommissioning obligations | - | (5.7) | - | - | (5.7) |
British Columbia Mining Tax | (36.6) | - | - | - | (36.6) |
Mexican Mining Royalty | - | - | - | (0.1) | (0.1) |
Other | (6.4) | (3.7) | - | - | (10.1) |
(187.5) | (62.7) | - | (0.1) | (250.3) | |
Deferred income tax liabilities, net | (46.3) | (32.3) | - | (0.1) | (78.7) |
1. | As at December 31, 2017, the deferred tax asset and deferred tax liability at Peak Mines are included in assets held-for-sale and liabilities held-for-sale, respectively. |
The following table outlines the movement in the net deferred tax liabilities:
|
Year ended December 31 | |
(in millions of U.S. dollars) | 2018 | 2017 |
Movement in the net deferred tax liabilities | ||
Balance at the beginning of the year | (78.7) | (230.3) |
Recognized in net loss | 29.4 | 139.2 |
Recognized in other comprehensive income | (23.5) | 1.8 |
Recognized as reduction in mineral properties | - | (43.6) |
Recognized as foreign exchange | (1.3) | 50.3 |
Other | 0.6 | 2.0 |
Reclassified as held-for-sale or disposed of | 32.0 | 1.9 |
Total movement in the net deferred tax liabilities | (41.5) | (78.7) |
49 |
Deferred income tax assets are recognized for tax loss carry-forwards to the extent that the realization of the related tax benefit through future taxable profits is probable. The Company did not recognize deductible temporary differences on the following losses by country:
· | Canadian capital loss carry-forwards of $146.0 million with no expiry date; and |
· | Other loss carry-forwards of $40.3 million with varying expiry dates. |
In addition to the above, the Company did not recognize net deductible temporary differences and tax credits in the amount of $783.9 million for income taxes (2017 - $196.6 million) and $634.6 million for mining taxes (2017 - $nil) on other temporary differences.
The Company recognizes deferred taxes by taking into account the effects of local enacted tax legislation. Deferred tax assets are fully recognized when the Company concludes that sufficient positive evidence exists to demonstrate that it is probable that a deferred tax asset will be realized. In order to determine whether an asset can be recognized, it must be considered probable that an entity will have sufficient taxable profits available in the future to enable recovery of the asset. IAS 12 states that an entity will have sufficient taxable profits available in the future to enable the recovery of the asset when:
· | There are sufficient taxable temporary differences relating to the same tax authority and the same taxable entity that are expected to reverse either in the same period as the expected reversal of the deductible temporary difference or in periods into which a tax loss arising from the deferred tax asset that can be carried back or forward; |
· | It is probable that the entity will have sufficient taxable profit relating to the same tax authority and the same taxable entity, in the same period as the reversal of the deductible temporary difference (or in the periods into which a tax loss arising from the deferred tax asset can be carried back or forward). In making this evaluation taxable amounts arising from deductible temporary differences that are expected to originate in future periods should be ignored because these will need further future taxable profits in order to be utilized. |
· | Tax planning opportunities that are available to the entity that will create taxable profit in appropriate periods. |
Future income is impacted by changes in market gold, copper and silver prices as well as forecasted future costs and expenses to produce gold and copper reserves. In addition, the quantities of proven and probable gold and copper reserves, market interest rates and foreign currency exchange rates also impact future levels of taxable income. Any change in any of these factors will result in an adjustment to the recognition of deferred tax assets to reflect the Company's latest assessment of the amount of deferred tax assets that is probable will be realized.
50 |
17. Reclamation and closure cost obligations
Changes to the reclamation and closure cost obligations are as follows:
(in millions of U.S. dollars) | Rainy River |
New Afton |
Mesquite | Peak Mines |
Cerro San Pedro |
Blackwater | Total |
Changes to reclamation and closure cost obligations | |||||||
Balance – December 31, 2016 | 20.0 | 7.6 | 13.6 | 13.7 | 18.1 | 8.9 | 81.9 |
Reclamation expenditures | - | (0.2) | - | (0.1) | (1.0) | (0.1) | (1.4) |
Unwinding of discount | 0.4 | 0.2 | 0.3 | 0.4 | 0.2 | 0.2 | 1.7 |
Revisions to expected cash flows | 41.4 | 3.2 | 6.6 | 3.1 | 1.2 | (0.3) | 55.2 |
Foreign exchange movement | 1.6 | 0.8 | - | 1.1 | 0.7 | 0.7 | 4.9 |
Less: amounts reclassified as held for sale | - | - | - | (18.2) | - | - | (18.2) |
Balance – December 31, 2017 | 63.4 | 11.6 | 20.5 | - | 19.2 | 9.4 | 124.1 |
Less: current portion of closure costs (Note 5) | - | - | (0.2) | - | (2.4) | - | (2.6) |
Non-current portion of closure costs | 63.4 | 11.6 | 20.3 | - | 16.8 | 9.4 | 121.5 |
Balance – December 31, 2017 | 63.4 | 11.6 | 20.5 | - | 19.2 | 9.4 | 124.1 |
Reclamation expenditures | (0.3) | - | - | - | (0.9) | - | (1.2) |
Unwinding of discount | 1.5 | 0.2 | 0.4 | - | 0.1 | 0.2 | 2.4 |
Revisions to expected cash flows | (6.1) | (0.3) | (0.9) | - | 1.5 | (0.5) | (6.3) |
Foreign exchange movement | (4.9) | (0.8) | - | - | 0.1 | (0.8) | (6.4) |
Less: amounts reclassified as held for sale and sold | - | - | (20.0) | - | - | - | (20.0) |
Balance – December 31, 2018 | 53.6 | 10.7 | - | - | 20.0 | 8.3 | 92.6 |
Less: current portion of closure costs (Note 5) | - | - | - | (6.5) | - | (6.5) | |
Non-current portion of closure costs | 53.6 | 10.7 | - | - | 13.5 | 8.3 | 86.1 |
Each period the Company reviews cost estimates and other assumptions used in the valuation of the obligations at each of its mining properties and development properties to reflect events, changes in circumstances and new information available. Changes in these cost estimates and assumptions have a corresponding impact on the fair value of the obligation. The fair values of the obligations are measured by discounting the expected cash flows using a discount factor that reflects the risk-free rate of interest. The Company prepares estimates of the timing and amount of expected cash flows when an obligation is incurred. Expected cash flows are updated to reflect changes in facts and circumstances. The principal factors that can cause expected cash flows to change are: the construction of new processing facilities; obligations realized through additional ore bodies mined; changes in the quantities of material in reserves and a corresponding change in the LOM plan; changing ore characteristics that impact required environmental protection measures and related costs; changes in water quality that impact the extent of water treatment required; and changes in laws and regulations governing the protection of the environment. The fair value of an obligation is recorded when it is incurred.
The majority of the expenditures are expected to occur between 2019 and 2031. The discount rates used in estimating the site reclamation and closure cost obligations were between 1.9% and 7.1% for the year ended December 31, 2018 (2017 – 1.9% and 6.0%), and the inflation rate used was between 1.4% and 3.3% for the year ended December 31, 2018 (2017 – 1.7% and 3.3%).
51 |
Regulatory authorities in certain jurisdictions require that security be provided to cover the estimated reclamation and remediation obligations. As at December 31, 2018, letters of credit totalling $110.8 million (2017 - $137.8 million) had been issued to various regulatory agencies to satisfy financial assurance requirements for this purpose. The letters of credit are secured by the revolving Credit Facility (Note 11 (c)), and the annual fees are 1.50% of the value of the outstanding letters of credit.
18. Supplemental cash flow information
Supplemental cash flow information (included within operating activities) is as follows:
Year ended December 31 | ||
(in millions of U.S. dollars) | 2018 | 2017 |
Change in non-cash operating working capital | ||
Trade and other receivables | (5.4) | 15.6 |
Inventories | (53.1) | 3.2 |
Prepaid expenses and other | (0.6) | (1.0) |
Trade and other payables | (12.5) | 26.0 |
Total change in non-cash operating working capital | (71.6) | 43.8 |
Year ended December 31 | ||
(in millions of U.S. dollars) | 2018 | 2017 |
other Non-cash adjustments | ||
Unrealized gain on share purchase warrants | - | (1.2) |
Unrealized (gain) loss on concentrate contracts | 0.7 | 1.9 |
Equity settled share-based payment expense | 2.7 | 5.7 |
Loss (gain) on disposal of assets | 0.3 | (0.3) |
Settlement and (gain) loss on revaluation of gold price option contracts | 4.8 | 6.5 |
Unrealized (gain) loss on gold stream obligation | (11.7) | 21.8 |
Unrealized (gain) loss on copper forward contracts and copper price option contracts | (4.8) | 4.4 |
Inventory write-downs | 15.8 | - |
Revaluation of CSP’s reclamation and closure cost obligation | 1.0 | - |
Other non-cash adjustments | 0.2 | 0.2 |
Total other non-cash adjustments | 9.0 | 39.0 |
52 |
19. Segmented information
(a) Segment revenues and results
The Company manages its reportable operating segments by operating mines, development projects and exploration projects. Operating results of reportable operating segments are reviewed by the Company's chief operating decision maker ("CODM") to make decisions about resources to be allocated to the segments and to assess their performance. The results from operations for these reportable operating segments are summarized in the following tables:
Year ended December 31, 2018 | |||||||
(in millions of U.S. dollars) | Rainy River |
New Afton |
Cerro San Pedro |
Corporate | Other(1) | Discontinued Operations(3) |
Total |
Operating segment results | |||||||
Gold revenues | 270.6 | 83.8 | 13.8 | - | - | - | 368.2 |
Copper revenues | - | 226.1 | - | - | - | - | 226.1 |
Silver revenues | 3.8 | 4.2 | 2.2 | - | - | - | 10.2 |
Total revenues(2) | 274.4 | 314.1 | 16.0 | - | - | - | 604.5 |
Operating expenses | 179.9 | 104.3 | 41.2 | - | - | - | 325.4 |
Depreciation and depletion | 78.3 | 158.2 | 3.4 | - | - | - | 239.9 |
Revenue less cost of goods sold | 16.2 | 51.6 | (28.6) | - | - | - | 39.2 |
Corporate administration | - | - | - | 23.2 | - | - | 23.2 |
Corporate restructuring(4) | - | - | - | 4.1 | - | - | 4.1 |
Share-based payment expenses | - | - | - | 0.7 | - | - | 0.7 |
Asset impairment | 836.6 | - | - | - | 218.2 | - | 1,054.8 |
Exploration and business development | 0.5 | 0.5 | - | 1.9 | 0.1 | - | 3.0 |
(Loss) income from operations | (820.9) | 51.1 | (28.6) | (29.9) | (218.3) | - | (1,046.6) |
Finance income | 0.2 | 0.1 | 0.1 | 1.1 | - | - | 1.5 |
Finance costs | (3.0) | (1.4) | (0.8) | (63.6) | (0.2) | - | (69.0) |
Other gains (losses) | 12.1 | (0.8) | (0.5) | 7.1 | 0.2 | - | 18.1 |
(Loss) earnings before taxes | (811.6) | 49.0 | (29.8) | (85.3) | (218.3) | - | (1,096.0) |
Income tax recovery (expense) | (39.6) | 31.3 | 0.1 | 0.9 | 32.5 | - | 25.2 |
(Loss) earnings from continuing operations | (851.2) | 80.3 | (29.7) | (84.4) | (185.8) | - | (1,070.8) |
Loss from discontinued operations, net of tax | - | - | - | - | - | (154.9) | (154.9) |
Net (loss) earnings | (851.2) | 80.3 | (29.7) | (84.4) | (185.8) | (154.9) | (1,225.7) |
1. | Other includes balances relating to the development and exploration properties that have no revenues or operating costs. |
2. | Segmented revenue reported above represents revenue generated from external customers. There were no inter-segment sales in the year ended December 31, 2018. |
3. | Refer to Note 15 for further information on discontinued operations. |
4. | In 2018, the Company recognized a restructuring charge of approximately $4.1 million in severance and other termination benefits related to changes at the executive leadership level of the organization. |
53 |
Year ended December 31, 2017 | |||||||
(in millions of U.S. dollars) | Rainy River |
New Afton | Cerro San Pedro |
Corporate | Other(1) | Discontinued Operations(3) |
Total |
Operating segment results | |||||||
Gold revenues | 33.6 | 94.1 | 42.5 | - | - | - | 170.2 |
Copper revenues | - | 203.8 | - | - | - | - | 203.8 |
Silver revenues | 0.7 | 4.1 | 9.9 | - | - | - | 14.7 |
Total revenues(2) | 34.3 | 302.0 | 52.4 | - | - | - | 388.7 |
Operating expenses | 38.5 | 107.1 | 52.7 | - | - | - | 198.3 |
Depreciation and depletion | 14.1 | 139.3 | 6.7 | - | - | - | 160.1 |
Revenue less cost of goods sold | (18.3) | 55.6 | (7.0) | - | - | - | 30.3 |
Corporate administration | - | - | - | 23.7 | - | - | 23.7 |
Corporate restructuring(4) | - | - | - | 4.2 | - | - | 4.2 |
Share-based payment expenses | - | - | - | 5.1 | - | - | 5.1 |
Asset impairment | 268.4 | - | - | - | - | - | 268.4 |
Exploration and business development | 2.2 | 1.4 | - | 0.6 | 2.2 | - | 6.4 |
(Loss) income from operations | (288.9) | 54.2 | (7.0) | (33.6) | (2.2) | - | (277.5) |
Finance income | - | - | 0.2 | 0.9 | - | - | 1.1 |
Finance costs | (1.7) | (1.0) | (0.5) | (9.4) | (0.2) | - | (12.8) |
Other gains (losses) | 12.2 | 2.4 | (1.2) | 0.3 | 32.9 | - | 46.6 |
(Loss) earnings before taxes | (278.4) | 55.6 | (8.5) | (41.8) | 30.5 | - | (242.6) |
Income tax (expense) recovery | 86.0 | (0.2) | (0.7) | 2.9 | (3.4) | - | 84.6 |
(Loss) earnings from continuing operations | (192.4) | 55.4 | (9.2) | (38.9) | 27.1 | - | (158.0) |
Earnings from discontinued operations, net of tax | - | - | - | - | - | 50.0 | 50.0 |
Net earnings (loss) | (192.4) | 55.4 | (9.2) | (38.9) | 27.1 | 50.0 | (108.0) |
1. | Other includes balances relating to the development and exploration properties that have no revenues or operating costs. |
2. | Segmented revenue reported above represents revenue generated from external customers. There were no inter-segment sales in the year ended December 31, 2017. |
3. | Refer to Note 15 for further information on discontinued operations |
4. | In 2017, the Company recognized a restructuring charge of approximately $4.2 million in severance and other termination benefits related to restructuring its corporate office workforce. |
54 |
(b) Segmented assets and liabilities
The following table presents the segmented assets and liabilities:
Total assets | Total liabilities | Capital expenditures(1) | ||||
As at December 31 |
As at December 31 |
As at December 31 |
As at December 31 |
Year ended December 31 | ||
(in millions of U.S. dollars) | 2018 | 2017 | 2018 | 2017 | 2018 | 2017 |
Segmented assets and liabilities | ||||||
Rainy River | 986.0 | 1,774.2 | 313.6 | 454.4 | 170.6 | 499.3 |
New Afton | 730.9 | 874.5 | 61.4 | 147.8 | 35.9 | 42.2 |
Mesquite | - | 482.3 | - | 96.3 | - | - |
Cerro San Pedro | 12.8 | 43.9 | 25.8 | 26.7 | - | 0.7 |
Blackwater | 341.4 | 560.8 | 16.4 | 56.9 | 7.3 | 11.3 |
Other(2) | 98.5 | 172.6 | 793.1 | 1,032.9 | 0.1 | 0.7 |
2,169.6 | 3,908.3 | 1,210.3 | 1,815.0 | 213.9 | 554.2 | |
Assets and liabilities held for sale and capital expenditures from discontinued operations (Note 15) | - | 109.0 | - | 62.8 | 13.2 | 47.5 |
Total assets, liabilities and capital expenditures | 2,169.6 | 4,017.3 | 1,210.3 | 1,877.8 | 227.1 | 601.7 |
1. | Capital expenditures per consolidated statement of cash flows. |
2. | Other includes corporate balance and exploration properties. |
(c) Geographical information
The Company operates in two principal geographical areas - Canada (country of domicile) and Mexico. The Company previously operated in the United States and Australia. The Company's revenue by location of operations and information about the Company’s non-current assets by location of assets are detailed below for the years ended December 31, 2018 and 2017.
Revenue(1) | Non-current assets(2) | |||
(in millions of U.S. dollars) | 2018 | 2017 | 2018 | 2017 |
Revenue and non-current assets by location | ||||
Canada | 588.5 | 336.3 | 1,868.3 | 2,971.0 |
United States(3) | - | - | - | 302.4 |
Australia(3) | - | - | - | 85.3 |
Mexico | 16.0 | 52.4 | - | 5.1 |
Other | - | - | - | 0.6 |
Total | 604.5 | 388.7 | 1,868.3 | 3,364.4 |
1. | Presented based on the location in which the sale originated. |
2. | Non-current assets exclude financial instruments (investments, reclamation deposits and other) and deferred tax assets. |
3. | For the years ended December 31, 2018 and 2017, revenue from Peak Mines and Mesquite is included in earnings from discontinued operations. |
55 |
(d) Information about major customers
The following table presents sales to individual customers exceeding 10% of annual sales for the following periods. The following five customers represent 79% (2017 – three customers representing 68%) of the Company’s sales revenue for the years ended December 31.
Year ended December 31 | ||
(in millions of U.S. dollars) | 2018 | |
Customer | Reporting segment | |
1 | Rainy River | 137.9 |
2 | New Afton | 109.9 |
3 | New Afton | 94.2 |
4 | Rainy River | 78.0 |
5 | New Afton | 70.7 |
Total sales to customers exceeding 10% of annual sales(2) | 490.7 |
Year ended December 31 | ||
(in millions of U.S. dollars) | 2017 | |
Customer | Reporting segment | |
1 | New Afton | 125.5 |
2 | New Afton | 99.8 |
3 | Rainy River(1) | 34.3 |
Cerro San Pedro (1) | 4.4 | |
Total sales to customers exceeding 10% of annual sales(2) | 264.0 |
1. | For the year ended December 31, 2017, Rainy River and Cerro San Pedro sold to the same customer. |
2. | Amounts presented exclude sales generated from Peak Mines and Mesquite, which have been classified as discontinued operations. |
The Company is not economically dependent on a limited number of customers for the sale of its product because gold and other metals can be sold through numerous commodity market traders worldwide. Refer to Note 21(a) for further discussion on the Company’s exposure to credit risk.
56 |
20. Capital risk management
The Company manages its capital to ensure that it will be able to continue as a going concern while maximizing the return to stakeholders through the optimization of the debt and equity balance.
In the management of capital, the Company includes the components of equity, long-term debt, net of cash and cash equivalents, and investments.
Year ended December 31 | ||
(in millions of U.S. dollars) | 2018 | 2017 |
Capital (as defined above) is summarized as follows | ||
Equity | 959.3 | 2,139.5 |
Long-term debt | 780.5 | 1,007.7 |
1,739.8 | 3,147.2 | |
Cash and cash equivalents | (103.7) | (216.2) |
Total | 1,636.1 | 2,931.0 |
The Company manages the capital structure and makes adjustments to it in light of changes in economic conditions and the risk characteristics of the underlying capital instruments. To maintain or adjust the capital structure, the Company may issue new shares, restructure or issue new debt, acquire or dispose of assets or sell its investments.
In order to facilitate the management of its capital requirements, the Company prepares annual budgets that are updated as necessary depending on various factors, including successful capital deployment and general industry conditions. The annual budget is approved by the Board of Directors. The Company’s investment policy is to invest its surplus funds in permitted investments consisting of treasury bills, bonds, notes and other evidences of indebtedness of Canada, the United States or any of the Canadian provinces with a minimum credit rating of R-1 mid from the Dominion Bond Rating Service (“DBRS”) or an equivalent rating from Standard & Poor’s and Moody’s and with maturities of 12 months or less at the original date of acquisition. In addition, the Company is permitted to invest in bankers’ acceptances and other evidences of indebtedness of certain financial institutions. All investments must have a maximum term to maturity of 12 months and the average term will generally range from seven days to 90 days. Under the policy, the Company is not permitted to make investments in asset-backed commercial paper.
21. Financial risk management
The Company examines the various financial instrument risks to which it is exposed and assesses the impact and likelihood of those risks. These risks may include credit risk, liquidity risk, market risk and other price risks. Where material, these risks are reviewed and monitored by the Board of Directors.
(a) Credit risk
Credit risk is the risk of an unexpected loss if a party to the Company’s financial instruments fails to meet its contractual obligations. The Company’s financial assets are primarily composed of cash and cash equivalents, and trade and other receivables. Credit risk is primarily associated with trade and other receivables; however, it also arises on cash and cash equivalents, gold and copper price options, and copper forward contracts. To mitigate exposure to credit risk, the Company has established policies to limit the concentration of credit risk, to ensure counterparties demonstrate minimum acceptable credit worthiness, and to ensure liquidity of available funds.
The Company closely monitors its financial assets and does not have any significant concentration of credit risk. The Company sells its gold exclusively to large international organizations with strong credit ratings. The historical level of customer defaults is minimal and, as a result, the credit risk associated with gold and copper concentrate trade receivables at December 31, 2018 is not considered to be high.
57 |
The Company’s maximum exposure to credit risk is as follows:
Year ended December 31 | ||
(in millions of U.S. dollars) | 2018 | 2017 |
Credit risk exposure | ||
Cash and cash equivalents | 103.7 | 216.2 |
Trade and other receivables | 35.9 | 27.1 |
Total financial instrument exposure to credit risk | 139.6 | 243.3 |
A significant portion of the Company’s cash and cash equivalents is held in large Canadian financial institutions. Short-term investments (including those presented as part of cash and cash equivalents) are composed of financial instruments issued by Canadian banks with high investment-grade ratings and the governments of Canada and the U.S.
The Company employs a restrictive investment policy as detailed in the capital risk management section, which is described in Note 20.
The aging of trade and other receivables is as follows:
As at December 31 | |||||||
(in millions of U.S. dollars) | 0-30 days |
31-60 days |
61-90 days |
91-120 days |
Over 120 days |
2018 Total |
2017 Total |
Aging trade and other receivables | |||||||
Rainy River | 4.5 | 3.8 | - | - | 0.5 | 8.8 | 17.3 |
New Afton | 5.6 | 0.4 | 1.6 | 0.7 | - | 8.3 | 1.4 |
Mesquite | - | - | - | - | - | - | 0.7 |
Cerro San Pedro | 3.8 | 0.3 | 0.2 | 0.3 | 0.5 | 5.1 | 6.3 |
Blackwater | - | - | - | - | 0.3 | 0.3 | 0.4 |
Corporate | 13.4 | - | - | - | - | 13.4 | 1.0 |
Total trade and other receivables | 27.3 | 4.5 | 1.8 | 1.0 | 1.3 | 35.9 | 27.1 |
The Company sells its gold and copper concentrate production from New Afton to four different customers under off-take contracts.
The Company is not economically dependent on a limited number of customers for the sale of its gold and other metals because gold and other metals can be sold through numerous commodity market traders worldwide.
(b) Liquidity risk
Liquidity risk is the risk that the Company will not be able to meet its financial obligations as they fall due. The Company manages liquidity risk through the management of its capital structure and financial leverage, as outlined in Note 20.
The following table shows the contractual maturities of debt commitments. The amounts presented represent the future undiscounted principal and interest cash flows, and therefore, do not equate to the carrying amounts on the consolidated statements of financial position.
58 |
As at December 31 | ||||||
(in millions of U.S. dollars) | < 1 year | 1-3 years | 4-5 years | After 5 years |
2018 Total |
2017 Total |
Debt commitments | ||||||
Trade and other payables | 112.6 | - | - | - | 112.6 | 153.7 |
Long-term debt | - | - | 500.0 | 300.0 | 800.0 | 1,030.0 |
Interest payable on long-term debt | 50.3 | 100.8 | 65.5 | 26.3 | 242.9 | 292.9 |
Gold stream obligation | 19.2 | 43.5 | 55.2 | 149.6 | 267.5 | 290.5 |
Total debt commitments | 182.1 | 144.3 | 620.7 | 475.9 | 1,423.0 | 1,767.1 |
The Company’s future operating cash flow and cash position are highly dependent on metal prices, including gold and copper, as well as other factors. Taking into consideration the Company’s current cash position, volatile equity markets, and global uncertainty in the capital markets, the Company is continually reviewing expenditures and assessing business opportunities to enhance liquidity in order to ensure adequate liquidity and flexibility to support its growth strategy, including the development of its projects, while continuing production at its current operations. A period of continuous low gold and copper prices may necessitate the deferral of capital expenditures which may impact the timing of development work and project completion, as well as production from mining operations. In addition, in such a price environment, the Company may be required to adopt one or more alternatives to increase liquidity.
59 |
(c) Currency Risk
The Company operates in Canada and Mexico. As a result, the Company has foreign currency exposure with respect to items not denominated in U.S. dollars. The three main types of foreign exchange risk for the Company can be categorized as follows:
(i) Transaction exposure
The Company’s operations sell commodities and incur costs in different currencies. This creates exposure at the operational level, which may affect the Company’s profitability as exchange rates fluctuate.
(ii) Exposure to currency risk
The Company is exposed to currency risk through the following assets and liabilities denominated in currencies other than the U.S. dollar: cash and cash equivalents, investments; accounts receivable, accounts payable and accruals, reclamation and closure cost obligations.
The currencies of the Company’s financial instruments and other foreign currency denominated liabilities, based on notional amounts, were as follows:
As at December 31, 2018 | ||
(in millions of U.S. dollars) | CAD | MXN |
Exposure to currency risk | ||
Cash and cash equivalents | 12.9 | 0.6 |
Trade and other receivables | 9.9 | 4.9 |
Income tax receivable | - | 4.6 |
Trade and other payables | (105.0) | (14.1) |
Deferred tax liability | (41.5) | - |
Reclamation and closure cost obligations | (72.6) | (13.5) |
Performance share units and restricted share units | (0.5) | - |
Total exposure to currency risk | (196.8) | (17.5) |
As at December 31, 2017 | |||
(in millions of U.S. dollars) | CAD | AUD | MXN |
Exposure to currency risk | |||
Cash and cash equivalents | 16.6 | 5.9 | 1.5 |
Trade and other receivables | 19.5 | - | 6.2 |
Income tax receivable | 0.4 | - | 4.2 |
Deferred tax asset | 130.5 | - | - |
Trade and other payables | (141.6) | - | (11.5) |
Deferred tax liability | (183.9) | - | (0.1) |
Reclamation and closure cost obligations | (84.6) | - | (11.7) |
Performance share units and restricted share units | (2.8) | (2.6) | - |
Total exposure to currency risk | (245.9) | 3.3 | (11.4) |
(iii) Translation exposure
The Company’s functional and reporting currency is U.S. dollars. The Company’s operations translate their operating results from the host currency to U.S. dollars. Therefore, exchange rate movements in the Canadian dollar and Mexican peso can have a significant impact on the Company’s consolidated operating results. A 10% strengthening (weakening) of the U.S. dollar against the following currencies would have decreased (increased) the Company’s net loss from the financial instruments presented by the amounts shown below.
60 |
Year ended December 31 | ||
(in millions of U.S. dollars) | 2018 | 2017 |
Impact of 10% change in foreign exchange rates | ||
Canadian dollar | 19.7 | 24.6 |
Australian dollar | - | (0.6) |
Mexican peso | 1.8 | 1.1 |
(d) Interest Rate Risk
Interest rate risk is the risk that the fair value or the future cash flows of a financial instrument will fluctuate because of changes in market interest rates. The majority of the Company’s outstanding debt obligations are fixed and are therefore not exposed to changes in market interest rates. The Credit Facility interest is variable and a 1% change in interest rates would result in a difference of approximately $1.5 million in interest paid for the year ended December 31, 2018.
The Company is exposed to interest rate risk on its cash and cash equivalents. Interest earned on cash and cash equivalents is based on prevailing money market and bank account interest rates which may fluctuate. A 1.0% change in the interest rate would result in a difference of approximately $1.0 million in interest earned by the Company for the year ended December 31, 2018 The Company has not entered into any derivative contracts to manage this risk.
(e) Metal and Input Price Risk
The Company’s earnings, cash flows and financial condition are subject to price risk due to fluctuations in the market price of gold, silver and copper.
For the year ended December 31, 2018, the Company’s revenue and cash flows were impacted by gold prices and copper prices. Metal price declines could cause continued development of, and production from, the Company’s properties to be uneconomic. There is a time lag between the shipment of gold and copper and final pricing, and changes in pricing can impact the Company’s revenue and working capital position. The Company’s exposure to changes in gold and copper prices has been significantly reduced as the Company has entered into gold and copper price option contracts (whereby it sold a series of call option contracts and purchased a series of put option contracts) to reduce exposure to changes in gold and copper prices. The details of the remaining contracts as at December 31, 2018 can be found in Note 13.
Reserve calculations and mine plans using significantly lower gold, silver, copper and other metal prices could result in significant reductions in mineral reserve and resource estimates and revisions in the Company’s life-of-mine plans, which in turn could result in material write-downs of its investments in mining properties and increased depletion, reclamation and closure charges. Depending on the price of gold or other metals, the Company may determine that it is impractical to commence or, if commenced, to continue commercial production at a particular site. Metal price fluctuations also create adjustments to the provisional prices of sales made in previous periods that have not yet been subject to final pricing, and these adjustments could have an adverse impact on the Company’s financial results and financial condition. Any of these factors could result in a material adverse effect on the Company’s results of operations and financial condition.
The Company is also subject to price risk for fluctuations in the cost of energy, principally electricity and purchased petroleum products. The Company’s costs are affected by the prices of commodities and other inputs it consumes or uses in its operations, such as lime, sodium cyanide and explosives. The prices of such commodities and inputs are influenced by supply and demand trends affecting the mining industry in general and other factors outside the Company’s control. Increases in the price for materials consumed in the Company’s mining and production activities could materially adversely affect its results of operations and financial condition.
61 |
An increase in gold and copper prices would decrease the Company’s net loss whereas an increase in fuel and electicity prices would increase the Company’s net loss. A 10% change in commodity prices and fuel and electricity prices would impact the Company’s net earnings before taxes and other comprehensive income before taxes as follows:
Year ended December 31, 2018 | Year ended December 31, 2017 | |||
(in millions of U.S. dollars) |
Net
|
Other Comprehensive Income |
Net Earnings |
Other Comprehensive Income |
Impact of 10% change in commodity prices | ||||
Gold price | 37.6 | - | 52.5 | - |
Copper price | 6.5 | - | 9.0 | - |
Fuel and electricity price | 5.5 | - | 4.6 | 0.3 |
62 |
22. Fair value measurement
Fair value is the price that would be received when selling an asset or paid to transfer a liability in an orderly transaction between market participants at the measurement date. In assessing the fair value of a particular contract, the market participant would consider the credit risk of the counterparty to the contract. Consequently, when it is appropriate to do so, the Company adjusts the valuation models to incorporate a measure of credit risk. Fair value represents management's estimates of the current market value at a given point in time.
The Company has certain financial assets and liabilities that are held at fair value. The fair value hierarchy establishes three levels to classify the inputs to valuation techniques used to measure fair value. Level 1 inputs are quoted prices (unadjusted) in active markets for identical assets or liabilities. Level 2 inputs are quoted prices in markets that are not active, quoted prices for similar assets or liabilities in active markets, inputs other than quoted prices that are observable for the asset or liability (for example, interest rate and yield curves observable at commonly quoted intervals, forward pricing curves used to value currency and commodity contracts), or inputs that are derived principally from or corroborated by observable market data or other means. Level 3 inputs are unobservable (supported by little or no market activity). The fair value hierarchy gives the highest priority to Level 1 inputs and the lowest priority to Level 3 inputs.
There were no transfers among Levels 1, 2 and 3 during the year ended December 31, 2018 or the year ended December 31, 2017. The Company’s policy is to recognize transfers into and transfers out of fair value hierarchy levels as of the date of the event or change in circumstances that caused the transfer.
Valuation methodologies for Level 2 and 3 financial assets and liabilities:
Provisionally priced contracts and gold and copper swap contracts
The fair value of the provisionally priced contracts and the gold and copper swap contracts is calculated using the mark-to-market forward prices of London Metals Exchange gold and copper based on the applicable settlement dates of the outstanding provisionally priced contracts and copper swap contracts.
Gold and copper price option contracts and copper forward contracts
The fair value of the gold and copper price option contracts and copper forward contracts are calculated using the mark-to-market method based on fair value prices obtained from the counterparties of the gold price option contracts, copper price option contracts and copper forward contracts.
Gold stream obligation
The fair value of the gold stream obligation is calculated using the risk-free interest rate derived from the U.S. Treasury rate, forward metal prices, company specific credit spread based on the yield on the Company’s 2025 Senior Unsecured Notes, and expected gold and silver ounces to be delivered from Rainy River’s life of mine model.
Proceeds due from income tax refunds at Mesquite
The proceeds due from income tax refunds at Mesquite is related to income tax refunds that were recoverable by Mesquite on the date of the sale of Mesquite. These income tax refunds are required to be paid to the Company once Mesquite receives these income tax refunds. The fair value of the income tax refund receivable is calculated based on the value of the income tax refunds that Mesquite is expected to receive, and an unsecured discount rate.
63 |
Performance share units (PSU)
The fair value of the PSU liability is calculated using the quantity of base options subject to cash settlement, the weighted-average three-year achieved performance ratio (calculated using the annualized return of the Company’s share price compared to the annualized return of the S&P Global Gold Index) and the expected share price at the end of the vesting period.
The following table summarizes the Company’s financial assets and liabilities by category and information about financial assets and liabilities measured at fair value on a recurring basis in the statement of financial position categorized by level of significance of the inputs used in making the measurements:
As at December 31, 2018 | As at December 31, 2017 | ||||
(in millions of U.S. dollars) | Category | Level | Level | ||
FINANCIAL ASSETS | |||||
Cash and cash equivalents | Financial assets at amortized cost | 103.7 | 216.2 | ||
Trade and other receivables | Financial assets at amortized cost | 36.6 | 29.0 | ||
Provisionally priced contracts | Financial instruments at FVTPL | 2 | (1.6) | 2 | 4.2 |
Gold and copper swap contracts | Financial instruments at FVTPL | 2 | 0.9 | 2 | (6.1) |
Copper price option contracts | Financial Instruments at FVTPL | 2 | 0.7 | 2 | - |
Proceeds due from income tax refunds at Mesquite(2) | Financial Instruments at FVTPL | 3 | 8.5 | 3 | - |
Investments | Financial instruments at FVTPL | 1 | 0.8 | 1 | 1.0 |
FINANCIAL LIABILITIES | |||||
Trade and other payables(1) | Financial liabilities at amortized cost | 101.3 | 146.0 | ||
Long-term debt | Financial liabilities at amortized cost | 780.5 | 1,007.7 | ||
Gold stream obligation | Financial instruments at FVTPL | 3 | 182.4 | 3 | 273.5 |
Performance share units | Financial instruments at FVTPL | 3 | 0.2 | 3 | 1.8 |
Restricted share units | Financial instruments at FVTPL | 1 | 0.3 | 1 | 0.8 |
Copper price option contracts | Financial instruments at FVTPL | 2 | - | 2 | 4.1 |
Gold price option contracts | Financial instruments at FVTPL | 2 | 4.8 | 2 | - |
1. | Trade and other payables exclude the short-term portion of reclamation and closure cost obligations and the short-term portion of the gold stream obligation. |
2. | Proceeds due from income tax refunds at Mesquite are included in other non-current assets on the consolidated statement of financial position. |
64 |
The carrying values and fair values of the Company’s financial instruments are as follows:
As at December 31, 2018 | As at December 31, 2017 | |||
(in millions of U.S. dollars) | Carrying value |
Fair value | Carrying value |
Fair value |
FINANCIAL ASSETS | ||||
Cash and cash equivalents | 103.7 | 103.7 | 216.2 | 216.2 |
Trade and other receivables | 36.6 | 36.6 | 29.0 | 29.0 |
Provisionally priced contracts | (1.6) | (1.6) | 4.2 | 4.2 |
Gold and copper swap contracts | 0.9 | 0.9 | (6.1) | (6.1) |
Investments | 0.8 | 0.8 | 1.0 | 1.0 |
Copper price option contracts | 0.7 | 0.7 | - | - |
Proceeds due from income tax refunds at Mesquite(2) | 8.5 | 8.5 | - | - |
FINANCIAL LIABILITIES | ||||
Trade and other payables(1) | 101.3 | 101.3 | 146.0 | 146.0 |
Long-term debt | 780.5 | 652.9 | 1,007.7 | 1,064.3 |
Gold stream obligation | 182.4 | 182.4 | 273.5 | 273.5 |
Performance share units | 0.2 | 0.2 | 1.8 | 1.8 |
Restricted share units | 0.3 | 0.3 | 0.8 | 0.8 |
Copper price option contracts | - | - | 4.1 | 4.1 |
Gold price option contracts | 4.8 | 4.8 | - | - |
1. | Trade and other payables exclude the short-term portion of reclamation and closure cost obligation and the short-term portion of the gold stream obligation. |
2. | Proceeds due from income tax refunds at Mesquite are included in other non-current assets on the consolidated statement of financial position. |
23. Operating leases
Non-cancellable operating lease rentals are payable as follows:
Year ended December 31 | ||
(in millions of U.S. dollars) | 2018 | 2017 |
Non-cancellable operating lease rentals | ||
Less than 1 year | 1.0 | 2.0 |
Between 1 and 5 years | 0.5 | 5.0 |
More than 5 years | - | 3.2 |
Total non-cancellable operating lease rentals | 1.5 | 10.2 |
For the year ended December 31, 2018, an amount of $4.4 million was recognized as an expense in respect of operating leases (2017 - $4.4 million).
65 |
24. Compensation of key management personnel
The remuneration of the Company’s key management personnel(1) was as follows:
Year ended December 31 | ||
(in millions of U.S. dollars) | 2018 | 2017 |
Key management personnel remuneration | ||
Short-term benefits(2) | 1.5 | 2.5 |
Share-based payments | - | 2.4 |
Termination benefits | 4.1 | 1.5 |
Total key management personnel remuneration | 5.6 | 6.4 |
1. | Key management personnel are those persons having authority and responsibility for planning, directing, and controlling the activities of the Company. |
2. | Short-term benefits include salaries, bonuses payable within twelve months of the statement of financial position date and other annual employee benefits. |
The remuneration of key executives is determined by the compensation committee having regard to the performance of individuals and market trends.
25. Commitments and contingencies
The Company has entered into a number of contractual commitments for capital items relating to operations and development. At December 31, 2018, these commitments totalled $27.2 million, $26.9 million of which is expected to fall due over the next 12 months. This compares to commitments of $51.4 million as at December 31, 2017, $48.5 million of which was expected to fall due over the upcoming year. Certain contractual commitments may contain cancellation clauses; however, the Company discloses its commitments based on management’s intent to fulfill the contracts.
66 |
Exhibit 3
MANAGEMENT DISCUSSION AND ANALYSIS
All dollar figures are in United States dollars and tabular dollar amounts are in millions, unless otherwise noted.
For the year ended December 31, 2018
The following Management’s Discussion and Analysis (“MD&A”) provides information that management believes is relevant to an assessment and understanding of the consolidated financial condition and results of operations of New Gold Inc. and its subsidiaries (“New Gold” or the “Company”). This MD&A should be read in conjunction with New Gold’s consolidated financial statements for the years ended December 31, 2018 and 2017 and related notes, which are prepared in accordance with International Financial Reporting Standards (“IFRS”) as issued by the International Accounting Standards Board (“IASB”). This MD&A contains forward-looking statements that are subject to risks and uncertainties, as discussed in the cautionary note contained in this MD&A. The reader is cautioned not to place undue reliance on forward-looking statements. All dollar figures are in United States dollars and tabular dollar amounts are in millions, unless otherwise noted. This MD&A has been prepared as at February 13, 2019. Additional information relating to the Company, including the Company’s Annual Information Form, is available on SEDAR at www.sedar.com.
OUR BUSINESS
New Gold is a Canadian-focused intermediate gold mining Company. The Company has a portfolio of two core producing assets in a leading jurisdiction, the Rainy River gold mine (“Rainy River”) and New Afton gold-copper mine (“New Afton”) in Canada. The Company also operates the Cerro San Pedro gold-silver mine (“Cerro San Pedro”) in Mexico (which transitioned to the reclamation phase on December 31, 2018). The Mesquite gold mine (“Mesquite”) in the United States was sold in October 2018 and the Peak Mines gold-copper mine in Australia (“Peak Mines”) was sold in April 2018. In addition, New Gold owns 100% of the Blackwater project located in Canada (“Blackwater”). New Gold’s objective is to be a leading intermediate gold producer, focused on the environment and social responsibility.
1 |
Contents
OUR BUSINESS | 1 |
OPERATING AND FINANCIAL HIGHLIGHTS | 3 |
CORPORATE DEVELOPMENTS | 5 |
OUTLOOK FOR 2019 | 5 |
RESERVES AND RESOURCES | 7 |
KEY PERFORMANCE DRIVERS | 8 |
FINANCIAL RESULTS | 10 |
REVIEW OF OPERATING MINES | 16 |
DISCONTINUED OPERATIONS | 24 |
DEVELOPMENT AND EXPLORATION REVIEW | 26 |
FINANCIAL CONDITION REVIEW | 27 |
NON-GAAP FINANCIAL PERFORMANCE MEASURES | 33 |
ENTERPRISE RISK MANAGEMENT AND RISK FACTORS | 50 |
CRITICAL JUDGMENTS AND ESTIMATION UNCERTAINTIES | 65 |
ACCOUNTING POLICIES | 65 |
CONTROLS AND PROCEDURES | 66 |
MINERAL RESERVES AND MINERAL RESOURCES | 67 |
CAUTIONARY NOTES | 70 |
2 |
OPERATING AND FINANCIAL HIGHLIGHTS
OPERATING HIGHLIGHTS
The Company completed the sale of Mesquite in October 2018. Additionally, the Company completed the sale of Peak Mines in early April 2018. As a result, Mesquite and Peak Mines have been classified as discontinued operations. Operating highlights are disclosed on a continuing operations basis (unless otherwise noted).
Three months ended December 31 | Year ended December 31 | ||||
2018 | 2017 | 2018 | 2017 | 2016 | |
Continuing Operating information | |||||
Gold (ounces): | |||||
Produced (1) | 97,428 | 58,070 | 315,483 | 149,009 | 163,091 |
Sold (1) | 84,421 | 54,170 | 298,002 | 140,654 | 161,000 |
Copper (millions of pounds): | |||||
Produced (1) | 20.8 | 24.6 | 85.1 | 90.6 | 87.3 |
Sold (1) | 19.7 | 22.0 | 81.1 | 84.5 | 84.9 |
Silver (millions of ounces): | |||||
Produced (1) | 0.2 | 0.3 | 0.7 | 1.0 | 1.1 |
Sold (1) | 0.1 | 0.2 | 0.7 | 0.9 | 1.1 |
Revenue (1) | |||||
Gold ($/ounce) | 1,209 | 1,223 | 1,236 | 1,211 | 1,180 |
Copper ($/pound) | 2.71 | 2.44 | 2.79 | 2.41 | 2.03 |
Silver ($/ounce) | 13.37 | 15.84 | 14.89 | 16.41 | 16.71 |
Average realized price(1) (2) | |||||
Gold ($/ounce) | 1,230 | 1,268 | 1,263 | 1,278 | 1,275 |
Copper ($/pound) | 2.96 | 2.70 | 3.06 | 2.66 | 2.95 |
Silver ($/ounce) | 13.95 | 16.29 | 15.47 | 16.88 | 17.00 |
Operating expenses per gold ounce sold ($/ounce) (3) | 568 | 731 | 648 | 605 | 622 |
Operating expenses per copper pound sold ($/pound) (3) | 1.37 | 1.56 | 1.57 | 1.26 | 1.11 |
Operating expenses per silver ounce sold ($/ounce) (3) | 6.44 | 9.39 | 7.93 | 7.98 | 8.55 |
Total cash costs per gold ounce sold ($/ounce) (2)(4) | 186 | 393 | 270 | (82) | (8) |
All-in sustaining costs per gold ounce sold ($/ounce) (2)(4) | 688 | 714 | 961 | 488 | 463 |
Total cash costs per gold ounce sold on a co-product basis ($/ounce) (2)(4) | 540 | 778 | 641 | 670 | 612 |
All-in sustaining costs per gold ounce sold on a co-product basis ($/ounce) (2)(4) TOTAL OPERATIONS (includes Mesquite and Peak Mines) |
857 | 945 | 1,051 | 914 | 843 |
Gold (ounces): | |||||
Produced(1) | 110,559 | 145,992 | 455,448 | 422,411 | 381,633 |
Sold (1) | 96,721 | 143,644 | 434,866 | 410,086 | 378,239 |
All-in sustaining costs per gold ounce sold ($/ounce) (2) | 718 | 771 | 925 | 727 | 692 |
1. | Production is shown on a total contained basis while sales are shown on a net payable basis, including
final product inventory and smelter payable adjustments, where applicable. |
2. | The Company uses certain non-GAAP financial performance measures throughout this MD&A. Average realized price, total cash costs and all-in sustaining costs per gold ounce sold and total cash costs and all-in sustaining costs on a co-product basis are non-GAAP financial performance measures with no standard meaning under IFRS. For further information and a detailed reconciliation, please refer to the “Non-GAAP Financial Performance Measures” section of this MD&A. |
3. | Operating expenses are apportioned to each metal produced on a percentage of revenue basis. |
4. | The calculation of total cash costs and all-in sustaining costs per gold ounce sold is net of by-product silver and copper revenue. Total cash costs and all-in sustaining costs on a co-product basis remove the impact of other metal sales that are produced as a by-product of the Company’s gold production and apportions the cash costs to each metal produced on a percentage of revenue basis. If silver and copper revenue were treated as co-products, co-product total cash costs for the year ended December 31, 2018 from continuing operations would be $8.10 per silver ounce sold (2017 - $8.42) and $1.75 per copper pound sold (2017 - $1.49) and co-product all-in sustaining costs for the year ended December 31, 2018 would be $13.12 per silver ounce sold (2017 - $11.65) and $2.74 per copper pound sold (2017 - $2.00). Co-product total cash costs for the three months ended December 31, 2018 would be $6.45 per silver ounce sold (2017 - $9.85) and $1.50 per copper pound sold (2017 - $1.82) and co-product all-in sustaining costs for the year ended December 31, 2018 would be $10.05 per silver ounce sold (2017 - $12.00) and $2.27 per copper pound sold (2017 - $2.18). |
3 |
FINANCIAL HIGHLIGHTS
Three months ended December 31 | Year ended December 31 | ||||
(in millions of U.S. dollars, except where noted) | 2018 | 2017 | 2018 | 2017 | 2016 |
FINANCIAL INFORMATION | |||||
Revenue | 157.4 | 123.5 | 604.5 | 388.7 | 381.1 |
Operating margin(1) | 81.5 | 47.4 | 279.1 | 190.4 | 177.1 |
Revenue less cost of goods sold | 20.8 | (4.1) | 39.2 | 30.3 | 15.9 |
Loss from continuing operations | (727.7) | (226.9) | (1,070.8) | (158.0) | (23.9) |
Net loss | (728.4) | (195.6) | (1,225.7) | (108.0) | (43.0) |
Adjusted net earnings (loss) from continuing operations (1) | 22.7 | (21.5) | (10.6) | (21.0) | (8.9) |
Operating cash flows generated from continuing operations | 57.8 | 58.4 | 193.0 | 197.1 | 165.8 |
Operating cash flows generated from continuing operations before changes in non-cash operating working capital (1) | 74.8 | 39.1 | 264.6 | 153.3 | 167.5 |
Capital expenditures (sustaining) from continuing operations (1) | 30.7 | 11.2 | 174.8 | 43.3 | 87.4 |
Capital expenditures (growth) from continuing operations (1) | 8.7 | 83.4 | 39.1 | 510.9 | 479.6 |
Total assets | 2,169.6 | 4,017.3 | 2,169.6 | 4,017.3 | 3,933.0 |
Cash and cash equivalents | 103.7 | 216.2 | 103.7 | 216.2 | 185.9 |
Long-term debt
|
780.5 | 1,007.7 | 780.5 | 1,007.7 | 889.5 |
Non-current liabilities excluding long-term debt | 298.9 | 626.1 | 298.9 | 626.1 | 794.9 |
Share Data | |||||
Loss per share from continuing operations: | |||||
Basic ($) | (1.26) | (0.39) | (1.85) | (0.28) | (0.08) |
Diluted ($) | (1.26) | (0.39) | (1.85) | (0.28) | (0.08) |
Loss per share: | |||||
Basic ($) | (1.26) | (0.34) | (2.12) | (0.19) | (0.01) |
Diluted ($) | (1.26) | (0.34) | (2.12) | (0.19) | (0.01) |
Adjusted net earnings (loss) per basic share ($)(1) | 0.04 | (0.04) | (0.02) | (0.04) | (0.02) |
Share price as at December 31 (TSX – Canadian dollars) | 1.05 | 4.13 | 1.05 | 4.13 | 4.71 |
Weighted average outstanding shares (basic) (millions) | 578.8 | 578.1 | 578.7 | 564.7 | 511.8 |
1. | The Company uses certain non-GAAP financial performance measures throughout this MD&A. Operating margin, adjusted net earnings (loss) from continuing operations, adjusted net earnings (loss) per basic share, capital expenditures (sustaining and growth) from continuing operations and operating cash flows generated from continuing operations before changes in non-cash operating working capital are non-GAAP financial performance measures with no standard meaning under IFRS. For further information and a detailed reconciliation, please refer to the “Non-GAAP Financial Performance Measures” section of this MD&A. |
4 |
CORPORATE DEVELOPMENTS
In October 2018, the Company completed the sale of its Mesquite Mine located in California for $158 million in cash prior to closing adjustments. Subsequent to December 31, 2018, the Company also received a final net working capital closing adjustment of approximately $4 million.
The Company has implemented a hedging strategy whereby it entered into gold and copper price option contracts to reduce exposure to fluctuations in gold and copper prices during the completion of remaining mine construction at Rainy River and relaunch the development of the New Afton C-zone.
The Company entered into gold price option collar contracts by purchasing put options with an average strike price of $1,230 per ounce and selling call options at an average strike price $1,300 per ounce covering 192,000 ounces of gold for 2019 (16,000 ounces per month).
The Company entered into copper price option collar contracts by purchasing put options with an average strike price of $2.50 per pound and selling call options at an average strike price $3.00 per pound covering 21,600 tonnes of copper for 2019 (1,800 tonnes per month).
OUTLOOK FOR 2019
Operational Estimates | Rainy River | New Afton | 2019 Consolidated Guidance(1) |
Gold Produced (ounces) | 245,000 – 270,000 | 55,000 – 65,000 | 300,000 – 335,000 |
Copper Produced (Mlbs) | - | 75 - 85 | 75 - 85 |
Gold Eq. Produced (ounces)(2) | 250,000 – 275,000 | 215,000 – 245,000 | 465,000 – 520,000 |
Operating Expense per gold ounce | $870 - $950 | $480 - $520 | $690 - $770 |
Operating Expense per copper pound | - | $0.95 - $1.15 | - |
Total Cash Costs per gold ounce (with by-product credits)(3) Cash Costs per gold eq. ounce (on a co-product basis)(i) |
$870 - $950 | ($1,350) - ($1,310) | $470 - $540 |
Total Cash Costs per gold eq. ounce (on a co-product basis)(3) | $870 - $950 | $600 - $640 | $740 - $820 |
All-in Sustaining Costs per gold ounce (with by-product credits)(3)
|
$1,690 - $1,790 | ($500) – ($420) | $1,370 - $1,470 |
All-in Sustaining Costs per gold eq. ounce (on a co-product basis)(3) | $1,690 - $1,790 | $810 - $890 | $1,330 - $1,430 |
Capital Investment & Exploration Estimates | Rainy River | New Afton | 2019 Consolidated Guidance |
Sustaining Capital ($M)(3) | $210 - $230 | $45 - $55 | $255 - $285 |
Growth Capital ($M)(3) | ~$3 | $40 - $45 | $50 - $55(4) |
Exploration ($M) | ~$5 | ~$4 | ~$9 |
1. All production and cost estimates exclude potential production from Cerro San Pedro residual leaching. 2. Gold equivalent ounces includes 505,000 to 540,000 ounces of silver. | |||
3. Refer to the Non-GAAP financial performance measures of the MD&A. | |||
4. Consolidated growth capital includes $7 million for Blackwater permitting. |
Material assumptions include: Spot prices of $1,300 per gold ounce, copper price of $2.75 per pound, and a foreign exchange rate of 1.30 Canadian dollars to the US dollar.
The Company’s 2019 guidance includes an increase in production from Rainy River and another year of solid performance from New Afton. During the year the Company will continue to advance its strategy of re-positioning for long-term success, which will include: completion of all remaining construction capital at the Rainy River in order to position the operation for efficient and sustainable mining; optimizing Rainy River life of mine plan with a clear focus on lowering future capital requirements while delivering strong free cash flow generation starting in 2020; re-launching an internally funded development program for the New Afton C-zone and delivering an optimized life of mine plan; as well as returning the Company’s focus to organic growth opportunities by launching strategic exploration programs at both assets.
5 |
Rainy River
Rainy River is expected to deliver another year of production growth that builds on the progress achieved in the final four months of 2018. During 2019, the key objective will be optimizing open pit mining productivity and mill performance in order to achieve targeted availability, throughput and recoveries.
Gold production in 2019 is expected to increase over the previous year, driven by higher mill throughput and planned higher recoveries, offset by planned lower grades as mining operations transition between phase 1 and phase 2 of the mine plan.
During the year, approximately 46.7 million ex-pit tonnes will be mined at an increased strip ratio (waste: ore) of approximately 3.1:1 as the mine transitions to phase 2 of the mine plan. Approximately 11.3 million of ore tonnes will be mined for the year that will support continued segregation of approximately 3.8 million of lower grade ore for stockpiling.
Operating expenses are expected to be higher than the fourth quarter of 2018 as a result of a higher planned strip ratio and lower planned grades, however overall unit costs will continue to decrease throughout the year as mine and mill efficiencies improve, and cost controls and procurement initiatives are implemented.
Total sustaining capital is expected to be between $210 and $230 million for the year. Management has carefully reviewed the capital requirements for the year with the objective of positioning the operation for efficient, sustainable and long-term success.
Up to 72% ($150-$165 million) of sustaining capital requirements for the year is to complete deferred mine construction, primarily related to the tailings disposal facility, installation of wick drains to implement the engineered stabilization of the waste dumps, completion of the water treatment train, construction of a maintenance and warehouse facility, mill modifications and improvements that allow efficient operation of the gravity circuit, pebble crusher, ore classification system and camp facility.
Other sustaining capital of an estimated $60 to $65 million includes additional mobile equipment requirements (purchase and lease) to expand the mining fleet as well as the mill and surface equipment fleet, mill upgrades to support achievement of targeted throughput, availability and recoveries and additional pumping capacity. Approximately $33 million of other sustaining and working capital primarily consists of the phase 2 capitalized stripping program of the mine plan and capital projects that were not completed in 2018.
All-in sustaining costs will increase as compared to the fourth quarter of 2018 due to higher sustaining capital requirements as described above. It is expected that sustaining capital requirements will decrease significantly beginning in 2020 as all remaining construction and mill upgrades are completed and the mining fleet has been expanded to planned levels.
Consistent with the Company’s focus on organic growth opportunities, an exploration program will be launched in 2019 that will focus on the northeast trend and potential expansion of the intrepid zone.
6 |
During the year, the Company is fully committed to completing all remaining construction in order to best position the operation for efficient and sustainable mining and long-term success.
New Afton
New Afton is expected to deliver another year of solid production and low costs that drive strong free cash flow streams. The objective for 2019 is to reinvest in the long-term future of this high-quality asset by re-launching a self-funded development strategy for the C-zone, which will extend mine life to 2030 with robust economics. A strategic exploration program will be launched during the year that will follow up on key targets located below the C-zone as well as regional targets on the larger land package.
Gold and copper production for the year is expected to be lower than the prior year, primarily related to planned lower gold and copper grades, which is consistent with the current mine plan. Production will continue to drive solid operating and cash cost performance for the year.
Sustaining capital is expected to increase over the prior year and primarily includes the development of the B3-zone, as well as a scheduled tailings dam raise.
As previously disclosed, an internally funded development strategy (assuming spot prices of $1,300 per gold ounce, $2.75 per copper pound and a foreign exchange rate of $1.30 Canadian dollars to the U.S. dollar) for the New Afton C-zone is underway, which will extend mine life to 2030 with robust economics. Subsequently, growth capital for the year is expected to increase significantly over 2018, primarily related to C-zone development activities.
Growth capital for 2019 is estimated to be between $40 and $45 million, which primarily consists of advancing an exploration decline and the purchase of required mobile equipment and infrastructure ($5 to $7.5 million).
During the year, the Company will launch a strategic exploration program at New Afton that will focus on previously identified exploration targets located below the C-zone as well as regionally over the land package, which could further extend mine life.
Other assets
During the year closure activities will continue that primarily focus on closing and reclaiming mine infrastructure while working closely with local communities and governments in order to leave a positive legacy.
The Company will continue to assess alternative project scenarios at Blackwater that would involve lower initial capital requirements and a higher-grade pit configuration with the goal of generating positive returns at current metals prices. The Company will continue to work on receiving the Environmental Assessment (“EA”) approval in 2019, and actively working with local First Nations to complete a Participation Agreement (“PA”).
During 2019, the Company may consider other strategic alternatives with respect to the Blackwater project.
RESERVES AND RESOURCES
Consolidated gold reserves decreased by approximately 35,000 ounces as compared to year-end 2017 (mid-year 2018 for Rainy River). This decrease includes approximately 218,000 ounces of mining depletion at Rainy River during Q3 and Q4 and approximately 79,000 ounces of mining depletion at the New Afton Mine. Mining depletion was partially offset by approximately 262,000 ounces of positive resource-to-reserve conversions from updated mining designs and operational plans.
7 |
Measured and Indicated resources decreased marginally due to the resource to reserve conversion at New Afton. Measured and Indicated resources at Rainy River and Blackwater remain materially unchanged as compared to previously reported Measured and Indicated resources.
Inferred resources were relatively unchanged over the prior year.
KEY PERFORMANCE DRIVERS
There is a range of key performance drivers that are critical to the successful implementation of New Gold’s strategy and the achievement of its goals. The key internal drivers are production volumes and costs. The key external drivers are market prices of gold, copper and silver, as well as foreign exchange rates.
Production Volumes and Costs
New Gold’s portfolio of continuing operating mines produced 315,483 gold ounces for the year ended December 31, 2018 and 97,428 gold ounces for the three months ended December 31, 2018.
For an analysis of the impact of production volumes and costs for the three months ended December 31, 2018 relative to prior-year periods, refer to the “Review of Operating Mines” section of this MD&A.
Commodity Prices
Gold Prices
The price of gold is the single largest factor affecting New Gold’s profitability and operating cash flows. As such, the current and future financial performance of the Company is expected to be closely related to the prevailing price of gold.
For the year ended December 31, 2018, New Gold’s gold revenue per ounce and average realized gold price per ounce were $1,236 and $1,263, respectively, compared to the London bullion market (“LBMA”) p.m. average gold price of $1,269 per ounce. For the three months ended December 31, 2018, New Gold’s gold revenue per ounce and average realized gold price per ounce were $1,209 and $1,230, respectively, compared to the LBMA p.m. average gold price of $1,228 per ounce.
Copper Prices
For the year ended December 31, 2018, New Gold’s copper revenue per pound and average realized copper price per pound were $2.79 and $3.06, respectively, above the average London Metal Exchange (“LME”) copper price of $2.96 per pound. For the three months ended December 31, 2018, New Gold’s copper revenue per pound and average realized copper price per pound were $2.71 and $2.96, respectively, compared to the average LME copper price of $2.80 per pound. The higher price realized was due to the Company exercising its copper put options.
Silver Prices
For the year ended December 31, 2018, New Gold’s silver revenue per ounce and average realized silver price per ounce were $14.89 and $15.47 respectively, compared to the LBMA p.m. average silver price of $15.71 per ounce. For the three months ended December 31, 2018, New Gold’s silver revenue per ounce and average realized silver price per ounce were $13.37 and $13.95, respectively, compared to the LBMA p.m. average silver price of $14.54 per ounce.
In December 2018 the Company entered into gold price option contracts and copper price option contracts to provide downside price protection. Please refer to the “Corporate Developments” section of this MD&A.
8 |
Foreign Exchange Rates
The Company operates in Canada and Mexico, while revenue is generated in U.S. dollars. As a result, the Company has foreign currency exposure with respect to costs not denominated in U.S. dollars. New Gold’s operating results and cash flows are influenced by changes in various exchange rates against the U.S. dollar. The Company has exposure to the Canadian dollar through New Afton, Rainy River and Blackwater, as well as through corporate administration costs. The Company also has exposure to the Mexican peso through Cerro San Pedro.
The Canadian dollar was consistent against the U.S. dollar for the year ended December 31, 2018. The average Canadian dollar against the average U.S. dollar for the three months ended December 31, 2018 weakened by approximately 4% when compared to the prior-year period. The strengthening or weakening of the Canadian dollar impacts costs in U.S. dollar terms at the Company’s Canadian operations, as well as capital costs at the Company’s Canadian development properties as a significant portion of operating and capital costs are denominated in Canadian dollars.
The Mexican peso weakened against the U.S. dollar by approximately 2% for the year ended December 31, 2018. The average Mexican peso against the average U.S. dollar for the three months ended December 31, 2018 weakened by approximately 5% when compared to the prior-year period. The strengthening or weakening of the Mexican peso impacts costs in U.S. dollar terms at the Company’s Mexican operation, Cerro San Pedro, as a portion of operating costs are denominated in Mexican pesos.
For an analysis of the impact of foreign exchange fluctuations on operating costs for the year ended December 31, 2018 relative to prior-year periods, refer to the “Review of Operating Mines” sections for Rainy River, New Afton and Cerro San Pedro.
Economic Outlook
The LBMA p.m. gold price decreased by 1% since the start of 2018 and increased by 4% during the fourth quarter. The global economy remains relatively strong, although ongoing trade tensions between the U.S. and China continues to be the greatest risk to further growth in the near-term.
Prospects for gold are encouraged by several structural factors. Mine supply has been plateauing as high quality deposits become more difficult to find and more expensive to develop and mine. Exploration budgets have been cut in recent years, increasing the likelihood that supply will remain muted, even in the face of increasing gold prices. Gold held in exchange-traded products has increased steadily since October 2018, suggesting increased investor interest in the gold sector.
Economic events can have significant effects on the price of gold, through currency rate fluctuations, the relative strength of the U.S. dollar, gold supply and demand, and macroeconomic factors such as interest rates and inflation expectations. Management anticipates that the long-term economic environment should provide support for precious metals and for gold in particular, and believes the prospects for the business are favourable.
9 |
FINANCIAL RESULTS
Summary of Quarterly Financial Results
Three months ended December 31 | Year ended December 31 | ||||
(in millions of U.S. dollars, except where noted) | 2018 | 2017 | 2018 | 2017 | 2016 |
FINANCIAL RESULTS | |||||
Revenue | 157.4 | 123.5 | 604.5 | 388.7 | 381.1 |
Operating expenses | 75.9 | 76.1 | 325.4 | 198.3 | 204.0 |
Depreciation and depletion | 60.7 | 51.5 | 239.9 | 160.1 | 161.2 |
Revenue less cost of goods sold | 20.8 | (4.1) | 39.2 | 30.3 | 15.9 |
Corporate administration | 7.6 | 4.9 | 23.2 | 23.7 | 22.9 |
Corporate restructuring | 1.8 | 4.2 | 4.1 | 4.2 | - |
Share-based payment expenses | 0.2 | (1.8) | 0.7 | 5.1 | 8.3 |
Asset Impairment | 671.1 | 268.4 | 1,054.8 | 268.4 | 6.4 |
Exploration and business development | 1.5 | 1.3 | 3.0 | 6.4 | 2.2 |
Loss from operations | (661.4) | (281.1) | (1,046.6) | (277.5) | (23.9) |
Finance income | 0.5 | 0.2 | 1.5 | 1.1 | 1.4 |
Finance costs | (17.1) | (12.6) | (69.0) | (12.8) | (9.5) |
Other gains and losses | |||||
Gain (loss) on foreign exchange | 23.9 | (8.8) | 6.6 | 43.8 | 0.3 |
Gain on disposal of El Morro stream | - | - | - | 33.0 | - |
Other gain (loss) on disposal of assets | 1.1 | 0.2 | (0.3) | 0.3 | 0.1 |
Loss on revaluation of investments | - | (0.1) | (0.2) | (0.2) | - |
(Loss) gain on copper forward contracts and copper option contracts | (2.2) | 0.3 | 4.8 | (4.4) | - |
Unrealized (loss) gain on revaluation of gold stream obligation | (2.5) | (17.0) | 11.7 | (21.8) | - |
Settlement and loss on revaluation of gold price option contracts | (4.8) | 1.1 | (4.8) | (6.5) | (4.0) |
Revaluation of CSP’s reclamation and closure cost obligation | (1.0) | - | (1.0) | - | - |
Other | (0.2) | 0.1 | 1.3 | 2.4 | (9.6) |
Loss earnings before taxes | (663.7) | (317.7) | (1,096.0) | (242.6) | (45.2) |
Income tax (expense) recovery | (64.0) | 90.8 | 25.2 | 84.6 | 2.2 |
Loss from continuing operations |
(727.7) | (226.9) | (1,070.8) | (158.0) | (43.0) |
Earnings (loss) from discontinued operations | (0.7) | 31.3 | (154.9) | 50.0 | 36.0 |
Net loss | 728.4 | (195.6) | (1,225.7) | (108.0) | (7.0) |
Adjusted earnings (loss) from continuing operations (1) | 22.7 | (21.5) | (10.6) | (21.0) | (8.9) |
1. | The Company uses certain non-GAAP financial performance measures throughout this MD&A. For a detailed description of each of the non-GAAP measures used in this MD&A and a detailed reconciliation, please refer to the “Non-GAAP Financial Performance Measures” section of this MD&A. |
10 |
Revenue
For the year ended December 31, 2018, the $215.8 million, or 56%, increase in revenue was due to the combined impact of a $187.7 million increase in sales volumes and a $28.1 million increase in average realized prices, due to higher copper prices. The average realized prices for the year ended December 31, 2018 were $1,263 per gold ounce, $3.06 per pound of copper and $15.47 per silver ounce. This compared to $1,278 per gold ounce, $2.66 per pound of copper and $16.88 per silver ounce in the prior-year period.
For the three months ended December 31, 2018, the $33.9 million, or 27%, increase in revenue was due to the combined impact of a $30.9 million increase in sales volumes and a $3.0 million increase in average realized prices. The average realized prices for the three months ended December 31, 2018 were $1,230 per gold ounce, $2.96 per pound of copper and $13.95 per silver ounce. This compared to $1,268 per gold ounce, $2.70 per pound of copper and $16.29 per silver ounce in the prior-year period.
The increase in volume is due to production from Rainy River, which reached commercial production in the fourth quarter of 2017. A detailed discussion of production is included in the “Review of Operating Mines” section of this MD&A.
Operating expenses
For the year ended December 31, 2018, operating expenses increased compared with the prior-year period mainly due to the inclusion of operating expenses at Rainy River during its first full year of production, and an inventory write-down at Cerro San Pedro as a result of a recoverability analysis performed as residual leaching at Cerro San Pedro begins its final phase.
For the three months ended December 31, 2018, operating expenses were consistent with the prior year.
Depreciation and depletion
For the year and three months ended December 31, 2018, depreciation and depletion increased compared with the prior-year period due to depreciation and depletion being recognized at Rainy River.
Revenue less cost of goods sold
For the year and three months ended December 31, 2018, revenue less cost of goods sold increased, primarily due to increased revenues, partially offset by increased operating expenses, and higher depreciation and depletion.
Corporate administration, corporate restructuring and share-based payment expenses
For the year ended December 31, 2018, corporate administration was consistent with that of the prior year. For the three months ended December 31, 2018, the increase in corporate administration was due to the Company restructuring the senior leadership team.
Additionally, in 2018, the Company recognized a restructuring charge of approximately $4.1 million in severance and other termination benefits related to changes at the executive leadership level of the organization. In 2017, the Company recognized a restructuring charge of approximately $4.2 million in severance and other termination benefits related to restructuring its corporate office workforce.
For the year and three months ended December 31, 2018, the decrease in share-based payment expenses was primarily attributable to the decrease of the Company’s share price in the current period, which resulted in lower costs for the Company’s cash-settled share-based payment arrangements.
11 |
Asset impairment
In accordance with the Company’s accounting policies, the recoverable amount of an asset or cash generating unit (“CGU”) is estimated when an indication of impairment exists.
During the second half of 2018, the Company experienced a significant and prolonged period where the carrying value of its net assets was more than its market capitalization. The Company identified this market capitalization deficiency as an indicator of impairment as at December 31, 2018. As a result of this impairment indicator, the Company assessed its CGUs and determined that an impairment existed at Rainy River and Blackwater.
At Rainy River, the impairment loss was largely driven by increased capital expenditures and a lower in-situ value as a result of applying a lower per ounce value to in-situ ounces. As a result of this assessment, the Company is recording a $452.9 million impairment loss at Rainy River.
At Blackwater, the Company assessed the value of the project using an in-situ metric approach for reserves and resources, rather than a discounted cash flow approach, consistent with the approach a market participant would take, and also applying a lower per ounce value to in-situ ounces. This approach incorporated values based on recent comparable market transactions. As a result of this assessment, the Company is recording a $218.2 million impairment loss at Blackwater.
Total impairment loss recorded during the three months ended December 31, 2018 is $671.1 million. For the year ended December 31, 2018 the Company recorded impairment losses of $836.6 million at Rainy River and $218.2 million at Blackwater, totaling $1,054.8 million pre-tax ($953.2 million after-tax). There was no tax recovery associated with the impairment losses at Rainy River and Blackwater recorded during the fourth quarter of 2018 as the Company has not recognized any deferred tax assets as at December 31, 2018. Refer to Note 16 of the consolidated financial statements for further information.
Detailed disclosures of the Company’s impairment losses are included in the consolidated financial statements for the years ended December 31, 2018 and 2017 and related notes.
Finance income and finance costs
For the year and three months ended December 31, 2018, finance costs increased as the Company ceased capitalization of interest to its qualifying development property due to the commencement of commercial production at Rainy River in November 2017.
Other gains and losses
The following other gains and losses are added back for the purposes of adjusted net earnings:
Gold stream obligation
For the year ended December 31, 2018, the unrealized gain on revaluation of the gold stream obligation derivative instrument was due to an increase in the risk-free interest rate and a decrease in short-term metal forward prices.
Copper option contracts
In December 2018, the Company entered into copper price option collar contracts by purchasing put options with an average strike price of $2.50 per pound and selling call options at an average strike price of $3.00 per metric tonne covering 21,600 tonnes of copper for 2019 (1,800 tonnes per month).
These derivative instruments are fair valued at the end of each reporting period. For the three months ended December 31, 2018, the Company recognized a gain of $0.7 million on the revaluation of the copper price option contracts resulting from the revaluation of the copper price option contracts due to the decrease in copper prices. The Company recorded a gain of $4.1 million on the settlement of its 2018 copper option contracts.
12 |
Gold option contracts
In December 2018, the Company entered into gold price option collar contracts by purchasing put options with an average strike price of $1,230 per ounce and selling call options at an average strike price of $1,300 per ounce covering 192,000 ounces of gold for 2019 (16,000 ounces per month).
These derivative instruments are fair valued at the end of each reporting period. For the year ended December 31, 2018, the Company recognized a loss of $4.8 million on the revaluation of the gold price option contracts resulting from the revaluation of the gold price option contracts due to an increase in gold prices.
Foreign exchange
Movements in foreign exchange are primarily due to the revaluation of the deferred tax assets and liabilities at the balance sheet date and the appreciation or depreciation of the Canadian dollar and Mexican peso compared to the U.S. dollar in the current period.
Other prior-year period gains and losses
In 2017, a gain of $1.2 million on the mark-to-market of share purchase warrants was recorded as the traded value of the New Gold share purchase warrants decreased. In June 2017 all share purchase warrants expired unexercised, thus there was no earnings impact for the year and three months ended December 31, 2018. During the first quarter of 2017, the Company sold its 4% stream on future gold production from El Morro for $65.0 million cash. As a result, the Company recorded a gain on disposal of $33.0 million representing the difference between the net proceeds received and the carrying value of the asset.
Income tax
Income tax recovery from continuing operations for the year ended December 31, 2018 was $25.2 million on a loss before taxes of $1,096.0 million compared to a recovery of $84.6 million on loss before tax of $242.6 million in the prior year, reflecting an effective tax rate of 2.14% in 2018 compared to 34.9% in 2017. The primary reason for the change in the unadjusted effective tax rate is the change in unrecognized deferred tax assets.
For the year ended December 31, 2018, the Company recorded a foreign exchange gain of $0.4 million on non-monetary assets and liabilities, compared to a loss of $7.4 million in the prior year with no associated tax impact.
On an adjusted net loss basis, the adjusted tax recovery from continuing operations for the year ended December 31, 2018, was $25.9 million, compared to adjusted tax expense of $1.1 million in the prior year. The adjusted tax expense excludes the impairment on Rainy River and Blackwater, impact of the Cerro San Pedro heap leach write-down, corporate restructuring costs and other gains and losses on the consolidated income statement. Please refer to the “Non-GAAP Financial Performance Measures” section of this MD&A.
(Loss) earnings from discontinued operations, net of tax
For the year and three months ended December 31, 2018 and comparative periods, both Peak Mines and Mesquite have been classified as discontinued operations, and accordingly earnings and cash flows from continuing operations are presented exclusive of Peak Mines and Mesquite.
As a result of the sale of Mesquite, the Company recognized a pre-tax impairment loss of $253.1 million for the year ended December 31, 2018.
13 |
Net loss
For the year and three months ended December 31, 2018, the net loss was impacted by the impairment loss at Rainy River and Blackwater, an inventory write-down at Cerro San Pedro, an increase in depreciation and depletion expenses and finance costs, which were partially offset by a higher operating margin when compared to the prior period.
Adjusted net earnings (loss) from continuing operations
Net losses have been adjusted for the impairment loss at Rainy River and Blackwater, corporate restructuring costs, inventory impairment at Cerro San Pedro and other gains and losses on the consolidated income statement. Key elements in other gains and losses are: the fair value changes for the gold stream obligation; fair value changes for copper forward contracts and gold price option contracts; foreign exchange gain or loss; and fair value of gold price option. The adjusted entries are also impacted for tax to the extent that the underlying entries are impacted for tax in the unadjusted net earnings. Please refer to the “Non-GAAP Financial Performance Measures” section of this MD&A.
Adjusted net loss from continuing operations for the year ended December 31, 2018 was $10.6 million, or $0.02 per basic share, compared to an adjusted net loss from continuing operations of $21.0 million, or $0.04 per basic share in the prior-year period. Adjusted net loss from continuing operations was primarily impacted by an increase in operating margin of $104.5 million (adjusted for the impact of the heap leach write-down at Cerro San Pedro), a decrease of $8.3 million in exploration, business development, and corporate general and administrative expenses, and a decrease in income tax recovery of $28.8 million when compared to the prior year. This was partially offset by an increase in depreciation and depletion expenses of $78.7 million and an increase in finance costs less finance income of $52.5 million (adjusted for the impact of the gain on modification of long-term debt), as the Company ceased capitalization of interest to its qualifying development property due to the commencement of commercial production at Rainy River.
Adjusted net earnings from continuing operations for the three months ended December 31, 2018 was $22.7 million, or $0.04 per basic share, compared to adjusted net loss of $21.5 million, or $0.04 per basic share in the prior-year period. Adjusted net earnings from continuing operations was primarily impacted by an increase in operating margin of $40.5 million (adjusted for the impact of the heap leach write-down at Cerro San Pedro) and an income tax recovery of $22.0 million. This increase was partially offset by an increase in finance costs less finance income of $4.2 million, an increase in depreciation and depletion expenses of $9.2 million and an increase of $4.9 million in exploration, business development, and corporate general and administrative expenses.
For further information on the Company’s liquidity and cash flow position, please refer to the “Liquidity and Cash Flow” section of this MD&A. For further information on the Company’s financial results, please refer to the “Financial Results” section of this MD&A.
14 |
Key Quarterly Operating and Financial Information
Selected financial and operating information for the current and previous quarters is as follows:
|
(in millions of U.S. dollars, except where noted) |
Q4 2018 |
Q3 2018 |
Q2 2018 |
Q1 2018 |
Q4 2017 |
Q3 2017 |
Q2 2017 |
Q1 2017 |
Q4 2016 |
Continuing Operating information | |||||||||
Gold production from continuing operations (ounces)(1) | 97,428 | 77,533 | 76,751 | 63,711 | 58,070 | 29,520 | 30,842 | 30,577 | 37,943 |
Gold sales from continuing operations (ounces)(1) | 84,421 | 76,653 | 72,774 | 64,154 | 54,170 | 28,479 | 27,245 | 30,760 | 37,522 |
Revenue | 157.4 | 147.1 | 152.5 | 147.5 | 123.5 | 93.0 | 84.8 | 87.3 | 94.0 |
(Loss) earnings from continuing operations | (727.7) | (1.6) | (310.6) | (30.9) | (226.6) | 26.7 | 11.1 | 31.1 | (38.2) |
per share: | |||||||||
Basic ($) | (1.26) | (0.00) | (0.54) | (0.05) | (0.39) | 0.05 | 0.02 | 0.06 | (0.07) |
Diluted ($) | (1.26) | (0.00) | (0.54) | (0.05) | (0.39) | 0.05 | 0.02 | 0.06 | (0.07) |
Discontinued Operating information | |||||||||
Earnings (loss) from discontinued operations, net of tax | 0.7 | (164.2) | 8.6 | 1.4 | 31.3 | 0.3 | 12.0 | 6.4 | 15.9 |
TOTAL OPERATIONS (INCLUDES MESQUITE AND PEAK MINES) | |||||||||
Total gold production (ounces)(1) | 110,559 | 144,025 | 108,550 | 122,315 | 145,992 | 82,027 | 105,064 | 89,327 | 95,883 |
Total gold sales (ounces)(1) | 96,721 | 112,058 | 105,924 | 120,163 | 143,644 | 79,904 | 99,235 | 87,304 | 93,936 |
Net (loss) earnings | 728.4 | (165.8) | (302.0) | (29.5) | (195.6) | 27.0 | 23.1 | 37.5 | (22.3) |
per share: | |||||||||
Basic ($) | (1.26) | (0.29) | (0.52) | (0.05) | (0.34) | 0.05 | 0.04 | 0.07 | (0.04) |
Diluted ($) | (1.26) | (0.29) | (0.52) | (0.05) | (0.34) | 0.05 | 0.04 | 0.07 | (0.04) |
1. | A detailed discussion of production is included in the “Operating Highlights” section of this MD&A. |
15 |
REVIEW OF OPERATING MINES
Rainy River Mine, Ontario, Canada
Rainy River is a gold mine located approximately 50 kilometres northwest of Fort Frances, a town of approximately 8,000 people, in northwestern Ontario, Canada. The property is located near infrastructure and is comprised of approximately 192 square kilometres of freehold and leasehold patented surface rights and mining rights, properties and unpatented mining claims.
As at December 31, 2018, the mine had 4.2 million ounces of Proven and Probable Gold Mineral Reserves, with 2.1 million ounces of Measured and Indicated Gold Mineral Resources, exclusive of Mineral Reserves. A summary of Rainy River’s operating results is provided below.
Three months ended December 31 | Year ended December 31 | |||
(in millions of U.S. dollars, except where noted) | 2018 | 2017 | 2018 | 2017 |
Operating information | ||||
Ore mined (thousands of tonnes) | 2,949 | 1,808 | 12,296 | 1,808 |
Waste mined (thousands of tonnes) | 7,310 | 5,013 | 27,267 | 5,013 |
Ore processed (thousands of tonnes) | 1,901 | 977 | 6,546 | 977 |
Ratio of waste-to-ore | 2.48 | 2.77 | 2.22 | 2.77 |
Average grade: | ||||
Gold (grams/tonne) | 1.42 | 0.94 | 1.25 | 0.94 |
Silver (%) | 2.12 | 2.20 | 1.99 | 2.20 |
Recovery rate (%): | ||||
Gold | 89 | 86 | 86 | 86 |
Silver | 64 | 56 | 60 | 56 |
Gold (ounces): | ||||
Produced (1) | 77,202 | 28,509 | 227,284 | 28,509 |
Sold (1) | 66,123 | 26,359 | 214,804 | 26,359 |
Silver (millions of ounces): | ||||
Produced (1) | 0.1 | 0.04 | 0.2 | 0.04 |
Sold (1) | 0.1 | 0.04 | 0.2 | 0.04 |
Revenue | ||||
Gold ($/ounce) | 1,229 | 1,276 | 1,260 | 1,276 |
Silver ($/ounce) | 14.53 | 16.49 | 15.65 | 16.49 |
Average realized price (2): | ||||
Gold ($/ounce) | 1,229 | 1,276 | 1,260 | 1,276 |
Silver ($/ounce) | 14.53 | 16.50 | 15.65 | 16.50 |
Operating expenses per gold ounce sold ($/ounce) (4) | 648 | 1,432 | 826 | 1,432 |
Operating expenses per silver ounce sold ($/ounce) (4) | 7.66 | 18.52 | 10.26 | 18.52 |
Total cash costs per gold ounce sold (2)(3) | 641 | 1,436 | 820 | 1,436 |
All-in sustaining costs per gold ounce sold (2)(3) | 1,054 | 1,549 | 1,501 | 1,549 |
Total cash costs on a co-product basis (2)(3) | ||||
Gold ($/ounce) | 648 | 1,432 | 826 | 1,432 |
Silver ($/ounce) | 7.66 | 18.52 | 10.26 | 18.52 |
All-in sustaining costs on a co-product basis (2)(3) | ||||
Gold ($/ounce) | 1,056 | 1,543 | 1,498 | 1,543 |
Silver ($/ounce) | 12.49 | 19.96 | 18.61 | 19.96 |
FINANCIAL INFORMATION | ||||
Revenue | 82.2 | 34.3 | 274.4 | 34.3 |
Operating margin (2) | 38.9 | (4.2) | 94.5 | (4.2) |
Revenue less cost of goods sold | 18.9 | (18.3) | 16.2 | (18.3) |
Capital expenditures (sustaining capital) (2) | 25.6 | 2.6 | 142.1 | 2.6 |
Capital expenditures (growth capital) (2) | 6.1 | 80.7 | 28.5 | 496.7 |
1. | Production is shown on a total contained basis while sales are shown on a net payable basis, including final product inventory and smelter payable adjustments, where applicable. |
16 |
2. | We use certain non-GAAP financial performance measures throughout our MD&A. Total cash costs and all-in sustaining costs per gold ounce sold, total cash costs and all-in sustaining costs on a co-product basis, average realized price, and operating margin and capital expenditures (sustaining and growth capital) are non-GAAP financial performance measures with no standard meaning under IFRS. For further information and a detailed reconciliation, please refer to the “Non-GAAP Financial Performance Measures” section of this MD&A. |
3. | The calculation of total cash costs per gold ounce is net of by-product silver revenue. Total cash costs and all-in sustaining costs on a co-product basis removes the impact of other metal sales that are produced as a by-product of our gold production and apportions the cash costs to each metal produced on a percentage of revenue basis. |
4. | Operating expenses are apportioned to each metal produced on a percentage of revenue basis. For further information and a detailed reconciliation, please refer to the “Non-GAAP Financial Performance Measures” section of this MD&A. |
Operating results
Production
During the fourth quarter, the Rainy River Mine reported continued improvement in overall operational performance and delivered quarterly gold production of 77,202 ounces (66,123 sold) and 227,284 ounces (214,804 sold) for the year, achieving revised annual guidance.
The mill run rate averaged 25,835 tonnes per day for the quarter. The first full quarter in which the mill averaged a daily run rate above the target 24,000 tonnes per day. Milling operations were suspended for approximately ten days during the quarter to repair the Semi-Autogenous Grinding (SAG) mill starter and to address the ball mill trunnion, which was replaced during the first quarter of 2019.
Mill gold recovery for the quarter was 89%. During the quarter, considerable efforts were deployed to improve the carbon regeneration and stripping circuits, allowing for an improved overall recovery of more than 90% during the second half of December. Mill recoveries are expected to continue to improve over the next two quarters as ongoing mill upgrades and the optimization of the grinding circuit are completed.
A total of 10.3 million ex-pit tonnes were mined during the quarter, for an average of 111,507 tonnes per day, including 2.53 million tonnes of medium and high-grade ore.
Grade reconciliation for the quarter continued to be consistent with the resource and dig-shape models, providing additional confidence in the deposit.
Revenue
For the year and three months ended December 31, 2018, revenue increased compared to the prior-year period due to higher metal sales volumes. Revenue consists of a full year of production in comparison to the prior year in which commercial production was effective from November 1, 2017.
Revenue less cost of goods sold
For the year and three months ended December 31, 2018, revenue less cost of goods sold increased, primarily driven by higher gold sales volumes.
Asset impairment
For the year ended December 31, 2018, the Company has recorded an after-tax impairment charge of $735.0 million relating to Rainy River. Please refer to the “Financial Results” section of this MD&A.
Operating expenses, total cash costs and all-in sustaining costs
For the year ended December 31, 2018, operating expense per gold ounce sold was $826 compared to $1,432 in the prior year with the decrease driven by the stronger operational performance and increase in gold ounces sold. Operating expenses per ounce exceeded full-year revised 2018 guidance by 7% due to the impact of start-up challenges and unplanned maintenance related to the mill facility impacting both production and costs.
17 |
For the year ended December 31, 2018, total cash costs and all-in sustaining costs per gold ounce sold were $820 and $1,501. All-in sustaining costs in the year includes costs related to the mill upgrade and $71.6 million ($333 per ounce) of construction costs that have been categorized as sustaining capital. Excluding construction, all-in sustaining costs for the year were $1,168 per ounce.
Total cash costs and all-in sustaining costs per gold ounce sold were below revised annual guidance due to lower capital expenditures in 2018.
Capital expenditures
For the year and three months ended December 31, 2018, the increase in sustaining capital expenditures related primarily to tailings dam construction, other infrastructure and capitalized stripping.
Impact of foreign exchange on operations
Rainy River’s operations are impacted by fluctuations in the valuation of the U.S. dollar against the Canadian dollar. For the year ended December 31, 2018, the value of the U.S. dollar averaged $1.295 against the Canadian dollar, compared to $1.297 in the prior-year period. This had a negative impact on total cash costs of $1 per gold ounce sold against the prior year.
For the three months ended December 31, 2018, the value of the U.S. dollar averaged $1.32 against the Canadian dollar compared to $1.27 in the prior-year period. This had a positive impact on total cash costs of $25 per gold ounce sold against the prior year.
Exploration activities
Exploration activities during year and three months ended December 31, 2018 involved field reconnaissance to identify areas of prospective gold mineralization within the Company’s greater Rainy River mineral tenements.
18 |
New Afton Mine, British Columbia, Canada
The New Afton Mine is located near Kamloops, British Columbia. As at December 31, 2018, the mine had 1.1 million ounces of Proven and Probable Gold Mineral Reserves and 903 million pounds of Proven and Probable Copper Mineral Reserves, with 1.1 million ounces of Measured and Indicated Gold Mineral Resources, exclusive of Mineral Reserves, and 891 million pounds of Measured and Indicated Copper Mineral Resources, exclusive of Mineral Reserves. A summary of New Afton’s operating results is provided below.
Three months ended December 31 | Year ended December 31 | |||
(in millions of U.S. dollars, except where noted) | 2018 | 2017 | 2018 | 2017 |
Operating information | ||||
Ore mined (thousands of tonnes) | 1,573 | 1,728 | 5,839 | 6,325 |
Ore processed (thousands of tonnes) | 1,381 | 1,483 | 5,354 | 5,993 |
Average grade: | ||||
Gold (grams/tonne) | 0.51 | 0.58 | 0.53 | 0.56 |
Copper (%) | 0.82 | 0.93 | 0.87 | 0.85 |
Recovery rate (%): | ||||
Gold | 84 | 81 | 85 | 80 |
Copper | 83 | 81 | 83 | 81 |
Gold (ounces): | ||||
Produced (1) | 18,778 | 22,384 | 77,329 | 86,163 |
Sold (1) | 17,176 | 20,132 | 72,489 | 81,067 |
Copper (millions of pounds): | ||||
Produced (1) | 20.8 | 24.6 | 85.1 | 90.6 |
Sold (1) | 19.7 | 22.0 | 81.1 | 84.5 |
Silver (millions of ounces): | ||||
Produced (1) | 0.1 | 0.1 | 0.3 | 0.3 |
Sold (1) | 0.1 | 0.1 | 0.3 | 0.3 |
Revenue | ||||
Gold ($/ounce) | 1,130 | 1,132 | 1,156 | 1,162 |
Copper ($/pound) | 2.71 | 2.44 | 2.79 | 2.41 |
Silver ($/ounce) | 12.19 | 13.92 | 13.64 | 15.11 |
Average realized price (1)(2): | ||||
Gold ($/ounce) | 1,237 | 1,254 | 1,266 | 1,280 |
Copper ($/pound) | 2.96 | 2.70 | 3.06 | 2.66 |
Silver ($/ounce) | 13.34 | 15.43 | 14.95 | 16.64 |
Operating expenses per gold ounce sold ($/ounce) (4) | 375 | 362 | 384 | 412 |
Operating expenses per copper pound sold ($/pound) (4) | 0.90 | 0.78 | 0.93 | 0.85 |
Total cash costs per gold ounce sold ($/ounce) (2)(3) | (1,629) | (1,363) | (1,626) | (1,126) |
All-in sustaining costs per gold ounce sold ($/ounce) (2)(3) | (1,306) | (909) | (1,147) | (605) |
Total cash costs on a co-product basis (2)(3) | ||||
Gold ($/ounce) | 482 | 484 | 495 | 530 |
Copper ($/pound) | 1.16 | 1.04 | 1.19 | 1.10 |
All-in sustaining costs on a co-product basis (2)(3) | ||||
Gold ($/ounce) | 567 | 617 | 623 | 692 |
Copper ($/pound) | 1.36 | 1.33 | 1.50 | 1.44 |
Financial Information: | ||||
Revenue | 73.7 | 77.3 | 314.1 | 302.0 |
Operating margin(2) | 49.2 | 52.6 | 209.8 | 194.9 |
Revenue less cost of goods sold(5) | 9.3 | 16.8 | 51.6 | 55.6 |
Capital expenditures (sustaining capital) (2) | 5.0 | 8.3 | 32.6 | 39.3 |
Capital expenditures (growth capital) (2) | 1.0 | 0.3 | 3.3 | 2.9 |
1. | Production is shown on a total contained basis while sales are shown on a net payable basis, including final product inventory and smelter payable adjustments, where applicable. |
2. | We use certain non-GAAP financial performance measures throughout our MD&A. Total cash costs and all-in sustaining costs per gold ounce sold, total cash costs and all-in sustaining costs on a co-product basis, average realized price, operating margin, and capital expenditures (sustaining capital and growth capital) are non-GAAP financial performance measures with no standard meaning under IFRS. For further information and a detailed reconciliation, please refer to the “Non-GAAP Financial Performance Measures” section of this MD&A. |
19 |
3. | The calculation of total cash costs per gold ounce is net of by-product revenue while total cash costs and all-in sustaining costs on a co-product basis removes the impact of other metal sales that are produced as a by-product of our gold production and apportions the cash costs to each metal produced on a percentage of revenue basis. |
4. | Operating expenses are apportioned to each metal produced on a percentage of revenue basis. For further information and a detailed reconciliation, please refer to the “Non-GAAP Financial Performance Measures” section of this MD&A. |
Operating results
Production
The mine produced 18,778 gold ounces for the quarter and 77,329 ounces for the year, exceeding the high end of annual guidance. Copper production for the quarter was 20.8 million pounds and 85.1 million pounds for the year, reaching the high end of annual guidance.
An ore segregation strategy commenced during the quarter and was further enhanced with the recent commissioning of an ore scanner, which is expected to increase overall mill grade.
The initial phase of a two-phase mill upgrade to address supergene ore recovery was completed on time and on budget during the quarter, which included the installation of pressure jigs and a magnetic separator with commissioning currently underway. The second phase of the planned upgrade will be launched during the first quarter of 2019 with commissioning scheduled for the third quarter.
Revenue
For the year ended December 31, 2018, revenue increased compared to the prior-year period due to higher copper realized prices, which were partially offset by lower gold realized prices and lower metal sales volume.
For the three months ended December 31, 2018, revenue decreased compared to the prior-year period due to lower metal sales volume and lower realized gold prices, which were partially offset by higher realized copper prices.
Revenue less cost of goods sold
For the year ended December 31, 2018, the decrease in revenue less cost of goods sold was primarily driven by higher operating expenses per gold ounce sold. For the three months ended December 31, 2018, the decrease in revenue less cost of goods sold was primarily driven by higher operating expenses per gold and lower copper ounces sold.
Operating expenses, total cash costs and all-in sustaining costs per gold ounce sold
For the year ended December 31, 2018, operating expenses per gold ounces sold decreased due to lower processing costs resulting from the expected decrease in mill throughput.
For the three months ended December 31, 2018, operating expenses increased as there was no capitalized mine development in the current quarter compared to the prior-year quarter. For the year ended December 31, 2018, all-in sustaining costs decreased due to higher by-product revenues and lower sustaining costs which were partially offset by the increase in operating expenses. By-product revenues benefitted from an increase in the realized copper price which more than offset the decrease in copper sales volumes. New Afton’s sustaining costs decreased by $6.7 million to $32.6 million when compared to the prior-year period due to capitalized mine development being included in the prior year.
For the three months ended December 31, 2018, all-in sustaining costs decreased due to lower quarterly sustaining costs which were partially offset by higher operating expenses. By-product revenues were slightly lower than the prior-year period as lower copper sales volume was partially offset by an increase in the realized copper price. New Afton’s quarterly sustaining costs decreased by $3.3 million to $5.0 million when compared to the fourth quarter of 2017.
20 |
Capital expenditures
During the year ended December 31, 2018, sustaining capital expenditures were primarily related to tailings dam raises and equipment purchases, while the prior-year period included mine development and tailings dam raises. Growth capital expenditures in the current and prior-year period were study costs related primarily to the New Afton C-zone.
Impact of foreign exchange on operations
New Afton’s operations are impacted by fluctuations in the valuation of the U.S. dollar against the Canadian dollar. For the year ended December 31, 2018, the value of the U.S. dollar averaged $1.295 against the Canadian dollar, compared to $1.297 in the prior-year period, resulting in a negative impact on total cash costs of $3 per gold ounce sold against the prior year.
For the three months ended December 31, 2018, the value of the U.S. dollar averaged $1.32 against the U.S. dollar compared to $1.27 in the prior-year period. This had a positive impact on total cash costs of $70 per gold ounce sold.
Exploration activities
Exploration activities for the year ended December 31, 2018 continued to focus on field reconnaissance to identify prospective copper and gold targets within the Company’s greater New Afton mineral tenements.
21 |
Cerro San Pedro Mine, San Luis Potosí, México
The Cerro San Pedro Mine is located in the state of San Luis Potosí in central México, approximately 20 kilometres east of the city of San Luis Potosí. The mine is a gold-silver, open pit, run-of-mine heap leach operation. Cerro San Pedro finished active mining late in the second quarter of 2016 and the Company has now discontinued the addition of cyanide to the heap leach pad. A summary of Cerro San Pedro’s operating results is provided below:
Three months ended December 31 | Year ended December 31 | |||
(in millions of U.S. dollars, except where noted) | 2018 | 2017 | 2018 | 2017 |
Operating information | ||||
Gold (ounces) | ||||
Produced (1) | 1,448 | 7,177 | 10,870 | 34,337 |
Sold (1) | 1,122 | 7,679 | 10,709 | 33,228 |
Silver (millions of ounces) | ||||
Produced (1) | 0.1 | 0.1 | 0.1 | 0.6 |
Sold (1) | 0.1 | 0.1 | 0.1 | 0.6 |
Revenue | ||||
Gold ($/ounce) | 1,243 | 1,279 | 1,291 | 1,278 |
Silver ($/ounce) | 14.83 | 16.71 | 16.30 | 17.02 |
Average realized price (2): | ||||
Gold ($/ounce) | 1,243 | 1,279 | 1,291 | 1,278 |
Silver ($/ounce) | 14.83 | 16.71 | 16.30 | 17.02 |
Operating expenses per gold ounce sold ($/ounce) (4) | 6,583 | 1,380 | 3,308 | 1,287 |
Operating expenses per silver ounce sold ($/ounce) (4) | 78.50 | 18.03 | 41.76 | 17.14 |
Total cash costs per gold ounce sold ($/ounce) (2)(3) | 1,146 | 1,414 | 2,068 | 1,264 |
All-in sustaining costs per gold ounce sold ($/ounce) (2)(3) | 14 | 1,545 | 2,023 | 1,425 |
Total cash costs on a co-product basis (2)(3) | ||||
Gold ($/ounce) | 1,154 | 1,390 | 1,959 | 1,267 |
Silver ($/ounce) | 13.76 | 18.16 | 24.73 | 16.87 |
All-in sustaining costs on a co-product basis )(2) | ||||
Gold ($/ounce) | 120 | 1,498 | 1,921 | 1,397 |
Silver ($/ounce) | 1.43 | 19.56 | 24.25 | 18.61 |
FINANCIAL INFORMATION | ||||
Revenue | 1.5 | 11.9 | 16.0 | 52.4 |
Operating margin (2) | (6.6) | (1.0) | (25.2) | (0.3) |
Revenue less cost of goods sold | (7.4) | (2.6) | (28.6) | (7.0) |
Capital expenditures (sustaining capital)(2) | - | - | - | - 0.7 |
1. | Production is shown on a total contained basis while sales are shown on a net payable basis, including final product inventory adjustments, where applicable. |
2. | We use certain non-GAAP financial performance measures throughout our MD&A. Total cash costs and all-in sustaining costs per gold ounce sold, total cash costs and all-in sustaining costs on a co-product basis, average realized price, and operating margin and capital expenditures (sustaining) are non-GAAP financial performance measures with no standard meaning under IFRS. For further information and a detailed reconciliation, please refer to the “Non-GAAP Performance Measures” section of this MD&A. |
3. | The calculation of total cash costs per gold ounce sold and all-in sustaining costs per gold ounce sold is net of by-product silver revenue. Total cash costs and all-in sustaining costs on a co-product basis removes the impact of other metal sales that are produced as a by-product of our gold production and apportions the cash costs to each metal produced on a percentage of revenue basis. |
4. | Operating expenses are apportioned to each metal produced on a percentage of revenue basis. For further information and a detailed reconciliation, please refer to the “Non-GAAP Financial Performance Measures” section of this MD&A. |
Operating results
Production
Cerro San Pedro finished active mining late in the second quarter of 2016 and the Company has now discontinued the addition of cyanide to the heap leach pad. While existing solution will be recirculated, small amounts of residual gold and silver are expected to be recovered during this process. As a result, and consistent with expectations, for the year and three months ended December 31, 2018, gold and silver production decreased compared to the prior-year period. Cerro San Pedro gold production for the year ended December 31, 2018 was 10,870 ounces, achieving revised annual guidance.
22 |
Revenue
For the year ended December 31, 2018, the decrease in revenue was attributable to lower metal prices and a decrease in metal sales volumes at Cerro San Pedro due to the mine transitioning to the reclamation phase of its mine cycle life.
Revenue less cost of goods sold
For the year ended December 31, 2018, revenue less cost of goods sold was a loss of $28.6 million, primarily attributable to the decrease in revenue described above. Revenue less cost of goods sold included an inventory write-down of $16.9 million, of which $15.8 million was included in operating expenses and $1.1 million was included in depreciation and depletion. The write-down was a result of the mine transitioning to the reclamation phase of its mine life cycle.
Operating expenses, total cash costs and all-in sustaining costs
For the year and three months ended December 31, 2018, operating expenses increased as compared to the prior-year period, due to lower gold sales volumes. All-in sustaining costs also increased when compared to the prior-year period, due to lower gold sales volumes.
Impact of foreign exchange on operations
Cerro San Pedro operations are impacted by fluctuations in the valuation of the Mexican peso against the U.S. dollar. For the year ended December 31, 2018, the value of the Mexican peso averaged MXN19.23 against the U.S dollar, compared to MXN18.91 in the prior year. This had a positive impact on total cash costs of $6 per gold ounce sold.
For the three months ended December 31, 2018, the value of the Mexican peso averaged MXN19.83 against the U.S. dollar compared to MXN18.96 in the prior-year period. This had a positive impact on total cash costs of $5 per gold ounce sold.
23 |
DISCONTINUED OPERATIONS
In September 2018, the Company announced that it had entered into an agreement to sell Mesquite and as a result Mesquite met the criteria as a discontinued operation under IFRS 5. The Company completed the sale of Mesquite in October 2018.
For the year ended December 31, 2018 and prior-year comparative periods, the net earnings from Mesquite are reported as earnings from discontinued operations.
In 2017, the Company began a process for the sale of Peak Mines, its gold-copper mine located in Australia, and upon commencement of the process, Peak Mines met the criteria as a discontinued operation under IFRS 5. The Company completed the sale of Peak Mines in early April 2018.
Mesquite Mine, California, USA
During the third quarter of 2018, the Company entered into an agreement for the sale of Mesquite and completed the sale during the fourth quarter of 2018. Accordingly, the Mesquite Mine has been classified as a discontinued operation. A summary of Mesquite’s operating results is provided below.
Three months ended December 31 | Year ended December 31 | |||
(in millions of U.S. dollars, except where noted) | 2018 | 2017 | 2018 | 2017 |
Operating information | ||||
Ore mined and placed on leach pad (thousands of tonnes) | 2,040 | 5,868 | 18,473 | 20,828 |
Waste mined (thousands of tonnes) | 2,627 | 5,818 | 33,129 | 38,023 |
Ratio of waste-to-ore | 1.29 | 0.99 | 1.79 | 1.83 |
Average grade: | ||||
Gold (grams/tonne) | 0.31 | 0.29 | 0.58 | 0.32 |
Gold (ounces): | ||||
Produced (1)(2) | 13,131 | 52,170 | 114,533 | 168,889 |
Sold (1) | 12,300 | 54,612 | 115,389 | 168,800 |
Revenue | ||||
Gold ($/ounce) | 1,226 | 1,281 | 1,266 | 1,278 |
Average realized price (3): | ||||
Gold ($/ounce) | 1,226 | 1,281 | 1,266 | 1,278 |
Total cash costs per gold ounce sold ($/ounce) (3) | 810 | 749 | 828 | 727 |
All-in sustaining costs per gold ounce sold ($/ounce) (3) | 921 | 833 | 889 | 817 |
FINANCIAL INFORMATION | ||||
Revenue | 15.1 | 70.0 | 146.1 | 215.7 |
Operating margin(3) | 5.1 | 29.1 | 50.5 | 93.0 |
Revenue less cost of goods sold | 5.1 | 10.1 | 15.1 | 32.8 |
Capital expenditures (sustaining capital)(3) | 1.0 | 3.9 | 4.5 | 12.8 |
1. | Production is shown on a total contained basis while sales are shown on a net payable basis, including final product inventory, where applicable. |
2. | Tonnes of ore processed each period does not necessarily correspond to ounces produced during the period, as there is a time delay between placing tonnes on the leach pad and pouring gold ounces. |
3. | We use certain non-GAAP financial performance measures throughout our MD&A. Total cash costs and all-in sustaining costs per gold ounce sold, average realized price, operating margin and capital expenditures (sustaining capital) are non-GAAP financial performance measures with no standard meaning under IFRS. For further information and a detailed reconciliation, please refer to the “Non-GAAP Financial Performance Measures” section of this MD&A. |
4. | Operating expenses are apportioned to each metal produced on a percentage of revenue basis. For further information and a detailed reconciliation, please refer to the “Non-GAAP Financial Performance Measures” section of this MD&A. |
24 |
Operating results
In the third quarter of 2018, the Company announced that it had entered into an agreement to sell the Mesquite Mine located in California. The Company completed the sale of Mesquite in the fourth quarter of 2018.
Production
For the year and three months ended December 31, 2018, gold production was lower than the prior year as the asset was sold in October 2018.
Revenue
For the year ended December 31, 2018, revenue decreased compared with the prior year due to lower gold sales volumes and a lower realized gold price.
Revenue less cost of goods sold
For the year and three months ended December 31, 2018, the decrease in revenue less cost of goods sold was primarily driven by a decrease in revenue compared to the prior year.
Operating expenses, total cash costs and all-in sustaining costs per gold ounce sold
For the year and three months ended December 31, 2018, all-in sustaining costs increased compared to the prior year. All-in sustaining costs per ounce for the three months ended December 31, 2018 were impacted by the lower gold sales volumes.
25 |
DEVELOPMENT AND EXPLORATION REVIEW
Blackwater Project, British Columbia, Canada
Blackwater is a bulk-tonnage, gold-silver project located approximately 160 kilometres southwest of Prince George, a city of approximately 80,000 people, in central British Columbia, Canada. The project property position covers over 1,000 square kilometres and is located near infrastructure.
Environmental and permitting activities
The following environmental and permitting related activities occurred at Blackwater during the year and three months ended December 31, 2018:
· | The Provincial and Federal EA technical review stage continued, with the Company working through the remaining requests for information received in the quarter and now anticipates approval of the Blackwater EA in 2019. |
· | Advanced discussions with key First Nations on Participation Agreements. |
· | Advanced project trade-off studies. |
The Company will continue to assess alternative project scenarios at Blackwater that would involve lower initial capital requirements and a higher-grade pit configuration with the goal of generating positive returns at current metals prices. The Company will continue to work on receiving the EA approval in 2019, and actively working with local First Nations to complete a PA.
Project costs
For the year ended December 31, 2018, capital expenditures totalled $7.3 million, compared to $11.3 million in the prior year. For the three months ended December 31, 2018, capital expenditures totalled $1.6 million, compared to $2.4 million in the prior-year period. Expenditures in the current period related to continued advancement of the EA process, including work to resolve remaining regulatory and First Nations comments and related environmental and engineering studies, as well as discussions with First Nations on Participation Agreements.
Asset impairment
For the year ended December 31, 2018, the Company has recorded an after-tax impairment charge of $218.2 million relating to Blackwater. Please refer to the “Financial Results” section of this MD&A.
26 |
FINANCIAL CONDITION REVIEW
Balance Sheet Review
As at December 31 | As at December 31 | |
(in millions of U.S. dollars) | 2018 | 2017 |
balance sheet information | ||
Cash and cash equivalents | 103.7 | 216.2 |
Other current assets | 186.7 | 238.8 |
Non-current assets | 1,879.2 | 3,453.3 |
Assets held for sale | - | 109.0 |
Total assets | 2,169.6 | 4,017.3 |
Current liabilities | 130.9 | 181.2 |
Non-current liabilities excluding long-term debt | 298.9 | 626.1 |
Long-term debt | 780.5 | 1,007.7 |
Liabilities held for sale | - | 62.8 |
Total liabilities | 1,210.3 | 1,877.8 |
Total equity | 959.3 | 2,139.5 |
Total liabilities and equity | 2,169.6 | 4,017.3 |
Assets
Cash and cash equivalents
The decrease in cash and cash equivalents was primarily driven by the repayment of $230.0 million under the Credit Facility (the “Credit Facility”) and capital expenditures at Rainy River which were partially offset by the net proceeds from the sales of Mesquite and Peak Mines and operating cash flows generated during the year.
Other current assets
Other current assets primarily consist of trade and other receivables, inventories, prepaid expenses, and derivative assets. Other current assets decreased when compared with the prior period with a decrease in heap leach ore inventories due to the completion of the sale of Mesquite and an inventory write-down at Cerro San Pedro which was partially offset by an increase in trade and other receivables.
Non-current assets
Non-current assets consist of mining interests which include the Company’s mining properties, development projects, property, plant and equipment, and long-term inventory. The decrease in non-current assets were driven by the impairment losses at Rainy River and Blackwater and the completion of the sale of Mesquite.
Assets held for sale
Assets held for sale in the prior year consisted of Peak Mines which were sold in April 2018. A detailed discussion is included in the “Discontinued Operations” section of this MD&A.
Liabilities
Current liabilities
Current liabilities consist primarily of trade and other payables. Current liabilities decreased compared to 2017 as the prior year included current liabilities of Mesquite and a reduction in trade payables and accruals related to the payment of capital development working capital at Rainy River which was outstanding as at December 31, 2017.
27 |
Non-current liabilities excluding long-term debt
Non-current liabilities excluding long-term debt consist primarily of reclamation and closure cost obligations, the gold stream obligation and deferred tax liabilities.
The Company’s asset retirement obligations consist of reclamation and closure costs for Rainy River, New Afton, Cerro San Pedro and Blackwater. Significant reclamation and closure activities include land rehabilitation, demolition of buildings and mine facilities, ongoing monitoring, and other costs. The long-term discounted portion of the liability as at December 31, 2018 was $86.1 million, and was lower than the balance at December 31, 2017 of $121.5 million, primarily due to the sale of Mesquite.
The net deferred income tax liability decreased from $78.7 million as at December 31, 2017, to $41.5 million at December 31, 2018. The decrease was mainly driven by the impact of asset impairment at Rainy River and Blackwater, which resulted in a net deferred tax asset as at December 31, 2018 for income tax purposes, which was not recognized. The remaining net deferred tax liability pertains to the BC Mining Tax for New Afton and Blackwater.
Long-term debt and other financial liabilities containing financial covenants
The majority of the Company’s contractual obligations consist of long-term debt and interest payable. Long-term debt includes senior unsecured notes and the amounts drawn on the Company’s revolving Credit Facility.
The Company’s gold stream obligation contains a maximum leverage ratio covenant (net debt to earnings before interest, taxes, depreciation, amortization, exploration, impairment and other non-cash adjustments) of 3.5 : 1.0, with the exception that the net leverage covenant limit may increase to 4.0 : 1.0 for two consecutive quarters, provided that it thereafter returns to a maximum of 3.5 : 1.0.
The Company issued $500.0 million of senior unsecured notes (“2022 Unsecured Notes”) which mature and become due and payable on November 15, 2022, and bear interest at the rate of 6.25% per annum. The Company issued $300.0 million of senior unsecured notes (“2025 Unsecured Notes”) which mature and become due and payable on May 15, 2025, and bear interest at the rate of 6.375% per annum. Interest is payable in arrears in equal semi-annual instalments in May and November of each year. The 2022 and 2025 Unsecured Notes are subject to a minimum interest coverage incurrence covenant (earnings before interest, taxes, depreciation, amortization, impairment and other non-cash adjustments to interest) of 2.0: 1.0.
The Company holds a revolving Credit Facility with a maturity date in August 2021. As at December 31, 2018, the Credit Facility has a borrowing limit of $225.0 million, decreasing from $400.0 million as at September 30, 2018. Previously, the Credit Facility was secured by New Afton and Mesquite. The Company sold Mesquite in October 2018, which resulted in its removal as security for the Credit Facility and a reduction in the borrowing limit to $225.0 million. The Company has granted to its lenders under the credit facility a security interest in Rainy River. The Company completed perfection of the security of the Credit Facility in February 2019 and as a result, the borrowing limit has returned to $400.0 million.
The Credit Facility contains various covenants customary for a loan facility of this nature, including limits on indebtedness, asset sales and liens. The Credit Facility contains three covenant tests, the minimum interest coverage ratio, being earnings before interest, taxes, depreciation, amortization, exploration, impairment and other non-cash adjustments (“Adjusted EBITDA”) to interest, the maximum net debt to Adjusted EBITDA ratio (“Leverage Ratio”), and the maximum gross secured debt to Adjusted EBITDA, all of which are measured on a rolling four-quarter basis at the end of every quarter.
28 |
Significant financial covenants are as follows:
Year ended December 31 |
Year ended December 31 | ||
Financial covenant | 2018 | 2017 | |
Financial covenants | |||
Minimum interest coverage ratio (Adjusted EBITDA to interest) | >3.0 : 1 | 4.5 : 1 | 4.7 : 1 |
Maximum leverage ratio (net debt to Adjusted EBITDA) | <4.5 : 1 | 2.6 : 1 | 3.1 : 1 |
Maximum secured leverage ratio (secured debt to Adjusted EBITDA) | <2.0 : 1 | 0.4 : 1 | n/a |
During the year ended December 31, 2018, the Company repaid $230.0 million under the Credit Facility, reducing the outstanding amount as at December 31, 2018 to $nil. As at December 31, 2018, letters of credit amounting to $110.8 million have been issued through the Credit Facility (December 31, 2017 - $138.8 million). Letters of credit relate to reclamation bonds, and other financial assurances required with various government agencies.
Liquidity and Cash Flow
As at December 31, 2018, the Company had cash and cash equivalents of $103.7 million compared to $216.2 million at December 31, 2017. The Company’s investment policy is to invest its surplus funds in permitted investments consisting of treasury bills, bonds, notes and other evidences of indebtedness of Canada, the U.S. or any of the Canadian provinces with a minimum credit rating of R-1 mid from the DBRS or an equivalent rating from Standard & Poor’s or Moody’s and with maturities of 12 months or less at the original date of acquisition. In addition, the Company is permitted to invest in bankers’ acceptances and other evidences of indebtedness of certain financial institutions. All investments must have a maximum term to maturity of 12 months and the average term will generally range from seven days to 90 days. Under the policy, the Company is not permitted to make investments in asset-backed commercial paper.
The Company’s liquidity is impacted by several factors which include, but are not limited to, gold and copper market prices, capital expenditures, operating costs, interest rates and foreign exchange rates. These factors are monitored by the Company on a regular basis and will continue to be reviewed.
The Company’s cash flows from operating, investing and financing activities, as presented in the consolidated statements of cash flows, are summarized in the following table for the year and three months ended December 31, 2018 and 2017:
Three months ended December 31 | Year ended December 31 | |||
(in millions of U.S. dollars, except where noted) | 2018 | 2017 | 2018 | 2017 |
cash flow information | ||||
Cash generated from continuing operations | 57.8 | 58.4 | 193.0 | 197.1 |
Investing cash flows used by continuing operations (capital expenditures and other) | (39.0) | (94.3) | (212.7) | (554.1) |
Cash generated from investing activities (sale of Mesquite, Peak Mines, El Morro stream and other assets) | 150.6 | 2.6 | 193.3 | 67.9 |
Cash (used in) generated from financing activities | (194.3) | - | (312.7) | 219.8 |
Effect of exchange rate changes on cash and cash equivalents | (0.4) | (1.3) | (0.5) | 1.9 |
Cash flows related to discontinued operations | - | 43.7 | 27.2 | 97.7 |
Change in cash and cash equivalents | (25.3) | 9.1 | (112.5) | 30.3 |
Operations
For the year ended December 31, 2018, cash generated from operations was consistent with the prior-year period as the increase in operating margin was offset by an increase in working capital associated with the increase in stockpile inventory at Rainy River in comparison to the prior year including the receipt of an outstanding concentrate receivable of $21.2 million.
29 |
Investing Activities
Cash used in investing activities is primarily for the continued capital investment in the Company’s operating mines and development projects. Spending was $213.9 million for the year ended December 31, 2018 compared to $554.2 million in the prior year. In the prior year, investing activities primarily focused on project advancement at Rainy River, which reached commercial production in the fourth quarter of 2017.
For the year ended December 31, 2018, the Company received $42.4 million of net proceeds from the sale of Peak Mines which was completed in early April 2018, and $149.8 million of net proceeds from the sale of Mesquite which was completed in October 2018. The final net working capital closing adjustment will be received in February, 2019.
The following table summarizes the capital expenditures (mining interests per the audited consolidated statements of cash flows) for the year and three months ended December 31, 2018 and 2017:
Three months ended December 31 | Year ended December 31 | |||
(in millions of U.S. dollars) | 2018 | 2017 | 2018 | 2017 |
CAPital EXpenditures by site | ||||
Rainy River | 31.7 | 83.4 | 170.6 | 499.3 |
New Afton | 6.1 | 8.6 | 35.9 | 42.2 |
Cerro San Pedro | - | - | - | 0.7 |
Blackwater | 1.6 | 2.4 | 7.3 | 11.3 |
Corporate | - | 0.2 | 0.1 | 0.7 |
Capital expenditures from continuing operations | 39.4 | 94.6 | 213.9 | 554.2 |
Peak Mines | - | 13.1 | 8.7 | 34.7 |
Mesquite | 1.1 | 3.9 | 4.5 | 12.8 |
Total capital expenditures | 40.5 | 111.6 | 227.1 | 601.7 |
Financing Activities
Cash used in financing activities was primarily related to the repayment of $230.0 million under the Credit Facility and $63.2 million of interest paid on the Company’s long-term debt.
New Gold’s $400.0 million Credit Facility was previously secured by New Afton and Mesquite. Upon closing of the Mesquite sale, Rainy River was added as security to replace Mesquite in order to maintain the facility at $400.0 million and extend the maturity by one year to August 2021. Prior to the Rainy River security being perfected in February 2019, the Credit Facility was limited to a maximum draw of $225.0 million.
The Company’s December 31, 2018 cash balance of $103.7 million, together with the $114.2 million available for drawdown under the Credit Facility at December 31, 2018 provided the Company with approximately $217.9 million of liquidity. The liquidity increased to $392.9 million with $175 million of additional Credit Facility availability upon the perfection of the Rainy River security, which occurred in February 2019.
The net cash generated by operations is highly dependent on metal prices, including gold and copper, as well as other factors, including the Canadian/U.S. dollar exchange rate. To mitigate a portion of this risk, in December 2018, the Company entered into copper and gold price option collar contracts for 2019 production by purchasing put options and selling call options covering 21,600 tonnes of copper and 192,000 ounces of gold.
30 |
In 2019, the Company will be completing all remaining construction at Rainy River and will be starting the C-zone development at New Afton resulting in significant capital expenditures that are expected to exceed total cash generated from operations. Assuming the continuation of prevailing commodity prices and exchange rates, and operations performing in accordance with mine plans, the Company believes it has adequate liquidity to implement its near-term operational plan and will be able to repay future indebtedness from a combination of internally generated cash flow, refinancing activities and other corporate actions.
Commitments
The Company has entered into a number of contractual commitments for capital items relating to operations and development. As at December 31, 2018, these commitments totalled $27.2 million, $26.9 million of which is expected to come due over the next 12 months. This compares to commitments of $51.4 million as at December 31, 2017, $48.5 million of which was expected to come due over the upcoming year. Certain contractual commitments may contain cancellation clauses; however, the Company discloses its commitments based on management’s intent to fulfill the contracts.
Contingencies
In assessing the loss contingencies related to legal proceedings that are pending against the Company or unasserted claims that may result in such proceedings, the Company and its legal counsel evaluate the perceived merits of any legal proceedings or unasserted claims as well as the perceived merits of the amount of relief sought or expected to be sought. If the assessment of a contingency suggests that a loss is probable, and the amount can easily be estimated, then a loss is recorded. When a contingent loss is not probable but is reasonably possible, or is probable but the amount of the loss cannot be reliably estimated, then details of the contingent loss are disclosed. Loss contingencies considered remote are generally not disclosed unless they involve guarantees, in which case the Company discloses the nature of the guarantees. If the Company is unable to resolve these disputes favourably, it may have a material adverse impact on our financial condition, cash flow and results of operations. As at December 31, 2018 and 2017 there were no contingent losses recorded.
31 |
Contractual Obligations
The following is a summary of the Company’s payments due under contractual obligations:
As at December 31 |
As at December 31 | |||||
(in millions of U.S. dollars, except where noted) | < 1 year | 1-3 Years | 4-5 Years | After 5 Years |
2018 Total |
2017 Total |
CONTRACTUAL OBLIGATIONS(1) | ||||||
Long-term debt | - | - | 500.0 | 300.0 | 800.0 | 1,030.0 |
Interest payable on long-term debt | 50.3 | 100.8 | 65.5 | 26.3 | 242.9 | 292.9 |
Total lease commitments | 9.3 | 6.6 | 4.0 | - | 19.9 | 10.3 |
Capital expenditure commitments | 26.9 | 0.2 | 0.1 | - | 27.2 | 51.4 |
Reclamation and closure cost obligations | 6.6 | 21.8 | 9.8 | 78.4 | 116.6 | 187.1 |
Gold stream obligation | 19.2 | 43.5 | 55.2 | 149.6 | 267.5 | 290.5 |
Total contractual obligations | 112.3 | 172.9 | 634.6 | 554.3 | 1,474.1 | 1,862.2 |
Related Party Transactions
The Company did not enter into any related party transactions during the year and three month ended December 31, 2018 and 2017.
Off-Balance Sheet Arrangements
The Company has no off-balance sheet arrangements.
Outstanding Shares
As at February 13, 2019, there were 579,115,291 common shares of the Company outstanding. The Company had 8,730,978 stock options outstanding under its share option plan, exercisable for up to 8,730,978 common shares.
32 |
NON-GAAP FINANCIAL PERFORMANCE MEASURES
Total Cash Costs per Gold Ounce
“Total cash costs per gold ounce” is a non-GAAP measure that is a common financial performance measure in the gold mining industry but with no standard meaning under IFRS. New Gold reports total cash costs on a sales basis. The Company believes that, in addition to conventional measures prepared in accordance with IFRS, certain investors use this information to evaluate the Company’s performance and ability to generate liquidity through operating cash flow to fund future capital expenditures and working capital needs. New Gold believes that this measure, along with sales, is a key indicator of a Company’s ability to generate operating earnings and cash flow from its mining operations.
Total cash cost figures are calculated in accordance with a standard developed by The Gold Institute, a worldwide association of suppliers of gold and gold products that ceased operations in 2002. Adoption of the standard is voluntary and the cost measures presented may not be comparable to other similarly titled measures of other companies. Total cash costs include mine site operating costs such as mining, processing and administration costs, royalties, production taxes, but are exclusive of depreciation, amortization, reclamation, capital and exploration costs and net of by-product sales. Total cash costs are then divided by gold ounces sold to arrive at the total cash costs per ounce sold.
The Company produces copper and silver as by-products of its gold production. The calculation of total cash costs per gold ounce for Rainy River and Cerro San Pedro is net of by-product silver sales revenue, and the calculation of total cash costs per gold ounce sold for New Afton is net of by-product silver and copper sales revenue. New Gold notes that in connection with New Afton, the copper by-product revenue is sufficiently large to result in a negative total cash cost on a single mine basis. Notwithstanding this by-product contribution, as a Company focused on gold production, New Gold aims to assess the economic results of its operations in relation to gold, which is the primary driver of New Gold’s business. New Gold believes this metric is of interest to its investors, who invest in the Company primarily as a gold mining Company. To determine the relevant costs associated with gold only, New Gold believes it is appropriate to reflect all operating costs, as well as any revenue related to metals other than gold that are extracted in its operations.
To provide additional information to investors, New Gold has also calculated total cash costs on a co-product basis, which removes the impact of other metal sales that are produced as a by-product of gold production and apportions the cash costs to each metal produced on a percentage of revenue basis, and subsequently divides the amount by the total gold ounces, silver ounces or pounds of copper sold, as the case may be, to arrive at per ounce or per pound figures. In 2019, in addition to reporting total cash costs on a co-product basis per gold ounce, silver ounce or pound of copper sold, the Company will also report gold equivalent total cash costs per ounce on a co-product basis. Gold equivalent ounces of copper and silver produced will be computed as pounds of copper and silver ounces produced multiplied by the ratio of the average realized copper and silver price to the average realized gold price. Unless indicated otherwise, all total cash cost information in this MD&A is net of by-product sales.
Total cash costs are intended to provide additional information only and do not have any standardized meaning under IFRS and may not be comparable to similar measures presented by other mining companies. They should not be considered in isolation or as a substitute for measures of performance prepared in accordance with IFRS. The measure is not necessarily indicative of cash flow from operations under IFRS or operating costs presented under IFRS.
33 |
All-in Sustaining Costs per Gold Ounce
“All-in sustaining costs per gold ounce” is a non-GAAP measure based on guidance announced by the World Gold Council (“WGC”) in September 2013. The WGC is a non-profit association of the world’s leading gold mining companies established in 1987 to promote the use of gold to industry, consumers and investors. The WGC is not a regulatory body and does not have the authority to develop accounting standards or disclosure requirements. The WGC has worked with its member companies, to develop a measure that expands on IFRS measures such as operating expenses and non-GAAP measures to provide visibility into the economics of a gold mining Company. Current IFRS measures used in the gold industry, such as operating expenses, do not capture all of the expenditures incurred to discover, develop and sustain gold production. New Gold believes the all-in sustaining costs measure provides further transparency into costs associated with producing gold and will assist analysts, investors and other stakeholders of the Company in assessing its operating performance, its ability to generate free cash flow from current operations and its overall value. In addition, the Human Resources and Compensation Committee of the Board of Directors uses all-in sustaining costs, together with other measures, in its Company scorecard to set incentive compensation goals and assess performance.
All-in sustaining costs per gold ounce is intended to provide additional information only and does not have any standardized meaning under IFRS and may not be comparable to similar measures presented by other mining companies. It should not be considered in isolation or as a substitute for measures of performance prepared in accordance with IFRS. The measure is not necessarily indicative of cash flow from operations under IFRS or operating costs presented under IFRS.
New Gold defines all-in sustaining costs per ounce as the sum of total cash costs, net capital expenditures that are sustaining in nature, corporate general and administrative costs, capitalized and expensed exploration costs that are sustaining in nature, and environmental reclamation costs, all divided by the total gold ounces sold to arrive at a per ounce figure. To determine sustaining capital expenditures, New Gold uses cash flow related to mining interests from its statement of cash flows and deducts any expenditures that are non-sustaining (growth). Capital expenditures to develop new operations or capital expenditures related to major projects at existing operations where these projects will materially benefit the operation are classified as non-sustaining and are excluded. The definition of sustaining versus non-sustaining is similarly applied to capitalized and expensed exploration costs. Exploration costs to develop new operations or that relate to major projects at existing operations where these projects are expected to materially benefit the operation are classified as non-sustaining and are excluded.
Costs excluded from all-in sustaining costs are non-sustaining capital expenditures and exploration costs, financing costs, tax expense, transaction costs associated with mergers, acquisitions and divestitures, and any items that are deducted for the purposes of adjusted earnings.
To provide additional information to investors, New Gold has also calculated all-in sustaining costs per ounce on a co-product basis, which removes the impact of other metal sales that are produced as a by-product of gold production and apportions the all-in sustaining costs to each metal produced on a percentage of revenue basis, and subsequently divides the amount by the total gold ounces, silver ounces or pounds of copper sold, as the case may be, to arrive at per ounce or per pound figures. In 2019, in addition to reporting all-in sustaining costs on a co-product basis per gold ounce, silver ounce or pound of copper sold, the Company will also report gold equivalent all-in sustaining costs per ounce on a co-product basis. Gold equivalent ounces of copper and silver produced will be computed as pounds of copper and silver ounces produced multiplied by the ratio of the average realized copper and silver price to the average realized gold price. Unless indicated otherwise, all all-in sustaining costs information in this MD&A is net of by-product sales. By including total cash costs as a component of all-in sustaining costs, the measure deducts by-product revenue from gross cash costs.
34 |
Cash Costs and All-in Sustaining Costs (“AISC”) per Ounce Reconciliation Tables
The following tables reconcile these non-GAAP measures to the most directly comparable IFRS measure on an aggregate and mine-by-mine basis.
Three months ended December 31, 2018 | ||||
(in millions of U.S. dollars, except where noted) | Gold | Copper | Silver | Total |
COnsolidated Opex, Cash cost and aisc reconciliation | ||||
Operating expenses(1) | 47.9 | 27.0 | 0.9 | 75.8 |
Units of metal sold from continuing operations (ounces/millions of pounds/millions of ounces) | 84,421 | 19.7 | 0.1 | |
Operating expenses per unit of metal sold ($/ounce or pound) | 568 | 1.37 | 6.44 | |
Operating expenses(1) | 47.9 | 27.0 | 0.9 | 75.8 |
Treatment and refining charges on concentrate sales | 1.8 | 5.1 | 0.1 | 7.0 |
Adjustments(2) | (4.2) | (2.4) | (0.1) | (6.7) |
Total cash costs from continuing operations | 45.5 | 29.7 | 0.9 | 76.2 |
By-product silver and copper sales from continuing operations | (60.5) | |||
Total cash costs net of by-product revenue from continuing operations | 15.7 | |||
Units of metal sold from continuing operations (ounces/millions of pounds/millions of ounces) | 84,421 | 19.7 | 0.1 | |
Total cash costs on a co-product basis from continuing operations (3) ($/ounce or pound) | 540 | 1.50 | 6.45 | |
Total cash costs per gold ounce sold from continuing operations ($/ounce) | 186 | |||
Total co-product cash costs from continuing operations | 45.5 | 29.7 | 0.9 | |
Total cash costs net of by-product revenue from continuing operations | 15.7 | |||
Sustaining capital expenditures(4) | 18.6 | 10.4 | 0.4 | 29.4 |
Sustaining exploration - expensed | 0.9 | 0.5 | - | 1.4 |
Corporate G&A including share-based compensation(5) | 6.0 | 3.4 | 0.1 | 9.5 |
Reclamation expenses | 1.3 | 0.7 | - | 2.0 |
Total co-product all-in sustaining costs from continuing operations | 72.4 | 44.7 | 1.4 | |
Total all-in sustaining costs net of by-product revenue from continuing operations | 58.0 | |||
All-in sustaining costs on a co-product basis from continuing operations(3) ($/ounce or pound) | 857 | 2.27 | 10.05 | |
All-in sustaining costs per gold ounce sold from continuing operations ($/ounce) | 688 | |||
Total co-product all-in sustaining costs (6) | 83.3 | 45.1 | 1.5 | |
Total all-in sustaining costs net of by-product revenue (6) | 69.4 | |||
All-in sustaining costs on a co-product basis(3) ($/ounce or pound) | 862 | 2.29 | 10.13 | |
All-in sustaining costs per gold ounce sold ($/ounce) | 718 |
1. | Operating expenses (“Opex”) are apportioned to each metal produced on a percentage of revenue basis. |
2. | Adjustments include the non-cash inventory write-down associated with Cerro San Pedro transitioning to the reclamation phase of its mine life cycle and social closure costs incurred at Cerro San Pedro included in operating expenses. |
3. | Amounts presented on a co-product basis remove the impact of other metal sales that are produced as a by-product of our gold production and apportions the cash costs to each metal produced on a percentage of revenue basis. |
4. | See “Total Sustaining Capital Expenditure Reconciliation” to reconcile sustaining capital expenditures to mining interests per the statement of cash flows. |
5. | Includes the sum of corporate administration costs and share-based payment expense per the income statement, net of any non-cash depreciation within those figures. |
6. | Includes the impact of Mesquite and Peak Mines, which has been classified as a discontinued operation as at and for the year ended December 31, 2018. |
35 |
Year ended December 31, 2018 | ||||
(in millions of U.S. dollars, except where noted) | Gold | Copper | Silver | Total |
COnsolidated Opex, Cash cost and aisc reconciliation | ||||
Operating expenses(1) | 193.0 | 127.1 | 5.4 | 325.4 |
Units of metal sold from continuing operations (ounces/millions of pounds/millions of ounces) | 298,002 | 81.1 | 0.7 | |
Operating expenses per unit of metal sold ($/ounce or pound) | 648 | 1.56 | 7.93 | |
Operating expenses(1) | 193.0 | 127.1 | 5.4 | 325.4 |
Treatment and refining charges on concentrate sales | 8.0 | 21.6 | 0.4 | 30.0 |
Adjustments(2) | (10.0) | (6.6) | (0.3) | (16.9) |
Total cash costs | 191.0 | 142.1 | 5.5 | 338.6 |
By-product silver and copper sales from continuing operations | (258.2) | |||
Total cash costs net of by-product revenue from continuing operations | 80.4 | |||
Units of metal sold from continuing operations (ounces/millions of pounds/millions of ounces) | 298,002 | 81.1 | 0.7 | |
Total cash costs on a co-product basis from continuing operations (3) ($/ounce or pound) | 641 | 1.75 | 8.10 | |
Total cash costs per gold ounce sold from continuing operations ($/ounce) | 270 | |||
Total co-product cash costs from continuing operations | 191.0 | 142.1 | 5.5 | |
Total cash costs net of by-product revenue from continuing operations | 80.4 | |||
Sustaining capital expenditures(4) | 102.7 | 67.6 | 2.9 | 173.2 |
Sustaining exploration - expensed | 1.7 | 1.1 | 0.1 | 2.9 |
Corporate G&A including share-based compensation(5) | 13.7 | 9.0 | 0.4 | 23.2 |
Reclamation expenses | 3.9 | 2.6 | 0.1 | 6.6 |
Total co-product all-in sustaining costs from continuing operations | 313.0 | 222.4 | 9.0 | |
Total all-in sustaining costs net of by-product revenue from continuing operations | 286.3 | |||
All-in sustaining costs on a co-product basis from continuing operations (3) ($/ounce or pound) | 1,051 | 2.74 | 13.12 | |
All-in sustaining costs per gold ounce sold from continuing operations ($/ounce) | 961 | |||
Total co-product all-in sustaining costs (6) | 440.7 | 228.9 | 9.4 | |
Total all-in sustaining costs net of by-product revenue (6) | 402.3 | |||
All-in sustaining costs on a co-product basis(3) ($/ounce or pound) | 1,013 | 2.67 | 12.83 | |
All-in sustaining costs per gold ounce sold ($/ounce) | 925 |
1. | Operating expenses (“Opex”) are apportioned to each metal produced on a percentage of revenue basis. |
2. | Adjustments include the non-cash inventory write-down associated with Cerro San Pedro transitioning to the reclamation phase of its mine life cycle and social closure costs incurred at Cerro San Pedro included in operating expenses. |
3. | Amounts presented on a co-product basis remove the impact of other metal sales that are produced as a by-product of our gold production and apportions the cash costs to each metal produced on a percentage of revenue basis. |
4. | See “Total Sustaining Capital Expenditure Reconciliation” to reconcile sustaining capital expenditures to mining interests per the statement of cash flows. |
5. | Includes the sum of corporate administration costs and share-based payment expense per the income statement, net of any non-cash depreciation within those figures. |
6. | Includes the impact of Mesquite and Peak Mines, which have been classified as a discontinued operation as at and for the year ended December 31, 2018. |
36 |
Three months ended December 31, 2017 | ||||
(in millions of U.S. dollars, except where noted) | Gold | Copper | Silver | Total |
COnsolidated Opex, Cash cost and aisc reconciliation | ||||
Operating expenses(1) | 39.6 | 34.3 | 2.2 | 76.1 |
Units of metal sold from continuing operations (ounces/millions of pounds/millions of ounces) | 54,170 | 22.0 | 0.2 | |
Operating expenses per unit of metal sold ($/ounce or pound) | 731 | 1.56 | 9.39 | |
Operating expenses(1) | 39.6 | 34.3 | 2.2 | 76.1 |
Treatment and refining charges on concentrate sales | 2.5 | 5.8 | 0.1 | 8.4 |
Adjustments(2) | 0.1 | - | - | 0.1 |
Total cash costs from continuing operations | 42.1 | 40.1 | 2.3 | 84.6 |
By-product silver and copper sales from continuing operations | (63.3) | |||
Total cash costs net of by-product revenue from continuing operations | 21.3 | |||
Units of metal sold from continuing operations (ounces/millions of pounds/millions of ounces) | 54,170 | 22.0 | 0.2 | |
Total cash costs on a co-product basis from continuing operations (3) ($/ounce or pound) | 778 | 1.82 | 9.85 | |
Total cash costs per gold ounce sold from continuing operations ($/ounce) | 393 | |||
Total co-product cash costs from continuing operations | 42.1 | 40.1 | 2.3 | |
Total cash costs net of by-product revenue from continuing operations | 21.3 | |||
Sustaining capital expenditures(4) | 5.8 | 5.0 | 0.3 | 11.2 |
Sustaining exploration - expensed | 0.3 | 0.2 | - | 0.5 |
Corporate G&A including share-based compensation(5) | 2.0 | 1.7 | 0.1 | 3.8 |
Reclamation expenses | 1.0 | 0.8 | 0.1 | 1.9 |
Total co-product all-in sustaining costs from continuing operations | 51.2 | 48.0 | 2.8 | |
Total all-in sustaining costs net of by-product revenue from continuing operations | 38.6 | |||
All-in sustaining costs on a co-product basis from continuing operations(3) ($/ounce or pound) | 945 | 2.18 | 12.00 | |
All-in sustaining costs per gold ounce sold from continuing operations ($/ounce) | 714 | |||
Total co-product all-in sustaining costs (6) | 131.6 | 54.1 | 3.6 | |
Total all-in sustaining costs net of by-product revenue (6) | 110.7 | |||
All-in sustaining costs on a co-product basis(3) ($/ounce or pound) | 916 | 2.17 | 11.91 | |
All-in sustaining costs per gold ounce sold ($/ounce) | 771 |
1. | Operating expenses are apportioned to each metal produced on a percentage of revenue basis. |
2. | Adjustments include non-cash items related to inventory write-down reversals and social closure costs incurred at Cerro San Pedro that are included in operating expenses. |
3. | Amounts presented on a co-product basis remove the impact of other metal sales that are produced as a by-product of our gold production and apportions the cash costs to each metal produced on a percentage of revenue basis. |
4. | See “Total Sustaining Capital Expenditure Reconciliation” to reconcile sustaining capital expenditures to mining interests per the statement of cash flows. |
5. | Includes the sum of corporate administration costs and share-based payment expense per the income statement, net of any non-cash depreciation within those figures. |
6. | Includes the impact of Mesquite and Peak Mines, which has been classified as a discontinued operation as at and for the year ended December 31, 2018. |
37 |
Year ended December 31, 2017 | ||||
(in millions of U.S. dollars, except where noted) | Gold | Copper | Silver | Total |
COnsolidated Opex, Cash cost and aisc reconciliation | ||||
Operating expenses(1) | 85.0 | 106.1 | 7.1 | 198.3 |
Units of metal sold from continuing operations (ounces/millions of pounds/millions of ounces) | 140,654 | 84.5 | 0.9 | |
Operating expenses per unit of metal sold ($/ounce or pound) | 605 | 1.26 | 7.98 | |
Operating expenses(1) | 85.0 | 106.1 | 7.1 | 198.3 |
Treatment and refining charges on concentrate sales | 9.6 | 20.7 | 0.4 | 30.7 |
Adjustments(2) | (0.4) | (0.4) | - | (0.8) |
Total cash costs | 94.2 | 126.4 | 7.5 | 228.1 |
By-product silver and copper sales from continuing operations | (239.6) | |||
Total cash costs net of by-product revenue from continuing operations | (11.5) | |||
Units of metal sold from continuing operations (ounces/millions of pounds/millions of ounces) | 140,654 | 84.5 | 0.9 | |
Total cash costs on a co-product basis from continuing operations (3) ($/ounce or pound) | 670 | 1.49 | 8.42 | |
Total cash costs per gold ounce sold from continuing operations ($/ounce) | (82) | |||
Total co-product cash costs from continuing operations | 94.2 | 126.4 | 7.5 | |
Total cash costs net of by-product revenue from continuing operations | (11.5) | |||
Sustaining capital expenditures(4) | 18.4 | 23.0 | 1.5 | 42.9 |
Sustaining exploration - expensed | 0.9 | 1.1 | 0.1 | 2.1 |
Corporate G&A including share-based compensation(5) | 12.1 | 15.2 | 1.0 | 28.3 |
Reclamation expenses | 2.9 | 3.6 | 0.2 | 6.7 |
Total co-product all-in sustaining costs from continuing operations | 128.6 | 169.3 | 10.3 | |
Total all-in sustaining costs net of by-product revenue from continuing operations | 68.5 | |||
All-in sustaining costs on a co-product basis from continuing operations (3) ($/ounce or pound) | 914 | 2.00 | 11.65 | |
All-in sustaining costs per gold ounce sold from continuing operations ($/ounce) | 488 | |||
Total co-product all-in sustaining costs (6) | 372.8 | 198.9 | 12.9 | |
Total all-in sustaining costs net of by-product revenue (6) | 298.2 | |||
All-in sustaining costs on a co-product basis(3) ($/ounce or pound) (4) | 909 | 2.06 | 12.01 | |
All-in sustaining costs per gold ounce sold ($/ounce) (4) | 727 |
1. | Operating expenses (“Opex”) are apportioned to each metal produced on a percentage of revenue basis. |
2. | Adjustments include non-cash items related to inventory write-down reversals and social closure costs incurred at Cerro San Pedro that are included in operating expenses. |
3. | Amounts presented on a co-product basis remove the impact of other metal sales that are produced as a by-product of our gold production and apportions the cash costs to each metal produced on a percentage of revenue basis. |
4. | See “Total Sustaining Capital Expenditure Reconciliation” to reconcile sustaining capital expenditures to mining interests per the statement of cash flows. |
5. | Includes the sum of corporate administration costs and share-based payment expense per the income statement, net of any non-cash depreciation within those figures. |
6. | Includes the impact of Mesquite and Peak Mines, which have been classified as a discontinued operation as at and for the year ended December 31, 2018. |
38 |
Three months ended December 31, 2018 | |||
(in millions of U.S. dollars, except where noted) | Gold | Silver | Total |
RAINY RIVER OPEX, cash costs and AISC reconciliation | |||
Operating expenses(1) | 42.8 | 0.5 | 43.3 |
Units of metal sold (ounces/millions of ounces) | 66,123 | 0.1 | |
Operating expenses per unit of metal sold ($/ounce) | 648 | 7.66 | |
Operating expenses(1) | 42.8 | 0.5 | 43.3 |
By-product silver sales | (0.9) | ||
Total cash costs net of by-product revenue | 42.4 | ||
Units of metal sold (ounces/millions of ounces) | 66,123 | 0.1 | |
Total cash costs on a co-product basis(2) ($/ounce) | 648 | 7.66 | |
Total cash costs per gold ounce sold ($/ounce) | 641 | ||
Total co-product cash costs | 42.8 | 0.5 | |
Total cash costs net of by-product revenue | 42.4 | ||
Sustaining capital expenditures | 25.3 | 0.3 | 25.6 |
Sustaining exploration expense | 0.1 | - | 0.1 |
Reclamation expenses | 1.6 | - | 1.6 |
Total co-product all-in sustaining costs | 69.8 | 0.8 | |
Total all-in sustaining costs net of by-product revenue | 69.7 | ||
All-in sustaining costs on a co-product basis(2) ($/ounce) | 1,056 | 12.49 | |
All-in sustaining costs per gold ounce sold ($/ounce) | 1,054 |
1. | Operating expenses are apportioned to each metal produced on a percentage of revenue basis. |
2. | Amounts presented on a co-product basis remove the impact of other metal sales that are produced as a by-product of our gold production and apportions the cash costs to each metal produced on a percentage of revenue basis. |
Year ended December 31, 2018 | |||
(in millions of U.S. dollars, except where noted) | Gold | Silver | Total |
RAINY RIVER OPEX, cash costs and AISC reconciliation | |||
Operating expenses(1) | 177.5 | 2.5 | 179.9 |
Units of metal sold (ounces/millions of ounces) | 214,804 | 0.2 | |
Operating expenses per unit of metal sold ($/ounce) | 826 | 10.26 | |
Operating expenses(1) | 177.5 | 2.5 | 179.9 |
By-product silver sales | (3.8) | ||
Total cash costs net of by-product revenue | 176.2 | ||
Units of metal sold (ounces/millions of ounces) | 214,804 | 0.2 | |
Total cash costs on a co-product basis(2) ($/ounce) | 826 | 10.26 | |
Total cash costs per gold ounce sold ($/ounce) | 820 | ||
Total co-product cash costs | 177.5 | 2.5 | |
Total cash costs net of by-product revenue | 176.2 | ||
Sustaining capital expenditures | 139.9 | 1.9 | 141.9 |
Sustaining exploration expense | 0.5 | - | 0.5 |
Reclamation expenses | 3.9 | 0.1 | 4.0 |
Total co-product all-in sustaining costs | 321.8 | 4.5 | |
Total all-in sustaining costs net of by-product revenue | 322.5 | ||
All-in sustaining costs on a co-product basis(2) ($/ounce) | 1,498 | 18.61 | |
All-in sustaining costs per gold ounce sold ($/ounce) | 1,501 |
1. | Operating expenses are apportioned to each metal produced on a percentage of revenue basis. |
2. | Amounts presented on a co-product basis remove the impact of other metal sales that are produced as a by-product of our gold production and apportions the cash costs to each metal produced on a percentage of revenue basis. |
39 |
Three months and year ended December 31, 2017 | |||
(in millions of U.S. dollars, except where noted) | Gold | Silver | Total |
RAINY RIVER OPEX, cash costs and AISC reconciliation | |||
Operating expenses(1) | 37.8 | 0.7 | 38.5 |
Units of metal sold (ounces/millions of ounces) | 26,359 | 39,739 | |
Operating expenses per unit of metal sold ($/ounce) | 1,432 | 18.52 | |
Operating expenses(1) | 37.8 | 0.7 | 38.5 |
By-product silver and copper sales | (0.7) | ||
Total cash costs net of by-product revenue | 37.8 | ||
Units of metal sold (ounces/millions of ounces) | 26,359 | 39,739 | |
Total cash costs on a co-product basis(2) ($/ounce) | 1,432 | 18.5 | |
Total cash costs per gold ounce sold ($/ounce) | 1,436 | ||
Total co-product cash costs | 37.8 | 0.7 | |
Total cash costs net of by-product revenue | 37.8 | ||
Sustaining capital expenditures | 2.6 | 0.1 | 2.6 |
Reclamation expenses | 0.3 | - | 0.3 |
Total co-product all-in sustaining costs | 40.7 | 0.8 | |
Total all-in sustaining costs net of by-product revenue | 40.8 | ||
All-in sustaining costs on a co-product basis(2) ($/ounce) | 1,543 | 19.96 | |
All-in sustaining costs per gold ounce sold ($/ounce) | 1,549 |
1. | Operating expenses are apportioned to each metal produced on a percentage of revenue basis. |
2. | Amounts presented on a co-product basis remove the impact of other metal sales that are produced as a by-product of our gold production and apportions the cash costs to each metal produced on a percentage of revenue basis. |
40 |
Three months ended December 31, 2018 | ||||
(in millions of U.S. dollars, except where noted) | Gold | Copper | Silver | Total |
NEW AFTON OPEX, cash costs and AISC reconciliation | ||||
Operating expenses(1) | 6.4 | 17.7 | 0.3 | 24.5 |
Units of metal sold (ounces/millions of pounds/millions of ounces) | 17,176 | 19.7 | 0.1 | |
Operating expenses per unit of metal sold ($/ounce or pound) | 375 | 0.9 | 4.1 | |
Operating expenses | 6.4 | 17.7 | 0.3 | 24.5 |
Treatment and refining charges on concentrate sales | 1.8 | 5.1 | 0.1 | 7.0 |
Total cash costs | 8.3 | 22.8 | 0.4 | 31.4 |
By-product silver and copper sales | (59.4) | |||
Total cash costs net of by-product revenue | (28.0) | |||
Units of metal sold (ounces/millions of pounds/millions of ounces) | 17,176 | 19.7 | 0.1 | |
Total cash costs on a co-product basis(2) ($/ounce or pound) | 482 | 1.16 | 5.2 | |
Total cash costs per gold ounce sold ($/ounce) | (1,629) | |||
Total co-product cash costs | 8.3 | 22.8 | 0.4 | |
Total cash costs net of by-product revenue | (28.0) | |||
Sustaining capital expenditures | 1.3 | 3.6 | 0.1 | 5.0 |
Sustaining exploration expense | - | 0.1 | - | 0.1 |
Reclamation expenses | 0.1 | 0.3 | - | 0.4 |
Total co-product all-in sustaining costs | 9.7 | 26.8 | 0.5 | |
Total all-in sustaining costs net of by-product revenue | (22.4) | |||
All-in sustaining costs on a co-product basis(2) ($/ounce or pound) | 567 | 1.36 | 6.12 | |
All-in sustaining costs per gold ounce sold ($/ounce) | (1,306) |
1. | Operating expenses are apportioned to each metal produced on a percentage of revenue basis. |
2. | Amounts presented on a co-product basis remove the impact of other metal sales that are produced as a by-product of our gold production and apportions the cash costs to each metal produced on a percentage of revenue basis. |
Year ended December 31, 2018 | ||||
(in millions of U.S. dollars, except where noted) | Gold | Copper | Silver | Total |
NEW AFTON OPEX, cash costs and AISC reconciliation | ||||
Operating expenses(1) | 27.8 | 75.1 | 1.4 | 104.3 |
Units of metal sold (ounces/millions of pounds/millions of ounces) | 72,489 | 81.1 | 0.3 | |
Operating expenses per unit of metal sold ($/ounce or pound) | 384 | 0.93 | 4.53 | |
Operating expenses | 27.8 | 75.1 | 1.4 | 104.3 |
Treatment and refining charges on concentrate sales | 8.0 | 21.6 | 0.4 | 30.0 |
Total cash costs | 35.8 | 96.8 | 1.8 | 134.4 |
By-product silver and copper sales | (252.2) | |||
Total cash costs net of by-product revenue | (117.9) | |||
Units of metal sold (ounces/millions of pounds/millions of ounces) | 72,489 | 81.1 | 0.3 | |
Total cash costs on a co-product basis(2) ($/ounce or pound) | 495 | 1.19 | 5.84 | |
Total cash costs per gold ounce sold ($/ounce) | (1,626) | |||
Total co-product cash costs | 35.8 | 96.8 | 1.8 | |
Total cash costs net of by-product revenue | (117.9) | |||
Sustaining capital expenditures | 8.7 | 23.5 | 0.4 | 32.6 |
Sustaining exploration expense | 0.1 | 0.3 | - | 0.4 |
Reclamation expenses | 0.5 | 1.3 | - | 1.8 |
Total co-product all-in sustaining costs | 45.1 | 121.9 | 2.2 | |
Total all-in sustaining costs net of by-product revenue | (83.2) | |||
All-in sustaining costs on a co-product basis(2) ($/ounce or pound) | 623 | 1.50 | 7.35 | |
All-in sustaining costs per gold ounce sold ($/ounce) | (1,147) |
1. | Operating expenses are apportioned to each metal produced on a percentage of revenue basis. |
2. | Amounts presented on a co-product basis remove the impact of other metal sales that are produced as a by-product of our gold production and apportions the cash costs to each metal produced on a percentage of revenue basis. |
41 |
Three months ended December 31, 2017 | ||||
(in millions of U.S. dollars, except where noted) | Gold | Copper | Silver | Total |
NEW AFTON OPEX, cash costs and AISC reconciliation | ||||
Operating expenses(1) | 7.3 | 17.1 | 0.3 | 24.7 |
Units of metal sold (ounces/millions of pounds/millions of ounces) | 20,132 | 22.0 | 0.1 | |
Operating expenses per unit of metal sold ($/ounce or pound) | 362 | 0.78 | 4.45 | |
Operating expenses | 7.3 | 17.1 | 0.3 | 24.7 |
Treatment and refining charges on concentrate sales | 2.5 | 5.8 | 0.1 | 8.4 |
Total cash costs | 9.8 | 23.0 | 0.5 | 33.1 |
By-product silver and copper sales | (60.5) | |||
Total cash costs net of by-product revenue | (27.4) | |||
Units of metal sold (ounces/millions of pounds/millions of ounces) | 20,132 | 22.0 | 0.1 | |
Total cash costs on a co-product basis(2) ($/ounce or pound) | 484 | 1.04 | 5.96 | |
Total cash costs per gold ounce sold ($/ounce) | (1,363) | |||
Total co-product cash costs | 9.7 | 23.0 | 0.4 | |
Total cash costs net of by-product revenue | (27.4) | |||
Sustaining capital expenditures | 2.4 | 5.8 | 0.1 | 8.3 |
Sustaining exploration expense | 0.1 | 0.2 | - | 0.3 |
Reclamation expenses | 0.2 | 0.3 | - | 0.5 |
Total co-product all-in sustaining costs | 12.4 | 29.3 | 0.5 | |
Total all-in sustaining costs net of by-product revenue | (18.2) | |||
All-in sustaining costs on a co-product basis(2) ($/ounce or pound) | 617 | 1.33 | 7.60 | |
All-in sustaining costs per gold ounce sold ($/ounce) | (909) |
1. | Operating expenses are apportioned to each metal produced on a percentage of revenue basis. |
2. | Amounts presented on a co-product basis remove the impact of other metal sales that are produced as a by-product of our gold production and apportions the cash costs to each metal produced on a percentage of revenue basis. |
Year ended December 31, 2017 | ||||
(in millions of U.S. dollars, except where noted) | Gold | Copper | Silver | Total |
NEW AFTON OPEX, cash costs and AISC reconciliation | ||||
Operating expenses(1) | 33.4 | 72.3 | 1.4 | 107.1 |
Units of metal sold (ounces/millions of pounds/millions of ounces) | 81,067 | 84.5 | 0.3 | |
Operating expenses per unit of metal sold ($/ounce or pound) | 412 | 0.85 | 5.36 | |
Operating expenses | 33.4 | 72.3 | 1.4 | 107.1 |
Treatment and refining charges on concentrate sales | 9.6 | 20.6 | 0.5 | 30.7 |
Total cash costs | 43.0 | 92.9 | 1.9 | 137.8 |
By-product silver and copper sales | (229.0) | |||
Total cash costs net of by-product revenue | (91.2) | |||
Units of metal sold (ounces/millions of pounds/millions of ounces) | 81,067 | 84.5 | 0.3 | |
Total cash costs on a co-product basis(2) ($/ounce or pound) | 530 | 1.10 | 6.89 | |
Total cash costs per gold ounce sold ($/ounce) | (1,126) | |||
Total co-product cash costs | 43.0 | 92.9 | 1.9 | |
Total cash costs net of by-product revenue | (91.3) | |||
Sustaining capital expenditures | 12.2 | 26.3 | 0.5 | 39.1 |
Sustaining exploration expense | 0.3 | 1.0 | - | 1.3 |
Reclamation expenses | 0.6 | 1.2 | - | 1.8 |
Total co-product all-in sustaining costs | 56.1 | 121.4 | 2.4 | |
Total all-in sustaining costs net of by-product revenue | (49.0) | |||
All-in sustaining costs on a co-product basis(2) ($/ounce or pound) | 692 | 1.44 | 9.00 | |
All-in sustaining costs per gold ounce sold ($/ounce) | (605) |
1. | Operating expenses are apportioned to each metal produced on a percentage of revenue basis. |
2. | Amounts presented on a co-product basis remove the impact of other metal sales that are produced as a by-product of our gold production and apportions the cash costs to each metal produced on a percentage of revenue basis. |
42 |
Three months ended December 31, 2018 | |||
(in millions of U.S. dollars, except where noted) | Gold | Silver | Total |
CERRO SAN PEDRO OPEX, cash costs and AISC reconciliation | |||
Operating expenses(1) | 7.4 | 0.7 | 8.1 |
Units of metal sold (ounces/millions of ounces) | 1,122 | 8,846 | |
Operating expenses per unit of metal sold ($/ounce) | 6,583 | 78.50 | |
Operating expenses(1) | 7.4 | 0.7 | 8.1 |
Adjustments(2) | (6.1) | (0.6) | (6.7) |
Total cash costs | 1.3 | 0.1 | 1.4 |
By-product silver sales | (0.1) | ||
Total cash costs net of by-product revenue | 1.3 | ||
Units of metal sold (ounces/millions of ounces) | 1,122 | 8,846 | |
Total cash costs on a co-product basis(3) ($/ounce) | 1,154 | 13.76 | |
Total cash costs per gold ounce sold ($/ounce) | 1,146 | ||
Total co-product cash costs | 1.3 | 0.1 | |
Total cash costs net of by-product revenue | 1.3 | ||
Sustaining capital expenditures | (1.2) | (0.1) | (1.3) |
Total co-product all-in sustaining costs | 0.1 | - | |
Total all-in sustaining costs net of by-product revenue | - | ||
All-in sustaining costs on a co-product basis(3) ($/ounce) | 120.0 | 1.43 | |
All-in sustaining costs per gold ounce sold ($/ounce) | 14 |
1. | Operating expenses are apportioned to each metal produced on a percentage of revenue basis. |
2. | Adjustments include the non-cash inventory write-down associated with Cerro San Pedro transitioning to the reclamation phase of its mine life cycle and social closure costs incurred at Cerro San Pedro included in operating expenses. |
3. | Amounts presented on a co-product basis remove the impact of other metal sales that are produced as a by-product of our gold production and apportions the cash costs to each metal produced on a percentage of revenue basis. |
Year ended December 31, 2018 | |||
(in millions of U.S. dollars, except where noted) | Gold | Silver | Total |
CERRO SAN PEDRO OPEX, cash costs and AISC reconciliation | |||
Operating expenses(1) | 35.4 | 5.7 | 41.1 |
Units of metal sold (ounces/millions of ounces) | 10,709 | 0.1 | |
Operating expenses per unit of metal sold ($/ounce) | 3,308 | 41.76 | |
Operating expenses(1) | 35.4 | 5.7 | 41.1 |
Adjustments(2) | (14.5) | (2.4) | (16.9) |
Total cash costs | 21.0 | 3.4 | 24.3 |
By-product silver sales | (2.2) | ||
Total cash costs net of by-product revenue | 22.1 | ||
Units of metal sold (ounces/millions of ounces) | 10,709 | 0.1 | |
Total cash costs on a co-product basis(3) ($/ounce) | 1,959 | 24.73 | |
Total cash costs per gold ounce sold ($/ounce) | 2,068 | ||
Total co-product cash costs | 21.0 | 3.4 | |
Total cash costs net of by-product revenue | 22.1 | ||
Sustaining capital expenditures | (1.1) | (0.2) | (1.3) |
Reclamation expenses | 0.7 | 0.1 | 0.8 |
Total co-product all-in sustaining costs | 20.6 | 3.3 | |
Total all-in sustaining costs net of by-product revenue | 21.6 | ||
All-in sustaining costs on a co-product basis(3) ($/ounce) | 1,921 | 24.25 | |
All-in sustaining costs per gold ounce sold ($/ounce) | 2,023 |
1. | Operating expenses are apportioned to each metal produced on a percentage of revenue basis. |
2. | Adjustments include social closure costs that are included in operating expenses. |
3. | Amounts presented on a co-product basis remove the impact of other metal sales that are produced as a by-product of our gold production and apportions the cash costs to each metal produced on a percentage of revenue basis. |
43 |
Three months ended December 31, 2017 | |||
(in millions of U.S. dollars, except where noted) | Gold | Silver | Total |
CERRO SAN PEDRO OPEX, cash costs and AISC reconciliation | |||
Operating expenses(1) | 10.6 | 2.3 | 12.9 |
Units of metal sold (ounces/millions of ounces) | 7,679 | 0.1 | |
Operating expenses per unit of metal sold ($/ounce) | 1,380 | 18.03 | |
Operating expenses(1) | 10.6 | 2.3 | 12.9 |
Adjustments(2) | 0.1 | - | 0.1 |
Total cash costs | 10.7 | 2.3 | 13.0 |
By-product silver sales | (2.1) | ||
Total cash costs net of by-product revenue | 10.9 | ||
Units of metal sold (ounces/millions of ounces) | 7,679 | 0.1 | |
Total cash costs on a co-product basis(3) ($/ounce) | 1,390 | 18.16 | |
Total cash costs per gold ounce sold ($/ounce) | 1,414 | ||
Total co-product cash costs | 10.7 | 2.3 | |
Total cash costs net of by-product revenue | 10.9 | ||
Reclamation expenses | 0.8 | 0.2 | 1.0 |
Total co-product all-in sustaining costs | 11.5 | 2.5 | |
Total all-in sustaining costs net of by-product revenue | 11.9 | ||
All-in sustaining costs on a co-product basis(3) ($/ounce) | 1,498 | 19.56 | |
All-in sustaining costs per gold ounce sold ($/ounce) | 1,545 |
1. | Operating expenses are apportioned to each metal produced on a percentage of revenue basis. |
2. | Adjustments include social closure costs that are included in operating expenses. |
3. | Amounts presented on a co-product basis remove the impact of other metal sales that are produced as a by-product of our gold production and apportions the cash costs to each metal produced on a percentage of revenue basis. |
Year ended December 31, 2017 | |||
(in millions of U.S. dollars, except where noted) | Gold | Silver | Total |
CERRO SAN PEDRO OPEX, cash costs and AISC reconciliation | |||
Operating expenses(1) | 42.8 | 9.9 | 52.7 |
Units of metal sold (ounces/millions of ounces) | 33,228 | 0.6 | |
Operating expenses per unit of metal sold ($/ounce) | 1,287 | 17.14 | |
Operating expenses(1) | 43.1 | 9.9 | 52.7 |
Adjustments(2) | (0.7) | (0.1) | (0.8) |
Total cash costs | 42.1 | 9.8 | 51.9 |
By-product silver sales | (9.9) | ||
Total cash costs net of by-product revenue | 42.0 | ||
Units of metal sold (ounces/millions of ounces) | 33,228 | 0.6 | |
Total cash costs on a co-product basis(3) ($/ounce) | 1,267 | 16.87 | |
Total cash costs per gold ounce sold ($/ounce) | 1,264 | ||
Total co-product cash costs | 42.1 | 9.8 | |
Total cash costs net of by-product revenue | 42.0 | ||
Sustaining capital expenditures(4) | 0.6 | 0.1 | 0.7 |
Reclamation expenses | 3.8 | 0.9 | 4.6 |
Total co-product all-in sustaining costs | 46.5 | 10.8 | |
Total all-in sustaining costs net of by-product revenue | 47.3 | ||
All-in sustaining costs on a co-product basis(3) ($/ounce) | 1,397 | 18.61 | |
All-in sustaining costs per gold ounce sold ($/ounce) | 1,425 |
1. | Operating expenses are apportioned to each metal produced on a percentage of revenue basis. |
2. | Adjustments include social closure costs that are included in operating expenses. |
3. | Amounts presented on a co-product basis remove the impact of other metal sales that are produced as a by-product of our gold production and apportions the cash costs to each metal produced on a percentage of revenue basis. |
44 |
Three months ended December 31 |
Year ended December 31 | |||
(in millions of U.S. dollars, except where noted) | 2018 | 2017 | 2018 | 2017 |
MESQUITE OPEX, cash costs and AISC reconciliation | ||||
Operating expenses from discontinued operations | 10.0 | 40.9 | 95.6 | 122.7 |
Gold ounces sold | 12,300 | 54,612 | 115,389 | 168,800 |
Operating expenses per gold ounce sold | 810 | 749 | 828 | 727 |
Operating expenses | 10.0 | 40.9 | 95.6 | 122.7 |
Gold ounces sold | 12,300 | 54,612 | 115,389 | 168,800 |
Total cash costs per gold ounce sold ($/ounce) | 810 | 749 | 828 | 727 |
Total cash costs | 10.0 | 40.9 | 95.6 | 122.7 |
Sustaining capital expenditures | 1.1 | 3.9 | 4.5 | 12.7 |
Reclamation expenses | 0.3 | 0.7 | 2.5 | 2.3 |
Total all-in sustaining costs | 11.4 | 45.5 | 102.6 | 137.7 |
All-in sustaining costs per gold ounce sold ($/ounce) | 921 | 833 | 889 | 817 |
Sustaining Capital Expenditures Reconciliation Tables
Three months ended December 31 | Year ended December 31 | |||
(in millions of U.S. dollars, except where noted) | 2018 | 2017 | 2018 | 2017 |
Total sustaining capital expenditureS | ||||
Mining interests per statement of cash flows | 39.4 | 94.6 | 213.9 | 554.2 |
New Afton growth capital expenditures(1) | (1.0) | (0.3) | (3.3) | (2.9) |
Rainy River growth capital expenditures | (6.1) | (80.7) | (28.5) | (496.7) |
Blackwater growth capital expenditures | (1.6) | (2.4) | (7.3) | (11.3) |
Sustaining capital expenditures from continuing operations | 30.7 | 11.2 | 174.8 | 43.3 |
Sustaining capital from discontinued operations | 1.1 | 16.3 | 13.2 | 45.2 |
Total sustaining capital expenditures | 31.8 | 27.5 | 188.1 | 88.5 |
1. | Growth capital expenditures at New Afton in the current period and prior-year period relate to project advancement for the C-zone. Growth capital expenditures at Rainy River in the current period is primarily related to the Rainy River underground project and in the prior-year period related to project development (pre-commercial production). |
Adjusted Net Earnings from Continuing Operations and Adjusted Net Earnings from Continuing Operations per Share
“Adjusted net earnings from continuing operations” and “adjusted net earnings from continuing operations per share” are non-GAAP financial measures with no standard meaning under IFRS which exclude the following from net earnings:
· | Impairment losses; |
· | Inventory write-downs; |
· | Items included in “Other gains and losses” as per Note 5 of the Company’s consolidated financial statements; and |
· | Certain non-recurring items. |
Earnings from continuing operations have been adjusted, including the associated tax impact, for the group of costs in “Other gains and losses” on the unaudited condensed consolidated income statements. Key entries in this grouping are: the fair value changes for the gold stream obligation; share purchase warrants and the gold and copper option contracts and copper forward contracts; foreign exchange gain or loss and loss on disposal of assets. The adjusted entries are also impacted for tax to the extent that the underlying entries are impacted for tax in the unadjusted net earnings.
The Company uses adjusted net earnings for its own internal purposes. Management’s internal budgets and forecasts and public guidance do not reflect the items which have been excluded from the determination of adjusted net earnings. Consequently, the presentation of adjusted net earnings enables shareholders to better understand the underlying operating performance of our core mining business through the eyes of management. Management periodically evaluates the components of adjusted net earnings based on an internal assessment of performance measures that are useful for evaluating the operating performance of our business and a review of the non-GAAP measures used by mining industry analysts and other mining companies.
45 |
Adjusted net earnings are intended to provide additional information only and does not have any standardized meaning under IFRS and may not be comparable to similar measures presented by other companies. It should not be considered in isolation or as a substitute for measures of performance prepared in accordance with IFRS. The measure is not necessarily indicative of operating profit or cash flows from operations as determined under IFRS. The following table reconciles this non-GAAP measure to the most directly comparable IFRS measure.
Three months ended December 31 | ||
(in millions of U.S. dollars, except where noted) | 2018 | 2017 |
adjusted earnings FROM CONTINUING OPERATIONS reconciliation | ||
Loss before taxes from continuing operations | (663.7) | (317.7) |
Other (gains) losses(1) | (14.3) | 24.2 |
Asset impairment | 671.1 | 268.4 |
Corporate restructuring | 1.8 | 4.2 |
Inventory impairment | 6.4 | - |
Adjusted net earnings (loss) before taxes from continuing operations | 1.3 | (20.9) |
Income tax (expense) recovery | (64.0) | 90.8 |
Income tax adjustments | 85.4 | (91.4) |
Adjusted income tax recovery (expense) | 21.4 | (0.6) |
Adjusted net earnings (loss) from continuing operations | 22.7 | (21.5) |
Adjusted earnings (loss) from continuing operations per share (basic and diluted) | 0.04 | (0.04) |
1. | Please refer to Note 5 of the Company’s audited condensed consolidated financial statements for a detailed breakdown of other gains and losses. |
Year ended December 31 | |||
(in millions of U.S. dollars, except where noted) | 2018 | 2017 | 2016 |
adjusted earnings FROM CONTINUING OPERATIONS reconciliation | |||
Loss before taxes from continuing operations | (1,096.0) | (242.6) | (45.2) |
Other (gains) losses(1) | (18.1) | (46.6) | 13.2 |
Asset impairment | 1,054.8 | 268.4 | 6.4 |
Corporate restructuring | 4.1 | 4.2 | - |
Gain on modification of long-term debt | - | (3.3) | - |
Inventory impairment | 16.9 | - | 27.3 |
Adjusted net (loss) earnings before taxes from continuing operations | (38.3) | (19.9) | 1.7 |
Income tax recovery | 25.2 | 84.6 | 2.2 |
Income tax adjustments | 2.5 | (85.7) | (12.8) |
Adjusted income tax recovery (expense) | 27.7 | (1.1) | (10.6) |
Adjusted net loss from continuing operations | (10.6) | (21.0) | (8.9) |
Adjusted loss from continuing operations per share (basic and diluted) | (0.02) | (0.04) | (0.02) |
1. | Please refer to Note 5 of the Company’s audited condensed consolidated financial statements for a detailed breakdown of other gains and losses. |
46 |
Operating Cash Flows Generated from Continuing Operations, before Changes in Non-Cash Operating Working Capital
“Operating cash flows generated from continuing operations, before changes in non-cash operating working capital” is a non-GAAP financial measure with no standard meaning under IFRS, which excludes changes in non-cash operating working capital. Management uses this measure to evaluate the Company’s ability to generate cash from its operations before temporary working capital changes.
Operating cash flows generated from operations, before non-cash changes in working capital is intended to provide additional information only and does not have any standardized meaning under IFRS; it should not be considered in isolation or as a substitute for measures of performance prepared in accordance with IFRS. Other companies may calculate this measure differently and this measure is unlikely to be comparable to similar measures presented by other companies.
Three months December 31 | Year ended December 31 | ||||
(in millions of U.S. dollars) | 2018 | 2017 | 2018 | 2017 | 2016 |
cash reconciliation | |||||
Cash generated from continuing operations | 57.8 | 58.4 | 193.0 | 197.1 | 165.8 |
Add back (deduct): Change in non-cash operating working capital from continuing operations | 17.0 | (19.3) | 71.6 | (43.8) | 1.7 |
Cash generated from continuing operations before changes in non-cash operating working capital | 74.8 | 39.1 | 264.6 | 153.3 | 167.5 |
Cash generated from discontinued operations(1) | 5.2 | 60.6 | 52.1 | 145.1 | 116.4 |
Add back (deduct): Change in non-cash operating working capital from discontinued operations(1) | (0.1) | (6.7) | 20.4 | 0.8 | (17.9) |
Cash generated from operations before changes in non-cash operating working capital | 79.9 | 93.0 | 337.1 | 299.2 | 301.8 |
1. | Please refer to Note 15 of the Company’s audited consolidated financial statements for a breakdown of the earnings (loss) from Mesquite and Peak Mines, which were classified as discontinued operations. |
47 |
Operating Margin
“Operating margin” is a non-GAAP financial measure with no standard meaning under IFRS, which management uses to evaluate the Company’s aggregated and mine-by-mine contribution to net earnings before non-cash depreciation and depletion charges. Operating margin is calculated as revenue less operating expenses and therefore does not include depreciation and depletion. Operating margin is intended to provide additional information only and does not have any standardized meaning under IFRS; it should not be considered in isolation or as a substitute for measures of performance prepared in accordance with IFRS. Other companies may calculate this measure differently and this measure is unlikely to be comparable to similar measures presented by other companies. The following tables reconcile this non-GAAP measure to the most directly comparable IFRS measure on an aggregated and mine-by-mine basis.
Operating Margin Reconciliation Tables
Three months ended December 31 | Year ended December 31 | |||
(in millions of U.S. dollars) | 2018 | 2017 | 2018 | 2017 |
TOTAL OPERATING MARGIN | ||||
Revenue | 157.4 | 123.5 | 604.5 | 388.7 |
Less: Operating expenses | 75.9 | 76.1 | 325.4 | 198.3 |
Total operating margin | 81.5 | 47.4 | 279.1 | 190.4 |
Three months ended December 31 | Year ended December 31 | |||
(in millions of U.S. dollars) | 2018 | 2017 | 2018 | 2017 |
RAINY RIVER OPERATING MARGIN | ||||
Revenue | 82.2 | 34.3 | 274.4 | 34.3 |
Less: Operating expenses | 43.3 | 38.5 | 179.9 | 38.5 |
Rainy River operating margin | 38.9 | (4.2) | 94.5 | (4.2) |
Three months ended December 31 | Year ended December 31 | |||
(in millions of U.S. dollars) | 2018 | 2017 | 2018 | 2017 |
New Afton OPERATING MARGIN | ||||
Revenue | 73.7 | 77.3 | 314.1 | 302.0 |
Less: Operating expenses | 24.5 | 24.7 | 104.3 | 107.1 |
New Afton operating margin | 49.2 | 52.6 | 209.8 | 194.9 |
Three months ended December 31 | Year ended December 31 | |||
(in millions of U.S. dollars) | 2018 | 2017 | 2018 | 2017 |
CERRO San Pedro OPERATING MARGIN | ||||
Revenue | 1.5 | 11.9 | 16.0 | 52.4 |
Less: Operating expenses | 8.1 | 12.9 | 41.2 | 52.7 |
Cerro San Pedro operating margin | (6.6) | (1.0) | (25.2) | (0.3) |
Three months ended December 31 | Year ended December 31 | |||
(in millions of U.S. dollars) | 2018 | 2017 | 2018 | 2017 |
Mesquite OPERATING MARGIN | ||||
Revenue(1) | 15.1 | 70.0 | 146.1 | 215.7 |
Less: Operating expenses | 10.0 | 40.9 | 95.6 | 122.7 |
Mesquite operating margin | 5.1 | 29.1 | 50.5 | 93.0 |
1. | Please refer to Note 15 of the Company’s audited consolidated financial statements for a detailed breakdown of the earnings from Mesquite, which has been classified as a discontinued operation. |
48 |
Average Realized Price
“Average realized price per ounce of gold sold” is a non-GAAP financial measure with no standard meaning under IFRS. Management uses this measure to better understand the price realized in each reporting period for gold sales. Average realized price is intended to provide additional information only and does not have any standardized meaning under IFRS; it should not be considered in isolation or as a substitute for measures of performance prepared in accordance with IFRS. Other companies may calculate this measure differently and this measure is unlikely to be comparable to similar measures presented by other companies. The following tables reconcile this non-GAAP measure to the most directly comparable IFRS measure on an aggregate and mine-by-mine basis.
Three months ended December 31 | Year ended December 31 | |||
(in millions of U.S. dollars, except where noted) | 2018 | 2017 | 2018 | 2017 |
Total AVERAGE REALIZED PRICE FROM CONTINUING OPERATIONS | ||||
Revenue from gold sales | 101.9 | 66.4 | 368.2 | 170.2 |
Treatment and refining charges on gold concentrate sales | 1.8 | 2.5 | 8.0 | 9.6 |
Gross revenue from gold sales | 103.7 | 68.9 | 376.2 | 179.8 |
Gold ounces sold | 84,421 | 54,170 | 298,002 | 140,654 |
Total average realized price per gold ounce sold ($/ounce) | 1,230 | 1,268 | 1,263 | 1,278 |
Three months ended December 31 | Year ended December 31 | |||
(in millions of U.S. dollars, except where noted) | 2018 | 2017 | 2018 | 2017 |
RAINY RIVER AVERAGE REALIZED PRICE | ||||
Revenue from gold sales | 81.2 | 33.6 | 270.6 | 33.6 |
Gold ounces sold | 66,123 | 26,359 | 214,804 | 26,359 |
Rainy River average realized price per gold ounce sold ($/ounce) | 1,229 | 1,276 | 1,260 | 1,276 |
Three months ended December 31 | Year ended December 31 | |||
(in millions of U.S. dollars, except where noted) | 2018 | 2017 | 2018 | 2017 |
new afton AVERAGE REALIZED PRICE | ||||
Revenue from gold sales | 19.3 | 22.9 | 83.8 | 94.1 |
Treatment and refining charges on gold concentrate sales | 1.8 | 2.5 | 8.0 | 9.6 |
Gross revenue from gold sales | 21.1 | 25.4 | 91.8 | 103.7 |
Gold ounces sold | 17,176 | 20,132 | 72,489 | 81,067 |
New Afton average realized price per gold ounce sold ($/ounce) | 1,237 | 1,254 | 1,266 | 1,280 |
Three months ended December 31 | Year ended December 31 | |||
(in millions of U.S. dollars, except where noted) | 2018 | 2017 | 2018 | 2017 |
Cerro San Pedro AVERAGE REALIZED PRICE | ||||
Revenue from gold sales | 1.4 | 9.8 | 13.8 | 42.5 |
Gold ounces sold | 1,122 | 7,679 | 10,709 | 33,228 |
Cerro San Pedro average realized price per gold ounce sold ($/ounce) | 1,243 | 1,279 | 1,291 | 1,278 |
49 |
ENTERPRISE RISK MANAGEMENT AND RISK FACTORS
The Company is subject to various financial and other risks that could materially adversely affect the Company’s future business, operations and financial condition. The following is a summary of certain risks facing the Company. For a more comprehensive discussion of these and other risks facing Company, please refer to the section entitled “Risk Factors” in the Company’s most recent Annual Information Form filed on SEDAR at www.sedar.com.
Financial Risk Management
The Company holds a mixture of financial instruments, which are classified and measured as follows. For a discussion of the methods used to value financial instruments, as well as any significant assumptions, refer to Note 2 to our audited consolidated financial statements for the years ended December 31, 2018 and 2017.
As at December 31, 2018 | As at December 31, 2017 | ||||
(in millions of U.S. dollars) | Category | Level | Level | ||
FINANCIAL ASSETS | |||||
Cash and cash equivalents | Loans and receivables at amortized cost | 103.7 | 216.2 | ||
Trade and other receivables | Loans and receivables at amortized cost | 36.6 | 29.0 | ||
Provisionally priced contracts | Financial instruments at FVTPL | 2 | (1.6) | 2 | 4.2 |
Gold and copper swap contracts | Financial instruments at FVTPL | 2 | 0.9 | 2 | (6.1) |
Copper price options | Financial instruments at FVTPL | 2 | 0.7 | 2 | - |
Proceeds due from income tax refunds at Mesquite(2) | Financial Instruments at FVTPL | 3 | 8.5 | 3 | - |
Investments | Financial instruments at FVTPL | 1 | 0.8 | 1 | 1.0 |
FINANCIAL LIABILITIES | |||||
Trade and other payables(1) | Financial liabilities at amortized cost | 101.3 | 146.0 | ||
Long-term debt | Financial liabilities at amortized cost | 780.5 | 1,007.7 | ||
Gold stream obligation | Financial instruments at FVTPL | 3 | 182.4 | 3 | 273.5 |
Performance share units | Financial instruments at FVTPL | 3 | 0.2 | 3 | 1.8 |
Restricted share units | Financial instruments at FVTPL | 1 | 0.3 | 1 | 0.8 |
Copper price option contracts | Financial instruments at FVTPL | 2 | - | 2 | 4.1 |
Gold price option contracts | Financial instruments at FVTPL | 2 | 4.8 | 2 | - |
1. | Trade and other payables exclude the short-term portion of reclamation and closure cost obligations. |
2. | Proceeds due from income tax refunds at Mesquite are included in other non-current assets on the consolidated statement of financial position. |
The Company examines the various financial instrument risks to which it is exposed and assesses the impact and likelihood of those risks. These risks may include credit risk, liquidity risk, market risk and other price risks. Where material, these risks are reviewed and monitored by the Board of Directors.
Credit Risk
Credit risk is the risk of an unexpected loss if a party to the Company’s financial instruments fails to meet its contractual obligations. The Company’s financial assets are primarily composed of cash and cash equivalents, investments and trade and other receivables. Credit risk is primarily associated with trade and other receivables, investments, options, swaps, and forward contracts; however, it also arises on cash and cash equivalents. To mitigate exposure to credit risk, the Company has established policies to limit the concentration of credit risk, to ensure counterparties demonstrate minimum acceptable credit worthiness, and to ensure liquidity of available funds.
The Company closely monitors its financial assets and does not have any significant concentration of credit risk. The Company sells its gold exclusively to large international organizations with strong credit ratings. The historical level of customer defaults is minimal and, as a result, the credit risk associated with gold and copper concentrate trade receivables at December 31, 2018 is not considered high.
50 |
The Company’s maximum exposure to credit risk at December 31, 2018 and December 31, 2017 is as follows:
As at December 31 | As at December 31 | |
(in millions of U.S. dollars, except where noted) | 2018 | 2017 |
CREDIT RISK EXPOSURE | ||
Cash and cash equivalents | 103.7 | 216.2 |
Trade and other receivables | 35.9 | 27.1 |
Total financial instrument exposure to credit risk | 139.6 | 243.3 |
A significant portion of the Company’s cash and cash equivalents is held in large Canadian financial institutions. Short-term investments (including those presented as part of cash and cash equivalents) are composed of financial instruments issued by Canadian banks with high investment-grade ratings and the governments of Canada and the U.S. The Company employs a restrictive investment policy, which is described in Note 21 to our audited consolidated financial statements for the years ended December 31, 2018 and 2017.
Liquidity Risk
Liquidity risk is the risk that the Company will not be able to meet its financial obligations as they fall due. The Company manages liquidity risk through the management of its capital structure and financial leverage, as outlined in Note 20 to our audited consolidated financial statements for the years ended December 31, 2018 and 2017.
The following are the contractual maturities of debt commitments and certain other obligations. The amounts presented represent the future undiscounted cash flows, and therefore, do not equate to the carrying amounts on the consolidated statements of financial position.
As at December 31 |
As at December 31 | |||||
(in millions of U.S. dollars, except where noted) |
< 1 year |
1-3 years |
4-5 years |
After 5 years |
2018 Total |
2017 Total |
DEBT COMMITMENTS | ||||||
Trade and other payables | 112.6 | - | - | - | 112.6 | 153.7 |
Long-term debt | - | - | 500.0 | 300.0 | 800.0 | 1.030.0 |
Interest payable on long-term debt | 50.3 | 100.8 | 65.5 | 26.3 | 242.9 | 292.9 |
Gold stream obligation | 19.2 | 43.5 | 55.2 | 149.6 | 267.5 | 290.5 |
Total debt commitments | 182.1 | 144.3 | 620.7 | 475.9 | 1,423.0 | 1,767.1 |
The Company’s future operating cash flow and cash position are highly dependent on metal prices, including gold, copper and silver, as well as other factors. Taking into consideration the Company’s current cash position, volatile equity markets, global uncertainty in the capital markets and increasing cost pressures, the Company is continually reviewing expenditures and assessing business opportunities to enhance liquidity in order to ensure adequate liquidity and flexibility to support its growth strategy, including the development of its projects, while continuing production at its current operations. A period of continuous low gold and copper prices may necessitate the deferral of capital expenditures, which may impact production from mining operations. In addition, in such a price environment, the Company may be required to adopt one or more alternatives to increase liquidity.
51 |
Currency Risk
The Company operates in Canada and Mexico. As a result, the Company has foreign currency exposure with respect to items not denominated in U.S. dollars. The three main types of foreign exchange risk for the Company can be categorized as follows:
Transaction exposure
The Company’s operations sell commodities and incur costs in different currencies. This creates exposure at the operational level, which may affect the Company’s profitability as exchange rates fluctuate.
Exposure to currency risk
The Company is exposed to currency risk through the following assets and liabilities denominated in currencies other than the U.S. dollar: cash and cash equivalents, investments, accounts receivable, accounts payable and accruals, and reclamation and closure cost obligations. The currencies of the Company’s financial instruments and other foreign currency denominated liabilities, based on notional amounts, were as follows:
Year ended December 31, 2018 | ||
(in millions of U.S. dollars, except where noted) | CAD | MXN |
EXPOSURE TO CURRENCY RISK | ||
Cash and cash equivalents | 12.9 | 0.6 |
Trade and other receivables | 9.9 | 4.9 |
Income tax receivable | - | 4.6 |
Trade and other payables | (105.0) | (14.1) |
Deferred tax liability | (41.5) | - |
Reclamation and closure cost obligations | (72.6) | (13.5) |
Performance share units and restricted share units | (0.5) | - |
Total exposure to currency risk | (196.8) | (17.5) |
Year ended December 31, 2017 | |||
(in millions of U.S. dollars, except where noted) | CAD | AUD | MXN |
EXPOSURE TO CURRENCY RISK | |||
Cash and cash equivalents | 16.6 | 5.9 | 1.5 |
Trade and other receivables | 19.5 | - | 6.2 |
Income tax receivable/(payable) | 0.4 | - | 4.2 |
Deferred tax asset | 130.5 | - | - |
Trade and other payables | (141.6) | - | (11.5) |
Deferred tax liability | (183.9) | - | (0.1) |
Reclamation and closure cost obligations | (84.6) | - | (11.7) |
Performance share units and Restricted share units | (2.8) | (2.6) | - |
Total exposure to currency risk | (245.9) | 3.3 | (11.4) |
Translation exposure
The Company’s functional and reporting currency is U.S. dollars. The Company’s operations translate their operating results from the host currency to U.S. dollars. Therefore, exchange rate movements in the Canadian dollar and Mexican peso can have a significant impact on the Company’s consolidated operating results. A 10% strengthening (weakening) of the U.S. dollar against the following currencies would have decreased (increased) the Company’s net earnings (loss) from the financial instruments presented by the amounts shown below.
52 |
Year ended December 31 | Year ended December 31 | |
(in millions of U.S. dollars, except where noted) | 2018 | 2017 |
IMPACT OF 10% CHANGE IN FOREIGN EXCHANGE RATES | ||
Canadian dollar | 19.7 | 24.6 |
Australian dollar | - | (0.6) |
Mexican peso | 1.8 | 1.1 |
Interest Rate Risk
Interest rate risk is the risk that the fair value or the future cash flows of a financial instrument will fluctuate because of changes in market interest rates. The majority of the Company’s outstanding debt obligations are fixed and are therefore not exposed to changes in market interest rates. The Credit Facility interest is variable and a 1% change in interest rates would result in a difference of approximately $1.5 million in interest paid for the year ended December 31, 2018.
The Company is exposed to interest rate risk on its cash and cash equivalents. Interest earned on cash and cash equivalents is based on prevailing money market and bank account interest rates that may fluctuate. A 1.0% change in the interest rate would result in a difference of approximately $2.0 million in interest earned by the Company for the year ended December 31, 2018. The Company has not entered into any derivative contracts to manage this risk.
Metal and input price risk
The Company’s earnings, cash flows and financial condition are subject to risk due to fluctuations in the market price of gold, copper and silver. World gold prices have historically fluctuated widely. World gold prices are affected by numerous factors beyond the Company’s control, including:
· | the strength of the U.S. economy and the economies of other industrialized and developing nations; |
· | global or regional political or economic conditions; |
· | the relative strength of the U.S. dollar and other currencies; |
· | expectations with respect to the rate of inflation; |
· | interest rates; |
· | purchases and sales of gold by central banks and other large holders, including speculators; |
· | demand for jewellery containing gold; and |
· | investment activity, including speculation, in gold as a commodity. |
For the year ended December 31, 2018, the Company’s revenue and cash flows were impacted by gold prices and copper prices. Metal price declines could cause continued development of, and production from, the Company’s properties to be uneconomic. There is a time lag between the shipment of gold and copper and final pricing, and changes in pricing can impact the Company’s revenue and working capital position. The Company’s 2019 exposure to changes in gold and copper prices has been significantly reduced as the Company has entered into price option contracts (whereby it sold a series of call option contracts and purchased a series of put option contracts) to reduce exposure to changes in gold and copper prices. The Company entered into the 2019 gold and copper price option contracts to reduce exposure to fluctuations in gold and copper prices during the completion of remaining mine construction at Rainy River and relaunch the development of the New Afton C-zone.
Reserve calculations and mine plans using significantly lower gold, silver, copper and other metal prices could result in significant reductions in mineral reserve and resource estimates and revisions in the Company’s life-of-mine plans, which in turn could result in material write-downs of its investments in mining properties and increased depletion, reclamation and closure charges. Depending on the price of gold or other metals, the Company may determine that it is impractical to commence or, if commenced, to continue commercial production at a particular site. Metal price fluctuations also create adjustments to the provisional prices of sales made in previous periods that have not yet been subject to final pricing, and these adjustments could have an adverse impact on the Company’s financial results and financial condition. Any of these factors could result in a material adverse effect on the Company’s results of operations and financial condition.
53 |
The Company is also subject to price risk for fluctuations in the cost of energy, principally electricity and purchased petroleum products. The Company’s costs are affected by the prices of commodities and other inputs it consumes or uses in its operations, such as lime, sodium cyanide and explosives. The prices of such commodities and inputs are influenced by supply and demand trends affecting the mining industry in general and other factors outside the Company’s control. Increases in the price for materials consumed in the Company’s mining and production activities could materially adversely affect its results of operations and financial condition.
For the period ended December 31, 2018, the Company’s revenue and cash flows were impacted by gold prices in the range of $1,178 to $1,354 per ounce, and by copper prices in the range of $2.64 to $3.27 per pound. Low metal prices could cause continued developments of, and commercial production from, the Company’s properties to be uneconomic.
An increase in gold, copper and silver prices would increase the Company’s net earnings, whereas an increase in fuel or restricted share unit vested prices would decrease the Company’s net earnings. A 10% change in commodity prices would impact the Company’s net earnings (loss) before taxes and other comprehensive income before taxes as follows:
Year ended December 31 | Year ended December 31 | |||
(in millions of U.S. dollars, except where noted) |
2018 Net Earnings (Loss) |
2018 Other |
2017 Net Earnings (Loss) |
2017 Other |
IMPACT OF 10% CHANGE IN COMMODITY PRICES | ||||
Gold price | 37.6 | - | 52.5 | - |
Copper price | 6.5 | - | 9.0 | - |
Fuel and electricity price | 5.5 | - | 4.6 | 0.3 |
Other Risks
Production Estimates
Forecasts of future production are estimates based on interpretation and assumptions, and actual production may be less than estimated. The Company’s production forecasts are based on full production being achieved at all of its mines. The Company’s ability to achieve and maintain full production rates at these mines is subject to a number of risks and uncertainties. The Company’s production estimates are dependent on, among other things, the accuracy of Mineral Reserve and Mineral Resource estimates, the accuracy of assumptions regarding ore grades and recovery rates, ground conditions, physical characteristics of ores, such as hardness and the presence or absence of particular metallurgical characteristics, and the accuracy of estimated rates and costs of mining and processing and mill availability, and the receipt and maintenance of permits. The Company’s actual production may vary from its estimates for a variety of reasons, including, those identified under the heading “Operating Risks” below. The failure of the Company to achieve its production estimates could have a material adverse effect on the Company’s prospects, results of operations and financial condition.
Cost Estimates
The Company prepares estimates of operating costs and/or capital costs for each operation and project. The Company’s actual costs are dependent on a number of factors, including the exchange rate between the United States dollar and the Canadian dollar and, to a lesser extent, Mexican peso, smelting and refining charges, penalty elements in concentrates, royalties, the price of gold and byproduct metals, the cost of inputs used in mining operations and events that impact production levels.
54 |
New Gold’s actual costs may vary from estimates for a variety of reasons, including changing waste-to-ore ratios, ore grade metallurgy, labour and other input costs, commodity prices, general inflationary pressures and currency exchange rates, as well as those identified under the heading “Operating Risks” below. Failure to achieve cost estimates or material increases in costs could have an adverse impact on New Gold’s future cash flows, profitability, results of operations and financial condition.
Government Regulation
The mining, processing, development and exploration activities of the Company are subject to various laws governing prospecting, development, production, exports, imports, taxes, labour standards and occupational health and safety, mine safety, toxic substances, waste disposal, environmental protection and remediation, protection of endangered and protected species, land use, water use, land claims of local people and other matters. No assurance can be given that new rules and regulations will not be enacted or that existing rules and regulations will not be applied in a manner which could have an adverse effect on the Company’s financial position and results of operations. Amendments to current laws, regulations and permits governing operations or development activities and activities of mining and exploration companies, or more stringent or different implementation, could have a material adverse impact on the Company’s results of operations or financial position, or could require abandonment or delays in the development of new mining properties or the suspension or curtailment of operations at existing mines. Failure to comply with any applicable laws, regulations or permitting requirements may result in enforcement actions against the Company, including orders issued by regulatory or judicial authorities causing operations or development activities to cease or be curtailed or suspended, and may include corrective measures requiring capital expenditures, installation of additional equipment or remedial actions (see also “Permitting” below). The Company could be forced to compensate those suffering loss or damage by reason of its mining operations or exploration or development activities and could face civil or criminal fines or penalties imposed for violations of applicable laws or regulations. Any such regulatory or judicial action could materially increase the Company’s operating costs and delay or curtail or otherwise negatively impact the Company’s operations and other activities.
Permitting
The Company’s operations, development projects and exploration activities are subject to receiving and maintaining licenses, permits and approvals (collectively, “permits”) from appropriate governmental authorities. Before any development on any of its properties the Company must receive numerous permits, and continued operations at the Company’s mines is also dependent on maintaining and renewing required permits or obtaining additional permits.
New Gold may be unable to obtain on a timely basis or maintain in the future all necessary permits required to explore and develop its properties, commence construction or operation of mining facilities and properties or maintain continued operations. Delays may occur in connection with obtaining necessary renewals of permits for the Company’s existing operations and activities, additional permits for existing or future operations or activities, or additional permits associated with new legislation. It is possible that previously issued permits may become suspended or revoked for a variety of reasons, including through government or court action.
In October 2016, the Canadian federal and provincial governments entered into a memorandum of understanding regarding the environmental assessment process for the Blackwater project with the Ulkatcho First Nation and the Lhoosk’uz Dené Nation to facilitate government-to-government collaboration in such process. In addition, in April 2015, the provincial government entered into an agreement with the Nadleh Whuten First Nation, Saik’uz First Nation, Stellat’en First Nation and other First Nations included in the Carrier Sekani Tribal Council to facilitate a government-to-government relationship based on collaboration in connection with natural resource development carried on in their traditional territories, including the Blackwater project. New Gold continues to engage First Nations who have interests in the Blackwater project area. New Gold anticipates receiving environmental assessment approval for the Blackwater project in 2019, however, there can be no assurance that such approval will be obtained on such timeline or at all.
55 |
In the past there have been challenges to the Company’s permits that were temporarily successful as well as delays in the renewal of certain permits or receiving additional required permits. There can be no assurance that the Company will receive or continue to hold all permits necessary to develop or continue operating at any particular property or to pursue the Company’s exploration activities. To the extent that required permits cannot be obtained or maintained, the Company may be curtailed or prohibited from continuing its mining operations or from proceeding with planned exploration or development of mineral properties. Even if permits or renewals are available, the terms of such permits may be unattractive to the Company and result in the applicable operations or activities being financially unattractive or uneconomic. An inability to obtain or maintain permits or to conduct mining operations pursuant to applicable permits would materially reduce the Company’s production and cash flow and could undermine its profitability.
Dependence on the Rainy River and New Afton mines
The Company’s operations at the Rainy River and New Afton Mines are expected to account for substantially all of the Company’s gold and copper production in 2019. Any adverse condition affecting mining or milling conditions at the Rainy River Mine or New Afton Mine could have a material adverse effect on the Company’s financial performance and results of operations.
Unless the Company acquires or develops other significant gold-producing assets, the Company will continue to be dependent on its operations at the Rainy River and New Afton Mines for a substantial portion of its cash flow provided by operating activities.
Operating Risks
Mining operations generally involve a high degree of risk. The Company’s operations are subject to all the hazards and risks normally encountered in the exploration, development and production of gold, copper and silver including unusual and unexpected geologic formations, seismic activity, rock bursts, rock slides, cave-ins, slope or pit wall failures, flooding, fire, metal losses, periodic interruption due to inclement or hazardous weather conditions and other conditions that would impact the drilling and removal of material. Block caving activities, including at the New Afton Mine, generally result in surface subsidence. The configuration of subsidence presently occurring above the west cave at the New Afton Mine is slightly offset from the original model, which is thought to be driven largely by the weaker rockmass located south of the cave footprint. The subsidence is being monitored and evaluated on an ongoing basis. Surface subsidence or any of the above hazards and risks could result in reduced production, damage to, or destruction of, mines and other producing facilities, damage to life or property, environmental damage and possible legal liability. In addition, production may be adversely impacted by operational problems such as a failure of a production hoist, filter press, SAG mill or other equipment, or industrial accidents, as well as other potential issues such as actual ore mined varying from estimates of grade or tonnage, dilution, block cave performance and metallurgical or other characteristics, interruptions in electrical power or water, shortages of required inputs, labour shortages or strikes, restrictions or regulations imposed by government agencies or changes in the regulatory environment. The Company’s milling operations are subject to hazards such as equipment failure or failure of retaining dams around tailings disposal areas, which may result in environmental pollution and consequent liability. In addition, short-term operating factors, such as the need for orderly development of the ore bodies or the processing of new or different ore grades, may cause a mining operation to be unprofitable in any particular accounting period. The occurrence of one or more of these events may result in the death of, or personal injury to, employees, other personnel or third parties, the loss of mining equipment, damage to or destruction of mineral properties or production facilities, monetary losses, deferral or unanticipated fluctuations in production, suspension, curtailment or termination of operations, environmental damage and potential legal liabilities, any of which may adversely affect the Company’s business, reputation, prospects, results of operations and financial condition.
56 |
Risks Related to Further Processing
The Company’s operations produce concentrate, doré or other products that are not refined metals (“Unrefined Product”) and generally require further processing at a smelter and/or a refinery to become marketable metal. Such Unrefined Product contains metals and other elements that require removal, some of which may limit the smelters or brokers who can or will purchase or process the Unrefined Product and the refineries who will process the Unrefined Product, or negatively impact the terms of such purchase or processing arrangements. Treatment and refining charges are also subject to fluctuations, which could negatively impact the Company’s revenue or expenses.
In addition, the Company is generally responsible for transporting Unrefined Products either to the smelter or refinery or to a designated point where risk of loss is transferred. The Company is exposed to risks related to the cost and availability of transportation and storage facilities associated with Unrefined Product, and the Company may not be able to make alternative transportation or storage arrangements on reasonable commercial terms or at all. The Company is dependent on the Port of Vancouver for the storage and transportation of all concentrate from New Afton; in the event the Port of Vancouver is closed, there is no commercial alternative port available. There can be no assurance that the Company will be able to continue to sell and process its Unrefined Product, including the related transportation and storage, on reasonable commercial terms or at all.
Exploration and Development Risks
The exploration for and development of mineral deposits involves significant risks, which even a combination of careful evaluation, experience and knowledge cannot eliminate. While the discovery of an ore body may result in substantial rewards, few properties that are explored are ultimately developed into producing mines. Once a site with mineralization is discovered, it may take several years from the initial phases of drilling until production is possible, during which time the economic feasibility of production may change. Major expenses may be required to locate and establish Mineral Reserves, to develop metallurgical processes and to construct mining and processing facilities at a particular site. It is impossible to ensure that the exploration or development programs planned by the Company or any of its partners will result in a profitable commercial mining operation.
Whether a mineral deposit will be commercially viable depends on a number of factors, including but not limited to: the particular attributes of the deposit, such as accuracy of estimated size, continuity of mineralization, average grade and metallurgical characteristics (see “Uncertainty in the Estimation of Mineral Reserves and Mineral Resources” below); proximity to infrastructure; metal prices, which are highly cyclical; and government regulations, including regulations relating to prices, taxes, royalties, land tenure, land use, importing and exporting of minerals and environmental protection. The exact effect of these factors cannot be accurately predicted, but the combination of these factors may result in the Company being unable to receive an adequate return on invested capital.
Development projects are uncertain and capital cost estimates, projected operating costs, production rates, recovery rates, mine life and other operating parameters and economic returns may differ significantly from those estimated for a project. Development projects rely on the accuracy of predicted factors including capital and operating costs, metallurgical recoveries, reserve estimates and future metal prices. In addition, there can be no assurance that gold, silver or copper recoveries in small scale laboratory tests will be duplicated in larger scale tests under on-site conditions or during production.
The Company is in the process of constructing a water treatment plant and expanding the tailings management area at Rainy River. At New Afton, the Company is commencing mine development in 2019 of the C-zone expansion. The development of the underground mine at Rainy River is expected to commence in 2020. The Blackwater project is in the permitting stage. The Company may engage in other development and expansion activities at its operating mines from time to time. Expansion projects, including development and expansions of facilities and extensions to new ore bodies or new portions of existing ore bodies, can have risks and uncertainties similar to development projects.
57 |
A project is subject to numerous risks during development including, but not limited to, the accuracy of feasibility studies, obtaining and complying with required permits, changes in environmental or other government regulations, securing all necessary surface and land tenure rights, consulting and accommodating First Nations and other Indigenous groups and financing risks. In particular, the Company is actively engaged in consultation with various First Nations in connection with the Blackwater project. Unforeseen circumstances, including those related to the amount and nature of the mineralization at the development site, technological impediments to extraction and processing, legal challenges or restrictions or governmental intervention, infrastructure limitations, environmental issues, unexpected ground conditions or other unforeseen development challenges, commodity prices, disputes with local communities or other events, could result in one or more of New Gold’s planned developments becoming impractical or uneconomic to complete. Any such occurrence could have an adverse impact on New Gold’s growth, financial condition and results of operations. There can be no assurance that the Company’s expansion and development projects will continue in accordance with current expectations or at all. See also “Permitting” above.
Risks related to Rainy River’s early years of production
The first few years of production for the Rainy River Mine is subject to a number of inherent risks. It is not unusual in the mining industry for new mining operations to experience unexpected problems leading up to and during beginning period of production, including failure of equipment, machinery, the processing circuit or other processes to perform as designed or intended, inadequate water, insufficient ore stockpile or grade, and failure to deliver adequate tonnes of ore to the mill, any of which could result in delays, slowdowns or suspensions and require more capital than anticipated. In addition, mineral reserves and mineral resources projected by the most recent Technical Report, and anticipated costs, including, without limitation, operating expenses, cash costs and all-in sustaining costs, anticipated mine life, projected production, anticipated production rates and other projected economic and operating parameters may not be realized, and the level of future metal prices needed to ensure commercial viability may deteriorate. Consequently, there is a risk that Rainy River may encounter problems, be subject to delays or have other material adverse consequences for the Company during its first few years of production, including its operating results, cash flow and financial condition.
Financing Risks
The Company’s mining, processing, development and exploration activities may require additional external financing. There can be no assurance that additional capital or other types of financing will be available when needed or that, if available, the terms of such financing will be acceptable to the Company, and, if raised by offering equity securities or securities convertible into equity securities, any additional financing may involve substantial dilution to existing shareholders. Failure to obtain sufficient financing could result in the delay or indefinite postponement of exploration, development, construction or production on any or all of the Company’s mineral properties. The cost and terms of such financing may significantly reduce the expected benefits from new developments and/or render such developments uneconomic.
Need for Additional Mineral Reserves and Mineral Resources
Because mines have limited lives based on Proven and Probable Mineral Reserves, the Company continually seeks to replace and expand its Mineral Reserves and Mineral Resources. The Company’s ability to maintain or increase its annual production of gold, copper and silver depends in significant part on its ability to find or acquire new Mineral Reserves and Mineral Resources and bring new mines into production, and to expand Mineral Reserves and Mineral Resources at existing mines. Exploration is inherently speculative. New Gold’s exploration projects involve many risks and exploration is frequently unsuccessful. See “Exploration and Development Risks” above. There is a risk that depletion of Reserves will not be offset by discoveries or acquisitions. The mineral base of New Gold may decline if Reserves are mined without adequate replacement.
58 |
Uncertainty in the Estimation of Mineral Reserves and Mineral Resources
Mineral Reserves and Mineral Resources are estimates only, and no assurance can be given that the anticipated tonnages and grades will be achieved, that the indicated level of recovery will be realized or that Mineral Reserves can be mined or processed profitably. Mineral Reserve and Mineral Resource estimates may be materially affected by environmental, permitting, legal, title, taxation, socio-political, marketing and other risks and relevant issues. There are numerous uncertainties inherent in estimating Mineral Reserves and Mineral Resources, including many factors beyond the Company’s control. Such estimation is a subjective process, and the accuracy of any Mineral Reserve or Mineral Resource estimate is a function of the quantity and quality of available data, the nature of the ore body and of the assumptions made and judgments used in engineering and geological interpretation. These estimates may require adjustments or downward revisions based upon further exploration or development work, drilling or actual production experience.
Fluctuations in gold, copper and silver prices, results of drilling, metallurgical testing and production, the evaluation of mine plans after the date of any estimate, permitting requirements or unforeseen technical or operational difficulties may require revision of Mineral Reserve and Mineral Resource estimates. Prolonged declines in the market price of gold (or applicable by-product metal prices) may render Mineral Reserves and Mineral Resources containing relatively lower grades of mineralization uneconomical to recover and could materially reduce the Company’s Mineral Reserves and Mineral Resources. Mineral Resource estimates for properties that have not commenced production or at deposits that have not yet been exploited are based, in most instances, on very limited and widely spaced drill hole information, which is not necessarily indicative of conditions between and around the drill holes. Accordingly, such Mineral Resource estimates may require revision as more geologic and drilling information becomes available and as actual production experience is gained. Should reductions in Mineral Resources or Mineral Reserves occur, the Company may be required to take a material write-down of its investment in mining properties, reduce the carrying value of one or more of its assets or delay or discontinue production or the development of new projects, resulting in reduced net income or increased net losses and reduced cash flow. Mineral Resources and Mineral Reserves should not be interpreted as assurances of mine life or of the profitability of current or future operations. There is a degree of uncertainty attributable to the calculation and estimation of Mineral Resources and Mineral Reserves and corresponding grades being mined and, as a result, the volume and grade of Reserves mined and processed and recovery rates may not be the same as currently anticipated. Any material reductions in estimates of Mineral Reserves and Mineral Resources, or of the Company’s ability to extract these Mineral Reserves and Mineral Resources, could have a material adverse effect on the Company’s projects, results of operations and financial condition.
Mineral Resources are not Mineral Reserves and have a greater degree of uncertainty as to their existence and feasibility. There is no assurance that Mineral Resources will be upgraded to Proven or Probable Mineral Reserves.
Impairment
On a quarterly basis, the Company reviews and evaluates its mining interests for indicators of impairment. Impairment assessments are conducted at the level of CGUs. A CGU is the smallest identifiable group of assets that generates cash inflows that are largely independent of the cash inflows from other assets or groups of assets. Each operating mine, development and exploration project represents a separate CGU. If an indication of impairment exists, the recoverable amount of the CGU is estimated. An impairment loss is recognized when the carrying amount of the CGU is in excess of its recoverable amount. The assessment for impairment is subjective and requires management to make significant judgments and assumptions in respect of a number of factors, including estimates of production levels, operating costs and capital expenditures reflected in New Gold’s life-of-mine plans, the value of in-situ ounces, exploration potential and land holdings, as well as economic factors beyond management’s control, such as gold, copper and silver prices, discount rates, foreign exchange rates, and observable net asset value multiples. It is possible that the actual fair value could be significantly different from those estimates. In addition, should management’s estimate of the future not reflect actual events, further impairment charges may materialize, and the timing and amount of such impairment charges is difficult to predict.
59 |
Title Claims and Rights of Indigenous Peoples
Certain of New Gold’s properties may be subject to the rights or the asserted rights of various community stakeholders, including First Nations and other Aboriginal peoples. The presence of community stakeholders may impact the Company’s ability to develop or operate its mining properties and its projects or to conduct exploration activities. Accordingly, the Company is subject to the risk that one or more groups may oppose the continued operation, further development or new development or exploration of the Company’s current or future mining properties and projects. Such opposition may be directed through legal or administrative proceedings, or through protests or other campaigns against the Company’s activities.
Governments in many jurisdictions must consult with, or require the Company to consult with, indigenous peoples with respect to grants of mineral rights and the issuance or amendment of project authorizations. Consultation and other rights of Indigenous peoples may require accommodation including undertakings regarding employment, royalty payments and other matters. This may affect the Company’s ability to acquire within a reasonable time frame effective mineral titles, permits or licenses in these jurisdictions, including in some parts of Canada and Mexico in which title or other rights are claimed by Indigenous peoples, and may affect the timetable and costs of development and operation of mineral properties in these jurisdictions. The risk of unforeseen title claims by indigenous peoples also could affect existing operations as well as development projects. These legal requirements may also affect the Company’s ability to expand or transfer existing operations or to develop new projects.
Environmental Risk
The Company is subject to environmental regulation in Canada and Mexico where it operates or has exploration or development activities. In addition, the Company will be subject to environmental regulation in any other jurisdictions in which it may operate or have exploration or development properties. These regulations address, among other things, endangered and protected species, emissions, noise, air and water quality standards, land use and reclamation. They also set out limitations on the generation, transportation, storage and disposal of solid, liquid and hazardous waste.
Environmental legislation is evolving in a manner, which will involve, in certain jurisdictions, stricter standards and enforcement, increased fines and penalties for non-compliance, more stringent environmental assessments of proposed projects and a heightened degree of responsibility for companies and their officers, directors and employees. No certainty exists that future changes in environmental regulation, or the application of such regulations, if any, will not adversely affect the Company’s operations or development properties or exploration activities. The Company cannot give any assurance that, notwithstanding its precautions, breaches of environmental laws (whether inadvertent or not) or environmental pollution will not materially and adversely affect its financial condition and results from operations. Environmental hazards may exist on the Company’s properties which are unknown to management at present and which have been caused by previous owners or operators of the properties. In addition, measures taken to address and mitigate known environmental hazards or risks may not be fully successful, and such hazards or risks may materialize.
New Gold may also acquire properties with known or undiscovered environmental risks. Any indemnification from the entity from which the Company acquires such properties may not be adequate to pay all the fines, penalties and costs (such as clean-up and restoration costs) incurred related to such properties. New Afton has also been used for mining and related operations for many years before the Company acquired it and was acquired as is or with assumed environmental liabilities from previous owners or operators. The Company has been required to address contamination at its properties in the past and may need to continue to do so in the future, either for existing environmental conditions or for leaks, discharges or contamination that may arise from its ongoing operations or other contingencies. The cost of addressing environmental conditions or risks, and liabilities associated with environmental damage, may be significant, and could have a material adverse effect on the Company’s business, prospects, results of operations and financial condition. Production at New Gold’s mines involves the use of various chemicals, including certain chemicals that are designated as hazardous substances. Contamination from hazardous substances, either at the Company’s own properties or other locations for which it may be responsible, may subject the Company to liability for the investigation or remediation of contamination, as well as for claims seeking to recover for related property damage, personal injury or damage to natural resources. The occurrence of any of these adverse events could have a material adverse effect on the Company’s prospects, results of operations and financial position.
60 |
Production at certain of the Company’s mines involves the use of sodium cyanide which is a toxic material. Should sodium cyanide leak or otherwise be discharged from the containment system, the Company may become subject to liability for cleanup work that may not be insured, in addition to liability for any damage caused. Such liability could be material.
Insurance and Uninsured Risks
New Gold’s business is subject to a number of risks and hazards generally including adverse environmental conditions, industrial accidents, labour disputes, unusual or unexpected geological conditions, ground or slope or wall failures, cave-ins, metallurgical or other processing problems, fires, operational problems, changes in the regulatory environment and natural phenomena, such as inclement weather conditions, floods, hurricanes and earthquakes. Such occurrences could result in damage to mineral properties or production facilities or other property, personal injury or death, environmental damage to its properties or the properties of others, delays in mining, monetary losses and possible legal liability.
Although the Company maintains insurance to protect against certain risks in such amounts as it considers reasonable, such insurance will not cover all the potential risks associated with a mining company’s operations. The Company may also be unable to maintain insurance to cover these risks at economically feasible premiums. Insurance coverage may not continue to be available on acceptable terms or may not be adequate to cover any resulting liability. Moreover, insurance against risks such as loss of title to mineral property, environmental pollution, or other hazards as a result of exploration, development and production is not generally available to the Company or to other companies in the mining industry on acceptable terms. New Gold may also become subject to liability for pollution or other hazards which may not be insured against or which the Company may elect not to insure against because of premium costs or other reasons. Losses from these events may cause the Company to incur significant costs that could have a material adverse effect on results of operations and financial condition.
Reclamation Costs
The Company’s operations are subject to reclamation plans that establish its obligations to reclaim properties after minerals have been mined from a site. These obligations represent significant future costs for the Company. Reclamation bonds or other forms of financial assurance are often required to secure reclamation activities. Governing authorities require companies to periodically recalculate the amount of a reclamation bond and may require bond amounts to be increased. It may be necessary to revise the planned reclamation expenditures and the operating plan for a mine in order to fund an increase to a reclamation bond. In addition, reclamation bonds are generally issued under the Company’s credit facilities; increases in the amount of reclamation bonds will decrease the amount of the Credit Facility available for other purposes. Reclamation bonds may represent only a portion of the total amount of money that will be spent on reclamation over the life of a mine operation. The actual costs of reclamation set out in mine plans are estimates only and may not represent the actual amounts that will be required to complete all reclamation activity. If actual costs are significantly higher than the Company’s estimates, then its results of operations and financial position could be materially adversely affected.
61 |
Debt and Liquidity Risk
As of December 31, 2018, the Company had long-term debt comprising of two series of notes having an aggregate face value of $800 million. In addition, the Company has a $400 million Credit Facility. The Company’s ability to make scheduled payments of the principal of, to pay interest on or to refinance its indebtedness depends on the Company’s future performance, which is subject to economic, financial, competitive and other factors many of which are not under the control of New Gold. The Company is exposed to interest rate risk on variable rate debt, if any. Liquidity risk is the risk that the Company will not be able to meet its financial obligations as they become due, including, among others, debt repayments, interest payments and contractual commitments.
The Company may not continue to generate cash flow from operations in the future sufficient to service its debt and make necessary or planned capital expenditures. If the Company is unable to generate such cash flow, it may be required to adopt one or more alternatives, such as selling assets, borrowing additional funds, restructuring debt or obtaining additional equity capital on terms that may be onerous or highly dilutive. The Company’s ability to borrow additional funds or refinance its indebtedness will depend on the capital markets and its financial condition at such time. The Company may not be able to engage in any of these activities or engage in these activities on desirable terms, which could result in a default on its debt obligations. In addition, if New Gold is unable to maintain its indebtedness and financial ratios at levels acceptable to its credit rating agencies, or should New Gold’s business prospects deteriorate, the ratings currently assigned to New Gold by Moody’s Investor Services and Standard & Poor’s Ratings Services could be downgraded, which could adversely affect the value of New Gold’s outstanding securities and existing debt and its ability to obtain new financing on favourable terms, and increase New Gold’s borrowing costs.
If the Company’s cash flow and other sources of liquidity are not sufficient to continue operations and make necessary and planned capital expenditures, the Company may cancel or defer capital expenditures and/or suspend or curtail operations. Such an action may impact production at mining operations and/or the timelines and cost associated with development projects, which could have a material adverse effect on the Company’s prospects, results from operations and financial condition.
The terms of the Company’s Credit Facility and stream agreement with Royal Gold require the Company to satisfy various affirmative and negative covenants and to meet certain financial ratios and tests. In addition, the terms of the Company’s 2022 Unsecured Notes and 2025 Unsecured Notes require the Company to satisfy various affirmative and negative covenants. These covenants limit, among other things, the Company’s ability to incur indebtedness, create certain liens on assets or engage in certain types of transactions. There are no assurances that in future, the Company will not, as a result of these covenants, be limited in its ability to respond to changes in its business or competitive activities or be restricted in its ability to engage in mergers, acquisitions or dispositions of assets. Furthermore, a failure to comply with these covenants, including, in the case of the Credit Facility and stream agreement with Royal Gold, a failure to meet the financial tests or ratios, would likely result in an event of default under the Credit Facility and/or the 2022 Unsecured Notes and/or the 2025 Unsecured Notes and/or stream agreement and would allow the lenders or noteholders or other contractual counterparty, as the case may be, to accelerate the debt or other obligations as the case may be.
Litigation and Dispute Resolution
From time to time New Gold is subject to legal claims, with and without merit. These claims may commence informally and reach a commercial settlement or may progress to a more formal dispute resolution process. The causes of potential future claims cannot be known and may arise from, among other things, business activities, environmental laws, volatility in stock price or failure to comply with disclosure obligations. In particular, the complex activities and significant expenditures associated with construction activities may lead to various claims, some of which may be material. Defense and settlement costs may be substantial, even with respect to claims that have no merit. Due to the inherent uncertainty of the litigation and dispute resolution process, there can be no assurance that the resolution of any particular legal proceeding or dispute will not have a material adverse effect on the Company’s future cash flows, results of operations or financial condition. See “Legal Proceedings and Regulatory Actions”.
62 |
Title Risks
The acquisition of title to mineral properties is a very detailed and time-consuming process. Title to mineral concessions may be disputed. Although the Company believes it has taken reasonable measures to ensure proper title to its properties, there is no guarantee that title to any of such properties will not be challenged or impaired. Third parties may have valid claims underlying portions of our interest, including prior unregistered liens, agreements, transfers, royalties or claims, including Aboriginal land claims, and title may be affected by, among other things, undetected defects. In some cases, title to mineral rights and surface rights has been divided, and the Company may hold only surface rights or only mineral rights over a particular property, which can lead to potential conflict with the holder of the other rights. As a result of these issues, the Company may be constrained in its ability to operate its properties or unable to enforce its rights with respect to its properties or the economics of is mineral properties may be impacted. An impairment to or defect in the Company’s title to its properties or a dispute regarding property or other related rights could have a material adverse effect on the Company’s business, financial condition or results of operations.
Hedging Risks
From time to time the Company uses or may use certain derivative products to hedge or manage the risks associated with changes in gold prices, silver prices, copper prices, interest rates, foreign currency exchange rates and energy prices. The use of derivative instruments involves certain inherent risks including, among other things: (i) credit risk – the risk of an unexpected loss arising if a counterparty with which the Company has entered into transactions fails to meet its contractual obligations; (ii) market liquidity risk – the risk that the Company has entered into a derivative position that cannot be closed out quickly, by either liquidating such derivative instrument or by establishing an offsetting position; and (iii) unrealized mark-to-market risk – the risk that, in respect of certain derivative products, an adverse change in market prices for commodities, currencies or interest rates will result in the Company incurring an unrealized mark-to-market loss in respect of such derivative products.
There is no assurance that any hedging program or transactions which may be adopted or utilized by New Gold designed to reduce the risk associated with changes in gold prices, silver prices, copper prices, interest rates, foreign currency exchange rates or energy prices will be successful. Although hedging may protect New Gold from an adverse price change, it may also prevent New Gold from benefitting fully from a positive price change.
Climate Change Risks
Changes in climate conditions could adversely affect the Company’s business and operations through the impact of (i) more extreme temperatures, precipitation levels and other weather events; (ii) changes to laws and regulations related to climate change; and (iii) changes in the price or availability of goods and services required by our business.
Climate change may lead to more extreme temperatures, precipitation levels and other weather events. Extreme high or low temperatures could impact the operation of equipment and the safety of personnel at the Company’s sites, which could result in damage to equipment, injury to personnel and production disruptions. Changes in precipitation levels may impact the availability of water at the Company’s operations, which the mills require to operate, potentially leading to production disruptions. Low precipitation also increases the risk of large forest fires, as occurred in proximity to the Company’s operations in British Columbia in the summer of 2017, which could cause production disruptions or damage site infrastructure. Increases in precipitation levels could also lead to water management challenges. Extreme weather events, such as forest fires, severe storms or floods, all of which may be more probable and more extreme due to climate change, may negatively impact operations and disrupt production. Significant capital investment may be required to address these occurrences and to adapt to changes in average operating conditions caused by these changes to the climate.
63 |
Climate change may lead to new laws and regulations that affect the Company’s business and operations. Many governments are moving to enact climate change legislation and treaties at the international, national, state, provincial and local levels. Where legislation already exists, regulations relating to emission levels and energy efficiency are becoming more stringent. Some of the costs associated with meeting more stringent regulations can be offset by increased energy efficiency and technological innovation. However, if the current regulatory trend continues, meeting more stringent regulations is anticipated to result in increased costs. For example, the Company’s operations will pay Canadian Federal and Provincial carbon taxes in 2019.
Climate change may lead to changes in the price and availability of goods and services required for the Company’s operations, which require the regular supply of consumables such as diesel, electricity, and sodium cyanide to operate efficiently. The Company’s operations also depend on service providers to transport these consumables and other goods to the operations and to transport doré and concentrate produced by the Company to refiners. The effects of extreme weather described above and changes in legislation and regulation on the Company’s suppliers and their industries may cause limited availability or higher price for these goods and services, which could result in higher costs or production disruptions.
We can provide no assurance that efforts to mitigate the risks of climate changes will be effective and that the physical risks of climate change will not have an adverse effect on the Company’s operations and profitability.
64 |
CRITICAL JUDGMENTS AND ESTIMATION UNCERTAINTIES
The preparation of the Company’s consolidated financial statements in conformity with IFRS requires the Company’s management to make judgments, estimates and assumptions about the future events that affect the amounts reported in the consolidated financial statements and related notes to the financial statements. Estimates and assumptions are continually evaluated and are based on management’s experience and other facts and circumstances. Revisions to estimates and the resulting effects on the carrying amounts of the Company’s assets and liabilities are accounted for prospectively.
The areas which require management to make significant judgments, estimates and assumptions in determining carrying values are described in the Company’s audited consolidated financial statements for the year ended December 31, 2018.
ACCOUNTING POLICIES
The Company's significant accounting policies and future changes in accounting policies are presented in the audited consolidated financial statements for the year ended December 31, 2018 and have been consistently applied in the preparation of the audited consolidated financial statements.
Changes in accounting policies
Revenue
The IASB issued IFRS 15, Revenue from Contracts with Customers (“IFRS 15”). This standard outlines a single comprehensive model with prescriptive guidance for entities to use in accounting for revenue arising from contracts with its customers. IFRS 15 uses a control-based approach to recognize revenue which is a change from the risk and reward approach under the current standard. This standard replaces IAS 18 Revenue, IAS 11 Construction Contracts and related interpretations. The Company has adopted IFRS 15 effective January 1, 2018 applying the retrospective method of transition.
The standard requires entities to apportion revenue earned from contracts to individual promises or performance obligations, on a relative standalone selling price basis. For the Company's concentrate sales, the seller may contract for and pay the shipping and insurance costs necessary to bring the goods to the named destination. Therefore, where material, a portion of the revenue earned under these contracts, representing the obligation to fulfill the shipping and insurance services, is deferred and recognized over time as the obligations are fulfilled, along with the associated costs. The impact of this change on the amount of revenue recognized in a year is not significant. As a result, there have been no changes in the amounts of the revenue recognized or a significant change in the timing of revenue recognition under the new standard.
65 |
CONTROLS AND PROCEDURES
Disclosure Controls and Procedures
The Company’s management, with the participation of and under the supervision of its President and Chief Executive Officer and Chief Financial Officer, has evaluated the effectiveness of the Company’s disclosure controls and procedures as defined in Rules 13a-15(e) and 15d-15(e) under the Securities Exchange Act of 1934, as amended (“Exchange Act”) and in National Instrument 52-109 Certification of Disclosure in Issuers’ Annual and Interim Filings, as of December 31, 2018. Based on that evaluation, the Company’s Chief Executive Officer and Chief Financial Officer have concluded that, as of December 31, 2018, the Company’s disclosure controls and procedures were effective to provide reasonable assurance that the information required to be disclosed by the Company in reports it files is recorded, processed, summarized and reported, within the appropriate time periods.
Internal Controls over Financial Reporting
New Gold’s management, with the participation of its Chief Executive Officer and Chief Financial Officer, is responsible for establishing and maintaining adequate internal controls over financial reporting. Internal controls over financial reporting is a process designed by, or under the supervision of, the Company’s principal executive and principal financial officers and effected by the Company’s Board of Directors, management and other personnel, to provide reasonable assurance regarding the reliability of financial reporting and the preparation of financial statements for external purposes in accordance with International Financial Reporting Standards. New Gold’s management assessed the effectiveness of the Company’s internal controls over financial reporting as of December 31, 2018 based on the 2013 updated Committee of Sponsoring Organization of the Treadway Commission (“COSO”) and has concluded that New Gold’s internal controls over financial reporting are effective as of December 31, 2018.
The effectiveness of the Company’s internal control over financial reporting as of December 31, 2018 has been audited by Deloitte LLP, the Company’s independent registered public accounting firm, as stated in their report immediately preceding the Company’s audited consolidated financial statements for the year ended December 31, 2018.
Limitations of Controls and Procedures
The Company’s management, including its President and Chief Executive Officer and Chief Financial Officer, believe that any internal controls and procedures for financial reporting, no matter how well conceived and operated, can provide only reasonable, not absolute, assurance that the objectives of the control system are met. Furthermore, the design of a control system must reflect the fact that there are resource constraints and the benefits of controls must be considered relative to their costs. Due to the inherent limitations of all control systems, they cannot provide absolute assurance that all control issues and instances of fraud, if any, within the Company have been prevented and/or detected. These inherent limitations include the realities that judgments in decision-making can be faulty and breakdowns can occur because of simple error or mistake. Additionally, controls can be circumvented by the individual acts of some persons, by collusion of two or more people, or by unauthorized override control. The design of any system of controls is also based in part upon certain assumptions about the likelihood of future events, and there can be no assurance that any design will succeed in achieving its stated goals under all potential future conditions. Accordingly, because of the inherent limitations in a cost-effective control system, misstatements due to error or fraud may occur and not be detected.
Changes in Internal Controls over Financial Reporting
There has been no change in the Company’s design of internal controls and procedures over financial reporting that has materially affected, or is reasonably likely to materially affect, the Company’s internal controls over financial reporting during the period covered by this MD&A.
66 |
MINERAL RESERVES AND MINERAL RESOURCES
Mineral Reserves
New Gold’s Mineral Reserve estimates as at December 31, 2018, exclusive of Peak Mines and Mesquite, is presented in the following table.
MINERAL RESERVES | |||||||
Metal grade | Contained metal | ||||||
Tonnes 000s |
Gold g/t |
Silver g/t |
Copper % |
Gold Koz |
Silver Koz |
Copper Mlbs | |
RAINY RIVER | |||||||
Direct processing reserves | |||||||
Open Pit | |||||||
Proven | 18,663 | 1.24 | 2.4 | - | 744 | 1,450 | - |
Probable | 47,670 | 1.18 | 3.0 | - | 1,810 | 4,542 | - |
Open Pit P&P (direct proc.) | 66,333 | 1.20 | 2.8 | - | 2,554 | 5,993 | - |
Underground | |||||||
Proven | - | - | - | - | - | - | - |
Probable | 8,954 | 3.55 | 9.5 | - | 1,021 | 2,728 | - |
Underground P&P (direct proc.) | 8,954 | 3.55 | 9.5 | - | 1,021 | 2,728 | - |
Total Direct Processing Reserves | 75,287 | 1.48 | 3.6 | - | 3,575 | 8,721 | - |
Low grade reserves | |||||||
Open Pit | |||||||
Proven | 8,430 | 0.36 | 2.0 | - | 97 | 541 | - |
Probable | 32,714 | 0.35 | 2.3 | - | 366 | 2,428 | - |
Open Pit P&P (low grade) | 41,145 | 0.35 | 2.2 | - | 463 | 2,969 | - |
Surface Stockpiles | |||||||
Proven | 7,307 | 0.63 | 1.8 | - | 147 | 426 | - |
Total Low Grade Reserves | 48,452 | 0.39 | 2.2 | - | 611 | 3,395 | - |
Combined Direct proc. & Low grade | |||||||
Proven | 34,400 | 0.89 | 2.2 | - | 989 | 2,417 | - |
Probable | 89,339 | 1.11 | 3.4 | - | 3,197 | 9,699 | - |
Total Rainy River P&P | 123,739 | 1.05 | 3.0 | - | 4,186 | 12,116 | - |
NEW AFTON | |||||||
A&B Zones | |||||||
Proven | - | - | - | - | - | - | - |
Probable | 25,731 | 0.51 | 1.9 | 0.74 | 420 | 1,612 | 420 |
C-zone | |||||||
Proven | - | - | - | - | - | - | - |
Probable | 26,911 | 0.76 | 1.9 | 0.82 | 657 | 1,668 | 484 |
Total New Afton P&P | 52,642 | 0.64 | 1.9 | 0.78 | 1,077 | 3,280 | 903 |
BLACKWATER | |||||||
Direct processing reserves | |||||||
Proven | 124,500 | 0.95 | 5.5 | - | 3,790 | 22,100 | - |
Probable | 169,700 | 0.68 | 4.1 | - | 3,730 | 22,300 | - |
P&P (direct proc.) | 294,300 | 0.79 | 4.7 | - | 7,510 | 44,400 | - |
Low grade reserves | |||||||
Proven | 20,100 | 0.50 | 3.6 | - | 330 | 2,300 | - |
Probable | 30,100 | 0.34 | 14.6 | - | 330 | 14,100 | - |
P&P (low grade) | 50,200 | 0.40 | 10.2 | - | 650 | 16,400 | - |
Combined Direct proc. & Low grade | |||||||
Proven | 144,600 | 0.88 | 5.3 | - | 4,110 | 24,400 | - |
Probable | 199,800 | 0.63 | 5.7 | - | 4,050 | 36,400 | - |
Total Blackwater P&P | 344,400 | 0.74 | 5.5 | - | 8,170 | 60,800 | - |
Total Proven & Probable Reserves | 13,433 | 76,136 | 903 |
Notes to the Mineral Reserve and Mineral Resource estimates are provided below.
67 |
Mineral Resources
Mineral Resource estimates as at December 31, 2018, exclusive of Peak Mines and Mesquite, are presented in the following tables:
MEASURED & INDICATED MINERAL RESOURCES (Exclusive of Mineral Reserves) | |||||||
Metal grade | Contained metal | ||||||
Tonnes 000s |
Gold g/t |
Silver g/t |
Copper % |
Gold Koz |
Silver Koz |
Copper Mlbs | |
RAINY RIVER | |||||||
Direct processing resources | |||||||
Open Pit | |||||||
Measured | 2,990 | 1.13 | 5.6 | - | 109 | 534 | - |
Indicated | 26,370 | 1.13 | 3.3 | - | 955 | 2,759 | - |
Open Pit M&I (direct proc.) | 29,360 | 1.13 | 3.5 | - | 1,064 | 3,292 | - |
Underground | |||||||
Measured | - | - | - | - | - | - | - |
Indicated | 7,908 | 3.06 | 8.6 | - | 778 | 2,188 | - |
Underground M&I (direct proc.) | 7,908 | 3.06 | 8.6 | - | 778 | 2,188 | - |
Low grade resources | |||||||
Open Pit | |||||||
Measured | 2,465 | 0.35 | 3.1 | - | 28 | 248 | - |
Indicated | 23,135 | 0.36 | 2.1 | - | 269 | 1,592 | - |
Open Pit M&I (low grade) | 25,600 | 0.36 | 2.2 | - | 297 | 1,840 | - |
Combined M&I | |||||||
Measured | 5,455 | 0.78 | 4.5 | - | 137 | 782 | - |
Indicated | 57,412 | 1.08 | 3.5 | - | 2,002 | 6,539 | - |
Total Rainy River M&I | 62,867 | 1.06 | 3.6 | - | 2,139 | 7,321 | - |
NEW AFTON | |||||||
A&B Zones | |||||||
Measured | 15,239 | 0.64 | 2.0 | 0.86 | 315 | 972 | 289 |
Indicated | 8,530 | 0.51 | 2.8 | 0.77 | 140 | 776 | 145 |
A&B Zone M&I | 23,769 | 0.60 | 2.3 | 0.83 | 455 | 1,748 | 434 |
C-zone | |||||||
Measured | 5,711 | 0.79 | 2.0 | 0.96 | 144 | 366 | 120 |
Indicated | 11,976 | 0.72 | 2.1 | 0.87 | 279 | 809 | 230 |
C-zone M&I | 17,687 | 0.74 | 2.1 | 0.90 | 423 | 1,174 | 350 |
HW Lens | |||||||
Measured | - | - | - | - | - | - | - |
Indicated | 10,951 | 0.52 | 2.1 | 0.44 | 183 | 722 | 107 |
HW Lens M&I | 10,951 | 0.52 | 2.1 | 0.44 | 183 | 722 | 107 |
Combined M&I | |||||||
Measured | 20,950 | 0.68 | 2.0 | 0.89 | 459 | 1,338 | 410 |
Indicated | 31,457 | 0.60 | 2.3 | 0.69 | 602 | 2,307 | 481 |
Total New Afton M&I | 52,407 | 0.63 | 2.2 | 0.77 | 1,061 | 3,645 | 891 |
BLACKWATER | |||||||
Direct processing resources | |||||||
Measured | 288 | 1.39 | 6.6 | - | 13 | 61 | - |
Indicated | 45,249 | 0.84 | 4.6 | - | 1,225 | 6,692 | - |
M&I (direct proc.) | 45,537 | 0.85 | 4.6 | - | 1,238 | 6,753 | - |
Low grade resources | |||||||
Measured | - | - | - | - | - | - | - |
Indicated | 15,779 | 0.32 | 3.9 | - | 162 | 1,980 | - |
M&I (low grade) | 15,779 | 0.32 | 3.9 | - | 162 | 1,980 | - |
Total Blackwater M&I | 61,316 | 0.71 | 4.4 | - | 1,400 | 8,733 | - |
Total M&I RESOURCES | 4,600 | 19,699 | 891 |
Notes to the Mineral Reserve and Mineral Resource estimates are provided below.
68 |
Inferred Mineral Resources
INFERRED MINERAL RESOURCES | |||||||
Metal grade | Contained metal | ||||||
Tonnes 000s |
Gold g/t |
Silver g/t |
Copper % |
Gold Koz |
Silver Koz |
Copper Mlbs | |
RAINY RIVER | |||||||
Direct processing | |||||||
Open Pit | 5,883 | 1.17 | 3.1 | - | 222 | 578 | - |
Underground | 1,270 | 3.68 | 3.8 | - | 150 | 156 | - |
Total Direct Processing | 7,153 | 1.62 | 3.2 | - | 372 | 733 | - |
Low grade resources | |||||||
Open Pit | 6,049 | 0.37 | 1.4 | - | 72 | 274 | - |
Rainy River Inferred | 13,202 | 1.05 | 2.4 | - | 444 | 1,007 | - |
NEW AFTON | |||||||
A&B Zones | 6,530 | 0.35 | 1.4 | 0.38 | 74 | 295 | 54 |
C-zone | 7,034 | 0.43 | 1.4 | 0.51 | 98 | 309 | 77 |
HW Lens | - | - | - | - | - | - | - |
New Afton Inferred | 13,564 | 0.39 | 1.4 | 0.45 | 172 | 605 | 132 |
BLACKWATER | |||||||
Direct processing | 13,905 | 0.76 | 4.0 | - | 341 | 1,788 | - |
Low grade resources | 4,207 | 0.33 | 3.4 | - | 44 | 460 | - |
Blackwater Inferred | 18,112 | 0.66 | 3.9 | - | 385 | 2,248 | - |
Total Inferred | 1,001 | 3,860 | 132 |
Notes to the mineral reserve and mineral resource estimates are provided below.
Notes to Mineral Reserve and Resource Estimates
1. | New Gold’s Mineral Reserves and Mineral Resources have been estimated in accordance with the CIM Standards, which are incorporated by reference in NI 43-101. |
2. | All Mineral Reserve and Mineral Resource estimates for New Gold’s properties and projects are effective December 31, 2018. |
3. | New Gold’s year-end 2018 Mineral Reserves and Mineral Resources have been estimated based on the following metal prices and foreign exchange (FX) rate criteria: |
Gold $/ounce |
Silver $/ounce |
Copper $/pound |
FX CAD:USD | |
Mineral Reserves | $1,275 | $17.00 | $3.00 | $1.30 |
Mineral Resources | $1,350 | $18.00 | $3.25 | $1.30 |
4. | Lower cut-offs for the Company’s Mineral Reserves and Mineral Resources are outlined in the following table: |
Mineral Property |
Mineral Reserves Lower cut-off |
Mineral Resources Lower Cut-off | |
Rainy River | O/P direct processing: | 0.30 – 0.50 g/t AuEq | 0.30 – 0.50 g/t AuEq |
O/P low grade material: | 0.30 g/t AuEq | 0.30 g/t AuEq | |
U/G direct processing: | 2.20 g/t AuEq | 2.00 g/t AuEq | |
New Afton | Main Zone – B1 & B2 Blocks: | C$ 17.00/t | All Resources: 0.40% CuEq |
B3 Block & C-zone: | C$ 24.00/t | ||
Blackwater | O/P direct processing: | 0.26 – 0.38 g/t AuEq | All Resources: 0.40 g/t AuEq |
O/P low grade material: | 0.32 g/t AuEq |
69 |
5. | New Gold reports its measured and indicated mineral resources exclusive of mineral reserves. Measured and indicated mineral resources that are not mineral reserves do not have demonstrated economic viability. Inferred mineral resources have a greater amount of uncertainty as to their existence and technical feasibility, do not have demonstrated economic viability, and are likewise exclusive of mineral reserves. Numbers may not add due to rounding. |
6. | Mineral resources are classified as measured, indicated and inferred based on relative levels of confidence in their estimation and on technical and economic parameters consistent with the methods considered to be most suitable to their potential commercial extraction. The designators ‘open pit’ and ‘underground’ may be used to indicate the envisioned mining method for different portions of a resource. Similarly, the designators ‘direct processing’ and ‘lower grade material’ may be applied to differentiate material envisioned to be mined and processed directly from material to be mined and stored separately for future processing. Mineral reserves and mineral resources may be materially affected by environmental, permitting, legal, title, taxation, sociopolitical, marketing and other risks and relevant issues. Additional details regarding mineral reserve and mineral resource estimation, classification, reporting parameters, key assumptions and associated risks for each of New Gold’s material properties are provided in the respective NI 43-101 Technical Reports, which are available at www.sedar.com. |
7. | The preparation of New Gold's consolidated statement and estimation of mineral reserves has been completed under the oversight and review of Mr. Nicholas Kwong, Director of Technical Services for the Company. Mr. Kwong is a Professional Engineer and member of the Association of Professional Engineers Ontario. Preparation of New Gold’s has consolidated statement and estimation of mineral resources has been completed under the oversight and review of Mr. Mark Petersen, a consultant to New Gold and former Vice President, Exploration for the Company. Mr. Petersen is a SME Registered Member, AIPG Certified Professional Geologist. Mr. Kwong and Mr. Petersen are "Qualified Persons" as defined by NI 43-101. |
CAUTIONARY NOTES
Cautionary Note to U.S. Readers Concerning Estimates of Mineral Reserves and Mineral Resources
Information concerning the properties and operations of New Gold has been prepared in accordance with Canadian standards under applicable Canadian securities laws, and may not be comparable to similar information for United States companies. The terms “Mineral Resource”, “Measured Mineral Resource”, “Indicated Mineral Resource” and “Inferred Mineral Resource” used in this MD&A are Canadian mining terms as defined in the CIM Definition Standards for Mineral Resources and Mineral Reserves adopted by the CIM Council on May 10, 2014 and incorporated by reference in National Instrument 43-101 (“NI 43-101”). While the terms “Mineral Resource”, “Measured Mineral Resource”, “Indicated Mineral Resource” and “Inferred Mineral Resource” are recognized and required by Canadian securities regulations, they are not defined terms under standards of the United States Securities and Exchange Commission. As such, certain information contained in this MD&A concerning descriptions of mineralization and resources under Canadian standards is not comparable to similar information made public by United States companies subject to the reporting and disclosure requirements of the United States Securities and Exchange Commission.
An “Inferred Mineral Resource” has a great amount of uncertainty as to its existence and as to its economic and legal feasibility. Under Canadian rules, estimates of Inferred Mineral Resources may not form the basis of feasibility or pre-feasibility studies. It cannot be assumed that all or any part of an “Inferred Mineral Resource” will ever be upgraded to a higher confidence category through additional exploration drilling and technical evaluation. Readers are cautioned not to assume that all or any part of an “Inferred Mineral Resource” exists or is economically or legally mineable.
70 |
Under United States standards, mineralization may not be classified as a “Reserve” unless the determination has been made that the mineralization could be economically and legally produced or extracted at the time the Reserve estimation is made. Readers are cautioned not to assume that all or any part of the Measured or Indicated Mineral Resources will ever be converted into Mineral Reserves. In addition, the definitions of “Proven Mineral Reserves” and “Probable Mineral Reserves” under CIM standards differ in certain respects from the standards of the United States Securities and Exchange Commission.
Cautionary Note Regarding Forward-Looking Statements
Certain information contained in this MD&A, including any information relating to New Gold’s future financial or operating performance are “forward looking”. All statements in this MD&A, other than statements of historical fact, which address events, results, outcomes or developments that New Gold expects to occur are “forward-looking statements”. Forward-looking statements are statements that are not historical facts and are generally, but not always, identified by the use of forward-looking terminology such as “plans”, “expects”, “is expected”, “budget”, “scheduled”, “targeted”, “estimates”, “forecasts”, “intends”, “anticipates”, “projects”, “potential”, “believes” or variations of such words and phrases or statements that certain actions, events or results “may”, “could”, “would”, “should”, “might” or “will be taken”, “occur” or “be achieved” or the negative connotation of such terms. Forward-looking statements in this MD&A include those under the heading “Outlook for 2019” and “Development and Exploration Review” include, among others, statements with respect to: guidance for production, operating expenses per gold ounce sold, total cash costs and all-in sustaining costs, and the factors contributing to those expected results, as well as expected capital expenditures; Mineral Reserve and Mineral Resource estimates; grades expected to be mined at the Company’s operations; the expected production, costs, economics and operating parameters of Blackwater and New Afton C-zone; planned activities for 2019 and beyond at the Company’s operations and projects, as well as planned exploration activities, expenses; expected permitting and development activities for Blackwater and the New Afton C-zone and production, costs, economics, grade and other operating parameters of Rainy River and New Afton; planned development activities and timing for 2019 and future years at the Rainy River Mine,.
All forward-looking statements in this MD&A are based on the opinions and estimates of management as of the date such statements are made and are subject to important risk factors and uncertainties, many of which are beyond New Gold’s ability to control or predict. Certain material assumptions regarding such forward-looking statements are discussed in this MD&A, New Gold’s Annual Information Form and its Technical Reports filed on SEDAR at www.sedar.com. In addition to, and subject to, such assumptions discussed in more detail elsewhere, the forward-looking statements in this MD&A are also subject to the following assumptions: (1) there being no significant disruptions affecting New Gold’s operations; (2) political and legal developments in jurisdictions where New Gold operates, or may in the future operate, being consistent with New Gold’s current expectations; (3) the accuracy of New Gold’s current Mineral Reserve and Mineral Resource estimates; (4) the exchange rate between the Canadian dollar and U.S. dollar and, to a lesser extent, the Mexican peso, being approximately consistent with current levels; (5) prices for diesel, natural gas, fuel oil, electricity and other key supplies being approximately consistent with current levels; (6) equipment, labour and material costs increasing on a basis consistent with New Gold’s current expectations; (7) arrangements with First Nations and other Aboriginal groups in respect of Rainy River and Blackwater being consistent with New Gold’s current expectations; (8) all required permits, licenses and authorizations being obtained from the relevant governments and other relevant stakeholders within the expected timelines; (9) the results of the feasibility studies for New Afton C-zone and Blackwater being realized; and (10) in the case of production, cost and expenditure outlooks at operating mine’s for 2019, metals and commodity prices, exchange rates, grades, recovery rates, mill availability and mill throughput rates being consistent with those estimated for the purposes of 2019 guidance.
71 |
Forward-looking statements are necessarily based on estimates and assumptions that are inherently subject to known and unknown risks, uncertainties and other factors that may cause actual results, level of activity, performance or achievements to be materially different from those expressed or implied by such forward-looking statements. Such factors include, without limitation: significant capital requirements and the availability and management of capital resources; additional funding requirements; price volatility in the spot and forward markets for metals and other commodities; fluctuations in the international currency markets and in the rates of exchange of the currencies of Canada and the United States and, to a lesser extent, Mexico; discrepancies between actual and estimated production, between actual and estimated Mineral Reserves and Mineral Resources and between actual and estimated metallurgical recoveries; risks related to early production at the Rainy River Mine, including failure of equipment, machinery, the process circuit or other processes to perform as designed or intended; changes in national and local government legislation in Canada and, to a lesser extent, Mexico or any other country in which New Gold currently or may in the future carry on business; taxation; controls, regulations and political or economic developments in the countries in which New Gold does or may carry on business; the speculative nature of mineral exploration and development, including the risks of obtaining and maintaining the validity and enforceability of the necessary licenses and permits and complying with the permitting requirements of each jurisdiction in which New Gold operates, including, but not limited to: in Canada, obtaining the necessary permits for New Afton C-zone and Blackwater; the lack of certainty with respect to foreign legal systems, which may not be immune from the influence of political pressure, corruption or other factors that are inconsistent with the rule of law; the uncertainties inherent to current and future legal challenges New Gold is or may become a party to; diminishing quantities or grades of Mineral Reserves and Mineral Resources; competition; loss of key employees; rising costs of labour, supplies, fuel and equipment; actual results of current exploration or reclamation activities; uncertainties inherent to mining economic studies including the feasibility studies for New Afton C-zone and Blackwater; the uncertainty with respect to prevailing market conditions necessary for a positive development or construction decision for Blackwater; changes in project parameters as plans continue to be refined; accidents; labour disputes; defective title to mineral claims or property or contests over claims to mineral properties; unexpected delays and costs inherent to consulting and accommodating rights of First Nations and other Aboriginal groups; uncertainties and unanticipated delays associated with obtaining and maintaining necessary licenses, permits and authorizations and complying with permitting requirements, including those associated with the environmental assessment process for Blackwater. In addition, there are risks and hazards associated with the business of mineral exploration, development and mining, including environmental events and hazards, industrial accidents, unusual or unexpected formations, pressures, cave-ins, flooding and gold bullion losses (and the risk of inadequate insurance or inability to obtain insurance to cover these risks) as well as “Risk Factors” included in New Gold’s disclosure documents filed on and available on SEDAR at www.sedar.com. Forward-looking statements are not guarantees of future performance, and actual results and future events could materially differ from those anticipated in such statements. All of the forward-looking statements contained in this MD&A are qualified by these cautionary statements. New Gold expressly disclaims any intention or obligation to update or revise any forward-looking statements whether as a result of new information, events or otherwise, except in accordance with applicable securities laws.
Technical Information
The scientific and technical information relating to the operation of New Gold’s operating mine’s and Mineral Reserves contained herein has been reviewed and approved by Mr. Nicholas Kwong, Director, Technical Services of New Gold. The scientific and technical information relating to Mineral Resources contained herein has been reviewed and approved by Mr. Mark A. Petersen a consultant to New Gold and its former Vice President, Exploration. Mr. Kwong is a Professional Engineer and member of the Association of Professional Engineers Ontario. Mr. Petersen is a SME Registered Member, AIPG Certified Professional Geologist. Mr. Kwong and Mr. Petersen are "Qualified Persons" for the purposes of NI 43-101.
The estimates of Mineral Reserves and Mineral Resources discussed in this MD&A may be materially affected by environmental, permitting, legal, title, taxation, sociopolitical, marketing and other relevant issues. New Gold’s current Annual Information Form and the NI 43-101 Technical Reports for its mineral properties, all of which are available on SEDAR at www.sedar.com, contain further details regarding Mineral Reserve and Mineral Resource estimates, classification and reporting parameters, key assumptions and associated risks for each of New Gold's mineral properties, including a breakdown by category.
72 |
Exhibit 4
Code of Business Conduct and Ethics
This Code of Business Conduct and Ethics (“Code”) applies to every Director, Officer (including our President and Chief Executive Officer (“CEO”) and Chief Financial Officer (“CFO”)), contractor and employee of New Gold Inc. or its subsidiaries (collectively the “Company”). For the purposes of this Code, the term “employee” includes contractors and any individual who is paid on the Company’s payroll.
To further the Company’s values of integrity, creativity, commitment, development of employees and teamwork, we have established this Code. Our Code strives to deter wrongdoing and promote the following objectives:
· | Honest and ethical conduct, including ethical interactions with government officials and the ethical handling of actual or apparent conflicts of interest between personal and professional relationships; |
· | Full, fair, accurate, timely, understandable and transparent disclosure in periodic reports and documents required to be filed by the Company and in other public communications made by the Company; |
· | Compliance with the applicable exchange, government and self-regulatory organization laws, rules and regulations; |
· | Prompt internal reporting of Code violations; and |
· | Accountability for compliance with the Code. |
Below, we discuss situations that require application of our fundamental principles and promotion of our objectives. If there is a conflict between this Code and a specific procedure, you should consult the CEO or the General Counsel for guidance. In the event of a conflict between this Code and any such procedure, or for any other guidance in respect of this Code absent a specific referral herein, the CEO or General Counsel, as the case may be, should consult the Chair of the Audit Committee of the Board of Directors.
Accountability for Compliance with the Code
Each of the Company’s directors, officers and employees is expected to:
Understand. The Company expects you to understand the requirements of your position including Company expectations and laws, rules and regulations that apply to your position.
Comply. The Company expects you to comply with this Code and all applicable laws, rules and regulations.
Report. The Company expects you to report any violation of this Code of which you become aware.
Be Accountable. The Company holds you accountable for complying with this Code.
New Gold Inc. – Code of Business Conduct and Ethics |
Table of Contents
Accounting Policies | 1 |
Commitment | 1 |
Compliance with Laws, Rules and Regulations | 1 |
Computer and Information Systems | 1 |
Confidential Information Belonging to Others | 2 |
Confidential and Proprietary Information | 2 |
Conflicts of Interest | 3 |
Corporate Opportunities and Use and Protection of Company Assets | 4 |
Disclosure Policies and Controls | 4 |
Fair Dealing with Others | 5 |
Filing of Government Reports | 5 |
Bribery | 5 |
Foreign Corrupt Practices Act | 5 |
Health, Safety, Environment & Corporate Social Responsibility | 6 |
Political Contributions | 6 |
Prohibited Substances | 6 |
Relations, Respect and Contribution | 6 |
Reporting of Code Violations | 7 |
Non-Retaliation for Reporting | 7 |
Anonymous Reporting | 8 |
Waivers | 8 |
Amendments and Modifications of this Code | 8 |
Conclusion | 8 |
Discipline for Noncompliance with this Code | 9 |
New Gold Inc. – Code of Business Conduct and Ethics |
Accounting Policies
The Company and each of its subsidiaries will make and keep books, records and accounts which, in reasonable detail, accurately and fairly present the transactions and disposition of the assets of the Company.
All directors, officers and employees are prohibited from directly or indirectly falsifying or causing to be false or misleading any financial or accounting book, record or account. You and others are expressly prohibited from directly or indirectly manipulating an audit, and from destroying or tampering with any record, document or tangible object with the intent to obstruct a pending or contemplated audit, review or investigation. The commission of, or participation in, one of these prohibited activities or other illegal conduct will subject you to penalties under applicable laws and regulations, as well as disciplinary action, including termination of employment.
No director, officer or employee of the Company may directly or indirectly;
· | Make or cause to be made a materially false or misleading statement, or |
· | Omit to state, or cause another person to omit to state, any material fact necessary to make statements made not misleading |
in connection with the audit of financial statements by independent accountants, the preparation of any required reports whether by independent or internal accountants, or any other work which involves or relates to the filing of a document with the applicable Canadian securities regulatory authorities or the U.S. Securities and Exchange Commission (“SEC”).
Commitment
To demonstrate our determination and commitment, the Company asks each director, officer and employee to review the Code periodically throughout the year. Take the opportunity to discuss with management any circumstances that may have arisen that could be an actual or potential violation of these ethical standards of conduct. Directors, officers and employees are required to confirm compliance with the Code annually.
Compliance with Laws, Rules and Regulations
The Company’s goal and intention is to comply with the laws, rules and regulations by which we are governed. In fact, we strive to comply not only with requirements of the law but also with recognized compliance practices. All illegal activities or illegal conduct by or on behalf of New Gold are prohibited whether or not they are specifically identified in this Code. Where law does not govern a situation or where the law is unclear or conflicting, you should discuss the situation with your supervisor and management should seek advice from the CEO or General Counsel. Business should always be conducted in a fair and forthright manner. Directors, officers and employees are expected to act according to high ethical standards.
Computer and Information Systems
For business purposes, officers and employees are provided telephones, tablets, mobile devices and computers and software, including network access to computing systems such as the Internet and e-mail, to improve personal productivity and to efficiently manage proprietary information in a secure and reliable manner. As with other equipment and assets of the Company, we are each responsible for the appropriate use of these assets. Except for limited personal use of the Company’s telephones, tablets, mobile devices and computers, such equipment may be used only for business purposes. Officers and employees should not expect a right to privacy of their e-mail, Internet or network use. All communications, e-mails or Internet use on Company equipment or networks may be subject to monitoring by the Company for legitimate business purposes.
New Gold Inc. – Code of Business Conduct and Ethics | 1 |
Confidential Information Belonging to Others
You must respect the confidentiality of information, including, but not limited to, trade secrets and other information given in confidence by others, including but not limited to partners, suppliers, contractors, competitors, customers or acquisition or investment targets, just as we protect our own confidential information. However, certain restrictions arising in relation to the information of others may place an unfair or inappropriate burden on the Company’s future business. For that reason, directors, officers and employees should coordinate with the CEO, CFO or General Counsel to ensure appropriate agreements are in place prior to receiving any confidential third-party information. These agreements must reflect a balance between the value of the information received on the one hand and the logistical and financial costs of maintaining confidentiality of the information and, if applicable, limiting the Company’s business opportunities on the other. In addition, any confidential information that you may possess from an outside source, such as a previous employer, must not, so long as such information remains confidential, be disclosed to or used by the Company. Unsolicited confidential information submitted to the Company should be refused, returned to the sender where possible and deleted, if received via the Internet.
Confidential and Proprietary Information
It is the Company’s policy to ensure that all operations, activities and business affairs of the Company are kept confidential to the greatest extent possible. Confidential information includes all non-public information that might be of use to competitors, or that might be harmful to the Company or its customers if disclosed. Confidential and proprietary information about the Company belongs to the Company, must be treated with strictest confidence and is not to be disclosed or discussed with others.
Unless otherwise agreed to in writing, confidential and proprietary information includes any and all non-public information, methods, inventions, improvements or discoveries, whether or not patentable or copyrightable, and any other information of a similar nature disclosed to the directors, officers or employees of the Company or otherwise made known to the Company as a consequence of or through employment or association with the Company (including information originated by the director, officer or employee). This can include, but is not limited to, information regarding the Company’s business, products, processes, and services. It also can include information relating to research, development, inventions, trade secrets, intellectual property of any type or description, data, business plans, marketing strategies, engineering, contract negotiations and business methods or practices.
The following are examples of information that are not considered confidential:
· | Information that is in the public domain to the extent it is readily available; |
· | Information that becomes generally known to the public other than by disclosure by the Company or a director, officer or employee; or |
· | Information you receive from a party that is under no legal obligation of confidentiality with the Company with respect to such information. |
We have exclusive property rights to all confidential and proprietary information regarding the Company. The unauthorized disclosure of this information could destroy its value to the Company and give others an unfair advantage. You are responsible for safeguarding Company information and complying with established security controls and procedures. All documents, records, notebooks, notes, memoranda and similar repositories of information containing information of a secret, proprietary, confidential or generally undisclosed nature relating to the Company or our operations and activities made or compiled by the director, officer or employee or made available to you prior to or during the term of your association with the Company, including any copies thereof, unless otherwise agreed to in writing, belong to the Company and shall be held by you in trust solely for the benefit of the Company, and shall be delivered to the Company by you on the termination of your association with us or at any other time we request.
New Gold Inc. – Code of Business Conduct and Ethics | 2 |
Conflicts of Interest
Conflicts of interest can arise in virtually every area of our operations. A “conflict of interest” exists whenever an individual’s personal interests interfere or conflict with the interests of the Company. We must strive to handle in an ethical and practical manner actual or apparent conflicts of interest between personal and professional relationships. We must each make decisions in the best interest of the Company. Business, financial or other relationships with suppliers, customers or competitors that might impair or appear to impair the exercise of our judgment should be avoided.
Here are some examples of potential conflicts of interest:
Family Members. Actions of family members may create a conflict of interest. For example, gifts to family members by a supplier of the Company are considered gifts to you and should be reported if they involve more than ordinary social amenity or are of more than nominal value from any organization doing or seeking to do business with the Company. Doing business for the Company with organizations where your family members are employed or that are partially or fully owned by your family members or close friends may create a conflict or the appearance of a conflict of interest. For purposes of the Code “family members” include any child, stepchild, grandchild, parent, stepparent, grandparent, spouse (including a common-law spouse), sibling, mother-in-law, father-in-law, son-in-law, daughter-in-law, brother-in-law or sister-in-law, and adoptive relationships.
Gifts, Entertainment, Loans, or Other Favors. Directors, officers and employees shall not seek or accept gifts, entertainment, loans, or other favors for personal gain if it is more than ordinary social amenity or of more than nominal value from anyone soliciting business from, or doing business with the Company, or from any person or entity in competition with us. Other than common business courtesies, directors, officers, and employees must not offer or provide anything to any person or organization for the purpose of influencing the person or organization in their business relationship with us. Additional restrictions apply when providing anything of value to a government official or employee, employee or agent of a state-owned or controlled enterprise, employee or agent of a public international organization, political party or official thereof or any candidate for a political office. Please refer to the sections of this Code on Bribery and the Foreign Corrupt Practices Act and the Corruption of Foreign Public Officials Act for more information.
Directors, officers and employees are expected to deal with advisors or suppliers who best serve the needs of the Company as to price, quality and service in making decisions concerning the use or purchase of materials, equipment, property or services. Directors, officers and employees who use the company’s advisors, suppliers or contractors in a personal capacity are expected to pay market value for materials and services provided.
Outside Employment. Officers and employees may not participate in outside employment, self-employment, or serve as officers, directors, partners or consultants for outside organizations, if such activity:
· | reduces work efficiency; |
· | interferes with your ability to act conscientiously in our best interest; |
· | requires you to utilize our proprietary or confidential procedures, plans or techniques; or |
· | negatively impacts the reputation of the Company. |
New Gold Inc. – Code of Business Conduct and Ethics | 3 |
You must inform your supervisor of any outside employment, including the employer’s name and expected work hours.
You should report any actual or potential conflict of interest involving yourself or others of which you become aware to your supervisor or the CEO or General Counsel. Officers and Directors should report any actual or potential conflict of interest involving yourself or another officer or director of which you become aware to the Chair of the Audit Committee of the Board of Directors.
Corporate Opportunities and Use and Protection of Company Assets
You are prohibited from:
· | taking for yourself, personally, opportunities that are discovered through the use of Company property, information or position; |
· | using Company property, information or position for personal gain; or |
· | competing with the Company. |
You have a duty to the Company to advance its legitimate interests when the opportunity to do so arises.
You are personally responsible and accountable for the proper expenditure of Company funds, including money spent for travel expenses or for business entertainment. You are also responsible for the proper use of property over which you have control, including both Company property and funds and property that has been entrusted to your custody. Company assets must be used only for proper purposes.
Company property should not be misused. Company property may not be sold, loaned or given away regardless of condition or value, without proper authorization. Each director, officer and employee should protect our assets and ensure their efficient use. Theft, carelessness and waste have a direct impact on the Company’s profitability. Company assets should be used only for legitimate business purposes.
Disclosure Policies and Controls
The continuing excellence of the Company’s reputation depends on our full and complete disclosure of important information about the Company that is used in the securities marketplace. Our financial and non-financial disclosures and filings with the applicable Canadian securities regulatory authorities and SEC must be accurate and timely. Proper reporting of reliable, truthful and accurate information is a complex process involving cooperation among many of us. We must all work together to ensure that reliable, truthful and accurate information is disclosed to the public.
The Company must disclose to the applicable Canadian securities regulatory authorities, the SEC, current security holders and the investing public, information that is required, and any additional information that may be necessary to ensure the required disclosures are not misleading or inaccurate. The Company requires you to participate in the disclosure process in accordance with the Disclosure, Confidentiality and Insider Trading Policy, which is overseen by the Disclosure Committee appointed in accordance with such policy. The disclosure process is designed to record, process, summarize and report material information as required by all applicable laws, rules and regulations. Participation in the disclosure process is a requirement of a public company, and full cooperation with members of the Disclosure Committee and other officers, managers and employees in the disclosure process is a requirement of this Code.
New Gold Inc. – Code of Business Conduct and Ethics | 4 |
Officers and employees must fully comply with their disclosure responsibilities in an accurate and timely manner (within the guidelines of applicable securities regulatory authorities) or be subject to discipline of up to and including termination of employment.
Fair Dealing with Others
No director, officer or employee should take unfair advantage of anyone through manipulation, concealment, abuse of privileged information, misrepresentation of material facts or any other unfair-dealing practice.
Filing of Government Reports
Any reports or information provided by the Company, or on our behalf, to federal, provincial, territorial, state, local or foreign governments must be true and accurate. You are required to assist the Company in providing true and accurate reports and information. Any omission, misstatement or lack of attention to detail could result in a violation of the reporting laws, rules and regulations.
Bribery
You are strictly forbidden from, directly or indirectly, offering, promising or giving money, gifts, loans, rewards, favors or anything of value to any government official or employee, employee or agent of a state-owned or controlled enterprise, employee or agent of a public international organization, political party or official thereof or any candidate for a political office, including any agent or other intermediary, including a close family member or household member, of any of the above, in connection with the business of New Gold, except in full compliance with the Company’s Anti-Bribery and Anti-Corruption Policy.
Those paying a bribe may subject the Company and themselves to civil and criminal penalties. When dealing with government representatives or officials and private parties, no improper payments will be tolerated. If you become aware of or receive any solicitation for, or offer of, money or a gift, that is intended to influence an official decision or business decision inside or outside of the Company, it should be reported to your supervisor, the General Counsel or the CEO immediately.
The Company prohibits improper payments in all of its activities, whether these activities are with governments or in the private sector. Please refer to the Company’s Anti-Bribery and Anti-Corruption Policy and procedures implemented in respect of that policy for more information.
Foreign Corrupt Practices Act and the Corruption of Foreign Public Officials Act
The United States Foreign Corrupt Practices Act (“FCPA”) and the Corruption of Foreign Public Officials Act (Canada) (“CFPOA”) contain certain prohibitions with respect to giving anything of value, directly or indirectly, to foreign government officials or certain other individuals in order to obtain, retain or direct business for or to any person. Accordingly, corporate funds, property or anything of value may not be, directly or indirectly, offered or given by you or an agent acting on our behalf, to a government official or employee, employee or agent of a state-owned or controlled enterprise, employee or agent of a public international organization, political party or official thereof or any candidate for a political office, including any agent or other intermediary, including a close family member or household member, of any of the above for the purpose of influencing any act or decision of such party or person or inducing such party or person to use its or his influence, or to otherwise secure any improper advantage, in order to assist in obtaining or retaining business for, or directing business to, any person.
New Gold Inc. – Code of Business Conduct and Ethics | 5 |
You are also prohibited from offering or paying anything of value to any person if it is known or there is a reason to know that all or part of such payment will be used for the above-described prohibited actions. This provision includes situations when intermediaries, such as affiliates, or agents, are used to channel payments to government officials.
In addition to complying with the FCPA and CFPOA, you are required to comply with local anti-bribery and anti-corruption laws in the jurisdictions in which New Gold conducts business.
Each officer, director and employee is also expected to comply with our additional policies, programs, standards and procedures related to anti-corruption compliance. Please refer to the Company’s Anti-Bribery and Anti-Corruption Policy and procedures implemented in respect of that policy for more information.
Health, Safety, Environment & Corporate Social Responsibility
The Company is committed to managing and operating our assets in a manner that is protective of human health and safety and the environment, respects human rights and involves active engagement with host communities. It is our policy to comply, in all material respects, with applicable health, safety and environmental laws and regulations. Each employee is also expected to comply with our policies, programs, standards and procedures relating to health, safety, the environment, human rights, community engagement and corporate social responsibility.
Political Contributions
You must refrain from making any use of Company, personal or other funds or resources on behalf of the Company, or which may be attributed to or associated with the Company, for political or other purposes which are improper or prohibited by the applicable federal, provincial, territorial, state, local or foreign laws, rules or regulations. Company contributions, or those which may be associated with the Company, or expenditures in connection with election campaigns may be permitted only to the extent allowed by federal, provincial, territorial, state, local or foreign election laws, rules and regulations and require the approval of the CEO.
You are encouraged to participate actively in the political process in your personal capacity, but not on behalf of the Company. We believe that individual participation is a continuing responsibility of those who live in a free country.
Prohibited Substances
You are prohibited from using alcohol, cannabis, illegal drugs or other prohibited items, including unauthorized legal drugs which affect the ability to perform your work duties, while on Company premises. You are also prohibited from the possession or use of alcoholic beverages, cannabis, firearms, weapons or explosives on our property unless authorized by the CEO or an Executive Vice President. You are also prohibited from reporting to work while under the influence of alcohol, cannabis or illegal drugs.
Relations, Respect and Contribution
We function as a team. Your success as part of this team depends on your contribution and ability to inspire the trust and confidence of your coworkers and supervisors. Respect for the rights and dignity of others and a dedication to the good of our Company are essential.
A cornerstone of our success is the teamwork of our directors, officers and employees. We must each respect the rights of others while working as a team to fulfill our objectives. To best function as part of a team, you must be trustworthy and dedicated to high standards of performance. The relationships between business groups also require teamwork.
New Gold Inc. – Code of Business Conduct and Ethics | 6 |
To facilitate respect and contribution among employees, we have implemented the following employment policies:
· | To hire, pay and assign work on the basis of qualifications and performance; |
· | Not to discriminate on the basis of race, religion, ethnicity, national origin, color, gender, age, sexual orientation, citizenship, veteran’s status, marital status or disability; |
· | To attract and retain a highly talented workforce; |
· | To encourage skill growth through training and education and promotional opportunities; |
· | To encourage an open discussion between all levels of employees and to provide an opportunity for feedback from the top to the bottom and from the bottom to the top; |
· | To prohibit harassment (including sexual, physical, verbal) by others while an employee is on the job; |
· | To make the safety and security of our employees while at Company facilities a priority; |
· | To recognize and reward additional efforts that go beyond our expectations; and |
· | To respect all workers’ rights to dignity and personal privacy by not disclosing employee information, including protected health information, unnecessarily. |
Reporting of Code Violations
You should be alert and sensitive to situations that could result in actions that might violate federal, state, or local laws or the standards of conduct set forth in this Code. If you believe your own conduct or that of an employee, director or officer may have violated any such laws or this Code, you have an obligation to report the matter in accordance with this Code and/or the Whistleblower Policy.
Generally, you should raise such matters first with an immediate supervisor. However, if you are not comfortable bringing the matter up with your immediate supervisor, or do not believe the supervisor has dealt with the matter properly, then you should raise the matter with the CEO, CFO or General Counsel. Alternatively, complaints may be made in accordance with the Whistleblower Policy. The most important point is that possible violations should be reported and we support all means of reporting them.
Directors and officers should report any potential violations of this Code involving directors or officers to the Chair of the Audit Committee of the Board of Directors.
Non-Retaliation for Reporting
In no event will the Company take or threaten any action against you as a reprisal or retaliation for making a complaint in good faith in accordance with this Code or the Company’s Whistleblower Policy. However, if a reporting individual was involved in improper activity the individual may be appropriately disciplined even if he or she was the one who disclosed the matter to the Company. In these circumstances, we may consider the conduct of the reporting individual in reporting the information as a mitigating factor in any disciplinary decision.
We will not allow retaliation against a reporting individual for reporting, in good faith, a concern regarding compliance with this Code in accordance with this Code or the Company’s Whistleblower Policy. Retaliation for reporting an offense may be illegal under applicable law and prohibited under this Code. Retaliation for reporting any violation of a law, rule or regulation or a provision of this Code or the Company’s policies and procedures is prohibited. Retaliation will result in discipline up to and including termination of employment and may also result in criminal prosecution.
New Gold Inc. – Code of Business Conduct and Ethics | 7 |
Anonymous Reporting
If you wish to report a suspected violation of this Code anonymously, you may do so in accordance with the Company’s Whistleblower Policy. You do not have to reveal your identity in order to make a report. If you do reveal your identity, it will not be disclosed by the Chair of the Audit Committee unless disclosure is unavoidable during an investigation.
Waivers
There shall be no waiver of any part of this Code for any director or executive officer (being the CEO, the CFO, each Executive Vice President and each Vice President that is an executive officer as defined in National Instrument 51-102) except by a vote of the Board of Directors or a designated Board committee that will ascertain whether a waiver is appropriate under all the circumstances. If a waiver (or implicit waiver) is granted to a director or executive officer, notice of such waiver will be disclosed to the extent required by applicable law or stock exchange rules. For these purposes, the term “waiver” means the approval by the Company of a material departure from a provision of the Code, and the term “implicit waiver” means a failure of the Company to take action within a reasonable period of time regarding a material departure from a provision of the Code that has been made known to an executive officer. Any notices of waiver posted on our website shall remain there for a period of 12 months and shall be retained in our files as required by applicable law.
A waiver for a specific event arising under this Code may be granted to an employee that is not a director or executive officer on the approval of two of the following: the CEO, any Executive Vice President, the General Counsel, and any director. No other waivers of this Code are permitted.
Amendments and Modifications of this Code
There shall be no amendment or modification to this Code except by a vote of the Board of Directors or a designated Board committee that will ascertain whether an amendment or modification is appropriate.
In case of any amendment or modification of this Code that applies to an officer or director of the Company, the amendment or modification shall be posted on the Company’s website within five days of the Board vote or shall be otherwise disclosed as required by applicable law or applicable exchange rules. Notice posted on the website shall remain there for a period of 12 months and shall be retained in the Company’s files as required by law.
Conclusion
This Code is an attempt to point all of us at the Company in the right direction, but no document can achieve the level of principled compliance that we are seeking. In reality, each of us must strive every day to maintain our awareness of these issues and to comply with the Code’s principles to the best of our abilities. Before we take an action, we must always ask ourselves:
Does it feel right?
Is this action ethical in every way?
Is this action in compliance with the law?
Could my action create an appearance of impropriety?
Am I trying to fool anyone, including myself, about the propriety of this action?
New Gold Inc. – Code of Business Conduct and Ethics | 8 |
If an action would elicit the wrong answer to any of these questions, do not take it. We cannot expect perfection, but we do expect good faith. If you act in bad faith or fail to report illegal or unethical behavior, then you will be subject to disciplinary procedures. We hope that you agree that the best course of action is to be honest, forthright and loyal at all times.
Discipline for Noncompliance with this Code
Disciplinary actions for violations of this Code can include oral or written reprimands, suspension or termination of employment or a potential civil lawsuit against you.
The violation of laws, rules or regulations, which can subject the Company to fines and other penalties, may result in your criminal prosecution.
New Gold Inc. – Code of Business Conduct and Ethics | 9 |
Exhibit 5
Dodd-Frank Act Disclosure of Mine Safety and Health Administration Safety Data
Prior to its sale on October 30, 2018, the Mesquite Mine in California was the Company’s sole mine in the United States. Its operation is subject to regulation by The Federal Mine Safety and Health Administration (“MSHA”) under the Federal Mine Safety and Health Act of 1977 (“FMSH Act”). MSHA inspects the Mesquite Mine on a regular basis and issues citations and orders when it believes a violation has occurred under the FMSH Act.
As required by the reporting requirements regarding mine safety included in section 1503(a)(1) of the Dodd-Frank Wall Street Reform and Consumer Protection Act (“Dodd-Frank Act”), the table below presents the following information for the Mesquite Mine, for January 1 to October 30, 2018, the period for the year ended December 31, 2018 in which the Company was the operator (“Period”):
Reporting Requirement | Disclosure for Mesquite Mine for the Period |
The total number of violations of mandatory health or safety standards that could significantly and substantially contribute to the cause and effect of a coal or other mine safety or health hazard under section 104 of the FMSH Act for which the operator received a citation from the MSHA | 2 |
The total number of orders issued under section 104(b) of the FMSH Act | 0 |
The total number of citations and orders for unwarrantable failure of the mine operator to comply with mandatory health or safety standards under section 104(d) of the FMSH Act | 0 |
The total number of flagrant violations under section 110(b)(2) of the FMSH Act | 0 |
The total number of imminent danger orders issued under section 107(a) of the FMSH Act | 0 |
The total dollar value of proposed assessments from MSHA under the FMSH Act | 1,280 |
The total number of mining-related fatalities | 0 |
Notices received from MSHA during the Period regarding a pattern of violations of mandatory health or safety standards that are of such nature as could have significantly and substantially contributed to the cause and effect of coal or other mine health or safety hazards under section 104(e) of the FMSH Act | 0 |
Notices received from MSHA during the Period regarding the potential to have a pattern of violations of mandatory health or safety standards that are of such nature as could have significantly and substantially contributed to the cause and effect of coal or other mine health or safety hazards under section 104(e) of the FMSH Act | 0 |
The total number of legal actions before the Federal Mine Safety and Health Review Commission (“FMSHRC”) pending as of the last day of the Period | 0 |
The total number of legal actions before FMSHRC instituted during the Period | 8 |
The total number of legal actions before FMSHRC resolved during the Period | 8 |
Exhibit 6
Certification of President and Chief Executive Officer as Required by Rule 13a-14(a) under the Securities Exchange Act of 1934
I, Renaud Adams, certify that:
1. | I have reviewed this annual report on Form 40-F of New Gold Inc.; |
2. | Based on my knowledge, this report does not contain any untrue statement of a material fact or omit to state a material fact necessary to make the statements made, in light of the circumstances under which such statements were made, not misleading with respect to the period covered by this report; |
3. | Based on my knowledge, the financial statements, and other financial information included in this report, fairly present in all material respects the financial condition, results of operations and cash flows of the issuer as of, and for, the periods presented in this report; |
4. | The issuer’s other certifying officer(s) and I are responsible for establishing and maintaining disclosure controls and procedures (as defined in Exchange Act Rules 13a-15(e) and 15d-15(e)) and internal control over financial reporting (as defined in Exchange Act Rules 13a-15(f) and 15d-15(f)) for the issuer and have: |
a) | Designed such disclosure controls and procedures, or caused such disclosure controls and procedures to be designed under our supervision, to ensure that material information relating to the issuer, including its consolidated subsidiaries, is made known to us by others within those entities, particularly during the period in which this report is being prepared; |
b) | Designed such internal control over financial reporting, or caused such internal control over financial reporting to be designed under our supervision, to provide reasonable assurance regarding the reliability of financial reporting and the preparation of financial statements for external purposes in accordance with generally accepted accounting principles; |
c) | Evaluated the effectiveness of the issuer’s disclosure controls and procedures and presented in this report our conclusions about the effectiveness of the disclosure controls and procedures, as of the end of the period covered by this report based on such evaluation; and |
d) | Disclosed in this report any change in the issuer’s internal control over financial reporting that occurred during the period covered by the annual report that has materially affected, or is reasonably likely to materially affect, the issuer’s internal control over financial reporting; and |
5. | The issuer’s other certifying officer(s) and I have disclosed, based on our most recent evaluation of internal control over financial reporting, to the issuer’s auditors and the audit committee of the issuer’s board of directors (or persons performing the equivalent functions): |
a) | All significant deficiencies and material weaknesses in the design or operation of internal control over financial reporting which are reasonably likely to adversely affect the issuer’s ability to record, process, summarize and report financial information; and |
b) | Any fraud, whether or not material, that involves management or other employees who have a significant role in the issuer’s internal control over financial reporting. |
Date: March 29, 2019
/s/ Renaud Adams | |
Renaud Adams | |
President and Chief Executive Officer |
Exhibit 7
Certification of Chief Financial Officer as Required by Rule 13a-14(a) under the Securities Exchange Act of 1934
I, Robert Chausse, certify that:
1. | I have reviewed this annual report on Form 40-F of New Gold Inc.; |
2. | Based on my knowledge, this report does not contain any untrue statement of a material fact or omit to state a material fact necessary to make the statements made, in light of the circumstances under which such statements were made, not misleading with respect to the period covered by this report; |
3. | Based on my knowledge, the financial statements, and other financial information included in this report, fairly present in all material respects the financial condition, results of operations and cash flows of the issuer as of, and for, the periods presented in this report; |
4. | The issuer’s other certifying officer(s) and I are responsible for establishing and maintaining disclosure controls and procedures (as defined in Exchange Act Rules 13a-15(e) and 15d-15(e)) and internal control over financial reporting (as defined in Exchange Act Rules 13a-15(f) and 15d-15(f)) for the issuer and have: |
a) | Designed such disclosure controls and procedures, or caused such disclosure controls and procedures to be designed under our supervision, to ensure that material information relating to the issuer, including its consolidated subsidiaries, is made known to us by others within those entities, particularly during the period in which this report is being prepared; |
b) | Designed such internal control over financial reporting, or caused such internal control over financial reporting to be designed under our supervision, to provide reasonable assurance regarding the reliability of financial reporting and the preparation of financial statements for external purposes in accordance with generally accepted accounting principles; |
c) | Evaluated the effectiveness of the issuer’s disclosure controls and procedures and presented in this report our conclusions about the effectiveness of the disclosure controls and procedures, as of the end of the period covered by this report based on such evaluation; and |
d) | Disclosed in this report any change in the issuer’s internal control over financial reporting that occurred during the period covered by the annual report that has materially affected, or is reasonably likely to materially affect, the issuer’s internal control over financial reporting; and |
5. | The issuer’s other certifying officer(s) and I have disclosed, based on our most recent evaluation of internal control over financial reporting, to the issuer’s auditors and the audit committee of the issuer’s board of directors (or persons performing the equivalent functions): |
a) | All significant deficiencies and material weaknesses in the design or operation of internal control over financial reporting which are reasonably likely to adversely affect the issuer’s ability to record, process, summarize and report financial information; and |
b) | Any fraud, whether or not material, that involves management or other employees who have a significant role in the issuer’s internal control over financial reporting. |
Date: March 29, 2019
/s/ Robert Chausse | |
Robert Chausse | |
Executive Vice President and Chief Financial Officer |
Exhibit 8
Certification of President and Chief Executive Officer Pursuant to 18 U.S.C. Section 1350, as Adopted Pursuant to Section 906 of the Sarbanes-Oxley Act of 2002
In connection with the filing of the annual report on Form 40-F for the fiscal year ended December 31, 2018 (the “Report”) by New Gold Inc. (the “Company”), I, Renaud Adams, as President and Chief Executive Officer of the Company, hereby certify, pursuant to 18 U.S.C. §1350, as adopted pursuant to § 906 of the Sarbanes-Oxley Act of 2002, to the best of my knowledge that:
1. | The Report fully complies with the requirements of Section 13(a) of the Securities Exchange Act of 1934; and |
2. | The information contained in the Report fairly presents, in all material respects, the financial condition and results of operations of the Company. |
/s/ Renaud Adams | |
Renaud Adams | |
President and Chief Executive Officer |
Exhibit 9
Certification of Chief Financial Officer Pursuant to 18 U.S.C. Section 1350, as Adopted Pursuant to Section 906 of the Sarbanes-Oxley Act of 2002
In connection with the filing of the annual report on Form 40-F for the fiscal year ended December 31, 2018 (the “Report”) by New Gold Inc. (the “Company”), I, Robert Chausse, as Chief Financial Officer of the Company, hereby certify, pursuant to 18 U.S.C. §1350, as adopted pursuant to § 906 of the Sarbanes-Oxley Act of 2002, to the best of my knowledge that:
1. | The Report fully complies with the requirements of Section 13(a) of the Securities Exchange Act of 1934; and |
2. | The information contained in the Report fairly presents, in all material respects, the financial condition and results of operations of the Company. |
Dated: March 29, 2019
/s/ Robert Chausse | |
Robert Chausse | |
Executive Vice President and Chief Financial Officer |
Exhibit 10
Consent of Independent Registered Public Accounting Firm
We consent to the use of our reports dated February 13, 2019 relating to the consolidated financial statements of New Gold Inc. and subsidiaries (“New Gold Inc.”) and the effectiveness of New Gold Inc.’s internal control over financial reporting appearing in this annual report on Form 40-F of New Gold Inc. for the year ended December 31, 2018.
/s/ Deloitte LLP
Chartered Professional Accountants
Licensed Public Accountants
Toronto, Canada
March 29, 2019
Exhibit 11
Consent of Mark Petersen
United States Securities and Exchange Commission
Ladies and Gentlemen:
I, Mark A. Petersen, Professional Geoscientist (P.Geo) and Practicing Member of the Association of Professional Geoscientists of Ontario (APGO), SME Registered Member, AIPG Certified Professional Geologist (CPG), hereby consent to the use of and reference to my name, and the inclusion in the annual report on Form 40-F of New Gold Inc. of the information reviewed and approved by me relating to Mineral Resources that is of a scientific or technical nature contained therein for the financial year ended December 31, 2018.
Dated this 29th day of March, 2019
Yours truly,
/s/ Mark A. Petersen | ||
Name: | Mark A. Petersen | |
APGO P.Geo. AIPG Certified Professional Geologist SME Registered Member MAP Geo Consulting |
Exhibit 12
Consent of Nicholas Kwong
United States Securities and Exchange Commission
Ladies and Gentlemen:
I, Nicholas Kwong, Professional Engineer, hereby consent to the use of and reference to my name, and the inclusion in the annual report on Form 40-F of New Gold Inc. of the information reviewed and approved by me relating to Mineral Reserves that is of a scientific or technical nature contained therein for the financial year ended December 31, 2018.
Dated this 29th day of March, 2019
Yours truly,
/s/ Nicholas Kwong | ||
Name: | Nicholas Kwong | |
Professional Engineer | ||
New Gold Inc. |
Exhibit 13
Consent of Eric Vinet
United States Securities and Exchange Commission
Ladies and Gentlemen:
I, Eric Vinet, Professional Engineer, hereby consent to the use of and reference to my name, and the inclusion in the annual report on Form 40-F of New Gold Inc. of the information reviewed and approved by me that is all scientific and technical information contained therein for the financial year ended December 31, 2018 other than that related to Mineral Reserves and Mineral Resources.
Dated this 29th day of March, 2019
Yours truly,
/s/ Eric Vinet | ||
Name: | Eric Vinet | |
Professional Engineer | ||
New Gold Inc. |
&@C9QXB'?3-+?:,Z1%4GN+OH&WPT0]!+ @S>X: EAH$&@):V#0 :
M#0.7]1']OX:"ZZK48T$VW#0)-S AH9=DH'H,Y:V#0 ] +"IV#4>SQM:J;E8PFPC3)YLGE/;O8Z^P_NMVW:X
MNZ[ON.UM['W%JU[C*\UL7_U&!65'V3L<'O6?W_&K?\
M<>XP8\-WR?'ABM>U(KT2<\DGNCQ_:_/ODG9+VS^TRUQY/:,N;)V]E6O)6SWK?)RE-75G5*+
M)KBW6(;1ZSZJ?KV^L?U4^E/KWZ&__1GT"^F'TE^I7J'TQZP]6^BOHM]%O2WT
MWH\AZQ]+K%RLU0\Y7JO)2W]
M%/=B^;T??_V'==AWF"U.[Q=OEM;T77'D[BM;8)=,MG99%>LNBMZ;LE>-6X=EFI?MLG<8Z5]=7R8\%KU[C2^&G!XWCR-*[KZE:MTY:(^U?
M6G_QYR\O];O5/HW],OJ[T%ZD2A]1OHI]/^2^EJ\IZYD]3_2V3ZT>C*_+>F.8
M]5>H?47II.(Y[AVY/B^1/*-Q-WDY^(=X87C=G"KXCV;]P%B]EQ]Y\DQ9\;?;
M]QE6;CCX9O[?(ZWK2M+\JVAUX)Y*Q'8J5ZE->6:7S>0-J94D7PV']OO8\>%]KFOW6?L_0S8J
M8\F2:XJY[*V5XHK6U;6M5-6=K<(C'P3:?ENX_<_Y!FRT[G%C[7!W:[C#FO?'
MCBV6V"KKB61.UJNJ5G-56JR-SE]2T-?(>7_4GSTY]>Q>EOIW]+?ISQWU*^EM
MWZ2>JN)]'<9ZQGJ6O3O(>N/2WU LWZUGUIZX]7\M5YM>;]'THH76S\K7I*T,
M===VX>7Q?&\"6#^Z[CNNXR=MW2STMD>--76*^))K'CQU=>.2S:B7;5V9X;)\
MJSWMW#[/M>T[:G<]J\&18UD:='EIF;3R9,EE;ECJONXJJA51Y/Z2_5RO]*;=
MR]-])?H[]4IYKW!\OQ9^K'IGG.?_ /IKF/3UBS9X^_PC\#ZI]+2F*::P#;I7
M&M\==\J(35WV#75[M[0_=:UHNZ[OMJJMJOT+UKSK9)-6Y4OM'EM7C>LOC92<
MGLGO_P#V*][+M.T[IV=6O7K:W%UG[>%Z2G/FK;E2T+E1P?2:?ZN/7?\ ]-?7
MW@_4GHCZ4^O>9_4OSW(^IOJSZ]]9^G_4MGUKS/.7/4C>M*=VC;X'UCZ?X+B1
MP7K)VY.FD/'A5L,4E$L&(1XV_P 2['^Y[#/VV?NL&+VW&J8,6.U%CK54]-IJ
MV.UK