Exhibit 99.1
|
|
NEWS RELEASE
|
|
|
For Immediate Release
|
Contact:
|
Barbara Thompson
|
|
October 16, 2020
|
First Citizens BancShares
|
|
|
919.716.2716
|
||
FIRST CITIZENS BANCSHARES REPORTS EARNINGS FOR THIRD QUARTER 2020
RALEIGH, N.C. -- First Citizens BancShares Inc. (“BancShares”) (Nasdaq: FCNCA) reported strong earnings for the third quarter of 2020. Key results for
the quarter ended September 30, 2020 are presented below:
|
THIRD QUARTER RESULTS
|
||||||||||||||||||
|
Q3 2020
|
Q3 2019
|
Q3 2020
|
Q3 2019
|
Q3 2020
|
Q3 2019
|
Q3 2020
|
Q3 2019
|
Q3 2020
|
Q3 2019
|
|||||||||
|
Net income (in millions)
|
Net income per share
|
Net interest margin
|
Return on average assets
|
Return on average equity
|
||||||||||||||
|
$142.7
|
$124.8
|
$14.03
|
$11.27
|
3.06%
|
3.77%
|
1.18%
|
1.32%
|
14.93%
|
13.83%
|
|||||||||
|
YEAR-TO-DATE (“YTD”) RESULTS
|
||||||||||||||||||
|
2020
|
2019
|
2020
|
2019
|
2020
|
2019
|
2020
|
2019
|
2020
|
2019
|
|||||||||
|
Net income (in millions)
|
Net income per share
|
Net interest margin
|
Return on average assets
|
Return on average equity
|
||||||||||||||
|
$353.6
|
$355.5
|
$33.96
|
$31.50
|
3.23%
|
3.80%
|
1.05%
|
1.29%
|
12.59%
|
13.41%
|
|||||||||
|
THIRD QUARTER HIGHLIGHTS
|
||||||||||||||||||
|
Net income
|
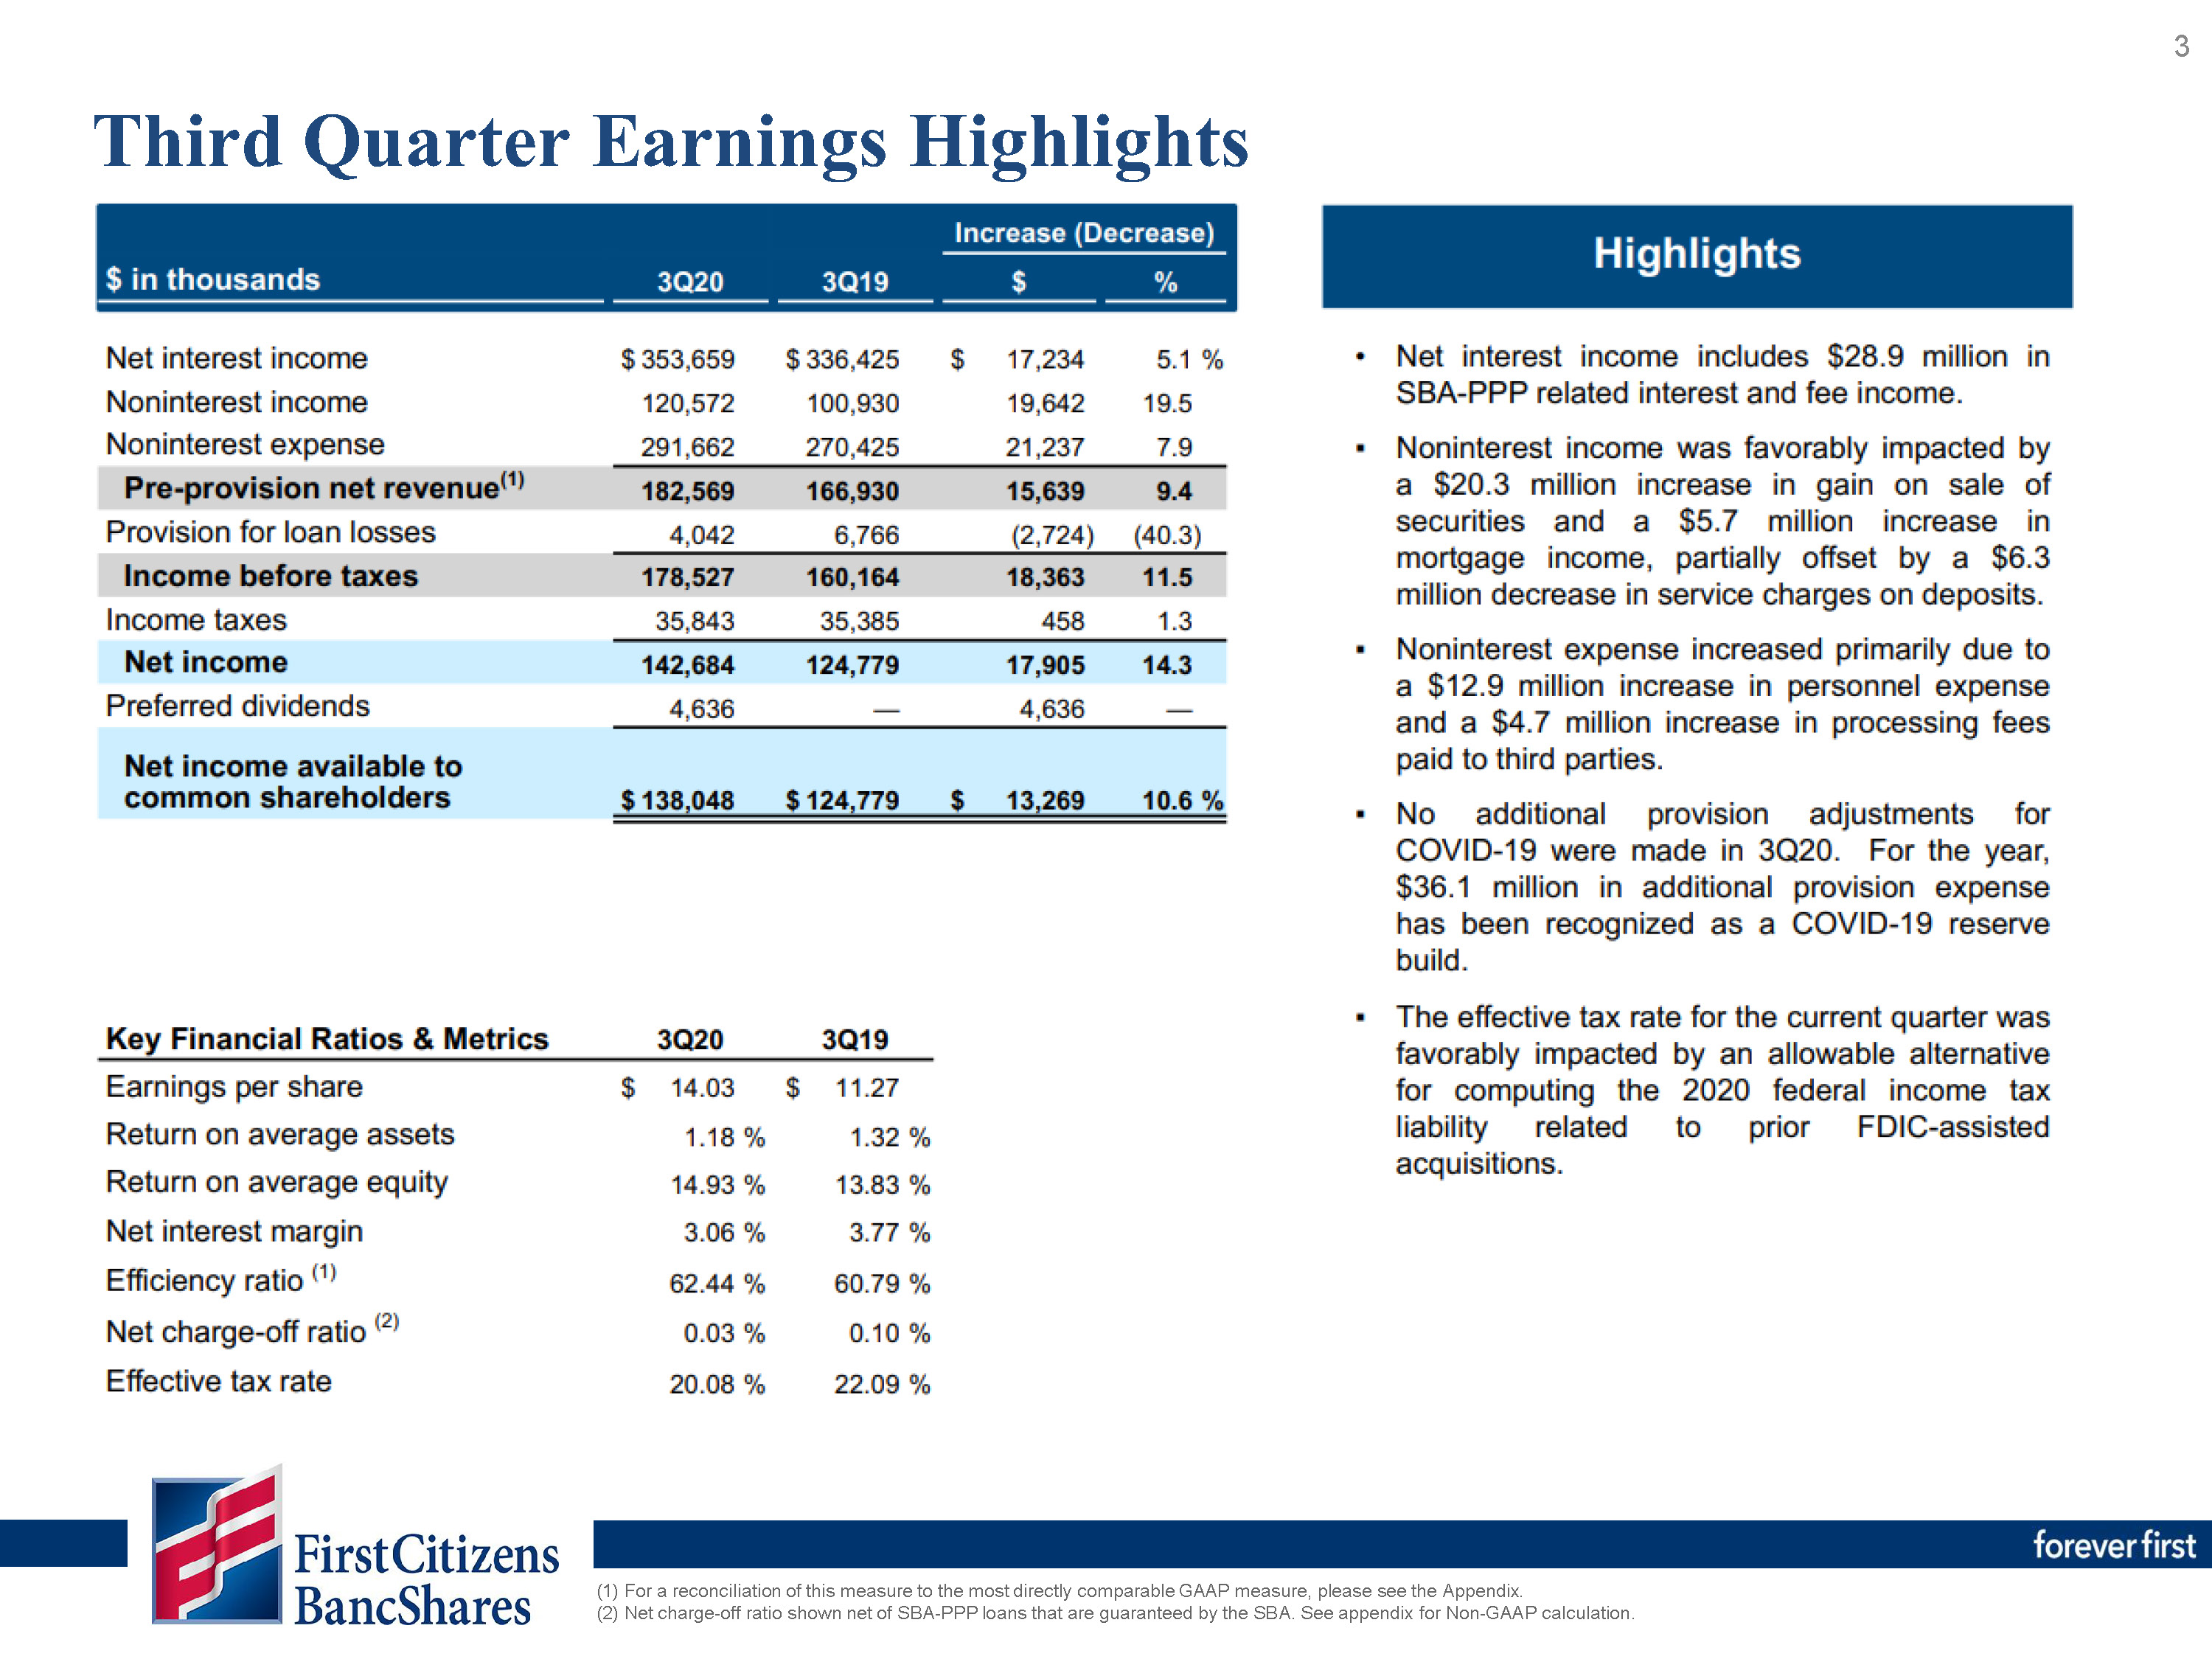
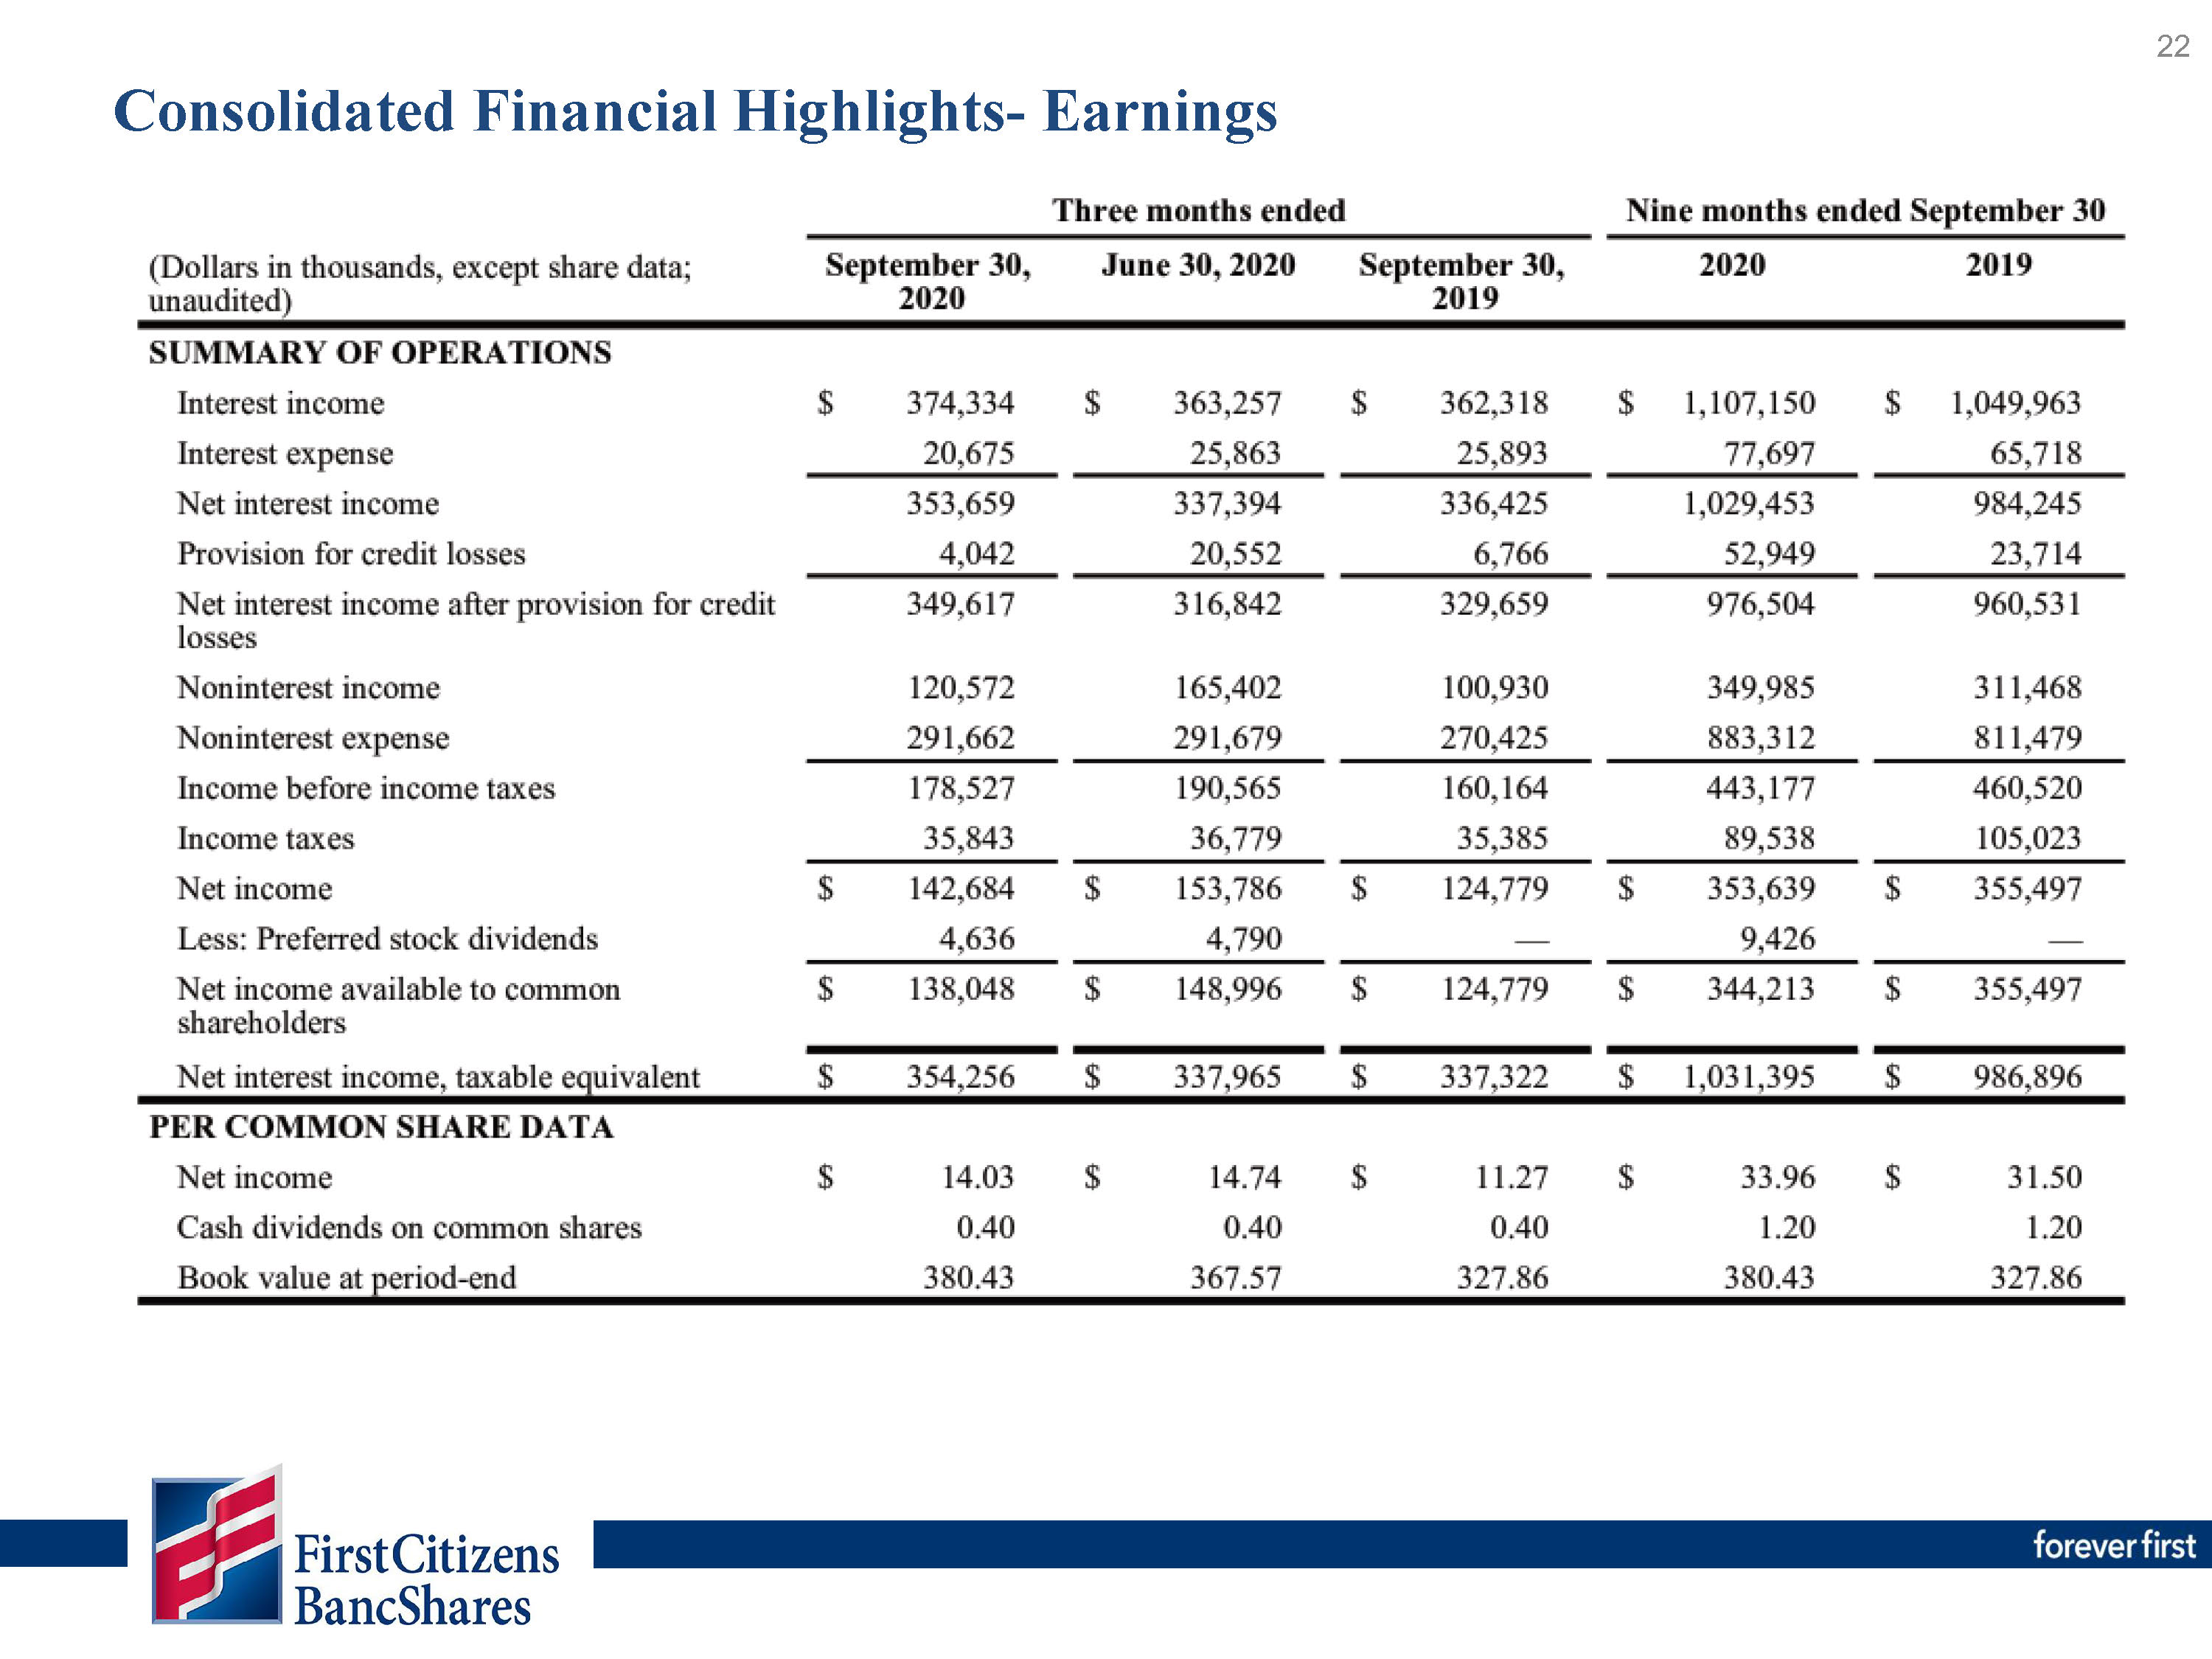
Net income for the third quarter of 2020 totaled $142.7 million, an increase of $17.9 million, or 14.3%, compared to the same
quarter in 2019. Net income per common share increased to $14.03 for the third quarter of 2020, from $11.27 per share during the same quarter in 2019.
|
|||||||||||||||||
|
Return on average assets and equity
|
Return on average assets for the third quarter of 2020 was 1.18%, down from 1.32% during the same quarter in 2019. Return on
average equity for the third quarter of 2020 was 14.93%, up from 13.83% during the same period of 2019.
|
|||||||||||||||||
|
Net interest income and net interest margin
|
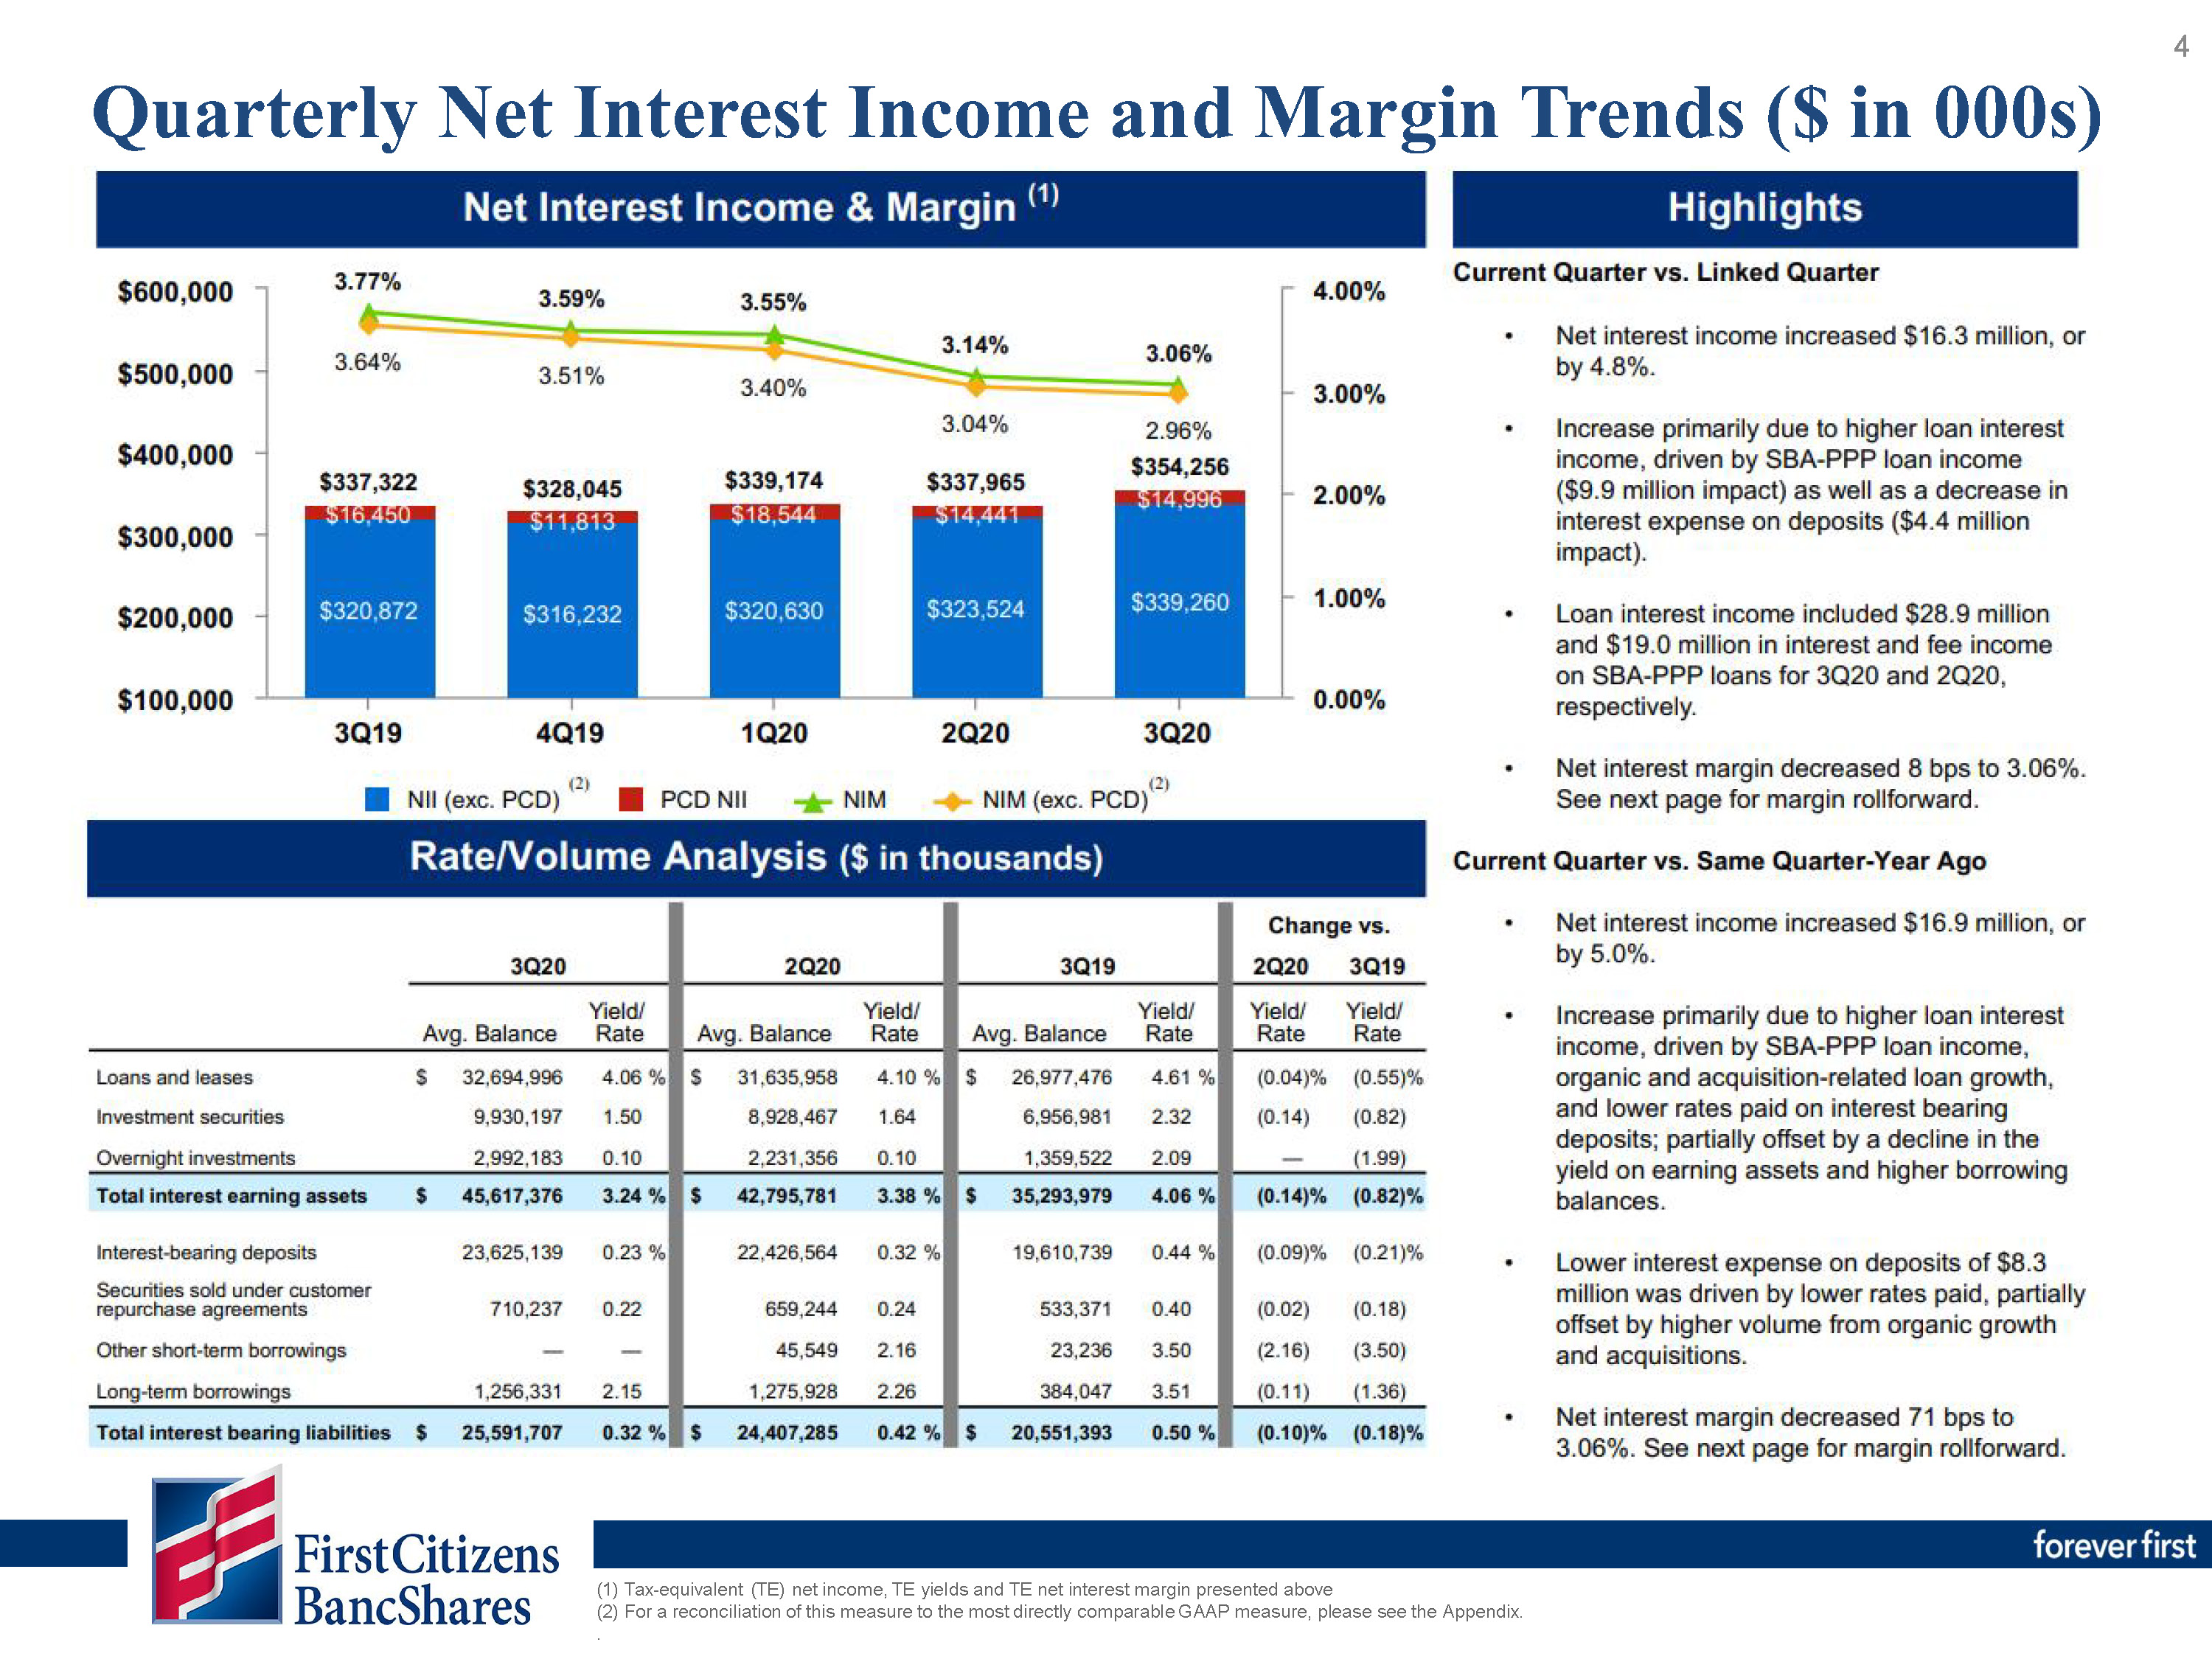
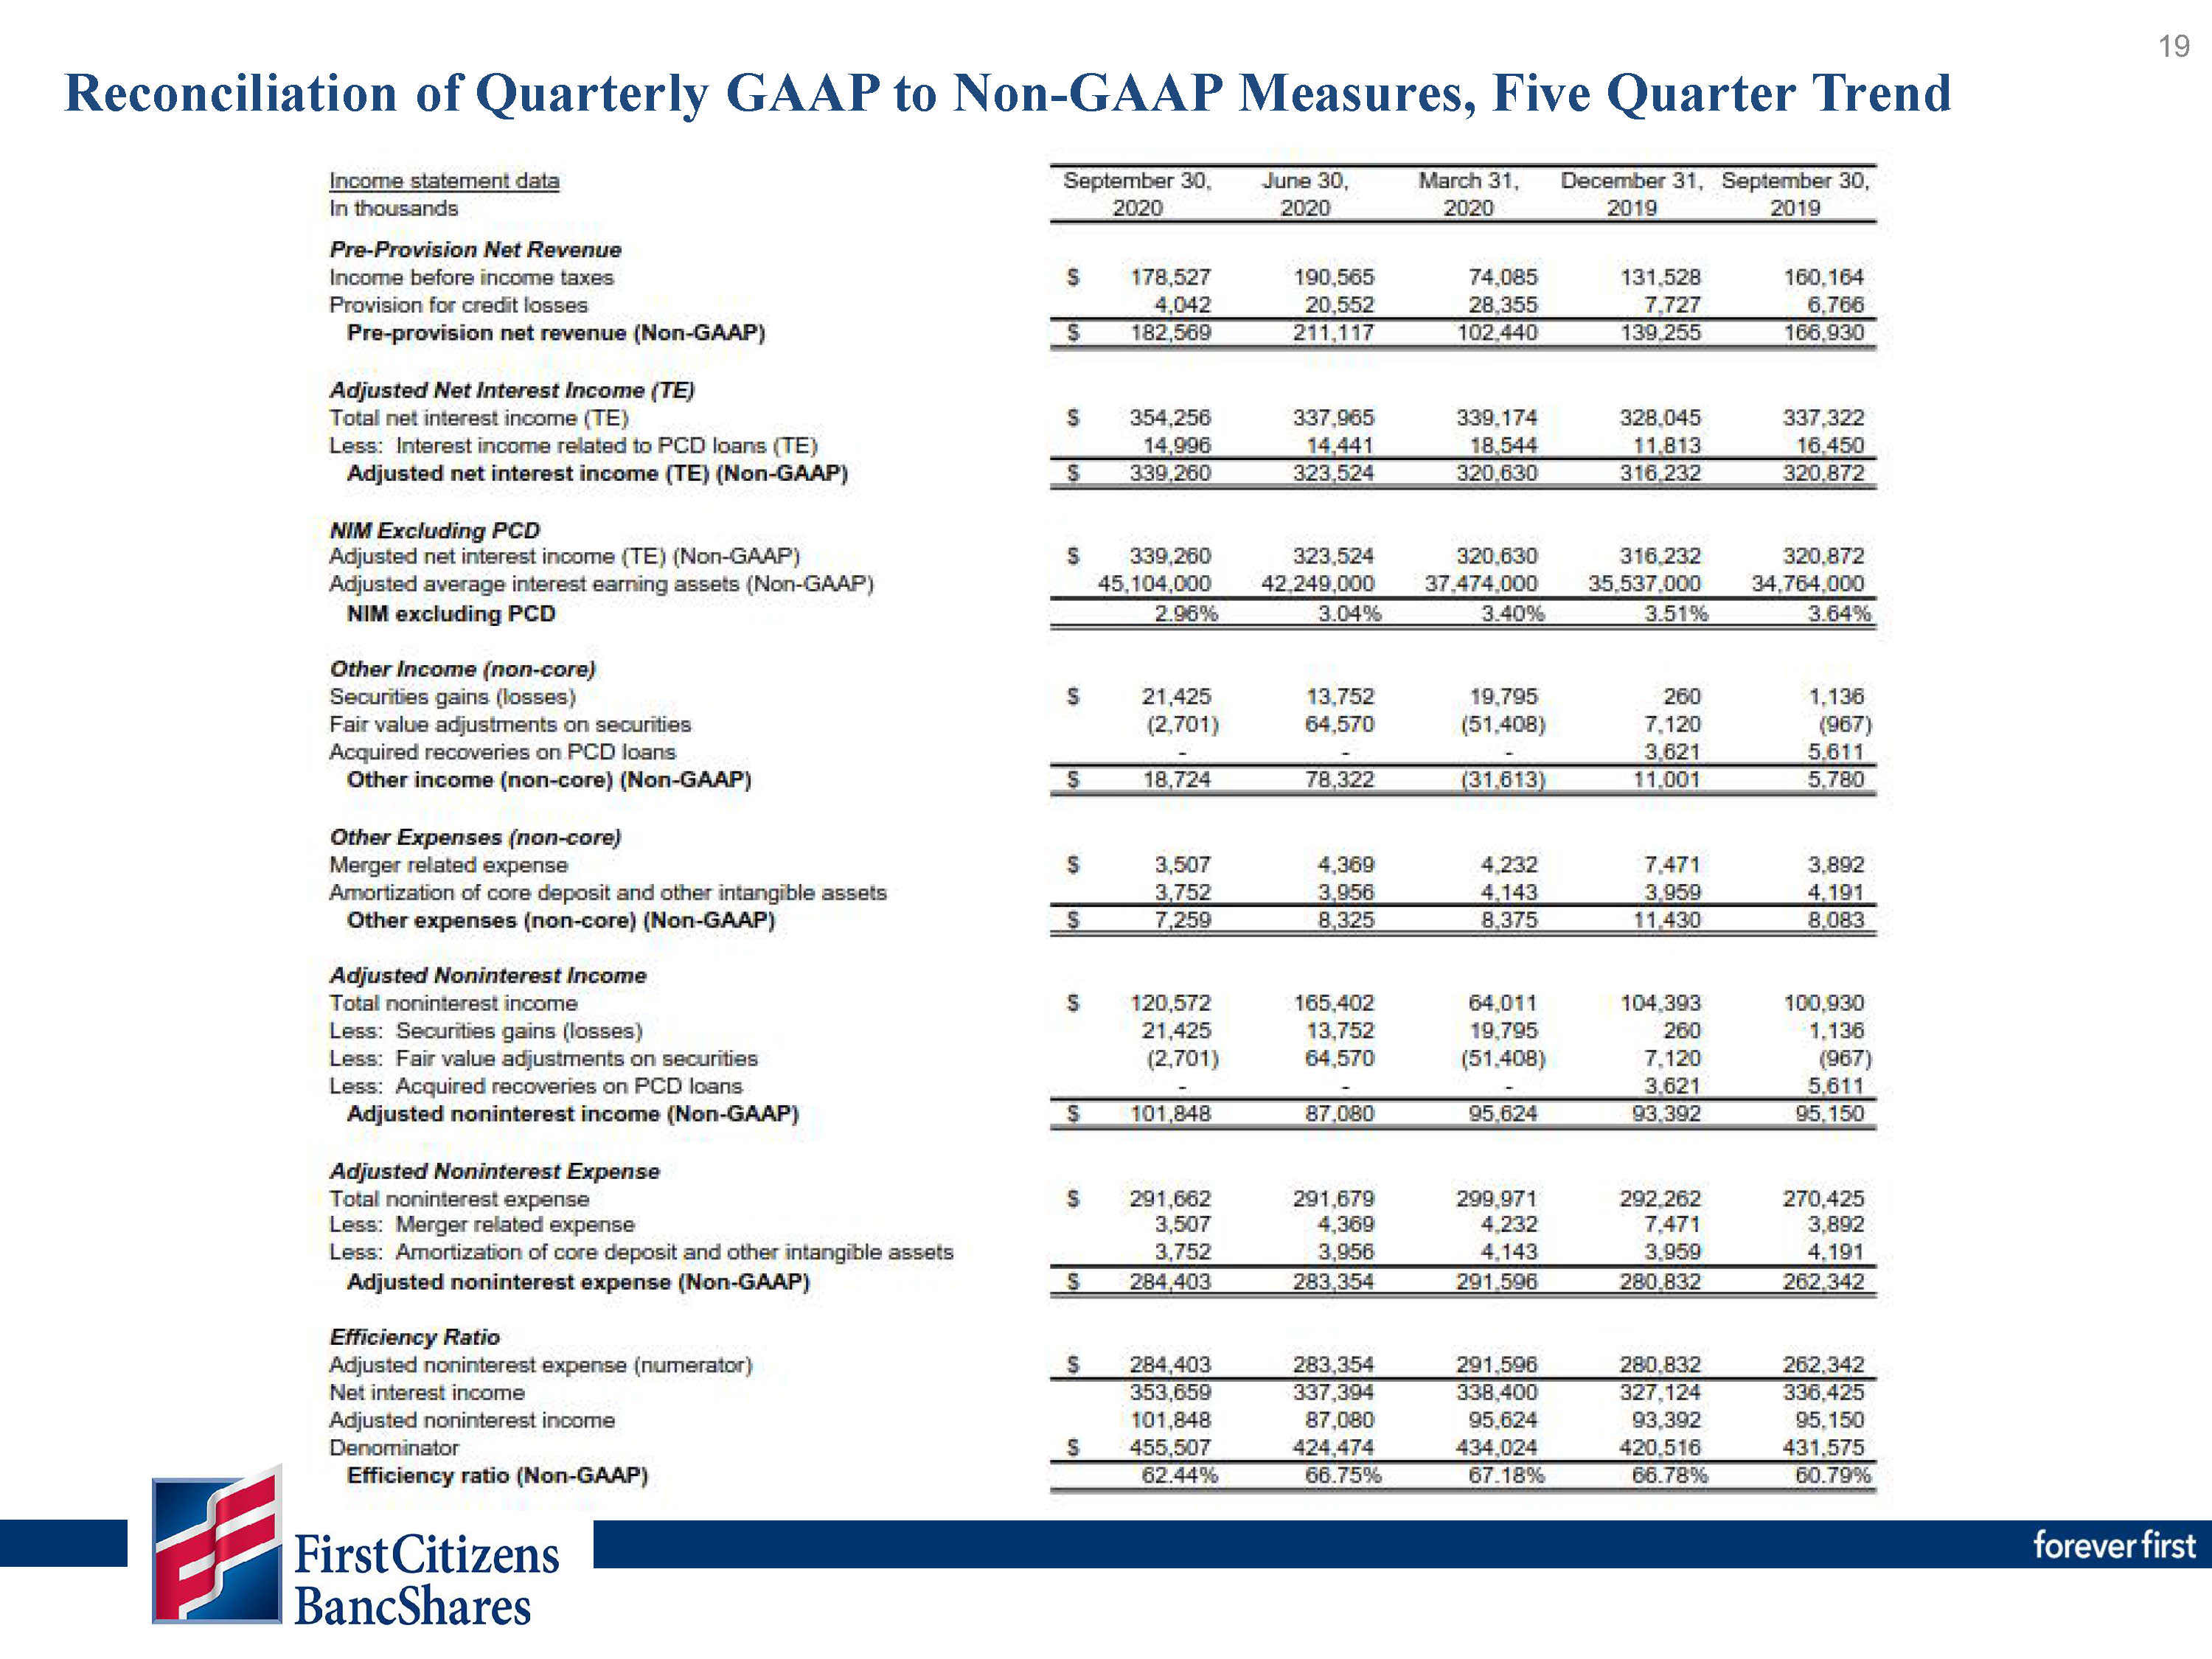
BancShares reported total net interest income of $353.7 million for the third quarter of 2020, an increase of $17.2 million, or
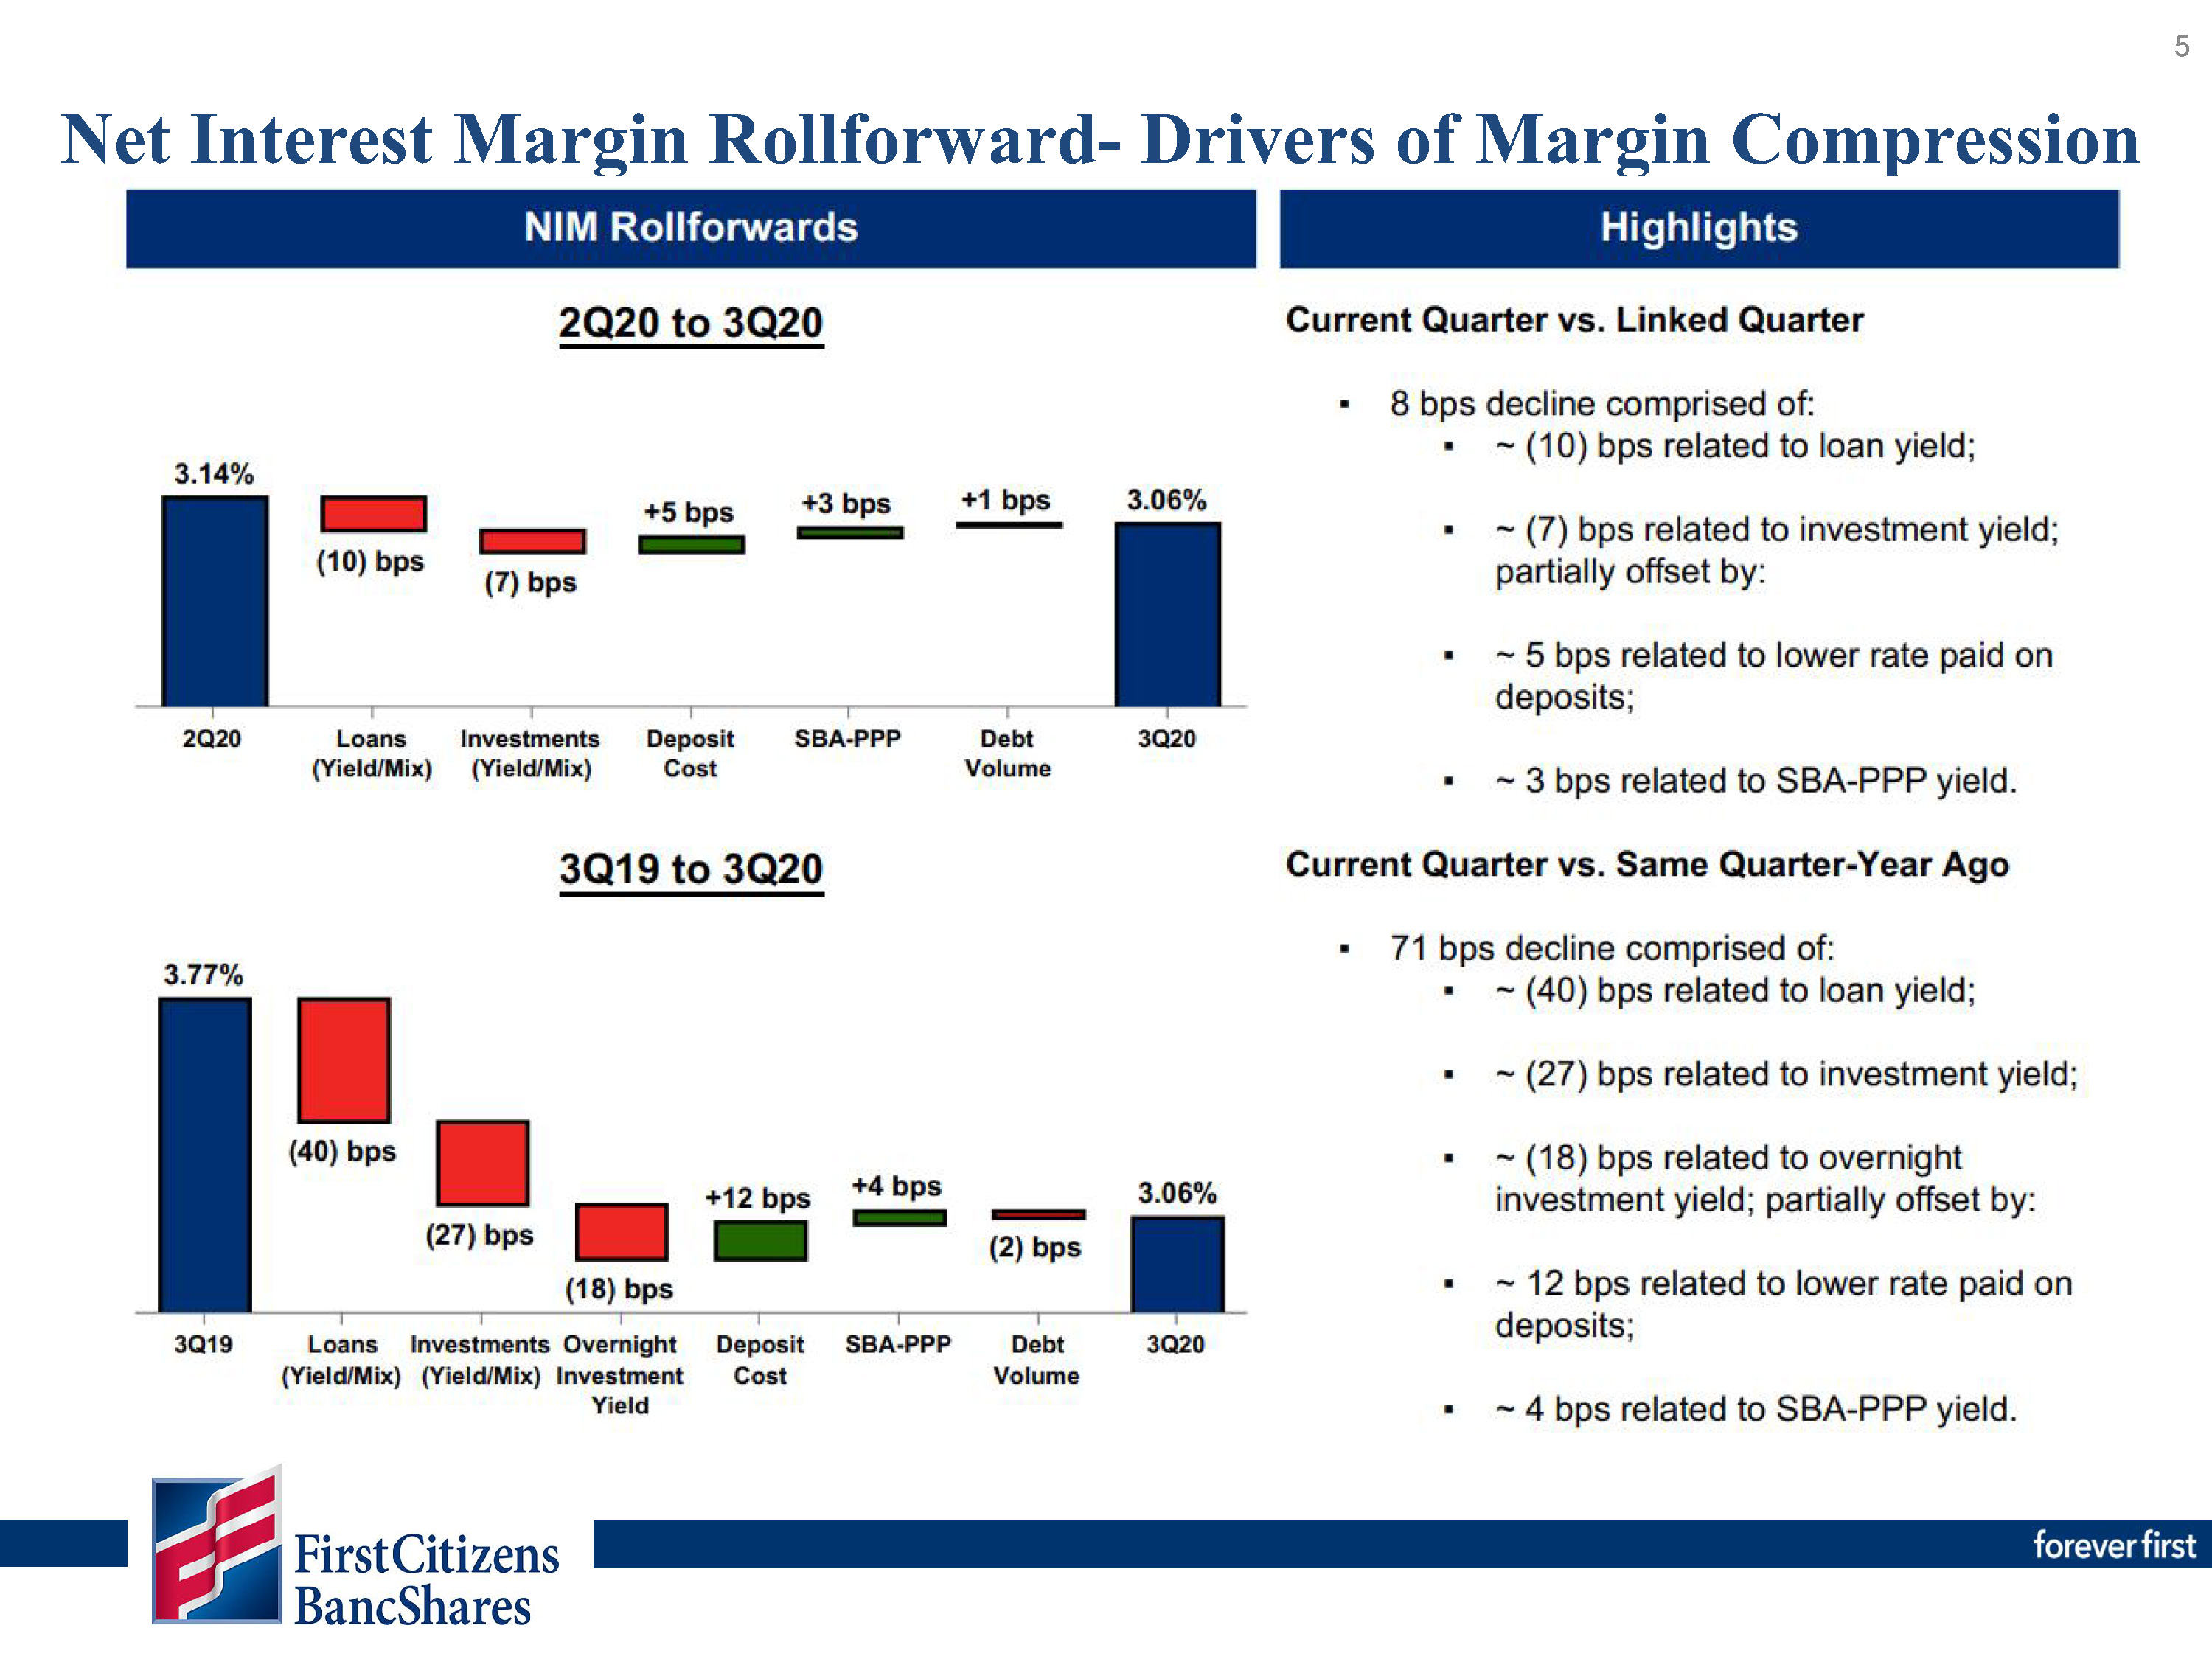
5.1%, compared to the same quarter in 2019. The taxable-equivalent net interest margin (“NIM”) was 3.06% for the third quarter of 2020, down 71 basis points from 3.77% during the same quarter in 2019 and down 8 basis points from 3.14%
during the second quarter of 2020.
|
|||||||||||||||||
|
Allowance for credit losses
|
The allowance for credit losses (“ACL”) was $223.9 million at September 30, 2020, compared to $225.1 million at December 31,
2019. The change relates primarily to a $37.9 million reduction in the ACL as a result of adopting the Current Expected Credit Loss model (“CECL”), partially offset by a reserve build of $36.1 million due to an increase in potential loan
losses related to the impact of COVID-19.
|
|||||||||||||||||
|
Operating performance
|
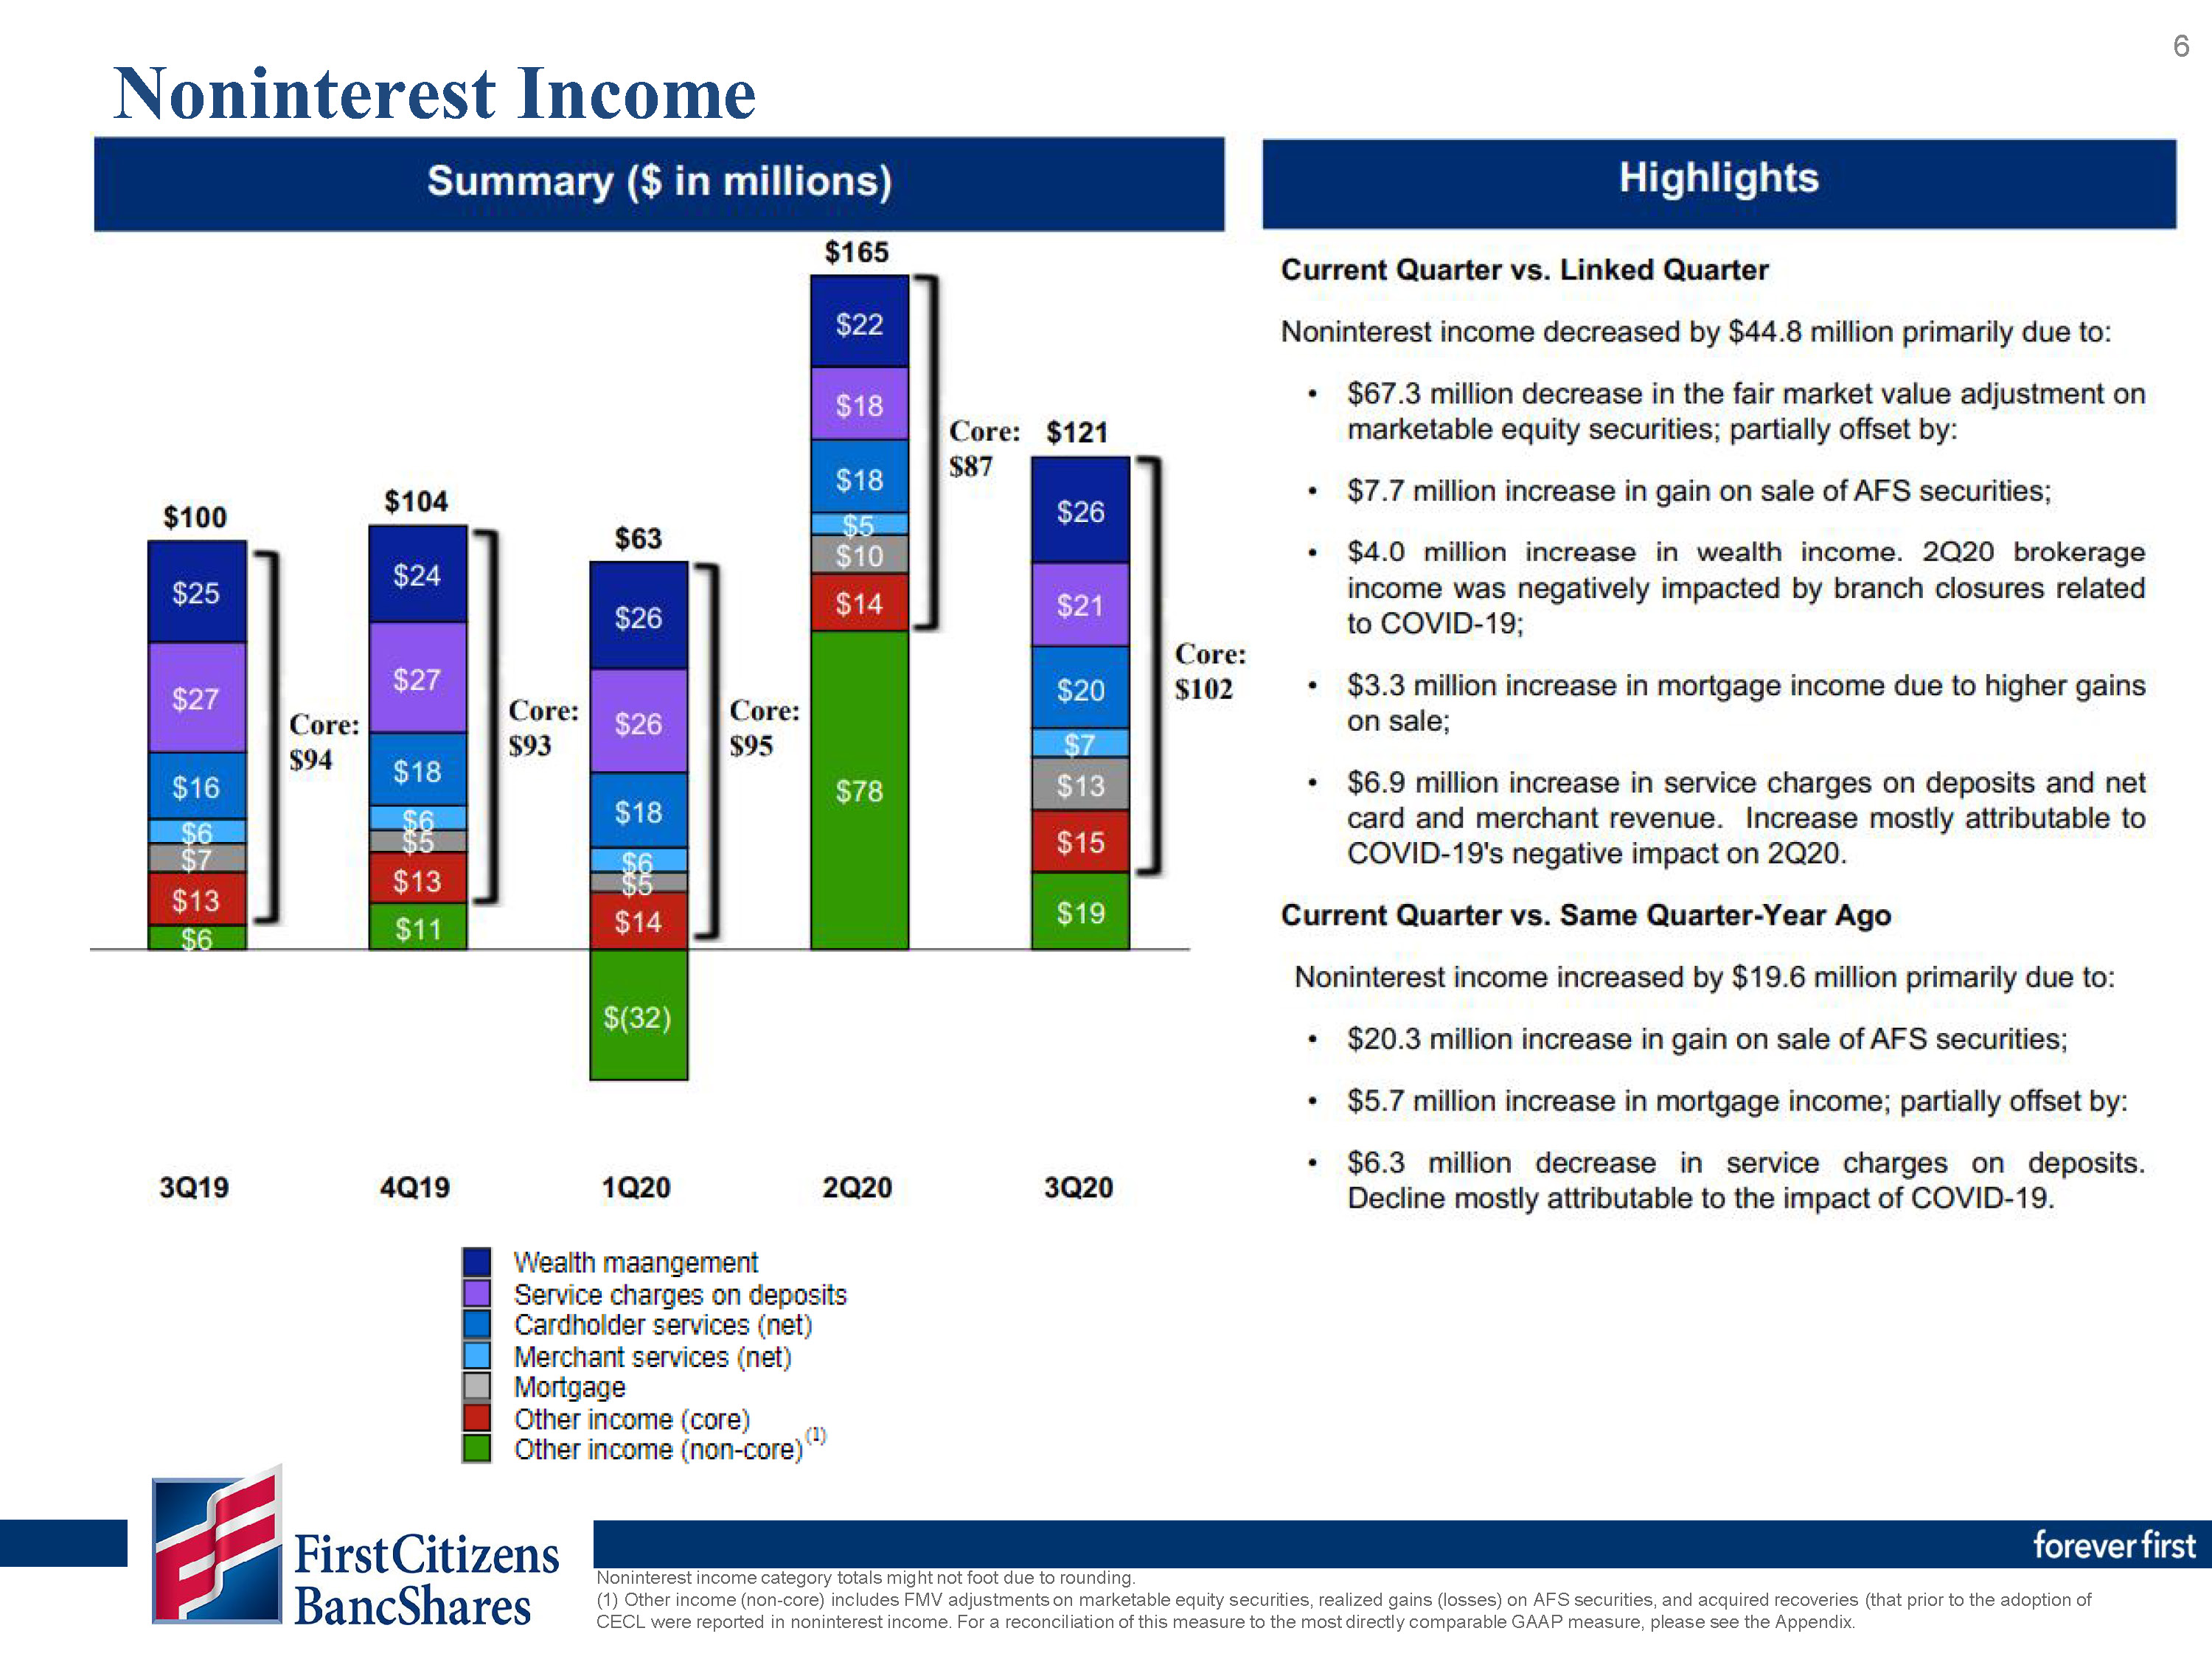
Noninterest income totaled $120.6 million for the third quarter of 2020, an increase of $19.6 million, or 19.5%, compared to the
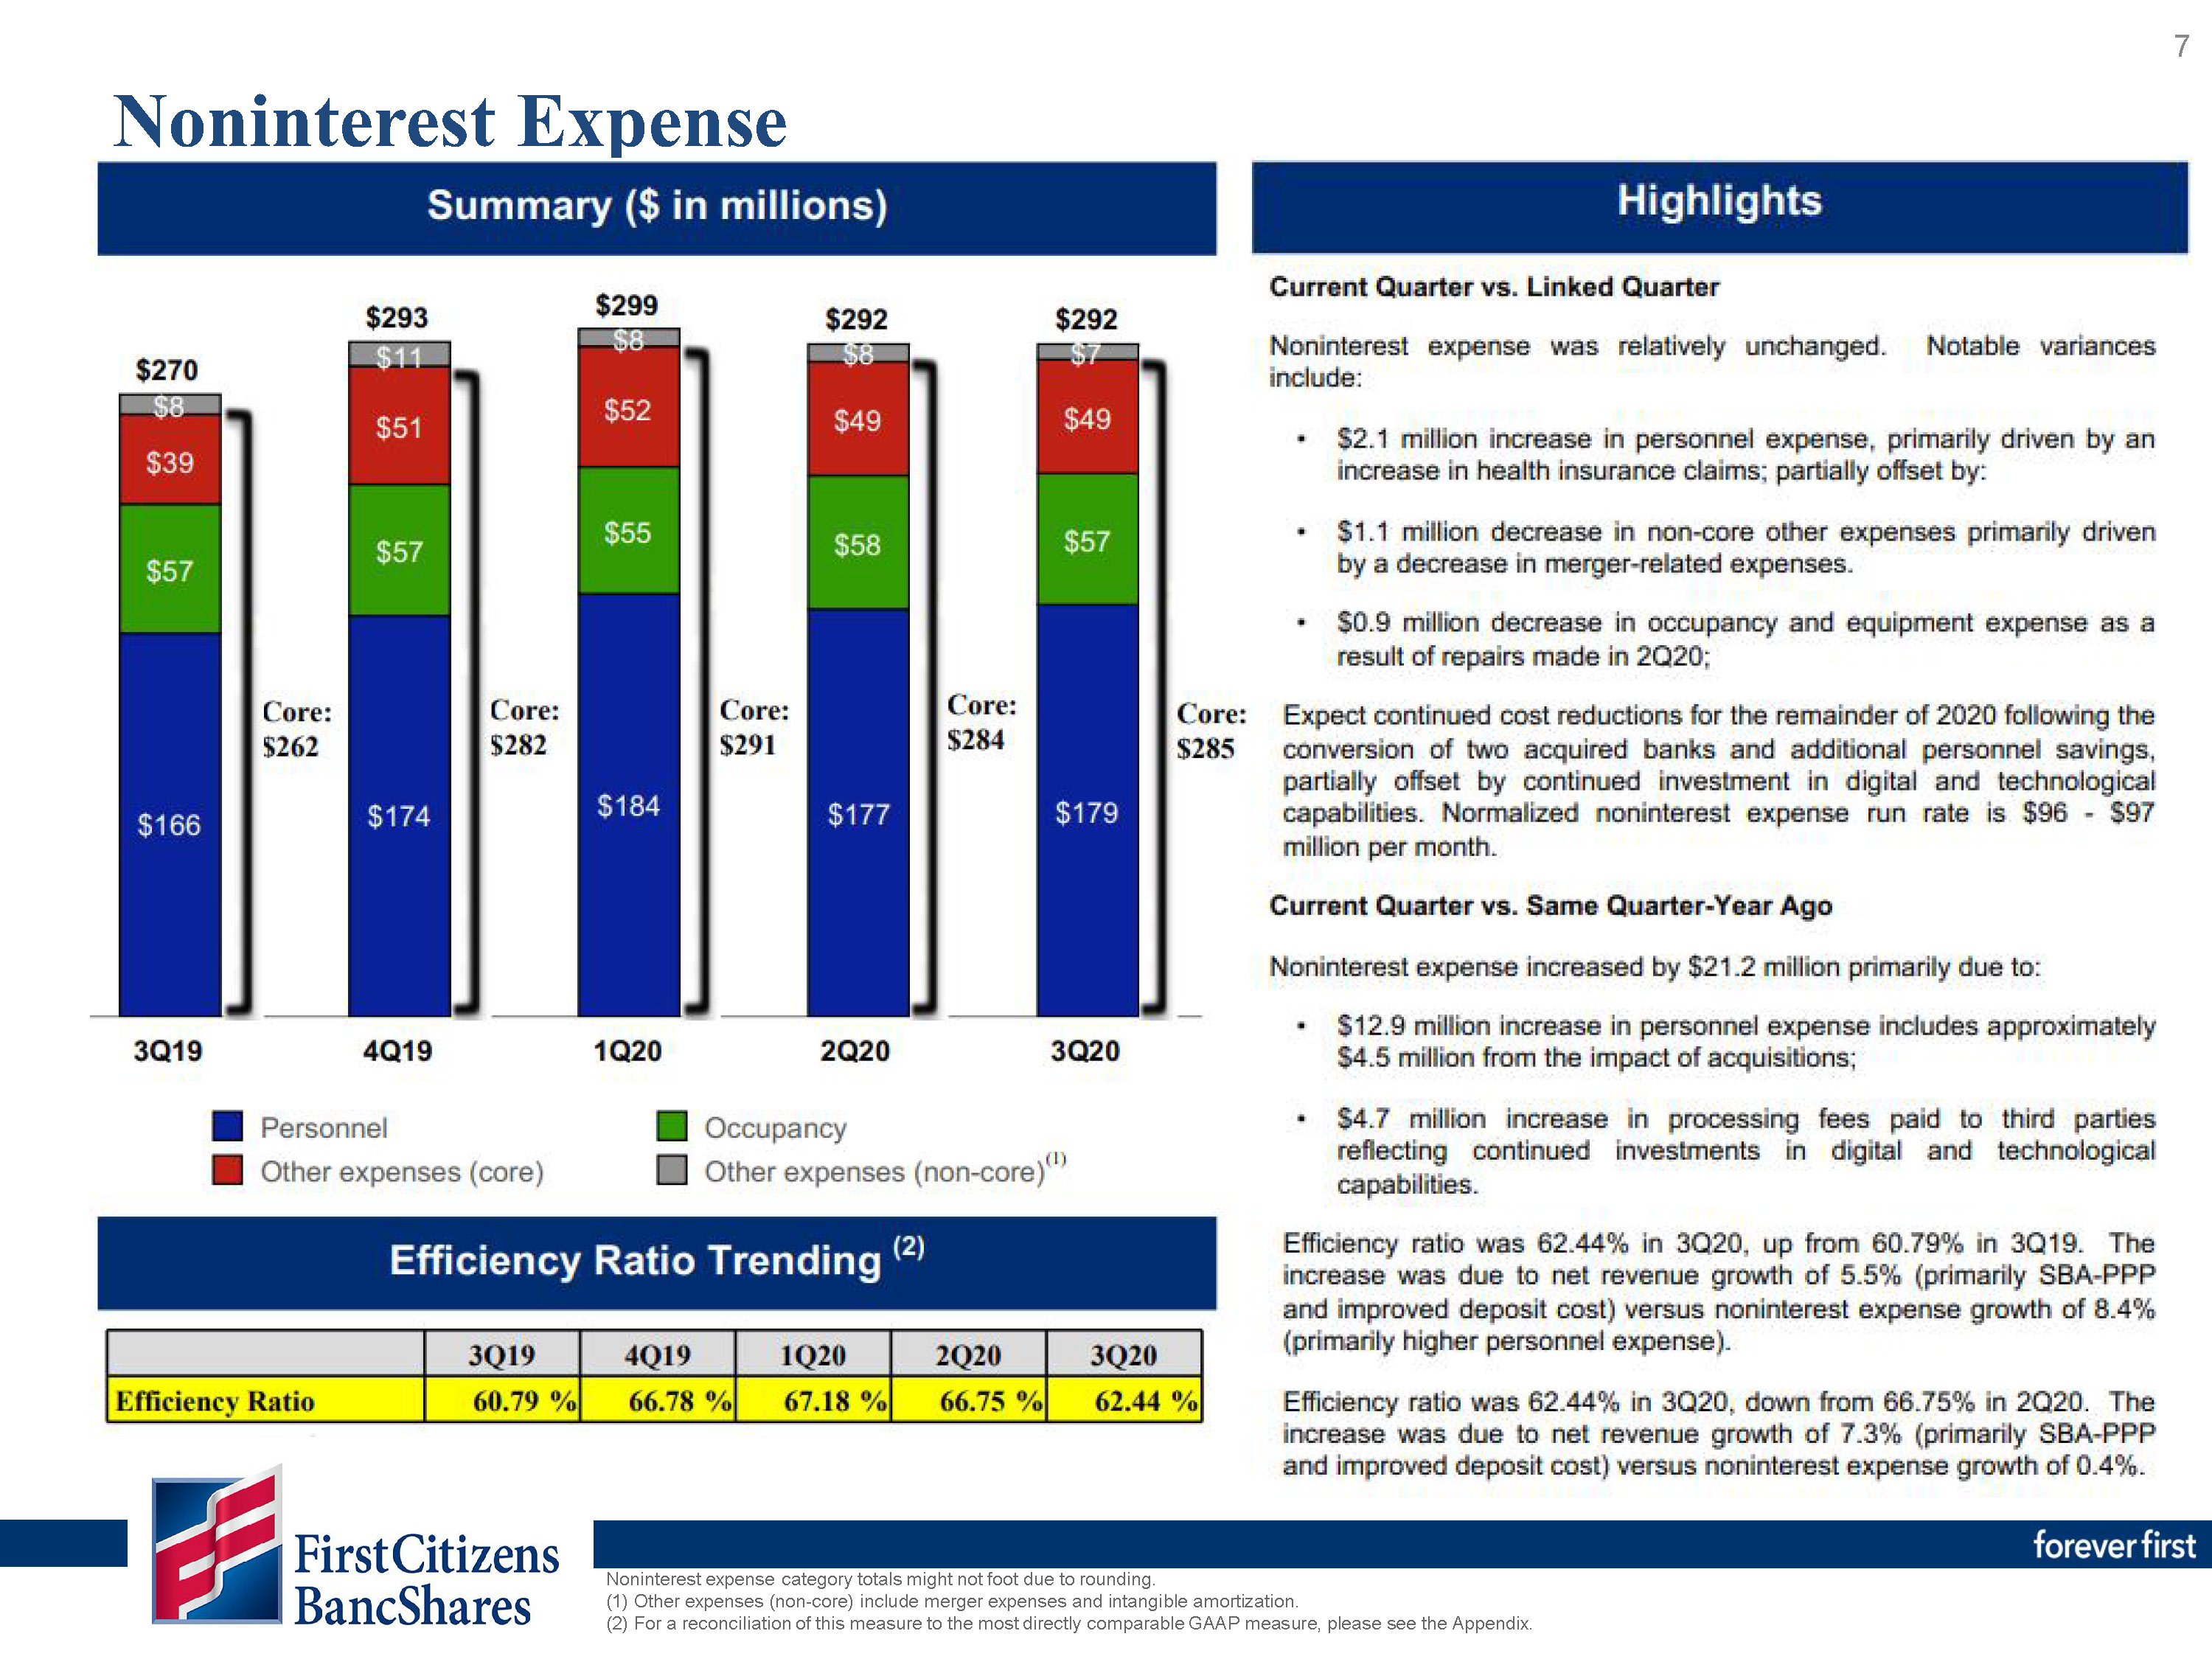
same quarter of 2019. Noninterest expense was $291.7 million for the third quarter of 2020, an increase of $21.3 million, or 7.9%, compared to the same quarter of 2019.
|
|||||||||||||||||
|
Loans and credit quality
|
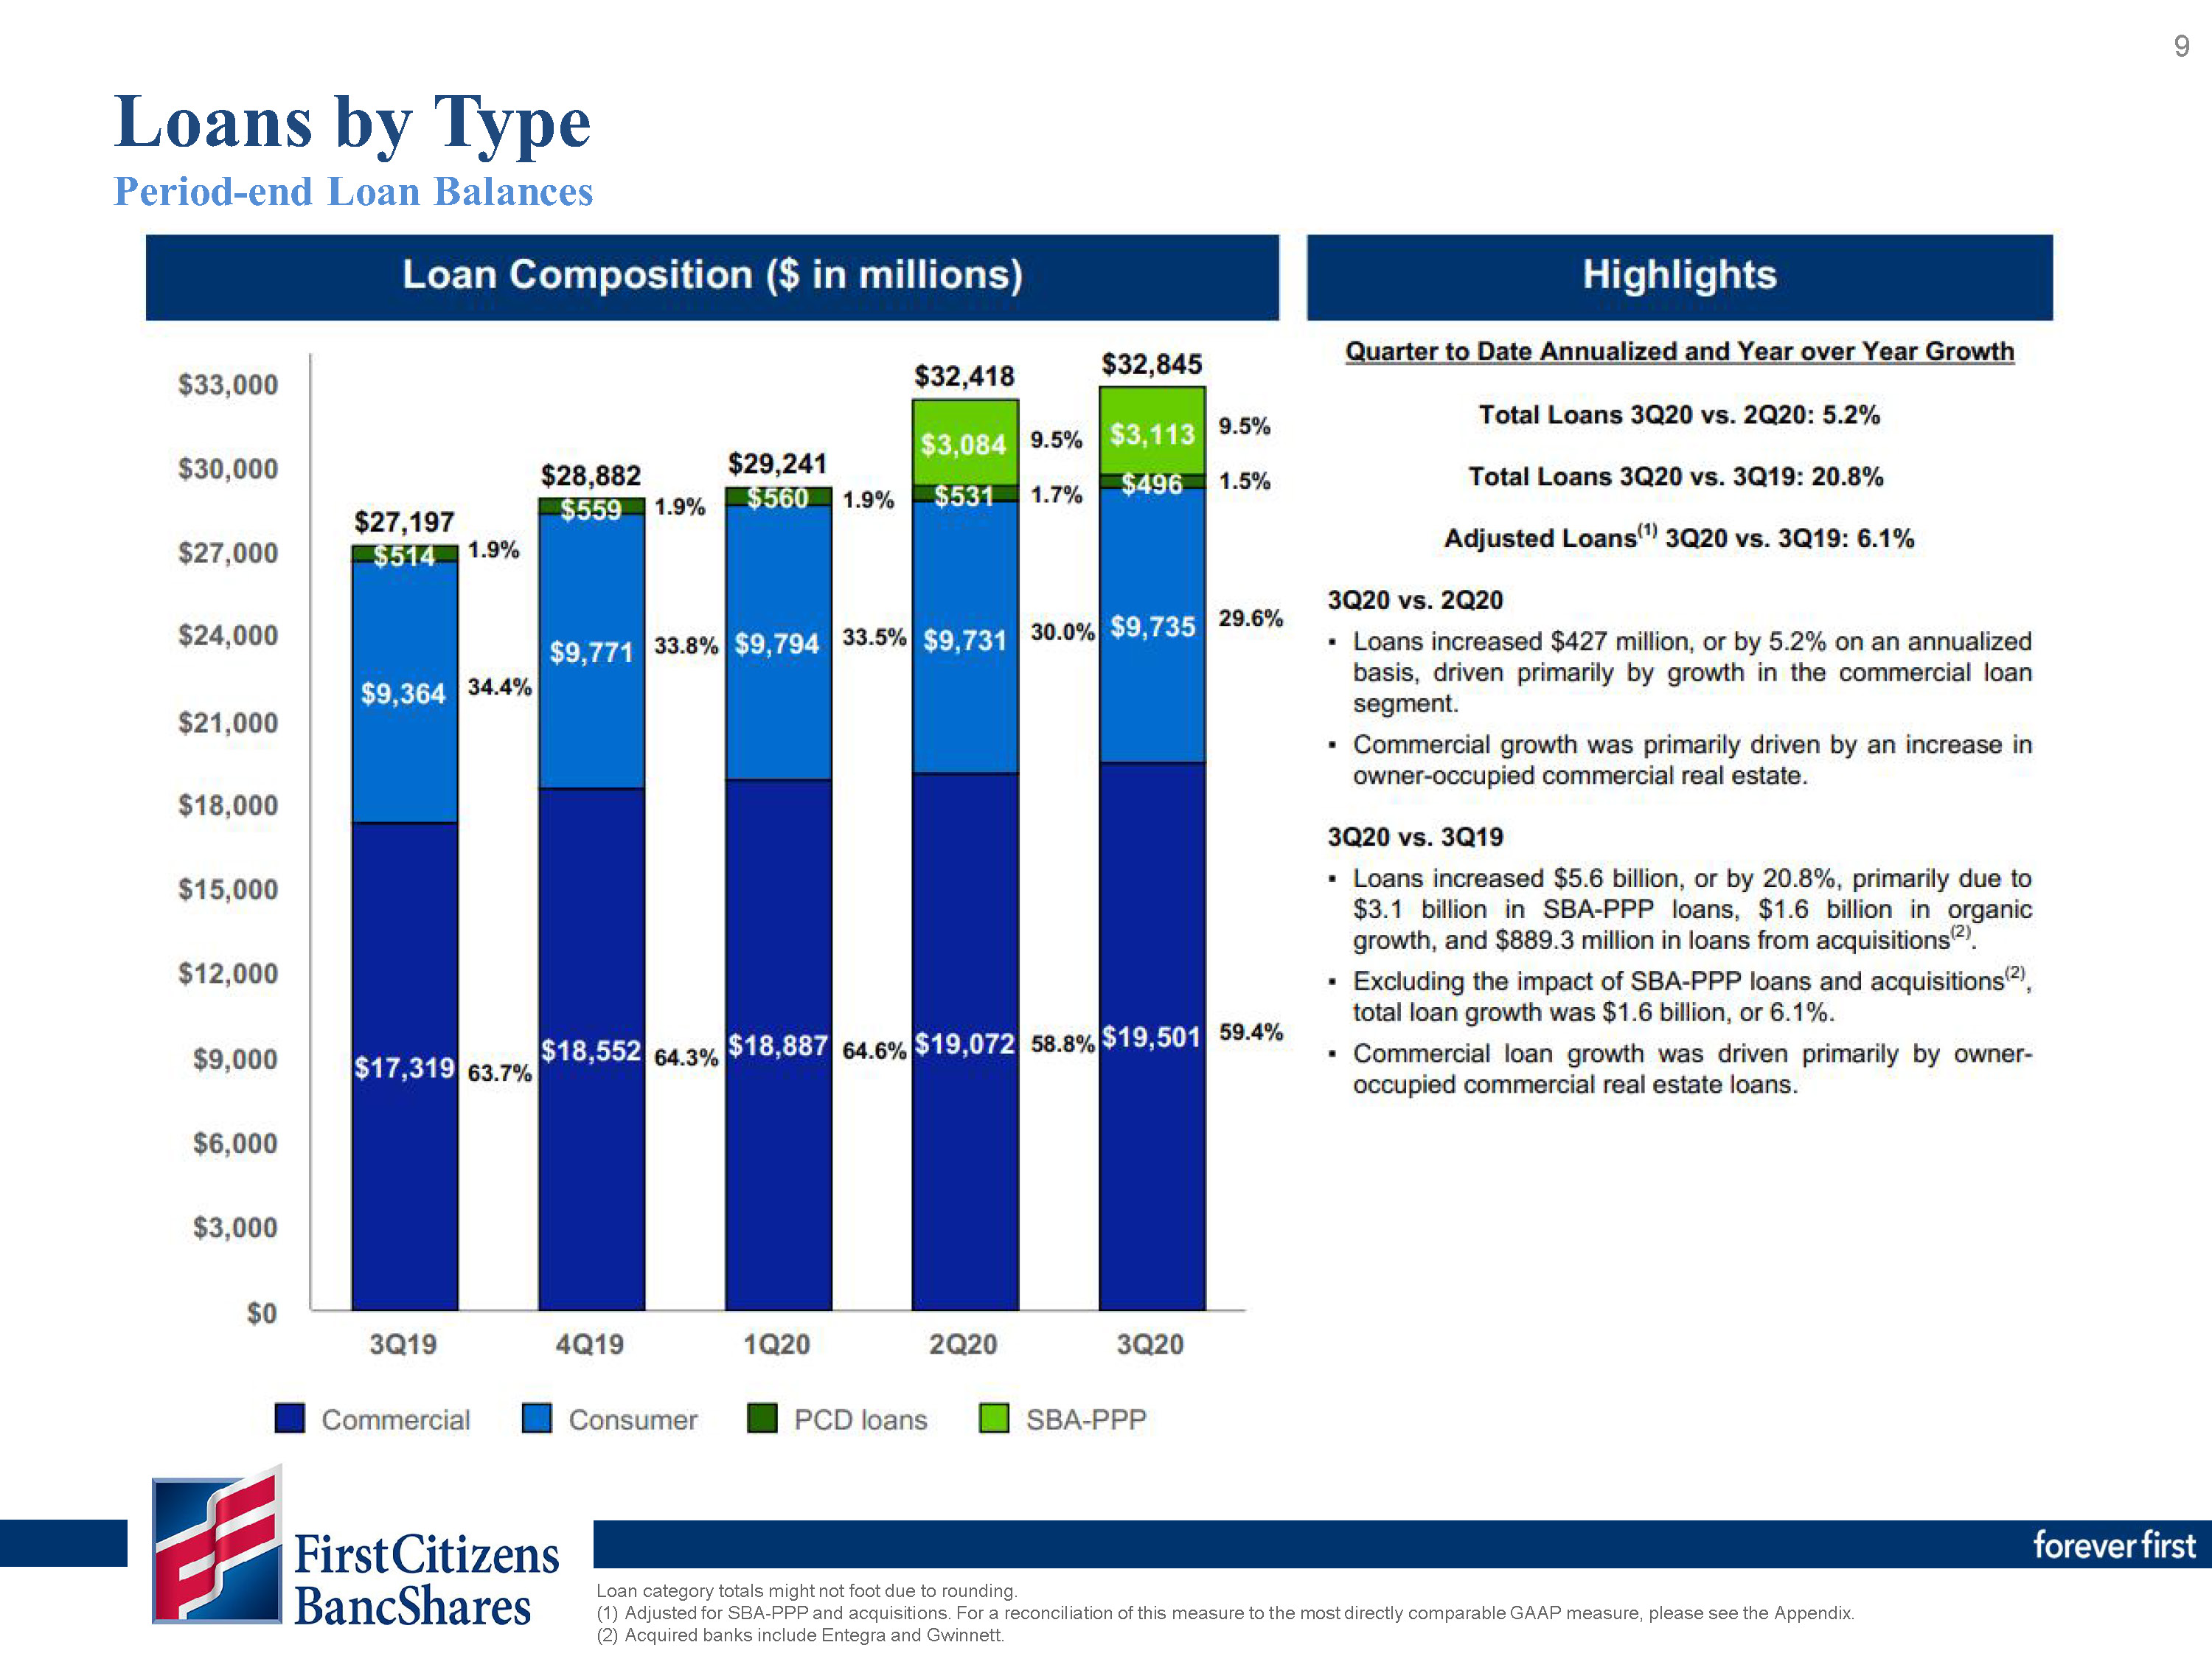
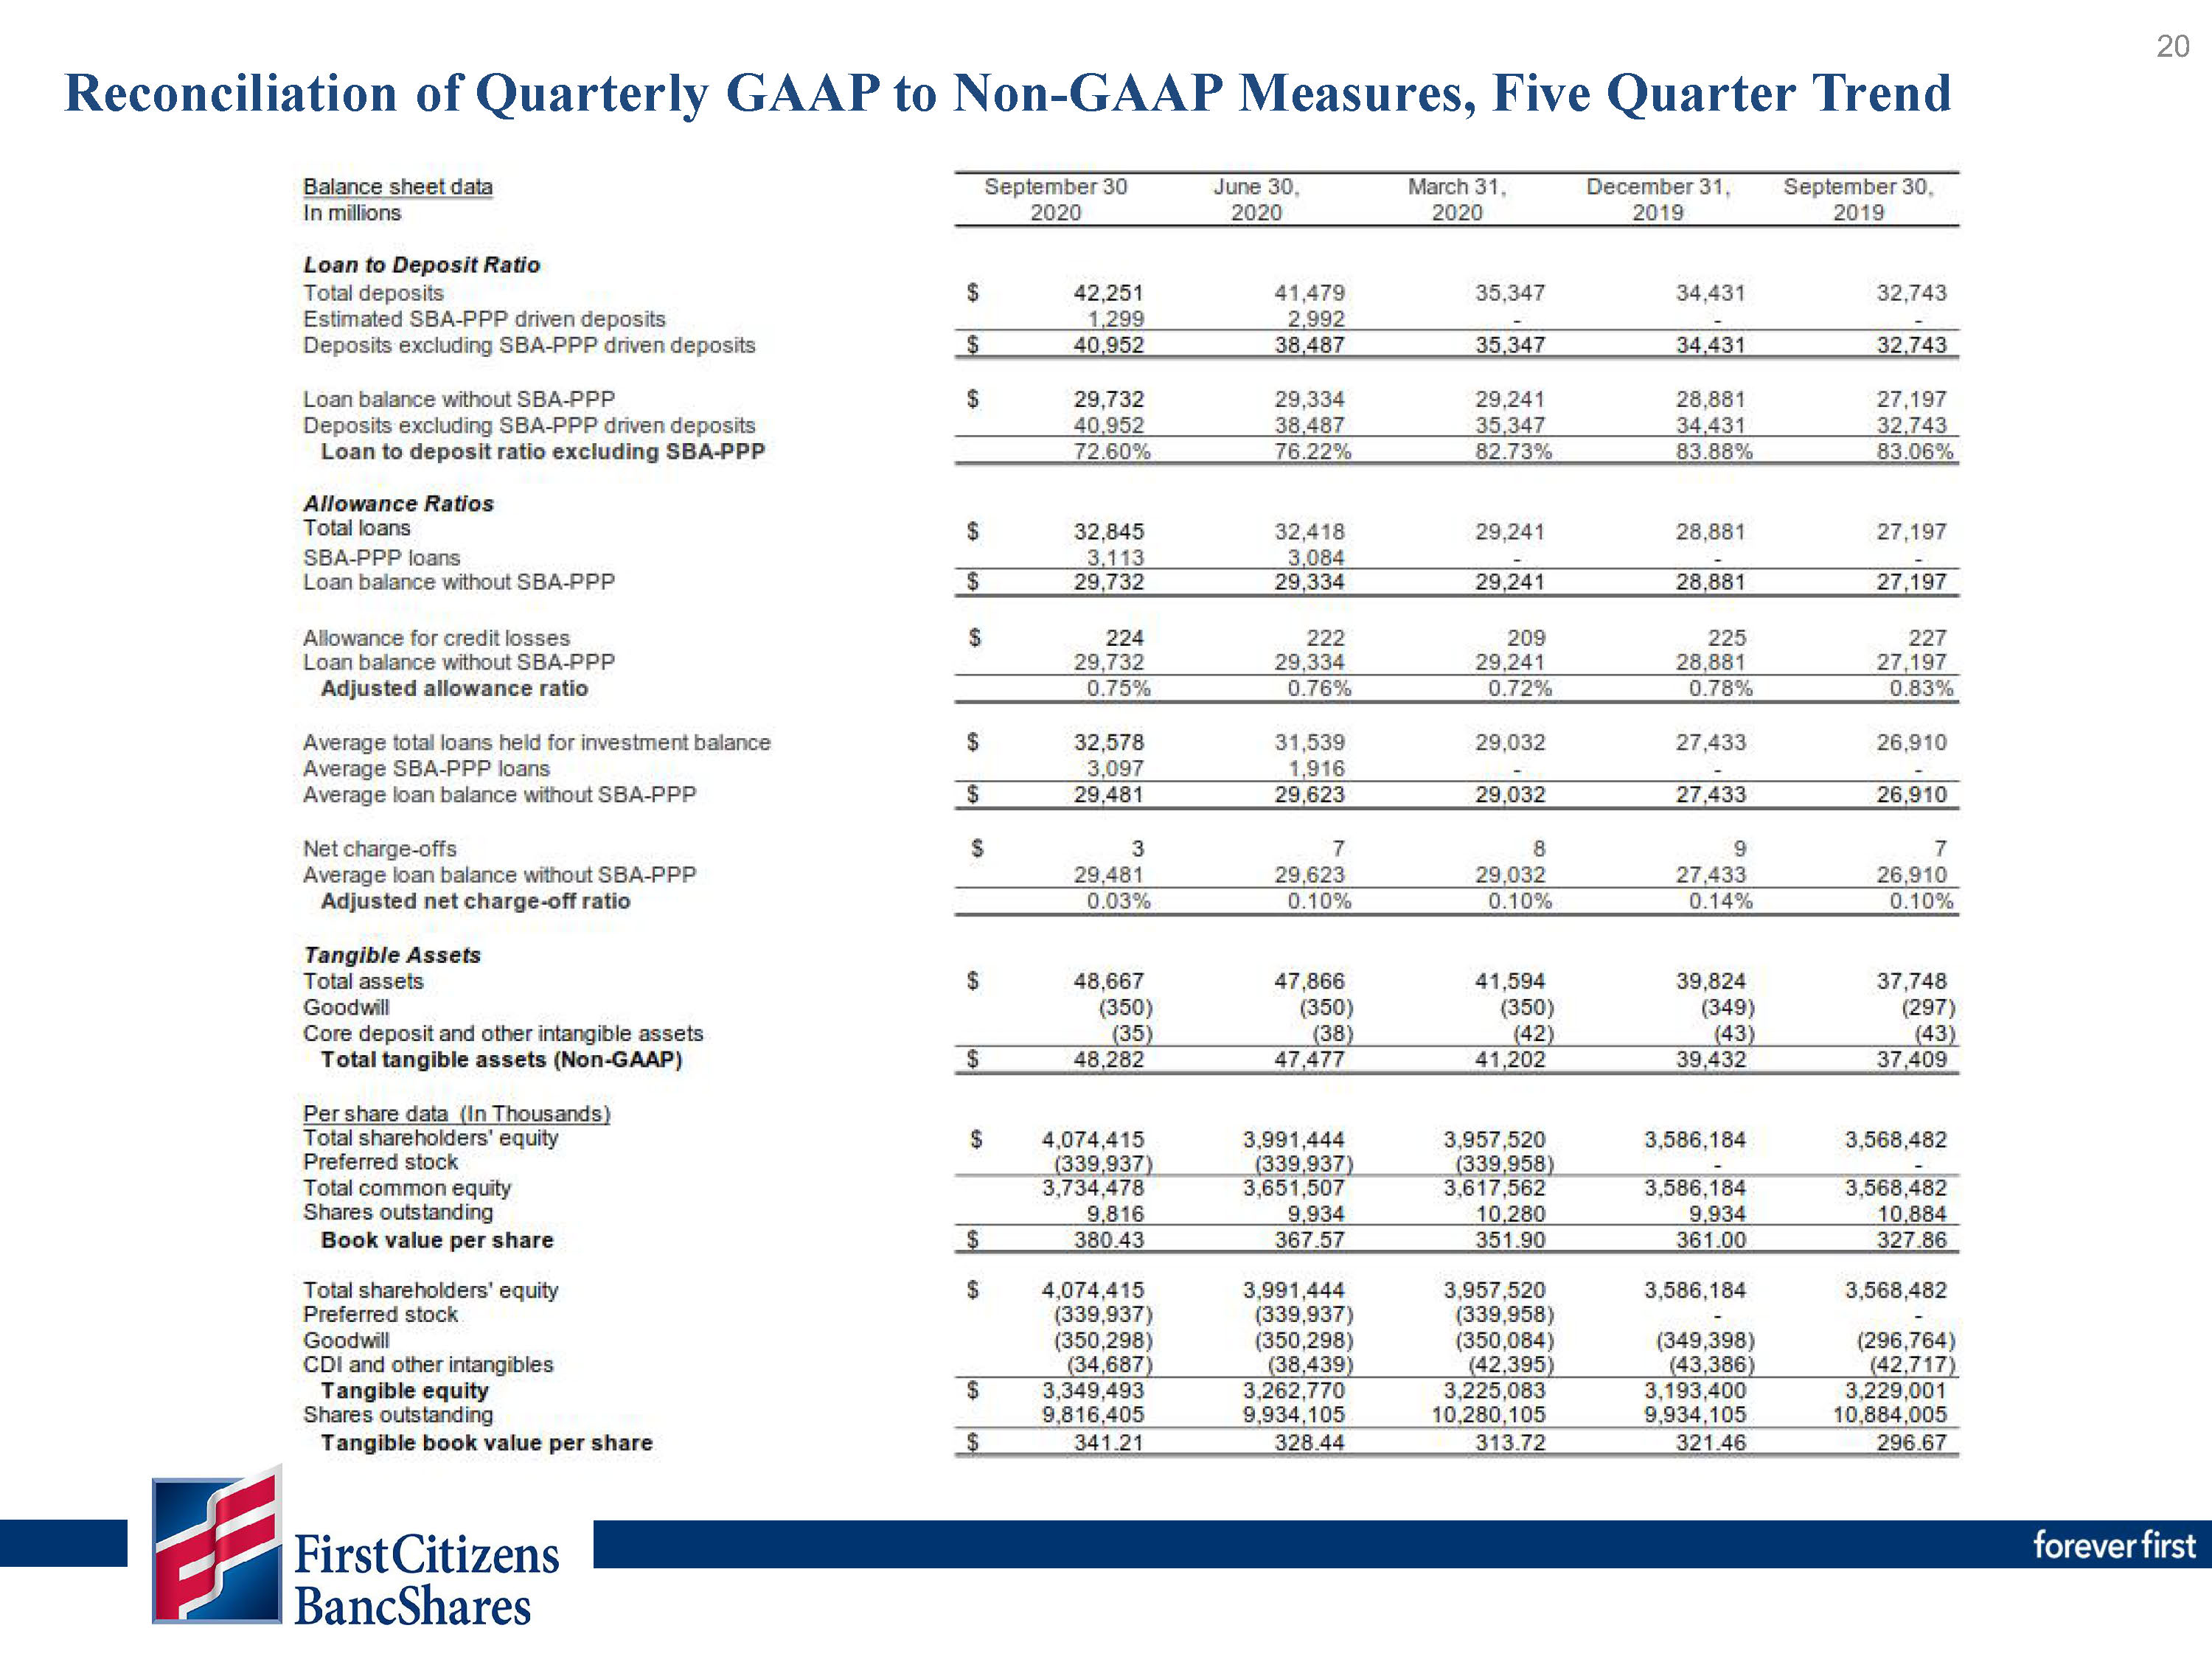
Total loans grew to $32.85 billion, an increase of $3.96 billion, or by 18.3% on an annualized basis, since December 31, 2019.
Excluding $3.11 billion of loans originated under the Small Business Administration Paycheck Protection Program (“SBA-PPP”), total loans increased $851.0 million since December 31, 2019, or by 3.9% on an annualized basis. The net charge-off
ratio was 0.03% and 0.07% for the three and nine months ended September 30, 2020, respectively, compared to 0.10% for both the three and nine months ended September 30, 2019.
|
|||||||||||||||||
|
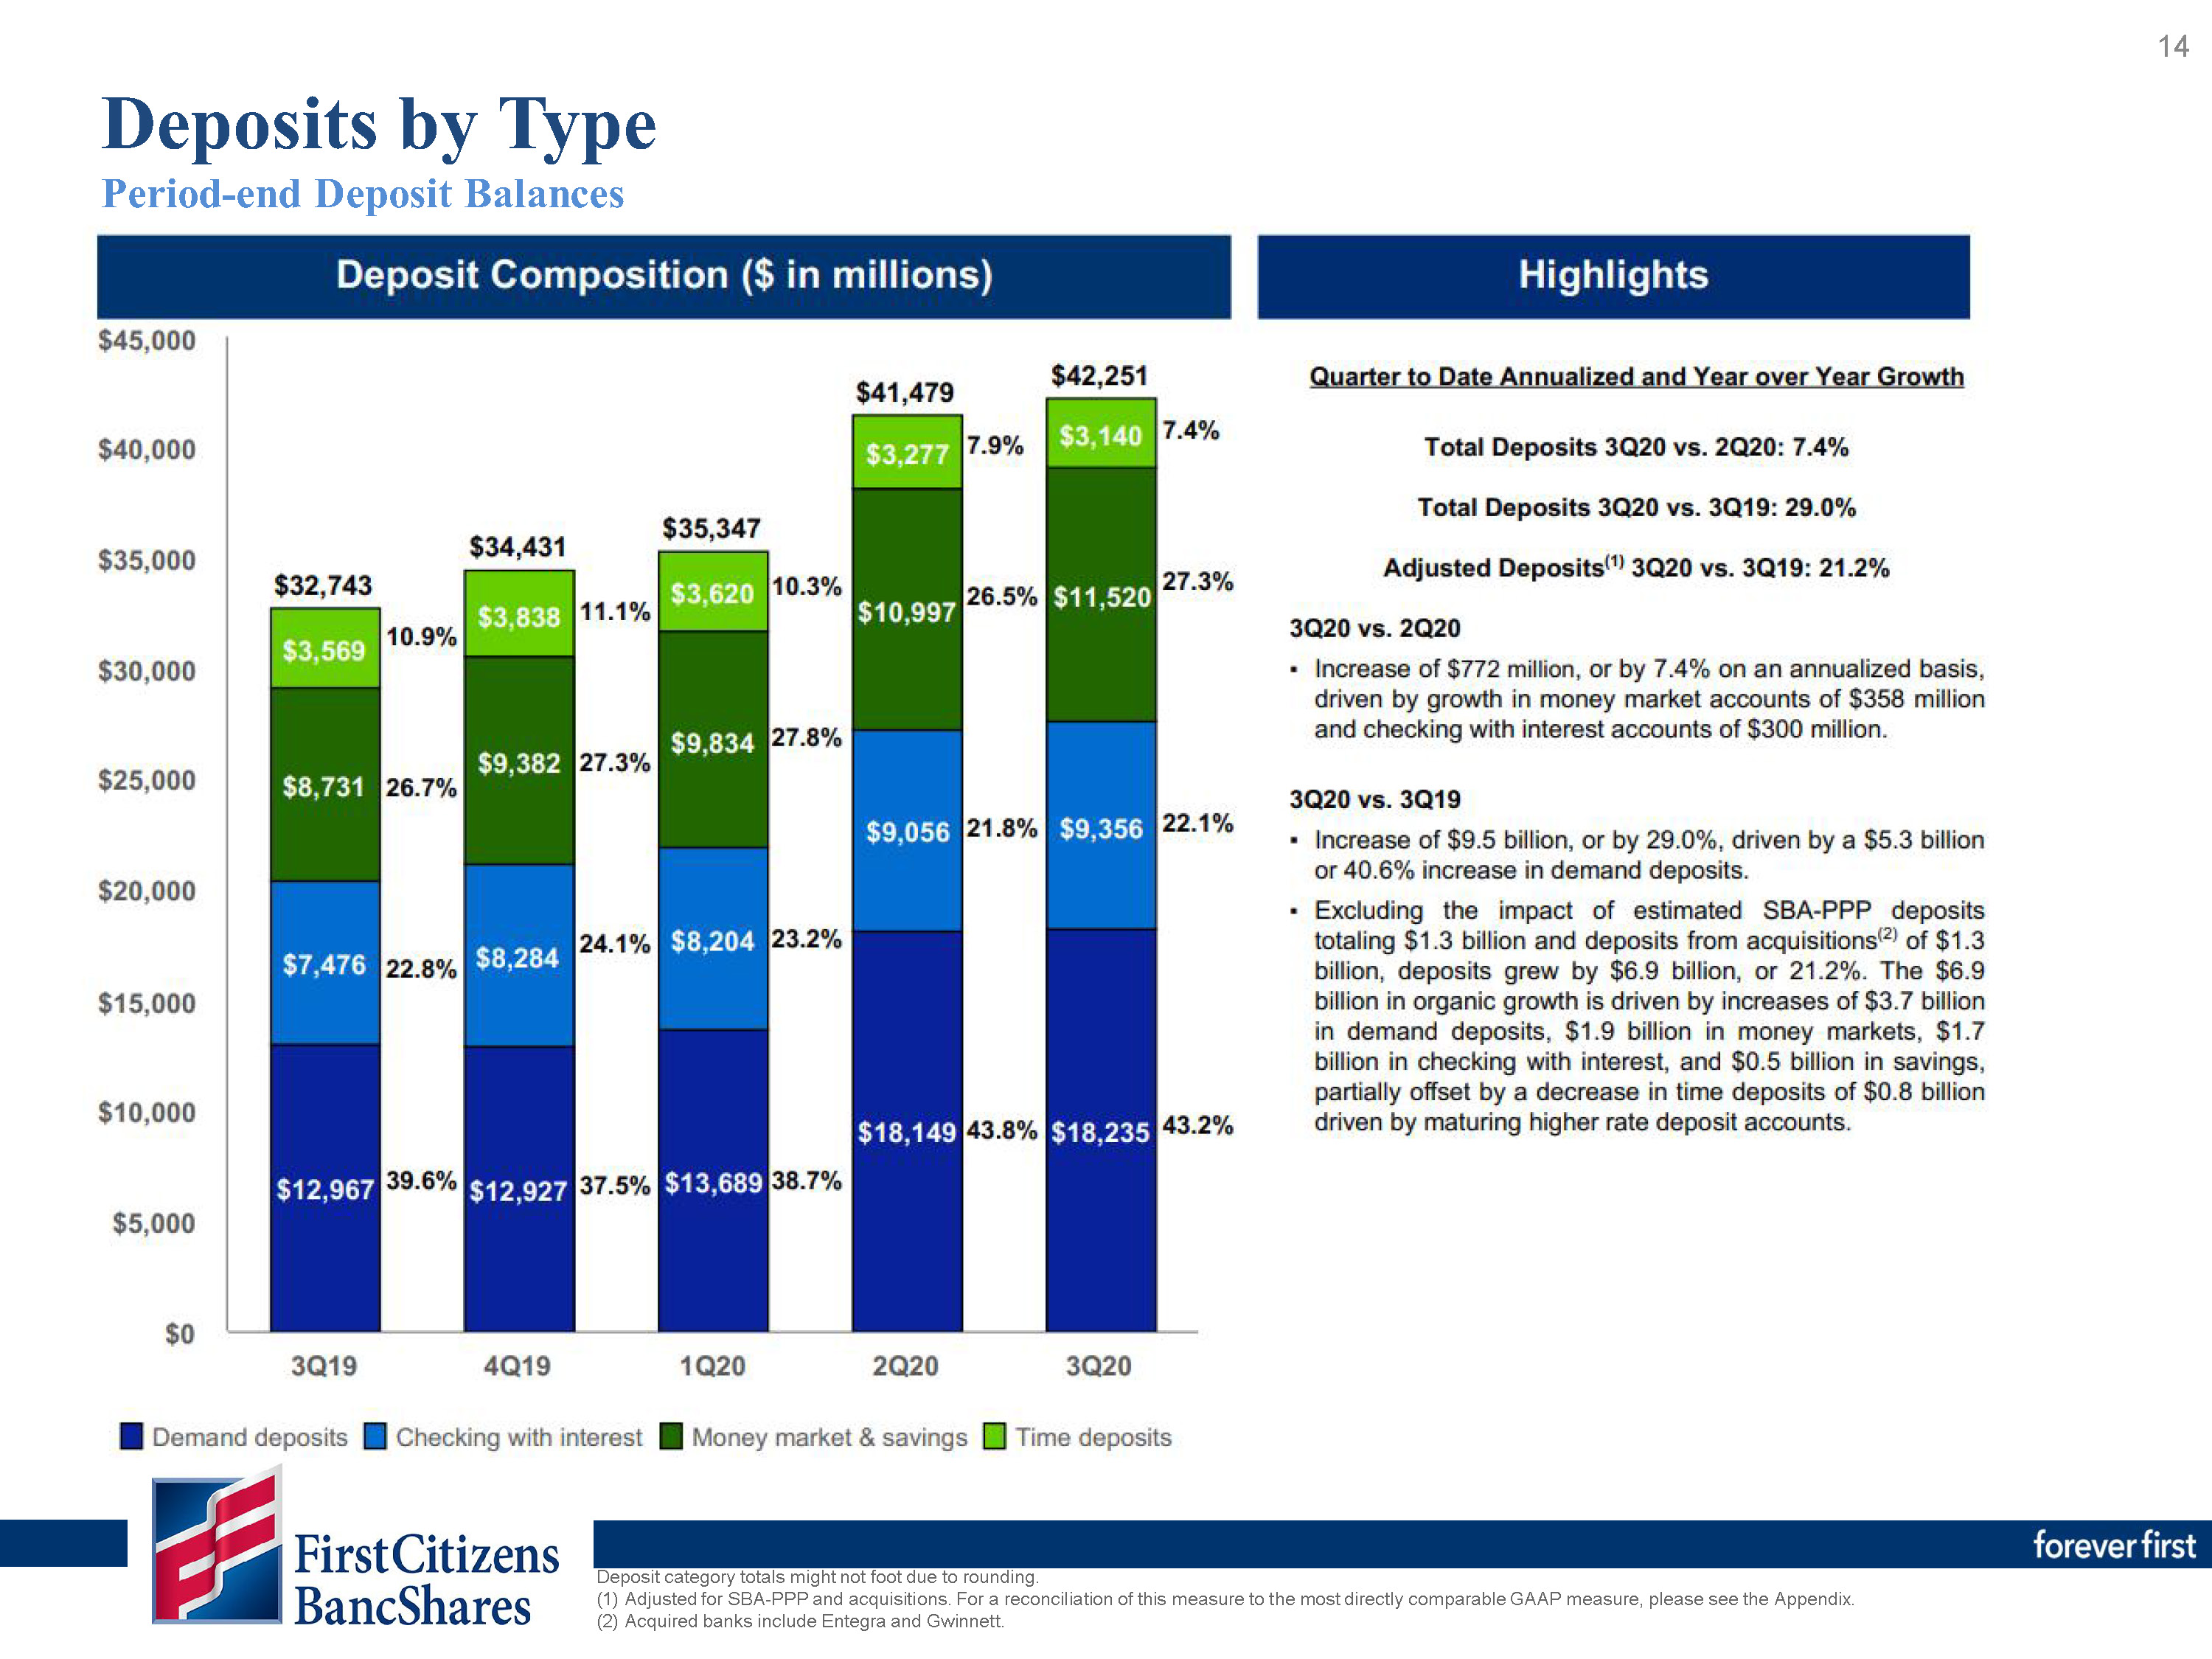
Deposits
|
Total deposits grew to $42.25 billion, an increase of $7.82 billion, or by 30.3% on an annualized basis, since December 31, 2019.
Excluding estimated SBA-PPP deposits which combined totaled $1.30 billion, total deposits increased $6.52 billion since December 31, 2019, or by 25.3% on an annualized basis.
|
|||||||||||||||||
|
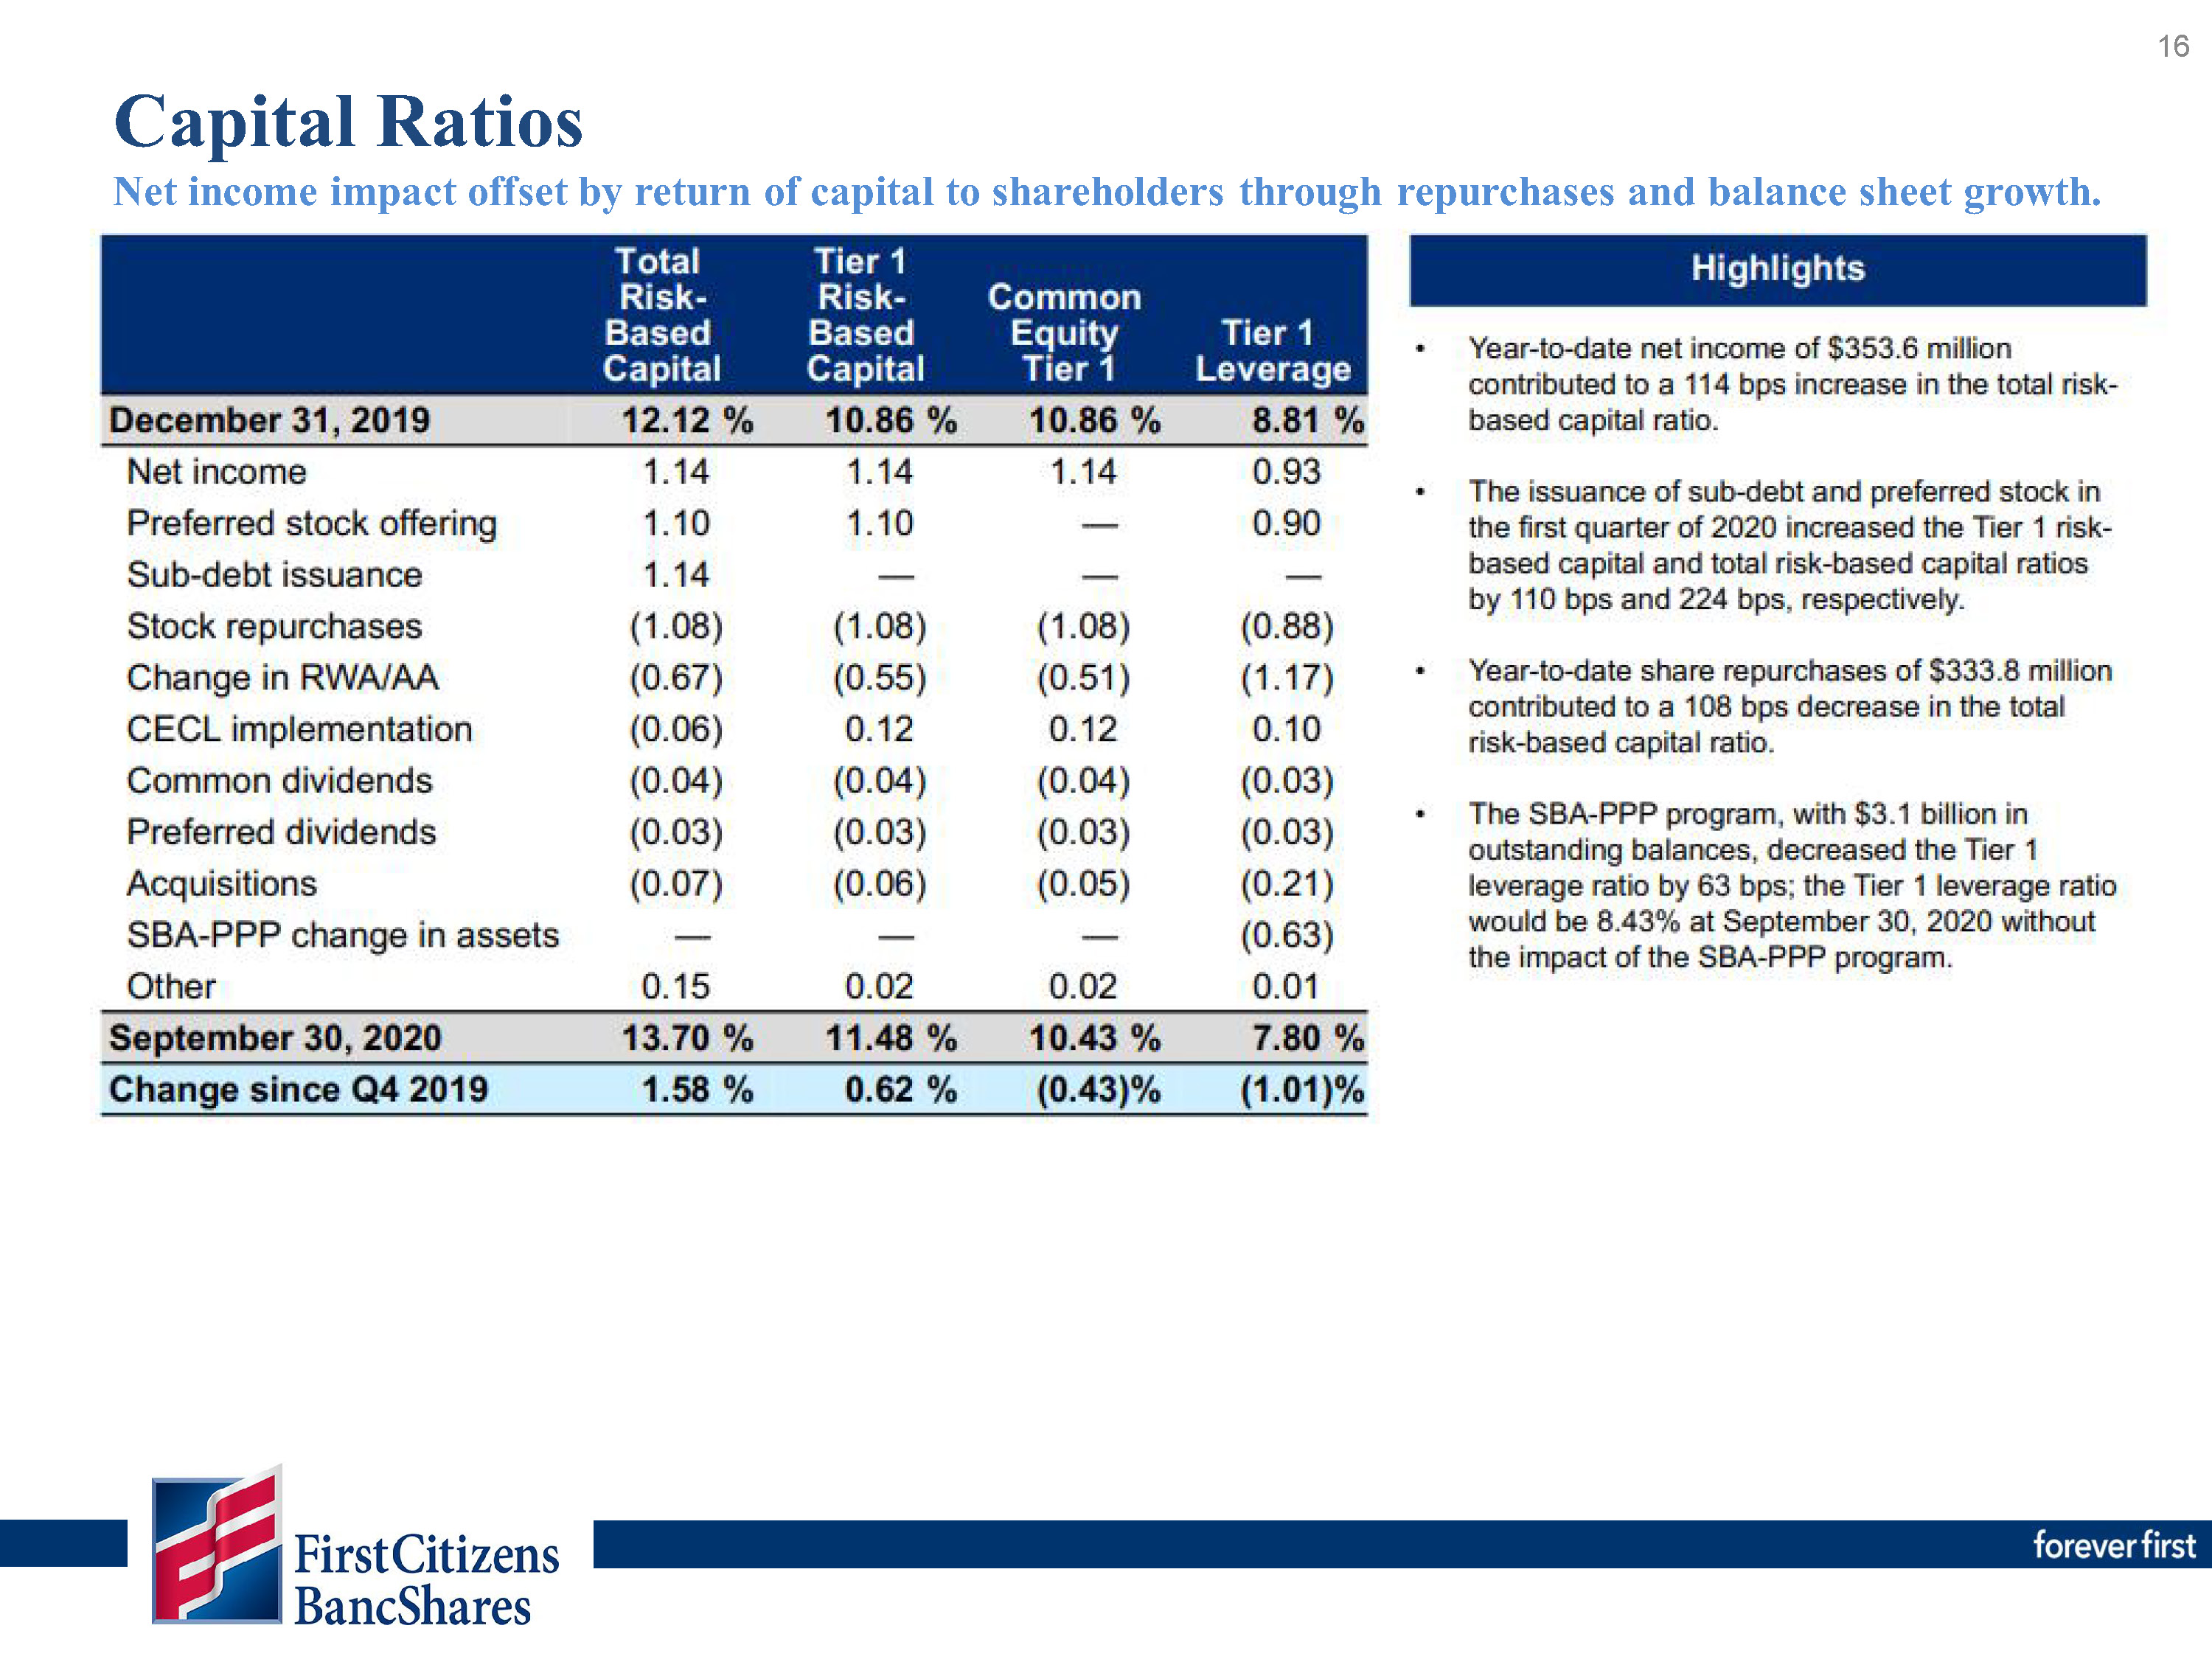
Capital
|
During the third quarter of 2020, BancShares repurchased 117,700 shares of Class A common stock for $47.1 million.
BancShares remained well capitalized with a total risk-based capital ratio of 13.7%, a Tier 1 risk-based capital ratio of 11.5%, a common equity Tier 1 ratio of 10.4% and a Tier 1 leverage ratio of 7.8%.
|
|||||||||||||||||
ONGOING COVID-19 RESPONSE
BancShares remains in a very strong capital and liquidity position providing stability in navigating the COVID-19 crisis. Our leadership team continues
to ensure appropriate measures are in place to protect the welfare of our employees and soundness of the organization, while continuing to support our customers. Our branches have re-opened with enhanced safety protocols, and our corporate
locations remain at limited occupancy due to current virus trends.
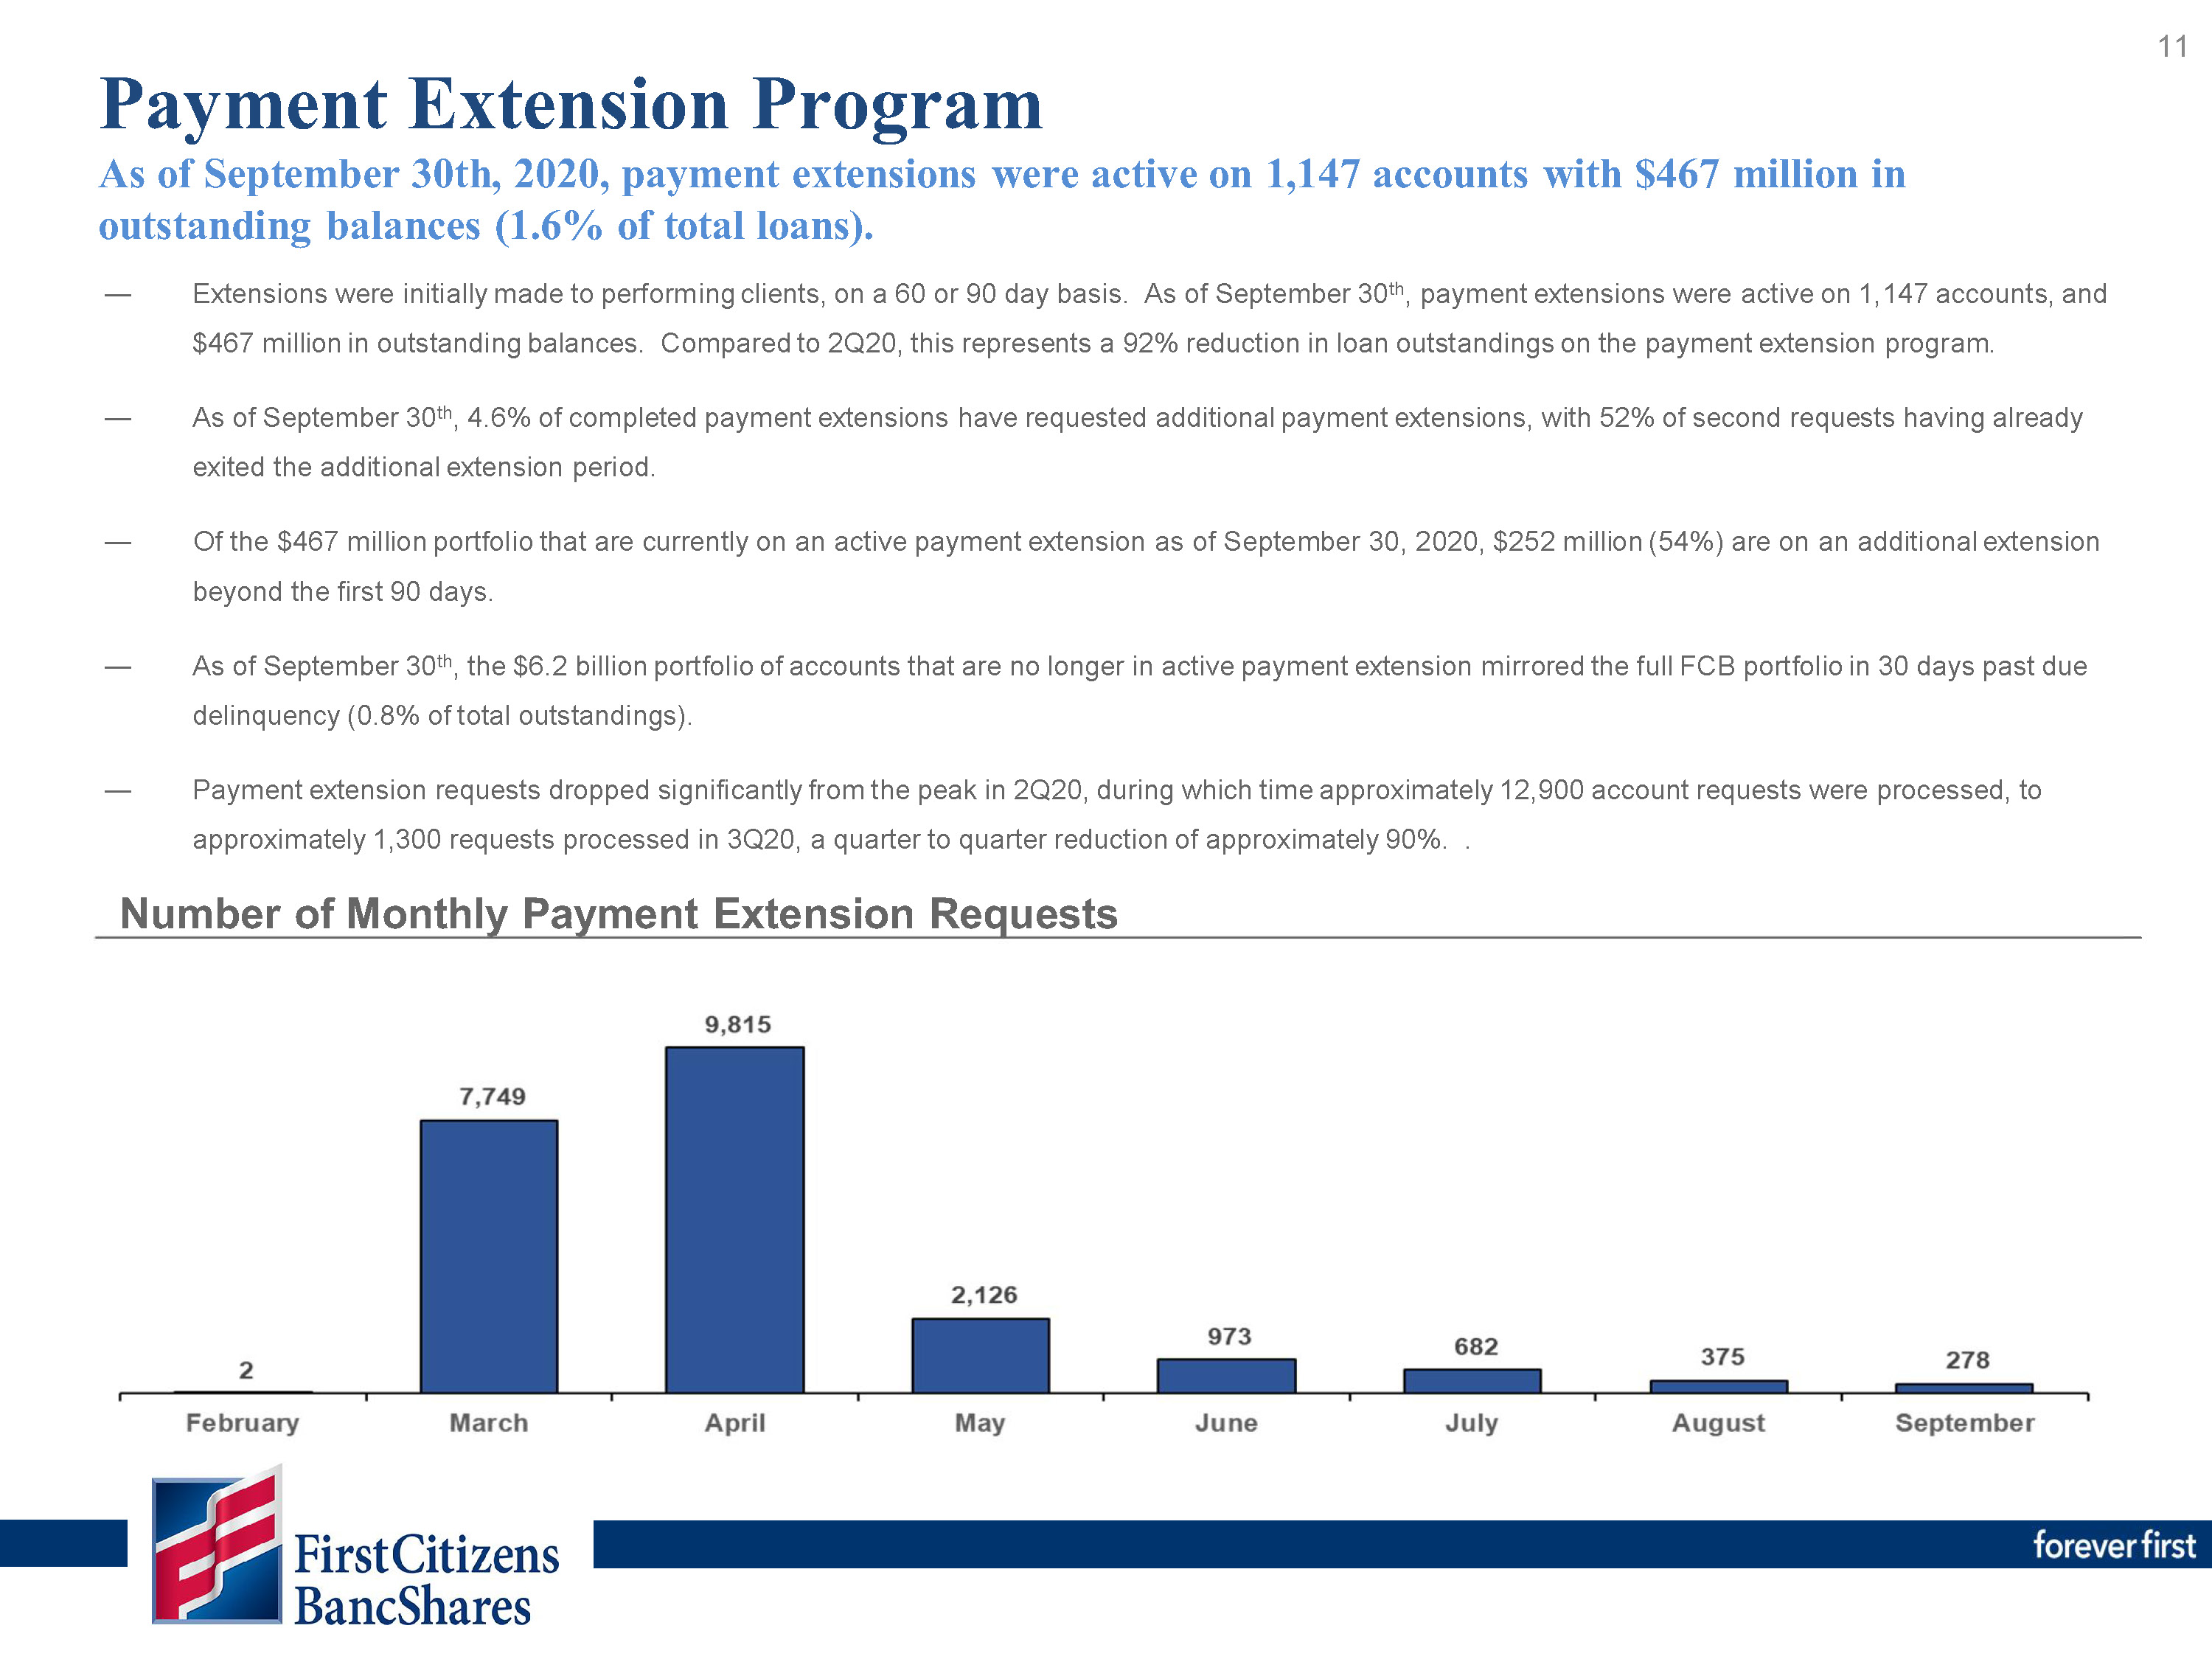
Through September 30, 2020, over 94% of all COVID-19 related loan extensions have begun repayment. Delinquency trends among loans entering repayment are
in line with the remainder of the portfolio. We have not seen significant declines in overall credit quality, though the impacts of the SBA-PPP and payment extensions could be delaying signs of credit deterioration.
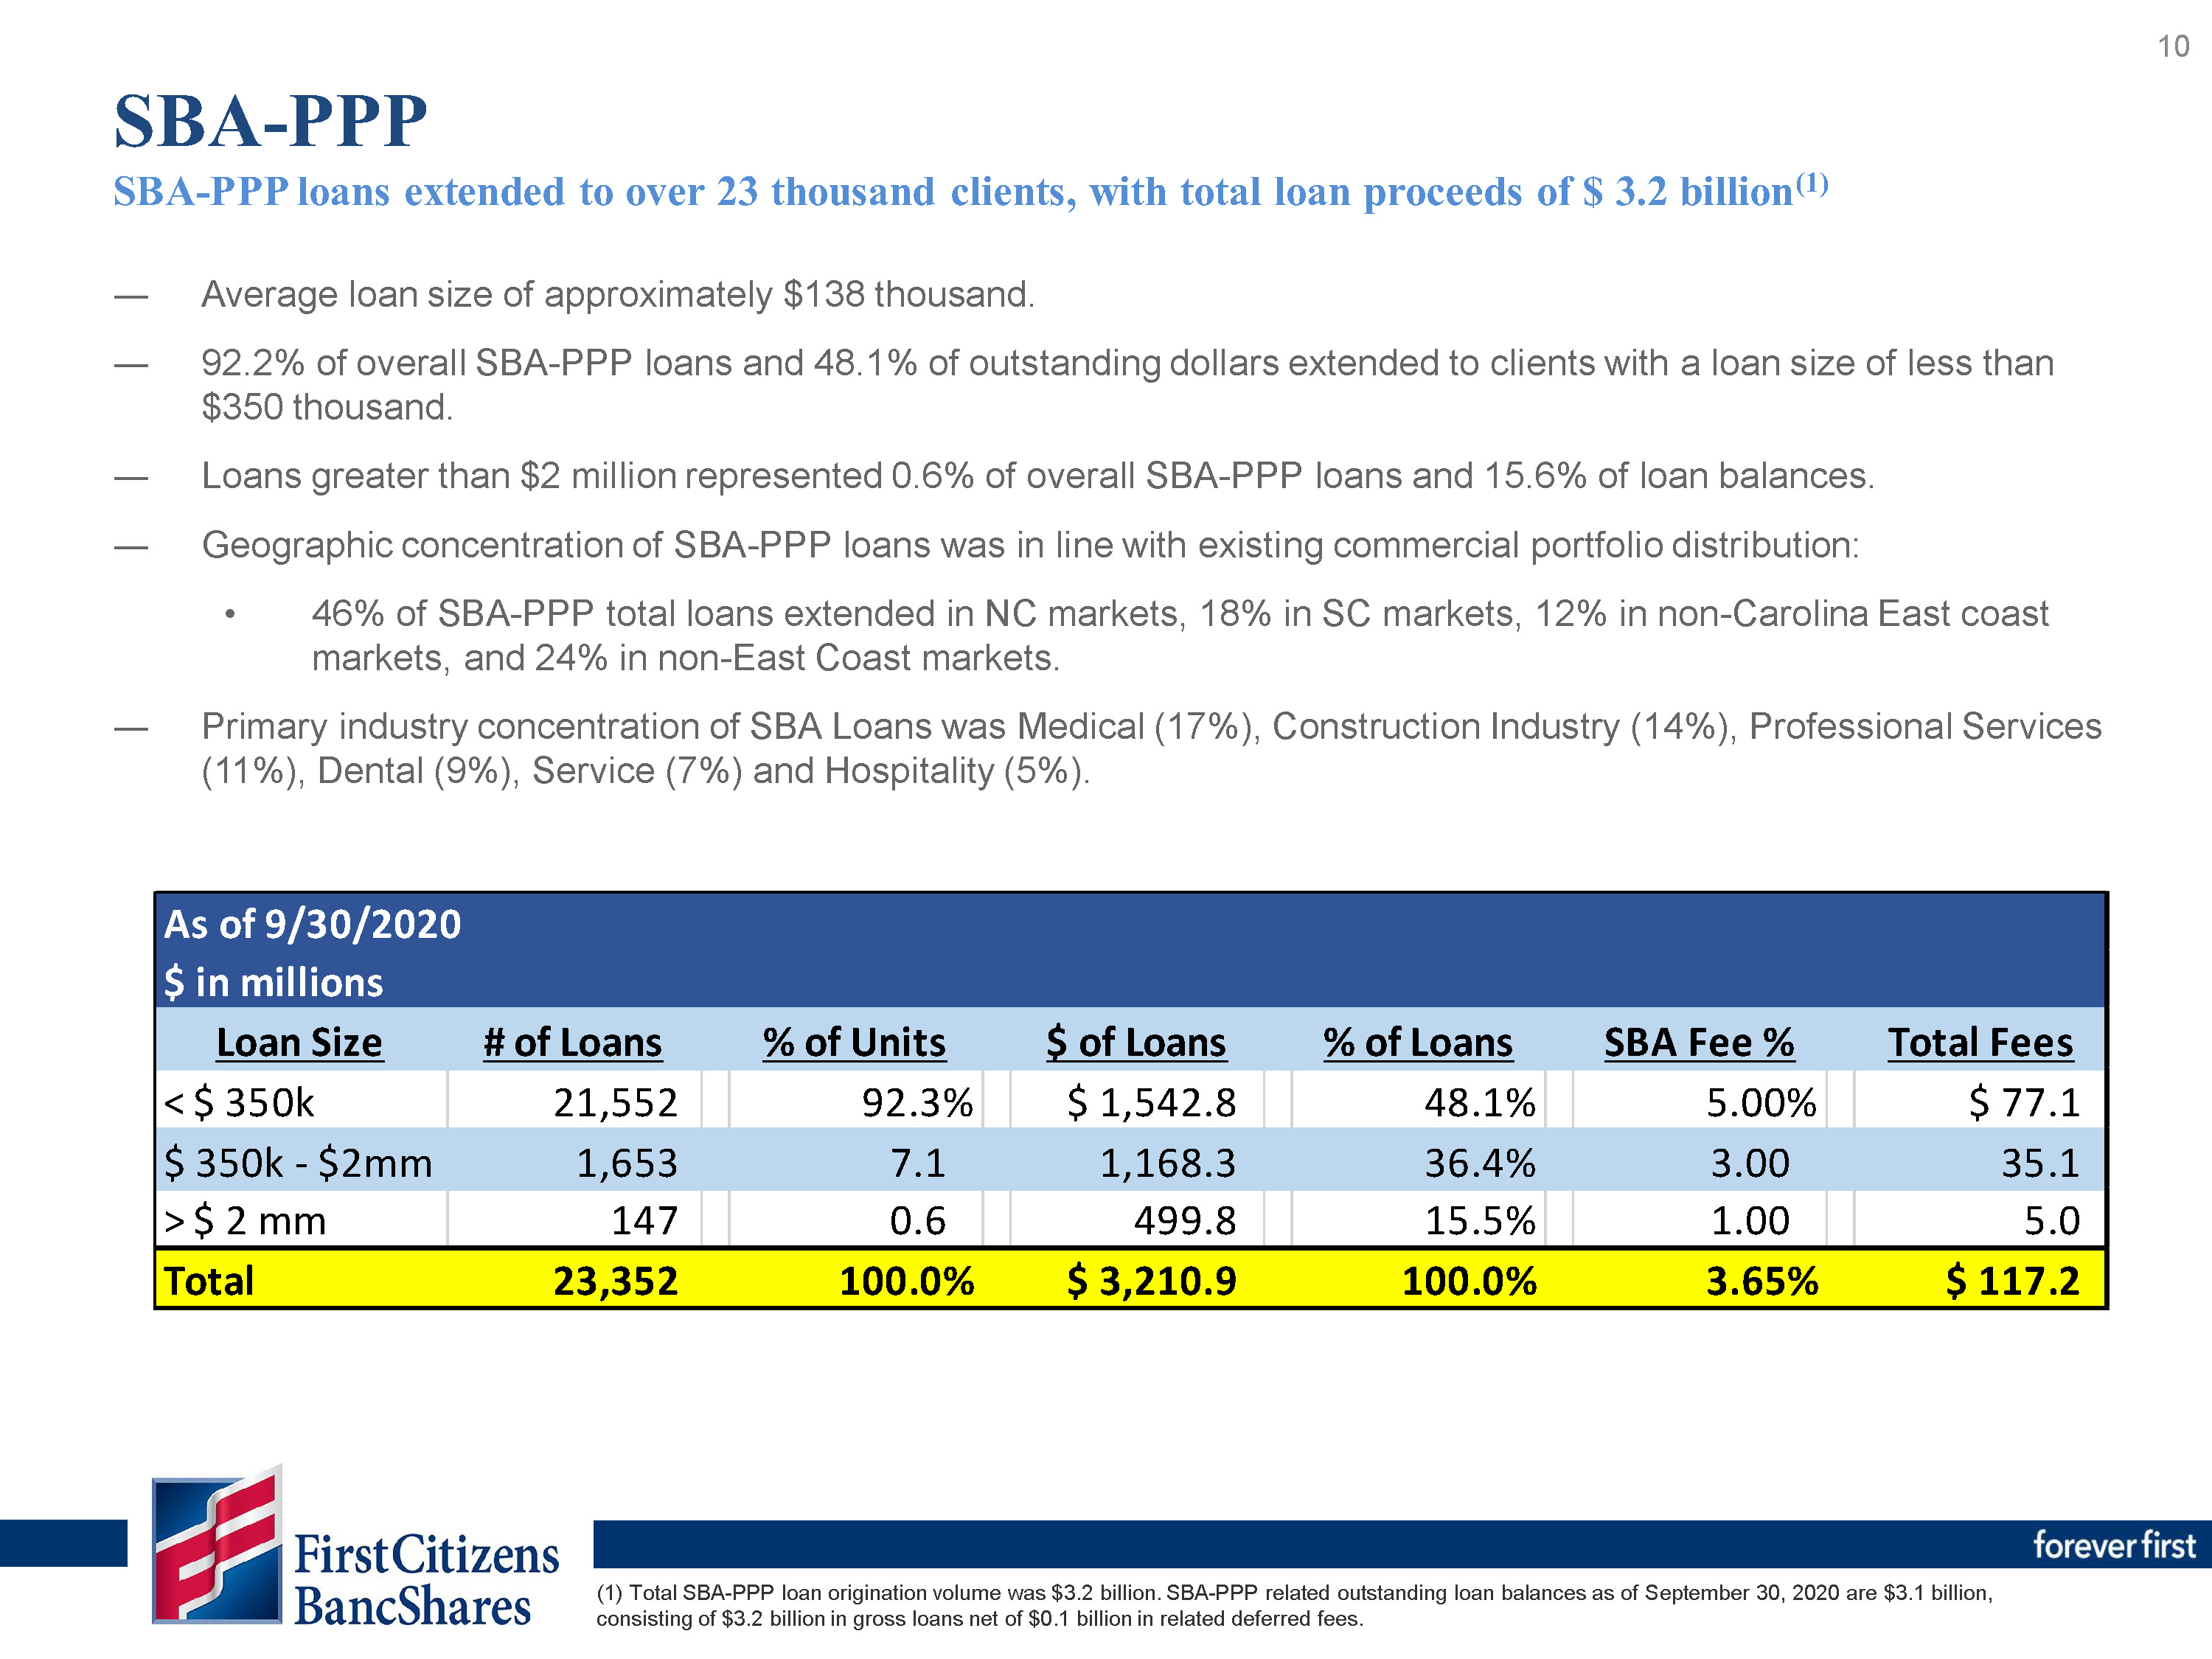
During 2020, BancShares originated over 23,000 SBA-PPP loans with an outstanding balance of $3.11 billion at September 30, 2020. We collected $117.2
million in SBA-PPP related loan fees per the program terms. These fees were deferred and are being recognized in interest income over the life of the respective loans. We have begun accepting and processing applications for forgiveness during the
third quarter, and we anticipate acceleration of the fee income as the volume of approved forgiveness applications increases and payments are received from the SBA.
Strong Liquidity and Capital Position
We maintain a strong level of liquidity. As of September 30, 2020, liquid assets (available cash and unencumbered high quality liquid assets at market
value) totaled approximately $8.51 billion, representing 17.5% of consolidated assets as of September 30, 2020.
In addition to liquid assets, we had contingent sources of liquidity totaling approximately $11.37 billion in the form of Federal Home Loan Bank
borrowing capacity, Federal Reserve Discount Window availability, fed funds lines and a committed line of credit.
At September 30, 2020, BancShares’ regulatory capital ratios were well in excess of Basel III capital requirements with a total risk-based capital ratio
of 13.7%, a Tier 1 risk-based capital ratio of 11.5%, a common equity Tier 1 ratio of 10.4%, a Tier 1 leverage ratio of 7.8% and a capital conservation buffer of 5.5%, more than twice the required level of 2.5%.
RECENT MERGER ACTIVITY
On October 15, 2020, BancShares, First-Citizens Bank & Trust Company, the bank subsidiary of BancShares (“FCB”), FC Merger Subsidiary IX, Inc., a
subsidiary of FCB, and CIT Group Inc. (“CIT”) entered into a definitive merger agreement through which the companies will combine in an all-stock merger of equals. The transaction is anticipated to close during the first half of 2021 subject to the
receipt of regulatory approvals, the approval of CIT’s and BancShares’ stockholders and the satisfaction of other customary closing conditions.
NET INTEREST INCOME
Net interest income for the third quarter of 2020 totaled $353.7 million, an increase of $17.2 million, or 5.1%, compared to the third quarter of 2019.
This was primarily due to an increase in interest earned on loans, driven by SBA-PPP loans and organic loan growth, and lower rates paid on interest-bearing liabilities, partially offset by declines in yields on interest-earning assets and
increased borrowings. SBA-PPP loans contributed $28.9 million in interest and fee income during the quarter. The taxable-equivalent NIM was 3.06% during the third quarter of 2020, a decrease of 71 basis points from 3.77% for the comparable quarter
in the prior year. The margin decline was primarily due to a decrease in the yield on interest-earning assets, partially offset by a decline in rates paid on deposits and borrowings. The taxable-equivalent NIM declined 8 basis points from 3.14% in
the linked quarter primarily related to a decline in yield on interest-earning assets, partially offset by a decline in the rate paid on interest-bearing deposits.
Net interest income for the nine months ended September 30, 2020, totaled $1.03 billion, an increase of $45.2 million, or 4.6% compared to the same
period of 2019. The change was primarily due to SBA-PPP loans and organic loan growth coupled with lower rates paid on deposits and borrowings. This was partially offset by declines in the yield on interest-earning assets and higher deposit and
borrowing balances. SBA-PPP loans contributed $47.9 million in interest and fee income during 2020. The taxable equivalent NIM decreased 57 basis points to 3.23% compared to 3.80% for the nine months ended September 30, 2019, primarily due to a
decline in yield on interest-earning assets coupled with an increase in total borrowings, only partially offset by a decline in the rate paid on interest-bearing deposits.
PROVISION FOR CREDIT LOSSES
Provision expense was $4.0 million and $52.9 million for the three and nine month periods ended September 30, 2020, respectively, as compared to $6.8
million and $23.7 million for the three and nine month periods ended September 30, 2019, respectively. The increase in the nine month period was primarily COVID-19 related as loss estimates consider the potential impact of slower economic activity
and elevated unemployment, as well as potential mitigants due to government stimulus and loan accommodations. The year-to-date provision expense includes $36.1 million of reserve build for credit losses specifically related to the potential impacts
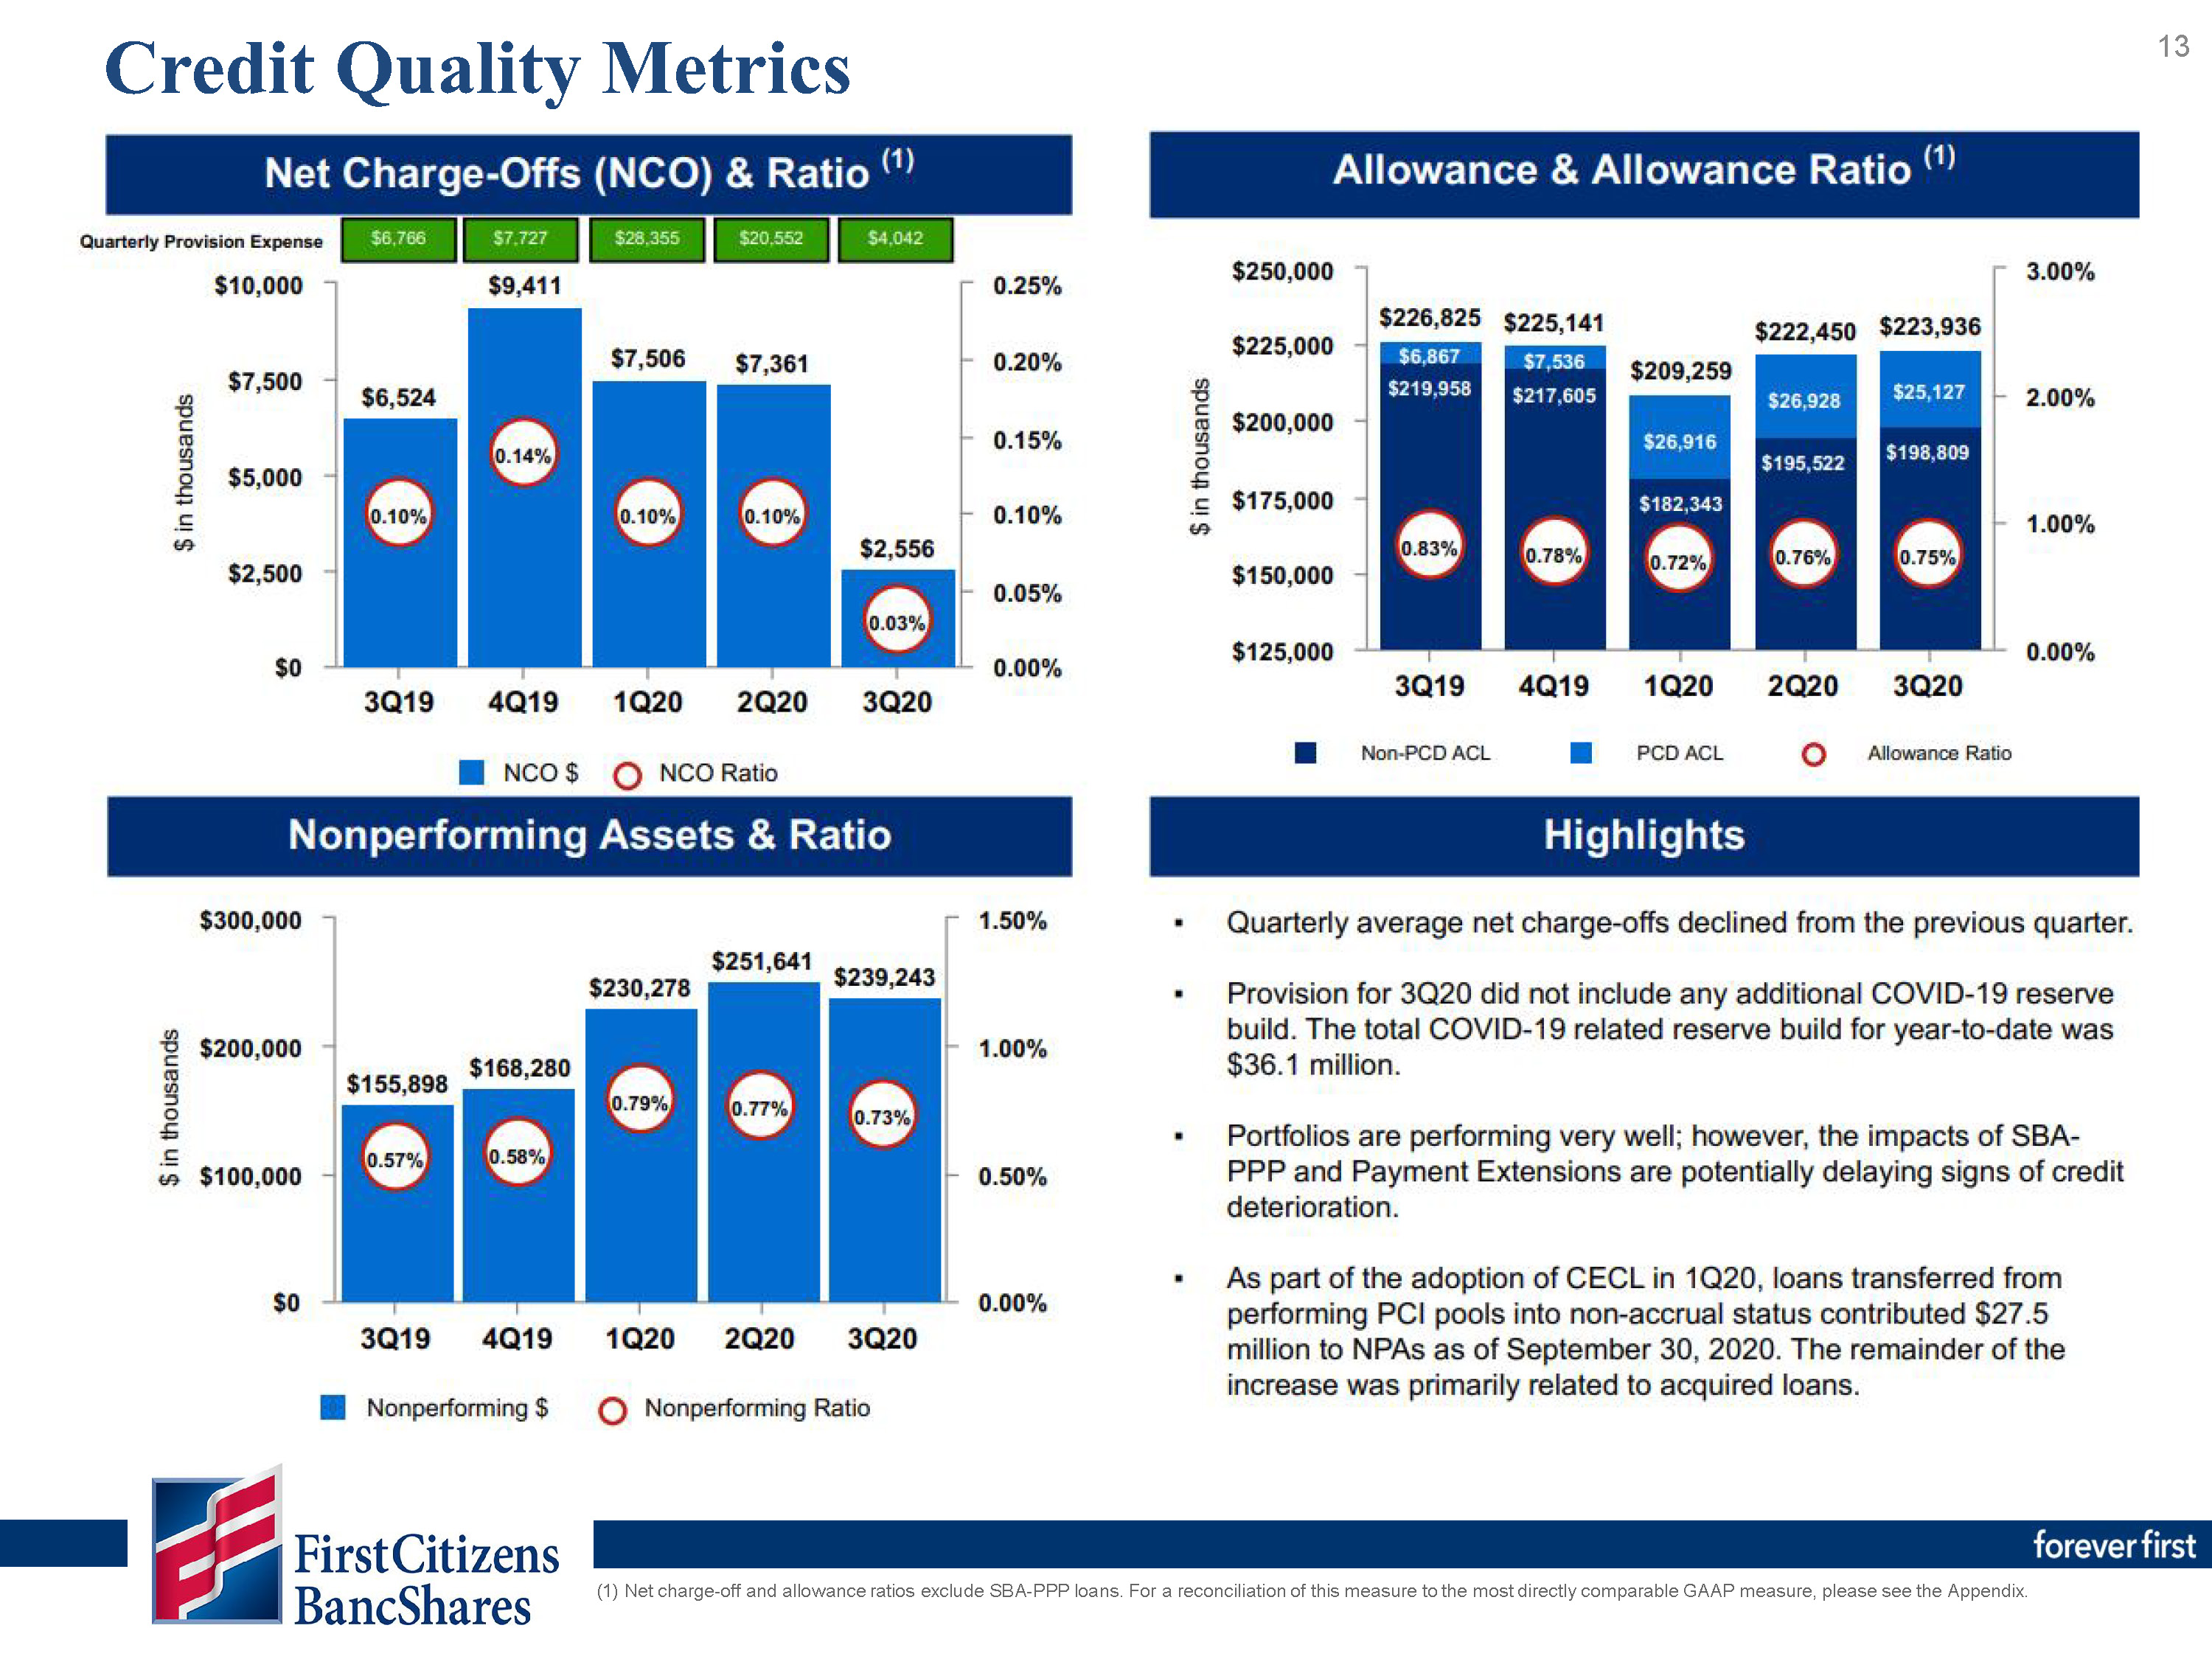
of COVID-19. The decrease in the three month period was due to stabilization in the macroeconomic forecasts, limited movement in credit quality metrics and continued low net charge-offs.
Total net charge-offs in the third quarter of 2020 were $2.6 million, a decrease from $6.5 million in the third quarter of 2019 due to a lower volume of
charge-offs and increased recoveries. Net charge-offs were $17.4 million and $20.6 million for the nine months ended September 30, 2020 and 2019, respectively. The net charge-off ratio was 0.03% and 0.07% for the three and nine month periods ended
September 30, 2020, respectively, compared to 0.10% for both the three and nine month periods ended September 30, 2019. Excluding the impact of SBA-PPP loans on average loan balances, the net charge-off ratio was 0.03% and 0.08% for the three and
nine month periods ended September 30, 2020.
NONINTEREST INCOME
Noninterest income for the third quarter of 2020 totaled $120.6 million compared to $100.9 million for the third quarter of 2019, an increase of $19.7
million, or 19.5%. The third quarter of 2020 included realized gains on available for sale securities totaling $21.4 million and negative fair value adjustments on marketable equity securities totaling $2.7 million. This compares to realized gains
on available for sale securities of $1.1 million and negative fair value adjustments on marketable equity securities of $1.0 million for the third quarter of 2019. The remaining $1.1 million increase was primarily driven by a $5.7 million increase
in mortgage income due to increased production resulting from lower mortgage interest rates and a $3.8 million increase in cardholder services income, partially offset by a $6.3 million decrease in net service charges on deposits.
Noninterest income for the first nine months of 2020 totaled $350.0 million compared to $311.5 million for the same period of 2019, an increase of $38.5
million, or 12.4%. Year-to-date 2020 noninterest income included realized gains on available for sale securities totaling $55.0 million, positive fair value adjustments on marketable equity securities totaling $10.5 million, and impairment of
mortgage servicing rights of $4.3 million. This compares to realized gains on available for sale securities of $6.9 million and positive fair value adjustments on marketable equity securities of $13.5 million for the same period of 2019. The
remaining decrease was driven primarily by a $13.2 million decrease in net service charges on deposits and a $13.8 million decrease in purchased credit impaired (“PCI”) recoveries, which following the adoption of CECL, are recorded to the ACL.
These declines were partially offset by a $16.3 million increase in mortgage income due to increased production resulting from lower mortgage interest rates and a $4.4 million increase in cardholder services.
NONINTEREST EXPENSE
Noninterest expense totaled $291.7 million for the third quarter of 2020, a $21.2 million, or 7.9%, increase compared to the same period in 2019. The
increase was largely driven by a $12.9 million increase in personnel-related expenses primarily due to increased salaries and wages as a result of personnel from acquisitions and merit increases. In addition, processing fees paid to third parties
increased by $4.7 million reflecting continued investment in digital and technological capabilities.
Noninterest expense totaled $883.3 million for the first nine months of 2020, a $71.8 million, or 8.9%, increase compared to the same period of 2019. The
increase was largely driven by a $42.0 million increase in personnel expenses as a result of merit increases and personnel from acquisitions, an $11.5 million increase in processing fees paid to third parties reflecting continued investment in
digital and technological capabilities and a $6.2 million increase in pension expense as a result of a decline in the discount rate.
INCOME TAXES
Income tax expense totaled $35.8 million and $35.4 million for the third quarter of 2020 and 2019, respectively, representing effective tax rates of
20.1% and 22.1% for the respective periods.
Income tax expense totaled $89.5 million and $105.0 million for the first nine months of 2020 and 2019, respectively, representing effective tax rates of
20.2% and 22.8% for the respective nine month periods.
The effective tax rates for the third quarter and first nine months of 2020 were favorably impacted by $3.5 million and $10.4 million, respectively, due
to BancShares’ decision in the second quarter to utilize an allowable alternative for computing its 2020 federal income tax liability. Without this alternative, the effective tax rate would have been approximately 22.0% and 22.6% for the third
quarter and first nine months of 2020, respectively. The allowable alternative provides BancShares the ability to use the federal income tax rate for certain current year deductible amounts related to prior year FDIC-assisted acquisitions that was
applicable when these amounts were originally subjected to tax.
LOANS AND DEPOSITS
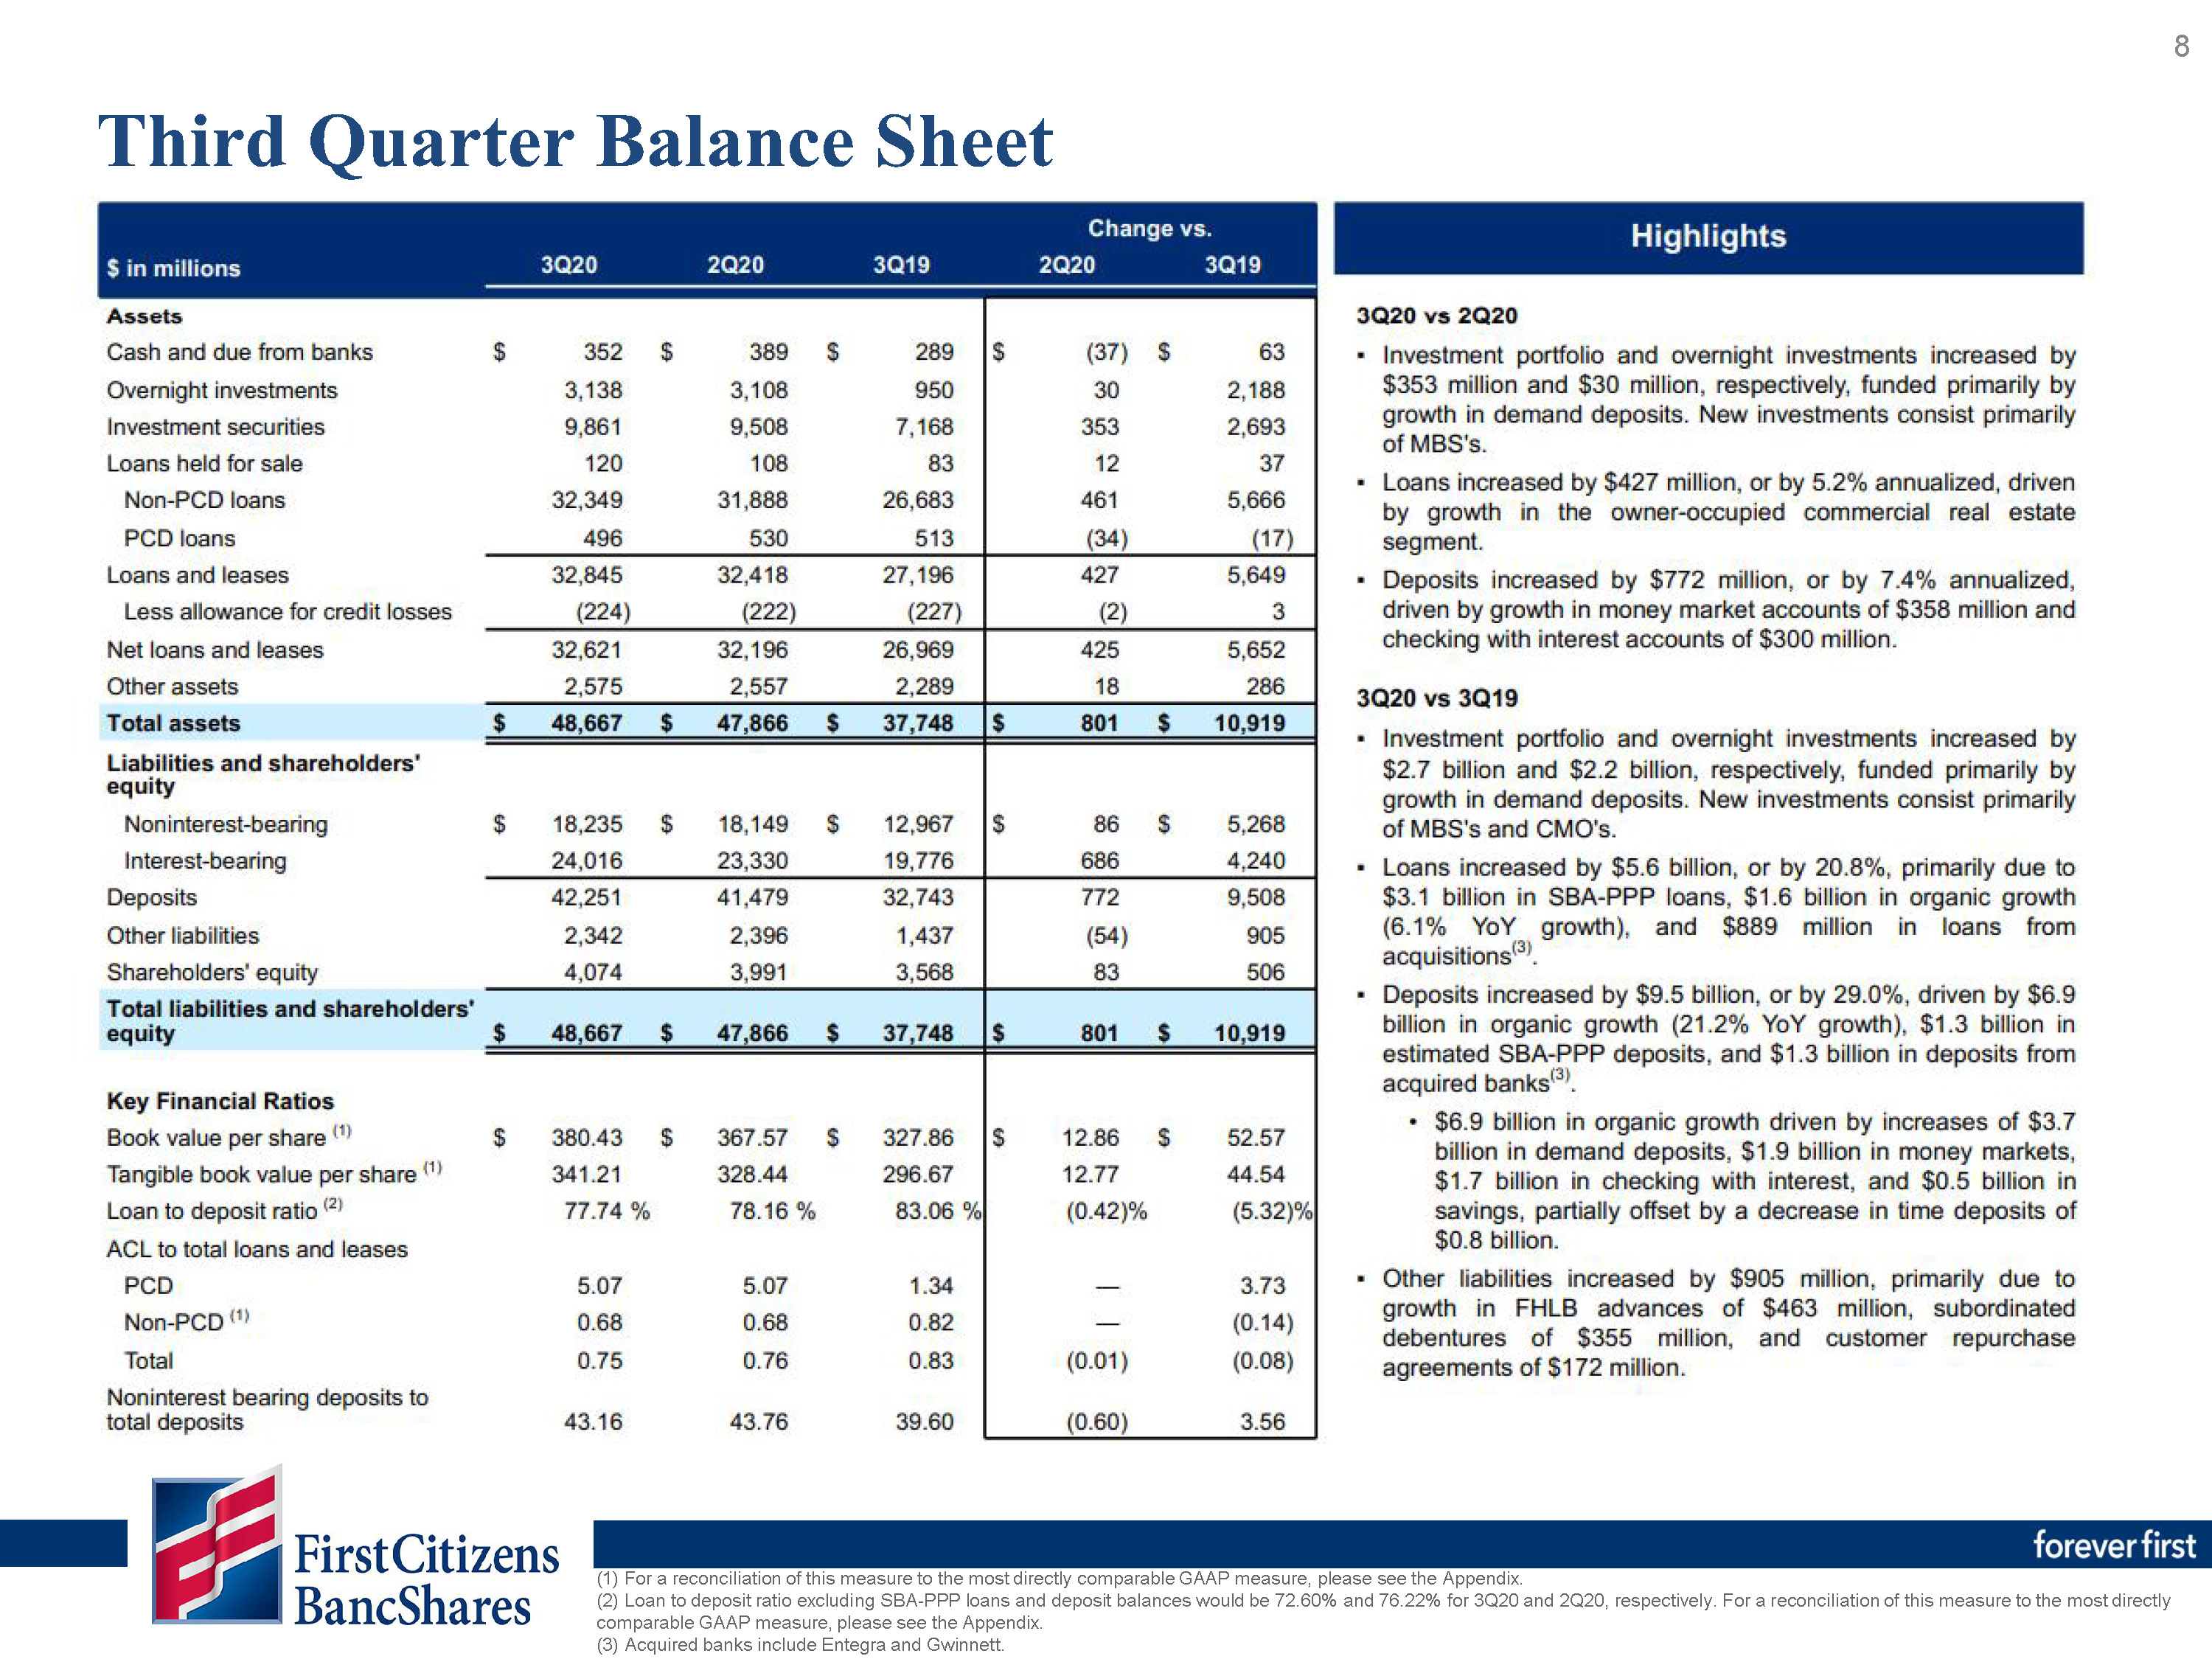
At September 30, 2020, loans totaled $32.85 billion, an increase of $3.96 billion since December 31, 2019. Of this growth, $3.11 billion was related to
SBA-PPP loans originations. Excluding SBA-PPP loans, total loans increased $851.0 million since December 31, 2019, or by 3.9% on an annualized basis.
At September 30, 2020, deposits totaled $42.25 billion, an increase of $7.82 billion since December 31, 2019. This growth includes estimated deposits of
$1.30 billion related to the SBA-PPP. Excluding the impact of these deposits, total deposits increased $6.52 billion since December 31, 2019, or by 25.3% on an annualized basis.
ALLOWANCE FOR CREDIT LOSSES
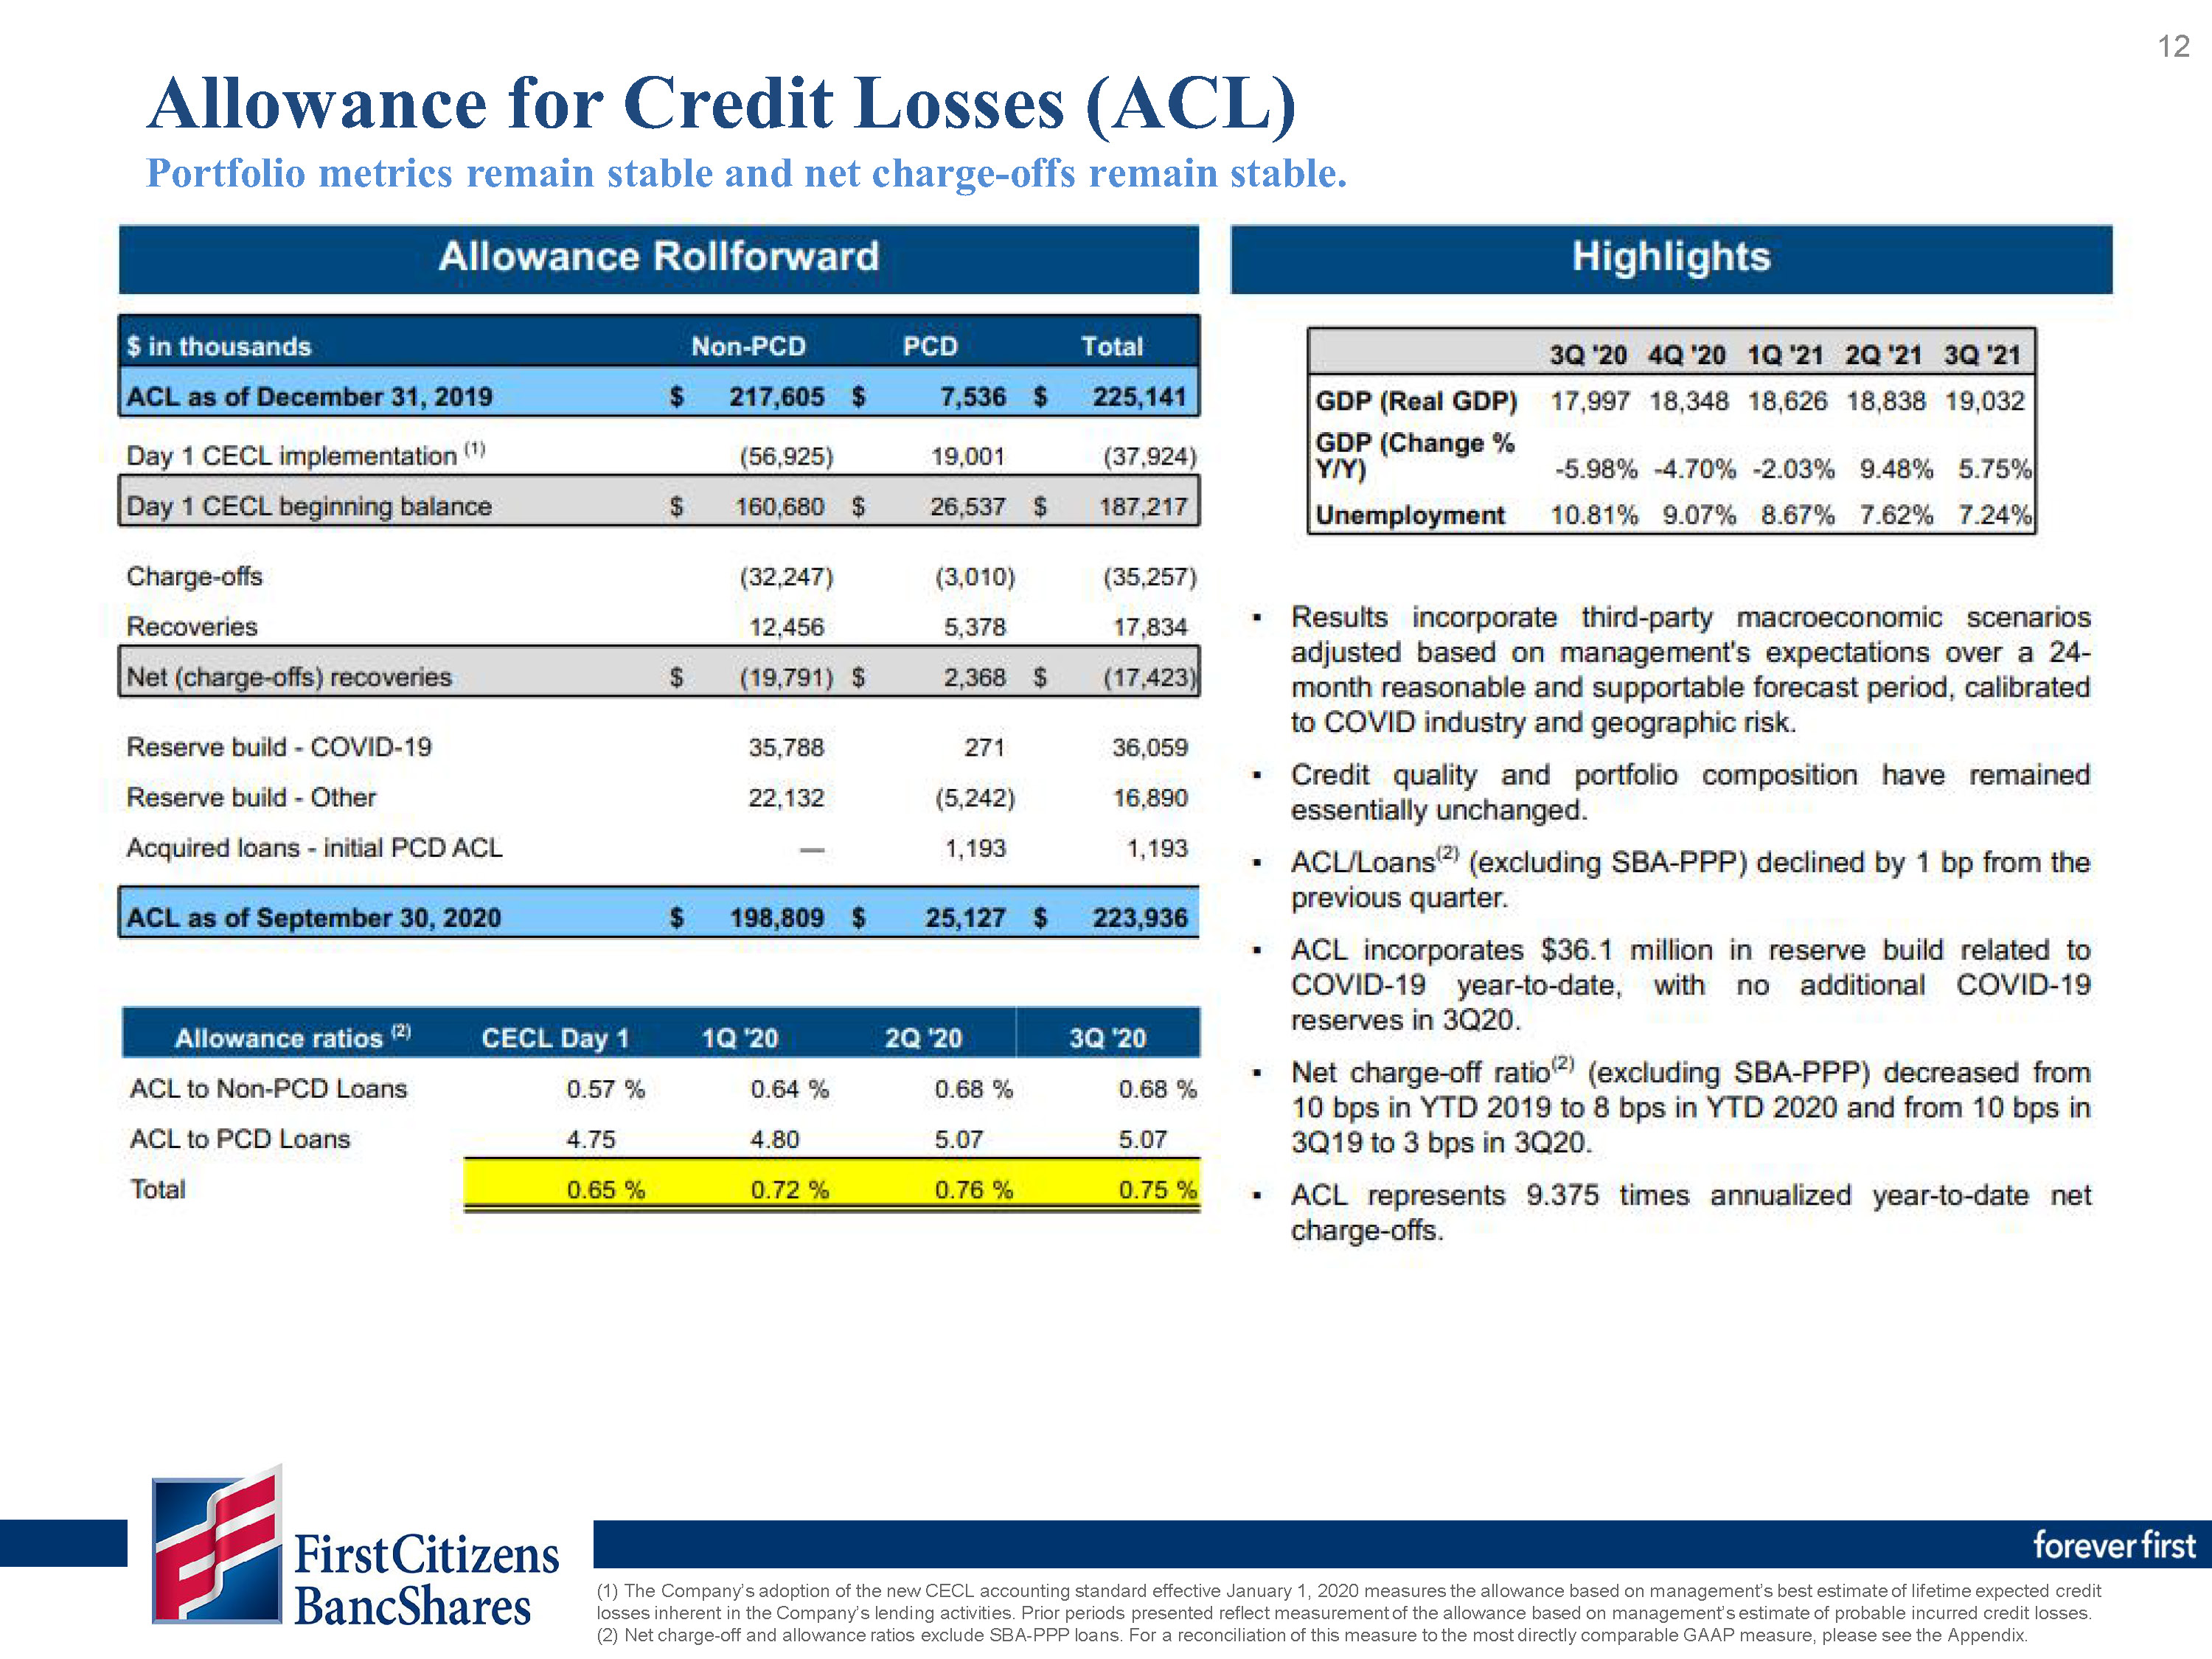
The ACL was $223.9 million at September 30, 2020, compared to $225.1 million at December 31, 2019. The ACL as a percentage of total loans was 0.68% at
September 30, 2020, compared to 0.78% at December 31, 2019. The reduction was due primarily to the adoption of CECL, resulting in a $37.9 million reduction in the ACL, partially offset by a reserve build of $36.1 million due to an increase in
potential loan losses related to the impact of COVID-19. Excluding SBA-PPP loans, which have no associated ACL, the ACL as a percentage of total loans was 0.75% as of September 30, 2020. The ACL as of September 30, 2020, excluding SBA-PPP loans,
covered approximately 9.4 times annualized year-to-date net charge-offs compared to 6.5 times at January 1, 2020 with the adoption of CECL.
NONPERFORMING ASSETS
Nonperforming assets, including nonaccrual loans and other real estate owned, were $239.2 million, or 0.73% of total loans and other real estate owned at
September 30, 2020, compared to $168.3 million or 0.58% at December 31, 2019. Contributing to the increase was the dissolution of PCI pools as part of the adoption of CECL, which moved loans from performing PCI pools into nonaccrual status, and
represents $27.5 million of nonaccrual loans as of September 30, 2020. Excluding the impact of the accounting change, the nonperforming asset ratio at September 30, 2020 would have been relatively consistent with December 31, 2019.
CAPITAL TRANSACTIONS
During the third quarter of 2020, BancShares repurchased 117,700 shares of Class A common stock for $47.1 million at an average cost per share of $399.82
compared to a total of 295,900 shares of Class A common stock for $135.4
million at an average cost per share of $457.50 for the third quarter of 2019.
For the nine months ended September 30, 2020, BancShares repurchased 813,090 shares of Class A common stock for $333.8 million at an average cost per share of $410.48 compared to 744,400 shares of Class A common stock for $325.9 million at an
average cost per share of $437.84 for the nine months ended September 30, 2019. All Class A common stock repurchases completed in 2020 and 2019 were consummated under
previously approved authorizations. Upon completion of the share repurchase authorization on July 31, 2020, share repurchase activity was suspended.
EARNINGS CALL DETAILS
In light of the announcement earlier today of entry into a definitive merger agreement with CIT, BancShares has cancelled its live conference call
originally scheduled for October 28, 2020, at 9 a.m.
There will be a joint conference call to discuss the transaction and third quarter 2020 earnings at 8 a.m. Eastern time today. To listen to the live
call, please dial 1-888-317-6003 (U.S.), 1-866-284-3684 (Canada) or 1-412-317-6061 (international) and enter the participant code 7110614.
A link to the live webcast, along with the related presentations, will be available on the investor relations section of each company’s website at
ir.cit.com/CorporateProfile and firstcitizens.com/investor-relations.
An audio replay will be available an hour after the conclusion of the call. To access the replay, dial 1-877-344-7529 (U.S.), 1-855-669-9658 (Canada) or
1-412-317-0088 (international) and use access number 10149208. This replay will be available through November 30, 2020.
For investor inquiries, contact Tom Heath, director of Investor Relations,
919-716-4565.
ABOUT FIRST CITIZENS BANCSHARES
BancShares is the financial holding company for Raleigh, North Carolina-headquartered First Citizens Bank. First Citizens Bank provides a broad range of
financial services to individuals, businesses, professionals and the medical community through branch offices in 19 states, including digital banking, mobile banking, ATMs and telephone banking. As of September 30, 2020, BancShares had total assets
of $48.67 billion.
For more information, visit First Citizens’ website at firstcitizens.com.
First Citizens Bank. Forever First®.
FORWARD-LOOKING STATEMENTS
This communication contains “forward-looking statements” within the meaning of the Private Securities Litigation Reform Act of 1995 regarding the
financial condition, results of operations, business plans and future performance of BancShares. Words such as “anticipates,” “believes,” “estimates,” “expects,” “forecasts,” “intends,” “plans,” “projects,” “targets,” “designed,” “could,” “may,”
“should,” “will” or other similar words and expressions are intended to identify these forward-looking statements. These forward-looking statements are based on BancShares’ current expectations and assumptions regarding BancShares’ business, the
economy, and other future conditions.
Because forward-looking statements relate to future results and occurrences, they are subject to inherent risks, uncertainties, changes in circumstances
and other factors that are difficult to predict. Many possible events or factors could affect BancShares’ future financial results and performance and could cause the actual results, performance or achievements of BancShares to differ materially
from any anticipated results expressed or implied by such forward-looking statements. Such risks and uncertainties include, among others, the impacts of the global COVID-19 pandemic on BancShares’ business, the financial success or changing
conditions or strategies of BancShares’ customers or vendors, fluctuations in interest rates, actions of government regulators, the availability of capital and personnel, the delay in closing (or failure to close) one or more of BancShares’
previously announced acquisition transaction(s), the failure to realize the anticipated benefits of BancShares’ previously announced acquisition transaction(s), and general competitive, economic, political, and market conditions, as well as risks
related to the proposed transaction with CIT including, in addition to those described above and among others, (1) the risk that the cost savings, any revenue synergies and other anticipated benefits of the proposed transaction may not be realized
or may take longer than anticipated to be realized, including as a result of the impact of, or problems arising from, the integration of the two companies or as a result of the condition of the economy and competitive factors in areas where
BancShares and CIT do business, (2) disruption to BancShares’ and CIT’s businesses as a result of the announcement and pendency of the proposed transaction and diversion of management’s attention from ongoing business operations and opportunities,
(3) the occurrence of any event, change or other circumstances that could give rise to the right of one or both of the parties to terminate the definitive merger agreement, (4) the risk that the integration of BancShares’ and CIT’s operations will
be materially delayed or will be more costly or difficult than expected or that BancShares and CIT are otherwise unable to successfully integrate their businesses, (5) the failure to obtain the necessary approvals of the stockholders of BancShares
and/or CIT, (6) the outcome of any legal proceedings that may be instituted against BancShares and/or CIT, (7) the failure to obtain required governmental approvals (and the risk that such approvals may result in the imposition of conditions that
could adversely affect the combined company or the expected benefits of the proposed transaction), (8) reputational risk and potential adverse reactions of BancShares’ and/or CIT’s customers, suppliers, employees or other business partners,
including those resulting from the announcement or completion of the proposed transaction, (9) the failure of any of the closing conditions in the definitive merger agreement to be satisfied on a timely basis or at all, (10) delays in closing the
proposed transaction, (11) the possibility that the proposed transaction may be more expensive to complete than anticipated, including as a result of unexpected factors or events, (12) the dilution caused by BancShares’ issuance of additional
shares of its capital stock in connection with the proposed transaction, (13) general competitive, economic, political and market conditions, (14) other factors that may affect future results of BancShares and CIT including changes in asset quality
and credit risk, the inability to sustain revenue and earnings growth, changes in capital markets, inflation, customer borrowing, repayment, investment and deposit practices, the impact, extent and timing of technological changes, capital
management activities, and other actions of the Federal Reserve Board and legislative and regulatory actions and reforms, and (15) the impact of the global COVID-19 pandemic on CIT’s business, the parties’ ability to complete the proposed
transaction and/or any of the other foregoing risks.
Except to the extent required by applicable law or regulation, BancShares disclaims any obligation to update such factors or to publicly announce the
results of any revisions to any of the forward-looking statements included herein to reflect future events or developments. Further information regarding BancShares and factors which could affect the forward-looking statements contained herein can
be found in BancShares’ Annual Report on Form 10-K for the fiscal year ended December 31, 2019, its Quarterly Reports on Form 10-Q for the periods ended March 31, 2020 and June 30, 2020, and its other filings with the Securities and Exchange
Commission.
###
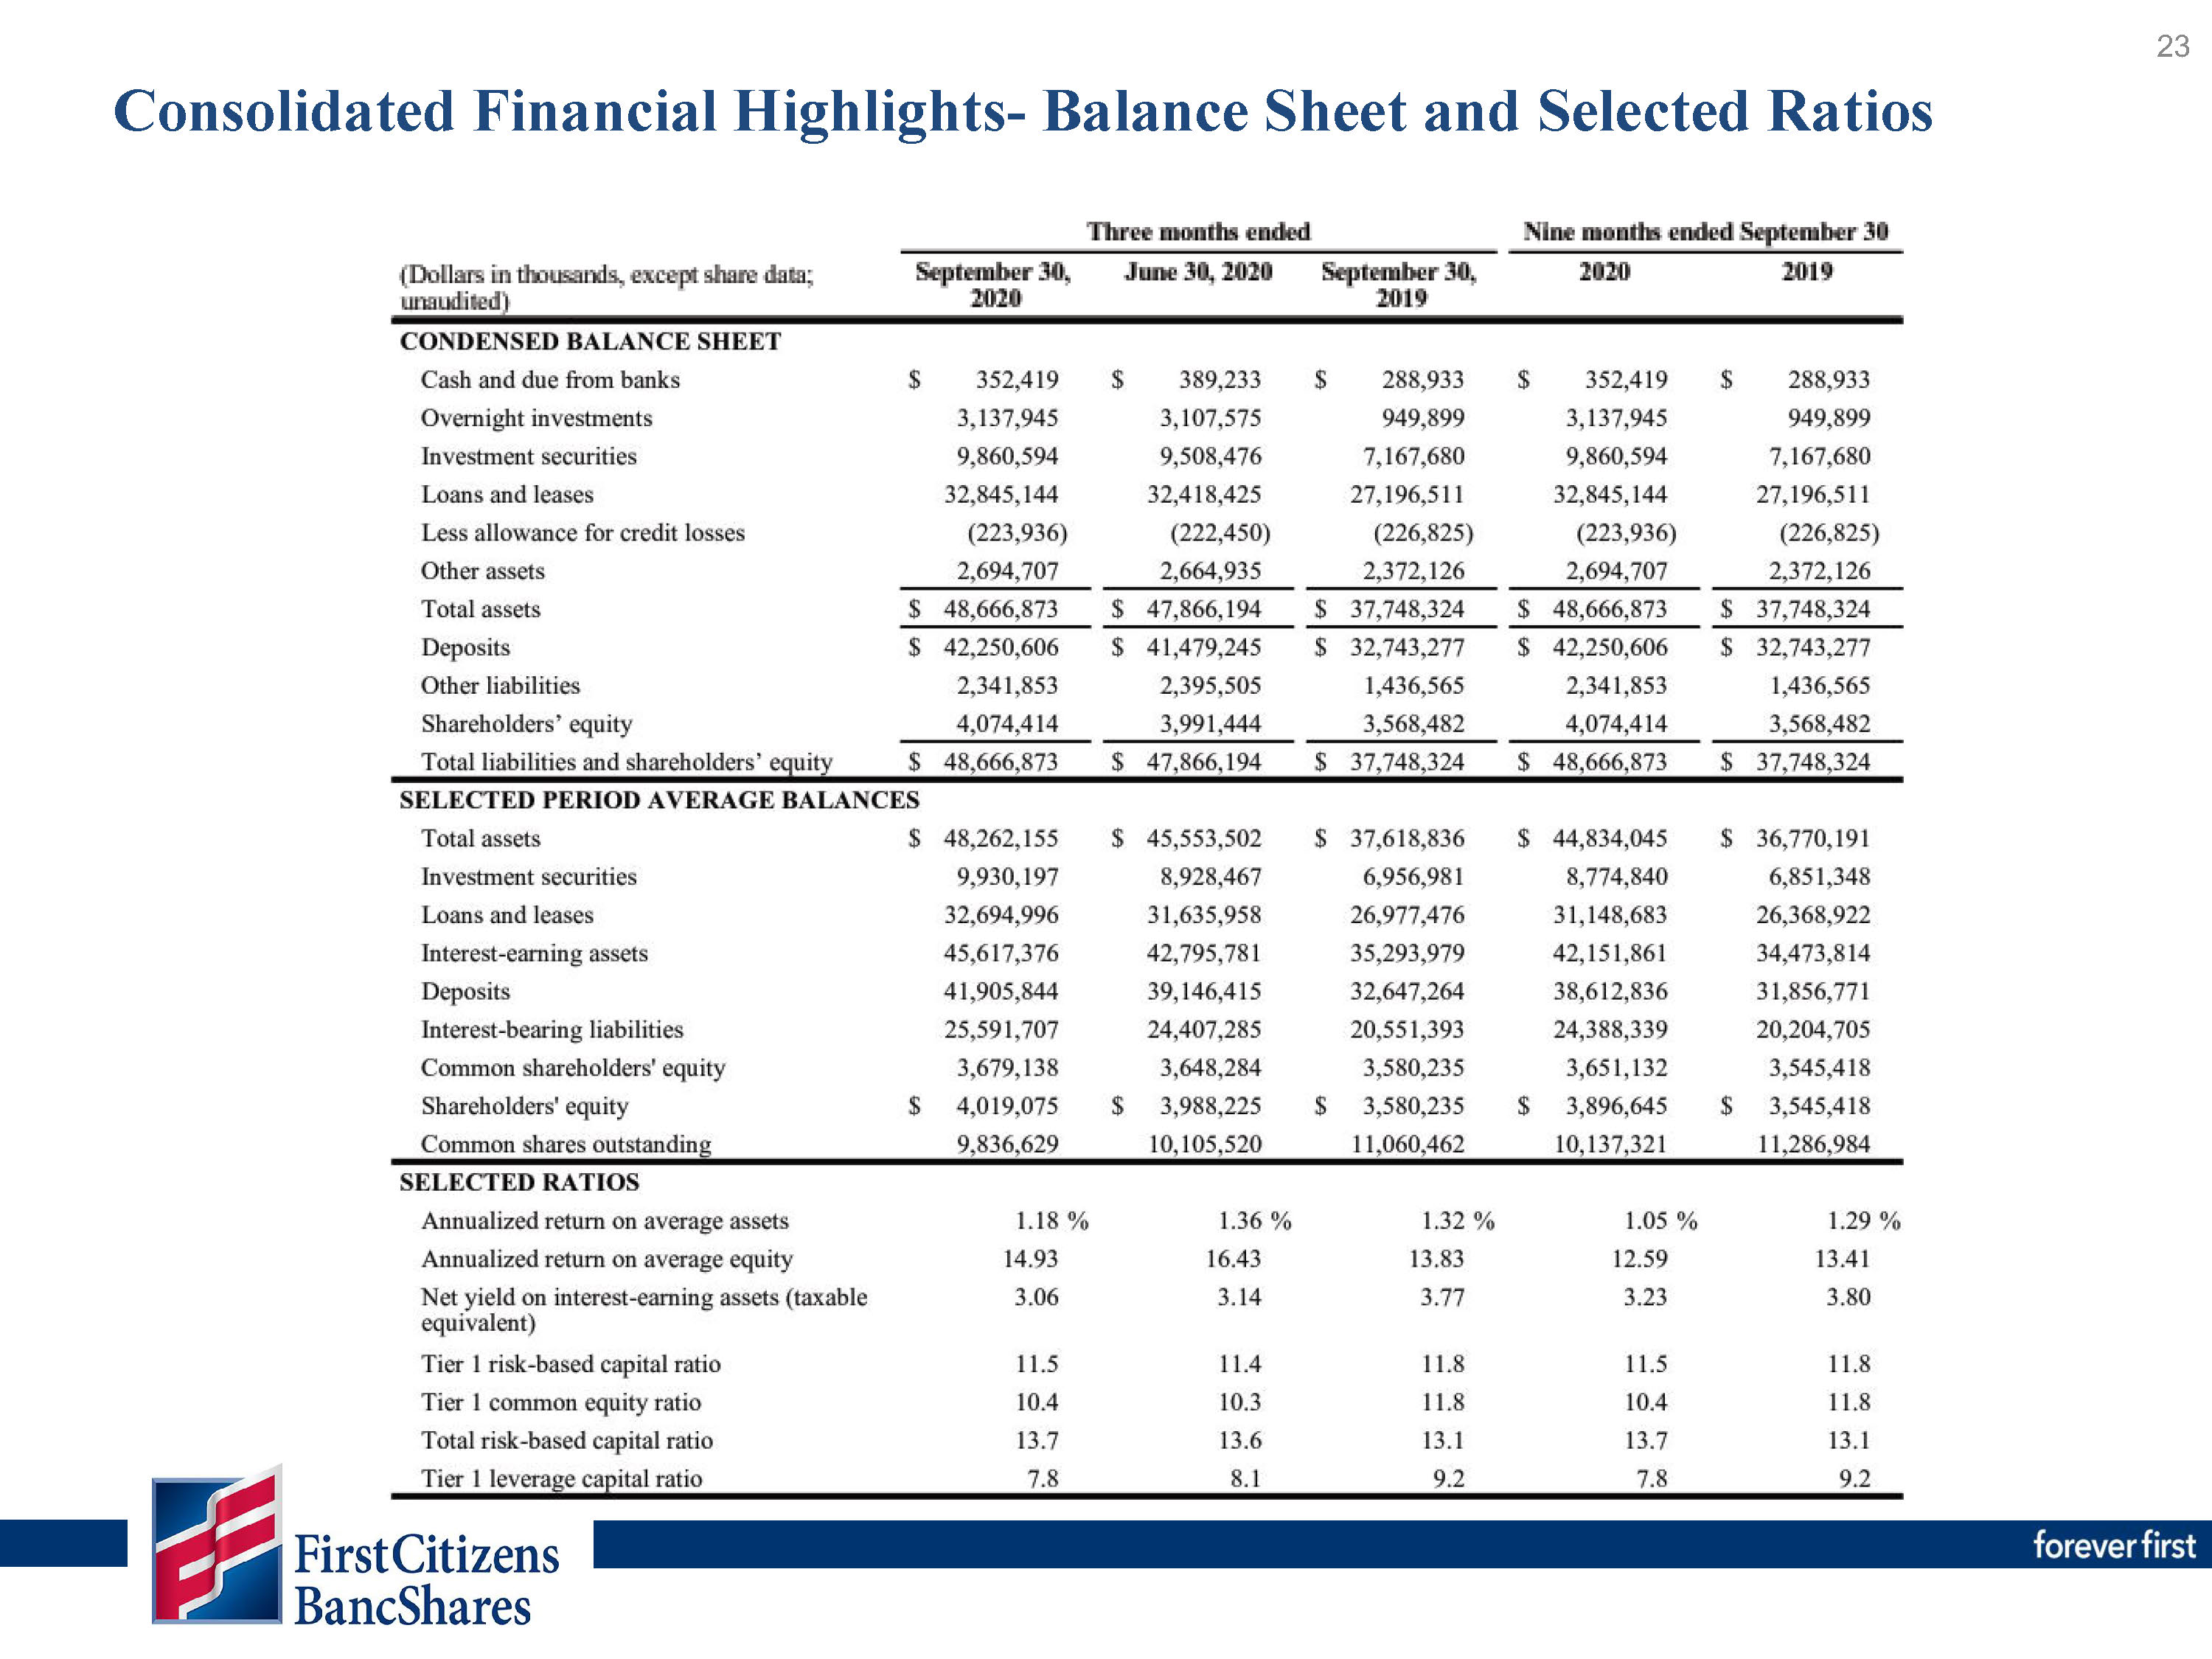
CONSOLIDATED FINANCIAL HIGHLIGHTS
|
(Dollars in thousands, except share data; unaudited)
|
Three months ended
|
Nine months ended September 30
|
|||||||||||||||||
|
September 30, 2020
|
June 30, 2020
|
September 30, 2019
|
2020
|
2019
|
|||||||||||||||
|
SUMMARY OF OPERATIONS
|
|||||||||||||||||||
|
Interest income
|
$
|
374,334
|
$
|
363,257
|
$
|
362,318
|
$
|
1,107,150
|
$
|
1,049,963
|
|||||||||
|
Interest expense
|
20,675
|
25,863
|
25,893
|
77,697
|
65,718
|
||||||||||||||
|
Net interest income
|
353,659
|
337,394
|
336,425
|
1,029,453
|
984,245
|
||||||||||||||
|
Provision for credit losses
|
4,042
|
20,552
|
6,766
|
52,949
|
23,714
|
||||||||||||||
|
Net interest income after provision for credit losses
|
349,617
|
316,842
|
329,659
|
976,504
|
960,531
|
||||||||||||||
|
Noninterest income
|
120,572
|
165,402
|
100,930
|
349,985
|
311,468
|
||||||||||||||
|
Noninterest expense
|
291,662
|
291,679
|
270,425
|
883,312
|
811,479
|
||||||||||||||
|
Income before income taxes
|
178,527
|
190,565
|
160,164
|
443,177
|
460,520
|
||||||||||||||
|
Income taxes
|
35,843
|
36,779
|
35,385
|
89,538
|
105,023
|
||||||||||||||
|
Net income
|
$
|
142,684
|
$
|
153,786
|
$
|
124,779
|
$
|
353,639
|
$
|
355,497
|
|||||||||
|
Less: Preferred stock dividends
|
4,636
|
4,790
|
—
|
9,426
|
—
|
||||||||||||||
|
Net income available to common shareholders
|
$
|
138,048
|
$
|
148,996
|
$
|
124,779
|
$
|
344,213
|
$
|
355,497
|
|||||||||
|
Net interest income, taxable equivalent
|
$
|
354,256
|
$
|
337,965
|
$
|
337,322
|
$
|
1,031,395
|
$
|
986,896
|
|||||||||
|
PER COMMON SHARE DATA
|
|||||||||||||||||||
|
Net income
|
$
|
14.03
|
$
|
14.74
|
$
|
11.27
|
$
|
33.96
|
$
|
31.50
|
|||||||||
|
Cash dividends on common shares
|
0.40
|
0.40
|
0.40
|
1.20
|
1.20
|
||||||||||||||
|
Book value at period-end
|
380.43
|
367.57
|
327.86
|
380.43
|
327.86
|
||||||||||||||
|
CONDENSED BALANCE SHEET
|
|||||||||||||||||||
|
Cash and due from banks
|
$
|
352,419
|
$
|
389,233
|
$
|
288,933
|
$
|
352,419
|
$
|
288,933
|
|||||||||
|
Overnight investments
|
3,137,945
|
3,107,575
|
949,899
|
3,137,945
|
949,899
|
||||||||||||||
|
Investment securities
|
9,860,594
|
9,508,476
|
7,167,680
|
9,860,594
|
7,167,680
|
||||||||||||||
|
Loans and leases
|
32,845,144
|
32,418,425
|
27,196,511
|
32,845,144
|
27,196,511
|
||||||||||||||
|
Less allowance for credit losses
|
(223,936)
|
(222,450)
|
(226,825)
|
(223,936)
|
(226,825)
|
||||||||||||||
|
Other assets
|
2,694,707
|
2,664,935
|
2,372,126
|
2,694,707
|
2,372,126
|
||||||||||||||
|
Total assets
|
$
|
48,666,873
|
$
|
47,866,194
|
$
|
37,748,324
|
$
|
48,666,873
|
$
|
37,748,324
|
|||||||||
|
Deposits
|
$
|
42,250,606
|
$
|
41,479,245
|
$
|
32,743,277
|
$
|
42,250,606
|
$
|
32,743,277
|
|||||||||
|
Other liabilities
|
2,341,853
|
2,395,505
|
1,436,565
|
2,341,853
|
1,436,565
|
||||||||||||||
|
Shareholders’ equity
|
4,074,414
|
3,991,444
|
3,568,482
|
4,074,414
|
3,568,482
|
||||||||||||||
|
Total liabilities and shareholders’ equity
|
$
|
48,666,873
|
$
|
47,866,194
|
$
|
37,748,324
|
$
|
48,666,873
|
$
|
37,748,324
|
|||||||||
|
SELECTED PERIOD AVERAGE BALANCES
|
|||||||||||||||||||
|
Total assets
|
$
|
48,262,155
|
$
|
45,553,502
|
$
|
37,618,836
|
$
|
44,834,045
|
$
|
36,770,191
|
|||||||||
|
Investment securities
|
9,930,197
|
8,928,467
|
6,956,981
|
8,774,840
|
6,851,348
|
||||||||||||||
|
Loans and leases
|
32,694,996
|
31,635,958
|
26,977,476
|
31,148,683
|
26,368,922
|
||||||||||||||
|
Interest-earning assets
|
45,617,376
|
42,795,781
|
35,293,979
|
42,151,861
|
34,473,814
|
||||||||||||||
|
Deposits
|
41,905,844
|
39,146,415
|
32,647,264
|
38,612,836
|
31,856,771
|
||||||||||||||
|
Interest-bearing liabilities
|
25,591,707
|
24,407,285
|
20,551,393
|
24,388,339
|
20,204,705
|
||||||||||||||
|
Common shareholders’ equity
|
3,679,138
|
3,648,284
|
3,580,235
|
3,651,132
|
3,545,418
|
||||||||||||||
|
Shareholders’ equity
|
$
|
4,019,075
|
$
|
3,988,225
|
$
|
3,580,235
|
$
|
3,896,645
|
$
|
3,545,418
|
|||||||||
|
Common shares outstanding
|
9,836,629
|
10,105,520
|
11,060,462
|
10,137,321
|
11,286,984
|
||||||||||||||
|
SELECTED RATIOS
|
|||||||||||||||||||
|
Annualized return on average assets
|
1.18
|
%
|
1.36
|
%
|
1.32
|
%
|
1.05
|
%
|
1.29
|
%
|
|||||||||
|
Annualized return on average equity
|
14.93
|
16.43
|
13.83
|
12.59
|
13.41
|
||||||||||||||
|
Net yield on interest-earning assets (taxable equivalent)
|
3.06
|
3.14
|
3.77
|
3.23
|
3.80
|
||||||||||||||
|
Tier 1 risk-based capital ratio
|
11.5
|
11.4
|
11.8
|
11.5
|
11.8
|
||||||||||||||
|
Tier 1 common equity ratio
|
10.4
|
10.3
|
11.8
|
10.4
|
11.8
|
||||||||||||||
|
Total risk-based capital ratio
|
13.7
|
13.6
|
13.1
|
13.7
|
13.1
|
||||||||||||||
|
Tier 1 leverage capital ratio
|
7.8
|
8.1
|
9.2
|
7.8
|
9.2
|
||||||||||||||
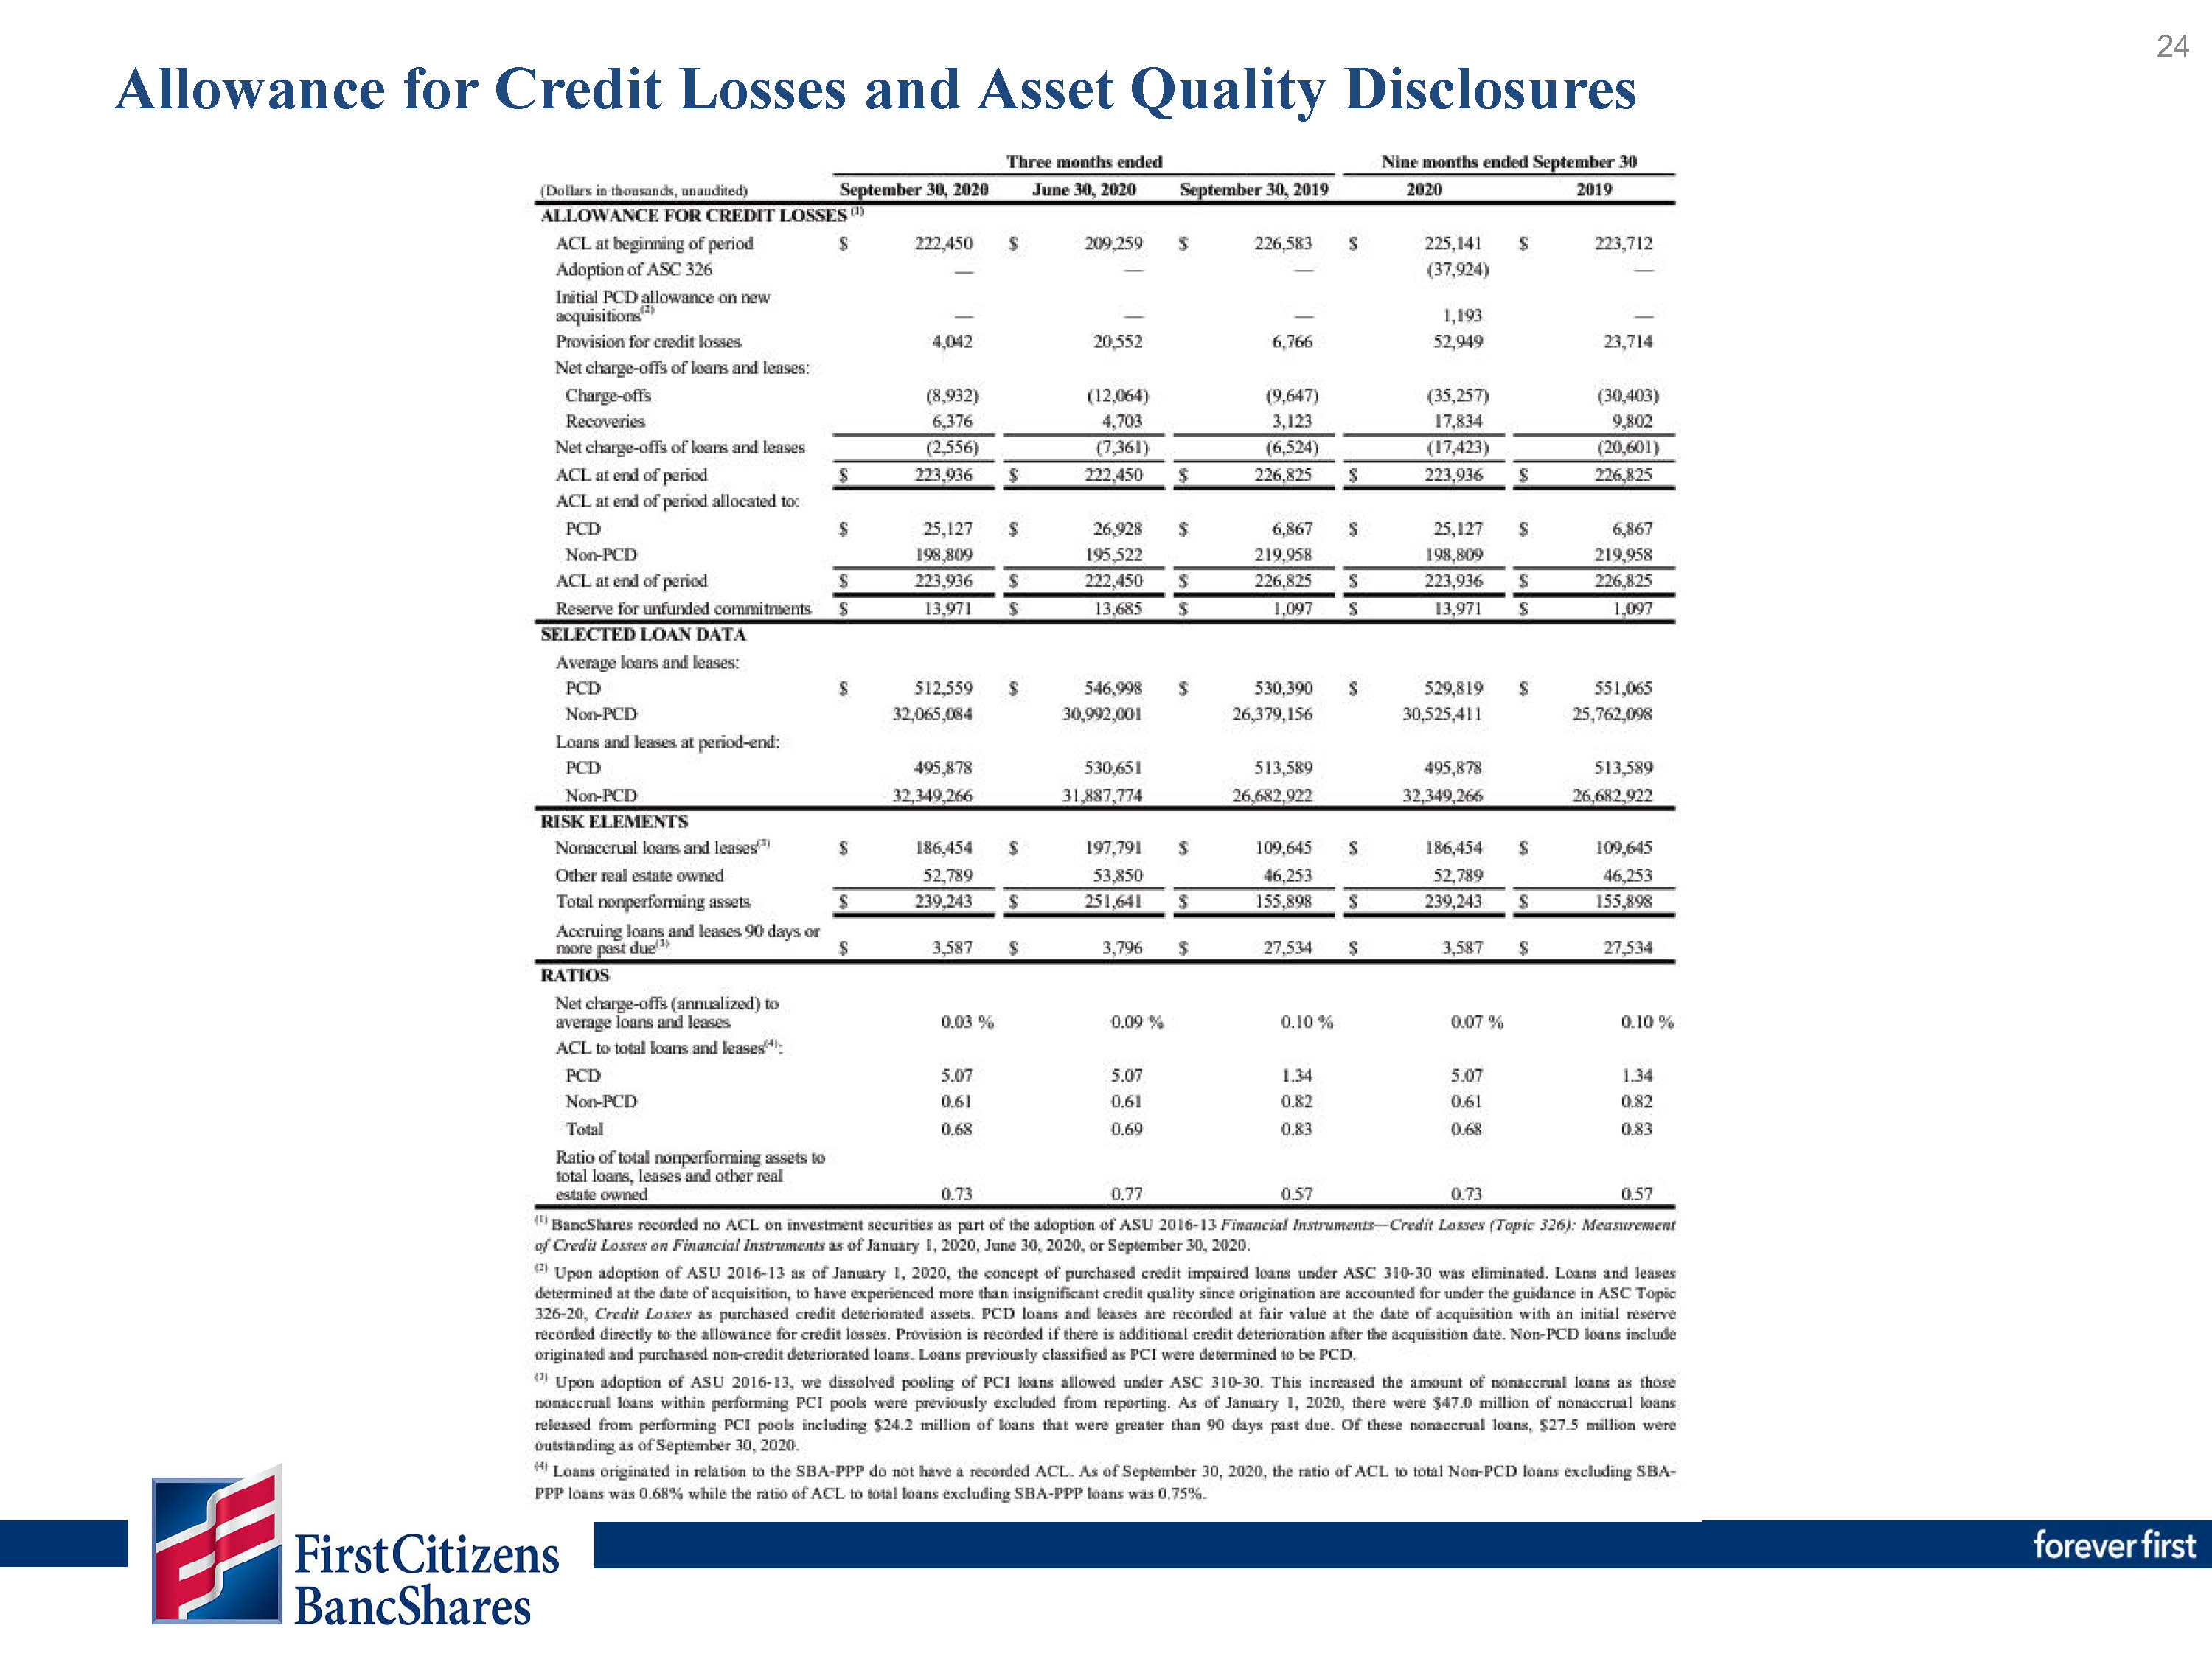
ALLOWANCE FOR CREDIT LOSSES AND ASSET QUALITY DISCLOSURES
|
Three months ended
|
Nine months ended September 30
|
||||||||||||||||||
|
(Dollars in thousands, unaudited)
|
September 30, 2020
|
June 30, 2020
|
September 30, 2019
|
2020
|
2019
|
||||||||||||||
|
ALLOWANCE FOR CREDIT LOSSES (1)
|
|||||||||||||||||||
|
ACL at beginning of period
|
$
|
222,450
|
$
|
209,259
|
$
|
226,583
|
$
|
225,141
|
$
|
223,712
|
|||||||||
|
Adoption of ASC 326
|
—
|
—
|
—
|
(37,924)
|
—
|
||||||||||||||
|
Initial PCD allowance on new acquisitions(2)
|
—
|
—
|
—
|
1,193
|
—
|
||||||||||||||
|
Provision for credit losses
|
4,042
|
20,552
|
6,766
|
52,949
|
23,714
|
||||||||||||||
|
Net charge-offs of loans and leases:
|
|||||||||||||||||||
|
Charge-offs
|
(8,932)
|
(12,064)
|
(9,647)
|
(35,257)
|
(30,403)
|
||||||||||||||
|
Recoveries
|
6,376
|
4,703
|
3,123
|
17,834
|
9,802
|
||||||||||||||
|
Net charge-offs of loans and leases
|
(2,556)
|
(7,361)
|
(6,524)
|
(17,423)
|
(20,601)
|
||||||||||||||
|
ACL at end of period
|
$
|
223,936
|
$
|
222,450
|
$
|
226,825
|
$
|
223,936
|
$
|
226,825
|
|||||||||
|
ACL at end of period allocated to:
|
|||||||||||||||||||
|
PCD
|
$
|
25,127
|
$
|
26,928
|
$
|
6,867
|
$
|
25,127
|
$
|
6,867
|
|||||||||
|
Non-PCD
|
198,809
|
195,522
|
219,958
|
198,809
|
219,958
|
||||||||||||||
|
ACL at end of period
|
$
|
223,936
|
$
|
222,450
|
$
|
226,825
|
$
|
223,936
|
$
|
226,825
|
|||||||||
|
Reserve for unfunded commitments
|
$
|
13,971
|
$
|
13,685
|
$
|
1,097
|
$
|
13,971
|
$
|
1,097
|
|||||||||
|
SELECTED LOAN DATA
|
|||||||||||||||||||
|
Average loans and leases:
|
|||||||||||||||||||
|
PCD
|
$
|
512,559
|
$
|
546,998
|
$
|
530,390
|
$
|
529,819
|
$
|
551,065
|
|||||||||
|
Non-PCD
|
32,065,084
|
30,992,001
|
26,379,156
|
30,525,411
|
25,762,098
|
||||||||||||||
|
Loans and leases at period-end:
|
|||||||||||||||||||
|
PCD
|
495,878
|
530,651
|
513,589
|
495,878
|
513,589
|
||||||||||||||
|
Non-PCD
|
32,349,266
|
31,887,774
|
26,682,922
|
32,349,266
|
26,682,922
|
||||||||||||||
|
RISK ELEMENTS
|
|||||||||||||||||||
|
Nonaccrual loans and leases(3)
|
$
|
186,454
|
$
|
197,791
|
$
|
109,645
|
$
|
186,454
|
$
|
109,645
|
|||||||||
|
Other real estate owned
|
52,789
|
53,850
|
46,253
|
52,789
|
46,253
|
||||||||||||||
|
Total nonperforming assets
|
$
|
239,243
|
$
|
251,641
|
$
|
155,898
|
$
|
239,243
|
$
|
155,898
|
|||||||||
|
Accruing loans and leases 90 days or more past due(3)
|
$
|
3,587
|
$
|
3,796
|
$
|
27,534
|
$
|
3,587
|
$
|
27,534
|
|||||||||
|
RATIOS
|
|||||||||||||||||||
|
Net charge-offs (annualized) to average loans and leases
|
0.03
|
%
|
0.09
|
%
|
0.10
|
%
|
0.07
|
%
|
0.10
|
%
|
|||||||||
|
ACL to total loans and leases(4):
|
|||||||||||||||||||
|
PCD
|
5.07
|
5.07
|
1.34
|
5.07
|
1.34
|
||||||||||||||
|
Non-PCD
|
0.61
|
0.61
|
0.82
|
0.61
|
0.82
|
||||||||||||||
|
Total
|
0.68
|
0.69
|
0.83
|
0.68
|
0.83
|
||||||||||||||
|
Ratio of total nonperforming assets to total loans, leases and other real estate owned
|
0.73
|
0.77
|
0.57
|
0.73
|
0.57
|
||||||||||||||
(1) BancShares recorded no ACL on investment securities as part of the
adoption of ASU 2016-13 Financial Instruments—Credit Losses (Topic 326): Measurement of Credit Losses on Financial Instruments as of January 1,
2020, June 30, 2020, or September 30, 2020.
(2) Upon adoption of ASU 2016-13 as of January 1, 2020, the concept of
purchased credit impaired loans under ASC 310-30 was eliminated. Loans and leases determined at the date of acquisition, to have experienced more than insignificant credit quality since origination are accounted for under the guidance in ASC Topic
326-20, Credit Losses as purchased
credit deteriorated assets. PCD loans and leases are recorded at fair value at the date of acquisition with an initial reserve recorded directly to the allowance for credit losses. Provision is recorded if there is additional credit deterioration
after the acquisition date. Non-PCD loans include originated and purchased non-credit deteriorated loans. Loans previously classified as PCI were determined to be PCD.
(3) Upon adoption of ASU 2016-13, we dissolved pooling of PCI loans
allowed under ASC 310-30. This increased the amount of nonaccrual loans as those nonaccrual loans within performing PCI pools were previously excluded from reporting. As of January 1, 2020, there were $47.0 million of nonaccrual loans released from
performing PCI pools including $24.2 million of loans that were greater than 90 days past due. Of these nonaccrual loans, $27.5 million were outstanding as of September 30, 2020.
(4) Loans originated in relation to the SBA-PPP do not have a recorded
ACL. As of September 30, 2020, the ratio of ACL to total Non-PCD loans excluding SBA-PPP loans was 0.68% while the ratio of ACL to total loans excluding SBA-PPP loans was 0.75%.
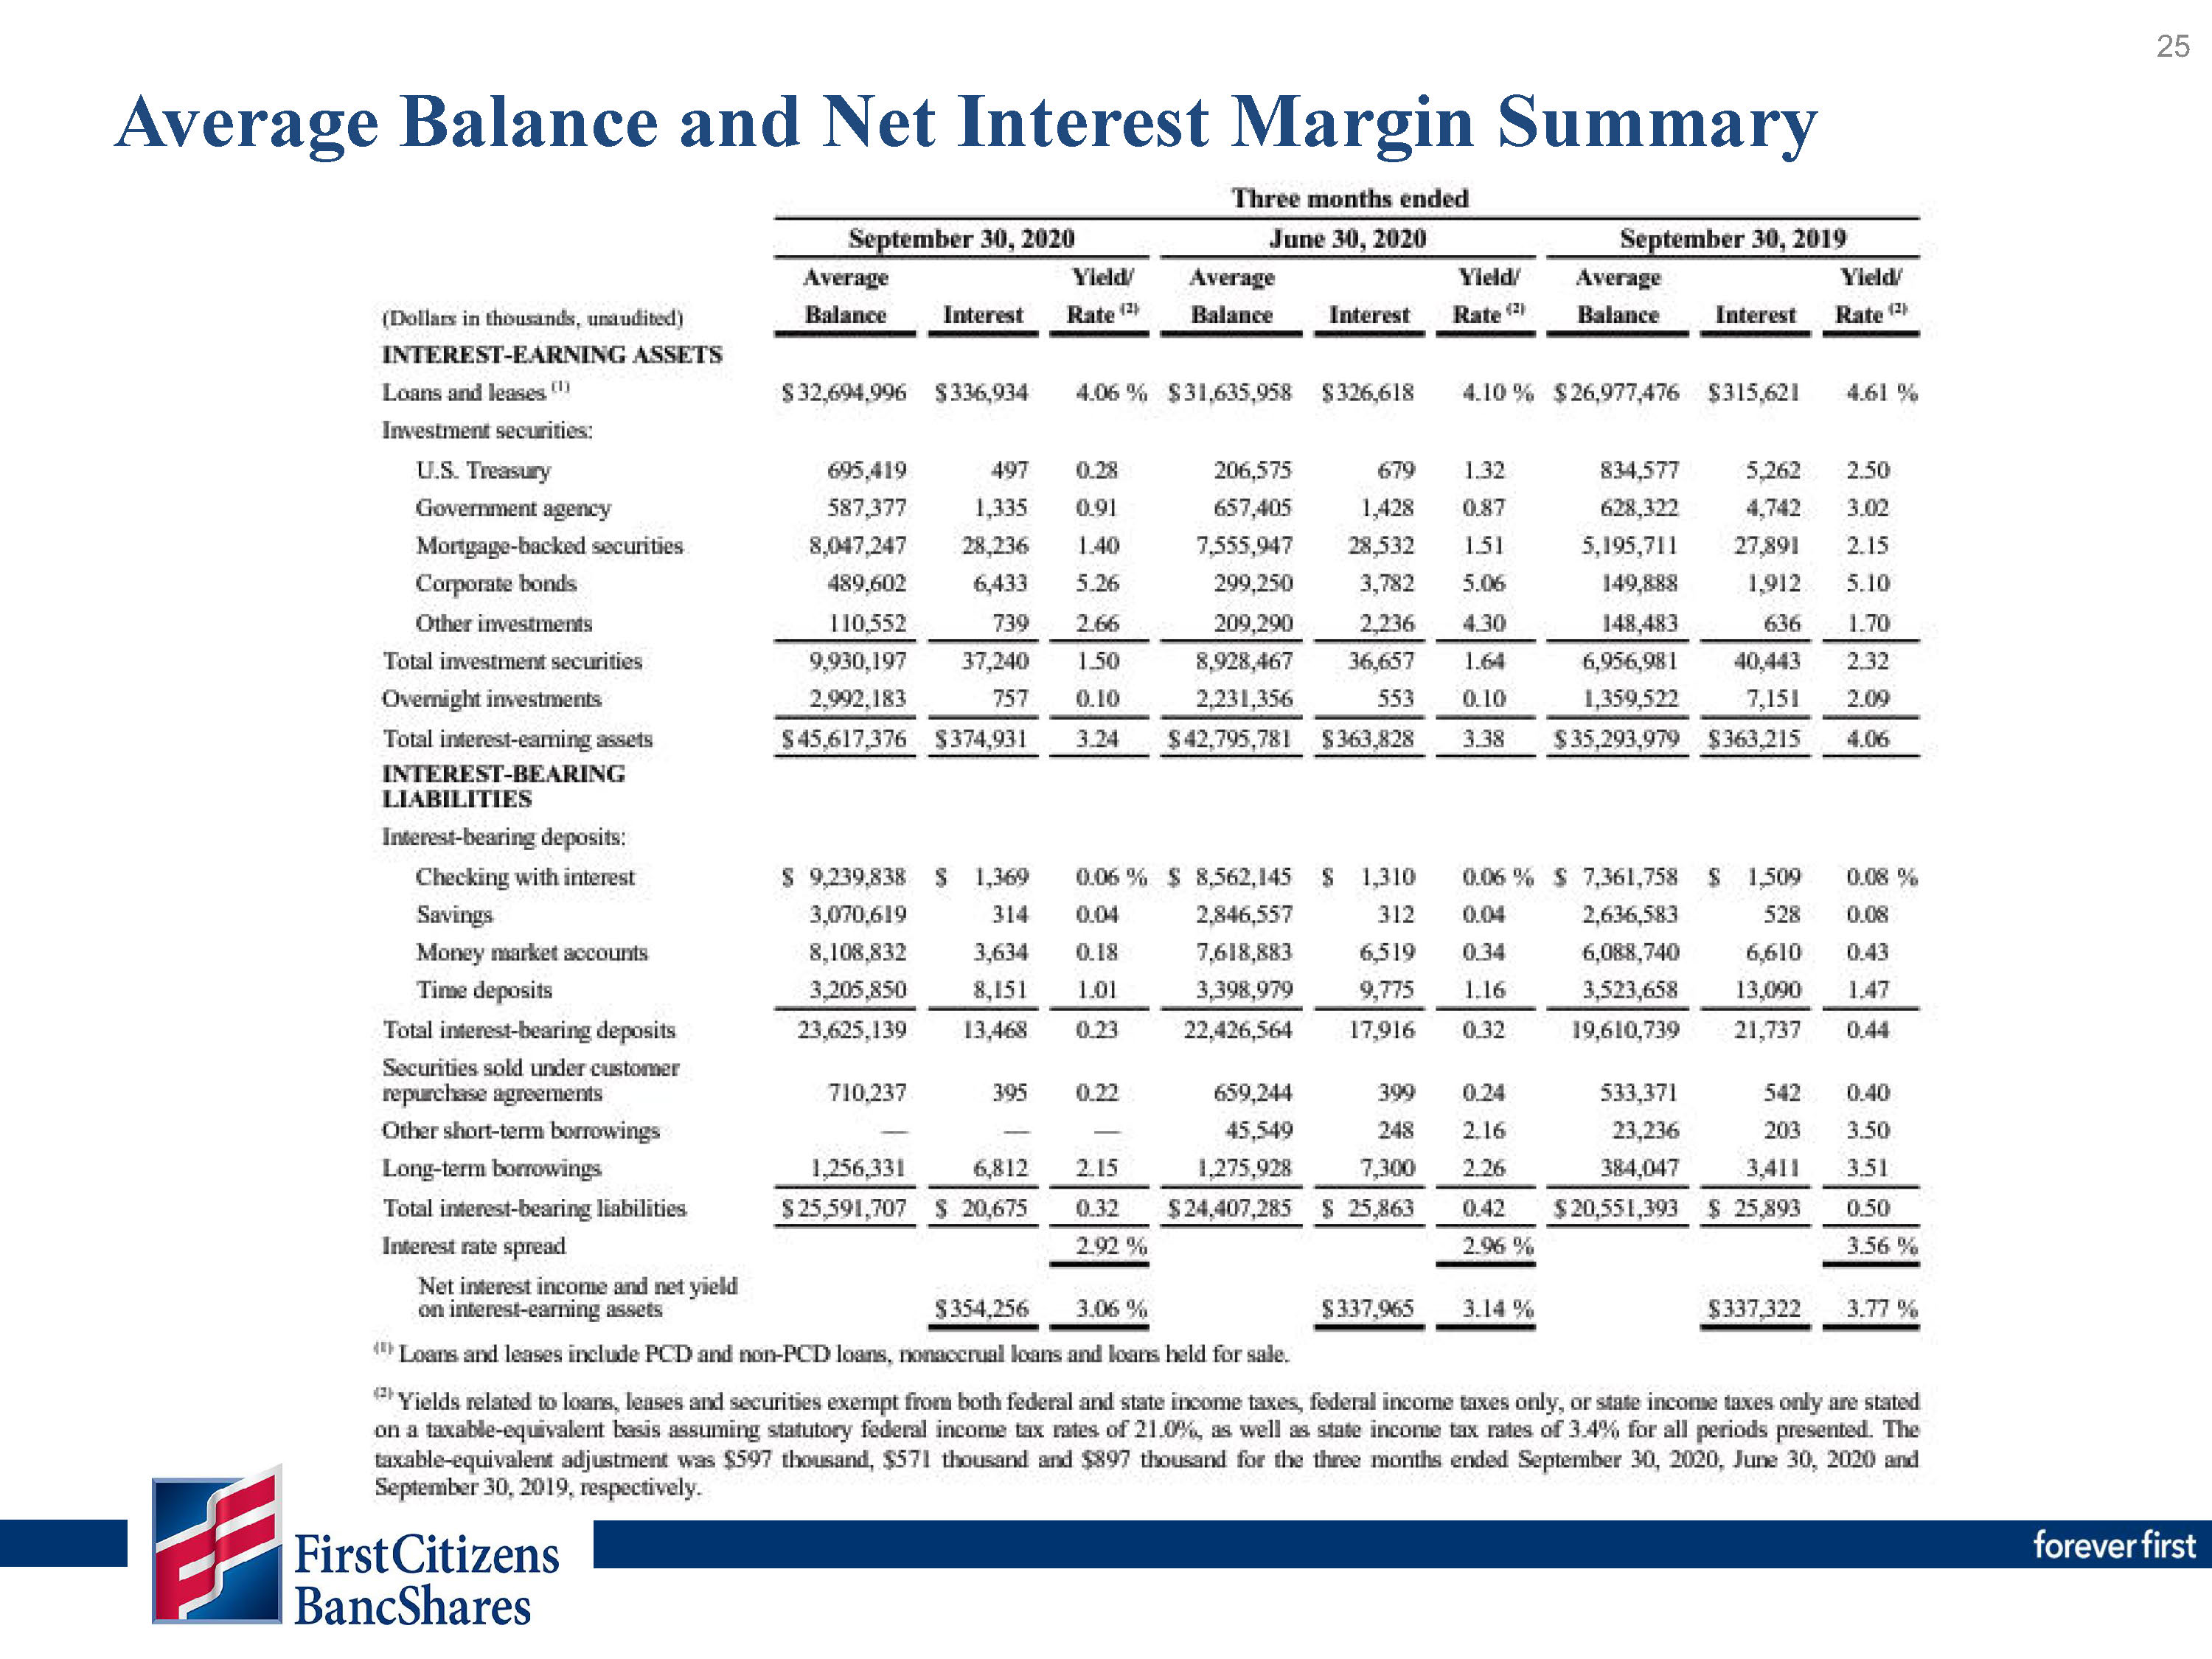
AVERAGE BALANCE AND NET INTEREST MARGIN SUMMARY
|
Three months ended
|
||||||||||||||||||||||||||||||||
|
September 30, 2020
|
June 30, 2020
|
September 30, 2019
|
||||||||||||||||||||||||||||||
|
Average
|
Yield/
|
Average
|
Yield/
|
Average
|
Yield/
|
|||||||||||||||||||||||||||
|
(Dollars in thousands, unaudited)
|
Balance
|
Interest
|
Rate (2)
|
Balance
|
Interest
|
Rate (2)
|
Balance
|
Interest
|
Rate (2)
|
|||||||||||||||||||||||
|
INTEREST-EARNING ASSETS
|
||||||||||||||||||||||||||||||||
|
Loans and leases (1)
|
$
|
32,694,996
|
$
|
336,934
|
4.06
|
%
|
$
|
31,635,958
|
$
|
326,618
|
4.10
|
%
|
$
|
26,977,476
|
$
|
315,621
|
4.61
|
%
|
||||||||||||||
|
Investment securities:
|
||||||||||||||||||||||||||||||||
|
U.S. Treasury
|
695,419
|
497
|
0.28
|
206,575
|
679
|
1.32
|
834,577
|
5,262
|
2.50
|
|||||||||||||||||||||||
|
Government agency
|
587,377
|
1,335
|
0.91
|
657,405
|
1,428
|
0.87
|
628,322
|
4,742
|
3.02
|
|||||||||||||||||||||||
|
Mortgage-backed securities
|
8,047,247
|
28,236
|
1.40
|
7,555,947
|
28,532
|
1.51
|
5,195,711
|
27,891
|
2.15
|
|||||||||||||||||||||||
|
Corporate bonds
|
489,602
|
6,433
|
5.26
|
299,250
|
3,782
|
5.06
|
149,888
|
1,912
|
5.10
|
|||||||||||||||||||||||
|
Other investments
|
110,552
|
739
|
2.66
|
209,290
|
2,236
|
4.30
|
148,483
|
636
|
1.70
|
|||||||||||||||||||||||
|
Total investment securities
|
9,930,197
|
37,240
|
1.50
|
8,928,467
|
36,657
|
1.64
|
6,956,981
|
40,443
|
2.32
|
|||||||||||||||||||||||
|
Overnight investments
|
2,992,183
|
757
|
0.10
|
2,231,356
|
553
|
0.10
|
1,359,522
|
7,151
|
2.09
|
|||||||||||||||||||||||
|
Total interest-earning assets
|
$
|
45,617,376
|
$
|
374,931
|
3.24
|
$
|
42,795,781
|
$
|
363,828
|
3.38
|
$
|
35,293,979
|
$
|
363,215
|
4.06
|
|||||||||||||||||
|
INTEREST-BEARING LIABILITIES
|
||||||||||||||||||||||||||||||||
|
Interest-bearing deposits:
|
||||||||||||||||||||||||||||||||
|
Checking with interest
|
$
|
9,239,838
|
$
|
1,369
|
0.06
|
%
|
$
|
8,562,145
|
$
|
1,310
|
0.06
|
%
|
$
|
7,361,758
|
$
|
1,509
|
0.08
|
%
|
||||||||||||||
|
Savings
|
3,070,619
|
314
|
0.04
|
2,846,557
|
312
|
0.04
|
2,636,583
|
528
|
0.08
|
|||||||||||||||||||||||
|
Money market accounts
|
8,108,832
|
3,634
|
0.18
|
7,618,883
|
6,519
|
0.34
|
6,088,740
|
6,610
|
0.43
|
|||||||||||||||||||||||
|
Time deposits
|
3,205,850
|
8,151
|
1.01
|
3,398,979
|
9,775
|
1.16
|
3,523,658
|
13,090
|
1.47
|
|||||||||||||||||||||||
|
Total interest-bearing deposits
|
23,625,139
|
13,468
|
0.23
|
22,426,564
|
17,916
|
0.32
|
19,610,739
|
21,737
|
0.44
|
|||||||||||||||||||||||
|
Securities sold under customer repurchase agreements
|
710,237
|
395
|
0.22
|
659,244
|
399
|
0.24
|
533,371
|
542
|
0.40
|
|||||||||||||||||||||||
|
Other short-term borrowings
|
—
|
—
|
—
|
45,549
|
248
|
2.16
|
23,236
|
203
|
3.50
|
|||||||||||||||||||||||
|
Long-term borrowings
|
1,256,331
|
6,812
|
2.15
|
1,275,928
|
7,300
|
2.26
|
384,047
|
3,411
|
3.51
|
|||||||||||||||||||||||
|
Total interest-bearing liabilities
|
$
|
25,591,707
|
$
|
20,675
|
0.32
|
$
|
24,407,285
|
$
|
25,863
|
0.42
|
$
|
20,551,393
|
$
|
25,893
|
0.50
|
|||||||||||||||||
|
Interest rate spread
|
2.92
|
%
|
2.96
|
%
|
3.56
|
%
|
||||||||||||||||||||||||||
|
Net interest income and net yield on interest-earning assets
|
$
|
354,256
|
3.06
|
%
|
$
|
337,965
|
3.14
|
%
|
$
|
337,322
|
3.77
|
%
|
||||||||||||||||||||
(1) Loans and leases include PCD and non-PCD loans, nonaccrual loans and
loans held for sale.
(2) Yields related to loans, leases and securities exempt from both
federal and state income taxes, federal income taxes only, or state income taxes only are stated on a taxable-equivalent basis assuming statutory federal income tax rates of 21.0%, as well as state income tax rates of 3.4% for all periods
presented. The taxable-equivalent adjustment was $597 thousand, $571 thousand and $897 thousand for the three months ended September 30, 2020, June 30, 2020 and September 30, 2019, respectively.