MFS SERIES TRUST II N-CSR
UNITED STATES
SECURITIES AND EXCHANGE COMMISSION
Washington, D.C. 20549
FORM N-CSR
CERTIFIED SHAREHOLDER REPORT OF
REGISTERED MANAGEMENT INVESTMENT COMPANIES
Investment Company Act file number 811-04775
MFS SERIES TRUST II
(Exact name of registrant as specified in charter)
111 Huntington Avenue, Boston, Massachusetts 02199
(Address of principal executive offices) (Zip code)
Christopher R. Bohane
Massachusetts Financial Services Company
111 Huntington Avenue
Boston, Massachusetts 02199
(Name and address of agents for service)
Registrant’s telephone number, including area code: (617) 954-5000
Date of fiscal year end: November 30
Date of reporting
period: November 30, 2021
| ITEM 1. |
REPORTS TO STOCKHOLDERS. |
Item 1(a):
Annual Report
November 30, 2021
|
1
|
|
2
|
|
3
|
|
6
|
|
9
|
|
11
|
|
15
|
|
17
|
|
18
|
|
19
|
|
26
|
|
38
|
|
40
|
|
44
|
|
48
|
|
48
|
|
48
|
|
48
|
|
48
|
|
49
|
The
report is prepared for the general information of shareholders. It is authorized for distribution to prospective investors only when preceded or accompanied by a current prospectus.
NOT FDIC INSURED • MAY LOSE VALUE
• NO BANK GUARANTEE
LETTER FROM THE CEO
Dear Shareholders:
After experiencing dramatic swings in the early days of the
coronavirus pandemic, global equity markets have performed strongly over the past year. Though the speedy development of vaccines brightened the economic and market outlook, uncertainty remains as variants of the virus appear, the effectiveness of
vaccines appears to wane over time, and their uneven distribution impacts the developing world.
After having taken aggressive steps to
cushion the economic and market fallout related to the virus, some global central banks have begun to recalibrate monetary policy. For example, the U.S. Federal Reserve has begun to taper its bond buying, which has pushed up Treasury yields,
particularly on the short end of the yield curve. Fiscal stimulus has been abundant as the U.S. Congress passed a $1.9 trillion COVID-19 relief bill in March and a $1.1 trillion infrastructure bill in November. Along with the high levels of
government spending, production and transportation bottlenecks and labor shortages stemming from the pandemic have fueled a rise in inflation.
Since midyear, global economic growth has moderated, with the
spread of the Delta and Omicron variants of the coronavirus and a regulatory crackdown in China featuring prominently. Stress in China’s property development sector has contributed to a slowdown there. Tightening global energy and raw
materials supplies are a further concern for investors.
The policy measures put in place to counteract the
pandemic’s effects have helped build a supportive environment and are encouraging economic recovery; however, if markets disconnect from fundamentals, they can sow the seeds of instability. As such, recent dramatic increases in speculative
trading in cryptocurrencies, special purpose acquisition companies (SPACs), and the like bear watching.
In the aftermath of the crisis, we could see societal changes
as households, businesses, and governments adjust to a new reality, and any such alterations could affect the investment landscape. For investors, events such as the COVID-19 outbreak demonstrate the importance of having a deep understanding of
company fundamentals, and we have built our global research platform to do just that.
At MFS®, we put our clients’ assets to work responsibly by carefully navigating the increasing complexity of global markets and economies. Guided by our commitment to long-term
investing, we tune out the noise and aim to uncover what we believe are the best, most durable investment opportunities in the market. Our unique global investment platform combines collective expertise, long-term discipline, and thoughtful risk
management to create sustainable value for investors over time.
Respectfully,
Michael W.
Roberge
Chief Executive Officer
MFS Investment Management
January 14, 2022
The opinions expressed in this letter are subject to change and
may not be relied upon for investment advice. No forecasts can be guaranteed.
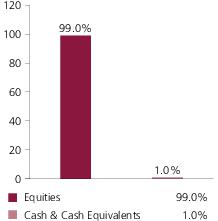
Top ten holdings
| Microsoft
Corp. |
11.5%
|
| Amazon.com,
Inc. |
7.7%
|
| Alphabet,
Inc., “A” |
5.8%
|
| Adobe
Systems, Inc. |
4.5%
|
| Apple,
Inc. |
4.1%
|
| NVIDIA
Corp. |
3.8%
|
| Intuit,
Inc. |
2.9%
|
| Meta
Platforms, Inc., “A” |
2.8%
|
| MasterCard,
Inc., “A” |
2.5%
|
| Danaher
Corp. |
2.3%
|
GICS equity sectors (g)
| Information
Technology |
43.3%
|
| Communication
Services |
16.3%
|
| Consumer
Discretionary |
11.2%
|
| Health
Care |
11.1%
|
| Industrials
|
7.0%
|
| Financials
|
3.8%
|
| Materials
|
3.1%
|
| Consumer
Staples |
2.2%
|
| Real
Estate |
1.0%
|
| (g)
|
The
Global Industry Classification Standard (GICS®) was developed by and/or is the exclusive property of MSCI, Inc. and S&P Global Market Intelligence Inc. (“S&P
Global Market Intelligence”). GICS is a service mark of MSCI and S&P Global Market Intelligence and has been licensed for use by MFS. MFS has applied its own internal sector/industry classification methodology for equity securities and
non-equity securities that are unclassified by GICS. |
Cash & Cash Equivalents includes any cash, investments in
money market funds, short-term securities, and other assets less liabilities. Please see the Statement of Assets and Liabilities for additional information related to the fund’s cash position and other assets and liabilities.
Percentages are based on net assets as of November 30,
2021.
The portfolio is actively managed and current
holdings may be different.
Management Review
Summary of Results
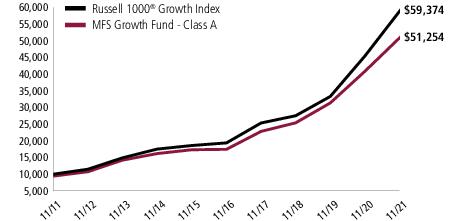
For the twelve months ended November 30, 2021, Class A shares
of the MFS Growth Fund (fund) provided a total return of 25.49%, at net asset value. This compares with a return of 30.70% for the fund’s benchmark, the Russell 1000®
Growth Index.
Market Environment
Over the past year, the global economy was buffeted by an array
of crosscurrents as it adjusted to the ebbs and flows of the pandemic. Among the supportive currents were ample fiscal stimulus, loose monetary policy and the rollout of several highly effective coronavirus vaccines. Negative currents included the
rapid spread of several coronavirus variants, widespread global production bottlenecks and a surge in inflation. After experiencing a burst of exceptionally strong economic activity as the global economy began to reopen, growth slowed lately as
shortages of raw materials, labor, intermediate goods and even energy in some countries, disrupted supply chains.
Amid rising inflation, markets anticipated a transition from an
exceptionally accommodative environment to a more mixed monetary landscape ahead. Indeed, several central banks in emerging markets have already tightened policy and the US Federal Reserve reduced the pace of its asset purchases in November.
However, the European Central Bank, the Bank of Japan and the People's Bank of China are expected to maintain accommodative policies. Sovereign bond yields moved modestly higher late in the period amid higher inflation and on expectations of a
tighter Fed but slipped lower as the highly-transmissible Omicron variant began to spread at the end of the period.
A harsher Chinese regulatory environment toward industries such
as online gaming, food delivery and education increased market volatility as has stress in China's highly leveraged property development sector. Trade relations between the United States and China remained quite strained despite a change in
presidential administrations.
Signs of excess investor
enthusiasm continued to be seen in pockets of the market such as “meme stocks” popular with users of online message boards, cryptocurrencies and heavy retail participation in the market for short-dated options.
Detractors from Performance
Security selection in the consumer discretionary sector was a
primary detractor from the fund's performance relative to the Russell 1000® Growth Index. Within this sector, not owning shares of electric vehicle manufacturer Tesla held
back relative results. The share price of Tesla benefited from car sales volume growth that hit an all-time high, a reduction in production cost and favorable pricing for its Model 3 and Y vehicles, all of which helped improve profitability.
Stock selection in the information technology, industrials and
communication services sectors further hindered relative returns. Within the information technology sector, overweight positions in debit and credit transaction processing company Mastercard, software services provider Autodesk and digital payment
technology developer PayPal, and the fund's underweight position in personal electronics maker Apple, weighed on relative returns. The share price of Mastercard suffered from higher-than-anticipated operating expenses focused on strategic
priorities. Within the industrials sector, an
Management Review -
continued
overweight position in commercial real estate analytics provider CoStar Group,
and the fund's holdings of analytics services provider Clarivate(b) (United Kingdom), dampened relative performance. The share price of CoStar declined after the company reduced its earnings guidance growth and announced that it had reached an
agreement to acquire homes.com. Additionally, its shares suffered from near-term moderation in Apartments.com revenue growth as rental occupancy rates reached multi-decade highs in the United States. Within the communication services sector, the
timing of the fund's ownership in shares of video game maker Activision Blizzard, and its overweight position in cable services provider Charter Communications, weakened relative returns. The stock price of Activision Blizzard fell due to pending
litigation and the departure of the company's president. The company also suffered from delays of its Overwatch 2 and Diablo IV projects, caused by higher-than-anticipated staff turnover.
Elsewhere, the fund's overweight position in global consumer
products company Colgate-Palmolive Company further detracted from relative returns.
Contributors to Performance
An underweight position in the consumer staples sector
benefited relative performance. Within this sector, not holding shares of beverage maker Coca-Cola supported relative returns. The share price of Coca-Cola suffered from inflation within commodity markets, and supply chain pressures that weighed on
outlook expectations.
Security selection in both the
financials and health care sectors also supported relative results. Within the financials sector, an overweight position in index data provider MSCI aided relative returns. The share price of MSCI grew as the company reported better-than-expected
revenue and earnings growth, which reflected strong growth in asset-based fees, higher-than-expected ESG & Climate sales, and a lower-than-expected tax rate. Solid client retention rates and recurring revenue trends also supported the company's
results. Within the health care sector, the timing of the fund's ownership in shares of healthcare equipment manufacturer Danaher, and not owning shares of biotechnology company Amgen, strengthened relative results. The share price of Danaher
benefited from a COVID-19-related revenue boost to its Life Science and Diagnostics division. Danaher’s position as a critical supplier of COVID-19 test systems and vaccine production consumables continued to benefit the company.
Stocks in other sectors that supported relative performance
included the fund's overweight positions in financial management solutions provider Intuit, technology company Alphabet, software company Adobe Systems and semiconductor company Lam Research. The share price of Intuit advanced following the
company's strong results across all key metrics, primarily driven by its Small Business and Credit Karma segments. Management also noted an impressive upside in its Online Ecosystem business, which further helped the stock. The fund's avoidance of
communications platform services provider Zoom Video Communications, and its holdings of ASML(b) (Netherlands), a lithography systems manufacturer for the semiconductor industry, further boosted relative returns.
Respectfully,
Portfolio Manager(s)
Eric Fischman, Paul Gordon, and Bradford Mak
Management Review -
continued
Note to Shareholders: Effective June 30, 2021, Bradford Mak was
added as a Portfolio Manager of the fund.
| (b)
|
Security is not a
benchmark constituent. |
The views
expressed in this report are those of the portfolio manager(s) only through the end of the period of the report as stated on the cover and do not necessarily reflect the views of MFS or any other person in the MFS organization. These views are
subject to change at any time based on market or other conditions, and MFS disclaims any responsibility to update such views. These views may not be relied upon as investment advice or an indication of trading intent on behalf of any MFS portfolio.
References to specific securities are not recommendations of such securities, and may not be representative of any MFS portfolio’s current or future investments.
Performance Summary THROUGH
11/30/21
The following chart illustrates a
representative class of the fund’s historical performance in comparison to its benchmark(s). Performance results include the deduction of the maximum applicable sales charge and reflect the percentage change in net asset value, including
reinvestment of dividends and capital gains distributions. The performance of other share classes will be greater than or less than that of the class depicted below. Benchmarks are unmanaged and may not be invested in directly. Benchmark returns do
not reflect sales charges, commissions or expenses. (See Notes to Performance Summary.)
Performance data shown represents past performance and is no
guarantee of future results. Investment return and principal value fluctuate so your shares, when sold, may be worth more or less than the original cost; current performance may be lower or higher than quoted. The performance shown does not reflect
the deduction of taxes, if any, that a shareholder would pay on fund distributions or the redemption of fund shares.
Growth of a Hypothetical $10,000 Investment
Performance Summary -
continued
Total Returns through 11/30/21
Average annual without sales charge
| Share
Class |
Class
Inception Date |
1-yr
|
5-yr
|
10-yr
|
| A
|
9/13/93
|
25.49%
|
24.05%
|
18.45%
|
| B
|
12/29/86
|
24.55%
|
23.12%
|
17.57%
|
| C
|
4/01/96
|
24.55%
|
23.12%
|
17.56%
|
| I
|
1/02/97
|
25.80%
|
24.35%
|
18.74%
|
| R1
|
4/01/05
|
24.56%
|
23.12%
|
17.56%
|
| R2
|
10/31/03
|
25.17%
|
23.73%
|
18.15%
|
| R3
|
4/01/05
|
25.49%
|
24.04%
|
18.45%
|
| R4
|
4/01/05
|
25.80%
|
24.35%
|
18.75%
|
| R6
|
8/26/11
|
25.93%
|
24.47%
|
18.84%
|
Comparative benchmark(s)
| |
|
|
|
| Russell
1000® Growth Index (f) |
30.70%
|
25.10%
|
19.50%
|
Average annual with sales
charge
| |
|
|
|
A
With Initial Sales Charge (5.75%) |
18.27%
|
22.59%
|
17.75%
|
B
With CDSC (Declining over six years from 4% to 0%) (v) |
20.55%
|
22.95%
|
17.57%
|
C
With CDSC (1% for 12 months) (v) |
23.55%
|
23.12%
|
17.56%
|
CDSC – Contingent Deferred
Sales Charge.
Class I, R1, R2, R3, R4, and R6 shares do
not have a sales charge.
On May 30, 2012, Class W
shares were redesignated Class R5 shares. Total returns for Class R5 shares prior to May 30, 2012 reflect the performance history of Class W shares which had different fees and expenses than Class R5 shares. Effective August 26, 2016, Class R5
shares were renamed Class R6 shares.
| (f)
|
Source:
FactSet Research Systems Inc. |
| (v)
|
Assuming
redemption at the end of the applicable period. |
Benchmark Definition(s)
Russell 1000® Growth Index(h) - constructed to provide a comprehensive barometer for growth securities in the
large-cap segment of the U.S. equity universe. Companies in this index generally have higher price-to-book ratios and higher forecasted growth values.
It is not possible to invest directly in an index.
| (h)
|
Frank
Russell Company (“Russell”) is the source and owner of the trademarks, service marks, and copyrights related to the Russell Indexes. Russell® is a trademark of
Frank Russell Company. Neither Russell nor its licensors accept any liability for any errors or omissions in the Russell Indexes and/or Russell ratings or underlying data and no party may rely on any Russell |
Performance Summary -
continued
Indexes and/or Russell ratings and/or underlying data
contained in this document. No further distribution of Russell Data is permitted without Russell's express written consent. Russell does not promote, sponsor, or endorse the content of this document.
Notes to Performance Summary
Average annual total return represents the average annual
change in value for each share class for the periods presented.
Performance results reflect any applicable expense subsidies
and waivers in effect during the periods shown. Without such subsidies and waivers the fund's performance results would be less favorable. Please see the prospectus and financial statements for complete details.
Performance results do not include adjustments made for
financial reporting purposes in accordance with U.S. generally accepted accounting principles and may differ from amounts reported in the financial highlights.
From time to time the fund may receive proceeds from litigation
settlements, without which performance would be lower.
Expense Table
Fund expenses borne by the shareholders during the period,
June 1, 2021 through November 30, 2021
As a
shareholder of the fund, you incur two types of costs: (1) transaction costs, including sales charges (loads) on certain purchase or redemption payments, and (2) ongoing costs, including management fees; distribution and service (12b-1) fees; and
other fund expenses. This example is intended to help you understand your ongoing costs (in dollars) of investing in the fund and to compare these costs with the ongoing costs of investing in other mutual funds.
The example is based on an investment of $1,000 invested at the
beginning of the period and held for the entire period June 1, 2021 through November 30, 2021.
Actual Expenses
The first line for each share class in the following table
provides information about actual account values and actual expenses. You may use the information in this line, together with the amount you invested, to estimate the expenses that you paid over the period. Simply divide your account value by $1,000
(for example, an $8,600 account value divided by $1,000 = 8.6), then multiply the result by the number in the first line under the heading entitled “Expenses Paid During Period” to estimate the expenses you paid on your account during
this period.
Hypothetical Example for Comparison
Purposes
The second line for each share class in the
following table provides information about hypothetical account values and hypothetical expenses based on the fund’s actual expense ratio and an assumed rate of return of 5% per year before expenses, which is not the fund’s actual
return. The hypothetical account values and expenses may not be used to estimate the actual ending account balance or expenses you paid for the period. You may use this information to compare the ongoing costs of investing in the fund and other
funds. To do so, compare this 5% hypothetical example with the 5% hypothetical examples that appear in the shareholder reports of the other funds.
Please note that the expenses shown in the table are meant to
highlight your ongoing costs only and do not reflect any transactional costs, such as sales charges (loads). Therefore, the second line for each share class in the table is useful in comparing ongoing costs only, and will not help you determine the
relative total costs of owning different funds. In addition, if these transactional costs were included, your costs would have been higher.
Expense Table -
continued
Share
Class |
|
Annualized
Expense
Ratio |
Beginning
Account Value
6/01/21 |
Ending
Account Value
11/30/21 |
Expenses
Paid During
Period (p)
6/01/21-11/30/21 |
| A
|
Actual
|
0.83%
|
$1,000.00
|
$1,133.78
|
$4.44
|
| Hypothetical(h)
|
0.83%
|
$1,000.00
|
$1,020.91
|
$4.20
|
| B
|
Actual
|
1.58%
|
$1,000.00
|
$1,129.54
|
$8.43
|
| Hypothetical(h)
|
1.58%
|
$1,000.00
|
$1,017.15
|
$7.99
|
| C
|
Actual
|
1.58%
|
$1,000.00
|
$1,129.55
|
$8.43
|
| Hypothetical(h)
|
1.58%
|
$1,000.00
|
$1,017.15
|
$7.99
|
| I
|
Actual
|
0.58%
|
$1,000.00
|
$1,135.18
|
$3.10
|
| Hypothetical(h)
|
0.58%
|
$1,000.00
|
$1,022.16
|
$2.94
|
| R1
|
Actual
|
1.58%
|
$1,000.00
|
$1,129.59
|
$8.43
|
| Hypothetical(h)
|
1.58%
|
$1,000.00
|
$1,017.15
|
$7.99
|
| R2
|
Actual
|
1.08%
|
$1,000.00
|
$1,132.34
|
$5.77
|
| Hypothetical(h)
|
1.08%
|
$1,000.00
|
$1,019.65
|
$5.47
|
| R3
|
Actual
|
0.83%
|
$1,000.00
|
$1,133.78
|
$4.44
|
| Hypothetical
(h) |
0.83%
|
$1,000.00
|
$1,020.91
|
$4.20
|
| R4
|
Actual
|
0.58%
|
$1,000.00
|
$1,135.23
|
$3.10
|
| Hypothetical
(h) |
0.58%
|
$1,000.00
|
$1,022.16
|
$2.94
|
| R6
|
Actual
|
0.47%
|
$1,000.00
|
$1,135.82
|
$2.52
|
| Hypothetical
(h) |
0.47%
|
$1,000.00
|
$1,022.71
|
$2.38
|
| (h)
|
5% class return per year
before expenses. |
| (p)
|
“Expenses
Paid During Period” are equal to each class’s annualized expense ratio, as shown above, multiplied by the average account value over the period, multiplied by 183/365 (to reflect the one-half year period). Expenses paid do not
include any applicable sales charges (loads). If these transaction costs had been included, your costs would have been higher. |
Portfolio of
Investments
11/30/21
The Portfolio of Investments is a complete list of all
securities owned by your fund. It is categorized by broad-based asset classes.
| Issuer
|
|
|
Shares/Par
|
Value
($) |
| Common
Stocks – 99.0% |
| Apparel
Manufacturers – 0.9% |
|
| NIKE,
Inc., “B” |
|
2,647,820 |
$
448,117,057 |
| Biotechnology
– 0.6% |
|
| Alnylam
Pharmaceuticals, Inc. (a) |
|
527,419 |
$
96,939,612 |
| Vertex
Pharmaceuticals, Inc. (a) |
|
1,110,210 |
207,542,658 |
| |
|
|
|
$304,482,270 |
| Broadcasting
– 1.6% |
|
| Netflix,
Inc. (a) |
|
1,173,617 |
$
753,344,752 |
| Brokerage
& Asset Managers – 1.3% |
|
| Charles
Schwab Corp. |
|
6,503,233 |
$
503,285,202 |
| CME
Group, Inc. |
|
553,002 |
121,948,001 |
| |
|
|
|
$625,233,203 |
| Business
Services – 6.9% |
|
| Clarivate
PLC (a) |
|
10,666,360 |
$
248,952,842 |
| CoStar
Group, Inc. (a) |
|
4,158,929 |
323,398,319 |
| Equifax,
Inc. |
|
1,367,409 |
381,028,518 |
| MSCI,
Inc. |
|
1,468,341 |
924,247,243 |
| PayPal
Holdings, Inc. (a) |
|
4,090,180 |
756,233,380 |
| Verisk
Analytics, Inc., “A” |
|
3,129,244 |
703,673,098 |
| |
|
|
|
$3,337,533,400 |
| Cable
TV – 1.1% |
|
| Charter
Communications, Inc., “A” (a) |
|
805,856 |
$
520,808,616 |
| Computer
Software – 23.5% |
|
| Adobe
Systems, Inc. (a) |
|
3,210,551 |
$
2,150,587,587 |
| Atlassian
Corp. PLC, “A” (a) |
|
687,822 |
258,841,175 |
| Autodesk,
Inc. (a) |
|
2,010,959 |
511,165,668 |
| Black
Knight, Inc. (a) |
|
1,402,528 |
100,238,676 |
| Bumble,
Inc., “A” (a) |
|
1,555,332 |
53,285,674 |
| Cadence
Design Systems, Inc. (a) |
|
2,062,342 |
365,983,211 |
| Intuit,
Inc. |
|
2,125,868 |
1,386,703,697 |
| Microsoft
Corp. |
|
16,771,338 |
5,544,436,630 |
| salesforce.com,
inc. (a) |
|
2,397,679 |
683,242,608 |
| Synopsys,
Inc. (a) |
|
818,802 |
279,211,482 |
| |
|
|
|
$
11,333,696,408 |
Portfolio of
Investments – continued
| Issuer
|
|
|
Shares/Par
|
Value
($) |
| Common
Stocks – continued |
| Computer
Software - Systems – 7.6% |
|
| Apple,
Inc. |
|
11,982,211 |
$
1,980,659,478 |
| ServiceNow,
Inc. (a) |
|
895,085 |
579,746,554 |
| Shopify,
Inc. (a) |
|
156,062 |
237,493,591 |
| Square,
Inc., “A” (a) |
|
2,136,157 |
445,025,588 |
| TransUnion
|
|
3,922,908 |
436,188,141 |
| |
|
|
|
$3,679,113,352 |
| Construction
– 3.0% |
|
| Sherwin-Williams
Co. |
|
2,416,806 |
$
800,542,820 |
| Vulcan
Materials Co. |
|
3,284,833 |
629,505,396 |
| |
|
|
|
$1,430,048,216 |
| Consumer
Products – 2.2% |
|
| Colgate-Palmolive
Co. |
|
4,837,859 |
$
362,936,182 |
| Estee
Lauder Cos., Inc., “A” |
|
2,026,591 |
672,970,073 |
| |
|
|
|
$1,035,906,255 |
| Consumer
Services – 0.4% |
|
| Airbnb,
Inc., “A” (a) |
|
65,844 |
$
11,360,724 |
| Uber
Technologies, Inc. (a) |
|
4,795,391 |
182,224,858 |
| |
|
|
|
$193,585,582 |
| Electrical
Equipment – 1.4% |
|
| AMETEK,
Inc. |
|
2,978,323 |
$
406,541,089 |
| Johnson
Controls International PLC |
|
3,519,856 |
263,144,435 |
| |
|
|
|
$669,685,524 |
| Electronics
– 7.1% |
|
| Applied
Materials, Inc. |
|
2,450,893 |
$
360,746,941 |
| ASML
Holding N.V., ADR |
|
651,745 |
515,862,685 |
| Lam
Research Corp. |
|
1,080,511 |
734,585,403 |
| NVIDIA
Corp. |
|
5,572,612 |
1,820,906,697 |
| |
|
|
|
$3,432,101,726 |
| Gaming
& Lodging – 0.7% |
|
| Hilton
Worldwide Holdings, Inc. (a) |
|
1,664,724 |
$
224,854,271 |
| MGM
Resorts International |
|
2,553,831 |
101,080,631 |
| |
|
|
|
$325,934,902 |
| General
Merchandise – 0.3% |
|
| Dollar
General Corp. |
|
746,001 |
$
165,090,021 |
| Insurance
– 0.6% |
|
| Aon
PLC |
|
1,022,322 |
$
302,372,178 |
Portfolio of
Investments – continued
| Issuer
|
|
|
Shares/Par
|
Value
($) |
| Common
Stocks – continued |
| Internet
– 11.2% |
|
| Alphabet,
Inc., “A” (a) |
|
984,791 |
$
2,794,787,619 |
| Alphabet,
Inc., “C” (a) |
|
295,749 |
842,600,731 |
| Match
Group, Inc. (a) |
|
3,003,799 |
390,463,832 |
| Meta
Platforms, Inc., “A” (a) |
|
4,208,009 |
1,365,330,600 |
| |
|
|
|
$5,393,182,782 |
| Leisure
& Toys – 1.6% |
|
| Activision
Blizzard, Inc. |
|
2,347,253 |
$
137,549,026 |
| Electronic
Arts, Inc. |
|
2,513,203 |
312,190,077 |
| Roblox
Corp., “A” (a) |
|
1,705,116 |
215,015,127 |
| Take-Two
Interactive Software, Inc. (a) |
|
673,902 |
111,786,864 |
| |
|
|
|
$776,541,094 |
| Machinery
& Tools – 0.5% |
|
| Roper
Technologies, Inc. |
|
543,985 |
$
252,490,638 |
| Medical
& Health Technology & Services – 1.0% |
|
| ICON
PLC (a) |
|
1,732,780 |
$
468,665,007 |
| Medical
Equipment – 8.1% |
|
| Abbott
Laboratories |
|
5,457,739 |
$
686,419,834 |
| Becton,
Dickinson and Co. |
|
499,022 |
118,338,077 |
| Boston
Scientific Corp. (a) |
|
12,891,642 |
490,784,811 |
| Danaher
Corp. |
|
3,522,783 |
1,133,067,924 |
| Edwards
Lifesciences Corp. (a) |
|
3,356,645 |
360,201,575 |
| STERIS
PLC |
|
730,285 |
159,589,181 |
| Thermo
Fisher Scientific, Inc. |
|
1,528,842 |
967,497,083 |
| |
|
|
|
$3,915,898,485 |
| Network
& Telecom – 0.5% |
|
| Equinix,
Inc., REIT |
|
282,417 |
$
229,379,087 |
| Other
Banks & Diversified Financials – 4.5% |
|
| Mastercard,
Inc., “A” |
|
3,809,256 |
$
1,199,610,899 |
| Visa,
Inc., “A” |
|
5,043,158 |
977,212,726 |
| |
|
|
|
$2,176,823,625 |
| Pharmaceuticals
– 1.3% |
|
| Zoetis,
Inc. |
|
2,904,504 |
$
644,916,068 |
| Railroad
& Shipping – 0.4% |
|
| Canadian
Pacific Railway Ltd. |
|
2,521,649 |
$
176,591,079 |
Portfolio of
Investments – continued
| Issuer
|
|
|
Shares/Par
|
Value
($) |
| Common
Stocks – continued |
| Restaurants
– 0.8% |
|
| Chipotle
Mexican Grill, Inc., “A” (a) |
|
154,230 |
$
253,463,124 |
| Starbucks
Corp. |
|
1,240,451 |
136,003,048 |
| |
|
|
|
$389,466,172 |
| Specialty
Chemicals – 0.1% |
|
| Air
Products & Chemicals, Inc. |
|
233,434 |
$
67,098,269 |
| Specialty
Stores – 9.2% |
|
| Amazon.com,
Inc. (a) |
|
1,058,148 |
$
3,710,999,106 |
| Lululemon
Athletica, Inc. (a) |
|
480,349 |
218,275,389 |
| Ross
Stores, Inc. |
|
1,381,726 |
150,732,489 |
| Sea
Ltd., ADR (a) |
|
1,326,537 |
382,135,514 |
| |
|
|
|
$4,462,142,498 |
| Telecommunications
- Wireless – 0.6% |
|
| American
Tower Corp., REIT |
|
1,051,698 |
$
276,049,691 |
| Total
Common Stocks (Identified Cost, $19,839,310,958) |
|
$47,786,297,957
|
| Investment
Companies (h) – 1.0% |
| Money
Market Funds – 1.0% |
|
| MFS
Institutional Money Market Portfolio, 0.05% (v) (Identified Cost, $475,301,472) |
|
|
475,301,471
|
$
475,301,471 |
| |
| |
| Other
Assets, Less Liabilities – 0.0% |
|
13,156,302 |
| Net
Assets – 100.0% |
$48,274,755,730
|
| (a)
|
Non-income
producing security. |
|
|
|
| (h)
|
An
affiliated issuer, which may be considered one in which the fund owns 5% or more of the outstanding voting securities, or a company which is under common control. At period end, the aggregate values of the fund's investments in affiliated issuers
and in unaffiliated issuers were $475,301,471 and $47,786,297,957, respectively. |
|
|
|
| (v)
|
Affiliated
issuer that is available only to investment companies managed by MFS. The rate quoted for the MFS Institutional Money Market Portfolio is the annualized seven-day yield of the fund at period end. |
|
|
|
| The
following abbreviations are used in this report and are defined: |
| ADR
|
American
Depositary Receipt |
| REIT
|
Real
Estate Investment Trust |
See Notes to
Financial Statements
Financial Statements
Statement of Assets and Liabilities
At 11/30/21
This statement represents your fund’s balance sheet,
which details the assets and liabilities comprising the total value of the fund.
| Assets
|
|
| Investments
in unaffiliated issuers, at value (identified cost, $19,839,310,958) |
$47,786,297,957
|
| Investments
in affiliated issuers, at value (identified cost, $475,301,472) |
475,301,471
|
| Cash
|
887
|
| Receivables
for |
|
| Fund
shares sold |
48,859,532
|
| Dividends
|
19,357,621
|
| Total
assets |
$48,329,817,468
|
| Liabilities
|
|
| Payables
for |
|
| Fund
shares reacquired |
$46,857,516
|
| Payable
to affiliates |
|
| Investment
adviser |
1,214,107
|
| Administrative
services fee |
3,167
|
| Shareholder
servicing costs |
5,876,200
|
| Distribution
and service fees |
221,966
|
| Payable
for independent Trustees' compensation |
2,807
|
| Accrued
expenses and other liabilities |
885,975
|
| Total
liabilities |
$55,061,738
|
| Net
assets |
$48,274,755,730
|
| Net
assets consist of |
|
| Paid-in
capital |
$19,266,065,195
|
| Total
distributable earnings (loss) |
29,008,690,535
|
| Net
assets |
$48,274,755,730
|
| Shares
of beneficial interest outstanding |
252,994,765
|
Statement of Assets and
Liabilities – continued
| |
Net
assets |
Shares
outstanding |
Net
asset value
per share (a) |
| Class
A |
$10,189,593,846
|
56,025,888
|
$181.87
|
| Class
B |
134,455,924
|
961,281
|
139.87
|
| Class
C |
789,807,777
|
5,696,780
|
138.64
|
| Class
I |
14,295,870,198
|
72,966,490
|
195.92
|
| Class
R1 |
27,400,486
|
196,833
|
139.21
|
| Class
R2 |
219,795,232
|
1,296,692
|
169.50
|
| Class
R3 |
1,756,755,621
|
9,713,302
|
180.86
|
| Class
R4 |
1,373,778,040
|
7,225,156
|
190.14
|
| Class
R6 |
19,487,298,606
|
98,912,343
|
197.02
|
| (a)
|
Maximum
offering price per share was equal to the net asset value per share for all share classes, except for Class A, for which the maximum offering price per share was $192.97 [100 / 94.25 x $181.87]. On sales of $50,000 or more, the maximum offering
price of Class A shares is reduced. A contingent deferred sales charge may be imposed on redemptions of Class A, Class B, and Class C shares. Redemption price per share was equal to the net asset value per share for Classes I, R1, R2, R3, R4, and
R6. |
See Notes to Financial
Statements
Financial Statements
Statement of Operations
Year ended 11/30/21
This statement describes how much your fund earned in
investment income and accrued in expenses. It also describes any gains and/or losses generated by fund operations.
| Net
investment income (loss) |
|
| Income
|
|
| Dividends
|
$172,127,493
|
| Other
|
585,553
|
| Dividends
from affiliated issuers |
182,033
|
| Income
on securities loaned |
6,092
|
| Foreign
taxes withheld |
(706,820)
|
| Total
investment income |
$172,194,351
|
| Expenses
|
|
| Management
fee |
$209,412,047
|
| Distribution
and service fees |
37,676,581
|
| Shareholder
servicing costs |
28,700,944
|
| Administrative
services fee |
555,625
|
| Independent
Trustees' compensation |
112,772
|
| Custodian
fee |
547,116
|
| Shareholder
communications |
1,374,513
|
| Audit
and tax fees |
74,718
|
| Legal
fees |
227,710
|
| Miscellaneous
|
1,256,455
|
| Total
expenses |
$279,938,481
|
| Fees
paid indirectly |
(58)
|
| Reduction
of expenses by investment adviser and distributor |
(5,493,073)
|
| Net
expenses |
$274,445,350
|
| Net
investment income (loss) |
$(102,250,999)
|
| Realized
and unrealized gain (loss) |
| Realized
gain (loss) (identified cost basis) |
|
| Unaffiliated
issuers |
$1,788,434,829
|
| Affiliated
issuers |
21,155
|
| Net
realized gain (loss) |
$1,788,455,984
|
| Change
in unrealized appreciation or depreciation |
|
| Unaffiliated
issuers |
$8,195,914,843
|
| Affiliated
issuers |
(21,157)
|
| Net
unrealized gain (loss) |
$8,195,893,686
|
| Net
realized and unrealized gain (loss) |
$9,984,349,670
|
| Change
in net assets from operations |
$9,882,098,671
|
See Notes to Financial
Statements
Financial Statements
Statements of Changes in Net Assets
These statements describe the increases and/or decreases in
net assets resulting from operations, any distributions, and any shareholder transactions.
| |
Year
ended |
| |
11/30/21
|
11/30/20
|
| Change
in net assets |
|
|
| From
operations |
|
|
| Net
investment income (loss) |
$(102,250,999)
|
$(46,090,817)
|
| Net
realized gain (loss) |
1,788,455,984
|
1,616,790,853
|
| Net
unrealized gain (loss) |
8,195,893,686
|
6,981,288,967
|
| Change
in net assets from operations |
$9,882,098,671
|
$8,551,989,003
|
| Total
distributions to shareholders |
$(1,530,458,681)
|
$(382,863,384)
|
| Change
in net assets from fund share transactions |
$1,007,526,854
|
$6,044,081,651
|
| Total
change in net assets |
$9,359,166,844
|
$14,213,207,270
|
| Net
assets |
|
|
| At
beginning of period |
38,915,588,886
|
24,702,381,616
|
| At
end of period |
$48,274,755,730
|
$38,915,588,886
|
See Notes to Financial
Statements
Financial
Statements
Financial Highlights
The financial highlights table is intended to help you
understand the fund's financial performance for the past 5 years. Certain information reflects financial results for a single fund share. The total returns in the table represent the rate that an investor would have earned (or lost) on an investment
in the fund share class (assuming reinvestment of all distributions) held for the entire period.
| Class
A |
Year
ended |
| |
11/30/21
|
11/30/20
|
11/30/19
|
11/30/18
|
11/30/17
|
| Net
asset value, beginning of period |
$150.94
|
$117.66
|
$99.45
|
$92.03
|
$71.50
|
| Income
(loss) from investment operations |
| Net
investment income (loss) (d) |
$(0.72)
|
$(0.43)
|
$(0.20)
|
$(0.15)
|
$(0.03)
|
| Net
realized and unrealized gain (loss) |
37.82
|
35.54
|
22.39
|
10.27
|
21.72
|
| Total
from investment operations |
$37.10
|
$35.11
|
$22.19
|
$10.12
|
$21.69
|
| Less
distributions declared to shareholders |
| From
net investment income |
$—
|
$—
|
$—
|
$—
|
$—
|
| From
net realized gain |
(6.17)
|
(1.83)
|
(3.98)
|
(2.70)
|
(1.16)
|
| Total
distributions declared to shareholders |
$(6.17)
|
$(1.83)
|
$(3.98)
|
$(2.70)
|
$(1.16)
|
| Net
asset value, end of period (x) |
$181.87
|
$150.94
|
$117.66
|
$99.45
|
$92.03
|
| Total
return (%) (r)(s)(t)(x) |
25.49
|
30.25
|
23.50
|
11.26
|
30.79
|
Ratios
(%) (to average net assets)
and Supplemental data: |
| Expenses
before expense reductions (f) |
0.84
|
0.87
|
0.91
|
0.92
|
0.96
|
| Expenses
after expense reductions (f) |
0.83
|
0.86
|
0.89
|
0.91
|
0.93
|
| Net
investment income (loss) |
(0.44)
|
(0.33)
|
(0.19)
|
(0.15)
|
(0.04)
|
| Portfolio
turnover |
14
|
27
|
11
|
18
|
21
|
| Net
assets at end of period (000 omitted) |
$10,189,594
|
$8,386,539
|
$6,356,476
|
$5,237,495
|
$4,746,269
|
See Notes to Financial
Statements
Financial
Highlights – continued
| Class
B |
Year
ended |
| |
11/30/21
|
11/30/20
|
11/30/19
|
11/30/18
|
11/30/17
|
| Net
asset value, beginning of period |
$118.32
|
$93.30
|
$80.30
|
$75.36
|
$59.19
|
| Income
(loss) from investment operations |
| Net
investment income (loss) (d) |
$(1.51)
|
$(1.09)
|
$(0.79)
|
$(0.72)
|
$(0.52)
|
| Net
realized and unrealized gain (loss) |
29.23(g)
|
27.94
|
17.77
|
8.36
|
17.85
|
| Total
from investment operations |
$27.72
|
$26.85
|
$16.98
|
$7.64
|
$17.33
|
| Less
distributions declared to shareholders |
| From
net investment income |
$—
|
$—
|
$—
|
$—
|
$—
|
| From
net realized gain |
(6.17)
|
(1.83)
|
(3.98)
|
(2.70)
|
(1.16)
|
| Total
distributions declared to shareholders |
$(6.17)
|
$(1.83)
|
$(3.98)
|
$(2.70)
|
$(1.16)
|
| Net
asset value, end of period (x) |
$139.87
|
$118.32
|
$93.30
|
$80.30
|
$75.36
|
| Total
return (%) (r)(s)(t)(x) |
24.55
|
29.28
|
22.57
|
10.43
|
29.81
|
Ratios
(%) (to average net assets)
and Supplemental data: |
| Expenses
before expense reductions (f) |
1.59
|
1.62
|
1.66
|
1.67
|
1.71
|
| Expenses
after expense reductions (f) |
1.58
|
1.61
|
1.65
|
1.66
|
1.68
|
| Net
investment income (loss) |
(1.19)
|
(1.08)
|
(0.94)
|
(0.90)
|
(0.79)
|
| Portfolio
turnover |
14
|
27
|
11
|
18
|
21
|
| Net
assets at end of period (000 omitted) |
$134,456
|
$144,007
|
$148,633
|
$143,299
|
$140,459
|
| Class
C |
Year
ended |
| |
11/30/21
|
11/30/20
|
11/30/19
|
11/30/18
|
11/30/17
|
| Net
asset value, beginning of period |
$117.33
|
$92.54
|
$79.68
|
$74.80
|
$58.76
|
| Income
(loss) from investment operations |
| Net
investment income (loss) (d) |
$(1.50)
|
$(1.09)
|
$(0.79)
|
$(0.72)
|
$(0.52)
|
| Net
realized and unrealized gain (loss) |
28.98(g)
|
27.71
|
17.63
|
8.30
|
17.72
|
| Total
from investment operations |
$27.48
|
$26.62
|
$16.84
|
$7.58
|
$17.20
|
| Less
distributions declared to shareholders |
| From
net investment income |
$—
|
$—
|
$—
|
$—
|
$—
|
| From
net realized gain |
(6.17)
|
(1.83)
|
(3.98)
|
(2.70)
|
(1.16)
|
| Total
distributions declared to shareholders |
$(6.17)
|
$(1.83)
|
$(3.98)
|
$(2.70)
|
$(1.16)
|
| Net
asset value, end of period (x) |
$138.64
|
$117.33
|
$92.54
|
$79.68
|
$74.80
|
| Total
return (%) (r)(s)(t)(x) |
24.55
|
29.27
|
22.57
|
10.43
|
29.80
|
Ratios
(%) (to average net assets)
and Supplemental data: |
| Expenses
before expense reductions (f) |
1.59
|
1.62
|
1.66
|
1.67
|
1.71
|
| Expenses
after expense reductions (f) |
1.58
|
1.61
|
1.65
|
1.66
|
1.69
|
| Net
investment income (loss) |
(1.19)
|
(1.08)
|
(0.95)
|
(0.91)
|
(0.79)
|
| Portfolio
turnover |
14
|
27
|
11
|
18
|
21
|
| Net
assets at end of period (000 omitted) |
$789,808
|
$782,492
|
$642,321
|
$571,273
|
$645,936
|
See Notes to Financial
Statements
Financial
Highlights – continued
| Class
I |
Year
ended |
| |
11/30/21
|
11/30/20
|
11/30/19
|
11/30/18
|
11/30/17
|
| Net
asset value, beginning of period |
$161.75
|
$125.65
|
$105.67
|
$97.44
|
$75.45
|
| Income
(loss) from investment operations |
| Net
investment income (loss) (d) |
$(0.33)
|
$(0.13)
|
$0.06
|
$0.10
|
$0.19
|
| Net
realized and unrealized gain (loss) |
40.67
|
38.06
|
23.90
|
10.88
|
22.96
|
| Total
from investment operations |
$40.34
|
$37.93
|
$23.96
|
$10.98
|
$23.15
|
| Less
distributions declared to shareholders |
| From
net investment income |
$—
|
$—
|
$—
|
$(0.05)
|
$—
|
| From
net realized gain |
(6.17)
|
(1.83)
|
(3.98)
|
(2.70)
|
(1.16)
|
| Total
distributions declared to shareholders |
$(6.17)
|
$(1.83)
|
$(3.98)
|
$(2.75)
|
$(1.16)
|
| Net
asset value, end of period (x) |
$195.92
|
$161.75
|
$125.65
|
$105.67
|
$97.44
|
| Total
return (%) (r)(s)(t)(x) |
25.80
|
30.57
|
23.80
|
11.53
|
31.12
|
Ratios
(%) (to average net assets)
and Supplemental data: |
| Expenses
before expense reductions (f) |
0.59
|
0.62
|
0.66
|
0.67
|
0.71
|
| Expenses
after expense reductions (f) |
0.58
|
0.61
|
0.65
|
0.67
|
0.69
|
| Net
investment income (loss) |
(0.19)
|
(0.09)
|
0.05
|
0.09
|
0.22
|
| Portfolio
turnover |
14
|
27
|
11
|
18
|
21
|
| Net
assets at end of period (000 omitted) |
$14,295,870
|
$10,792,898
|
$6,082,950
|
$4,281,671
|
$3,461,152
|
See Notes to Financial
Statements
Financial
Highlights – continued
| Class
R1 |
Year
ended |
| |
11/30/21
|
11/30/20
|
11/30/19
|
11/30/18
|
11/30/17
|
| Net
asset value, beginning of period |
$117.78
|
$92.89
|
$79.97
|
$75.07
|
$58.96
|
| Income
(loss) from investment operations |
| Net
investment income (loss) (d) |
$(1.51)
|
$(1.09)
|
$(0.80)
|
$(0.73)
|
$(0.52)
|
| Net
realized and unrealized gain (loss) |
29.11(g)
|
27.81
|
17.70
|
8.33
|
17.79
|
| Total
from investment operations |
$27.60
|
$26.72
|
$16.90
|
$7.60
|
$17.27
|
| Less
distributions declared to shareholders |
| From
net investment income |
$—
|
$—
|
$—
|
$—
|
$—
|
| From
net realized gain |
(6.17)
|
(1.83)
|
(3.98)
|
(2.70)
|
(1.16)
|
| Total
distributions declared to shareholders |
$(6.17)
|
$(1.83)
|
$(3.98)
|
$(2.70)
|
$(1.16)
|
| Net
asset value, end of period (x) |
$139.21
|
$117.78
|
$92.89
|
$79.97
|
$75.07
|
| Total
return (%) (r)(s)(t)(x) |
24.56
|
29.27
|
22.56
|
10.42
|
29.82
|
Ratios
(%) (to average net assets)
and Supplemental data: |
| Expenses
before expense reductions (f) |
1.59
|
1.62
|
1.66
|
1.67
|
1.71
|
| Expenses
after expense reductions (f) |
1.58
|
1.61
|
1.65
|
1.67
|
1.69
|
| Net
investment income (loss) |
(1.19)
|
(1.08)
|
(0.95)
|
(0.91)
|
(0.79)
|
| Portfolio
turnover |
14
|
27
|
11
|
18
|
21
|
| Net
assets at end of period (000 omitted) |
$27,400
|
$26,527
|
$23,888
|
$18,657
|
$16,858
|
| Class
R2 |
Year
ended |
| |
11/30/21
|
11/30/20
|
11/30/19
|
11/30/18
|
11/30/17
|
| Net
asset value, beginning of period |
$141.43
|
$110.63
|
$93.99
|
$87.34
|
$68.08
|
| Income
(loss) from investment operations |
| Net
investment income (loss) (d) |
$(1.06)
|
$(0.71)
|
$(0.44)
|
$(0.38)
|
$(0.22)
|
| Net
realized and unrealized gain (loss) |
35.30
|
33.34
|
21.06
|
9.73
|
20.64
|
| Total
from investment operations |
$34.24
|
$32.63
|
$20.62
|
$9.35
|
$20.42
|
| Less
distributions declared to shareholders |
| From
net investment income |
$—
|
$—
|
$—
|
$—
|
$—
|
| From
net realized gain |
(6.17)
|
(1.83)
|
(3.98)
|
(2.70)
|
(1.16)
|
| Total
distributions declared to shareholders |
$(6.17)
|
$(1.83)
|
$(3.98)
|
$(2.70)
|
$(1.16)
|
| Net
asset value, end of period (x) |
$169.50
|
$141.43
|
$110.63
|
$93.99
|
$87.34
|
| Total
return (%) (r)(s)(t)(x) |
25.17
|
29.93
|
23.18
|
10.97
|
30.46
|
Ratios
(%) (to average net assets)
and Supplemental data: |
| Expenses
before expense reductions (f) |
1.09
|
1.12
|
1.16
|
1.17
|
1.21
|
| Expenses
after expense reductions (f) |
1.08
|
1.11
|
1.15
|
1.17
|
1.19
|
| Net
investment income (loss) |
(0.69)
|
(0.58)
|
(0.45)
|
(0.41)
|
(0.29)
|
| Portfolio
turnover |
14
|
27
|
11
|
18
|
21
|
| Net
assets at end of period (000 omitted) |
$219,795
|
$189,821
|
$170,298
|
$167,295
|
$197,723
|
See Notes to Financial
Statements
Financial
Highlights – continued
| Class
R3 |
Year
ended |
| |
11/30/21
|
11/30/20
|
11/30/19
|
11/30/18
|
11/30/17
|
| Net
asset value, beginning of period |
$150.14
|
$117.05
|
$98.96
|
$91.59
|
$71.17
|
| Income
(loss) from investment operations |
| Net
investment income (loss) (d) |
$(0.72)
|
$(0.43)
|
$(0.21)
|
$(0.15)
|
$(0.03)
|
| Net
realized and unrealized gain (loss) |
37.61
|
35.35
|
22.28
|
10.22
|
21.61
|
| Total
from investment operations |
$36.89
|
$34.92
|
$22.07
|
$10.07
|
$21.58
|
| Less
distributions declared to shareholders |
| From
net investment income |
$—
|
$—
|
$—
|
$—
|
$—
|
| From
net realized gain |
(6.17)
|
(1.83)
|
(3.98)
|
(2.70)
|
(1.16)
|
| Total
distributions declared to shareholders |
$(6.17)
|
$(1.83)
|
$(3.98)
|
$(2.70)
|
$(1.16)
|
| Net
asset value, end of period (x) |
$180.86
|
$150.14
|
$117.05
|
$98.96
|
$91.59
|
| Total
return (%) (r)(s)(t)(x) |
25.49
|
30.25
|
23.49
|
11.26
|
30.78
|
Ratios
(%) (to average net assets)
and Supplemental data: |
| Expenses
before expense reductions (f) |
0.84
|
0.87
|
0.91
|
0.92
|
0.96
|
| Expenses
after expense reductions (f) |
0.83
|
0.86
|
0.90
|
0.92
|
0.94
|
| Net
investment income (loss) |
(0.44)
|
(0.33)
|
(0.20)
|
(0.16)
|
(0.04)
|
| Portfolio
turnover |
14
|
27
|
11
|
18
|
21
|
| Net
assets at end of period (000 omitted) |
$1,756,756
|
$1,275,468
|
$836,994
|
$692,419
|
$690,689
|
See Notes to Financial
Statements
Financial
Highlights – continued
| Class
R4 |
Year
ended |
| |
11/30/21
|
11/30/20
|
11/30/19
|
11/30/18
|
11/30/17
|
| Net
asset value, beginning of period |
$157.15
|
$122.13
|
$102.83
|
$94.92
|
$73.53
|
| Income
(loss) from investment operations |
| Net
investment income (loss) (d) |
$(0.31)
|
$(0.11)
|
$0.06
|
$0.09
|
$0.18
|
| Net
realized and unrealized gain (loss) |
39.47
|
36.96
|
23.22
|
10.61
|
22.37
|
| Total
from investment operations |
$39.16
|
$36.85
|
$23.28
|
$10.70
|
$22.55
|
| Less
distributions declared to shareholders |
| From
net investment income |
$—
|
$—
|
$—
|
$(0.09)
|
$—
|
| From
net realized gain |
(6.17)
|
(1.83)
|
(3.98)
|
(2.70)
|
(1.16)
|
| Total
distributions declared to shareholders |
$(6.17)
|
$(1.83)
|
$(3.98)
|
$(2.79)
|
$(1.16)
|
| Net
asset value, end of period (x) |
$190.14
|
$157.15
|
$122.13
|
$102.83
|
$94.92
|
| Total
return (%) (r)(s)(t)(x) |
25.80
|
30.57
|
23.80
|
11.53
|
31.11
|
Ratios
(%) (to average net assets)
and Supplemental data: |
| Expenses
before expense reductions (f) |
0.59
|
0.62
|
0.66
|
0.67
|
0.71
|
| Expenses
after expense reductions (f) |
0.58
|
0.61
|
0.65
|
0.67
|
0.69
|
| Net
investment income (loss) |
(0.18)
|
(0.08)
|
0.05
|
0.09
|
0.21
|
| Portfolio
turnover |
14
|
27
|
11
|
18
|
21
|
| Net
assets at end of period (000 omitted) |
$1,373,778
|
$1,827,808
|
$1,090,857
|
$965,078
|
$898,023
|
See Notes to Financial
Statements
Financial
Highlights – continued
| Class
R6 |
Year
ended |
| |
11/30/21
|
11/30/20
|
11/30/19
|
11/30/18
|
11/30/17
|
| Net
asset value, beginning of period |
$162.46
|
$126.09
|
$105.93
|
$97.68
|
$75.57
|
| Income
(loss) from investment operations |
| Net
investment income (loss) (d) |
$(0.16)
|
$(0.00)(w)
|
$0.17
|
$0.20
|
$0.26
|
| Net
realized and unrealized gain (loss) |
40.89
|
38.20
|
23.97
|
10.91
|
23.01
|
| Total
from investment operations |
$40.73
|
$38.20
|
$24.14
|
$11.11
|
$23.27
|
| Less
distributions declared to shareholders |
| From
net investment income |
$—
|
$—
|
$—
|
$(0.16)
|
$—
|
| From
net realized gain |
(6.17)
|
(1.83)
|
(3.98)
|
(2.70)
|
(1.16)
|
| Total
distributions declared to shareholders |
$(6.17)
|
$(1.83)
|
$(3.98)
|
$(2.86)
|
$(1.16)
|
| Net
asset value, end of period (x) |
$197.02
|
$162.46
|
$126.09
|
$105.93
|
$97.68
|
| Total
return (%) (r)(s)(t)(x) |
25.93
|
30.68
|
23.92
|
11.63
|
31.23
|
Ratios
(%) (to average net assets)
and Supplemental data: |
| Expenses
before expense reductions (f) |
0.49
|
0.54
|
0.57
|
0.58
|
0.61
|
| Expenses
after expense reductions (f) |
0.48
|
0.53
|
0.56
|
0.57
|
0.59
|
| Net
investment income (loss) |
(0.09)
|
(0.00)(w)
|
0.15
|
0.19
|
0.29
|
| Portfolio
turnover |
14
|
27
|
11
|
18
|
21
|
| Net
assets at end of period (000 omitted) |
$19,487,299
|
$15,490,030
|
$9,349,964
|
$6,930,516
|
$5,883,569
|
| (d)
|
Per share
data is based on average shares outstanding. |
| (f)
|
Ratios do
not reflect reductions from fees paid indirectly, if applicable. |
| (g)
|
The per
share amount varies from the net realized and unrealized gain/loss for the period because of the timing of sales of fund shares and the per share amount of realized and unrealized gains and losses at such time. |
| (r)
|
Certain
expenses have been reduced without which performance would have been lower. |
| (s)
|
From time
to time the fund may receive proceeds from litigation settlements, without which performance would be lower. |
| (t)
|
Total
returns do not include any applicable sales charges. |
| (w)
|
Per share
amount was less than $0.01 and total return or ratio was less than 0.01%, as applicable. |
| (x)
|
The
net asset values and total returns have been calculated on net assets which include adjustments made in accordance with U.S. generally accepted accounting principles required at period end for financial reporting purposes. |
See Notes to Financial Statements
Notes to Financial
Statements
(1) Business and Organization
MFS Growth Fund (the fund) is a diversified series of MFS
Series Trust II (the trust). The trust is organized as a Massachusetts business trust and is registered under the Investment Company Act of 1940, as amended, as an open-end management investment company.
The fund is an investment company and accordingly follows the
investment company accounting and reporting guidance of the Financial Accounting Standards Board (FASB) Accounting Standards Codification Topic 946 Financial Services - Investment Companies.
(2) Significant Accounting Policies
General — The preparation
of financial statements in conformity with U.S. generally accepted accounting principles requires management to make estimates and assumptions that affect the reported amounts of assets and liabilities, and disclosure of contingent assets and
liabilities at the date of the financial statements and the reported amounts of increases and decreases in net assets from operations during the reporting period. Actual results could differ from those estimates. In the preparation of these
financial statements, management has evaluated subsequent events occurring after the date of the fund’s Statement of Assets and Liabilities through the date that the financial statements were issued.
Balance Sheet Offsetting
— The fund's accounting policy with respect to balance sheet offsetting is that, absent an event of default by the counterparty or a termination of the agreement, the International Swaps and Derivatives Association (ISDA) Master Agreement, or
similar agreement, does not result in an offset of reported amounts of financial assets and financial liabilities in the Statement of Assets and Liabilities across transactions between the fund and the applicable counterparty. The fund's right to
setoff may be restricted or prohibited by the bankruptcy or insolvency laws of the particular jurisdiction to which a specific master netting agreement counterparty is subject. Balance sheet offsetting disclosures, to the extent applicable to the
fund, have been included in the fund’s Significant Accounting Policies note under the captions for each of the fund’s in-scope financial instruments and transactions.
Investment Valuations
— Equity securities, including restricted equity securities, are generally valued at the last sale or official closing price on their primary market or exchange as provided by a third-party pricing
service. Equity securities, for which there were no sales reported that day, are generally valued at the last quoted daily bid quotation on their primary market or exchange as provided by a third-party pricing service. Short-term instruments with a maturity at issuance of 60 days or less may be valued at amortized cost, which approximates market value. Open-end investment companies are
generally valued at net asset value per share. Securities and other assets generally valued on the basis of information from a third-party pricing service may also be valued at a broker/dealer bid
quotation. In determining values, third-party pricing services can utilize both transaction data and market information such as yield, quality, coupon rate, maturity, type of issue, trading characteristics,
and other market data. The values of foreign securities and other assets and liabilities expressed in foreign currencies are converted to U.S. dollars using the mean of bid and asked prices for rates provided
by a third-party pricing service.
Notes to Financial
Statements - continued
The Board of Trustees has delegated primary responsibility for
determining or causing to be determined the value of the fund’s investments (including any fair valuation) to the adviser pursuant to valuation policies and procedures approved by the Board. If the adviser determines that reliable market
quotations are not readily available, investments are valued at fair value as determined in good faith by the adviser in accordance with such procedures under the oversight of the Board of Trustees. Under the fund’s valuation policies and
procedures, market quotations are not considered to be readily available for most types of debt instruments and floating rate loans and many types of derivatives. These investments are generally valued at fair value based on information from
third-party pricing services. In addition, investments may be valued at fair value if the adviser determines that an investment’s value has been materially affected by events occurring after the close of the exchange or market on which the
investment is principally traded (such as foreign exchange or market) and prior to the determination of the fund’s net asset value, or after the halt of trading of a specific security where trading does not resume prior to the close of the
exchange or market on which the security is principally traded. Events that occur after foreign markets close (such as developments in foreign markets and significant movements in the U.S. markets) and prior to the determination of the fund’s
net asset value may be deemed to have a material effect on the value of securities traded in foreign markets. Accordingly, the fund’s foreign equity securities may often be valued at fair value. The adviser generally relies on third-party
pricing services or other information (such as the correlation with price movements of similar securities in the same or other markets; the type, cost and investment characteristics of the security; the business and financial condition of the
issuer; and trading and other market data) to assist in determining whether to fair value and at what value to fair value an investment. The value of an investment for purposes of calculating the fund’s net asset value can differ depending on
the source and method used to determine value. When fair valuation is used, the value of an investment used to determine the fund’s net asset value may differ from quoted or published prices for the same investment. There can be no assurance
that the fund could obtain the fair value assigned to an investment if it were to sell the investment at the same time at which the fund determines its net asset value per share.
Various inputs are used in determining the value of the fund's
assets or liabilities. These inputs are categorized into three broad levels. In certain cases, the inputs used to measure fair value may fall into different levels of the fair value hierarchy. In such cases, an investment's level within the fair
value hierarchy is based on the lowest level of input that is significant to the fair value measurement. The fund's assessment of the significance of a particular input to the fair value measurement in its entirety requires judgment, and considers
factors specific to the investment. Level 1 includes unadjusted quoted prices in active markets for identical assets or liabilities. Level 2 includes other significant observable market-based inputs (including quoted prices for similar securities,
interest rates, prepayment speed, and credit risk). Level 3 includes unobservable inputs, which may include the adviser's own assumptions in determining the fair value of investments. The following is a summary of the levels used as of November 30,
2021 in valuing the fund's assets and liabilities:
| Financial
Instruments |
Level
1 |
Level
2 |
Level
3 |
Total
|
| Equity
Securities |
$47,786,297,957
|
$—
|
$—
|
$47,786,297,957
|
| Mutual
Funds |
475,301,471
|
—
|
—
|
475,301,471
|
| Total
|
$48,261,599,428
|
$—
|
$—
|
$48,261,599,428
|
Notes to Financial
Statements - continued
For further information regarding security characteristics, see
the Portfolio of Investments.
Foreign Currency Translation — Purchases and sales of foreign investments, income, and expenses are converted into U.S. dollars based upon currency exchange rates prevailing on the respective dates of such transactions or on the reporting
date for foreign denominated receivables and payables. Gains and losses attributable to foreign currency exchange rates on sales of securities are recorded for financial statement purposes as net realized gains and losses on investments. Gains and
losses attributable to foreign exchange rate movements on receivables, payables, income and expenses are recorded for financial statement purposes as foreign currency transaction gains and losses. That portion of both realized and unrealized gains
and losses on investments that results from fluctuations in foreign currency exchange rates is not separately disclosed.
Security Loans — Under
its Securities Lending Agency Agreement with the fund, JPMorgan Chase and Co., as lending agent, loans the securities of the fund to certain qualified institutions (the “Borrowers”) approved by the fund. Security loans can be terminated
at the discretion of either the lending agent or the fund and the related securities must be returned within the earlier of the standard trade settlement period for such securities or within three business days. The loans are collateralized by cash
and/or U.S. Treasury and federal agency obligations in an amount typically at least equal to the market value of the securities loaned. On loans collateralized by cash, the cash collateral is invested in a money market fund. The market value of the
loaned securities is determined at the close of business of the fund and any additional required collateral is delivered to the fund on the next business day. The lending agent provides the fund with indemnification against Borrower default. In the
event of Borrower default, the lending agent will, for the benefit of the fund, either purchase securities identical to those loaned or, when such purchase is commercially impracticable, pay the fund the market value of the loaned securities. In
return, the lending agent assumes the fund's rights to the related collateral. If the collateral value is less than the cost to purchase identical securities, the lending agent is responsible for the shortfall, but only to the extent that such
shortfall is not due to a decline in collateral value resulting from collateral reinvestment for which the fund bears the risk of loss. A portion of the income generated upon investment of the collateral is remitted to the Borrowers, and the
remainder is allocated between the fund and the lending agent. On loans collateralized by U.S. Treasury and/or federal agency obligations, a fee is received from the Borrower, and is allocated between the fund and the lending agent. Income from
securities lending is separately reported in the Statement of Operations. The dividend and interest income earned on the securities loaned is accounted for in the same manner as other dividend and interest income. At November 30, 2021, there were no
securities on loan or collateral outstanding.
Indemnifications — Under
the fund's organizational documents, its officers and Trustees may be indemnified against certain liabilities and expenses arising out of the performance of their duties to the fund. Additionally, in the normal course of business, the fund enters
into agreements with service providers that may contain indemnification clauses. The fund's maximum exposure under these agreements is unknown as this would involve future claims that may be made against the fund that have not yet
occurred.
Notes to Financial
Statements - continued
Investment Transactions and Income — Investment transactions are recorded on the trade date. Dividends received in cash are recorded on the ex-dividend date. Certain dividends from foreign securities will be
recorded when the fund is informed of the dividend if such information is obtained subsequent to the ex-dividend date. Dividend payments received in additional securities are recorded on the ex-dividend date in an amount equal to the value of the
security on such date.
The fund may receive
proceeds from litigation settlements. Any proceeds received from litigation involving portfolio holdings are reflected in the Statement of Operations in realized gain/loss if the security has been disposed of by the fund or in unrealized gain/loss
if the security is still held by the fund. Any other proceeds from litigation not related to portfolio holdings are reflected as other income in the Statement of Operations.
Fees Paid Indirectly —
The fund's custody fee may be reduced by a credit earned under an arrangement that measures the value of U.S. dollars deposited with the custodian by the fund. The amount of the credit, for the year ended November 30, 2021, is shown as a reduction
of total expenses in the Statement of Operations.
Tax Matters and Distributions
— The fund intends to qualify as a regulated investment company, as defined under Subchapter M of the Internal Revenue Code, and to distribute all of its taxable income, including realized capital gains. As a result, no provision for federal
income tax is required. The fund’s federal tax returns, when filed, will remain subject to examination by the Internal Revenue Service for a three year period. Management has analyzed the fund’s tax positions taken on federal and state
tax returns for all open tax years and does not believe that there are any uncertain tax positions that require recognition of a tax liability. Foreign taxes, if any, have been accrued by the fund in the accompanying financial statements in
accordance with the applicable foreign tax law. Foreign income taxes may be withheld by certain countries in which the fund invests. Additionally, capital gains realized by the fund on securities issued in or by certain foreign countries may be
subject to capital gains tax imposed by those countries.
Distributions to shareholders are recorded on the ex-dividend
date. Income and capital gain distributions are determined in accordance with income tax regulations, which may differ from U.S. generally accepted accounting principles. Certain capital accounts in the financial statements are periodically adjusted
for permanent differences in order to reflect their tax character. These adjustments have no impact on net assets or net asset value per share. Temporary differences which arise from recognizing certain items of income, expense, gain or loss in
different periods for financial statement and tax purposes will reverse at some time in the future.
Book/tax differences primarily relate to net operating losses,
wash sale loss deferrals, treating a portion of the proceeds from redemptions as a distribution for tax purposes, and redemptions in-kind.
The tax character of distributions declared to shareholders for
the last two fiscal years is as follows:
| |
Year
ended
11/30/21 |
Year
ended
11/30/20 |
| Long-term
capital gains |
$1,530,458,681
|
$382,863,384
|
Notes to Financial
Statements - continued
The federal tax cost and the tax basis components of
distributable earnings were as follows:
| As
of 11/30/21 |
|
| Cost
of investments |
$20,345,635,780
|
| Gross
appreciation |
28,172,576,973
|
| Gross
depreciation |
(256,613,325)
|
| Net
unrealized appreciation (depreciation) |
$27,915,963,648
|
| Undistributed
long-term capital gain |
1,171,374,969
|
| Post-October
capital loss deferral |
(2,128,132)
|
| Late
year ordinary loss deferral |
(76,517,188)
|
| Other
temporary differences |
(2,762)
|
| Total
distributable earnings (loss) |
$29,008,690,535
|
Multiple Classes of Shares of
Beneficial Interest — The fund offers multiple classes of shares, which differ in their respective distribution and service fees. The fund's income, realized and unrealized gain (loss), and common expenses are
allocated to shareholders based on the daily net assets of each class. Dividends are declared separately for each class. Differences in per share dividend rates are generally due to differences in separate class expenses. Class B and Class C shares
will convert to Class A shares approximately eight years after purchase. The fund’s distributions declared to shareholders as reported in the Statements of Changes in Net Assets are presented by class as follows:
| |
Year
ended
11/30/21 |
|
Year
ended
11/30/20 |
| Class
A |
$342,596,777
|
|
$99,757,661
|
| Class
B |
7,377,927
|
|
2,834,455
|
| Class
C |
40,596,507
|
|
12,869,985
|
| Class
I |
413,862,305
|
|
94,084,996
|
| Class
R1 |
1,371,851
|
|
468,535
|
| Class
R2 |
8,240,387
|
|
2,801,017
|
| Class
R3 |
53,289,621
|
|
13,007,925
|
| Class
R4 |
69,206,720
|
|
17,250,413
|
| Class
R6 |
593,916,586
|
|
139,788,397
|
| Total
|
$1,530,458,681
|
|
$382,863,384
|
Notes to Financial
Statements - continued
(3) Transactions with Affiliates
Investment Adviser — The
fund has an investment advisory agreement with MFS to provide overall investment management and related administrative services and facilities to the fund. For the period from December 1, 2020 through July
31, 2021, the management fee was computed daily and paid monthly at the following annual rates based on the fund’s average daily net assets:
| Up
to $1 billion |
0.75%
|
| In
excess of $1 billion and up to $2.5 billion |
0.65%
|
| In
excess of $2.5 billion and up to $5 billion |
0.60%
|
| In
excess of $5 billion and up to $10 billion |
0.55%
|
| In
excess of $10 billion and up to $20 billion |
0.50%
|
| In
excess of $20 billion and up to $30 billion |
0.45%
|
| In
excess of $30 billion |
0.40%
|
Effective August 1, 2021, the
management fee is computed daily and paid monthly at the following annual rates based on the fund’s average daily net assets:
| Up
to $1 billion |
0.75%
|
| In
excess of $1 billion and up to $2.5 billion |
0.65%
|
| In
excess of $2.5 billion and up to $5 billion |
0.60%
|
| In
excess of $5 billion and up to $10 billion |
0.55%
|
| In
excess of $10 billion and up to $20 billion |
0.50%
|
| In
excess of $20 billion and up to $30 billion |
0.45%
|
| In
excess of $30 billion and up to $40 billion |
0.40%
|
| In
excess of $40 billion and up to $50 billion |
0.38%
|
| In
excess of $50 billion |
0.36%
|
MFS has agreed in writing to reduce
its management fee by a specified amount if certain MFS mutual fund assets exceed thresholds agreed to by MFS and the fund's Board of Trustees. For the year ended November 30, 2021, this management fee reduction amounted to $5,464,581, which is
included in the reduction of total expenses in the Statement of Operations. The management fee incurred for the year ended November 30, 2021 was equivalent to an annual effective rate of 0.47% of the fund's average daily net assets.
Distributor — MFS Fund
Distributors, Inc. (MFD), a wholly-owned subsidiary of MFS, as distributor, received $1,731,134 for the year ended November 30, 2021, as its portion of the initial sales charge on sales of Class A shares of the fund.
The Board of Trustees has adopted a distribution plan for
certain share classes pursuant to Rule 12b-1 of the Investment Company Act of 1940.
The fund's distribution plan provides that the fund will pay
MFD for services provided by MFD and financial intermediaries in connection with the distribution and servicing of certain share classes. One component of the plan is a distribution fee paid to MFD and another component of the plan is a service fee
paid to MFD. MFD may subsequently pay all, or a portion, of the distribution and/or service fees to financial intermediaries.
Notes to Financial
Statements - continued
Distribution Plan Fee Table:
| |
Distribution
Fee Rate (d) |
Service
Fee Rate (d) |
Total
Distribution
Plan (d) |
Annual
Effective
Rate (e) |
Distribution
and Service
Fee |
| Class
A |
—
|
0.25%
|
0.25%
|
0.25%
|
$
23,352,512 |
| Class
B |
0.75%
|
0.25%
|
1.00%
|
1.00%
|
1,399,881
|
| Class
C |
0.75%
|
0.25%
|
1.00%
|
1.00%
|
7,718,061
|
| Class
R1 |
0.75%
|
0.25%
|
1.00%
|
1.00%
|
268,967
|
| Class
R2 |
0.25%
|
0.25%
|
0.50%
|
0.50%
|
1,044,860
|
| Class
R3 |
—
|
0.25%
|
0.25%
|
0.25%
|
3,892,300
|
| Total
Distribution and Service Fees |
|
|
|
|
$37,676,581
|
| (d)
|
In
accordance with the distribution plan for certain classes, the fund pays distribution and/or service fees equal to these annual percentage rates of each class’s average daily net assets. The distribution and service fee rates disclosed by
class represent the current rates in effect at the end of the reporting period. Any rate changes, if applicable, are detailed below. |
| (e)
|
The
annual effective rates represent actual fees incurred under the distribution plan for the year ended November 30, 2021 based on each class's average daily net assets. MFD has voluntarily agreed to rebate a portion of each class’s 0.25% service
fee attributable to accounts for which there is no financial intermediary specified on the account except for accounts attributable to MFS or its affiliates’ seed money. For the year ended November 30, 2021, this rebate amounted to $26,986,
$254, $569, and $683, for Class A, Class B, Class C, and Class R3, respectively, and is included in the reduction of total expenses in the Statement of Operations. |
Certain Class A shares are subject to a contingent deferred
sales charge (CDSC) in the event of a shareholder redemption within 18 months of purchase. Class B shares are subject to a CDSC in the event of a shareholder redemption within six years of purchase. Class C shares are subject to a CDSC in the event
of a shareholder redemption within 12 months of purchase. All contingent deferred sales charges are paid to MFD and during the year ended November 30, 2021, were as follows:
| |
Amount
|
| Class
A |
$105,626
|
| Class
B |
70,738
|
| Class
C |
75,688
|
Shareholder Servicing Agent — MFS Service Center, Inc. (MFSC), a wholly-owned subsidiary of MFS, receives a fee from the fund for its services as shareholder servicing agent calculated as a percentage of the average daily net assets of the
fund as determined periodically under the supervision of the fund's Board of Trustees. For the year ended November 30, 2021, the fee was $2,019,703, which equated to 0.0046% annually of the fund's average daily net assets. MFSC also receives
reimbursement from the fund for out-of-pocket expenses, sub-accounting and other shareholder servicing costs which may be paid to affiliated and unaffiliated service providers. Class R6 shares do not incur sub-accounting fees. For the year ended
November 30, 2021, these out-of-pocket expenses, sub-accounting and other shareholder servicing costs amounted to $26,681,241.
Notes to Financial
Statements - continued
Administrator — MFS
provides certain financial, legal, shareholder communications, compliance, and other administrative services to the fund. Under an administrative services agreement, the fund reimburses MFS the costs incurred to provide these services. The fund is
charged an annual fixed amount of $17,500 plus a fee based on average daily net assets. The administrative services fee incurred for the year ended November 30, 2021 was equivalent to an annual effective rate of 0.0013% of the fund's average daily
net assets.
Trustees’ and Officers’
Compensation — The fund pays compensation to independent Trustees in the form of a retainer, attendance fees, and additional compensation to Board and Committee chairpersons. The fund does not pay compensation
directly to Trustees or officers of the fund who are also officers of the investment adviser, all of whom receive remuneration from MFS for their services to the fund. Certain officers and Trustees of the fund are officers or directors of MFS, MFD,
and MFSC.
Prior to December 31, 2001, the fund had
an unfunded defined benefit plan (“DB plan”) for independent Trustees. As of December 31, 2001, the Board took action to terminate the DB plan with respect to then-current and any future independent Trustees, such that the DB plan covers
only certain of those former independent Trustees who retired on or before December 31, 2001. The DB plan resulted in a pension expense of $1,027 and is included in “Independent Trustees’ compensation” in the Statement of
Operations for the year ended November 30, 2021. The liability for deferred retirement benefits payable to those former independent Trustees under the DB plan amounted to $2,763 at November 30, 2021, and is included in “Payable for independent
Trustees’ compensation” in the Statement of Assets and Liabilities.
Other — The fund invests
in the MFS Institutional Money Market Portfolio which is managed by MFS and seeks current income consistent with preservation of capital and liquidity. This money market fund does not pay a management fee to MFS but does incur investment and
operating costs.
The fund is permitted to engage
in purchase and sale transactions with funds and accounts for which MFS serves as investment adviser or sub-adviser (“cross-trades”) pursuant to a policy adopted by the Board of Trustees. This policy has been designed to ensure that
cross-trades conducted by the fund comply with Rule 17a-7 under the Investment Company Act of 1940. During the year ended November 30, 2021, the fund engaged in purchase transactions pursuant to this policy, which amounted to $35,617,758.
The adviser has voluntarily undertaken to reimburse the fund
from its own resources on a quarterly basis for the cost of investment research embedded in the cost of the fund’s securities trades. This agreement may be rescinded at any time. For the year ended November 30, 2021, this reimbursement
amounted to $581,532, which is included in “Other” income in the Statement of Operations.
(4) Portfolio Securities
For the year ended November 30, 2021, purchases and sales of
investments, other than in-kind transactions and short-term obligations, aggregated $5,956,058,690 and $5,885,022,667, respectively.
Notes to Financial
Statements - continued
(5) Shares of Beneficial Interest
The fund's Declaration of Trust permits the Trustees to issue
an unlimited number of full and fractional shares of beneficial interest. Transactions in fund shares were as follows:
| |
Year
ended
11/30/21 |
|
Year
ended
11/30/20 |
| |
Shares
|
Amount
|
|
Shares
|
Amount
|
| Shares
sold |
|
|
|
|
|
| Class
A |
6,646,976
|
$1,076,699,933
|
|
11,755,942
|
$1,491,954,455
|
| Class
B |
14,288
|
1,765,759
|
|
37,010
|
3,763,296
|
| Class
C |
731,969
|
91,124,785
|
|
1,994,344
|
192,965,598
|
| Class
I |
22,238,699
|
4,034,819,955
|
|
34,837,575
|
4,667,030,330
|
| Class
R1 |
28,307
|
3,532,452
|
|
61,047
|
6,066,132
|
| Class
R2 |
351,136
|
53,157,019
|
|
469,224
|
56,240,118
|
| Class
R3 |
3,282,984
|
524,091,472
|
|
3,774,236
|
505,720,025
|
| Class
R4 |
2,374,296
|
389,229,279
|
|
5,499,587
|
734,703,060
|
| Class
R6 |
21,569,092
|
3,758,315,130
|
|
40,805,228
|
5,719,230,374
|
| |
57,237,747
|
$9,932,735,784
|
|
99,234,193
|
$13,377,673,388
|
Shares
issued to shareholders
in reinvestment of distributions |
|
|
|
|
|
| Class
A |
2,117,648
|
$316,294,948
|
|
768,111
|
$92,083,978
|
| Class
B |
61,408
|
7,095,519
|
|
28,978
|
2,734,806
|
| Class
C |
334,500
|
38,321,639
|
|
118,333
|
11,109,371
|
| Class
I |
2,396,301
|
384,643,744
|
|
666,459
|
85,725,527
|
| Class
R1 |
11,917
|
1,371,726
|
|
4,977
|
468,456
|
| Class
R2 |
58,079
|
8,106,831
|
|
23,344
|
2,624,178
|
| Class
R3 |
356,892
|
53,086,150
|
|
109,161
|
13,007,809
|
| Class
R4 |
438,728
|
68,017,665
|
|
134,759
|
16,842,518
|
| Class
R6 |
3,534,753
|
570,193,941
|
|
1,040,067
|
133,876,660
|
| |
9,310,226
|
$1,447,132,163
|
|
2,894,189
|
$358,473,303
|
| Shares
reacquired |
|
|
|
|
|
| Class
A |
(8,299,590)
|
$(1,346,415,838)
|
|
(10,986,962)
|
$(1,424,063,227)
|
| Class
B |
(331,554)
|
(41,767,773)
|
|
(441,932)
|
(44,291,652)
|
| Class
C |
(2,038,917)
|
(250,446,046)
|
|
(2,384,633)
|
(242,638,451)
|
| Class
I |
(18,394,425)
|
(3,234,106,236)
|
|
(17,188,663)
|
(2,368,719,605)
|
| Class
R1 |
(68,607)
|
(8,480,983)
|
|
(97,974)
|
(10,007,130)
|
| Class
R2 |
(454,703)
|
(69,226,324)
|
|
(689,697)
|
(82,398,844)
|
| Class
R3 |
(2,421,932)
|
(394,070,437)
|
|
(2,538,924)
|
(322,519,868)
|
| Class
R4 |
(7,218,762)
|
(1,218,400,160)
|
|
(2,935,296)
|
(394,828,347)
|
| Class
R6 |
(21,536,414)
|
(3,809,427,296)
|
|
(20,652,289)
|
(2,802,597,916)
|
| |
(60,764,904)
|
$(10,372,341,093)
|
|
(57,916,370)
|
$(7,692,065,040)
|
Notes to Financial
Statements - continued
| |
Year
ended
11/30/21 |
|
Year
ended
11/30/20 |
| |
Shares
|
Amount
|
|
Shares
|
Amount
|
| Net
change |
|
|
|
|
|
| Class
A |
465,034
|
$46,579,043
|
|
1,537,091
|
$159,975,206
|
| Class
B |
(255,858)
|
(32,906,495)
|
|
(375,944)
|
(37,793,550)
|
| Class
C |
(972,448)
|
(120,999,622)
|
|
(271,956)
|
(38,563,482)
|
| Class
I |
6,240,575
|
1,185,357,463
|
|
18,315,371
|
2,384,036,252
|
| Class
R1 |
(28,383)
|
(3,576,805)
|
|
(31,950)
|
(3,472,542)
|
| Class
R2 |
(45,488)
|
(7,962,474)
|
|
(197,129)
|
(23,534,548)
|
| Class
R3 |
1,217,944
|
183,107,185
|
|
1,344,473
|
196,207,966
|
| Class
R4 |
(4,405,738)
|
(761,153,216)
|
|
2,699,050
|
356,717,231
|
| Class
R6 |
3,567,431
|
519,081,775
|
|
21,193,006
|
3,050,509,118
|
| |
5,783,069
|
$1,007,526,854
|
|
44,212,012
|
$6,044,081,651
|
Effective June 1, 2019, purchases of
the fund’s Class B shares are closed to new and existing investors subject to certain exceptions. Please see the fund’s prospectus for details.
The fund is one of several mutual funds in which certain MFS
funds may invest. The MFS funds do not invest in the underlying funds for the purpose of exercising management or control. At the end of the period, the MFS Growth Allocation Fund and the MFS Moderate Allocation Fund were the owners of record of
approximately 2% and 1% of the value of outstanding voting shares of the fund. In addition, the MFS Aggressive Growth Allocation Fund, the MFS Conservative Allocation Fund, the MFS Lifetime 2020 Fund, the MFS Lifetime 2025 Fund, the MFS Lifetime
2030 Fund, the MFS Lifetime 2035 Fund, the MFS Lifetime 2040 Fund, the MFS Lifetime 2045 Fund, the MFS Lifetime 2050 Fund, the MFS Lifetime 2055 Fund, the MFS Lifetime 2060 Fund, the MFS Lifetime 2065 Fund, the MFS Lifetime Income Fund, and the MFS
Managed Wealth Fund were each the owners of record of less than 1% of the value of outstanding voting shares of the fund.
(6) Line of Credit
The fund and certain other funds managed by MFS participate in
a $1.25 billion unsecured committed line of credit of which $1 billion is reserved for use by the fund and certain other MFS U.S. funds. The line of credit is provided by a syndicate of banks under a credit agreement. Borrowings may be made for
temporary financing needs. Interest is charged to each fund, based on its borrowings, generally at a rate equal to the highest of one month LIBOR, the Federal Funds Effective Rate and the Overnight Bank Funding Rate, plus an agreed upon spread. A
commitment fee, based on the average daily, unused portion of the committed line of credit, is allocated among the participating funds. In addition, the fund and other funds managed by MFS have established unsecured uncommitted borrowing
arrangements with certain banks for temporary financing needs. Interest is charged to each fund, based on its borrowings, at rates equal to customary reference rates plus an agreed upon spread. For the year ended November 30, 2021, the fund’s
commitment fee and interest expense were $166,120 and $0, respectively, and are included in “Miscellaneous” expense in the Statement of Operations.
Notes to Financial
Statements - continued
(7) Investments in Affiliated Issuers
An affiliated issuer may be considered one in which the fund
owns 5% or more of the outstanding voting securities, or a company which is under common control. For the purposes of this report, the following were affiliated issuers:
| Affiliated
Issuers |
Beginning
Value |
Purchases
|
Sales
Proceeds |
Realized
Gain
(Loss) |
Change
in
Unrealized
Appreciation or
Depreciation |
Ending
Value |
| MFS
Institutional Money Market Portfolio |
$399,477,039
|
$3,329,868,563
|
$3,254,044,129
|
$21,155
|
$(21,157)
|
$475,301,471
|
| Affiliated
Issuers |
Dividend
Income |
Capital
Gain
Distributions |
| MFS
Institutional Money Market Portfolio |
$182,033
|
$—
|
(8) Redemptions In-Kind
On June 1, 2021, the fund recorded a redemption in-kind of
portfolio securities and cash that was valued at $668,180,153. The redeeming shareholder generally receives a pro rata share of the securities held by the fund. The distribution of such securities generated a realized gain (loss) of $479,390,506 for
the fund, which is included in Net realized gain (loss) in the Statement of Operations. For tax purposes, no gains or losses were recognized with respect to the portfolio securities redeemed in-kind.
On July 30, 2021, the fund recorded a redemption in-kind of
portfolio securities and cash that was valued at $79,640,847. The redeeming shareholder generally receives a pro rata share of the securities held by the fund. The distribution of such securities generated a realized gain (loss) of $59,430,918 for
the fund, which is included in Net realized gain (loss) in the Statement of Operations. For tax purposes, no gains or losses were recognized with respect to the portfolio securities redeemed in-kind.
(9) Impacts of COVID-19
The pandemic related to the global spread of novel coronavirus
disease (COVID-19), which was first detected in December 2019, has resulted in significant disruptions to global business activity and the global economy, as well as the economies of individual countries, the financial performance of individual
companies and sectors, and the securities and commodities markets in general. Multiple surges in cases globally, the availability and widespread adoption of vaccines, and the emergence of variant strains of the virus continue to create uncertainty
as to the future and long-term impacts resulting from the pandemic including impacts to the prices and liquidity of the fund's investments and the fund's performance.
(10) LIBOR Transition
Certain of the fund's investments, including its investments in
derivatives, as well as any debt issued by the fund and other contractual arrangements of the fund may be based on reference interest rates such as the London Interbank Offered Rate (“LIBOR”). In 2017, the regulatory authority that
oversees financial services firms in the United Kingdom announced plans to transition away from LIBOR by the end of 2021. In March 2021, the administrator of LIBOR announced the extension of the publication of the more commonly used U.S. dollar
LIBOR settings to the end of June 2023. Although the
Notes to Financial
Statements - continued
full impacts of the transition away from LIBOR are not fully known, the
transition may result in, among other things, an increase in volatility or illiquidity of the markets for instruments that currently rely on LIBOR to determine interest rates and this could have an adverse impact on the fund's performance. With
respect to the fund's accounting for investments, including its investments in derivatives, as well as any debt issued by the fund and other contractual arrangements of the fund that undergo reference rate-related modifications as a result of the
transition, management will rely upon the relief provided by FASB Codification Topic 848 – Reference Rate Reform (Topic 848). The guidance in Topic 848 permits the fund to disregard the GAAP accounting requirements around certain contract
modifications resulting from the LIBOR transition such that for contracts considered in scope, the fund can account for those modified contracts as a continuation of the existing contracts. While the cessation of the one-week and two-month U.S.
dollar LIBOR tenors along with certain other non-U.S. dollar denominated LIBOR settings at December 31, 2021 did not have a material impact on the fund, management is still evaluating the impact to the fund of the June 30, 2023 planned
discontinuation of the more commonly used U.S. dollar LIBOR settings.
Report of Independent
Registered Public Accounting Firm
To the Board of
Trustees of MFS Series Trust II and the shareholders of
MFS Growth Fund:
Opinion on the Financial Statements and Financial
Highlights
We have audited the accompanying statement of
assets and liabilities of MFS Growth Fund (the “Fund”), including the portfolio of investments, as of November 30, 2021, the related statement of operations for the year then ended, the statements of changes in net assets for each
of the two years in the period then ended, the financial highlights for each of the five years in the period then ended, and the related notes. In our opinion, the financial statements and financial highlights present fairly, in all
material respects, the financial position of the Fund as of November 30, 2021, and the results of its operations for the year then ended, the changes in its net assets for each of the two years in the period then ended, and the financial highlights
for each of the five years in the period then ended, in conformity with accounting principles generally accepted in the United States of America.
Basis for Opinion
These financial statements and financial highlights are
the responsibility of the Fund's management. Our responsibility is to express an opinion on the Fund's financial statements and financial highlights based on our audits. We are a public accounting firm registered with the Public Company
Accounting Oversight Board (United States) (PCAOB) and are required to be independent with respect to the Fund in accordance with the U.S. federal securities laws and the applicable rules and regulations of the Securities and Exchange Commission and
the PCAOB.
We conducted our audits in accordance with the
standards of the PCAOB. Those standards require that we plan and perform the audit to obtain reasonable assurance about whether the financial statements and financial highlights are free of material misstatement, whether due to error or fraud.
The Fund is not required to have, nor were we engaged to perform, an audit of its internal control over financial reporting. As part of our audits, we are required to obtain an understanding of internal control over financial reporting but not for
the purpose of expressing an opinion on the effectiveness of the Fund's internal control over financial reporting. Accordingly, we express no such opinion.
Our audits included performing procedures to assess the risks
of material misstatement of the financial statements and financial highlights, whether due to error or fraud, and performing procedures that respond to those risks. Such procedures included examining, on a test basis, evidence regarding the amounts
and disclosures in the financial statements and financial highlights. Our audits also included evaluating the accounting principles used and significant estimates made by management, as well as
Report of Independent
Registered Public Accounting Firm – continued
evaluating the overall presentation of the financial statements and financial
highlights. Our procedures included confirmation of securities owned as of November 30, 2021, by correspondence with the custodian. We believe that our audits provide a reasonable basis for our opinion.
DELOITTE & TOUCHE LLP
Boston, Massachusetts
January 14, 2022
We have served as the auditor of one or more of the MFS
investment companies since 1924.
Trustees and
Officers — Identification and Background
The Trustees and Officers of the Trust, as of January 1, 2022,
are listed below, together with their principal occupations during the past five years. (Their titles may have varied during that period.) The address of each Trustee and Officer is 111 Huntington Avenue, Boston, Massachusetts 02199-7618.
| Name,
Age |
|
Position(s)
Held with Fund |
|
Trustee/Officer
Since(h) |
|
Number
of MFS Funds overseen by the Trustee |
|
Principal
Occupations During
the Past Five Years |
|
Other
Directorships During
the Past Five Years (j) |
| INTERESTED
TRUSTEES |
|
|
|
|
|
|
|
|
|
|
Michael
W. Roberge (k)
(age 55) |
|
Trustee
|
|
January
2021 |
|
135
|
|
Massachusetts
Financial Services Company, Chairman (since January 2021); Chief Executive Officer (since January 2017); Director; Chairman of the Board (since January 2022); President (until December 2018); Chief Investment Officer (until December 2018) |
|
N/A
|
| INDEPENDENT
TRUSTEES |
|
|
|
|
|
|
|
|
|
|
John
P. Kavanaugh
(age 67) |
|
Trustee
and Chair of Trustees |
|
January
2009 |
|
135
|
|
Private
investor |
|
N/A
|
Steven
E. Buller
(age 70) |
|
Trustee
|
|
February
2014 |
|
135
|
|
Private
investor |
|
N/A
|
John
A. Caroselli
(age 67) |
|
Trustee
|
|
March
2017 |
|
135
|
|
Private
investor; JC Global Advisors, LLC (management consulting), President (since 2015) |
|
N/A
|
Maureen
R. Goldfarb
(age 66) |
|
Trustee
|
|
January
2009 |
|
135
|
|
Private
investor |
|
N/A
|
Peter
D. Jones
(age 66) |
|
Trustee
|
|
January
2019 |
|
135
|
|
Private
investor |
|
N/A
|
James
W. Kilman, Jr.
(age 60) |
|
Trustee
|
|
January
2019 |
|
135
|
|
Burford
Capital Limited (finance and investment management), Senior Advisor (since May 3, 2021), Chief Financial Officer (2019 - May 2, 2021); KielStrand Capital LLC (family office), Chief Executive Officer (since 2016) |
|
Alpha-En
Corporation, Director (2016-2019) |
Trustees and Officers -
continued
| Name,
Age |
|
Position(s)
Held with Fund |
|
Trustee/Officer
Since(h) |
|
Number
of MFS Funds overseen by the Trustee |
|
Principal
Occupations During
the Past Five Years |
|
Other
Directorships During
the Past Five Years (j) |
Clarence
Otis, Jr.
(age 65) |
|
Trustee
|
|
March
2017 |
|
135
|
|
Private
investor |
|
VF
Corporation, Director; Verizon Communications, Inc., Director; The Travelers Companies, Director |
Maryanne
L. Roepke
(age 65) |
|
Trustee
|
|
May
2014 |
|
135
|
|
Private
investor |
|
N/A
|
Laurie
J. Thomsen
(age 64) |
|
Trustee
|
|
March
2005 |
|
135
|
|
Private
investor |
|
The
Travelers Companies, Director; Dycom Industries, Inc., Director |
| Name,
Age |
|
Position(s)
Held with
Fund |
|
Trustee/Officer
Since(h) |
|
Number
of MFS Funds for which the Person is an Officer |
|
Principal
Occupations During
the Past Five Years |
| OFFICERS
|
|
|
|
|
|
|
|
|
Christopher
R. Bohane (k)
(age 47) |
|
Assistant
Secretary and Assistant Clerk |
|
July
2005 |
|
135
|
|
Massachusetts
Financial Services Company, Senior Vice President and Associate General Counsel |
Kino
Clark (k)
(age 53) |
|
Assistant
Treasurer |
|
January
2012 |
|
135
|
|
Massachusetts
Financial Services Company, Vice President |
John
W. Clark, Jr. (k)
(age 54) |
|
Assistant
Treasurer |
|
April
2017 |
|
135
|
|
Massachusetts
Financial Services Company, Vice President (since March 2017); Deutsche Bank (financial services), Department Head - Treasurer's Office (until February 2017) |
Thomas
H. Connors (k)
(age 62) |
|
Assistant
Secretary and Assistant Clerk |
|
September
2012 |
|
135
|
|
Massachusetts
Financial Services Company, Vice President and Senior Counsel |
David
L. DiLorenzo (k)
(age 53) |
|
President
|
|
July
2005 |
|
135
|
|
Massachusetts
Financial Services Company, Senior Vice President |
Heidi
W. Hardin (k)
(age 54) |
|
Secretary
and Clerk |
|
April
2017 |
|
135
|
|
Massachusetts
Financial Services Company, Executive Vice President and General Counsel (since March 2017); Harris Associates (investment management), General Counsel (until January 2017) |
Trustees and Officers -
continued
| Name,
Age |
|
Position(s)
Held with
Fund |
|
Trustee/Officer
Since(h) |
|
Number
of MFS Funds for which the Person is an Officer |
|
Principal
Occupations During
the Past Five Years |
Brian
E. Langenfeld (k)
(age 48) |
|
Assistant
Secretary and Assistant Clerk |
|
June
2006 |
|
135
|
|
Massachusetts
Financial Services Company, Vice President and Senior Counsel |
Amanda
S. Mooradian (k)
(age 42) |
|
Assistant
Secretary and Assistant Clerk |
|
September
2018 |
|
135
|
|
Massachusetts
Financial Services Company, Assistant Vice President and Senior Counsel |
Susan
A. Pereira (k)
(age 51) |
|
Assistant
Secretary and Assistant Clerk |
|
July
2005 |
|
135
|
|
Massachusetts
Financial Services Company, Vice President and Assistant General Counsel |
Kasey
L. Phillips (k)
(age 51) |
|
Assistant
Treasurer |
|
September
2012 |
|
135
|
|
Massachusetts
Financial Services Company, Vice President |
Matthew
A. Stowe (k)
(age 47) |
|
Assistant
Secretary and Assistant Clerk |
|
October
2014 |
|
135
|
|
Massachusetts
Financial Services Company, Vice President and Assistant General Counsel |
Martin
J. Wolin (k)
(age 54) |
|
Chief
Compliance Officer |
|
July
2015 |
|
135
|
|
Massachusetts
Financial Services Company, Senior Vice President and Chief Compliance Officer |
James
O. Yost (k)
(age 61) |
|
Treasurer
|
|
September
1990 |
|
135
|
|
Massachusetts
Financial Services Company, Senior Vice President |
| (h)
|
Date
first appointed to serve as Trustee/Officer of an MFS Fund. Each Trustee has served continuously since appointment unless indicated otherwise. From January 2012 through December 2016, Messrs. DiLorenzo and Yost served as Treasurer and Deputy
Treasurer of the Funds, respectively. |
| (j)
|
Directorships
or trusteeships of companies required to report to the Securities and Exchange Commission (i.e., “public companies”). |
| (k)
|
“Interested
person” of the Trust within the meaning of the Investment Company Act of 1940 (referred to as the 1940 Act), which is the principal federal law governing investment companies like the fund, as a result of a position with MFS. The address of
MFS is 111 Huntington Avenue, Boston, Massachusetts 02199-7618. |
Each Trustee (other than Messrs. Jones, Kilman and Roberge) has
been elected by shareholders and each Trustee and Officer holds office until his or her successor is chosen and qualified or until his or her earlier death, resignation, retirement or removal. Mr. Roberge became a Trustee of the Funds on January 1,
2021 and Messrs. Jones and Kilman became Trustees of the Funds on January 1, 2019. The Trust does not hold annual meetings for the purpose of electing Trustees, and Trustees are not elected for fixed terms. Under the terms of the Board's retirement
policy, an Independent Trustee shall retire at the end of the calendar year in which he or she reaches the earlier of 75 years of age or 15 years of service on the Board (or, in the case of any Independent Trustee who joined the Board prior to 2015,
20 years of service on the Board).
Trustees and Officers -
continued
Messrs. Buller, Kilman and Otis and Ms. Roepke are members of
the Trust’s Audit Committee.
Each of the Interested
Trustees and certain Officers hold comparable officer positions with certain affiliates of MFS.
| Investment
Adviser |
Custodian
|
Massachusetts
Financial Services Company
111 Huntington Avenue
Boston, MA 02199-7618 |
JPMorgan
Chase Bank, NA
4 Metrotech Center
New York, NY 11245 |
| Distributor
|
Independent
Registered Public Accounting Firm |
MFS Fund
Distributors, Inc.
111 Huntington Avenue
Boston, MA 02199-7618 |
Deloitte
& Touche LLP
200 Berkeley Street
Boston, MA 02116 |
| Portfolio
Manager(s) |
|
Eric
Fischman
Paul Gordon
Bradford Mak |
|
Board Review of Investment
Advisory Agreement
MFS Growth Fund
The Investment Company Act of 1940 requires that both the full
Board of Trustees and a majority of the non-interested (“independent”) Trustees, voting separately, annually approve the continuation of the Fund’s investment advisory agreement with MFS. The Trustees consider matters bearing on
the Fund and its advisory arrangements at their meetings throughout the year, including a review of performance data at each regular meeting. In addition, the independent Trustees met several times by videoconference (in accordance with Securities
and Exchange Commission relief) over the course of three months beginning in May and ending in July, 2021 (“contract review meetings”) for the specific purpose of considering whether to approve the continuation of the investment advisory
agreement for the Fund and the other investment companies that the Board oversees (the “MFS Funds”). The independent Trustees were assisted in their evaluation of the Fund’s investment advisory agreement by independent legal
counsel, from whom they received separate legal advice and with whom they met separately from MFS during various contract review meetings. The independent Trustees were also assisted in this process by an independent consultant who was retained by
and reported to the independent Trustees.
In connection
with their deliberations regarding the continuation of the investment advisory agreement, the Trustees, including the independent Trustees, considered such information and factors as they believed, in light of the legal advice furnished to them and
their own business judgment, to be relevant. The investment advisory agreement for the Fund was considered separately, although the Trustees also took into account the common interests of all MFS Funds in their review. As described below, the
Trustees considered the nature, quality, and extent of the various investment advisory, administrative, and shareholder services performed by MFS under the existing investment advisory agreement and other arrangements with the Fund.
In connection with their contract review meetings, the Trustees
received and relied upon materials that included, among other items: (i) information provided by Broadridge Financial Solutions, Inc. (“Broadridge”), an independent third party, on the investment performance of the Fund for various time
periods ended December 31, 2020 and the investment performance of a group of funds with substantially similar investment classifications/objectives (the “Broadridge performance universe”), (ii) information provided by Broadridge on the
Fund’s advisory fees and other expenses and the advisory fees and other expenses of comparable funds identified by Broadridge as well as all other funds in the same investment classification/category (the “Broadridge expense group and
universe”), (iii) information provided by MFS on the advisory fees of portfolios of other clients of MFS, including institutional separate accounts and other clients, (iv) information as to whether and to what extent applicable expense
waivers, reimbursements or fee “breakpoints” are observed for the Fund, (v) information regarding MFS’ financial results and financial condition, including MFS’ and certain of its affiliates’ estimated profitability
from services performed for the Fund and the MFS Funds as a whole, and compared to MFS’ institutional business, (vi) MFS’ views regarding the outlook for the mutual fund industry and the strategic business plans of MFS, (vii)
descriptions of various functions performed by MFS for the Funds, such as compliance monitoring and portfolio trading practices, and (viii)
Board Review of Investment
Advisory Agreement - continued
information regarding the overall organization of MFS, including information
about MFS’ senior management and other personnel providing investment advisory, administrative and other services to the Fund and the other MFS Funds. The comparative performance, fee and expense information prepared and provided by Broadridge
was not independently verified and the independent Trustees did not independently verify any information provided to them by MFS.
The Trustees’ conclusion as to the continuation of the
investment advisory agreement was based on a comprehensive consideration of all information provided to the Trustees and not the result of any single factor. Some of the factors that figured particularly in the Trustees’ deliberations are
described below, although individual Trustees may have evaluated the information presented differently from one another, giving different weights to various factors. It is also important to recognize that the fee arrangements for the Fund and other
MFS Funds are the result of years of review and discussion between the independent Trustees and MFS, that certain aspects of such arrangements may receive greater scrutiny in some years than in others, and that the Trustees’ conclusions may be
based, in part, on their consideration of these same arrangements during the course of the year and in prior years.
Based on information provided by Broadridge and MFS, the
Trustees reviewed the Fund’s total return investment performance as well as the Broadridge performance universe over various time periods. The Trustees placed particular emphasis on the total return performance of the Fund’s Class I
shares in comparison to the performance of funds in its Broadridge performance universe over the five-year period ended December 31, 2020, which the Trustees believed was a long enough period to reflect differing market conditions. The total return
performance of the Fund’s Class I shares was in the 2nd quintile relative to the other funds in the universe for this five-year period (the 1st quintile being the best performers and the 5th quintile being the worst performers). The total
return performance of the Fund’s Class I shares was in the 4th quintile for the one-year period and the 2nd quintile for the three-year period ended December 31, 2020 relative to the Broadridge performance universe. Because of the passage of
time, these performance results may differ from the performance results for more recent periods, including those shown elsewhere in this report.
In the course of their deliberations, the Trustees took into
account information provided by MFS in connection with the contract review meetings, as well as during investment review meetings conducted with portfolio management personnel during the course of the year regarding the Fund’s performance.
After reviewing these and related factors, the Trustees concluded, within the context of their overall conclusions regarding the investment advisory agreement, that they were satisfied with MFS’ responses and efforts relating to investment
performance.
In assessing the reasonableness of the
Fund’s advisory fee, the Trustees considered, among other information, the Fund’s advisory fee and the total expense ratio of the Fund’s Class I shares as a percentage of average daily net assets and the advisory fee and total
expense ratios of the Broadridge expense group based on information provided by Broadridge. The Trustees considered that, according to the data provided by Broadridge (which takes into account any fee reductions or expense limitations that were in
effect during the Fund’s last fiscal year), the Fund’s effective advisory fee rate and total expense ratio were each approximately at the Broadridge expense group median.
Board Review of Investment
Advisory Agreement - continued
The Trustees also considered the advisory fees charged by MFS
to any institutional separate accounts advised by MFS (“separate accounts”) and unaffiliated investment companies for which MFS serves as subadviser (“subadvised funds”) that have comparable investment strategies to the Fund,
if any. In comparing these fees, the Trustees considered information provided by MFS as to the generally broader scope of services provided by MFS to the Fund, as well as the more extensive regulatory burdens imposed on MFS in managing the Fund, in
comparison to separate accounts and subadvised funds. The Trustees also considered the higher demands placed on MFS’ investment personnel and trading infrastructure as a result of the daily cash in-flows and out-flows of the Fund in comparison
to separate accounts.
The Trustees also considered
whether the Fund may benefit from any economies of scale in the management of the Fund in the event of growth in assets of the Fund and/or growth in assets of the MFS Funds as a whole. They noted that the Fund’s advisory fee rate schedule is
subject to contractual breakpoints that reduce the Fund’s advisory fee rate on average daily net assets over $1 billion, $2.5 billion, $5 billion, $10 billion, $20 billion, and $30 billion. They also noted that MFS has agreed to implement
additional contractual breakpoints that reduce its advisory fee rate on the Fund’s average daily net assets over $40 billion and $50 billion effective August 1, 2021. The Trustees also noted that MFS has agreed in writing to waive a portion of
the management fees of certain MFS Funds, including the Fund, if the total combined assets of certain funds within the MFS Funds’ complex increase above agreed upon thresholds (the “group fee waiver”), enabling the Fund’s
shareholders to share in the benefits from any economies of scale at the complex level. The group fee waiver is reviewed and renewed annually between the Board and MFS. The Trustees concluded that the breakpoints and the group fee waiver were
sufficient to allow the Fund to benefit from economies of scale as its assets and overall complex assets grow.
The Trustees also considered information prepared by MFS
relating to MFS’ costs and profits with respect to the Fund, the MFS Funds considered as a group, and other investment companies and accounts advised by MFS, as well as MFS’ methodologies used to determine and allocate its costs to the
MFS Funds, the Fund and other accounts and products for purposes of estimating profitability.
After reviewing these and other factors described herein, the
Trustees concluded, within the context of their overall conclusions regarding the investment advisory agreement, that the advisory fees charged to the Fund represent reasonable compensation in light of the services being provided by MFS to the
Fund.
In addition, the Trustees considered MFS’
resources and related efforts to continue to retain, attract and motivate capable personnel to serve the Fund. The Trustees also considered current and developing conditions in the financial services industry, including the presence of large and
well-capitalized companies which are spending, and appear to be prepared to continue to spend, substantial sums to engage personnel and to provide services to competing investment companies. In this regard, the Trustees also considered the financial
resources of MFS and its ultimate parent, Sun Life Financial Inc. The Trustees also considered the advantages and possible disadvantages to the Fund of having an adviser that also serves other investment companies as well as other accounts.
Board Review of Investment
Advisory Agreement - continued
The Trustees also considered the nature, quality, cost, and
extent of administrative, transfer agency, and distribution services provided to the Fund by MFS and its affiliates under agreements and plans other than the investment advisory agreement, including any 12b-1 fees the Fund pays to MFS Fund
Distributors, Inc., an affiliate of MFS. The Trustees also considered the nature, extent and quality of certain other services MFS performs or arranges for on the Fund’s behalf, which may include securities lending programs, directed expense
payment programs, class action recovery programs, and MFS’ interaction with third-party service providers, principally custodians and sub-custodians. The Trustees concluded that the various non-advisory services provided by MFS and its
affiliates on behalf of the Fund were satisfactory.
The
Trustees considered so-called “fall-out benefits” to MFS such as reputational value derived from serving as investment manager to the MFS Funds. The Trustees also considered that MFS discontinued its historic practice of obtaining
investment research from portfolio brokerage commissions paid by certain MFS Funds effective January 2018, and directly pays or voluntarily reimburses a Fund, if applicable, for the costs of external research acquired through the use of the
Fund’s portfolio brokerage commissions.
Based on
their evaluation of factors that they deemed to be material, including those factors described above, the Board of Trustees, including the independent Trustees, concluded that the Fund’s investment advisory agreement with MFS should be
continued for an additional one-year period, commencing August 1, 2021.
Proxy
Voting Policies and Information
MFS votes proxies on
behalf of the fund pursuant to proxy voting policies and procedures that are available without charge, upon request, by calling 1-800-225-2606, by visiting mfs.com/proxyvoting, or by visiting the SEC’s
Web site at http://www.sec.gov.
Information regarding how the fund voted proxies relating to
portfolio securities during the most recent twelve-month period ended June 30 is available by August 31 of each year without charge by visiting mfs.com/proxyvoting, or by visiting the SEC’s Web site at http://www.sec.gov.
Quarterly Portfolio Disclosure
The fund files a complete schedule of portfolio holdings with
the SEC for the first and third quarters of each fiscal year as an exhibit to its reports on Form N-PORT. The fund's Form N-PORT reports are available on the SEC's Web site at http://www.sec.gov. A
shareholder can obtain the portfolio holdings report for the first and third quarters of the fund's fiscal year at mfs.com/openendfunds by choosing the fund's name and then scrolling to the
“Resources” section and clicking on the “Prospectus and Reports” tab.
Further Information
From time to time, MFS may post important information about the
fund or the MFS Funds on the MFS Web site (mfs.com). This information is available at https://www.mfs.com/announcements or at
mfs.com/openendfunds by choosing the fund’s name and then scrolling to the “Resources” section and clicking on the “Announcements” tab, if any.
Information About Fund Contracts and Legal Claims
The fund has entered into contractual arrangements with an
investment adviser, administrator, distributor, shareholder servicing agent, 529 program manager (if applicable), and custodian who each provide services to the fund. Unless expressly stated otherwise, shareholders are not parties to, or intended
beneficiaries of these contractual arrangements, and these contractual arrangements are not intended to create any shareholder right to enforce them against the service providers or to seek any remedy under them against the service providers, either
directly or on behalf of the fund.
Under the
Trust’s By-Laws and Declaration of Trust, any claims asserted against or on behalf of the MFS Funds, including claims against Trustees and Officers, must be brought in state and federal courts located within the Commonwealth of
Massachusetts.
Federal Tax Information (unaudited)
The
fund will notify shareholders of amounts for use in preparing 2021 income tax forms in January 2022. The following information is provided pursuant to provisions of the Internal Revenue Code.
The fund designates $1,755,957,000 as capital gain dividends
paid during the fiscal year.
| FACTS
|
WHAT
DOES MFS DO WITH YOUR PERSONAL INFORMATION? |
| Why?
|
Financial
companies choose how they share your personal information. Federal law gives consumers the right to limit some but not all sharing. Federal law also requires us to tell you how we collect, share, and protect your personal information. Please read
this notice carefully to understand what we do. |
| What?
|
The types of
personal information we collect and share depend on the product or service you have with us. This information can include: |
| • Social
Security number and account balances |
| • Account
transactions and transaction history |
| • Checking
account information and wire transfer instructions |
| When
you are no longer our customer, we continue to share your information as described in this notice. |
| How?
|
All
financial companies need to share customers' personal information to run their everyday business. In the section below, we list the reasons financial companies can share their customers' personal information; the reasons MFS chooses to share; and
whether you can limit this sharing. |
Reasons
we can share your
personal information |
Does
MFS share? |
Can
you limit
this sharing? |
For
our everyday business purposes –
such as to process your transactions, maintain your
account(s), respond to court orders and legal
investigations, or report to credit bureaus |
Yes
|
No
|
For
our marketing purposes –
to offer our products and services to you |
No
|
We
don't share |
For
joint marketing with other
financial companies |
No
|
We
don't share |
For
our affiliates' everyday business purposes –
information about your transactions and experiences |
No
|
We
don't share |
For
our affiliates' everyday business purposes –
information about your creditworthiness |
No
|
We
don't share |
| For
nonaffiliates to market to you |
No
|
We
don't share |
| Questions?
|
Call
800-225-2606 or go to mfs.com. |
| Who
we are |
| Who
is providing this notice? |
MFS
Funds, MFS Investment Management, MFS Institutional Advisors, Inc., and MFS Heritage Trust Company. |
| What
we do |
How
does MFS
protect my personal
information? |
To
protect your personal information from unauthorized access and use, we use security measures that comply with federal law. These measures include procedural, electronic, and physical safeguards for the protection of the personal information we
collect about you. |
How
does MFS
collect my personal
information? |
We
collect your personal information, for example, when you |
| • open
an account or provide account information |
| • direct
us to buy securities or direct us to sell your securities |
| • make
a wire transfer |
| We
also collect your personal information from others, such as credit bureaus, affiliates, or other companies. |
| Why
can't I limit all sharing? |
Federal
law gives you the right to limit only |
| • sharing
for affiliates' everyday business purposes – information about your creditworthiness |
| • affiliates
from using your information to market to you |
| • sharing
for nonaffiliates to market to you |
| State
laws and individual companies may give you additional rights to limit sharing. |
| Definitions
|
| Affiliates
|
Companies
related by common ownership or control. They can be financial and nonfinancial companies. |
| •
MFS does not share personal information with affiliates, except for everyday business purposes as described on page one of this notice. |
| Nonaffiliates
|
Companies
not related by common ownership or control. They can be financial and nonfinancial companies. |
| •
MFS does not share with nonaffiliates so they can market to you. |
| Joint
marketing |
A
formal agreement between nonaffiliated financial companies that together market financial products or services to you. |
| •
MFS doesn't jointly market. |
| Other
important information |
| If
you own an MFS product or receive an MFS service in the name of a third party such as a bank or broker-dealer, their privacy policy may apply to you instead of ours. |
Save paper with eDelivery.
MFS® will send you prospectuses, reports, and proxies directly via e-mail so you will get information faster with less mailbox clutter.
To sign up:
1. Go to mfs.com.
2. Log in via MFS® Access.
3. Select eDelivery.
If you own your MFS fund shares through a financial institution
or a retirement plan, MFS® TALK, MFS® Access, or eDelivery may not be available to you.
CONTACT
WEB SITE
mfs.com
MFS TALK
1-800-637-8255
24 hours a day
ACCOUNT SERVICE AND LITERATURE
Shareholders
1-800-225-2606
Financial advisors
1-800-343-2829
Retirement plan services
1-800-637-1255
MAILING ADDRESS
MFS Service Center, Inc.
P.O. Box 219341
Kansas City, MO 64121-9341
OVERNIGHT MAIL
MFS Service Center, Inc.
Suite 219341
430 W 7th Street
Kansas City, MO 64105-1407
Item 1(b):
Not applicable.
The Registrant has adopted a Code of Ethics (the “Code”) pursuant to Section 406 of the Sarbanes-Oxley Act and as defined in Form N-CSR that applies to the Registrant’s principal executive officer and principal financial and accounting officer. During the period covered by this report, the Registrant has not amended any provision in the
Code that relates to an element of the Code’s definition enumerated in paragraph (b) of Item 2 of this Form N-CSR. During the period covered by this report, the Registrant did not grant a waiver,
including an implicit waiver, from any provision of the Code.
A copy of the Code is filed as an exhibit to this Form
N-CSR.
| ITEM 3. |
AUDIT COMMITTEE FINANCIAL EXPERT. |
Messrs. Steven E. Buller, James Kilman, and Clarence Otis, Jr. and Ms. Maryanne L. Roepke, members of the Audit Committee, have been determined by
the Board of Trustees in their reasonable business judgment to meet the definition of “audit committee financial expert” as such term is defined in Form N-CSR. In addition, Messrs. Buller,
Kilman, and Otis and Ms. Roepke are “independent” members of the Audit Committee (as such term has been defined by the Securities and Exchange Commission in regulations implementing Section 407 of the Sarbanes-Oxley Act of 2002).
The Securities and Exchange Commission has stated that the designation of a person as an audit committee financial expert pursuant to this Item 3 on the Form N-CSR does not impose on such a person any duties,
obligations or liability that are greater than the duties, obligations or liability imposed on such person as a member of the Audit Committee and the Board of Trustees in the absence of such designation or identification.
| ITEM 4. |
PRINCIPAL ACCOUNTANT FEES AND SERVICES. |
Items 4(a) through 4(d) and 4(g):
The Board of Trustees
has appointed Deloitte & Touche LLP (“Deloitte”) to serve as independent accountants to the series of the Registrant (the series referred to as the “Fund”). The tables below set forth the audit fees billed to the Fund as
well as fees for non-audit services provided to the Fund and/or to the Fund’s investment adviser, Massachusetts Financial Services Company (“MFS”), and to various entities either controlling,
controlled by, or under common control with MFS that provide ongoing services to the Fund (“MFS Related Entities”).
For the fiscal years ended
November 30, 2021 and 2020, audit fees billed to the Fund by Deloitte were as follows:
|
|
|
|
|
|
|
|
|
| |
|
Audit Fees |
|
| |
|
2021 |
|
|
2020 |
|
| Fees billed by Deloitte: |
|
|
|
|
|
|
|
|
| MFS Growth Fund |
|
|
57,213 |
|
|
|
56,434 |
|
For the fiscal years ended November 30, 2021 and 2020, fees billed by Deloitte for audit-related, tax and
other services provided to the Fund and for audit-related, tax and other services provided to MFS and MFS Related Entities were as follows:
|
|
|
|
|
|
|
|
|
|
|
|
|
|
|
|
|
|
|
|
|
|
|
|
|
| |
|
Audit-Related Fees1 |
|
|
Tax Fees2 |
|
|
All Other Fees3 |
|
| |
|
2021 |
|
|
2020 |
|
|
2021 |
|
|
2020 |
|
|
2021 |
|
|
2020 |
|
| Fees billed by Deloitte: |
|
|
|
|
|
|
|
|
|
|
|
|
|
|
|
|
|
|
|
|
|
|
|
|
| To MFS Growth Fund |
|
|
0 |
|
|
|
0 |
|
|
|
7,761 |
|
|
|
7,509 |
|
|
|
0 |
|
|
|
0 |
|
|
|
|
|
|
|
|
|
|
|
|
|
|
|
|
|
|
|
|
|
|
|
|
|
|
| |
|
Audit-Related Fees1 |
|
|
Tax Fees2 |
|
|
All Other Fees3 |
|
| |
|
2021 |
|
|
2020 |
|
|
2021 |
|
|
2020 |
|
|
2021 |
|
|
2020 |
|
| Fees billed by Deloitte: |
|
|
|
|
|
|
|
|
|
|
|
|
|
|
|
|
|
|
|
|
|
|
|
|
| To MFS and MFS Related Entities of MFS Growth Fund* |
|
|
0 |
|
|
|
0 |
|
|
|
0 |
|
|
|
0 |
|
|
|
5,390 |
|
|
|
5,390 |
|
|
|
|
|
|
|
|
|
|
| |
|
Aggregate Fees for Non-audit
Services |
|
| |
2021 |
|
|
2020 |
|
| Fees Billed by Deloitte: |
|
|
|
|
|
|
|
|
| To MFS Growth Fund, MFS and MFS Related
Entities# |
|
|
13,151 |
|
|
|
906,649 |
|
| * |
This amount reflects the fees billed to MFS and MFS Related Entities for
non-audit services relating directly to the operations and financial reporting of the Fund (portions of which services also related to the operations and financial reporting of other funds within the MFS Funds
complex). |
| # |
This amount reflects the aggregate fees billed by Deloitte for
non-audit services rendered to the Fund and for non-audit services rendered to MFS and the MFS Related Entities. |
| 1 |
The fees included under “Audit-Related Fees” are fees related to assurance and related services that
are reasonably related to the performance of the audit or review of financial statements, but not reported under ‘‘Audit Fees,’’ including accounting consultations, agreed-upon procedure reports, attestation reports, comfort
letters and internal control reviews. |
| 2 |
The fees included under “Tax Fees” are fees associated with tax compliance, tax advice and tax
planning, including services relating to the filing or amendment of federal, state or local income tax returns, regulated investment company qualification reviews and tax distribution and analysis. |
| 3 |
The fees included under “All Other Fees” are fees for products and services provided by Deloitte
other than those reported under “Audit Fees,” “Audit-Related Fees” and “Tax Fees”. |
Item 4(e)(1):
Set forth below are the policies and procedures established by the Audit Committee of the Board of Trustees relating to the pre-approval of audit and non-audit related services:
To the extent required by
applicable law, pre-approval by the Audit Committee of the Board is needed for all audit and permissible non-audit services rendered to the Fund and all permissible non-audit services rendered to MFS or MFS Related Entities if the services relate directly to the operations and financial reporting of the Registrant. Pre-approval is
currently on an engagement-by-engagement basis. In the event pre-approval
of such services is necessary between regular meetings of the Audit Committee and it is not practical to wait to seek pre-approval at the next regular meeting of the Audit Committee, pre-approval of such services may be referred to the Chair of the Audit Committee for approval; provided that the Chair may not pre-approve any individual engagement for such
services exceeding $50,000 or multiple engagements for such services in the aggregate exceeding $100,000 between such regular meetings of the Audit Committee. Any engagement pre-approved by the Chair between
regular meetings of the Audit Committee shall be presented for ratification by the entire Audit Committee at its next regularly scheduled meeting.
Item 4(e)(2):
None, or 0%, of the services relating
to the Audit-Related Fees, Tax Fees and All Other Fees paid by the Fund and MFS and MFS Related Entities relating directly to the operations and financial reporting of the Registrant disclosed above were approved by the audit committee pursuant to
paragraphs (c)(7)(i)(C) of Rule 2-01 of Regulation S-X (which permits audit committee approval after the start of the engagement with respect to services other than
audit, review or attest services, if certain conditions are satisfied).
Item 4(f):
Not applicable.
Item 4(h):
The Registrant’s Audit Committee has considered whether the provision by a Registrant’s independent registered public accounting firm of non-audit services to MFS and MFS Related Entities that were not pre-approved by the Committee (because such services were provided prior to the effectiveness of SEC rules
requiring pre-approval or because such services did not relate directly to the operations and financial reporting of the Registrant) was compatible with maintaining the independence of the independent
registered public accounting firm as the Registrant’s principal auditors.
| ITEM 5. |
AUDIT COMMITTEE OF LISTED REGISTRANTS. |
Not applicable to the Registrant.
A schedule of investments of the series of the Registrant is included as part of the report to shareholders of such series under Item 1(a) of this Form N-CSR.
| ITEM 7. |
DISCLOSURE OF PROXY VOTING POLICIES AND PROCEDURES FOR CLOSED-END
MANAGEMENT INVESTMENT COMPANIES. |
Not applicable to the Registrant.
| ITEM 8. |
PORTFOLIO MANAGERS OF CLOSED-END MANAGEMENT INVESTMENT COMPANIES.
|
Not applicable to the Registrant.
| ITEM 9. |
PURCHASES OF EQUITY SECURITIES BY CLOSED-END MANAGEMENT INVESTMENT
COMPANY AND AFFILIATED PURCHASERS. |
Not applicable to the Registrant.
| ITEM 10. |
SUBMISSION OF MATTERS TO A VOTE OF SECURITY HOLDERS. |
There were no material changes to the procedures by which shareholders may send recommendations to the Board for nominees to the Registrant’s Board since
the Registrant last provided disclosure as to such procedures in response to the requirements of Item 407 (c)(2)(iv) of Regulation S-K or this Item.
| ITEM 11. |
CONTROLS AND PROCEDURES. |
| (a) |
Based upon their evaluation of the effectiveness of the registrant’s disclosure controls and procedures
(as defined in Rule 30a-3(c) under the Investment Company Act of 1940 (the “Act”)) as conducted within 90 days of the filing date of this report on Form N-CSR,
the registrant’s principal financial officer and principal executive officer have concluded that those disclosure controls and procedures provide reasonable assurance that the material information required to be disclosed by the registrant on
this report is recorded, processed, summarized and reported within the time periods specified in the Securities and Exchange Commission’s rules and forms. |
| (b) |
There were no changes in the registrant’s internal controls over financial reporting (as defined in Rule 30a-3(d) under the Act) that occurred during the period covered by the report that have materially affected, or are reasonably likely to materially affect, the registrant’s internal control over financial
reporting. |
| ITEM 12. |
DISCLOSURE OF SECURITIES LENDING ACTIVITIES FOR CLOSED-END
MANAGEMENT INVESTMENT COMPANIES. |
Not applicable to the Registrant.
| (a) (1) |
Any code of ethics, or amendment thereto, that is the subject of the disclosure required by Item 2, to the
extent that the |
| |
|
registrant intends to satisfy the Item 2 requirements through filing of an exhibit: Attached hereto as
EX-99.COE. |
| |
(2) |
A separate certification for each principal executive officer and principal financial officer of the registrant
as required by Rule 30a-2(a) under the Act (17 CFR 270.30a-2): Attached hereto as EX-99.302CERT.
|
| |
(3) |
Any written solicitation to purchase securities under Rule 23c-1 under
the Act (17 CFR 270.23c-1) sent or given during the period covered by the report by or on behalf of the registrant to 10 or more persons. Not applicable. |
| |
(4) |
Change in the registrant’s independent public accountant. Not applicable. |
| (b) |
If the report is filed under Section 13(a) or 15(d) of the Exchange Act, provide the certifications
required by Rule 30a-2(b) under the Act (17 CFR 270.30a-2(b)), Rule 13a-14(b) or Rule
15d-14(b) under the Exchange Act (17 CFR 240.13a-14(b) or 240.15d-14(b)) and Section 1350 of Chapter 63 of Title 18 of the
United States Code (18 U.S.C. 1350) as an exhibit. A certification furnished pursuant to this paragraph will not be deemed “filed” for the purposes of Section 18 of the Exchange Act (15 U.S.C. 78r), or otherwise subject to the
liability of that section. Such certification will not be deemed to be incorporated by reference into any filing under the Securities Act of 1933 or the Exchange Act, except to the extent that the registrant specifically incorporates it by
reference. Attached hereto as EX-99.906CERT |
Notice
A copy of the Amended and Restated Declaration of Trust, as amended, of the Registrant is on file with the Secretary of State of The Commonwealth of
Massachusetts and notice is hereby given that this instrument is executed on behalf of the Registrant by an officer of the Registrant as an officer and not individually and the obligations of or arising out of this instrument are not binding upon
any of the Trustees or shareholders individually, but are binding only upon the assets and property of the respective constituent series of the Registrant.
SIGNATURES
Pursuant to the requirements of the Securities Exchange Act of 1934 and the Investment Company Act of 1940, the registrant has duly caused this report to be
signed on its behalf by the undersigned, thereunto duly authorized.
(Registrant) MFS SERIES TRUST II
|
|
|
| By (Signature and Title)* |
|
/S/ DAVID L. DILORENZO |
|
|
David L. DiLorenzo, President |
Date: January 14, 2022
Pursuant to the requirements of the Securities Exchange Act of 1934 and the Investment Company Act of 1940, this report has been signed below by the following
persons on behalf of the registrant and in the capacities and on the dates indicated.
|
|
|
| By (Signature and Title)* |
|
/S/ DAVID L. DILORENZO |
|
|
David L. DiLorenzo, President
(Principal Executive Officer) |
Date: January 14, 2022
|
|
|
| By (Signature and Title)* |
|
/S/ JAMES O. YOST |
|
|
James O. Yost, Treasurer
(Principal Financial Officer
and Accounting Officer) |
Date: January 14, 2022
| * |
Print name and title of each signing officer under his or her signature. |