00007974682021FYFalseP1YP1Yhttp://fasb.org/us-gaap/2021-01-31#PropertyPlantAndEquipmentAndFinanceLeaseRightOfUseAssetAfterAccumulatedDepreciationAndAmortizationhttp://fasb.org/us-gaap/2021-01-31#PropertyPlantAndEquipmentAndFinanceLeaseRightOfUseAssetAfterAccumulatedDepreciationAndAmortizationhttp://fasb.org/us-gaap/2021-01-31#LongTermDebtAndCapitalLeaseObligationsCurrenthttp://fasb.org/us-gaap/2021-01-31#LongTermDebtAndCapitalLeaseObligationsCurrenthttp://fasb.org/us-gaap/2021-01-31#LongTermDebtAndCapitalLeaseObligationshttp://fasb.org/us-gaap/2021-01-31#LongTermDebtAndCapitalLeaseObligationsP3YP1Y00007974682021-01-012021-12-310000797468us-gaap:CommonStockMember2021-01-012021-12-310000797468oxy:WarrantsToPurchaseCommonStockMember2021-01-012021-12-3100007974682021-06-30iso4217:USD00007974682022-01-31xbrli:shares00007974682021-12-3100007974682020-12-310000797468us-gaap:OperatingSegmentsMemberoxy:OilAndGasSegmentMember2021-12-310000797468us-gaap:OperatingSegmentsMemberoxy:OilAndGasSegmentMember2020-12-310000797468us-gaap:OperatingSegmentsMemberoxy:ChemicalSegmentMember2021-12-310000797468us-gaap:OperatingSegmentsMemberoxy:ChemicalSegmentMember2020-12-310000797468oxy:MidstreamSegmentMemberus-gaap:OperatingSegmentsMember2021-12-310000797468oxy:MidstreamSegmentMemberus-gaap:OperatingSegmentsMember2020-12-310000797468us-gaap:CorporateNonSegmentMember2021-12-310000797468us-gaap:CorporateNonSegmentMember2020-12-31iso4217:USDxbrli:shares00007974682020-01-012020-12-3100007974682019-01-012019-12-310000797468oxy:GainLossonInterestRateSwapsandWarrantsNetMemberus-gaap:InterestRateSwapMember2021-01-012021-12-310000797468oxy:CorporateReconcilingItemsAndEliminationsMember2021-01-012021-12-310000797468us-gaap:PreferredStockMember2018-12-310000797468us-gaap:CommonStockMember2018-12-310000797468us-gaap:TreasuryStockMember2018-12-310000797468us-gaap:AdditionalPaidInCapitalMember2018-12-310000797468us-gaap:RetainedEarningsMember2018-12-310000797468us-gaap:AccumulatedOtherComprehensiveIncomeMember2018-12-310000797468us-gaap:NoncontrollingInterestMember2018-12-3100007974682018-12-310000797468us-gaap:RetainedEarningsMember2019-01-012019-12-310000797468us-gaap:NoncontrollingInterestMember2019-01-012019-12-310000797468us-gaap:AccumulatedOtherComprehensiveIncomeMember2019-01-012019-12-310000797468us-gaap:CommonStockMember2019-01-012019-12-310000797468us-gaap:AdditionalPaidInCapitalMember2019-01-012019-12-310000797468us-gaap:PreferredStockMember2019-01-012019-12-310000797468us-gaap:TreasuryStockMember2019-01-012019-12-310000797468us-gaap:PreferredStockMember2019-12-310000797468us-gaap:CommonStockMember2019-12-310000797468us-gaap:TreasuryStockMember2019-12-310000797468us-gaap:AdditionalPaidInCapitalMember2019-12-310000797468us-gaap:RetainedEarningsMember2019-12-310000797468us-gaap:AccumulatedOtherComprehensiveIncomeMember2019-12-310000797468us-gaap:NoncontrollingInterestMember2019-12-3100007974682019-12-310000797468us-gaap:RetainedEarningsMember2020-01-012020-12-310000797468us-gaap:AccumulatedOtherComprehensiveIncomeMember2020-01-012020-12-310000797468us-gaap:CommonStockMember2020-01-012020-12-310000797468us-gaap:AdditionalPaidInCapitalMember2020-01-012020-12-310000797468us-gaap:TreasuryStockMember2020-01-012020-12-310000797468us-gaap:PreferredStockMember2020-12-310000797468us-gaap:CommonStockMember2020-12-310000797468us-gaap:TreasuryStockMember2020-12-310000797468us-gaap:AdditionalPaidInCapitalMember2020-12-310000797468us-gaap:RetainedEarningsMember2020-12-310000797468us-gaap:AccumulatedOtherComprehensiveIncomeMember2020-12-310000797468us-gaap:NoncontrollingInterestMember2020-12-310000797468us-gaap:RetainedEarningsMember2021-01-012021-12-310000797468us-gaap:AccumulatedOtherComprehensiveIncomeMember2021-01-012021-12-310000797468us-gaap:AdditionalPaidInCapitalMember2021-01-012021-12-310000797468us-gaap:CommonStockMember2021-01-012021-12-310000797468us-gaap:TreasuryStockMember2021-01-012021-12-310000797468us-gaap:PreferredStockMember2021-12-310000797468us-gaap:CommonStockMember2021-12-310000797468us-gaap:TreasuryStockMember2021-12-310000797468us-gaap:AdditionalPaidInCapitalMember2021-12-310000797468us-gaap:RetainedEarningsMember2021-12-310000797468us-gaap:AccumulatedOtherComprehensiveIncomeMember2021-12-310000797468us-gaap:NoncontrollingInterestMember2021-12-310000797468srt:ParentCompanyMember2021-01-012021-12-310000797468srt:ParentCompanyMember2020-01-012020-12-310000797468srt:ParentCompanyMember2019-01-012019-12-310000797468us-gaap:VariableInterestEntityPrimaryBeneficiaryMember2021-01-012021-12-310000797468us-gaap:VariableInterestEntityPrimaryBeneficiaryMember2020-01-012020-12-310000797468us-gaap:VariableInterestEntityPrimaryBeneficiaryMember2019-01-012019-12-31oxy:segment0000797468oxy:WesternMidstreamOperatingLPMemberoxy:WesternMidstreamPartnersLPMember2019-08-082019-08-08xbrli:pure0000797468oxy:WesternMidstreamPartnersLPMember2021-12-310000797468oxy:WesternMidstreamPartnersLPMember2021-12-310000797468oxy:WesternMidstreamPartnersLPMember2021-01-012021-12-310000797468oxy:MozambiqueLNGAssetsMemberus-gaap:DiscontinuedOperationsDisposedOfBySaleMember2019-09-300000797468oxy:SouthAfricaAssetsMemberus-gaap:DiscontinuedOperationsDisposedOfBySaleMember2020-01-310000797468us-gaap:DiscontinuedOperationsHeldforsaleMemberoxy:GhanaOperationsMember2021-10-310000797468oxy:OutsideOfNorthAmericaMember2021-12-310000797468oxy:OutsideOfNorthAmericaMember2021-01-012021-12-310000797468srt:MinimumMemberoxy:ChemicalMember2021-01-012021-12-310000797468srt:MaximumMemberoxy:ChemicalMember2021-01-012021-12-310000797468oxy:OilAndGasSegmentMemberoxy:ProvedAndUnprovedNonCorePermianMember2021-01-012021-12-310000797468oxy:OilAndGasSegmentMemberoxy:ProvedAndUnprovedNonCorePermianMember2020-01-012020-12-310000797468oxy:GhanaAssetsMember2020-01-012020-12-310000797468oxy:WesternMidstreamPartnersLPMember2020-01-012020-12-310000797468oxy:QatarISSDMember2019-01-012019-12-310000797468us-gaap:SegmentContinuingOperationsMember2021-01-012021-12-310000797468us-gaap:SegmentContinuingOperationsMember2020-01-012020-12-310000797468us-gaap:SegmentContinuingOperationsMember2019-01-012019-12-310000797468srt:MinimumMember2021-01-012021-12-310000797468srt:MaximumMember2021-01-012021-12-310000797468oxy:OilAndGasSegmentMembersrt:OilReservesMembercountry:US2021-01-012021-12-310000797468us-gaap:NonUsMemberoxy:OilAndGasSegmentMembersrt:OilReservesMember2021-01-012021-12-310000797468oxy:OilAndGasSegmentMembersrt:OilReservesMemberus-gaap:IntersegmentEliminationMember2021-01-012021-12-310000797468oxy:OilAndGasSegmentMembersrt:OilReservesMember2021-01-012021-12-310000797468srt:NaturalGasLiquidsReservesMemberoxy:OilAndGasSegmentMembercountry:US2021-01-012021-12-310000797468srt:NaturalGasLiquidsReservesMemberus-gaap:NonUsMemberoxy:OilAndGasSegmentMember2021-01-012021-12-310000797468srt:NaturalGasLiquidsReservesMemberoxy:OilAndGasSegmentMemberus-gaap:IntersegmentEliminationMember2021-01-012021-12-310000797468srt:NaturalGasLiquidsReservesMemberoxy:OilAndGasSegmentMember2021-01-012021-12-310000797468oxy:OilAndGasSegmentMembercountry:USsrt:NaturalGasReservesMember2021-01-012021-12-310000797468us-gaap:NonUsMemberoxy:OilAndGasSegmentMembersrt:NaturalGasReservesMember2021-01-012021-12-310000797468oxy:OilAndGasSegmentMembersrt:NaturalGasReservesMemberus-gaap:IntersegmentEliminationMember2021-01-012021-12-310000797468oxy:OilAndGasSegmentMembersrt:NaturalGasReservesMember2021-01-012021-12-310000797468us-gaap:ProductAndServiceOtherMemberoxy:OilAndGasSegmentMembercountry:US2021-01-012021-12-310000797468us-gaap:NonUsMemberus-gaap:ProductAndServiceOtherMemberoxy:OilAndGasSegmentMember2021-01-012021-12-310000797468us-gaap:ProductAndServiceOtherMemberoxy:OilAndGasSegmentMemberus-gaap:IntersegmentEliminationMember2021-01-012021-12-310000797468us-gaap:ProductAndServiceOtherMemberoxy:OilAndGasSegmentMember2021-01-012021-12-310000797468oxy:OilAndGasSegmentMembercountry:US2021-01-012021-12-310000797468us-gaap:NonUsMemberoxy:OilAndGasSegmentMember2021-01-012021-12-310000797468oxy:OilAndGasSegmentMemberus-gaap:IntersegmentEliminationMember2021-01-012021-12-310000797468oxy:OilAndGasSegmentMember2021-01-012021-12-310000797468oxy:ChemicalSegmentMembercountry:US2021-01-012021-12-310000797468us-gaap:NonUsMemberoxy:ChemicalSegmentMember2021-01-012021-12-310000797468oxy:ChemicalSegmentMemberus-gaap:IntersegmentEliminationMember2021-01-012021-12-310000797468oxy:ChemicalSegmentMember2021-01-012021-12-310000797468oxy:MidstreamAndMarketingMembercountry:US2021-01-012021-12-310000797468oxy:MidstreamAndMarketingMemberus-gaap:NonUsMember2021-01-012021-12-310000797468oxy:MidstreamAndMarketingMemberus-gaap:IntersegmentEliminationMember2021-01-012021-12-310000797468oxy:MidstreamAndMarketingMember2021-01-012021-12-310000797468us-gaap:IntersegmentEliminationMember2021-01-012021-12-310000797468country:US2021-01-012021-12-310000797468us-gaap:NonUsMember2021-01-012021-12-310000797468oxy:OilAndGasSegmentMembersrt:OilReservesMembercountry:US2020-01-012020-12-310000797468us-gaap:NonUsMemberoxy:OilAndGasSegmentMembersrt:OilReservesMember2020-01-012020-12-310000797468oxy:OilAndGasSegmentMembersrt:OilReservesMemberus-gaap:IntersegmentEliminationMember2020-01-012020-12-310000797468oxy:OilAndGasSegmentMembersrt:OilReservesMember2020-01-012020-12-310000797468srt:NaturalGasLiquidsReservesMemberoxy:OilAndGasSegmentMembercountry:US2020-01-012020-12-310000797468srt:NaturalGasLiquidsReservesMemberus-gaap:NonUsMemberoxy:OilAndGasSegmentMember2020-01-012020-12-310000797468srt:NaturalGasLiquidsReservesMemberoxy:OilAndGasSegmentMemberus-gaap:IntersegmentEliminationMember2020-01-012020-12-310000797468srt:NaturalGasLiquidsReservesMemberoxy:OilAndGasSegmentMember2020-01-012020-12-310000797468oxy:OilAndGasSegmentMembercountry:USsrt:NaturalGasReservesMember2020-01-012020-12-310000797468us-gaap:NonUsMemberoxy:OilAndGasSegmentMembersrt:NaturalGasReservesMember2020-01-012020-12-310000797468oxy:OilAndGasSegmentMembersrt:NaturalGasReservesMemberus-gaap:IntersegmentEliminationMember2020-01-012020-12-310000797468oxy:OilAndGasSegmentMembersrt:NaturalGasReservesMember2020-01-012020-12-310000797468us-gaap:ProductAndServiceOtherMemberoxy:OilAndGasSegmentMembercountry:US2020-01-012020-12-310000797468us-gaap:NonUsMemberus-gaap:ProductAndServiceOtherMemberoxy:OilAndGasSegmentMember2020-01-012020-12-310000797468us-gaap:ProductAndServiceOtherMemberoxy:OilAndGasSegmentMemberus-gaap:IntersegmentEliminationMember2020-01-012020-12-310000797468us-gaap:ProductAndServiceOtherMemberoxy:OilAndGasSegmentMember2020-01-012020-12-310000797468oxy:OilAndGasSegmentMembercountry:US2020-01-012020-12-310000797468us-gaap:NonUsMemberoxy:OilAndGasSegmentMember2020-01-012020-12-310000797468oxy:OilAndGasSegmentMemberus-gaap:IntersegmentEliminationMember2020-01-012020-12-310000797468oxy:OilAndGasSegmentMember2020-01-012020-12-310000797468oxy:ChemicalSegmentMembercountry:US2020-01-012020-12-310000797468us-gaap:NonUsMemberoxy:ChemicalSegmentMember2020-01-012020-12-310000797468oxy:ChemicalSegmentMemberus-gaap:IntersegmentEliminationMember2020-01-012020-12-310000797468oxy:ChemicalSegmentMember2020-01-012020-12-310000797468oxy:MidstreamAndMarketingMembercountry:US2020-01-012020-12-310000797468oxy:MidstreamAndMarketingMemberus-gaap:NonUsMember2020-01-012020-12-310000797468oxy:MidstreamAndMarketingMemberus-gaap:IntersegmentEliminationMember2020-01-012020-12-310000797468oxy:MidstreamAndMarketingMember2020-01-012020-12-310000797468us-gaap:IntersegmentEliminationMember2020-01-012020-12-310000797468country:US2020-01-012020-12-310000797468us-gaap:NonUsMember2020-01-012020-12-310000797468oxy:OilAndGasSegmentMembersrt:OilReservesMembercountry:US2019-01-012019-12-310000797468us-gaap:NonUsMemberoxy:OilAndGasSegmentMembersrt:OilReservesMember2019-01-012019-12-310000797468oxy:OilAndGasSegmentMembersrt:OilReservesMemberus-gaap:IntersegmentEliminationMember2019-01-012019-12-310000797468oxy:OilAndGasSegmentMembersrt:OilReservesMember2019-01-012019-12-310000797468srt:NaturalGasLiquidsReservesMemberoxy:OilAndGasSegmentMembercountry:US2019-01-012019-12-310000797468srt:NaturalGasLiquidsReservesMemberus-gaap:NonUsMemberoxy:OilAndGasSegmentMember2019-01-012019-12-310000797468srt:NaturalGasLiquidsReservesMemberoxy:OilAndGasSegmentMemberus-gaap:IntersegmentEliminationMember2019-01-012019-12-310000797468srt:NaturalGasLiquidsReservesMemberoxy:OilAndGasSegmentMember2019-01-012019-12-310000797468oxy:OilAndGasSegmentMembercountry:USsrt:NaturalGasReservesMember2019-01-012019-12-310000797468us-gaap:NonUsMemberoxy:OilAndGasSegmentMembersrt:NaturalGasReservesMember2019-01-012019-12-310000797468oxy:OilAndGasSegmentMembersrt:NaturalGasReservesMemberus-gaap:IntersegmentEliminationMember2019-01-012019-12-310000797468oxy:OilAndGasSegmentMembersrt:NaturalGasReservesMember2019-01-012019-12-310000797468us-gaap:ProductAndServiceOtherMemberoxy:OilAndGasSegmentMembercountry:US2019-01-012019-12-310000797468us-gaap:NonUsMemberus-gaap:ProductAndServiceOtherMemberoxy:OilAndGasSegmentMember2019-01-012019-12-310000797468us-gaap:ProductAndServiceOtherMemberoxy:OilAndGasSegmentMemberus-gaap:IntersegmentEliminationMember2019-01-012019-12-310000797468us-gaap:ProductAndServiceOtherMemberoxy:OilAndGasSegmentMember2019-01-012019-12-310000797468oxy:OilAndGasSegmentMembercountry:US2019-01-012019-12-310000797468us-gaap:NonUsMemberoxy:OilAndGasSegmentMember2019-01-012019-12-310000797468oxy:OilAndGasSegmentMemberus-gaap:IntersegmentEliminationMember2019-01-012019-12-310000797468oxy:OilAndGasSegmentMember2019-01-012019-12-310000797468oxy:ChemicalSegmentMembercountry:US2019-01-012019-12-310000797468us-gaap:NonUsMemberoxy:ChemicalSegmentMember2019-01-012019-12-310000797468oxy:ChemicalSegmentMemberus-gaap:IntersegmentEliminationMember2019-01-012019-12-310000797468oxy:ChemicalSegmentMember2019-01-012019-12-310000797468oxy:MidstreamAndMarketingMembercountry:US2019-01-012019-12-310000797468oxy:MidstreamAndMarketingMemberus-gaap:NonUsMember2019-01-012019-12-310000797468oxy:MidstreamAndMarketingMemberus-gaap:IntersegmentEliminationMember2019-01-012019-12-310000797468oxy:MidstreamAndMarketingMember2019-01-012019-12-310000797468us-gaap:IntersegmentEliminationMember2019-01-012019-12-310000797468country:US2019-01-012019-12-310000797468us-gaap:NonUsMember2019-01-012019-12-310000797468oxy:WesternMidstreamPartnersLPMemberus-gaap:EquityMethodInvestmentNonconsolidatedInvesteeOrGroupOfInvesteesMember2021-12-310000797468oxy:OxychemInglesideFacilityMemberus-gaap:EquityMethodInvestmentNonconsolidatedInvesteeOrGroupOfInvesteesMember2021-12-310000797468oxy:OLCVRelatedMemberus-gaap:EquityMethodInvestmentNonconsolidatedInvesteeOrGroupOfInvesteesMember2021-12-310000797468oxy:OtherEquityInvestmentsMemberus-gaap:EquityMethodInvestmentNonconsolidatedInvesteeOrGroupOfInvesteesMember2021-12-310000797468us-gaap:EquityMethodInvestmentNonconsolidatedInvesteeOrGroupOfInvesteesMember2021-12-310000797468us-gaap:DisposalGroupDisposedOfBySaleNotDiscontinuedOperationsMemberoxy:WesternMidstreamPartnersLPMember2021-12-012021-12-310000797468us-gaap:DisposalGroupDisposedOfBySaleNotDiscontinuedOperationsMemberoxy:WesternMidstreamPartnersLPMember2021-03-012021-03-310000797468us-gaap:DisposalGroupDisposedOfBySaleNotDiscontinuedOperationsMemberoxy:WesternMidstreamPartnersLPMember2020-01-012020-03-310000797468us-gaap:DisposalGroupDisposedOfBySaleNotDiscontinuedOperationsMemberoxy:WesternMidstreamPartnersLPMember2020-07-012020-09-300000797468oxy:DolphinEnergyLimitedMember2021-12-310000797468oxy:DolphinEnergyLimitedMember2021-11-012021-11-300000797468oxy:AnadarkoPetroleumCorporationMember2021-12-310000797468us-gaap:EquityMethodInvestmentNonconsolidatedInvesteeOrGroupOfInvesteesMember2021-01-012021-12-310000797468us-gaap:EquityMethodInvestmentNonconsolidatedInvesteeOrGroupOfInvesteesMember2020-01-012020-12-310000797468us-gaap:EquityMethodInvestmentNonconsolidatedInvesteeOrGroupOfInvesteesMember2019-01-012019-12-310000797468us-gaap:EquityMethodInvestmentNonconsolidatedInvesteeOrGroupOfInvesteesMember2020-12-310000797468us-gaap:EquityMethodInvestmentNonconsolidatedInvesteeOrGroupOfInvesteesMember2019-12-310000797468oxy:PlainsAllAmericanPipelineLPMember2019-01-012019-12-310000797468oxy:WesternMidstreamPartnersLPMember2021-01-012021-12-310000797468oxy:GeneralPartnerofPlainsAllAmericanPipelineMember2019-01-012019-12-310000797468oxy:InglesideEthyleneLLCMember2021-01-012021-12-310000797468oxy:InglesideEthyleneLLCMember2020-01-012020-12-310000797468oxy:InglesideEthyleneLLCMember2019-01-012019-12-310000797468us-gaap:DiscontinuedOperationsDisposedOfBySaleMemberoxy:PermianBasinMemberus-gaap:SubsequentEventMember2022-01-012022-01-310000797468us-gaap:DiscontinuedOperationsHeldforsaleMemberoxy:PermianBasinMember2021-12-310000797468oxy:PermianEORBusinessUnitMember2021-11-012021-11-300000797468us-gaap:DiscontinuedOperationsDisposedOfBySaleMemberoxy:PermianBasinMember2021-07-012021-07-310000797468oxy:DJBasinMemberus-gaap:DiscontinuedOperationsDisposedOfBySaleMember2021-03-012021-03-310000797468us-gaap:DisposalGroupDisposedOfBySaleNotDiscontinuedOperationsMemberoxy:WesternMidstreamPartnersLPMember2021-01-012021-12-310000797468oxy:NonCorePermianAcreageMemberus-gaap:DiscontinuedOperationsDisposedOfBySaleMember2020-11-012020-12-310000797468us-gaap:DiscontinuedOperationsDisposedOfBySaleMemberoxy:OilAndGasColumbiaAssetsMember2020-12-012020-12-310000797468us-gaap:DiscontinuedOperationsDisposedOfBySaleMemberoxy:WyomingColoradoAndUtahAssetsMember2020-08-31utr:acre0000797468us-gaap:DiscontinuedOperationsDisposedOfBySaleMemberoxy:WyomingColoradoAndUtahAssetsMember2020-10-012020-10-310000797468us-gaap:DiscontinuedOperationsDisposedOfBySaleMemberoxy:WyomingColoradoAndUtahAssetsMember2020-10-3100007974682019-12-012019-12-310000797468oxy:FailedSaleLeasebackMember2019-12-310000797468oxy:EcopetrolJointVentureMember2019-11-012019-11-30utr:sqft0000797468oxy:EcopetrolMemberoxy:EcopetrolJointVentureMember2019-11-012019-11-300000797468oxy:EcopetrolMemberoxy:EcopetrolJointVentureMember2019-11-300000797468oxy:EcopetrolJointVentureMember2019-11-300000797468oxy:PlainsAllAmericanPipelineLPMember2019-09-012019-09-300000797468oxy:AnadarkoPetroleumCorporationMember2019-08-012019-08-310000797468oxy:AnadarkoPetroleumCorporationMember2019-08-082019-12-310000797468oxy:AnadarkoPetroleumCorporationMember2021-01-012021-12-310000797468oxy:AnadarkoPetroleumCorporationMember2020-01-012020-12-310000797468oxy:AnadarkoPetroleumCorporationMember2019-01-012019-12-310000797468oxy:GhanaOperationsMemberus-gaap:SegmentDiscontinuedOperationsMember2021-01-012021-12-310000797468oxy:GhanaOperationsMemberus-gaap:DiscontinuedOperationsDisposedOfBySaleMember2021-10-310000797468oxy:GhanaOperationsMemberus-gaap:DiscontinuedOperationsDisposedOfBySaleMember2021-10-012021-10-310000797468oxy:GhanaOperationsMemberus-gaap:SegmentDiscontinuedOperationsMember2021-01-012021-09-300000797468oxy:GhanaMozambiqueAndSouthAfricaAssetsMemberus-gaap:DiscontinuedOperationsDisposedOfBySaleMember2021-01-012021-12-310000797468oxy:GhanaMozambiqueAndSouthAfricaAssetsMemberus-gaap:DiscontinuedOperationsDisposedOfBySaleMember2020-01-012020-12-310000797468oxy:GhanaMozambiqueAndSouthAfricaAssetsMemberus-gaap:DiscontinuedOperationsDisposedOfBySaleMember2019-09-272019-12-310000797468us-gaap:DiscontinuedOperationsHeldforsaleMemberoxy:GhanaMozambiqueAndSouthAfricaAssetsMember2020-12-310000797468oxy:SeniorNotes4.850PercentDue2021Memberus-gaap:SeniorNotesMember2021-12-310000797468oxy:SeniorNotes4.850PercentDue2021Memberus-gaap:SeniorNotesMember2020-12-310000797468us-gaap:SeniorNotesMemberoxy:SeniorNotes2.600PercentDue2021Member2021-12-310000797468us-gaap:SeniorNotesMemberoxy:SeniorNotes2.600PercentDue2021Member2020-12-310000797468oxy:VariableRateBonds1193And2854Due2021Memberoxy:VariableRateBondsMember2020-12-310000797468oxy:VariableRateBonds1193And2854Due2021Memberoxy:VariableRateBondsMember2021-12-310000797468us-gaap:SeniorNotesMemberoxy:SeniorNotes2.700PercentDue2022Member2021-12-310000797468us-gaap:SeniorNotesMemberoxy:SeniorNotes2.700PercentDue2022Member2020-12-310000797468oxy:SeniorNotes3.125PercentDue2022Memberus-gaap:SeniorNotesMember2020-12-310000797468oxy:SeniorNotes3.125PercentDue2022Memberus-gaap:SeniorNotesMember2021-12-310000797468us-gaap:SeniorNotesMemberoxy:SeniorNotes2.600PercentDue2022Member2021-12-310000797468us-gaap:SeniorNotesMemberoxy:SeniorNotes2.600PercentDue2022Member2020-12-310000797468oxy:VariableRateBondsMemberoxy:VariableRateBonds1730And3360PercentDue2022Member2020-12-310000797468oxy:VariableRateBondsMemberoxy:VariableRateBonds1730And3360PercentDue2022Member2021-12-310000797468oxy:SeniorNotes2.700PercentDue2023Memberus-gaap:SeniorNotesMember2020-12-310000797468oxy:SeniorNotes2.700PercentDue2023Memberus-gaap:SeniorNotesMember2021-12-310000797468us-gaap:MediumTermNotesMemberoxy:MediumTermNotes8.750PercentDue2023Member2020-12-310000797468us-gaap:MediumTermNotesMemberoxy:MediumTermNotes8.750PercentDue2023Member2021-12-310000797468us-gaap:SeniorNotesMemberoxy:SeniorNotes2.900PercentDue2024Member2020-12-310000797468us-gaap:SeniorNotesMemberoxy:SeniorNotes2.900PercentDue2024Member2021-12-310000797468oxy:SeniorNotes6.950PercentDue2024Memberus-gaap:SeniorNotesMember2020-12-310000797468oxy:SeniorNotes6.950PercentDue2024Memberus-gaap:SeniorNotesMember2021-12-310000797468oxy:SeniorNotes3.450PercentDue2024Memberus-gaap:SeniorNotesMember2021-12-310000797468oxy:SeniorNotes3.450PercentDue2024Memberus-gaap:SeniorNotesMember2020-12-310000797468oxy:SeniorNotes8000PercentDue2025Memberus-gaap:SeniorNotesMember2020-12-310000797468oxy:SeniorNotes8000PercentDue2025Memberus-gaap:SeniorNotesMember2021-12-310000797468oxy:SeniorNotes5875PercentDue2025Memberus-gaap:SeniorNotesMember2020-12-310000797468oxy:SeniorNotes5875PercentDue2025Memberus-gaap:SeniorNotesMember2021-12-310000797468oxy:SeniorNotes3.500PercentDue2025Memberus-gaap:SeniorNotesMember2020-12-310000797468oxy:SeniorNotes3.500PercentDue2025Memberus-gaap:SeniorNotesMember2021-12-310000797468oxy:SeniorNotes5500PercentDue2025Memberus-gaap:SeniorNotesMember2020-12-310000797468oxy:SeniorNotes5500PercentDue2025Memberus-gaap:SeniorNotesMember2021-12-310000797468oxy:SeniorNotes5550PercentDue2026Memberus-gaap:SeniorNotesMember2021-12-310000797468oxy:SeniorNotes5550PercentDue2026Memberus-gaap:SeniorNotesMember2020-12-310000797468oxy:SeniorNotes3.200PercentDue2026Memberus-gaap:SeniorNotesMember2021-12-310000797468oxy:SeniorNotes3.200PercentDue2026Memberus-gaap:SeniorNotesMember2020-12-310000797468oxy:SeniorNotes3.400PercentDue2026Memberus-gaap:SeniorNotesMember2020-12-310000797468oxy:SeniorNotes3.400PercentDue2026Memberus-gaap:SeniorNotesMember2021-12-310000797468oxy:DebenturesMemberoxy:Debentures7.500PercentDue2026Member2020-12-310000797468oxy:DebenturesMemberoxy:Debentures7.500PercentDue2026Member2021-12-310000797468oxy:SeniorNotes8500PercentDue2027Memberus-gaap:SeniorNotesMember2021-12-310000797468oxy:SeniorNotes8500PercentDue2027Memberus-gaap:SeniorNotesMember2020-12-310000797468oxy:SeniorNotes3.000PercentDue2027Memberus-gaap:SeniorNotesMember2020-12-310000797468oxy:SeniorNotes3.000PercentDue2027Memberus-gaap:SeniorNotesMember2021-12-310000797468oxy:DebenturesMemberoxy:Debentures7.125PercentDue2027Member2020-12-310000797468oxy:DebenturesMemberoxy:Debentures7.125PercentDue2027Member2021-12-310000797468oxy:DebenturesMemberoxy:Debentures7.000PercentDue2027Member2021-12-310000797468oxy:DebenturesMemberoxy:Debentures7.000PercentDue2027Member2020-12-310000797468oxy:Debentures6.625PercentDue2028Memberoxy:DebenturesMember2020-12-310000797468oxy:Debentures6.625PercentDue2028Memberoxy:DebenturesMember2021-12-310000797468oxy:DebenturesMemberoxy:Debentures7.150PercentDue2028Member2021-12-310000797468oxy:DebenturesMemberoxy:Debentures7.150PercentDue2028Member2020-12-310000797468oxy:SeniorDebentures7.200PercentDue2028Memberus-gaap:SeniorNotesMember2021-12-310000797468oxy:SeniorDebentures7.200PercentDue2028Memberus-gaap:SeniorNotesMember2020-12-310000797468oxy:SeniorNotes6375PercentDue2028Memberus-gaap:SeniorNotesMember2020-12-310000797468oxy:SeniorNotes6375PercentDue2028Memberus-gaap:SeniorNotesMember2021-12-310000797468oxy:Debentures7.200PercentDue2029Memberoxy:DebenturesMember2020-12-310000797468oxy:Debentures7.200PercentDue2029Memberoxy:DebenturesMember2021-12-310000797468oxy:DebenturesMemberoxy:Debentures7.950PercentDue2029Member2020-12-310000797468oxy:DebenturesMemberoxy:Debentures7.950PercentDue2029Member2021-12-310000797468oxy:SeniorDebentures8.450PercentDue2029Memberus-gaap:SeniorNotesMember2020-12-310000797468oxy:SeniorDebentures8.450PercentDue2029Memberus-gaap:SeniorNotesMember2021-12-310000797468oxy:SeniorNotes3.500PercentDue2029Memberus-gaap:SeniorNotesMember2020-12-310000797468oxy:SeniorNotes3.500PercentDue2029Memberus-gaap:SeniorNotesMember2021-12-310000797468oxy:VariableRateBondsDue2030Memberoxy:VariableRateBondsMember2021-12-310000797468oxy:VariableRateBondsDue2030Memberoxy:VariableRateBondsMember2020-12-310000797468oxy:SeniorNotes8875PercentDue2030Memberus-gaap:SeniorNotesMember2020-12-310000797468oxy:SeniorNotes8875PercentDue2030Memberus-gaap:SeniorNotesMember2021-12-310000797468oxy:SeniorNotes6625PercentDue2030Memberus-gaap:SeniorNotesMember2020-12-310000797468oxy:SeniorNotes6625PercentDue2030Memberus-gaap:SeniorNotesMember2021-12-310000797468oxy:SeniorNotes6125PercentDue2031Memberus-gaap:SeniorNotesMember2021-12-310000797468oxy:SeniorNotes6125PercentDue2031Memberus-gaap:SeniorNotesMember2020-12-310000797468oxy:SeniorNotes7.500PercentDue2031Memberus-gaap:SeniorNotesMember2021-12-310000797468oxy:SeniorNotes7.500PercentDue2031Memberus-gaap:SeniorNotesMember2020-12-310000797468us-gaap:SeniorNotesMemberoxy:SeniorNotes7.875PercentDue2031Member2020-12-310000797468us-gaap:SeniorNotesMemberoxy:SeniorNotes7.875PercentDue2031Member2021-12-310000797468oxy:SeniorNotes6.450PercentDue2036Memberus-gaap:SeniorNotesMember2020-12-310000797468oxy:SeniorNotes6.450PercentDue2036Memberus-gaap:SeniorNotesMember2021-12-310000797468oxy:ZeroCouponSeniorNotesDue2036Memberus-gaap:SeniorNotesMember2021-12-310000797468oxy:ZeroCouponSeniorNotesDue2036Memberus-gaap:SeniorNotesMember2020-12-310000797468oxy:SeniorNotes4.300PercentDue2039Memberus-gaap:SeniorNotesMember2021-12-310000797468oxy:SeniorNotes4.300PercentDue2039Memberus-gaap:SeniorNotesMember2020-12-310000797468oxy:SeniorNotes7.950PercentDue2039Memberus-gaap:SeniorNotesMember2021-12-310000797468oxy:SeniorNotes7.950PercentDue2039Memberus-gaap:SeniorNotesMember2020-12-310000797468oxy:SeniorNotes6.200PercentDue2040Memberus-gaap:SeniorNotesMember2020-12-310000797468oxy:SeniorNotes6.200PercentDue2040Memberus-gaap:SeniorNotesMember2021-12-310000797468oxy:SeniorNotes4.500PercentDue2044Memberus-gaap:SeniorNotesMember2021-12-310000797468oxy:SeniorNotes4.500PercentDue2044Memberus-gaap:SeniorNotesMember2020-12-310000797468oxy:SeniorNotes4.625PercentDue2045Memberus-gaap:SeniorNotesMember2021-12-310000797468oxy:SeniorNotes4.625PercentDue2045Memberus-gaap:SeniorNotesMember2020-12-310000797468oxy:SeniorNotes6.600PercentDue2046Memberus-gaap:SeniorNotesMember2020-12-310000797468oxy:SeniorNotes6.600PercentDue2046Memberus-gaap:SeniorNotesMember2021-12-310000797468oxy:SeniorNotes4.400PercentDue2046Memberus-gaap:SeniorNotesMember2020-12-310000797468oxy:SeniorNotes4.400PercentDue2046Memberus-gaap:SeniorNotesMember2021-12-310000797468oxy:SeniorNotes4.100PercentDue2047Memberus-gaap:SeniorNotesMember2020-12-310000797468oxy:SeniorNotes4.100PercentDue2047Memberus-gaap:SeniorNotesMember2021-12-310000797468oxy:SeniorNotes4.200PercentDue2048Memberus-gaap:SeniorNotesMember2021-12-310000797468oxy:SeniorNotes4.200PercentDue2048Memberus-gaap:SeniorNotesMember2020-12-310000797468oxy:SeniorNotes4.400PercentDue2049Memberus-gaap:SeniorNotesMember2021-12-310000797468oxy:SeniorNotes4.400PercentDue2049Memberus-gaap:SeniorNotesMember2020-12-310000797468oxy:DebenturesMemberoxy:Debentures7.730PercentDue2096Member2021-12-310000797468oxy:DebenturesMemberoxy:Debentures7.730PercentDue2096Member2020-12-310000797468oxy:DebenturesMemberoxy:Debentures7.500PercentDue2096Member2020-12-310000797468oxy:DebenturesMemberoxy:Debentures7.500PercentDue2096Member2021-12-310000797468oxy:Debentures7.250PercentDue2096Memberoxy:DebenturesMember2021-12-310000797468oxy:Debentures7.250PercentDue2096Memberoxy:DebenturesMember2020-12-310000797468oxy:FourthQuarterIssuancesRepaymentsMemberoxy:SeniorNotesDue20466600Memberus-gaap:SeniorNotesMember2021-10-202021-10-200000797468oxy:FourthQuarterIssuancesRepaymentsMemberoxy:SeniorNotesDue20466600Memberus-gaap:SeniorNotesMember2021-10-200000797468oxy:FourthQuarterIssuancesRepaymentsMemberoxy:DebenturesDue2096Memberus-gaap:SeniorNotesMember2021-10-202021-10-200000797468oxy:SeniorNotesDueApril20222600Memberus-gaap:SeniorNotesMemberus-gaap:SubsequentEventMember2022-01-012022-01-310000797468oxy:SeniorNotesDueApril20222600Memberus-gaap:SeniorNotesMemberus-gaap:SubsequentEventMember2022-01-310000797468oxy:SeniorNotesDue20214850Memberoxy:FirstQuarterRepaymentsMemberus-gaap:SeniorNotesMember2021-03-310000797468oxy:SeniorNotesDue20214850Memberoxy:FirstQuarterRepaymentsMemberus-gaap:SeniorNotesMember2021-01-012021-03-310000797468oxy:VariableRateBondsDue2021Memberoxy:FirstQuarterRepaymentsMember2021-01-012021-03-310000797468oxy:ThirdQuarterRepaymentsMemberus-gaap:SeniorNotesMemberoxy:SeniorNotesDue2022Member2021-09-300000797468oxy:ThirdQuarterRepaymentsMemberus-gaap:SeniorNotesMemberoxy:SeniorNotesDue2022Member2021-07-012021-09-300000797468oxy:ThirdQuarterRepaymentsMemberus-gaap:SeniorNotesMemberoxy:SeniorNotesDue2023Member2021-09-300000797468oxy:ThirdQuarterRepaymentsMemberus-gaap:SeniorNotesMemberoxy:SeniorNotesDue2023Member2021-07-012021-09-300000797468oxy:ThirdQuarterRepaymentsMemberus-gaap:SeniorNotesMemberoxy:SeniorNotesDue20243450Member2021-09-300000797468oxy:ThirdQuarterRepaymentsMemberus-gaap:SeniorNotesMemberoxy:SeniorNotesDue20243450Member2021-07-012021-09-300000797468oxy:ThirdQuarterRepaymentsMemberoxy:SeniorNotesDue20242900Memberus-gaap:SeniorNotesMember2021-09-300000797468oxy:ThirdQuarterRepaymentsMemberoxy:SeniorNotesDue20242900Memberus-gaap:SeniorNotesMember2021-07-012021-09-300000797468oxy:ThirdQuarterRepaymentsMemberus-gaap:SeniorNotesMemberoxy:SeniorNotesDue2025Member2021-09-300000797468oxy:ThirdQuarterRepaymentsMemberus-gaap:SeniorNotesMemberoxy:SeniorNotesDue2025Member2021-07-012021-09-300000797468oxy:ThirdQuarterRepaymentsMemberoxy:SeniorNotesDue20263400Memberus-gaap:SeniorNotesMember2021-09-300000797468oxy:ThirdQuarterRepaymentsMemberoxy:SeniorNotesDue20263400Memberus-gaap:SeniorNotesMember2021-07-012021-09-300000797468oxy:ThirdQuarterRepaymentsMemberoxy:SeniorNotesDue20263200Memberus-gaap:SeniorNotesMember2021-09-300000797468oxy:ThirdQuarterRepaymentsMemberoxy:SeniorNotesDue20263200Memberus-gaap:SeniorNotesMember2021-07-012021-09-300000797468oxy:ThirdQuarterRepaymentsMemberoxy:SeniorNotesDue20212600Memberus-gaap:SeniorNotesMember2021-09-300000797468oxy:ThirdQuarterRepaymentsMemberoxy:SeniorNotesDue20212600Memberus-gaap:SeniorNotesMember2021-07-012021-09-300000797468oxy:FloatingInterestRateNotesMemberoxy:ThirdQuarterRepaymentsMemberus-gaap:SeniorNotesMember2021-07-012021-09-300000797468oxy:FourthQuarterIssuancesRepaymentsMemberoxy:SeniorNotesDue20464400NoteOneMemberus-gaap:SeniorNotesMember2021-12-310000797468oxy:FourthQuarterIssuancesRepaymentsMemberoxy:SeniorNotesDue20464400NoteOneMemberus-gaap:SeniorNotesMember2021-10-012021-12-310000797468oxy:FourthQuarterIssuancesRepaymentsMemberoxy:SeniorNotesDue20494400NoteOneMemberus-gaap:SeniorNotesMember2021-12-310000797468oxy:FourthQuarterIssuancesRepaymentsMemberoxy:SeniorNotesDue20494400NoteOneMemberus-gaap:SeniorNotesMember2021-10-012021-12-310000797468oxy:FourthQuarterIssuancesRepaymentsMemberoxy:Debentures7.730PercentDue2096Memberus-gaap:SeniorNotesMember2021-12-310000797468oxy:FourthQuarterIssuancesRepaymentsMemberoxy:Debentures7.730PercentDue2096Memberus-gaap:SeniorNotesMember2021-10-012021-12-310000797468oxy:FourthQuarterIssuancesRepaymentsMemberoxy:Debentures7.500PercentDue2026Memberus-gaap:SeniorNotesMember2021-12-310000797468oxy:FourthQuarterIssuancesRepaymentsMemberoxy:Debentures7.500PercentDue2026Memberus-gaap:SeniorNotesMember2021-10-012021-12-310000797468oxy:FourthQuarterIssuancesRepaymentsMemberoxy:Debentures7.250PercentDue2096Memberus-gaap:SeniorNotesMember2021-12-310000797468oxy:FourthQuarterIssuancesRepaymentsMemberoxy:Debentures7.250PercentDue2096Memberus-gaap:SeniorNotesMember2021-10-012021-12-310000797468oxy:FourthQuarterIssuancesRepaymentsMemberoxy:SeniorNotesDue20466600Memberus-gaap:SeniorNotesMember2021-12-310000797468oxy:FourthQuarterIssuancesRepaymentsMemberoxy:SeniorNotesDue20466600Memberus-gaap:SeniorNotesMember2021-10-012021-12-310000797468oxy:FourthQuarterIssuancesRepaymentsMemberus-gaap:SeniorNotesMemberoxy:SeniorNotesDue20243450Member2021-12-310000797468oxy:FourthQuarterIssuancesRepaymentsMemberus-gaap:SeniorNotesMemberoxy:SeniorNotesDue20243450Member2021-10-012021-12-310000797468oxy:FourthQuarterIssuancesRepaymentsMemberoxy:SeniorNotesDue20242900Memberus-gaap:SeniorNotesMember2021-12-310000797468oxy:FourthQuarterIssuancesRepaymentsMemberoxy:SeniorNotesDue20242900Memberus-gaap:SeniorNotesMember2021-10-012021-12-310000797468oxy:FourthQuarterIssuancesRepaymentsMemberus-gaap:SeniorNotesMemberoxy:SeniorNotesDue2025Member2021-12-310000797468oxy:FourthQuarterIssuancesRepaymentsMemberus-gaap:SeniorNotesMemberoxy:SeniorNotesDue2025Member2021-10-012021-12-310000797468oxy:FourthQuarterIssuancesRepaymentsMemberoxy:SeniorNotesDue20263400Memberus-gaap:SeniorNotesMember2021-12-310000797468oxy:FourthQuarterIssuancesRepaymentsMemberoxy:SeniorNotesDue20263400Memberus-gaap:SeniorNotesMember2021-10-012021-12-310000797468oxy:FourthQuarterIssuancesRepaymentsMemberoxy:SeniorNotesDue20263200Memberus-gaap:SeniorNotesMember2021-12-310000797468oxy:FourthQuarterIssuancesRepaymentsMemberoxy:SeniorNotesDue20263200Memberus-gaap:SeniorNotesMember2021-10-012021-12-310000797468oxy:FourthQuarterIssuancesRepaymentsMemberoxy:SeniorNotesDue20273000Memberus-gaap:SeniorNotesMember2021-12-310000797468oxy:FourthQuarterIssuancesRepaymentsMemberoxy:SeniorNotesDue20273000Memberus-gaap:SeniorNotesMember2021-10-012021-12-310000797468oxy:FourthQuarterIssuancesRepaymentsMemberoxy:SeniorNotesDue20293500Memberus-gaap:SeniorNotesMember2021-12-310000797468oxy:FourthQuarterIssuancesRepaymentsMemberoxy:SeniorNotesDue20293500Memberus-gaap:SeniorNotesMember2021-10-012021-12-310000797468oxy:FourthQuarterIssuancesRepaymentsMemberoxy:SeniorNotesDue20474100Memberus-gaap:SeniorNotesMember2021-12-310000797468oxy:FourthQuarterIssuancesRepaymentsMemberoxy:SeniorNotesDue20474100Memberus-gaap:SeniorNotesMember2021-10-012021-12-310000797468oxy:FourthQuarterIssuancesRepaymentsMemberus-gaap:SeniorNotesMemberoxy:SeniorNotesDue20484200Member2021-12-310000797468oxy:FourthQuarterIssuancesRepaymentsMemberus-gaap:SeniorNotesMemberoxy:SeniorNotesDue20484200Member2021-10-012021-12-310000797468oxy:FourthQuarterIssuancesRepaymentsMemberoxy:SeniorNotesDue20394300Memberus-gaap:SeniorNotesMember2021-12-310000797468oxy:FourthQuarterIssuancesRepaymentsMemberoxy:SeniorNotesDue20394300Memberus-gaap:SeniorNotesMember2021-10-012021-12-310000797468oxy:FourthQuarterIssuancesRepaymentsMemberoxy:SeniorNotesDue20444500Memberus-gaap:SeniorNotesMember2021-12-310000797468oxy:FourthQuarterIssuancesRepaymentsMemberoxy:SeniorNotesDue20444500Memberus-gaap:SeniorNotesMember2021-10-012021-12-310000797468oxy:FourthQuarterIssuancesRepaymentsMemberoxy:SeniorNotesDue20454625Memberus-gaap:SeniorNotesMember2021-12-310000797468oxy:FourthQuarterIssuancesRepaymentsMemberoxy:SeniorNotesDue20454625Memberus-gaap:SeniorNotesMember2021-10-012021-12-310000797468oxy:FourthQuarterIssuancesRepaymentsMemberus-gaap:SeniorNotesMemberoxy:SeniorNotesDue20223125Member2021-12-310000797468oxy:FourthQuarterIssuancesRepaymentsMemberus-gaap:SeniorNotesMemberoxy:SeniorNotesDue20223125Member2021-10-012021-12-310000797468oxy:FourthQuarterIssuancesRepaymentsMemberoxy:SeniorNotesDue20222700Memberus-gaap:SeniorNotesMember2021-12-310000797468oxy:FourthQuarterIssuancesRepaymentsMemberoxy:SeniorNotesDue20222700Memberus-gaap:SeniorNotesMember2021-10-012021-12-310000797468oxy:SeniorNotesDue20258000Memberoxy:IssuanceOfJuly2020NotesMemberus-gaap:SeniorNotesMember2020-12-310000797468oxy:SeniorNotesDue20258000Memberoxy:IssuanceOfJuly2020NotesMemberus-gaap:SeniorNotesMember2020-01-012020-12-310000797468oxy:SeniorNotesDue20278500Memberoxy:IssuanceOfJuly2020NotesMemberus-gaap:SeniorNotesMember2020-12-310000797468oxy:SeniorNotesDue20278500Memberoxy:IssuanceOfJuly2020NotesMemberus-gaap:SeniorNotesMember2020-01-012020-12-310000797468oxy:IssuanceOfJuly2020NotesMemberoxy:SeniorNotesDue20308875Memberus-gaap:SeniorNotesMember2020-12-310000797468oxy:IssuanceOfJuly2020NotesMemberoxy:SeniorNotesDue20308875Memberus-gaap:SeniorNotesMember2020-01-012020-12-310000797468oxy:JulyTenderAndPurchaseMemberoxy:SeniorNotesDueFebruary202141Memberus-gaap:SeniorNotesMember2020-12-310000797468oxy:JulyTenderAndPurchaseMemberoxy:SeniorNotesDueFebruary202141Memberus-gaap:SeniorNotesMember2020-01-012020-12-310000797468oxy:VariableRateBondsDue2021Memberoxy:JulyTenderAndPurchaseMember2020-01-012020-12-310000797468oxy:SeniorNotesDueMarch20214850Memberoxy:JulyTenderAndPurchaseMemberus-gaap:SeniorNotesMember2020-12-310000797468oxy:SeniorNotesDueMarch20214850Memberoxy:JulyTenderAndPurchaseMemberus-gaap:SeniorNotesMember2020-01-012020-12-310000797468oxy:JulyTenderAndPurchaseMemberus-gaap:SeniorNotesMemberoxy:SeniorNotesDueAugust20212600Member2020-12-310000797468oxy:JulyTenderAndPurchaseMemberus-gaap:SeniorNotesMemberoxy:SeniorNotesDueAugust20212600Member2020-01-012020-12-310000797468oxy:IssuanceOfAugust2020NotesMemberoxy:SeniorNotesDue20255875Memberus-gaap:SeniorNotesMember2020-12-310000797468oxy:IssuanceOfAugust2020NotesMemberoxy:SeniorNotesDue20255875Memberus-gaap:SeniorNotesMember2020-01-012020-12-310000797468oxy:SeniorNotesDue20286375Memberoxy:IssuanceOfAugust2020NotesMemberus-gaap:SeniorNotesMember2020-12-310000797468oxy:SeniorNotesDue20286375Memberoxy:IssuanceOfAugust2020NotesMemberus-gaap:SeniorNotesMember2020-01-012020-12-310000797468oxy:SeniorNotesDue20306625Memberoxy:IssuanceOfAugust2020NotesMemberus-gaap:SeniorNotesMember2020-12-310000797468oxy:SeniorNotesDue20306625Memberoxy:IssuanceOfAugust2020NotesMemberus-gaap:SeniorNotesMember2020-01-012020-12-310000797468oxy:AugustAndSeptemberTenderAndPurchaseMemberoxy:SeniorNotesDueFebruary202141Memberus-gaap:SeniorNotesMember2020-12-310000797468oxy:AugustAndSeptemberTenderAndPurchaseMemberoxy:SeniorNotesDueFebruary202141Memberus-gaap:SeniorNotesMember2020-01-012020-12-310000797468oxy:VariableRateBondsDue2021Memberoxy:AugustAndSeptemberTenderAndPurchaseMember2020-01-012020-12-310000797468oxy:AugustAndSeptemberTenderAndPurchaseMemberus-gaap:SeniorNotesMemberoxy:SeniorNotesDueAugust20212600Member2020-12-310000797468oxy:AugustAndSeptemberTenderAndPurchaseMemberus-gaap:SeniorNotesMemberoxy:SeniorNotesDueAugust20212600Member2020-01-012020-12-310000797468oxy:VariableRateBondsDue2022Memberoxy:AugustAndSeptemberTenderAndPurchaseMember2020-01-012020-12-310000797468oxy:SeniorNotesDueApril20222600Memberoxy:AugustAndSeptemberTenderAndPurchaseMemberus-gaap:SeniorNotesMember2020-12-310000797468oxy:SeniorNotesDueApril20222600Memberoxy:AugustAndSeptemberTenderAndPurchaseMemberus-gaap:SeniorNotesMember2020-01-012020-12-310000797468oxy:AugustAndSeptemberTenderAndPurchaseMemberus-gaap:SeniorNotesMemberoxy:SeniorNotesDueAugust20222700Member2020-12-310000797468oxy:AugustAndSeptemberTenderAndPurchaseMemberus-gaap:SeniorNotesMemberoxy:SeniorNotesDueAugust20222700Member2020-01-012020-12-310000797468oxy:SeniorNotesDueFebruary20232700Memberoxy:AugustAndSeptemberTenderAndPurchaseMemberus-gaap:SeniorNotesMember2020-12-310000797468oxy:SeniorNotesDueFebruary20232700Memberoxy:AugustAndSeptemberTenderAndPurchaseMemberus-gaap:SeniorNotesMember2020-01-012020-12-310000797468srt:AffiliatedEntityMemberoxy:NotePayableDue20386500Memberoxy:AugustExchangeMember2020-12-310000797468srt:AffiliatedEntityMemberoxy:NotePayableDue20386500Memberoxy:AugustExchangeMember2020-01-012020-12-310000797468oxy:VariableRateTermLoanDue2021Memberoxy:SeptemberRepaymentMember2020-01-012020-12-310000797468oxy:VariableRateBondsDueAugust2021Memberoxy:OctoberRepaymentMember2020-01-012020-12-310000797468oxy:SeniorNotes000PercentDueOctober2036Memberus-gaap:SeniorNotesMemberoxy:OctoberRepaymentMember2020-12-310000797468oxy:SeniorNotes000PercentDueOctober2036Memberus-gaap:SeniorNotesMemberoxy:OctoberRepaymentMember2020-01-012020-12-310000797468oxy:VariableRateTermLoanDueSeptember2021Memberoxy:OctoberRepaymentMember2020-01-012020-12-310000797468oxy:VariableRateTermLoanDueSeptember2021Memberoxy:NovemberRepaymentMember2020-01-012020-12-310000797468oxy:SeniorNotes5500PercentDue2025Memberoxy:IssuanceOfDecember2020NotesMemberus-gaap:SeniorNotesMember2020-12-310000797468oxy:SeniorNotes5500PercentDue2025Memberoxy:IssuanceOfDecember2020NotesMemberus-gaap:SeniorNotesMember2020-01-012020-12-310000797468oxy:SeniorNotes6125PercentDue2031Memberoxy:IssuanceOfDecember2020NotesMemberus-gaap:SeniorNotesMember2020-12-310000797468oxy:SeniorNotes6125PercentDue2031Memberoxy:IssuanceOfDecember2020NotesMemberus-gaap:SeniorNotesMember2020-01-012020-12-310000797468oxy:DecemberTenderAndPurchaseMemberus-gaap:SeniorNotesMemberoxy:SeniorNotesDueAugust20212600Member2020-12-310000797468oxy:DecemberTenderAndPurchaseMemberus-gaap:SeniorNotesMemberoxy:SeniorNotesDueAugust20212600Member2020-01-012020-12-310000797468oxy:SeniorNotesDueFebruary20223125Memberoxy:DecemberTenderAndPurchaseMemberus-gaap:SeniorNotesMember2020-12-310000797468oxy:SeniorNotesDueFebruary20223125Memberoxy:DecemberTenderAndPurchaseMemberus-gaap:SeniorNotesMember2020-01-012020-12-310000797468oxy:DecemberTenderAndPurchaseMemberoxy:SeniorNotesDueApril20222600Memberus-gaap:SeniorNotesMember2020-12-310000797468oxy:DecemberTenderAndPurchaseMemberoxy:SeniorNotesDueApril20222600Memberus-gaap:SeniorNotesMember2020-01-012020-12-310000797468oxy:DecemberTenderAndPurchaseMemberus-gaap:SeniorNotesMemberoxy:SeniorNotesDueAugust20222700Member2020-12-310000797468oxy:DecemberTenderAndPurchaseMemberus-gaap:SeniorNotesMemberoxy:SeniorNotesDueAugust20222700Member2020-01-012020-12-310000797468oxy:SeniorNotesDueFebruary20232700Memberoxy:DecemberTenderAndPurchaseMemberus-gaap:SeniorNotesMember2020-12-310000797468oxy:SeniorNotesDueFebruary20232700Memberoxy:DecemberTenderAndPurchaseMemberus-gaap:SeniorNotesMember2020-01-012020-12-310000797468oxy:VariableRateTermLoanDueSeptember2021Memberoxy:DecemberRepaymentMember2020-01-012020-12-310000797468oxy:DecemberRepaymentMemberoxy:SeniorNotesDueFebruary202141Memberus-gaap:SeniorNotesMember2020-12-310000797468oxy:DecemberRepaymentMemberoxy:SeniorNotesDueFebruary202141Memberus-gaap:SeniorNotesMember2020-01-012020-12-310000797468oxy:FourthQuarterIssuancesRepaymentsMemberoxy:SeniorNotesDueFrom2024Through2049Memberus-gaap:SeniorNotesMember2021-10-012021-12-310000797468oxy:FourthQuarterIssuancesRepaymentsMemberoxy:SeniorNotesDueFrom2024Through2049Memberus-gaap:SeniorNotesMember2021-12-310000797468oxy:FourthQuarterIssuancesRepaymentsMemberus-gaap:SeniorNotesMemberoxy:SeniorNotesDue2022Member2021-10-012021-12-310000797468oxy:ThirdQuarterRepaymentsMemberus-gaap:SeniorNotesMember2021-07-012021-09-300000797468oxy:FirstQuarterRepaymentsMemberus-gaap:SeniorNotesMember2021-01-012021-03-310000797468oxy:SecondQuarterRepaymentsMemberus-gaap:SeniorNotesMember2021-04-012021-06-300000797468us-gaap:SeniorNotesMember2020-12-310000797468oxy:SeniorNotesDue2021Memberus-gaap:SeniorNotesMember2020-07-012020-12-310000797468us-gaap:SeniorNotesMemberoxy:SeniorNotesDue2022Member2020-07-012020-12-310000797468us-gaap:SeniorNotesMemberoxy:SeniorNotesDue2023Member2020-07-012020-12-310000797468oxy:VariableRateTermLoanDue2021Member2020-07-012020-12-310000797468oxy:SeniorNotes000PercentDueOctober2036Memberus-gaap:SeniorNotesMember2020-07-012020-12-310000797468srt:AffiliatedEntityMember2020-08-012020-08-310000797468us-gaap:LineOfCreditMemberus-gaap:RevolvingCreditFacilityMember2021-12-300000797468us-gaap:LineOfCreditMemberus-gaap:RevolvingCreditFacilityMember2021-12-310000797468us-gaap:LineOfCreditMemberus-gaap:RevolvingCreditFacilityMember2021-01-012021-12-310000797468us-gaap:LineOfCreditMemberoxy:ReceivablesSecuritizationFacilityMember2021-12-310000797468us-gaap:EstimateOfFairValueFairValueDisclosureMemberus-gaap:FairValueInputsLevel1Member2021-12-310000797468us-gaap:EstimateOfFairValueFairValueDisclosureMemberus-gaap:FairValueInputsLevel1Member2020-12-310000797468oxy:OffshoreAndOnshoreDrillingRigsMember2021-12-310000797468oxy:CompressorsMember2021-12-310000797468oxy:StorageFacilitiesMember2021-12-310000797468oxy:OfficeSpaceMember2021-12-310000797468oxy:OtherFieldEquipmentMember2021-12-310000797468srt:MinimumMemberoxy:OilAndGasExplorationAndDevelopmentEquipmentMember2021-12-310000797468srt:MaximumMemberoxy:OilAndGasExplorationAndDevelopmentEquipmentMember2021-12-310000797468oxy:PipelinesRailCarsStorageFacilitiesEasementsAndRealEstateMember2021-12-310000797468oxy:RealEstateLeasesMembersrt:MinimumMember2021-12-310000797468oxy:RealEstateLeasesMembersrt:MaximumMember2021-12-310000797468us-gaap:PropertyPlantAndEquipmentMember2021-01-012021-12-310000797468us-gaap:PropertyPlantAndEquipmentMember2020-01-012020-12-310000797468us-gaap:CostOfSalesMember2021-01-012021-12-310000797468us-gaap:CostOfSalesMember2020-01-012020-12-310000797468us-gaap:SellingGeneralAndAdministrativeExpensesMember2021-01-012021-12-310000797468us-gaap:SellingGeneralAndAdministrativeExpensesMember2020-01-012020-12-310000797468oxy:GasPutsAndCallsMember2021-01-012021-12-310000797468oxy:OilCollarsAndCallsMember2020-01-012020-12-310000797468oxy:InterestRateSwapMandatoryTerminationDateSeptember20226709Member2021-12-310000797468oxy:InterestRateSwapMandatoryTerminationDateSeptember20236.445Member2021-12-310000797468us-gaap:InterestRateSwapMember2021-01-012021-12-310000797468oxy:InterestRateSwapMandatoryTerminationDateSeptember20216348Member2021-12-310000797468oxy:InterestRateSwapMandatoryTerminationDateSeptember20216662Member2021-12-310000797468us-gaap:InterestRateSwapMember2021-12-310000797468oxy:MarketingDerivativesMemberus-gaap:NondesignatedMember2021-01-012021-12-31iso4217:USDutr:bbliso4217:USDutr:Mcfe0000797468oxy:MarketingDerivativesMemberus-gaap:NondesignatedMember2020-01-012020-12-310000797468us-gaap:ShortMembersrt:CrudeOilAndNGLPerBarrelMember2021-01-012021-12-31utr:MMBbls0000797468us-gaap:ShortMembersrt:CrudeOilAndNGLPerBarrelMember2020-01-012020-12-310000797468us-gaap:ShortMemberoxy:NaturalGasPerCubicFootMember2021-01-012021-12-31utr:Bcf0000797468us-gaap:ShortMemberoxy:NaturalGasPerCubicFootMember2020-01-012020-12-310000797468us-gaap:CommonStockMemberoxy:AnadarkoPetroleumCorporationMemberus-gaap:WarrantMember2019-08-080000797468us-gaap:WarrantMemberus-gaap:AdditionalPaidInCapitalMember2020-05-290000797468us-gaap:CommonStockMemberus-gaap:WarrantMember2020-06-260000797468us-gaap:OtherCurrentAssetsMemberus-gaap:FairValueInputsLevel1Memberoxy:MarketingDerivativesMember2021-12-310000797468us-gaap:OtherCurrentAssetsMemberus-gaap:FairValueInputsLevel2Memberoxy:MarketingDerivativesMember2021-12-310000797468us-gaap:OtherCurrentAssetsMemberus-gaap:FairValueInputsLevel3Memberoxy:MarketingDerivativesMember2021-12-310000797468us-gaap:OtherCurrentAssetsMemberoxy:MarketingDerivativesMember2021-12-310000797468us-gaap:FairValueInputsLevel1Memberoxy:LongTermReceivablesAndOtherAssetsNetMemberoxy:MarketingDerivativesMember2021-12-310000797468us-gaap:FairValueInputsLevel2Memberoxy:LongTermReceivablesAndOtherAssetsNetMemberoxy:MarketingDerivativesMember2021-12-310000797468oxy:LongTermReceivablesAndOtherAssetsNetMemberus-gaap:FairValueInputsLevel3Memberoxy:MarketingDerivativesMember2021-12-310000797468oxy:MarketingDerivativesMemberoxy:LongTermReceivablesAndOtherAssetsNetMember2021-12-310000797468us-gaap:FairValueInputsLevel1Memberus-gaap:AccruedLiabilitiesMemberoxy:MarketingDerivativesMember2021-12-310000797468us-gaap:FairValueInputsLevel2Memberus-gaap:AccruedLiabilitiesMemberoxy:MarketingDerivativesMember2021-12-310000797468us-gaap:AccruedLiabilitiesMemberus-gaap:FairValueInputsLevel3Memberoxy:MarketingDerivativesMember2021-12-310000797468oxy:MarketingDerivativesMemberus-gaap:AccruedLiabilitiesMember2021-12-310000797468us-gaap:FairValueInputsLevel1Memberoxy:DeferredCreditsAndOtherLiabilitiesMemberoxy:MarketingDerivativesMember2021-12-310000797468oxy:DeferredCreditsAndOtherLiabilitiesMemberus-gaap:FairValueInputsLevel2Memberoxy:MarketingDerivativesMember2021-12-310000797468oxy:DeferredCreditsAndOtherLiabilitiesMemberus-gaap:FairValueInputsLevel3Memberoxy:MarketingDerivativesMember2021-12-310000797468oxy:DeferredCreditsAndOtherLiabilitiesMemberoxy:MarketingDerivativesMember2021-12-310000797468us-gaap:FairValueInputsLevel1Memberus-gaap:AccruedLiabilitiesMemberus-gaap:InterestRateSwapMember2021-12-310000797468us-gaap:FairValueInputsLevel2Memberus-gaap:AccruedLiabilitiesMemberus-gaap:InterestRateSwapMember2021-12-310000797468us-gaap:AccruedLiabilitiesMemberus-gaap:FairValueInputsLevel3Memberus-gaap:InterestRateSwapMember2021-12-310000797468us-gaap:AccruedLiabilitiesMemberus-gaap:InterestRateSwapMember2021-12-310000797468us-gaap:FairValueInputsLevel1Memberoxy:DeferredCreditsAndOtherLiabilitiesMemberus-gaap:InterestRateSwapMember2021-12-310000797468oxy:DeferredCreditsAndOtherLiabilitiesMemberus-gaap:FairValueInputsLevel2Memberus-gaap:InterestRateSwapMember2021-12-310000797468oxy:DeferredCreditsAndOtherLiabilitiesMemberus-gaap:FairValueInputsLevel3Memberus-gaap:InterestRateSwapMember2021-12-310000797468oxy:DeferredCreditsAndOtherLiabilitiesMemberus-gaap:InterestRateSwapMember2021-12-310000797468us-gaap:OtherCurrentAssetsMemberus-gaap:FairValueInputsLevel1Memberoxy:OilCollarsAndCallsMember2020-12-310000797468us-gaap:OtherCurrentAssetsMemberus-gaap:FairValueInputsLevel2Memberoxy:OilCollarsAndCallsMember2020-12-310000797468us-gaap:OtherCurrentAssetsMemberus-gaap:FairValueInputsLevel3Memberoxy:OilCollarsAndCallsMember2020-12-310000797468us-gaap:OtherCurrentAssetsMemberoxy:OilCollarsAndCallsMember2020-12-310000797468us-gaap:FairValueInputsLevel1Memberoxy:DeferredCreditsAndOtherLiabilitiesMemberoxy:OilCollarsAndCallsMember2020-12-310000797468oxy:DeferredCreditsAndOtherLiabilitiesMemberus-gaap:FairValueInputsLevel2Memberoxy:OilCollarsAndCallsMember2020-12-310000797468oxy:DeferredCreditsAndOtherLiabilitiesMemberus-gaap:FairValueInputsLevel3Memberoxy:OilCollarsAndCallsMember2020-12-310000797468oxy:DeferredCreditsAndOtherLiabilitiesMemberoxy:OilCollarsAndCallsMember2020-12-310000797468us-gaap:OtherCurrentAssetsMemberus-gaap:FairValueInputsLevel1Memberoxy:MarketingDerivativesMember2020-12-310000797468us-gaap:OtherCurrentAssetsMemberus-gaap:FairValueInputsLevel2Memberoxy:MarketingDerivativesMember2020-12-310000797468us-gaap:OtherCurrentAssetsMemberus-gaap:FairValueInputsLevel3Memberoxy:MarketingDerivativesMember2020-12-310000797468us-gaap:OtherCurrentAssetsMemberoxy:MarketingDerivativesMember2020-12-310000797468us-gaap:FairValueInputsLevel1Memberoxy:LongTermReceivablesAndOtherAssetsNetMemberoxy:MarketingDerivativesMember2020-12-310000797468us-gaap:FairValueInputsLevel2Memberoxy:LongTermReceivablesAndOtherAssetsNetMemberoxy:MarketingDerivativesMember2020-12-310000797468oxy:LongTermReceivablesAndOtherAssetsNetMemberus-gaap:FairValueInputsLevel3Memberoxy:MarketingDerivativesMember2020-12-310000797468oxy:MarketingDerivativesMemberoxy:LongTermReceivablesAndOtherAssetsNetMember2020-12-310000797468us-gaap:FairValueInputsLevel1Memberus-gaap:AccruedLiabilitiesMemberoxy:MarketingDerivativesMember2020-12-310000797468us-gaap:FairValueInputsLevel2Memberus-gaap:AccruedLiabilitiesMemberoxy:MarketingDerivativesMember2020-12-310000797468us-gaap:AccruedLiabilitiesMemberus-gaap:FairValueInputsLevel3Memberoxy:MarketingDerivativesMember2020-12-310000797468oxy:MarketingDerivativesMemberus-gaap:AccruedLiabilitiesMember2020-12-310000797468us-gaap:FairValueInputsLevel1Memberoxy:DeferredCreditsAndOtherLiabilitiesMemberoxy:MarketingDerivativesMember2020-12-310000797468oxy:DeferredCreditsAndOtherLiabilitiesMemberus-gaap:FairValueInputsLevel2Memberoxy:MarketingDerivativesMember2020-12-310000797468oxy:DeferredCreditsAndOtherLiabilitiesMemberus-gaap:FairValueInputsLevel3Memberoxy:MarketingDerivativesMember2020-12-310000797468oxy:DeferredCreditsAndOtherLiabilitiesMemberoxy:MarketingDerivativesMember2020-12-310000797468us-gaap:FairValueInputsLevel1Memberus-gaap:AccruedLiabilitiesMemberus-gaap:InterestRateSwapMember2020-12-310000797468us-gaap:FairValueInputsLevel2Memberus-gaap:AccruedLiabilitiesMemberus-gaap:InterestRateSwapMember2020-12-310000797468us-gaap:AccruedLiabilitiesMemberus-gaap:FairValueInputsLevel3Memberus-gaap:InterestRateSwapMember2020-12-310000797468us-gaap:AccruedLiabilitiesMemberus-gaap:InterestRateSwapMember2020-12-310000797468us-gaap:FairValueInputsLevel1Memberoxy:DeferredCreditsAndOtherLiabilitiesMemberus-gaap:InterestRateSwapMember2020-12-310000797468oxy:DeferredCreditsAndOtherLiabilitiesMemberus-gaap:FairValueInputsLevel2Memberus-gaap:InterestRateSwapMember2020-12-310000797468oxy:DeferredCreditsAndOtherLiabilitiesMemberus-gaap:FairValueInputsLevel3Memberus-gaap:InterestRateSwapMember2020-12-310000797468oxy:DeferredCreditsAndOtherLiabilitiesMemberus-gaap:InterestRateSwapMember2020-12-310000797468us-gaap:InterestRateSwapMember2020-12-310000797468oxy:MarketingDerivativesMember2021-12-310000797468oxy:MarketingDerivativesMember2020-12-310000797468us-gaap:SalesMemberoxy:OilCollarsAndCallsMember2021-01-012021-12-310000797468us-gaap:SalesMemberoxy:OilCollarsAndCallsMember2020-01-012020-12-310000797468us-gaap:SalesMemberoxy:OilCollarsAndCallsMember2019-01-012019-12-310000797468us-gaap:SalesMemberoxy:MarketingDerivativesMember2021-01-012021-12-310000797468us-gaap:SalesMemberoxy:MarketingDerivativesMember2020-01-012020-12-310000797468us-gaap:SalesMemberoxy:MarketingDerivativesMember2019-01-012019-12-310000797468oxy:GainLossonInterestRateSwapsandWarrantsNetMemberus-gaap:InterestRateSwapMember2020-01-012020-12-310000797468oxy:GainLossonInterestRateSwapsandWarrantsNetMemberus-gaap:InterestRateSwapMember2019-01-012019-12-310000797468us-gaap:OtherContractMemberoxy:GainLossonInterestRateSwapsandWarrantsNetMemberoxy:WesternMidstreamPartnersLPMember2021-01-012021-12-310000797468us-gaap:OtherContractMemberoxy:GainLossonInterestRateSwapsandWarrantsNetMemberoxy:WesternMidstreamPartnersLPMember2020-01-012020-12-310000797468us-gaap:OtherContractMemberoxy:GainLossonInterestRateSwapsandWarrantsNetMemberoxy:WesternMidstreamPartnersLPMember2019-01-012019-12-310000797468us-gaap:NondesignatedMember2021-12-310000797468us-gaap:NondesignatedMember2020-12-3100007974682021-10-012021-12-310000797468us-gaap:FairValueMeasurementsNonrecurringMember2020-01-012020-12-310000797468oxy:WesternMidstreamPartnersLPMember2020-01-012020-03-3100007974682020-04-012020-06-300000797468oxy:OilAndGasSegmentMember2020-04-012020-06-300000797468us-gaap:DiscontinuedOperationsHeldforsaleMemberoxy:GhanaAssetsMember2020-04-012020-06-300000797468oxy:GulfOfMexicoMember2020-04-012020-06-300000797468oxy:AlgeriaOilAndGasProvedPropertiesMember2020-04-012020-06-300000797468us-gaap:FairValueInputsLevel2Memberoxy:DomesticOnshoreUnprovedAcreageMember2020-04-012020-06-300000797468oxy:MeasurementInputWeightedAverageCostOfCapitalMemberus-gaap:FairValueInputsLevel3Member2021-12-310000797468srt:CrudeOilMembersrt:MinimumMember2020-04-012020-06-30iso4217:USDoxy:Barrel0000797468srt:CrudeOilMembersrt:MaximumMember2020-04-012020-06-300000797468srt:CrudeOilMember2020-04-012020-06-300000797468srt:NaturalGasReservesMembersrt:MinimumMember2020-04-012020-06-30iso4217:USDoxy:MillionCubicFeet0000797468srt:MaximumMembersrt:NaturalGasReservesMember2020-04-012020-06-300000797468srt:NaturalGasReservesMember2020-04-012020-06-300000797468srt:MinimumMember2020-04-012020-06-300000797468srt:MaximumMember2020-04-012020-06-300000797468oxy:OilAndGasSegmentMember2020-01-012020-03-310000797468oxy:OmanBoliviaAndTheGulfOfMexicoMember2020-01-012020-03-310000797468oxy:GulfOfMexicoMember2020-01-012020-03-310000797468oxy:WesternMidstreamPartnersLPMember2020-01-012020-09-300000797468us-gaap:DomesticCountryMember2021-12-310000797468us-gaap:StateAndLocalJurisdictionMember2021-12-310000797468us-gaap:ForeignCountryMember2021-12-310000797468srt:ScenarioForecastMember2022-01-012022-03-310000797468us-gaap:OtherCurrentAssetsMember2021-12-310000797468us-gaap:OtherCurrentAssetsMember2020-12-310000797468oxy:LongTermReceivablesAndOtherAssetsNetMember2021-12-310000797468oxy:LongTermReceivablesAndOtherAssetsNetMember2020-12-310000797468us-gaap:PensionPlansDefinedBenefitMember2020-06-302020-06-300000797468us-gaap:PensionPlansDefinedBenefitMember2021-01-012021-12-310000797468country:US2021-12-31oxy:employee0000797468us-gaap:ForeignPlanMember2021-12-310000797468us-gaap:PensionPlansDefinedBenefitMember2021-12-310000797468us-gaap:PensionPlansDefinedBenefitMember2020-12-310000797468us-gaap:OtherPostretirementBenefitPlansDefinedBenefitMember2021-12-310000797468us-gaap:OtherPostretirementBenefitPlansDefinedBenefitMember2020-12-310000797468us-gaap:PensionPlansDefinedBenefitMember2019-12-310000797468us-gaap:OtherPostretirementBenefitPlansDefinedBenefitMember2019-12-310000797468us-gaap:PensionPlansDefinedBenefitMember2020-01-012020-12-310000797468us-gaap:OtherPostretirementBenefitPlansDefinedBenefitMember2021-01-012021-12-310000797468us-gaap:OtherPostretirementBenefitPlansDefinedBenefitMember2020-01-012020-12-310000797468us-gaap:PensionPlansDefinedBenefitMember2019-01-012019-12-310000797468us-gaap:OtherPostretirementBenefitPlansDefinedBenefitMember2019-01-012019-12-310000797468us-gaap:OtherPostretirementBenefitPlansDefinedBenefitMemberoxy:MedicareAdvantagePlanMember2021-12-310000797468oxy:NonMedicareAdvantagePlanMemberus-gaap:OtherPostretirementBenefitPlansDefinedBenefitMembersrt:MinimumMember2021-12-310000797468oxy:NonMedicareAdvantagePlanMembersrt:MaximumMemberus-gaap:OtherPostretirementBenefitPlansDefinedBenefitMember2021-12-310000797468oxy:NonMedicareAdvantagePlanMemberus-gaap:OtherPostretirementBenefitPlansDefinedBenefitMember2021-12-310000797468us-gaap:FairValueInputsLevel1Memberus-gaap:PensionPlansDefinedBenefitMemberus-gaap:DefinedBenefitPlanCashAndCashEquivalentsMember2021-12-310000797468us-gaap:FairValueInputsLevel2Memberus-gaap:PensionPlansDefinedBenefitMemberus-gaap:DefinedBenefitPlanCashAndCashEquivalentsMember2021-12-310000797468us-gaap:PensionPlansDefinedBenefitMemberus-gaap:DefinedBenefitPlanCashAndCashEquivalentsMemberus-gaap:FairValueInputsLevel3Member2021-12-310000797468us-gaap:PensionPlansDefinedBenefitMemberus-gaap:DefinedBenefitPlanCashAndCashEquivalentsMember2021-12-310000797468us-gaap:FairValueInputsLevel1Memberus-gaap:PensionPlansDefinedBenefitMemberus-gaap:USGovernmentDebtSecuritiesMember2021-12-310000797468us-gaap:FairValueInputsLevel2Memberus-gaap:PensionPlansDefinedBenefitMemberus-gaap:USGovernmentDebtSecuritiesMember2021-12-310000797468us-gaap:PensionPlansDefinedBenefitMemberus-gaap:USGovernmentDebtSecuritiesMemberus-gaap:FairValueInputsLevel3Member2021-12-310000797468us-gaap:PensionPlansDefinedBenefitMemberus-gaap:USGovernmentDebtSecuritiesMember2021-12-310000797468us-gaap:FairValueInputsLevel1Memberus-gaap:PensionPlansDefinedBenefitMemberus-gaap:CorporateBondSecuritiesMember2021-12-310000797468us-gaap:FairValueInputsLevel2Memberus-gaap:PensionPlansDefinedBenefitMemberus-gaap:CorporateBondSecuritiesMember2021-12-310000797468us-gaap:PensionPlansDefinedBenefitMemberus-gaap:CorporateBondSecuritiesMemberus-gaap:FairValueInputsLevel3Member2021-12-310000797468us-gaap:PensionPlansDefinedBenefitMemberus-gaap:CorporateBondSecuritiesMember2021-12-310000797468us-gaap:FairValueInputsLevel1Memberus-gaap:PensionPlansDefinedBenefitMemberus-gaap:DefinedBenefitPlanEquitySecuritiesMember2021-12-310000797468us-gaap:FairValueInputsLevel2Memberus-gaap:PensionPlansDefinedBenefitMemberus-gaap:DefinedBenefitPlanEquitySecuritiesMember2021-12-310000797468us-gaap:PensionPlansDefinedBenefitMemberus-gaap:DefinedBenefitPlanEquitySecuritiesMemberus-gaap:FairValueInputsLevel3Member2021-12-310000797468us-gaap:PensionPlansDefinedBenefitMemberus-gaap:DefinedBenefitPlanEquitySecuritiesMember2021-12-310000797468us-gaap:FairValueInputsLevel1Memberus-gaap:PensionPlansDefinedBenefitMemberus-gaap:OtherAggregatedInvestmentsMember2021-12-310000797468us-gaap:FairValueInputsLevel2Memberus-gaap:PensionPlansDefinedBenefitMemberus-gaap:OtherAggregatedInvestmentsMember2021-12-310000797468us-gaap:PensionPlansDefinedBenefitMemberus-gaap:FairValueInputsLevel3Memberus-gaap:OtherAggregatedInvestmentsMember2021-12-310000797468us-gaap:PensionPlansDefinedBenefitMemberus-gaap:OtherAggregatedInvestmentsMember2021-12-310000797468us-gaap:FairValueInputsLevel1Memberus-gaap:PensionPlansDefinedBenefitMember2021-12-310000797468us-gaap:FairValueInputsLevel2Memberus-gaap:PensionPlansDefinedBenefitMember2021-12-310000797468us-gaap:PensionPlansDefinedBenefitMemberus-gaap:FairValueInputsLevel3Member2021-12-310000797468us-gaap:FairValueInputsLevel12And3Memberus-gaap:PensionPlansDefinedBenefitMember2021-12-310000797468us-gaap:FairValueMeasuredAtNetAssetValuePerShareMemberus-gaap:PensionPlansDefinedBenefitMember2021-12-310000797468us-gaap:FairValueInputsLevel1Memberus-gaap:PensionPlansDefinedBenefitMemberus-gaap:DefinedBenefitPlanCashAndCashEquivalentsMember2020-12-310000797468us-gaap:FairValueInputsLevel2Memberus-gaap:PensionPlansDefinedBenefitMemberus-gaap:DefinedBenefitPlanCashAndCashEquivalentsMember2020-12-310000797468us-gaap:PensionPlansDefinedBenefitMemberus-gaap:DefinedBenefitPlanCashAndCashEquivalentsMemberus-gaap:FairValueInputsLevel3Member2020-12-310000797468us-gaap:PensionPlansDefinedBenefitMemberus-gaap:DefinedBenefitPlanCashAndCashEquivalentsMember2020-12-310000797468us-gaap:FairValueInputsLevel1Memberus-gaap:PensionPlansDefinedBenefitMemberus-gaap:USGovernmentDebtSecuritiesMember2020-12-310000797468us-gaap:FairValueInputsLevel2Memberus-gaap:PensionPlansDefinedBenefitMemberus-gaap:USGovernmentDebtSecuritiesMember2020-12-310000797468us-gaap:PensionPlansDefinedBenefitMemberus-gaap:USGovernmentDebtSecuritiesMemberus-gaap:FairValueInputsLevel3Member2020-12-310000797468us-gaap:PensionPlansDefinedBenefitMemberus-gaap:USGovernmentDebtSecuritiesMember2020-12-310000797468us-gaap:FairValueInputsLevel1Memberus-gaap:PensionPlansDefinedBenefitMemberus-gaap:CorporateBondSecuritiesMember2020-12-310000797468us-gaap:FairValueInputsLevel2Memberus-gaap:PensionPlansDefinedBenefitMemberus-gaap:CorporateBondSecuritiesMember2020-12-310000797468us-gaap:PensionPlansDefinedBenefitMemberus-gaap:CorporateBondSecuritiesMemberus-gaap:FairValueInputsLevel3Member2020-12-310000797468us-gaap:PensionPlansDefinedBenefitMemberus-gaap:CorporateBondSecuritiesMember2020-12-310000797468us-gaap:FairValueInputsLevel1Memberus-gaap:PensionPlansDefinedBenefitMemberus-gaap:DefinedBenefitPlanEquitySecuritiesMember2020-12-310000797468us-gaap:FairValueInputsLevel2Memberus-gaap:PensionPlansDefinedBenefitMemberus-gaap:DefinedBenefitPlanEquitySecuritiesMember2020-12-310000797468us-gaap:PensionPlansDefinedBenefitMemberus-gaap:DefinedBenefitPlanEquitySecuritiesMemberus-gaap:FairValueInputsLevel3Member2020-12-310000797468us-gaap:PensionPlansDefinedBenefitMemberus-gaap:DefinedBenefitPlanEquitySecuritiesMember2020-12-310000797468us-gaap:FairValueInputsLevel1Memberus-gaap:PensionPlansDefinedBenefitMemberus-gaap:OtherAggregatedInvestmentsMember2020-12-310000797468us-gaap:FairValueInputsLevel2Memberus-gaap:PensionPlansDefinedBenefitMemberus-gaap:OtherAggregatedInvestmentsMember2020-12-310000797468us-gaap:PensionPlansDefinedBenefitMemberus-gaap:FairValueInputsLevel3Memberus-gaap:OtherAggregatedInvestmentsMember2020-12-310000797468us-gaap:PensionPlansDefinedBenefitMemberus-gaap:OtherAggregatedInvestmentsMember2020-12-310000797468us-gaap:FairValueInputsLevel1Memberus-gaap:PensionPlansDefinedBenefitMember2020-12-310000797468us-gaap:FairValueInputsLevel2Memberus-gaap:PensionPlansDefinedBenefitMember2020-12-310000797468us-gaap:PensionPlansDefinedBenefitMemberus-gaap:FairValueInputsLevel3Member2020-12-310000797468us-gaap:FairValueInputsLevel12And3Memberus-gaap:PensionPlansDefinedBenefitMember2020-12-310000797468us-gaap:FairValueMeasuredAtNetAssetValuePerShareMemberus-gaap:PensionPlansDefinedBenefitMember2020-12-310000797468us-gaap:PensionPlansDefinedBenefitMemberoxy:NetPayablesMember2021-12-310000797468us-gaap:PensionPlansDefinedBenefitMemberoxy:NetPayablesMember2020-12-31oxy:site0000797468oxy:NPLSitesMember2021-12-310000797468oxy:NPLSitesMember2020-12-310000797468oxy:ThirdPartySitesMember2021-12-310000797468oxy:ThirdPartySitesMember2020-12-310000797468oxy:EntityOperatedSitesMember2021-12-310000797468oxy:EntityOperatedSitesMember2020-12-310000797468oxy:ClosedOrNonOperatedEntitySitesMember2021-12-310000797468oxy:ClosedOrNonOperatedEntitySitesMember2020-12-310000797468srt:MinimumMember2021-12-310000797468srt:MaximumMember2021-12-310000797468oxy:EntityOperatedSitesMember2021-01-012021-12-310000797468oxy:NPLSitesMember2021-01-012021-12-310000797468oxy:ClosedOrNonOperatedEntitySitesMember2021-01-012021-12-310000797468oxy:ThirdPartySitesMember2021-01-012021-12-310000797468oxy:MaxusEnergyCorporationMember2021-01-012021-12-310000797468oxy:PassaicRiverMember2016-03-012016-03-31utr:mi0000797468oxy:PassaicRiverMember2016-07-012016-09-300000797468oxy:PassaicRiverMember2021-09-012021-09-300000797468oxy:ArbitrationDemandFiledByAndesPetroleumEcuadorLtdMember2016-01-012016-12-310000797468oxy:ArbitrationDemandFiledByAndesPetroleumEcuadorLtdMember2017-01-012017-12-310000797468oxy:ArbitrationDemandFiledByAndesPetroleumEcuadorLtdMember2021-03-262021-03-260000797468oxy:ArbitrationDemandFiledByAndesPetroleumEcuadorLtdMember2021-12-012021-12-310000797468oxy:AnadarkoPetroleumCorporationMember2016-01-012016-12-310000797468oxy:TronoxSettlementMember2015-01-012015-12-310000797468us-gaap:CommonStockMemberoxy:AnadarkoPetroleumCorporationMember2020-01-012020-03-310000797468oxy:AnadarkoPetroleumCorporationMemberus-gaap:SeriesAPreferredStockMember2019-08-082019-08-080000797468oxy:AnadarkoPetroleumCorporationMemberus-gaap:SeriesAPreferredStockMember2019-08-0800007974682021-07-012021-09-3000007974682021-04-012021-06-3000007974682021-01-012021-03-310000797468us-gaap:WarrantMemberus-gaap:CommonStockMember2020-06-260000797468us-gaap:WarrantMemberus-gaap:CommonStockMember2020-08-030000797468us-gaap:AccumulatedTranslationAdjustmentMember2021-12-310000797468us-gaap:AccumulatedTranslationAdjustmentMember2020-12-310000797468us-gaap:AccumulatedGainLossNetCashFlowHedgeParentMember2021-12-310000797468us-gaap:AccumulatedGainLossNetCashFlowHedgeParentMember2020-12-310000797468us-gaap:AccumulatedDefinedBenefitPlansAdjustmentNetUnamortizedGainLossMember2021-12-310000797468us-gaap:AccumulatedDefinedBenefitPlansAdjustmentNetUnamortizedGainLossMember2020-12-310000797468srt:DirectorMemberus-gaap:CommonStockMember2021-01-012021-12-310000797468us-gaap:RestrictedStockUnitsRSUMembersrt:MinimumMember2021-01-012021-12-310000797468us-gaap:RestrictedStockUnitsRSUMembersrt:MaximumMember2021-01-012021-12-310000797468oxy:CashSettledRestrictedStockUnitMember2021-01-012021-12-310000797468oxy:CashSettledRestrictedStockUnitMember2020-01-012020-12-310000797468oxy:CashSettledRestrictedStockUnitMember2019-01-012019-12-310000797468oxy:StockSettledRestrictedStockUnitMember2021-01-012021-12-310000797468oxy:StockSettledRestrictedStockUnitMember2020-01-012020-12-310000797468oxy:StockSettledRestrictedStockUnitMember2019-01-012019-12-310000797468oxy:CashSettledRestrictedStockUnitMember2020-12-310000797468oxy:StockSettledRestrictedStockUnitMember2020-12-310000797468oxy:CashSettledRestrictedStockUnitMember2021-12-310000797468oxy:StockSettledRestrictedStockUnitMember2021-12-310000797468oxy:TotalShareholderReturnIncentiveMember2021-01-012021-12-310000797468oxy:TotalShareholderReturnIncentiveMembersrt:MinimumMember2021-01-012021-12-310000797468srt:MaximumMemberoxy:TotalShareholderReturnIncentiveMember2021-01-012021-12-310000797468oxy:TotalShareholderReturnIncentiveMember2020-01-012020-12-310000797468oxy:TotalShareholderReturnIncentiveMember2019-01-012019-12-310000797468oxy:TotalShareholderReturnIncentiveMember2021-12-310000797468oxy:TotalShareholderReturnIncentiveMember2020-12-310000797468oxy:TotalShareholderReturnIncentiveMember2019-12-310000797468us-gaap:EmployeeStockOptionMember2021-01-012021-12-310000797468us-gaap:EmployeeStockOptionMember2021-12-310000797468oxy:VestedMember2020-12-310000797468oxy:NonvestedMember2020-12-310000797468oxy:VestedMember2021-01-012021-12-310000797468oxy:NonvestedMember2021-01-012021-12-310000797468oxy:VestedMember2021-12-310000797468oxy:NonvestedMember2021-12-310000797468oxy:ShareBasedCompensationArrangementByShareBasedPaymentAwardOptionsAndSARSMember2021-01-012021-12-310000797468oxy:ReturnOnCapitalEmployedIncentiveAndReturnOnAssetsIncentivesAwardsMember2021-01-012021-12-310000797468oxy:ReturnOnCapitalEmployedIncentiveAndReturnOnAssetsIncentivesAwardsMembersrt:MinimumMember2021-01-012021-12-310000797468oxy:ReturnOnCapitalEmployedIncentiveAndReturnOnAssetsIncentivesAwardsMembersrt:MaximumMember2021-01-012021-12-310000797468oxy:ReturnOnCapitalEmployedIncentiveAndReturnOnAssetsIncentivesAwardsMember2020-12-310000797468oxy:ReturnOnCapitalEmployedIncentiveAndReturnOnAssetsIncentivesAwardsMember2021-12-310000797468us-gaap:OperatingSegmentsMemberoxy:OilAndGasSegmentMember2021-01-012021-12-310000797468us-gaap:OperatingSegmentsMemberoxy:ChemicalMember2021-01-012021-12-310000797468oxy:MidstreamAndMarketingMemberus-gaap:OperatingSegmentsMember2021-01-012021-12-310000797468us-gaap:OperatingSegmentsMemberoxy:ChemicalMember2021-12-310000797468oxy:MidstreamAndMarketingMemberus-gaap:OperatingSegmentsMember2021-12-310000797468oxy:CorporateReconcilingItemsAndEliminationsMember2021-12-310000797468us-gaap:OperatingSegmentsMemberoxy:OilAndGasSegmentMember2020-01-012020-12-310000797468us-gaap:OperatingSegmentsMemberoxy:ChemicalMember2020-01-012020-12-310000797468oxy:MidstreamAndMarketingMemberus-gaap:OperatingSegmentsMember2020-01-012020-12-310000797468oxy:CorporateReconcilingItemsAndEliminationsMember2020-01-012020-12-310000797468us-gaap:OperatingSegmentsMemberoxy:ChemicalMember2020-12-310000797468oxy:MidstreamAndMarketingMemberus-gaap:OperatingSegmentsMember2020-12-310000797468oxy:CorporateReconcilingItemsAndEliminationsMember2020-12-310000797468us-gaap:OperatingSegmentsMemberoxy:OilAndGasSegmentMember2019-01-012019-12-310000797468us-gaap:OperatingSegmentsMemberoxy:ChemicalMember2019-01-012019-12-310000797468oxy:MidstreamAndMarketingMemberus-gaap:OperatingSegmentsMember2019-01-012019-12-310000797468oxy:CorporateReconcilingItemsAndEliminationsMember2019-01-012019-12-310000797468us-gaap:OperatingSegmentsMemberoxy:OilAndGasSegmentMember2019-12-310000797468us-gaap:OperatingSegmentsMemberoxy:ChemicalMember2019-12-310000797468oxy:MidstreamAndMarketingMemberus-gaap:OperatingSegmentsMember2019-12-310000797468oxy:CorporateReconcilingItemsAndEliminationsMember2019-12-310000797468oxy:MidstreamAndMarketingMemberus-gaap:DisposalGroupDisposedOfBySaleNotDiscontinuedOperationsMemberus-gaap:OperatingSegmentsMemberoxy:WesternMidstreamPartnersLPMember2021-01-012021-12-310000797468oxy:MidstreamAndMarketingMemberus-gaap:DisposalGroupDisposedOfBySaleNotDiscontinuedOperationsMemberus-gaap:OperatingSegmentsMemberoxy:WesternMidstreamPartnersLPMember2020-01-012020-12-310000797468oxy:MidstreamAndMarketingMemberus-gaap:DisposalGroupDisposedOfBySaleNotDiscontinuedOperationsMemberus-gaap:OperatingSegmentsMemberoxy:WesternMidstreamPartnersLPMember2019-01-012019-12-310000797468oxy:MidstreamAndMarketingMemberus-gaap:DisposalGroupDisposedOfBySaleNotDiscontinuedOperationsMemberus-gaap:OperatingSegmentsMemberoxy:PlainsAllAmericanPipelineLPMember2019-01-012019-12-310000797468oxy:MidstreamAndMarketingMemberus-gaap:DisposalGroupDisposedOfBySaleNotDiscontinuedOperationsMemberus-gaap:OperatingSegmentsMemberoxy:WesternMidstreamPartnersLPMemberus-gaap:InterestRateSwapMember2019-01-012019-12-310000797468oxy:HomeSegmentMember2021-12-310000797468oxy:HomeSegmentMember2020-12-310000797468oxy:HomeSegmentMember2019-12-310000797468country:AE2021-12-310000797468country:AE2020-12-310000797468country:AE2019-12-310000797468country:OM2021-12-310000797468country:OM2020-12-310000797468country:OM2019-12-310000797468country:DZ2021-12-310000797468country:DZ2020-12-310000797468country:DZ2019-12-310000797468country:CO2021-12-310000797468country:CO2020-12-310000797468country:CO2019-12-310000797468country:QA2021-12-310000797468country:QA2020-12-310000797468country:QA2019-12-310000797468oxy:OtherForeignSegmentMember2021-12-310000797468oxy:OtherForeignSegmentMember2020-12-310000797468oxy:OtherForeignSegmentMember2019-12-310000797468oxy:ForeignSegmentMember2021-12-310000797468oxy:ForeignSegmentMember2020-12-310000797468oxy:ForeignSegmentMember2019-12-310000797468us-gaap:AllowanceForCreditLossMember2020-12-310000797468us-gaap:AllowanceForCreditLossMember2021-01-012021-12-310000797468us-gaap:AllowanceForCreditLossMember2021-12-310000797468oxy:EnvironmentalLitigationTaxAndOtherReservesMember2020-12-310000797468oxy:EnvironmentalLitigationTaxAndOtherReservesMember2021-01-012021-12-310000797468oxy:EnvironmentalLitigationTaxAndOtherReservesMember2021-12-310000797468us-gaap:AllowanceForCreditLossMember2019-12-310000797468us-gaap:AllowanceForCreditLossMember2020-01-012020-12-310000797468oxy:EnvironmentalLitigationTaxAndOtherReservesMember2019-12-310000797468oxy:EnvironmentalLitigationTaxAndOtherReservesMember2020-01-012020-12-310000797468us-gaap:AllowanceForCreditLossMember2018-12-310000797468us-gaap:AllowanceForCreditLossMember2019-01-012019-12-310000797468oxy:EnvironmentalLitigationTaxAndOtherReservesMember2018-12-310000797468oxy:EnvironmentalLitigationTaxAndOtherReservesMember2019-01-012019-12-31
UNITED STATES SECURITIES AND EXCHANGE COMMISSION
Washington, D.C. 20549
Form 10-K
| | | | | | | | | | | | | | | | | |
| ☑ | Annual Report Pursuant to Section 13 or 15(d) of the Securities Exchange Act of 1934 | ☐ | Transition Report Pursuant to Section 13 or 15(d) of the Securities Exchange Act of 1934 |
| For the fiscal year ended | December 31, 2021 | | For the transition period from to |
Commission File Number 1-9210
Occidental Petroleum Corporation
(Exact name of registrant as specified in its charter)
| | | | | | | | | | | | | | | | | |
| State or other jurisdiction of incorporation or organization | | Delaware |
| I.R.S. Employer Identification No. | | 95-4035997 |
| Address of principal executive offices | | 5 Greenway Plaza, Suite 110 | Houston, | Texas |
| Zip Code | | 77046 |
| Registrant’s telephone number, including area code | | (713) | 215-7000 |
Securities registered pursuant to Section 12(b) of the Act:
| | | | | | | | |
| Title of Each Class | Trading Symbol | Name of Each Exchange on Which Registered |
| Common Stock, $0.20 par value | OXY | New York Stock Exchange |
Warrants to Purchase Common Stock, $0.20 par value | OXY WS | New York Stock Exchange |
Securities registered pursuant to Section 12(g) of the Act: None
Indicate by check mark if the registrant is a well-known seasoned issuer, as defined in Rule 405 of the Securities Act.
Yes ☑ No ☐
Indicate by check mark if the registrant is not required to file reports pursuant to Section 13 or Section 15(d) of the Act.
Yes ☐ No ☑
Indicate by check mark whether the registrant (1) has filed all reports required to be filed by Section 13 or 15(d) of the Securities Exchange Act of 1934 during the preceding 12 months (or for such shorter period that the registrant was required to file such reports), and (2) has been subject to such filing requirements for the past 90 days. Yes ☑ No ☐
Indicate by check mark whether the registrant has submitted electronically every Interactive Data File required to be submitted pursuant to Rule 405 of Regulation S-T (§232.405 of this chapter) during the preceding 12 months (or for such shorter period that the registrant was required to submit such files). Yes ☑ No ☐
Indicate by check mark whether the registrant is a large accelerated filer, an accelerated filer, a non-accelerated filer, a smaller reporting company, or an emerging growth company. See the definitions of “large accelerated filer,” “accelerated filer,” “smaller reporting company” and “emerging growth company” in Rule 12b-2 of the Exchange Act.
| | | | | | | | | | | | | | | | | |
| Large Accelerated Filer | ☑ | Accelerated Filer | ☐ | Emerging Growth Company | ☐ |
| Non-Accelerated Filer | ☐ | Smaller Reporting Company | ☐ | | |
If an emerging growth company, indicate by check mark if the registrant has elected not to use the extended transition period for complying with any new or revised financial accounting standards provided pursuant to Section 13(a) of the Exchange Act. ☐
Indicate by check mark whether the registrant has filed a report on and attestation to its management’s assessment of the effectiveness of its internal control over financial reporting under Section 404(b) of the Sarbanes-Oxley Act (15 U.S.C. 7262(b)) by the registered public accounting firm that prepared or issued its audit report. ☑
Indicate by check mark whether the registrant is a shell company (as defined in Rule 12b-2 of the Act). Yes ☐ No ☑
The aggregate market value of the registrant’s Common Stock held by nonaffiliates of the registrant was approximately $29.2 billion computed by reference to the closing price on the New York Stock Exchange of $31.27 per share of Common Stock on June 30, 2021.
As of January 31, 2022, there were 934,063,989 shares of Common Stock outstanding, par value $0.20 per share.
DOCUMENTS INCORPORATED BY REFERENCE
Portions of the registrant’s definitive Proxy Statement, relating to its 2022 Annual Meeting of Stockholders, are incorporated by reference into Part III of this Form 10-K.
| | | | | | | | |
| TABLE OF CONTENTS | PAGE |
| Part I | | |
| Items 1 and 2. | | |
| | |
| Human Capital Resources | |
| | |
| | |
| | |
| | |
| | |
| Item 1A. | | |
| Item 1B. | | |
| Item 3. | | |
| Item 4. | Mine Safety Disclosures | |
| | |
| Part II | | |
| Item 5. | | |
| | |
| Item 7. | | |
| | |
| | |
| | |
| | |
| | |
| | |
| | |
| | |
| | |
| | |
| | |
| | |
| | |
| | |
| | |
| | |
| | |
| Item 7A. | | |
| Item 8. | | |
| | |
| | |
| | |
| | |
| | |
| | |
| | |
| | |
| | |
| | |
| | |
| Item 9. | | |
| Item 9A. | | |
| | |
| | |
| Item 9B. | | |
| Item 9C. | Disclosure Regarding Foreign Jurisdictions that Prevented Inspections | |
| Part III | | |
| Item 10. | | |
| Item 11. | | |
| Item 12. | | |
| Item 13. | | |
| Item 14. | | |
| Part IV | | |
| Item 15. | | |
| Item 16. | | |
Part I
ITEMS 1 AND 2. BUSINESS AND PROPERTIES
In this report, “Occidental”, “we” and “our” refers to Occidental Petroleum Corporation, a Delaware corporation incorporated in 1986, or Occidental and one or more entities in which it owns a controlling interest (subsidiaries). Occidental conducts its operations through its various subsidiaries and affiliates. Occidental’s executive offices are located at 5 Greenway Plaza, Suite 110, Houston, Texas 77046; telephone (713) 215-7000.
Occidental’s principal businesses consist of three reporting segments: oil and gas, chemical and midstream and marketing. The oil and gas segment explores for, develops and produces oil (which includes condensate), natural gas liquids (NGL) and natural gas. The chemical segment (OxyChem) primarily manufactures and markets basic chemicals and vinyls. The midstream and marketing segment purchases, markets, gathers, processes, transports and stores oil (which includes condensate), NGL, natural gas, carbon dioxide (CO2) and power. It also optimizes its transportation and storage capacity, and invests in entities that conduct similar activities, such as Western Midstream Partners, L.P. (WES).
The midstream and marketing segment also includes Occidental’s low carbon ventures (OLCV) businesses. OLCV seeks to leverage Occidental’s legacy of carbon management expertise to develop carbon capture, utilization and storage (CCUS) projects, including the commercialization of direct air capture (DAC) technology, and invests in other low-carbon technologies intended to reduce greenhouse gas (GHG) emissions from our operations and strategically partner with other industries to help reduce their emissions.
On August 8, 2019, pursuant to the Agreement and Plan of Merger dated May 9, 2019, Occidental acquired all of the outstanding shares of Anadarko Petroleum Corporation (Anadarko), through a transaction in which a wholly owned subsidiary of Occidental merged with and into Anadarko (the Acquisition). The Acquisition added to Occidental's oil and gas portfolio, primarily in the Permian Basin, DJ Basin, Gulf of Mexico and Algeria, and an interest in WES.
For further information regarding Occidental’s segments, geographic areas of operation and current developments, see the Management’s Discussion and Analysis of Financial Condition and Results of Operations section under Part II, Item 7, of this Form 10-K and Note 16 - Industry Segments and Geographic Areas in the Notes to Consolidated Financial Statements in Part II Item 8 of this Form 10-K.
Occidental’s culture is built upon the following core values, and our employees are evaluated relative to these values:
■Lead with Passion
■Outperform Expectations
■Deliver Results Responsibly
■Unleash Opportunities
■Commit to Good
With this foundation, Occidental’s human capital resources and programs are managed by our human resources department, with support from business leaders across the company. Occidental’s senior management team plays a key role in setting and monitoring Occidental’s culture, values and broader human capital management practices, with oversight by our Board of Directors. Senior management and the Board of Directors also engage frequently on workforce-related topics.
DIVERSITY, INCLUSION AND BELONGING
Occidental’s culture of diversity, inclusion and belonging (DIB) supports an environment where employees’ differences are not only appreciated, but also celebrated and encouraged, with the goal that all employees are included and everyone feels that they belong. Occidental conducted a robust survey across the organization in 2020, the results of which were reviewed with our Board of Directors and became a basis for our company’s core values.
Occidental’s human capital resources extend across several regions. Occidental has attracted, and continues to recruit, a diverse workforce of exceptional talent, including employees from many nations. This diversity enriches our culture, our employees' experiences on the job and contributes to an innovative and effective business model that encourages local communities to thrive. DIB powers our innovation and spirit of excellence, as well as our knowledge and results. Embedding DIB into our culture enhances Occidental’s collaboration, performance and growth and helps uphold our organizational values.
In the first quarter of 2021, Occidental established the DIB Advisory Board and the DIB Ambassador Committee. The DIB Advisory Board, which is chaired by Occidental’s President and CEO and includes members of senior leadership, provides DIB governance and oversight to ensure that Occidental’s integrated DIB strategy is executed and properly aligns with the organization’s mission, vision and strategic objectives. The DIB Ambassador Committee, which is chaired by Occidental’s Vice President of Diversity and Inclusion, consists of a diverse group of employee representatives from all business segments, domestic and international. This committee leads company-wide initiatives to raise DIB awareness through educational resources and programs. Robust educational sessions are available to our entire workforce for continued growth and development on topics such as inclusive leadership, diversity advocacy, recognizing and addressing micro aggressions, overcoming unconscious bias and psychological safety at work.
Occidental’s senior management, together with the support of Occidental’s DIB Advisory Board and the DIB Ambassador Committee, works to leverage employees’ varied backgrounds, unique experiences and points of view to spark innovation, empower growth, outperform expectations and maximize results. In October 2021, Occidental’s DIB team hosted its inaugural company-wide DIB live event.
COVID-19 RESPONSE
Occidental and the communities in which we operate continue to be impacted by the ongoing effects of the COVID-19 pandemic and emergence and spread of new variants of the virus. Throughout the pandemic, Occidental has remained committed to ensuring the safety of our employees and communities while continuing to operate critical national infrastructure and supply essential products.
Senior management and the Human Resources department have been actively monitoring federal, state and local guidance and public health data. In March 2020, Occidental announced a work-from-home (WFH) program for certain domestic office-based employees. On November 2, 2021, employees returned to in-office work on a regular basis with COVID-19 safety measures in place, including a mandatory face covering requirement in common areas and enhanced office cleanings. However, given the surge in COVID-19 cases with the Omicron variant, Occidental announced the re-implementation of a WFH schedule for certain domestic office-based employees effective December 21, 2021, through March 1, 2022.
Understanding the impact of COVID-19 illnesses on our employees and their families, Occidental also instituted “pandemic pay” benefits, which provide employees with up to 14 days of paid leave if unable to work due to COVID-19 related issues.
TALENT ATTRACTION AND RETENTION
Occidental is dedicated to attracting and retaining top talent. In 2021, Occidental expanded source channels for employee candidates to include three historically black colleges and universities.
During COVID-19 outbreaks in our local communities, Occidental also efficiently conducted interviews, job fairs and campus recruiting virtually. Similarly, all college interns participated in virtual internships for health and safety reasons during 2020 and 2021. For 2022, our university relations team will work with universities and their staff to ensure that any in-person interviews and events are conducted safely. In addition, all college internships are currently set to be in-person later this year though we will continue to monitor federal, state and local guidance and public health data.
Despite the challenges introduced by COVID-19 to interact in-person with others, management continues to encourage employee engagement and feedback. For example, in late 2020, senior management began hosting Quarterly Executive Virtual Conversations, which provide employees the opportunity to hear directly from leadership regarding financial and operational updates and submit questions for management to answer.
In response to employee feedback received by the Human Resources department, Occidental implemented the Balanced Workplace Program under which eligible office-based employees may opt to work three days in the office and two days at home each week. The program affords employees more flexibility and promotes increased work/life balance.
In 2021, Occidental implemented its global Strategic Technical Excellence Program (STEP) to recruit, develop and retain highly skilled and valued geoscientists, engineers, scientists and other petrotechnical professionals who will collectively drive innovation, advance performance and inspire the future of energy. STEP drives a competitive advantage and increased profitability for Occidental through the optimum application of technology; STEP is a highly valued program for technical contributors to focus and advance on a technical, non-managerial career path. The Chief Petrotechnical Officer leads all aspects of STEP and reports directly to Occidental’s President and CEO.
Occidental also offers employees development opportunities, competitive compensation and attractive benefits, as discussed further below.
DEVELOPMENT AND TRAINING
Occidental employees have access to extensive development and training opportunities and programs to expand their personal and professional skills and knowledge. Occidental’s approach to education includes:
■Leadership/management training to develop leadership skills at all levels;
■Self-directed learning and development, including web-based and instructor-led training;
■An employee development library;
■Mentoring programs;
■Employee resource groups; and
■Educational assistance to support employees’ continuing education.
EMPLOYEE COMPENSATION AND BENEFITS
In addition to prioritizing employee engagement and development, Occidental’s compensation and benefits program is designed to attract and retain the talent necessary to achieve our business strategy. Our program recognizes and rewards strong company and individual performance with competitive base salaries, short-term performance incentives consisting of an annual bonus program and recognition awards, long-term performance incentives and advancement opportunities. Our compensation and benefits program is routinely reviewed and benchmarked to ensure competitiveness and to provide the benefits that matter most to current and future employees.
Occidental strives to give employees the tools and resources they need to succeed both professionally and personally and foster a safe and collaborative work environment. To that end, Occidental offers, and regularly evaluates, its comprehensive health, welfare and retirement and savings benefits plans, professional memberships, work/life balance benefits and provides programs to enhance and support employees’ overall well-being, including their physical, mental, social and financial health.
In 2021, Occidental launched a global Commit to You program to educate employees and leaders about how our benefits can support them under the four pillars of well-being: mental, physical, social and financial. Occidental also joined One Mind at Work, an employer coalition dedicated to implementing a gold standard for workplace mental health by combating stigma, improving access to treatment and prevention services and fostering a psychologically safe culture. In 2022, Occidental will focus on mental health and continue focusing programs and education to train leaders and support employees around the area of mental health and well-being. In January 2022, Occidental introduced a new benefit service provider that provides a health care concierge service to help families manage and navigate medical, in-home care, housing, and social/emotional support, for their own or their families’ complex care needs.
HEALTH AND SAFETY
The health and safety of our workforce and communities is a top priority of Occidental. Under our LiveSAFE culture, Occidental endeavors to continuously improve our workplace and contractor safety, prevent and mitigate incidents, and safeguard people and the environment in the communities where we operate. Employees and contractors are empowered and expected to uphold the LiveSAFE commitments, including to stop any job or activity if they observe conditions that may give rise to a safety or environmental incident, and they are often recognized for doing so.
WORKFORCE COMPOSITION
The below table approximates regional distribution of Occidental’s employees:
| | | | | | | | | | | | | | | | | | | | | | | | | | | | | | | | |
| | North America | | Middle East | | Latin America | | Other (a) | | Total (b) |
| Union | | 423 | | 800 | | 50 | | — | | | 1,273 |
| Non-Union | | 7,679 | | 2,499 | | 114 | | 113 | | 10,405 |
| Total | | 8,102 | | 3,299 | | 164 | | 113 | | 11,678 |
(a)Other headcount includes North Africa, Europe and Asia.
(b)Includes approximately 2,800 employees in OxyChem.
The below table approximates the self-reported gender and ethnicity, excluding non-specified ethnicities, of Occidental’s domestic leadership and other employees. Executive and senior officials and managers are considered top leadership while first- and mid-level officials and managers are considered junior leadership. Individual contributors are excluded from the leadership categories but included in all employee percentages:
| | | | | | | | | | | | | | | | | | | | | | | | | | |
| | Male | | Female | | White | | non-White |
| All employees | | 78 | % | | 22 | % | | 67 | % | | 33 | % |
| All leadership | | 79 | % | | 21 | % | | 77 | % | | 23 | % |
| Top leadership | | 84 | % | | 16 | % | | 86 | % | | 14 | % |
| Junior leadership | | 79 | % | | 21 | % | | 76 | % | | 24 | % |
We have also publicly disclosed the Consolidated EEO-1 Report that Occidental submitted in 2021 to the U.S. Equal Employment Opportunity Commission for the 2020 fiscal year, which can be found on the sustainability section of our website.
Occidental’s annual reports on Form 10-K, quarterly reports on Form 10-Q, current reports on Form 8-K and any amendments to those reports are available free of charge on its website, www.oxy.com, as soon as reasonably practicable after Occidental electronically files the material with, or furnishes it to, the U.S. Securities and Exchange Commission (SEC). In addition, copies of Occidental’s annual report will be made available, free of charge, upon written request.
Information contained on Occidental’s website is not part of this report or any other filings with the SEC.
GENERAL
Occidental’s oil and gas assets are characterized by an advantaged mix of short-cycle and long-cycle high-return development opportunities. Occidental primarily conducts its ongoing exploration and production activities in the United States, the Middle East and North Africa. Within the United States, Occidental has operations in Texas, New Mexico and Colorado, as well as offshore in the Gulf of Mexico. Internationally, Occidental primarily conducts operations in Oman, United Arab Emirates (UAE) and Algeria. Refer to the Oil and Gas Acreage section in Supplemental Oil and Gas Information under Item 8 of this Form 10-K for further disclosure of Occidental’s holdings of developed and undeveloped oil and gas acreage.
COMPETITION
As a producer of oil, NGL and natural gas, Occidental competes with numerous other domestic and international public, private and government producers. Oil, NGL and natural gas are sensitive to prevailing global and local market conditions, as well as anticipated market conditions. Occidental’s competitive strategy relies on maintaining production in a capital efficient manner through developing conventional and unconventional fields, and utilizing primary and enhanced oil recovery (EOR) techniques in areas where Occidental has a competitive advantage as a result of its successful operations or investments in shared infrastructure. Occidental also competes to develop and produce its worldwide oil and gas reserves safely, sustainably and cost-effectively, maintain a skilled workforce and obtain quality services. We believe that Occidental’s core competencies in CO2 separation, transportation, use, recycling and storage in EOR provide a competitive advantage over our peers as the world transitions to a lower carbon intensive economy and seeks to remove CO2 from the atmosphere.
PROVED RESERVES AND SALES VOLUMES
The table below shows Occidental’s year-end oil, NGL and natural gas proved reserves. See the information under Oil and Gas Segment in the Management's Discussion and Analysis section under Part II, Item 7, of this report for details regarding Occidental’s proved reserves, the reserves estimation process, sales and production volumes, production costs and other reserves-related data.
COMPARATIVE OIL AND GAS PROVED RESERVES AND SALES VOLUMES
Oil and NGL is in millions of barrels (MMbbl); natural gas is in billions of cubic feet (Bcf).
| | | | | | | | | | | | | | | | | | | | | | | | | | | | | | | | | | | | | | | | | | | | | | | |
| 2021 | | 2020 | | 2019 | |
| Oil | NGL | Gas | Boe | (a) | Oil | NGL | Gas | Boe | (a) | Oil | NGL | Gas | Boe | (a) |
Proved Reserves (b,c) | | | | | | | | | | | | | | | |
| United States | 1,466 | | 564 | | 3,419 | | 2,600 | | | 1,144 | | 384 | | 2,446 | | 1,936 | | | 1,570 | | 540 | | 4,128 | | 2,798 | | |
| International | 305 | | 202 | | 2,431 | | 912 | | | 331 | | 215 | | 2,573 | | 975 | | | 469 | | 208 | | 2,572 | | 1,106 | | |
| Total | 1,771 | | 766 | | 5,850 | | 3,512 | | | 1,475 | | 599 | | 5,019 | | 2,911 | | | 2,039 | | 748 | | 6,700 | | 3,904 | | |
Sales Volumes (c) | | | | | | | | | | | | | | | |
| United States | 182 | | 79 | | 477 | | 341 | | | 205 | | 81 | | 561 | | 380 | | | 155 | | 52 | | 326 | | 261 | | |
| International | 44 | | 12 | | 172 | | 85 | | | 59 | | 13 | | 195 | | 104 | | | 64 | | 13 | | 204 | | 111 | | |
| Total | 226 | | 91 | | 649 | | 426 | | | 264 | | 94 | | 756 | | 484 | | | 219 | | 65 | | 530 | | 372 | | |
(a)Natural gas volumes are converted to barrels of oil equivalent (Boe) at six thousand cubic feet (Mcf) of gas per one barrel of oil. Conversion to Boe does not necessarily result in price equivalency.
(b)The detailed proved reserves information presented in accordance with Item 1202(a)(2) to Regulation S-K under the Securities Exchange Act of 1934 (Exchange Act) is provided in the Supplemental Oil and Gas Information section in Item 8 of this Form 10-K. Proved reserves are stated on a net basis after applicable royalties.
(c)Excludes reserves and sales volumes related to Occidental’s discontinued operations.
GENERAL
OxyChem owns and operates manufacturing plants at 21 domestic sites in Alabama, Georgia, Illinois, Kansas, Louisiana, Michigan, New Jersey, Ohio, Tennessee and Texas and at two international sites in Canada and Chile.
COMPETITION
OxyChem competes with numerous other domestic and international chemical producers. OxyChem’s market position was first or second in the United States in 2021 for the principal basic chemical products it manufactures and markets as well as for vinyl chloride monomer (VCM). OxyChem ranks in the top three producers of polyvinyl chloride (PVC) in the United States. OxyChem’s competitive strategy is to be a low-cost producer of its products in order to compete on price.
OxyChem produces the following products:
| | | | | | | | |
| Principal Products | Major Uses | Annual Capacity |
| Basic Chemicals | | |
Chlorine | Raw material for ethylene dichloride (EDC), water treatment and pharmaceuticals | 3.2 million tons |
Caustic soda | Pulp, paper and aluminum production | 3.3 million tons |
Chlorinated organics | Refrigerants(a), silicones and pharmaceuticals | 1.0 billion pounds |
Potassium chemicals | Fertilizers, batteries, soaps, detergents and specialty glass | 0.4 million tons |
EDC | Raw material for VCM | 2.1 billion pounds |
| Chlorinated isocyanurates | Swimming pool sanitation and disinfecting products | 131 million pounds |
Sodium silicates | Catalysts, soaps, detergents and paint pigments | 0.6 million tons |
Calcium chloride | Ice melting, dust control, road stabilization and oil field services | 0.7 million tons |
| Vinyls | | |
VCM | Precursor for PVC | 6.2 billion pounds |
PVC | Piping, building materials and automotive and medical products | 3.7 billion pounds |
Ethylene | Raw material for VCM | 1.3 billion pounds(b) |
(a)Includes 4CPe, a raw material used in making next generation, climate friendly refrigerants with low global warming and zero ozone depletion potential.
(b)Amount is gross production capacity for 50/50 joint venture with Orbia (formerly Mexichem).
| | |
| MIDSTREAM AND MARKETING OPERATIONS |
GENERAL
Occidental’s midstream and marketing operations primarily support and enhance its oil and gas and chemical businesses. The midstream and marketing segment strives to optimize the use of its gathering, processing, transportation, storage and terminal commitments and to provide access to domestic and international markets. To generate returns, the segment evaluates opportunities across the value chain and uses its assets to provide services to Occidental subsidiaries, as well as third parties. The midstream and marketing segment operates or contracts for services on gathering systems, gas plants, co-generation facilities and storage facilities and invests in entities that conduct similar activities, such as WES and Dolphin Energy Limited (DEL), which are accounted for as equity method investments. WES owns gathering systems, plants and pipelines and earns revenue from fee-based and service-based contracts with Occidental and third parties. DEL owns and operates a pipeline that connects its gas processing and compression plant in Qatar and its receiving facilities in the UAE, and uses its network of DEL-owned and other existing leased pipelines to supply natural gas across the UAE and to Oman. The midstream and marketing segment also includes OLCV businesses.
LOW-CARBON BUSINESS
Leveraging Occidental’s carbon management expertise, OLCV primarily focuses on advancing carbon removal and CCUS projects, including developing and commercializing DAC technology. OLCV also invests in third-party entities that are developing technologies that advance other low-carbon initiatives.
COMPETITION
Occidental’s midstream and marketing businesses operate in competitive and highly regulated markets. Occidental competes for capacity and infrastructure for the gathering, processing, transportation, storage and delivery of its products, which are sold at current market prices or on a forward basis to refiners, end users and other market participants. Occidental’s marketing business competes with other market participants on exchange platforms and through other bilateral transactions with direct counterparties.
Occidental’s midstream and marketing operations are conducted in the locations described below as of December 31, 2021:
| | | | | | | | |
| Location | Description | Capacity (a) |
| Gas Plants | |
| Texas, New Mexico and Colorado | Occidental and third-party-operated natural gas/CO2 gathering, compression and processing systems | 2.9 Bcf/d |
| Texas, Rocky Mountains and Other | Equity investment in WES - gas processing facilities | 5.0 Bcf/d |
| UAE | Natural gas processing facilities for Al Hosn Gas | 1.3 Bcf/d |
| Pipelines and Gathering Systems | |
| Texas, New Mexico and Colorado | CO2 fields and pipeline systems transporting CO2 to oil and gas producing locations | 2.8 Bcf/d |
| Qatar, UAE and Oman | Equity investment in the DEL natural gas pipeline | 3.2 Bcf/d |
| United States | Equity investment in WES involved in gathering and transportation | 15,389 miles of pipeline |
| Power Generation | |
| Texas and Louisiana | Occidental-operated power and steam generation facilities | 1,218 megawatts of electricity and 1.6 million pounds of steam per hour |
| OLCV | |
| Texas | Occidental-owned solar generation facility | 16.8 megawatts of electricity |
| Texas | Equity investment in a zero-emission natural gas generation demonstration facility | up to 50 megawatts of electricity |
| Canada | Equity investment in developing DAC technology, which captures CO2 directly from the atmosphere |
(a)Amounts are gross, including interests held by third parties. Gas capacities are expressed in billions of cubic feet per day (Bcf/d)
For environmental regulation information, including associated costs, see the information under Environmental Liabilities and Expenditures in the Management’s Discussion and Analysis of Financial Condition and Results of Operations section under Part II, Item 7, of this Form 10-K and Risk Factors under Part I, Item 1A.
ITEM 1A. RISK FACTORS
Risks related to government regulations and the environment
The COVID-19 pandemic has adversely affected our business and the ultimate effect on our operations and financial condition will depend on future developments, which are highly uncertain.
The COVID-19 pandemic disrupted global supply chains and created significant volatility in the financial markets. While the worldwide economy continues to be impacted by the ongoing effects of the COVID-19 pandemic and emergence and spread of new variants of the virus, demand for oil and gas products has increased with the lifting of certain restrictions, including certain travel restrictions and stay-at-home orders. Current crude oil, NGL and natural gas demand and prices could be negatively impacted by a resurgence of COVID-19 cases, slow vaccine distribution in certain large international economies or the recurrence or tightening of travel restrictions and stay-at-home orders. If reduced demand for and lower prices of crude oil, NGL and natural gas persist for a prolonged period, our operations, financial condition, cash flows, level of expenditures and the quantity of estimated proved reserves that may be attributed to our properties may be materially and adversely affected. Our operations also may be adversely affected if significant portions of our workforce are unable to work, or work effectively, including because of illness, quarantines, government actions, vaccine mandates or other restrictions in connection with the pandemic. As a result of higher vaccination rates and lower infection rates in 2021 we lifted certain workplace restrictions implemented in the initial stages of the pandemic and implemented new workplace safety protocols and procedures in our offices and work sites to help mitigate the spread of COVID-19 amongst our workforce. We continue to monitor national, state and local government directives where we have operations and/or offices and have reinstituted a WFH schedule effective December 21, 2021, through March 1, 2022, for certain domestic office-based employees in light of the Omicron variant. Occidental has not experienced any significant disruptions as a result of any new COVID-19 variants. The extent to which the COVID-19 pandemic adversely affects our business, results of operations and financial condition will depend on future developments, which are highly uncertain, including the scope and duration of the pandemic and actions taken by governmental authorities and other third parties in response to the pandemic. The COVID-19 pandemic may also materially adversely affect our operating and financial results in a manner that is not currently known to us or that we do not currently consider to present significant risks to our operations. To the extent the COVID-19 pandemic may continue to adversely affect our business, operations, financial condition and operating results, it may also have the effect of heightening the other risks described herein.
Governmental actions and political instability may affect Occidental’s results of operations.
Occidental’s businesses are subject to the actions and decisions of many federal, state, local and international governments and political interests. As a result, Occidental faces risks of:
■New or amended laws and regulations, or new or different applications or interpretations of existing laws and regulations, including those related to drilling, manufacturing or production processes (including flaring and well stimulation techniques such as hydraulic fracturing and acidization), pipelines, labor and employment, taxes, royalty rates, permitted production rates, entitlements, import, export and use of raw materials, equipment or products, use or increased use of land, water and other natural resources, air emissions, water recycling and disposal, waste minimization and disposal, safety, the manufacturing of chemicals, asset integrity management, the marketing or export of commodities, security, environmental protection, and climate change-related and sustainability initiatives, all of which may restrict or prohibit activities of Occidental or its contractors, increase Occidental’s costs or reduce demand for Occidental’s products. In addition, violation of certain governmental laws and regulations may result in strict, joint and several liability and the imposition of significant civil and criminal fines and penalties;
■Refusal of, or delay in, the extension or grant of exploration, development or production contracts; and
■Development delays and cost overruns due to approval delays for, or denial of, drilling, construction, environmental and other regulatory approvals, permits and authorizations.
In November 2021, Congress passed and President Biden signed the Infrastructure Investment and Jobs Act. This law reinstates the federal Superfund excise taxes on various chemicals that OxyChem manufactures. These excise taxes could lead to higher costs and impact margins.
In November 2021, the House of Representatives passed the Build Back Better Act (BBB), which contains several climate-related provisions. While the BBB was not enacted in 2021, renewed efforts are expected in 2022 to legislate BBB or portions thereof. Provisions, if any, that reduce demand for oil and gas could negatively affect Occidental’s revenue.
In November 2021, the U.S. Department of the Interior (DOI) released its Report on the Federal Oil and Gas Leasing Program, recommending increasing royalty rates and rents for drilling programs on federal public lands and in federal offshore waters, in addition to prioritizing leasing in areas with known resource potential and in proximity to existing oil and gas infrastructure and avoiding leasing in areas with competing uses such as recreation, wildlife habitat, conservation and historical and cultural resources. If enacted, the regulations could increase royalties payable to the federal government and limit future potential drilling sites.
In January 2022, the U.S. District Court for the District of Columbia issued a decision to invalidate the results of Bureau of Ocean Energy Management’s oil and gas lease sale in the Gulf of Mexico, of which Occidental was the high bidder on 30 additional new blocks located nearby to its existing host platforms, ruling that the environmental analysis of GHG emissions was inadequate under the National Environmental Policy Act (NEPA). The DOI, which oversees federal oil and gas development, is currently reviewing the decision. The decision does not affect Occidental’s existing leases or operations, but restrictions or uncertainty regarding federal lease sales and associated NEPA requirements could impact the ability to develop resources in areas outside of existing leases.
In January 2021, the Colorado Oil and Gas Conservation Commission (COGCC) adopted new regulations that impose siting requirements or “setbacks” on certain oil and gas drilling locations based on the distance of a proposed well pad to occupied structures. Pursuant to the regulations, well pads cannot be located within 500 feet of an occupied structure without the consent of the property owner. As part of the permitting process, the COGCC will consider a series of siting requirements for all drilling locations located between 500 feet and 2,000 feet of an occupied structure. Alternatively, the operator may seek a waiver from each owner and tenant within the designated distance. Occidental has a dedicated, multidisciplinary stakeholder relations team that conducts regulatory and community outreach with respect to its permit applications and operations in Colorado. While Occidental has not been denied any permits, and received its first approved Oil and Gas Development Plan permit under the new state regulations in the fourth quarter of 2021, any significant delays could result in changes to our development program in the DJ Basin and our ability to establish new proved undeveloped (PUD) locations by meeting the SEC’s “reasonably certain” threshold for adding PUD reserves.
Texas and New Mexico have experienced an increase in seismic activity, with events measuring magnitude 3 or greater in each state. In the fourth quarter of 2021, both states issued new guidelines for operators to prevent or mitigate seismic activity, focused on produced water disposal wells. These guidelines also require operators to implement response plans for activities within agency-designated seismic response areas. These states have curtailed water disposal and suspended permits in seismic response areas, particularly in deep disposal wells. Occidental does not operate deep disposal wells in the seismic response areas established by the state agencies to date, and its shallow disposal wells have been authorized to operate at agency-approved volume limits. Occidental also has central water treatment and recycling facilities that reduce the need for disposal of produced water. While Occidental’s ability to drill and complete wells or to dispose of surplus produced water has not been impacted by these seismic guidelines to date, increased seismicity, or regulatory responses to seismic events, could impact the location, timing and cost of Occidental’s development program and existing operations in seismic response areas.
In addition, Occidental has experienced and may continue to experience adverse consequences, such as risk of loss or production limitations, because certain of its international operations are located in countries affected by political instability, nationalizations, corruption, armed conflict, terrorism, insurgency, civil unrest, security problems, labor unrest, Organization of the Petroleum Exporting Countries (OPEC) production restrictions, equipment import restrictions and sanctions. Exposure to such risks may increase if a greater percentage of Occidental’s future oil and gas production or revenue comes from international sources.
Climate change and further regulation of GHG and other air emissions may adversely affect Occidental’s operations or results.
Continuing political, social and industry attention to climate change has resulted in both existing and pending international agreements and national, regional and local legislation and regulatory programs to reduce GHG emissions. In December 2009, the Environmental Protection Agency (EPA) determined that CO2, methane and other GHG emissions endanger public health and the environment because they contribute to warming of the Earth’s atmosphere and other climatic changes. Based on these findings, the EPA began adopting and implementing regulations to restrict GHG emissions under existing provisions of the Clean Air Act. The EPA issued regulations in 2012 and 2016 to address methane and volatile organic compound (VOC) emissions from certain new or modified oil and gas sources, the methane provisions of which were rescinded by the Trump Administration’s 2020 methane policy rule. The Biden Administration has identified climate change as a priority and has identified a variety of avenues to prohibit or restrict oil and gas development activities in certain areas. In June 2021, Congress and President Biden rescinded the 2020 policy rule under the Congressional Review Act, reinstating the methane provisions of EPA’s 2012 and 2016 regulations, an action that Occidental supported. In November 2021, the White House Office of Domestic Climate Policy issued a U.S. Methane Emissions Reduction Action Plan that solicited public comment on the EPA’s proposed framework for expanding federal regulations. The proposal would regulate
methane and VOC emissions from a broader set of new upstream and midstream operations, as well as various existing operations. The EPA is expected to issue proposed regulations in 2022 based on this framework.
Several state governments have also established rules aimed at reducing GHG emissions, some including GHG cap and trade programs and others directly regulating equipment that emits GHG, including methane, and other compounds. Most of these cap and trade programs work by requiring major sources of emissions, such as electric power plants, or major producers of fuels, including refineries and natural gas processing plants, to acquire and surrender emission allowances. Other U.S. states where Occidental operates, including Colorado, New Mexico and Texas, adopted or proposed new regulations, policies or strategies in 2021 that increase inspection, recordkeeping, reporting, enforcement and controls on flaring, venting and equipment that emit methane and other compounds at oil and gas facilities. In certain instances, these states anticipate tying the processing and active status of oil and gas permits, including drilling permits, to air emissions and compliance. For example, Colorado has established GHG intensity targets for DJ Basin operators in 2025, 2027 and 2030, which Occidental currently meets.
These and other government actions relating to GHG and other air emissions could require Occidental to incur increased operating and maintenance costs including higher rates charged by service providers, costs to purchase, operate and maintain emissions control systems, to acquire emission allowances, pay carbon taxes or comply with new regulatory or reporting requirements or prevent Occidental from conducting oil and gas development activities in certain areas, or they could promote the use of alternative sources of energy and thereby decrease demand for oil, NGL and natural gas and other products that Occidental’s businesses produce. Any such legislation or regulatory programs could also increase the cost of consuming, and thereby reduce demand for, oil, NGL, natural gas or other products produced by Occidental’s businesses and lower the value of its reserves. Consequently, government actions designed to reduce GHG emissions could have an adverse effect on Occidental’s business, financial condition, results of operations, cash flows and reserves.
It is difficult to predict the timing, certainty and scope of such government actions and their ultimate effect on Occidental, which could depend on, among other things, the type and extent of GHG emissions reductions required, the availability and price of emission allowances or credits, the availability and price of alternative fuel sources, the energy sectors covered and Occidental’s ability to recover the costs incurred through its operating agreements or the pricing of its oil, NGL, natural gas and other products and whether service providers are able to pass increased costs through to Occidental.
There also have been efforts in the investment community, including investment advisers and certain sovereign wealth, pension and endowment funds, as well as political actors and other stakeholders, promoting divestment of fossil fuel equities, reducing access to capital markets and pressuring lenders to limit funding or increase the cost of lending to companies engaged in the extraction of fossil fuel reserves. Additionally, institutional lenders who provide financing to oil and gas companies have become more attentive to sustainable lending practices, and some of them may substantially reduce, or elect not to provide, funding for oil and gas companies. Such environmental initiatives aimed at limiting climate change and reducing air pollution could adversely affect our business activities, operations and ability to access capital, and could cause the market value of our securities to decrease, our cost of capital to increase and adversely affect our reputation. Finally, increasing attention to climate change risks has resulted in an increased possibility of governmental investigations and additional private litigation against Occidental without regard to causation or our contribution to the asserted damage, which could increase our costs or otherwise adversely affect our business.
Occidental’s businesses may experience catastrophic events.
The occurrence of severe weather events such as hurricanes, floods, freezes and heat waves, droughts, earthquakes or other acts of nature, pandemics, well blowouts, fires, explosions, pipeline ruptures, chemical releases, oil releases, including maritime releases, releases into navigable waters and groundwater contamination, material or mechanical failure, power outages, industrial accidents, physical or cyber attacks, abnormally pressured or structured formations and other events that cause operations to cease or be curtailed may negatively affect Occidental’s businesses and the communities in which it operates. Coastal operations are particularly susceptible to disruption from severe weather events. Any of these risks could adversely affect our ability to conduct operations or result in substantial losses to us as a result of:
■Damage to and destruction of property and equipment, including property and equipment owned by third-parties which our operations rely upon;
■Damage to natural resources;
■Pollution and other environmental damage, including spillage or mishandling of recovered chemicals or fluids;
■Regulatory investigations, fines and penalties;
■Loss of well location, acreage, expected production and related reserves;
■Suspension or delay of our operations;
■Substantial liability claims; and
■Significant repair and remediation costs that increase our break-even economics.
Third-party insurance may not provide adequate coverage or Occidental may be self-insured with respect to the related losses. In addition, under certain circumstances, we may be liable for environmental damage caused by previous owners or operators of properties that we own, lease or operate. As a result, we may incur substantial liabilities to third parties or governmental entities for environmental matters for which we do not have insurance coverage, which could reduce or
eliminate funds available for exploration, development, acquisitions or other investments in our business, or cause us to incur losses.
Risks related to Occidental’s business and operations
Volatile global and local commodity pricing strongly affect Occidental’s results of operations.
Occidental’s financial results correlate closely to the prices it obtains for its products, particularly oil and, to a lesser extent, NGL, natural gas and its chemical products.
Prices for oil, NGL and natural gas fluctuate widely. Historically, the markets for oil, NGL and natural gas have been volatile and may continue to be volatile in the future. If the prices of oil, NGL or natural gas continue to be volatile or decline, Occidental’s operations, financial condition, cash flows, level of expenditures and the quantity of estimated proved reserves that may be attributed to our properties may be materially and adversely affected. Prices are set by global and local market forces which are not in Occidental’s control. These factors include, among others:
■Worldwide and domestic supplies of, and demand for, oil, NGL, natural gas and refined products;
■The cost of exploring for, developing, producing, refining and marketing oil, NGL, natural gas and refined products;
■Operational impacts such as production disruptions, technological advances and regional market conditions, including available transportation capacity and infrastructure constraints in producing areas;
■Changes in weather patterns and climate;
■The impacts of the members of OPEC and other non-OPEC member-producing nations that may agree to and maintain production levels;
■The worldwide military and political environment, including uncertainty or instability resulting from an escalation or outbreak of armed hostilities or acts of terrorism in the United States or elsewhere;
■The price and availability of and demand for alternative and competing fuels and emissions reducing technology;
■Technological advances affecting energy consumption and supply;
■Government policies and support and market demand for low-carbon technologies;
■Domestic and international governmental regulations and taxes, including those that restrict the export of hydrocarbons;
■Shareholder activism or activities by non-governmental organizations to restrict the exploration, development and production of oil, NGL and natural gas;
■Additional or increased nationalization and expropriation activities by international governments;
■The impact and uncertainty of world health events, including the COVID-19 pandemic and the spread of new variants;
■The effect of releases from the U.S. Strategic Petroleum Reserve;
■Volatility in commodity markets;
■The effect of energy conservation efforts; and
■Global inventory levels and general economic conditions.
The long-term effects of these and other conditions on the prices of oil, NGL, natural gas and chemical products are uncertain and there can be no assurance that the demand or pricing for Occidental’s products will follow historic patterns in the near-term. Prolonged or substantial decline, or sustained market uncertainty, in these commodity prices may have the following effects on Occidental’s business:
■Adversely affect Occidental’s financial condition, results of operations, liquidity, ability to reduce debt, access to and cost of capital, and ability to finance planned capital expenditures, pay dividends and repurchase shares;
■Reduce the amount of oil, NGL and natural gas that Occidental can produce economically;
■Cause Occidental to delay or postpone some of its capital projects;
■Reduce Occidental’s revenues, operating income or cash flows;
■Reduce the amounts of Occidental’s estimated proved oil, NGL and natural gas reserves;
■Reduce the carrying value of Occidental’s oil and natural gas properties due to recognizing impairments of proved properties, unproved properties and exploration assets;
■Reduce the standardized measure of discounted future net cash flows relating to oil, NGL and natural gas reserves; and
■Adversely affect the ability of Occidental’s partners to fund their working interest capital requirements.
Generally, Occidental’s historical practice has been to remain exposed to the market prices of commodities. In 2019, Occidental entered into 2020 Brent-priced 3-way collars combined with 2021 call options on the same volume to manage its near-term exposure to cash flow variability from oil price risks in 2020. The 2021 call options were sold to enhance the upside retention in 2020. In 2020, management elected to hedge a portion of Occidental’s expected 2021 natural gas production to enhance cash flow stability. As of December 31, 2021, there are no active commodity hedges in place.
Management may choose to put hedges in place in the future for oil, NGL and natural gas commodities. Commodity price risk management activities may prevent us from fully benefiting from price increases and may expose us to regulatory, counterparty credit and other risks.
The prices obtained for Occidental’s chemical products correlate to the strength of the United States and global economies, as well as chemical industry expansion and contraction cycles. Occidental also depends on feedstocks and energy to produce chemicals, which are commodities subject to significant price fluctuations.
Occidental may experience delays, cost overruns, losses or other unrealized expectations in development efforts and exploration activities.
Oil, NGL and natural gas exploration and production activities are subject to numerous risks beyond our control, including the risk that drilling will not result in commercially viable oil, NGL and natural gas production. In its development and exploration activities, Occidental bears the risks of:
■Equipment failures;
■Construction delays;
■Escalating costs or competition for services, materials, supplies or labor;
■Property or border disputes;
■Disappointing drilling results or reservoir performance;
■Title problems and other associated risks that may affect its ability to profitably grow production, replace reserves and achieve its targeted returns;
■Actions by third-party operators of our properties;
■Permit delays and costs of drilling wells on lands subject to complex development terms and circumstances; and
■Oil, NGL and natural gas gathering, transportation and processing availability, restrictions or limitations.
Exploration is inherently risky and is subject to delays, misinterpretation of geologic or engineering data, unexpected geologic conditions or finding reserves of disappointing quality or quantity, which may result in significant losses.
Occidental’s oil and gas business operates in highly competitive environments, which affect, among other things, its ability to source production and replace reserves.
Results of operations, reserves replacement and the level of oil and gas production depend, in part, on Occidental’s ability to profitably acquire additional reserves. Occidental has many competitors (including national oil companies), some of which: (i) are larger and better funded; (ii) may be willing to accept greater risks; (iii) have greater access to capital; (iv) have substantially larger staffs; or (v) have special competencies. Competition for access to reserves may make it more difficult to find attractive investment opportunities or require delay of reserve replacement efforts. Further, during periods of low product prices, any cash conservation efforts may delay production growth and reserve replacement efforts. Also, there is substantial competition for capital available for investment in the oil and natural gas industry. Our failure to acquire properties, potentially grow production, replace reserves and attract and retain qualified personnel could have a material adverse effect on our cash flows and results of operations.
In addition, Occidental’s acquisition activities carry risks that it may: (i) not fully realize anticipated benefits due to less-than-expected reserves or production or changed circumstances, such as declines in oil, NGL and natural gas prices; (ii) bear unexpected integration costs or experience other integration difficulties; (iii) experience share price declines based on the market’s evaluation of the activity; or (iv) be subject to liabilities that are greater than anticipated.
Occidental’s oil and gas reserves are estimates based on professional judgments and may be subject to revision.
Reported oil and gas reserves are an estimate based on periodic review of reservoir characteristics and recoverability, including production decline rates, operating performance and economic feasibility at the prescribed weighted average commodity prices, future operating costs and capital expenditures, workover and remedial costs, assumed effects of regulation by governmental agencies, the quantity, quality and interpretation of relevant data, taxes and availability of funds. The procedures and methods for estimating the reserves by our internal engineers were reviewed by independent petroleum consultants; however, there are inherent uncertainties in estimating reserves. Actual production, revenues, expenditures, oil, NGL and natural gas prices and taxes with respect to our reserves may vary from estimates and the variance may be material. Additional regulation around GHG emissions and future costs related to a lower carbon intensive economy could result in a shortened oil and gas reservoir reserve life as the underlying reserves become uneconomical. If Occidental were required to make significant negative reserve revisions, its results of operations and stock price could be adversely affected.
In addition, the discounted cash flows included in this Form 10-K should not be construed as the fair value of the reserves attributable to our properties. The estimated discounted future net cash flows from proved reserves are based on an unweighted arithmetic average of the first-day-of-the-month price for each month within the year in accordance with SEC regulations. Actual future prices and costs may differ materially from SEC regulation-compliant prices and costs used for
purposes of estimating future discounted net cash flows from proved reserves. Also, actual future net cash flows may differ from these discounted net cash flows due to the amount and timing of actual production, availability of financing for capital expenditures necessary to develop our undeveloped reserves, supply and demand for oil, NGL and natural gas, increases or decreases in consumption of oil, NGL and natural gas and changes in governmental regulations or taxation.
Occidental’s future results could be adversely affected if it is unable to execute new business strategies effectively.
Occidental’s results of operations depend on the extent to which it can execute new business strategies effectively relative to both the larger transition to sustainable energy and government regulation regarding the environment and climate change. Occidental’s strategies, which include the goal of reaching net-zero emissions in its operations and energy use before 2040, are subject to business, economic and competitive uncertainties and contingencies, many of which are beyond its control. Additionally, Occidental may be forced to develop or implement new technologies at substantial costs to achieve its strategies. Effective execution of these goals may require substantial new capital, which might not be available to Occidental in the amounts or at the times expected. In addition, raising such capital may increase our leverage or overall costs of doing business. These uncertainties and costs could cause Occidental to not be able to fully implement or realize the anticipated results and benefits of its business strategies.
Certain of Occidental’s emissions goals are dependent upon the successful implementation of new and existing technology on an industrial scale. These technologies are in various stages of development or implementation and may require more capital, or take longer to develop, than currently expected. Further, these carbon management technologies are in competition with technology being developed by other companies. The carbon management solutions are not well established and, while Occidental believes it has access to the technology and the expertise necessary to develop these on an industrial scale, Occidental may not ultimately succeed in achieving its GHG emissions reduction and net-zero goals.
Occidental’s strategy to include carbon management in its product line is also dependent upon demand for carbon sequestration and related carbon offsets and attributes. If this market does not develop, or if the regulatory environment does not support carbon management activities, Occidental may not be successful in entering this industry.
Occidental’s aspirations, goals and initiatives related to carbon management and overall sustainability expose it to numerous risks.
We continue to develop new technology and strategies to meet our emissions goals. Our efforts to research, establish, accomplish and accurately report on our emissions goals, targets and strategies expose Occidental to numerous operational, reputational, financial, legal and other risks. Our ability to reach our target emissions is subject to a multitude of factors and conditions, many of which are out of our control. Examples of such factors include evolving government regulation, the pace of changes in technology, the successful development and deployment of existing or new technologies and business solutions on a commercial scale, the availability, timing and cost of equipment, manufactured goods and services, and the availability of requisite financing and federal and state incentive programs.
Occidental may face increased scrutiny from the investment community, other stakeholders and the media related to its emissions goals and strategies. If Occidental’s emissions goals and strategies to achieve them do not meet evolving investor or other stakeholder expectations or standards, Occidental’s reputation, ability to attract and retain employees and attractiveness as an investment, business partner or acquirer could be negatively impacted. Similarly, Occidental’s failure or perceived failure to fulfill its emissions goals and targets, to comply with ethical, environmental, social, governance or other standards, regulations, or expectations, or to satisfy various reporting standards with respect to these matters effectively could have the same negative impacts and further expose Occidental to government enforcement actions and private litigation. Even if Occidental achieves its goals, targets and objectives, it may not realize all of the benefits that it expected at the time the goals were established.
Occidental has previously recorded impairments of its proved and unproved oil and gas properties and will continue to assess further impairments in the future.
We have recorded impairments of our proved and unproved oil and gas properties resulting from prolonged declines in oil and gas prices and may record such impairments in the future. Past impairments included pre-tax impairment and related charges to both proved and unproved oil and gas properties and a lower of cost or net realizable value adjustment for crude inventory. If there is an adverse downturn of the macroeconomic conditions and if such downturn is expected to or does persist for a prolonged period of time, Occidental’s oil and gas properties may be subject to further testing for impairment, which could result in additional non-cash asset impairments. Such impairments could be material to the financial statements.
Future costs associated with reducing emissions and carbon impacts, as well as impacts resulting from other risk factors described herein, could lead to impairments in the future, if such costs significantly increase our breakeven economics.
Occidental uses CO2 for its EOR operations. Occidental’s production from these operations may decline if Occidental is not able to obtain sufficient amounts of CO2.
Occidental’s CO2 EOR operations are critical to Occidental’s long-term strategy. Oil production from Occidental’s CO2 EOR projects depends largely on having access to sufficient amounts of naturally occurring or anthropogenic (human-made) CO2. Occidental’s ability to produce oil from its CO2 EOR projects would be hindered if the supply of CO2 was limited due to, among other things, problems with current CO2 producing wells and facilities, including compression equipment, catastrophic pipeline failure or the ability to economically purchase naturally occurring or anthropogenic CO2. This could have a material adverse effect on Occidental’s financial condition, results of operations or cash flows. Future oil production from its CO2 EOR operations is dependent on the timing, volumes and location of CO2 injections and, in particular, Occidental’s ability to obtain sufficient volumes of CO2. Market conditions may cause the delay or cancellation of the development of naturally occurring CO2 sources or construction of plants that produce anthropogenic CO2 as a byproduct that can be purchased, thus limiting the amount of CO2 available for use in Occidental’s CO2 EOR operations.
Occidental is exposed to cyber-related risks.
The oil and gas industry is increasingly dependent on digital and industrial control technologies to conduct certain exploration, development and production activities. Occidental relies on digital and industrial control systems, related infrastructure, technologies and networks to run its business and to control and manage its oil and gas, chemicals, marketing and pipeline operations. Use of the internet, cloud services, mobile communication systems and other public networks exposes Occidental’s business and that of other third parties with whom Occidental does business to cyber attacks. Cyber attacks on businesses have escalated in recent years.
Information and industrial control technology system failures, network disruptions and breaches of data security could disrupt our operations by causing delays, impeding processing of transactions and reporting financial results, leading to the unintentional disclosure of company, partner, customer or employee information or could damage our reputation. A cyber attack involving our information or industrial control systems and related infrastructure, or that of our business associates, could negatively impact our operations in a variety of ways, including, but not limited to, the following:
■Unauthorized access to seismic data, reserves information, strategic information or other sensitive or proprietary information could have a negative impact on our ability to compete for oil and natural gas resources;
■Data corruption, communication or systems interruption or other operational disruption during drilling activities could result in delays and failure to reach the intended target or cause a drilling incident;
■Data corruption, communication or systems interruption or operational disruptions of production-related infrastructure could result in a loss of production or accidental discharge;
■A cyber attack on our chemical operations could result in a disruption of the manufacturing and marketing of our products or a potential environmental hazard;
■A cyber attack on a vendor or service provider could result in supply chain disruptions, which could delay or halt our construction and development projects;
■A cyber attack on third-party gathering, pipeline, processing, terminal or other infrastructure systems could delay or prevent us from producing, transporting, processing and marketing our production;
■A cyber attack involving commodities exchanges or financial institutions could slow or halt commodities trading, thus preventing us from marketing our production or engaging in hedging activities;
■A cyber attack that halts activities at a power generation facility or refinery using natural gas as feedstock could have a significant impact on the natural gas market;
■A cyber attack on a communications network or power grid could cause operational disruption;
■A cyber attack on our automated and surveillance systems could cause a loss in production and potential environmental hazards;
■A deliberate corruption of our financial or operating data could result in events of non-compliance which could then lead to regulatory fines or penalties; and
■A cyber attack resulting in the loss or disclosure of, or damage to, our or any of our customer’s or supplier’s data or confidential information could harm our business by damaging our reputation, subjecting us to potential financial or legal liability and requiring us to incur significant costs, including costs to repair or restore our systems and data or to take other remedial steps.
Although Occidental has implemented controls and multiple layers of security to mitigate the risks of a cyber attack that it believes are reasonable, there can be no assurance that such cyber security measures will be sufficient to prevent security breaches of its systems from occurring, and if a breach occurs, it may remain undetected for an extended period of time. Further, Occidental has no control over the comparable systems of the third parties with whom it does business. While Occidental has experienced cyber attacks in the past, Occidental has not suffered any material losses. However, if in the future Occidental’s cyber security measures are compromised or prove insufficient, the potential consequences to Occidental’s businesses and the communities in which it operates could be significant. As cyber attacks continue to evolve
in magnitude and sophistication, Occidental may be required to expend additional resources in order to continue to enhance Occidental’s cyber security measures and to investigate and remediate any digital and operational systems, related infrastructure, technologies and network security vulnerabilities, which would increase our costs. A system failure or data security breach, or a series of such failures or breaches, could have a material adverse effect on our financial condition, results of operations or cash flows.
Occidental’s oil and gas reserve additions may not continue at the same rate and a failure to replace reserves may negatively affect Occidental’s business.
Producing oil and natural gas reservoirs generally are characterized by declining production rates that vary depending upon reservoir characteristics and other factors. Unless Occidental conducts successful exploration or development activities, acquires properties containing proved reserves, or both, proved reserves will generally decline and negatively impact our business. The value of our securities and our ability to raise capital will be adversely impacted if we are not able to replace reserves that are depleted by production or replace our declining production with new production by successfully allocating annual capital to maintain our reserves and production base. Occidental expects infill development projects, extensions, discoveries and improved recovery to continue as main sources for reserve additions but factors such as geology, government regulations and permits, the effectiveness of development plans and the ability to make the necessary capital investments or acquire capital are partially or fully outside management’s control and could cause results to differ materially from expectations.
Occidental’s operations and financial results could be significantly negatively impacted by its offshore operations.
Occidental is vulnerable to risks associated with our offshore operations that could negatively impact our operations and financial results. Occidental conducts offshore operations primarily in the Gulf of Mexico and its operations and financial results are vulnerable to certain unique risks associated with operating offshore, including conditions relating to the following:
■Hurricanes and other adverse weather conditions;
■Geological complexities and water depths associated with such operations;
■Limited number of partners available to participate in projects;
■Oilfield service costs and availability;
■Compliance with environmental, safety and other laws and regulations;
■Terrorist attacks or piracy;
■Remediation and other costs and regulatory changes resulting from oil spills, emissions or releases of hazardous materials;
■Failure of equipment or facilities; and
■Response capabilities for personnel, equipment or environmental incidents.
In addition, Occidental conducts some of its exploration in deep waters (greater than 1,000 feet) where operations, support services and decommissioning activities are more difficult and costly than in shallower waters. The deep waters in the Gulf of Mexico, as well as international deep-water locations, lack the physical and oilfield service infrastructure present in shallower waters. As a result, deep-water operations may require significant time between a discovery and the time that Occidental can market its production, thereby increasing the risk involved with these operations.
Occidental’s operations in the Gulf of Mexico were negatively impacted by Hurricane Ida in 2021, which reduced production by approximately 2.5 million barrels of oil equivalent (MMboe), associated with safely shutting in production, evacuating and then restarting the platforms.
Occidental’s indebtedness may make it more vulnerable to economic downturns and adverse developments in its business. Downgrades in Occidental’s credit ratings or future increases in interest rates may negatively impact Occidental’s cost of capital, and ability to access capital markets.
Occidental’s level of indebtedness could increase Occidental’s vulnerability to adverse changes in general economic and industry conditions, economic downturns and adverse developments in its business and/or limit Occidental’s flexibility in planning for or reacting to changes in its business and the industries in which it operates. From time to time, Occidental has relied on access to capital markets for funding, including in connection with the Acquisition. There can be no assurance that additional debt or equity financing will be available to Occidental in the future on acceptable terms, or at all. Occidental’s ability to obtain additional financing or refinancing will be subject to a number of factors, including general economic and market conditions, Occidental’s performance, investor sentiment and its ability to meet existing debt compliance requirements. If Occidental is unable to generate sufficient funds from its operations to satisfy its capital requirements, including its existing debt obligations, or to raise additional capital on acceptable terms, Occidental’s business could be
adversely affected. As of the date of this filing, Occidental’s long-term debt was rated BB+ by Fitch Ratings, Ba2 by Moody’s Investors Service and BB+ by Standard and Poor’s. Any downgrade in the credit ratings of Occidental could negatively impact its cost of, and ability to access, capital and to effectively execute aspects of its strategy and may require Occidental to provide cash collateral, letters of credit or other forms of security under certain contractual agreements, which would increase Occidental’s operating costs and reduce liquidity.
One of Occidental’s subsidiaries acts as the general partner of WES, a publicly traded master limited partnership, which may involve potential legal liability.
One of Occidental’s subsidiaries acts as the general partner of WES, a publicly traded master limited partnership. Our general partner interest in WES may increase the possibility that we could be subject to claims of breach of duties owed to WES, including claims of conflict of interest. Any such claims could increase our costs and any liability resulting from such claims could have a material adverse effect on Occidental’s financial condition, operating results or cash flows.
Anadarko’s Tronox settlement may not be deductible for income tax purposes; Occidental may be required to repay the tax refund Anadarko received in 2016 related to the deduction of the Tronox settlement payment, which may have a material adverse effect on Occidental’s results of operations, liquidity and financial condition.
In April 2014, Anadarko and Kerr-McGee Corporation and certain of its subsidiaries (collectively, Kerr-McGee) entered into a settlement agreement for $5.2 billion, resolving, among other things, all claims that were or could have been asserted in connection with the May 2009 lawsuit filed by Tronox against Anadarko and Kerr-McGee in the U.S. Bankruptcy Court for the Southern District of New York. After the settlement became effective in January 2015, Anadarko paid $5.2 billion and deducted this payment on its 2015 federal income tax return. Due to the deduction, Anadarko had a net operating loss carryback for 2015, which resulted in a tentative tax refund of $881 million in 2016.
The Internal Revenue Service (IRS) has audited Anadarko’s tax position regarding the deductibility of the payment and in September 2018 issued a statutory notice of deficiency rejecting Anadarko’s refund claim. Anadarko disagreed and filed a petition with the U.S. Tax Court to dispute the disallowance in November 2018. The case was in the IRS appeals process until the second quarter of 2020; however, it has since been returned to the U.S. Tax Court, where a trial date has been set for July 2022 and Occidental expects to continue pursuing resolution. In accordance with Accounting Standards Codification (ASC) Topic 740’s guidance on the accounting for uncertain tax positions, as of December 31, 2021, Occidental has recorded no tax benefit on the tentative cash tax refund. If the payment is ultimately determined not to be deductible, Occidental would be required to repay the tentative refund received plus interest totaling approximately $1.3 billion as of December 31, 2021, which could have a material adverse effect on our liquidity and consolidated balance sheets. Occidental’s consolidated financial statements include an uncertain tax position for the approximate repayment of $1 billion ($1 billion federal and $27 million in state taxes) plus accrued interest of approximately $314 million. This amount is not covered by insurance. For additional information on income taxes, see Note 10 - Income Taxes in the Notes to Consolidated Financial Statements in Part II Item 8 of this Form 10-K.
ITEM 1B. UNRESOLVED STAFF COMMENTS
None.
ITEM 3. LEGAL PROCEEDINGS
For information regarding legal proceedings, see the information under Lawsuits, Claims, Commitments and Contingencies in the Management’s Discussion and Analysis section of this Form 10-K and in Note 13 - Lawsuits, Claims, Commitments and Contingencies in the Notes to Consolidated Financial Statements in Part II Item 8 of this Form 10-K.
ITEM 4. MINE SAFETY DISCLOSURES
Not applicable.
| | |
| INFORMATION ABOUT OUR EXECUTIVE OFFICERS |
Each executive officer holds his or her office from the date of election by the Board of Directors until the first board meeting held after the next Annual Meeting of Stockholders or until his or her removal or departure or a successor is duly elected, if earlier.
The following table sets forth the executive officers of Occidental as of February 24, 2022:
| | | | | | | | |
Name Current Title | Age as of February 24, 2022 | Positions with Occidental and Employment History |
|
Marcia E. Backus Senior Vice President, General Counsel and Chief Compliance Officer | 67 | Senior Vice President, General Counsel and Chief Compliance Officer since December 2016. |
Peter J. Bennett Vice President | 54 | President, Commercial Development U.S. Onshore Resources and Carbon Management since October 2020; President and General Manager of Permian Resources and the Rockies, 2020; Senior Vice President, Permian Resources, 2018-2020; President and General Manager - Permian Resources New Mexico, 2017-2018; Chief Transformation Officer, 2016-2017. |
Christopher O. Champion Vice President, Chief Accounting Officer and Controller | 52 | Vice President, Chief Accounting Officer and Controller since August 2019; Anadarko Petroleum Corporation: Senior Vice President, Chief Accounting Officer and Controller, 2017-2019, Vice President, Chief Accounting Officer and Controller, 2015-2017. |
Kenneth Dillon Senior Vice President | 62 | Senior Vice President since December 2016; President – International Oil and Gas Operations since June 2016. |
Vicki Hollub President and Chief Executive Officer | 62 | President, Chief Executive Officer and Director since April 2016. |
Richard A. Jackson Senior Vice President | 46 | President Operations U.S. Onshore Resources and Carbon Management since October 2020; President and General Manager, EOR and Oxy Low Carbon Ventures, LLC, 2020; President Low Carbon Ventures, 2019-2020; Senior Vice President, Operation Support, 2018-2019; Vice President, Investor Relations, 2017-2018; President and General Manager Permian Resources Delaware Basin, 2014-2017. |
Robert L. Peterson Senior Vice President and Chief Financial Officer | 51 | Senior Vice President and Chief Financial Officer since April 2020; Senior Vice President, Permian EOR, 2019-2020; Vice President Permian Strategy, 2018-2019; Director Permian Business Area, 2017-2018; President OxyChem, 2014-2017. |
Part II
ITEM 5. MARKET FOR REGISTRANT’S COMMON EQUITY, RELATED STOCKHOLDER MATTERS AND ISSUER PURCHASES OF EQUITY SECURITIES
| | |
| MARKET INFORMATION, HOLDERS AND DIVIDEND POLICY |
Occidental’s common stock is listed and traded on the New York Stock Exchange (NYSE) under the ticker symbol “OXY.” The common stock was held by approximately 26,800 stockholders of record as of January 31, 2022, which does not include beneficial owners for whom Cede and Co. or others act as nominees.
Occidental’s current annualized dividend rate is $0.04 per share. The declaration of future dividends is a business decision made by the Board of Directors from time to time and will depend on Occidental’s financial condition and other factors deemed relevant by the Board of Directors.
| | |
| SHARE REPURCHASE ACTIVITIES |
Occidental’s share repurchase activities for the year ended December 31, 2021, were as follows:
| | | | | | | | | | | | | | | | | | | | | | | | | | | | | | | | | | | | | | | | | |
| Period | | Total
Number
of Shares Purchased | (a) | Average
Price
Paid
per Share | | Total Number of Shares Purchased as Part of Publicly Announced
Plans or Programs | | Maximum Number of Shares that May Yet Be Purchased Under the
Plans or Programs |
| First Quarter 2021 | | 148,296 | | | | | $ | 22.62 | | | — | | | | | |
| Second Quarter 2021 | | — | | | | | $ | — | | | — | | | | | |
| Third Quarter 2021 | | — | | | | | $ | — | | | — | | | | | |
| October 1 - 31, 2021 | | 148,464 | | | | | $ | 32.77 | | | — | | | | | |
| November 1 - 30, 2021 | | — | | | | | $ | — | | | — | | | | | |
| December 1 - 31, 2021 | | — | | | | | $ | — | | | — | | | | | |
| Fourth Quarter 2021 | | 148,464 | | | | | $ | 32.77 | | | — | | | | | |
| Total 2021 | | 296,760 | | | | | $ | 27.70 | | | — | | | | 44,206,787 | | (b) |
(a)All 2021 purchases were from the trustee of Occidental’s defined contribution savings plan.
(b)Represents the total number of shares remaining at year end under Occidental’s previous share repurchase program of 185 million shares. The program was initially announced in 2005. The program did not obligate Occidental to acquire any specific number of shares and could be discontinued at any time. See “Liquidity and Capital Resources” in the Management’s Discussion and Analysis of Financial Condition and Results of Operations section under Part II, Item 7, of this Form 10-K for more information on Occidental’s recently announced share repurchase program.
The following graph compares the yearly percentage change in Occidental’s cumulative total return on its common stock with the cumulative total return of the Standard & Poor’s 500 Stock Index (S&P 500), which includes Occidental, with that of Occidental’s peer group over the five-year period ended December 31, 2021. The graph assumes that $100 was invested at the beginning of the five-year period shown in the graph below in: (i) Occidental common stock, (ii) the stock of the companies in the S&P 500 and (iii) each of the peer group companies’ common stock weighted by their relative market capitalization within the peer group and that all dividends were reinvested. The cumulative total return of the peer group companies’ common stock includes the cumulative total return of Occidental’s common stock.
Occidental’s peer group consists of BP p.l.c., Chevron Corporation, ConocoPhillips, EOG Resources, Inc., ExxonMobil Corporation, Shell, TotalEnergies SE (Total) and Occidental.
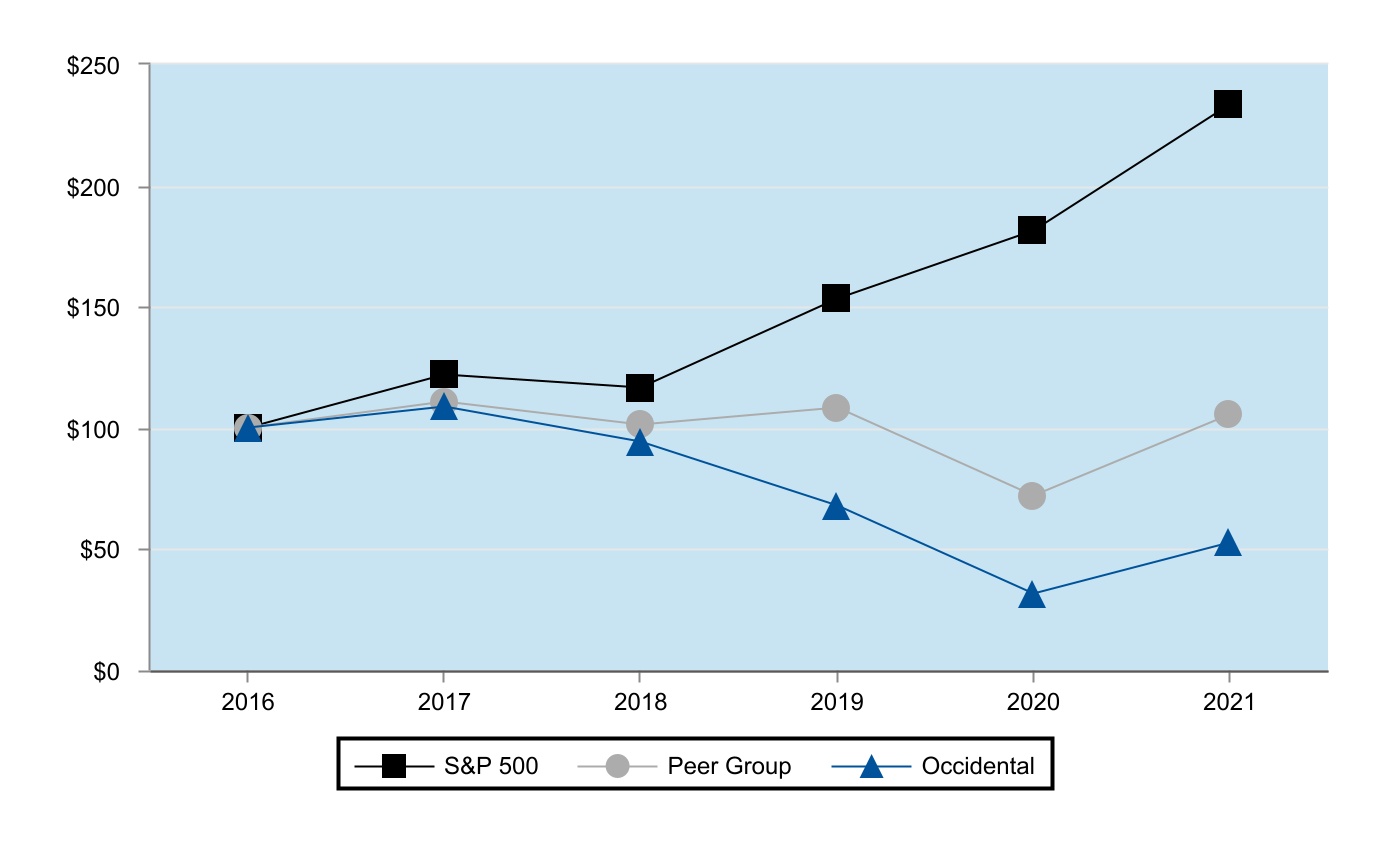
| | | | | | | | | | | | | | | | | | | | | | | | | | | | | | | | | | | |
| Fiscal Year Ended December 31, | 2016 | | 2017 | | 2018 | | 2019 | | 2020 | | 2021 |
| Occidental | $ | 100 | | | $ | 109 | | | $ | 94 | | | $ | 68 | | | $ | 31 | | | $ | 53 | |
| Peer Group | $ | 100 | | | $ | 111 | | | $ | 101 | | | $ | 108 | | | $ | 72 | | | $ | 106 | |
| S&P 500 | $ | 100 | | | $ | 122 | | | $ | 116 | | | $ | 153 | | | $ | 181 | | | $ | 233 | |
The information provided in this Performance Graph shall not be deemed “soliciting material” or “filed” with the SEC or subject to Regulation 14A or 14C under the Exchange Act, other than as provided in Item 201 to Regulation S-K under the Exchange Act, or subject to the liabilities of Section 18 of the Exchange Act and shall not be deemed incorporated by reference into any filing under the Securities Act of 1933 or the Exchange Act except to the extent Occidental specifically requests that it be treated as soliciting material or specifically incorporates it by reference.
| | | | | | | | |
| | MANAGEMENT’S DISCUSSION AND ANALYSIS |
ITEM 7. MANAGEMENT’S DISCUSSION AND ANALYSIS OF FINANCIAL CONDITION AND RESULTS OF OPERATIONS (MD&A)
The following discussion should be read together with the Consolidated Financial Statements and the Notes to Consolidated Financial Statements, which are included in this Form 10-K in Item 8 and the information set forth in Risk Factors under Part 1, Item 1A.
| | | | | | | | |
| | MANAGEMENT’S DISCUSSION AND ANALYSIS |
| | |
| CURRENT BUSINESS OUTLOOK AND STRATEGY |
GENERAL
Occidental’s operations, financial condition, cash flows and levels of expenditures are highly dependent on oil prices and, to a lesser extent, NGL and natural gas prices, the Midland-to-Gulf-Coast oil spreads and the prices it receives for its chemical products. During 2021, as compared to 2020, the average annual price per barrel ($/Bbl) of West Texas Intermediate (WTI) crude increased to $67.91 from $39.40 and the average annual Brent price per barrel increased to $70.78 from $43.21. While the worldwide economy continues to be impacted by the ongoing effects of the COVID-19 pandemic and emergence and spread of new variants of the virus, demand for oil has returned to near pre-pandemic levels. Current uncertainty of whether oil supply will be able to sustain a continued supply response, as well as geopolitical risks, have resulted in a significant increase to benchmark oil prices. In addition, current oil prices could be negatively impacted by the emergence of new COVID-19 variants, slow vaccine distribution in developing economies or the recurrence or tightening of travel restrictions and stay-at-home orders.
STRATEGY
Occidental is focused on delivering a unique shareholder value proposition with its integrated portfolio of oil and gas, chemicals and midstream and marketing assets and its commitment to implement carbon management and storage solutions and reduce GHG emissions. Occidental conducts its operations with a focus on sustainability, health, safety, and environmental and social responsibility. Occidental aims to maximize shareholder returns through a combination of:
■Enhancing capital and operational efficiency to sustain 2021 production levels and free cash flow;
■Reducing financial leverage while maintaining a robust liquidity position;
■Returning additional capital to shareholders while continuing to reduce debt and improve Occidental’s financial position; and
■Advancing technologies and business solutions to help drive a sustainable low-carbon future.
OPERATIONAL EXCELLENCE AND CAPITAL EFFICIENCY
Occidental's operational priorities for 2021 were to sustain production in-line with its 2020 fourth quarter rate by investing $2.9 billion in capital and maintaining a majority of the cost savings achieved in 2020. Occidental adhered to its capital budget and exceeded its original 2021 production guidance by 27 thousand barrels of oil equivalent per day (Mboe/d). Occidental set new operational records and efficiency benchmarks in the Permian, Rockies, Gulf of Mexico and Oman. Additionally, OxyChem recorded its highest earnings in 30 years, largely as a result of stronger realized pricing and margins across most product lines with improved demand. With the increase in commodity prices and Occidental’s focus on its cash costs and operational efficiencies, Occidental’s higher cash flow allowed it to reduce its leverage and improve its liquidity position.
DEBT AND INTEREST RATE SWAPS
Occidental used its excess cash flow generated during 2021, coupled with divestiture proceeds, to continue to strengthen its balance sheet by reducing its debt and other financial obligations. In 2021, Occidental reduced total borrowings at face value of over $6.7 billion and retired interest rate swaps with a notional value of $750 million. The 2021 balance sheet improvement efforts have significantly reduced debt maturities in the near and medium terms, which will allow Occidental more operational flexibility and the ability to pay down additional debt in the future with a more opportunistic approach. As of December 31, 2021, Occidental had debt maturities of approximately $101 million in 2022, $465 million in 2023 and $1.7 billion in 2024. In January 2022, Occidental paid off its last 2022 maturity for $101 million.
Occidental’s $2.3 billion Zero Coupon senior notes due 2036 (Zero Coupons) can be put to Occidental in October of each year, in whole or in part, for the then accreted value of the outstanding Zero Coupons. The Zero Coupons can next be put to Occidental in October 2022, which, if put in whole, would require a payment of approximately $1.1 billion at such date. Occidental currently has the intent and ability to meet this obligation, including, if necessary, using amounts available under the revolving credit facility (RCF) should the put right be exercised.
The remaining interest rate swaps with a fair value of $428 million, net of collateral, as of December 31, 2021, have mandatory termination dates in September 2022 and 2023. The interest rate swaps’ fair value, and cash required to settle them on their termination dates, will continue to fluctuate with changes in interest rates through the mandatory termination dates.
As of December 31, 2021, all of Occidental’s Brent-priced sold calls and two way natural gas collars have expired. See Note 8 - Derivatives in the Notes to Consolidated Financial Statements in Part II Item 8 of this Form 10-K for further discussion.
| | | | | | | | |
| | MANAGEMENT’S DISCUSSION AND ANALYSIS |
DEBT RATINGS
As of the date of this filing, Occidental’s long-term debt was rated BB+ by Fitch Ratings, Ba2 by Moody’s Investors Service and BB+ by Standard and Poor’s. In January, 2022, Standard and Poor’s upgraded Occidental’s credit rating to BB+. Any downgrade in credit ratings could impact Occidental's ability to access capital markets and increase its cost of capital. Occidental’s non-investment grade debt rating may require Occidental to provide financial assurance in the form of cash, letters of credit, surety bonds or other acceptable support under certain contractual arrangements.
As of the date of this filing, Occidental has provided required financial assurance through a combination of cash, letters of credit and surety bonds. Occidental has not issued any letters of credit under the RCF or other committed facilities. For additional information, see Risk Factors in Part I, Item 1A of this Form 10-K.
SUSTAINABILITY AND ENVIRONMENTAL STEWARDSHIP STRATEGY
In 2020, Occidental was the first U.S. oil and gas company to announce goals to achieve net-zero GHG emissions for its total emissions inventory including use of sold products. These goals include achieving net-zero GHG emissions (i) from its operations and energy use before 2040, with an ambition to do so before 2035, and (ii) from the use of its sold products with an ambition to do so before 2050. In 2020, Occidental also set various interim targets, including 2025 carbon and methane intensity targets, and Occidental was also the first U.S. oil and gas company to endorse the World Bank’s initiative for zero routine flaring by 2030. In 2021, Occidental made progress on these sustainability commitments and established additional interim targets toward its net-zero goals to advance a low-carbon future.
Occidental seeks to meet its sustainability and environmental goals through its development and commercialization of technologies that lower both GHG emissions from industrial processes and existing atmospheric concentrations of CO2. Occidental believes that carbon removal technologies, including DAC and CCUS, can, with incentives necessary for their development and deployment, provide essential CO2 reductions in the medium term, while the world transitions to a lower carbon intensive economy. Occidental has undertaken the following actions, among others, toward advancing its low-carbon strategy:
■Incorporated specific GHG emissions reduction targets in its RCF and receivables securitization facility, which can impact its costs related to its borrowing facilities;
■Invested in a third party to develop a zero-emission natural gas generation demonstration facility and license the underlying technology;
■Initiated a front end engineering and design study on an industrial scale DAC facility;
■Implemented multiple programs to reduce emissions and the routine flaring of gas;
■Delivered the world’s first cargo of carbon-neutral oil in January 2021;
■Formed teams to specifically advance Occidental’s environmental, social and governance goals and associated accounting, and report to executive management; and
■Provided technical advisory services to third parties regarding their CCUS projects.
In 2022, OLCV plans to invest approximately $300 million in the development and commercialization of new technologies and low-carbon business models. In addition, Occidental plans to invest approximately $83 million in emissions reduction capital projects at its existing oil and gas, chemical and other midstream operations in 2022, such as retrofitting facilities to reduce CO2, methane and other air emissions. The future costs associated with emissions reduction, carbon removal and CCUS to meet its long-term net-zero GHG goals may be substantial and execution of its plans depends on securing financing. Occidental is pursuing multiple pathways to finance these projects including:
■Project financing with long-term carbon removal or CCUS agreements;
■Identifying business opportunities with stakeholders in carbon-intensive industries; and
■Occidental self-funding with excess cash flow.
LIQUIDITY
Occidental exited 2021 with cash and cash equivalents of $2.8 billion and total borrowings at face value of $28.5 billion. Occidental undertook the following actions to improve its liquidity position beyond the improvements provided by 2021’s strong cash flows:
■Maintained its 2021 capital budget of $2.9 billion while exceeding production guidance;
■Maintained the majority of cost savings achieved in prior years;
■Completed its large-scale asset divestiture program;
■Amended and extended the RCF to June 2025 with a fully committed borrowing capacity of $4.0 billion. The amended facility is now a Secured Overnight Financing Rate (SOFR) priced, sustainability linked loan with no material change to existing covenants; and
■Amended and extended the receivables securitization facility to December 2024 with a borrowing capacity as of the date of this filing of $400 million. The amended facility is now a SOFR-priced, sustainability linked loan.
| | | | | | | | |
| | MANAGEMENT’S DISCUSSION AND ANALYSIS |
In the current commodity price environment, Occidental intends to continue strengthening its financial position while returning additional cash to shareholders through an increase in the common dividend and a reactivated share repurchase program. Occidental expects to fund its return of capital to shareholders as well as its operational and capital requirements with cash flows from operations. Occidental will continue to evaluate the economic environment, as well as the commodity price environment, and may make further adjustments to its future levels of capital expenditures and operating and corporate costs. However, lower oil and gas prices as a result of the COVID-19 pandemic or reduced demand may result in the short or long-term reduction of Occidental’s capital expenditures and production profile. Occidental believes the long-term sustainability of the increased dividend rate, even in a lower oil and gas price environment, will be enhanced by continued deleveraging and the reactivated share repurchase program.
KEY PERFORMANCE INDICATORS
Occidental seeks to meet its strategic goals by continually measuring its success against key performance indicators that drive total stockholder return. In addition to efficient capital allocation and deployment discussed below in the section titled Oil and Gas Segment - Business Strategy, Occidental believes the following are its most significant performance indicators:
SAFETY
■Injury Incidence Rate (IIR) and Days Away Restricted Transfer (DART) rate - Occidental’s combined employee and contractor IIR is determined by multiplying the total number of Occupational Safety and Health Administration (OSHA) recordable injuries and illnesses by 200,000 and dividing that result by the total number of hours worked by all employees and contractors. The DART rate is calculated in the same manner as IIR, but uses the number of incidents that resulted in days away from work, job transfer or restricted job duties instead of the number of recordable injuries or illnesses.
OPERATIONAL
■Total spend per barrel - In 2022, Occidental will continue to focus on controlling total costs from a per-barrel perspective. Total spend per barrel is the sum of capital spending, general and administrative expenses, other operating and non-operating expenses and oil and gas lease operating costs divided by global oil, NGL and natural gas sales volumes.
■Daily production - Occidental seeks to maintain 2021 production levels.
FINANCIAL
■Cash returns on capital employed (CROCE) - CROCE is calculated as (i) the cash flows from operating activities, before changes in working capital, plus distributions from WES classified as investing cash flows, divided by (ii) the average of the opening and closing balances of total equity plus total debt.
■Reduce financial leverage.
SUSTAINABILITY AND ENVIRONMENTAL
■Specific emissions reduction, emissions intensity and zero routine flaring targets to advance our goal of net-zero operational and energy use emissions before 2040, with an ambition to achieve before 2035.
■Milestones in specific carbon removal and CCUS projects that advance our net-zero total emissions inventory, including use of sold products, with an ambition to achieve before 2050.
■Water recycling targets to reduce the use of fresh water resources and the disposal of surplus produced water.
■Facilitate deployment of carbon removal, CCUS and other solutions to advance total carbon impact past 2050.
IMPACT OF THE COVID-19 PANDEMIC
Occidental continues to focus on protecting the health and safety of its employees and contractors during the COVID-19 pandemic. New workplace safety protocols and procedures were implemented by Occidental for its offices and work sites in response to help mitigate the spread of COVID-19 and any related variants. Occidental has not incurred material costs or significant disruptions to its day-to-day operations related to the COVID-19 pandemic to date; however, the extent to which the COVID-19 pandemic could adversely affect Occidental's business, results of operations and financial condition will depend on future developments, which remain uncertain.
| | | | | | | | |
| | MANAGEMENT’S DISCUSSION AND ANALYSIS |
BUSINESS STRATEGY
Occidental’s oil and gas segment focuses on long-term value creation and leadership in sustainability, health, safety and the environment. In each core operating area, Occidental’s operations benefit from scale, technical expertise, decades of high-margin inventory, environmental and safety leadership and commercial and governmental collaboration. These attributes allow Occidental to bring additional production quickly to market, extend the life of older fields at lower costs and provide low-cost returns-driven growth opportunities with advanced technology.
With the completion of the Acquisition, Occidental became one of the largest U.S. producers of liquids, which includes oil and NGL, allowing Occidental to maximize cash margins on a Bbl basis. Since the Acquisition, Occidental initially focused on its divestiture program to pay down near-term debt maturities; however, the advantages that Occidental’s portfolio provides, coupled with unmatched subsurface characterization ability and the proven ability to execute, position Occidental for full-cycle success in the years ahead. The oil and gas segment has realized synergies to deliver lower breakeven costs and generate excess free cash flow and, with the late 2021 sale of the Ghana assets, Occidental has completed its large scale asset divestiture program.
Occidental’s assets are strategically positioned to provide a future portfolio of projects that are flexible and have a mix of short-cycle and mid-cycle investment paybacks. Together with Occidental’s technical capabilities, the oil and gas segment strives to achieve low development and operating costs to maximize full-cycle value of the assets.
The oil and gas business implements Occidental’s strategy primarily by:
■Operating and developing areas where reserves are known to exist and optimizing capital intensity in core areas, primarily in the Permian Basin, DJ Basin, Gulf of Mexico, UAE, Oman and Algeria;
■Maintaining a disciplined and prudent approach to capital expenditures with a focus on high-return, short-cycle, cash-flow-generating opportunities and an emphasis on creating value and further enhancing Occidental’s existing positions;
■Focusing Occidental’s subsurface characterization and technical activities on unconventional opportunities, primarily in the Permian Basin;
■Using EOR techniques, such as CO2, water and steam floods in mature fields; and
■Focusing on cost-reduction efficiencies and innovative technologies to reduce carbon emissions.
In 2021, oil and gas capital expenditures were approximately $2.4 billion and primarily focused on Occidental’s assets in the Permian Basin, DJ Basin, Gulf of Mexico and Oman.
OIL AND GAS PRICE ENVIRONMENT
Oil and gas prices are the major variables that drive the industry’s financial performance. The following table presents the average daily WTI and Brent prices for oil and New York Mercantile Exchange (NYMEX) natural gas prices for 2021 and 2020:
| | | | | | | | | | | | | | | | | | | | |
| | 2021 | | 2020 | | % Change |
| WTI Oil ($/Bbl) | | $ | 67.91 | | | $ | 39.40 | | | 72 | % |
| Brent Oil ($/Bbl) | | $ | 70.78 | | | $ | 43.21 | | | 64 | % |
| NYMEX Natural Gas ($/Mcf) | | $ | 3.61 | | | $ | 2.11 | | | 71 | % |
The following table presents Occidental’s average realized prices for continuing operations as a percentage of WTI, Brent and NYMEX for 2021 and 2020:
| | | | | | | | | | | | | | |
| | 2021 | | 2020 |
| Worldwide oil as a percentage of average WTI | | 97 | % | | 95 | % |
| Worldwide oil as a percentage of average Brent | | 93 | % | | 86 | % |
| Worldwide NGL as a percentage of average WTI | | 44 | % | | 32 | % |
| Worldwide NGL as a percentage of average Brent | | 42 | % | | 29 | % |
| Domestic natural gas as a percentage of NYMEX | | 91 | % | | 56 | % |
/
Prices and differentials can vary significantly, even on a short-term basis, making it difficult to predict realized prices with a reliable degree of certainty.
| | | | | | | | |
| | MANAGEMENT’S DISCUSSION AND ANALYSIS |
DOMESTIC INTERESTS
BUSINESS REVIEW
Occidental conducts its domestic operations through land leases, subsurface mineral rights it owns, or a combination of both. Occidental’s domestic oil and gas leases have a primary term ranging from one to 10 years, which is extended through the end of production once it commences. Occidental has leasehold and mineral interests in 9.5 million net acres, of which approximately 52% is leased, 24% is owned subsurface mineral rights and 24% is owned land with mineral rights.
DOMESTIC ASSETS (a)
| | | | | |
| 1. Powder River Basin
2. DJ Basin
3. Permian Basin
4. Gulf of Mexico
|
(a)Map represents geographic outlines of the respective basins.
The Permian Basin
The Permian Basin extends throughout West Texas and Southeast New Mexico and is one of the largest and most active oil basins in the United States, accounting for more than 41% of total United States oil production in 2021. Overall in 2021, Occidental’s share of production in the Permian Basin was approximately 487 Mboe/d.
Occidental manages its Permian Basin operations through two business units: Permian Resources, which includes unconventional opportunities, and Permian EOR, which utilizes EOR techniques such as CO2 floods and waterfloods. Occidental has a leading position in the Permian Basin, producing approximately 9% of total oil in the basin throughout 2021. By exploiting the natural synergies between Permian Resources and Permian EOR, Occidental is able to deliver unique short- and long-term advantages, efficiencies and expertise across its Permian Basin operations.
Permian Resources unconventional oil development projects provide very short-cycle investment payback, averaging less than two years. These investments contribute cash flow, while increasing long-term value and sustainability through higher return on capital employed. Occidental’s oil and gas operations in Permian Resources include approximately 1.5 million net acres. In 2021, well design processes, technologies and logistics improvements drove increased operational efficiencies, which helped lower the overall well cost while improving recovery. Overall in 2021, Permian Resources produced from approximately 6,000 gross wells and added 222 MMboe to Occidental’s proved reserves through development and extensions of proved area.
The Permian Basin’s concentration of large conventional reservoirs, favorable CO2 flooding performance and the expansive CO2 transportation and processing infrastructure has resulted in decades of high-value enhanced oil production. With 35 active CO2 floods and over 50 years of experience, Occidental is the industry leader in Permian Basin CO2 flooding, which can increase ultimate oil recovery by 10% to 25%. Technology improvements, such as the recent trend toward vertical expansion of the CO2 flooded interval into residual oil zone targets, continue to yield more recovery from existing projects, and Permian EOR produced from approximately 14,100 gross wells in 2021.
Significant opportunities also remain to gain additional recovery by expanding Occidental’s existing CO2 projects into new portions of reservoirs that have only been water-flooded. Permian EOR has a large inventory of future CO2 projects,
| | | | | | | | |
| | MANAGEMENT’S DISCUSSION AND ANALYSIS |
which could be developed over the next 20 years or accelerated, depending on market conditions. In addition, OLCV continues making progress towards supplying anthropogenic CO2 for the purpose of CCUS in Occidental’s Permian EOR operations.
In 2021, Occidental spent approximately $1.1 billion of capital in the Permian Basin, of which approximately 93% was spent on Permian Resources assets. Also in 2021, Occidental divested of certain non-strategic assets in the Permian Resources business unit, as well as acquired additional working interests in certain assets in our Permian EOR business unit. In 2022, Occidental expects to allocate approximately $1.7 billion to $1.9 billion, or almost half of its worldwide capital budget to the Permian Basin.
Rockies and Other Domestic
Occidental was Colorado’s top oil and gas producer in 2021, with interests in approximately 600,000 net acres and net production of approximately 302 Mboe/d in 2021 in our Rockies and Other Domestic locations. Production in Colorado is derived from 2,200 operated vertical wells and 2,300 operated horizontal wells primarily focused in 400,000 net acres in the Niobrara and Codell formations. The DJ Basin provides competitive economics, low breakeven costs and free cash flow generation through Occidental’s contiguous acreage position and royalty uplift.
In the DJ Basin, horizontal drilling results in the field continue to be strong, with improved operational efficiencies in drilling and completions. In 2021, Occidental drilled 72 operated horizontal wells and completed 163 operated horizontal wells. Also, in 2021, Occidental divested of certain non-operated assets in the DJ Basin. In 2022, Occidental plans to deploy approximately $0.4 billion in total net capital spending in the Rockies and Other Domestic.
In January 2021, the COGCC adopted new regulations that impose siting requirements, or “setbacks,” on certain oil and gas drilling locations based on the distance of a proposed well pad to occupied structures. Other state agencies, including the Colorado Department of Public Health and Environment and the Colorado Air Quality Control Commission, have also updated their regulations regarding oil and gas operations. As of December 31, 2021, Occidental is fully permitted, or has submitted permit applications to applicable regulatory agencies, for all planned 2022 drilling and completions activity in the DJ Basin. As of year-end 2021, Occidental had not been denied any permits and received its first Oil & Gas Development Plan permit approval under the new COGCC regulations in the fourth quarter of 2021. Occidental has a dedicated, multidisciplinary stakeholder relations team that conducts regulatory and community outreach with respect to its permit applications and operations in Colorado. Occidental continues to have development optionality by flexing resources between the DJ Basin and other high rate-of-return projects in the Permian or Powder River Basin. Occidental’s focus for 2022 in Colorado is continuing to proactively implement Colorado’s new and updated regulatory processes and build operational inventory.
Occidental has gained efficiencies in the permitting process and will continue to look for additional opportunities to do so. As discussed above, Occidental does not anticipate significant near-term changes to our development program in the DJ Basin based on these regulations. However, if Occidental is unable to obtain new drilling permits to develop a significant portion of the company’s undeveloped acreage in the DJ Basin, the company’s DJ Basin assets may be subject to testing for impairment, and if deemed to be impaired, such impairment could be material to our financial statements.
Occidental holds approximately 5.0 million net acres in other domestic locations, which includes the Powder River Basin, North DJ Basin and Wyoming.
OFFSHORE DOMESTIC ASSETS
Gulf of Mexico
Occidental is the fourth-largest oil and gas producer in the deep-water Gulf of Mexico, operating 10 strategically located deep-water floating platforms, producing from 17 active fields while owning a working interest in 180 blocks – one of the largest portfolios in the Gulf of Mexico. Occidental further operates marine shore-bases in Galveston, Texas, and Port Fourchon, Louisiana, as well as two helicopter bases in Louisiana that are configured to support the western and eastern Gulf operations, which are located across the 600-mile platform spread as well as providing back up and redundancy to each other. A central supply chain base, with a training center, is located in Broussard, Louisiana, and the operations are supported and managed with engineering and technical staff from The Woodlands, Texas, offices.
In 2021, Occidental increased net production to 144 Mboe/d from approximately 78 gross wells, investing over $300 million in capital, primarily directed towards drilling activity in its Horn Mountain West subsea development, Lucius and Holstein facilities, using one floating drill ship and one platform rig. Occidental also progressed and accelerated key infrastructure facility projects for Horn Mountain West, Caesar-Tonga Subsea Expansion as well as initiating a major subsea-pumping project supporting the K2 Complex.
Operational excellence and efficiency was a prime initiative in 2021 for both drilling and well performance, including the implementation of several stimulations and artificial lift projects, together with optimum sequencing of platform turn-arounds, to reduce both planned and unplanned downtime for a third consecutive year. Hazard and operability studies of all 10 platforms were completed in 2021 and implementation of the resulting risk reduction projects was commenced. During 2021, all necessary regulatory permits for new wells and for existing operations were obtained timely.
| | | | | | | | |
| | MANAGEMENT’S DISCUSSION AND ANALYSIS |
The following table shows areas of continuing development in the Gulf of Mexico, along with the corresponding working interest in those areas.
| | | | | |
| Working Interest |
| Horn Mountain | 100 | % |
| Holstein | 100 | % |
| Marlin | 100 | % |
| Lucius | 64 | % |
| K2 Complex | 42 | % |
| Caesar Tonga | 34 | % |
| Constellation | 33 | % |
In 2022, Occidental expects to allocate approximately $0.5 billion in capital expenditures to continue to leverage its strategically advantaged infrastructure across the Gulf of Mexico to deliver high-margin production while seeking expansion and exploration opportunities. Occidental plans to conduct production adding activities with one floating drillship, one-to-two platform rigs with several other well service vessels. Horn Mountain West first production is scheduled for summer 2022, with Caesar-Tonga Subsea Expansion ready for first production before spring 2023. Several seismic acquisition programs are planned in 2022 to delineate and de-risk development opportunities as well as generate new opportunities that support the strategy of continued long-term production from the Gulf of Mexico.
INTERNATIONAL INTERESTS
BUSINESS REVIEW
Occidental conducts its ongoing international operations in two sub-regions: the Middle East and North Africa. Its activities include oil, NGL and natural gas production through direct working-interests, production sharing agreements (PSA) and production sharing contracts (PSC). Under the PSCs, Occidental records a share of production and reserves to recover certain development and production costs and an additional share for profit. These contracts do not transfer any right of ownership to Occidental and reserves reported from these arrangements are based on Occidental’s economic interest as defined in the contracts. Occidental’s share of production and reserves from these contracts decreases when product prices rise and increases when prices decline. Overall, Occidental’s net economic benefit from these contracts is greater when product prices are higher. Approximately $0.5 billion of Occidental’s worldwide capital budget is expected to be allocated to its international operations in 2022.
MIDDLE EAST / NORTH AFRICA ASSETS
| | | | | |
| 1.Algeria
2.Oman
3.Qatar
4.UAE |
| | | | | | | | |
| | MANAGEMENT’S DISCUSSION AND ANALYSIS |
Algeria
Operations in Algeria involve production and development activities in 18 fields within Blocks 404A and 208, which are located in the Berkine Basin in Algeria’s Sahara Desert and are governed by an agreement between Occidental, Sonatrach and other partners. Occidental is responsible for 24.5% of the development and production costs. The El Merk Central Processing Facility (CPF) in Block 208 processes produced oil and NGL, while the Hassi Berkine South and Ourhoud CPFs in Block 404A processes produced oil. The rights to produce from the Block 404 fields expire between December 2022 and 2036 and the rights to produce from the Block 208 fields expire in 2032. In 2021, net production in Algeria was 43 Mbbl/d. Also, in 2021, Occidental signed a Heads of Agreement with Sonatrach and other partners to discuss a new 25-year PSA that would align the expiration date for all 18 fields. Discussions regarding the potential new PSA are ongoing. In the first quarter of 2022, the joint venture plans to commence a drilling program of four wells.
Oman
In Oman, Occidental is the operator of Block 9 with a 50% working interest, Block 27 with a 65% working interest, Block 53 (Mukhaizna Field) with a 47% working interest and Block 62 with a 100% working interest. Occidental additionally has interests in Blocks 30, 51, 65 and 72. Occidental holds 6.0 million gross acres and has 10,000 potential well inventory locations. In 2021, Occidentals share of production was 74 Mboe/d.
The Block 9 contract expires in 2030 and the Block 27 contract expires in 2035. Occidental’s share of production for Blocks 9 and 27 was 25 Mboe/d and 6 Mboe/d, respectively, in 2021. Occidental has produced over 718 million gross barrels from Block 9 since the beginning of its operation through successful exploration, continuous drilling improvements and EOR projects. The Mukhaizna Field contract expires in 2035 and is a major pattern steam flood project for EOR that utilizes some of the largest mechanical vapor compressors ever built. Since assuming operations in the Mukhaizna Field in 2005, Occidental has drilled over 3,560 new wells and has increased gross production by over 15-fold. Occidental’s share of production for Mukhaizna Field was 30 Mboe/d in 2021. The Block 62 contract expires in 2028 and Occidental delivered production of 12 Mboe/d in 2021. Block 65 is under the exploration phase with a 73% working interest and Occidental’s share of production in 2021 was one Mboe/d based on three oil discoveries. In 2021, Occidental invested capital of $363 million to drill 111 wells and execute facilities projects to support development and EOR activities.
In 2022, Occidental plans to invest over $0.3 billion of capital to drill 128 wells and execute required facilities projects. Occidental will continue to enhance production by adding extended and dual laterals, stimulating wells with OXY JETTING, an in-house developed stimulation technique, and expanding thermal conformance. Occidental will continue to execute projects in Oman targeting emissions reductions. Based on the successful exploration results in Block 65 for 2021, the block’s Declaration of Commerciality is planned for 2022.
Qatar
In Qatar, Occidental partners in the Dolphin Energy Project, an investment that is comprised of two separate economic interests. Occidental has a 24.5% interest in the upstream operations (Dolphin) to develop and produce NGL, natural gas and condensate from Qatar’s North Field through mid-2032. Occidental also has a 24.5% interest in DEL, which operates a pipeline and is discussed further in the midstream and marketing segment section in this Form 10-K under Pipeline. In 2021, Occidental’s net share of production from Dolphin was 40 Mboe/d.
UAE
In 2011, Occidental acquired a 40% participating interest in the Shah gas field (Al Hosn Gas), joining with the Abu Dhabi National Oil Company, which expires in 2041. In 2021, Occidental’s share of production from Al Hosn Gas was 234 million cubic feet per day (MMcf/d) of natural gas and 37 Mbbl/d of NGL and condensate. Al Hosn Gas includes gas processing facilities which are discussed further in the midstream and marketing segment section in this Form 10-K under Gas Processing, Gathering and CO2.
In 2019 and 2020, Occidental acquired 9-year exploration concessions and, subject to a declaration of commerciality, 35-year production concessions for Onshore Block 3 and Block 5, which cover an area approximately 1.5 million acres and 1.0 million acres, respectively, and are adjacent to Al Hosn Gas. In 2021, Occidental announced a multi-zone oil and gas discovery in Block 3.
In 2022, Occidental plans to continue work on an expansion project that will increase the production capacity of the Al Hosn Gas processing facilities from the current 1.28 Bcf/d to 1.45 Bcf/d in 2023 and continue further exploration activities in Onshore Block 3 and Block 5.
Ghana - Discontinued Operations
In October 2021, Occidental completed the sale of its Ghana assets. Prior to the divestiture, Ghana operations included production and development activities located offshore in the West Cape Three Point Block and the Deepwater Tano Block. Occidental’s net share of production in 2021 was 16 Mboe/d.
| | | | | | | | |
| | MANAGEMENT’S DISCUSSION AND ANALYSIS |
PROVED RESERVES
Proved oil, NGL and natural gas reserves were estimated using the unweighted arithmetic average of the first-day-of-the-month price for each month within the year, unless prices were defined by contractual arrangements. Oil, NGL and natural gas prices used for this purpose were based on posted benchmark prices and adjusted for price differentials including gravity, quality and transportation costs.
The following table shows the 2021, 2020 and 2019 calculated first-day-of-the-month average prices for both WTI and Brent oil prices, as well as the Henry Hub gas prices measured in million British thermal units (MMbtu):
| | | | | | | | | | | | | | | | | | | | |
| | 2021 | | 2020 | | 2019 |
| WTI Oil ($/Bbl) | | $ | 66.56 | | | $ | 39.57 | | | $ | 55.69 | |
| Brent Oil ($/Bbl) | | $ | 69.24 | | | $ | 43.41 | | | $ | 63.03 | |
| Henry Hub Natural Gas ($/MMbtu) | | $ | 3.60 | | | $ | 1.98 | | | $ | 2.58 | |
Mt. Belvieu NGL ($/Bbl) (a) | | $ | 44.22 | | | $ | 18.74 | | | N/A |
(a)Mt. Belvieu pricing was added as an NGL benchmark beginning in 2020. Prior to 2020, WTI oil was used as a benchmark for NGL.
Occidental had proved reserves from continuing operations at year-end 2021 of 3,512 MMboe, compared to the year-end 2020 amount of 2,911 MMboe. Proved developed reserves represented approximately 75% and 78% of Occidental’s total proved reserves at year-end 2021 and 2020, respectively. The following table shows the breakout of Occidental’s proved reserves from continuing operations by commodity as a percentage of total proved reserves:
| | | | | | | | | | | | | | |
| | 2021 | | 2020 |
| Oil | | 50 | % | | 51 | % |
| NGL | | 22 | % | | 20 | % |
| Natural gas | | 28 | % | | 29 | % |
Occidental does not have any reserves from non-traditional sources. For further information regarding Occidental’s proved reserves, see the Supplemental Oil and Gas Information section in Item 8 of this Form 10-K.
CHANGES IN PROVED RESERVES
Occidental’s total proved reserves from continuing operations increased 601 MMboe in 2021, which was primarily driven by price and other revisions of 829 MMboe and extensions and discoveries of 145 MMboe. These increases were partially offset by production of 426 MMboe and asset divestitures of 11 MMboe. Changes in reserves were as follows:
| | | | | | | | |
| MMboe | | 2021 |
| Revisions of previous estimates | | 829 | |
| Improved recovery | | 20 | |
| Extensions and discoveries | | 145 | |
| Purchases | | 44 | |
| Sales | | (11) | |
| Production | | (426) | |
| Total | | 601 | |
Occidental’s ability to add reserves, other than through purchases, depends on the success of infill development, extension, discovery and improved recovery projects, each of which depends on reservoir characteristics, technology improvements and oil and natural gas prices, as well as capital and operating costs. Many of these factors are outside management’s control and may negatively or positively affect Occidental’s reserves.
Revisions of Previous Estimates
Revisions can include upward or downward changes to previous proved reserve estimates for existing fields due to the evaluation or interpretation of geologic, production decline or operating performance data. In addition, product price changes affect proved reserves recorded by Occidental. For example, lower prices may decrease the economically recoverable reserves, particularly for domestic properties, because the reduced margin limits the expected life of the operations. Offsetting this effect, lower prices increase Occidental’s share of proved reserves under PSCs because more oil is required to recover costs. Conversely, when prices rise, Occidental’s share of proved reserves decreases for PSCs and economically
| | | | | | | | |
| | MANAGEMENT’S DISCUSSION AND ANALYSIS |
recoverable reserves may increase for other operations. Reserve estimation rules require that estimated ultimate recoveries be much more likely to increase or remain constant than to decrease, as changes are made due to increased availability of technical data.
In 2021, Occidental’s revisions of previous estimates of proved reserves were positive 829 MMboe, of which approximately 421 MMboe were positive price revisions. The positive price revisions were primarily associated with the Permian Basin (380 MMboe) and the DJ Basin (51 MMboe), which were partially offset by negative price revisions of 35 MMboe on international PSCs.
An additional 208 MMboe of positive revisions were related to additions associated with infill development projects, primarily in the Permian Basin (103 MMboe) and the DJ Basin (90 MMboe).
Further positive revisions of 101 MMboe were associated with updates based on reservoir performance.
The remaining revisions were associated with various other cost related revisions (57 MMboe) and management changes in development plans primarily due to higher average commodity prices compared to the prior year (42 MMboe).
Improved Recovery
In 2021, Occidental added proved reserves of 20 MMboe related to improved recovery primarily due to secondary and tertiary projects, mainly in certain international assets which accounted for approximately two-thirds of the reserve additions. These properties comprise conventional projects, which are characterized by the deployment of EOR development methods, largely employing application of CO2 flood, waterflood or steam flood. These types of conventional EOR development methods can be applied through existing wells, though additional drilling is frequently required to fully optimize the development configuration. Waterflooding is the technique of injecting water into the formation to displace the oil to the offsetting oil production wells. The use of either CO2 or steam flooding depends on the geology of the formation, the evaluation of engineering data, availability and cost of either CO2 or steam and other economic factors. Both techniques work similarly to lower viscosity causing the oil to move more easily to the producing wells.
Extensions and Discoveries
Occidental also added proved reserves from extensions and discoveries, which are dependent on successful exploration and exploitation programs. In 2021, extensions and discoveries added 145 MMboe primarily related to the recognition of proved reserves in the Permian Basin (120 MMboe) and Gulf of Mexico (10 MMboe).
Purchases of Proved Reserves
In 2021, Occidental purchased proved reserves of 44 MMboe primarily consisting of proved reserves in the Permian EOR.
Sales of Proved Reserves
In 2021, Occidental sold 11 MMboe in proved reserves, primarily related to the divestitures of certain non-strategic assets in the Permian Basin.
Proved Undeveloped Reserves
Occidental had PUD reserves at year-end 2021 of 865 MMboe, compared to the year-end 2020 amount of 645 MMboe.
Changes in PUD reserves were as follows:
| | | | | | | | |
| MMboe | | 2021 |
| Revisions of previous estimates | | 280 | |
| Improved recovery | | 10 | |
| Extensions and discoveries | | 60 | |
| Purchases | | 6 | |
| Sales | | — | |
| Transfer to proved developed reserves | | (136) | |
| Total | | 220 | |
Revisions of previous estimates were a positive 280 MMboe. Approximately 203 MMboe of the positive revisions were related to additions associated with infill development projects, primarily in the Permian Basin (99 MMboe) and the DJ Basin (90 MMboe). Additionally, the revisions included positive price revisions of 50 MMboe. The positive price revisions were primarily associated with the Permian Basin (48 MMboe) and the DJ Basin (8 MMboe). Further, 38 MMboe of positive revisions were related to management changes in development plans. The remaining revisions were associated with various updates based on reservoir performance.
Extensions and discoveries added 60 MMboe primarily related to the recognition of proved reserves in the Permian Basin (45 MMboe) and Gulf of Mexico (10 MMboe). Total improved recovery additions of 10 MMboe were primarily the result
| | | | | | | | |
| | MANAGEMENT’S DISCUSSION AND ANALYSIS |
of secondary and tertiary projects in international assets (9 MMboe). The 2021 additions to PUD reserves were offset by transfers to proved developed reserves. Transfers to proved developed reserves were a total of 136 MMboe. The transfers were primarily associated with the DJ Basin (70 MMboe), the Permian Basin (41 MMboe), and Gulf of Mexico (18 MMboe).
PUD reserves are supported by a five-year detailed field-level development plan, which includes the timing, location and capital commitment of the wells to be drilled. Only PUD reserves which are reasonably certain to be drilled within five years of booking and are supported by a final investment decision to drill them are included in the development plan. A portion of the PUD reserves associated with international operations are expected to be developed beyond the five years and are tied to approved long-term development projects.
In 2021, Occidental incurred approximately $0.6 billion to convert PUD reserves to proved developed reserves, and in 2021 Occidental converted approximately 15% of its PUD reserves to proved developed, when adjusted for revisions and sales. As of December 31, 2021, Occidental had 865 MMboe of PUD reserves of which 60% were associated with domestic onshore, 8% with Gulf of Mexico and 32% with international assets. Occidental’s most active development areas are located in the Permian Basin, which represented 45% of the PUD reserves as of December 31, 2021. Almost half of Occidental’s 2022 capital program of $3.9 billion to $4.3 billion is allocated to the development program in the Permian Basin. Overall, Occidental plans to spend approximately $3.0 billion over the next five years to develop its PUD reserves in the Permian Basin.
As of December 31, 2021, Occidental had 192 MMboe of pre-2017 PUD reserves that remained undeveloped. These PUD reserves relate to approved long-term development plans, 187 MMboe of which are associated with international development projects with physical limitations in existing gas processing capacity. Occidental remains committed to these projects and continues to actively progress the development of these volumes. In addition to the above, Occidental has 112 MMboe of PUD reserves that are scheduled to be developed more than five years from their initial date of booking. These PUD reserves are primarily related to approved long-term development plans with physical limitations in existing gas processing capacity, 63 MMboe of which are associated with other Permian EOR projects and 38 MMboe associated with international development projects.
RESERVES EVALUATION AND REVIEW PROCESS
Occidental’s estimates of proved reserves and associated future net cash flows as of December 31, 2021, were made by Occidental’s technical personnel and are the responsibility of management. The estimation of proved reserves is based on the requirement of reasonable certainty of economic producibility and funding commitments by Occidental to develop the reserves. This process involves reservoir engineers, geoscientists, planning engineers and financial analysts. As part of the proved reserves estimation process, all reserve volumes are estimated by a forecast of production rates, operating costs and capital expenditures. Price differentials between benchmark prices (the unweighted arithmetic average of the first-day-of-the-month price for each month within the year) and realized prices and specifics of each operating agreement are then used to estimate the net reserves. Production rate forecasts are derived by a number of methods, including estimates from decline curve analysis, type curve analysis, material balance calculations that take into account the volumes of substances replacing the volumes produced and associated reservoir pressure changes, seismic analysis and computer simulation of the reservoir performance. These reliable field-tested technologies have demonstrated reasonably certain results with consistency and repeatability in the formation being evaluated or in an analogous formation. Operating and capital costs are forecast using the current cost environment applied to expectations of future operating and development activities.
Net proved developed reserves are those volumes that are expected to be recovered through existing wells with existing equipment and operating methods for which the incremental cost of any additional required investment is relatively minor.
Net PUD reserves are those volumes that are expected to be recovered from new wells on undrilled acreage, or from existing wells where a relatively major expenditure is required for recompletion. PUD reserves are supported by a five-year, detailed, field-level development plan, which includes the timing, location and capital commitment of the wells to be drilled. The development plan is reviewed and approved annually by senior management and technical personnel. Annually, a detailed review is performed by Occidental’s Worldwide Reserves Group and its technical personnel on a lease-by-lease basis to assess whether PUD reserves are being converted on a timely basis within five years from the initial disclosure date. Any leases not showing timely transfers from PUD reserves to proved developed reserves are reviewed by senior management to determine if the remaining reserves will be developed in a timely manner and have sufficient capital committed in the development plan. Only PUD reserves that are reasonably certain to be drilled within five years of booking and are supported by a final investment decision to drill them are included in the development plan. A portion of the PUD reserves associated with international operations are expected to be developed beyond the five years and are tied to approved long-term development plans.
The current Senior Vice President, Reserves for Oxy Oil and Gas is responsible for overseeing the preparation of reserve estimates, in compliance with SEC rules and regulations, including the internal audit and review of Occidental’s oil and gas reserves data. He has over 40 years of experience in the upstream sector of the exploration and production business and has held various assignments in North America, Asia and Europe. He is a three-time past Chair of the Society of Petroleum Engineers Oil and Gas Reserves Committee. He is an American Association of Petroleum Geologists (AAPG) Certified Petroleum Geologist and currently serves on the AAPG Committee on Resource Evaluation. He is a member of the Society of Petroleum Evaluation Engineers, the Colorado School of Mines Potential Gas Committee and the United Nations
| | | | | | | | |
| | MANAGEMENT’S DISCUSSION AND ANALYSIS |
Economic Commission for Europe Expert Group on Resource Management. He has Bachelor of Science and Master of Science degrees in geology from Emory University in Atlanta.
Occidental has a Corporate Reserves Review Committee (Reserves Committee), consisting of senior corporate officers, to review and approve Occidental’s oil and gas reserves. The Reserves Committee reports to the Audit Committee of Occidental’s Board of Directors during the year. Since 2003, Occidental has retained Ryder Scott Company, L.P. (Ryder Scott), independent petroleum engineering consultants, to review its annual oil and gas reserve estimation processes. For additional reserves information, see Supplemental Oil and Gas Information under Item 8 of this Form 10-K. In 2021, Ryder Scott conducted a process review of the methods and analytical procedures utilized by Occidental’s engineering and geological staff for estimating the proved reserves volumes, preparing the economic evaluations and determining the reserves classifications as of December 31, 2021, in accordance with SEC regulatory standards. Ryder Scott reviewed the specific application of such methods and procedures for selected oil and gas properties considered to be a valid representation of Occidental’s 2021 year-end total proved reserves portfolio. In 2021, Ryder Scott reviewed approximately 36% of Occidental’s proved oil and gas reserves. Since being engaged in 2003, Ryder Scott has reviewed the specific application of Occidental’s reserve estimation methods and procedures for approximately 91% of Occidental’s existing proved oil and gas reserves.
Management retained Ryder Scott to provide objective third-party input on its methods and procedures and to gather industry information applicable to Occidental’s reserve estimation and reporting process. Ryder Scott has not been engaged to render an opinion as to the reasonableness of reserves quantities reported by Occidental. Occidental has filed Ryder Scott’s independent report as an exhibit to this Form 10-K.
Based on its reviews, including the data, technical processes and interpretations presented by Occidental, Ryder Scott has concluded that the overall procedures and methodologies Occidental utilized in estimating the proved reserves volumes, preparing the economic evaluations and determining the reserves classifications for the reviewed properties are appropriate for the purpose thereof and comply with current SEC regulations.
INDUSTRY OUTLOOK
The oil and gas exploration and production industry is highly competitive, is subject to significant volatility due to various market conditions and operations are highly dependent on oil prices and, to a lesser extent, NGL and natural gas prices. Oil prices increased significantly in 2021. During 2021, as compared to 2020, the average annual $/Bbl of WTI crude increased to $67.91 from $39.40 and the average annual Brent price per barrel increased to $70.78 from $43.21.
Oil prices will continue to be affected by: (i) global supply and demand, which are generally a function of global economic conditions, inventory levels, production or supply chain disruptions, technological advances, regional market conditions and the actions of OPEC, other significant producers and governments; (ii) transportation capacity, infrastructure constraints, and costs in producing areas; (iii) currency exchange rates and inflation rates; and (iv) the effect of changes in these variables on market perceptions.
NGL prices are related to the supply and demand for the components of products making up these liquids. Some of them more typically correlate to the price of oil while others are affected by natural gas prices as well as the demand for certain chemical products for which they are used as feedstock. In addition, infrastructure constraints magnify the pricing volatility from region to region.
Domestic natural gas prices and local differentials are strongly affected by local supply and demand fundamentals, as well as government regulations, global LNG demand and availability of transportation capacity from producing areas.
We expect that oil prices in the near-term will continue to be influenced by the duration and severity of the COVID-19 pandemic and its resulting impact on oil and gas supply and demand.
These and other factors make it difficult to predict the future direction of oil, NGL and domestic gas prices reliably. For purposes of the current capital plan, Occidental will continue to focus on allocating capital to its highest-return assets with the flexibility to adjust based on fluctuations in commodity prices. International gas prices are generally fixed under long-term contracts. Occidental continues to adjust capital expenditures in line with current economic conditions with the goal of keeping returns well above its cost of capital.
The timing, process and ultimate cost to transition to a lower carbon intensive economy remains largely unknown; various industry forecasts indicate a growing demand for hydrocarbons for the remainder of the current decade. Occidental believes its operational flexibility regarding its mix of short-cycle and mid-cycle projects and its knowledge and experience in CO2 separation, transportation, use, recycling and storage means that its oil and gas segment is well positioned to support Occidental’s transition to net zero as well as create opportunities in a low-carbon future.
| | | | | | | | |
| | MANAGEMENT’S DISCUSSION AND ANALYSIS |
BUSINESS STRATEGY
OxyChem concentrates on the chlorovinyls chain, beginning with the co-production of caustic soda and chlorine. Caustic soda and chlorine are marketed to external customers. In addition, chlorine, together with ethylene, is converted through a series of intermediate products into PVC. OxyChem seeks to be a low-cost producer in order to generate cash flow in excess of its normal capital expenditure requirements and achieve above-cost-of-capital returns. OxyChem’s focus on chlorovinyls allows it to maximize the benefits of integration and take advantage of economies of scale. Capital is employed to sustain production capacity and to focus on projects and developments designed to improve the competitiveness of segment assets. Acquisitions and plant development opportunities may be pursued when they are expected to enhance the existing core chlor-alkali and PVC businesses or take advantage of other specific opportunities. In 2021, capital expenditures for OxyChem totaled $308 million.
BUSINESS ENVIRONMENT
In 2021, the United States economic growth, estimated to be 5.6%, was significantly higher than the 3.4% contraction experienced in 2020, which resulted in higher demand for most products including caustic soda and PVC. Pricing for PVC continued to remain strong in 2021 due to increased domestic demand and record high pricing in global markets. Caustic soda prices were significantly higher in 2021, partially offset by higher energy costs.
BUSINESS REVIEW
BASIC CHEMICALS
The U.S. economic growth resulted in higher domestic demand as chlor-alkali operating rates increased compared to 2020. Liquid caustic soda and chlorine prices/margins were higher in 2021 due to strong demand in most market segments, which was partially offset by higher energy prices. Increases in prices/margins for caustic, chlorine and chlorine derivatives in 2021 versus 2020 was driven by strong demand, weather events and other supply disruptions.
VINYLS
Strong demand from the second half of 2020 continued into 2021, resulting in an 11% increase in domestic PVC demand. Housing starts, construction projects and low mortgage rates were the main catalyst driving the growth. During 2021, PVC producers were confronted with extended production outages, weather events and supply chain interruptions while PVC converters also experienced challenges due to shortages of labor, parts and raw materials. As with 2020, higher U.S. demand limited PVC availability for export markets. 2021 PVC export volume was down 32% year over year. PVC exports represented 19% of total North American production in 2021 compared to 28% in 2020.
INDUSTRY OUTLOOK
Industry performance will depend on the health of the global economy and recovery from the COVID-19 pandemic. The housing, construction and automotive markets are expected to remain strong throughout 2022. Product margins will depend on market supply and demand balances, feedstock and energy prices, supply chain interruptions, labor constraints and rising inflation rates. Further recovery in the petroleum industry should strengthen the demand/margins for some of Occidental’s products that are consumed by industry participants. U.S. commodity export markets could be impacted by the relative strength of the U.S. dollar.
BASIC CHEMICALS
Demand for basic chemicals is expected to further improve in 2022 over 2021 levels. Improvement in most market segments is expected with the anticipated improvement in the overall economy and recovering supply chains. Demand for chlorine and derivatives will improve with continued growth in the housing, general construction and automotive markets. Demand for alkali products, particularly caustic soda, will improve with growth in the pulp and paper, industrial and alumina markets. Chlor-alkali operating rates should improve moderately with higher demand and continued competitive energy and raw material pricing as compared to global feedstock costs.
VINYLS
Domestic PVC demand is expected to remain strong with further year-over-year growth in 2022. Residential construction spending and expected new infrastructure projects are forecasted to drive domestic growth in 2022. New domestic PVC capacity is expected to fully enter the market in 2022 but is not expected to have a material impact on PVC production rates due to domestic and export growth expectations.
| | | | | | | | |
| | MANAGEMENT’S DISCUSSION AND ANALYSIS |
| | |
| MIDSTREAM AND MARKETING SEGMENT |
BUSINESS STRATEGY
The midstream and marketing segment strives to maximize value by optimizing the use of its gathering, processing, transportation, storage and terminal commitments and by providing the oil and gas segment access to domestic and international markets. To generate returns, the segment evaluates opportunities across the value chain and uses its assets to provide services to Occidental’s subsidiaries, as well as third parties. The midstream and marketing segment operates or contracts for services on gathering systems, gas plants, co-generation facilities and storage facilities and invests in entities that conduct similar activities.
This segment also seeks to minimize the costs of gas and power used in Occidental’s various businesses. Capital is employed to sustain or expand assets to improve the competitiveness of Occidental’s businesses. In 2021, capital expenditures related to the midstream and marketing segment totaled $106 million.
Also included in the midstream and marketing segment is OLCV. OLCV seeks to leverage Occidental’s carbon management expertise through the development of CCUS projects, and invests in innovative low-carbon technologies that are expected to reduce our carbon footprint and enable others to do the same.
BUSINESS ENVIRONMENT
Midstream and marketing segment earnings are affected by the performance of its various businesses, including its marketing, gathering and transportation, gas processing and power-generation assets. The marketing business aggregates, markets and stores Occidental and third-party volumes. Marketing performance is affected primarily by commodity price changes and margins in oil and gas transportation and storage programs. The marketing business results can experience significant volatility depending on commodity prices and the Midland-to-Gulf-Coast oil spreads. In 2021, Permian to Gulf Coast transportation capacity increased as new third-party pipelines were completed. This, along with reduction in Permian Basin production, reduced the Midland-to-Gulf-Coast oil spreads. The Midland-to-Gulf-Coast oil spreads have decreased from an average of $1.43 per barrel in 2020 to $0.48 per barrel for the year ended December 31, 2021. A $0.25 change in the Midland-to-Gulf-Coast oil spreads impacts total year operating cash flows by approximately $65 million. Gas gathering, processing and transportation results are affected by fluctuations in commodity prices and the volumes that are processed and transported through the segment’s plants, as well as the margins obtained on related services from investments in which Occidental has an equity interest. The 2021 increases in NGL prices and sulfur prices positively impacted the gas processing business.
BUSINESS REVIEW
MARKETING
The marketing group markets substantially all of Occidental’s oil, NGL and natural gas production and optimizes its transportation and storage capacity. Occidental’s third-party marketing activities focus on purchasing oil, NGL and gas for resale from parties whose oil and gas supply is located near its transportation and storage assets. These purchases allow Occidental to aggregate volumes to better utilize and optimize its assets. In 2021, compared to the prior year, marketing results were favorable due to the rising crude oil price environment and its impact on export sales.
DELIVERY AND TRANSPORTATION COMMITMENTS
Occidental has made long-term commitments to certain refineries and other buyers to deliver oil, NGL and natural gas. The total amount contracted to be delivered is approximately 92 MMbbl of oil through 2025, 731 MMbbl of NGL through 2029 and 764 Bcf of gas through 2029. The price for these deliveries is set at the time of delivery of the product.
Occidental has pipeline take-or-pay capacity of approximately 800 thousand barrels per day (Mbbl/d) to the Gulf Coast, leased storage capacity of approximately 10 MMbbl and capacity at the Ingleside Crude terminal of approximately 525 Mbbl/d.
PIPELINE
Occidental’s pipeline business mainly consists of its 24.5% ownership interest in DEL. DEL owns and operates a 230-mile-long, 48-inch-diameter natural gas pipeline (Dolphin Pipeline), which transports dry natural gas from Qatar to the UAE and Oman. The Dolphin Pipeline has capacity to transport up to 3.2 Bcf/d and currently transports approximately 2.0 Bcf/d and up to 2.2 Bcf/d in the summer months.
GAS PROCESSING, GATHERING AND CO2
Occidental processes its and third-party domestic wet gas to extract NGL and other gas byproducts, including CO2 and delivers dry gas to pipelines. Margins primarily result from the difference between inlet costs of wet gas and market prices for NGL.
As of December 31, 2021, Occidental owned all of the 2.2% non-voting general partner interest and 49.7% of the limited partner units in WES. On a combined basis, with its 2% non-voting limited partner interest in Western Midstream Operating, LP (WES Operating), Occidental's total effective economic interest in WES and its subsidiaries was 51.8%. See Note 1 - Summary of Significant Accounting Policies in the Notes to Consolidated Financial Statements in Part II Item 8 of this Form
| | | | | | | | |
| | MANAGEMENT’S DISCUSSION AND ANALYSIS |
10-K for more information regarding Occidental’s equity method investment in WES. WES owns gathering systems, plants and pipelines and earns revenue from fee-based and service-based contracts with Occidental and third parties.
Occidental’s 40% participating interest in Al Hosn Gas also includes sour gas processing facilities that are designed to process 1.28 Bcf/d of natural gas and separate it into salable gas, condensate, NGL and sulfur. In 2021, the project produced 640 MMcf/d of natural gas, 100 Mbbl/d of NGL and condensate, and 11,700 tons/d of sulfur, of which Occidental’s net share was 256 MMcf/d of natural gas, 40 Mbbl/d of NGL and condensate and 4,700 tons/d of sulfur.
In 2021, compared to the prior year, gas processing, gathering and CO2 results increased primarily due to higher sulfur and NGL prices.
POWER GENERATION FACILITIES
Earnings from power and steam generation facilities are derived from sales to affiliates and third parties.
LOW-CARBON VENTURES
OLCV was formed to execute on Occidental’s vision to reduce global emissions and provide a more sustainable future through the development of low-carbon energy and products. OLCV capitalizes on Occidental’s extensive experience in utilizing CO2 in its development of CCUS projects and providing services to third parties to facilitate the implementation of their CCUS projects. Moreover, OLCV is fostering new technologies, including DAC and low-carbon power sources, and business models with the potential to position Occidental as a leader in the production of low-carbon oil and products.
Occidental has developed standards and protocols recognized by the EPA for monitoring, reporting and verifying the amount, safety and permanence of CO2 stored through secure geologic sequestration. Occidental holds the nation’s first two EPA-approved monitoring, reporting and verification (MRV) plans for geologic sequestration through EOR production and obtained a third MRV plan in 2021.
OLCV is currently conducting front-end engineering design work and feasibility studies on a number of projects to capture and sequester CO2, either from the atmosphere or from industrial point sources. In 2022, OLCV plans to invest approximately $300 million to pursue various projects.
The profitability of sequestration projects is dependent upon the costs of developing, building and operating sequestration infrastructure, demand for sequestration services from emitters and the availability of certain tax attributes and credits generated from the capture and storage of CO2.
INDUSTRY OUTLOOK
Midstream and marketing segment results can experience volatility depending on the Midland-to-Gulf-Coast oil spreads, commodity price changes and demand impacting export sales. To a lesser extent, declines in commodity prices, including NGL and sulfur prices, reduce the results for the gas processing business.
At the end of 2021, the U.S. experienced economy-wide cost increases, which could increase the cost of sequestration projects. Occidental saw increased interest from third parties in providing sequestration services during the year. Additionally, grants, credits and other tax-advantaged low-carbon attributes continue to be actively discussed at both state and federal levels. These trends are expected to continue, which Occidental believes will enhance the economics of sequestration projects.
| | | | | | | | |
| | MANAGEMENT’S DISCUSSION AND ANALYSIS |
| | |
| SEGMENT RESULTS OF OPERATIONS AND ITEMS AFFECTING COMPARABILITY |
SEGMENT RESULTS OF OPERATIONS
Segment earnings exclude income taxes, interest income, interest expense, environmental remediation expenses, unallocated corporate expenses and discontinued operations, but include gains and losses from divestitures of segment assets and income from the segments’ equity investments. Seasonality is not a primary driver of changes in Occidental’s consolidated quarterly earnings during the year.
The following table sets forth the sales and earnings of each operating segment and corporate items for the years ended December 31:
| | | | | | | | | | | | | | | | | | | | |
| millions, except per share amounts | | 2021 | | 2020 | | 2019 |
NET SALES (a) | | | | | | |
| Oil and gas | | $ | 18,941 | | | $ | 13,066 | | | $ | 13,941 | |
Chemical | | 5,246 | | | 3,733 | | | 4,102 | |
| Midstream and marketing | | 2,863 | | | 1,768 | | | 4,132 | |
| Eliminations | | (1,094) | | | (758) | | | (1,264) | |
| Total | | $ | 25,956 | | | $ | 17,809 | | | $ | 20,911 | |
| SEGMENT RESULTS AND EARNINGS | | | | | | |
Domestic | | $ | 2,900 | | | $ | (8,758) | | | $ | 838 | |
International | | 1,497 | | | (742) | | | 1,851 | |
Exploration | | (252) | | | (132) | | | (169) | |
| Oil and gas | | 4,145 | | | (9,632) | | | 2,520 | |
Chemical | | 1,544 | | | 664 | | | 799 | |
| Midstream and marketing | | 257 | | | (4,175) | | | 241 | |
| Total | | $ | 5,946 | | | $ | (13,143) | | | $ | 3,560 | |
Unallocated corporate items | | | | | | |
Interest expense, net | | (1,614) | | | (1,424) | | | (1,002) | |
| Income tax benefit (expense) | | (915) | | | 2,172 | | | (861) | |
| Other | | (627) | | | (1,138) | | | (2,204) | |
Income (loss) from continuing operations | | $ | 2,790 | | | $ | (13,533) | | | $ | (507) | |
Discontinued operations, net | | (468) | | | (1,298) | | | (15) | |
Net income (loss) | | 2,322 | | | (14,831) | | | (522) | |
| Less: Net income attributable to noncontrolling interests | | — | | | — | | | (145) | |
Less: Preferred stock dividends | | (800) | | | (844) | | | (318) | |
Net income (loss) attributable to common stockholders | | $ | 1,522 | | | $ | (15,675) | | | $ | (985) | |
| Net income (loss) attributable to common stockholders—basic | | $ | 1.62 | | | $ | (17.06) | | | $ | (1.22) | |
| Net income (loss) attributable to common stockholders—diluted | | $ | 1.58 | | | $ | (17.06) | | | $ | (1.22) | |
(a)Intersegment sales eliminate upon consolidation and are generally made at prices approximating those that the selling entity would be able to obtain in third-party transactions.
| | | | | | | | |
| | MANAGEMENT’S DISCUSSION AND ANALYSIS |
ITEMS AFFECTING COMPARABILITY
OIL AND GAS SEGMENT
Results of Operations
| | | | | | | | | | | | | | | | | | | | |
| millions | | 2021 | | 2020 | | 2019 |
| Segment Sales | | $ | 18,941 | | | $ | 13,066 | | | $ | 13,941 | |
Segment Results (a) | | | | | | |
Domestic | | $ | 2,900 | | | $ | (8,758) | | | $ | 838 | |
International | | 1,497 | | | (742) | | | 1,851 | |
Exploration | | (252) | | | (132) | | | (169) | |
Total | | $ | 4,145 | | | $ | (9,632) | | | $ | 2,520 | |
| | | | | | |
| Items affecting comparability | | | | | | |
Asset impairments and related items - domestic (b) | | $ | (282) | | | $ | (5,904) | | | $ | (288) | |
Asset impairments and related items - international (c) | | $ | — | | | $ | (1,195) | | | $ | (39) | |
Asset sale gains (losses), net - domestic (d) | | $ | 27 | | | $ | (1,275) | | | $ | 475 | |
Asset sale losses, net - international (e) | | $ | 43 | | | $ | (353) | | | $ | — | |
Oil, natural gas and CO2 mark-to-market gains (losses) | | $ | (280) | | | $ | 1,090 | | | $ | (15) | |
| Rig terminations and other - domestic | | $ | — | | | $ | (59) | | | $ | — | |
| Rig terminations and other - international | | $ | — | | | $ | (13) | | | $ | — | |
(a)Results included significant items affecting comparability discussed in the footnotes below.
(b)The 2021 amount included $282 million of asset impairments primarily related to undeveloped leases that either expired or were set to expire in the near-term where Occidental had no plans to pursue exploration activities. The 2020 amount included pre-tax impairments of $4.5 billion primarily related to domestic onshore unproved acreage as well as $1.3 billion primarily related to other domestic onshore assets and the Gulf of Mexico. The 2019 amount included $285 million of impairment and related charges associated with domestic undeveloped leases that were set to expire in the near-term, where Occidental had no plans to pursue exploration activities.
(c)The 2020 amount included $1.2 billion of impairment and related charges associated with Occidental’s proved properties in Algeria and Oman. The 2019 amount related to Occidental’s mutually agreed early termination of certain Qatar concessions.
(d)The 2021 amount included $27 million in post-closing consideration earned from 2020 asset sales as a result of certain production and pricing targets being met. The 2020 amount included a $440 million loss on the sale of Occidental’s mineral and fee surface acres in Wyoming, Colorado and Utah and losses of $820 million related to the sale of non-core, largely non-operated acreage in the Permian Basin. The 2019 amount included gain on the sale of a portion of Occidental’s joint venture with ECOPETROL S.A. (Ecopetrol) and a loss on sale of real estate assets.
(e)The 2021 amount primarily included $55 million in post-closing consideration earned from 2020 asset sales as a result of certain production and pricing targets being met, The 2020 amount included a loss on the sale of Occidental’s Colombia assets of $353 million.
| | | | | | | | |
| | MANAGEMENT’S DISCUSSION AND ANALYSIS |
The following table sets forth the average realized prices for oil, NGL and natural gas from ongoing operations for each of the three years in the period ended December 31, 2021, and includes a year-over-year change calculation:
| | | | | | | | | | | | | | | | | | | | | | | | | | | | | | | | |
| | 2021 | | Year over Year Change | | 2020 (a) | | Year over Year Change | | 2019 (a) |
| Average Realized Prices | | | | | | | | | | |
Oil ($/Bbl) | | | | | | | | | | |
| United States | | $ | 66.39 | | | 82 | % | | $ | 36.39 | | | (33) | % | | $ | 54.31 | |
| International | | $ | 65.08 | | | 57 | % | | $ | 41.50 | | | (33) | % | | $ | 62.00 | |
Total worldwide | | $ | 66.14 | | | 77 | % | | $ | 37.34 | | | (34) | % | | $ | 56.26 | |
NGL ($/Bbl) | | | | | | | | | | |
| United States | | $ | 30.62 | | | 156 | % | | $ | 11.98 | | | (25) | % | | $ | 16.03 | |
| International | | $ | 26.13 | | | 61 | % | | $ | 16.22 | | | (26) | % | | $ | 21.85 | |
| Total worldwide | | $ | 30.01 | | | 139 | % | | $ | 12.58 | | | (27) | % | | $ | 17.20 | |
Natural Gas ($/Mcf) | | | | | | | | | | |
| United States | | $ | 3.30 | | | 180 | % | | $ | 1.18 | | | (10) | % | | $ | 1.31 | |
| International | | $ | 1.69 | | | 1 | % | | $ | 1.67 | | | 1 | % | | $ | 1.66 | |
Total worldwide | | $ | 2.87 | | | 119 | % | | $ | 1.31 | | | (10) | % | | $ | 1.45 | |
(a)2020 and 2019 average realized prices have been adjusted to reflect the exclusion of Colombia, which was sold in 2020.
Domestic oil and gas results, excluding significant items affecting comparability, increased in 2021 compared to 2020 primarily due to higher realized oil, NGL and natural gas prices, partially offset by higher DD&A rates and overall lower oil volumes, primarily in the Permian Basin and DJ Basin.
International oil and gas results, excluding significant items affecting comparability, increased in 2021 compared to 2020 primarily due to higher oil prices partially offset by lower oil volumes.
Production
The following table sets forth the production volumes of oil, NGL and natural gas per day from ongoing operations for each of the three years in the period ended December 31, 2021, and includes a year-over-year change calculation:
| | | | | | | | | | | | | | | | | | | | | | | | | | | | | | | | |
| Production per Day, Ongoing Operations (Mboe/d) | | 2021 | | Year over Year Change | | 2020 | | Year over Year Change | | 2019 |
| United States | | | | | | | | | | |
| Permian | | 487 | | | (15) | % | | 575 | | | 13 | % | | 509 | |
| Rockies & Other Domestic | | 302 | | | (9) | % | | 332 | | | 126 | % | | 147 | |
| Gulf of Mexico | | 144 | | | 11 | % | | 130 | | | 124 | % | | 58 | |
| Total | | 933 | | | (10) | % | | 1,037 | | | 45 | % | | 714 | |
| International | | | | | | | | | | |
| Algeria & Other International | | 44 | | | (2) | % | | 45 | | | 88 | % | | 24 | |
| Al Hosn Gas | | 76 | | | (3) | % | | 78 | | | (5) | % | | 82 | |
| Dolphin | | 40 | | | (9) | % | | 44 | | | 5 | % | | 42 | |
| Oman | | 74 | | | (13) | % | | 85 | | | (4) | % | | 89 | |
| Total | | 234 | | | (7) | % | | 252 | | | 6 | % | | 237 | |
Total Production from Ongoing Operations | | 1,167 | | | (9) | % | | 1,289 | | | 36 | % | | 951 | |
Operations exited (a) | | 16 | | | (72) | % | | 58 | | | (26) | % | | 78 | |
Total Production (Mboe/d) (b) | | 1,183 | | | (12) | % | | 1,347 | | | 31 | % | | 1,029 | |
(a)Operations exited include the Ghana assets (sold in October 2021), the Colombia onshore assets (sold in December 2020) and the Qatar Idd El Shargi Fields (exited in 2019).
(b)Natural gas volumes have been converted to Boe based on energy content of six Mcf of gas to one barrel of oil. Boe equivalent does not necessarily result in price equivalency. Please refer to the Supplemental Oil and Gas Information (unaudited) section of this Form 10-K for additional information on oil and gas production and sales.
| | | | | | | | |
| | MANAGEMENT’S DISCUSSION AND ANALYSIS |
Average daily production volumes from ongoing operations decreased in 2021 compared to 2020 primarily due to maintaining capital expenditures at a level to sustain production at the rate Occidental exited 2020.
Lease Operating Expense
The following table sets forth the average lease operating expense per Boe from ongoing operations for each of the three years in the period ended December 31, 2021:
| | | | | | | | | | | | | | | | | | | | |
| | 2021 | | 2020 | | 2019 |
| Average lease operating expense per Boe | | $ | 7.58 | | | $ | 6.38 | | | $ | 9.07 | |
Average lease operating expense per Boe increased in 2021 compared to 2020 primarily as a result of higher maintenance, support and workover costs in the Gulf of Mexico, including additional costs associated with platforms reaching the end of their useful life, as well as higher energy and purchase injectant costs in the Permian, partially offset by continued operational efficiencies which decreased down hole maintenance and workover and support costs in the Permian.
CHEMICAL SEGMENT
| | | | | | | | | | | | | | | | | | | | |
| millions | | 2021 | | 2020 | | 2019 |
| Segment Sales | | $ | 5,246 | | | $ | 3,733 | | | $ | 4,102 | |
| Segment Results | | $ | 1,544 | | | $ | 664 | | | $ | 799 | |
Chemical segment results increased in 2021 compared to 2020 due to improved demand due to improved U.S. economic growth and higher prices across most product lines, including caustic soda and PVC, partially offset by higher raw material costs, primarily ethylene and energy.
MIDSTREAM AND MARKETING SEGMENT
| | | | | | | | | | | | | | | | | | | | |
| millions | | 2021 | | 2020 | | 2019 |
| Segment Sales | | $ | 2,863 | | | $ | 1,768 | | | $ | 4,132 | |
Segment Results (a) | | $ | 257 | | | $ | (4,175) | | | $ | 241 | |
| | | | | | |
| Items affecting comparability | | | | | | |
Asset sales gains (losses) and others, net (b) | | $ | 124 | | | $ | (46) | | | $ | 114 | |
Goodwill impairments and other charges (c) | | $ | (21) | | | $ | (4,194) | | | $ | (1,002) | |
Derivative gains (losses), net (d) | | $ | (252) | | | $ | 97 | | | $ | (184) | |
(a)Results included significant items affecting comparability discussed in the footnotes below.
(b)The 2021 amount included a $102 million gain from the sale of 11.5 million limited partner units in WES. The 2020 amount represented a loss on the exchange of WES common units to retire a $260 million note. The 2019 amount represented a $114 million gain on the sale of an equity investment in Plains All American Pipeline, L.P. and Plains GP Holdings, L.P. (together, Plains).
(c)The 2020 amount included a $2.7 billion other-than-temporary impairment of the equity investment in WES and $1.4 billion of impairments related to the write-off of goodwill and a loss from an equity investment related to WES’ write-off of its goodwill. The 2019 amount included a $1 billion charge as a result of recording Occidental’s investment in WES at fair value as of December 31, 2019 upon the loss of control.
(d)The 2019 amount represented a $30 million mark-to-market gain on an interest rate swap for WES and other derivative mark-to-market activity.
Midstream and marketing segment results, excluding items affecting comparability, increased in 2021 compared to 2020, primarily due to improved marketing results from higher crude oil prices and higher sulfur prices at Al Hosn Gas.
| | | | | | | | |
| | MANAGEMENT’S DISCUSSION AND ANALYSIS |
CORPORATE
Significant corporate items include the following:
| | | | | | | | | | | | | | | | | | | | |
| millions | | 2021 | | 2020 | | 2019 |
| Items Affecting Comparability | | | | | | |
Anadarko acquisition-related costs (a) | | $ | (153) | | | $ | (339) | | | $ | (1,647) | |
Bridge loan financing fees (a) | | $ | — | | | $ | — | | | $ | (122) | |
Acquisition-related pension & termination benefits (a) | | $ | — | | | $ | 114 | | | $ | 37 | |
Interest rate swap gains (losses), net (b) | | $ | 122 | | | $ | (428) | | | $ | 122 | |
| Early debt extinguishment expenses and other | | $ | (118) | | | $ | — | | | $ | (22) | |
Warrants gains, net (b) | | $ | — | | | $ | 5 | | | $ | 81 | |
(b)See Note 8 - Derivatives in the Notes to the Consolidated Financial Statements in Part II Item 8 of this Form 10-K for more information.
Total deferred tax assets, after valuation allowance, were $3.5 billion and $4.3 billion as of December 31, 2021 and 2020, respectively. Occidental expects to realize the recorded deferred tax assets, net of any allowances, through future operating income and reversal of temporary differences. The total deferred tax liabilities were $10.5 billion and $11.4 billion as of December 31, 2021 and 2020, respectively. The decrease in net deferred tax liability in 2021 compared to 2020 was primarily driven by the impact of lower capital spending and domestic asset impairments for which Occidental does not receive an immediate tax benefit, partially offset by the utilization of net operating losses and other tax attributes.
LEGAL ENTITY REORGANIZATION
In order to align Occidental’s legal entity structure with the nature of its business activities after completing the acquisition of Anadarko and subsequent large scale post-Acquisition divestiture program, management has undertaken a legal entity reorganization that is expected to be completed in the first quarter of 2022.
As a result of this legal entity reorganization, management will make an adjustment to the tax basis in a portion of its operating assets, thus reducing Occidental’s deferred tax liabilities. Accordingly, in the first quarter of 2022, Occidental will record a one-time non-cash tax benefit that is currently estimated not to exceed $2.6 billion, in connection with this reorganization. The timing of any reduction in Occidental’s future cash taxes as a result of this legal entity reorganization will be dependent on a number of factors, including prevailing commodity prices, capital activity level and production mix. Occidental will complete its review of its tax basis calculations, fair value assessments and other information and will finalize the adjustment to its deferred tax liabilities during the first quarter of 2022.
WORLDWIDE EFFECTIVE TAX RATE
The following table sets forth the calculation of the worldwide effective tax rate for income from continuing operations:
| | | | | | | | | | | | | | | | | | | | |
| millions | | 2021 | | 2020 | | 2019 |
| SEGMENT RESULTS | | | | | | |
| Oil and gas | | $ | 4,145 | | | $ | (9,632) | | | $ | 2,520 | |
| Chemical | | 1,544 | | | 664 | | | 799 | |
| Midstream and marketing | | 257 | | | (4,175) | | | 241 | |
| Unallocated corporate items | | (2,241) | | | (2,562) | | | (3,206) | |
| Income (loss) from continuing operations before taxes | | $ | 3,705 | | | $ | (15,705) | | | $ | 354 | |
| Income tax benefit (expense) | | | | | | |
| Federal and state | | (247) | | | 2,607 | | | 34 | |
| Foreign | | (668) | | | (435) | | | (895) | |
| Total income tax benefit (expense) | | (915) | | | 2,172 | | | (861) | |
Income (loss) from continuing operations | | $ | 2,790 | | | $ | (13,533) | | | $ | (507) | |
| Worldwide effective tax rate | | 25 | % | | 14 | % | | 243 | % |
| | | | | | | | |
| | MANAGEMENT’S DISCUSSION AND ANALYSIS |
In 2021, Occidental’s worldwide effective tax rate was 25%, which was higher than the U.S. statutory rate of 21% due to higher tax rates in the foreign jurisdictions in which Occidental operates, partially offset by the tax impact of business credits, state tax revaluations and other domestic tax benefits.
In 2020, Occidental’s worldwide effective tax rate was 14%, which was largely a result of the impairment of the WES goodwill and certain international assets for which Occidental received no tax benefit and higher-taxed international operations which generally caused Occidental’s tax rate to vary significantly from the U.S. corporate tax rate.
| | |
| CONSOLIDATED RESULTS OF OPERATIONS |
REVENUE AND OTHER INCOME ITEMS
| | | | | | | | | | | | | | | | | | | | |
| millions | | 2021 | | 2020 | | 2019 |
| Net sales | | $ | 25,956 | | | $ | 17,809 | | | $ | 20,911 | |
Interest, dividends and other income | | $ | 166 | | | $ | 118 | | | $ | 217 | |
| Gains (losses) on sale of assets, net | | $ | 192 | | | $ | (1,666) | | | $ | 622 | |
NET SALES
Price and volume changes generally represent the majority of the change in the oil and gas and chemical segments sales. Midstream and marketing sales generally represent the margins earned by the marketing business at it strives to optimize the use of its transportation, storage and terminal commitments to provide access to domestic and international markets and, to a lesser extent, NGL and sulfur revenues from the gas processing business.
The increase in net sales in 2021 compared to 2020 was primarily due to higher realized commodity prices, which were partially offset by lower oil volumes. Chemical sales increased primarily due to higher prices and volumes across all product lines, specifically PVC, VCM and caustic due to increased domestic demand and record high pricing in global markets. Midstream and marketing sales improved due to the rising crude oil price environment and its impact on export sales and higher realized sulfur prices at Al Hosn Gas.
GAINS (LOSSES) ON SALE OF ASSETS, NET
The 2021 gains on sales of assets, net, was primarily comprised of a gain from the sale of limited partner units of WES in the first quarter of 2021 as well as post-closing consideration earned on 2020 asset sales as a result of certain production and pricing targets being met. Losses on asset sales in 2020 included $820 million related to the sale of certain non-core, largely non-operated acreage in the Permian Basin, $440 million related to the sale of 4.5 million mineral acres and 1 million fee surface acres located in Wyoming, Colorado and Utah, $353 million related to the sale of the Colombia onshore assets and a loss of $46 million related to an exchange of 27.9 million WES limited partner units to retire a $260 million note payable to WES.
EXPENSE ITEMS
| | | | | | | | | | | | | | | | | | | | |
| millions | | 2021 | | 2020 | | 2019 |
| Oil and gas operating expense | | $ | 3,160 | | | $ | 3,065 | | | $ | 3,282 | |
| Transportation and gathering expense | | $ | 1,419 | | | $ | 1,600 | | | $ | 635 | |
| Chemical and midstream cost of sales | | $ | 2,772 | | | $ | 2,408 | | | $ | 2,791 | |
| Purchased commodities | | $ | 2,308 | | | $ | 1,395 | | | $ | 1,679 | |
| Selling, general and administrative | | $ | 863 | | | $ | 864 | | | $ | 893 | |
| Other operating and non-operating expense | | $ | 1,065 | | | $ | 884 | | | $ | 1,421 | |
| Depreciation, depletion and amortization | | $ | 8,447 | | | $ | 8,097 | | | $ | 6,140 | |
| Asset impairments and other charges | | $ | 304 | | | $ | 11,083 | | | $ | 1,361 | |
| Taxes other than on income | | $ | 1,005 | | | $ | 622 | | | $ | 840 | |
| Anadarko Acquisition-related costs | | $ | 153 | | | $ | 339 | | | $ | 1,647 | |
| Exploration expense | | $ | 252 | | | $ | 132 | | | $ | 247 | |
| Interest and debt expense, net | | $ | 1,614 | | | $ | 1,424 | | | $ | 1,066 | |
| | | | | | | | |
| | MANAGEMENT’S DISCUSSION AND ANALYSIS |
OIL AND GAS OPERATING EXPENSE
Oil and gas operating expense increased in 2021 from the prior year, primarily as a result of higher maintenance, support and workover costs in the Gulf of Mexico, including additional costs associated with platforms reaching the end of their useful life, as well as higher energy and purchase injectant costs in the Permian, partially offset by continued operational efficiencies which decreased down hole maintenance and workover and support costs in the Permian.
TRANSPORTATION AND GATHERING EXPENSE
Transportation and gathering expense decreased in 2021 from the prior year, primarily as a result of lower domestic oil and gas production volumes.
CHEMICAL AND MIDSTREAM COST OF SALES
Chemical and midstream cost of sales increased in 2021 from the prior year, primarily due to higher ethylene and energy costs in the chemical segment and higher energy costs in the midstream segment.
PURCHASED COMMODITIES
Purchased commodities increased in 2021 largely as a result of higher crude oil prices on third-party crude purchases related to the midstream and marketing segment.
OTHER OPERATING AND NON-OPERATING EXPENSE
Other operating and non-operating expense increased in 2021 from the prior year, primarily due to a net gain in 2020 related to the settlement, curtailment and special termination benefits on pension plans acquired in the Acquisition.
DEPRECIATION, DEPLETION AND AMORTIZATION
Depreciation, depletion and amortization (DD&A) expense increased in 2021 from the prior year, primarily due to higher DD&A rates primarily in the onshore U.S. domestic assets. As a result of Occidental's mid-year reserve review undertaken in the second quarter of 2021, DD&A rates for the second half of 2021 were lower compared to the first half of 2021 due to increased proved reserves primarily related to positive price revisions. Proved oil, NGL and natural gas reserves were estimated during this mid-year review using the unweighted arithmetic average of the first-day-of-the-month price for each month for the twelve months ended June 30, 2021, unless prices were defined by contractual arrangements.
ASSET IMPAIRMENTS AND OTHER CHARGES
In 2021, asset impairments and other charges of $304 million were mainly comprised of the impairment of undeveloped leases that either expired or were set to expire in the near-term where Occidental had no plans to pursue exploration activities. In 2020, asset impairments and other charges included pre-tax impairments of $4.5 billion primarily related to domestic onshore unproved acreage as well as $1.3 billion primarily related to other domestic onshore assets and the Gulf of Mexico. In addition there were $931 million of impairment and related charges associated with Occidental’s proved properties in Algeria to remeasure the Algeria oil and gas properties to their fair value. Also for the midstream and marketing segment, there were pre-tax impairment charges of $2.7 billion other-than-temporary impairment of the equity investment in WES and $1.2 billion of impairments related to the write-off of goodwill. In 2021, impairments included $276 million related to undeveloped leases that either expired or were set to expire in the near-term, where Occidental had no plans to pursue exploration activities.
TAXES OTHER THAN ON INCOME
Taxes other than on income in 2021 increased from the prior year, primarily due to higher production taxes, which are directly tied to higher commodity prices.
OTHER ITEMS
| | | | | | | | | | | | | | | | | | | | |
Income (expense) millions | | 2021 | | 2020 | | 2019 |
| Gains (losses) on interest rate swaps and warrants | | $ | 122 | | | $ | (423) | | | $ | 233 | |
Income from equity investments | | $ | 631 | | | $ | 370 | | | $ | 373 | |
| Income tax benefit (expense) | | $ | (915) | | | $ | 2,172 | | | $ | (861) | |
GAINS (LOSSES) ON INTEREST RATE SWAPS AND WARRANTS
Gains on interest rate swaps in 2021 were due to an increase in the floating reference rate of interest rate swaps.
INCOME FROM EQUITY INVESTMENTS
Income from equity investments in 2021 increased as a result of higher earnings from WES as income from equity earnings in 2020 included a loss of $240 million related to WES’s write-off of its goodwill.
| | | | | | | | |
| | MANAGEMENT’S DISCUSSION AND ANALYSIS |
INCOME TAX BENEFIT (EXPENSE)
Income tax expense increased in 2021 from the prior year, as a result of higher pre-tax income, which was primarily related to higher commodity prices.
LOSS FROM DISCONTINUED OPERATIONS, NET
Discontinued operations, net, primarily included a $437 million after-tax loss contingency associated with Occidental’s former operations in Ecuador, see Note - 13 Lawsuits, Claims, Commitments and Contingencies in the Notes to Consolidated Financial Statements in Part ii Item 8 of this Form 10-K for more information. In addition, discontinued operations, net was associated with operations in Ghana which were sold in October 2021.
| | |
| LIQUIDITY AND CAPITAL RESOURCES |
CASH ON HAND
As of December 31, 2021, Occidental had approximately $2.8 billion in cash and cash equivalents. A substantial majority of this cash is held and available for use in the United States.
SOURCES AND USES OF CASH
In the current commodity price environment, Occidental expects to fund its operational and capital requirements as well as return capital to its shareholders via an increase in common dividends and a reactivated share repurchase program with cash flows from operations. Sustained strength in commodity prices and the resultant cash flow generated will also allow Occidental to continue to strengthen its balance sheet by reducing debt and other financial obligations. Occidental currently expects its operational cash flows and cash on hand to be sufficient to meet its current debt maturities and other obligations for the next 12 months from the date of this filing. Should commodity prices return to their 2020 lows, Occidental’s $4.0 billion RCF, receivables securitization facility and access to capital markets are available to meet its ongoing capital needs, purchase obligations, near-term debt maturities and other liabilities and financial obligations, if required.
Occidental’s 2022 capital budget is $3.9 billion to $4.3 billion, of which only a small percentage is allocated to non-cancellable commitments.
As of December 31, 2021, Occidental had $101 million in current maturities of long-term debt through December 31, 2022, and an additional $465 million in long-term obligations due in 2023. The current maturities of long-term debt were paid in January 2022.
As of December 31, 2021, Occidental had $268 million in non-cancelable lease payments due in 2022, and an additional $212 million in non-cancelable lease payments due in 2023.
Dividends on common and preferred stock were $839 million for the year ended December 31, 2021.
Occidental is party to various purchase agreements that are not accounted for as leases or otherwise accrued as liabilities as of December 31, 2021. These agreements consist primarily of obligations to secure terminal, pipeline and processing capacity, purchase services used in the normal course of business including transporting and disposing of produced water, purchase goods used in the production of finished goods including certain chemical raw materials and power and agreements relating to equipment maintenance and service. The amounts that will be paid for such outstanding off-balance sheet purchase obligations as of December 31, 2021 are $3.0 billion in 2022, $4.3 billion in 2023 and 2024, $2.6 billion in 2025 and 2026 and $2.6 billion in 2027 and thereafter.
SHARE REPURCHASE PROGRAM
On February 10, 2022, the Board of Directors authorized a new share repurchase program with a maximum dollar limit of $3 billion and no set term limits, which supersedes the previously authorized share repurchase program.
| | | | | | | | |
| | MANAGEMENT’S DISCUSSION AND ANALYSIS |
The following table summarizes and cross-references Occidental’s contractual obligations and indicates on- and off-balance sheet obligations as of December 31, 2021. Commitments related to held for sale assets are excluded.
| | | | | | | | | | | | | | | | | | | | | | | | | | | | | |
millions | | | Payments Due by Year |
| Total | | 2022 | | 2023 and 2024 | | 2025 and 2026 | | 2027 and
thereafter |
| On-Balance Sheet | | | | | | | | | |
Current portion of long-term debt (Note 6) (a) | $ | 101 | | | $ | 101 | | | $ | — | | | $ | — | | | $ | — | |
Long-term debt (Note 6) (a) | 28,392 | | | — | | | 2,191 | | | 5,264 | | | 20,937 | |
| Expected interest payments on long-term debt | 17,087 | | | 1,448 | | | 2,835 | | | 2,513 | | | 10,291 | |
Leases (Note 7) (b) | 1,560 | | | 268 | | | 393 | | | 297 | | | 602 | |
| Asset retirement obligations (Note 1) | 4,026 | | | 339 | | | 906 | | | 569 | | | 2,212 | |
Other long-term liabilities (c) | 3,183 | | | 1 | | | 861 | | | 299 | | | 2,022 | |
| Off-Balance Sheet | | | | | | | | | |
Purchase obligations (d) | 12,463 | | | 3,033 | | | 4,291 | | | 2,571 | | | 2,568 | |
| Total | $ | 66,812 | | | $ | 5,190 | | | $ | 11,477 | | | $ | 11,513 | | | $ | 38,632 | |
(a)Excluded unamortized debt discount and interest.
(b)Occidental is the lessee under various agreements for real estate, equipment, plants and facilities.
(c)Included long term obligations and current portions of long term obligations under postretirement benefits, accrued transportation commitments, ad valorem taxes and other accrued liabilities.
(d)Amounts included payments which will become due under long-term agreements to purchase goods and services used in the normal course of business to secure terminal, pipeline and processing capacity, CO2, electrical power, steam and certain chemical raw materials including but not limited to capital commitments. Amounts excluded certain product purchase obligations related to marketing activities for which there are no minimum purchase requirements or the amounts are not fixed or determinable. Long-term purchase contracts were discounted at a 4.99% discount rate.
DEBT ACTIVITY
Occidental recently completed its large scale asset divestiture program and used the net proceeds from asset sales and free cash flow to repay near and medium-term debt maturities. During 2021, through repayments and cash tenders Occidental reduced its face value of borrowings by $6.7 billion from $35.2 billion as of December 31, 2020, to $28.5 billion as of December 31, 2021.
In January 2022, Occidental used cash on hand to repay of $101 million in outstanding 2.600% senior notes due April 2022, which were called in December 2021. Subsequent to the repayment of this note, there are no remaining 2022 debt maturities.
In the fourth quarter of 2021, Occidental completed a cash tender offer for outstanding senior notes with a face value of $1.5 billion and maturities ranging from 2024 to 2049 and called and repaid $627 million of senior notes due 2022. In the third quarter of 2021, Occidental completed a cash tender for outstanding senior notes with a face value of $3.0 billion and maturities ranging from 2022 through 2026, paid $224 million of senior notes upon maturity and fully retired $1.1 billion of floating interest rate notes due August 2022. In the first quarter of 2021, Occidental repaid $174 million of debt upon maturity.
In December 2021, Occidental entered into the Second Amended and Restated Credit Agreement on its existing $5.0 billion RCF in which the total commitment was decreased to $4.0 billion, the London Interbank Offered Rate (LIBOR) benchmark was changed to SOFR, an environmental key performance indicator was added with regard to scope 1 and 2 GHG emissions from worldwide operated assets, making this a sustainability-linked loan, and the facility maturity date was extended to June 30, 2025. As of December 31, 2021, under the most restrictive covenants of its financing agreements, Occidental had substantial capacity for additional unsecured borrowings, the payment of cash dividends and other distributions on, or acquisitions of, Occidental common stock.
See Note 6 - Long-Term Debt in the Notes to Consolidated Financial Statements in Part II Item 8 of this Form 10-K for more information related to Occidental’s debt issuance and repayments.
GUARANTEES
Occidental has entered into various guarantees, indemnities and commitments provided by Occidental to third parties, mainly to provide assurance that Occidental or its consolidated subsidiaries or affiliates will meet their various obligations.
| | | | | | | | |
| | MANAGEMENT’S DISCUSSION AND ANALYSIS |
CASH FLOW ANALYSIS
CASH PROVIDED BY OPERATING ACTIVITIES
| | | | | | | | | | | | | | | | | | | | |
| millions | | 2021 | | 2020 | | 2019 |
| Operating cash flow from continuing operations | | $ | 10,253 | | | $ | 3,842 | | | $ | 7,336 | |
| Operating cash flow from discontinued operations, net of taxes | | 181 | | | 113 | | | 39 | |
| Net cash provided by operating activities | | $ | 10,434 | | | $ | 3,955 | | | $ | 7,375 | |
Cash provided by operating activities increased in 2021 compared to 2020, primarily due to higher commodity prices, especially for oil, as average WTI and Brent prices increased by 72% and 64%, respectively. The chemical segment also generated substantial operating cash flows largely due to higher demand for most chemical products including caustic soda and PVC and higher pricing relative to 2020. The overall increase in operating cash flows was partially offset by an increase in working capital related to receivables, which increased largely as a result of higher commodity prices.
CASH USED BY INVESTING ACTIVITIES
| | | | | | | | | | | | | | | | | | | | |
| millions | | 2021 | | 2020 | | 2019 |
| Capital expenditures | | | | | | |
| Oil and gas | | $ | (2,409) | | | $ | (2,208) | | | $ | (5,512) | |
| Chemical | | (308) | | | (255) | | | (267) | |
| Midstream and marketing | | (106) | | | (50) | | | (461) | |
| Corporate | | (47) | | | (22) | | | (127) | |
| Total | | $ | (2,870) | | | $ | (2,535) | | | $ | (6,367) | |
| Changes in capital accrual | | 97 | | | (519) | | | (249) | |
| Purchase of businesses and assets, net | | (431) | | | (114) | | | (28,088) | |
| Proceeds from sale of assets and equity investments, net | | 1,624 | | | 2,281 | | | 6,143 | |
| Other investing activities, net | | 406 | | | 109 | | | (291) | |
Investing cash flows from continuing operations | | $ | (1,174) | | | $ | (778) | | | $ | (28,852) | |
Investing cash flows from discontinued operations | | (79) | | | (41) | | | (175) | |
Net cash used by investing activities | | $ | (1,253) | | | $ | (819) | | | $ | (29,027) | |
Cash flows used by investing activities increased by $434 million in 2021 compared to 2020. In 2020, Occidental reduced capital spending in response to the COVID-19 pandemic and targeted its capital spend in 2021 to maintain Q4 production and other maintenance capital for operating segments. Additionally, Occidental completed its major divestiture plans, reducing proceeds from asset sales year over year. See Note 5 - Acquisitions, Divestitures and Other Transactions in the Notes to Consolidated Financial Statements in Part II Item 8 of this Form 10-K for a listing of assets and equity investments sold in 2021, 2020 and 2019. In addition, Occidental received a $450 million return of investment from DEL, which is being presented in other investing activities, net, and acquired an additional working interests in certain assets in the Permian Basin and the Gulf of Mexico for approximately $360 million.
CASH PROVIDED (USED) BY FINANCING ACTIVITIES
| | | | | | | | | | | | | | | | | | | | |
| millions | | 2021 | | 2020 | | 2019 |
| Financing cash flows from continuing operations | | $ | (8,564) | | | $ | (4,508) | | | $ | 22,196 | |
| Financing cash flows from discontinued operations | | (8) | | | (8) | | | (3) | |
Net cash provided (used) by financing activities | | $ | (8,572) | | | $ | (4,516) | | | $ | 22,193 | |
Cash used by financing activities increased by $4.0 billion compared to 2020 primarily due to the 2021 debt tenders and repayments. See Note 6 - Long-Term Debt in the Notes to Consolidated Financial Statements in Part II Item 8 of this Form 10-K for more information related to Occidental’s debt issuance and repayments. In addition, cash used by financing activities reflected cash dividend payments of $839 million on preferred and common stock and $815 million paid in advance of the mandatory termination dates of interest rate swaps during the third quarter of 2021.
| | | | | | | | |
| | MANAGEMENT’S DISCUSSION AND ANALYSIS |
| | |
| LAWSUITS, CLAIMS, COMMITMENTS AND CONTINGENCIES |
LEGAL MATTERS
Occidental or certain of its subsidiaries are involved, in the normal course of business, in lawsuits, claims and other legal proceedings that seek, among other things, compensation for alleged personal injury, breach of contract, property damage or other losses, punitive damages, civil penalties or injunctive or declaratory relief. Occidental or certain of its subsidiaries also are involved in proceedings under Comprehensive Environmental Response, Compensation and Liability Act (CERCLA) and similar federal, state, local and international environmental laws. These environmental proceedings seek funding or performance of remediation and, in some cases, compensation for alleged property damage, punitive damages, civil penalties and injunctive relief. Usually Occidental or such subsidiaries are among many companies in these environmental proceedings and have to date been successful in sharing response costs with other financially sound companies. Further, some lawsuits, claims and legal proceedings involve acquired or disposed assets with respect to which a third party or Occidental retains liability or indemnifies the other party for conditions that existed prior to the transaction.
In accordance with applicable accounting guidance, Occidental accrues reserves for outstanding lawsuits, claims and proceedings when it is probable that a liability has been incurred and the liability can be reasonably estimated. Reserves for matters, other than for environmental remediation and the arbitration award disclosed below, that satisfy this criteria as of December 31, 2021 and 2020, were not material to Occidental’s Consolidated Balance Sheets.
In 2016, Occidental received payments from the Republic of Ecuador of approximately $1.0 billion pursuant to a November 2015 arbitration award for Ecuador’s 2006 expropriation of Occidental’s Participation Contract for Block 15. The awarded amount represented a recovery of 60% of the value of Block 15. In 2017, Andes Petroleum Ecuador Ltd. (Andes) filed a demand for arbitration, claiming it is entitled to a 40% share of the judgment amount obtained by Occidental. Occidental contends that Andes is not entitled to any of the amounts paid under the 2015 arbitration award because Occidental’s recovery was limited to Occidental’s own 60% economic interest in the block. On March 26, 2021, the arbitration tribunal issued an award in favor of Andes and against Occidental Exploration and Production Company (OEPC) in the amount of $391 million plus interest. In June 2021, OEPC filed a motion to vacate the award due to concerns regarding the validity of the award. In addition, OEPC has made a demand for significant additional claims not addressed by the arbitration tribunal that OEPC has against Andes relating to Andes' 40% share of costs, liabilities, losses and expenses due under the farmout agreement and joint operating agreement to which Andes and OEPC are parties. In December 2021, the U.S. District Court Southern District of New York confirmed the arbitration award, plus prejudgment interest, in the aggregate amount of $558 million. OEPC has appealed the judgement.
In August 2019, Sanchez Energy Corporation and certain of its affiliates (Sanchez) filed voluntary petitions for reorganization under Chapter 11 of the United States Bankruptcy Code. Sanchez is a party to agreements with Anadarko as a result of its 2017 purchase of Anadarko's Eagle Ford Shale assets. Sanchez attempted to reject some of the agreements related to the purchase of Anadarko’s Eagle Ford Shale assets (the Bankruptcy Litigation). If Sanchez was permitted to reject certain of those agreements, then Anadarko may owe deficiency payments to various third parties. In December 2021, Occidental and certain of its affiliates entered into an agreement to resolve the Bankruptcy Litigation. Occidental recorded a contingency reserve as of September 30, 2021, associated with the settlement.
If unfavorable outcomes of these matters were to occur, future results of operations or cash flows for any particular quarterly or annual period could be materially adversely affected. Occidental’s estimates are based on information known about the legal matters and its experience in contesting, litigating and settling similar matters. Occidental reassesses the probability and estimability of contingent losses as new information becomes available.
TAX MATTERS
During the course of its operations, Occidental is subject to audit by tax authorities for varying periods in various federal, state, local and international tax jurisdictions. Tax years through 2017 for U.S. federal income tax purposes have been audited by the IRS pursuant to its Compliance Assurance Program and subsequent taxable years are currently under review. Tax years through 2012 have been audited for state income tax purposes. Significant audit matters in international jurisdictions have been resolved through 2010. During the course of tax audits, disputes have arisen and other disputes may arise as to facts and matters of law.
For Anadarko, its taxable years through 2014 and tax year 2016 for U.S. federal tax purposes have been audited by the IRS. Tax years through 2008 have been audited for state income tax purposes. There is one outstanding significant tax matter in an international jurisdiction related to a discontinued operation. As stated above, during the course of tax audits, disputes have arisen and other disputes may arise as to facts and matters of law.
Other than the matter discussed below, Occidental believes that the resolution of these outstanding tax matters would not have a material adverse effect on its consolidated financial position or results of operations.
Anadarko received an $881 million tentative refund in 2016 related to its $5.2 billion Tronox Adversary Proceeding settlement payment in 2015. In September 2018, Anadarko received a statutory notice of deficiency from the IRS disallowing the net operating loss carryback and rejecting Anadarko’s refund claim. As a result, Anadarko filed a petition with the U.S. Tax Court to dispute the disallowances in November 2018. The case was in the IRS appeals process until the second
| | | | | | | | |
| | MANAGEMENT’S DISCUSSION AND ANALYSIS |
quarter of 2020; however, it has since been returned to the U.S. Tax Court, where a trial date has been set for July 2022 and Occidental expects to continue pursuing resolution.
In accordance with ASC 740’s guidance on the accounting for uncertain tax positions, Occidental has recorded no tax benefit on the tentative cash tax refund of $881 million. As a result, should Occidental not ultimately prevail on the issue, there would be no additional tax expense recorded relative to this position for financial statement purposes other than future interest. However, in that event, Occidental would be required to repay approximately $1 billion in federal taxes, $27 million in state taxes and accrued interest of $314 million. A liability for this amount plus interest is included in deferred credits and other liabilities-other.
INDEMNITIES TO THIRD PARTIES
Occidental, its subsidiaries, or both, have indemnified various parties against specified liabilities those parties might incur in the future in connection with purchases and other transactions that they have entered into with Occidental. These indemnities usually are contingent upon the other party incurring liabilities that reach specified thresholds. As of December 31, 2021, Occidental is not aware of circumstances that it believes would reasonably be expected to lead to indemnity claims that would result in payments materially in excess of reserves.
| | |
| ENVIRONMENTAL LIABILITIES AND EXPENDITURES |
Occidental’s operations are subject to stringent federal, state, local and international laws and regulations related to improving or maintaining environmental quality. The laws that require or address environmental remediation, including CERCLA and similar federal, state, local and international laws, may apply retroactively and regardless of fault, the legality of the original activities or the current ownership or control of sites. Occidental or certain of its subsidiaries participate in or actively monitor a range of remedial activities and government or private proceedings under these laws with respect to alleged past practices at operating, closed and third-party sites. Remedial activities may include one or more of the following: investigation involving sampling, modeling, risk assessment or monitoring; cleanup measures including removal, treatment or disposal; or operation and maintenance of remedial systems. The environmental proceedings seek funding or performance of remediation and, in some cases, compensation for alleged property damage, punitive damages, civil penalties, injunctive relief and government oversight costs.
ENVIRONMENTAL REMEDIATION
As of December 31, 2021, Occidental participated in or monitored remedial activities or proceedings at 165 sites. The following table presents Occidental’s current and non-current environmental remediation liabilities as of December 31, 2021 and 2020, the current portion of which is included in accrued liabilities ($155 million in 2021 and $123 million in 2020) and the remainder in deferred credits and other liabilities - environmental remediation liabilities ($0.9 billion in 2021 and $1.0 billion in 2020).
Occidental’s environmental remediation sites are grouped into four categories: National Priorities List (NPL) sites listed or proposed for listing by the EPA on the CERCLA NPL and three categories of non-NPL sites — third-party sites, Occidental-operated sites and closed or non-operated Occidental sites.
| | | | | | | | | | | | | | | | | | | | | | | | | | |
| | 2021 | | 2020 |
| millions, except number of sites | | Number of Sites | | Remediation Balance | | Number of Sites | | Remediation Balance |
| NPL sites | | 30 | | | $ | 427 | | | 35 | | | $ | 447 | |
| Third-party sites | | 69 | | | 273 | | | 69 | | | 293 | |
| Occidental-operated sites | | 15 | | | 122 | | | 17 | | | 144 | |
| Closed or non-operated Occidental sites | | 51 | | | 277 | | | 49 | | | 267 | |
| Total | | 165 | | | $ | 1,099 | | | 170 | | | $ | 1,151 | |
As of December 31, 2021, Occidental’s environmental liabilities exceeded $10 million each at 20 of the 165 sites described above and 96 of the sites had liabilities from $0 to $1 million each. As of December 31, 2021, two sites — the Maxus Energy Corporation (Maxus)-indemnified Diamond Alkali Superfund Site and a landfill in Western New York — accounted for 96% of its liabilities associated with NPL sites. 14 of the 30 NPL sites are indemnified by Maxus.
Five of the 69 third-party sites — a Maxus-indemnified chrome site in New Jersey, a former copper mining and smelting operation in Tennessee, a former oil field and a landfill in California and an active refinery in Louisiana where Occidental reimburses the current owner for certain remediation activities — accounted for 75% of Occidental’s liabilities associated with these sites. Nine of the 69 third-party sites are indemnified by Maxus.
Four sites — oil and gas operations in Colorado and chemical plants in Kansas, Louisiana and Texas — accounted for 69% of the liabilities associated with the Occidental-operated sites. Ten other sites — a landfill in Western New York, a
| | | | | | | | |
| | MANAGEMENT’S DISCUSSION AND ANALYSIS |
former refinery in Oklahoma, former chemical plants in California, Delaware, Michigan, New York, Ohio, Tennessee and Washington, and a closed coal mine in Pennsylvania — accounted for 75% of the liabilities associated with closed or non-operated Occidental sites.
Environmental remediation liabilities vary over time depending on factors such as acquisitions or divestitures, identification of additional sites and remedy selection and implementation. Occidental recorded environmental remediation expenses of $28 million, $36 million and $112 million for the years ended December 31, 2021, 2020 and 2019, respectively. Environmental remediation expenses primarily relate to changes to existing conditions from past operations. Based on current estimates, Occidental expects to expend funds corresponding to approximately 40% of the year-end remediation balance over the next three to four years with the remainder over the subsequent 10 or more years. Occidental believes its range of reasonably possible additional losses beyond those amounts currently recorded for environmental remediation for all of its environmental sites could be up to $1.3 billion.
MAXUS ENVIRONMENTAL SITES
When Occidental acquired Diamond Shamrock Chemicals Company (DSCC) in 1986, Maxus, a subsidiary of YPF S.A., agreed to indemnify Occidental for a number of environmental sites, including the Diamond Alkali Superfund Site (Site) along a portion of the Passaic River. On June 17, 2016, Maxus and several affiliated companies filed for Chapter 11 bankruptcy in Federal District Court in the State of Delaware. Prior to filing for bankruptcy, Maxus defended and indemnified Occidental in connection with clean-up and other costs associated with the sites subject to the indemnity, including the Site.
In March 2016, the EPA issued a Record of Decision (ROD) specifying remedial actions required for the lower 8.3 miles of the Lower Passaic River. The ROD does not address any potential remedial action for the upper nine miles of the Lower Passaic River or Newark Bay. During the third quarter of 2016, and following Maxus’s bankruptcy filing, Occidental and the EPA entered into an Administrative Order on Consent (AOC) to complete the design of the proposed clean-up plan outlined in the ROD with an estimated cost of $165 million. The EPA announced that it will pursue similar agreements with other potentially responsible parties.
Occidental has accrued a reserve relating to its estimated allocable share of the costs to perform the design and remediation called for in the AOC and the ROD, as well as for certain other Maxus-indemnified sites. Occidental's accrued estimated environmental reserve does not consider any recoveries for indemnified costs. Occidental’s ultimate share of this liability may be higher or lower than the reserved amount, and is subject to final design plans and the resolution of Occidental's allocable share with other potentially responsible parties. Occidental continues to evaluate the costs to be incurred to comply with the AOC and the ROD and to perform remediation at other Maxus-indemnified sites in light of the Maxus bankruptcy and the share of ultimate liability of other potentially responsible parties. In June 2018, Occidental filed a complaint under CERCLA in Federal District Court in the State of New Jersey against numerous potentially responsible parties for reimbursement of amounts incurred or to be incurred to comply with the AOC and the ROD, or to perform other remediation activities at the Site.
In September 2021, the EPA issued a ROD with an estimated cost of $441 million for an interim remedy plan for the upper nine miles of the Lower Passaic River. At this time, Occidental’s role or responsibilities under this ROD, and those of other potentially responsible parties, have not been determined with the EPA. Discussions between Occidental and the EPA are ongoing about this ROD.
In June 2017, the court overseeing the Maxus bankruptcy approved a Plan of Liquidation (Plan) to liquidate Maxus and create a trust to pursue claims against current and former parents YPF and each of its respective subsidiaries and affiliates (YPF) and Repsol, S.A. and each of its respective subsidiaries and affiliates (Repsol), as well as others to satisfy claims by Occidental and other creditors for past and future cleanup and other costs. In July 2017, the court-approved Plan became final and the trust became effective. The trust is pursuing claims against YPF, Repsol and others and is expected to distribute assets to Maxus' creditors in accordance with the trust agreement and Plan. In June 2018, the trust filed its complaint against YPF and Repsol in Delaware bankruptcy court asserting claims based upon, among other things, fraudulent transfer and alter ego. During 2019, the bankruptcy court denied Repsol's and YPF's motions to dismiss the complaint as well as their motions to move the case away from the bankruptcy court. Discovery remains ongoing.
| | | | | | | | |
| | MANAGEMENT’S DISCUSSION AND ANALYSIS |
ENVIRONMENTAL COSTS
Occidental’s environmental costs, some of which include estimates, are presented below for each segment for each of the years ended December 31:
| | | | | | | | | | | | | | | | | | | | |
| millions | | 2021 | | 2020 | | 2019 |
| Operating Expenses | | | | | | |
| Oil and gas | | $ | 267 | | | $ | 176 | | | $ | 174 | |
| Chemical | | 88 | | | 73 | | | 80 | |
| Midstream and marketing | | 6 | | | 4 | | | 12 | |
| Total | | $ | 361 | | | $ | 253 | | | $ | 266 | |
| Capital Expenditures | | | | | | |
| Oil and gas | | $ | 87 | | | $ | 74 | | | $ | 109 | |
| Chemical | | 66 | | | 40 | | | 34 | |
| Midstream and marketing | | 1 | | | 1 | | | 4 | |
| Total | | $ | 154 | | | $ | 115 | | | $ | 147 | |
| Remediation Expenses | | | | | | |
| Corporate | | $ | 28 | | | $ | 36 | | | $ | 112 | |
Operating expenses are incurred on a continual basis. Capital expenditures relate to longer-lived improvements in properties currently operated by Occidental. Remediation expenses relate to existing conditions from past operations.
A portion of Occidental’s assets are located outside North America. The following table shows the geographic distribution of Occidental’s assets as of December 31, 2021, at both the segment and consolidated level related to Occidental’s ongoing operations:
| | | | | | | | | | | | | | | | | | | | | | | | | | | | | |
| millions | Oil and gas | | Chemical | | Midstream and marketing | | Corporate and other | | Total Consolidated |
| North America | | | | | | | | | |
| United States | $ | 51,805 | | | $ | 4,465 | | | $ | 7,761 | | | $ | 3,101 | | | $ | 67,132 | |
| Canada | — | | | 121 | | | 62 | | | — | | | 183 | |
| Middle East | 3,475 | | | — | | | 3,205 | | | — | | | 6,680 | |
| North Africa and Other | 852 | | | 85 | | | 104 | | | — | | | 1,041 | |
| Consolidated | $ | 56,132 | | | $ | 4,671 | | | $ | 11,132 | | | $ | 3,101 | | | $ | 75,036 | |
For the year ended December 31, 2021, net sales outside North America totaled $4.2 billion, or approximately 16% of total net sales.
| | | | | | | | |
| | MANAGEMENT’S DISCUSSION AND ANALYSIS |
| | |
| CRITICAL ACCOUNTING POLICIES AND ESTIMATES |
The process of preparing financial statements in accordance with United States Generally Accepted Accounting Principles (GAAP) requires Occidental’s management to make informed estimates and judgments regarding certain items and transactions. Changes in facts and circumstances or discovery of new information may result in revised estimates and judgments and actual results may differ from these estimates upon settlement but generally not by material amounts. The selection and development of these policies and estimates have been discussed with the Audit Committee of the Board of Directors. Occidental considers the following to be its most critical accounting policies and estimates that involve management’s judgment.
OIL AND GAS PROPERTIES
The carrying value of Occidental’s property, plant and equipment (PP&E) represents the cost incurred to acquire or develop the asset, including any asset retirement obligations (AROs) and capitalized interest, net of DD&A and any impairment charges. For assets acquired in a business combination, PP&E cost is based on fair values at the acquisition date. AROs and interest costs incurred in connection with qualifying capital expenditures are capitalized and amortized over the useful lives of the related assets.
Occidental uses the successful efforts method to account for its oil and gas properties. Under this method, Occidental capitalizes costs of acquiring properties, costs of drilling successful exploration wells and development costs. The costs of exploratory wells are initially capitalized pending a determination of whether proved reserves have been found. If proved reserves have been found, the costs of exploratory wells remain capitalized. For exploratory wells that find reserves that cannot be classified as proved when drilling is completed, costs continue to be capitalized as suspended exploratory drilling costs if there have been sufficient reserves found to justify completion as a producing well and sufficient progress is being made in assessing the economic and operating viability of the project. At the end of each quarter, management reviews the status of all suspended exploratory drilling costs in light of ongoing exploration activities, in particular, whether Occidental is making sufficient progress in its ongoing exploration and appraisal efforts or, in the case of discoveries requiring government sanctioning, analyzing whether development negotiations are underway and proceeding as planned. If management determines that future appraisal drilling or development activities are unlikely to occur, associated suspended exploratory well costs are expensed.
Occidental expenses annual lease rentals, the costs of injectants used in production and geological and geophysical costs as incurred for exploration activities.
Occidental determines depreciation and depletion of oil and gas producing properties by the unit-of-production method. It amortizes leasehold acquisition costs over total proved reserves and capitalized development and successful exploration costs over proved developed reserves. As a result of Occidental's mid-year reserve review undertaken in the second quarter of 2021, DD&A rates for the second half of 2021 were lower compared to the first half of 2021 due to increased proved reserves primarily related to positive price revisions. Proved oil, NGL and natural gas reserves were estimated during this mid-year review using the unweighted arithmetic average of the first-day-of-the-month price for each month for the twelve months ended June 30, 2021, unless prices were defined by contractual arrangements.
Proved oil and gas reserves are those quantities of oil and gas which, by analysis of geoscience and engineering data, can be estimated with reasonable certainty to be economically producible—from a given date forward, from known reservoirs, and under existing economic conditions, operating methods, and government regulations—prior to the time at which contracts providing the right to operate expire, unless evidence indicates that renewal is reasonably certain, regardless of whether deterministic or probabilistic methods are used for the estimation.
Several factors could change Occidental’s proved oil and gas reserves. For example, Occidental receives a share of production from PSCs to recover its costs and generally an additional share for profit. Occidental’s share of production and reserves from these contracts decreases when product prices rise and increases when prices decline. Generally, Occidental’s net economic benefit from these contracts is greater at higher product prices. In other cases, particularly with long-lived properties, lower product prices may lead to a situation where production of a portion of proved reserves becomes uneconomical. For such properties, higher product prices typically result in additional reserves becoming economical. Estimation of future production and development costs is also subject to change partially due to factors beyond Occidental’s control, such as energy costs and inflation or deflation of oil field service costs. These factors, in turn, could lead to changes in the quantity of proved reserves. Additional factors that could result in a change of proved reserves include production decline rates and operating performance differing from those estimated when the proved reserves were initially recorded. Changes in the political and regulatory climate could lead to decreases in proved reserves as development horizons may be extended into the future.
Occidental performs impairment tests with respect to its proved properties whenever events or circumstances indicate that the carrying value of property may not be recoverable. If there is an indication the carrying amount of the asset may not be recovered due to significant and prolonged declines in current and forward prices, significant changes in reserve estimates, changes in management’s plans or other significant events, management will evaluate the property for impairment. Under the successful efforts method, if the sum of the undiscounted cash flows is less than the carrying value of the proved property, the carrying value is reduced to estimated fair value and reported as an impairment charge in the
| | | | | | | | |
| | MANAGEMENT’S DISCUSSION AND ANALYSIS |
period. Individual proved properties are grouped for impairment purposes at the lowest level for which there are identifiable cash flows unless observable and comparable transactions are available. The fair value of impaired assets is typically determined based on the present value of expected future cash flows using discount rates believed to be consistent with those used by market participants. The impairment test incorporates a number of assumptions involving expectations of future cash flows which can change significantly over time. These assumptions include estimates of future production, product prices, contractual prices, estimates of risk-adjusted oil and gas proved and unproved reserves and estimates of future operating and development costs. It is reasonably possible that prolonged declines in commodity prices, reduced capital spending in response to lower prices or increases in operating costs could result in impairments.
For impairment testing, unless prices are contractually fixed, Occidental uses observable forward strip prices for oil and natural gas prices when projecting future cash flows. Future operating and development costs are estimated using the current cost environment applied to expectations of future operating and development activities to develop and produce oil and gas reserves. Market prices for oil, NGL and natural gas have been volatile and may continue to be volatile in the future. Changes in global supply and demand, transportation capacity, currency exchange rates, applicable laws and regulations and the effect of changes in these variables on market perceptions could impact current forecasts. Future fluctuations in commodity prices could result in estimates of future cash flows to vary significantly.
Net capitalized costs attributable to unproved properties were $14.8 billion as of December 31, 2021, and $18.6 billion as of December 31, 2020. The unproved amounts are not subject to DD&A until they are classified as proved properties. Individually insignificant unproved properties are combined and amortized on a group basis based on factors such as lease terms, success rates and other factors to provide for full amortization upon lease expiration or abandonment.
Significant unproved properties, primarily as a result of the Acquisition, are assessed individually for impairment and when events or circumstances indicate that the carrying value of property may not be recovered a valuation allowance is provided if an impairment is indicated. Occidental periodically reviews significant unproved properties for impairments; numerous factors are considered, including but not limited to, availability of funds for future exploration and development activities, current exploration and development plans, favorable or unfavorable exploration activity on the property or the adjacent property, geologists’ evaluation of the property, the current and projected political and regulatory climate, contractual conditions and the remaining lease term for the properties. If an impairment is indicated, Occidental will first determine whether a comparable transaction for similar properties or implied acreage valuation derived from domestic onshore market participants is available and will adjust the carrying amount of the unproved property to its fair value using the market approach. In situations where the market approach is not observable and unproved reserves are available, undiscounted future net cash flows used in the impairment analysis are determined based on managements’ risk adjusted estimates of unproved reserves, future commodity prices and future costs to produce the reserves. If undiscounted future net cash flows are less than the carrying value of the property, the future net cash flows are discounted and compared to the carrying value for determining the amount of the impairment loss to record. Occidental utilizes the same assumptions and methodology discussed above for cash flows associated with proved properties.
PROVED RESERVES
Occidental estimates its proved oil and gas reserves according to the definition of proved reserves provided by the SEC and Financial Accounting Standards Board. This definition includes oil, NGL and natural gas that geological and engineering data demonstrate with reasonable certainty to be economically producible in future periods from known reservoirs under existing economic conditions, operating methods, government regulations, etc. (at prices and costs as of the date the estimates are made). Prices include consideration of price changes provided only by contractual arrangements and do not include adjustments based on expected future conditions. For reserves information, see the Supplemental Information on Oil and Gas Exploration and Production Activities under Item 8 of this Form 10-K. Engineering estimates of the quantities of proved reserves are inherently imprecise and represent only approximate amounts because of the judgments involved in developing such information. Occidental’s estimates of proved reserves are made using available geological and reservoir data as well as production performance data. The reliability of these estimates at any point in time depends on both the quality and quantity of the technical and economic data and the efficiency of extracting and processing the hydrocarbons. These estimates are reviewed annually by internal reservoir engineers and revised, either upward or downward, as warranted by additional data. Revisions are necessary due to changes in, among other things, development plans, reservoir performance, prices, economic conditions and governmental restrictions as well as changes in the expected recovery associated with infill drilling. Decreases in prices, for example, may cause a reduction in some proved reserves due to reaching economic limits at an earlier projected date. A material adverse change in the estimated volume of proved reserves could have a negative impact on DD&A and could result in property impairments.
The most significant ongoing financial statement effect from a change in Occidental’s oil and gas reserves or impairment of its proved properties would be to the DD&A rate. For example, a 5% increase or decrease in the amount of oil and gas reserves would change the DD&A rate by approximately $0.65/Bbl, which would increase or decrease pre-tax income by approximately $275 million annually at current production rates.
| | | | | | | | |
| | MANAGEMENT’S DISCUSSION AND ANALYSIS |
FAIR VALUES
Occidental estimates fair-value of long-lived assets for impairment testing, assets and liabilities acquired in a business combination or exchanged in non-monetary transactions, pension plan assets and initial measurements of AROs.
Accounting for the acquisition of a business requires the allocation of the purchase price to the various assets and liabilities of the acquired business and recording deferred taxes for any differences between the allocated values and tax basis of assets and liabilities. Any excess of the purchase price over the amounts assigned to assets and liabilities is recorded as goodwill. The purchase price allocation is accomplished by recording each asset and liability at its estimated fair value.
Occidental primarily applies the market approach for recurring fair value measurements, maximizes its use of observable inputs and minimizes its use of unobservable inputs. When estimating the fair values of assets acquired and liabilities assumed, Occidental must apply various assumptions.
FINANCIAL ASSETS AND LIABILITIES
Occidental utilizes published prices or counterparty statements for valuing the majority of its financial assets and liabilities measured and reported at fair value. In addition to using market data, Occidental makes assumptions in valuing its assets and liabilities, including assumptions about the risks inherent in the inputs to the valuation technique. For financial assets and liabilities carried at fair value, Occidental measures fair value using the following methods:
■Occidental values exchange-cleared commodity derivatives using closing prices provided by the exchange as of the balance sheet date. These derivatives are classified as using quoted prices in active markets for the assets or liabilities (Level 1).
■Over-the-Counter (OTC) bilateral financial commodity contracts, international exchange contracts, options and physical commodity forward purchase and sale contracts are generally classified as using observable inputs other than quoted prices for the assets or liabilities (Level 2) and are generally valued using quotations provided by brokers or industry-standard models that consider various inputs, including quoted forward prices for commodities, time value, volatility factors, credit risk and current market and contractual prices for the underlying instruments, as well as other relevant economic measures. Substantially all of these inputs are observable in the marketplace throughout the full term of the instrument and can be derived from observable data or are supported by observable prices at which transactions are executed in the marketplace.
■Occidental values commodity derivatives based on a market approach that considers various assumptions, including quoted forward commodity prices and market yield curves. The assumptions used include inputs that are generally unobservable in the marketplace or are observable but have been adjusted based upon various assumptions and the fair value is designated as using unobservable inputs (Level 3) within the valuation hierarchy.
■Occidental values debt using market-observable information for debt instruments that are traded on secondary markets. For debt instruments that are not traded, the fair value is determined by interpolating the value based on debt with similar terms and credit risk.
NON-FINANCIAL ASSETS
Occidental uses market-observable prices for assets when comparable transactions can be identified that are similar to the asset being valued. When Occidental is required to measure fair value and there is not a market-observable price for the asset or for a similar asset then the cost or income approach is used depending on the quality of information available to support management’s assumptions. The cost approach is based on management’s best estimate of the current asset replacement cost. The income approach is based on management’s best assumptions regarding expectations of future net cash flows and the expected cash flows are discounted using a commensurate risk-adjusted discount rate. Such evaluations involve significant judgment. The results are based on expected future events or conditions such as sales prices, estimates of future oil and gas production or throughput, development and operating costs and the timing thereof, economic and regulatory climates and other factors, most of which are often outside of management’s control. However, assumptions used reflect a market participant’s view of long-term prices, costs and other factors and are consistent with assumptions used in Occidental’s business plans and investment decisions.
ENVIRONMENTAL LIABILITIES AND EXPENDITURES
Environmental expenditures that relate to current operations are expensed or capitalized as appropriate. Occidental records environmental liabilities and related charges and expenses for estimated remediation costs that relate to existing conditions from past operations when environmental remediation efforts are probable and the costs can be reasonably estimated. In determining the environmental remediation liability and the range of reasonably possible additional losses, Occidental refers to currently available information, including relevant past experience, remedial objectives, available technologies, applicable laws and regulations and cost-sharing arrangements. Occidental bases its environmental remediation liabilities on management’s estimate of the most likely cost to be incurred, using the most cost-effective technology reasonably expected to achieve the remedial objective. Occidental periodically reviews its environmental remediation liabilities and adjusts them as new information becomes available. Occidental generally records reimbursements or recoveries of environmental remediation costs in income when received, or when receipt of recovery is
| | | | | | | | |
| | MANAGEMENT’S DISCUSSION AND ANALYSIS |
highly probable.
Many factors could affect Occidental’s future remediation costs and result in adjustments to its environmental remediation liabilities and the range of reasonably possible additional losses. The most significant are: (1) cost estimates for remedial activities may vary from the initial estimate; (2) the length of time, type or amount of remediation necessary to achieve the remedial objective may change due to factors such as site conditions, the ability to identify and control contaminant sources or the discovery of additional contamination; (3) a regulatory agency may ultimately reject or modify Occidental’s proposed remedial plan; (4) improved or alternative remediation technologies may change remediation costs; (5) laws and regulations may change remediation requirements or affect cost sharing or allocation of liability; and (6) changes in allocation or cost-sharing arrangements may occur.
Certain sites involve multiple parties with various cost-sharing arrangements, which fall into the following three categories: (1) environmental proceedings that result in a negotiated or prescribed allocation of remediation costs among Occidental and other alleged potentially responsible parties; (2) oil and gas ventures in which each participant pays its proportionate share of remediation costs reflecting its working interest; or (3) contractual arrangements, typically relating to purchases and sales of properties, in which the parties to the transaction agree to methods of allocating remediation costs. In these circumstances, Occidental evaluates the financial viability of other parties with whom it is alleged to be jointly liable, the degree of their commitment to participate and the consequences to Occidental of their failure to participate when estimating Occidental’s ultimate share of liability. Occidental records its environmental remediation liabilities at its expected net cost of remedial activities and, based on these factors, believes that it will not be required to assume a share of liability of such other potentially responsible parties in an amount materially above amounts reserved.
In addition to the costs of investigations and cleanup measures, which often take in excess of 10 years at CERCLA NPL sites, Occidental’s environmental remediation liabilities include management’s estimates of the costs to operate and maintain remedial systems. If remedial systems are modified over time in response to significant changes in site-specific data, laws, regulations, technologies or engineering estimates, Occidental reviews and adjusts its environmental remediation liabilities accordingly.
If Occidental were to adjust the balance of its environmental remediation liabilities based on the factors described above, the amount of the increase or decrease would be recognized in earnings. For example, if the balance were reduced by 10%, Occidental would record a pre-tax gain of $110 million. If the balance were increased by 10%, Occidental would record an additional remediation expense of $110 million.
INCOME TAXES
Occidental files various U.S. federal, state and foreign income tax returns. The impact of changes in tax regulations are reflected when enacted. In general, deferred federal, state and foreign income taxes are provided on temporary differences between the financial statement carrying amounts of assets and liabilities and their respective tax basis. Occidental routinely assesses the realizability of its deferred tax assets. If Occidental concludes that it is more likely than not that some of the deferred tax assets will not be realized, the tax asset is reduced by a valuation allowance. Occidental recognizes a tax benefit from an uncertain tax position when it is more likely than not that the position will be sustained upon examination, based on the technical merits of the position. The tax benefit recorded is equal to the largest amount that is greater than 50% likely to be realized through final settlement with a taxing authority. Interest and penalties related to unrecognized tax benefits are recognized in income tax expense (benefit). See Note 10 - Income Taxes in the Notes to Consolidated Financial Statements in Part II Item 8 of this Form 10-K.
LOSS CONTINGENCIES
Occidental is involved, in the normal course of business, in lawsuits, claims and other legal proceedings and audits. Occidental accrues reserves for these matters when it is probable that a liability has been incurred and the liability can be reasonably estimated. In addition, Occidental discloses, in aggregate, its exposure to loss in excess of the amount recorded on the balance sheet for these matters if it is reasonably possible that an additional material loss may be incurred. Occidental reviews its loss contingencies on an ongoing basis.
Loss contingencies are based on judgments made by management with respect to the likely outcome of these matters and are adjusted as appropriate. Management’s judgments could change based on new information, changes in, or interpretations of, laws or regulations, changes in management’s plans or intentions, opinions regarding the outcome of legal proceedings or other factors. See Note 13 - Lawsuits, Claims, Commitments and Contingencies in the Notes to Consolidated Financial Statements in Part II Item 8 of this Form 10-K for additional information.
| | | | | | | | |
| | MANAGEMENT’S DISCUSSION AND ANALYSIS |
| | |
| SAFE HARBOR DISCUSSION REGARDING OUTLOOK AND OTHER FORWARD-LOOKING DATA |
Portions of this report contain forward-looking statements within the meaning of Section 27A of the Securities Act of 1933, as amended, and Section 21E of the Securities Exchange Act of 1934, as amended. All statements other than statements of historical fact are “forward-looking statements” for purposes of federal and state securities laws, and they include, but are not limited to: any projections of earnings, revenue or other financial items or future financial position or sources of financing; any statements of the plans, strategies and objectives of management for future operations or business strategy; any statements regarding future economic conditions or performance; any statements of belief; and any statements of assumptions underlying any of the foregoing. Words such as “estimate,” “project,” “predict,” “will,” “would,” “should,” “could,” “may,” “might,” “anticipate,” “plan,” “intend,” “believe,” “expect,” “aim,” “goal,” “target,” “objective,” "commit," "advance," “likely” or similar expressions that convey the prospective nature of events or outcomes are generally indicative of forward-looking statements. You should not place undue reliance on these forward-looking statements, which speak only as of the date of this report. Unless legally required, Occidental does not undertake any obligation to update, modify or withdraw any forward-looking statements as a result of new information, future events or otherwise.
Although Occidental believes that the expectations reflected in any of its forward-looking statements are reasonable, actual results may differ from anticipated results, sometimes materially. In addition, historical, current and forward-looking sustainability-related statements may be based on standards for measuring progress that are still developing, internal controls and processes that continue to evolve and assumptions that are subject to change in the future. Factors that could cause results to differ from those projected or assumed in any forward-looking statement include, but are not limited to: the scope and duration of the COVID-19 pandemic and ongoing actions taken by governmental authorities and other third parties in response to the pandemic; Occidental’s indebtedness and other payment obligations, including the need to generate sufficient cash flows to fund operations; Occidental’s ability to successfully monetize select assets and repay or refinance debt and the impact of changes in Occidental’s credit ratings; assumptions about energy markets; global and local commodity and commodity-futures pricing fluctuations; supply and demand considerations for, and the prices of, Occidental’s products and services; actions by OPEC and non-OPEC oil producing countries; results from operations and competitive conditions; future impairments of our proved and unproved oil and gas properties or equity investments, or write-downs of productive assets, causing charges to earnings; unexpected changes in costs; availability of capital resources, levels of capital expenditures and contractual obligations; the regulatory approval environment, including Occidental's ability to timely obtain or maintain permits or other governmental approvals, including those necessary for drilling and/or development projects; Occidental's ability to successfully complete, or any material delay of, field developments, expansion projects, capital expenditures, efficiency projects, acquisitions or dispositions; risks associated with acquisitions, mergers and joint ventures, such as difficulties integrating businesses, uncertainty associated with financial projections, projected synergies, restructuring, increased costs and adverse tax consequences; uncertainties and liabilities associated with acquired and divested properties and businesses; uncertainties about the estimated quantities of oil, NGL and natural gas reserves; lower-than-expected production from development projects or acquisitions; Occidental’s ability to realize the anticipated benefits from prior or future streamlining actions to reduce fixed costs, simplify or improve processes and improve Occidental’s competitiveness; exploration, drilling and other operational risks; disruptions to, capacity constraints in, or other limitations on the pipeline systems that deliver Occidental’s oil and natural gas and other processing and transportation considerations; general economic conditions, including slowdowns, domestically or internationally, and volatility in the securities, capital or credit markets; inflation; governmental actions, war and political conditions and events; legislative or regulatory changes, including changes relating to hydraulic fracturing or other oil and natural gas operations, retroactive royalty or production tax regimes, deep-water and onshore drilling and permitting regulations and environmental regulation (including regulations related to climate change); environmental risks and liability under federal, regional, state, provincial, tribal, local and international environmental laws and regulations (including remedial actions); Occidental's ability to recognize intended benefits from its business strategies and initiatives, such as OLCV or announced GHG emissions reduction targets or net-zero goals; potential liability resulting from pending or future litigation; disruption or interruption of production or manufacturing or facility damage due to accidents, chemical releases, labor unrest, weather, power outages, natural disasters, cyber-attacks or insurgent activity; the creditworthiness and performance of Occidental's counterparties, including financial institutions, operating partners and other parties; failure of risk management; Occidental’s ability to retain and hire key personnel; supply, transportation, and labor constraints; reorganization or restructuring of Occidental’s operations; changes in state, federal or international tax rates; and actions by third parties that are beyond Occidental's control.
Additional information concerning these and other factors that may cause Occidental’s results of operations and financial position to differ from expectations can be found in Item 1A, “Risk Factors” and elsewhere in this Form 10-K, as well as in Occidental’s other filings with the SEC, including Occidental’s Quarterly Reports on Form 10-Q and Current Reports on Form 8-K.
| | | | | | | | |
| | QUANTITATIVE AND QUALITATIVE DISCLOSURES |
ITEM 7A. QUANTITATIVE AND QUALITATIVE DISCLOSURES ABOUT MARKET RISK
GENERAL
Occidental’s results are sensitive to fluctuations in oil, NGL and natural gas prices. Price changes at current global prices and levels of production affect Occidental’s budgeted 2022 pre-tax annual income by approximately $200 million for a $1 per barrel change in oil prices and approximately $30 million for a $1 per barrel change in NGL prices. If domestic natural gas prices varied by $0.10 per Mcf, it would have an estimated annual effect on Occidental’s budgeted 2022 pre-tax income of approximately $40 million. These price-change sensitivities include the impact of PSC and similar contract volume changes on income. If production levels change in the future, the sensitivity of Occidental’s results to prices also will change. Marketing results are sensitive to price changes of oil, natural gas and, to a lesser degree, other commodities. A $0.25 change in the Midland-to-Gulf-Coast oil spreads impacts budgeted 2022 operating cash flows by approximately $65 million.
Occidental’s results are also sensitive to fluctuations in chemical prices. A variation in chlorine and caustic soda prices of $10 per ton would have a pre-tax annual effect on income of approximately $10 million and $30 million, respectively. A variation in PVC prices of $0.01 per lb. would have a pre-tax annual effect on income of approximately $30 million. Historically, over time, product price changes have tracked raw material and feedstock product price changes, somewhat mitigating the effect of price changes on margins.
Occidental uses forwards derivative instruments to manage its exposure to commodity price fluctuations for oil and natural gas and swaps to manage interest rate risks.
RISK MANAGEMENT
Occidental conducts its risk management activities for marketing and trading under the controls and governance of its risk control policies. The controls under these policies are implemented and enforced by a risk management group which monitors risk by providing an independent and separate evaluation and check. Members of the risk management group report to the Corporate Vice President and Treasurer. Controls for these activities include limits on value at risk, limits on credit, limits on total notional trade value, segregation of duties, delegation of authority, daily price verifications, reporting to senior management on various risk measures and a number of other policy and procedural controls.
FAIR VALUE OF MARKETING DERIVATIVE CONTRACTS
Occidental carries derivative contracts it enters into in connection with its marketing activities at fair value. Fair values for these contracts are derived from Level 1 and Level 2 sources. The fair values in future maturity periods are insignificant.
The following table shows the fair value of Occidental’s derivatives (excluding collateral), segregated by maturity periods and by methodology of fair value estimation:
| | | | | | | | | | | | | | | | | | | | | | | | | | | | | | | | |
| | Maturity Periods | | |
Source of Fair Value Assets (Liabilities) millions | | 2022 | | 2023 and 2024 | | 2025 and 2026 | | 2027 and thereafter | | Total |
Prices actively quoted | | $ | (91) | | | $ | — | | | $ | — | | | $ | — | | | $ | (91) | |
Prices provided by other external sources | | (23) | | | — | | | — | | | — | | | (23) | |
| Total | | $ | (114) | | | $ | — | | | $ | — | | | $ | — | | | $ | (114) | |
QUANTITATIVE INFORMATION
Occidental uses value at risk to estimate the potential effects of changes in fair values of commodity contracts used in trading activities. This measure determines the maximum potential negative one day change in fair value with a 95% level of confidence. Additionally, Occidental uses complementary trading limits including position and tenor limits and maintains liquid positions as a result of which market risk typically can be neutralized or mitigated on short notice. As a result of these controls, Occidental believes that the market risk of its trading activities is not reasonably likely to have a material adverse effect on its performance.
| | | | | | | | |
| | QUANTITATIVE AND QUALITATIVE DISCLOSURES |
GENERAL
Occidental pays fixed interest rates and receives a floating interest rate indexed to three-month LIBOR on its interest rate swaps. The remaining swaps have mandatory termination dates in September 2022 and 2023 with notional amounts of $275 million and $450 million, respectively, as of December 31, 2021. As of December 31, 2021, Occidental had a net liability of approximately $428 million based on the fair value of the swaps of negative $751 million netted against $323 million in posted cash collateral. A 25-basis point decrease in implied LIBOR rates over the term of the swaps would result in an additional liability of approximately $88 million on these swaps.
As of December 31, 2021, Occidental had variable rate debt with a notional value of $68 million outstanding. A 25-basis point increase in LIBOR interest rates would increase gross interest expense approximately $1.7 million per year.
As of December 31, 2021, Occidental had fixed rate debt with a fair value of $31.1 billion outstanding. A 25-basis point change in Treasury rates would change the fair value of the fixed rate debt approximately $629 million.
The table below provides information about Occidental’s long-term debt obligations. Debt amounts represent principal payments by maturity date.
| | | | | | | | | | | | | | | | | | | | |
| millions except percentages | | U.S. Dollar
Fixed-Rate Debt | | U.S. Dollar
Variable-Rate Debt | | Total (a) |
2022 (b) | | $ | 101 | | | $ | — | | | $ | 101 | |
| 2023 | | 465 | | | — | | | 465 | |
| 2024 | | 1,725 | | | — | | | 1,725 | |
| 2025 | | 2,476 | | | — | | | 2,476 | |
| 2026 | | 2,788 | | | — | | | 2,788 | |
| Thereafter | | 20,870 | | | 68 | | | 20,938 | |
| Total | | $ | 28,425 | | | $ | 68 | | | $ | 28,493 | |
| Weighted-average interest rate | | 5.10% | | 0.90 | % | | 5.09% |
| Fair Value | | $ | 31,075 | | | $ | 68 | | | $ | 31,143 | |
(a)Excluded net unamortized debt premiums of $670 million and debt issuance costs of $135 million.
(b)In January 2022, Occidental used cash on hand to repay $101 million in outstanding 2.600% senior notes due April 2022 at face value.
Occidental’s international operations have limited currency risk. Occidental manages its exposure primarily by balancing monetary assets and liabilities and limiting cash positions in foreign currencies to levels necessary for operating purposes. A vast majority of international oil sales are denominated in United States dollars. Additionally, all of Occidental’s consolidated international oil and gas subsidiaries have the United States dollar as the functional currency. The effect of exchange rates on transactions in foreign currencies is included in periodic income.
The majority of Occidental’s counterparty credit risk is related to the physical delivery of energy commodities to its customers and any inability of these customers to meet their settlement commitments. Occidental manages credit risk by selecting counterparties that it believes to be financially strong, by entering into netting arrangements with counterparties and by requiring collateral or other credit risk mitigants, as appropriate. Occidental actively evaluates the creditworthiness of its counterparties, assigns appropriate credit limits and monitors credit exposures against those assigned limits. Occidental also enters into futures contracts through regulated exchanges with select clearinghouses and brokers, which are subject to minimal credit risk, if any.
Certain OTC derivative instruments contain credit-risk-contingent features, primarily tied to credit ratings for Occidental or its counterparties, which may affect the amount of collateral that each party would need to post. The fair value of derivative instruments with credit-risk-contingent features, that were net liabilities as of December 31, 2021 was $107 million (net of $323 million collateral) and $104 million (net of $374 million collateral) as of December 31, 2020. Credit-risk-contingent features are primarily related to interest rate swaps.
As of December 31, 2021, the substantial majority of the credit exposures were with investment grade counterparties. Occidental believes its exposure to credit-related losses as of December 31, 2021, was not material and losses associated with credit risk have been insignificant for all years presented.
| | | | | | | | |
| | FINANCIAL STATEMENTS INDEX |
ITEM 8. FINANCIAL STATEMENTS AND SUPPLEMENTARY DATA
| | | | | |
| INDEX TO CONSOLIDATED FINANCIAL STATEMENTS | PAGE |
| |
| |
| |
| |
| |
| |
| |
| |
| |
| |
| |
| |
| |
| |
| |
| |
| |
| |
| |
| |
| |
| |
| |
| |
| |
| |
| |
| | | | | | | | |
| | FINANCIAL STATEMENTS REPORT |
Report of Independent Registered Public Accounting Firm
To the Stockholders and Board of Directors
Occidental Petroleum Corporation:
Opinion on the Consolidated Financial Statements
We have audited the accompanying consolidated balance sheets of Occidental Petroleum Corporation and subsidiaries (the Company) as of December 31, 2021 and 2020, the related consolidated statements of operations, comprehensive income (loss), stockholders’ equity, and cash flows for each of the years in the three‑year period ended December 31, 2021, and the related notes and financial statement schedule II – valuation and qualifying accounts (collectively, the consolidated financial statements). In our opinion, the consolidated financial statements present fairly, in all material respects, the financial position of the Company as of December 31, 2021 and 2020, and the results of its operations and its cash flows for each of the years in the three‑year period ended December 31, 2021, in conformity with U.S. generally accepted accounting principles.
We also have audited, in accordance with the standards of the Public Company Accounting Oversight Board (United States) (PCAOB), the Company’s internal control over financial reporting as of December 31, 2021, based on criteria established in Internal Control – Integrated Framework (2013) issued by the Committee of Sponsoring Organizations of the Treadway Commission, and our report dated February 24, 2022 expressed an unqualified opinion on the effectiveness of the Company’s internal control over financial reporting.
Basis for Opinion
These consolidated financial statements are the responsibility of the Company’s management. Our responsibility is to express an opinion on these consolidated financial statements based on our audits. We are a public accounting firm registered with the PCAOB and are required to be independent with respect to the Company in accordance with the U.S. federal securities laws and the applicable rules and regulations of the Securities and Exchange Commission and the PCAOB.
We conducted our audits in accordance with the standards of the PCAOB. Those standards require that we plan and perform the audit to obtain reasonable assurance about whether the consolidated financial statements are free of material misstatement, whether due to error or fraud. Our audits included performing procedures to assess the risks of material misstatement of the consolidated financial statements, whether due to error or fraud, and performing procedures that respond to those risks. Such procedures included examining, on a test basis, evidence regarding the amounts and disclosures in the consolidated financial statements. Our audits also included evaluating the accounting principles used and significant estimates made by management, as well as evaluating the overall presentation of the consolidated financial statements. We believe that our audits provide a reasonable basis for our opinion.
Critical Audit Matters
The critical audit matters communicated below are matters arising from the current period audit of the consolidated financial statements that were communicated or required to be communicated to the audit committee and that: (1) relate to accounts or disclosures that are material to the consolidated financial statements and (2) involved our especially challenging, subjective, or complex judgments. The communication of critical audit matters does not alter in any way our opinion on the consolidated financial statements, taken as a whole, and we are not, by communicating the critical audit matters below, providing separate opinions on the critical audit matters or on the accounts or disclosures to which they relate.
Evaluation of the environmental liability associated with the lower 8.3 miles of the Lower Passaic River site
As discussed in Notes 1 and 12 to the consolidated financial statements, the Company accrues a liability for estimated environmental remedial activities when it is probable a liability has been incurred and the amount of remediation costs can be estimated. The Company accrued a liability related to its estimated allocable share of the costs to perform the remedial activities required for the lower 8.3 miles of the Lower Passaic River site. As of December 31, 2021, the Company’s total estimated environmental liabilities were $1.1 billion, which includes the estimated environmental liability for the lower 8.3 miles of the Lower Passaic River site.
We identified the evaluation of the environmental liability associated with the lower 8.3 miles of the Lower Passaic River site as a critical audit matter. There was a high degree of subjective auditor judgment in applying and evaluating the results of our procedures. This is due to (1) possible changes to expected remedial activities to implement the proposed clean-up plan outlined in the Record of Decision (ROD) issued by the Environmental Protection Agency (EPA) and their estimated costs, and (2) possible changes to the Company’s estimated share of the remediation costs.
| | | | | | | | |
| | FINANCIAL STATEMENTS REPORT |
The following are the primary procedures we performed to address this critical audit matter. We evaluated the design and tested the operating effectiveness of certain internal controls over the Company’s environmental liability process to estimate the cost of remedial activities and estimate the Company’s allocable share of the remediation costs. We evaluated the remedial activities and related cost assumptions used by the Company by comparing them against remedial activities and cost estimates provided by the EPA in the ROD. We compared certain design documentation provided by the Company to the EPA in order to identify potential differences between the design plan and the ROD and assessed the impact of any such differences on the remediation cost assumptions used by the Company to estimate the liability. We assessed the Company’s assumption for its allocable share of the remediation costs and analyzed publicly available data sources for information that might be contrary to the information used by the Company. We involved an environmental analysis professional with specialized skills and knowledge who assisted in reading correspondence between the Company and the EPA related to the design phase for this site to assess the Company’s remediation cost assumptions.
Assessment of the estimated proved oil and gas reserves on the determination of depreciation and depletion expense related to proved oil and gas properties
As discussed in Note 1 to the consolidated financial statements, the Company determines depreciation and depletion of oil and gas producing properties by the unit-of-production method. Under this method, capitalized costs are amortized over estimated proved reserves. For the year ended December 31, 2021, the Company recorded depreciation and depletion expense related to proved oil and gas properties of $7.7 billion.
We identified the assessment of the estimated proved oil and gas reserves on the determination of depreciation and depletion expense related to proved oil and gas properties as a critical audit matter. Complex auditor judgment was required to assess the Company’s estimate of proved oil and gas reserves, which is a key input for the determination of depreciation and depletion expense. Estimating proved oil and gas reserves requires the expertise of professional petroleum reservoir engineers. The key assumptions included (1) commodity prices, inclusive of market differentials, (2) estimated future production quantities, and (3) estimated operating and capital costs.
The following are the primary procedures we performed to address this critical audit matter. We evaluated the design and tested the operating effectiveness of certain internal controls over the Company’s depreciation and depletion process, including the estimation of proved oil and gas reserves. We analyzed and assessed the determination of depreciation and depletion expense for compliance with industry and regulatory standards. We assessed compliance of the methodology used by the Company’s engineering and technical staff to estimate proved oil and gas reserves with industry and regulatory standards. We read the findings of the independent reservoir engineering specialist’s review of the methods and procedures used by the Company in estimating the proved reserves for compliance with industry and regulatory standards. We assessed the commodity prices, including relevant market differentials, used by the Company’s engineering and technical staff by comparing them to publicly available prices, adjusted for historical market differentials. To assess the Company’s ability to accurately estimate future production quantities, we compared the future production quantity assumptions used by the Company in prior periods to the actual production amounts. We compared the estimated future production quantities used by the Company in the current period to historical production rates. We evaluated the operating and capital cost assumptions used by the Company’s engineering and technical staff by comparing them to historical costs. We evaluated the professional qualifications and the knowledge, skills, and ability of the Company’s internal reserve engineers and the independent reservoir engineering specialists engaged by the Company.
/s/ KPMG LLP
We have served as the Company’s auditor since 2002.
Houston, Texas
February 24, 2022
| | | | | | | | |
| | FINANCIAL STATEMENTS REPORT |
Report of Independent Registered Public Accounting Firm
To the Stockholders and Board of Directors
Occidental Petroleum Corporation:
Opinion on Internal Control Over Financial Reporting
We have audited Occidental Petroleum Corporation and subsidiaries’ (the Company) internal control over financial reporting as of December 31, 2021, based on criteria established in Internal Control – Integrated Framework (2013) issued by the Committee of Sponsoring Organizations of the Treadway Commission. In our opinion, the Company maintained, in all material respects, effective internal control over financial reporting as of December 31, 2021, based on criteria established in Internal Control – Integrated Framework (2013) issued by the Committee of Sponsoring Organizations of the Treadway Commission.
We also have audited, in accordance with the standards of the Public Company Accounting Oversight Board (United States) (PCAOB), the consolidated balance sheets of the Company as of December 31, 2021 and 2020, the related consolidated statements of operations, comprehensive income (loss), stockholders’ equity, and cash flows for each of the years in the three-year period ended December 31, 2021, and the related notes and financial statement schedule II – valuation and qualifying accounts (collectively, the consolidated financial statements), and our report dated February 24, 2022 expressed an unqualified opinion on those consolidated financial statements.
Basis for Opinion
The Company’s management is responsible for maintaining effective internal control over financial reporting and for its assessment of the effectiveness of internal control over financial reporting, included in the accompanying Management’s Annual Assessment of and Report on Internal Control over Financial Reporting. Our responsibility is to express an opinion on the Company’s internal control over financial reporting based on our audit. We are a public accounting firm registered with the PCAOB and are required to be independent with respect to the Company in accordance with the U.S. federal securities laws and the applicable rules and regulations of the Securities and Exchange Commission and the PCAOB.
We conducted our audit in accordance with the standards of the PCAOB. Those standards require that we plan and perform the audit to obtain reasonable assurance about whether effective internal control over financial reporting was maintained in all material respects. Our audit of internal control over financial reporting included obtaining an understanding of internal control over financial reporting, assessing the risk that a material weakness exists, and testing and evaluating the design and operating effectiveness of internal control based on the assessed risk. Our audit also included performing such other procedures as we considered necessary in the circumstances. We believe that our audit provides a reasonable basis for our opinion.
Definition and Limitations of Internal Control Over Financial Reporting
A company’s internal control over financial reporting is a process designed to provide reasonable assurance regarding the reliability of financial reporting and the preparation of financial statements for external purposes in accordance with generally accepted accounting principles. A company’s internal control over financial reporting includes those policies and procedures that (1) pertain to the maintenance of records that, in reasonable detail, accurately and fairly reflect the transactions and dispositions of the assets of the company; (2) provide reasonable assurance that transactions are recorded as necessary to permit preparation of financial statements in accordance with generally accepted accounting principles, and that receipts and expenditures of the company are being made only in accordance with authorizations of management and directors of the company; and (3) provide reasonable assurance regarding prevention or timely detection of unauthorized acquisition, use, or disposition of the company’s assets that could have a material effect on the financial statements.
Because of its inherent limitations, internal control over financial reporting may not prevent or detect misstatements. Also, projections of any evaluation of effectiveness to future periods are subject to the risk that controls may become inadequate because of changes in conditions, or that the degree of compliance with the policies or procedures may deteriorate.
/s/ KPMG LLP
Houston, Texas
February 24, 2022
| | | | | |
| Consolidated Balance Sheets | Occidental Petroleum Corporation
and Subsidiaries |
| | | | | | | | | | | | | | |
| | December 31, |
| millions | | 2021 | | 2020 |
| ASSETS | | | | |
| CURRENT ASSETS | | | | |
| Cash and cash equivalents | | $ | 2,764 | | | $ | 2,008 | |
| Restricted cash and restricted cash equivalents | | 24 | | | 170 | |
Trade receivables, net of reserves of $35 in 2021 and $24 in 2020 | | 4,208 | | | 2,115 | |
| Inventories | | 1,846 | | | 1,898 | |
| Assets held for sale | | 72 | | | 1,433 | |
| Other current assets | | 1,297 | | | 1,195 | |
| Total current assets | | 10,211 | | | 8,819 | |
| | | | |
| INVESTMENTS IN UNCONSOLIDATED ENTITIES | | 2,938 | | | 3,250 | |
| | | | |
| PROPERTY, PLANT AND EQUIPMENT | | | | |
| Oil and gas | | 101,251 | | | 102,454 | |
| Chemical | | 7,571 | | | 7,356 | |
| Midstream and marketing | | 8,371 | | | 8,232 | |
| Corporate | | 964 | | | 922 | |
| | 118,157 | | | 118,964 | |
| Accumulated depreciation, depletion and amortization | | (58,227) | | | (53,075) | |
| Total property, plant and equipment, net | | 59,930 | | | 65,889 | |
| | | | |
| OPERATING LEASE ASSETS | | 726 | | | 1,062 | |
| | | | |
| LONG-TERM RECEIVABLES AND OTHER ASSETS, NET | | 1,231 | | | 1,044 | |
| | | | |
| TOTAL ASSETS | | $ | 75,036 | | | $ | 80,064 | |
The accompanying notes are an integral part of these consolidated financial statements.
| | | | | |
| Consolidated Balance Sheets | Occidental Petroleum Corporation
and Subsidiaries |
| | | | | | | | | | | | | | |
| | December 31, |
| millions except share and per-share amounts | | 2021 | | 2020 |
| LIABILITIES AND EQUITY | | | | |
| CURRENT LIABILITIES | | | | |
Current maturities of long-term debt (a) | | $ | 186 | | | $ | 440 | |
| Current operating lease liabilities | | 186 | | | 473 | |
| Accounts payable | | 3,899 | | | 2,987 | |
| Accrued liabilities | | 4,046 | | | 3,570 | |
| Liabilities of assets held for sale | | 7 | | | 753 | |
| Total current liabilities | | 8,324 | | | 8,223 | |
| | | | |
| LONG-TERM DEBT, NET | | | | |
Long-term debt, net (b) | | 29,431 | | | 35,745 | |
| | | | |
| DEFERRED CREDITS AND OTHER LIABILITIES | | | | |
| Deferred income taxes, net | | 7,039 | | | 7,113 | |
| Asset retirement obligations | | 3,687 | | | 3,977 | |
| Pension and postretirement obligations | | 1,540 | | | 1,763 | |
| Environmental remediation liabilities | | 944 | | | 1,028 | |
| Operating lease liabilities | | 585 | | | 641 | |
| Other | | 3,159 | | | 3,001 | |
| Total deferred credits and other liabilities | | 16,954 | | | 17,523 | |
| | | | |
| EQUITY | | | | |
Preferred stock, at $1.00 per share par value (100,000 shares as of December 31, 2021 and 2020) | | 9,762 | | | 9,762 | |
Common stock, $0.20 per share par value, authorized shares: 1.5 billion, issued shares: 2021 — 1,083,423,094 and 2020 — 1,080,564,947 | | 217 | | | 216 | |
Treasury stock: 2021 — 149,348,394 shares and 2020 — 149,051,634 shares | | (10,673) | | | (10,665) | |
| Additional paid-in capital | | 16,749 | | | 16,552 | |
| Retained earnings | | 4,480 | | | 2,996 | |
| Accumulated other comprehensive loss | | (208) | | | (288) | |
| Total stockholders’ equity | | 20,327 | | | 18,573 | |
| | | | |
TOTAL LIABILITIES AND STOCKHOLDERS’ EQUITY | | $ | 75,036 | | | $ | 80,064 | |
(a)Included $85 million and $42 million of current finance lease liabilities as of December 31, 2021, and 2020, respectively.
(b)Included $504 million and $316 million of finance lease liabilities as of December 31, 2021, and 2020, respectively.
The accompanying notes are an integral part of these consolidated financial statements.
| | | | | |
| Consolidated Statements of Operations | Occidental Petroleum Corporation
and Subsidiaries |
| | | | | | | | | | | | | | | | | | | | |
| | Years Ended December 31, |
| millions except per-share amounts | | 2021 | | 2020 | | 2019 |
| REVENUES AND OTHER INCOME | | | | | | |
| Net sales | | $ | 25,956 | | | $ | 17,809 | | | $ | 20,911 | |
| Interest, dividends and other income | | 166 | | | 118 | | | 217 | |
| Gains (losses) on sale of assets, net | | 192 | | | (1,666) | | | 622 | |
| Total | | 26,314 | | | 16,261 | | | 21,750 | |
| | | | | | |
| COSTS AND OTHER DEDUCTIONS | | | | | | |
| Oil and gas operating expense | | 3,160 | | | 3,065 | | | 3,282 | |
| Transportation and gathering expense | | 1,419 | | | 1,600 | | | 635 | |
| Chemical and midstream cost of sales | | 2,772 | | | 2,408 | | | 2,791 | |
| Purchased commodities | | 2,308 | | | 1,395 | | | 1,679 | |
| Selling, general and administrative | | 863 | | | 864 | | | 893 | |
| Other operating and non-operating expense | | 1,065 | | | 884 | | | 1,421 | |
| Depreciation, depletion and amortization | | 8,447 | | | 8,097 | | | 6,140 | |
| Asset impairments and other charges | | 304 | | | 11,083 | | | 1,361 | |
| Taxes other than on income | | 1,005 | | | 622 | | | 840 | |
| Anadarko Acquisition-related costs | | 153 | | | 339 | | | 1,647 | |
| Exploration expense | | 252 | | | 132 | | | 247 | |
| Interest and debt expense, net | | 1,614 | | | 1,424 | | | 1,066 | |
| Total | | 23,362 | | | 31,913 | | | 22,002 | |
| Income (loss) before income taxes and other items | | 2,952 | | | (15,652) | | | (252) | |
| OTHER ITEMS | | | | | | |
| Gains (losses) on interest rate swaps and warrants, net | | 122 | | | (423) | | | 233 | |
| Income from equity investments | | 631 | | | 370 | | | 373 | |
| Total | | 753 | | | (53) | | | 606 | |
| Income (loss) from continuing operations before income taxes | | 3,705 | | | (15,705) | | | 354 | |
| Income tax benefit (expense) | | (915) | | | 2,172 | | | (861) | |
| Income (loss) from continuing operations | | 2,790 | | | (13,533) | | | (507) | |
| Loss from discontinued operations, net of tax | | (468) | | | (1,298) | | | (15) | |
| | | | | | |
| NET INCOME (LOSS) | | 2,322 | | | (14,831) | | | (522) | |
| Less: Net income attributable to noncontrolling interest | | — | | | — | | | (145) | |
| Less: Preferred stock dividends | | (800) | | | (844) | | | (318) | |
| NET INCOME (LOSS) ATTRIBUTABLE TO COMMON STOCKHOLDERS | | 1,522 | | | $ | (15,675) | | | $ | (985) | |
| | | | | | |
| PER COMMON SHARE | | | | | | |
| Income (loss) from continuing operations—basic | | $ | 2.12 | | | $ | (15.65) | | | $ | (1.20) | |
| Loss from discontinued operations—basic | | (0.50) | | | (1.41) | | | (0.02) | |
| Net income (loss) attributable to common stockholders—basic | | $ | 1.62 | | | $ | (17.06) | | | $ | (1.22) | |
| | | | | | |
| Income (loss) from continuing operations—diluted | | $ | 2.06 | | | $ | (15.65) | | | $ | (1.20) | |
| Loss from discontinued operations—diluted | | (0.48) | | | (1.41) | | | (0.02) | |
| Net income (loss) attributable to common stockholders—diluted | | $ | 1.58 | | | $ | (17.06) | | | $ | (1.22) | |
The accompanying notes are an integral part of these consolidated financial statements.
| | | | | |
Consolidated Statements of Comprehensive
Income (Loss) | Occidental Petroleum Corporation
and Subsidiaries |
| | | | | | | | | | | | | | | | | | | | |
| | Years Ended December 31, |
| millions | | 2021 | | 2020 | | 2019 |
| Net income (loss) | | $ | 2,322 | | | $ | (14,831) | | | $ | (522) | |
| Other comprehensive income (loss) items: | | | | | | |
| | | | | | |
Gains (losses) on derivatives (a) | | 14 | | | 4 | | | (127) | |
Pension and postretirement gains (losses) (b) | | 67 | | | (71) | | | 78 | |
| Other | | (1) | | | — | | | — | |
| Other comprehensive income (loss), net of tax | | 80 | | | (67) | | | (49) | |
| Comprehensive income (loss) | | 2,402 | | | (14,898) | | | (571) | |
| Less: Comprehensive income attributable to noncontrolling interests | | — | | | — | | | (145) | |
| Comprehensive income (loss) attributable to preferred and common stockholders | | $ | 2,402 | | | $ | (14,898) | | | $ | (716) | |
(a)Net of tax benefit (expense) of $(4), $(1) and $36 in 2021, 2020 and 2019, respectively.
(b)Net of tax benefit (expense) of $(18), $24 and $(25) in 2021, 2020 and 2019, respectively. See Note 11 - Retirement and Postretirement Benefit Plans in the Notes to Consolidated Financial Statements in Part II Item 8 of this Form 10-K for additional information.
The accompanying notes are an integral part of these consolidated financial statements.
| | | | | |
| Consolidated Statements of Stockholders’ Equity | Occidental Petroleum Corporation
and Subsidiaries |
| | | | | | | | | | | | | | | | | | | | | | | | | | | | | | | | | | | | | | | | | | | | | | | | | | |
| | | | Equity Attributable to Common Stock | | | | |
| | Preferred Stock | | Common Stock | | Treasury Stock | | Additional Paid-in Capital | | Retained Earnings | | Accumulated Other Comprehensive Income (Loss) | | Non-controlling Interests | | Total Equity |
| Balance, December 31, 2018 | | $ | — | | | $ | 179 | | | $ | (10,473) | | | $ | 8,046 | | | $ | 23,750 | | | $ | (172) | | | $ | — | | | $ | 21,330 | |
| Net income (loss) | | — | | | — | | | — | | | — | | | (667) | | | — | | | 145 | | | (522) | |
| Other comprehensive loss, net of tax | | — | | | — | | | — | | | — | | | — | | | (49) | | | — | | | (49) | |
Dividends on common stock, $3.14 per share | | — | | | — | | | — | | | — | | | (2,585) | | | — | | | — | | | (2,585) | |
Dividends on preferred stock, $3,489 per share | | — | | | — | | | — | | | — | | | (318) | | | — | | | — | | | (318) | |
| Issuance of common stock, net | | — | | | 30 | | | — | | | 6,909 | | | — | | | — | | | — | | | 6,939 | |
| Issuance of preferred stock | | 9,762 | | | — | | | — | | | — | | | — | | | — | | | — | | | 9,762 | |
| Purchases of treasury stock | | — | | | — | | | (180) | | | — | | | — | | | — | | | — | | | (180) | |
| Fair value of noncontrolling interest acquired | | — | | | — | | | — | | | — | | | — | | | — | | | 4,895 | | | 4,895 | |
| Noncontrolling interest distributions, net | | — | | | | | — | | | — | | | — | | | — | | | (131) | | | (131) | |
| Change in control WES | | — | | | — | | | — | | | — | | | — | | | — | | | (4,909) | | | (4,909) | |
| Balance, December 31, 2019 | | $ | 9,762 | | | $ | 209 | | | $ | (10,653) | | | $ | 14,955 | | | $ | 20,180 | | | $ | (221) | | | $ | — | | | $ | 34,232 | |
| Net loss | | — | | | — | | | — | | | — | | | (14,831) | | | — | | | — | | | (14,831) | |
| Other comprehensive loss, net of tax | | — | | | — | | | — | | | — | | | — | | | (67) | | | — | | | (67) | |
Dividends on common stock, $0.82 per share | | — | | | — | | | — | | | — | | | (746) | | | — | | | — | | | (746) | |
Dividends on preferred stock, $8,444 per share | | — | | | 6 | | | — | | | 438 | | | (844) | | | — | | | — | | | (400) | |
| Issuance of warrants on common stock | | — | | | — | | | — | | | 767 | | | (763) | | | — | | | — | | | 4 | |
| Berkshire Warrants | | — | | | — | | | — | | | 103 | | | — | | | — | | | — | | | 103 | |
| Issuance of common stock and other, net | | — | | | 1 | | | — | | | 289 | | | — | | | — | | | — | | | 290 | |
| Purchases of treasury stock | | — | | | — | | | (12) | | | — | | | — | | | — | | | — | | | (12) | |
| Balance, December 31, 2020 | | $ | 9,762 | | | $ | 216 | | | $ | (10,665) | | | $ | 16,552 | | | $ | 2,996 | | | $ | (288) | | | $ | — | | | $ | 18,573 | |
| Net income | | — | | | — | | | — | | | — | | | 2,322 | | | — | | | — | | | 2,322 | |
| Other comprehensive income, net of tax | | — | | | — | | | — | | | — | | | — | | | 80 | | | — | | | 80 | |
Dividends on common stock, $0.04 per share | | — | | | — | | | — | | | — | | | (38) | | | — | | | — | | | (38) | |
Dividends on preferred stock, $8,000 per share | | — | | | — | | | — | | | — | | | (800) | | | — | | | — | | | (800) | |
| Shareholder warrants exercised | | — | | | — | | | — | | | 7 | | | — | | | — | | | — | | | 7 | |
| | | | | | | | | | | | | | | | |
| Issuance of common stock and other, net | | — | | | 1 | | | — | | | 190 | | | — | | | — | | | — | | | 191 | |
| Purchases of treasury stock | | — | | | — | | | (8) | | | — | | | — | | | — | | | — | | | (8) | |
| Balance, December 31, 2021 | | $ | 9,762 | | | $ | 217 | | | $ | (10,673) | | | $ | 16,749 | | | $ | 4,480 | | | $ | (208) | | | $ | — | | | $ | 20,327 | |
The accompanying notes are an integral part of these consolidated financial statements.
| | | | | |
| Consolidated Statements of Cash Flows | Occidental Petroleum Corporation
and Subsidiaries |
| | | | | | | | | | | | | | | | | | |
| | Years Ended December 31, |
| millions | | 2021 | | 2020 | | 2019 |
| CASH FLOW FROM OPERATING ACTIVITIES | | | | | | |
| Net income (loss) | | $ | 2,322 | | | $ | (14,831) | | | $ | (522) | |
| Adjustments to reconcile net income (loss) to net cash from operating activities: | | | | | | |
| Discontinued operations, net | | 468 | | | 1,298 | | | 15 | |
| Depreciation, depletion and amortization of assets | | 8,447 | | | 8,097 | | | 6,140 | |
| Deferred income tax provision (benefit) | | 46 | | | (2,517) | | | (1,027) | |
| Other noncash charges to income | | 229 | | | 419 | | | 958 | |
| Asset impairments and other charges | | 304 | | | 11,002 | | | 1,328 | |
| (Gain) loss on sales of equity investments and other assets, net | | (192) | | | 1,666 | | | (622) | |
| Undistributed earnings from affiliates | | (70) | | | (61) | | | (50) | |
| Dry hole expense | | 125 | | | 47 | | | 89 | |
| Changes in operating assets and liabilities: | | | | | | |
| (Increase) decrease in receivables | | (2,086) | | | 2,062 | | | 401 | |
| (Increase) decrease in inventories | | (86) | | | (484) | | | 78 | |
| (Increase) decrease in other current assets | | (119) | | | 350 | | | 170 | |
| Increase (decrease) in accounts payable and accrued liabilities | | 865 | | | (3,228) | | | 358 | |
| Increase in current domestic and foreign income taxes | | — | | | 22 | | | 20 | |
| Operating cash flow from continuing operations | | 10,253 | | | 3,842 | | | 7,336 | |
| Operating cash flow from discontinued operations, net of taxes | | 181 | | | 113 | | | 39 | |
| Net cash provided by operating activities | | 10,434 | | | 3,955 | | | 7,375 | |
| | | | | | |
| CASH FLOW FROM INVESTING ACTIVITIES | | | | | | |
| Capital expenditures | | (2,870) | | | (2,535) | | | (6,367) | |
| Change in capital accrual | | 97 | | | (519) | | | (249) | |
| Purchase of businesses and assets, net | | (431) | | | (114) | | | (28,088) | |
| Proceeds from sale of assets and equity investments, net | | 1,624 | | | 2,281 | | | 6,143 | |
| Equity investments and other, net | | 406 | | | 109 | | | (291) | |
| Investing cash flow from continuing operations | | (1,174) | | | (778) | | | (28,852) | |
| Investing cash flow from discontinued operations | | (79) | | | (41) | | | (175) | |
| Net cash used by investing activities | | (1,253) | | | (819) | | | (29,027) | |
| | | | | | |
| CASH FLOW FROM FINANCING ACTIVITIES | | | | | | |
| Proceeds from long-term debt, net - Occidental | | — | | | 6,936 | | | 21,557 | |
| Payments of long-term debt, net - Occidental | | (6,834) | | | (8,916) | | | (6,959) | |
| Proceeds from long-term debt, net - WES | | — | | | — | | | 459 | |
| Proceeds from issuance of common and preferred stock | | 31 | | | 134 | | | 10,028 | |
| Purchases of treasury stock | | (8) | | | (12) | | | (237) | |
| Cash dividends paid on common and preferred stock | | (839) | | | (1,845) | | | (2,624) | |
| Distributions to noncontrolling interest | | — | | | — | | | (257) | |
| Payment of liabilities associated with the sale of future royalties | | — | | | (386) | | | (28) | |
| Financing portion of net cash received (paid) for derivative instruments | | (834) | | | (362) | | | 120 | |
| Other financing, net | | (80) | | | (57) | | | 137 | |
| Financing cash flow from continuing operations | | (8,564) | | | (4,508) | | | 22,196 | |
| Financing cash flow from discontinued operations | | (8) | | | (8) | | | (3) | |
| Net cash provided (used) by financing activities | | (8,572) | | | (4,516) | | | 22,193 | |
| | | | | | |
| Increase (decrease) in cash, cash equivalents, restricted cash and restricted cash equivalents | | 609 | | | (1,380) | | | 541 | |
| Cash, cash equivalents, restricted cash and restricted cash equivalents — beginning of year | | 2,194 | | | 3,574 | | | 3,033 | |
| Cash, cash equivalents, restricted cash and restricted cash equivalents — end of year | | $ | 2,803 | | | $ | 2,194 | | | $ | 3,574 | |
The accompanying notes are an integral part of these consolidated financial statements.
| | | | | | | | |
| | FINANCIAL STATEMENTS FOOTNOTES |
| | | | | |
| Notes to Consolidated Financial Statements | Occidental Petroleum Corporation
and Subsidiaries |
| | |
| NOTE 1 - SUMMARY OF SIGNIFICANT ACCOUNTING POLICIES |
NATURE OF OPERATIONS
Occidental conducts its operations through various subsidiaries and affiliates. Occidental’s principal businesses consist of three reporting segments: oil and gas, chemical and midstream and marketing. The oil and gas segment explores for, develops and produces oil (which includes condensate), NGL and natural gas. OxyChem primarily manufactures and markets basic chemicals and vinyls. The midstream and marketing segment purchases, markets, gathers, processes, transports and stores oil (which includes condensate), NGL, natural gas, CO2 and power. It also optimizes its transportation and storage capacity, and invests in entities that conduct similar activities, such as WES.
The midstream and marketing segment also includes OLCV. OLCV seeks to leverage Occidental’s legacy of carbon management expertise to develop CCUS projects, including the commercialization of DAC technology, and invests in other low-carbon technologies intended to reduce GHG emissions from our operations and strategically partner with other industries to help reduce their emissions.
PRINCIPLES OF CONSOLIDATION
The consolidated financial statements have been prepared in conformity with GAAP and include the accounts of Occidental, its subsidiaries, its undivided interests in oil and gas exploration and production ventures and, previously, variable interest entities, for which Occidental was the primary beneficiary. Occidental accounts for its share of oil and gas exploration and production ventures, in which it has a direct working interest, by reporting its proportionate share of assets, liabilities, revenues, costs and cash flows within the relevant lines on the balance sheets, statements of operations and statements of cash flows. Certain prior period amounts have been reclassified to conform to the current presentation.
WES INVESTMENT
WES is a publicly traded limited partnership with its common units traded on the NYSE under the ticker symbol “WES.” WES owns the entire non-economic general partner interest and a 98% limited partner interest in WES Operating.
As a result of certain partnership agreement amendments and other related agreements executed in 2019, Occidental does not consolidate WES under the voting interest model since Occidental does not control the power to appoint or remove a successor general partner.
As of December 31, 2021, Occidental’s equity method investment in WES was approximately $2.0 billion, which exceeds Occidental’s pro-rata interest in the net assets of WES by $362 million. This basis difference is primarily associated with WES' PP&E and equity investments and is subject to amortization over their estimated average lives. As of December 31, 2021, Occidental owned all of a 2.2% non-voting general partner interest and 49.7% of the limited partner units in WES. On a combined basis, with its 2% non-voting limited partner interest in WES Operating, Occidental's total effective economic interest in WES and its subsidiaries was 51.8%. See Note 4 - Investment and Related-Party Transactions.
INVESTMENTS IN UNCONSOLIDATED ENTITIES
Occidental’s percentage interest in the underlying net assets of affiliates for which it exercises significant influence without having a controlling interest (excluding oil and gas ventures in which Occidental holds an undivided interest) are accounted for under the equity method. Occidental reviews equity-method investments for impairment whenever events or changes in circumstances indicate that an other-than-temporary decline in value may have occurred. The amount of impairment, if any, is based on quoted market prices, when available, or other valuation techniques, including discounted cash flows. Occidental evaluates the facts and circumstances of any distributions in excess of its carrying amount in the investment to determine the appropriate accounting, including the source of the proceeds and any implicit or explicit commitments to fund the affiliate. If there is no implicit or explicit commitment the distribution is treated as a gain. If an implicit or explicit commitment exists to possibly fund the affiliate at a future date the distribution is recorded against the equity-method investment. See Note 4 - Investments and Related-Party Transactions for further discussion regarding investments in unconsolidated entities.
| | | | | | | | |
| | FINANCIAL STATEMENTS FOOTNOTES |
DISCONTINUED OPERATIONS
In connection with the Acquisition, Occidental entered into a purchase and sale agreement with Total to sell all of the assets, liabilities, businesses and operations of Anadarko's operations in Algeria, Ghana, Mozambique and South Africa. Total and Occidental completed the sale of the Mozambique assets in September 2019 for approximately $4.2 billion and the South Africa assets in January 2020 for approximately $100 million.
In April 2020, subsequent to communications with Algerian government officials, Occidental determined that the sale of the Algeria operations to Total would not be consummated and the decision was made to continue to operate within Algeria. As a result, as of the second quarter of 2020, Occidental no longer classified the Algeria operations as a held for sale asset in discontinued operations and reclassified prior periods to reflect the Algeria operations as continuing operations.
In May 2020, Occidental and Total mutually agreed to execute a waiver of the obligation to purchase and sell the Ghana assets, and in October 2021, Occidental closed on the sale of the Ghana assets with a third party for a purchase price of $750 million. Unless otherwise indicated, information presented in the Notes to Consolidated Financial Statements relates only to Occidental's continuing operations. Information related to discontinued operations is included in Note 5 - Acquisitions, Divestitures and Other Transactions and in some instances, where appropriate, is included as a separate disclosure within the individual Notes to Consolidated Financial Statements.
RISKS AND UNCERTAINTIES
The process of preparing consolidated financial statements in conformity with GAAP requires Occidental’s management to make informed estimates and judgments regarding certain types of financial statement balances and disclosures. Such estimates primarily relate to unsettled transactions and events as of the date of the consolidated financial statements and judgments on expected outcomes as well as the materiality of transactions and balances. Changes in facts and circumstances or discovery of new information relating to such transactions and events may result in revised estimates and judgments and actual results may differ from estimates upon settlement. Management believes that these estimates and judgments provide a reasonable basis for the fair presentation of Occidental’s financial statements. Occidental establishes a valuation allowance against net operating losses and other deferred tax assets to the extent it believes the future benefit from these assets will not be realized in the statutory carryforward periods. Realization of deferred tax assets is dependent upon Occidental generating sufficient future taxable income and reversal of temporary differences in jurisdictions where such assets originate.
The accompanying consolidated financial statements include assets of approximately $7.7 billion as of December 31, 2021 and net sales of approximately $4.2 billion for the year ended December 31, 2021, relating to Occidental’s operations in countries outside North America. Occidental operates some of its oil and gas business in countries that have experienced situations including such things as political instability, nationalizations, corruption, armed conflict, terrorism, insurgency, civil unrest, security problems, labor unrest, OPEC production restrictions, equipment import restrictions and sanctions, all of which increase Occidental’s risk of loss, delayed or restricted production or may result in other adverse consequences. Occidental attempts to conduct its affairs so as to mitigate its exposure to such risks and would seek compensation in the event of nationalization.
Because Occidental’s major products are commodities, significant changes in the prices of oil, NGL, natural gas and chemical products may have a significant impact on Occidental’s results of operations. Also, see Property, Plant and Equipment section below.
RECEIVABLES AND OTHER CURRENT ASSETS
Trade receivables, net, of $4.2 billion and $2.1 billion as of December 31, 2021, and 2020, respectively, represent rights to payment for which Occidental has satisfied its obligations under a contract with a customer and its right to payment is conditioned only on the passage of time.
Other current assets includes amounts receivable from working interest partners in Occidental’s oil and gas operations, derivative assets and taxes receivable.
INVENTORIES
Materials and supplies are valued at weighted-average cost and are reviewed periodically for obsolescence. Oil, NGL and natural gas inventories are valued at the lower of cost or market.
For the chemical segment, Occidental’s finished goods inventories are valued at the lower of cost or market. For most of its domestic inventories, other than materials and supplies, the chemical segment uses the last-in, first-out (LIFO) method as it better matches current costs and current revenue. For other countries, Occidental uses the first-in, first-out method (if the costs of goods are specifically identifiable) or the average-cost method (if the costs of goods are not specifically identifiable).
| | | | | | | | |
| | FINANCIAL STATEMENTS FOOTNOTES |
PROPERTY, PLANT AND EQUIPMENT
OIL AND GAS
The carrying value of Occidental’s PP&E represents the cost incurred to acquire or develop the asset, including any AROs and capitalized interest, net of accumulated DD&A and any impairment charges. For assets acquired, PP&E cost is based on fair values at the acquisition date. AROs and interest costs incurred in connection with qualifying capital expenditures are capitalized and amortized over the lives of the related assets.
Occidental uses the successful efforts method to account for its oil and gas properties. Under this method, Occidental capitalizes costs of acquiring properties, costs of drilling successful exploration wells and development costs. The costs of exploratory wells are initially capitalized pending a determination of whether proved reserves have been found. If proved reserves have been found, the costs of exploratory wells remain capitalized. For exploratory wells that find reserves that cannot be classified as proved when drilling is completed, costs continue to be capitalized as suspended exploratory drilling costs if there have been sufficient reserves found to justify completion as a producing well and sufficient progress is being made in assessing the reserves and the economic and operating viability of the project. At the end of each quarter, management reviews the status of all suspended exploratory drilling costs in light of ongoing exploration activities, in particular, whether Occidental is making sufficient progress in its ongoing exploration and appraisal efforts or, in the case of discoveries requiring government sanctioning, analyzing whether development negotiations are underway and proceeding as planned. If management determines that future appraisal drilling or development activities are unlikely to occur, associated suspended exploratory well costs are expensed.
The following table summarizes the activity of capitalized exploratory well costs for continuing operations for the years ended December 31:
| | | | | | | | | | | | | | | | | | | | |
| millions | | 2021 | | 2020 | | 2019 |
| Balance — beginning of year | | $ | 211 | | | $ | 424 | | | $ | 112 | |
| Exploratory well costs acquired through the Acquisition | | — | | | — | | | 231 | |
Additions to capitalized exploratory well costs pending the determination of proved reserves | | 163 | | | 122 | | | 383 | |
Reclassifications to property, plant and equipment based on the determination of proved reserves | | (67) | | | (309) | | | (230) | |
Capitalized exploratory well costs charged to expense | | (94) | | | (26) | | | (72) | |
| Balance — end of year | | $ | 213 | | | $ | 211 | | | $ | 424 | |
Occidental expenses annual lease rentals, the costs of injectants used in production and geological and geophysical costs as incurred.
Occidental determines depreciation and depletion of oil and gas producing properties by the unit-of-production method. It amortizes leasehold costs over total proved reserves and capitalized development and successful exploration costs over proved developed reserves. As a result of Occidental's mid-year reserve review undertaken in the second quarter of 2021, DD&A rates for the second half of 2021 were lower compared to the first half of 2021 due to increased proved reserves primarily related to positive price revisions. Proved oil, NGL and natural gas reserves were estimated during this mid-year review using the unweighted arithmetic average of the first-day-of-the-month price for each month for the twelve months ended June 30, 2021, unless prices were defined by contractual arrangements.
Proved oil and gas reserves are those quantities of oil and gas which, by analysis of geoscience and engineering data, can be estimated with reasonable certainty to be economically producible from a given date forward, from known reservoirs and under existing economic conditions, operating methods and government regulations prior to the time at which contracts providing the right to operate expire, unless evidence indicates that renewal is reasonably certain, regardless of whether deterministic or probabilistic methods are used for the estimation. Proved reserves includes PUD reserves. PUD reserves are supported by a management approved, detailed, field-level development plan where sufficient capital has been committed to develop those reserves. Only PUD reserves which are reasonably certain to be drilled within five years of booking and are supported by a final investment decision to drill them are included in the development plan. A portion of the PUD reserves associated with international operations are expected to be developed beyond the five years and are tied to approved long-term development projects.
Occidental performs impairment tests with respect to its proved properties whenever events or circumstances indicate that the carrying value of property may not be recoverable. If there is an indication the carrying amount of the asset may not be recovered due to significant and prolonged declines in current and forward prices, significant changes in reserve estimates, changes in management’s plans, or other significant events, management will evaluate the property for impairment. Under the successful efforts method, if the sum of the undiscounted cash flows is less than the carrying value of the proved property, the carrying value is reduced to estimated fair value and reported as an impairment charge in the period. Individual proved properties are grouped for impairment purposes at the lowest level for which there are identifiable cash flows unless observable and comparable transactions are available. The fair value of impaired assets is typically determined based on the present value of expected future cash flows using discount rates believed to be consistent with those used by market participants. The impairment test incorporates a number of assumptions involving expectations of future cash flows which can change significantly over time. These assumptions include estimates of future production,
| | | | | | | | |
| | FINANCIAL STATEMENTS FOOTNOTES |
product prices, contractual prices, estimates of risk-adjusted oil and gas proved and unproved reserves and estimates of future operating and development costs. It is reasonably possible that prolonged declines in commodity prices, reduced capital spending in response to lower prices or increases in operating costs could result in additional impairments. See Note 9 - Fair Value Measurements and below for further discussion of asset impairments. Net capitalized costs attributable to unproved properties were $14.8 billion as of December 31, 2021 and $18.6 billion as of December 31, 2020. The unproved amounts are not subject to DD&A until they are classified as proved properties. Individually insignificant unproved properties are combined and amortized on a group basis based on factors such as lease terms, success rates and other factors to provide for full amortization upon lease expiration or abandonment.
Significant unproved properties, primarily as a result of the Acquisition, are assessed individually for impairment and when events or circumstances indicate that the carrying value of property may not be recovered a valuation allowance is provided if an impairment is indicated. Occidental periodically reviews significant unproved properties for impairments; numerous factors are considered, including but not limited to, availability of funds for future exploration and development activities, current exploration and development plans, favorable or unfavorable exploration activity on the property or the adjacent property, geologists’ evaluation of the property, the current and projected political and regulatory climate, contractual conditions and the remaining lease term for the properties. If an impairment is indicated, Occidental will first determine whether a comparable transaction for similar properties or implied acreage valuation derived from domestic onshore market participants is available and will adjust the carrying amount of the unproved property to its fair value using the market approach. In situations where the market approach is not observable and unproved reserves are available, undiscounted future net cash flows used in the impairment analysis are determined based on managements’ risk adjusted estimates of unproved reserves, future commodity prices and future costs to produce the reserves. If undiscounted future net cash flows are less than the carrying value of the property, the future net cash flows are discounted and compared to the carrying value for determining the amount of the impairment loss to record. Occidental utilizes the same assumptions and methodology discussed above for cash flows associated with proved properties.
CHEMICAL
Occidental’s chemical assets are depreciated using either the unit-of-production or the straight-line method, based upon the estimated useful lives of the facilities. The estimated useful lives of Occidental’s chemical assets, which range from three years to 50 years, are also used for impairment tests. The estimated useful lives for the chemical facilities are based on the assumption that Occidental will provide an appropriate level of annual expenditures to ensure productive capacity is sustained. Such expenditures consist of ongoing routine repairs and maintenance, as well as planned major maintenance activities (PMMA). Ongoing routine repairs and maintenance expenditures are expensed as incurred. PMMA costs are capitalized and amortized over the period until the next planned overhaul. Additionally, Occidental incurs capital expenditures that extend the remaining useful lives of existing assets, increase their capacity or operating efficiency beyond the original specification or add value through modification for a different use. These capital expenditures are not considered in the initial determination of the useful lives of these assets at the time they are placed into service. The resulting revision, if any, of the asset’s estimated useful life is measured and accounted for prospectively.
Without these continued expenditures, the useful lives of these assets could decrease significantly. Other factors that could change the estimated useful lives of Occidental’s chemical assets include sustained higher or lower product prices, which are affected by domestic and international competition, demand, feedstock costs, energy prices, environmental regulations and technological changes.
Occidental performs impairment tests on its chemical assets whenever events or changes in circumstances lead to a reduction in the estimated useful lives or estimated future cash flows that would indicate that the carrying amount may not be recoverable, or when management’s plans change with respect to those assets. Any impairment loss would be calculated as the excess of the asset’s net book value over its estimated fair value.
MIDSTREAM AND MARKETING
Occidental’s midstream and marketing PP&E is depreciated over the estimated useful lives of the assets, using either the unit-of-production or straight-line method.
Occidental performs impairment tests on its midstream and marketing assets whenever events or changes in circumstances lead to a reduction in the estimated useful lives or estimated future cash flows that would indicate that the carrying amount may not be recoverable, or when management’s plans change with respect to those assets. Any impairment loss would be calculated as the excess of the asset’s net book value over its estimated fair value.
IMPAIRMENTS AND OTHER CHARGES
During 2021, Occidental’s oil and gas segment recognized pre-tax impairment and related charges of $282 million primarily related to undeveloped leases that either expired or were set to expire in the near-term, where Occidental had no plans to pursue exploration activities and, to a lesser extent, impairments of oil and gas materials and supplies inventories.
| | | | | | | | |
| | FINANCIAL STATEMENTS FOOTNOTES |
During 2020, Occidental’s oil and gas segment recognized pre-tax impairment and related charges of $7.0 billion related to proved and unproved properties. An additional pre-tax impairment of $2.2 billion related to Ghana was included in discontinued operations.
During 2020, Occidental’s midstream and marketing segment recognized pre-tax impairment and related charges of $1.2 billion related to goodwill associated with Occidental’s ownership in WES. Significant declines in the market value of WES’ publicly traded units resulted in management’s determination that, more likely than not, the fair value of the reporting unit was significantly less than its carrying value and the entire balance was fully impaired. The market value of WES’ publicly traded units is considered a Level 1 input.
During 2019, Occidental’s oil and gas segment recognized pre-tax impairment and related charges of $285 million related to domestic undeveloped leases that were set to expire in the near-term, where Occidental had no plans to pursue exploration activities, and $39 million related to Occidental’s mutually agreed early termination of its Qatar Idd El Shargi South Dome (ISSD) contract.
It is reasonably possible that prolonged declines in commodity prices, reduced capital spending in response to lower prices or increases in operating costs could result in additional impairments.
FAIR VALUE MEASUREMENTS
Occidental has categorized its assets and liabilities that are measured at fair value in a three-level fair value hierarchy, based on the inputs to the valuation techniques: Level 1 – using quoted prices in active markets for the assets or liabilities; Level 2 – using observable inputs other than quoted prices for the assets or liabilities; and Level 3 – using unobservable inputs. Transfers between levels, if any, are reported at the end of each reporting period.
FAIR VALUES - RECURRING
Occidental primarily applies the market approach for recurring fair value measurements, maximizes its use of observable inputs and minimizes its use of unobservable inputs. Occidental utilizes the mid-point between bid and ask prices for valuing the majority of its assets and liabilities measured and reported at fair value. In addition to using market data, Occidental makes assumptions in valuing its assets and liabilities, including assumptions about the risks inherent in the inputs to the valuation technique. For assets and liabilities carried at fair value, Occidental measures fair value using the following methods:
■Occidental values exchange-cleared commodity derivatives using closing prices provided by the exchange as of the balance sheet date. These derivatives are classified as Level 1.
■OTC bilateral financial commodity contracts, foreign exchange contracts, interest rate swaps, warrants, options and physical commodity forward purchase and sale contracts are generally classified as Level 2 and are generally valued using quotations provided by brokers or industry-standard models that consider various inputs, including quoted forward prices for commodities, time value, volatility factors, credit risk and current market and contractual prices for the underlying instruments, as well as other relevant economic measures. Substantially all of these inputs are observable in the marketplace throughout the full term of the instrument, and can be derived from observable data or are supported by observable prices at which transactions are executed in the marketplace.
■Occidental values commodity derivatives based on a market approach that considers various assumptions, including quoted forward commodity prices and market yield curves. The assumptions used include inputs that are generally unobservable in the marketplace or are observable but have been adjusted based upon various assumptions and the fair value is designated as Level 3 within the valuation hierarchy.
■Occidental values debt using market-observable information for debt instruments that are traded on secondary markets. For debt instruments that are not traded, the fair value is determined by interpolating the value based on debt with similar terms and credit risk.
NON-FINANCIAL ASSETS
Occidental uses market-observable prices for assets when comparable transactions can be identified that are similar to the asset being valued. When Occidental is required to measure fair value and there is not a market-observable price for the asset or for a similar asset then the cost or income approach is used depending on the quality of information available to support management’s assumptions. The cost approach is based on management’s best estimate of the current asset replacement cost. The income approach is based on management’s best assumptions regarding expectations of future net cash flows. The expected cash flows are discounted using a commensurate risk-adjusted discount rate. Such evaluations involve significant judgment, and the results are based on expected future events or conditions such as sales prices, estimates of future oil and gas production or throughput, development and operating costs and the timing thereof, economic and regulatory climates and other factors, most of which are often outside of management’s control. However, assumptions used reflect a market participant’s view of long-term prices, costs and other factors and are consistent with assumptions used in Occidental’s business plans and investment decisions.
| | | | | | | | |
| | FINANCIAL STATEMENTS FOOTNOTES |
ACCRUED LIABILITIES - CURRENT
Accrued liabilities - current included accrued payroll, commissions and related expenses of $677 million and $461 million as of December 31, 2021, and 2020, respectively. Dividends payable, also included in accrued liabilities - current, were $188 million and $189 million as of December 31, 2021, and 2020, respectively. Derivative financial instruments, also included in accrued liabilities - current, were $0.2 billion and $1.1 billion as of December 31, 2021, and 2020, respectively.
ENVIRONMENTAL LIABILITIES AND EXPENDITURES
Environmental expenditures that relate to current operations are expensed or capitalized as appropriate. Occidental records environmental liabilities and related charges and expenses for estimated remediation costs that relate to existing conditions from past operations when environmental remediation efforts are probable and the costs can be reasonably estimated. In determining the environmental remediation liability and the range of reasonably possible additional losses, Occidental refers to currently available information, including relevant past experience, remedial objectives, available technologies, applicable laws and regulations and cost-sharing arrangements. Occidental bases its environmental remediation liabilities on management’s estimate of the most likely cost to be incurred, using the most cost-effective technology reasonably expected to achieve the remedial objective. Occidental periodically reviews its environmental remediation liabilities and adjusts them as new information becomes available. Occidental generally records reimbursements or recoveries of environmental remediation costs in income when received, or when receipt of recovery is highly probable.
Many factors could affect Occidental’s future remediation costs and result in adjustments to its environmental remediation liabilities and the range of reasonably possible additional losses. The most significant are: (1) cost estimates for remedial activities may vary from the initial estimate; (2) the length of time, type or amount of remediation necessary to achieve the remedial objective may change due to factors such as site conditions, the ability to identify and control contaminant sources or the discovery of additional contamination; (3) a regulatory agency may ultimately reject or modify Occidental’s proposed remedial plan; (4) improved or alternative remediation technologies may change remediation costs; (5) laws and regulations may change remediation requirements or affect cost sharing or allocation of liability; and (6) changes in allocation or cost-sharing arrangements may occur.
Certain sites involve multiple parties with various cost-sharing arrangements, which fall into the following three categories: (1) environmental proceedings that result in a negotiated or prescribed allocation of remediation costs among Occidental and other alleged potentially responsible parties; (2) oil and gas ventures in which each participant pays its proportionate share of remediation costs reflecting its working interest; or (3) contractual arrangements, typically relating to purchases and sales of properties, in which the parties to the transaction agree to methods of allocating remediation costs. In these circumstances, Occidental evaluates the financial viability of other parties with whom it is alleged to be jointly liable, the degree of their commitment to participate and the consequences to Occidental of their failure to participate when estimating Occidental’s ultimate share of liability. Occidental records its environmental remediation liabilities at its expected net cost of remedial activities and, based on these factors, believes that it will not be required to assume a share of liability of such other potentially responsible parties in an amount materially above amounts reserved.
In addition to the costs of investigations and cleanup measures, which often take in excess of 10 years at CERCLA NPL sites, Occidental’s environmental remediation liabilities include management’s estimates of the costs to operate and maintain remedial systems. If remedial systems are modified over time in response to significant changes in site-specific data, laws, regulations, technologies or engineering estimates, Occidental reviews and adjusts its environmental remediation liabilities accordingly.
ASSET RETIREMENT OBLIGATIONS
Occidental recognizes the fair value of AROs in the period in which a determination is made that a legal obligation exists to dismantle an asset and reclaim or remediate the property at the end of its useful life and the cost of the obligation can be reasonably estimated. The liability amounts are based on future retirement cost estimates and incorporate many assumptions such as time to abandonment, future inflation rates and the risk-adjusted discount rate. When the liability is initially recorded, Occidental capitalizes the cost by increasing the related PP&E balances. If the estimated future cost of the AROs changes, Occidental records an adjustment to both the AROs and PP&E. Over time, the liability is increased, expense is recognized for accretion and the capitalized cost is depreciated over the useful life of the asset.
The majority of Occidental’s AROs relate to the plugging of wells and the related abandonment of oil and gas properties.
At a certain number of its facilities, Occidental has identified conditional AROs that are related mainly to plant decommissioning. Occidental does not know or cannot estimate when it may settle these obligations. Therefore, Occidental cannot reasonably estimate the fair value of these liabilities. Occidental will recognize these conditional AROs in the periods in which sufficient information becomes available to reasonably estimate their fair values.
| | | | | | | | |
| | FINANCIAL STATEMENTS FOOTNOTES |
The following table summarizes the activity of AROs for the years ended December 31:
| | | | | | | | | | | | | | |
| millions | | 2021 | | 2020 |
| Beginning balance | | $ | 4,130 | | | $ | 4,659 | |
| | | | |
| Liabilities incurred – capitalized to PP&E | | 27 | | | 79 | |
| Liabilities settled and paid | | (174) | | | (186) | |
| Accretion expense | | 205 | | | 147 | |
| Acquisitions, divestitures and other, net | | (53) | | | (294) | |
| | | | |
| Revisions to previous estimates | | (109) | | | (275) | |
Ending balance (a) | | $ | 4,026 | | | $ | 4,130 | |
(a)The ending balance included $339 million and $153 million related to the current balance of AROs that are included in accrued liabilities on the Consolidated Balance Sheets as of December 31, 2021, and 2020, respectively.
DERIVATIVE INSTRUMENTS
Derivatives are carried at fair value and on a net basis when a legal right of offset exists with the same counterparty. Occidental applies hedge accounting when transactions meet specified criteria for cash flow hedge treatment and management elects and documents such treatment. Otherwise, any fair value gains or losses are recognized in earnings in the current period. For cash flow hedges, the gain or loss on the effective portion of the derivative is reported as a component of other comprehensive income (OCI) with an offsetting adjustment to the carrying value of the item being hedged. Realized gains or losses from cash flow hedges, and any ineffective portion, are recorded as a component of net sales in the consolidated statements of operations. Ineffectiveness is primarily created by a lack of correlation between the hedged item and the hedging instrument due to location, quality, grade or changes in the expected quantity of the hedged item. Gains and losses from derivative instruments are reported net in the consolidated statements of operations. There were no fair value hedges as of and during the years ended December 31, 2021, 2020 and 2019.
STOCK-BASED INCENTIVE PLANS
Occidental has established a stockholder-approved 2015 Long-Term Incentive Plan, as amended and restated, for certain employees and directors (the Plan) that is more fully described in Note 15 - Stock-Based Incentive Plans. A summary of Occidental’s accounting policy for awards issued under the Plan is as follows. For cash- and stock-settled restricted stock units (RSU) and cash return on capital employed incentive (CROCEI) awards, compensation value is initially measured on the grant date using the quoted market price of Occidental’s common stock and the estimated payout on the grant date. The fair value of stock options is estimated using a Black Scholes model. For total shareholder return incentive (TSRI) awards, compensation value is initially measured on the grant date using the fair value derived from a Monte Carlo valuation model. Compensation expense for all awards is recognized on a straight-line basis over the requisite service periods, which is generally over the awards’ respective vesting or performance periods. The stock-settled awards are expensed using the initially measured compensation value. The liability resulting from cash settled awards and accrued dividends are remeasured at each reporting period. Dividends accrued on unvested awards are adjusted quarterly for any changes in the number of share equivalents expected to be paid based on the relevant performance and market criteria, if applicable.
There are no outstanding awards under Occidental’s 2005 Long-Term Incentive Plan following the expiration of the non-qualified stock options granted in 2015 on February 11, 2022.
EARNINGS PER SHARE
Occidental’s instruments containing rights to nonforfeitable dividends granted in stock-based awards are considered participating securities prior to vesting and, therefore, have been deducted from earnings in computing basic and diluted earnings per share (EPS) under the two-class method.
Basic EPS was computed by dividing net income attributable to common stock, net of income allocated to participating securities, by the weighted-average number of common shares outstanding during each period, including vested but unissued shares and share units. The computation of diluted EPS reflects the additional dilutive effect of stock options, warrants and unvested stock awards.
RETIREMENT AND POSTRETIREMENT BENEFIT PLANS
Occidental recognizes the overfunded or underfunded amounts of its defined benefit pension and postretirement plans, which are more fully described in Note 11 - Retirement and Postretirement Benefit Plans, in its financial statements using a December 31 measurement date. Occidental’s defined benefit pension and postretirement benefit plan obligations are actuarially determined based on various assumptions and discount rates. The discount rate assumptions used are meant to reflect the interest rate at which the obligations could effectively be settled on the measurement date. Occidental estimates the rate of return on assets with
| | | | | | | | |
| | FINANCIAL STATEMENTS FOOTNOTES |
regard to current market factors but within the context of historical returns. Occidental funds and expenses negotiated pension increases for domestic union employees over the terms of the applicable collective bargaining agreements.
Pension and any postretirement plan assets are measured at fair value. Common stock, preferred stock, publicly registered mutual funds, U.S. government securities and corporate bonds are valued using quoted market prices in active markets when available. When quoted market prices are not available, these investments are valued using pricing models with observable inputs from both active and non-active markets. Common and collective trusts are valued at the fund units’ net asset value (NAV) provided by the issuer, which represents the quoted price in a non-active market. Short-term investment funds are valued at the fund units’ NAV provided by the issuer.
SUPPLEMENTAL CASH FLOW INFORMATION
The following table represents U.S. federal, domestic state and international income taxes paid, tax refunds received and interest paid related to continuing operations during the year ended December 31, 2021, 2020 and 2019, respectively.
| | | | | | | | | | | | | | | | | | | | |
| millions | | 2021 | | 2020 | | 2019 |
| Income tax payments | | $ | 763 | | | $ | 498 | | | $ | 1,944 | |
| Income tax refunds received | | $ | 70 | | | $ | 223 | | | $ | 80 | |
| Production, property and other tax payments | | $ | 790 | | | $ | 629 | | | $ | 724 | |
Interest paid (a) | | $ | 1,685 | | | $ | 1,521 | | | $ | 912 | |
(a) Net of capitalized interest of $61 million, $84 million and $89 million, for the years 2021, 2020 and 2019, respectively.
CASH EQUIVALENTS AND RESTRICTED CASH EQUIVALENTS
Occidental considers all highly liquid investments with a maturity of three months or less when purchased to be cash equivalents or restricted cash equivalents. The cash equivalents and restricted cash equivalents balance as of December 31, 2021, included investments in government money market funds in which the carrying value approximates fair value.
The following table provides a reconciliation of cash, cash equivalents, restricted cash and restricted cash equivalents as reported at the end of the period in the Consolidated Statements of Cash Flows for the year ended December 31, 2021, and 2020 to the line items within the Consolidated Balance Sheet as of December 31:
| | | | | | | | | | | |
| millions | | 2021 | 2020 |
| Cash and cash equivalents | | $ | 2,764 | | $ | 2,008 | |
| Restricted cash and restricted cash equivalents | | 24 | | 170 | |
| Restricted cash and restricted cash equivalents included in long-term receivables and other assets, net | | 15 | | 16 | |
| Cash, cash equivalents, restricted cash and restricted cash equivalents | | $ | 2,803 | | $ | 2,194 | |
FOREIGN CURRENCY TRANSACTIONS
The functional currency applicable to all of Occidental’s international oil and gas operations is the U.S. dollar since cash flows are denominated principally in U.S. dollars. In Occidental’s other operations, Occidental’s use of non-United States dollar functional currencies was not material for all years presented. The effect of exchange rates on transactions in foreign currencies is included in periodic income. Occidental reports the exchange rate differences arising from translating foreign-currency-denominated balance sheet accounts to the United States dollar as of the reporting date in OCI. Exchange-rate gains and losses for continuing operations were not material for all years presented.
INCOME TAXES
Occidental files various U.S. federal, state and foreign income tax returns. The impact of changes in tax regulations are reflected when enacted. In general, deferred federal, state and foreign income taxes are provided on temporary differences between the financial statement carrying amounts of assets and liabilities and their respective tax basis. Occidental routinely assesses the realizability of its deferred tax assets. If Occidental concludes that it is more likely than not that some of the deferred tax assets will not be realized, the tax asset is reduced by a valuation allowance. Occidental recognizes a tax benefit from an uncertain tax position when it is more likely than not that the position will be sustained upon examination, based on the technical merits of the position. The tax benefit recorded is equal to the largest amount that is greater than 50% likely to be realized through final settlement with a taxing authority. Interest and penalties related to unrecognized tax benefits are recognized in income tax expense (benefit). See Note 10 - Income Taxes for more information.
LOSS CONTINGENCIES
Occidental or certain of its subsidiaries are involved, in the normal course of business, in lawsuits, claims and other legal proceedings that seek, among other things, compensation for alleged personal injury, breach of contract, property
| | | | | | | | |
| | FINANCIAL STATEMENTS FOOTNOTES |
damage or other losses, punitive damages, civil penalties, or injunctive or declaratory relief. Occidental or certain of its subsidiaries also are involved in proceedings under CERCLA and similar federal, state, local and international environmental laws. These environmental proceedings seek funding or performance of remediation and, in some cases, compensation for alleged property damage, punitive damages, civil penalties and injunctive relief. Usually Occidental or such subsidiaries are among many companies in these environmental proceedings and have to date been successful in sharing response costs with other financially sound companies. Further, some lawsuits, claims and legal proceedings involve acquired or disposed assets with respect to which a third party or Occidental retains liability or indemnifies the other party for conditions that existed prior to the transaction.
SIGNIFICANT ACCOUNTING AND DISCLOSURE CHANGES
There were no significant accounting or disclosure changes for the periods in the three years ended December 31, 2021.
| | | | | | | | |
| | FINANCIAL STATEMENTS FOOTNOTES |
Revenue from customers is recognized when obligations under the terms of a contract are satisfied; this generally occurs with the delivery of oil, NGL, gas, chemicals or services such as transportation. Revenue from customers is measured as the amount of consideration Occidental expects to receive in exchange for the delivery of goods or services. Contracts may last from one month to one year or more and may have renewal terms that extend indefinitely at the option of either party. Price is typically based on market indexes. Volumes fluctuate due to production and, in certain cases, customer demand and transportation availability. Occidental records revenue net of certain taxes, such as sales taxes, that are assessed by governmental authorities on Occidental’s customers.
Occidental does not incur significant costs to obtain contracts. Incidental items that are immaterial in the context of the contract are recognized as expenses. Sales of hydrocarbons and chemicals to customers are invoiced and settled on a monthly basis. Occidental is not usually subject to obligations for warranties, rebates, returns or refunds except in the case of customer incentive payments as discussed for the chemical segment below. Occidental does not typically receive payment in advance of satisfying its obligations under the terms of its sales contracts with customers; therefore, liabilities related to such payment are immaterial to Occidental. Occidental does not disclose consideration for remaining performance obligations with an original expected duration of one year or less or for variable consideration related to unsatisfied performance obligations.
OIL AND GAS SEGMENT
Revenue from oil and gas production is recognized when production is delivered and control passes to the customer. Revenues from the production of oil and gas properties in which Occidental has an interest with other producers are recognized on the basis of Occidental’s net revenue interest.
CHEMICAL SEGMENT
Revenue from chemical product sales is recognized when control passes to the customer. Certain incentive programs may provide for payments or credits to be made to customers based on the volume of product purchased over a defined period. Customer incentives are estimated and recorded as a reduction to revenue ratably over the contract period. Such estimates are evaluated and revised as warranted. Revenue from exchange contracts is excluded from revenue from customers.
MIDSTREAM AND MARKETING SEGMENT
Revenue from pipeline and gas processing is recognized upon the completion of the transportation or processing service. Revenue from power sales is recognized upon delivery. Net marketing revenue is recognized upon completion of contract terms that are a prerequisite to payment and upon title transfer for physical deliveries. Unless the normal purchases and sales exception has been elected, net marketing revenue is classified as a derivative, reported on a net basis, recorded at fair value. Changes in fair value are reflected in net sales and excluded from revenue from customers in the table below.
DISAGGREGATION OF REVENUE FROM CONTRACTS WITH CUSTOMERS
The following table reconciles revenue from customers to total net sales for the years ended December 31:
| | | | | | | | | | | | | | | | | | | | |
| millions | | 2021 | | 2020 | | 2019 |
| Revenue from customers | | $ | 25,959 | | | $ | 17,130 | | | $ | 19,192 | |
All other revenues (a) | | (3) | | | 679 | | | 1,719 | |
| Net sales | | $ | 25,956 | | | $ | 17,809 | | | $ | 20,911 | |
(a)Included net marketing derivatives, oil collars and calls and chemical exchange contracts.
| | | | | | | | |
| | FINANCIAL STATEMENTS FOOTNOTES |
The table below presents Occidental's revenue from customers by segment, product and geographical area. The oil and gas segment typically sells its oil, NGL and gas at the lease or concession area. Chemical segment revenues are shown by geographic area based on the location of the sale. Excluding net marketing revenue, midstream and marketing segment revenues are shown by the location of sale.
| | | | | | | | | | | | | | | | | | | | | | | | | | |
| millions | | United States | | International | | Eliminations | | Total |
| Year ended December 31, 2021 | | | | | | | | |
| Oil and gas | | | | | | | | |
| Oil | | $ | 12,072 | | | $ | 2,844 | | | $ | — | | | $ | 14,916 | |
| NGL | | 2,203 | | | 325 | | | — | | | 2,528 | |
| Gas | | 1,524 | | | 291 | | | — | | | 1,815 | |
| Other | | 24 | | | 2 | | | — | | | 26 | |
| Segment total | | $ | 15,823 | | | $ | 3,462 | | | $ | — | | | $ | 19,285 | |
| Chemical | | $ | 4,995 | | | $ | 248 | | | $ | — | | | $ | 5,243 | |
| Midstream and marketing | | $ | 1,969 | | | $ | 556 | | | $ | — | | | $ | 2,525 | |
| | | | | | | | |
| | | | | | | | |
| | | | | | | | |
| | | | | | | | |
| Eliminations | | $ | — | | | $ | — | | | $ | (1,094) | | | $ | (1,094) | |
| Consolidated | | $ | 22,787 | | | $ | 4,266 | | | $ | (1,094) | | | $ | 25,959 | |
| | | | | | | | |
| Year ended December 31, 2020 | | | | | | | | |
| Oil and gas | | | | | | | | |
| Oil | | $ | 7,485 | | | $ | 2,403 | | | $ | — | | | $ | 9,888 | |
| NGL | | 838 | | | 217 | | | — | | | 1,055 | |
| Gas | | 660 | | | 326 | | | — | | | 986 | |
| Other | | 65 | | | 1 | | | — | | | 66 | |
| Segment total | | $ | 9,048 | | | $ | 2,947 | | | $ | — | | | $ | 11,995 | |
| Chemical | | $ | 3,524 | | | $ | 202 | | | $ | — | | | $ | 3,726 | |
| Midstream and marketing | | $ | 1,595 | | | $ | 572 | | | $ | — | | | $ | 2,167 | |
| Eliminations | | $ | — | | | $ | — | | | $ | (758) | | | $ | (758) | |
| Consolidated | | $ | 14,167 | | | $ | 3,721 | | | $ | (758) | | | $ | 17,130 | |
| | | | | | | | |
| Year ended December 31, 2019 | | | | | | | | |
| Oil and gas | | | | | | | | |
| Oil | | $ | 8,411 | | | $ | 3,939 | | | $ | — | | | $ | 12,350 | |
| NGL | | 658 | | | 283 | | | — | | | 941 | |
| Gas | | 424 | | | 339 | | | — | | | 763 | |
| Other | | (1) | | | (5) | | | — | | | (6) | |
| Segment total | | $ | 9,492 | | | $ | 4,556 | | | $ | — | | | $ | 14,048 | |
| Chemical | | $ | 3,858 | | | $ | 222 | | | $ | — | | | $ | 4,080 | |
Midstream and marketing (a) | | $ | 1,977 | | | $ | 351 | | | $ | — | | | $ | 2,328 | |
| Eliminations | | $ | — | | | $ | — | | | $ | (1,264) | | | $ | (1,264) | |
| Consolidated | | $ | 15,327 | | | $ | 5,129 | | | $ | (1,264) | | | $ | 19,192 | |
| | | | | | | | |
| | FINANCIAL STATEMENTS FOOTNOTES |
Finished goods primarily represents oil, which is carried at the lower of weighted-average cost or net realizable value, and caustic soda and chlorine, which are valued under the LIFO method. Inventories consisted of the following as of December 31:
| | | | | | | | | | | | | | |
| millions | | 2021 | | 2020 |
| Raw materials | | $ | 96 | | | $ | 70 | |
| Materials and supplies | | 783 | | | 848 | |
| Commodity inventory and finished goods | | 1,066 | | | 1,009 | |
| | 1,945 | | | 1,927 | |
| Revaluation to LIFO | | (99) | | | (29) | |
| Total | | $ | 1,846 | | | $ | 1,898 | |
| | |
| NOTE 4 - INVESTMENTS AND RELATED-PARTY TRANSACTIONS |
EQUITY INVESTMENTS
Occidental’s significant equity investments are presented in investments in unconsolidated entities and in other - deferred credits and other liabilities. As of December 31, 2021, and 2020, investments in unconsolidated entities were $2.9 billion and $3.3 billion, respectively. Occidental’s equity investments presented in investments in unconsolidated entities primarily consist of the following:
| | | | | | | | | | | | | | |
| millions | | % Interest | | Carrying amount |
WES (a) | | 51.8 | % | | $ | 1,963 | |
| OxyChem Ingleside Facility | | 50.0 | % | | 599 | |
| OLCV - related | | various | | 164 | |
| Other | | various | | 212 | |
Total Investments in unconsolidated entities (b) | | | | $ | 2,938 | |
| | | | |
(a) In December 2021, Occidental sold 2.5 million limited partner units of WES for proceeds of approximately $50 million. In March 2021, Occidental sold 11.5 million limited partner units for proceeds of approximately $200 million, resulting in a gain of $102 million. In the first quarter of 2020, Occidental recorded an impairment of $1.2 billion in goodwill related to its ownership in WES and in the third quarter of 2020, recorded an other than temporary impairment of $2.7 billion related to the WES equity method investment. See Note 9 - Fair Value Measurements for more information on the impairments. (b) Not presented in investments in unconsolidated entities is Occidental’s 24.5% ownership in DEL, which has a carrying value of $217 million. Refer to the discussion below regarding the presentation of Occidental’s equity investment in DEL.
As of December 31, 2021 and 2020, Occidental’s significant equity investments consisted of investments in WES, OxyChem Ingleside Facility and DEL.
In November 2021, Occidental received approximately $560 million in cash distributions as a result of a refinancing transaction at DEL. The cash distributions received from the refinancing transaction were comprised of $110 million in dividends and $450 million in excess distributions. As Occidental may be requested to provide financial support to DEL, the excess distributions were recorded against the $217 million carrying amount of the equity investment. The net of the carrying value of the investment in DEL and the excess distributions was $233 million and is presented in deferred credits and other liabilities - other. Occidental recorded the $110 million in dividends as a return on investment in cash flow from operations and the $450 million excess distribution as a return of investment in cash flow from investing.
As part of the Acquisition, Occidental acquired equity investments in certain oil and gas properties and gathering and processing assets and assumed an associated notes payable which Occidental has the legal right of setoff and intends to net settle with its ownership interest in the equity investments. The notes payable can be net settled starting in 2022. The carrying value of the investment and note payable were $2.9 billion as of December 31, 2021, respectively. Accordingly, the equity investments and the related notes payable are presented net on the Consolidated Balance Sheets.
Dividends received from equity investments were $652 million, $678 million and $422 million to Occidental in 2021, 2020 and 2019, respectively. As of December 31, 2021 and 2020, cumulative undistributed earnings of equity-method investees since they were acquired was $242 million and $166 million, respectively. As of December 31, 2021, Occidental’s
| | | | | | | | |
| | FINANCIAL STATEMENTS FOOTNOTES |
investments in equity investees exceeded the underlying equity in net assets by approximately $667 million, of which, $347 million represented PP&E and equity investments with the remainder comprised of intangibles, both are subject to amortization over their estimated average lives.
The following table presents the summarized financial information of its equity-method investments combined for the years ended and as of December 31:
| | | | | | | | | | | | | | | | | | | | |
| millions | | 2021 | | 2020 | | 2019 |
Summarized Results of Operations (a) | | | | | | |
| Revenues and other income | | $ | 6,252 | | | $ | 5,455 | | | $ | 26,520 | |
| Costs and expenses | | 4,569 | | | 5,455 | | | 24,084 | |
| Net income | | $ | 1,683 | | | $ | — | | | $ | 2,436 | |
| | | | | | |
| Summarized Balance Sheet | | | | | | |
| Current assets | | $ | 3,387 | | | $ | 1,419 | | | $ | 1,130 | |
| Non-current assets | | $ | 19,341 | | | $ | 18,693 | | | $ | 21,158 | |
| Current liabilities | | $ | 1,976 | | | $ | 1,549 | | | $ | 785 | |
| Long-term debt | | $ | 9,464 | | | $ | 7,860 | | | $ | 8,673 | |
| Other non-current liabilities | | $ | 1,187 | | | $ | 866 | | | $ | 859 | |
| Stockholders’ equity | | $ | 10,101 | | | $ | 9,837 | | | $ | 11,971 | |
(a)The 2019 Summarized Results of Operations included results of Plains for the period beginning January 1, 2019 through the date Occidental’s interest was sold in September 2019. Plains accounted for $24.7 billion of equity-method investment revenues and other income in 2019.
RELATED-PARTY TRANSACTIONS
Occidental sells oil, NGL, natural gas, chemicals, power and steam to and purchases oil, NGL and chemicals from its equity method investees and other related parties. Occidental is charged service fees primarily related to gathering, processing, oil, NGL and natural gas treatment by certain of its equity investees and other related parties. During 2021, 2020 and 2019, Occidental entered into the following related-party transactions and had the following amounts due from or to its related parties for the years ended December 31:
| | | | | | | | | | | | | | | | | | | | |
| millions | | 2021 | | 2020 | | 2019 |
Sales (a,c) | | $ | 261 | | | $ | 301 | | | $ | 691 | |
Purchases (b,c) | | $ | 773 | | | $ | 1,112 | | | $ | 463 | |
Services (d) | | $ | 942 | | | $ | 1,101 | | | $ | 28 | |
Advances and amounts due from related parties (c) | | $ | 57 | | | $ | 62 | | | $ | 133 | |
Amounts due to related parties (c) | | $ | 280 | | | $ | 296 | | | $ | 463 | |
(a)In 2021 and 2020, sales of Occidental-produced oil and NGL to WES accounted for 58% and 70% of these totals, respectively. In 2019, sales of Occidental-produced oil and NGL to Plains Pipeline affiliates accounted for 87% of these totals. In September 2019, Occidental sold its equity investment in Plains. See Note 5 - Acquisitions, Divestitures and Other Transactions for additional information. (b)In 2021 and 2020, purchases of gas and NGL marketed on behalf of WES accounted for 27% and 59% of related party purchases, respectively, while purchases of ethylene from the OxyChem Ingleside Facility accounted for 70% and 41% in 2021 and 2020 respectively, and, in 2019, for 98% of related party purchases.
(c)Excluded sales to and purchases from WES and amounts due to and from WES in 2019 as it was a consolidated subsidiary from the date of the Acquisition through December 31, 2019.
(d)In 2021 and 2020, services primarily related to fees charged by WES to gather, process and treat Occidental produced oil, NGL and natural gas. Excluded charges to WES for shared corporate services.
| | | | | | | | |
| | FINANCIAL STATEMENTS FOOTNOTES |
| | |
| NOTE 5 - ACQUISITIONS, DIVESTITURES AND OTHER TRANSACTIONS |
ACQUISITIONS, DIVESTITURES AND OTHER TRANSACTIONS
2021
In November 2021, Occidental entered into an agreement to sell certain non-strategic assets in the Permian Basin. The transaction closed in January 2022 for net cash proceeds of approximately $190 million. The assets and liabilities, of which $72 million is related to PP&E, net and $7 million is related to AROs, were presented as held for sale as of December 31, 2021.
In November 2021, Occidental acquired additional working interests in certain assets in the Permian EOR business unit for a net purchase price of approximately $285 million.
In October 2021, Occidental closed the sale of its Ghana assets. See below discussion on Discontinued Operations for additional information. This divestiture completed Occidental's large-scale asset divestiture program.
In June 2021, Occidental entered into an agreement to sell certain non-strategic assets in the Permian Basin. The transaction closed in July 2021 for net cash proceeds of approximately $475 million. The difference in the assets' net book value and adjusted purchase price was treated as a recovery of cost and normal retirement, which resulted in no gain or loss being recognized.
In March 2021, Occidental completed the sale of certain non-operated assets in the DJ Basin for net cash proceeds of approximately $280 million. The difference in the assets' net book value and adjusted purchase price was treated as a recovery of cost and normal retirement, which resulted in no gain or loss being recognized.
2020
In November 2020 and December 2020, Occidental divested of certain non-core, largely non-operated proved and unproved acreage in the Permian for a loss of approximately $820 million. The losses have been presented within gains (losses) on sale of assets, net in the Consolidated Statement of Operations.
In October 2020, Occidental entered into an agreement to sell its onshore oil and gas Colombia assets. The transaction closed in December 2020, and Occidental recorded a loss on sale of approximately $353 million. The loss has been presented within gains (losses) on sale of assets, net in the Consolidated Statement of Operations.
In August 2020, Occidental entered into an agreement to sell approximately 4.5 million mineral acres and 1 million fee surface acres located in Wyoming, Colorado and Utah for approximately $1.33 billion. The transaction closed in October 2020 for net cash proceeds of approximately $1.0 billion, after satisfying $329 million of liabilities associated with the sale of future royalties. Occidental recorded a loss on sale of $440 million. The loss has been presented within gains (losses) on sale of assets, net in the Consolidated Statement of Operations.
2019
In December 2019, Occidental disposed of real estate assets for $565 million. Occidental utilized net proceeds to pay down a portion of the Term Loans. Concurrent with the sale, Occidental entered a 13-year lease for part of the real estate assets. Based on the terms of the lease, Occidental treated this as a failed sale-leaseback, retained the related book value in PP&E and recognized a finance lease of approximately $300 million based on the discounted future minimum lease payments.
In November 2019, Occidental and Ecopetrol closed on the joint venture to develop approximately 97,000 net acres of Occidental’s Midland Basin unproved properties in the Permian Basin. Ecopetrol paid $750 million in cash at closing and up to $750 million of carried capital in exchange for a 49% interest in the new venture. Occidental recognized a gain of $563 million on the sale. Following the close, Occidental owned a 51% interest and operates the joint venture. During the carry period, Ecopetrol will pay 75% of Occidental’s share of capital expenditures, up to $750 million. The joint venture allows Occidental to accelerate its development plans in the Midland Basin, where it currently has minimal activity. Occidental will retain production and cash flow from its existing operations in the Midland Basin.
In September 2019, Occidental sold its remaining equity investment in Plains for net proceeds of $646 million, which resulted in a pre-tax gain of $114 million. The proceeds were used to pay down a portion of the Term Loans.
In August 2019, the Acquisition was consummated. The Acquisition added to Occidental’s oil and gas portfolio, primarily in the Permian Basin, DJ Basin and Gulf of Mexico and Algeria and a general and limited partner interest in WES. Total consideration of the Acquisition was approximately $35.7 billion in cash and common stock. See Note 14 - Stockholders’ Equity for additional information. From the date of the Acquisition through December 31, 2019, revenues and the net loss attributable to common stockholders associated with the operations acquired through the Acquisition totaled $4.2 billion and $1.7 billion, respectively, which included a charge as a result of recording Occidental’s investment in WES at fair value as of December 31, 2019 upon the loss of control.
| | | | | | | | |
| | FINANCIAL STATEMENTS FOOTNOTES |
The following table summarizes the Acquisition-related costs incurred for the years ended December 31:
| | | | | | | | | | | | | | |
| millions | | 2021 | 2020 | 2019 |
| Employee severance and related employee cost | | $ | 117 | | $ | 314 | | $ | 1,033 | |
| IT costs | | 36 | | 9 | | 15 | |
| Licensing fees for critical seismic data | | — | | — | | 401 | |
| Bank, legal, consulting and other | | — | | 16 | | 198 | |
| Total | | $ | 153 | | $ | 339 | | $ | 1,647 | |
| | | | |
Employee severance and related employee cost primarily related to one-time severance costs and the accelerated vesting of certain Anadarko share-based awards for former Anadarko employees based on the terms of the Acquisition Agreement and existing change of control provisions within the former Anadarko employment agreements. In addition, this category included expenses for a voluntary separation program for eligible employees and retention awards for certain employees.
The IT costs primarily related to Occidental’s efforts to integrate the Anadarko finance, supply chain, asset integrity, and well life cycle systems.
The seismic licensing fees related to relicensing of critical seismic data related to the Gulf of Mexico, Permian Basin and DJ Basin that Anadarko had licensed from third-party vendors. The third-party vendors who own the seismic data required a transfer fee in order for Occidental to use the data.
The following table summarizes the unaudited pro forma condensed financial information of Occidental for the year ended December 31, 2019 as if the Acquisition had occurred on January 1, 2018:
| | | | | |
| |
| millions except per-share amounts | |
| Revenues | $ | 28,723 | |
Net loss attributable to common stockholders (a) | $ | (769) | |
| Net loss attributable to common stockholders per share—basic | $ | (0.95) | |
| Net loss attributable to common stockholders per share—diluted | $ | (0.95) | |
| |
(a)Excluding the pro-forma results of WES, net loss attributable to common stockholders would be $(1.1) billion for the year ended December 31, 2019.
The unaudited pro forma information is presented for illustration purposes only and is not necessarily indicative of the operating results that would have occurred had the Acquisition been completed on January 1, 2018, nor is it necessarily indicative of future operating results of the combined entity. The unaudited pro forma information for 2019 is a result of combining the statements of operations of Occidental with the pre-Acquisition results from January 1, 2019 of Anadarko and included adjustments for revenues and direct expenses. The pro forma results exclude results from any assets classified as held for sale, any cost savings anticipated as a result of the Acquisition and the impact of any Acquisition-related costs. The pro forma results include adjustments to DD&A based on the purchase price allocated to PP&E and the estimated useful lives as well as adjustments to interest expense. The pro forma adjustments include estimates and assumptions based on currently available information. Management believes the estimates and assumptions are reasonable and the relative effects of the Acquisition are properly reflected.
| | | | | | | | |
| | FINANCIAL STATEMENTS FOOTNOTES |
DISCONTINUED OPERATIONS
In October 2021, Occidental closed the sale of its Ghana assets for $750 million and net proceeds of $555 million, after closing adjustments to reflect an April 1, 2021 effective date. In addition, Occidental settled certain tax claims related to historical operations in Ghana for $170 million. Prior to the sale, 2021 operations in Ghana resulted in an after-tax loss of $31 million.
The following table presents the amounts reported in discontinued operations, net of income taxes, related to the Ghana assets for the years ended December 31, 2021 and 2020 and for the Ghana, Mozambique and South Africa assets subsequent to the Acquisition closing date through December 31, 2019:
| | | | | | | | | | | |
| millions | 2021 | 2020 | 2019 |
| Revenues and other income | | | |
| Net sales | $ | 458 | | $ | 419 | | $ | 221 | |
| | | |
| Costs and other deductions | | | |
| Oil and gas lease operating expense | 71 | | 117 | | 45 | |
Fair value adjustment on assets held for sale (a) | 409 | | 2,263 | | 85 | |
| Other | 24 | | 48 | | 45 | |
| Total costs and other deductions | $ | 504 | | $ | 2,428 | | $ | 175 | |
| | | |
| Income (loss) before income taxes | $ | (46) | | $ | (2,009) | | $ | 46 | |
| Income tax benefit (expense) | 15 | | 711 | | (61) | |
| Discontinued operations, net of tax | $ | (31) | | $ | (1,298) | | $ | (15) | |
(a) For 2021, included effective date to close date adjustments as well as settlements of certain tax claims.
The following table presents amounts related to the Ghana assets reported as held for sale in the Consolidated Balance Sheet as of December 31, 2020:
| | | | | |
| millions | 2020 |
| |
| Current assets | $ | 37 | |
| Property, plant and equipment, net | 1,364 | |
| Long-term receivables and other assets, net | 32 | |
| Assets held for sale | $ | 1,433 | |
| |
| Current liabilities | $ | 84 | |
| Long-term debt, net - finance leases | 175 | |
| Deferred income taxes | 328 | |
| Asset retirement obligations | 166 | |
| Liabilities of assets held for sale | $ | 753 | |
| |
| Net assets held for sale | $ | 680 | |
| |
| | | | | | | | |
| | FINANCIAL STATEMENTS FOOTNOTES |
As of December 31, 2021 and 2020, Occidental’s debt consisted of the following:
| | | | | | | | | | | | | | | | | | |
| millions | | 2021 | | 2020 | | | | |
4.850% senior notes due 2021 | | $ | — | | | $ | 147 | | | | | |
2.600% senior notes due 2021 | | — | | | 224 | | | | | |
Variable rate bonds due 2021 (1.193% as of December 31, 2020) | | — | | | 27 | | | | | |
2.700% senior notes due 2022 | | — | | | 629 | | | | | |
3.125% senior notes due 2022 | | — | | | 276 | | | | | |
2.600% senior notes due 2022 | | 101 | | | 101 | | | | | |
Variable rate bonds due 2022 (1.730% as of December 31, 2020) | | — | | | 1,052 | | | | | |
2.700% senior notes due 2023 | | 442 | | | 927 | | | | | |
8.750% medium-term notes due 2023 | | 22 | | | 22 | | | | | |
2.900% senior notes due 2024 | | 949 | | | 3,000 | | | | | |
6.950% senior notes due 2024 | | 650 | | | 650 | | | | | |
3.450% senior notes due 2024 | | 127 | | | 248 | | | | | |
8.000% senior notes due 2025 | | 500 | | | 500 | | | | | |
5.875% senior notes due 2025 | | 900 | | | 900 | | | | | |
3.500% senior notes due 2025 | | 326 | | | 750 | | | | | |
5.500% senior notes due 2025 | | 750 | | | 750 | | | | | |
5.550% senior notes due 2026 | | 1,100 | | | 1,100 | | | | | |
3.200% senior notes due 2026 | | 797 | | | 1,000 | | | | | |
3.400% senior notes due 2026 | | 779 | | | 1,150 | | | | | |
7.500% debentures due 2026 | | 112 | | | 112 | | | | | |
8.500% senior notes due 2027 | | 500 | | | 500 | | | | | |
3.000% senior notes due 2027 | | 634 | | | 750 | | | | | |
7.125% debentures due 2027 | | 150 | | | 150 | | | | | |
7.000% debentures due 2027 | | 48 | | | 48 | | | | | |
6.625% debentures due 2028 | | 14 | | | 14 | | | | | |
7.150% debentures due 2028 | | 235 | | | 235 | | | | | |
7.200% senior debentures due 2028 | | 82 | | | 82 | | | | | |
6.375% senior notes due 2028 | | 600 | | | 600 | | | | | |
7.200% debentures due 2029 | | 135 | | | 135 | | | | | |
7.950% debentures due 2029 | | 116 | | | 116 | | | | | |
8.450% senior debentures due 2029 | | 116 | | | 116 | | | | | |
3.500% senior notes due 2029 | | 1,477 | | | 1,500 | | | | | |
Variable rate bonds due 2030 (0.900% and 2.700% as of December 31, 2021 and 2020, respectively) | | 68 | | | 68 | | | | | |
8.875% senior notes due 2030 | | 1,000 | | | 1,000 | | | | | |
6.625% senior notes due 2030 | | 1,500 | | | 1,500 | | | | | |
6.125% senior notes due 2031 | | 1,250 | | | 1,250 | | | | | |
7.500% senior notes due 2031 | | 900 | | | 900 | | | | | |
7.875% senior notes due 2031 | | 500 | | | 500 | | | | | |
6.450% senior notes due 2036 | | 1,750 | | | 1,750 | | | | | |
| Zero Coupon senior notes due 2036 | | 2,269 | | | 2,269 | | | | | |
4.300% senior notes due 2039 | | 693 | | | 750 | | | | | |
7.950% senior notes due 2039 | | 325 | | | 325 | | | | | |
6.200% senior notes due 2040 | | 750 | | | 750 | | | | | |
4.500% senior notes due 2044 | | 608 | | | 625 | | | | | |
| (continued on next page) | | | | | | | | |
| | | | | | | | |
| | FINANCIAL STATEMENTS FOOTNOTES |
| | | | | | | | | | | | | | | | | | |
| millions (continued) | | 2021 | | 2020 | | | | |
4.625% senior notes due 2045 | | 634 | | | 750 | | | | | |
6.600% senior notes due 2046 (a) | | 1,157 | | | 1,100 | | | | | |
4.400% senior notes due 2046 | | 976 | | | 1,200 | | | | | |
4.100% senior notes due 2047 | | 663 | | | 750 | | | | | |
4.200% senior notes due 2048 | | 961 | | | 1,000 | | | | | |
4.400% senior notes due 2049 | | 704 | | | 750 | | | | | |
7.730% debentures due 2096 | | 58 | | | 60 | | | | | |
7.500% debentures due 2096 | | 60 | | | 78 | | | | | |
7.250% debentures due 2096 | | 5 | | | 49 | | | | | |
| Total borrowings at face value | | $ | 28,493 | | | $ | 35,235 | | | | | |
| Adjustments to book value: | | | | | | | | |
| Unamortized premium, net | | 670 | | | 748 | | | | | |
| Debt issuance costs | | (135) | | | (156) | | | | | |
| Net book value of debt | | $ | 29,028 | | | $ | 35,827 | | | | | |
| Long-term finance leases | | 504 | | | 316 | | | | | |
| Current finance leases | | 85 | | | 42 | | | | | |
| Total debt and finance leases | | $ | 29,617 | | | $ | 36,185 | | | | | |
| Less current maturities of financing leases | | (85) | | | (42) | | | | | |
| Less current maturities of long-term debt | | (101) | | | (398) | | | | | |
| Long-term debt, net | | $ | 29,431 | | | $ | 35,745 | | | | | |
(a) Occidental entered into an exchange agreement, dated as of October 20, 2021, among Occidental and certain holders of its subsidiary Anadarko’s 7.250% debentures due 2096, its subsidiary Anadarko Holding Company’s 7.500% debentures due 2096 and its subsidiary Anadarko’s 7.730% debentures due 2096 (such notes, the 2096 Notes), pursuant to which Occidental issued approximately $57.2 million of 6.600% senior notes due 2046 as additional securities under the Indenture, dated as of August 8, 2019, between Occidental and The Bank of New York Mellon Trust Company, N.A., as trustee (the 2019 Indenture), in exchange for the cancellation of approximately $64.8 million of the 2096 notes. The additional securities have identical terms and conditions as Occidental’s previously issued 6.600% senior notes due 2046 (the Initial Securities), other than the issue date and the date from which interest will accrue, are restricted securities with a related legend and initially have a different CUSIP number and ISIN number from the Initial Securities and for all purposes are treated as a single class with the outstanding Initial Securities under the 2019 Indenture.
DEBT MATURITIES
As of December 31, 2021, future principal payments on debt were approximately $28.5 billion, of which, $101 million is due in 2022, $465 million is due in 2023, $1.7 billion is due in 2024, $2.5 billion is due in 2025, and $23.7 billion is due in 2026 and thereafter.
In January 2022, Occidental used cash on hand to repay $101 million in outstanding 2.600% senior notes due April 2022 at face value. Subsequent to the purchase and retirement of this note, Occidental’s face value of debt was $28.4 billion with no maturities in 2022.
| | | | | | | | |
| | FINANCIAL STATEMENTS FOOTNOTES |
DEBT ACTIVITY - 2021
The following table summarizes Occidental’s debt activity for the year ended December 31, 2021:
| | | | | | | | |
| millions | | Borrowings at face value |
| Total borrowings at face value as of December 31, 2020 | | $ | 35,235 | |
| First quarter: | | |
4.850% senior notes due 2021 | | $ | (147) | |
| Variable rate bonds due 2021 | | (27) | |
| Third quarter: | | |
2.700% senior notes due 2022 | | $ | (278) | |
2.700% senior notes due 2023 | | (484) | |
3.450% senior notes due 2024 | | (81) | |
2.900% senior notes due 2024 | | (1,620) | |
3.500% senior notes due 2025 | | (229) | |
3.400% senior notes due 2026 | | (224) | |
3.200% senior notes due 2026 | | (110) | |
2.600% senior notes due 2021 | | (224) | |
| Floating interest rate notes due August 2022 | | (1,051) | |
| Fourth quarter: | | |
4.400% senior notes due 2046 | | $ | (224) | |
4.400% senior notes due 2049 | | (46) | |
7.730% debentures due 2096 | | (3) | |
7.500% debentures due 2096 | | (18) | |
7.250% debentures due 2096 | | (44) | |
6.600% senior notes due 2046 | | 57 | |
3.450% senior notes due 2024 | | (40) | |
2.900% senior notes due 2024 | | (431) | |
3.500% senior notes due 2025 | | (195) | |
3.400% senior notes due 2026 | | (148) | |
3.200% senior notes due 2026 | | (93) | |
3.000% senior notes due 2027 | | (116) | |
3.500% senior notes due 2029 | | (23) | |
4.100% senior notes due 2047 | | (87) | |
4.200% senior notes due 2048 | | (39) | |
4.300% senior notes due 2039 | | (57) | |
4.500% senior notes due 2044 | | (17) | |
4.625% senior notes due 2045 | | (116) | |
3.125% senior notes due 2022 | | (276) | |
2.700% senior notes due 2022 | | (351) | |
| Total borrowings at face value as of December 31, 2021 | | $ | 28,493 | |
| | | | | | | | |
| | FINANCIAL STATEMENTS FOOTNOTES |
DEBT ACTIVITY - 2020
The following table summarizes Occidental’s debt issuances, repurchases, repayments and exchanges for the year ended December 31, 2020:
| | | | | | | | |
| millions | | Borrowings at face value |
| Total borrowings at face value as of December 31, 2019 | | $ | 37,401 | |
| Issuance of July 2020 notes: | | |
8.000% senior notes due 2025 | | 500 | |
8.500% senior notes due 2027 | | 500 | |
8.875% senior notes due 2030 | | 1,000 | |
| July tender and purchase: | | |
4.100% senior notes due February 2021 | | (943) | |
| Variable rate bonds due February 2021 | | (473) | |
4.850% senior notes due March 2021 | | (530) | |
2.600% senior notes due August 2021 | | (51) | |
| Issuance of August 2020 notes: | | |
5.875% senior notes due 2025 | | 900 | |
6.375% senior notes due 2028 | | 600 | |
6.625% senior notes due 2030 | | 1,500 | |
| August and September tender and purchase: | | |
4.100% senior notes due February 2021 | | (139) | |
| Variable rate bonds due August 2021 | | (123) | |
2.600% senior notes due August 2021 | | (1,099) | |
| Variable rate bonds due August 2022 | | (448) | |
2.600% senior notes due April 2022 | | (171) | |
2.700% senior notes due August 2022 | | (102) | |
2.700% senior notes due February 2023 | | (52) | |
| August WES exchange: | | |
6.500% note payable to WES due 2038 | | (260) | |
| September Term Loan repayment: | | |
2-year variable rate term loan due 2021 | | (500) | |
| October Term Loan and note repayment: | | |
2-year variable rate bonds due August 2021 | | (377) | |
0.00% senior notes due October 2036 | | (2) | |
2-year variable rate term loan due September 2021 | | (1,010) | |
| November Term Loan repayment: | | |
2-year variable rate term loan due September 2021 | | (232) | |
| Issuance of December 2020 notes: | | |
5.500% senior notes due 2025 | | 750 | |
6.125% senior notes due 2031 | | 1,250 | |
| December tender and purchase: | | |
2.600% senior notes due August 2021 | | (126) | |
3.125% senior notes due February 2022 | | (538) | |
2.600% senior notes due April 2022 | | (128) | |
2.700% senior notes due August 2022 | | (1,269) | |
2.700% senior notes due February 2023 | | (212) | |
| December Term Loan and note repayment: | | |
2-year variable rate term loan due September 2021 | | (214) | |
4.100% senior notes due February 2021 | | (167) | |
| Total borrowings at face value as of December 31, 2020 | | $ | 35,235 | |
| | | | | | | | |
| | FINANCIAL STATEMENTS FOOTNOTES |
In the fourth quarter of 2021, Occidental used cash on hand to complete a $1.6 billion cash tender offer for outstanding senior notes with a face value of $1.5 billion and maturities ranging from 2024 through 2049. Also in December 2021, Occidental used cash on hand to retire $627 million of senior notes due 2022.
In the third quarter of 2021, Occidental completed a cash tender for outstanding senior notes with a face value of $3.0 billion and maturities ranging from 2022 through 2026, paid $224 million of senior notes upon maturity and fully retired $1.1 billion of floating interest rate notes due August 2022.
In the first quarter of 2021, Occidental repaid $174 million of debt upon maturity. No debt matured or was otherwise paid during the second quarter of 2021.
In July, August, and December, 2020, Occidental issued $7.0 billion in senior unsecured notes, in aggregate, with maturities ranging from 2025 to 2031 and used the net proceeds to tender $3.5 billion of 2021, $2.7 billion of 2022 and $264 million of 2023 maturities. In addition, Occidental used proceeds from the sale of mineral and surface acres located in Wyoming, Colorado and Utah; the Colombian asset sale and proceeds from other divestitures and cash on hand to repay $2.5 billion of 2021 and $2 million of 2036 maturities.
In August 2020, Occidental exchanged approximately 27.9 million WES common units to retire a $260 million note payable to WES, resulting in a net loss of $46 million, which included a $76 million gain on debt extinguished associated with an unamortized premium on the note payable to WES. This net loss on exchange has been presented in (losses) gains on sale of assets, net in the Consolidated Statement of Operations.
REVOLVING CREDIT FACILITY
In December 2021, Occidental entered into the Second Amended and Restated Credit Agreement on its existing $5.0 billion RCF in which the total commitment was decreased to $4.0 billion and the LIBOR benchmark was changed to SOFR. In addition, the interest rate margin and the facility fee rates were amended to be subject to adjustments based on Occidental’s performance on specified sustainability target thresholds with respect to absolute reductions in GHG emissions from its worldwide operated assets. The RCF maturity date was extended to June 30, 2025.
Borrowings under the RCF bear interest at SOFR benchmark rates, plus a margin based on Occidental’s senior debt ratings. The facility has similar terms to other debt agreements and does not contain material adverse change clauses or debt ratings triggers that could restrict Occidental’s ability to borrow, or that would permit lenders to terminate their commitments or accelerate debt repayment. The facility provides for the termination of loan commitments and requires immediate repayment of any outstanding amounts if certain events of default occur. As of the date of this filing, Occidental has no drawn amounts under the RCF. In 2021, Occidental paid average annual facility fees of 0.302% on the total commitment amount.
RECEIVABLES SECURITIZATION FACILITY
In December 2021, Occidental amended and extended its existing receivables securitization facility to December 2024. As of December 31, 2021, the facility had $400 million of available borrowing capacity and no drawn amounts. The amended facility includes adjustments based on the same specified sustainability target thresholds as contained in the RCF.
ZERO COUPONS
The Zero Coupons have an aggregate principal amount due at the 2036 maturity of approximately $2.3 billion, reflecting an accretion rate of 5.24%. The Zero Coupons can be put to Occidental in October of each year, in whole or in part, for the then-accreted value of the outstanding Zero Coupons. The Zero Coupons can next be put to Occidental in October 2022, which, if put in whole, would be $1.1 billion at such date. Occidental has the ability and intent to refinance these obligations under the RCF or other committed facilities.
FAIR VALUE OF DEBT
Occidental estimates the fair value of fixed-rate debt based on the quoted market prices for those instruments or on quoted market yields for similarly rated debt instruments, taking into account such instruments’ maturities. The estimated fair values of Occidental’s debt as of December 31, 2021, and 2020, the majority of which were classified as Level 1, were approximately $31.1 billion and $33.8 billion, respectively. Occidental’s exposure to changes in interest rates relates primarily to its variable-rate, long-term debt obligations, and is not material. As of December 31, 2021, and 2020, variable-rate debt constituted approximately 0.2% and 3% of Occidental’s total debt, respectively.
| | | | | | | | |
| | FINANCIAL STATEMENTS FOOTNOTES |
DEBT RATINGS
As of the date of this filing, Occidental’s long-term debt was rated BB+ by Fitch Ratings, Ba2 by Moody’s Investors Service and BB+ by Standard and Poor’s. In January 2022, Standard and Poor’s upgraded Occidental’s credit rating to BB+. Any downgrade in credit ratings could impact Occidental's ability to access capital markets and increase its cost of capital. In addition, given that Occidental’s current debt ratings are non-investment grade, Occidental may be requested, and in some cases required, to provide collateral in the form of cash, letters of credit, surety bonds or other acceptable support as financial assurance of its performance and payment obligations under certain contractual arrangements such as pipeline transportation contracts, environmental remediation obligations, oil and gas purchase contracts and certain derivative instruments.
As of the date of this filing, Occidental has provided required financial assurances through a combination of cash, letters of credit and surety bonds and has not issued any letters of credit under the RCF or other committed facilities. For additional information, see Risk Factors in Part I, Item IA of this Form 10-K.
| | |
| NOTE 7 - LEASE COMMITMENTS |
Occidental identifies leases through its accounts payable and contract monitoring processes. Lease assets and liabilities are recognized at commencement date based on the present value of lease payments over the lease term. Lease assets include the lease liability, upfront payments and costs incurred to execute the lease and are amortized on a straight-line basis over the lease term. Occidental assesses the likelihood of exercising renewal, termination and purchase options to determine the lease term. Occidental uses its incremental borrowing rate at commencement date to determine the present value of lease payments. The incremental borrowing rate is the rate of interest that Occidental would pay to borrow an amount equal to the lease payments over a similar term on a collateralized basis in a similar economic environment. Certain leases include variable lease payments based on the underlying asset’s operations that are not included in the lease asset and liability.
Occidental has operating leases for oil and gas exploration and development equipment, including offshore and onshore drilling rigs of $32 million, compressors of $62 million, storage facilities of $52 million, office space of $386 million and other field equipment of $32 million. Operating lease terms generally range from one to eight years. Operating leases also include pipelines, rail cars, easements, aircraft and real estate of $207 million. These operating leases have contract expiration terms ranging from one to 10 years.
Occidental’s finance leases include a gas treating and processing plant, oil and gas exploration and development equipment, compressors, real estate offices and field equipment of approximately $589 million.
The following table presents lease balances and their classification on the Consolidated Balance Sheets as of December 31:
| | | | | | | | | | | | | | | | | |
| millions | | Balance sheet classification | 2021 | | 2020 |
| Assets: | | | | | |
| Operating | | Operating lease assets | $ | 726 | | | $ | 1,062 | |
| Finance | | Property, plant and equipment | 581 | | | 365 | |
| Total lease assets | | | $ | 1,307 | | | $ | 1,427 | |
| | | | | |
| Liabilities: | | | | | |
| Current | | | | | |
| Operating | | Current operating lease liabilities | $ | 186 | | | $ | 473 | |
| Finance | | Current maturities of long-term debt | 85 | | | 42 | |
| Non-current | | | | | |
| Operating | | Deferred credits and other liabilities - Operating lease liabilities | 585 | | | 641 | |
| Finance | | Long-term debt, net | 504 | | | 316 | |
| Total lease liabilities | | | $ | 1,360 | | | $ | 1,472 | |
| | | | | | | | |
| | FINANCIAL STATEMENTS FOOTNOTES |
As of December 31, 2021, Occidental will make the following lease payments:
| | | | | | | | | | | | | | | | | | | | |
| millions | | Operating Leases (a) | | Finance Leases (b) | | Total |
| 2022 | | $ | 183 | | | $ | 85 | | | $ | 268 | |
| 2023 | | 128 | | | 84 | | | 212 | |
| 2024 | | 99 | | | 82 | | | 181 | |
| 2025 | | 78 | | | 68 | | | 146 | |
| 2026 | | 94 | | | 57 | | | 151 | |
| Thereafter | | 302 | | | 300 | | | 602 | |
| Total lease payments | | 884 | | | 676 | | | 1,560 | |
| Less: Interest | | (113) | | | (87) | | | (200) | |
| Total lease liabilities | | $ | 771 | | | $ | 589 | | | $ | 1,360 | |
(a)The weighted-average remaining lease term is 7.3 years and the weighted-average discount rate is 3.40%.
(b)The weighted-average remaining lease term is 9.2 years and the weighted-average discount rate is 2.91%.
The following tables present Occidental’s total lease cost classifications and cash paid for operating and finance lease liabilities for the years ended December 31:
| | | | | | | | |
| millions | | |
Lease cost classification (a) | 2021 | 2020 |
Operating lease costs (b) | | |
| Property, plant and equipment, net | $ | 222 | | $ | 197 | |
| Operating expense and cost of sales | 487 | | 557 | |
| Selling, general and administrative expenses | 109 | | 107 | |
| Finance lease cost | | |
| Amortization of ROU assets | 39 | | 29 | |
| Interest on lease liabilities | 13 | | 14 | |
| Total lease cost | $ | 870 | | $ | 904 | |
(a)Amounts reflected are gross before joint-interest recoveries. Lease payments are reduced by joint-interest recoveries on the income statement through the joint-interest billing process.
(b)Included short-term lease cost of $238 million and $207 million and variable lease cost of $120 million and $95 million for the years ended December 31, 2021 and 2020, respectively.
| | | | | | | | |
| | |
| millions | 2021 | 2020 |
| Operating cash flows | $ | 401 | | $ | 506 | |
| Investing cash flows | $ | 73 | | $ | 89 | |
| Financing cash flows | $ | 39 | | $ | 29 | |
OBJECTIVE AND STRATEGY
Occidental uses a variety of derivative financial instruments and physical contracts to manage its exposure to commodity price fluctuations, interest rate risks and transportation commitments and to fix margins on the future sale of stored commodity volumes. Occidental also enters into derivative financial instruments for trading purposes.
Occidental may elect normal purchases and normal sales exclusions when physically delivered commodities are purchased or sold to a customer. Occidental occasionally applies cash flow hedge accounting treatment to derivative financial instruments to lock in margins on the forecasted sales of its natural gas storage volumes, and at times for other strategies, such as to lock in rates on debt issuances. Derivatives are carried at fair value and on a net basis when a legal right of offset exists with the same counterparty. See Note 1 - Summary of Significant Accounting Policies for Occidental’s accounting policy on derivatives.
| | | | | | | | |
| | FINANCIAL STATEMENTS FOOTNOTES |
DERIVATIVES NOT DESIGNATED AS HEDGING INSTRUMENTS
As of December 31, 2021, Occidental’s derivatives not designated as hedges consist of interest rate swaps and marketing derivatives. Occidental’s previously outstanding Brent-priced call options and natural gas two-way collar derivative instruments expired on or before December 31, 2021.
Derivative instruments that are not designated as hedging instruments are required to be recorded on the balance sheet at fair value. Changes in fair value will impact Occidental’s earnings through mark-to-market adjustments until the physical commodity is delivered or the financial instrument is settled. The fair value does not reflect the realized or cash value of the instrument.
COLLARS AND OIL CALL OPTIONS
In September 2020, Occidental entered into natural gas two-way collar derivative instruments for 2021 to manage its near-term exposure to cash flow variability from natural gas price risk. A two-way collar is a combination of two options: a sold call and a purchased put. The sold call establishes the ceiling price that Occidental will receive for the contracted commodity volume for a defined period of time. The purchased put establishes the floor price that Occidental will receive for the contracted volumes. Net gains and losses associated with puts and calls are recognized currently in net sales. Occidental did not have any puts or calls outstanding as of December 31, 2021. In 2021, Occidental paid $152 million to settle its gas puts and calls.
In 2019, Occidental entered into 2020 Brent-priced 3-way collars combined with 2021 call options on the same volume to manage its near-term exposure to cash flow variability from oil price risks in 2020. The 2021 call options were sold to enhance the upside retention in 2020. In 2020, collars settled with the receipt of cash of $960 million. In 2021, Occidental paid $146 million to settle oil calls.
INTEREST RATE SWAPS
Occidental's interest rate swap contracts lock in a fixed interest rate in exchange for a floating interest rate indexed to the three-month LIBOR throughout the reference period. Net gains and losses associated with interest rate swaps are recognized currently in gains (losses) on interest rate swaps and warrants, net.
Occidental had the following outstanding interest rate swaps outstanding as of December 31, 2021:
| | | | | | | | | | | | | | | | | | | | | | | |
| millions except percentages | | | | Mandatory | | Weighted-Average |
| Notional Principal Amount | | Reference Period | | Termination Date | | Interest Rate |
| $ | 275 | | | | September 2016 - 2046 | | September 2022 | | 6.709 | % |
| $ | 450 | | | | September 2017 - 2047 | | September 2023 | | 6.445 | % |
| | | | | | | |
| | | | | | | |
Depending on market conditions, liability management actions or other factors, Occidental may enter into offsetting interest rate swap positions as well as amend or settle certain or all of the currently outstanding interest rate swaps.
Derivative settlements and collateralization are classified as cash flows from operating activities unless the derivatives contain an other-than-insignificant financing element, in which case the settlements and collateralization are classified as cash flows from financing activities. Net cash payments related to settlements were $885 million for the year ended December 31, 2021, which included $815 million paid to settle interest rate swaps with notional principal amounts of $400 million and $350 million and weighted average interest rates of 6.348% and 6.662%, respectively. For the year ended December 31, 2021, $51 million of collateral was returned. As of December 31, 2021, $323 million of collateral related to interest rate swaps had been netted against derivative liabilities.
MARKETING DERIVATIVES
Occidental’s marketing derivative instruments not designated as hedges are short-duration physical and financial forward contracts. Marketing derivative instruments do not include the put and call options discussed above. A substantial majority of Occidental’s physically settled derivative contracts are index-based and carry no mark-to-market valuation in earnings. As of December 31, 2021, the weighted-average settlement price of these forward contracts was $74.85/Bbl and $4.61/Mcf for crude oil and natural gas, respectively. The weighted-average settlement price was $46.05/Bbl and $2.58/Mcf for crude oil and natural gas, respectively, as of December 31, 2020. Net gains and losses associated with marketing derivative instruments not designated as hedging instruments are recognized currently in net sales.
| | | | | | | | |
| | FINANCIAL STATEMENTS FOOTNOTES |
The following table summarizes net short volumes associated with the outstanding marketing commodity derivatives not designated as hedging instruments as of December 31:
| | | | | | | | | | | | | | |
| | |
| | 2021 | | 2020 |
| Oil commodity contracts | | | | |
| Volume (MMbbl) | | (28) | | | (31) | |
| | | | |
| Natural gas commodity contracts | | | | |
| Volume (Bcf) | | (136) | | | (117) | |
THE BERKSHIRE WARRANTS
Warrants for 80 million shares of Occidental stock, with an initial exercise price of $62.50, were issued in connection with the financing of the Acquisition (the Berkshire Warrants). The Berkshire Warrants are exercisable at the holder’s option, in whole or in part, until the first anniversary of the date on which no shares of preferred stock remain outstanding, at which time the Berkshire Warrants expire. The holders of the Berkshire Warrants could have required net cash settlement if certain shareholder and regulatory approvals to issue shares of Occidental’s common stock underlying the Berkshire Warrants were not obtained. Prior to these approvals, the fair value of the Berkshire Warrants was remeasured each reporting date with gains and losses being recorded on the income statement.
At Occidental’s May 29, 2020, annual shareholders meeting, all remaining approvals were obtained and the Berkshire Warrants can no longer be cash settled. Upon these approvals, the fair value of the Berkshire Warrants was remeasured on May 29, 2020, using the Black-Scholes option model. The reclassification from liabilities to “Additional paid-in capital” was $103 million.
The following inputs were used in the Black-Scholes option model: the expected life of the Berkshire Warrants, a volatility factor and the exercise price. The expected life is based on the estimated term of the Berkshire Warrants, the volatility factor is based on historical volatilities of Occidental common stock and the initial exercise price of $62.50.
The Berkshire Warrants contain an anti-dilution provision that adjusts the exercise price and the number of shares of Occidental’s common stock issuable on exercise upon the occurrence of certain distributions to common shareholders. On June 26, 2020, Occidental’s Board of Directors declared a distribution to its common shareholders of warrants to purchase additional shares of common stock, See Note 14 - Stockholders’ Equity. This distribution to common shareholders resulted in an anti-dilution adjustment to the Berkshire Warrants, which lowered its exercise price to $59.624 and increased the number of shares of Occidental’s common stock issuable on exercise of the Berkshire Warrants by approximately 3.9 million shares.
DERIVATIVES DESIGNATED AS HEDGING INSTRUMENTS
Net gains and losses attributable to derivative instruments subject to cash flow hedge accounting reside in accumulated other comprehensive loss and are reclassified to earnings as the transactions to which the derivatives relate, primarily interest expense on debt issued to partially finance the Acquisition, are recognized in earnings. The value of cash flow hedges was insignificant as of December 31, 2021 and 2020.
FAIR VALUE OF DERIVATIVES
Occidental has categorized its assets and liabilities that are measured at fair value in a three-level fair value hierarchy, based on the inputs to the valuation techniques: Level 1 – using quoted prices in active markets for the assets or liabilities; Level 2 – using observable inputs other than quoted prices for the assets or liabilities; and Level 3 – using unobservable inputs. Transfers between levels, if any, are reported at the end of each reporting period. The following table presents the fair values of Occidental’s outstanding derivatives. Fair values are presented at gross amounts below, including when derivatives are subject to netting arrangements, and are presented on a net basis in the Consolidated Balance Sheets.
| | | | | | | | |
| | FINANCIAL STATEMENTS FOOTNOTES |
| | | | | | | | | | | | | | | | | | | | | | | | | | | | | | | | |
| millions | | Fair Value Measurements Using | | | | Total Fair Value |
| Balance Sheet Classification | | Level 1 | | Level 2 | | Level 3 | | Netting (a) | |
| December 31, 2021 | | | | | | | | | | |
| | | | | | | | | | |
| | | | | | | | | | |
| | | | | | | | | | |
| Marketing Derivatives | | | | | | | | | | |
| Other current assets | | $ | 1,516 | | | $ | 173 | | | $ | — | | | $ | (1,645) | | | $ | 44 | |
| Long-term receivables and other assets, net | | 4 | | | 1 | | | — | | | (4) | | | 1 | |
| Accrued liabilities | | (1,608) | | | (196) | | | — | | | 1,645 | | | (159) | |
| Deferred credits and other liabilities - other | | (4) | | | — | | | — | | | 4 | | | — | |
| Interest Rate Swaps | | | | | | | | | | |
| Accrued liabilities | | — | | | (315) | | | — | | | — | | | (315) | |
| Deferred credits and other liabilities - other | | — | | | (436) | | | — | | | — | | | (436) | |
| | | | | | | | | | |
| December 31, 2020 | | | | | | | | | | |
| Collars and Calls | | | | | | | | | | |
| Other current assets | | $ | — | | | $ | 25 | | | $ | — | | | $ | — | | | $ | 25 | |
| Deferred credits and other liabilities - other | | — | | | (42) | | | — | | | — | | | (42) | |
| Marketing Derivatives | | | | | | | | | | — | |
| Other current assets | | 1,155 | | | 80 | | | — | | | (1,204) | | | 31 | |
| Long-term receivables and other assets, net | | 7 | | | 2 | | | — | | | (7) | | | 2 | |
| Accrued liabilities | | (1,252) | | | (81) | | | — | | | 1,204 | | | (129) | |
| Deferred credits and other liabilities - other | | (7) | | | — | | | — | | | 7 | | | — | |
| Interest Rate Swaps | | | | | | | | | | — | |
| | | | | | | | | | |
| | | | | | | | | | |
| Accrued liabilities | | — | | | (936) | | | — | | | — | | | (936) | |
| Deferred credits and other liabilities - other | | — | | | (822) | | | — | | | — | | | (822) | |
| | | | | | | | | | |
| | | | | | | | | | |
(a)These amounts do not include collateral. As of December 31, 2021, and December 31, 2020, $323 million and $374 million of collateral related to interest rate swaps had been netted against derivative liabilities, respectively. Occidental netted $110 million and $85 million of collateral deposited with brokers against derivative liabilities related to marketing derivatives as of December 31, 2021 and December 31, 2020, respectively.
GAINS AND LOSSES ON DERIVATIVES
The following table presents gains and (losses) related to Occidental’s derivative instruments in the consolidated condensed statements of operations for the years ended December 31:
| | | | | | | | | | | | | | | | | | | | | | | | |
| millions | | | | |
| Income Statement Classification | | | | | | 2021 | | 2020 | | 2019 |
| | | | | | | | | | |
| Collars and Calls | | | | | | | | | | |
| Net sales | | | | | | $ | (344) | | | $ | 1,064 | | | $ | (107) | |
| Marketing Derivatives | | | | | | | | | | |
Net sales (a) | | | | | | 338 | | | (393) | | | 1,804 | |
| Interest Rate Swaps (Excluding WES) | | | | | | | | | | |
| Gains (losses) on interest rate swaps and warrants, net | | | | | | 122 | | | (428) | | | 122 | |
Other (b) | | | | | | | | | | |
| Gains on interest rate swaps and warrants, net | | | | | | — | | | 5 | | | 111 | |
(a)Includes derivative and non-derivative marketing activity.
(b)Primarily includes losses and gains on Berkshire Warrants prior to the May 29, 2020 reclassification to equity.
CREDIT RISK
The majority of Occidental’s counterparty credit risk is related to the physical delivery of energy commodities to its customers and their inability to meet their settlement commitments. Occidental manages credit risk by selecting
| | | | | | | | |
| | FINANCIAL STATEMENTS FOOTNOTES |
counterparties that it believes to be financially strong, by entering into netting arrangements with counterparties and by requiring collateral or other credit risk mitigants, as appropriate. Occidental actively evaluates the creditworthiness of its counterparties, assigns appropriate credit limits and monitors credit exposures against those assigned limits. Occidental also enters into futures contracts through regulated exchanges with select clearinghouses and brokers, which are subject to minimal credit risk, if any.
Certain of Occidental’s OTC derivative instruments contain credit-risk-contingent features, primarily tied to credit ratings for Occidental or its counterparties, which may affect the amount of collateral that each party would need to post. The aggregate fair value of derivative instruments with credit-risk-contingent features for which a net liability position existed as of December 31, 2021 was $107 million (net of $323 million collateral), which was primarily related to interest rate swaps. The aggregate fair value of derivative instruments with credit-risk-contingent features for which a net liability position existed as of December 31, 2020 was $104 million (net of $374 million of collateral), which was primarily related to interest rate swaps.
| | |
| NOTE 9 - FAIR VALUE MEASUREMENTS |
FAIR VALUES – RECURRING
In January 2012, Occidental entered into a long-term contract to purchase CO2. This contract contained a price adjustment clause that was not clearly and closely related to the host contract and Occidental accounted for it at fair value in the consolidated financial statements. In December 2021, the price adjustment clause related to the contract expired and no longer is recognized at fair value.
FAIR VALUES – NONRECURRING
2021:
For the year ended December 31, 2021, Occidental recorded pre-tax impairments of $276 million related to undeveloped leases that either expired or were set to expire in the near-term, where Occidental had no plans to pursue exploration activities.
2020:
The table below summarizes the significant impairments and other charges incurred to measure assets to their fair value on a nonrecurring basis throughout the year ended December 31, 2020:
| | | | | | | | |
| millions | | Total Fair Value |
| Asset impairments and other charges | | |
| Goodwill | | $ | 1,153 | |
| Oil and gas properties - proved | | $ | 2,436 | |
| Oil and gas properties - unproved | | $ | 4,591 | |
| Oil and gas properties - discontinued operations | | $ | 2,191 | |
| WES equity investment | | $ | 2,673 | |
GOODWILL
In the first quarter of 2020, Occidental impaired $1.2 billion in goodwill related to Occidental’s ownership in WES, which was previously included in long-term receivables and other assets, net. The market value of WES’ publicly traded units is considered a Level 1 input.
OIL AND GAS PROPERTIES
In the second quarter of 2020, as a result of the expected prolonged period of lower commodity prices brought on by the COVID-19 pandemic’s impact on oil demand, Occidental tested substantially all of its oil and gas assets for impairment. Occidental recognized total pre-tax impairments to its oil and gas proved and unproved properties of $8.6 billion, of which $6.4 billion was included in oil and gas segment results and $2.2 billion ($1.4 billion net of tax) related to Ghana was included in discontinued operations.
In the second quarter of 2020, Occidental recorded proved property pre-tax impairments of $1.2 billion primarily related to certain assets for its domestic onshore and Gulf of Mexico assets and $0.9 billion to adjust the Algeria oil and gas proved properties to their fair value. The fair value of the proved properties was measured based on the income approach.
Unproved property pre-tax impairments of $4.3 billion were primarily related to domestic onshore unproved acreage. The fair value of this acreage was measured based on a market approach using an implied acreage valuation derived from domestic onshore market participants excluding the fair value assigned to proved properties.
| | | | | | | | |
| | FINANCIAL STATEMENTS FOOTNOTES |
Income approaches are considered Level 3 fair value estimates and include significant assumptions of future production and timing of production, commodity price assumptions and operating and capital cost estimates, discounted using a 10 percent weighted average cost of capital. Taxes were based on current statutory rates. Future production and timing of production is based on internal reserves estimates and internal economic models for a specific oil and gas asset. Internal reserve estimates consist of proved reserves and unproved reserves, the latter adjusted for uncertainty based on reserve category. Price assumptions were based on a combination of market information and published industry resources adjusted for historical differentials. Price assumptions ranged from approximately $40 per barrel of oil in 2020 increasing to approximately $70 per barrel of oil in 2034, with an unweighted arithmetic average price of $59.17 and $62.42 for WTI and Brent indexed assets for the 15 year period, respectively. Natural gas prices ranged from approximately $2.00 per Mcf in 2020 to approximately $3.60 per Mcf in 2034, with an unweighted arithmetic average price of $3.13 for NYMEX based assets for the 15 year period. Both oil and natural gas commodity prices were held flat after 2034 and were adjusted for location and quality differentials. Operating and capital cost estimates were based on current observable costs and were further escalated 1 percent in every period where commodity prices exceeded $50 per barrel and 2 percent in every period where commodity prices exceeded $60 per barrel. The weighted average cost of capital is calculated based on industry peers and best approximates the cost of capital an external market participant would expect to obtain.
In the first quarter of 2020, Occidental's oil and gas segment recognized pre-tax impairment and related charges of $581 million primarily related to both proved and unproved oil and gas properties and a lower of cost or net realizable value adjustment for crude inventory. Occidental recorded proved property impairments of $293 million related to certain international assets and the Gulf of Mexico. Occidental recorded unproved property impairments, of approximately $241 million, primarily related to domestic onshore undeveloped leases and offshore Gulf of Mexico where Occidental no longer intends to pursue exploration, appraisal or development activities primarily due to the reduction in near-term capital plans.
If there is an adverse downturn of the macroeconomic conditions and if such downturn is expected to or does persist for a prolonged period of time, Occidental’s oil and gas properties may be subject to further testing for impairment, which could result in additional non-cash asset impairments. Such impairments could be material to the financial statements.
WES EQUITY INVESTMENT
At the end of the third quarter of 2020, Occidental recorded an other-than-temporary impairment of $2.7 billion, as the fair value of Occidental’s investment in WES had remained significantly lower than its book value for the majority of the nine months ended September 30, 2020. Occidental concluded that the difference between the fair value and book value of WES was not temporary, primarily given both the magnitude and the duration that the fair value was below its book value. This other-than-temporary impairment was calculated based on the closing market price of WES as of September 30, 2020. The market value of WES’ publicly traded common units is considered a Level 1 input.
FINANCIAL INSTRUMENTS FAIR VALUE
The carrying amounts of cash, cash equivalents, restricted cash, restricted cash equivalents and other on-balance sheet financial instruments, other than fixed-rate debt, approximate fair value. See Note 6 - Long-Term Debt for the fair value of long-term debt.
| | | | | | | | |
| | FINANCIAL STATEMENTS FOOTNOTES |
The following summarizes domestic and foreign components of income (loss) from continuing operations before domestic and foreign income taxes for the years ended December 31:
| | | | | | | | | | | | | | | | | | | | |
| millions | | 2021 | | 2020 | | 2019 |
| Domestic | | $ | 1,966 | | | $ | (15,322) | | | $ | (1,632) | |
| Foreign | | 1,739 | | | (383) | | | 1,986 | |
| Total | | $ | 3,705 | | | $ | (15,705) | | | $ | 354 | |
The following summarizes components of income tax expense (benefit) on continuing operations for the years ended December 31:
| | | | | | | | | | | | | | | | | | | | |
| millions | | 2021 | | 2020 | | 2019 |
| Current | | | | | | |
| Federal | | $ | 173 | | | $ | (126) | | | $ | 33 | |
| State and Local | | 36 | | | 6 | | | 46 | |
| Foreign | | 660 | | | 465 | | | 1,809 | |
| Total current tax expense | | $ | 869 | | | $ | 345 | | | $ | 1,888 | |
| Deferred | | | | | | |
| Federal | | 191 | | | (2,384) | | | (130) | |
| State and Local | | (153) | | | (103) | | | 17 | |
| Foreign | | 8 | | | (30) | | | (914) | |
| Total deferred tax expense (benefit) | | $ | 46 | | | $ | (2,517) | | | $ | (1,027) | |
| Total income tax expense (benefit) | | $ | 915 | | | $ | (2,172) | | | $ | 861 | |
The following reconciliation of the U.S federal statutory income tax rate to Occidental’s worldwide effective tax rate on income from continuing operations for the years ended December 31 is stated as a percentage of income (loss) from continuing operations before income taxes:
| | | | | | | | | | | | | | | | | | | | |
| | 2021 | | 2020 | | 2019 |
| U.S. federal statutory tax rate | | 21 | % | | 21 | % | | 21 | % |
| Enhanced oil recovery credit and other general business credits | | (3) | | | — | | | (2) | |
| Goodwill impairment | | — | | | (3) | | | — | |
| Capital loss | | (2) | | | — | | | — | |
| Tax impact from foreign operations | | 8 | | | (4) | | | 135 | |
| State income taxes, net of federal benefit | | (2) | | | — | | | 14 | |
| Uncertain tax positions | | — | | | — | | | 7 | |
| Transaction costs | | — | | | — | | | 10 | |
| Non-controlling interest | | — | | | — | | | (8) | |
| Executive compensation limitation | | 1 | | | — | | | 12 | |
| Stock warrants | | — | | | — | | | (5) | |
| WES loss of control | | — | | | — | | | 58 | |
| Other | | 2 | | | — | | | 1 | |
| Worldwide effective tax rate | | 25 | % | | 14 | % | | 243 | % |
In 2021, Occidental’s worldwide effective tax rate was 25%, which was higher than the U.S. statutory rate of 21% due to higher tax rates in the foreign jurisdictions in which Occidental operates, partially offset by the tax impact of business credits, state tax revaluations and other domestic tax benefits.
| | | | | | | | |
| | FINANCIAL STATEMENTS FOOTNOTES |
In 2020, Occidental’s worldwide effective tax rate was 14%, which was largely a result of the impairment of the WES goodwill and certain international assets for which Occidental received no tax benefit and higher-taxed international operations which generally caused Occidental’s tax rate to vary significantly from the U.S. corporate tax rate.
The tax effects of temporary differences resulting in deferred income taxes as of December 31:
| | | | | | | | | | | | | | |
| millions | | 2021 | | 2020 |
| Deferred tax liabilities | | | | |
| Property, plant and equipment differences | | $ | (9,905) | | | $ | (10,744) | |
| Equity investments, partnerships and international subsidiaries | | (571) | | | (658) | |
| Gross long-term deferred tax liabilities | | (10,476) | | | (11,402) | |
| | | | |
| Deferred tax assets | | | | |
| Environmental reserves | | 242 | | | 257 | |
| Postretirement benefit accruals | | 285 | | | 398 | |
| Deferred compensation and benefits | | 286 | | | 186 | |
| Asset retirement obligations | | 850 | | | 942 | |
| Foreign tax credit carryforwards | | 3,904 | | | 4,465 | |
| General business credit carryforwards | | 698 | | | 607 | |
| Net operating loss carryforward | | 1,628 | | | 1,797 | |
| Interest expense carryforward | | 28 | | | 668 | |
| All other | | 689 | | | 720 | |
| Gross long-term deferred tax assets | | 8,610 | | | 10,040 | |
| Valuation allowance | | (5,136) | | | (5,695) | |
| Net long-term deferred tax assets | | $ | 3,474 | | | $ | 4,345 | |
| Total deferred income tax liability, net | | $ | (7,002) | | | $ | (7,057) | |
| Less: foreign deferred tax asset in long-term receivables and other assets, net | | (37) | | | (56) | |
| Total deferred income tax liability, gross | | $ | (7,039) | | | $ | (7,113) | |
Total deferred tax assets, after valuation allowances, were $3.5 billion and $4.3 billion as of December 31, 2021, and 2020, respectively. Occidental expects to realize the recorded deferred tax assets, net of any allowances, through future operating income and reversal of temporary differences. The total deferred tax liabilities were $10.5 billion and $11.4 billion as of December 31, 2021 and 2020, respectively. The decrease in the net deferred tax liability in 2021 compared to 2020 was primarily driven by the impact of lower capital spending and domestic asset impairments for which Occidental does not receive an immediate tax benefit, partially offset by the utilization of net operating losses and other tax attributes.
As of December 31, 2021, Occidental had foreign tax credit carryforwards of $3.9 billion, federal general business credits carryforwards of $659 million and state tax credit carryforwards of $39 million. Occidental has recorded a valuation allowance for $3.9 billion of the foreign tax credit carryforwards and $34 million of the state tax credit carryforwards.
As of December 31, 2021, Occidental had tax-effected federal net operating loss carryforwards of $511 million, foreign net operating loss carryforwards of $833 million and state net operating loss carryforwards of $284 million. The carryforward balances have varying carryforward periods through 2041, excluding certain attributes for which there is an indefinite carryforward period. A valuation allowance was recorded for $244 million of the tax-effected state net operating loss carryforwards and $797 million of the tax-effected foreign net operating loss carryforwards. Occidental has an additional valuation allowance of $145 million against other foreign deferred tax assets.
Occidental had no tax-effected federal interest expense carryforward and tax-effected state interest expense carryforward of $28 million as of December 31, 2021. Occidental recorded a valuation allowance for $9 million of the state interest expense carryforward.
A deferred tax liability has not been recognized for temporary differences related to unremitted earnings of certain consolidated international subsidiaries aggregating approximately $916 million as of December 31, 2021, as it is Occidental’s intention to reinvest such earnings indefinitely. If the earnings of these international subsidiaries were not indefinitely reinvested, an additional deferred tax liability of approximately $219 million would be required.
As a result of a legal entity reorganization, management will make an adjustment to the tax basis in a portion of its operating assets, thus reducing Occidental’s deferred tax liabilities. Accordingly, in the first quarter of 2022, Occidental will record a one-time non-cash tax benefit that is currently estimated not to exceed $2.6 billion, in connection with this
| | | | | | | | |
| | FINANCIAL STATEMENTS FOOTNOTES |
reorganization. The timing of any reduction in Occidental’s future cash taxes as a result of this legal entity reorganization will be dependent on a number of factors, including prevailing commodity prices, capital activity level and production mix. Occidental will complete its review of its tax basis calculations, fair value assessments and other information and will finalize the adjustment to its deferred tax liabilities during the first quarter of 2022.
A reconciliation of the beginning and ending amount of unrecognized tax benefits is as follows:
| | | | | | | | | | | | | | | | | | | | |
| millions | | 2021 | | 2020 | | 2019 |
| Balance as of January 1 | | $ | 2,045 | | | $ | 2,173 | | | $ | — | |
| Increase related to Anadarko Acquisition | | — | | | — | | | 2,143 | |
| Increases related to prior-year positions | | 75 | | | 14 | | | 30 | |
| Settlements | | (80) | | | (42) | | | — | |
| Reductions for tax positions of prior years | | (14) | | | (100) | | | — | |
| Balance as of December 31 | | $ | 2,026 | | | $ | 2,045 | | | $ | 2,173 | |
The December 31, 2021 balance of unrecognized tax benefits of $2.0 billion included potential benefits of $2.0 billion of which, if recognized, $1.6 billion would affect the effective tax rate on income. Also included were benefits of $60 million related to tax positions for which the ultimate deductibility is highly certain, but the timing of such deductibility is uncertain. Occidental records estimated potential interest and penalties related to liabilities for unrecognized tax benefits in the provisions for domestic and foreign income taxes. During 2021, Occidental recorded interest related to liabilities for unrecognized tax benefits of $58 million, for a cumulative accrued interest related to liabilities for unrecognized tax benefits of $321 million as of December 31, 2021. There were no penalties associated with liabilities for unrecognized tax benefits recorded for the years ended December 31, 2021 and 2020. Over the next 12 months, it is reasonably possible that there will not be a decrease in the total amount of unrecognized tax benefits resulting from settlements with taxing authorities or statute of limitations lapses.
Occidental recognized $105 million and $110 million in federal and state income tax receivables as of December 31, 2021, and 2020, respectively, which was recorded in other current assets. In addition, Occidental recognized $33 million and $24 million associated with audits as of December 31, 2021 and 2020, respectively, both of which were recorded in long-term receivables and other assets, net.
| | |
| NOTE 11 - RETIREMENT AND POSTRETIREMENT BENEFIT PLANS |
Occidental has various defined contribution and defined benefit plans for its salaried, domestic union and nonunion hourly and certain foreign national employees. In addition, Occidental also provides medical and other benefits for certain active, retired and disabled employees and their eligible dependents.
Effective as of June 30, 2020 the defined benefit pension plans and certain of the supplemental plans covering active Anadarko employees were frozen. This resulted in a decrease to the benefit obligation of approximately $278 million, including a curtailment gain of approximately $124 million and a corresponding offset to accumulated OCI of approximately $154 million.
In 2021, Occidental settled a significant portion of retiree liability through an annuity purchase. This annuity purchase applied to participants in certain defined benefit plans. The impact of this settlement transaction was approximately $109 million and is reflected in the December 31, 2021 projected benefit obligation.
DEFINED CONTRIBUTION PLANS
All domestic employees and certain foreign national employees are eligible to participate in one or more of the defined contribution retirement or savings plans that provide for periodic contributions by Occidental based on plan-specific criteria, such as base pay, level and employee contributions. Certain salaried employees participate in a supplemental retirement plan that restores benefits lost due to governmental limitations on qualified retirement benefits. The accrued liabilities for the supplemental retirement plan were $249 million and $239 million as of December 31, 2021, and 2020, respectively. Occidental expensed $166 million in 2021, $192 million in 2020 and $192 million in 2019 under the provisions of these defined contribution and supplemental retirement plans.
| | | | | | | | |
| | FINANCIAL STATEMENTS FOOTNOTES |
DEFINED BENEFIT PLANS
Participation in defined benefit plans is limited. Approximately 400 domestic and 300 foreign national employees, mainly union, nonunion hourly and certain employees that joined Occidental from acquired operations with grandfathered benefits, are currently accruing benefits under these plans.
Pension costs for Occidental’s defined benefit pension plans, determined by independent actuarial valuations, are generally funded by payments to trust funds, which are administered by independent trustees.
POSTRETIREMENT AND OTHER BENEFIT PLANS
Occidental provides medical and dental benefits and life insurance coverage for certain active, retired and disabled employees and their eligible dependents. Occidental generally funds the benefits as they are paid during the year. These benefit costs, including the postretirement costs for the years ended December 31, were $211 million in 2021, $235 million in 2020 and $220 million in 2019.
OBLIGATIONS AND FUNDED STATUS
The following tables show the amounts recognized in Occidental’s consolidated balance sheets related to its pension and postretirement benefit plans as of December 31:
| | | | | | | | | | | | | | | | | | | | | | | | | | |
| | Pension Benefits | | Postretirement Benefits |
| millions | | 2021 | | 2020 | | 2021 | | 2020 |
| Amounts recognized in the consolidated balance sheet: | | | | | | | | |
| Long-term receivables and other assets, net | | $ | 192 | | | $ | 167 | | | $ | — | | | $ | — | |
| Accrued liabilities | | (4) | | | (9) | | | (71) | | | (74) | |
| Deferred credits and other liabilities — pension and postretirement obligations | | (391) | | | (578) | | | (1,149) | | | (1,185) | |
| | | $ | (203) | | | $ | (420) | | | $ | (1,220) | | | $ | (1,259) | |
| Accumulated other comprehensive loss included the following after-tax balances: | | | | | | | | |
| Net (gain) loss | | $ | (17) | | | $ | (3) | | | $ | 163 | | | $ | 226 | |
| Prior service credit | | — | | | — | | | (50) | | | (60) | |
| | | $ | (17) | | | $ | (3) | | | $ | 113 | | | $ | 166 | |
| | | | | | | | |
| | FINANCIAL STATEMENTS FOOTNOTES |
The following tables show the funding status, obligations and plan asset fair values of Occidental related to its pension and postretirement benefit plans for the years ended December 31:
| | | | | | | | | | | | | | | | | | | | | | | | | | |
| | Pension Benefits | | Postretirement Benefits |
| millions | | 2021 | | 2020 | | 2021 | | 2020 |
| Changes in the benefit obligation: | | | | | | | | |
| Benefit obligation — beginning of year | | $ | 1,613 | | | $ | 2,508 | | | $ | 1,259 | | | $ | 1,175 | |
| Service cost — benefits earned during the period | | 8 | | | 37 | | | 42 | | | 39 | |
| Interest cost on projected benefit obligation | | 35 | | | 52 | | | 33 | | | 37 | |
| Actuarial (gain) loss | | (55) | | | 251 | | | (54) | | | 73 | |
| Curtailment (gain) loss | | — | | | (278) | | | — | | | 2 | |
| Special termination benefits | | — | | | 23 | | | — | | | — | |
| Benefits paid | | (219) | | | (948) | | | (67) | | | (73) | |
| Sale of Colombia assets | | — | | | (24) | | | — | | | — | |
| Settlement due to annuity purchase | | (109) | | | — | | | — | | | — | |
| Other | | — | | | (8) | | | 7 | | | 6 | |
| Benefit obligation — end of year | | $ | 1,273 | | | $ | 1,613 | | | $ | 1,220 | | | $ | 1,259 | |
| | | | | | | | |
| Changes in plan assets: | | | | | | | | |
| Fair value of plan assets — beginning of year | | $ | 1,193 | | | $ | 1,841 | | | $ | — | | | $ | — | |
| Actual return on plan assets | | 44 | | | 161 | | | — | | | — | |
| Employer contributions | | 162 | | | 146 | | | 59 | | | 67 | |
| Benefits paid | | (219) | | | (948) | | | (67) | | | (73) | |
| Payments due to annuity purchase | | (109) | | | — | | | — | | | — | |
| Other | | (1) | | | (7) | | | 8 | | | 6 | |
| Fair value of plan assets — end of year | | $ | 1,070 | | | $ | 1,193 | | | $ | — | | | $ | — | |
| Unfunded status: | | $ | (203) | | | $ | (420) | | | $ | (1,220) | | | $ | (1,259) | |
Changes in actuarial gains and losses in the projected benefit obligation are primarily driven by discount rate movement.
The following table sets forth details of the obligations and assets of Occidental’s defined benefit pension plans for the years ended December 31:
| | | | | | | | | | | | | | | | | | | | | | | | | | |
| | Accumulated Benefit
Obligation in Excess of
Plan Assets | | Plan Assets in
Excess of Accumulated
Benefit Obligation |
| millions | | 2021 | | 2020 | | 2021 | | 2020 |
| Projected benefit obligation | | $ | 963 | | | $ | 1,226 | | | $ | 310 | | | $ | 387 | |
| Accumulated benefit obligation | | $ | 960 | | | $ | 1,221 | | | $ | 308 | | | $ | 379 | |
| Fair value of plan assets | | $ | 656 | | | $ | 670 | | | $ | 414 | | | $ | 523 | |
| | | | | | | | |
| | FINANCIAL STATEMENTS FOOTNOTES |
COMPONENTS OF NET PERIODIC BENEFIT COST
The following table sets forth the components of net periodic benefit costs for the years ended December 31:
| | | | | | | | | | | | | | | | | | | | | | | | | | | | | | | | | | | | | | |
| | Pension Benefits | | Postretirement Benefits |
| millions | | 2021 | | 2020 | | 2019 | | 2021 | | 2020 | | 2019 |
| Net periodic benefit costs: | | | | | | | | | | | | |
| Service cost — benefits earned during the period | | $ | 8 | | | $ | 37 | | | $ | 47 | | | $ | 42 | | | $ | 39 | | | $ | 24 | |
| Interest cost on projected benefit obligation | | 35 | | | 52 | | | 40 | | | 33 | | | 37 | | | 36 | |
| Expected return on plan assets | | (59) | | | (73) | | | (52) | | | — | | | — | | | — | |
| Recognized actuarial loss | | 2 | | | 5 | | | 9 | | | 15 | | | 11 | | | 8 | |
| Recognized prior service credit | | — | | | — | | | — | | | (9) | | | (8) | | | (8) | |
| (Gain) loss due to curtailment | | — | | | (124) | | | (91) | | | — | | | 2 | | | 6 | |
| Gain due to settlement | | (19) | | | (19) | | | — | | | — | | | — | | | — | |
| Special termination benefits | | — | | | 22 | | | 49 | | | — | | | — | | | — | |
| Other costs and adjustments | | — | | | 1 | | | (2) | | | — | | | — | | | — | |
| Net periodic benefit cost | | $ | (33) | | | $ | (99) | | | $ | — | | | $ | 81 | | | $ | 81 | | | $ | 66 | |
The service cost component of net periodic benefit cost is included in selling, general and administrative, oil and gas operating expense, chemical and midstream costs and exploration expense on Occidental’s Consolidated Statements of Operations. All other components of net periodic benefit cost are included in other operating and non-operating expense.
ADDITIONAL INFORMATION
The following table sets forth the weighted-average assumptions used to determine Occidental’s benefit obligation and net periodic benefit cost for domestic plans for the years ended December 31:
| | | | | | | | | | | | | | | | | | | | | | | | | | |
| | | Pension Benefits | | Postretirement Benefits |
| | 2021 | | 2020 | | 2021 | | 2020 |
| Benefit Obligation Assumptions: | | | | | | | | |
| Discount rate | | 2.67 | % | | 2.19 | % | | 2.94 | % | | 3.05 | % |
| Rate of increase in compensation levels | | 3.98 | % | | 5.07 | % | | — | | | — | |
| Net Periodic Benefit Cost Assumptions: | | | | | | | | |
| Discount rate | | 2.19 | % | | 3.04 | % | | 3.05 | % | | 3.26 | % |
| Rate of increase in compensation levels | | 5.07 | % | | 5.34 | % | | — | | | — | |
| Assumed long-term rate of return on assets | | 4.92 | % | | 6.02 | % | | — | | | — | |
For domestic pension plans and postretirement benefit plans, Occidental based the discount rate on a AA-AAA Universe yield curve in 2021 and 2020. The assumed long-term rate of return on assets is estimated with regard to current market factors but within the context of historical returns for the asset mix that exists at year end. Assumed rates of compensation increases for active participants in certain plans and vary by age group.
In 2020, Occidental adopted the Society of Actuaries Pri-2012 Private Retirement Plans Mortality Tables with MP-2020 Mortality Improvement Scale, which updated the mortality assumptions that private defined-benefit plans in the United States use in the actuarial valuations that determine a plan sponsor’s pension obligations. The new mortality assumption reflects additional data that the Social Security Administration has released since the previous mortality tables and improvement scales were released.
The postretirement benefit obligation was determined by application of the terms of medical and dental benefits and life insurance coverage, including the effect of established maximums on covered costs, together with relevant actuarial assumptions and health care cost trend rates. Health care cost trend rates for Medicare advantaged prescription drug (MAPD) plans of 9.6% starting in 2021, then grading down to 4.5% in 2028 and beyond. Health care cost trend rates used for non-MAPD plans are 6.3% to 6.8% in 2021, then grading down to 4.5% in 2028 and beyond.
The actuarial assumptions used could change in the near-term as a result of changes in expected future trends and other factors that, depending on the nature of the changes, could cause increases or decreases in the plan assets and liabilities.
| | | | | | | | |
| | FINANCIAL STATEMENTS FOOTNOTES |
FAIR VALUE OF PENSION PLAN ASSETS
Qualified defined benefit plan assets are monitored by Occidental’s Pension and Retirement Trust and Investment Committee in its role as a fiduciary. The Investment Committee selects and employs various external professional investment management firms to manage specific investments across the spectrum of asset classes. The Investment Committee employs a liability driven investment approach that uses a diversified blend of investments (equity securities, fixed-income securities, and alternative investments) along a glide path to optimize the long-term return of plan assets relative to plan liabilities, at a prudent level of risk. Equity investments are diversified across U.S. and non-U.S. stocks, as well as differing styles and market capitalizations. Investment performance is measured and monitored on an ongoing basis through quarterly investment portfolio and manager guideline compliance reviews, annual liability measurements and periodic studies.
The fair values of Occidental’s pension plan assets by asset category were as follows:
| | | | | | | | | | | | | | | | | | | | | | | | | | |
| millions | | Level 1 | | Level 2 | | Level 3 | | Total |
| December 31, 2021 | | | | | | | | |
| Asset Class: | | | | | | | | |
| Cash and cash equivalents | | $ | 19 | | | $ | — | | | $ | — | | | $ | 19 | |
| Government securities | | 63 | | | — | | | — | | | 63 | |
Corporate bonds (a) | | — | | | 36 | | | — | | | 36 | |
Equity securities (b) | | 46 | | | — | | | — | | | 46 | |
| Other | | — | | | 76 | | | — | | | 76 | |
| Investments measured at fair value | | $ | 128 | | | $ | 112 | | | $ | — | | | $ | 240 | |
Investments measured at net asset value (c) | | — | | | — | | | — | | | 836 | |
Total pension plan assets (d) | | $ | 128 | | | $ | 112 | | | $ | — | | | $ | 1,076 | |
| | | | | | | | |
| December 31, 2020 | | | | | | | | |
| Asset Class: | | | | | | | | |
| Cash and cash equivalents | | $ | 38 | | | $ | — | | | $ | — | | | $ | 38 | |
| Government securities | | 65 | | | — | | | — | | | 65 | |
Corporate bonds (a) | | — | | | 39 | | | — | | | 39 | |
Equity securities (b) | | 138 | | | — | | | — | | | 138 | |
| Other | | — | | | 55 | | | — | | | 55 | |
| Investments measured at fair value | | $ | 241 | | | $ | 94 | | | $ | — | | | $ | 335 | |
Investments measured at net asset value (c) | | — | | | — | | | — | | | 861 | |
Total pension plan assets (d) | | $ | 241 | | | $ | 94 | | | $ | — | | | $ | 1,196 | |
(a)This category represents investment grade bonds of U.S. and non-U.S. issuers from diverse industries.
(b)This category represents direct investments in mutual funds and common and preferred stocks from diverse U.S. and non-U.S. industries.
(c)Certain investments measured at fair value using the NAV per share (or its equivalent) have not been categorized in the fair value hierarchy. Amounts presented in this table are intended to reconcile the fair value hierarchy to the pension plan assets.
(d)Amounts exclude net payables of approximately $6 million as of December 31, 2021 and $3 million as of December 31, 2020.
Occidental expects to contribute an immaterial amount in cash to its defined benefit pensions plans during 2022.
| | | | | | | | |
| | FINANCIAL STATEMENTS FOOTNOTES |
Estimated future benefit payments, which reflect expected future service, as appropriate, are as follows for the years ended December 31:
| | | | | | | | | | | | | | |
| millions | Pension Benefits | Postretirement Benefits |
| 2022 | | $ | 130 | | | $ | 72 | |
| 2023 | | 73 | | | 70 | |
| 2024 | | 77 | | | 68 | |
| 2025 | | 71 | | | 66 | |
| 2026 | | 68 | | | 64 | |
| 2027 - 2031 | | 318 | | | 306 | |
| | |
| NOTE 12 - ENVIRONMENTAL LIABILITIES AND EXPENDITURES |
Occidental’s operations are subject to stringent federal, state, local and international laws and regulations related to improving or maintaining environmental quality. The laws that require or address environmental remediation, including CERCLA and similar federal, state, local and international laws, may apply retroactively and regardless of fault, the legality of the original activities or the current ownership or control of sites. Occidental or certain of its subsidiaries participate in or actively monitor a range of remedial activities and government or private proceedings under these laws with respect to alleged past practices at operating, closed and third-party sites. Remedial activities may include one or more of the following: investigation involving sampling, modeling, risk assessment or monitoring; cleanup measures including removal, treatment or disposal; or operation and maintenance of remedial systems. The environmental proceedings seek funding or performance of remediation and, in some cases, compensation for alleged property damage, punitive damages, civil penalties, injunctive relief and government oversight costs.
ENVIRONMENTAL REMEDIATION
As of December 31, 2021, Occidental participated in or monitored remedial activities or proceedings at 165 sites. The following table presents Occidental’s current and non-current environmental remediation liabilities as of December 31, 2021 and 2020, the current portion of which is included in accrued liabilities ($155 million in 2021 and $123 million in 2020) and the remainder in deferred credits and other liabilities - environmental remediation liabilities ($0.9 billion in 2021 and $1.0 billion in 2020).
Occidental’s environmental remediation sites are grouped into four categories: NPL sites listed or proposed for listing by the EPA on the CERCLA NPL and three categories of non-NPL sites — third-party sites, Occidental-operated sites and closed or non-operated Occidental sites.
| | | | | | | | | | | | | | | | | | | | | | | | | | |
| | 2021 | | 2020 |
| millions, except number of sites | | Number of Sites | | Remediation Balance | | Number of Sites | | Remediation Balance |
| NPL sites | | 30 | | | $ | 427 | | | 35 | | | $ | 447 | |
| Third-party sites | | 69 | | | 273 | | | 69 | | | 293 | |
| Occidental-operated sites | | 15 | | | 122 | | | 17 | | | 144 | |
| Closed or non-operated Occidental sites | | 51 | | | 277 | | | 49 | | | 267 | |
| Total | | 165 | | | $ | 1,099 | | | 170 | | | $ | 1,151 | |
As of December 31, 2021, Occidental’s environmental liabilities exceeded $10 million each at 20 of the 165 sites described above, and 96 of the sites had liabilities from $0 to $1 million each. As of December 31, 2021, two sites — the Maxus-indemnified Diamond Alkali Superfund Site and a landfill in Western New York — accounted for 96% of its liabilities associated with NPL sites. 14 of the 30 NPL sites are indemnified by Maxus.
Five of the 69 third-party sites — a Maxus-indemnified chrome site in New Jersey, a former copper mining and smelting operation in Tennessee, a former oil field and a landfill in California and an active refinery in Louisiana where Occidental reimburses the current owner for certain remediation activities — accounted for 75% of Occidental’s liabilities associated with these sites. Nine of the 69 third-party sites are indemnified by Maxus.
Four sites — oil and gas operations in Colorado and chemical plants in Kansas, Louisiana and Texas — accounted for 69% of the liabilities associated with the Occidental-operated sites. Ten other sites — a landfill in Western New York, a former refinery in Oklahoma, former chemical plants in California, Delaware, Michigan, New York, Ohio, Tennessee and
| | | | | | | | |
| | FINANCIAL STATEMENTS FOOTNOTES |
Washington, and a closed coal mine in Pennsylvania — accounted for 75% of the liabilities associated with closed or non-operated Occidental sites.
Environmental remediation liabilities vary over time depending on factors such as acquisitions or divestitures, identification of additional sites and remedy selection and implementation. Occidental recorded environmental remediation expenses of $28 million, $36 million and $112 million for the years ended December 31, 2021, 2020, and 2019, respectively. Environmental remediation expenses primarily relate to changes to existing conditions from past operations. Based on current estimates, Occidental expects to expend funds corresponding to approximately 40% of the year-end remediation balance over the next three to four years with the remainder over the subsequent 10 or more years. Occidental believes its range of reasonably possible additional losses beyond those amounts currently recorded for environmental remediation for all of its environmental sites could be up to $1.3 billion.
MAXUS ENVIRONMENTAL SITES
When Occidental acquired DSCC in 1986, Maxus agreed to indemnify Occidental for a number of environmental sites, including the Diamond Alkali Superfund Site (Site) along a portion of the Passaic River. On June 17, 2016, Maxus and several affiliated companies filed for Chapter 11 bankruptcy in Federal District Court in the State of Delaware. Prior to filing for bankruptcy, Maxus defended and indemnified Occidental in connection with clean-up and other costs associated with the sites subject to the indemnity, including the Site.
In March 2016, the EPA issued a ROD specifying remedial actions required for the lower 8.3 miles of the Lower Passaic River. The ROD does not address any potential remedial action for the upper nine miles of the Lower Passaic River or Newark Bay. During the third quarter of 2016, and following Maxus’s bankruptcy filing, Occidental and the EPA entered into an AOC to complete the design of the proposed clean-up plan outlined in the ROD with an estimated cost of $165 million. The EPA announced that it will pursue similar agreements with other potentially responsible parties.
Occidental has accrued a reserve relating to its estimated allocable share of the costs to perform the design and remediation called for in the AOC and the ROD, as well as for certain other Maxus-indemnified sites. Occidental's accrued estimated environmental reserve does not consider any recoveries for indemnified costs. Occidental’s ultimate share of this liability may be higher or lower than the reserved amount and is subject to final design plans and the resolution of Occidental's allocable share with other potentially responsible parties. Occidental continues to evaluate the costs to be incurred to comply with the AOC and the ROD and to perform remediation at other Maxus-indemnified sites in light of the Maxus bankruptcy and the share of ultimate liability of other potentially responsible parties. In June 2018, Occidental filed a complaint under CERCLA in Federal District Court in the State of New Jersey against numerous potentially responsible parties for reimbursement of amounts incurred or to be incurred to comply with the AOC and the ROD, or to perform other remediation activities at the Site.
In September 2021, the EPA issued a ROD with an estimated cost of $441 million for an interim remedy plan for the upper nine miles of the Lower Passaic River. At this time, Occidental’s role or responsibilities under this ROD, and those of other potentially responsible parties, have not been determined with the EPA. Discussions between Occidental and the EPA are ongoing about this ROD.
In June 2017, the court overseeing the Maxus bankruptcy approved a Plan to liquidate Maxus and create a trust to pursue claims against current and former parents YPF and Repsol, as well as others to satisfy claims by Occidental and other creditors for past and future cleanup and other costs. In July 2017, the court-approved Plan became final and the trust became effective. The trust is pursuing claims against YPF, Repsol and others and is expected to distribute assets to Maxus' creditors in accordance with the trust agreement and Plan. In June 2018, the trust filed its complaint against YPF and Repsol in Delaware bankruptcy court asserting claims based upon, among other things, fraudulent transfer and alter ego. During 2019, the bankruptcy court denied Repsol's and YPF's motions to dismiss the complaint as well as their motions to move the case away from the bankruptcy court. Discovery remains ongoing.
| | |
| NOTE 13 - LAWSUITS, CLAIMS, COMMITMENTS AND CONTINGENCIES |
LEGAL MATTERS
Occidental or certain of its subsidiaries are involved, in the normal course of business, in lawsuits, claims and other legal proceedings that seek, among other things, compensation for alleged personal injury, breach of contract, property damage or other losses, punitive damages, civil penalties, or injunctive or declaratory relief. Occidental or certain of its subsidiaries also are involved in proceedings under CERCLA and similar federal, state, local and international environmental laws. These environmental proceedings seek funding or performance of remediation and, in some cases, compensation for alleged property damage, punitive damages, civil penalties and injunctive relief. Usually Occidental or such subsidiaries are among many companies in these environmental proceedings and have to date been successful in sharing response costs with other financially sound companies. Further, some lawsuits, claims and legal proceedings involve acquired or disposed assets with respect to which a third party or Occidental retains liability or indemnifies the other party for conditions that existed prior to the transaction.
In accordance with applicable accounting guidance, Occidental accrues reserves for outstanding lawsuits, claims and proceedings when it is probable that a liability has been incurred and the liability can be reasonably estimated. Reserves for
| | | | | | | | |
| | FINANCIAL STATEMENTS FOOTNOTES |
matters, other than for environmental remediation and the arbitration award disclosed below, that satisfy this criteria as of December 31, 2021 and 2020, were not material to Occidental’s Consolidated Balance Sheets.
In 2016, Occidental received payments from the Republic of Ecuador of approximately $1.0 billion pursuant to a November 2015 arbitration award for Ecuador’s 2006 expropriation of Occidental’s Participation Contract for Block 15. The awarded amount represented a recovery of 60% of the value of Block 15. In 2017, Andes filed a demand for arbitration, claiming it is entitled to a 40% share of the judgment amount obtained by Occidental. Occidental contends that Andes is not entitled to any of the amounts paid under the 2015 arbitration award because Occidental’s recovery was limited to Occidental’s own 60% economic interest in the block. On March 26, 2021, the arbitration tribunal issued an award in favor of Andes and against OEPC in the amount of $391 million plus interest. In June 2021, OEPC filed a motion to vacate the award due to concerns regarding the validity of the award. In addition, OEPC has made a demand for significant additional claims not addressed by the arbitration tribunal that OEPC has against Andes relating to Andes' 40% share of costs, liabilities, losses and expenses due under the farmout agreement and joint operating agreement to which Andes and OEPC are parties. In December 2021, the U.S. District Court Southern District of New York confirmed the arbitration award, plus prejudgment interest, in the aggregate amount of $558 million. OEPC has appealed the judgement.
In August 2019, Sanchez filed voluntary petitions for reorganization under Chapter 11 of the United States Bankruptcy Code. Sanchez is a party to agreements with Anadarko as a result of its 2017 purchase of Anadarko's Eagle Ford Shale assets. Sanchez attempted to reject some of the agreements related to the Bankruptcy Litigation. If Sanchez was permitted to reject certain of those agreements, then Anadarko may owe deficiency payments to various third parties. In December 2021, Occidental and certain of its affiliates entered into an agreement to resolve the Bankruptcy Litigation. Occidental recorded a contingency reserve as of September 30, 2021, associated with the settlement.
If unfavorable outcomes of these matters were to occur, future results of operations or cash flows for any particular quarterly or annual period could be materially adversely affected. Occidental’s estimates are based on information known about the legal matters and its experience in contesting, litigating and settling similar matters. Occidental reassesses the probability and estimability of contingent losses as new information becomes available.
TAX MATTERS
During the course of its operations, Occidental is subject to audit by tax authorities for varying periods in various federal, state, local and international tax jurisdictions. Tax years through 2017 for U.S. federal income tax purposes have been audited by the IRS pursuant to its Compliance Assurance Program and subsequent taxable years are currently under review. Tax years through 2012 have been audited for state income tax purposes. Significant audit matters in international jurisdictions have been resolved through 2010. During the course of tax audits, disputes have arisen and other disputes may arise as to facts and matters of law.
For Anadarko, its taxable years through 2014 and tax year 2016 for U.S. federal tax purposes have been audited by the IRS. Tax years through 2008 have been audited for state income tax purposes. There is one outstanding significant tax matter in an international jurisdiction related to a discontinued operation. As stated above, during the course of tax audits, disputes have arisen and other disputes may arise as to facts and matters of law.
Other than the matter discussed below, Occidental believes that the resolution of these outstanding tax matters would not have a material adverse effect on its consolidated financial position or results of operations.
Anadarko received an $881 million tentative refund in 2016 related to its $5.2 billion Tronox Adversary Proceeding settlement payment in 2015. In September 2018, Anadarko received a statutory notice of deficiency from the IRS disallowing the net operating loss carryback and rejecting Anadarko’s refund claim. As a result, Anadarko filed a petition with the U.S. Tax Court to dispute the disallowances in November 2018. The case was in the IRS appeals process until the second quarter of 2020, however it has since been returned to the U.S. Tax Court, where a trial date has been set for July 2022 and Occidental expects to continue pursuing resolution.
In accordance with ASC 740’s guidance on the accounting for uncertain tax positions, Occidental has recorded no tax benefit on the tentative cash tax refund of $881 million. As a result, should Occidental not ultimately prevail on the issue, there would be no additional tax expense recorded relative to this position for financial statement purposes other than future interest. However, in that event, Occidental would be required to repay approximately $1 billion in federal taxes, $27 million in state taxes and accrued interest of $314 million. A liability for this amount plus interest is included in deferred credits and other liabilities-other.
INDEMNITIES TO THIRD PARTIES
Occidental, its subsidiaries, or both, have indemnified various parties against specified liabilities those parties might incur in the future in connection with purchases and other transactions that they have entered into with Occidental. These indemnities usually are contingent upon the other party incurring liabilities that reach specified thresholds. As of December 31, 2021, Occidental is not aware of circumstances that it believes would reasonably be expected to lead to indemnity claims that would result in payments materially in excess of reserves.
PURCHASE OBLIGATIONS AND COMMITMENTS
Occidental, its subsidiaries, or both, have entered into agreements providing for future payments, primarily to secure terminal and pipeline capacity, and also for drilling rigs and services, electrical power, steam and certain chemical raw
| | | | | | | | |
| | FINANCIAL STATEMENTS FOOTNOTES |
materials. Occidental has certain other commitments under contracts, guarantees and joint ventures, including purchase commitments for goods and services at market-related prices and certain other contingent liabilities. As of December 31, 2021, total purchase obligations were $12.5 billion, which included approximately $3.0 billion in 2022, $4.3 billion in 2023 and 2024, $2.6 billion in 2025 and 2026, and $2.6 billion in 2027 and thereafter.
| | |
| NOTE 14 - STOCKHOLDERS’ EQUITY |
The following is a summary of common stock issuances:
| | | | | | | | |
| Shares in thousands | | Common Stock |
| Balance, December 31, 2018 | | 895,116 | |
| Issued | | 3,188 | |
Issued as part of the Acquisition (a) | | 146,131 | |
| Balance, December 31, 2019 | | 1,044,435 | |
| Issued | | 36,130 | |
| Balance, December 31, 2020 | | 1,080,565 | |
| Issued | | 2,522 | |
| Options exercised and other, net | | 336 | |
| Balance, December 31, 2021 | | 1,083,423 | |
(a)Included approximately two million shares of common stock issued to a benefits trust for former Anadarko employees treated as treasury stock as of December 31, 2019. These shares were sold from the trust in the first quarter of 2020.
TREASURY STOCK
The total number of shares authorized for Occidental’s share repurchase program is 185 million shares of which 44.2 million may yet be purchased under the repurchase program. However, the program does not obligate Occidental to acquire any specific number of shares and may be discontinued at any time. In 2021 and 2020, no shares were purchased under the program. In 2019, 2.7 million shares were purchased at an average price of $66.94. Additionally, Occidental purchased shares from the trustee of its defined contribution savings plan in 2021 and 2020. As of December 31, 2021, 2020 and 2019, treasury stock shares numbered 149.3 million, 149.1 million and 150.3 million, respectively.
PREFERRED STOCK
In connection with the Acquisition, Occidental issued 100,000 shares of series A preferred stock, having a face value of $100,000 per share and a liquidation preference of $105,000 per share plus unpaid accrued dividends. In connection with the preferred stock issuance, Occidental also issued the Warrant. The holder of the Warrant and the preferred stock may redeem the preferred stock as payment for the exercise price of the Warrant in lieu of cash payment upon exercise. The preferred stock is redeemable at Occidental’s option after the 10th anniversary of issuance. Dividends on the preferred stock will accrue on the face value at a rate per annum of 8%, but will be paid only when, as and if declared by Occidental’s Board of Directors. At any time, when such dividends have not been paid in full, the unpaid amounts will accrue dividends, compounded quarterly, at a rate per annum of 9%. Following the payment in full of any accrued but unpaid dividends, the dividend rate will remain at 9% per annum. If preferred dividends are not paid in full, Occidental is prohibited from paying dividends on common stock. Occidental paid $200 million in preferred stock dividends in each quarter of 2021.
As of December 31, 2021 and 2020, Occidental had 100,000 shares of preferred stock issued and outstanding, and none were outstanding in 2019.
COMMON STOCK WARRANTS
On June 26, 2020, the Board of Directors declared a distribution of warrants to holders of Occidental common stock, at a rate of 0.125 warrants per share of Occidental common stock (Common Stock Warrants). Occidental issued approximately 116 million Common Stock Warrants on August 3, 2020 to holders of record of outstanding shares of Occidental’s common stock as of the close of business on July 6, 2020, and pursuant to Occidental’s outstanding equity-based incentive awards in connection with anti-dilution adjustments resulting from such distribution. The Common Stock Warrants have an exercise price of $22.00 per share and will expire on August 3, 2027. The Common Stock Warrants are listed on the NYSE and trade under the symbol "OXY WS".
The Common Stock Warrants were measured at fair value on the declaration date using the Black-Scholes option model and were classified as equity in "Additional paid-in capital". The following level 2 inputs were used in the Black-Scholes option model: the expected life of the Common Stock Warrants, a volatility factor and the exercise price. The expected life is based on the estimated term of the Common Stock Warrants, the volatility factor is based on historical
| | | | | | | | |
| | FINANCIAL STATEMENTS FOOTNOTES |
volatilities of Occidental common stock and the exercise of $22.00 per share of Occidental common stock. As of the declaration date, the fair value of the Common Stock Warrants was determined to be $767 million.
EARNINGS PER SHARE
The following table presents the calculation of basic and diluted EPS for the years ended December 31:
| | | | | | | | | | | | | | | | | | | | |
| millions except per share amounts | | 2021 | | 2020 | | 2019 |
| Income (loss) from continuing operations | | $ | 2,790 | | | $ | (13,533) | | | $ | (507) | |
| Loss from discontinued operations | | (468) | | | (1,298) | | | (15) | |
| Net income (loss) | | $ | 2,322 | | | $ | (14,831) | | | $ | (522) | |
| Less: Net income attributable to noncontrolling interest | | — | | | — | | | (145) | |
| Less: Preferred stock dividends | | (800) | | | (844) | | | (318) | |
| Net income (loss) attributable to common stock | | $ | 1,522 | | | $ | (15,675) | | | $ | (985) | |
| Less: Net income allocated to participating securities | | (10) | | | — | | | — | |
| Net income (loss), net of participating securities | | $ | 1,512 | | | $ | (15,675) | | | $ | (985) | |
| Weighted-average number of basic shares | | 935.0 | | | 918.7 | | | 809.5 | |
| Basic earnings (loss) per common share | | $ | 1.62 | | | $ | (17.06) | | | $ | (1.22) | |
| Net income (loss), net of participating securities | | $ | 1,512 | | | $ | (15,675) | | | $ | (985) | |
| Weighted-average number of basic shares | | 935.0 | | | 918.7 | | | 809.5 | |
| Dilutive securities | | 23.8 | | | — | | | — | |
| Total diluted weighted-average common shares | | 958.8 | | | 918.7 | | | 809.5 | |
| Diluted earnings (loss) per common share | | $ | 1.58 | | | $ | (17.06) | | | $ | (1.22) | |
As of December 31, 2021, warrants and options covering 87 million shares of Occidental common stock were excluded from the diluted shares as their effect would have been anti-dilutive. As of December 31, 2020, warrants and options covering 203 million shares of Occidental common stock were excluded from the diluted shares as their effect would have been anti-dilutive.
ACCUMULATED OTHER COMPREHENSIVE INCOME (LOSS)
Accumulated OCI (loss) consisted of the following after-tax amounts as of December 31:
| | | | | | | | | | | | | | |
| millions | | 2021 | | 2020 |
| Foreign currency translation adjustments | | $ | (8) | | | $ | (6) | |
| Losses on derivatives | | (104) | | | (119) | |
Pension and postretirement adjustments (a) | | (96) | | | (163) | |
| Total | | $ | (208) | | | $ | (288) | |
| | |
| NOTE 15 - STOCK-BASED INCENTIVE PLANS |
Occidental issues stock-based awards to employees in accordance with the terms of the Plan, as amended and restated. An aggregate of 133 million shares of Occidental common stock were authorized for issuance and approximately 16.0 million shares had been reserved for issuance for employee awards through December 31, 2021. As of December 31, 2021, approximately 68.7 million shares were available for grants of future awards. The plan requires each share covered by an award (other than options) to be counted as if three shares were issued in determining the number of shares that are available for future awards. Accordingly, the number of shares available for future awards may be less than 68.7 million depending on the type of award granted, and shares available for future awards may increase by the number of shares that are forfeited, canceled, or correspond to the portion of any stock-based awards settled in cash, including awards that were issued under a previous plan that remain outstanding. Current outstanding awards include RSUs, stock options, CROCEI awards and TSRI awards.
During 2021, non-employee directors were granted awards for 88,802 shares of common stock. Compensation expense for these awards was measured using the closing quoted market price of Occidental’s common stock on the grant date and was fully recognized at that time.
| | | | | | | | |
| | FINANCIAL STATEMENTS FOOTNOTES |
Occidental incurred expenses of $287 million, $202 million and $208 million related to stock-based incentive plans in the years ended December 31, 2021, 2020, and 2019, respectively. The income tax benefit associated with this expense was $60 million, $42 million and $43 million in the years ended December 31, 2021, 2020, and 2019, respectively.
As of December 31, 2021, unrecognized compensation expense for all unvested stock-based incentive awards was $225 million. This expense is expected to be recognized over a weighted-average period of 1.7 years. Occidental accounts for forfeitures as they occur.
RESTRICTED STOCK UNITS
Certain employees are awarded the right to receive RSUs, some of which have performance criteria, and are in the form of, or equivalent in value to, actual shares of Occidental common stock. Depending on their terms, RSUs may be settled in stock or may be cash settled liabilities. These awards vest from one to three years following the grant date. For certain RSUs, dividend equivalents are paid during the vesting period (Term).
CASH-SETTLED RSU LIABILITY AWARDS
The weighted-average, grant-date fair values of cash-settled RSUs granted in 2021, 2020 and 2019 were $25.83, $40.86 and $42.62 per share, respectively. Cash-settled RSUs resulted in payments of $4 million, $3 million and $4 million, during the years ended December 31, 2021, 2020 and 2019, respectively.
STOCK-SETTLED RESTRICTED STOCK UNIT EQUITY AWARDS
The weighted-average, grant-date fair values of the stock-settled RSUs granted in 2021, 2020, and 2019 were $25.45, $41.60 and $58.73, respectively. The fair value of RSUs settled in shares during the years ended December 31, 2021, 2020 and 2019 was $70 million, $62 million and $148 million, respectively.
A summary of changes in Occidental’s unvested cash- and stock-settled RSUs during the year ended December 31, 2021, is presented below:
| | | | | | | | | | | | | | | | | | | | | | | | | | | | | | | | |
| | | Cash-Settled | | Stock-Settled |
| thousands, except fair values | | RSUs | | Weighted-Average
Grant-Date
Fair Value | | RSUs | | Weighted-Average
Grant-Date
Fair Value |
| Unvested as of January 1 | | 5,457 | | | | $ | 42.41 | | | 5,856 | | | | $ | 50.21 | |
| Granted | | 190 | | | | $ | 25.83 | | | 5,773 | | | | $ | 25.45 | |
Vested (a) | | (166) | | | | $ | 56.36 | | | (2,750) | | | | $ | 53.27 | |
| Forfeitures | | (106) | | | | $ | 40.08 | | | (290) | | | | $ | 35.07 | |
| Unvested as of December 31 | | 5,375 | | | | $ | 41.44 | | | 8,589 | | | | $ | 33.10 | |
(a)Presented at the target payouts. Stock-settled RSU weighted-average payout at vesting was 95% of the target, resulting in the issuance of approximately 2,605,000 shares of Occidental common stock. Cash-settled RSUs do not have performance criteria.
TOTAL SHAREHOLDER RETURN INCENTIVE AWARDS
Certain executives are awarded TSRIs that vest at the end of a three-year period following the grant date. Payout is based upon Occidental’s absolute total shareholder return and performance relative to its peers. TSRIs have payouts that range from 0% to 200% of the target award and settle in stock once certified. Dividend equivalents for TSRIs are accumulated and paid upon certification of the award. The fair value of TSRIs settled in shares during the years ended December 31, 2021, 2020 and 2019 was $4 million, $9 million and $4 million, respectively.
The fair values of TSRIs are initially determined on the grant date using a Monte Carlo simulation model based on Occidental’s assumptions, noted in the following table, and the volatility from corresponding peer group companies. The expected life is based on the Term. The risk-free interest rate is the implied yield available on zero coupon Treasury notes at the time of grant with a remaining term equal to the Term. The dividend yield is the expected annual dividend yield over the Term, expressed as a percentage of the stock price on the grant date. Estimates of fair value may not accurately predict the value ultimately realized by the employees who receive the awards, and the ultimate value may not be indicative of the reasonableness of the original estimates of fair value made by Occidental.
| | | | | | | | |
| | FINANCIAL STATEMENTS FOOTNOTES |
The grant-date assumptions used in the Monte Carlo simulation models for the estimated payout level of TSRIs were as follows:
| | | | | | | | | | | | | | | | | | | | |
| | | TSRIs |
| | 2021 | | 2020 | | 2019 |
| Assumptions used: | | | | | | |
| Risk-free interest rate | | 0.2% | | 1.4% | | 2.5% |
| Volatility factor | | 75% | | 26% | | 22% |
| Expected life (years) | | 2.88 | | 3 | | 3 |
| Grant-date fair value of underlying Occidental common stock | | $ | 25.39 | | $ | 41.60 | | $ | 67.19 |
A summary of changes in Occidental’s unvested TSRIs during the year ended December 31, 2021 is presented below:
| | | | | | | | | | | | | | | | | |
| | | TSRIs |
| thousands, except fair values | | Awards | | Weighted-Average
Grant-Date Fair Value
of Occidental Stock |
| Unvested as of January 1 | | 1,534 | | | | $ | 58.02 | |
| Granted | | 665 | | | | $ | 25.39 | |
Vested (a) | | (420) | | | | $ | 69.87 | |
| Forfeitures | | (10) | | | | $ | 25.39 | |
| Unvested as of December 31 | | 1,769 | | | | $ | 43.12 | |
(a)Presented at the target payouts. The weighted-average payout at vesting was 34% of the target, resulting in the issuance of approximately 145,000 shares of Occidental common stock.
STOCK OPTIONS
Certain employees are granted options that vest over three years, expire on the tenth anniversary of the grant date, and settle in stock. Exercise prices of the options were equal to the quoted market value of Occidental’s stock on the grant date. These options had a grant date fair value of $12.72, as estimated by the Black Scholes model. The inputs to this model are presented below:
| | | | | | | | | | | |
| | | Options |
| | 2021 | |
| Assumptions used: | | | |
| Risk-free interest rate | | 0.7% | |
| Volatility factor | | 55% | |
| Expected life (years) | | 6.00 | |
| Dividend yield | | 0.16% | |
| Grant-date fair value of underlying Occidental common stock | | $ | 25.39 | |
A summary of Occidental’s outstanding stock options as of December 31, 2021 and changes during the year ended December 31, 2021 is presented below:
| | | | | | | | | | | | | | | | | | | | |
| | | Vested | | Unvested |
| thousands, except fair values | | Options | Weighted Average Strike Price | | Options | Weighted Average Strike Price |
| January 1 | | 1,326 | | $ | 55.38 | | | 1,900 | | $ | 40.03 | |
| Granted | | — | | $ | — | | | 440 | | $ | 25.39 | |
| Vested | | 910 | | $ | 40.03 | | | (910) | | $ | 40.03 | |
| | | | | | |
| December 31 | | 2,236 | | $ | 49.13 | | | 1,430 | | $ | 35.52 | |
No options were exercised during the years ended December 31, 2021, 2020 and 2019. As of December 31, 2021, the remaining life of fully vested options was 6.9 years.
| | | | | | | | |
| | FINANCIAL STATEMENTS FOOTNOTES |
CASH RETURN ON CAPITAL EMPLOYED INCENTIVE AWARDS
Certain executives are awarded CROCEI awards that vest at the end of a three-year period if performance targets based on CROCE are met. These awards are settled in stock upon certification of the performance target, with payouts that range from 0% to 200% of the target award. Dividend equivalents are accumulated and paid upon certification of the award. A summary of changes in Occidental’s unvested CROCEI during the year ended December 31, 2021 is presented below:
| | | | | | | | | | | | | | | | | |
| | | CROCEI |
| thousands, except fair values | | Awards | | Weighted-Average
Grant-Date
Fair Value of Occidental Stock |
| Unvested as of January 1 | | 197 | | | | $ | 41.60 | |
| Granted | | 221 | | | | $ | 25.39 | |
| | | | | |
| | | | | |
| Unvested as of December 31 | | 418 | | | | $ | 33.03 | |
| | |
| NOTE 16 - INDUSTRY SEGMENTS AND GEOGRAPHIC AREAS |
Occidental conducts its operations through three segments: (1) oil and gas; (2) chemical; and (3) midstream and marketing. The factors used to identify these segments are based on the nature of the operations that are undertaken in each segment. Income taxes, interest income, interest expense, environmental remediation expenses, Anadarko Acquisition-related costs and unallocated corporate expenses are included under corporate and eliminations. Intersegment sales eliminate upon consolidation and are generally made at prices approximating those that the selling entity would be able to obtain in third-party transactions. Identifiable assets are those assets used in the operations of the segments. Corporate assets consist of cash and restricted cash, certain corporate receivables and PP&E. The chief operating decision maker analyzes each segment’s operating results to make decisions about resources to be allocated to the segment and to assess its performance as well as Occidental’s overall performance.
| | | | | | | | |
| | FINANCIAL STATEMENTS FOOTNOTES |
| | | | | | | | | | | | | | | | | | | | | | | | | | | | | |
| Oil and gas | | Chemical | | Midstream and marketing | | Corporate
and
eliminations | | Total |
| Year ended December 31, 2021 | | | | | | | | | |
| Net sales | $ | 18,941 | | | $ | 5,246 | | | $ | 2,863 | | | $ | (1,094) | | | $ | 25,956 | |
Income (loss) from continuing operations before income taxes | $ | 4,145 | | (a) | $ | 1,544 | | | $ | 257 | | (b) | $ | (2,241) | | (c) | $ | 3,705 | |
| Income tax expense | — | | | — | | | — | | | (915) | | (d) | (915) | |
Income (loss) from continuing operations | $ | 4,145 | | | $ | 1,544 | | | $ | 257 | | | $ | (3,156) | | | $ | 2,790 | |
| Investments in unconsolidated entities | $ | 154 | | | $ | 608 | | | $ | 2,176 | | | $ | — | | | $ | 2,938 | |
Property, plant and equipment additions (e) | $ | 2,458 | | | $ | 316 | | | $ | 107 | | | $ | 50 | | | $ | 2,931 | |
| Depreciation, depletion and amortization | $ | 7,741 | | | $ | 343 | | | $ | 325 | | | $ | 38 | | | $ | 8,447 | |
| Total assets | $ | 56,132 | | | $ | 4,671 | | | $ | 11,132 | | | $ | 3,101 | | | $ | 75,036 | |
| | | | | | | | | |
| Year ended December 31, 2020 | | | | | | | | | |
| Net sales | $ | 13,066 | | | $ | 3,733 | | | $ | 1,768 | | | $ | (758) | | | $ | 17,809 | |
Income (loss) from continuing operations before income taxes | $ | (9,632) | | (a) | $ | 664 | | | $ | (4,175) | | (b) | $ | (2,562) | | (c) | $ | (15,705) | |
| Income tax benefit | — | | | — | | | — | | | 2,172 | | (d) | 2,172 | |
Income (loss) from continuing operations | $ | (9,632) | | | $ | 664 | | | $ | (4,175) | | | $ | (390) | | | $ | (13,533) | |
| Investments in unconsolidated entities | $ | 168 | | | $ | 645 | | | $ | 2,437 | | | $ | — | | | $ | 3,250 | |
Property, plant and equipment additions (e) | $ | 2,279 | | | $ | 261 | | | $ | 50 | | | $ | 29 | | | $ | 2,619 | |
| Depreciation, depletion and amortization | $ | 7,414 | | | $ | 356 | | | $ | 312 | | | $ | 15 | | | $ | 8,097 | |
| Total assets | $ | 62,931 | | | $ | 4,326 | | | $ | 9,856 | | | $ | 2,951 | | | $ | 80,064 | |
| | | | | | | | | |
| Year ended December 31, 2019 | | | | | | | | | |
| Net sales | $ | 13,941 | | | $ | 4,102 | | | $ | 4,132 | | | $ | (1,264) | | | $ | 20,911 | |
Income (loss) from continuing operations before income taxes | $ | 2,520 | | (a) | $ | 799 | | | $ | 241 | | (b) | $ | (3,206) | | (c) | $ | 354 | |
| Income tax expense | — | | | — | | | — | | | (861) | | (d) | (861) | |
Income (loss) from continuing operations | $ | 2,520 | | | $ | 799 | | | $ | 241 | | | $ | (4,067) | | | $ | (507) | |
| Investments in unconsolidated entities | $ | 181 | | | $ | 689 | | | $ | 5,519 | | | $ | — | | | $ | 6,389 | |
Property, plant and equipment additions (e) | $ | 5,571 | | | $ | 272 | | | $ | 475 | | | $ | 135 | | | $ | 6,453 | |
| Depreciation, depletion and amortization | $ | 5,153 | | | $ | 368 | | | $ | 563 | | | $ | 56 | | | $ | 6,140 | |
| Total assets | $ | 80,093 | | | $ | 4,361 | | | $ | 14,915 | | | $ | 7,821 | | | $ | 107,190 | |
(a)The 2021 amount included $282 million of asset impairments and $280 million of net oil, gas and CO2 derivative losses. The 2020 amount included $7.1 billion related to asset impairments and net asset sale losses of $1.6 billion, partially offset by a $1.1 billion gain on the oil and gas collars and calls. The 2019 amount included a net gain on sale of $475 million related to Occidental’s joint venture with Ecopetrol in the Midland Basin and sale of real estate assets, a $285 million impairment charge associated with domestic undeveloped leases that were set to expire in the near-term, where Occidental had no plans to pursue exploration activities and a $39 million charge related to Occidental’s mutually agreed early termination of its Qatar ISSD contract.
(b)The 2021 amount included $252 million in derivative mark-to-market losses and $124 million of gains on sales, primarily from the sale of 11.5 million limit partner units in WES. The 2020 amount included $2.7 billion of other-than-temporary impairment of WES equity investment and $1.4 billion of impairments related to the write-off of goodwill and a $236 million loss from an equity investment related to WES' write-off of its goodwill. The 2019 amount included a $1 billion charge as a result of recording Occidental’s investment in WES at fair value as of December 31, 2019 upon the loss of control, a $114 million gain on the sale of an equity investment in Plains and a $30 million mark-to-market gain on an interest rate swap for WES.
(c)The 2021 amount included $153 million of Anadarko acquisition-related costs, $122 million net derivative mark-to-market gains on interest rate swaps and $118 million of early debt extinguishment expenses. The 2020 amount included $339 million in expenses related to Anadarko Acquisition-related costs and a $428 million loss on interest rate swaps. The 2019 amount included corporate transactions related to the Acquisition including charges of $1.0 billion related to employee severance and related costs, $401 million related to crucial seismic data and $213 million for bank, legal and consulting fees. The tax effect of these pre-tax adjustments was a $0.2 billion benefit in 2021, a $1.9 billion benefit in 2020, and a $245 million benefit in 2019.
(d)Included all foreign and domestic income taxes from continuing operations.
(e)Included capital expenditures and capitalized interest, but excluded acquisition and disposition of assets.
| | | | | | | | |
| | FINANCIAL STATEMENTS FOOTNOTES |
GEOGRAPHIC AREAS
| | | | | | | | | | | | | | | | | | | | |
| millions | | Property, plant and equipment, net |
| For the years ended December 31, | | 2021 | | 2020 | | 2019 |
| United States | | $ | 53,197 | | | $ | 59,016 | | | $ | 72,808 | |
| International | | | | | | |
| UAE | | 3,645 | | | 3,737 | | | 3,886 | |
| Oman | | 2,055 | | | 1,901 | | | 2,115 | |
| Algeria | | 496 | | | 664 | | | 1,761 | |
| Colombia | | — | | | — | | | 1,010 | |
| Qatar | | 468 | | | 510 | | | 563 | |
| Other International | | 69 | | | 61 | | | 87 | |
| Total International | | 6,733 | | | 6,873 | | | 9,422 | |
| Total | | $ | 59,930 | | | $ | 65,889 | | | $ | 82,230 | |
| | | | | |
| Supplemental Oil and Gas Information (Unaudited) |
Supplemental Oil and Gas Information
OIL AND GAS RESERVES
The following tables set forth Occidental’s net interests in quantities of proved developed and undeveloped reserves of oil, NGL and natural gas and changes in such quantities. Proved oil, NGL and natural gas reserves were estimated using the unweighted arithmetic average of the first-day-of-the-month price for each month within the year, unless prices were defined by contractual arrangements. Oil, NGL and natural gas prices used for this purpose were based on posted benchmark prices and adjusted for price differentials including gravity, quality and transportation costs. The following table shows the pricing used in the reserve analysis for the periods presented:
| | | | | | | | | | | | | | | | | | | | |
| | 2021 | | 2020 | | 2019 |
| Average WTI Oil ($/Bbl) | | $ | 66.56 | | | $ | 39.57 | | | $ | 55.69 | |
| Average Brent Oil ($/Bbl) | | $ | 69.24 | | | $ | 43.41 | | | $ | 63.03 | |
| Average Henry Hub Natural Gas ($/MMbtu) | | $ | 3.60 | | | $ | 1.98 | | | $ | 2.58 | |
Average Mt. Belvieu NGL ($/Bbl) (a) | | $ | 44.22 | | | $ | 18.74 | | | N/A |
(a) Mt. Belvieu pricing was added as an NGL benchmark beginning in 2020. Prior to 2020, WTI Oil was used as a benchmark for NGL.
Reserves are stated net of applicable royalties. Estimated reserves include Occidental’s economic interests under PSCs and other similar economic arrangements. In addition, discussions of oil and gas production or volumes, in general, refer to sales volumes unless the context requires or it is indicated otherwise.
Prices for oil, NGL and natural gas fluctuate widely. Historically, the markets for oil, NGL and natural gas and refined products have been volatile and may continue to be volatile in the future. Prolonged declines in oil, NGL and natural gas prices would reduce Occidental’s operating results and cash flows and could impact its future rate of growth and the recoverability of the carrying value of its assets.
| | | | | |
| Supplemental Oil and Gas Information (Unaudited) |
OIL RESERVES (a)
| | | | | | | | | | | | | | | | | | | | | | | | |
| MMbbl | | United States | | | | | | International (b) | | Total |
| PROVED DEVELOPED AND UNDEVELOPED RESERVES | | | | | | | | | | |
| Balance as of December 31, 2018 | | 1,186 | | | | | | | 397 | | | 1,583 | |
| Revisions of previous estimates | | (154) | | | | | | | 11 | | | (143) | |
| Improved recovery | | 128 | | | | | | | 37 | | | 165 | |
| Extensions and discoveries | | 37 | | | | | | | 4 | | | 41 | |
| Purchases of proved reserves | | 545 | | | | | | | 84 | | | 629 | |
| Sales of proved reserves | | (17) | | | | | | | — | | | (17) | |
| Production | | (155) | | | | | | | (64) | | | (219) | |
| Balance as of December 31, 2019 | | 1,570 | | | | | | | 469 | | | 2,039 | |
| Revisions of previous estimates | | (283) | | | | | | | (1) | | | (284) | |
| Improved recovery | | 82 | | | | | | | 18 | | | 100 | |
| Extensions and discoveries | | 9 | | | | | | | 5 | | | 14 | |
| Purchases of proved reserves | | 2 | | | | | | | — | | | 2 | |
| Sales of proved reserves | | (31) | | | | | | | (101) | | | (132) | |
| Production | | (205) | | | | | | | (59) | | | (264) | |
| Balance as of December 31, 2020 | | 1,144 | | | | | | | 331 | | | 1,475 | |
Revisions of previous estimates (c) | | 382 | | | | | | | 4 | | | 386 | |
| Improved recovery | | 6 | | | | | | | 13 | | | 19 | |
| Extensions and discoveries | | 88 | | | | | | | 1 | | | 89 | |
| Purchases of proved reserves | | 33 | | | | | | | — | | | 33 | |
| Sales of proved reserves | | (5) | | | | | | | — | | | (5) | |
| Production | | (182) | | | | | | | (44) | | | (226) | |
| Balance as of December 31, 2021 | | 1,466 | | | | | | | 305 | | | 1,771 | |
| | | | | | | | | | |
| PROVED DEVELOPED RESERVES | | | | | | | | | | |
| December 31, 2018 | | 843 | | | | | | | 317 | | | 1,160 | |
| December 31, 2019 | | 1,206 | | | | | | | 371 | | | 1,577 | |
| December 31, 2020 | | 917 | | | | | | | 251 | | | 1,168 | |
December 31, 2021 (d) | | 1,140 | | | | | | | 226 | | | 1,366 | |
PROVED UNDEVELOPED RESERVES | | | | | | | | | | |
| December 31, 2018 | | 343 | | | | | | | 80 | | | 423 | |
| December 31, 2019 | | 364 | | | | | | | 98 | | | 462 | |
| December 31, 2020 | | 227 | | | | | | | 80 | | | 307 | |
| December 31, 2021 | | 326 | | | | | | | 79 | | | 405 | |
| | | | | | | | | | |
(a)Excluded reserve amounts related to discontinued operations and held for sale assets in 2020 and 2019. Proved reserves for held for sale assets as of December 31, 2021 were immaterial.
(b)For 2021, included Middle East and North Africa. For 2020, 2019 and 2018, also included Latin America, which primarily consisted of Colombia, which was sold in 2020. Total proved oil reserves for Latin America were 101 MMboe and 96 MMboe as of December 31, 2019 and 2018, respectively.
(c)Revisions of previous estimates in 2021 included the effects of price revisions, new infill drilling and other updates, including changes in reservoir performance, economic conditions, and development plans. Positive price revisions of 235 MMboe were primarily in the Permian Basin (230 MMboe) and the DJ Basin (11 MMboe), partially offset by negative price revisions of 24 MMboe related to PSCs. Another 92 MMboe in positive revisions were related to additions associated with infill development projects, primarily in the Permian Basin (57 MMboe) and the DJ Basin (24 MMboe). Further positive revisions of 34 MMboe were associated with updates based on reservoir performance, various other cost related revisions (16 MMboe), and changes in development plans (8 MMboe).
(d)Approximately 9% of the proved developed reserves as of December 31, 2021, were nonproducing, primarily associated with the Permian Basin and Oman.
| | | | | |
| Supplemental Oil and Gas Information (Unaudited) |
NGL RESERVES (a)
| | | | | | | | | | | | | | | | | | | | | | | | |
| MMbbl | | United States | | | | | | International (b) | | Total |
| PROVED DEVELOPED AND UNDEVELOPED RESERVES | | | | | | | | | | |
| Balance as of December 31, 2018 | | 284 | | | | | | | 202 | | | 486 | |
| Revisions of previous estimates | | (21) | | | | | | | 9 | | | (12) | |
| Improved recovery | | 58 | | | | | | | — | | | 58 | |
| Extensions and discoveries | | 11 | | | | | | | — | | | 11 | |
| Purchases of proved reserves | | 267 | | | | | | | 10 | | | 277 | |
| Sales of proved reserves | | (7) | | | | | | | — | | | (7) | |
| Production | | (52) | | | | | | | (13) | | | (65) | |
| Balance as of December 31, 2019 | | 540 | | | | | | | 208 | | | 748 | |
| Revisions of previous estimates | | (90) | | | | | | | 10 | | | (80) | |
| Improved recovery | | 32 | | | | | | | 10 | | | 42 | |
| Extensions and discoveries | | 2 | | | | | | | — | | | 2 | |
| Purchases of proved reserves | | 1 | | | | | | | — | | | 1 | |
| Sales of proved reserves | | (20) | | | | | | | — | | | (20) | |
| Production | | (81) | | | | | | | (13) | | | (94) | |
| Balance as of December 31, 2020 | | 384 | | | | | | | 215 | | | 599 | |
Revisions of previous estimates (c) | | 227 | | | | | | | (1) | | | 226 | |
| Improved recovery | | — | | | | | | | — | | | — | |
| Extensions and discoveries | | 27 | | | | | | | — | | | 27 | |
| Purchases of proved reserves | | 7 | | | | | | | — | | | 7 | |
| Sales of proved reserves | | (2) | | | | | | | — | | | (2) | |
| Production | | (79) | | | | | | | (12) | | | (91) | |
| Balance as of December 31, 2021 | | 564 | | | | | | | 202 | | | 766 | |
| | | | | | | | | | |
| PROVED DEVELOPED RESERVES | | | | | | | | | | |
| December 31, 2018 | | 196 | | | | | | | 145 | | | 341 | |
| December 31, 2019 | | 406 | | | | | | | 147 | | | 553 | |
| December 31, 2020 | | 314 | | | | | | | 138 | | | 452 | |
December 31, 2021 (d) | | 433 | | | | | | | 125 | | | 558 | |
| PROVED UNDEVELOPED RESERVES | | | | | | | | | | |
| December 31, 2018 | | 88 | | | | | | | 57 | | | 145 | |
| December 31, 2019 | | 134 | | | | | | | 61 | | | 195 | |
| December 31, 2020 | | 70 | | | | | | | 77 | | | 147 | |
| December 31, 2021 | | 131 | | | | | | | 77 | | | 208 | |
(a)Excluded reserve amounts related to discontinued operations and held for sale assets in 2020 and 2019. Proved reserves for held for sale assets as of December 31, 2021 were immaterial.
(b)Included Middle East and North Africa.
(c)Revisions of previous estimates in 2021 included the effects of price revisions, new infill drilling and other updates, including changes in reservoir performance, economic conditions and development plans. Positive price revisions of 97 MMbbl were primarily in the Permian Basin (80 MMbbl) and the DJ Basin (17 MMbbl). Another 54 MMbbl in positive revisions were related to additions associated with infill development projects, primarily in the DJ Basin (28 MMbbl) and the Permian Basin (25 MMbbl). Further positive revisions of 47 MMbbl were associated with updates based on reservoir performance, various other cost related revisions (19 MMbbl), and changes in development plans (10 MMbbl).
(d)Approximately 4% of the proved developed reserves as of December 31, 2021, were nonproducing, primarily associated with the Permian Basin.
| | | | | |
| Supplemental Oil and Gas Information (Unaudited) |
NATURAL GAS RESERVES (a)
| | | | | | | | | | | | | | | | | | | | | | | | |
| Bcf | | United States | | | | | | International (b) | | Total |
| PROVED DEVELOPED AND UNDEVELOPED RESERVES | | | | | | | | | | |
| Balance as of December 31, 2018 | | 1,445 | | | | | | | 2,650 | | | 4,095 | |
| Revisions of previous estimates | | (409) | | | | | | | 89 | | | (320) | |
| Improved recovery | | 393 | | | | | | | 32 | | | 425 | |
| Extensions and discoveries | | 59 | | | | | | | 5 | | | 64 | |
| Purchases of proved reserves | | 2,996 | | | | | | | — | | | 2,996 | |
| Sales of proved reserves | | (30) | | | | | | | — | | | (30) | |
| Production | | (326) | | | | | | | (204) | | | (530) | |
| Balance as of December 31, 2019 | | 4,128 | | | | | | | 2,572 | | | 6,700 | |
| Revisions of previous estimates | | (823) | | | | | | | 102 | | | (721) | |
| Improved recovery | | 183 | | | | | | | 103 | | | 286 | |
| Extensions and discoveries | | 38 | | | | | | | — | | | 38 | |
| Purchases of proved reserves | | 4 | | | | | | | — | | | 4 | |
| Sales of proved reserves | | (523) | | | | | | | (9) | | | (532) | |
| Production | | (561) | | | | | | | (195) | | | (756) | |
| Balance as of December 31, 2020 | | 2,446 | | | | | | | 2,573 | | | 5,019 | |
Revisions of previous estimates (c) | | 1,274 | | | | | | | 27 | | | 1,301 | |
| Improved recovery | | 3 | | | | | | | 3 | | | 6 | |
| Extensions and discoveries | | 176 | | | | | | | — | | | 176 | |
| Purchases of proved reserves | | 22 | | | | | | | — | | | 22 | |
| Sales of proved reserves | | (25) | | | | | | | — | | | (25) | |
| Production | | (477) | | | | | | | (172) | | | (649) | |
| Balance as of December 31, 2021 | | 3,419 | | | | | | | 2,431 | | | 5,850 | |
| | | | | | | | | | |
| PROVED DEVELOPED RESERVES | | | | | | | | | | |
| December 31, 2018 | | 978 | | | | | | | 2,026 | | | 3,004 | |
| December 31, 2019 | | 3,198 | | | | | | | 2,007 | | | 5,205 | |
| December 31, 2020 | | 2,028 | | | | | | | 1,846 | | | 3,874 | |
December 31, 2021 (d) | | 2,632 | | | | | | | 1,705 | | | 4,337 | |
| PROVED UNDEVELOPED RESERVES | | | | | | | | | | |
| December 31, 2018 | | 467 | | | | | | | 624 | | | 1,091 | |
| December 31, 2019 | | 930 | | | | | | | 565 | | | 1,495 | |
| December 31, 2020 | | 418 | | | | | | | 727 | | | 1,145 | |
| December 31, 2021 | | 787 | | | | | | | 726 | | | 1,513 | |
(a)Excluded reserve amounts related to discontinued operations and held for sale assets in 2020 and 2019. Proved reserves for held for sale assets as of December 31, 2021 were immaterial.
(b)For 2021, included Middle East, North Africa and Latin America. For 2020, 2019 and 2018, Latin America also included Colombia which was sold in 2020. Total proved natural gas reserves for Latin America were 12 Bcf and 11 Bcf as of December 31, 2019 and 2018, respectively.
(c)Revisions of previous estimates in 2021 included the effects of price revisions, new infill drilling and other updates, including changes in reservoir performance, economic conditions and development plans. Positive price revisions of 533 Bcf were primarily in the Permian Basin (420 Bcf) and the DJ Basin (140 Bcf), partially offset by negative price revisions of 51 Bcf related to PSCs. Another 371 Bcf in positive revisions were related to additions associated with infill development projects, primarily in the DJ Basin (229 Bcf) and the Permian Basin (126 Bcf). Further positive revisions were associated with changes in development plans (146 Bcf), various other cost related revisions (135 Bcf), and updates based on reservoir performance (114 Bcf).
(d)Approximately 2% of the proved developed reserves as of December 31, 2021, were nonproducing, primarily associated with the Permian Basin, DJ Basin and Oman.
| | | | | |
| Supplemental Oil and Gas Information (Unaudited) |
TOTAL RESERVES (a) | | | | | | | | | | | | | | | | | | | | | | | | |
MMboe (b) | | United States | | | | | | International (c) | | Total |
| PROVED DEVELOPED AND UNDEVELOPED RESERVES | | | | | | | | | | |
| Balance as of December 31, 2018 | | 1,711 | | | | | | | 1,041 | | | 2,752 | |
| Revisions of previous estimates | | (243) | | | | | | | 35 | | | (208) | |
| Improved recovery | | 251 | | | | | | | 42 | | | 293 | |
| Extensions and discoveries | | 58 | | | | | | | 5 | | | 63 | |
| Purchases of proved reserves | | 1,311 | | | | | | | 94 | | | 1,405 | |
| Sales of proved reserves | | (29) | | | | | | | — | | | (29) | |
| Production | | (261) | | | | | | | (111) | | | (372) | |
| Balance as of December 31, 2019 | | 2,798 | | | | | | | 1,106 | | | 3,904 | |
| Revisions of previous estimates | | (510) | | | | | | | 26 | | | (484) | |
| Improved recovery | | 145 | | | | | | | 45 | | | 190 | |
| Extensions and discoveries | | 17 | | | | | | | 5 | | | 22 | |
| Purchases of proved reserves | | 4 | | | | | | | — | | | 4 | |
| Sales of proved reserves | | (138) | | | | | | | (103) | | | (241) | |
| Production | | (380) | | | | | | | (104) | | | (484) | |
| Balance as of December 31, 2020 | | 1,936 | | | | | | | 975 | | | 2,911 | |
Revisions of previous estimates (d) | | 821 | | | | | | | 8 | | | 829 | |
| Improved recovery | | 7 | | | | | | | 13 | | | 20 | |
| Extensions and discoveries | | 144 | | | | | | | 1 | | | 145 | |
| Purchases of proved reserves | | 44 | | | | | | | — | | | 44 | |
| Sales of proved reserves | | (11) | | | | | | | — | | | (11) | |
| Production | | (341) | | | | | | | (85) | | | (426) | |
| Balance as of December 31, 2021 | | 2,600 | | | | | | | 912 | | | 3,512 | |
| | | | | | | | | | |
| PROVED DEVELOPED RESERVES | | | | | | | | | | |
| December 31, 2018 | | 1,202 | | | | | | | 800 | | | 2,002 | |
| December 31, 2019 | | 2,145 | | | | | | | 853 | | | 2,998 | |
| December 31, 2020 | | 1,569 | | | | | | | 697 | | | 2,266 | |
December 31, 2021 (e) | | 2,012 | | | | | | | 635 | | | 2,647 | |
| PROVED UNDEVELOPED RESERVES | | | | | | | | | | |
| December 31, 2018 | | 509 | | | | | | | 241 | | | 750 | |
| December 31, 2019 | | 653 | | | | | | | 253 | | | 906 | |
| December 31, 2020 | | 367 | | | | | | | 278 | | | 645 | |
| December 31, 2021 | | 588 | | | | | | | 277 | | | 865 | |
(a)Excluded reserve amounts related to discontinued operations and held for sale assets in 2020 and 2019. Proved reserves for held for sale assets as of December 31, 2021 were immaterial.
(b)Natural gas volumes have been converted to Boe based on an energy content of six Mcf of gas to one barrel of oil. Conversion to Boe does not necessarily result in price equivalency.
(c)For 2021, included Middle East, North Africa and Latin America. For 2020, 2019 and 2018, Latin America also included Colombia which was sold in 2020. Total proved reserves for Latin America were 103 MMboe and 98 MMboe and as of December 31, 2019 and 2018, respectively.
(d)Revisions of previous estimates in 2021 included the effects of price revisions, new infill drilling and other updates, including changes in reservoir performance, economic conditions and development plans. Positive price revisions of 421 MMboe were primarily in the Permian Basin (380 MMboe) and the DJ Basin (51 MMboe), partially offset by negative price revisions of 35 MMboe related to PSCs. Another 208 MMboe in positive revisions were related to additions associated with infill development projects, primarily in the Permian Basin (103 MMboe) and the DJ Basin (90 MMboe). Further positive revisions were associated with updates based on reservoir performance (101 MMboe), various other cost related revisions (57 MMboe), and changes in development plans (42 MMboe).
(e)Approximately 6% of the proved developed reserves as of December 31, 2021, were nonproducing, primarily associated with the Permian Basin, Oman and Gulf of Mexico.
| | | | | |
| Supplemental Oil and Gas Information (Unaudited) |
CAPITALIZED COSTS
Capitalized costs relating to oil and gas producing activities and related accumulated DD&A were as follows:
| | | | | | | | | | | | | | | | | | | | | | | | |
| millions | | United States | | | | | | International (a) | | Total |
| December 31, 2021 | | | | | | | | | | |
| Proved properties | | $ | 66,443 | | | | | | | $ | 15,232 | | | $ | 81,675 | |
Unproved properties | | 19,423 | | | | | | | 153 | | | 19,576 | |
Total capitalized costs (b) | | 85,866 | | | | | | | 15,385 | | | 101,251 | |
| Proved properties depreciation, depletion and amortization | | (32,355) | | | | | | | (11,821) | | | (44,176) | |
| Unproved properties valuation | | (4,789) | | | | | | | (27) | | | (4,816) | |
| Total Accumulated depreciation, depletion and amortization | | (37,144) | | | | | | | (11,848) | | | (48,992) | |
| Net capitalized costs | | $ | 48,722 | | | | | | | $ | 3,537 | | | $ | 52,259 | |
| | | | | | | | | | |
| December 31, 2020 | | | | | | | | | | |
| Proved properties | | $ | 63,988 | | | | | | | $ | 14,548 | | | $ | 78,536 | |
Unproved properties | | 23,713 | | | | | | | 205 | | | 23,918 | |
Total capitalized costs (b,c) | | 87,701 | | | | | | | 14,753 | | | 102,454 | |
| Proved properties depreciation, depletion and amortization | | (27,914) | | | | | | | (11,140) | | | (39,054) | |
| Unproved properties valuation | | (5,285) | | | | | | | (27) | | | (5,312) | |
| Total Accumulated depreciation, depletion and amortization | | (33,199) | | | | | | | (11,167) | | | (44,366) | |
| Net capitalized costs | | $ | 54,502 | | | | | | | $ | 3,586 | | | $ | 58,088 | |
| | | | | | | | | | |
| December 31, 2019 | | | | | | | | | | |
| Proved properties | | $ | 59,658 | | | | | | | $ | 17,374 | | | $ | 77,032 | |
Unproved properties | | 30,301 | | | | | | | 468 | | | 30,769 | |
Total capitalized costs (b,c,d) | | 89,959 | | | | | | | 17,842 | | | 107,801 | |
| Proved properties depreciation, depletion and amortization | | (20,961) | | | | | | | (11,655) | | | (32,616) | |
| Unproved properties valuation | | (1,025) | | | | | | | (197) | | | (1,222) | |
| Total Accumulated depreciation, depletion and amortization | | (21,986) | | | | | | | (11,852) | | | (33,838) | |
| Net capitalized costs | | $ | 67,973 | | | | | | | $ | 5,990 | | | $ | 73,963 | |
(a)For 2021, included Middle East, North Africa and Latin America. For 2020 and 2019, Latin America also included Colombia, which was sold in 2020. For the year ended December 31, 2019, Latin America had total net capitalized costs of $1.0 billion.
(b)Included acquisition costs, development costs, capitalized interest and AROs.
(c)Excluded capitalized costs related to Ghana, which was presented as held for sale as of December 31, 2020 and 2019. Excluded capitalized costs related to South Africa, which was presented as held for sale as of December 31, 2019.
(d)$50.3 billion of capitalized costs are associated with the Acquisition.
| | | | | |
| Supplemental Oil and Gas Information (Unaudited) |
COSTS INCURRED
Costs incurred in oil and gas property acquisition, exploration and development activities, whether capitalized or expensed, were as follows:
| | | | | | | | | | | | | | | | | | | | | | | | |
| millions | | United States | | | | | | International (a) | | Total |
December 31, 2021 (b) | | | | | | | | | | |
| Property acquisition costs | | | | | | | | | | |
| Proved properties | | $ | 378 | | | | | | | $ | 1 | | | $ | 379 | |
| Unproved properties | | 51 | | | | | | | — | | | 51 | |
| Exploration costs | | 147 | | | | | | | 143 | | | 290 | |
| Development costs | | 1,749 | | | | | | | 366 | | | 2,115 | |
| Costs incurred | | $ | 2,325 | | | | | | | $ | 510 | | | $ | 2,835 | |
December 31, 2020 (b) | | | | | | | | | | |
| Property acquisition costs | | | | | | | | | | |
| Proved properties | | $ | 7 | | | | | | | $ | 35 | | | $ | 42 | |
| Unproved properties | | 41 | | | | | | | 24 | | | 65 | |
| Exploration costs | | 117 | | | | | | | 95 | | | 212 | |
| Development costs | | 1,376 | | | | | | | 466 | | | 1,842 | |
| Costs incurred | | $ | 1,541 | | | | | | | $ | 620 | | | $ | 2,161 | |
December 31, 2019 (b) | | | | | | | | | | |
| Property acquisition costs | | | | | | | | | | |
| Proved properties | | $ | 19,567 | | | | | | | $ | 1,915 | | | $ | 21,482 | |
| Unproved properties | | 29,042 | | | | | | | 12 | | | 29,054 | |
| Exploration costs | | 307 | | | | | | | 200 | | | 507 | |
| Development costs | | 4,449 | | | | | | | 771 | | | 5,220 | |
| Costs incurred | | $ | 53,365 | | | | | | | $ | 2,898 | | | $ | 56,263 | |
(a)For 2021, included Middle East, North Africa and Latin America. For 2020 and 2019, Latin America also included Colombia, which was sold in 2020. For the years ended December 31, 2020 and 2019, Latin America incurred costs of $97 million and $261 million, respectively.
(b)Excluded costs incurred related to the Mozambique (sold 2019), South Africa (sold 2020) and Ghana (sold 2021) assets.
| | | | | |
| Supplemental Oil and Gas Information (Unaudited) |
RESULTS OF OPERATIONS
Occidental’s oil and gas producing activities for continuing operations, which exclude items such as asset divestitures, corporate overhead, interest and royalties, were as follows:
| | | | | | | | | | | | | | | | | | | | | | | | |
| millions | | United States | | | | | | International (a) | | Total |
| FOR THE YEAR ENDED DECEMBER 31, 2021 | | | | | | | | | | |
Revenues (b) | | $ | 15,817 | | | | | | | $ | 3,462 | | | $ | 19,279 | |
| Lease operating costs | | 2,341 | | | | | | | 883 | | | 3,224 | |
| Transportation costs | | 1,306 | | | | | | | 65 | | | 1,371 | |
| Other operating expenses | | 896 | | | | | | | 176 | | | 1,072 | |
| Depreciation, depletion and amortization | | 7,053 | | | | | | | 687 | | | 7,740 | |
| Taxes other than on income | | 785 | | | | | | | 209 | | | 994 | |
| Exploration expenses | | 158 | | | | | | | 94 | | | 252 | |
Oil and gas mark-to-market - Collars and CO2 | | 280 | | | | | | | — | | | 280 | |
| Pretax income (loss) before impairments and other charges | | 2,998 | | | | | | | 1,348 | | | 4,346 | |
| Asset impairments and other charges | | 282 | | | | | | | — | | | 282 | |
| Pretax income (loss) | | 2,716 | | | | | | | 1,348 | | | 4,064 | |
Income tax expense (benefit) (c) | | 508 | | | | | | | 656 | | | 1,164 | |
| Results of operations | | $ | 2,208 | | | | | | | $ | 692 | | | $ | 2,900 | |
| FOR THE YEAR ENDED DECEMBER 31, 2020 | | | | | | | | | | |
Revenues (b) | | $ | 9,058 | | | | | | | $ | 2,947 | | | $ | 12,005 | |
| Lease operating costs | | 2,169 | | | | | | | 921 | | | 3,090 | |
| Transportation costs | | 1,425 | | | | | | | 72 | | | 1,497 | |
| Other operating expenses | | 960 | | | | | | | 221 | | | 1,181 | |
| Depreciation, depletion and amortization | | 6,611 | | | | | | | 803 | | | 7,414 | |
| Taxes other than on income | | 503 | | | | | | | 111 | | | 614 | |
| Exploration expenses | | 68 | | | | | | | 64 | | | 132 | |
Oil and gas mark-to-market - Collars and CO2 | | (1,089) | | | | | | | — | | | (1,089) | |
| Pretax income (loss) before impairments and other charges | | (1,589) | | | | | | | 755 | | | (834) | |
| Asset impairments and other charges | | 5,973 | | | | | | | 1,208 | | | 7,181 | |
| Pretax income (loss) | | (7,562) | | | | | | | (453) | | | (8,015) | |
Income tax expense (benefit) (c) | | (1,663) | | | | | | | 428 | | | (1,235) | |
| Results of operations | | $ | (5,899) | | | | | | | $ | (881) | | | $ | (6,780) | |
| FOR THE YEAR ENDED DECEMBER 31, 2019 | | | | | | | | | | |
Revenues (b) | | $ | 9,497 | | | | | | | $ | 4,556 | | | $ | 14,053 | |
| Lease operating costs | | 2,271 | | | | | | | 1,103 | | | 3,374 | |
| Transportation costs | | 647 | | | | | | | 97 | | | 744 | |
| Other operating expenses | | 1,125 | | | | | | | 258 | | | 1,383 | |
| Depreciation, depletion and amortization | | 4,113 | | | | | | | 1,040 | | | 5,153 | |
| Taxes other than on income | | 651 | | | | | | | 141 | | | 792 | |
| Exploration expenses | | 99 | | | | | | | 148 | | | 247 | |
Oil and gas mark-to-market - CO2 | | 15 | | | | | | | — | | | 15 | |
| Pretax income before impairments and other charges | | 576 | | | | | | | 1,769 | | | 2,345 | |
| Asset impairments and other charges | | 288 | | | | | | | 39 | | | 327 | |
| Pretax income | | 288 | | | | | | | 1,730 | | | 2,018 | |
Income tax expense (c) | | 74 | | | | | | | 937 | | | 1,011 | |
| Results of operations | | $ | 214 | | | | | | | $ | 793 | | | $ | 1,007 | |
(a)For 2021, included Middle East, North Africa and Latin America. For 2020 and 2019, Latin America also included Colombia, which was sold in 2020. For the years ended December 31, 2020 and 2019, Latin America’s results of operations were $56 million and $161 million, respectively. Results of operations excluded discontinued operations related to the Mozambique (sold 2019), South Africa (sold 2020) and Ghana (sold 2021) assets.
(b)Revenues are net of royalty payments.
(c)U.S. federal income taxes reflect certain expenses related to oil and gas activities allocated for U.S. income tax purposes. These amounts are computed using the statutory rate in effect during the period.
| | | | | |
| Supplemental Oil and Gas Information (Unaudited) |
RESULTS PER UNIT OF PRODUCTION FOR CONTINUING OPERATIONS
| | | | | | | | | | | | | | | | | | | | | | | | |
$/Boe (a) | | United States | | | | | | International (b) | | Total |
| FOR THE YEAR ENDED DECEMBER 31, 2021 | | | | | | | | | | |
Revenues (c) | | $ | 46.42 | | | | | | | $ | 40.82 | | | $ | 45.31 | |
| Lease operating costs | | 6.87 | | | | | | | 10.41 | | | 7.58 | |
| Transportation costs | | 3.83 | | | | | | | 0.76 | | | 3.22 | |
| Other operating expenses | | 2.63 | | | | | | | 2.08 | | | 2.52 | |
| Depreciation, depletion and amortization | | 20.70 | | | | | | | 8.10 | | | 18.19 | |
| Taxes other than on income | | 2.30 | | | | | | | 2.47 | | | 2.34 | |
| Exploration expenses | | 0.46 | | | | | | | 1.10 | | | 0.59 | |
Oil and gas mark-to-market - Collars and CO2 | | 0.82 | | | | | | | — | | | 0.66 | |
| Pretax income (loss) before impairments and other charges | | 8.81 | | | | | | | 15.90 | | | 10.21 | |
| Asset impairments and other charges | | 0.83 | | | | | | | — | | | 0.66 | |
| Pretax income (loss) | | 7.98 | | | | | | | 15.90 | | | 9.55 | |
Income tax expense (d) | | 1.49 | | | | | | | 7.73 | | | 2.73 | |
| Results of operations | | $ | 6.49 | | | | | | | $ | 8.17 | | | $ | 6.82 | |
| FOR THE YEAR ENDED DECEMBER 31, 2020 | | | | | | | | | | |
Revenues (c) | | $ | 23.86 | | | | | | | $ | 28.15 | | | $ | 24.79 | |
| Lease operating costs | | 5.71 | | | | | | | 8.80 | | | 6.38 | |
| Transportation costs | | 3.75 | | | | | | | 0.69 | | | 3.09 | |
| Other operating expenses | | 2.53 | | | | | | | 2.11 | | | 2.44 | |
| Depreciation, depletion and amortization | | 17.41 | | | | | | | 7.67 | | | 15.31 | |
| Taxes other than on income | | 1.32 | | | | | | | 1.06 | | | 1.27 | |
| Exploration expenses | | 0.18 | | | | | | | 0.61 | | | 0.27 | |
Oil and gas mark-to-market - CO2 | | (2.87) | | | | | | | — | | | (2.25) | |
| Pretax income (loss) before impairments and other charges | | (4.17) | | | | | | | 7.21 | | | (1.72) | |
| Asset impairments and other charges | | 15.73 | | | | | | | 11.54 | | | 14.83 | |
| Pretax income (loss) | | (19.90) | | | | | | | (4.33) | | | (16.55) | |
Income tax expense (benefit) (d) | | (4.38) | | | | | | | 4.09 | | | (2.55) | |
| Results of operations | | $ | (15.52) | | | | | | | $ | (8.42) | | | $ | (14.00) | |
| FOR THE YEAR ENDED DECEMBER 31, 2019 | | | | | | | | | | |
Revenues (c) | | $ | 36.43 | | | | | | | $ | 40.94 | | | $ | 37.78 | |
| Lease operating costs | | 8.71 | | | | | | | 9.91 | | | 9.07 | |
| Transportation costs | | 2.48 | | | | | | | 0.87 | | | 2.00 | |
| Other operating expenses | | 4.32 | | | | | | | 2.32 | | | 3.72 | |
| Depreciation, depletion and amortization | | 15.78 | | | | | | | 9.35 | | | 13.85 | |
| Taxes other than on income | | 2.50 | | | | | | | 1.27 | | | 2.13 | |
| Exploration expenses | | 0.38 | | | | | | | 1.33 | | | 0.66 | |
Oil and gas mark-to-market - CO2 | | 0.06 | | | | | | | — | | | 0.04 | |
| Pretax income before impairments and other charges | | 2.20 | | | | | | | 15.89 | | | 6.31 | |
| Asset impairments and other charges | | 1.11 | | | | | | | 0.35 | | | 0.88 | |
| Pretax income (loss) | | 1.09 | | | | | | | 15.54 | | | 5.43 | |
Income tax expense (d) | | 0.29 | | | | | | | 8.42 | | | 2.72 | |
| Results of operations | | $ | 0.80 | | | | | | | $ | 7.12 | | | $ | 2.71 | |
(a)Natural gas volumes have been converted to Boe based on energy content of six Mcf of gas to one barrel of oil.
(b)For 2021, included Middle East, North Africa and Latin America. For 2020 and 2019, Latin America also included Colombia, which was sold in 2020. For the years ended December 31, 2020 and 2019, Latin America’s results of operations per unit of production were $4.62 per Boe and $12.99 per Boe, respectively. Results of operations excluded discontinued operations related to the Mozambique (sold 2019), South Africa (sold 2020) and Ghana (sold 2021) assets.
(c)Revenues are net of royalty payments.
(d)U.S. federal income taxes reflect certain expenses related to oil and gas activities allocated for U.S. income tax purposes. These amounts are computed using the statutory rate in effect during the period.
| | | | | |
| Supplemental Oil and Gas Information (Unaudited) |
STANDARDIZED MEASURE, INCLUDING YEAR-TO-YEAR CHANGES THEREIN, OF DISCOUNTED FUTURE NET CASH FLOWS
For purposes of the following disclosures, future cash flows were computed by applying to Occidental’s proved oil and gas reserves the unweighted arithmetic average of the first-day-of-the-month price for each month within the years ended December 31, 2021, 2020 and 2019, respectively, unless prices were defined by contractual arrangements, and exclude escalations based upon future conditions. The realized prices used to calculate future cash flows vary by producing area and market conditions. Future operating and capital costs were forecast using the current cost environment applied to expectations of future operating and development activities to develop and produce proved reserves at year end.
Future income tax expenses were computed by applying, generally, year-end statutory tax rates (adjusted for permanent differences, tax credits, allowances and foreign income repatriation considerations) to the estimated net future pre-tax cash flows. The discount was computed by application of a 10% discount factor. The calculations assumed the continuation of existing economic, operating and contractual conditions as of December 31, 2021, 2020 and 2019. Such assumptions, which are required by regulation, have not always proven accurate in the past. Other valid assumptions would give rise to substantially different results.
STANDARDIZED MEASURE OF DISCOUNTED FUTURE NET CASH FLOWS
| | | | | | | | | | | | | | | | | | | | | | | | |
| millions | | United States | | | | | | International (a) | | Total |
| Balance as of December 31, 2021 | | | | | | | | | | |
| Future cash inflows | | $ | 116,014 | | | | | | | $ | 28,865 | | | $ | 144,879 | |
| Future costs | | | | | | | | | | |
Production costs and other operating | | (47,803) | | | | | | | (9,284) | | | (57,087) | |
Development costs (b) | | (12,186) | | | | | | | (3,004) | | | (15,190) | |
| Future income tax expense | | (9,875) | | | | | | | (3,544) | | | (13,419) | |
| Future net cash flows | | 46,150 | | | | | | | 13,033 | | | 59,183 | |
| 10% discount factor | | (19,538) | | | | | | | (5,821) | | | (25,359) | |
| Standardized measure of discounted future net cash flows | | $ | 26,612 | | | | | | | $ | 7,212 | | | $ | 33,824 | |
| Balance as of December 31, 2020 | | | | | | | | | | |
| Future cash inflows | | $ | 49,050 | | | | | | | $ | 21,270 | | | $ | 70,320 | |
| Future costs | | | | | | | | | | |
Production costs and other operating | | (29,147) | | | | | | | (8,304) | | | (37,451) | |
Development costs (b) | | (9,103) | | | | | | | (2,410) | | | (11,513) | |
| Future income tax expense | | (19) | | | | | | | (2,088) | | | (2,107) | |
| Future net cash flows | | 10,781 | | | | | | | 8,468 | | | 19,249 | |
| 10% discount factor | | (3,827) | | | | | | | (4,071) | | | (7,898) | |
| Standardized measure of discounted future net cash flows | | $ | 6,954 | | | | | | | $ | 4,397 | | | $ | 11,351 | |
| Balance as of December 31, 2019 | | | | | | | | | | |
| Future cash inflows | | $ | 97,293 | | | | | | | $ | 39,061 | | | $ | 136,354 | |
| Future costs | | | | | | | | | | |
Production costs and other operating | | (47,685) | | | | | | | (14,142) | | | (61,827) | |
Development costs (b) | | (13,137) | | | | | | | (3,272) | | | (16,409) | |
| Future income tax expense | | (4,097) | | | | | | | (4,529) | | | (8,626) | |
| Future net cash flows | | 32,374 | | | | | | | 17,118 | | | 49,492 | |
| 10% discount factor | | (12,427) | | | | | | | (7,836) | | | (20,263) | |
| Standardized measure of discounted future net cash flows | | $ | 19,947 | | | | | | | $ | 9,282 | | | $ | 29,229 | |
(a)For 2021, included Middle East, North Africa and Latin America. For 2020 and 2019, Latin America also included Colombia, which was sold in 2020. For the years ended December 31, 2020 and 2019, the standardized measure of discounted future net cash flows for Latin America were outflows of $6 million and inflows of $1.0 billion, respectively. Excluded discontinued operations related to Ghana (sold 2021).
(b)Included ARO costs.
| | | | | |
| Supplemental Oil and Gas Information (Unaudited) |
CHANGES IN THE STANDARDIZED MEASURE OF DISCOUNTED FUTURE NET CASH FLOWS FROM PROVED RESERVE QUANTITIES (a)
| | | | | | | | | | | | | | | | | | | | |
| millions | | 2021 | | 2020 | | 2019 |
| Balance as of January 1 | | $ | 11,351 | | | $ | 29,229 | | | $ | 23,461 | |
Sales and transfers of oil and gas produced, net of production costs and other operating expenses | | (13,983) | | | (6,483) | | | (9,207) | |
Net change in prices received per barrel, net of production costs and other operating expenses | | 32,464 | | | (19,738) | | | (6,506) | |
Extensions, discoveries and improved recovery, net of future production and development costs | | 2,412 | | | 1,007 | | | 2,607 | |
| Change in estimated future development costs | | (376) | | | 1,686 | | | (1,666) | |
| Revisions of quantity estimates | | 10,296 | | | (1,989) | | | (2,172) | |
| Previously estimated development costs incurred during the period | | 1,277 | | | 1,680 | | | 3,304 | |
| Accretion of discount | | 1,009 | | | 2,541 | | | 2,381 | |
| Net change in income taxes | | (6,249) | | | 3,212 | | | 3,285 | |
| Purchases and sales of reserves in place, net | | 377 | | | (651) | | | 11,229 | |
| Changes in production rates and other | | (4,754) | | | 857 | | | 2,513 | |
| Net change | | 22,473 | | | (17,878) | | | 5,768 | |
| Balance as of December 31 | | $ | 33,824 | | | $ | 11,351 | | | $ | 29,229 | |
(a) Excluded results from discontinued operations.
AVERAGE SALES PRICE
The following table sets forth, for each year in the three-year period ended December 31, 2021, Occidental’s approximate average sales prices for ongoing operations:
| | | | | | | | | | | | | | | | | | | | | | | | |
| | United States | | | | | | International (a) | | Total |
| 2021 | | | | | | | | | | |
| Oil ($/Bbl) | | $ | 66.39 | | | | | | | $ | 65.08 | | | $ | 66.14 | |
| NGL ($/Bbl) | | $ | 30.62 | | | | | | | $ | 26.13 | | | $ | 30.01 | |
| Gas ($/Mcf) | | $ | 3.30 | | | | | | | $ | 1.69 | | | $ | 2.87 | |
| 2020 | | | | | | | | | | |
| Oil ($/Bbl) | | $ | 36.39 | | | | | | | $ | 41.50 | | | $ | 37.34 | |
| NGL ($/Bbl) | | $ | 11.98 | | | | | | | $ | 16.22 | | | $ | 12.58 | |
| Gas ($/Mcf) | | $ | 1.18 | | | | | | | $ | 1.67 | | | $ | 1.31 | |
| 2019 | | | | | | | | | | |
| Oil ($/Bbl) | | $ | 54.31 | | | | | | | $ | 62.00 | | | $ | 56.26 | |
| NGL ($/Bbl) | | $ | 16.03 | | | | | | | $ | 21.85 | | | $ | 17.20 | |
| Gas ($/Mcf) | | $ | 1.31 | | | | | | | $ | 1.66 | | | $ | 1.45 | |
(a)Included Middle East, North Africa and Latin America. 2020 and 2019 average realized prices have been adjusted to reflect the exclusion of Colombia, which was sold in 2020.
| | | | | |
| Supplemental Oil and Gas Information (Unaudited) |
NET PRODUCTIVE AND DRY— EXPLORATORY AND DEVELOPMENT WELLS COMPLETED
The following table sets forth, for each year in the three-year period ended December 31, 2021, Occidental’s net productive and dry exploratory and development wells completed:
| | | | | | | | | | | | | | | | | | | | |
| | United States | | International (a) | | Total |
| 2021 | | | | | | |
| Oil | | | | | | |
| Exploratory | | 6 | | | 4 | | | 10 | |
| Development | | 292 | | | 42 | | | 334 | |
| Gas | | | | | | |
| | | | | | |
| Exploratory | | — | | | 1 | | | 1 | |
| Development | | 4 | | | — | | | 4 | |
| Dry | | | | | | |
| Exploratory | | 4 | | | 2 | | | 6 | |
| Development | | 1 | | | — | | | 1 | |
| | | | | | |
| 2020 | | | | | | |
| Oil | | | | | | |
| Exploratory | | 7 | | | 2 | | | 9 | |
| Development | | 240 | | | 81 | | | 321 | |
| Gas | | | | | | |
| Exploratory | | — | | | 2 | | | 2 | |
| Development | | 6 | | | 1 | | | 7 | |
| Dry | | | | | | |
| Exploratory | | — | | | 1 | | | 1 | |
| Development | | — | | | — | | | — | |
| 2019 | | | | | | |
| Oil | | | | | | |
| Exploratory | | 22 | | | 7 | | | 29 | |
| Development | | 422 | | | 197 | | | 619 | |
| Gas | | | | | | |
| Exploratory | | — | | | 7 | | | 7 | |
| Development | | 2 | | | 2 | | | 4 | |
| Dry | | | | | | |
| Exploratory | | 1 | | | 9 | | | 10 | |
| Development | | — | | | 1 | | | 1 | |
| | | | | | |
| | | | | | |
| | | | | | |
| | | | | | |
(a)Included Middle East, North Africa and Latin America.
| | | | | |
| Supplemental Oil and Gas Information (Unaudited) |
PRODUCTIVE OIL AND GAS WELLS
The following table sets forth, as of December 31, 2021, Occidental’s productive oil and gas wells (both producing and capable of production):
| | | | | | | | | | | | | | | | | | | | | | | | | | | | | | | | | | | | | | | | | | |
| | United States | | | | International (b) | | Total |
Oil (a) | | | | | | | | | | | | | | | | |
Gross (c) | | 19,050 | | | (984) | | | | | | | 2,808 | | | — | | | 21,858 | | | (984) | |
Net (d) | | 15,816 | | | (886) | | | | | | | 1,238 | | | (34) | | | 17,054 | | | (920) | |
Gas (a) | | | | | | | | | | | | | | | | |
Gross (c) | | 4,414 | | | (1,938) | | | | | | | 159 | | | (2) | | | 4,573 | | | (1,940) | |
Net (d) | | 3,188 | | | (1,774) | | | | | | | 92 | | | (4) | | | 3,280 | | | (1,778) | |
(a)The numbers in parentheses indicate the number of wells with multiple completions.
(b)Included Middle East and North Africa.
(c)The total number of wells in which interests are owned.
(d)The sum of fractional interests.
PARTICIPATION IN WELLS BEING DRILLED OR PENDING COMPLETION
The following table sets forth, as of December 31, 2021, Occidental’s participation in exploratory and development wells being drilled:
| | | | | | | | | | | | | | | | | | | | | | |
| | United States | | | | International (a) | | Total |
| Exploratory and development wells being drilled | | | | | | | | |
| Gross | | 7 | | | | | 17 | | | 24 | |
| Net | | 5 | | | | | 13 | | | 18 | |
Exploratory and development wells pending completion (b) | | | | | | | | |
| Gross | | 86 | | | | | 3 | | | 89 | |
| Net | | 63 | | | | | 1 | | | 64 | |
(a)Included Middle East, North Africa and Latin America.
(b)Wells suspended or waiting on completion include exploration and development wells where drilling has occurred, but the wells are awaiting the completion of hydraulic fracturing or other completion activities or the resumption of drilling in the future. There were 17 MMboe of PUD reserves primarily assigned to U.S. onshore development wells suspended or waiting on completion as of December 31, 2021. Occidental expects to convert all of these PUD reserves to developed status within five years of their initial disclosure.
As of December 31, 2021, Occidental was participating in 167 and 42 gross pressure-maintenance projects in the United States and Internationally, respectively. In the United States, these projects primarily consisted of waterfloods with some CO2 floods, and in the Middle East and North Africa, these projects consisted mostly of waterfloods.
| | | | | |
| Supplemental Oil and Gas Information (Unaudited) |
OIL AND GAS ACREAGE
The following table sets forth, as of December 31, 2021, Occidental’s holdings of developed and undeveloped oil and gas acreage:
| | | | | | | | | | | | | | | | | | | | | | |
| thousands | | United States | | | | International (a) | | Total |
Developed (b) | | | | | | | | |
Gross (c) | | 6,409 | | | | | 1,139 | | | 7,548 | |
Net (d) | | 4,007 | | | | | 379 | | | 4,386 | |
Undeveloped (e) | | | | | | | | |
Gross (c) | | 1,223 | | | | | 8,444 | | | 9,667 | |
Net (d) | | 877 | | | | | 7,046 | | | 7,923 | |
Fee Mineral Ownership (f) | | | | | | | | |
Gross (c) | | 8,034 | | | | | — | | | 8,034 | |
Net (d) | | 4,568 | | | | | — | | | 4,568 | |
(a)Included Middle East, North Africa and Latin America.
(b)Acres spaced or assigned to productive wells.
(c)Total acres in which interests are held.
(d)Sum of the fractional interests owned based on working interests, or interests under PSCs and other economic arrangements.
(e)Acres on which wells have not been drilled or completed to a point that would permit the production of commercial quantities of oil and gas, regardless of whether the acreage contains proved reserves.
(f)Occidental’s fee mineral acreage is primarily undeveloped.
Occidental’s investment in developed and undeveloped acreage comprises numerous concessions, blocks and leases. Work programs are designed to ensure that the exploration potential of any property is fully evaluated before the contractual expiration date. In some instances, Occidental may elect to relinquish acreage in advance of the contractual expiration date if the evaluation process is complete and there is not a business basis for extension. In cases where additional time may be required to fully evaluate acreage, Occidental has generally been successful in obtaining extensions. Scheduled lease and concession expirations for undeveloped acreage over the next three years are not expected to have a material adverse impact on Occidental.
| | | | | |
| Supplemental Oil and Gas Information (Unaudited) |
OIL, NGL AND NATURAL GAS SALES VOLUMES PER DAY
The following tables set forth the sales volumes from ongoing operations of oil, NGL and natural gas per day for each of the three years in the period ended December 31, 2021. The differences between the sales and production volumes per day are negligible and are generally due to the timing of shipments at Occidental’s international locations where product is loaded onto tankers. Natural gas volumes have been converted to Boe based on energy content of six Mcf of gas to one barrel of oil.
| | | | | | | | | | | | | | | | | | | | |
| Sales per Day from Ongoing Operations (Mboe/d) | | 2021 | | 2020 | | 2019 |
| United States | | | | | | |
| Permian | | 487 | | | 575 | | | 509 | |
| Rockies & Other Domestic | | 302 | | | 332 | | | 147 | |
| Gulf of Mexico | | 144 | | | 130 | | | 58 | |
| Total | | 933 | | | 1,037 | | | 714 | |
| International | | | | | | |
| Algeria and Other International | | 43 | | | 46 | | | 25 | |
| Al Hosn Gas | | 76 | | | 78 | | | 82 | |
| Dolphin | | 40 | | | 45 | | | 42 | |
| Oman | | 74 | | | 85 | | | 89 | |
| Total | | 233 | | | 254 | | | 238 | |
| Total Sales from Ongoing Operations (Mboe/d) | | 1,166 | | | 1,291 | | | 952 | |
| Operations exited or exiting | | 18 | | | 60 | | | 77 | |
| Total Sales (Mboe/d) | | 1,184 | | | 1,351 | | | 1,029 | |
| | | | | |
| Supplemental Oil and Gas Information (Unaudited) |
| | | | | | | | | | | | | | | | | | | | |
| Sales per Day by Products from Ongoing Operations | | 2021 | | 2020 | | 2019 |
| United States | | | | | | |
Oil (Mbbl) | | | | | | |
| Permian | | 286 | | | 343 | | | 324 | |
| Rockies & Other Domestic | | 93 | | | 109 | | | 53 | |
| Gulf of Mexico | | 119 | | | 109 | | | 48 | |
Total | | 498 | | | 561 | | | 425 | |
| NGL (Mbbl) | | | | | | |
| Permian | | 110 | | | 129 | | | 104 | |
| Rockies & Other Domestic | | 97 | | | 83 | | | 32 | |
| Gulf of Mexico | | 10 | | | 9 | | | 4 | |
Total | | 217 | | | 221 | | | 140 | |
Natural gas (MMcf) | | | | | | |
| Permian | | 548 | | | 620 | | | 486 | |
| Rockies & Other Domestic | | 676 | | | 838 | | | 373 | |
| Gulf of Mexico | | 84 | | | 71 | | | 34 | |
Total | | 1,308 | | | 1,529 | | | 893 | |
| International | | | | | | |
Oil (Mbbl) | | | | | | |
| Algeria and Other International | | 39 | | | 42 | | | 22 | |
| Al Hosn Gas | | 13 | | | 14 | | | 14 | |
| Dolphin | | 7 | | | 7 | | | 7 | |
| Oman | | 61 | | | 65 | | | 66 | |
| Total | | 120 | | | 128 | | | 109 | |
| NGL (Mbbl) | | | | | | |
| Algeria and Other International | | 3 | | | 3 | | | 2 | |
| Al Hosn Gas | | 23 | | | 25 | | | 26 | |
| Dolphin | | 8 | | | 9 | | | 8 | |
| Total | | 34 | | | 37 | | | 36 | |
Natural gas (MMcf) | | | | | | |
| Algeria and Other International | | 6 | | | 6 | | | 7 | |
| Al Hosn Gas | | 234 | | | 238 | | | 251 | |
| Dolphin | | 151 | | | 171 | | | 161 | |
| Oman | | 80 | | | 120 | | | 138 | |
| Total | | 471 | | | 535 | | | 557 | |
| Total Sales from Ongoing Operations (Mboe/d) | | 1,166 | | | 1,291 | | | 952 | |
| | | | | |
| Schedule II – Valuation and Qualifying Accounts | Occidental Petroleum Corporation
and Subsidiaries |
| | | | | | | | | | | | | | | | | | | | | | | | | | | | | | | | | | | |
| | | | Additions | | | | | |
| millions | | Balance at Beginning of Period | | Charged to
Costs and
Expenses | | Charged to
Other
Accounts | | Deductions (a) | | Balance at
End of
Period | |
| 2021 | | | | | | | | | | | |
| Allowance for doubtful accounts | | $ | 822 | | | $ | 56 | | | $ | (11) | | | $ | — | | | $ | 867 | | (b) |
| Environmental, litigation, tax and other reserves | | $ | 2,429 | | | $ | 900 | | | $ | 94 | | | $ | (259) | | | $ | 3,164 | | (c) |
| | | | | | | | | | | |
| 2020 | | | | | | | | | | | |
| Allowance for doubtful accounts | | $ | 788 | | | $ | 37 | | | $ | (3) | | | $ | — | | | $ | 822 | | (b) |
| Environmental, litigation, tax and other reserves | | $ | 2,411 | | | $ | 115 | | | $ | 43 | | | $ | (140) | | | $ | 2,429 | | (c) |
| | | | | | | | | | | |
| 2019 | | | | | | | | | | | |
| Allowance for doubtful accounts | | $ | 668 | | | $ | 126 | | | $ | (6) | | | $ | — | | | $ | 788 | | (b) |
| Environmental, litigation, tax and other reserves | | $ | 994 | | | $ | 182 | | | $ | 1,408 | | | $ | (173) | | | $ | 2,411 | | (c) |
(a)Primarily represents payments.
(b)Of these amounts, $46 million, $42 million and $22 million in 2021, 2020, and 2019, respectively, were classified as current.
(c)Of these amounts, $790 million, $149 million and $188 million in 2021, 2020, and 2019, respectively, were classified as current.
Note: The amounts presented represent continuing operations.
ITEM 9. CHANGES IN AND DISAGREEMENTS WITH ACCOUNTANTS ON ACCOUNTING AND FINANCIAL DISCLOSURE
Occidental had no changes in, and no disagreements with, Occidental’s accountants on accounting and financial disclosure.
ITEM 9A. CONTROLS AND PROCEDURES
| | |
| MANAGEMENT’S ANNUAL ASSESSMENT OF AND REPORT ON INTERNAL CONTROL OVER FINANCIAL REPORTING |
The management of Occidental Petroleum Corporation and its subsidiaries is responsible for establishing and maintaining adequate internal control over financial reporting. Occidental’s system of internal control over financial reporting is designed to provide reasonable assurance regarding the reliability of financial reporting and the preparation of consolidated financial statements for external purposes in accordance with GAAP. Occidental’s internal control over financial reporting includes those policies and procedures that: (i) pertain to the maintenance of records that, in reasonable detail, accurately and fairly reflect the transactions and divestitures of Occidental’s assets; (ii) provide reasonable assurance that transactions are recorded as necessary to permit preparation of financial statements in accordance with GAAP and that Occidental’s receipts and expenditures are being made only in accordance with authorizations of Occidental’s management and directors; and (iii) provide reasonable assurance regarding prevention or timely detection of unauthorized acquisition, use or disposition of Occidental’s assets that could have a material effect on the financial statements.
Because of its inherent limitations, internal control over financial reporting may not prevent or detect misstatements. Also, projections of any evaluation of effectiveness to future periods are subject to the risk that controls may become inadequate because of changes in conditions, or that the degree of compliance with the policies or procedures may deteriorate.
Management has assessed the effectiveness of Occidental’s internal control system as of December 31, 2021, based on the criteria for effective internal control over financial reporting described in Internal Control - Integrated Framework issued in 2013 by the Committee of Sponsoring Organizations of the Treadway Commission (COSO). Based on this assessment, management believes that, as of December 31, 2021, Occidental’s system of internal control over financial reporting is effective.
Occidental’s independent auditors, KPMG LLP, have issued an audit report on Occidental’s internal control over financial reporting.
| | |
| DISCLOSURE CONTROLS AND PROCEDURES |
Occidental’s President and Chief Executive Officer and its Senior Vice President and Chief Financial Officer supervised and participated in Occidental’s evaluation of its disclosure controls and procedures (as defined in Rules 13a-15(e) and 15d-15(e) under the Exchange Act) as of the end of the period covered by this report. Based upon that evaluation, Occidental’s President and Chief Executive Officer and Senior Vice President and Chief Financial Officer concluded that Occidental’s disclosure controls and procedures were effective as of December 31, 2021.
Occidental is converting legacy Anadarko’s information into Occidental’s primary enterprise resource planning system during the first quarter of 2022. Certain existing internal controls will be modified and new controls will be implemented. There has been no change in Occidental’s internal control over financial reporting (as defined in Rules 13a-15(f) and 15d-15(f) under the Exchange Act) during the fourth quarter of 2021 that has materially affected, or is reasonably likely to materially affect, Occidental’s internal control over financial reporting. The Report of Independent Registered Public Accounting Firm on Internal Control over Financial Reporting is set forth in Item 8.
ITEM 9B. OTHER INFORMATION
None.
ITEM 9C. DISCLOSURE REGARDING FOREIGN JURISDICTIONS THAT PREVENT INSPECTIONS
None.
Part III
ITEM 10. DIRECTORS, EXECUTIVE OFFICERS AND CORPORATE GOVERNANCE
Occidental has adopted a Code of Business Conduct (Code). The Code applies to the President and Chief Executive Officer, Senior Vice President and Chief Financial Officer, Vice President, Chief Accounting Officer and Controller and persons performing similar functions (Key Personnel). The Code also applies to Occidental’s directors, employees and the employees of entities which it controls. The Code is posted on our website, www.oxy.com. Occidental will satisfy any disclosure requirement under Item 5.05 of Form 8-K regarding an amendment to, or waiver from, any provision of the Code with respect to its Key Personnel or directors by disclosing the nature of that amendment or waiver on its website within four business days following the date of the amendment or waiver.
The list of Occidental’s executive officers and related information under Information About Our Executive Officers set forth in Part I of this 10-K is incorporated by reference herein. The information required by this Item 10 is incorporated herein by reference from Occidental’s definitive Proxy Statement to be filed with the SEC pursuant to Regulation 14A within 120 days of December 31, 2021.
ITEM 11. EXECUTIVE COMPENSATION
The information under the caption “Compensation Discussion and Analysis - Compensation Committee Report” shall not be deemed to be “soliciting material,” or to be “filed” with the SEC, or subject to Regulation 14A or 14C under the Exchange Act or to the liabilities of Section 18 of the Exchange Act, nor shall it be deemed incorporated by reference into any filing under the Securities Act of 1933. The information required by this Item 11 is incorporated herein by reference from Occidental’s definitive Proxy Statement to be filed with the SEC pursuant to Regulation 14A within 120 days of December 31, 2021.
ITEM 12. SECURITY OWNERSHIP OF CERTAIN BENEFICIAL OWNERS AND MANAGEMENT AND RELATED STOCKHOLDER MATTERS
| | |
| SECURITIES AUTHORIZED FOR ISSUANCE UNDER EQUITY COMPENSATION PLANS |
All of Occidental’s stock-based compensation plans for its employees and non-employee directors have been approved by the stockholders. The aggregate number of shares of Occidental common stock authorized for issuance under such plans is approximately 133 million, of which approximately 16.0 million had been reserved for issuance through December 31, 2021. The following is a summary of the securities available for issuance under such plans:
| | | | | | | | | | | | | | | | | | | | | | | |
| a) | Number of securities to be issued upon exercise of outstanding options, warrants and rights | | b) | Weighted-average exercise price of outstanding options, warrants and rights | | c) | Number of securities remaining available for future issuance under equity compensation plans (excluding securities reflected in column (a)) |
16,627,404 (1) | | 43.82 (2) | | 68,689,570 (3) |
(1)Includes shares reserved to be issued pursuant to RSUs, stock options (Options) and performance-based awards. Shares for performance-based awards are included assuming maximum payout, but may be paid out at lesser amounts, or not at all, according to achievement of performance goals.
(2)Price applies only to the Options included in column (a). Exercise price is not applicable to the other awards included in column (a), nor warrants not issued under equity compensation plans.
(3)A plan provision requires each share covered by an award (other than stock appreciation rights (SARs) and Options) to be counted as if three shares were issued in determining the number of shares that are available for future awards. Accordingly, the number of shares available for future awards may be less than the amount shown depending on the type of award granted. Additionally, under the plan, the amount shown may increase, depending on the award type, by the number of shares currently unvested or forfeitable, or three times that number as applicable, that are forfeited or canceled, or correspond to the portion of any stock-based awards settled in cash.
The information required by this Item 12 is incorporated herein by reference from Occidental’s definitive Proxy Statement to be filed with the SEC pursuant to Regulation 14A within 120 days of December 31, 2021.
ITEM 13. CERTAIN RELATIONSHIPS AND RELATED TRANSACTIONS AND DIRECTOR INDEPENDENCE
The information required by this Item 13 is incorporated herein by reference from Occidental’s definitive Proxy Statement to be filed with the SEC pursuant to Regulation 14A within 120 days of December 31, 2021.
ITEM 14. PRINCIPAL ACCOUNTING FEES AND SERVICES
Our independent registered public accounting firm is KPMG LLP, Houston, TX, Auditor Firm ID: 185.
The information about our principle accountant, KPMG LLP, Houston, Texas (185) required by this Item 14 is incorporated herein by reference from Occidental’s definitive Proxy Statement to be filed with the SEC pursuant to Regulation 14A within 120 days of December 31, 2021.
Part IV
ITEM 15. EXHIBITS AND FINANCIAL STATEMENT SCHEDULES
The agreements included as exhibits to this report are included to provide information about their terms and not to provide any other factual or disclosure information about Occidental or the other parties to the agreements. The agreements contain representations and warranties by each of the parties to the applicable agreement that were made solely for the benefit of the other agreement parties and:
■Should not be treated as categorical statements of fact, but rather as a way of allocating the risk among the parties if those statements prove to be inaccurate;
■Have been qualified by disclosures that were made to the other party in connection with the negotiation of the applicable agreement, which disclosures are not necessarily reflected in the agreement;
■May apply standards of materiality in a way that is different from the way investors may view materiality; and
■Were made only as of the date of the applicable agreement or such other date or dates as may be specified in the agreement and are subject to more recent developments.
(a) (1) and (2). Financial Statements and Financial Statement Schedule
Reference is made to Item 8 of the Table of Contents of this report, where these documents are listed.
(a) (3). Exhibits
| | | | | |
| 3.(i) | Restated Certificate of Incorporation of Occidental, dated November 12, 1999, and Certificates of Amendment thereto dated May 5, 2006, May 1, 2009, May 2, 2014 and June 3, 2020 (filed as Exhibit 4.1 to the Registration Statement on Form S-8 of Occidental filed on June 17, 2020, File No. 333-239236). |
| 3.(i)(a) | |
| 3.(ii) | |
| 3.(ii)(a) | |
| 3.(ii)(b) | |
| 4.1 | |
| 4.2 | |
| 4.3 | |
| 4.4 | |
| 4.5 | |
| 4.6 | |
| | | | | |
| Other instruments defining the rights of holders of other long-term debt of Occidental and its subsidiaries are not being filed since the total amount of securities authorized under each of such instruments does not exceed 10% of the total assets of Occidental and its subsidiaries on a consolidated basis. Occidental agrees to furnish a copy of any such instrument to the Commission upon request. |
| All of the exhibits numbered 10.1 to 10.24 are management contracts and compensatory plans required to be identified specifically as responsive to Item 601(b)(10)(iii)(A) of Regulation S-K pursuant to Item 15(b) of Form 10-K. |
| 10.1 | |
| 10.2 | |
| 10.3 | |
| 10.4 | |
| 10.5 | |
| 10.6 | Form of Indemnification Agreement between Occidental and each of its directors and certain executive officers (filed as Exhibit B to the Proxy Statement of Occidental for its May 21, 1987, Annual Meeting of Stockholders, File No. 1-9210). |
| 10.7 | |
| 10.8 | |
| 10.9 | |
| 10.10 | |
| 10.11 | |
| 10.12 | |
| 10.13 | |
| 10.14 | |
| 10.15 | |
| 10.16 | |
| 10.17 | |
| 10.18 | |
| 10.19 | |
| 10.20 | |
| 10.21 | |
| 10.22 | |
| 10.23 | |
| 10.24 | |
| | | | | |
| 10.25 | |
| 10.26 | |
| 10.27 | Second Amended and Restated Credit Agreement, dated as of December 10, 2021, by and among Occidental Petroleum Corporation, the banks party thereto, as lenders, and JPMorgan Chase Bank, N.A., as administrative agent (filed as Exhibit 10.1 to the Current Report on Form 8-K of Occidental filed on December 13, 2021, File No. 1-9210). |
| 21 | |
| 23.1 | |
| 23.2 | |
| 31.1 | |
| 31.2 | |
| 32.1 | |
| 99.1 | |
| 101.INS | Inline XBRL Instance Document. |
| 101.SCH | Inline XBRL Taxonomy Extension Schema Document. |
| 101.CAL | Inline XBRL Taxonomy Extension Calculation Linkbase Document. |
| 101.LAB | Inline XBRL Taxonomy Extension Label Linkbase Document. |
| 101.PRE | Inline XBRL Taxonomy Extension Presentation Linkbase Document. |
| 101.DEF | Inline XBRL Taxonomy Extension Definition Linkbase Document. |
| 104 | Cover Page Interactive Data File - The cover page from Occidental Petroleum Corporation’s Annual Report on Form 10-K for the year ended December 31, 2021 is formatted in Inline XBRL (included as Exhibit 101). |
| |
ITEM 16. FORM 10-K SUMMARY
None.
Pursuant to the requirements of Section 13 or 15(d) of the Securities Exchange Act of 1934, the registrant has duly caused this report to be signed on its behalf by the undersigned, thereunto duly authorized.
| | | | | | | | |
| | OCCIDENTAL PETROLEUM CORPORATION |
| | | |
| By: | /s/ Vicki Hollub |
| | | Vicki Hollub |
| | | President and Chief Executive Officer |
Pursuant to the requirements of the Securities Exchange Act of 1934, this report has been signed below by the following persons on behalf of the registrant and in the capacities and on the dates indicated.
| | | | | | | | | | | | | | |
| | | Title | Date |
| | | | |
| /s/ Vicki Hollub | | President, Chief Executive Officer | February 24, 2022 |
| Vicki Hollub | | and Director |
| | | | |
| /s/ Robert L. Peterson | | Senior Vice President and | February 24, 2022 |
| Robert L. Peterson | | Chief Financial Officer |
| | | | |
| /s/ Christopher O. Champion | | Vice President, Chief Accounting Officer | February 24, 2022 |
| Christopher O. Champion | | and Controller |
| | | | |
| /s/ Stephen I. Chazen | | Chairman of the Board of Directors | February 24, 2022 |
| Stephen I. Chazen | |
| | | | |
| /s/ Andrew F. Gould | | Director | February 24, 2022 |
| Andrew F. Gould | |
| | | | |
| /s/ Carlos M. Gutierrez | | Director | February 24, 2022 |
| Carlos M. Gutierrez | |
| | | | |
| /s/ Gaoxiang Hu | | Director | February 24, 2022 |
| Gaoxiang Hu | |
| | | | |
| /s/ William R. Klesse | | Director | February 24, 2022 |
| William R. Klesse | |
| | | | |
| /s/ Andrew N. Langham | | Director | February 24, 2022 |
| Andrew N. Langham | |
| | | | |
| /s/ Jack B. Moore | | Director | February 24, 2022 |
| Jack B. Moore | |
| | | | |
| /s/ Margarita Paláu-Hernández | | Director | February 24, 2022 |
| Margarita Paláu-Hernández | |
| | | | |
| /s/ Avedick B. Poladian | | Director | February 24, 2022 |
| Avedick B. Poladian | |
| | | | |
| /s/ Robert M. Shearer | | Director | February 24, 2022 |
| Robert M. Shearer | |