UNITED STATES SECURITIES AND EXCHANGE COMMISSION
Washington, D.C. 20549
Form 10-K
Annual Report Pursuant to Section 13 or 15(d) of the Securities Exchange Act of 1934 | Transition Report Pursuant to Section 13 or 15(d) of the Securities Exchange Act of 1934 | ||||
For the fiscal year ended | For the transition period from to | ||||
Commission File Number 1-9210
Occidental Petroleum Corporation
(Exact name of registrant as specified in its charter)
State or other jurisdiction of incorporation or organization | |||||
I.R.S. Employer Identification No. | |||||
Address of principal executive offices | |||||
Zip Code | |||||
Registrant’s telephone number, including area code | |||||
Securities registered pursuant to Section 12(b) of the Act:
Title of Each Class | Trading Symbol | Name of Each Exchange on Which Registered |
Securities registered pursuant to Section 12(g) of the Act: None
Indicate by check mark if the registrant is a well-known seasoned issuer, as defined in Rule 405 of the Securities Act. Yes ☑ No ☐
Indicate by check mark if the registrant is not required to file reports pursuant to Section 13 or Section 15(d) of the Act. Yes ☐ No ☑
Indicate by check mark whether the registrant (1) has filed all reports required to be filed by Section 13 or 15(d) of the Securities Exchange Act of 1934 during the preceding 12 months (or for such shorter period that the registrant was required to file such reports), and (2) has been subject to such filing requirements for the past 90 days. Yes ☑ No ☐
Indicate by check mark whether the registrant has submitted electronically every Interactive Data File required to be submitted pursuant to Rule 405 of Regulation S-T (§232.405 of this chapter) during the preceding 12 months (or for such shorter period that the registrant was required to submit such files). Yes ☑ No ☐
Indicate by check mark whether the registrant is a large accelerated filer, an accelerated filer, a non-accelerated filer, a smaller reporting company, or an emerging growth company. See the definitions of “large accelerated filer,” “accelerated filer,” “smaller reporting company” and “emerging growth company” in Rule 12b-2 of the Exchange Act.
☑ | Accelerated Filer | ☐ | Emerging Growth Company | ||
Non-Accelerated Filer | ☐ | Smaller Reporting Company | |||
If an emerging growth company, indicate by check mark if the registrant has elected not to use the extended transition period for complying with any new or revised financial accounting standards provided pursuant to Section 13(a) of the Exchange Act. ☐
Indicate by check mark whether the registrant is a shell company (as defined in Rule 12b-2 of the Act). Yes ☐ No ☑
The aggregate market value of the registrant’s Common Stock held by nonaffiliates of the registrant was approximately $45.0 billion, computed by reference to the closing price on the New York Stock Exchange composite tape of $50.28 per share of Common Stock on June 28, 2019.
At January 31, 2020, there were 895,224,961 shares of Common Stock outstanding, par value $0.20 per share.
DOCUMENTS INCORPORATED BY REFERENCE
Portions of the registrant’s definitive Proxy Statement, relating to its 2020 Annual Meeting of Stockholders, are incorporated by reference into Part III of this Form 10-K.
TABLE OF CONTENTS | PAGE | |
Part I | ||
Items 1 and 2. | ||
Marketing and Midstream Operations | ||
Item 1A. | ||
Item 1B. | ||
Item 3. | ||
Item 4. | ||
Information About Our Executive Officers | ||
Part II | ||
Item 5. | ||
Item 6. | ||
Item 7. | ||
Item 7A. | ||
Item 8. | ||
Item 9. | ||
Item 9A. | ||
Item 9B. | ||
Part III | ||
Item 10. | ||
Item 11. | ||
Item 12. | ||
Item 13. | ||
Item 14. | ||
Part IV | ||
Item 15. | ||
Item 16. | ||
 | BUSINESS AND PROPERTIES | |
Part I
ITEMS 1 AND 2. BUSINESS AND PROPERTIES
In this report, “Occidental” means Occidental Petroleum Corporation, a Delaware corporation (OPC) incorporated in 1986, or OPC and one or more entities in which it owns a controlling interest (subsidiaries). Occidental conducts its operations through its various subsidiaries and affiliates. Occidental’s executive offices are located at 5 Greenway Plaza, Suite 110, Houston, Texas 77046; telephone (713) 215-7000.
On August 8, 2019, pursuant to the Agreement and Plan of Merger, dated as of May 9, 2019, among Occidental, Baseball Merger Sub 1, Inc., a Delaware corporation and an indirect, wholly owned subsidiary of Occidental (Merger Subsidiary), and Anadarko Petroleum Corporation (Anadarko), Occidental acquired all of the outstanding shares of Anadarko through a transaction in which Merger Subsidiary merged with and into Anadarko (the Acquisition), with Anadarko continuing as the surviving entity and as an indirect, wholly owned subsidiary of Occidental.
GENERAL |
Occidental’s principal businesses consist of three reporting segments: oil and gas, chemical, and marketing and midstream. The oil and gas segment explores for, develops and produces oil and condensate, natural gas liquids (NGL) and natural gas. The chemical segment (OxyChem) mainly manufactures and markets basic chemicals and vinyls. The marketing and midstream segment purchases, markets, gathers, processes, transports and stores oil, condensate, NGL, natural gas, carbon dioxide (CO2) and power. It also trades around its assets, including transportation and storage capacity, and invests in entities that conduct similar activities such as Western Midstream Partners, L.P. (WES).
The marketing and midstream segment also includes Oxy Low Carbon Ventures (OLCV). OLCV seeks to capitalize on Occidental’s enhanced oil recovery (EOR) leadership by developing carbon capture, utilization and storage projects that source anthropogenic CO2 and promote innovative technologies that drive cost efficiencies and economically grow Occidental’s business while reducing emissions.
For further information regarding Occidental’s segments, geographic areas of operation and current developments, see the “Management’s Discussion and Analysis of Financial Condition and Results of Operations” (MD&A) section of this report and Note 18 - Industry Segments and Geographic Areas in the Notes to Consolidated Financial Statements.
EMPLOYEES |
Occidental employed approximately 14,400 people at December 31, 2019, which included approximately 1,000 employees who have been seconded to WES. Occidental has 10,000 employees located in the United States. Occidental employed approximately 10,400 people in the oil and gas and marketing and midstream segments and 3,000 people in the chemical segment. An additional 1,000 people were employed in administrative and corporate functions. Approximately 500 U.S.-based employees and 900 international-based employees are represented by labor unions.
AVAILABLE INFORMATION |
Occidental’s annual reports on Form 10-K, quarterly reports on Form 10-Q, current reports on Form 8-K, and any amendments to those reports are available free of charge on its website, www.oxy.com, as soon as reasonably practicable after Occidental electronically files the material with, or furnishes it to, the Securities and Exchange Commission (SEC). In addition, copies of our annual report will be made available, free of charge, upon written request.
Information contained on Occidental’s website is not part of this report or any other filings with the SEC.
2 | OXY 2019 FORM 10-K |
| BUSINESS AND PROPERTIES | |
OIL AND GAS OPERATIONS |
GENERAL
Occidental’s oil and gas assets are located in some of the world’s highest-margin basins and are characterized by an advantaged mix of short- and long-cycle high-return development opportunities. Occidental conducts its ongoing exploration and production activities in the United States, the Middle East and Latin America. Within the United States, Occidental has operations in Texas, New Mexico, Colorado, Wyoming and Utah, as well as offshore operations in the Gulf of Mexico. Internationally, Occidental conducts operations in Oman, United Arab Emirates (UAE), Qatar and Colombia. Refer to the Supplemental Oil and Gas Information - Oil and Gas Acreage under Item 8 of this Form 10-K for further disclosure of Occidental’s holdings of developed and undeveloped oil and gas acreage.
In connection with the Acquisition, Occidental agreed to sell to TOTAL S.A. (Total) all of the assets, liabilities, businesses and operations of Anadarko’s operations in Algeria, Ghana, Mozambique and South Africa (collectively, the Africa Assets). Occidental completed the sale of Mozambique LNG assets for approximately $4.2 billion in September 2019. The remaining Africa Assets are classified as held-for-sale and not considered part of Occidental’s ongoing international operations as of December 31, 2019. In January 2020, Occidental completed the sale of South Africa assets to Total. The closing of the sale of the remaining Africa Assets is conditioned on the receipt of required regulatory and government approvals, as well as other customary closing conditions.
COMPETITION
As a producer of oil, condensate, NGL and natural gas, Occidental competes with numerous other domestic and international public, private and government producers. Oil, NGL and natural gas are sensitive to prevailing global and local, current and anticipated market conditions. Occidental competes for capacity and infrastructure for the gathering, processing, transportation, storage and delivery of its products, which are sold at current market prices or on a forward basis to refiners, end users and other market participants. Occidental’s competitive strategy relies on increasing production through developing conventional and unconventional fields, utilizing primary and EOR techniques and strategic acquisitions in areas where Occidental has a competitive advantage as a result of its successful operations or investments in shared infrastructure. Occidental also competes to develop and produce its worldwide oil and gas reserves safely and cost-effectively, maintain a skilled workforce and obtain quality services.
PROVED RESERVES AND SALES VOLUMES
The table below shows Occidental’s year-end oil, NGL and natural gas proved reserves, including reserves acquired in the Acquisition, but excluding reserves related to the Africa Assets. Year-to-date sales volumes exclude Anadarko sales prior to the date of the Acquisition and all sales related to the Africa Assets. See “MD&A — Oil and Gas Segment,” and the information under the caption “Supplemental Oil and Gas Information” for details regarding Occidental’s proved reserves, the reserves estimation process, sales and production volumes, production costs and other reserves-related data.
COMPARATIVE OIL AND GAS PROVED RESERVES AND SALES VOLUMES
Oil (which includes condensate) and NGL are in millions of barrels; natural gas is in billions of cubic feet (Bcf); barrels of oil equivalent (BOE) are in millions.
2019 | 2018 | 2017 | |||||||||||||||||||||||||
Oil | NGL | Gas | BOE | (a) | Oil | NGL | Gas | BOE | (a) | Oil | NGL | Gas | BOE | (a) | |||||||||||||
Proved Reserves (b) | |||||||||||||||||||||||||||
United States | 1,570 | 540 | 4,128 | 2,798 | 1,186 | 284 | 1,445 | 1,711 | 1,107 | 247 | 1,205 | 1,555 | |||||||||||||||
International (c) | 400 | 200 | 2,572 | 1,029 | 397 | 202 | 2,650 | 1,041 | 408 | 198 | 2,626 | 1,043 | |||||||||||||||
Total | 1,970 | 740 | 6,700 | 3,827 | 1,583 | 486 | 4,095 | 2,752 | 1,515 | 445 | 3,831 | 2,598 | |||||||||||||||
Sales Volumes | |||||||||||||||||||||||||||
United States | 155 | 52 | 326 | 261 | 91 | 25 | 119 | 136 | 73 | 20 | 108 | 111 | |||||||||||||||
International (c) | 56 | 12 | 204 | 102 | 62 | 11 | 189 | 104 | 66 | 11 | 188 | 109 | |||||||||||||||
Total | 211 | 64 | 530 | 363 | 153 | 36 | 308 | 240 | 139 | 31 | 296 | 220 | |||||||||||||||
(a) | Natural gas volumes are converted to barrels of oil equivalence (BOE) at six thousand cubic feet (Mcf) of gas per one barrel of oil. Barrels of oil equivalence does not necessarily result in price equivalence. |
(b) | The detailed proved reserves information presented in accordance with Item 1202(a)(2) to Regulation S-K under the Securities Exchange Act of 1934 (Exchange Act) is provided under the heading “Supplemental Oil and Gas Information”. Proved reserves are stated on a net basis after applicable royalties. |
(c) | Excluded reserves of 125 MMBOE and sales of 12 MMBOE related to the Africa Assets. |
OXY 2019 FORM 10-K | 3 |
| BUSINESS AND PROPERTIES | |
CHEMICAL OPERATIONS |
GENERAL
OxyChem owns and operates manufacturing plants at 22 domestic sites in Alabama, Georgia, Illinois, Kansas, Louisiana, Michigan, New Jersey, New York, Ohio, Tennessee and Texas and at two international sites in Canada and Chile.
COMPETITION
OxyChem competes with numerous other domestic and international chemical producers. OxyChem’s market position was first or second in the United States in 2019 for the principal basic chemical products it manufactures and markets as well as for vinyl chloride monomer (VCM). OxyChem ranks in the top three producers of polyvinyl chloride (PVC) in the United States. OxyChem’s competitive strategy is to be a low-cost producer of its products in order to compete on price.
OxyChem produces the following products:
Principal Products | Major Uses | Annual Capacity |
Basic Chemicals | ||
Chlorine | Raw material for ethylene dichloride (EDC), water treatment and pharmaceuticals | 3.4 million tons |
Caustic soda | Pulp, paper and aluminum production | 3.5 million tons |
Chlorinated organics | Refrigerants(a), silicones and pharmaceuticals | 1.0 billion pounds |
Potassium chemicals | Fertilizers, batteries, soaps, detergents and specialty glass | 0.4 million tons |
EDC | Raw material for VCM | 2.1 billion pounds |
Chlorinated isocyanurates | Swimming pool sanitation and disinfecting products | 131 million pounds |
Sodium silicates | Catalysts, soaps, detergents and paint pigments | 0.6 million tons |
Calcium chloride | Ice melting, dust control, road stabilization and oil field services | 0.7 million tons |
Vinyls | ||
VCM | Precursor for PVC | 6.2 billion pounds |
PVC | Piping, building materials and automotive and medical products | 3.7 billion pounds |
Ethylene | Raw material for VCM | 1.2 billion pounds (b) |
(a) | Includes 4CPe, a raw material used in making next-generation, climate-friendly refrigerants with low global-warming and zero ozone-depletion potential. |
(b) | Amount is gross production capacity for 50/50 joint venture with Orbia (formerly Mexichem). |
4 | OXY 2019 FORM 10-K |
| BUSINESS AND PROPERTIES | |
MARKETING AND MIDSTREAM OPERATIONS |
GENERAL
Occidental’s marketing and midstream operations primarily support and enhance its oil and gas and chemical businesses and also provide similar services for third parties. The marketing and midstream segment strives to maximize realized value by optimizing the use of its gathering, processing, transportation, storage and terminal commitments and by providing access to domestic and international markets. To generate returns, the segment evaluates opportunities across the value chain and uses its assets to provide services to Occidental subsidiaries, as well as third parties. The marketing and midstream segment operates gathering systems, gas plants, co-generation facilities and storage facilities and invests in entities that conduct similar activities. Also included in the marketing and midstream segment is OLCV.
Included in the marketing and midstream segment is Occidental’s equity method investment in WES. WES owns gathering systems, plants and pipelines and earns revenue from fee-based and service-based contracts with Occidental and third parties.
COMPETITION
Occidental’s marketing and midstream businesses operate in competitive and highly regulated markets. From the date of the Acquisition to December 31, 2019, WES was a consolidated subsidiary in Occidental’s financial statements. Occidental’s marketing business competes with other market participants on exchange platforms and through other bilateral transactions with direct counterparties.
Occidental’s marketing and midstream operations are conducted in the locations described below as of December 31, 2019:
Location | Description | Capacity |
Gas Plants | ||
Texas, New Mexico and Colorado | Occidental and third-party-operated natural gas gathering, compression and processing systems, and CO2 processing and capturing | 2.7 Bcf per day |
Rocky Mountains, Pennsylvania, Texas and New Mexico | Equity investment in WES - gas processing facilities | 5.7 Bcf per day |
UAE | Natural gas processing facilities for Al Hosn Gas | 1.3 Bcf of natural gas per day |
Pipelines and Gathering Systems | ||
Texas, New Mexico and Colorado | CO2 fields and pipeline systems transporting CO2 to oil and gas producing locations | 2.8 Bcf per day |
Qatar, UAE and Oman | Equity investment in the Dolphin Energy Ltd natural gas pipeline | 3.2 Bcf of natural gas per day |
United States | Equity investment in WES involved in gathering and transportation | 15,819 miles of pipeline(a) |
Power Generation | ||
Texas and Louisiana | Occidental-operated power and steam generation facilities | 1,218 megawatts of electricity and 1.6 million pounds of steam per hour |
(a) | Amounts are gross, including interests held by third parties. |
ENVIRONMENTAL REGULATION |
For environmental regulation information, including associated costs, see the information under the heading “Environmental Liabilities and Expenditures” in the MD&A section of this report and “Risk Factors.”
OXY 2019 FORM 10-K | 5 |
| RISK FACTORS | |
ITEM 1A. | RISK FACTORS |
Risks related to Occidental’s business and operations
Volatile global and local commodity pricing strongly affect Occidental’s results of operations.
Occidental’s financial results correlate closely to the prices it obtains for its products, particularly oil and, to a lesser extent, natural gas and NGL, and its chemical products.
Prices for oil, natural gas and NGL fluctuate widely. Historically, the markets for oil, natural gas and NGL have been volatile and may continue to be volatile in the future. If the prices of oil, natural gas, or NGL continue to be volatile or decline, Occidental’s operations, financial condition, cash flows, level of expenditures and the quantity of estimated proved reserves that may be attributed to our properties may be materially and adversely affected. Prices are set by global and local market forces which are not in Occidental’s control. These factors include, among others:
Ø | Worldwide and domestic supplies of, and demand for, oil, natural gas, NGL and refined products; |
Ø | The cost of exploring for, developing, producing, refining and marketing oil, natural gas, NGL and refined products; |
Ø | Operational impacts such as production disruptions, technological advances and regional market conditions, including available transportation capacity and infrastructure constraints in producing areas; |
Ø | Changes in weather patterns and climate; |
Ø | The impacts of the members of OPEC and other non-OPEC member-producing nations that may agree to and maintain production levels; |
Ø | The worldwide military and political environment, including uncertainty or instability resulting from an escalation or outbreak of armed hostilities or acts of terrorism in the United States, or elsewhere; |
Ø | The price and availability of alternative and competing fuels; |
Ø | Technological advances affecting energy consumption and supply; |
Ø | Domestic and foreign governmental regulations and taxes; |
Ø | Shareholder activism or activities by non-governmental organizations to restrict the exploration, development and production of oil, natural gas and NGL; |
Ø | Additional or increased nationalization and expropriation activities by foreign governments; |
Ø | The impact and uncertainty of world health events; |
Ø | Volatility in commodity futures markets; |
Ø | The effect of energy conservation efforts; and |
Ø | Global inventory levels and general economic conditions. |
The long-term effects of these and other conditions on the prices of oil, natural gas, NGL and refined products are uncertain, and there can be no assurance that the demand or pricing for Occidental’s products will follow historic patterns or recover meaningfully in the near term. Prolonged or substantial decline, or sustained market uncertainty, in these commodity prices may have the following effects on Occidental’s business:
Ø | Adversely affect Occidental’s financial condition, liquidity, ability to reduce debt, pay dividends, finance planned capital expenditures, ability to repurchase shares and results of operations; |
Ø | Reduce the amount of oil, natural gas and NGLs that Occidental can produce economically; |
Ø | Cause Occidental to delay or postpone some of its capital projects; |
Ø | Reduce Occidental’s revenues, operating income or cash flows; |
Ø | Reduce the amounts of Occidental’s estimated proved oil, natural gas and NGL reserves; |
Ø | Reduce the carrying value of Occidental’s oil and natural gas properties due to recognizing impairments of proved properties, unproved properties and exploration assets; |
Ø | Reduce the standardized measure of discounted future net cash flows relating to oil, natural gas and NGL reserves; |
Ø | Limit Occidental’s access to, or increase the cost of, sources of capital such as equity and long-term debt; and |
Ø | Adversely affect the ability of Occidental’s partners to fund their working interest capital requirements. |
Generally, Occidental’s historical practice has been to remain exposed to the market prices of commodities. In 2019, management elected to hedge a portion of Occidental’s expected 2020 oil production to enhance cash flow stability following the Acquisition. In the future, management may elect to hedge some of the risk of oil, natural gas and NGL price fluctuations. Past or future commodity price risk management activities may prevent us from fully benefiting from price increases and may expose us to regulatory and other risks.
The prices obtained for Occidental’s chemical products correlate to the health of the United States and global economies, as well as chemical industry expansion and contraction cycles. Occidental also depends on feedstocks and energy to produce chemicals, which are commodities subject to significant price fluctuations.
6 | OXY 2019 FORM 10-K |
| RISK FACTORS | |
Occidental may experience delays, cost overruns, losses or other unrealized expectations in development efforts and exploration activities.
Oil, natural gas and NGL exploration and production activities are subject to numerous risks beyond our control, including the risk that drilling will not result in commercially viable oil, natural gas and NGL production. In its development and exploration activities, Occidental bears the risks of:
Ø | Equipment failures; |
Ø | Construction delays; |
Ø | Escalating costs or competition for services, materials, supplies or labor; |
Ø | Property or border disputes; |
Ø | Disappointing drilling results or reservoir performance; |
Ø | Title problems and other associated risks that may affect its ability to profitably grow production, replace reserves and achieve its targeted returns; |
Ø | Actions by third-party operators of our properties; |
Ø | Delays and costs of drilling wells on lands subject to complex development terms and circumstances; and |
Ø | Oil, natural gas or NGL gathering, transportation and processing availability, restrictions or limitations. |
Exploration is inherently risky and is subject to delays, misinterpretation of geologic or engineering data, unexpected geologic conditions or finding reserves of disappointing quality or quantity, which may result in significant losses.
Governmental actions and political instability may affect Occidental’s results of operations.
Occidental’s businesses are subject to the actions and decisions of many federal, state, local and foreign governments and political interests. As a result, Occidental faces risks of:
Ø | New or amended laws and regulations, or new or different applications or interpretations of existing laws and regulations, including those related to drilling, manufacturing or production processes (including well stimulation techniques such as hydraulic fracturing and acidization), pipelines, labor and employment, taxes, royalty rates, permitted production rates, entitlements, import, export and use of raw materials, equipment or products, use or increased use of land, water and other natural resources, safety, the manufacturing of chemicals, asset integrity management, the marketing or export of commodities, security and environmental protection, all of which may restrict or prohibit activities of Occidental or its contractors, increase Occidental’s costs or reduce demand for Occidental’s products. In addition, violation of certain governmental laws and regulations may result in strict, joint and several liability and the imposition of significant civil and criminal fines and penalties; |
Ø | Refusal of, or delay in, the extension or grant of exploration, development or production contracts; and |
Ø | Development delays and cost overruns due to approval delays for, or denial of, drilling, construction, environmental and other regulatory approvals, permits and authorizations. |
As an example of local governmental actions, some counties in Colorado have amended their land use regulations to impose new requirements on oil and gas development while other local governments have entered memoranda of agreement with oil and gas producers to accomplish the same objective. Further, voters in Colorado have proposed or advanced ballot initiatives restricting or banning oil and gas development in Colorado. In the event that these ballot initiatives are adopted or the county-level regulations are implemented in areas where we conduct operations, we may incur significant costs to comply with such requirements or may experience delays or curtailment in the permitting or pursuit of exploration, development or production activities.
In addition, Occidental has and may continue to experience adverse consequences, such as risk of loss or production limitations, because certain of its international operations are located in countries affected by political instability, nationalizations, corruption, armed conflict, terrorism, insurgency, civil unrest, security problems, labor unrest, OPEC production restrictions, equipment import restrictions and sanctions. Exposure to such risks may increase if a greater percentage of Occidental’s future oil and gas production or revenue comes from international sources.
Occidental’s oil and gas business operates in highly competitive environments, which affect, among other things, its ability to make acquisitions to grow production and replace reserves.
Results of operations, reserves replacement and growth in oil and gas production depend, in part, on Occidental’s ability to profitably acquire additional reserves. Occidental has many competitors (including national oil companies), some of which: (i) are larger and better funded; (ii) may be willing to accept greater risks; (iii) have greater access to capital; (iv) have substantially larger staffs; or (v) have special competencies. Competition for reserves may make it more difficult to find attractive investment opportunities or require delay of reserve replacement efforts. Further, during periods of low product prices, any cash conservation efforts may delay production growth and reserve replacement efforts. Also, there is substantial competition for capital available for investment in the oil and natural gas industry. Our failure to acquire properties, grow production, replace reserves and attract and retain qualified personnel could have a material adverse effect on our cash flows and results of operations.
OXY 2019 FORM 10-K | 7 |
| RISK FACTORS | |
In addition, Occidental’s acquisition activities carry risks that it may: (i) not fully realize anticipated benefits due to less-than-expected reserves or production or changed circumstances, such as declines in oil, NGL, and natural gas prices; (ii) bear unexpected integration costs or experience other integration difficulties; (iii) experience share price declines based on the market’s evaluation of the activity; or (iv) be subject to liabilities that are greater than anticipated.
Occidental’s oil and gas reserves are estimates based on professional judgments and may be subject to revision.
Reported oil and gas reserves are an estimate based on periodic review of reservoir characteristics and recoverability, including production decline rates, operating performance and economic feasibility at the prevailing commodity prices, assumptions concerning future oil and natural gas prices, future operating costs and capital expenditures, workover and remedial costs, assumed effects of regulation by governmental agencies, the quantity, quality and interpretation of relevant data, taxes and availability of funds. The procedures and methods for estimating the reserves by our internal engineers were reviewed by independent petroleum consultants; however, there are inherent uncertainties in estimating reserves. Actual production, revenues, expenditures, oil, NGL and natural gas prices and taxes with respect to our reserves may vary from estimates, and the variance may be material. If Occidental were required to make significant negative reserve revisions, its results of operations and stock price could be adversely affected.
In addition, the discounted cash flows included in this Form 10-K should not be construed as the fair value of the reserves attributable to our properties. The estimated discounted future net cash flows from proved reserves are based on an unweighted 12-month average first-day-of-the-month prices in accordance with SEC regulations. Actual future prices and costs may differ materially from SEC regulation-compliant prices and costs used for purposes of estimating future discounted net cash flows from proved reserves. Also, actual future net cash flows may differ from these discounted net cash flows due to the amount and timing of actual production, availability of financing for capital expenditures necessary to develop our undeveloped reserves, supply and demand for oil, NGL and natural gas, increases or decreases in consumption of oil, natural gas and NGL and changes in governmental regulations or taxation.
Climate change and further regulation of greenhouse gas emissions may adversely affect Occidental’s operations or results.
Continuing political and social attention to the issue of climate change has resulted in both existing and pending international agreements and national, regional and local legislation and regulatory programs to reduce greenhouse gas emissions. In December 2009, the Environmental Protection Agency (EPA) determined that emissions of carbon dioxide, methane and other greenhouse gases endanger public health and the environment because emissions of such gases are, according to the EPA, contributing to warming of the Earth’s atmosphere and other climatic changes. Based on these findings, the EPA began adopting and implementing regulations to restrict emissions of greenhouse gases under existing provisions of the Clean Air Act (CAA). For example, the EPA issued rules restricting methane emissions from hydraulically fractured and refractured gas wells, compressors, pneumatic controls, storage vessels, and natural gas processing plants. In addition, in August 2019, the EPA issued the Affordable Clean Energy rule that designates heat rate improvement, or efficiency improvement, as the best system of emissions reduction for carbon dioxide from existing coal-fired electric utility generating units.
In the absence of federal legislation to significantly reduce emissions of greenhouse gases to date, many state governments have established rules aimed at reducing greenhouse gas emissions, including greenhouse gas cap and trade programs. Most of these cap and trade programs work by requiring major sources of emissions, such as electric power plants, or major producers of fuels, including refineries and natural gas processing plants, to acquire and surrender emission allowances. In the future, the United States may also choose to adhere to international agreements targeting greenhouse gas reductions. These and other government actions relating to greenhouse gas emissions could require Occidental to incur increased operating and maintenance costs, such as costs to purchase and operate emissions control systems, to acquire emissions allowances, pay carbon taxes, or comply with new regulatory or reporting requirements, or they could promote the use of alternative sources of energy and thereby decrease demand for oil, natural gas, NGL and other products that Occidental’s businesses produce. Any such legislation or regulatory programs could also increase the cost of consuming, and thereby reduce demand for, oil, natural gas, NGL and other products produced by Occidental’s businesses and lower the value of its reserves. Consequently, government actions designed to reduce emissions of greenhouse gases could have an adverse effect on Occidental’s business, financial condition, results of operations, cash flows and reserves.
It is difficult to predict the timing and certainty of such government actions and their ultimate effect on Occidental, which could depend on, among other things, the type and extent of greenhouse gas reductions required, the availability and price of emissions allowances or credits, the availability and price of alternative fuel sources, the energy sectors covered, and Occidental’s ability to recover the costs incurred through its operating agreements or the pricing of its oil, natural gas, NGL and other products.
There also have been efforts in the investment community, including investment advisers and certain sovereign wealth, pension and endowment funds, as well as other stakeholders, promoting divestment of fossil fuel equities and pressuring lenders to limit funding to companies engaged in the extraction of fossil fuel reserves. Such environmental activism and initiatives aimed at limiting climate change and reducing air pollution could interfere with our business activities, operations and ability to access capital. Such initiatives could cause the market value of our securities to decrease, our cost of capital to
8 | OXY 2019 FORM 10-K |
| RISK FACTORS | |
increase and adversely affect our reputation. Finally, increasing attention to climate change risks has resulted in an increased possibility of governmental investigations and additional private litigation against Occidental without regard to causation or our contribution to the asserted damage, which could increase our costs or otherwise adversely affect our business. Occidental has been named in certain private litigation relating to these matters.
Occidental’s businesses may experience catastrophic events.
The occurrence of events such as hurricanes, floods, droughts, earthquakes or other acts of nature, well blowouts, pandemics, fires, explosions, pipeline ruptures, chemical releases, oil releases, including maritime releases, releases into navigable waters, and groundwater contamination, material or mechanical failure, industrial accidents, physical attacks, abnormally pressured or structured formations and other events that cause operations to cease or be curtailed may negatively affect Occidental’s businesses and the communities in which it operates. Coastal operations are particularly susceptible to disruption from extreme weather events. Any of these risks could adversely affect our ability to conduct operations or result in substantial losses to us as a result of:
Ø | Damage to and destruction of property and equipment; |
Ø | Damage to natural resources; |
Ø | Pollution and other environmental damage, including spillage or mishandling of recovered chemicals or fluids; |
Ø | Regulatory investigations and penalties; |
Ø | Loss of well location, acreage, expected production and related reserves; |
Ø | Suspension or delay of our operations; |
Ø | Substantial liability claims; and |
Ø | Repair and remediation costs. |
Third-party insurance may not provide adequate coverage or Occidental may be self-insured with respect to the related losses. In addition, under certain circumstances, we may be liable for environmental damage caused by previous owners or operators of properties that we own, lease or operate. As a result, we may incur substantial liabilities to third parties or governmental entities for environmental matters for which we do not have insurance coverage, which could reduce or eliminate funds available for exploration, development or acquisitions or cause us to incur losses.
Occidental uses CO2 for its enhanced oil recovery (EOR) operations, and its production from these operations may decline if Occidental is not able to obtain sufficient amounts of CO2.
Occidental’s CO2 EOR operations are critical to Occidental’s long-term strategy. Oil production from Occidental’s EOR projects depends largely on having access to sufficient amounts of naturally occurring or anthropogenic CO2. Occidental’s ability to produce oil from its EOR projects would be hindered if the supply of CO2 was limited due to, among other things, problems with current CO2 producing wells and facilities, including compression equipment, catastrophic pipeline failure or the ability to economically purchase naturally occurring or anthropogenic CO2. This could have a material adverse effect on Occidental’s financial condition, results of operations or cash flows. Future oil production from its EOR operations is dependent on the timing, volumes and location of CO2 injections and, in particular, Occidental’s ability to obtain sufficient volumes of CO2. Market conditions may cause the delay or cancellation of the development of naturally occurring CO2 sources or construction of plants that produce anthropogenic CO2 as a byproduct that can be purchased, thus limiting the amount of CO2 available for use in Occidental’s EOR operations.
Occidental is exposed to cyber-related risks.
The oil and gas industry is increasingly dependent on digital and industrial control technologies to conduct certain exploration, development and production activities. Occidental relies on digital and industrial control systems, related infrastructure, technologies and networks to run its business and to control and manage its oil and gas, chemicals, marketing and pipeline operations. Use of the internet, cloud services, mobile communication systems and other public networks exposes Occidental’s business and that of other third parties with whom Occidental does business to cyber-attacks. Cyber-attacks on businesses have escalated in recent years.
Information and industrial control technology system failures, network disruptions and breaches of data security could disrupt our operations by causing delays, impeding processing of transactions and reporting financial results, resulting in the unintentional disclosure of company, partner, customer or employee information or could damage our reputation. A cyber-attack involving our information or industrial control systems and related infrastructure, or that of our business associates, could negatively impact our operations in a variety of ways, including but not limited to, the following:
Ø | Unauthorized access to seismic data, reserves information, strategic information, or other sensitive or proprietary information could have a negative impact on our ability to compete for oil and natural gas resources; |
Ø | Data corruption, communication or systems interruption or other operational disruption during drilling activities could result in delays and failure to reach the intended target or cause a drilling incident; |
OXY 2019 FORM 10-K | 9 |
| RISK FACTORS | |
Ø | Data corruption, communication or systems interruption or operational disruptions of production-related infrastructure could result in a loss of production or accidental discharge; |
Ø | A cyber-attack on our chemical operations could result in a disruption of the manufacturing and marketing of our products or a potential environmental hazard; |
Ø | A cyber-attack on a vendor or service provider could result in supply chain disruptions, which could delay or halt our construction and development projects; |
Ø | A cyber-attack on third-party gathering, pipeline, processing, or other infrastructure systems could delay or prevent us from transporting, processing and marketing our production; |
Ø | A cyber-attack involving commodities exchanges or financial institutions could slow or halt commodities trading, thus preventing us from marketing our production or engaging in hedging activities; |
Ø | A cyber-attack that halts activities at a power generation facility or refinery using natural gas as feedstock could have a significant impact on the natural gas market; |
Ø | A cyber-attack on a communications network or power grid could cause operational disruption; |
Ø | A cyber-attack on our automated and surveillance systems could cause a loss in production and potential environmental hazards; |
Ø | A deliberate corruption of our financial or operating data could result in events of non-compliance which could then lead to regulatory fines or penalties; and |
Ø | A cyber-attack resulting in the loss or disclosure of, or damage to, our or any of our customer’s or supplier’s data or confidential information could harm our business by damaging our reputation, subjecting us to potential financial or legal liability, and requiring us to incur significant costs, including costs to repair or restore our systems and data or to take other remedial steps. |
Even though Occidental has implemented controls and multiple layers of security to mitigate the risks of a cyber-attack that it believes are reasonable, there can be no assurance that such cyber security measures will be sufficient to prevent security breaches of its systems from occurring, and if a breach occurs, it may remain undetected for an extended period of time. Further, Occidental has no control over the comparable systems of the third parties with whom it does business. While Occidental has experienced cyber-attacks in the past, Occidental has not suffered any material losses. However, if in the future Occidental’s cyber security measures are compromised or prove insufficient, the potential consequences to Occidental’s businesses and the communities in which it operates could be significant. As cyber-attacks continue to evolve in magnitude and sophistication, Occidental may be required to expend additional resources in order to continue to enhance Occidental’s cyber security measures and to investigate and remediate any digital and operational systems, related infrastructure, technologies and network security vulnerabilities, which would increase our costs. A system failure or data security breach, or a series of such failures or breaches, could have a material adverse effect on our financial condition, results of operations or cash flows.
Occidental’s oil and gas reserve additions may not continue at the same rate and a failure to replace reserves may negatively affect Occidental’s business.
Producing oil and natural gas reservoirs generally are characterized by declining production rates that vary depending upon reservoir characteristics and other factors. Unless Occidental conducts successful exploration or development activities, acquires properties containing proved reserves, or both, proved reserves will generally decline and negatively impact our business. The value of our securities and our ability to raise capital will be adversely impacted if we are not able to replace reserves that are depleted by production or replace our declining production with new production. Management expects improved recovery, extensions and discoveries to continue as main sources for reserve additions but factors such as geology, government regulations and permits, the effectiveness of development plans and the ability to make the necessary capital investments or acquire capital are partially or fully outside management’s control and could cause results to differ materially from expectations.
Occidental’s commodity-price risk management may prevent us from fully benefiting from price increases and may expose us to regulatory and other risks.
To the extent that we engage in activities to protect Occidental’s cash flows from commodity-price declines, we may be prevented from realizing the full benefits of price increases above the levels of the derivative instruments used to manage price risk. In addition, Occidental’s commodity-price risk management may expose us to the risk of financial loss in certain circumstances, including instances in which the following occur:
Ø | Occidental’s production is less than the notional volume; |
Ø | The counterparties to Occidental’s hedging or other price risk management contracts fail to perform under those arrangements; or |
Ø | A sudden, unexpected event materially impacts oil, natural gas or NGL prices. |
10 | OXY 2019 FORM 10-K |
| RISK FACTORS | |
Occidental’s operations and financial results could be significantly negatively impacted by its offshore operations.
Occidental is vulnerable to risks associated with our offshore operations that could negatively impact our operations and financial results. Occidental conducts offshore operations in the Gulf of Mexico and Ghana. Occidental’s operations and financial results could be significantly impacted by conditions in some of these areas and are also vulnerable to certain unique risks associated with operating offshore, including those relating to the following:
Ø Hurricanes and other adverse weather conditions;
Ø Geological complexities and water depths associated with such operations;
Ø Limited number of partners available to participate in projects;
Ø Oilfield service costs and availability;
Ø Compliance with environmental, safety, and other laws and regulations;
Ø Terrorist attacks or piracy;
Ø Remediation and other costs and regulatory changes resulting from oil spills or releases of hazardous materials;
Ø Failure of equipment or facilities; and
Ø Response capabilities for personnel, equipment, or environmental incidents.
In addition, Occidental conducts some of its exploration in deep waters (greater than 1,000 feet) where operations, support services, and decommissioning activities are more difficult and costly than in shallower waters. The deep waters in the Gulf of Mexico, as well as international deepwater locations, lack the physical and oilfield service infrastructure present in shallower waters. As a result, deepwater operations may require significant time between a discovery and the time that Occidental can market its production, thereby increasing the risk involved with these operations.
Additional domestic and international deepwater drilling laws, regulations and other restrictions, delays in the processing and approval of drilling permits and exploration, development, oil spill response and decommissioning plans and other offshore-related developments may have a material adverse effect on Occidental’s business, financial condition or results of operations.
The Bureau of Ocean Energy Management (BOEM) and the Bureau of Safety and Environmental Enforcement have imposed more stringent permitting procedures and regulatory safety and performance requirements for new wells to be drilled in federal waters. In addition, these governmental agencies are continuing to evaluate, develop and implement new, more restrictive regulatory requirements, which could result in additional costs, delays, restrictions or obligations with respect to oil exploration and production operations conducted offshore. For example, the BOEM has considered, and may adopt, supplemental bonding procedures for the decommissioning of offshore wells, platforms, pipelines and other facilities, which may be material. Compliance with these more stringent regulatory requirements and with existing environmental and oil spill regulations, together with any uncertainties or inconsistencies in decisions and rulings by governmental agencies, delays in the processing and approval of drilling permits or exploration, development, oil spill-response and decommissioning plans, and possible additional regulatory initiatives could result in difficult and more costly actions and adversely affect or delay new drilling and ongoing development efforts.
Occidental’s indebtedness may make it more vulnerable to economic downturns and adverse developments in its business. A downgrade in Occidental’s credit ratings or future increases in interest rates may negatively impact Occidental’s cost of and ability to access the capital markets.
Occidental incurred indebtedness and other payment obligations in connection with the Acquisition. Occidental’s higher level of indebtedness could increase Occidental’s vulnerability to adverse changes in general economic and industry conditions, economic downturns and adverse developments in its business and/or limit Occidental’s flexibility in planning for or reacting to changes in its business and the industries in which it operates. From time to time, Occidental has relied on access to the capital markets for funding, including in connection with the Acquisition. There can be no assurance that additional debt or equity financing will be available to Occidental in the future on acceptable terms, or at all. Occidental’s ability to obtain additional financing or refinancing will be subject to a number of factors, including general economic and market conditions, Occidental’s performance, investor sentiment and its existing debt compliance requirements. If Occidental is unable to generate sufficient funds from its operations to satisfy its capital requirements, including its existing debt obligations, or to raise additional capital on acceptable terms, Occidental’s business could be adversely affected. In addition, a downgrade in the credit rating of Occidental could negatively impact its cost of and ability to access capital and to effectively execute aspects of its strategy, and may require Occidental to provide collateral, letters of credit, or other forms of security under certain contractual agreements, which would increase Occidental’s operating costs. As a result, a downgrade below investment grade in Occidental’s credit ratings could have a material adverse impact on Occidental’s financial condition, operating results, or liquidity.
Further, a portion of Occidental’s indebtedness bears interest at fluctuating interest rates, some of which is tied to the London Interbank Offered Rate (“LIBOR”). LIBOR tends to fluctuate based on general interest rates, rates set by the Federal Reserve and other central banks, the supply of and demand for credit in the London interbank market and general economic conditions. In July 2017, the United Kingdom Financial Conduct Authority, which regulates LIBOR, announced that it intends to stop compelling banks
OXY 2019 FORM 10-K | 11 |
| RISK FACTORS | |
to submit rates for the calculation of LIBOR after 2021. The U.S. Federal Reserve, in conjunction with the Alternative Reference Rates Committee, is considering replacing U.S. dollar LIBOR with a newly created index, calculated based on repurchase agreements backed by treasury securities. It is not possible to predict the effect of these changes, other reforms or the establishment of alternative reference rates in the United Kingdom, the United States or elsewhere. These reforms and other pressures may cause LIBOR to disappear entirely or to perform differently than in the past. The consequences of these developments cannot be entirely predicted, but may include an increase in the cost of Occidental’s variable rate indebtedness, including floating rate notes and interest rate swaps, which may have an adverse effect on Occidental’s financial condition, operating results or cash flows.
Risks related to Occidental’s Acquisition of Anadarko
Occidental may not be able to integrate Anadarko successfully, and many of the anticipated benefits of combining Occidental and Anadarko may not be realized.
Occidental acquired Anadarko with the expectation that the Acquisition will result in various benefits, including, among other things, operating efficiencies. Achieving those anticipated benefits is subject to a number of uncertainties, including whether Occidental can integrate the business of Anadarko in an efficient and effective manner. Occidental cannot ensure that those benefits will be realized as quickly as expected or at all. If Occidental does not achieve anticipated benefits, costs could increase, expected net income could decrease, the stock price could decline, and future business, financial condition, operating results and prospects could suffer.
The integration process could take longer than anticipated and involve unanticipated costs. Disruptions of each company’s ongoing businesses, processes and systems or inconsistencies in standards, controls, procedures, practices, policies and compensation arrangements could adversely affect the combined company. Occidental may also have difficulty addressing differences in corporate cultures and management philosophies and harmonizing other systems and business practices. Although Occidental expects that the elimination of certain duplicative costs, as well as the realization of other efficiencies related to the integration of the two businesses, will over time offset the substantial incremental transaction and Acquisition-related costs, Occidental may not achieve this net benefit in the near term, or at all.
Moreover, even if the integration of Anadarko is successful, the integration process places a significant burden on Occidental’s management and internal resources. The diversion of management’s attention away from day-to-day business concerns and any difficulties encountered in the integration process could adversely affect our financial condition, results of operations or cash flows.
Future results will be negatively impacted if Occidental does not effectively manage its expanded operations.
With completion of the Acquisition, the size of Occidental’s business has increased significantly. Occidental’s continued success depends, in part, upon its ability to manage this expanded business, which poses substantial challenges for management, including challenges related to the management and monitoring of new operations and associated increased costs and complexity. Occidental cannot assure that it will be successful or that it will realize the expected operating efficiencies, cost savings and other benefits from the combination currently anticipated.
Anadarko’s Tronox settlement may not be deductible for income tax purposes, and Occidental may be required to repay the tax refund Anadarko received in 2016 related to the deduction of the Tronox settlement payment, which may have a material adverse effect on Occidental’s results of operations, liquidity and financial condition.
In April 2014, Anadarko and Kerr-McGee Corporation and certain of its subsidiaries (collectively, Kerr-McGee) entered into a settlement agreement for $5.15 billion, resolving all claims that were or could have been asserted in connection with the May 2009 lawsuit filed by Tronox against Anadarko and Kerr-McGee Corporation (and certain of its subsidiaries) in the U.S. Bankruptcy Court for the Southern District of New York. After the settlement became effective in January 2015, Anadarko paid $5.2 billion and deducted this payment on its 2015 federal income tax return. Due to the deduction, Anadarko had a net operating loss carryback for 2015, which resulted in a tentative tax refund of $881 million in 2016. Occidental’s consolidated financial statements include an uncertain tax position greater than the amount of the tentative tax refund received.
The IRS has audited Anadarko’s tax position regarding the deductibility of the payment and in September 2018 issued a statutory notice of deficiency rejecting Anadarko’s refund claim. Anadarko disagreed and filed a petition with the U.S. Tax Court to dispute the disallowance in November 2018. It is possible that Occidental may not ultimately succeed in defending this deduction. If the payment is ultimately determined not to be deductible, Occidental would be required to repay the tentative refund received plus interest totaling approximately $1.1 billion as of December 31, 2019, which could have a material adverse effect on our statement of operations, liquidity and consolidated balance sheets. This amount is not covered by insurance. For additional information on income taxes, see Note 11 - Lawsuits, Claims, Commitments and Contingencies in the Notes to Consolidated Financial Statements.
12 | OXY 2019 FORM 10-K |
| RISK FACTORS | |
Occidental may not be able to complete its planned divestitures of certain assets on favorable terms or at all.
Occidental announced a $15 billion divestiture program in connection with the Acquisition. The completion of these divestitures is subject to customary closing conditions, and certain of the divestitures are conditioned on the receipt of required government and regulatory approvals. Occidental may not be able to complete its planned divestitures on favorable terms, in a timely manner or at all. Any difficulties with respect to the completion of the planned divestitures could have a material adverse effect on Occidental’s business, financial condition, results of operations, cash flows and/or stock price. See Note 4 - Acquisitions, Dispositions and Other Transactions in the Notes to Consolidated Financial Statements in Part II Item 8 of this Form 10-K for information about the Total transaction.
ITEM 1B. | UNRESOLVED STAFF COMMENTS |
None.
ITEM 3. | LEGAL PROCEEDINGS |
On July 17, 2019, an Occidental subsidiary received a draft consent agreement and final order from the EPA regarding alleged violations under the CAA and various sections of the EPA’s Chemical Accident Prevention Provisions at the Convent, Louisiana facility. The EPA’s order includes allegations associated with process reviews, procedures and recordkeeping. The EPA’s revised draft settlement proposal includes a civil penalty of $121,457. Occidental is currently negotiating a resolution of this matter with the EPA.
On September 13, 2019, an Occidental subsidiary received a draft consent agreement and final order from the EPA regarding alleged violations under the CAA and various sections of the EPA’s Chemical Accident Prevention Provisions at the Geismar, Louisiana facility. The EPA’s order includes allegations associated with operating procedures, inspections, contractor reviews, medical protocols in the emergency response plan, administrative updates and four historical on-site incidents. The EPA’s revised draft settlement proposal includes a civil penalty of $734,182. Occidental is currently negotiating a resolution of this matter with the EPA.
For information regarding legal proceedings, see the information under the caption “Lawsuits, Claims, Commitments and Contingencies” in the MD&A section of this report and in Note 11 - Lawsuits, Claims, Commitments and Contingencies in the Notes to Consolidated Financial Statements.
ITEM 4. | MINE SAFETY DISCLOSURES |
Not applicable.
OXY 2019 FORM 10-K | 13 |
| OTHER INFORMATION | |
INFORMATION ABOUT OUR EXECUTIVE OFFICERS |
Each executive officer holds his or her office from the date of election by the Board of Directors until the first board meeting held after the next Annual Meeting of Stockholders or until his or her removal or departure or a successor is duly elected, if earlier.
The following table sets forth the executive officers of Occidental as of February 27, 2020:
Name Current Title | Age at February 27, 2020 | Positions with Occidental and Employment History | |
Marcia E. Backus Senior Vice President | 65 | Senior Vice President, General Counsel and Chief Compliance Officer since December 2016; Senior Vice President, General Counsel, Chief Compliance Officer and Corporate Secretary, 2015-2016; Vice President, General Counsel and Corporate Secretary, 2014-2015; Vice President and General Counsel, 2013-2014; Vinson & Elkins: Partner, 1990-2013. | |
Oscar K. Brown Senior Vice President | 49 | Senior Vice President - Strategy, Business Development and Supply Chain since November 2018; Senior Vice President - Corporate Strategy and Development, 2017 - 2018; Senior Vice President - Business Development, 2016 - 2017; Bank of America Merrill Lynch: Managing Director and co-head of Americas Energy Investment Banking, 2010 - 2016. | |
Cedric W. Burgher Chief Financial Officer and Senior Vice President | 59 | Senior Vice President and Chief Financial Officer since May 2017; EOG Resources: Senior Vice President, Investor and Public Relations, 2014-2017; QR Energy L.P.: Chief Financial Officer, 2010-2014. | |
Christopher O. Champion Vice President | 50 | Vice President, Chief Accounting Officer and Controller since August 2019; Anadarko Petroleum Corporation: Senior Vice President, Chief Accounting Officer and Controller, 2017-2019; Vice President, Chief Accounting Officer and Controller 2015-2017; KPMG LLP: Audit Partner, 2003-2015. | |
Kenneth Dillon Senior Vice President | 60 | Senior Vice President since December 2016; President - International Oil and Gas Operations since June 2016; Senior Vice President - Operations and Major Projects, 2014-2016; Senior Vice President - Major Projects, 2012-2014. | |
Vicki Hollub President and Chief Executive Officer | 60 | President, Chief Executive Officer and Director since April 2016; President, Chief Operating Officer and Director, 2015-2016; Senior Executive Vice President and President, Oxy Oil and Gas, 2015; Executive Vice President and President Oxy Oil and Gas - Americas, 2014-2015; Vice President and Executive Vice President, U.S. Operations, Oxy Oil and Gas, 2013-2014. | |
Edward A. “Sandy” Lowe Executive Vice President | 68 | Executive Vice President since 2015; Group Chairman - Middle East since 2016; Senior Vice President, 2008-2015; President - Oxy Oil & Gas International, 2009-2016. | |
Robert Palmer Senior Vice President | 64 | Senior Vice President since July 2017; President - Domestic Onshore Oil and Gas Operations, Oxy Oil and Gas since June 2019; Senior Vice President - Technical Support, 2017-2019; President and General Manager - Colombia, 2012-2017. | |
Glenn M. Vangolen Senior Vice President | 61 | Senior Vice President, Business Support since February 2015; Executive Vice President, Business Support, 2014-2015; Senior Vice President - Oxy Oil & Gas Middle East, 2010-2014. | |
14 | OXY 2019 FORM 10-K |
| OTHER INFORMATION | |
Part II
ITEM 5. | MARKET FOR REGISTRANT’S COMMON EQUITY, RELATED STOCKHOLDER MATTERS AND ISSUER PURCHASES OF EQUITY SECURITIES |
MARKET INFORMATION, HOLDERS AND DIVIDEND POLICY |
Occidental’s common stock is listed and traded on the New York Stock Exchange under the ticker symbol “OXY.” The common stock was held by approximately 27,700 stockholders of record at January 31, 2020, which does not include beneficial owners for whom Cede and Co. or others act as nominees.
Occidental’s current annualized dividend rate of $3.16 per share has increased by over 500% since 2002. The declaration of future dividends is a business decision made by the Board of Directors from time to time, and will depend on Occidental’s financial condition and other factors deemed relevant by the Board.
SHARE REPURCHASE ACTIVITIES |
Occidental’s share repurchase activities for the year ended December 31, 2019, were as follows:
Period | Total Number of Shares Purchased | Average Price Paid per Share | Total Number of Shares Purchased as Part of Publicly Announced Plans or Programs | Maximum Number of Shares that May Yet Be Purchased Under the Plans or Programs | ||||||||||||||
First Quarter 2019 | 2,690,000 | $ | 66.94 | 2,690,000 | ||||||||||||||
Second Quarter 2019 | — | $ | — | — | ||||||||||||||
Third Quarter 2019 | — | $ | — | — | ||||||||||||||
Fourth Quarter 2019 | — | (a) | $ | — | — | |||||||||||||
Total 2019 | 2,690,000 | (a) | $ | 66.94 | 2,690,000 | 44,206,787 | (b) | |||||||||||
(a) | There were no purchases from the trustee of Occidental’s defined contribution savings plan in the fourth quarter of 2019. |
(b) | Represents the total number of shares remaining at year end under Occidental’s share repurchase program of 185 million shares. The program was initially announced in 2005. The program does not obligate Occidental to acquire any specific number of shares and may be discontinued at any time. |
OXY 2019 FORM 10-K | 15 |
| OTHER INFORMATION | |
PERFORMANCE GRAPH |
The following graph compares the yearly percentage change in Occidental’s cumulative total return on its common stock with the cumulative total return of the Standard & Poor’s 500 Stock Index (S&P 500), which includes Occidental, and with that of Occidental’s peer group over the five-year period ended December 31, 2019. The graph assumes that $100 was invested at the beginning of the five-year period shown in the graph below in: (i) Occidental common stock, (ii) the stock of the companies in the S&P 500, and (iii) each of the peer group companies’ common stock weighted by their relative market capitalization within the peer group, and that all dividends were reinvested. The cumulative total return of the peer group companies’ common stock includes the cumulative total return of Occidental’s common stock.
Occidental’s peer group consists of Apache Corporation, Canadian Natural Resources Limited, Chevron Corporation, ConocoPhillips, Devon Energy Corporation, EOG Resources Inc., ExxonMobil Corporation, Hess Corporation, Marathon Oil Corporation, Total S.A. and Occidental.
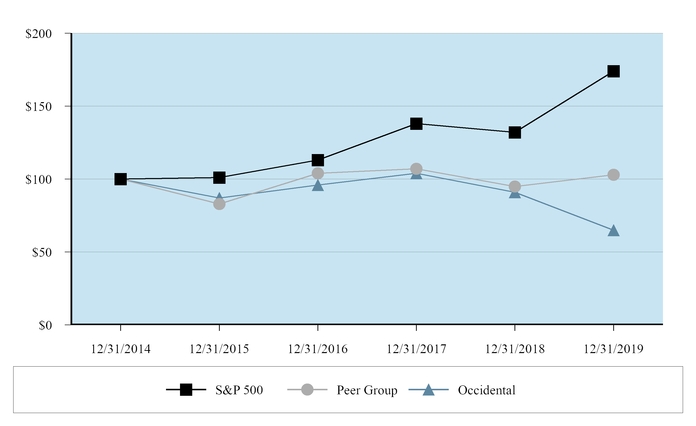
Fiscal Year Ended December 31 | 2014 | 2015 | 2016 | 2017 | 2018 | 2019 | |||||||||||||||||
Occidental | $ | 100 | $ | 87 | $ | 96 | $ | 104 | $ | 91 | $ | 65 | |||||||||||
Peer Group | $ | 100 | $ | 83 | $ | 104 | $ | 107 | $ | 95 | $ | 103 | |||||||||||
S&P 500 | $ | 100 | $ | 101 | $ | 113 | $ | 138 | $ | 132 | $ | 174 | |||||||||||
The information provided in this Performance Graph shall not be deemed “soliciting material” or “filed” with the SEC or subject to Regulation 14A or 14C under the Exchange Act, other than as provided in Item 201 to Regulation S-K under the Exchange Act, or subject to the liabilities of Section 18 of the Exchange Act and shall not be deemed incorporated by reference into any filing under the Securities Act of 1933 or the Exchange Act except to the extent Occidental specifically requests that it be treated as soliciting material or specifically incorporates it by reference.
16 | OXY 2019 FORM 10-K |
| OTHER INFORMATION | |
ITEM 6. | SELECTED FINANCIAL DATA |
millions, except per-share amounts | 2019 (a) | 2018 | 2017 | 2016 | 2015 | ||||||||||||||
RESULTS OF OPERATIONS (b,c) | |||||||||||||||||||
Net sales | $ | 20,393 | $ | 17,824 | $ | 12,508 | $ | 10,090 | $ | 12,480 | |||||||||
Income (loss) from continuing operations | $ | (507 | ) | $ | 4,131 | $ | 1,311 | $ | (1,002 | ) | $ | (8,146 | ) | ||||||
Net income (loss) attributable to common stockholders | $ | (985 | ) | $ | 4,131 | $ | 1,311 | $ | (574 | ) | $ | (7,829 | ) | ||||||
Net income (loss) from continuing operations attributable to common stockholders - basic per common share | $ | (1.20 | ) | $ | 5.40 | $ | 1.71 | $ | (1.31 | ) | $ | (10.64 | ) | ||||||
Net income (loss) attributable to common stockholders - basic per common share | $ | (1.22 | ) | $ | 5.40 | $ | 1.71 | $ | (0.75 | ) | $ | (10.23 | ) | ||||||
Net income (loss) attributable to common stockholders - diluted per common share | $ | (1.22 | ) | $ | 5.39 | $ | 1.70 | $ | (0.75 | ) | $ | (10.23 | ) | ||||||
FINANCIAL POSITION (b) | |||||||||||||||||||
Total assets | $ | 109,330 | $ | 43,854 | $ | 42,026 | $ | 43,109 | $ | 43,409 | |||||||||
Long-term debt, net | $ | 38,537 | $ | 10,201 | $ | 9,328 | $ | 9,819 | $ | 6,855 | |||||||||
Stockholders’ equity | $ | 34,232 | $ | 21,330 | $ | 20,572 | $ | 21,497 | $ | 24,350 | |||||||||
MARKET CAPITALIZATION (d) | $ | 36,846 | $ | 45,998 | $ | 56,357 | $ | 54,437 | $ | 51,632 | |||||||||
CASH FLOW FROM CONTINUING OPERATIONS (b,c) | |||||||||||||||||||
Operating: | |||||||||||||||||||
Cash flow from continuing operations | $ | 7,203 | $ | 7,669 | $ | 4,861 | $ | 2,520 | $ | 3,251 | |||||||||
Investing: | |||||||||||||||||||
Capital expenditures | $ | (6,355 | ) | $ | (4,975 | ) | $ | (3,599 | ) | $ | (2,717 | ) | $ | (5,272 | ) | ||||
Payments for purchases of assets and businesses | $ | (28,088 | ) | $ | (928 | ) | $ | (1,064 | ) | $ | (2,044 | ) | $ | (109 | ) | ||||
Sales of assets, net | $ | 6,143 | $ | 2,824 | $ | 1,403 | $ | 302 | $ | 819 | |||||||||
Cash provided (used) by all other investing activities, net | $ | (573 | ) | $ | (127 | ) | $ | 181 | $ | (284 | ) | $ | (858 | ) | |||||
Financing: | |||||||||||||||||||
Cash dividends paid | $ | (2,624 | ) | $ | (2,374 | ) | $ | (2,346 | ) | $ | (2,309 | ) | $ | (2,264 | ) | ||||
Purchases of treasury stock | $ | (237 | ) | $ | (1,248 | ) | $ | (25 | ) | $ | (22 | ) | $ | (593 | ) | ||||
Proceeds from long-term debt, net - Occidental | $ | 21,557 | $ | 978 | $ | — | $ | 4,203 | $ | 1,478 | |||||||||
Payment of long-term debt, net - Occidental | $ | (6,959 | ) | $ | (500 | ) | $ | — | $ | (2,710 | ) | $ | — | ||||||
Proceeds from issuance of common and preferred stock | $ | 10,028 | $ | 33 | $ | 28 | $ | 36 | $ | 37 | |||||||||
Cash provided (used) by all other financing activities, net | $ | 431 | $ | 9 | $ | — | $ | — | $ | — | |||||||||
DIVIDENDS PER COMMON SHARE | $ | 3.14 | $ | 3.10 | $ | 3.06 | $ | 3.02 | $ | 2.97 | |||||||||
WEIGHTED-AVERAGE BASIC SHARES OUTSTANDING | 810 | 762 | 765 | 764 | 766 | ||||||||||||||
(a) | Summary financial information included the impact of the Acquisition, see Note 3 - The Acquisition in the Notes to Consolidated Financial Statements. Summary results of operations from the date of the Acquisition to December 31, 2019 included the results of WES, a previously consolidated subsidiary. The summary results of operations also included a loss as a result of no longer consolidating WES of approximately $1 billion. See Note 1 - Summary of Significant Accounting Policies in the Notes to Consolidated Financial Statements. |
(b) | See the MD&A section of this report and the Notes to Consolidated Financial Statements for information regarding acquisitions and dispositions, discontinued operations and other charges affecting comparability. |
(c) | The 2019 results include results of operations and cash flows related to the Acquisition for the period beginning August 8, 2019 through December 31, 2019. |
(d) | Market capitalization is calculated by multiplying the year-end total shares of common stock outstanding, net of shares held as treasury stock, by the year-end closing stock price. |
OXY 2019 FORM 10-K | 17 |
| MANAGEMENT’S DISCUSSION AND ANALYSIS | |
ITEM 7. | MANAGEMENT’S DISCUSSION AND ANALYSIS OF FINANCIAL CONDITION AND RESULTS OF OPERATIONS (MD&A) |
The following discussion should be read together with the Consolidated Financial Statements and the Notes to Consolidated Financial Statements, which are included in this Form 10-K in Item 8, and the information set forth in Risk Factors under Item 1A.
INDEX | PAGE |
Segment Results of Operations and Items Affecting Comparability | |
Income Taxes | |
Commitments and Obligations | |
Global Investments | |
18 | OXY 2019 FORM 10-K |
| MANAGEMENT’S DISCUSSION AND ANALYSIS | |
STRATEGY |
GENERAL
Occidental is focused on delivering a unique shareholder value proposition through continual enhancements to its asset quality, organizational capability and innovative technical applications that provide competitive advantages. Occidental’s integrated business provides conventional and unconventional opportunities through which to grow value. Occidental aims to maximize shareholder returns through a combination of:
Ø | Maintaining a sustainable and sector-leading dividend; |
Ø | Allocating capital to high-return, short-cycle and long-cycle, cash-flow generating opportunities across its integrated business; |
Ø | Generating free cash flow growth to reduce debt and return cash to shareholders; |
Ø | Achieving production growth rates of up to 5% over the long-term; and |
Ø | Maintaining a strong balance sheet to secure business and enhance shareholder value. |
Occidental conducts its operations with a focus on sustainability, health, safety and environmental and social responsibility. Capital is employed to operate all assets in a safe and environmentally sound manner. Price volatility is inherent in the oil and gas business, and Occidental’s strategy is to position the business to thrive in an up- or down-cycle commodity price environment.
On August 8, 2019, Occidental closed on its acquisition of Anadarko. The Acquisition added to Occidental’s oil and gas portfolio, primarily in the Permian Basin, DJ Basin and Gulf of Mexico, as well as a significant economic interest in WES. Post-Acquisition, Occidental’s diversified portfolio provides numerous competitive advantages. Occidental is now the largest oil and gas leaseholder in the United States on a net acreage basis with ample opportunities in the Permian Basin, DJ Basin, Powder River Basin and the Gulf of Mexico with the ability to selectively deploy capital in a way that optimizes capital intensity. As the acquired assets are integrated and developed, Occidental will utilize its subsurface and operating expertise to improve productivity and reduce full cycle costs.
KEY PERFORMANCE INDICATORS
Occidental seeks to meet its strategic goals by continually measuring its success against key performance metrics that drive total stockholder return. In addition to efficient capital allocation and deployment discussed below, Occidental believes the following are its most significant metrics:
Ø | Health, safety and environmental and sustainability-related performance measures; |
Ø | Achieving debt reduction targets; |
Ø | Total shareholder return, including dividends; |
Ø | Maintaining investment grade credit metrics; |
Ø | Return on capital employed (ROCE) and cash return on capital employed (CROCE); |
Ø | Specific measures such as earnings per share, per-unit profit, production cost, cash flow, finding and development costs and reserves replacement percentages; and |
Ø | Acquisition-related synergy and divestiture targets. |
OIL AND GAS SEGMENT | ||||
BUSINESS STRATEGY
Occidental’s oil and gas segment focuses on long-term value creation and leadership in sustainability, health, safety and the environment. In each core operating area, Occidental’s operations benefit from scale, technical expertise, decades of high-margin inventory, environmental and safety leadership, and commercial and governmental collaboration. These attributes allow Occidental to bring additional production quickly to market, extend the life of older fields at lower costs, and provide low-cost returns-driven growth opportunities with advanced technology.
With the completion of the Acquisition, Occidental became the largest U.S. producer of oil and liquids in the second half of 2019, allowing Occidental to maximize cash margins on a BOE basis. Through the Acquisition, Occidental acquired modern 3D seismic data pertaining to approximately 450,000 square miles of core domestic development areas. This resulted in a 40% increase in Occidental’s Permian seismic inventory. The advantages that Occidental’s diversified portfolio provides, coupled with unmatched subsurface characterization ability and the proven ability to execute, ensures that Occidental is positioned for full-cycle success in the years ahead. The oil and gas segment continues to focus on integration of the newly acquired assets and efforts to realize synergies at an early stage to deliver lower breakeven costs and generate excess free cash flow.
OXY 2019 FORM 10-K | 19 |
| MANAGEMENT’S DISCUSSION AND ANALYSIS | |
As a result of Occidental’s strategic positioning, Occidental’s assets provide current production and a future portfolio of projects that are flexible and have short-cycle investment paybacks. Together with Occidental’s technical capabilities, the oil and gas segment strives to achieve low development and operating costs to maximize full-cycle value of the assets.
The oil and gas business implements Occidental’s strategy primarily by:
Ø Operating and developing areas where reserves are known to exist and optimizing capital intensity in core areas, primarily in the Permian Basin, DJ Basin, Gulf of Mexico, UAE, Oman, Qatar and Colombia;
Ø Maintaining a disciplined and prudent approach to capital expenditures with a focus on high-return, short-cycle, cash-flow-generating opportunities and an emphasis on creating value and further enhancing Occidental’s existing positions;
Ø Focusing Occidental’s subsurface characterization and technical activities on unconventional opportunities, primarily in the Permian Basin;
Ø Using enhanced oil recovery techniques, such as CO2, water and steam floods in mature fields; and
Ø Focusing on cost-reduction efficiencies and innovative technologies to reduce carbon emissions.
In 2019, oil and gas capital expenditures were approximately $5.5 billion and primarily focused on Occidental’s assets in the Permian Basin, the DJ Basin, Gulf of Mexico and Oman.
BUSINESS ENVIRONMENT
Oil and gas prices are the major variables that drive the industry’s financial performance. The following table presents the average daily West Texas Intermediate (WTI), Brent and New York Mercantile Exchange (NYMEX) prices for 2019 and 2018:
2019 | 2018 | % Change | |||||||||
WTI oil ($/barrel) | $ | 57.03 | $ | 64.77 | (12 | )% | |||||
Brent oil ($/barrel) | $ | 64.18 | $ | 71.53 | (10 | )% | |||||
NYMEX gas ($/Mcf) | $ | 2.67 | $ | 2.97 | (10 | )% | |||||
The following table presents Occidental’s average realized prices for continuing operations as a percentage of WTI, Brent and NYMEX for 2019 and 2018:
2019 | 2018 | |||||
Worldwide oil as a percentage of average WTI | 98 | % | 94 | % | ||
Worldwide oil as a percentage of average Brent | 87 | % | 85 | % | ||
Worldwide NGL as a percentage of average WTI | 30 | % | 41 | % | ||
Worldwide NGL as a percentage of average Brent | 27 | % | 37 | % | ||
Domestic natural gas as a percentage of NYMEX | 49 | % | 54 | % | ||
Prices and differentials can vary significantly, even on a short-term basis, making it difficult to predict realized prices with a reliable degree of certainty.
DOMESTIC INTERESTS
BUSINESS REVIEW
Occidental conducts its domestic operations through land leases, subsurface mineral rights it owns, or a combination of both. Occidental’s domestic oil and gas leases have a primary term ranging from one to ten years, which is extended through the end of production once it commences. Occidental has leasehold and mineral interests in 14.4 million net acres, of which approximately 39% is leased, 55% is owned subsurface mineral rights and 6% is owned land with mineral rights. Included in Occidental’s total net acres is approximately 7 million net acres of primarily undeveloped minerals that pass through Colorado, Wyoming and into Utah. Occidental holds fee ownership of oil and gas, mineral and hardrock mineral rights in this area.
20 | OXY 2019 FORM 10-K |
| MANAGEMENT’S DISCUSSION AND ANALYSIS | |
The following chart shows Occidental’s domestic production volumes for the last five years:
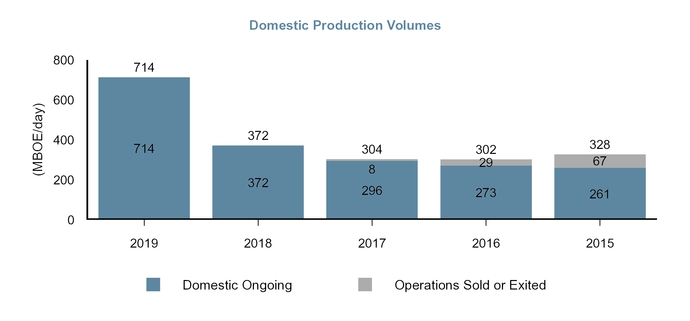
Note: Operations sold include South Texas (sold in April 2017), Piceance (sold in March 2016) and Williston (sold in November 2015).
DOMESTIC ASSETS
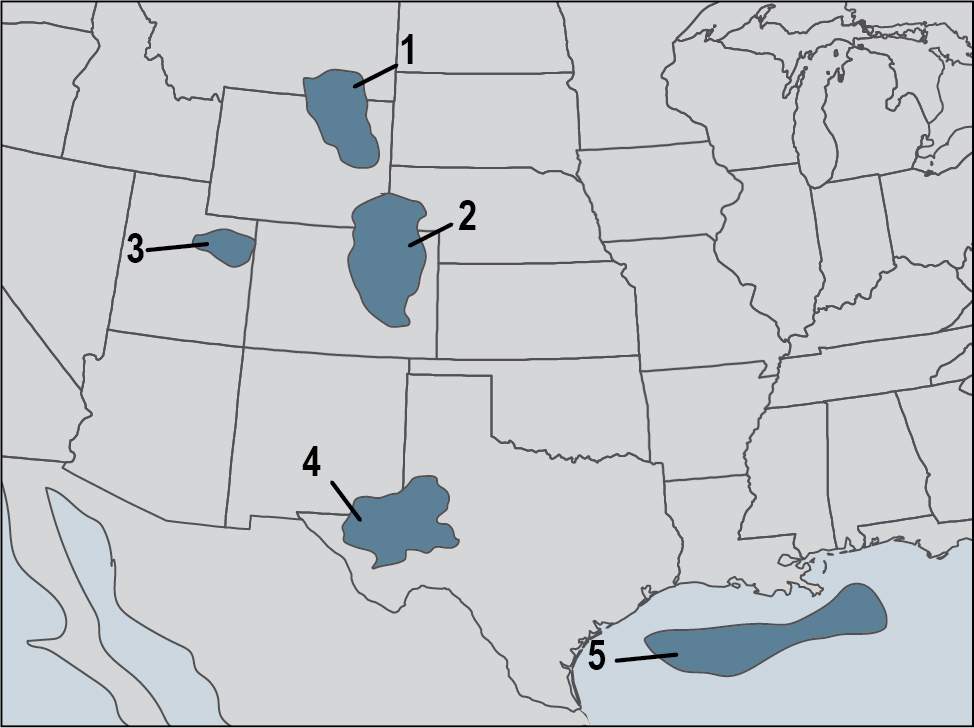 | 1. Powder River Basin 2. DJ Basin 3. Greater Natural Buttes 4. Permian Basin 5. Gulf of Mexico |
Permian Basin
The Permian Basin extends throughout West Texas and southeast New Mexico and is one of the largest and most active oil basins in the United States, accounting for more than 30% of total United States oil production in 2019.
Occidental manages its Permian Basin operations through two business units: Permian Resources, which includes growth-oriented unconventional opportunities, and Permian EOR, which utilizes enhanced oil recovery techniques such as CO2 floods and waterfloods. Occidental has a leading position in the Permian Basin, producing approximately 11% of total oil in
the basin. Occidental’s position in the Texas Delaware sub-basin was further enhanced through assets acquired as part of the Acquisition. By exploiting the natural synergies between Permian Resources and Permian EOR, Occidental is able to deliver unique short- and long-term advantages, efficiencies and expertise across its Permian Basin operations. Occidental expects to decrease its Permian Basin full-cycle breakeven costs, while continuing to expand its high-quality, low-cost
OXY 2019 FORM 10-K | 21 |
| MANAGEMENT’S DISCUSSION AND ANALYSIS | |
breakeven inventory. Occidental expects the combined technical advancements, infrastructure utilization opportunities and operations across over 3.1 million net acres will provide sustainability of Occidental’s low-cost position in the Permian Basin.
In the next few years, growth within Occidental’s Permian Basin portfolio is expected to be focused in the Permian Resources unconventional assets. In 2019, Occidental spent approximately $3.8 billion of capital in the Permian Basin, of which over 85% was spent on Permian Resources assets. In 2020, Occidental expects to allocate approximately 40% of its worldwide capital budget to Permian Resources for development and approximately 8% to Permian EOR for the expansion of existing facilities to increase CO2 production and injection capacity.
In November 2019, Occidental and Ecopetrol formed a joint venture to explore and develop approximately 97,000 net acres of Occidental’s Midland sub-basin properties in the Permian Basin. Occidental owns a 51% interest in the joint venture and is the operator. In exchange for its 49% interest, Ecopetrol paid $750 million in cash to Occidental at closing and will carry 75% of Occidental’s share of capital expenditures, up to $750 million. The joint venture allows Occidental to accelerate its development plans in the Midland Basin, where it currently has minimal activity. Occidental will retain production and cash flow from its existing operations in the Midland Basin.
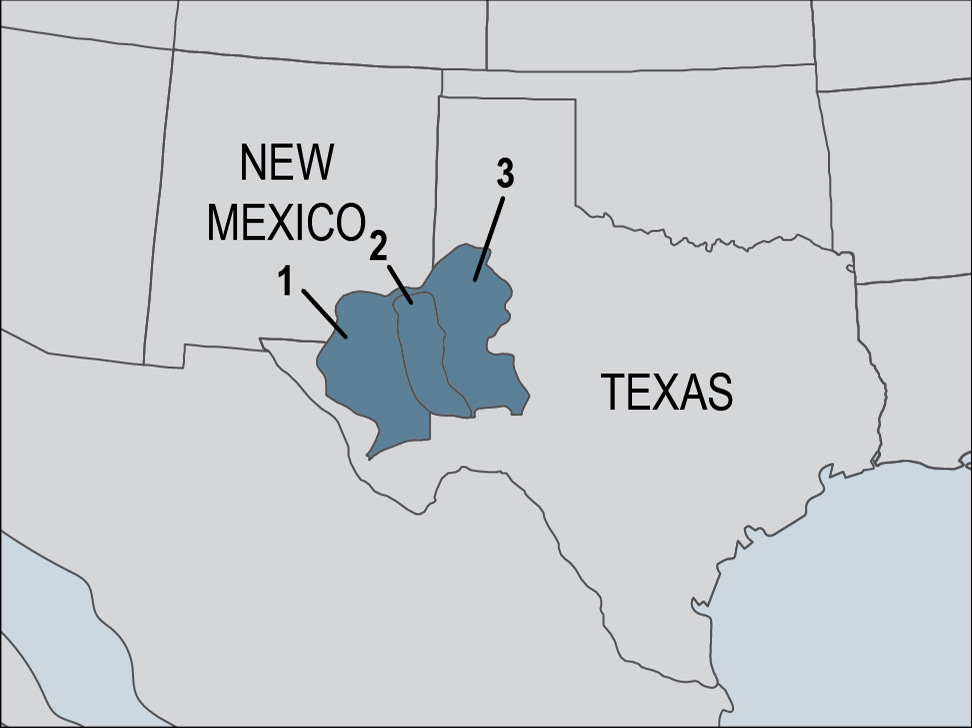 | 1. Delaware Basin 2. Central Basin Platform 3. Midland Basin |
Permian Resources
Permian Resources unconventional oil development projects provide very short-cycle investment payback, averaging less than two years, and generate some of the highest margin and returns of any oil and gas projects in the world. These investments contribute cash flow and production growth, while increasing long-term value and sustainability through higher return on capital employed.
As part of the Acquisition, Occidental acquired Anadarko’s oil and gas operations in Permian Resources which included approximately 370,000 net acres, including 240,000 net acres located primarily within Loving and Reeves Counties. A new well design and flowback method will be implemented in 2020, which is expected to lower the overall well cost while improving completion efficiency. The 2020 plan contemplates the continued development of the newly acquired acreage. Occidental’s share of production from the acquired assets in Permian Resources was approximately 159 thousand BOE per day (MBOE/d) from the Acquisition date through December 31, 2019. Overall in 2019, Permian Resources produced approximately 355 MBOE/d from approximately 7,600 gross wells. In 2019, Permian Resources added 173 MMBOE to Occidental’s proved reserves for improved recovery additions.
Permian EOR
The Permian Basin’s concentration of large conventional reservoirs, favorable CO2 flooding performance and the proximity to naturally occurring CO2 supply has resulted in decades of high-value enhanced oil production. With 34 active CO2 floods and over 40 years of experience, Occidental is the industry leader in Permian Basin CO2 flooding, which can increase ultimate oil recovery by 10% to 25%. Technology improvements, such as the recent trend toward vertical expansion of the CO2 flooded interval into residual oil zone targets, continue to yield more recovery from existing projects. Occidental utilizes workover rigs to drill extra depth into additional CO2 floodable sections of the reservoir. Occidental completed 72 well workovers in 2019 and has plans to complete 81 well workovers in 2020. In 2019, Permian EOR added 14 MMBOE to Occidental’s proved
22 | OXY 2019 FORM 10-K |
| MANAGEMENT’S DISCUSSION AND ANALYSIS | |
reserves for improved recovery additions, primarily as a result of executing CO2 flood development projects and expansions. Occidental’s share of production from Permian EOR was approximately 154 MBOE/d in 2019.
Significant opportunities also remain to gain additional recovery by expanding Occidental’s existing CO2 projects into new portions of reservoirs that have only been water-flooded. Permian EOR has a large inventory of future CO2 projects, which could be developed over the next 20 years or accelerated, depending on market conditions. In addition, OLCV continues making progress towards supplying anthropogenic, or man-made, CO2 for the purpose of carbon capture, utilization and storage in Occidental’s Permian EOR operations.
DJ Basin
Through the Acquisition, Occidental is Colorado’s top oil and gas producer with interest in approximately 650,000 net acres. Production is derived from 2,700 operated vertical wells and 2,000 operated horizontal wells primarily focused in 460,000 net acres in the Niobrara and Codell formations. The DJ Basin provides competitive economics, low breakeven costs and free cash-flow generation.
Occidental’s share of production from the DJ Basin was approximately 303 MBOE/d from the Acquisition date through December 31, 2019. Horizontal drilling results in the field continue to be strong, with improved operational efficiencies in drilling and completions.
License to operate continues to be a key focus moving into 2020. Occidental has a majority of its planned 2020 completions activity permitted. Occidental maintains optionality by flexing resources between DJ Basin and another emerging high rate- of-return program in the Powder River Basin.
Powder River
In the southern Powder River Basin, Occidental acquired through the Acquisition approximately 400,000 net acres mainly located in Converse County, Wyoming. The field contains the Turner, Niobrara, Mowry and Parkman formations that hold both liquids and natural gas.
Greater Natural Buttes
The Greater Natural Buttes area in eastern Utah is a tight-gas asset producing primarily from the Mesa Verde, Wasatch and Blackhawk formations. Occidental uses cryogenic and refrigeration processing facilities in this area to extract NGLs from the natural-gas stream. There was no development activity in this field during 2019 due to capital being allocated to higher-margin projects.
OFFSHORE DOMESTIC ASSETS
Gulf of Mexico
Occidental owns a working interest in 230 blocks in the Gulf of Mexico, operates 10 active floating platforms and holds interests in 18 active fields. In 2020, Occidental will take advantage of its extensive infrastructure across the Gulf of Mexico to execute its long-term plan for development and exploration. It will operate one floating drillship and three platform rigs together with a floating well service rig to cost effectively develop known resources and perform exploration activities to identify tie-back opportunities near existing facilities. The following table shows areas of continuing development in the Gulf of Mexico along with the corresponding working interest in those areas. Acquired assets in the Gulf of Mexico produced approximately 147 MBOE/d from the Acquisition date through December 31, 2019. In addition to its portfolio of undeveloped leases, Occidental’s Gulf of Mexico exploration assets are primarily related to a deepwater discovery located with tie-back proximity to the Horn Mountain platform.
Development Area | Working Interest | |
Horn Mountain | 100 | % |
Marlin | 100 | % |
Holstein | 100 | % |
Caesar Tonga | 34 | % |
Constellation | 33 | % |
Lucius | 49 | % |
K2 Complex | 42 | % |
OXY 2019 FORM 10-K | 23 |
| MANAGEMENT’S DISCUSSION AND ANALYSIS | |
INTERNATIONAL INTERESTS
BUSINESS REVIEW
Occidental conducts its ongoing international operations in two sub-regions: the Middle East and Latin America. Its activities include oil, natural gas and NGL production through direct working-interest and production sharing contracts (PSC).
Production Sharing Contracts
Occidental’s interest in Oman and Dolphin are subject to PSCs. Under such contracts, Occidental records a share of production and reserves to recover certain development and production costs and an additional share for profit. In addition, certain contracts in Colombia are subject to contractual arrangements similar to a PSC. These contracts do not transfer any right of ownership to Occidental and reserves reported from these arrangements are based on Occidental’s economic interest as defined in the contracts. Occidental’s share of production and reserves from these contracts decreases when product prices rise and increases when prices decline. Overall, Occidental’s net economic benefit from these contracts is greater when product prices are higher.
The following chart shows Occidental’s international production volumes for the last five years:
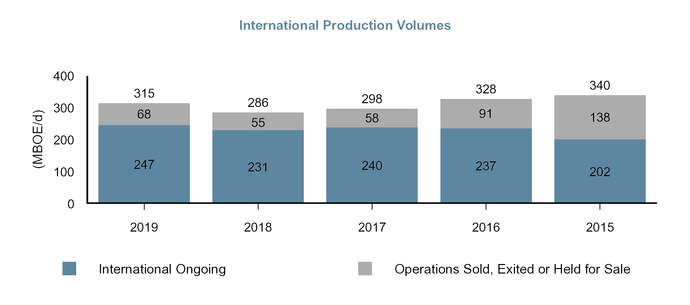
Note: Operations sold, exited or held for sale include the Africa Assets (sold in 2019 or held for sale at December 31, 2019), Qatar (exited in 2019) and other Middle East and North Africa operations exited in 2016 and 2015.
MIDDLE EAST ASSETS
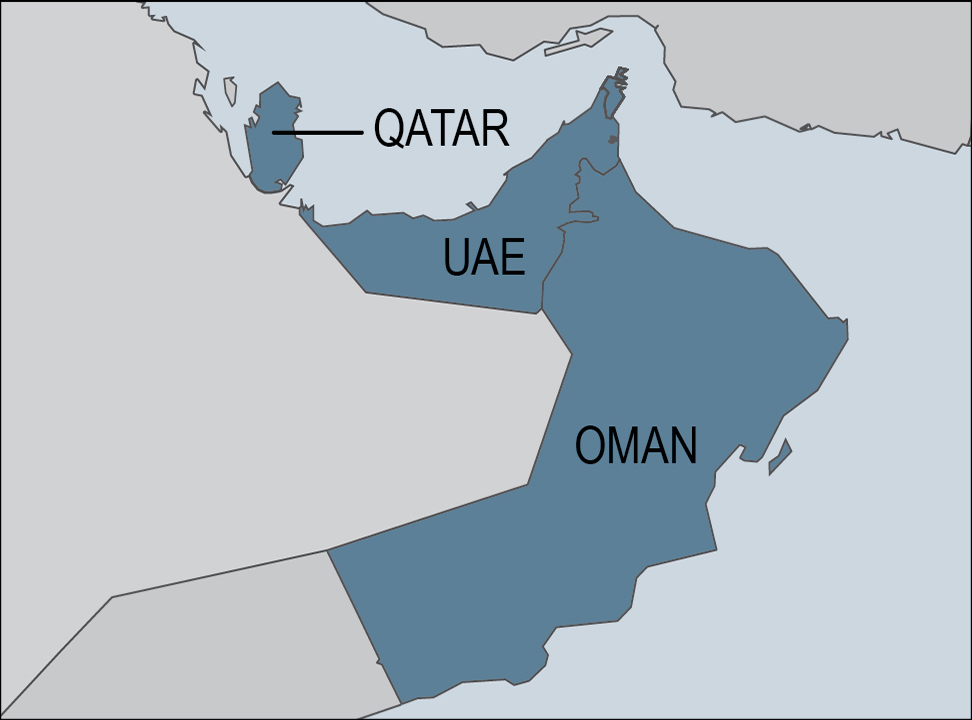 | |
24 | OXY 2019 FORM 10-K |
| MANAGEMENT’S DISCUSSION AND ANALYSIS | |
Oman
In Oman, Occidental is the operator of Block 9 with a 50% working interest, Block 27 with a 65% working interest, Block 53 with a 45% working interest and Block 62 with a 100% working interest. In 2018 and 2019, Occidental entered into Exploration and Production Sharing Agreements for Blocks 30, 51, 65 and 72, which increased the acreage that Occidental holds in Oman from 2.3 million to 6.0 million gross acres and the potential well inventory locations to approximately 10,000. In 2019, Occidental’s share of production was 89 MBOE/d.
The Block 9 contract expires in 2030 and the Block 27 contract expires in 2035. Occidental’s share of production for Blocks 9 and 27 was 27 MBOE/d and 7 MBOE/d in 2019, respectively. The Block 53 (Mukhaizna Field) contract expires in 2035 and is a major world-class pattern steam flood project for enhanced oil recovery that utilizes some of the largest mechanical vapor compressors ever built. Since assuming operations in Mukhaizna in 2005, Occidental has drilled over 3,450 new wells and has increased gross production by over 15 fold. Occidental’s share of production for Block 53 was 33 MBOE/d in 2019. Subject to declaration of commerciality, Block 62 will expire in 2028. Occidental’s share of production for Block 62 was 22 MBOE/d in 2019.
United Arab Emirates
In 2011, Occidental acquired a 40% participating interest in Al Hosn Gas, joining with the Abu Dhabi National Oil Company (ADNOC) in a 30-year joint venture agreement. In 2019, Occidental’s share of production from Al Hosn Gas was 251 MMcf per day of natural gas and 40,000 barrels per day of NGL and condensate. Al Hosn Gas includes gas processing facilities which are discussed further in “Marketing and Midstream Segment - Gas Processing, Gathering and CO2 .”
In 2019, Occidental acquired a 9-year exploration concession and, subject to a declaration of commerciality, a 35-year production concession for onshore Block 3 which covers an area of approximately 1.5 million acres and is adjacent to Al Hosn Gas. Occidental conducts a majority of its Middle East business development activities through its office in Abu Dhabi, which also provides various support functions for Occidental’s Middle East oil and gas operations.
Qatar
In Qatar, Occidental partners in the Dolphin Energy project, an investment that is comprised of two separate economic interests. Occidental has a 24.5% interest in the upstream operations to develop and produce natural gas, NGL and condensate from Qatar’s North Field through mid-2032. Occidental also has a 24.5% interest in Dolphin Energy Limited, which operates a pipeline and is discussed further in “Marketing and Midstream Segment – Pipeline.” Occidental’s net share of production from the Dolphin upstream operations was 42 MBOE/d in 2019.
In 2019, Occidental’s contract for Idd El Shargi North Dome (ISND) expired, and there was a mutually agreed early termination of its Idd El Shargi South Dome (ISSD) contract.
LATIN AMERICA ASSETS
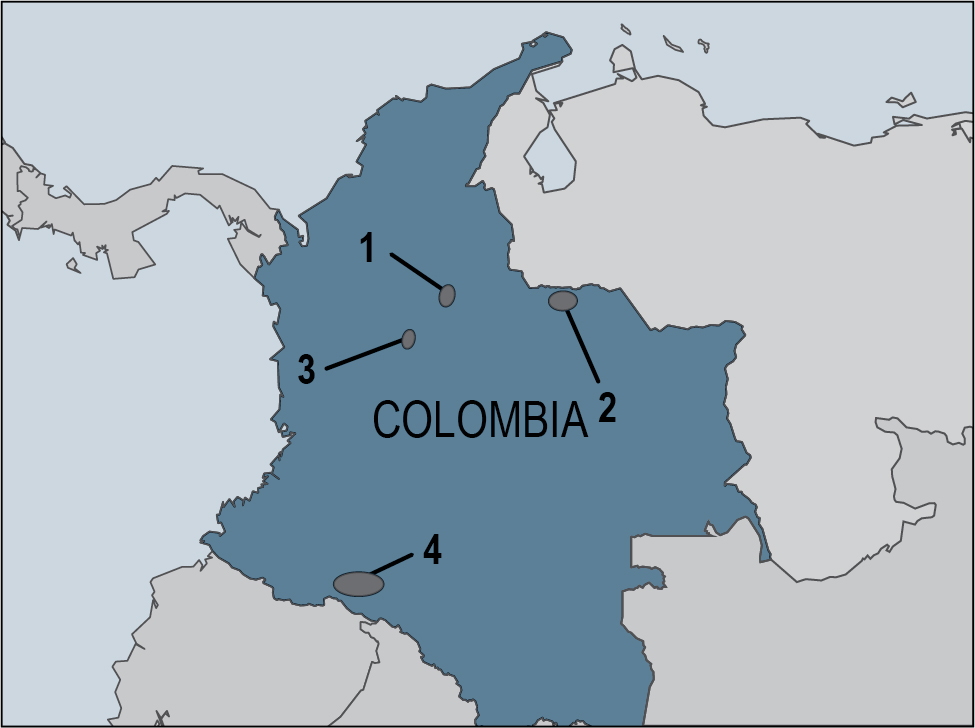 | 1. La Cira-Infantas Waterflood Area 2. Llanos Norte Basin 3. Teca Heavy Oil Area 4. Putumayo Basin |
Colombia
Occidental has working interests in the La Cira-Infantas and Teca areas and has operations within the Llanos Norte Basin. Occidental’s interests range from 39% to 61% and certain interests expire between 2023 and 2038, while others extend through the economic limit of the areas.
OXY 2019 FORM 10-K | 25 |
| MANAGEMENT’S DISCUSSION AND ANALYSIS | |
In 2019, Occidental and Ecopetrol initiated Teca steam flood project second phase development activities. During 2019, 17 new wells were drilled, and the initial facility upgrade project began.
Occidental also farmed into two additional blocks in the prospective Putumayo Basin, consolidating a position of 1.6 million gross acres in the basin.
Occidental’s net share of production from Colombia was 33 MBOE/d in 2019.
AFRICA ASSETS
In September 2019, Occidental completed the sale of Mozambique LNG assets to Total for approximately $4.2 billion. In January 2020, Occidental completed the sale of South Africa assets to Total. Occidental and Total continue to work toward completing the sales of the remaining Africa Assets during 2020. The results of the Africa Assets are presented as discontinued operations in the Consolidated Statements of Operations and Cash Flows. The remaining Africa Assets are classified as held-for-sale and not considered part of Occidental’s ongoing international operations as of December 31, 2019. Operations in Algeria involve production and development activities in Blocks 404A and 208 of Algeria’s Sahara Desert. The El Merk Central Processing Facility (CPF) in Block 208 processed produced oil and NGL, while the Hassi Berkine South and Ourhoud CPFs in Block 404A processed only produced oil. Ghana operations include production and development activities located offshore in the West Cape Three Point Block and the Deepwater Tano Block.
PROVED RESERVES
Proved oil, NGL and natural gas reserves were estimated using the unweighted arithmetic average of the first-day-of-the-month price for each month within the year, unless prices were defined by contractual arrangements. Oil, NGL and natural gas prices used for this purpose were based on posted benchmark prices and adjusted for price differentials including gravity, quality and transportation costs.
The following table shows the 2019, 2018 and 2017 calculated average prices for both WTI and Brent oil prices, as well as the NYMEX gas prices:
2019 | 2018 | 2017 | ||||||||||
WTI oil ($/barrel) | $ | 55.69 | $ | 65.56 | $ | 51.34 | ||||||
Brent oil ($/barrel) | $ | 63.03 | $ | 72.20 | $ | 54.93 | ||||||
NYMEX gas ($/Mcf) | $ | 2.58 | $ | 3.10 | $ | 2.98 | ||||||
Occidental had proved reserves from continuing operations at year-end 2019 of 3,827 million barrels of oil equivalent (MMBOE) (excluding the Africa Assets), compared to the year-end 2018 amount of 2,752 MMBOE. Proved developed reserves represented approximately 76% and 73% of Occidental’s total proved reserves at year-end 2019 and 2018, respectively. The following table shows the breakout of Occidental’s proved reserves from continuing operations by commodity as a percentage of total proved reserves:
2019 | 2018 | |||||
Oil | 52 | % | 57 | % | ||
Natural gas | 29 | % | 25 | % | ||
NGL | 19 | % | 18 | % | ||
Occidental does not have any reserves from non-traditional sources. For further information regarding Occidental’s proved reserves, see “Supplemental Oil and Gas Information.”
The following table details the proved developed and undeveloped reserves related to the Africa Assets that were presented as held for sale at December 31, 2019:
Oil (MMbbl) | NGL(MMbbl) | Natural Gas (Bcf) | Total (MMBOE) | |||||||||
Proved developed reserves | 99 | 7 | 19 | 109 | ||||||||
Proved undeveloped reserves | 14 | — | 11 | 16 | ||||||||
26 | OXY 2019 FORM 10-K |
| MANAGEMENT’S DISCUSSION AND ANALYSIS | |
CHANGES IN PROVED RESERVES
Occidental’s total proved reserves from continuing operations increased 1,075 MMBOE in 2019, which was primarily driven by additions of 1,311 MMBOE primarily from the Acquisition and 356 MMBOE from Occidental’s development program. Changes in reserves were as follows:
MMBOE | 2019 | ||
Revisions of previous estimates | (200 | ) | |
Improved recovery | 293 | ||
Extensions and discoveries | 63 | ||
Purchases | 1,311 | ||
Sales | (29 | ) | |
Production | (363 | ) | |
Total | 1,075 | ||
Occidental’s ability to add reserves, other than through purchases, depends on the success of improved recovery, extension and discovery projects, each of which depends on reservoir characteristics, technology improvements and oil and natural gas prices, as well as capital and operating costs. Many of these factors are outside management’s control and may negatively or positively affect Occidental’s reserves.
Purchases of Proved Reserves
In 2019, Occidental purchased proved reserves of 1,311 MMBOE primarily as part of the Acquisition, including proved reserves in the Permian Delaware Basin, the DJ Basin and Gulf of Mexico. As part of smaller asset purchases separate from the Acquisition, Occidental purchased proved reserves in Permian Resources New Mexico.
Revisions of Previous Estimates
Revisions can include upward or downward changes to previous proved reserve estimates for existing fields due to the evaluation or interpretation of geologic, production decline or operating performance data. In addition, product price changes affect proved reserves recorded by Occidental. For example, lower prices may decrease the economically recoverable reserves, particularly for domestic properties, because the reduced margin limits the expected life of the operations. Offsetting this effect, lower prices increase Occidental’s share of proved reserves under PSCs because more oil is required to recover costs. Conversely, when prices rise, Occidental’s share of proved reserves decreases for PSCs and economically recoverable reserves may increase for other operations. Reserve estimation rules require that estimated ultimate recoveries be much more likely to increase or remain constant than to decrease, as changes are made due to increased availability of technical data.
In 2019, Occidental had negative revisions of 200 MMBOE, primarily related to negative price revisions, changes to development plans and reservoir performance in the Permian Basin.
Improved Recovery
In 2019, Occidental added proved reserves of 293 MMBOE mainly associated with the Permian Basin. These properties comprise both conventional projects, which are characterized by the deployment of EOR development methods, largely employing application of CO2 flood, waterflood or steam flood, and unconventional projects. These types of conventional EOR development methods can be applied through existing wells, though additional drilling is frequently required to fully optimize the development configuration. Waterflooding is the technique of injecting water into the formation to displace the oil to the offsetting oil production wells. The use of either CO2 or steam flooding depends on the geology of the formation, the evaluation of engineering data, availability and cost of either CO2 or steam and other economic factors. Both techniques work similarly to lower viscosity causing the oil to move more easily to the producing wells. Many of Occidental’s projects, including unconventional projects, rely on improving permeability to increase flow in the wells. In addition, some improved recovery comes from drilling infill wells that allow recovery of reserves that would not be recoverable from existing wells.
Extensions and Discoveries
Occidental also added proved reserves from extensions and discoveries, which are dependent on successful exploration and exploitation programs. In 2019, extensions and discoveries added 63 MMBOE primarily related to the recognition of proved undeveloped reserves due to post-Acquisition activities for acquired properties in the Permian Basin and Gulf of Mexico.
Sales of Proved Reserves
In 2019, Occidental sold 29 MMBOE in proved reserves mainly related to non-core Permian Basin acreage.
OXY 2019 FORM 10-K | 27 |
| MANAGEMENT’S DISCUSSION AND ANALYSIS | |
Proved Undeveloped Reserves
Occidental had proved undeveloped reserves at year-end 2019 of 904 MMBOE, compared to the year-end 2018 amount of 750 MMBOE. Changes in proved undeveloped reserves were as follows:
MMBOE | 2019 | ||
Revisions of previous estimates | (166 | ) | |
Improved recovery | 192 | ||
Extensions and discoveries | 36 | ||
Purchases | 317 | ||
Sales | (29 | ) | |
Transfer to proved developed reserves | (196 | ) | |
Total | 154 | ||
Occidental incurred approximately $1.8 billion in 2019 to convert proved undeveloped reserves to proved developed reserves. Permian Basin added approximately 500 MMBOE through improved recovery and purchases.
The 2019 additions to proved undeveloped reserves were partially offset by 196 MMBOE transfers to proved developed reserves, primarily in the Permian Basin, 166 MMBOE of negative revisions of previous estimates primarily related to negative price revisions, changes to development plans and reservoir performance in the Permian Basin.
Occidental’s highest-return projects and most active development areas are located in the Permian Basin, which represented 44% of the proved undeveloped reserves as of December 31, 2019. Nearly half of Occidental’s 2020 capital program of $5.3 billion is allocated to the development program in the Permian Basin. Overall, Occidental plans to spend approximately $3.6 billion over the next five years to develop its proved undeveloped reserves in the Permian Basin.
Occidental’s proved undeveloped reserves in international locations are associated with approved long-term international development projects.
RESERVES EVALUATION AND REVIEW PROCESS
Occidental’s estimates of proved reserves and associated future net cash flows as of December 31, 2019, were made by Occidental’s technical personnel and are the responsibility of management. The estimation of proved reserves is based on the requirement of reasonable certainty of economic producibility and funding commitments by Occidental to develop the reserves. This process involves reservoir engineers, geoscientists, planning engineers and financial analysts. As part of the proved reserves estimation process, all reserve volumes are estimated by a forecast of production rates, operating costs and capital expenditures. Price differentials between benchmark prices (the unweighted arithmetic average of the first-day-of-the-month price for each month within the year) and realized prices and specifics of each operating agreement are then used to estimate the net reserves. Production rate forecasts are derived by a number of methods, including estimates from decline curve analysis, type curve analysis, material balance calculations that take into account the volumes of substances replacing the volumes produced, and associated reservoir pressure changes, seismic analysis and computer simulation of the reservoir performance. These reliable field-tested technologies have demonstrated reasonably certain results with consistency and repeatability in the formation being evaluated or in an analogous formation. Operating and capital costs are forecast using the current cost environment applied to expectations of future operating and development activities.
Net proved developed reserves are those volumes that are expected to be recovered through existing wells with existing equipment and operating methods for which the incremental cost of any additional required investment is relatively minor.
Net proved undeveloped reserves are those volumes that are expected to be recovered from new wells on undrilled acreage, or from existing wells where a relatively major expenditure is required for recompletion. Proved undeveloped reserves are supported by a five-year, detailed, field-level development plan, which includes the timing, location and capital commitment of the wells to be drilled. The development plan is reviewed and approved annually by senior management and technical personnel. Annually a detailed review is performed by Occidental’s Worldwide Reserves Group and its technical personnel on a lease-by-lease basis to assess whether proved undeveloped reserves are being converted on a timely basis within five years from the initial disclosure date. Any leases not showing timely transfers from proved undeveloped reserves to proved developed reserves are reviewed by senior management to determine if the remaining reserves will be developed in a timely manner and have sufficient capital committed in the development plan. Only proved undeveloped reserves that are reasonably certain to be drilled within five years of booking and are supported by a final investment decision to drill them are included in the development plan. A portion of the proved undeveloped reserves associated with international operations are expected to be developed beyond the five years and are tied to approved long-term development plans.
The current Senior Vice President, Reserves for Oxy Oil and Gas is responsible for overseeing the preparation of reserve estimates, in compliance with U.S. SEC rules and regulations, including the internal audit and review of Occidental’s oil and gas reserves data. He has over 35 years of experience in the upstream sector of the exploration and production business, and has held various assignments in North America, Asia and Europe. He is a three-time past Chair of the Society of Petroleum Engineers Oil and Gas Reserves Committee. He is an American Association of Petroleum Geologists (AAPG) Certified Petroleum Geologist and currently serves on the AAPG Committee on Resource Evaluation. He is a member of the Society
28 | OXY 2019 FORM 10-K |
| MANAGEMENT’S DISCUSSION AND ANALYSIS | |
of Petroleum Evaluation Engineers, the Colorado School of Mines Potential Gas Committee and the UNECE Expert Group on Resource Management. He has Bachelor of Science and Master of Science degrees in geology from Emory University in Atlanta.
Occidental has a Corporate Reserves Review Committee (Reserves Committee), consisting of senior corporate officers, to review and approve Occidental’s oil and gas reserves. The Reserves Committee reports to the Audit Committee of Occidental’s Board of Directors during the year. Since 2003, Occidental has retained Ryder Scott Company, L.P. (Ryder Scott), independent petroleum engineering consultants, to review its annual oil and gas reserve estimation processes. In addition, Occidental utilized Miller and Lents, Ltd. (M&L), independent petroleum engineering consultants who were previously retained by Anadarko, to review the annual oil and gas reserve estimation processes associated with the Anadarko reserves. For additional reserves information, see Supplemental Oil and Gas Information under Item 8 of this Form 10-K.
In 2019, both Ryder Scott and M&L conducted a process review of the methods and analytical procedures utilized by Occidental’s engineering and geological staff for estimating the proved reserves volumes, preparing the economic evaluations and determining the reserves classifications as of December 31, 2019, in accordance with SEC regulatory standards. Ryder Scott and M&L reviewed the specific application of such methods and procedures for selected oil and gas properties considered to be a valid representation of Occidental’s 2019 year-end total proved reserves portfolio. In 2019, Ryder Scott reviewed approximately 20% of legacy Occidental’s proved oil and gas reserves. Since being engaged in 2003, Ryder Scott has reviewed the specific application of Occidental’s reserve estimation methods and procedures for approximately 80% of legacy Occidental’s existing proved oil and gas reserves. M&L reviewed approximately 90% of the Anadarko proved oil and gas reserves.
Management retained Ryder Scott and M&L to provide objective third-party input on its methods and procedures and to gather industry information applicable to Occidental’s reserve estimation and reporting process. Neither Ryder Scott nor M&L has been engaged to render an opinion as to the reasonableness of reserves quantities reported by Occidental. Occidental has filed Ryder Scott’s and M&L’s independent reports as exhibits to this Form 10-K.
Based on its reviews, including the data, technical processes and interpretations presented by Occidental, Ryder Scott and M&L have concluded that the overall procedures and methodologies Occidental utilized in estimating the proved reserves volumes, documenting the changes in reserves from prior estimates, preparing the economic evaluations and determining the reserves classifications for the reviewed properties are appropriate for the purpose thereof and comply with current SEC regulations.
INDUSTRY OUTLOOK
The petroleum industry is highly competitive and subject to significant volatility due to various market conditions. WTI and Brent oil price indexes increased throughout 2019 closing at $61.06 per barrel and $66.00 per barrel, respectively, as of December 31, 2019.
Oil prices will continue to be affected by: (i) global supply and demand, which are generally a function of global economic conditions, inventory levels, production disruptions, technological advances, regional market conditions and the actions of OPEC, other significant producers and governments; (ii) transportation capacity, infrastructure constraints, and costs in producing areas; (iii) currency exchange rates; and (iv) the effect of changes in these variables on market perceptions.
NGL prices are related to the supply and demand for the components of products making up these liquids. Some of them more typically correlate to the price of oil while others are affected by natural gas prices as well as the demand for certain chemical products for which they are used as feedstock. In addition, infrastructure constraints magnify the pricing volatility from region to region.
Domestic natural gas prices and local differentials are strongly affected by local supply and demand fundamentals, as well as government regulations and availability of transportation capacity from producing areas.
These and other factors make it difficult to predict the future direction of oil, NGL and domestic gas prices reliably. For purposes of the current capital plan, Occidental will continue to focus on allocating capital to its highest-return assets with the flexibility to adjust based on fluctuations in commodity prices. International gas prices are generally fixed under long-term contracts. Occidental continues to adjust capital expenditures in line with current economic conditions with the goal of keeping returns well above its cost of capital.
OXY 2019 FORM 10-K | 29 |
| MANAGEMENT’S DISCUSSION AND ANALYSIS | |
CHEMICAL SEGMENT |
BUSINESS STRATEGY
OxyChem seeks to generate cash flow in excess of its normal capital expenditure requirements and achieve above-cost-of-capital returns. The chemical segment focuses on being a low-cost producer in order to maximize cash flow generation. OxyChem concentrates on the chlorovinyls chain, beginning with the co-production of caustic soda and chlorine. Caustic soda and chlorine are marketed to external customers. In addition, chlorine, together with ethylene, is converted through a series of intermediate products into polyvinyl chloride (PVC). OxyChem’s focus on chlorovinyls allows it to maximize the benefits of integration and take advantage of economies of scale. Capital is employed to sustain production capacity and to focus on projects and developments designed to improve the competitiveness of segment assets. Acquisitions and plant development opportunities may be pursued when they are expected to enhance the existing core chlor-alkali and PVC businesses or take advantage of other specific opportunities. In 2019, capital expenditures for OxyChem totaled $267 million.
BUSINESS ENVIRONMENT
In 2019, the United States economic growth rate, estimated to be 2.3%, was lower than the 2.9% experienced in 2018, which resulted in lower demand for caustic soda and PVC. Ethylene prices trended downward in the first half of 2019 before increasing in the second half of the year with the total year average ethylene price being less than that of 2018. Pricing for caustic soda and PVC was lower in 2019, partially offset by lower energy and feedstock costs. Domestic demand for caustic soda and PVC was negatively impacted by slower or no growth in manufacturing, automotive and construction markets as well as a weaker pulp and paper market.
BUSINESS REVIEW
BASIC CHEMICALS
The lower U.S. growth rate resulted in lower domestic demand as the industry chlor-alkali operating rates decreased by 3% compared to 2018. Liquid caustic soda prices were lower both domestically and globally in 2019 due to weaker demand in the alumina and pulp and paper market segments, which was partially offset by lower energy prices than in 2018. Exports of downstream chlorine derivatives into the vinyls chain decreased in 2019 as demand for PVC lagged year-over-year.
VINYLS
Demand for PVC in 2019 decreased year-over-year in total as domestic demand was down 3% from 2018 while export demand increased by less than 1%. Domestic demand was weaker in the first half of 2019 due to lower construction demand caused by weather conditions and demand did not fully recover in the second half of 2019. Export demand growth was driven by emerging economy growth and competitive North American feedstock costs. Export volume remains a significant portion of PVC sales representing over 34% of total North American producer’s production. PVC industry operating rates decreased by 1% compared to 2018. Industry PVC margins decreased in 2019 due to lower PVC prices partially offset by lower ethylene prices in the first half of 2019 and lower energy prices than in 2018.
INDUSTRY OUTLOOK
Industry performance will depend on the health of the global economy, specifically in the housing, construction, automotive and durable goods markets. The housing and construction markets are expected to strengthen over the next year while the automotive and durable goods markets look to remain flat or decrease slightly. Margins also depend on market supply and demand balances and feedstock and energy prices. Weakening in the petroleum industry may negatively affect the demand and pricing of a number of Occidental’s products that are consumed by industry participants. U.S. commodity export markets will continue to be impacted by the relative strength of the U.S. dollar.
BASIC CHEMICALS
Continued improvement in the United States housing market, offset by flat to weakening automotive and durable goods markets, are expected to result in a flattening to a moderate increase in demand for basic chemical products in 2020. Export demand for caustic soda is expected to be similar to 2019 levels driven by limited demand improvement into the alumina market. Chlor-alkali operating rates should improve moderately with higher demand and continued competitive energy and raw material pricing as compared to global feedstock costs. Businesses such as calcium chloride and muriatic acid may be affected by flatter U.S. oil growth trends, as well as shifts in drilling technology.
VINYLS
North American demand for PVC is expected to improve in 2020 over 2019 levels, as growth in residential construction spending is expected to rebound along with upside potential driven by new infrastructure projects. Although overall demand is expected to increase in North America, operating rates are anticipated to remain relatively flat in 2020 as new PVC capacity is expected to enter the market. Growth in the export market is likely along with favorable ethylene costs continuing in 2020.
30 | OXY 2019 FORM 10-K |
| MANAGEMENT’S DISCUSSION AND ANALYSIS | |
MARKETING AND MIDSTREAM SEGMENT |
BUSINESS STRATEGY
The marketing and midstream segment strives to maximize realized value by optimizing the use of its gathering, processing, transportation, storage and terminal commitments and by providing access to domestic and international markets. To generate returns, the segment evaluates opportunities across the value chain and uses its assets to provide services to Occidental’s subsidiaries, as well as third parties. The marketing and midstream segment operates gathering systems, gas plants, co-generation facilities and storage facilities and invests in entities that conduct similar activities. From August 8, 2019, to December 31, 2019, WES’s operating results were consolidated in the marketing and midstream segment. As of December 31, 2019, Occidental will account for its ownership investment in WES under the equity method of accounting. See Note 16 - Investments and Related-Party Transactions in the Notes to Consolidated Financial Statements.
Also within the marketing and midstream segment is OLCV. OLCV seeks to capitalize on Occidental’s EOR leadership by developing carbon capture, utilization and storage projects that source anthropogenic CO2 and promote innovative technologies that drive cost efficiencies and economically grow Occidental’s business while reducing emissions.
This segment also seeks to minimize the costs of gas, power and other commodities used in Occidental’s various businesses. Capital is employed to sustain or expand assets to improve the competitiveness of Occidental’s businesses. In 2019, capital expenditures related to the marketing and midstream segment totaled $461 million (including $365 million related to WES).
BUSINESS ENVIRONMENT
Marketing and midstream segment earnings are affected by the performance of its various businesses, including its marketing, gathering and transportation, gas processing and power-generation assets. The marketing business aggregates, markets and stores Occidental and third-party volumes. Marketing performance is affected primarily by commodity price changes and margins in oil and gas transportation and storage programs. The marketing business results can experience significant volatility depending on commodity price changes and the Midland to Gulf Coast spreads. In 2019, the Permian takeaway capacity increased as several new third-party pipelines were completed, which in turn reduced the Midland to Gulf Coast spreads. Gas gathering, processing and transportation results are affected by fluctuations in commodity prices and the volumes that are processed and transported through the segment’s plants, as well as the margins obtained on related services from investments in which Occidental has an equity interest. The 2019 declines in NGL prices and sulfur prices negatively impacted the gas processing business.
BUSINESS REVIEW
MARKETING
The marketing group markets substantially all of Occidental’s oil, NGL and natural gas production, as well as trades around its assets, including contracted transportation and storage capacity. Occidental’s third-party marketing activities focus on purchasing oil, NGL and gas for resale from parties whose oil and gas supply is located near its transportation and storage assets. These purchases allow Occidental to aggregate volumes to better utilize and optimize its assets. In 2019, compared to the prior year, marketing results were negatively impacted by the decline in the Midland-to-Gulf Coast spreads, as well as non-cash mark-to-market losses.
OXY 2019 FORM 10-K | 31 |
| MANAGEMENT’S DISCUSSION AND ANALYSIS | |
PIPELINE
Occidental’s pipeline business mainly consists of its 24.5% ownership interest in Dolphin Energy. Dolphin Energy owns and operates a 230-mile-long, 48-inch-diameter natural gas pipeline (Dolphin Pipeline), which transports dry natural gas from Qatar to the UAE and Oman. The Dolphin Pipeline has capacity to transport up to 3.2 Bcf of natural gas per day and currently transports approximately 2.2 Bcf per day, and up to 2.5 Bcf per day in the summer months.
In 2019, compared to the prior year, pipeline income declined due to the 2018 sale of the Centurion Pipeline common carrier oil pipeline and storage system and the Ingleside Crude Terminal.
GAS PROCESSING, GATHERING AND CO2
Occidental processes its and third-party domestic wet gas to extract NGL and other gas byproducts, including CO2, and delivers dry gas to pipelines. Margins primarily result from the difference between inlet costs of wet gas and market prices for NGL.
As of December 31, 2019, Occidental has 54.5% of limited partner unit interest and a 2% non-voting general partner unit interest in WES. In addition, Occidental has a 2% non-voting limited partner interest in Western Midstream Operating, LP, a consolidated subsidiary of WES. Prior to December 31, 2019 Occidental consolidated WES. As of December 31, 2019, Occidental recognizes WES as an equity method investment. See Note 1 - Summary of Significant Accounting Policies in the Notes to Consolidated Financial Statements. WES owns gathering systems, plants and pipelines and earns revenue from fee-based and service-based contracts with Occidental and third parties.
Occidental also has a 40% participating interest in Al Hosn Gas which is designed to process 1.3 Bcf per day of natural gas and separate it into salable gas, condensate, NGL and sulfur. In 2019, the facilities produced approximately 11,500 metric tons per day of sulfur, of which approximately 4,600 metric tons was Occidental’s share. Al Hosn Gas facilities generate revenues from gas processing fees and the sale of sulfur.
In 2019, compared to the prior year, gas processing, gathering and CO2 results increased primarily due to income from WES partially offset by lower NGL prices and sulfur prices which negatively impacted the gas processing business.
POWER GENERATION FACILITIES
Earnings from power and steam generation facilities are derived from sales to affiliates and third parties.
LOW CARBON VENTURES
OLCV was formed to execute on Occidental’s vision to reduce global emissions and provide a more sustainable future through low carbon energy and products. OLCV capitalizes on Occidental’s extensive experience in utilizing CO2 for EOR by investing in technologies, developing projects and providing services to facilitate and accelerate the implementation of carbon capture, utilization and storage projects and opportunities for zero-carbon power. Moreover, OLCV is fostering new technologies and business models with the potential to position Occidental as a leader in the production of low-carbon oil and products.
INDUSTRY OUTLOOK
Marketing and midstream segment results can experience volatility depending on the Midland to Gulf Coast spreads and commodity price changes. The decline in the Midland to Gulf Coast spreads in the second half of 2019 has continued into the early part of 2020. If the spread remains at current levels or are lower for the rest of 2020, this could significantly reduce margins in the marketing business. To a lesser extent, declines in commodity prices, including NGL and sulfur prices, would reduce the results for the gas processing business.
32 | OXY 2019 FORM 10-K |
| MANAGEMENT’S DISCUSSION AND ANALYSIS | |
SEGMENT RESULTS OF OPERATIONS AND ITEMS AFFECTING COMPARABILITY |
SEGMENT RESULTS OF OPERATIONS
Segment earnings exclude income taxes, interest income, interest expense, environmental remediation expenses, unallocated corporate expenses and discontinued operations, but include gains and losses from dispositions of segment assets and income from the segments’ equity investments. Seasonality is not a primary driver of changes in Occidental’s consolidated quarterly earnings during the year.
The following table sets forth the sales and earnings of each operating segment and corporate items for the years ended December 31:
millions, except per share amounts | 2019 | 2018 | 2017 | |||||||||
NET SALES (a) | ||||||||||||
Oil and Gas | $ | 13,423 | $ | 10,441 | $ | 7,870 | ||||||
Chemical | 4,102 | 4,657 | 4,355 | |||||||||
Marketing and Midstream | 4,132 | 3,656 | 1,157 | |||||||||
Eliminations | (1,264 | ) | (930 | ) | (874 | ) | ||||||
Total | $ | 20,393 | $ | 17,824 | $ | 12,508 | ||||||
SEGMENT RESULTS AND EARNINGS | ||||||||||||
Domestic | $ | 838 | $ | 621 | $ | (589 | ) | |||||
International | 1,683 | 1,896 | 1,767 | |||||||||
Exploration | (169 | ) | (75 | ) | (67 | ) | ||||||
Oil and Gas | 2,352 | 2,442 | 1,111 | |||||||||
Chemical | 799 | 1,159 | 822 | |||||||||
Marketing and Midstream | 241 | 2,802 | 85 | |||||||||
Total | $ | 3,392 | $ | 6,403 | $ | 2,018 | ||||||
Unallocated corporate items | ||||||||||||
Interest expense, net | (1,002 | ) | (356 | ) | (324 | ) | ||||||
Income taxes | (693 | ) | (1,477 | ) | (17 | ) | ||||||
Other | (2,204 | ) | (439 | ) | (366 | ) | ||||||
Income (loss) from continuing operations | $ | (507 | ) | $ | 4,131 | $ | 1,311 | |||||
Discontinued operations, net | (15 | ) | — | — | ||||||||
Net income (loss) | (522 | ) | 4,131 | 1,311 | ||||||||
Less: Net income attributable to noncontrolling interests | (145 | ) | — | — | ||||||||
Less: Preferred stock dividends | (318 | ) | — | — | ||||||||
Net income (loss) attributable to common stockholders | $ | (985 | ) | $ | 4,131 | $ | 1,311 | |||||
Net income (loss) attributable to common stockholders—basic | $ | (1.22 | ) | $ | 5.40 | $ | 1.71 | |||||
Net income (loss) attributable to common stockholders—diluted | $ | (1.22 | ) | $ | 5.39 | $ | 1.70 | |||||
(a) | Intersegment sales eliminate upon consolidation and are generally made at prices approximating those that the selling entity would be able to obtain in third-party transactions. |
OXY 2019 FORM 10-K | 33 |
| MANAGEMENT’S DISCUSSION AND ANALYSIS | |
ITEMS AFFECTING COMPARABILITY
OIL AND GAS SEGMENT
Results of Operations
millions | 2019 | 2018 | 2017 | |||||||||
Segment Sales | $ | 13,423 | $ | 10,441 | $ | 7,870 | ||||||
Segment Results (a) | ||||||||||||
Domestic | $ | 838 | $ | 621 | $ | (589 | ) | |||||
International | 1,683 | 1,896 | 1,767 | |||||||||
Exploration | (169 | ) | (75 | ) | (67 | ) | ||||||
Total | $ | 2,352 | $ | 2,442 | $ | 1,111 | ||||||
Items affecting comparability | ||||||||||||
Asset sale gains, net (b) | $ | 475 | $ | — | $ | 655 | ||||||
Asset impairments and related items domestic (c) | $ | (288 | ) | $ | — | $ | (397 | ) | ||||
Asset impairments and related items international (d) | $ | (39 | ) | $ | (416 | ) | $ | (4 | ) | |||
Oil collars mark-to-market gains | $ | (107 | ) | $ | — | $ | — | |||||
(a) | Results include significant items affecting comparability discussed in the footnotes below. |
(b) | The 2019 amount included gain on sale of a portion of Occidental’s joint venture with Ecopetrol and a loss on sale of real estate assets. The 2017 gain on sale of assets included the sale of South Texas and non-core acreage in the Permian Basin. |
(c) | The 2019 amount included $285 million of impairment and related charges associated with domestic undeveloped leases that were set to expire in the near term, where Occidental had no plans to pursue exploration activities. The 2017 amount included $397 million of impairment and related charges associated with non-core proved and unproved Permian acreage. |
(d) | The 2019 amount related to Occidental’s mutually agreed early termination of its Qatar ISSD contract. The 2018 amount consisted of impairment and related charges associated with ISND and ISSD. |
The following table sets forth the average realized prices for oil, NGL and natural gas from ongoing operations for each of the three years in the period ended December 31, 2019, and includes a year-over-year change calculation:
millions (except percentages) | 2019 | Year over Year Change | 2018 | Year over Year Change | 2017 | |||||||||||||
Average Realized Prices | ||||||||||||||||||
Oil Prices ($ per bbl) | ||||||||||||||||||
United States | $ | 54.31 | (4 | )% | $ | 56.30 | 18 | % | $ | 47.91 | ||||||||
Latin America | $ | 57.26 | (11 | )% | $ | 64.32 | 33 | % | $ | 48.50 | ||||||||
Middle East | $ | 61.96 | (8 | )% | $ | 67.69 | 34 | % | $ | 50.38 | ||||||||
Total worldwide | $ | 56.09 | (8 | )% | $ | 60.64 | 24 | % | $ | 48.93 | ||||||||
NGL Prices ($ per bbl) | ||||||||||||||||||
United States | $ | 16.03 | (42 | )% | $ | 27.64 | 17 | % | $ | 23.67 | ||||||||
Middle East | $ | 21.31 | (8 | )% | $ | 23.20 | 29 | % | $ | 18.05 | ||||||||
Total worldwide | $ | 17.06 | (35 | )% | $ | 26.25 | 21 | % | $ | 21.63 | ||||||||
Gas Prices ($ per Mcf) | ||||||||||||||||||
United States | $ | 1.31 | (18 | )% | $ | 1.59 | (31 | )% | $ | 2.31 | ||||||||
Latin America | $ | 7.01 | 9 | % | $ | 6.43 | 27 | % | $ | 5.08 | ||||||||
Total worldwide | $ | 1.45 | (10 | )% | $ | 1.62 | (12 | )% | $ | 1.84 | ||||||||
Domestic oil and gas results, excluding items affecting comparability, increased in 2019 compared to 2018 primarily due to higher oil, NGL and natural gas sales volumes mostly due to added production from the Acquisition and increased production in the legacy Occidental Permian Resources operations, partially offset by lower realized oil, NGL and natural gas prices. Domestic oil and gas results, excluding significant items affecting comparability, increased in 2018 compared to 2017 primarily due to an increase in average domestic realized oil prices, higher volumes and lower DD&A rates.
34 | OXY 2019 FORM 10-K |
| MANAGEMENT’S DISCUSSION AND ANALYSIS | |
International oil and gas results, excluding significant items affecting comparability, decreased in 2019 compared to 2018 primarily due to lower volumes from the expiration of the ISND contract and early termination of the ISSD contract as well as a decrease in realized oil prices in Latin America and the Middle East. International oil and gas results, excluding significant items affecting comparability, increased in 2018 compared to 2017 primarily due to an increase in realized oil prices in Latin America and the Middle East, respectively.
Production
The following table sets forth the production volumes of oil, NGL and natural gas per day from ongoing operations for each of the three years in the period ended December 31, 2019 and includes a year-over-year change calculation:
Production per Day from Ongoing Operations (MBOE/d) | 2019 | Year over Year Change | 2018 | Year over Year Change | 2017 | ||||||||||
United States | |||||||||||||||
Permian Resources | 355 | 66 | % | 214 | 52 | % | 141 | ||||||||
Permian EOR | 154 | — | % | 154 | 3 | % | 150 | ||||||||
DJ Basin | 120 | N/A | — | N/A | — | ||||||||||
Gulf of Mexico | 58 | N/A | — | N/A | — | ||||||||||
Other Domestic | 27 | N/A | 4 | N/A | 5 | ||||||||||
Total | 714 | 92 | % | 372 | 26 | % | 296 | ||||||||
Latin America | 34 | 6 | % | 32 | — | % | 32 | ||||||||
Middle East | |||||||||||||||
Al Hosn Gas | 82 | 12 | % | 73 | 3 | % | 71 | ||||||||
Dolphin | 42 | 5 | % | 40 | (5 | )% | 42 | ||||||||
Oman | 89 | 3 | % | 86 | (9 | )% | 95 | ||||||||
Qatar | 35 | (36 | )% | 55 | (5 | )% | 58 | ||||||||
Total | 248 | (2 | )% | 254 | (5 | )% | 266 | ||||||||
Total Production from Ongoing Operations | 996 | 51 | % | 658 | 11 | % | 594 | ||||||||
Sold domestic operations | — | N/A | — | N/A | 8 | ||||||||||
Discontinued operations - Africa Assets | 33 | N/A | — | N/A | — | ||||||||||
Total Production (MBOE/d) (a) | 1,029 | 56 | % | 658 | 9 | % | 602 | ||||||||
(a) | Natural gas volumes have been converted to BOE based on energy content of six Mcf of gas to one barrel of oil. Barrels of oil equivalence does not necessarily result in price equivalence. Please refer to “Supplemental Oil and Gas Information (unaudited)” for additional information on oil and gas production and sales. |
Average daily production volumes from ongoing operations increased in 2019 compared to 2018 primarily due to 264 MBOE/d in acquired production from the Acquisition, including 120 MBOE/d in DJ Basin, 58 MBOE/d in the Gulf of Mexico and 63 MBOE/d in the Delaware Basin, as well as an increase of 78 MBOE/d in the legacy Occidental Permian Resources operations as a result of increased drilling and well productivity.
Average daily production volumes from ongoing operations increased in 2018 compared to 2017 primarily due to higher Permian Resources production which increased by 52% from the prior year, due to developmental drilling activity and improved well performance.
Lease operating expense
The following table sets forth the average lease operating expense per BOE from ongoing operations for each of the three years in the period ended December 31, 2019:
2019 | 2018 | 2017 | ||||
Average lease operating expense per BOE | $9.19 | $11.52 | $11.20 | |||
Average lease operating expense per BOE, decreased in 2019 compared to 2018 primarily due to operational efficiencies related to maintenance and support cost. Combined 2019 Permian Resources lease operating expense per BOE, was $6.80 which represented a decrease of 6% from the prior year.
Average lease operating costs per BOE, excluding taxes other than on income, increased in 2018 compared to 2017 primarily due to increased surface operations and maintenance costs. Permian Resources lease operating costs per BOE for 2018 decreased by 10% from the prior year, and the fourth quarter of 2018 costs were below $7.00 per BOE, due to continued improved operational efficiencies.
OXY 2019 FORM 10-K | 35 |
| MANAGEMENT’S DISCUSSION AND ANALYSIS | |
CHEMICAL SEGMENT
millions | 2019 | 2018 | 2017 | |||||||||
Segment Sales | $ | 4,102 | $ | 4,657 | $ | 4,355 | ||||||
Segment Results | $ | 799 | $ | 1,159 | $ | 822 | ||||||
Chemical segment results decreased in 2019 compared to 2018 due to lower realized caustic soda prices and lower domestic demand across many product lines partially offset by favorable feedstock costs. The 2019 earnings also reflected fees received under a pipeline easement agreement that was executed during the first quarter of 2019.
Chemical segment results increased in 2018 compared to 2017 due to significant improvements in realized caustic soda pricing, strong margins and demand across many product lines and lower ethylene costs, slightly offset by decreased caustic soda export volumes. The 2018 earnings also benefited from the full-year equity contributions from the joint venture ethylene cracker in Ingleside, Texas, and additional earning contributions from the Geismar, Louisiana plant expansion to produce 4CPe.
MARKETING AND MIDSTREAM SEGMENT
millions | 2019 | 2018 | 2017 | |||||||||
Segment Sales | $ | 4,132 | $ | 3,656 | $ | 1,157 | ||||||
Segment Results (a) | $ | 241 | $ | 2,802 | $ | 85 | ||||||
Items affecting comparability | ||||||||||||
Asset and equity investment sale gains (b) | $ | 114 | $ | 907 | $ | 94 | ||||||
Asset impairments and other charges(c) | $ | (1,002 | ) | $ | — | $ | (120 | ) | ||||
Interest rate swaps MTM, net(d) | $ | 30 | $ | — | $ | — | ||||||
(a) | Results include items affecting comparability listed below, as well as WES segment results from August 8, 2019 to December 31, 2019 of $541 million. |
(b) | The 2019 amount represented a $114 million gain on the sale of an equity investment in Plains All American Pipeline, L.P. and Plains GP Holdings, L.P. (together, Plains). The 2018 amount represented a gain on sale of non-core domestic midstream assets. The 2017 amount represented a non-cash fair value gain related to Plains. |
(c) | The 2019 amount included a $1 billion charge as a result of recording Occidental’s investment in WES at fair value as of December 31, 2019 upon the loss of control. The 2017 amount represented impairments and related charges related to idled midstream facilities. |
(d) | The 2019 amount represented a $30 million mark-to-market gain on an interest rate swap for WES. |
Marketing and midstream segment results, excluding items affecting comparability, decreased in 2019 compared to 2018, primarily due to lower marketing margins from the decrease in the Midland-to-Gulf Coast spreads by approximately $4.00 per barrel and lower pipeline income due to the 2018 sales of the Centurion pipeline and the Ingleside Crude Oil Terminal.
Marketing and midstream segment results, excluding items affecting comparability, increased in 2018 compared to 2017 primarily due to higher marketing margins from improved Midland-to-Gulf Coast spreads and higher gas plant income due to higher domestic NGL prices and higher sulfur prices in connection with Al Hosn Gas sulfur sales.
CORPORATE
Significant corporate items during 2019 include the following:
millions | 2019 | 2018 | 2017 | |||||||||
Items Affecting Comparability | ||||||||||||
Anadarko acquisition-related costs | $ | (1,647 | ) | $ | — | $ | — | |||||
Bridge loan financing fees | $ | (122 | ) | $ | — | $ | — | |||||
Other acquisition-related pension and other termination benefits | $ | 37 | $ | — | $ | — | ||||||
Asset impairments and other charges | $ | (22 | ) | $ | — | $ | — | |||||
Gains on warrants and interest rate swaps, net | $ | 203 | $ | — | $ | — | ||||||
36 | OXY 2019 FORM 10-K |
| MANAGEMENT’S DISCUSSION AND ANALYSIS | |
INCOME TAXES |
Deferred tax liabilities, net of deferred tax assets of $3.7 billion, were $9.7 billion at December 31, 2019. The deferred tax assets, net of allowances, are expected to be realized through future operating income and reversal of temporary differences.
WORLDWIDE EFFECTIVE TAX RATE
The following table sets forth the calculation of the worldwide effective tax rate for income from continuing operations:
millions | 2019 | 2018 | 2017 | |||||||||
SEGMENT RESULTS | ||||||||||||
Oil and Gas | $ | 2,352 | $ | 2,442 | $ | 1,111 | ||||||
Chemical | 799 | 1,159 | 822 | |||||||||
Marketing and Midstream | 241 | 2,802 | 85 | |||||||||
Unallocated corporate items | (3,206 | ) | (795 | ) | (690 | ) | ||||||
Income from continuing operations before taxes | $ | 186 | $ | 5,608 | $ | 1,328 | ||||||
Income tax expense (benefit) | ||||||||||||
Federal and state | (34 | ) | 463 | (903 | ) | |||||||
Foreign | 727 | 1,014 | 920 | |||||||||
Total income tax expense | $ | 693 | $ | 1,477 | $ | 17 | ||||||
Income (loss) from continuing operations | $ | (507 | ) | $ | 4,131 | $ | 1,311 | |||||
Worldwide effective tax rate | 373 | % | 26 | % | 1 | % | ||||||
In 2019, Occidental’s worldwide effective tax rate was 373%, which was largely a result of Acquisition-related costs and charges associated with the loss of control of WES for which Occidental received no tax benefit. Excluding the impact of items affecting comparability, Occidental’s worldwide effective tax rate for 2019 would be 36%.
The increase in worldwide effective tax rate from 2017 to 2018 was primarily due to the 2017 remeasurement of net deferred tax liabilities to the new federal corporate income tax rate.
CONSOLIDATED RESULTS OF OPERATIONS |
REVENUE AND OTHER INCOME ITEMS
millions | 2019 | 2018 | 2017 | |||||||||
Net sales | $ | 20,393 | $ | 17,824 | $ | 12,508 | ||||||
Interest, dividends and other income | $ | 217 | $ | 136 | $ | 99 | ||||||
Gain on sale of equity investments and other assets, net | $ | 622 | $ | 974 | $ | 667 | ||||||
Price and volume changes generally represent the majority of the change in the oil and gas and chemical segments sales. Marketing and midstream sales are mainly impacted by the change in the Midland-to-Gulf Coast spread for the marketing business and, to a lesser extent, the change in NGL and sulfur prices for the gas processing business.
The increase in net sales in 2019 compared to 2018 was primarily due to higher domestic volumes related to the Acquisition, which added approximately $3.5 billion in net sales as well as increased production activity in Occidental’s Permian Resources operations, partially offset by oil, NGL and natural gas prices in the oil and gas segment and lower realized caustic soda prices in the chemical segment.
The increase in net sales in 2018 compared to 2017 was mainly due to higher oil prices and higher domestic oil volumes, as well as higher marketing margins in the marketing and midstream segment due to improved Midland-to-Gulf Coast spreads and higher realized caustic soda prices in the chemical segment. Average worldwide realized oil prices rose approximately 24% from 2017 to 2018.
The 2019 gain on sale included a net gain of $475 million related to Occidental’s Midland Basin joint venture with Ecopetrol and sale of real estate assets and $114 million from the sale of Occidental’s remaining equity investment in Plains.
The 2018 gain on sale included the sale of non-core domestic midstream assets including the Centurion common carrier pipeline and storage system, Southeast New Mexico oil gathering system, and Ingleside Crude Terminal of $907 million.
The 2017 gain on sale included the sale of South Texas and non-core proved and unproved Permian acreage.
OXY 2019 FORM 10-K | 37 |
| MANAGEMENT’S DISCUSSION AND ANALYSIS | |
EXPENSE ITEMS
millions | 2019 | 2018 | 2017 | |||||||||
Oil and gas operating expense | $ | 3,246 | $ | 2,761 | $ | 2,427 | ||||||
Transportation expense | $ | 621 | $ | 152 | $ | 175 | ||||||
Chemical and midstream cost of sales | $ | 2,791 | $ | 2,833 | $ | 2,938 | ||||||
Purchased commodities | $ | 1,679 | $ | 822 | $ | 54 | ||||||
Selling, general and administrative | $ | 882 | $ | 585 | $ | 546 | ||||||
Other operating and non-operating expense | $ | 1,425 | $ | 1,028 | $ | 878 | ||||||
Depreciation, depletion and amortization | $ | 5,981 | $ | 3,977 | $ | 4,002 | ||||||
Asset impairments and other charges | $ | 1,361 | $ | 561 | $ | 545 | ||||||
Taxes other than on income | $ | 707 | $ | 439 | $ | 311 | ||||||
Anadarko acquisition-related costs | $ | 1,647 | $ | — | $ | — | ||||||
Exploration expense | $ | 246 | $ | 110 | $ | 82 | ||||||
Interest and debt expense, net | $ | 1,066 | $ | 389 | $ | 345 | ||||||
OIL AND GAS OPERATING EXPENSE
Oil and gas operating expense increased in 2019 from the prior year, primarily due to higher oil and gas production costs for surface operations and maintenance due to increased activity mainly related to acquired operations as part of the Acquisition.
Oil and gas operating expense increased in 2018 from the prior year, primarily due to higher oil and gas production costs for surface operations and downhole maintenance due to increased activity in the Permian Basin as well as an increase in purchased CO2 injectant.
TRANSPORTATION EXPENSE
Transportation expense increased in 2019 from the prior year, primarily due to increased oil sales volumes, mainly driven by added production and the fulfillment of additional capacity commitments related to the Acquisition.
Transportation expense decreased in 2018 from the prior year due to the 2018 sale of the Centurion Pipeline common carrier oil pipeline and storage system and the Ingleside Crude Terminal.
CHEMICAL AND MIDSTREAM COST OF SALES
Chemical and midstream cost of sales decreased slightly in 2019 from the prior year, primarily due to favorable raw material costs in the chemical segment, partially offset by an increase in midstream operation costs due to WES.
Chemical and midstream cost of sales decreased slightly in 2018 from the prior year, primarily due to lower gas plant and maintenance expenses in the midstream segment.
PURCHASED COMMODITIES
Purchased commodities included purchased oil volumes for which Occidental does not act as agent. Several of these oil purchase agreements commenced in mid-year 2018. The increase in 2019 from the prior year is due to a full year of purchases under these contracts, which are used to ensure the full utilization of committed transportation capacity in the marketing business. Similarly, the purchased oil volumes for contracts effective in late 2017 but in effect for the full year of 2018 caused the increase between those years.
SELLING, GENERAL AND ADMINISTRATIVE
Selling, general and administrative expense increased in 2019 from the prior year, primarily due to higher employee costs related to the Acquisition.
Selling, general and administrative expense increased in 2018 from the prior year due to higher compensation costs.
OTHER OPERATING AND NON-OPERATING EXPENSE
Other operating and non-operating expense increased in 2019 from the prior year, primarily due to higher overhead oil and gas engineering costs related to the Acquisition.
Other operating and non-operating expense increased in 2018 from the prior year, primarily due to higher environmental costs.
TAXES OTHER THAN ON INCOME
Taxes other than on income in 2019 increased from the prior year, primarily due to production taxes on higher oil, NGL and natural gas volumes as well as additional ad valorem tax related to the Acquisition.
Taxes other than on income increased in 2018 from the prior year, primarily due to higher production taxes, which are directly tied to higher commodity prices.
38 | OXY 2019 FORM 10-K |
| MANAGEMENT’S DISCUSSION AND ANALYSIS | |
DEPRECIATION, DEPLETION AND AMORTIZATION
DD&A expense increased in 2019 from prior year, primarily due to increased production related to the Acquisition.
DD&A expense decreased slightly in 2018 from the prior year due to lower domestic DD&A rates due to higher reserves partially offset by higher production volumes and higher DD&A rates in the Middle East.
ASSET IMPAIRMENTS AND OTHER CHARGES
Asset impairments and other charges are primarily related to a $1 billion loss on the December 31, 2019 loss of control of WES. In addition, Occidental incurred impairment charges of approximately $285 million related to domestic undeveloped mineral leases that were set to expire in the near term, where Occidental had no plans to pursue exploration activities, and $39 million related to early termination of its Qatar ISSD contract.
In 2018, Occidental incurred impairment and other charges of approximately $416 million on proved oil and gas properties and inventory in Qatar due to the decline in oil prices. Also in 2018, the marketing and midstream segment incurred approximately $100 million of charges primarily for lower of cost or market adjustments on its crude inventory and line fill.
In 2017, Occidental incurred impairment and other charges of $545 million, of which $397 million related to proved and unproved non-core Permian acreage and $120 million for idled marketing and midstream assets.
ANADARKO ACQUISITION-RELATED COSTS
In 2019, Occidental had the following charges related to the Acquisition: employee severance and related cost of $1 billion; licensing fees for critical seismic data of $401 million; and $213 million for bank, legal and consulting fees. Estimated acquisition-related charges of approximately $1.3 billion that were mostly accrued in 2019 are expected to be mostly paid in 2020.
INTEREST AND DEBT EXPENSE, NET
Interest and debt expense, net, increased in 2019 from the prior year due to an increase in debt issued to partially fund the Acquisition, as well as the debt assumed through the Acquisition.
Interest and debt expense, net, remained relatively consistent between 2018 and 2017 experiencing a small increase in interest paid on debt due to the addition of $1 billion in senior notes.
OTHER ITEMS
Income/(expense) millions | 2019 | 2018 | 2017 | |||||||||
Income tax expense | $ | (693 | ) | $ | (1,477 | ) | $ | (17 | ) | |||
Income from equity investments | $ | 373 | $ | 331 | $ | 357 | ||||||
Discontinued operations, net | $ | (15 | ) | $ | — | $ | — | |||||
INCOME TAX EXPENSE
Income tax expense decreased in 2019 from the prior year, primarily due to lower pre-tax income, partially offset by charges related to the loss of control of WES and acquisition-related costs for which Occidental did not receive a tax benefit.
Income tax expense increased in 2018 from the prior year, primarily due to Tax Reform in 2017 and higher pre-tax income in 2018. Occidental recorded an income tax benefit in 2017 due to the revaluation of deferred taxes as a result of the corporate tax rate reduction enacted as part of Tax Reform, partially offset by higher pre-tax operating income as a result of a recovery in commodity prices.
OXY 2019 FORM 10-K | 39 |
| MANAGEMENT’S DISCUSSION AND ANALYSIS | |
LIQUIDITY AND CAPITAL RESOURCES |
At December 31, 2019, Occidental had approximately $3.0 billion in cash and cash equivalents. A substantial majority of this cash is held and available for use in the United States. At December 31, 2019, Occidental had $0.5 billion in restricted cash and restricted cash equivalents, which was primarily associated with a benefits trust for former Anadarko employees that was funded as part of the Acquisition. Restricted cash within the benefits trust will be made available to Occidental as benefits are paid to former Anadarko employees.
DEBT ACTIVITY
In August 2019, Occidental issued $13.0 billion of new senior unsecured notes, consisting of both floating and fixed rate debt. Occidental also borrowed under the Term Loans, which consisted of: (1) a 364-day senior unsecured variable-rate term loan tranche of $4.4 billion and (2) a two-year senior unsecured variable-rate term loan tranche of $4.4 billion. In total, the $21.8 billion in debt issued was used to finance part of the cash portion of the purchase price for the Acquisition. Through the Acquisition, Occidental assumed Anadarko debt with an outstanding principal balance of $11.9 billion.
In 2019, Occidental paid approximately $7.0 billion of long-term debt including a majority of the Term Loans using proceeds from assets sales and available cash.
On June 3, 2019, Occidental entered into an amendment to its existing $3.0 billion revolving credit facility (Occidental RCF) pursuant to which, among other things, the commitments under the Occidental RCF were increased to $5.0 billion at the closing of the Acquisition. Borrowings under the Occidental RCF bear interest at various benchmark rates, including London Inter-Bank Offered Rate (LIBOR), plus a margin based on Occidental’s senior debt-ratings. The facility has similar terms to other debt agreements and does not contain material adverse change clauses or debt ratings triggers that could restrict Occidental’s ability to borrow, or that would permit lenders to terminate their commitments or accelerate debt repayment. The facility provides for the termination of loan commitments and requires immediate repayment of any outstanding amounts if certain events of default occur. Occidental has not drawn down any amounts under the Occidental RCF.
As of December 31, 2019, under the most restrictive covenants of its financing agreements, Occidental had substantial capacity for additional unsecured borrowings, the payment of cash dividends and other distributions on, or acquisitions of, Occidental stock.
With a continued focus on capital and operational efficiencies, Occidental expects to fund its liquidity needs, including future dividend payments, through cash on hand, cash generated from operations, monetization of non-core assets or investments and, if necessary, proceeds from other forms of capital issuance.
CASH FLOW ANALYSIS
CASH PROVIDED BY OPERATING ACTIVITIES
millions | 2019 | 2018 | 2017 | |||||||||
Operating cash flow from continuing operations | $ | 7,203 | $ | 7,669 | $ | 4,861 | ||||||
Operating cash flow from discontinued operations, net of taxes | 172 | — | — | |||||||||
Net cash provided by operating activities | $ | 7,375 | $ | 7,669 | $ | 4,861 | ||||||
Cash provided by operating activities decreased $294 million in 2019 compared to 2018, reflecting Acquisition related costs, higher interest expense, and slightly lower oil prices, which were partially offset by a 92% increase in domestic production volumes.
Cash provided by operating activities increased $2.8 billion in 2018 compared to 2017, reflecting higher realized worldwide oil and NGL prices, which increased by 24% and 21%, respectively, as well as a 25% increase in domestic oil volumes. Operating cash flows in 2018 also benefited from higher marketing margins in the marketing and midstream segment due to improved Midland-to-Gulf Coast spreads and higher chemical margins from significant improvements in caustic soda prices.
40 | OXY 2019 FORM 10-K |
| MANAGEMENT’S DISCUSSION AND ANALYSIS | |
CASH USED BY INVESTING ACTIVITIES
millions | 2019 | 2018 | 2017 | |||||||||
Capital expenditures | ||||||||||||
Oil and Gas | $ | (5,500 | ) | $ | (4,413 | ) | $ | (2,945 | ) | |||
Chemical | (267 | ) | (271 | ) | (308 | ) | ||||||
Marketing and Midstream(a) | (461 | ) | (216 | ) | (284 | ) | ||||||
Corporate | (127 | ) | (75 | ) | (62 | ) | ||||||
Total | $ | (6,355 | ) | $ | (4,975 | ) | $ | (3,599 | ) | |||
Purchase of businesses and assets, net | (28,088 | ) | (928 | ) | (1,064 | ) | ||||||
Proceeds from sale of assets and equity investments, net | 6,143 | 2,824 | 1,403 | |||||||||
Other investing activities, net | (573 | ) | (127 | ) | 181 | |||||||
Investing cash flows from continuing operations | $ | (28,873 | ) | $ | (3,206 | ) | $ | (3,079 | ) | |||
Investing cash flows from discontinued operations | (154 | ) | — | — | ||||||||
Net cash used by investing activities | $ | (29,027 | ) | $ | (3,206 | ) | $ | (3,079 | ) | |||
(a) Included $365 million related to WES in 2019.
The increase in cash flows used by investing activities in 2019 compared to 2018 primarily reflected the cash portion of the Acquisition consideration, partially offset by the cash acquired. In 2019, proceeds from the sale of assets and equity investments, net, included the sale of Mozambique LNG assets, the Ecopetrol joint venture, the equity investment in Plains and real estate assets. Occidental’s capital expenditures increased by $1.4 billion in 2019, compared to 2018. The increase was primarily related to the Permian Basin due to its high returns of legacy operations coupled with the addition of assets through the Acquisition in the Permian Basin, DJ Basin and Gulf of Mexico. Occidental’s 2020 capital spending is expected to be $5.3 billion.
The increase in cash flows used by investing activities in 2018 compared to 2017 was a result of additional capital spending, primarily in the Permian Basin due to its high returns. In 2018, proceeds from sale of assets and equity investments, net related to the sale of non-core domestic midstream assets, partially offset by purchases of businesses and assets, net related to the acquisition of a previously leased power and steam cogeneration plant.
CASH PROVIDED (USED) BY FINANCING ACTIVITIES
millions | 2019 | 2018 | 2017 | |||||||||
Net cash provided (used) by financing activities | $ | 22,193 | $ | (3,102 | ) | $ | (2,343 | ) | ||||
Cash provided by financing activities in 2019 increased $25.3 billion, compared to 2018, primarily due to net proceeds from long-term debt of $21.6 billion and the issuance of $10.0 billion of preferred shares with a warrant used to fund the Acquisition. These proceeds were partially offset by debt payments of $7.0 billion and dividends on common stock of $2.6 billion.
OXY 2019 FORM 10-K | 41 |
| MANAGEMENT’S DISCUSSION AND ANALYSIS | |
OFF-BALANCE SHEET ARRANGEMENTS |
GUARANTEES
Occidental has guaranteed its portion of the debt of Dolphin Energy, an equity method investment, and has entered into various other guarantees, including performance bonds, letters of credit, indemnities and commitments provided by Occidental to third parties, mainly to provide assurance that OPC or its subsidiaries and affiliates will meet their various obligations. See “Oil and Gas Segment — Business Review — Qatar” and “Segment Results of Operations” for further information about Dolphin. As of December 31, 2019, and 2018, Occidental had provided limited recourse guarantees on approximately $242 million and $244 million, respectively, of Dolphin Energy’s debt, which are limited to certain political and other events.
COMMITMENTS AND OBLIGATIONS |
DELIVERY COMMITMENTS
Occidental has made commitments to certain refineries and other buyers to deliver oil, natural gas and NGL. The total amount contracted to be delivered in the United States is approximately 158 million barrels of oil through 2025, 1,346 Bcf of gas through 2035 and 660 million barrels of NGL through 2035. The price for these deliveries is set at the time of delivery of the product. Occidental has significantly more production capacity than the amounts committed and has the ability to secure additional volumes in case of a shortfall.
CONTRACTUAL OBLIGATIONS
The following table summarizes and cross-references Occidental’s contractual obligations, and indicates on- and off-balance sheet obligations as of December 31, 2019:
millions | Payments Due by Year | ||||||||||||||||||
Total | 2020 | 2021 and 2022 | 2023 and 2024 | 2025 and thereafter | |||||||||||||||
On-Balance Sheet | |||||||||||||||||||
Long-term debt (Note 7) (a) | $ | 37,401 | $ | — | $ | 11,096 | $ | 5,111 | $ | 21,194 | |||||||||
Leases (Note 8) (b) | 2,018 | 608 | 630 | 251 | 529 | ||||||||||||||
Asset retirement obligations (Note 1) | 4,633 | 247 | 271 | 799 | 3,316 | ||||||||||||||
Other long-term liabilities (c) | 3,765 | 1,054 | 513 | 490 | 1,708 | ||||||||||||||
Off-Balance Sheet | |||||||||||||||||||
Purchase obligations (d) | 20,712 | 3,252 | 5,704 | 4,660 | 7,096 | ||||||||||||||
Total | $ | 68,529 | $ | 5,161 | $ | 18,214 | $ | 11,311 | $ | 33,843 | |||||||||
(a) | Excluded unamortized debt discount and interest on the debt. As of December 31, 2019, interest on long-term debt totaling $18.1 billion is payable in the following years: 2020 - $1.5 billion, 2021 and 2022 - $2.6 billion, 2023 and 2024 - $2.1 billion, 2025 and thereafter - $11.9 billion. |
(b) | Occidental is the lessee under various agreements for real estate, equipment, plants and facilities. See Note 2 - Accounting and Disclosure Changes in the Notes to Consolidated Financial Statements regarding the impact of rules effective January 1, 2019 which require Occidental to recognize most leases, including operating leases, on the balance sheet. |
(c) | Included obligations under postretirement benefit and deferred compensation plans, accrued transportation commitments, severance and change of control obligations related to the Acquisition and other accrued liabilities. |
(d) | Amounts included payments which will become due under long-term agreements to purchase goods and services used in the normal course of business to secure terminal, pipeline and processing capacity, CO2, electrical power, steam and certain chemical raw materials. In 2019, Occidental added $7.7 billion of additional long-term commitments as a result of the loss of control of WES. Amounts exclude certain product purchase obligations related to marketing activities for which there are no minimum purchase requirements or the amounts are not fixed or determinable. Long-term purchase contracts are discounted at a 3.89% discount rate. |
42 | OXY 2019 FORM 10-K |
| MANAGEMENT’S DISCUSSION AND ANALYSIS | |
LAWSUITS, CLAIMS, COMMITMENTS AND CONTINGENCIES |
LEGAL MATTERS
Occidental or certain of its subsidiaries are involved, in the normal course of business, in lawsuits, claims and other legal proceedings that seek, among other things, compensation for alleged personal injury, breach of contract, property damage or other losses, punitive damages, civil penalties, or injunctive or declaratory relief. Occidental or certain of its subsidiaries also are involved in proceedings under Comprehensive Environmental Response, Compensation and Liability Act (CERCLA) and similar federal, state, local and foreign environmental laws. These environmental proceedings seek funding or performance of remediation and, in some cases, compensation for alleged property damage, punitive damages, civil penalties and injunctive relief. Usually Occidental or such subsidiaries are among many companies in these environmental proceedings and have to date been successful in sharing response costs with other financially sound companies. Further, some lawsuits, claims and legal proceedings involve acquired or disposed assets with respect to which a third party or Occidental retains liability or indemnifies the other party for conditions that existed prior to the transaction.
In accordance with applicable accounting guidance, Occidental accrues reserves for outstanding lawsuits, claims and proceedings when it is probable that a liability has been incurred and the liability can be reasonably estimated. Reserves for matters, other than for environmental remediation, that satisfy this criteria as of December 31, 2019, and December 31, 2018, were not material to Occidental’s Consolidated Balance Sheets.
On May 30, 2019, a complaint was filed in the Court of Chancery of the State of Delaware by purported Occidental stockholders High River Limited Partnership, Icahn Partners Master Fund LP and Icahn Partners LP (the “Icahn Complainants”), captioned High River Ltd. P’ship v. Occidental Petroleum Corp., C.A. No. 2019-0403-JRS, seeking inspection of Occidental’s books and records pursuant to Section 220 of the Delaware General Corporation Law. In the complaint, the Icahn Complainants noted that they had accumulated over $1.6 billion of Occidental Common Stock. On June 14, 2019, Occidental filed an answer to the complaint in the Court of Chancery of the State of Delaware. A trial was held on September 20, 2019, and the court dismissed the Icahn Complaint. The Icahn Complainants appealed and oral arguments occurred in February 2020.
In 2016, Occidental received payments from the Republic of Ecuador of approximately $1.0 billion pursuant to a November 2015 arbitration award for Ecuador’s 2006 expropriation of Occidental’s Participation Contract for Block 15. The awarded amount represented a recovery of 60% of the value of Block 15. In 2017, Andes Petroleum Ecuador Ltd. (Andes) filed a demand for arbitration, claiming it is entitled to a 40% share of the judgment amount obtained by Occidental. Occidental contends that Andes is not entitled to any of the amounts paid under the 2015 arbitration award because Occidental’s recovery was limited to Occidental’s own 60% economic interest in the block. The merits hearing is scheduled for May 2020. Occidental intends to vigorously defend against this claim in arbitration.
The ultimate outcome and impact of outstanding lawsuits, claims and proceedings on Occidental cannot be predicted. Management believes that the resolution of these matters will not, individually or in the aggregate, have a material adverse effect on Occidental’s Consolidated Balance Sheets. If unfavorable outcomes of these matters were to occur, future results of operations or cash flows for any particular quarterly or annual period could be materially adversely affected. Occidental’s estimates are based on information known about the legal matters and its experience in contesting, litigating and settling similar matters. Occidental reassesses the probability and estimability of contingent losses as new information becomes available.
TAX MATTERS
During the course of its operations, Occidental is subject to audit by tax authorities for varying periods in various federal, state, local and foreign tax jurisdictions. Taxable years through 2016 for U.S. federal income tax purposes have been audited by the U.S. Internal Revenue Service (IRS) pursuant to its Compliance Assurance Program and subsequent taxable years are currently under review. Taxable years through 2009 have been audited for state income tax purposes. While a single foreign tax jurisdiction is open for 2002, all other significant audit matters in foreign jurisdictions have been resolved through 2010. During the course of tax audits, disputes have arisen and other disputes may arise as to facts and matters of law. Occidental believes that the resolution of outstanding tax matters would not have a material adverse effect on its consolidated financial position or results of operations.
For Anadarko, its taxable years through 2016 for U.S. federal and state income tax purposes have been audited by the IRS and respective state taxing authorities. There are outstanding significant audit matters in one foreign jurisdiction. During the course of the tax audit, disputes have arisen and other disputes may arise as to facts and matters of law. Other than the matter discussed below, Occidental believes that the resolution of these outstanding tax matters would not have a material adverse effect on its consolidated financial position or results of operations.
Anadarko received an $881 million tentative refund in 2016 related to its $5.2 billion Tronox settlement payment in 2015. In September 2018, Anadarko received a statutory notice of deficiency from the IRS disallowing the net operating loss carryback and rejecting Anadarko’s refund claim. As a result, Anadarko filed a petition with the U.S. Tax Court to dispute the disallowances in November 2018. The case is currently in the IRS appeals process. If the matter is not resolved in the IRS appeals process, Occidental expects to continue pursuing resolution in the U.S. Tax Court.
While Occidental believes it is entitled to this refund, in accordance with ASC 740’s guidance on the accounting for uncertain tax positions, as of December 31, 2019, Occidental has recorded no tax benefit on the tentative cash tax refund of
OXY 2019 FORM 10-K | 43 |
| MANAGEMENT’S DISCUSSION AND ANALYSIS | |
$881 million. As a result, should Occidental not ultimately prevail on the issue, there would be no additional tax expense recorded for financial statement purposes other than future interest. However, in that event Occidental would be required to repay approximately $925 million ($898 million federal and $27 million in state taxes) plus accrued interest of approximately $189 million. As a result, a liability for this amount has been recorded in deferred credits and other liabilities - other at December 31, 2019.
INDEMNITIES TO THIRD PARTIES
Occidental, its subsidiaries, or both, have indemnified various parties against specified liabilities those parties might incur in the future in connection with purchases and other transactions that they have entered into with Occidental. These indemnities usually are contingent upon the other party incurring liabilities that reach specified thresholds. As of December 31, 2019, Occidental is not aware of circumstances that it believes would reasonably be expected to lead to indemnity claims that would result in payments materially in excess of reserves.
ENVIRONMENTAL LIABILITIES AND EXPENDITURES |
Occidental’s operations are subject to stringent federal, state, local and international laws and regulations related to improving or maintaining environmental quality. The laws that require or address environmental remediation, including Comprehensive Environmental Response, Compensation, and Liability Act (CERCLA) and similar federal, state, local and international laws, may apply retroactively and regardless of fault, the legality of the original activities or the current ownership or control of sites. OPC or certain of its subsidiaries participate in or actively monitor a range of remedial activities and government or private proceedings under these laws with respect to alleged past practices at operating, closed and third-party sites. Remedial activities may include one or more of the following: investigation involving sampling, modeling, risk assessment or monitoring; cleanup measures including removal, treatment or disposal; or operation and maintenance of remedial systems. The environmental proceedings seek funding or performance of remediation and, in some cases, compensation for alleged property damage, punitive damages, civil penalties, injunctive relief and government oversight costs.
ENVIRONMENTAL REMEDIATION
As of December 31, 2019, Occidental participated in or monitored remedial activities or proceedings at 177 sites, which included 36 sites assumed through the Acquisition. The following table presents Occidental’s current and non-current environmental remediation liabilities as of December 31, 2019 and 2018, the current portion of which is included in accrued liabilities ($162 million in 2019 and $120 million in 2018) and the remainder in deferred credits and other liabilities - environmental remediation liabilities ($1.04 billion in 2019 and $762 million in 2018). Occidental continues to evaluate the remediation obligations assumed through the Acquisition.
Occidental’s environmental remediation sites are grouped into four categories: National Priorities List (NPL) sites listed or proposed for listing by the EPA on the CERCLA NPL and three categories of non-NPL sites — third-party sites, Occidental-operated sites and closed or non-operated Occidental sites.
2019 | 2018 | |||||||||||||
millions, except number of sites | Number of Sites | Remediation Balance | Number of Sites | Remediation Balance | ||||||||||
NPL sites | 36 | $ | 463 | 34 | $ | 458 | ||||||||
Third-party sites | 74 | 311 | 68 | 168 | ||||||||||
Occidental-operated sites | 17 | 154 | 14 | 115 | ||||||||||
Closed or non-operated Occidental sites | 50 | 269 | 29 | 141 | ||||||||||
Total | 177 | $ | 1,197 | 145 | $ | 882 | ||||||||
As of December 31, 2019, Occidental’s environmental remediation liabilities exceeded $10 million each at 20 of the 177 sites described above, and 101 of the sites had liabilities from $0 to $1 million each. As of December 31, 2019, three sites — the Diamond Alkali Superfund Site and a former chemical plant in Ohio (both of which are indemnified by Maxus Energy Corporation, as discussed further below) and a landfill in Western New York — accounted for 94 percent of its liabilities associated with NPL sites. Seventeen of the 36 NPL sites are indemnified by Maxus.
Six of the 74 third-party sites — a Maxus-indemnified chrome site in New Jersey, a former copper mining and smelting operation in Tennessee, a former oil field, a landfill and a chemical plant in California, and an active refinery in Louisiana where Occidental reimburses the current owner for certain remediation activities — accounted for 75 percent of Occidental’s liabilities associated with these sites. Nine of the 74 third-party sites are indemnified by Maxus.
Five sites — oil and gas operations in Colorado and chemical plants in Kansas, Louisiana, New York and Texas — accounted for 67 percent of the liabilities associated with the Occidental-operated sites.
44 | OXY 2019 FORM 10-K |
| MANAGEMENT’S DISCUSSION AND ANALYSIS | |
Six other sites — a landfill in Western New York, a former refinery in Oklahoma, former chemical plants in California, Tennessee and Washington, and a closed coal mine in Pennsylvania — accounted for 64 percent of the liabilities associated with closed or non-operated Occidental sites.
Environmental remediation liabilities vary over time depending on factors such as acquisitions or dispositions, identification of additional sites and remedy selection and implementation. Based on current estimates, Occidental expects to expend funds corresponding to approximately 40 percent of the year end remediation balance over the next three to four years with the remainder over the subsequent 10 or more years. Occidental believes its range of reasonably possible additional losses beyond those amounts currently recorded for environmental remediation for all of its environmental sites could be up to $1.1 billion.
MAXUS ENVIRONMENTAL SITES
When Occidental acquired Diamond Shamrock Chemicals Company (DSCC) in 1986, Maxus, a subsidiary of YPF S.A. (YPF), agreed to indemnify Occidental for a number of environmental sites, including the Diamond Alkali Superfund Site (Site) along a portion of the Passaic River. On June 17, 2016, Maxus and several affiliated companies filed for Chapter 11 bankruptcy in Federal District Court in the State of Delaware. Prior to filing for bankruptcy, Maxus defended and indemnified Occidental in connection with clean-up and other costs associated with the sites subject to the indemnity, including the Site.
In March 2016, the EPA issued a Record of Decision (ROD) specifying remedial actions required for the lower 8.3 miles of the Lower Passaic River. The ROD does not address any potential remedial action for the upper nine miles of the Lower Passaic River or Newark Bay. During the third quarter of 2016, and following Maxus’s bankruptcy filing, Occidental and the EPA entered into an Administrative Order on Consent (AOC) to complete the design of the proposed clean-up plan outlined in the ROD at an estimated cost of $165 million. The EPA announced that it will pursue similar agreements with other potentially responsible parties.
Occidental has accrued a remediation liability relating to its estimated allocable share of the costs to perform the design and the remediation called for in the AOC and the ROD, as well as for certain other Maxus-indemnified sites. Occidental’s accrued estimated environmental remediation liability does not consider any recoveries for indemnified costs. Occidental’s ultimate share of the estimated costs may be higher or lower than its accrued remediation liability, and is subject to final design plans and the resolution with other potentially responsible parties. Occidental continues to evaluate the costs to be incurred to comply with the AOC, the ROD and to perform remediation at other Maxus-indemnified sites in light of the Maxus bankruptcy and the share of ultimate liability of other potentially responsible parties. In June 2018, Occidental filed a complaint under CERCLA in Federal District Court in the State of New Jersey against numerous potentially responsible parties for reimbursement of amounts incurred or to be incurred to comply with the AOC, the ROD or to perform other remediation activities at the Site.
In June 2017, the court overseeing the Maxus bankruptcy approved a Plan of Liquidation (Plan) to liquidate Maxus and create a trust to pursue claims against YPF, Repsol and others to satisfy claims by Occidental and other creditors for past and future cleanup and other costs. In July 2017, the court-approved Plan became final and the trust became effective. Among other responsibilities, the trust will pursue claims against YPF, Repsol and others and distribute assets to Maxus’ creditors in accordance with the trust agreement and Plan. In June 2018, the trust filed its complaint against YPF and Repsol in Delaware bankruptcy court asserting claims based upon, among other things, fraudulent transfer and alter ego. On February 15, 2019, the bankruptcy court denied Repsol’s and YPF’s motions to dismiss the complaint.
ENVIRONMENTAL COSTS
Occidental’s environmental costs, some of which include estimates, are presented below for each segment for each of the years ended December 31:
millions | 2019 | 2018 | 2017 | |||||||||
Operating Expenses | ||||||||||||
Oil and Gas | $ | 178 | $ | 91 | $ | 62 | ||||||
Chemical | 80 | 80 | 78 | |||||||||
Marketing and Midstream | 12 | 10 | 7 | |||||||||
Total | $ | 270 | $ | 181 | $ | 147 | ||||||
Capital Expenditures | ||||||||||||
Oil and Gas | $ | 111 | $ | 71 | $ | 71 | ||||||
Chemical | 34 | 23 | 18 | |||||||||
Marketing and Midstream | 4 | 2 | 3 | |||||||||
Total | $ | 149 | $ | 96 | $ | 92 | ||||||
Remediation Expenses | ||||||||||||
Corporate | $ | 112 | $ | 47 | $ | 39 | ||||||
Operating expenses are incurred on a continual basis. Capital expenditures relate to longer-lived improvements in properties currently operated by Occidental. Remediation expenses relate to existing conditions from past operations.
OXY 2019 FORM 10-K | 45 |
| MANAGEMENT’S DISCUSSION AND ANALYSIS | |
GLOBAL INVESTMENTS |
A portion of Occidental’s assets are located outside North America. The following table shows the geographic distribution of Occidental’s assets at December 31, 2019 at both the segment and consolidated level related to Occidental’s ongoing operations:
millions | Oil and Gas | Chemical | Marketing and Midstream | Corporate and Other | Total Consolidated | ||||||||||||||
North America | |||||||||||||||||||
United States | $ | 72,833 | $ | 4,173 | $ | 13,324 | $ | 3,952 | $ | 94,282 | |||||||||
Canada | — | 126 | 27 | — | 153 | ||||||||||||||
Middle East | 3,748 | — | 3,634 | — | 7,382 | ||||||||||||||
Latin America | 1,355 | 57 | — | — | 1,412 | ||||||||||||||
Africa and Other | — | 5 | 70 | 6,026 | 6,101 | ||||||||||||||
Consolidated | $ | 77,936 | $ | 4,361 | $ | 17,055 | $ | 9,978 | $ | 109,330 | |||||||||
For the year ended December 31, 2019, net sales outside North America totaled $4.6 billion, or approximately 22% of total net sales.
CRITICAL ACCOUNTING POLICIES AND ESTIMATES |
The process of preparing financial statements in accordance with generally accepted accounting principles requires Occidental’s management to make informed estimates and judgments regarding certain items and transactions. Changes in facts and circumstances or discovery of new information may result in revised estimates and judgments, and actual results may differ from these estimates upon settlement but generally not by material amounts. The selection and development of these policies and estimates have been discussed with the Audit Committee of the Board of Directors. Occidental considers the following to be its most critical accounting policies and estimates that involve management’s judgment.
OIL AND GAS PROPERTIES
The carrying value of Occidental’s property, plant, and equipment (PP&E) represents the cost incurred to acquire or develop the asset, including any asset retirement obligations (AROs) and capitalized interest, net of DD&A and any impairment charges. For assets acquired in a business combination, PP&E cost is based on fair values at the acquisition date. Asset retirement obligations and interest costs incurred in connection with qualifying capital expenditures are capitalized and amortized over the useful lives of the related assets.
Occidental uses the successful efforts method to account for its oil and gas properties. Under this method, Occidental capitalizes costs of acquiring properties, costs of drilling successful exploration wells and development costs. The costs of exploratory wells are initially capitalized pending a determination of whether proved reserves have been found. If proved reserves have been found, the costs of exploratory wells remain capitalized. For exploratory wells that find reserves that cannot be classified as proved when drilling is completed, costs continue to be capitalized as suspended exploratory drilling costs if there have been sufficient reserves found to justify completion as a producing well and sufficient progress is being made in assessing the economic and operating viability of the project. At the end of each quarter, management reviews the status of all suspended exploratory drilling costs in light of ongoing exploration activities, in particular, whether Occidental is making sufficient progress in its ongoing exploration and appraisal efforts or, in the case of discoveries requiring government sanctioning, analyzing whether development negotiations are underway and proceeding as planned. If management determines that future appraisal drilling or development activities are unlikely to occur, associated suspended exploratory well costs are expensed.
Occidental expenses annual lease rentals, the costs of injectants used in production, and geological, geophysical and seismic costs as incurred.
Occidental determines depreciation and depletion of oil and gas producing properties by the unit-of-production method. It amortizes acquisition costs over total proved reserves and capitalized development and successful exploration costs over proved developed reserves.
Proved oil and gas reserves are those quantities of oil and gas which, by analysis of geoscience and engineering data, can be estimated with reasonable certainty to be economically producible—from a given date forward, from known reservoirs, and under existing economic conditions, operating methods, and government regulations—prior to the time at which contracts providing the right to operate expire, unless evidence indicates that renewal is reasonably certain, regardless of whether
46 | OXY 2019 FORM 10-K |
| MANAGEMENT’S DISCUSSION AND ANALYSIS | |
deterministic or probabilistic methods are used for the estimation. Occidental has no proved oil and gas reserves for which the determination of economic producibility is subject to the completion of major additional capital expenditures.
Several factors could change Occidental’s proved oil and gas reserves. For example, Occidental receives a share of production from PSCs to recover its costs and generally an additional share for profit. Occidental’s share of production and reserves from these contracts decreases when product prices rise and increases when prices decline. Overall, Occidental’s net economic benefit from these contracts is greater at higher product prices. In other cases, particularly with long-lived properties, lower product prices may lead to a situation where production of a portion of proved reserves becomes uneconomical. For such properties, higher product prices typically result in additional reserves becoming economical. Estimation of future production and development costs is also subject to change partially due to factors beyond Occidental’s control, such as energy costs and inflation or deflation of oil field service costs. These factors, in turn, could lead to changes in the quantity of proved reserves. Additional factors that could result in a change of proved reserves include production decline rates and operating performance differing from those estimated when the proved reserves were initially recorded.
Additionally, Occidental performs impairment tests with respect to its proved properties whenever events or circumstances indicate that the carrying value of property may not be recoverable. If there is an indication the carrying amount of the asset may not be recovered due to significant and prolonged declines in current and forward prices, significant changes in reserve estimates, changes in management’s plans, or other significant events, management will evaluate the property for impairment. Under the successful efforts method, if the sum of the undiscounted cash flows is less than the carrying value of the proved property, the carrying value is reduced to estimated fair value and reported as an impairment charge in the period. Individual proved properties are grouped for impairment purposes at the lowest level for which there are identifiable cash flows. The fair value of impaired assets is typically determined based on the present value of expected future cash flows using discount rates believed to be consistent with those used by market participants. The impairment test incorporates a number of assumptions involving expectations of future cash flows which can change significantly over time. These assumptions include estimates of future production, product prices, contractual prices, estimates of risk-adjusted oil and gas reserves and estimates of future operating and development costs. It is reasonably possible that prolonged declines in commodity prices, reduced capital spending in response to lower prices or increases in operating costs could result in additional impairments.
For impairment testing, unless prices are contractually fixed, Occidental uses observable forward strip prices for oil and natural gas prices when projecting future cash flows. Future operating and development costs are estimated using the current cost environment applied to expectations of future operating and development activities to develop and produce oil and gas reserves. Market prices for oil, natural gas and NGL have been volatile and may continue to be volatile in the future. Changes in global supply and demand, transportation capacity, currency exchange rates, and applicable laws and regulations, and the effect of changes in these variables on market perceptions could impact current forecasts. Future fluctuations in commodity prices could result in estimates of future cash flows to vary significantly.
The most significant ongoing financial statement effect from a change in Occidental’s oil and gas reserves or impairment of its proved properties would be to the DD&A rate. For example, a 5% increase or decrease in the amount of oil and gas reserves would change the DD&A rate by approximately $1.15 per barrel, which would increase or decrease pre-tax income by approximately $415 million annually at current production rates.
A portion of the carrying value of Occidental’s oil and gas properties is attributable to unproved properties. Net capitalized costs attributable to unproved properties were $29.5 billion at December 31, 2019, and $1.0 billion at December 31, 2018. The 2019 amount is primarily related to the Acquisition. The unproved amounts are not subject to DD&A until they are classified as proved properties. Individually insignificant unproved properties are combined and amortized on a group basis based on factors such as lease terms, success rates, and other factors. If the exploration efforts are unsuccessful, or management decides not to pursue development of these properties as a result of lower commodity prices, higher development and operating costs, contractual conditions or other factors, the capitalized costs of the related properties would be expensed. The timing of any writedowns of these unproved properties, if warranted, depends upon management’s plans, the nature, timing and extent of future exploration and development activities and their results. Occidental periodically reviews unproved properties for impairments; numerous factors are considered, including but not limited to, current exploration plans, favorable or unfavorable exploration activity on the property or the adjacent property, geologists’ evaluation of the property and the remaining lease term for the property. Management’s assessment of the availability of funds for future activities and the current and projected political and regulatory climate in areas in which Occidental operates also impacts the timing of any impairment.
PROVED RESERVES
Occidental estimates its proved oil and gas reserves according to the definition of proved reserves provided by the SEC and FASB. This definition includes oil, natural gas, and NGLs that geological and engineering data demonstrate with reasonable certainty to be economically producible in future periods from known reservoirs under existing economic conditions, operating methods, government regulations, etc. (at prices and costs as of the date the estimates are made). Prices include consideration of price changes provided only by contractual arrangements, and do not include adjustments based on expected future conditions. For reserves information, see the Supplemental Information on Oil and Gas Exploration and Production Activities under Item 8 of this Form 10-K.
Engineering estimates of the quantities of proved reserves are inherently imprecise and represent only approximate amounts because of the judgments involved in developing such information. Occidental’s estimates of proved reserves are made using available geological and reservoir data as well as production performance data. The reliability of these estimates at any point in time depends on both the quality and quantity of the technical and economic data and the efficiency of extracting
OXY 2019 FORM 10-K | 47 |
| MANAGEMENT’S DISCUSSION AND ANALYSIS | |
and processing the hydrocarbons. These estimates are reviewed annually by internal reservoir engineers and revised, either upward or downward, as warranted by additional data. Revisions are necessary due to changes in, among other things, development plans, reservoir performance, prices, economic conditions, and governmental restrictions as well as changes in the expected recovery associated with infill drilling. Decreases in prices, for example, may cause a reduction in some proved reserves due to reaching economic limits at an earlier projected date. A material adverse change in the estimated volume of proved reserves could have a negative impact on DD&A and could result in property impairments.
FAIR VALUES
Occidental estimates fair-value of long-lived assets for impairment testing, assets and liabilities acquired in a business combination or exchanged in non-monetary transactions, pension plan assets and initial measurements of AROs.
Accounting for the acquisition of a business requires the allocation of the purchase price to the various assets and liabilities of the acquired business and recording deferred taxes for any differences between the allocated values and tax basis of assets and liabilities. Any excess of the purchase price over the amounts assigned to assets and liabilities is recorded as goodwill. The purchase price allocation is accomplished by recording each asset and liability at its estimated fair value.
Occidental primarily applies the market approach for recurring fair value measurements, maximizes its use of observable inputs and minimizes its use of unobservable inputs. When estimating the fair values of assets acquired and liabilities assumed, Occidental must apply various assumptions.
FINANCIAL ASSETS AND LIABILITIES
Occidental utilizes the mid-point between bid and ask prices for valuing the majority of its financial assets and liabilities measured and reported at fair value. In addition to using market data, Occidental makes assumptions in valuing its assets and liabilities, including assumptions about the risks inherent in the inputs to the valuation technique. For financial assets and liabilities carried at fair value, Occidental measures fair value using the following methods:
Ø Occidental values exchange-cleared commodity derivatives using closing prices provided by the exchange as of the balance sheet date. These derivatives are classified as Level 1.
Ø | Over-the-Counter (OTC) bilateral financial commodity contracts, international exchange contracts, options and physical commodity forward purchase and sale contracts are generally classified as Level 2 and are generally valued using quotations provided by brokers or industry-standard models that consider various inputs, including quoted forward prices for commodities, time value, volatility factors, credit risk and current market and contractual prices for the underlying instruments, as well as other relevant economic measures. Substantially all of these inputs are observable in the marketplace throughout the full term of the instrument, and can be derived from observable data or are supported by observable prices at which transactions are executed in the marketplace. |
Ø | Occidental values commodity derivatives based on a market approach that considers various assumptions, including quoted forward commodity prices and market yield curves. The assumptions used include inputs that are generally unobservable in the marketplace or are observable but have been adjusted based upon various assumptions and the fair value is designated as Level 3 within the valuation hierarchy. |
Ø | Occidental values debt using market-observable information for debt instruments that are traded on secondary markets. For debt instruments that are not traded, the fair value is determined by interpolating the value based on debt with similar terms and credit risk. |
NON-FINANCIAL ASSETS
Occidental uses market-observable prices for assets when comparable transactions can be identified that are similar to the asset being valued. When Occidental is required to measure fair value and there is not a market-observable price for the asset or for a similar asset then the cost or income approach is used depending on the quality of information available to support management’s assumptions. The cost approach is based on management’s best estimate of the current asset replacement cost. The income approach is based on management’s best assumptions regarding expectations of future net cash flows, and the expected cash flows are discounted using a commensurate risk-adjusted discount rate. Such evaluations involve significant judgment, and the results are based on expected future events or conditions such as sales prices, estimates of future oil and gas production or throughput, development and operating costs and the timing thereof, economic and regulatory climates, and other factors, most of which are often outside of management’s control. However, assumptions used reflect a market participant’s view of long-term prices, costs, and other factors and are consistent with assumptions used in the Company’s business plans and investment decisions.
ENVIRONMENTAL LIABILITIES AND EXPENDITURES
Environmental expenditures that relate to current operations are expensed or capitalized as appropriate. Occidental records environmental liabilities and related charges and expenses for estimated remediation costs that relate to existing conditions from past operations when environmental remediation efforts are probable and the costs can be reasonably estimated. In determining the environmental remediation liability and the range of reasonably possible additional losses, Occidental refers to currently available information, including relevant past experience, remedial objectives, available technologies, applicable laws and regulations and cost-sharing arrangements. Occidental bases its environmental remediation liabilities on management’s estimate of the most likely cost to be incurred, using the most cost-effective technology reasonably
48 | OXY 2019 FORM 10-K |
| MANAGEMENT’S DISCUSSION AND ANALYSIS | |
expected to achieve the remedial objective. Occidental periodically reviews its environmental remediation liabilities and adjusts them as new information becomes available. Occidental records environmental remediation liabilities on a discounted basis when it deems the aggregate amount and timing of cash payments to be reliably determinable at the time the reserves are established. The reserve methodology with respect to discounting for a specific site is not modified once it is established. Presently none of its environmental remediation liabilities are recorded on a discounted basis. Occidental generally records reimbursements or recoveries of environmental remediation costs in income when received, or when receipt of recovery is highly probable.
Many factors could affect Occidental’s future remediation costs and result in adjustments to its environmental remediation liabilities and the range of reasonably possible additional losses. The most significant are: (1) cost estimates for remedial activities may vary from the initial estimate; (2) the length of time, type or amount of remediation necessary to achieve the remedial objective may change due to factors such as site conditions, the ability to identify and control contaminant sources or the discovery of additional contamination; (3) a regulatory agency may ultimately reject or modify Occidental’s proposed remedial plan; (4) improved or alternative remediation technologies may change remediation costs; (5) laws and regulations may change remediation requirements or affect cost sharing or allocation of liability; and (6) changes in allocation or cost-sharing arrangements may occur.
Certain sites involve multiple parties with various cost-sharing arrangements, which fall into the following three categories: (1) environmental proceedings that result in a negotiated or prescribed allocation of remediation costs among Occidental and other alleged potentially responsible parties; (2) oil and gas ventures in which each participant pays its proportionate share of remediation costs reflecting its working interest; or (3) contractual arrangements, typically relating to purchases and sales of properties, in which the parties to the transaction agree to methods of allocating remediation costs. In these circumstances, Occidental evaluates the financial viability of other parties with whom it is alleged to be jointly liable, the degree of their commitment to participate and the consequences to Occidental of their failure to participate when estimating Occidental’s ultimate share of liability. Occidental records its environmental remediation liabilities at its expected net cost of remedial activities and, based on these factors, believes that it will not be required to assume a share of liability of such other potentially responsible parties in an amount materially above amounts reserved.
In addition to the costs of investigations and cleanup measures, which often take in excess of 10 years at CERCLA NPL sites, Occidental’s environmental remediation liabilities include management’s estimates of the costs to operate and maintain remedial systems. If remedial systems are modified over time in response to significant changes in site-specific data, laws, regulations, technologies or engineering estimates, Occidental reviews and adjusts its liabilities accordingly.
If Occidental were to adjust the balance of its environmental remediation liabilities based on the factors described above, the amount of the increase or decrease would be recognized in earnings. For example, if the balance were reduced by 10%, Occidental would record a pre-tax gain of $120 million. If the balance were increased by 10%, Occidental would record an additional remediation expense of $120 million.
INCOME TAXES
Occidental files various U.S. federal, state and foreign income tax returns. The impact of changes in tax regulations are reflected when enacted. In general, deferred federal, state and foreign income taxes are provided on temporary differences between the financial statement carrying amounts of assets and liabilities and their respective tax basis. Occidental routinely assesses the realizability of its deferred tax assets. If Occidental concludes that it is more likely than not that some of the deferred tax assets will not be realized, the tax asset is reduced by a valuation allowance. Occidental recognizes a tax benefit from an uncertain tax position when it is more likely than not that the position will be sustained upon examination, based on the technical merits of the position. The tax benefit recorded is equal to the largest amount that is greater than 50% likely to be realized through final settlement with a taxing authority. Interest and penalties related to unrecognized tax benefits are recognized in income tax expense (benefit). Occidental uses the flow-through method to account for its investment tax credits. See Note 12 - Income Taxes in the Notes to Consolidated Financial Statements.
LOSS CONTINGENCIES
Occidental is involved, in the normal course of business, in lawsuits, claims and other legal proceedings and audits. Occidental accrues reserves for these matters when it is probable that a liability has been incurred and the liability can be reasonably estimated. In addition, Occidental discloses, in aggregate, its exposure to loss in excess of the amount recorded on the balance sheet for these matters if it is reasonably possible that an additional material loss may be incurred. Occidental reviews its loss contingencies on an ongoing basis.
Loss contingencies are based on judgments made by management with respect to the likely outcome of these matters and are adjusted as appropriate. Management’s judgments could change based on new information, changes in, or interpretations of, laws or regulations, changes in management’s plans or intentions, opinions regarding the outcome of legal proceedings, or other factors. See “Lawsuits, Claims and Contingencies” for additional information.
SIGNIFICANT ACCOUNTING AND DISCLOSURE CHANGES |
OXY 2019 FORM 10-K | 49 |
| MANAGEMENT’S DISCUSSION AND ANALYSIS | |
SAFE HARBOR DISCUSSION REGARDING OUTLOOK AND OTHER FORWARD-LOOKING DATA |
Portions of this report contain forward-looking statements within the meaning of Section 27A of the Securities Act of 1933 and Section 21E of the Securities Exchange Act of 1934 and involve risks and uncertainties that could materially affect expected results of operations, liquidity, cash flows and business prospects. Words such as “estimate,” “project,” “predict,” “will,” “would,” “should,” “could,” “may,” “might,” “anticipate,” “plan,” “intend,” “believe,” “expect,” “aim,” “goal,” “target,” “objective,” “likely” or similar expressions that convey the prospective nature of events or outcomes generally indicate forward-looking statements. You should not place undue reliance on these forward-looking statements, which speak only as of the date of this report. Unless legally required, Occidental does not undertake any obligation to update any forward-looking statements as a result of new information, future events, except as required by law. Factors that may cause Occidental’s results of operations and financial position to differ from expectations include the factors discussed in Item 1A, “Risk Factors” and elsewhere in this Annual Report on Form 10-K.
ITEM 7A. | QUANTITATIVE AND QUALITATIVE DISCLOSURES ABOUT MARKET RISK |
COMMODITY PRICE RISK |
GENERAL
Occidental’s results are sensitive to fluctuations in oil, NGL and natural gas prices. Price changes at current global prices and levels of production affect Occidental’s pre-tax annual income by approximately $260 million for a $1 per barrel change in oil prices and $90 million for a $1 per barrel change in NGL prices. If domestic natural gas prices varied by $0.50 per Mcf, it would have an estimated annual effect on Occidental’s pre-tax income of approximately $185 million. These price-change sensitivities include the impact of PSC and similar contract volume changes on income. If production levels change in the future, the sensitivity of Occidental’s results to prices also will change. Marketing results are sensitive to price changes of oil, natural gas and, to a lesser degree, other commodities. These sensitivities are additionally dependent on marketing volumes and cannot be predicted reliably.
Occidental’s results are also sensitive to fluctuations in chemical prices. A variation in chlorine and caustic soda prices of $10 per ton would have a pre-tax annual effect on income of approximately $10 million and $30 million, respectively. A variation in PVC prices of $0.01 per lb. would have a pre-tax annual effect on income of approximately $30 million. Historically, over time, product price changes have tracked raw material and feedstock product price changes, somewhat mitigating the effect of price changes on margins.
Occidental uses derivative instruments, including a combination of short-term futures, forwards, options and swaps, to obtain the average prices for the relevant production month and to improve realized prices for oil and gas.
RISK MANAGEMENT
Occidental conducts its risk management activities for marketing and trading under the controls and governance of its risk control policies. The controls under these policies are implemented and enforced by a risk management group which monitors risk by providing an independent and separate evaluation and check. Members of the risk management group report to the Corporate Vice President and Treasurer. Controls for these activities include limits on value at risk, limits on credit, limits on total notional trade value, segregation of duties, delegation of authority, daily price verifications, reporting to senior management on various risk measures and a number of other policy and procedural controls.
FAIR VALUE OF MARKETING DERIVATIVE CONTRACTS
Occidental carries derivative contracts it enters into in connection with its marketing activities at fair value. Fair values for these contracts are derived from Level 1 and Level 2 sources. The fair values in future maturity periods are insignificant.
The following table shows the fair value of Occidental’s derivatives (excluding collateral), segregated by maturity periods and by methodology of fair value estimation:
Maturity Periods | ||||||||||||||||||||
Source of Fair Value Assets/(Liabilities) millions | 2020 | 2021 and 2022 | 2023 and 2024 | 2025 and thereafter | Total | |||||||||||||||
Prices actively quoted | $ | (63 | ) | $ | — | $ | — | $ | — | $ | (63 | ) | ||||||||
Prices provided by other external sources | 36 | 8 | 1 | 1 | 46 | |||||||||||||||
Total | $ | (27 | ) | $ | 8 | $ | 1 | $ | 1 | $ | (17 | ) | ||||||||
50 | OXY 2019 FORM 10-K |
 | QUANTITATIVE AND QUALITATIVE DISCLOSURES | |
CASH-FLOW HEDGES
Occidental’s marketing operations, from time to time, store natural gas purchased from third parties at Occidental’s North American leased storage facilities. As of December 31, 2019, and 2018, Occidental had approximately 6 Bcf and 5 Bcf of natural gas held in storage, respectively, and had cash-flow hedges for the forecast sales, to be settled by physical delivery, of approximately 3 Bcf and 4 Bcf of stored natural gas, respectively.
QUANTITATIVE INFORMATION
Occidental uses value at risk to estimate the potential effects of changes in fair values of commodity contracts used in trading activities. This measure determines the maximum potential negative one day change in fair value with a 95% level of confidence. Additionally, Occidental uses complementary trading limits including position and tenor limits and maintains liquid positions as a result of which market risk typically can be neutralized or mitigated on short notice. As a result of these controls, Occidental believes that the market risk of its trading activities is not reasonably likely to have a material adverse effect on its performance.
INTEREST RATE RISK |
GENERAL
Occidental acquired interest rate swap contracts in the Acquisition. Occidental pays a fixed interest rate and receives a floating interest rate indexed to three-month LIBOR. The swaps have an initial term of 30 years with mandatory termination dates in September 2020 through 2023 and a total notional amount of $1.475 billion as of December 31, 2019. In October 2019, $125 million of notional interest rate swaps were terminated. As of December 31, 2019, the fair value of the swaps of negative $1.4 billion net liability was offset by $104 million in posted cash collateral, resulting in a net $1.3 billion liability. A 25-basis point decrease in implied LIBOR rates over the term of the swaps would result in an additional liability of approximately $101 million on these swaps. In January and February 2020, Occidental extended September 2020 mandatory termination dates to September 2021 and September 2022 for swaps with a notional value of $500 million and $150 million, respectively.
As of December 31, 2019, Occidental had $4.5 billion of variable-rate debt outstanding. A 25-basis point increase in LIBOR interest rates would increase gross interest expense approximately $11 million per year.
As of December 31, 2019, Occidental had $34.3 billion of fixed-rate debt outstanding. A 25-basis point change in Treasury rates would change the fair value of the fixed-rate debt approximately $680 million.
TABULAR PRESENTATION OF INTEREST RATE RISK
The table below provides information about Occidental’s debt obligations. Debt amounts represent principal payments by maturity date including amounts assumed from the Acquisition except WES debt.
millions except percentages | U.S. Dollar Fixed-Rate Debt | U.S. Dollar Variable-Rate Debt | Total (a) | |||||||||
2020 | $ | — | $ | — | $ | — | ||||||
2021 | 3,426 | 2,956 | 6,382 | |||||||||
2022 | 3,214 | 1,500 | 4,714 | |||||||||
2023 | 1,213 | — | 1,213 | |||||||||
2024 | 3,898 | — | 3,898 | |||||||||
Thereafter | 21,126 | 68 | 21,194 | |||||||||
Total | $ | 32,877 | $ | 4,524 | $ | 37,401 | ||||||
Weighted-average interest rate | 4.09 | % | 3.15 | % | 3.98 | % | ||||||
Fair Value | $ | 34,260 | $ | 4,535 | $ | 38,795 | ||||||
(a) | Excluded net unamortized debt premiums of $914 million and debt issuance cost of $125 million. |
FOREIGN CURRENCY RISK |
Occidental’s international operations have limited currency risk. Occidental manages its exposure primarily by balancing monetary assets and liabilities and limiting cash positions in foreign currencies to levels necessary for operating purposes. A vast majority of international oil sales are denominated in United States dollars. Additionally, all of Occidental’s consolidated international oil and gas subsidiaries have the United States dollar as the functional currency. As of December 31, 2019, the fair value of foreign currency derivatives used in the marketing operations was immaterial. The effect of exchange rates on transactions in foreign currencies is included in periodic income.
OXY 2019 FORM 10-K | 51 |
| QUANTITATIVE AND QUALITATIVE DISCLOSURES | |
CREDIT RISK |
The majority of Occidental’s counterparty credit risk is related to the physical delivery of energy commodities to its customers and their inability to meet their settlement commitments. Occidental manages credit risk by selecting counterparties that it believes to be financially strong, by entering into netting arrangements with counterparties and by requiring collateral or other credit risk mitigants, as appropriate. Occidental actively evaluates the creditworthiness of its counterparties, assigns appropriate credit limits, and monitors credit exposures against those assigned limits. Occidental also enters into future contracts through regulated exchanges with select clearinghouses and brokers, which are subject to minimal credit risk as a significant portion of these transactions settle on a daily margin basis.
Certain over-the-counter derivative instruments contain credit-risk-contingent features, primarily tied to credit ratings for Occidental or its counterparties, which may affect the amount of collateral that each party would need to post. The aggregate fair value of derivative instruments with credit-risk-contingent features for which a net liability position existed at December 31, 2019 was $787 million (net of $169 million collateral), primarily related to acquired interest-rate swaps, and $68 million (net of $1 million of collateral) existed at December 31, 2018.
As of December 31, 2019, the substantial majority of the credit exposures were with investment grade counterparties. Occidental believes its exposure to credit-related losses at December 31, 2019, was not material and losses associated with credit risk have been insignificant for all years presented.
DERIVATIVE INSTRUMENTS HELD FOR NON-TRADING PURPOSES |
As of December 31, 2019, Occidental had derivative instruments in place to reduce the price risk associated with future oil production of 350 thousand barrels per day. As of December 31, 2019, these derivative instruments were at a $68 million net derivative liability position.
The following table shows a sensitivity analysis based on both a 5% and 10% change in commodity prices and their effect on the net derivative liability position of $68 million at December 31, 2019:
millions except percentages | ||||||||||
Percent change in commodity prices | Resulting net fair value position-asset (liability) | Change to fair value from December 31, 2019 position | ||||||||
+ 5% | $ | (270 | ) | $ | (202 | ) | ||||
- 5% | $ | 100 | $ | 168 | ||||||
+ 10% | $ | (525 | ) | $ | (457 | ) | ||||
-10% | $ | 254 | $ | 322 | ||||||
52 | OXY 2019 FORM 10-K |
| FINANCIAL STATEMENTS INDEX | |
ITEM 8. | FINANCIAL STATEMENTS AND SUPPLEMENTARY DATA |
INDEX TO CONSOLIDATED FINANCIAL STATEMENTS | PAGE |
Note 3 - The Acquisition | |
OXY 2019 FORM 10-K | 53 |
| FINANCIAL STATEMENTS REPORT | |
Report of Independent Registered Public Accounting Firm
To the Stockholders and Board of Directors
Occidental Petroleum Corporation:
Opinion on the Consolidated Financial Statements
We have audited the accompanying consolidated balance sheets of Occidental Petroleum Corporation and subsidiaries (the Company) as of December 31, 2019 and 2018, the related consolidated statements of operations, comprehensive income, stockholders’ equity, and cash flows for each of the years in the three year period ended December 31, 2019, and the related notes and financial statement schedule II - valuation and qualifying accounts (collectively, the consolidated financial statements). In our opinion, the consolidated financial statements present fairly, in all material respects, the financial position of the Company as of December 31, 2019 and 2018, and the results of its operations and its cash flows for each of the years in the three year period ended December 31, 2019, in conformity with U.S. generally accepted accounting principles.
We also have audited, in accordance with the standards of the Public Company Accounting Oversight Board (United States) (PCAOB), the Company’s internal control over financial reporting as of December 31, 2019, based on criteria established in Internal Control - Integrated Framework (2013) issued by the Committee of Sponsoring Organizations of the Treadway Commission, and our report dated February 27, 2020 expressed an unqualified opinion on the effectiveness of the Company’s internal control over financial reporting.
Change in Accounting Principle
As discussed in Notes 2 and 8 to the consolidated financial statements, the Company has changed its method of accounting for leases as of January 1, 2019 due to the adoption of Accounting Standards Codification Topic 842, Leases.
Basis for Opinion
These consolidated financial statements are the responsibility of the Company’s management. Our responsibility is to express an opinion on these consolidated financial statements based on our audits. We are a public accounting firm registered with the PCAOB and are required to be independent with respect to the Company in accordance with the U.S. federal securities laws and the applicable rules and regulations of the Securities and Exchange Commission and the PCAOB.
We conducted our audits in accordance with the standards of the PCAOB. Those standards require that we plan and perform the audit to obtain reasonable assurance about whether the consolidated financial statements are free of material misstatement, whether due to error or fraud. Our audits included performing procedures to assess the risks of material misstatement of the consolidated financial statements, whether due to error or fraud, and performing procedures that respond to those risks. Such procedures included examining, on a test basis, evidence regarding the amounts and disclosures in the consolidated financial statements. Our audits also included evaluating the accounting principles used and significant estimates made by management, as well as evaluating the overall presentation of the consolidated financial statements. We believe that our audits provide a reasonable basis for our opinion.
Critical Audit Matters
The critical audit matters communicated below are matters arising from the current period audit of the consolidated financial statements that were communicated or required to be communicated to the audit committee and that: (1) relate to accounts or disclosures that are material to the consolidated financial statements and (2) involved our especially challenging, subjective, or complex judgments. The communication of critical audit matters does not alter in any way our opinion on the consolidated financial statements, taken as a whole, and we are not, by communicating the critical audit matters below, providing separate opinions on the critical audit matters or on the accounts or disclosures to which they relate.
54 | OXY 2019 FORM 10-K |
| FINANCIAL STATEMENTS REPORT | |
Evaluation of the environmental liability associated with the lower 8.3 miles of the Lower Passaic River site
As discussed in Notes 1 and 10 to the consolidated financial statements, the Company accrues a liability for estimated environmental remedial activities when it is probable a liability has been incurred and the amount of remediation costs can be estimated. As of December 31, 2019, the Company’s estimated environmental liabilities were $1.2 billion. The Company accrued a liability related to its estimated allocable share of the costs to perform the remedial activities required for the lower 8.3 miles of the Lower Passaic River site.
We identified the evaluation of the environmental liability associated with the lower 8.3 miles of the Lower Passaic River site as a critical audit matter. There was a high degree of subjective auditor judgment in applying and evaluating the results of our procedures. This is due to 1) possible changes to expected remedial activities to implement the proposed clean-up plan outlined in the Record of Decision (ROD) issued by the Environmental Protection Agency (EPA) and their estimated costs, and 2) possible changes to the Company’s estimated share of the remediation costs.
The primary procedures we performed to address this critical audit matter included the following. We tested certain internal controls over the Company’s environmental liability process to estimate the cost of remedial activities, and estimate the Company’s allocable share of the remediation costs. We evaluated the remedial activities and related cost assumptions used by the Company by comparing them against remedial activities and cost estimates provided by the EPA in the ROD. We compared certain design documentation provided by the Company to the EPA in order to identify potential differences between the design plan and the ROD and assessed the impact of any such differences on the remediation cost assumptions used by the Company to estimate the liability. We assessed the Company’s assumption for its allocable share of the remediation costs and analyzed publicly available data sources for information that might be contrary to the information used by the Company. We involved an environmental analysis professional with specialized skills and knowledge who assisted in reading correspondence between the Company and the EPA related to the design phase for this site to assess the Company’s remediation cost assumptions.
Assessment of the estimated proved oil and gas reserves on the determination of depreciation and depletion expense related to proved oil and gas properties
As discussed in Note 1 to the consolidated financial statements, the Company determines depreciation and depletion of oil and gas producing properties by the unit-of-production method. Under this method, capitalized costs are amortized over total estimated proved reserves. For the year ended December 31, 2019, the Company recorded depreciation and depletion expense related to proved oil and gas properties of $5.0 billion.
We identified the assessment of the estimated proved oil and gas reserves on the determination of depreciation and depletion expense related to proved oil and gas properties as a critical audit matter. Complex auditor judgment was required to evaluate the Company’s estimate of total proved oil and gas reserves, which is a key input for the determination of depreciation and depletion expense. Estimating total proved oil and gas reserves requires the expertise of professional petroleum reservoir engineers. The estimate of proved oil and gas reserves is dependent upon timing of future estimated production, operating and capital cost assumptions and oil and gas prices inclusive of market differentials.
The primary procedures we performed to address this critical audit matter included the following. We tested certain internal controls over the Company’s depreciation and depletion process, including the estimation of proved oil and gas reserves. We evaluated the competence, capabilities, and objectivity of the internal engineering and technical staff who estimated the proved oil and gas reserves and the independent reservoir engineering specialists engaged by the Company. We analyzed and assessed the determination of depreciation and depletion expense for compliance with industry and regulatory standards. We assessed compliance of the methodology used by the Company’s engineering and technical staff to estimate proved oil and gas reserves with industry and regulatory standards. We read the findings of the independent reservoir engineering specialist’s review of the methods and procedures used by the Company in estimating the proved reserves for compliance with industry and regulatory standards. We compared the timing of future estimated production assumptions used by the Company’s engineering and technical staff to historical production rates. We evaluated the operating and capital cost assumptions used by the Company’s engineering and technical staff by comparing them to historical costs. We assessed the oil and gas prices, including relevant market differentials, used by the Company’s engineering and technical staff by comparing them to publicly available prices, adjusted for historical market differentials.
OXY 2019 FORM 10-K | 55 |
| FINANCIAL STATEMENTS REPORT | |
Evaluation of the fair value measurement of oil and gas properties acquired in the Anadarko Petroleum Corporation business combination
As discussed in Note 3 to the consolidated financial statements, on August 8, 2019, the Company acquired Anadarko Petroleum Corporation (Anadarko) in a business combination. As a result of the transaction, the Company acquired both proved and unproved oil and gas properties. The acquisition-date fair value for the oil and gas properties was $46.5 billion.
We identified the evaluation of the initial fair value measurement of the oil and gas properties acquired in the Anadarko transaction as a critical audit matter. The Company used a combination of valuation methodologies in estimating the initial fair value of acquired oil and gas properties which included market based data from similar transactions and an income approach. There was a high degree of subjectivity in evaluating results of the market based transaction values and the discounted cash flow models used in the income approach. The evaluation of market based transactions included determining which market transactions were most relevant to the Company’s acquisition of Anadarko’s oil and gas properties. In addition, the income approach utilized risk adjusted discounted cash flow models, which included several significant assumptions. The following key assumptions were used in the discounted cash flow models: estimated future commodities prices, reserve category risk adjustment factors, estimated future production, estimated future operating and capital costs and discount rate. Changes to the assumptions used could have a significant effect on the determination of the acquisition date fair values.
The primary procedures we performed to address this critical audit matter included the following. We tested certain internal controls over the Company’s acquisition-date valuation process to develop and analyze the key assumptions, as listed above, used to measure the initial fair value of the acquired oil and gas properties. We compared acres utilized in the market analysis to historical Anadarko property records. We compared estimated future production to Anadarko’s historical actual production volumes. We evaluated the estimated future operating and capital cost assumptions by comparing them to Anadarko’s historical costs. In addition, we involved valuation professionals with specialized skills and knowledge, who assisted in: 1) evaluating the Company’s discount rate, by comparing it to a discount rate range that was independently developed using publicly available market data for comparable entities, 2) evaluating the reserve category risk adjustment factors used by the Company by comparing them to third party publications of risk adjustment factors utilized by market participants, 3) evaluating benchmark commodity prices used by the Company in estimating future commodity prices by comparing the benchmark prices utilized to publicly disclosed projected commodity prices 4) for oil and gas properties valued using the income approach, developing an estimate of the oil and gas properties’ fair value using the oil and gas properties’ cash flow assumptions and an independently developed discount rate, and compared to the Company’s fair value estimate and 5) evaluating the Company’s initial measurement of fair value by comparing the Company’s estimated fair values for onshore undeveloped properties to a range of indicated values of recent similar market transactions using publicly available market data.
/s/ KPMG LLP
We have served as the Company’s auditor since 2002.
Houston, Texas
February 27, 2020
56 | OXY 2019 FORM 10-K |
| FINANCIAL STATEMENTS REPORT | |
Report of Independent Registered Public Accounting Firm
To the Stockholders and Board of Directors
Occidental Petroleum Corporation:
Opinion on Internal Control Over Financial Reporting
We have audited Occidental Petroleum Corporation and subsidiaries’ (the Company) internal control over financial reporting as of December 31, 2019, based on criteria established in Internal Control - Integrated Framework (2013) issued by the Committee of Sponsoring Organizations of the Treadway Commission. In our opinion, the Company maintained, in all material respects, effective internal control over financial reporting as of December 31, 2019, based on criteria established in Internal Control - Integrated Framework (2013) issued by the Committee of Sponsoring Organizations of the Treadway Commission.
We also have audited, in accordance with the standards of the Public Company Accounting Oversight Board (United States) (PCAOB), the consolidated balance sheets of the Company as of December 31, 2019 and 2018, the related consolidated statements of operations, comprehensive income, stockholders’ equity, and cash flows for each of the years in the three-year period ended December 31, 2019, and the related notes and financial statement schedule II - valuation and qualifying accounts (collectively, the consolidated financial statements), and our report dated February 27, 2020 expressed an unqualified opinion on those consolidated financial statements.
Basis for Opinion
The Company’s management is responsible for maintaining effective internal control over financial reporting and for its assessment of the effectiveness of internal control over financial reporting, included in the accompanying Management’s Annual Assessment of and Report on Internal Control over Financial Reporting. Our responsibility is to express an opinion on the Company’s internal control over financial reporting based on our audit. We are a public accounting firm registered with the PCAOB and are required to be independent with respect to the Company in accordance with the U.S. federal securities laws and the applicable rules and regulations of the Securities and Exchange Commission and the PCAOB.
We conducted our audit in accordance with the standards of the PCAOB. Those standards require that we plan and perform the audit to obtain reasonable assurance about whether effective internal control over financial reporting was maintained in all material respects. Our audit of internal control over financial reporting included obtaining an understanding of internal control over financial reporting, assessing the risk that a material weakness exists, and testing and evaluating the design and operating effectiveness of internal control based on the assessed risk. Our audit also included performing such other procedures as we considered necessary in the circumstances. We believe that our audit provides a reasonable basis for our opinion.
Definition and Limitations of Internal Control Over Financial Reporting
A company’s internal control over financial reporting is a process designed to provide reasonable assurance regarding the reliability of financial reporting and the preparation of financial statements for external purposes in accordance with generally accepted accounting principles. A company’s internal control over financial reporting includes those policies and procedures that (1) pertain to the maintenance of records that, in reasonable detail, accurately and fairly reflect the transactions and dispositions of the assets of the company; (2) provide reasonable assurance that transactions are recorded as necessary to permit preparation of financial statements in accordance with generally accepted accounting principles, and that receipts and expenditures of the company are being made only in accordance with authorizations of management and directors of the company; and (3) provide reasonable assurance regarding prevention or timely detection of unauthorized acquisition, use, or disposition of the company’s assets that could have a material effect on the financial statements.
Because of its inherent limitations, internal control over financial reporting may not prevent or detect misstatements. Also, projections of any evaluation of effectiveness to future periods are subject to the risk that controls may become inadequate because of changes in conditions, or that the degree of compliance with the policies or procedures may deteriorate.
/s/ KPMG LLP
Houston, Texas
February 27, 2020
OXY 2019 FORM 10-K | 57 |
 | FINANCIAL STATEMENTS | |
Consolidated Balance Sheets | Occidental Petroleum Corporation and Subsidiaries |
December 31, | ||||||||
millions | 2019 | 2018 | ||||||
ASSETS | ||||||||
CURRENT ASSETS | ||||||||
Cash and cash equivalents | $ | $ | ||||||
Restricted cash and restricted cash equivalents | ||||||||
Trade receivables, net of reserves of $19 in 2019 and $21 in 2018 | ||||||||
Inventories | ||||||||
Assets held for sale | ||||||||
Other current assets | ||||||||
Total current assets | ||||||||
INVESTMENTS IN UNCONSOLIDATED ENTITIES | ||||||||
PROPERTY, PLANT AND EQUIPMENT | ||||||||
Oil and gas segment | ||||||||
Chemical segment | ||||||||
Marketing and midstream segment | ||||||||
Corporate | ||||||||
Accumulated depreciation, depletion and amortization | ( | ) | ( | ) | ||||
OPERATING LEASE ASSETS | — | |||||||
LONG-TERM RECEIVABLES AND OTHER ASSETS, NET | ||||||||
TOTAL ASSETS | $ | $ | ||||||
The accompanying notes are an integral part of these consolidated financial statements.
58 | OXY 2019 FORM 10-K |
| FINANCIAL STATEMENTS | |
Consolidated Balance Sheets | Occidental Petroleum Corporation and Subsidiaries |
December 31, | ||||||||
millions except share and per-share amounts | 2019 | 2018 | ||||||
LIABILITIES AND EQUITY | ||||||||
CURRENT LIABILITIES | ||||||||
Current maturities of long-term debt | $ | $ | ||||||
Current operating lease liabilities | — | |||||||
Accounts payable | ||||||||
Accrued liabilities | ||||||||
Liabilities of assets held for sale | ||||||||
Total current liabilities | ||||||||
LONG-TERM DEBT, NET | ||||||||
Long-term debt, net | ||||||||
DEFERRED CREDITS AND OTHER LIABILITIES | ||||||||
Deferred income taxes, net | ||||||||
Asset retirement obligations | ||||||||
Pension and postretirement obligations | ||||||||
Environmental remediation liabilities | ||||||||
Operating lease liabilities | — | |||||||
Other | ||||||||
EQUITY | ||||||||
Preferred stock, at $1.00 per share par value (100,000 shares at December 31, 2019) | ||||||||
Common stock, $0.20 per share par value, authorized shares: 1.1 billion, issued shares: 2019 — 1,044,434,893 and 2018 — 895,115,637 | ||||||||
Treasury stock: 2019 — 150,323,151 shares and 2018 — 145,726,051 shares | ( | ) | ( | ) | ||||
Additional paid-in capital | ||||||||
Retained earnings | ||||||||
Accumulated other comprehensive loss | ( | ) | ( | ) | ||||
Total stockholders’ equity | ||||||||
TOTAL LIABILITIES AND STOCKHOLDERS’ EQUITY | $ | $ | ||||||
The accompanying notes are an integral part of these consolidated financial statements.
OXY 2019 FORM 10-K | 59 |
| FINANCIAL STATEMENTS | |
Consolidated Statements of Operations | Occidental Petroleum Corporation and Subsidiaries |
Years Ended December 31, | ||||||||||||
millions except per-share amounts | 2019 | 2018 | 2017 | |||||||||
REVENUES AND OTHER INCOME | ||||||||||||
Net sales | $ | $ | $ | |||||||||
Interest, dividends and other income | ||||||||||||
Gains on sale of equity investments and other assets, net | ||||||||||||
Total | ||||||||||||
COSTS AND OTHER DEDUCTIONS | ||||||||||||
Oil and gas operating expense | ||||||||||||
Transportation expense | ||||||||||||
Chemical and midstream cost of sales | ||||||||||||
Purchased commodities | ||||||||||||
Selling, general and administrative | ||||||||||||
Other operating and non-operating expense | ||||||||||||
Depreciation, depletion and amortization | ||||||||||||
Asset impairments and other charges | ||||||||||||
Taxes other than on income | ||||||||||||
Anadarko acquisition-related costs | ||||||||||||
Exploration expense | ||||||||||||
Interest and debt expense, net | ||||||||||||
Total | ||||||||||||
Income (loss) before income taxes and other items | ( | ) | ||||||||||
OTHER ITEMS | ||||||||||||
Gains on interest rate swaps and warrants, net | ||||||||||||
Income from equity investments | ||||||||||||
Total | ||||||||||||
Income from continuing operations before income taxes | ||||||||||||
Income tax expense | ( | ) | ( | ) | ( | ) | ||||||
Income (loss) from continuing operations | ( | ) | ||||||||||
Loss from discontinued operations, net of tax | ( | ) | ||||||||||
NET INCOME (LOSS) | ( | ) | ||||||||||
Less: Net income attributable to noncontrolling interest | ( | ) | ||||||||||
Less: Preferred stock dividends | ( | ) | ||||||||||
NET INCOME (LOSS) ATTRIBUTABLE TO COMMON STOCKHOLDERS | $ | ( | ) | $ | $ | |||||||
PER COMMON SHARE | ||||||||||||
Income (loss) from continuing operations—basic | $ | ( | ) | $ | $ | |||||||
(Loss) from discontinued operations—basic | ( | ) | ||||||||||
Net income (loss) attributable to common stockholders—basic | $ | ( | ) | $ | $ | |||||||
Income (loss) from continuing operations—diluted | $ | ( | ) | $ | $ | |||||||
(Loss) from discontinued operations—diluted | ( | ) | ||||||||||
Net income (loss) attributable to common stockholders—diluted | $ | ( | ) | $ | $ | |||||||
DIVIDENDS PER COMMON SHARE | $ | $ | $ | |||||||||
The accompanying notes are an integral part of these consolidated financial statements.
60 | OXY 2019 FORM 10-K |
| FINANCIAL STATEMENTS | |
Consolidated Statements of Comprehensive Income | Occidental Petroleum Corporation and Subsidiaries |
Years Ended December 31, | ||||||||||||
millions | 2019 | 2018 | 2017 | |||||||||
Net income (loss) | $ | ( | ) | $ | $ | |||||||
Other comprehensive income (loss) items: | ||||||||||||
Foreign currency translation gains | ||||||||||||
Unrealized gains (losses) on derivatives (a) | ( | ) | ( | ) | ||||||||
Pension and postretirement gains (losses) (b) | ( | ) | ||||||||||
Reclassification of realized losses (gains) on derivatives (c) | ( | ) | ||||||||||
Other comprehensive income (loss), net of tax | ( | ) | ||||||||||
Comprehensive income (loss) | ( | ) | ||||||||||
Less: Comprehensive income attributable to noncontrolling interests | ( | ) | ||||||||||
Comprehensive income (loss) attributable to preferred and common stockholders | $ | ( | ) | $ | $ | |||||||
(a) | Net of tax of $ |
(b) | Net of tax of $( |
(c) | Net of tax of $ |
The accompanying notes are an integral part of these consolidated financial statements.
OXY 2019 FORM 10-K | 61 |
| FINANCIAL STATEMENTS | |
Consolidated Statements of Stockholders’ Equity | Occidental Petroleum Corporation and Subsidiaries |
Equity Attributable to Common Stock | ||||||||||||||||||||||||||||||||
millions, except per share amounts | Preferred Stock | Common Stock | Treasury Stock | Additional Paid-in Capital | Retained Earnings | Accumulated Other Comprehensive Loss | Non-controlling Interests | Total Equity | ||||||||||||||||||||||||
Balance, December 31, 2016 | $ | $ | $ | ( | ) | $ | $ | $ | ( | ) | $ | $ | ||||||||||||||||||||
Net income | — | — | — | — | — | — | ||||||||||||||||||||||||||
Other comprehensive income, net of tax | — | — | — | — | — | — | ||||||||||||||||||||||||||
Dividends on common stock, $3.06 per share | — | — | — | — | ( | ) | — | — | ( | ) | ||||||||||||||||||||||
Issuance of common stock and other, net | — | — | — | — | — | |||||||||||||||||||||||||||
Purchases of treasury stock | — | — | ( | ) | — | — | — | — | ( | ) | ||||||||||||||||||||||
Balance, December 31, 2017 | $ | $ | $ | ( | ) | $ | $ | $ | ( | ) | $ | $ | ||||||||||||||||||||
Net income | — | — | — | — | — | — | ||||||||||||||||||||||||||
Other comprehensive income, net of tax | — | — | — | — | — | — | ||||||||||||||||||||||||||
Dividends on common stock, $3.10 per share | — | — | — | — | ( | ) | — | — | ( | ) | ||||||||||||||||||||||
Issuance of common stock and other, net | — | — | — | — | — | — | ||||||||||||||||||||||||||
Purchases of treasury stock | — | — | ( | ) | — | — | — | — | ( | ) | ||||||||||||||||||||||
Reclassification of stranded tax effects (See Note 2) | — | — | — | — | ( | ) | — | — | ||||||||||||||||||||||||
Balance, December 31, 2018 | $ | $ | $ | ( | ) | $ | $ | $ | ( | ) | $ | $ | ||||||||||||||||||||
Net income (loss) | — | — | — | — | ( | ) | — | ( | ) | |||||||||||||||||||||||
Other comprehensive loss, net of tax | — | — | — | — | — | ( | ) | — | ( | ) | ||||||||||||||||||||||
Dividends on common stock, $3.14 per share | — | — | — | — | ( | ) | — | — | ( | ) | ||||||||||||||||||||||
Dividends on preferred stock, $3,489 per share | — | — | — | — | ( | ) | — | — | ( | ) | ||||||||||||||||||||||
Issuance of common stock, net | — | — | — | — | — | |||||||||||||||||||||||||||
Issuance of preferred stock | — | — | — | — | — | — | ||||||||||||||||||||||||||
Purchases of treasury stock | — | — | ( | ) | — | — | — | — | ( | ) | ||||||||||||||||||||||
Fair value of noncontrolling interest acquired | — | — | — | — | — | — | ||||||||||||||||||||||||||
Noncontrolling interest distributions, net | — | — | — | — | — | — | ( | ) | ( | ) | ||||||||||||||||||||||
Change in control WES | — | — | — | — | — | — | ( | ) | ( | ) | ||||||||||||||||||||||
Balance, December 31, 2019 | $ | $ | $ | ( | ) | $ | $ | $ | ( | ) | $ | $ | ||||||||||||||||||||
The accompanying notes are an integral part of these consolidated financial statements.
62 | OXY 2019 FORM 10-K |
| FINANCIAL STATEMENTS | |
Consolidated Statements of Cash Flows | Occidental Petroleum Corporation and Subsidiaries |
Years Ended December 31, | |||||||||||
millions | 2019 | 2018 | 2017 | ||||||||
CASH FLOW FROM OPERATING ACTIVITIES | |||||||||||
Net income (loss) | $ | ( | ) | $ | $ | ||||||
Adjustments to reconcile net income (loss) to net cash from operating activities: | |||||||||||
Discontinued operations, net | |||||||||||
Depreciation, depletion and amortization of assets | |||||||||||
Deferred income tax (benefit) provision | ( | ) | ( | ) | |||||||
Other noncash charges to income | |||||||||||
Asset impairments and other charges | |||||||||||
Gain on sales of equity investments and other assets, net | ( | ) | ( | ) | ( | ) | |||||
Undistributed earnings from affiliates | ( | ) | ( | ) | ( | ) | |||||
Dry hole expense | |||||||||||
Changes in operating assets and liabilities: | |||||||||||
Increase in receivables | ( | ) | ( | ) | ( | ) | |||||
Decrease (increase) in inventories | ( | ) | ( | ) | |||||||
Decrease in other current assets | |||||||||||
(Decrease) increase in accounts payable and accrued liabilities | ( | ) | |||||||||
Increase in current domestic and foreign income taxes | |||||||||||
Other operating, net | |||||||||||
Operating cash flow from continuing operations | |||||||||||
Operating cash flow from discontinued operations, net of taxes | |||||||||||
Net cash provided by operating activities | |||||||||||
CASH FLOW FROM INVESTING ACTIVITIES | |||||||||||
Capital expenditures | ( | ) | ( | ) | ( | ) | |||||
Change in capital accrual | ( | ) | |||||||||
Purchase of businesses and assets, net | ( | ) | ( | ) | ( | ) | |||||
Proceeds from sale of assets and equity investments, net | |||||||||||
Equity investments and other, net | ( | ) | ( | ) | |||||||
Investing cash flow from continuing operations | ( | ) | ( | ) | ( | ) | |||||
Investing cash flow from discontinued operations | ( | ) | |||||||||
Net cash used by investing activities | ( | ) | ( | ) | ( | ) | |||||
CASH FLOW FROM FINANCING ACTIVITIES | |||||||||||
Proceeds from long-term debt, net - Occidental | |||||||||||
Payments of long-term debt, net - Occidental | ( | ) | ( | ) | |||||||
Proceeds from long-term debt, net - WES | |||||||||||
Payments of long-term debt, net - WES | ( | ) | |||||||||
Proceeds from issuance of common and preferred stock | |||||||||||
Purchases of treasury stock | ( | ) | ( | ) | ( | ) | |||||
Cash dividends paid | ( | ) | ( | ) | ( | ) | |||||
Distributions to noncontrolling interest | ( | ) | |||||||||
Other financing, net | |||||||||||
Financing cash flow from continuing operations | ( | ) | ( | ) | |||||||
Financing cash flow from discontinued operations | ( | ) | |||||||||
Net cash provided (used) by financing activities | ( | ) | ( | ) | |||||||
Increase (decrease) in cash, cash equivalents, restricted cash and restricted cash equivalents | ( | ) | |||||||||
Cash and cash equivalents — beginning of year | |||||||||||
Cash, cash equivalents, restricted cash and restricted cash equivalents — end of year | $ | $ | $ | ||||||||
The accompanying notes are an integral part of these consolidated financial statements.
OXY 2019 FORM 10-K | 63 |
| FINANCIAL STATEMENTS FOOTNOTES | |
Notes to Consolidated Financial Statements | Occidental Petroleum Corporation and Subsidiaries |
NOTE 1 - SUMMARY OF SIGNIFICANT ACCOUNTING POLICIES |
NATURE OF OPERATIONS
In this report, “Occidental” means Occidental Petroleum Corporation, a Delaware corporation (OPC), or OPC and one or more entities in which it owns a controlling interest (subsidiaries). Occidental conducts its operations through various subsidiaries and affiliates. On August 8, 2019, pursuant to the Agreement and Plan of Merger, dated as of May 9, 2019 (the Merger Agreement), among Occidental, Baseball Merger Sub 1, Inc., a Delaware corporation and an indirect, wholly owned subsidiary of Occidental (Merger Subsidiary), and Anadarko Petroleum Corporation (Anadarko), Occidental acquired all of the outstanding shares of Anadarko through a transaction in which Merger Subsidiary merged with and into Anadarko (the Acquisition), with Anadarko continuing as the surviving entity and as an indirect, wholly owned subsidiary of Occidental. See Note 3 - The Acquisition.
Occidental’s principal businesses consist of three reporting segments: oil and gas, chemical and marketing and midstream. The oil and gas segment explores for, develops and produces oil and condensate, natural gas liquids (NGL) and natural gas. The chemical segment (OxyChem) mainly manufactures and markets basic chemicals and vinyls. The marketing and midstream segment purchases, markets, gathers, processes, transports and stores oil, condensate, NGL, natural gas, carbon dioxide (CO2) and power. It also trades around its assets, including transportation and storage capacity, and invests in entities that conduct similar activities. Included in the marketing and midstream segment is Occidental’s equity method investment in Western Midstream Partners, L.P. (WES). WES owns gathering systems, plants and pipelines and earns revenue from fee-based and service-based contracts with Occidental and third parties. Also within the marketing and midstream segment is Oxy Low Carbon Ventures (OLCV). OLCV seeks to capitalize on Occidental’s enhanced oil recovery (EOR) leadership by developing carbon capture, utilization and storage projects that source anthropogenic CO2 and promote innovative technologies that drive cost efficiencies and economically grow Occidental’s business while reducing emissions.
PRINCIPLES OF CONSOLIDATION
The consolidated financial statements have been prepared in conformity with United States Generally Accepted Accounting Principles (GAAP) and include the accounts of OPC, its subsidiaries, variable interest entities (VIE) for which Occidental is the primary beneficiary, and its undivided interests in oil and gas exploration and production ventures. Occidental accounts for its share of oil and gas exploration and production ventures, in which it has a direct working interest, by reporting its proportionate share of assets, liabilities, revenues, costs and cash flows within the relevant lines on the balance sheets, statements of operations and statements of cash flows.
WES INVESTMENT
WES is a publicly traded limited partnership with its common units traded on the New York Stock Exchange (NYSE) under the ticker symbol “WES.” WES owns the entire non-economic general partner interest and a 98 % limited partner interest in Western Midstream Operating, LP (WES Operating), a Delaware limited partnership formed by Anadarko in 2007 to acquire, own, develop and operate midstream assets. WES maintains its own capital structure that is separate from Occidental, consisting of its own debt instruments and publicly traded common units.
From the Acquisition date through December 31, 2019, WES was determined to be a VIE, and Occidental, through its ownership of the general partner interest in WES, had the power to direct the activities that significantly affected the economic performance of WES and the obligation to absorb losses or the right to receive benefits that could be significant to WES. As such, Occidental was considered the primary beneficiary and consolidated WES and its consolidated subsidiaries from the date of the Acquisition to December 31, 2019. All intercompany transactions were eliminated during the consolidated period. Revenues of $1.1 billion, cost of sales of $500 million and operating cash flows of $498 million from the date of the Acquisition to December 31, 2019 are attributable to WES and are included in Occidental’s consolidated financial statements. Net income from noncontrolling interest for the same period relates to the 44.6 % limited partner interest of WES owned by the public.
64 | OXY 2019 FORM 10-K |
| FINANCIAL STATEMENTS FOOTNOTES | |
On December 31, 2019, Occidental and WES executed several agreements to allow WES to operate as an independent midstream company to support its ongoing pursuit of third-party growth opportunities. The executed agreements include amendments to the partnership agreement that significantly expand the unaffiliated limited partner unitholders’ rights. The significant amendments to the partnership agreement included:
Ø Providing for a simple majority of the unaffiliated unitholders to remove and elect a new general partner;
Ø Allowing for 20 % of the unaffiliated unitholders to call a special meeting to vote to remove the general partner;
Ø Eliminating ownership thresholds that could have prevented unaffiliated unitholders from voting;
Ø Limiting Occidental’s voting percentage to 45 % for certain unitholder matters until Occidental owns less than 40 % of the limited partner units for twelve consecutive months; and
Ø Transferring 2 % of Occidental’s limited partner interest to the general partner to provide a 2 % economic interest to the general partner.
In addition to the partnership agreement amendments, in December 2019, the WES management team’s employment was transferred from Occidental to WES, and WES-dedicated personnel were seconded to WES from Occidental. The seconded employees’ employment is contractually obligated to be transferred to WES during 2020 once employee benefit plans are established. Additionally, as of December 31, 2019, Occidental employees no longer comprise a majority of the board of directors of WES’s general partner.
As a result of the partnership agreement amendments and other related agreements, WES no longer met the criteria to be considered a VIE. Accordingly, Occidental evaluated WES under the voting interest model and determined, because Occidental did not control the power to appoint or remove a successor general partner, it should no longer consolidate WES.
As a result of the loss of control, Occidental derecognized all assets, liabilities, and noncontrolling interest that were previously consolidated. Occidental recognized, at fair value, an equity method investment of $5.1 billion based on the closing market price of WES as of December 31, 2019 and recognized a loss of approximately $1 billion that is included in asset impairments and other charges on the Statement of Operations. In future periods, Occidental will recognize equity method earnings and dividends received for its economic interest in WES.
As of December 31, 2019, Occidental has a 55.4 % unit ownership in WES, which consists of a 2 % non-voting general partner unit interest and 54.5 % of limited partner unit interest. In addition, Occidental has a 2 % non-voting limited partner interest in WES Operating, which brings Occidental’s total effective economic interest in WES and its subsidiaries to 56.3 %. During 2020, Occidental intends to reduce its limited partner ownership interest in WES to below 50%. Occidental’s historical pro rata interest in the net assets of WES was $1.9 billion, resulting in a basis difference of $3.2 billion primarily associated with WES’s equity method investments, PP&E, equity method goodwill and intangible assets - customer relationships and subject to amortization over their estimated average useful life.
INVESTMENTS IN UNCONSOLIDATED ENTITIES
DISCONTINUED OPERATIONS
In connection with the Acquisition, Occidental agreed to sell to TOTAL S.A. (Total) all of the assets, liabilities, businesses, and operations of Anadarko’s operations in Algeria, Ghana, Mozambique and South Africa (collectively, the Africa Assets) for $8.8 billion, subject to certain purchase price adjustments. In August 2019, a purchase and sale agreement was executed for these Africa Assets. This transaction is conditioned on the receipt of required regulatory approvals, as well as other customary closing conditions. In September 2019, Occidental completed the sale of Mozambique LNG assets to Total for $4.2 billion. The assets and liabilities for Algeria, Ghana and South Africa are presented as held for sale at December 31, 2019. The results of operations of the Africa Assets are presented as discontinued operations, see Note 4 - Acquisitions, Dispositions and Other Transactions. In January 2020, Occidental completed the sale of South Africa assets to Total.
Unless otherwise indicated, information presented in the Notes to the Consolidated Financial Statements relates only to Occidental’s continuing operations. Information related to discontinued operations is included in Note 4 - Acquisitions, Dispositions and Other Transactions, and in some instances, where appropriate, is included as a separate disclosure within the individual Notes to the Consolidated Financial Statements.
OXY 2019 FORM 10-K | 65 |
| FINANCIAL STATEMENTS FOOTNOTES | |
RISKS AND UNCERTAINTIES
The process of preparing consolidated financial statements in conformity with GAAP requires Occidental’s management to make informed estimates and judgments regarding certain types of financial statement balances and disclosures. Such estimates primarily relate to unsettled transactions and events as of the date of the consolidated financial statements and judgments on expected outcomes as well as the materiality of transactions and balances. Changes in facts and circumstances or discovery of new information relating to such transactions and events may result in revised estimates and judgments and actual results may differ from estimates upon settlement. Management believes that these estimates and judgments provide a reasonable basis for the fair presentation of Occidental’s financial statements. Occidental establishes a valuation allowance against net operating losses and other deferred tax assets to the extent it believes the future benefit from these assets will not be realized in the statutory carryforward periods. Realization of deferred tax assets is dependent upon Occidental generating sufficient future taxable income and reversal of temporary differences in jurisdictions where such assets originate.
The accompanying consolidated financial statements include assets of approximately $14.9 billion as of December 31, 2019, and net sales of approximately $4.6 billion for the year ended December 31, 2019, relating to Occidental’s operations in countries outside North America. Occidental operates some of its oil and gas business in countries that have experienced political instability, nationalizations, corruption, armed conflict, terrorism, insurgency, civil unrest, security problems, labor unrest, OPEC production restrictions, equipment import restrictions and sanctions, all of which increase Occidental’s risk of loss, delayed or restricted production or may result in other adverse consequences. Occidental attempts to conduct its affairs so as to mitigate its exposure to such risks and would seek compensation in the event of nationalization.
CASH EQUIVALENTS AND RESTRICTED CASH EQUIVALENTS
Occidental considers all highly liquid investments with a maturity of three months or less when purchased to be cash equivalents or restricted cash equivalents. The cash equivalents and restricted cash equivalents balance at December 31, 2019, included investments in government money market funds in which the carrying value approximates fair value.
The following table provides a reconciliation of cash, cash equivalents, restricted cash and restricted cash equivalents as reported at the end of the period in the Consolidated Statements of Cash Flows for the twelve months ended December 31, 2019 to the line items within the Consolidated Balance Sheet at December 31, 2019. There was no restricted cash or restricted cash equivalents at December 31, 2018.
millions | December 31, 2019 | |||
Cash and cash equivalents | $ | |||
Restricted cash and restricted cash equivalents | ||||
Cash and restricted cash included in assets held for sale | ||||
Restricted cash and restricted cash equivalents included in long-term receivables and other assets, net | ||||
Cash, cash equivalents, restricted cash, and restricted cash equivalents | $ | |||
RECEIVABLES AND OTHER CURRENT ASSETS
Trade receivables, net, of $6.4 billion and $4.9 billion at December 31, 2019, and 2018, respectively, represent rights to payment for which Occidental has satisfied its obligations under a contract with a customer and its right to payment is conditioned only on the passage of time.
Other current assets included amounts receivable from working interest partners in Occidental’s oil and gas operations, derivative assets, and taxes receivable.
66 | OXY 2019 FORM 10-K |
| FINANCIAL STATEMENTS FOOTNOTES | |
INVENTORIES
Materials and supplies are valued at weighted-average cost and are reviewed periodically for obsolescence. Oil, NGL and natural gas inventories are valued at the lower of cost or market.
For the chemical segment, Occidental’s finished goods inventories are valued at the lower of cost or market. For most of its domestic inventories, other than materials and supplies, the chemical segment uses the last-in, first-out (LIFO) method as it better matches current costs and current revenue. For other countries, Occidental uses the first-in, first-out method (if the costs of goods are specifically identifiable) or the average-cost method (if the costs of goods are not specifically identifiable).
PROPERTY, PLANT AND EQUIPMENT
OIL AND GAS
The carrying value of Occidental’s property, plant and equipment (PP&E) represents the cost incurred to acquire or develop the asset, including any asset retirement obligations and capitalized interest, net of accumulated depreciation, depletion and amortization (DD&A) and any impairment charges. For assets acquired, PP&E cost is based on fair values at the acquisition date. Asset retirement obligations and interest costs incurred in connection with qualifying capital expenditures are capitalized and amortized over the lives of the related assets.
Occidental uses the successful efforts method to account for its oil and gas properties. Under this method, Occidental capitalizes costs of acquiring properties, costs of drilling successful exploration wells and development costs. The costs of exploratory wells are initially capitalized pending a determination of whether proved reserves have been found. If proved reserves have been found, the costs of exploratory wells remain capitalized. For exploratory wells that find reserves that cannot be classified as proved when drilling is completed, costs continue to be capitalized as suspended exploratory drilling costs if there have been sufficient reserves found to justify completion as a producing well and sufficient progress is being made in assessing the reserves and the economic and operating viability of the project. At the end of each quarter, management reviews the status of all suspended exploratory drilling costs in light of ongoing exploration activities, in particular, whether Occidental is making sufficient progress in its ongoing exploration and appraisal efforts or, in the case of discoveries requiring government sanctioning, analyzing whether development negotiations are underway and proceeding as planned. If management determines that future appraisal drilling or development activities are unlikely to occur, associated suspended exploratory well costs are expensed.
millions | 2019 | 2018 | 2017 | |||||||||
Balance — beginning of year | $ | $ | $ | |||||||||
Exploratory well costs acquired through the Acquisition | ||||||||||||
Additions to capitalized exploratory well costs pending the determination of proved reserves | ||||||||||||
Reclassifications to property, plant and equipment based on the determination of proved reserves | ( | ) | ( | ) | ( | ) | ||||||
Capitalized exploratory well costs charged to expense | ( | ) | ( | ) | ( | ) | ||||||
Balance — end of year | $ | $ | $ | |||||||||
Occidental expenses annual lease rentals, the costs of injectants used in production and geological, geophysical and seismic costs as incurred.
Occidental determines depreciation and depletion of oil and gas producing properties by the unit-of-production method. It amortizes leasehold costs over total proved reserves, and capitalized development and successful exploration costs over proved developed reserves.
Proved oil and gas reserves are those quantities of oil and gas which, by analysis of geoscience and engineering data, can be estimated with reasonable certainty to be economically producible-from a given date forward, from known reservoirs, and under existing economic conditions, operating methods, and government regulations-prior to the time at which contracts providing the right to operate expire, unless evidence indicates that renewal is reasonably certain, regardless of whether deterministic or probabilistic methods are used for the estimation.
OXY 2019 FORM 10-K | 67 |
| FINANCIAL STATEMENTS FOOTNOTES | |
Occidental performs impairment tests with respect to its proved properties whenever events or circumstances indicate that the carrying value of property may not be recoverable. If there is an indication the carrying amount of the asset may not be recovered due to prolonged declines in current and forward prices, significant changes in reserve estimates, changes in management’s plans, or other significant events, management will evaluate the property for impairment. Under the successful efforts method, if the sum of the undiscounted cash flows is less than the carrying value of the proved property, the carrying value is reduced to estimated fair value and reported as an impairment charge in the period. Individual proved properties are grouped for impairment purposes at the lowest level for which there are identifiable cash flows. The fair value of impaired assets is typically determined based on the present value of expected future cash flows using discount rates believed to be consistent with those used by market participants. The impairment test incorporates a number of assumptions involving expectations of future cash flows which can change significantly over time. These assumptions include future production and timing of production, estimates of future product prices, contractual prices, estimates of risk-adjusted oil and gas reserves and estimates of future operating and development costs. See Note 17 - Fair Value Measurements and below for further discussion of asset impairments.
A portion of the carrying value of Occidental’s oil and gas properties is attributable to unproved properties. Net capitalized costs attributable to unproved properties were $29.5 billion at December 31, 2019 and $1.0 billion December 31, 2018. The unproved amounts are not subject to DD&A until they are classified as proved properties. Individually insignificant unproved properties are combined and amortized on a group basis based on factors such as lease terms, success rates, and other factors. If the exploration efforts are unsuccessful, or management decides not to pursue development of these properties as a result of lower commodity prices, higher development and operating costs, contractual conditions or other factors, the capitalized costs of the related properties would be expensed. The timing of any writedowns of these unproved properties, if warranted, depends upon management’s plans, the nature, timing and extent of future exploration and development activities and their results. Occidental periodically reviews unproved properties for impairments; numerous factors are considered, including but not limited to, current exploration plans, favorable or unfavorable exploration activity on the property or the adjacent property, geologists’ evaluation of the property and the remaining lease term for the property. Management’s assessment of the availability of funds for future activities and the current and projected political and regulatory climate in areas in which Occidental operates also impacts the timing of any impairment.
CHEMICAL
Occidental’s chemical assets are depreciated using either the unit-of-production or the straight-line method, based upon the estimated useful lives of the facilities. The estimated useful lives of Occidental’s chemical assets, which range from three years to 50 years, are also used for impairment tests. The estimated useful lives for the chemical facilities are based on the assumption that Occidental will provide an appropriate level of annual expenditures to ensure productive capacity is sustained. Such expenditures consist of ongoing routine repairs and maintenance, as well as planned major maintenance activities (PMMA). Ongoing routine repairs and maintenance expenditures are expensed as incurred. PMMA costs are capitalized and amortized over the period until the next planned overhaul. Additionally, Occidental incurs capital expenditures that extend the remaining useful lives of existing assets, increase their capacity or operating efficiency beyond the original specification or add value through modification for a different use. These capital expenditures are not considered in the initial determination of the useful lives of these assets at the time they are placed into service. The resulting revision, if any, of the asset’s estimated useful life is measured and accounted for prospectively.
Without these continued expenditures, the useful lives of these assets could decrease significantly. Other factors that could change the estimated useful lives of Occidental’s chemical assets include sustained higher or lower product prices, which are affected by domestic and international competition, demand, feedstock costs, energy prices, environmental regulations and technological changes.
Occidental performs impairment tests on its chemical assets whenever events or changes in circumstances lead to a reduction in the estimated useful lives or estimated future cash flows that would indicate that the carrying amount may not be recoverable, or when management’s plans change with respect to those assets. Any impairment loss would be calculated as the excess of the asset’s net book value over its estimated fair value.
MARKETING AND MIDSTREAM
Occidental’s marketing and midstream PP&E is depreciated over the estimated useful lives of the assets, using either the unit-of-production or straight-line method.
Occidental performs impairment tests on its marketing and midstream assets whenever events or changes in circumstances lead to a reduction in the estimated useful lives or estimated future cash flows that would indicate that the carrying amount may not be recoverable, or when management’s plans change with respect to those assets. Any impairment loss would be calculated as the excess of the asset’s net book value over its estimated fair value.
68 | OXY 2019 FORM 10-K |
| FINANCIAL STATEMENTS FOOTNOTES | |
GOODWILL
Occidental recognized goodwill of $5.8 billion associated with the Acquisition. The goodwill was based on WES’s publicly traded units and was primarily associated with the relationship between Occidental and WES as well as Occidental’s tax basis in WES. Upon loss of control and application of the equity method of accounting, $4.6 billion of goodwill was derecognized. The remaining $1.2 billion in goodwill is assigned to the marketing and midstream segment and is attributable to the deferred tax liability associated with the investment in WES.
Goodwill is subject to annual impairment testing every October. Occidental’s goodwill impairment test first assesses qualitative factors to determine whether goodwill is likely impaired. If the qualitative assessment indicates that it is more likely than not that the fair value of a reporting unit is less than its carrying amount including goodwill, Occidental will then perform a quantitative goodwill impairment test. Changes in goodwill may result from, among other things, impairments, future acquisitions, or future divestitures.
IMPAIRMENTS AND OTHER CHARGES
During 2019, Occidental’s Oil and Gas segment recognized pre-tax impairment and related charges of $285 million related to domestic undeveloped leases that were set to expire in the near term, where Occidental had no plans to pursue exploration activities, and $39 million related to Occidental’s mutually agreed early termination of its Qatar Idd El Shargi South Dome (ISSD) contract.
During 2018, Occidental recognized pre-tax impairment and related charges of $416 million related to Qatar Idd El Shargi North Dome (ISND) and ISSD proved properties and inventory. The fair value of the proved properties was measured based on the income approach, which incorporated a number of assumptions involving expectations of future cash flows. These assumptions included estimates of future product prices, which Occidental based on forward price curves, estimates of oil and gas reserves, estimates of future expected operating and capital costs and a risk-adjusted discount rate of 10%. These inputs are categorized as Level 3 in the fair-value hierarchy.
Also in 2018, the marketing and midstream segment incurred approximately $100 million of charges primarily for lower of cost or market adjustments on its crude inventory and line fill.
In 2017, Occidental recorded net impairment and related charges of $397 million related to proved and unproved non-core Permian acreage and $120 million related to idled marketing and midstream facilities.
FAIR VALUE MEASUREMENTS
Occidental has categorized its assets and liabilities that are measured at fair value in a three-level fair value hierarchy, based on the inputs to the valuation techniques: Level 1 – using quoted prices in active markets for the assets or liabilities; Level 2 – using observable inputs other than quoted prices for the assets or liabilities; and Level 3 – using unobservable inputs. Transfers between levels, if any, are reported at the end of each reporting period.
FAIR VALUES - RECURRING
Occidental primarily applies the market approach for recurring fair value measurements, maximizes its use of observable inputs and minimizes its use of unobservable inputs. Occidental utilizes the mid-point between bid and ask prices for valuing the majority of its assets and liabilities measured and reported at fair value. In addition to using market data, Occidental makes assumptions in valuing its assets and liabilities, including assumptions about the risks inherent in the inputs to the valuation technique. For assets and liabilities carried at fair value, Occidental measures fair value using the following methods:
Ø | Occidental values exchange-cleared commodity derivatives using closing prices provided by the exchange as of the balance sheet date. These derivatives are classified as Level 1. |
Ø | Over-the-Counter (OTC) bilateral financial commodity contracts, foreign exchange contracts, interest rate swaps, warrants, options and physical commodity forward purchase and sale contracts are generally classified as Level 2 and are generally valued using quotations provided by brokers or industry-standard models that consider various inputs, including quoted forward prices for commodities, time value, volatility factors, credit risk and current market and contractual prices for the underlying instruments, as well as other relevant economic measures. Substantially all of these inputs are observable in the marketplace throughout the full term of the instrument, and can be derived from observable data or are supported by observable prices at which transactions are executed in the marketplace. |
Ø | Occidental values commodity derivatives based on a market approach that considers various assumptions, including quoted forward commodity prices and market yield curves. The assumptions used include inputs that are generally unobservable in the marketplace or are observable but have been adjusted based upon various assumptions and the fair value is designated as Level 3 within the valuation hierarchy. |
Ø | Occidental values debt using market-observable information for debt instruments that are traded on secondary markets. For debt instruments that are not traded, the fair value is determined by interpolating the value based on debt with similar terms and credit risk. |
OXY 2019 FORM 10-K | 69 |
| FINANCIAL STATEMENTS FOOTNOTES | |
NON-FINANCIAL ASSETS
Occidental uses market-observable prices for assets when comparable transactions can be identified that are similar to the asset being valued. When Occidental is required to measure fair value and there is not a market-observable price for the asset or for a similar asset then the cost or income approach is used depending on the quality of information available to support management’s assumptions. The cost approach is based on management’s best estimate of the current asset replacement cost. The income approach is based on management’s best assumptions regarding expectations of future net cash flows, and the expected cash flows are discounted using a commensurate risk-adjusted discount rate. Such evaluations involve significant judgment, and the results are based on expected future events or conditions such as sales prices, estimates of future oil and gas production or throughput, development and operating costs and the timing thereof, economic and regulatory climates, and other factors, most of which are often outside of management’s control. However, assumptions used reflect a market participant’s view of long-term prices, costs, and other factors and are consistent with assumptions used in the Company’s business plans and investment decisions.
ACCRUED LIABILITIES - CURRENT
ENVIRONMENTAL LIABILITIES AND EXPENDITURES
Environmental expenditures that relate to current operations are expensed or capitalized as appropriate. Occidental records environmental liabilities and related charges and expenses for estimated remediation costs that relate to existing conditions from past operations when environmental remediation efforts are probable and the costs can be reasonably estimated. In determining the environmental remediation liability and the range of reasonably possible additional losses, Occidental refers to currently available information, including relevant past experience, remedial objectives, available technologies, applicable laws and regulations and cost-sharing arrangements. Occidental bases its environmental remediation liabilities on management’s estimate of the most likely cost to be incurred, using the most cost-effective technology reasonably expected to achieve the remedial objective. Occidental periodically reviews its environmental remediation liabilities and adjusts them as new information becomes available. Occidental records environmental remediation liabilities on a discounted basis when it deems the aggregate amount and timing of cash payments to be reliably determinable at the time the reserves are established. The reserve methodology with respect to discounting for a specific site is not modified once it is established. Presently none of its environmental remediation liabilities are recorded on a discounted basis. Occidental generally records reimbursements or recoveries of environmental remediation costs in income when received, or when receipt of recovery is highly probable.
Many factors could affect Occidental’s future remediation costs and result in adjustments to its environmental remediation liabilities and the range of reasonably possible additional losses. The most significant are: (1) cost estimates for remedial activities may vary from the initial estimate; (2) the length of time, type or amount of remediation necessary to achieve the remedial objective may change due to factors such as site conditions, the ability to identify and control contaminant sources or the discovery of additional contamination; (3) a regulatory agency may ultimately reject or modify Occidental’s proposed remedial plan; (4) improved or alternative remediation technologies may change remediation costs; (5) laws and regulations may change remediation requirements or affect cost sharing or allocation of liability; and (6) changes in allocation or cost-sharing arrangements may occur.
Certain sites involve multiple parties with various cost-sharing arrangements, which fall into the following three categories: (1) environmental proceedings that result in a negotiated or prescribed allocation of remediation costs among Occidental and other alleged potentially responsible parties; (2) oil and gas ventures in which each participant pays its proportionate share of remediation costs reflecting its working interest; or (3) contractual arrangements, typically relating to purchases and sales of properties, in which the parties to the transaction agree to methods of allocating remediation costs. In these circumstances, Occidental evaluates the financial viability of other parties with whom it is alleged to be jointly liable, the degree of their commitment to participate and the consequences to Occidental of their failure to participate when estimating Occidental’s ultimate share of liability. Occidental records its environmental remediation liabilities at its expected net cost of remedial activities and, based on these factors, believes that it will not be required to assume a share of liability of such other potentially responsible parties in an amount materially above amounts reserved.
70 | OXY 2019 FORM 10-K |
| FINANCIAL STATEMENTS FOOTNOTES | |
ASSET RETIREMENT OBLIGATIONS
Occidental recognizes the fair value of asset retirement obligations in the period in which a determination is made that a legal obligation exists to dismantle an asset and reclaim or remediate the property at the end of its useful life and the cost of the obligation can be reasonably estimated. The liability amounts are based on future retirement cost estimates and incorporate many assumptions such as time to abandonment, future inflation rates and the risk-adjusted discount rate. When the liability is initially recorded, Occidental capitalizes the cost by increasing the related PP&E balances. If the estimated future cost of the asset retirement obligations changes, Occidental records an adjustment to both the asset retirement obligations and PP&E. Over time, the liability is increased and expense is recognized for accretion, and the capitalized cost is depreciated over the useful life of the asset.
The majority of Occidental’s asset retirement obligations relate to the plugging of wells and the related abandonment of oil and gas properties. Revisions in estimated liabilities during the period primarily relate to liabilities acquired in the Acquisition and include, but are not limited to, changes in estimates of asset retirement costs, revisions of estimated inflation rates, changes in property lives, and the expected timing of settlements.
At a certain number of its facilities, Occidental has identified conditional asset retirement obligations that are related mainly to plant decommissioning. Occidental does not know or cannot estimate when it may settle these obligations. Therefore, Occidental cannot reasonably estimate the fair value of these liabilities. Occidental will recognize these conditional asset retirement obligations in the periods in which sufficient information becomes available to reasonably estimate their fair values.
The following table summarizes the activity of asset retirement obligations for the years ended December 31,:
millions | 2019 | 2018 | ||||||
Beginning balance | $ | $ | ||||||
Liabilities assumed in the Acquisition | ||||||||
Liabilities incurred – capitalized to PP&E | ||||||||
Liabilities settled and paid | ( | ) | ( | ) | ||||
Accretion expense | ||||||||
Acquisitions, dispositions and other | ( | ) | ||||||
WES loss of control | ( | ) | ||||||
Revisions to previous estimates | ||||||||
Ending balance (a) | $ | $ | ||||||
(a) | The ending balance included $ |
DERIVATIVE INSTRUMENTS
Derivatives are carried at fair value and on a net basis when a legal right of offset exists with the same counterparty. Occidental applies hedge accounting when transactions meet specified criteria for cash-flow hedge treatment and management elects and documents such treatment. Otherwise, any fair value gains or losses are recognized in earnings in the current period. For cash-flow hedges, the gain or loss on the effective portion of the derivative is reported as a component of other comprehensive income (OCI) with an offsetting adjustment to the carrying value of the item being hedged. Realized gains or losses from cash-flow hedges, and any ineffective portion, are recorded as a component of net sales in the consolidated statements of operations. Ineffectiveness is primarily created by a lack of correlation between the hedged item and the hedging instrument due to location, quality, grade or changes in the expected quantity of the hedged item. Gains and losses from derivative instruments are reported net in the consolidated statements of operations. There were no fair value hedges as of and during the years ended December 31, 2019, 2018 and 2017.
A hedge is regarded as highly effective such that it qualifies for hedge accounting if, at inception and throughout its life, it is expected that changes in the fair value or cash flows of the hedged item will be offset by 80 % to 125 % of the changes in the fair value or cash flows, respectively, of the hedging instrument. In the case of hedging a forecast transaction, the transaction must be probable and must present an exposure to variations in cash flows that could ultimately affect reported net income or loss. Occidental discontinues hedge accounting when it determines that a derivative has ceased to be highly effective as a hedge; when the hedged item matures or is sold or repaid; or when a forecast transaction is no longer deemed probable.
OXY 2019 FORM 10-K | 71 |
| FINANCIAL STATEMENTS FOOTNOTES | |
STOCK-BASED INCENTIVE PLANS
Occidental has established several stockholder-approved stock-based incentive plans for certain employees and directors (Plans) that are more fully described in Note 14 - Stock-Based Incentive Plans. A summary of Occidental’s accounting policy for awards issued under the Plans is as follows.
For cash- and stock-settled restricted stock units or incentive award shares (RSU), cash return on capital employed incentive awards (CROCEI), return on capital employed incentive awards (ROCEI) and return on assets incentive awards (ROAI), compensation value is initially measured on the grant date using the quoted market price of Occidental’s common stock and the estimated payout at the grant date. For total shareholder return incentive awards (TSRI), compensation value is initially measured on the grant date using estimated payout levels derived from a Monte Carlo valuation model. Compensation expense for RSUs, CROCEIs, ROCEIs, ROAIs and TSRIs is recognized on a straight-line basis over the requisite service periods, which is generally over the awards’ respective vesting or performance periods. Dividends accrued on unvested awards are adjusted quarterly for any changes in the number of share equivalents expected to be paid based on the relevant performance and market criteria, if applicable. All such performance or stock-price-related changes are recognized in periodic compensation expense. The stock-settled portion of these awards is expensed using the initially measured compensation value. The liability resulting from the cash settled portion of these awards and accrued dividends are remeasured at each reporting period.
EARNINGS PER SHARE
Occidental’s instruments containing rights to nonforfeitable dividends granted in stock-based awards are considered participating securities prior to vesting and, therefore, have been deducted from earnings in computing basic and diluted EPS under the two-class method.
Basic EPS was computed by dividing net income attributable to common stock, net of income allocated to participating securities, by the weighted-average number of common shares outstanding during each period, including vested but unissued shares and share units. The computation of diluted EPS reflects the additional dilutive effect of stock options and unvested stock awards.
RETIREMENT AND POSTRETIREMENT BENEFIT PLANS
Occidental recognizes the overfunded or underfunded amounts of its defined benefit pension and postretirement plans, which are more fully described in Note 15 - Retirement and Postretirement Benefit Plans, in its financial statements using a December 31 measurement date.
Occidental’s defined benefit pension and postretirement benefit plan obligations are actuarially determined based on various assumptions and discount rates. The discount rate assumptions used are meant to reflect the interest rate at which the obligations could effectively be settled on the measurement date. Occidental estimates the rate of return on assets with regard to current market factors but within the context of historical returns. Occidental funds and expenses negotiated pension increases for domestic union employees over the terms of the applicable collective bargaining agreements.
Pension and any postretirement plan assets are measured at fair value. Common stock, preferred stock, publicly registered mutual funds, U.S. government securities and corporate bonds are valued using quoted market prices in active markets when available. When quoted market prices are not available, these investments are valued using pricing models with observable inputs from both active and non-active markets. Common and collective trusts are valued at the fund units’ net asset value (NAV) provided by the issuer, which represents the quoted price in a non-active market. Short-term investment funds are valued at the fund units’ NAV provided by the issuer.
SUPPLEMENTAL CASH FLOW INFORMATION
Occidental paid U.S. federal, state and foreign income taxes for continuing operations of approximately $1.7 billion, $1.1 billion and $0.8 billion during the years ended December 31, 2019, 2018 and 2017, respectively. Occidental received refunds of $79 million, $82 million and $768 million during the years ended December 31, 2019, 2018, and 2017, respectively. Occidental also paid production, property and other taxes of approximately $725 million, $505 million and $375 million during the years ended December 31, 2019, 2018 and 2017, respectively, substantially all of which was in the United States. Interest paid totaled $911 million, $383 million and $351 million, net of capitalized interest of $85 million, $46 million and $52 million, for the years 2019, 2018 and 2017, respectively.
72 | OXY 2019 FORM 10-K |
| FINANCIAL STATEMENTS FOOTNOTES | |
FOREIGN CURRENCY TRANSACTIONS
The functional currency applicable to all of Occidental’s international oil and gas operations is the U.S. dollar since cash flows are denominated principally in U.S. dollars. In Occidental’s other operations, Occidental’s use of non-United States dollar functional currencies was not material for all years presented. The effect of exchange rates on transactions in foreign currencies is included in periodic income. Occidental reports the exchange rate differences arising from translating foreign-currency-denominated balance sheet accounts to the United States dollar as of the reporting date in other comprehensive income. Exchange-rate gains and losses for continuing operations were not material for all years presented.
INCOME TAXES
OTHER LOSS CONTINGENCIES
Occidental or certain of its subsidiaries are involved, in the normal course of business, in lawsuits, claims and other legal proceedings that seek, among other things, compensation for alleged personal injury, breach of contract, property damage or other losses, punitive damages, civil penalties, or injunctive or declaratory relief. Occidental or certain of its subsidiaries also are involved in proceedings under CERCLA and similar federal, state, local and international environmental laws. These environmental proceedings seek funding or performance of remediation and, in some cases, compensation for alleged property damage, punitive damages, civil penalties and injunctive relief. Usually Occidental or such subsidiaries are among many companies in these environmental proceedings and have to date been successful in sharing response costs with other financially sound companies. Further, some lawsuits, claims and legal proceedings involve acquired or disposed assets with respect to which a third-party or Occidental retains liability or indemnifies the other party for conditions that existed prior to the transaction.
NOTE 2 - ACCOUNTING AND DISCLOSURE CHANGES |
RECENTLY ADOPTED ACCOUNTING AND DISCLOSURE CHANGES
In January 2019, Occidental adopted the new lease standard Accounting Standards Codification Topic 842 - Leases (ASC 842). The new standard requires Occidental to recognize most leases, including operating leases, on the balance sheet. The new rules require lessees to recognize a right-of-use (ROU) asset and lease liability for all leases with lease terms of more than 12 months. Occidental adopted the standard using the modified retrospective approach, including adopting several optional practical expedients. See Note 8 - Lease Commitments.
In February 2018, the Financial Accounting Standards Board (FASB) released standards that allow the reclassification from accumulated other comprehensive income to retained earnings of stranded tax effects resulting from changes to U.S. federal tax law from the 2017 Tax Cuts and Jobs Act (Tax Reform) enacted in December 2017. Occidental early adopted this standard in the first quarter of 2018, resulting in the reclassification of $58 million in stranded tax effects from accumulated other comprehensive income (AOCI) to retained earnings.
In January 2018, Occidental adopted the new revenue recognition standard Topic 606 - Revenue from Contracts with Customers and related updates (ASC 606). The new standard requires more detailed disclosures related to the nature, amount, timing and uncertainty of revenue and cash flows arising from contracts with customers. Occidental adopted the standard using the modified retrospective method. The cumulative-effect adjustment to retained earnings upon adoption was not material. See Note 5 - Revenue.
In January 2017, FASB issued new guidance clarifying the definition of a business under the topic Business Combinations. The rules became effective in the first quarter of 2018, and did not have a material impact to Occidental’s financial statements upon adoption.
OXY 2019 FORM 10-K | 73 |
| FINANCIAL STATEMENTS FOOTNOTES | |
NOTE 3 - THE ACQUISITION |
On May 9, 2019, Occidental entered into the Acquisition Agreement with Anadarko. On August 8, 2019, Anadarko’s stockholders voted to approve the Acquisition and it was made effective the same day. The Acquisition added to Occidental’s oil and gas portfolio, primarily in the Permian Basin, DJ Basin and Gulf of Mexico, and a controlling interest in WES.
In exchange for each share of Anadarko common stock, Anadarko stockholders received $59.00 in cash and 0.2934 of a share of Occidental common stock, plus cash in lieu of any fractional share of Occidental common stock that otherwise would have been issued, based on the average price of $46.31 per share of Occidental common stock on the NYSE on August 8, 2019.
In connection with the Acquisition, Occidental issued $13.0 billion of new senior unsecured notes, $8.8 billion of term loans (the Term Loans) and 100,000 shares of series A preferred stock (the Preferred Stock) with a warrant to purchase 80 million shares of Occidental common stock at an exercise price of $62.50 (the Warrant) for $10 billion. In addition, Occidental increased its existing $3.0 billion revolving credit facility by an additional $2.0 billion in commitments. See Note 7 - Long-term Debt and Note 13 - Stockholders’ Equity for additional information.
The Acquisition constitutes a business combination and was accounted for using the acquisition method of accounting. The following table presents the Acquisition consideration paid to Anadarko stockholders as a result of the Acquisition:
millions except per-share amounts | As of August 8, 2019 | |||
Total shares of Anadarko common stock eligible for Acquisition consideration | ||||
Cash consideration (per share of common stock and shares underlying Anadarko stock-based awards eligible for Acquisition consideration) | $ | |||
Cash portion of Acquisition consideration | $ | |||
Total shares of Anadarko common stock eligible for Acquisition consideration | ||||
Exchange ratio (per share of Anadarko common stock) | ||||
Total shares of Occidental common stock issued to Anadarko stockholders | ||||
Average share price of Occidental common stock at August 8, 2019 | $ | |||
Stock portion of Acquisition consideration | $ | |||
Acquisition consideration attributable to Anadarko stock-based awards | $ | |||
Total Acquisition consideration | $ | |||
74 | OXY 2019 FORM 10-K |
| FINANCIAL STATEMENTS FOOTNOTES | |
The following table sets forth the preliminary allocation of the Acquisition consideration. Certain data necessary to complete the purchase price allocation is not yet available, including, but not limited to, final appraisals of certain assets acquired and liabilities assumed, valuation of pre-Acquisition contingencies and final tax returns that provide underlying tax basis of assets acquired and liabilities assumed. Occidental will finalize the purchase price allocation during the 12-month period following the Acquisition date, during which time the value of the assets and liabilities may be revised as appropriate.
millions | As of August 8, 2019 | |||
Fair value of assets acquired: | ||||
Current assets | $ | |||
Africa Assets held for sale | ||||
Investments in unconsolidated entities | ||||
Property, plant and equipment | ||||
Other assets | ||||
Amount attributable to assets acquired | $ | |||
Fair value of liabilities assumed: | ||||
Current liabilities | $ | |||
Liabilities of Africa Assets held for sale | ||||
Long-term debt | ||||
Deferred income taxes | ||||
Asset retirement obligations | ||||
Pension and post-retirement obligations | ||||
Non-current derivative liabilities | ||||
Other long-term liabilities | ||||
Amount attributable to liabilities assumed | $ | |||
Net assets | $ | |||
Fair value of WES net assets acquired less noncontrolling interests (a) | $ | |||
Total Acquisition consideration | $ | |||
(a) | See Note 1 - Summary of Significant Accounting Policies for a discussion of the WES investment. |
OXY 2019 FORM 10-K | 75 |
| FINANCIAL STATEMENTS FOOTNOTES | |
The following table summarizes the fair value of the major categories of WES assets acquired and liabilities assumed at the Acquisition date as well as the noncontrolling interest, which primarily consists of the 44.6 % limited partner interest in WES owned by the public. The fair value of Occidental’s controlling interest in WES is calculated based on the market capitalization value at the Acquisition date.
millions | As of August 8, 2019 | |||
Fair value of WES assets acquired: | ||||
Current assets | $ | |||
Investments in unconsolidated entities | ||||
Property, plant and equipment | ||||
Intangible assets - customer relationships | ||||
Goodwill | ||||
Other assets | ||||
Amount attributable to assets acquired | $ | |||
Fair value of WES liabilities assumed: | ||||
Current liabilities | $ | |||
Long-term debt | ||||
Deferred income taxes | ||||
Asset retirement obligations | ||||
Other long-term liabilities | ||||
Amount attributable to liabilities assumed | $ | |||
Net assets | $ | |||
Less: Fair value of noncontrolling interests in WES | $ | |||
Fair value of WES net assets acquired less noncontrolling interests | $ | |||
The aggregate purchase price noted above was allocated to the major categories of assets and liabilities acquired based upon their preliminary estimated fair values at the date of the Acquisition. The valuation of certain assets, including property and intangible assets, are based on preliminary appraisals. The majority of measurements of assets acquired and liabilities assumed, other than debt, are based on inputs that are not observable in the market and thus represent Level 3 inputs. The fair value of acquired properties and equipment is based on both available market data and a cost approach.
Onshore undeveloped oil and gas properties were valued primarily using a market approach based on comparable transactions for similar properties while the income approach was utilized for developed oil and gas properties based on underlying reserve projections at the Acquisition date. For the acquired Gulf of Mexico offshore properties, an income approach was used as the primary valuation method based on underlying reserve projections. Income approaches are considered level 3 fair value estimates and include significant assumptions of future production, commodity prices, and operating and capital cost estimates, discounted using weighted average cost of capital for industry peers, and risk adjustment factors based on reserve category. Price assumptions were based on a combination of market information and published industry resources adjusted for historical differentials. Cost estimates were based on current observable costs inflated based on historical and expected future inflation. Taxes were based on current statutory rates.
The fair value of WES investments in unconsolidated entities were valued using an income approach for each investment, with significant inputs being forecasted distributions, an anticipated growth rate and an estimated discount rate. Acquired WES property, plant and equipment primarily consisted of gathering systems and processing and treating facilities and were primarily valued using a replacement cost approach. Intangible assets primarily consist of relationships with third-party customers, the fair value of which was determined using an income approach, including significant assumptions related to estimated cash flows from third-party customers less a contributory asset charge, a customer retention rate and an estimated discount rate. Customer relationships are amortized over 30 years. Goodwill is attributable to the difference in WES market capitalization value and the net assets acquired and primarily relates to the relationship between Occidental and WES that is not recognized as a separate asset, due to Occidental consolidating WES as of the Acquisition date.
Deferred income taxes represent the tax effects of differences in the tax basis and acquisition-date fair values of assets acquired and liabilities assumed. The measurement of debt instruments was based on unadjusted quoted prices in an active market and are primarily Level 1; approximately $2.5 billion of the assumed Anadarko debt is considered Level 2, while approximately $730 million of the WES debt is considered Level 2. The value of derivative instruments was based on observable inputs, primarily forward commodity-price and interest-rate curves and is considered Level 2.
76 | OXY 2019 FORM 10-K |
| FINANCIAL STATEMENTS FOOTNOTES | |
With the completion of the Acquisition, Occidental acquired proved and unproved properties of approximately $19.1 billion and $27.4 billion, respectively, primarily associated with the Permian Basin, DJ Basin, Gulf of Mexico and Powder River Basin. The remaining $2.5 billion in PP&E which consists of non-oil and gas mineral interests and other real estate assets.
From the date of the Acquisition through December 31, 2019, revenues and the net loss attributable to common stockholders associated with the operations acquired through the Acquisition totaled $4.2 billion and $1.7 billion, respectively, which includes a charge as a result of recording Occidental’s investment in WES at fair value as of December 31, 2019 upon the loss of control.
The following table summarizes the unaudited pro forma condensed financial information of Occidental as if the Acquisition had occurred on January 1, 2018:
Year ended December 31, | ||||||||
millions except per-share amounts | 2019 | 2018 | ||||||
Revenues | $ | $ | ||||||
Net income (loss) attributable to common stockholders (a) | $ | ( | ) | $ | ||||
Net income (loss) attributable to common stockholders per share—basic | $ | ( | ) | $ | ||||
Net income (loss) attributable to common stockholders per share—diluted | $ | ( | ) | $ | ||||
(a) |
The unaudited pro forma information is presented for illustration purposes only and is not necessarily indicative of the operating results that would have occurred had the Acquisition been completed at January 1, 2018, nor is it necessarily indicative of future operating results of the combined entity. The unaudited pro forma information for 2019 and 2018 is a result of combining the statements of operations of Occidental with the pre-Acquisition results from January 1, 2019, and 2018 of Anadarko and included adjustments for revenues and direct expenses. The pro forma results exclude results from the Africa Assets, any cost savings anticipated as a result of the Acquisition and the impact of any Acquisition-related costs. The pro forma results include adjustments to DD&A (depreciation, depletion and amortization) based on the purchase price allocated to property, plant, and equipment and the estimated useful lives as well as adjustments to interest expense. The pro forma adjustments include estimates and assumptions based on currently available information. Management believes the estimates and assumptions are reasonable, and the relative effects of the Acquisition are properly reflected.
ANADARKO ACQUISITION-RELATED COSTS
The following table summarizes the Acquisition-related costs incurred for the year ended December 31:
millions | 2019 | |||
Employee severance and related employee cost | $ | |||
Licensing fees for critical seismic data | ||||
Bank, legal, consulting and other | ||||
Total | $ | |||
Employee severance and related employee cost primarily relates to one-time severance costs and the accelerated vesting of certain Anadarko share-based awards for former Anadarko employees based on the terms of the Acquisition Agreement and existing change of control provisions within the former Anadarko employment agreements. In addition, employee severance and related employee cost included expenses for a voluntary separation program for eligible employees. Occidental initiated this program to align the size and composition of its workforce with its expected future operating and capital plans. Employee notifications related to the voluntary separation program were ongoing at December 31, 2019, with additional expenses associated with the program expected to be incurred through most of 2020. Employees may revoke their participation in the voluntary severance program up to their separation date.
OXY 2019 FORM 10-K | 77 |
| FINANCIAL STATEMENTS FOOTNOTES | |
NOTE 4 - ACQUISITIONS, DISPOSITIONS AND OTHER TRANSACTIONS |
AFRICA ASSETS - DISCONTINUED OPERATIONS
In September 2019, Occidental completed the sale of Mozambique LNG assets to Total for approximately $4.2 billion, with proceeds used to pay down a portion of the Term Loans. In January 2020, Occidental completed the sale of South Africa assets to Total. Occidental and Total continue to work toward completing the sales of the remaining Africa Assets. The carrying amount of the remaining Africa Assets will be adjusted in future periods based on changes in fair value. The results of the Africa Assets are presented as discontinued operations in the Consolidated Statements of Operations and Cash Flows.
The following table presents the amounts reported in discontinued operations, net of income taxes, related to the Africa Assets subsequent to the Acquisition closing date through December 31, 2019:
millions | 2019 | ||
Revenues and other income | |||
Net sales | $ | ||
Costs and other deductions | |||
Oil and gas lease operating expense | $ | ||
Transportation expense | |||
Taxes other than on income | |||
Fair value adjustment on assets held for sale | |||
Other | |||
Total costs and other deductions | $ | ||
Income before income taxes | $ | ||
Income tax expense | ( | ) | |
Discontinued operations, net of tax | $ | ( | ) |
The following table presents amounts related to the Africa Assets reported as held for sale in the Consolidated Balance Sheet as of December 31, 2019:
millions | 2019 | ||
Current assets | $ | ||
Property, plant and equipment, net | |||
Long-term receivables and other assets, net | |||
Assets held for sale (a) | $ | ||
Current liabilities | $ | ||
Long-term debt, net - finance leases | |||
Deferred income taxes | |||
Asset retirement obligations | |||
Other | |||
Liabilities of assets held for sale (a) | $ | ||
Net assets held for sale | $ | ||
(a) | Assets and liabilities held for sale at December 31, 2019 included South Africa assets which were sold to Total in January 2020. |
78 | OXY 2019 FORM 10-K |
| FINANCIAL STATEMENTS FOOTNOTES | |
OTHER TRANSACTIONS
2019
In December 2019, Occidental disposed of real estate assets for $565 million. Occidental utilized net proceeds to pay down a portion of the Term Loans. Concurrent with the sale, Occidental entered a thirteen-year lease for part of the real estate assets. Based on the terms of the lease, Occidental treated this as a failed sale-leaseback, retained the related book value in property, plant and equipment and recognized a finance lease of approximately $300 million based on the discounted future minimum lease payments.
In November 2019, Occidental and Ecopetrol closed on the joint venture to develop approximately 97,000 net acres of Occidental’s Midland Basin unproved properties in the Permian Basin. Ecopetrol paid $750 million in cash at closing and up to $750 million of carried capital in exchange for a 49 % interest in the new venture. Occidental recognized a gain of $563 million on the sale. Following the close, Occidental owned a 51 % interest and operates the joint venture. During the carry period, Ecopetrol will pay 75 % of Occidental’s share of capital expenditures, up to $750 million. The joint venture allows Occidental to accelerate its development plans in the Midland Basin, where it currently has minimal activity. Occidental will retain production and cash flow from its existing operations in the Midland Basin. The proceeds were used to pay down a portion of the Term Loans.
In September 2019, Occidental sold its remaining equity investment in Plains All American Pipeline, L.P. and Plains GP Holdings, L.P. (together, Plains) for net proceeds of $646 million, which resulted in a pre-tax gain of $114 million. The proceeds were used to pay down a portion of the Term Loans.
2018
In September 2018, Occidental divested non-core domestic midstream assets for total consideration of $2.6 billion, of which approximately $2.4 billion was received at closing, resulting in a pre-tax net gain of $907 million. These assets include the Centurion common carrier oil pipeline and storage system, Southeast New Mexico oil gathering system, and Ingleside Crude Terminal. Following the transactions, Occidental retained its long-term flow assurance, pipeline takeaway and export capacity through its retained marketing business.
In July 2018, Occidental acquired a previously leased power and steam cogeneration facility for $443 million.
In March 2018, Occidental divested non-core midstream assets for approximately $150 million, resulting in a pre-tax gain of $43 million.
2017
In the third quarter of 2017, Occidental closed on two divestitures of non-core acreage in the Permian Basin for proceeds of approximately $0.6 billion, resulting in a pre-tax gain of approximately $81 million. Concurrently, Occidental purchased additional ownership interests and assumed operatorship in CO2 enhanced oil recovery (EOR) properties located in the Seminole-San Andres Unit for approximately $0.6 billion, which was primarily allocated to proved property. In the fourth quarter of 2017, Occidental sold other non-core proved and unproved acreage in the Permian Basin for approximately $90 million, resulting in a pre-tax gain of approximately $55 million. Occidental also classified approximately $0.5 billion in non-core proved and unproved Permian acreage to assets held for sale at December 31, 2017.
OXY 2019 FORM 10-K | 79 |
| FINANCIAL STATEMENTS FOOTNOTES | |
NOTE 5 - REVENUE |
Revenue from customers is recognized when obligations under the terms of a contract are satisfied; this generally occurs with the delivery of oil, gas, NGL, chemicals or services such as transportation. Revenue from customers is measured as the amount of consideration Occidental expects to receive in exchange for the delivery of goods or services. Contracts may last from one month to one year or more, and may have renewal terms that extend indefinitely at the option of either party. Price is typically based on market indexes. Volumes fluctuate due to production and, in certain cases, customer demand and transportation availability. Occidental records revenue net of certain taxes, such as sales taxes, that are assessed by governmental authorities on Occidental’s customers.
Occidental does not incur significant costs to obtain contracts. Incidental items that are immaterial in the context of the contract are recognized as expenses. Sales of hydrocarbons and chemicals to customers are invoiced and settled on a monthly basis. Occidental is not usually subject to obligations for warranties, rebates, returns or refunds except in the case of customer incentive payments as discussed for the chemical segment below. Occidental does not typically receive payment in advance of satisfying its obligations under the terms of its sales contracts with customers; therefore, liabilities related to such payment are immaterial to Occidental.
OIL AND GAS SEGMENT
Revenue from oil and gas production is recognized when production is delivered and control passes to the customer. Revenues from the production of oil and gas properties in which Occidental has an interest with other producers are recognized on the basis of Occidental’s net revenue interest.
CHEMICALS SEGMENT
Revenue from chemical product sales is recognized when control passes to the customer. Certain incentive programs may provide for payments or credits to be made to customers based on the volume of product purchased over a defined period. Customer incentives are estimated and recorded as a reduction to revenue ratably over the contract period. Such estimates are evaluated and revised as warranted. Revenue from exchange contracts is excluded from revenue from customers.
MARKETING AND MIDSTREAM SEGMENT
80 | OXY 2019 FORM 10-K |
| FINANCIAL STATEMENTS FOOTNOTES | |
The following table reconciles revenue from customers to total net sales for the years ended December 31:
millions | 2019 | 2018 | ||||||
Revenue from customers | $ | $ | ||||||
All other revenues (a) | ||||||||
Net sales | $ | $ | ||||||
(a) | Included net marketing derivatives, oil collars and calls and chemical exchange contracts. |
DISAGGREGATION OF REVENUE FROM CONTRACTS WITH CUSTOMERS
The following table presents Occidental’s revenue from customers by segment, product and geographical area. The oil and gas segment typically sells its oil, gas and NGL at the lease or concession area. Chemical revenues are shown by geographic area based on the location of the sale. Marketing and midstream revenues are shown by the location of sale.
millions | United States | Middle East | Latin America | Other International | Eliminations | Total | ||||||||||||||||||
Year ended December 31, 2019 | ||||||||||||||||||||||||
Oil and Gas | ||||||||||||||||||||||||
Oil | $ | $ | $ | $ | $ | $ | ||||||||||||||||||
NGL | ||||||||||||||||||||||||
Gas | ||||||||||||||||||||||||
Other | ( | ) | ( | ) | ( | ) | ||||||||||||||||||
Segment total | $ | $ | $ | $ | $ | $ | ||||||||||||||||||
Chemical | $ | $ | $ | $ | $ | $ | ||||||||||||||||||
Marketing and Midstream (a) | ||||||||||||||||||||||||
Gas processing | $ | $ | $ | $ | $ | $ | ||||||||||||||||||
WES - Gas processing and pipeline | ||||||||||||||||||||||||
Power and other | ||||||||||||||||||||||||
Segment total | $ | $ | $ | $ | $ | $ | ||||||||||||||||||
Eliminations | $ | $ | $ | $ | $ | ( | ) | $ | ( | ) | ||||||||||||||
Consolidated | $ | $ | $ | $ | $ | ( | ) | $ | ||||||||||||||||
Year ended December 31, 2018 | ||||||||||||||||||||||||
Oil and Gas | ||||||||||||||||||||||||
Oil | $ | $ | $ | $ | $ | $ | ||||||||||||||||||
NGL | ||||||||||||||||||||||||
Gas | ||||||||||||||||||||||||
Other | ||||||||||||||||||||||||
Segment total | $ | $ | $ | $ | $ | $ | ||||||||||||||||||
Chemical | $ | $ | $ | $ | $ | $ | ||||||||||||||||||
Marketing and Midstream | ||||||||||||||||||||||||
Gas processing | $ | $ | $ | $ | $ | $ | ||||||||||||||||||
Pipelines | ||||||||||||||||||||||||
Power and other | ||||||||||||||||||||||||
Segment total | $ | $ | $ | $ | $ | $ | ||||||||||||||||||
Eliminations | $ | $ | $ | $ | $ | ( | ) | $ | ( | ) | ||||||||||||||
Consolidated | $ | $ | $ | $ | $ | ( | ) | $ | ||||||||||||||||
(a) |
OXY 2019 FORM 10-K | 81 |
| FINANCIAL STATEMENTS FOOTNOTES | |
TRANSACTION PRICE ALLOCATED TO REMAINING PERFORMANCE OBLIGATIONS
Revenue expected to be recognized from certain performance obligations that are unsatisfied as of December 31, 2019, is reflected in the table below. Occidental applies the optional exemptions in Topic 606 and does not disclose consideration for remaining performance obligations with an original expected duration of one year or less or for variable consideration related to unsatisfied performance obligations. As a result, the following table represents a small portion of Occidental’s expected future consolidated revenues, as future revenue from the sale of most products and services is dependent on future production or variable customer volume and variable commodity prices for that volume:
millions | Total | ||
2020 | $ | ||
2021 | |||
2022 | |||
2023 | |||
2024 | |||
Thereafter | |||
Total | $ | ||
NOTE 6 - INVENTORIES |
Finished goods primarily represents oil, which is carried at the lower of weighted-average cost or net realizable value, and caustic soda and chlorine, which are valued under the LIFO method. Net carrying values of inventories valued under the LIFO method were $168 million and $169 million at December 31, 2019 and 2018, respectively. Inventories consisted of the following at December 31:
millions | 2019 | 2018 | ||||||
Raw materials | $ | $ | ||||||
Materials and supplies | ||||||||
Commodity inventory and finished goods | ||||||||
Revaluation to LIFO | ( | ) | ( | ) | ||||
Total | $ | $ | ||||||
82 | OXY 2019 FORM 10-K |
| FINANCIAL STATEMENTS FOOTNOTES | |
NOTE 7 - LONG-TERM DEBT |
Long-term debt consisted of the following:
millions | December 31, 2019 | |||
4.850% senior notes due 2021 | $ | |||
2.600% senior notes due 2021 | ||||
4.100% senior notes due 2021 | ||||
Variable rate bonds due 2021 (2.854% as of December 31, 2019) | ||||
Variable rate bonds due 2021 (3.151% as of December 31, 2019) | ||||
2-year variable rate Term Loan due 2021 (3.111% as of December 31, 2019) | ||||
2.700% senior notes due 2022 | ||||
3.125% senior notes due 2022 | ||||
2.600% senior notes due 2022 | ||||
Variable rate bonds due 2022 (3.360% as of December 31, 2019) | ||||
2.700% senior notes due 2023 | ||||
8.750% medium-term notes due 2023 | ||||
2.900% senior notes due 2024 | ||||
6.950% senior notes due 2024 | ||||
3.450% senior notes due 2024 | ||||
3.500% senior notes due 2025 | ||||
5.550% senior notes due 2026 | ||||
3.200% senior notes due 2026 | ||||
3.400% senior notes due 2026 | ||||
7.500% debentures due 2026 | ||||
3.000% senior notes due 2027 | ||||
7.125% debentures due 2027 | ||||
7.000% debentures due 2027 | ||||
6.625% debentures due 2028 | ||||
7.150% debentures due 2028 | ||||
7.200% senior debentures due 2028 | ||||
7.200% debentures due 2029 | ||||
7.950% debentures due 2029 | ||||
8.450% senior debentures due 2029 | ||||
3.500% senior notes due 2029 | ||||
Variable rate bonds due 2030 (1.705% as of December 31, 2019) | ||||
7.500% senior notes due 2031 | ||||
7.875% senior notes due 2031 | ||||
6.450% senior notes due 2036 | ||||
Zero Coupon senior notes due 2036 | ||||
6.500% note payable to WES due 2038 | ||||
4.300% senior notes due 2039 | ||||
7.950% senior notes due 2039 | ||||
6.200% senior notes due 2040 | ||||
4.500% senior notes due 2044 | ||||
4.625% senior notes due 2045 | ||||
6.600% senior notes due 2046 | ||||
4.400% senior notes due 2046 | ||||
4.100% senior notes due 2047 | ||||
4.200% senior notes due 2048 | ||||
4.400% senior notes due 2049 | ||||
7.730% debentures due 2096 | ||||
7.500% debentures due 2096 | ||||
7.250% debentures due 2096 | ||||
Total borrowings at face value(a) | ||||
Adjustments to book value: | ||||
Unamortized premium, net | ||||
Debt issuance costs | ( | ) | ||
Long-term finance leases | ||||
Long-term Debt, net | $ | |||
(a) | Total borrowings at face value included a $ |
OXY 2019 FORM 10-K | 83 |
| FINANCIAL STATEMENTS FOOTNOTES | |
millions | December 31, 2018 | |||
Occidental | ||||
9.250% senior debentures due 2019 | $ | |||
4.100% senior notes due 2021 | ||||
3.125% senior notes due 2022 | ||||
2.600% senior notes due 2022 | ||||
2.700% senior notes due 2023 | ||||
8.750% medium-term notes due 2023 | ||||
3.500% senior notes due 2025 | ||||
3.400% senior notes due 2026 | ||||
3.000% senior notes due 2027 | ||||
7.200% senior debentures due 2028 | ||||
8.450% senior debentures due 2029 | ||||
4.625% senior notes due 2045 | ||||
4.400% senior notes due 2046 | ||||
4.100% senior notes due 2047 | ||||
4.200% senior notes due 2048 | ||||
Variable rate bonds due 2030 (1.9% as of December 31, 2018) | ||||
Total borrowings at face value | ||||
Adjustments to book value: | ||||
Unamortized discount, net | ( | ) | ||
Debt issuance costs | ( | ) | ||
Current maturities | ( | ) | ||
Long-term Debt, net | $ | |||
DEBT ISSUED AND ASSUMED
On August 8, 2019, Occidental issued $13.0 billion of new senior unsecured notes, consisting of both floating and fixed rate debt. Occidental also borrowed under the Term Loans, which consist of: (1) a 364 -day senior unsecured variable-rate term loan tranche of $4.4 billion and (2) a two-year senior unsecured variable-rate term loan tranche of $4.4 billion. In total, the $21.8 billion in debt issued was used to finance part of the cash portion of the purchase price for the Acquisition.
In the Acquisition, Occidental assumed Anadarko debt with an outstanding principal balance of $11.9 billion. In September 2019, Occidental completed its offers to exchange the Anadarko senior notes and debentures assumed as part of the Acquisition for notes of a corresponding series issued by Occidental and cash, and related solicitation of consents. Of the approximately $11.9 billion in aggregate principal amount of Anadarko senior notes and debentures offered in the exchange, 97 %, or approximately $11.5 billion, were tendered and accepted in the exchange offers. The portion not exchanged, approximately $400 million, remains outstanding with the original terms.
DEBT REPAYMENT
In 2019, Occidental paid approximately $7.0 billion of long-term debt including a majority of the Term Loans using proceeds from assets sales and available cash.
REVOLVING CREDIT FACILITY
On June 3, 2019, Occidental entered into an amendment to its existing $3.0 billion revolving credit facility (Occidental RCF) pursuant to which, among other things, the commitments under the Occidental RCF were increased to $5.0 billion at the closing of the Acquisition. Borrowings under the Occidental RCF bear interest at various benchmark rates, including LIBOR, plus a margin based on Occidental’s senior debt ratings. The facility has similar terms to other debt agreements and does not contain material adverse change clauses or debt ratings triggers that could restrict Occidental’s ability to borrow, or that would permit lenders to terminate their commitments or accelerate debt repayment. The facility provides for the termination of loan commitments and requires immediate repayment of any outstanding amounts if certain events of default occur. Occidental has not drawn down any amounts under the Occidental RCF. In 2019, Occidental paid average annual facility fees of 0.11 % on the total commitment amount.
ZERO COUPON NOTES DUE 2036
The Zero Coupon senior notes due 2036 (Zero Coupons) have an aggregate principal amount due at maturity of approximately $2.3 billion, reflecting an accretion rate of 5.24 %. The Zero Coupons can be put to Occidental in October of each year, in whole or in part, for the then-accreted value of the outstanding Zero Coupons. The Zero Coupons can next be put to Occidental in October 2020, which, if put in whole, would be $992 million at such date. Occidental has the ability and intent to refinance these obligations using long-term debt should a put be exercised.
84 | OXY 2019 FORM 10-K |
| FINANCIAL STATEMENTS FOOTNOTES | |
DEBT GUARANTEES
As of December 31, 2019, and 2018, Occidental had provided limited recourse guarantees on approximately $242 million and $244 million, respectively, of Dolphin Energy’s debt, which are limited to certain political and other events.
FAIR VALUE OF DEBT
Occidental estimates the fair value of fixed-rate debt based on the quoted market prices for those instruments or on quoted market yields for similarly rated debt instruments, taking into account such instruments’ maturities. The estimated fair values of Occidental’s debt at December 31, 2019, and 2018, substantially all of which were classified as Level 1, were approximately $38.8 billion and $10.3 billion, respectively. Occidental’s exposure to changes in interest rates relates primarily to its variable-rate, long-term debt obligations, and is not material. As of December 31, 2019, and 2018, variable-rate debt constituted approximately 12 % and 1 % of Occidental’s total debt, respectively.
DEBT MATURITIES
At December 31, 2019, future principal payments on long-term debt aggregated approximately $37.4 billion, of which, $6.4 billion is due in 2021, $4.7 billion is due in 2022, $1.2 billion is due in 2023, and $25.1 billion is due in 2024 and thereafter.
NOTE 8 - LEASE COMMITMENTS |
On January 1, 2019, Occidental adopted ASC 842 using the modified retrospective approach, which provided a method for recording existing leases at adoption and did not require restatement of prior year amounts and disclosures, which continue to be reflected in accordance with ASC 840. Occidental elected certain practical expedients as follows:
Ø Leases that commenced before the effective date carried forward their historical lease classification.
Ø | Existing or expired land easements as of December 31, 2018, were not reassessed to determine whether or not they contained a lease. |
Ø | Leases with a lease term of 12 months or less from lease commencement date are considered short-term leases and not recorded on the Consolidated Balance Sheet; however, the lease expenditures recognized are captured and reported as incurred. |
Ø | For asset classes, except long-term drilling rigs, Occidental elected to account for the lease and non-lease components as a single lease component as the non-lease portions were not significant to separate in determining the lease liability. For long-term drilling rig contracts, Occidental bifurcated the lease and non-lease components using relative fair value as a stand-alone selling price between the asset rental and the services obtained. |
ASC 842 requires lessees to recognize a ROU asset and lease liability for all long-term leases. A ROU asset represents Occidental’s right to use an underlying asset for the lease term and the associated lease liability represents the discounted obligation of future minimum lease payments. Occidental identifies leases through its accounts payable and contract monitoring process. Operating lease ROU assets and liabilities are recognized at commencement date based on the present value of lease payments over the lease term. The ROU assets include the discounted obligation in addition to any upfront payments or costs incurred during the contract execution of the lease and amortized on a straight-line basis over the course of the lease term. Except for leases with explicitly defined contract terms, Occidental utilizes judgment to assess likelihood of renewals, terminations and purchase options, in order to determine the lease term. Occidental uses the incremental borrowing rate at commencement date to determine the present value of lease payments. The incremental borrowing rate equates to the rate of interest that Occidental would have to pay to borrow on a collateralized basis over a similar term an amount equal to the lease payments in a similar economic environment. Certain leases include variable lease payments which are over and above the minimum lease liability used to derive the ROU asset and lease liability and are based on the underlying asset’s operations. These variable lease costs are reported in the lease cost classification table.
Recognition, measurement, and presentation of expenses and cash flows arising from a lease will depend on classification as a finance or operating lease. The criteria for distinguishing between finance and operating leases are substantially similar to the criteria under ASC 840. For Occidental operations, adoption of ASC 842 resulted in recording of net lease assets and lease liabilities of $772 million as of January 1, 2019. There was no material impact to net income, cash flows, or stockholders’ equity.
ACQUISITION IMPACT
ASC 805 Business Combinations requires lease-related assets and liabilities acquired to be measured as if the lease were new at the acquisition date. Occidental measured the Anadarko lease agreements using Occidental’s incremental borrowing rates. This resulted in Anadarko assets and lease liabilities of $503 million and $574 million, respectively, excluding the Africa Assets at the Acquisition date, being evaluated and adjusted, as necessary, for above- or below -market impacts. For the leases acquired through the Acquisition, Occidental will retain the previous lease classification.
OXY 2019 FORM 10-K | 85 |
| FINANCIAL STATEMENTS FOOTNOTES | |
The following table reconciles the undiscounted cash flows related to the operating and finance lease liabilities assumed in the Acquisition and recorded on the Consolidated Balance Sheet at the Acquisition date:
millions | Operating Leases | Finance Leases | Total | ||||||||
2019 | $ | $ | $ | ||||||||
2020 | |||||||||||
2021 | |||||||||||
2022 | |||||||||||
2023 | |||||||||||
Thereafter | |||||||||||
Total lease payments | $ | $ | $ | ||||||||
Less: Interest | ( | ) | ( | ) | ( | ) | |||||
Total lease liabilities (a) | $ | $ | $ | ||||||||
(a) |
Additionally, Occidental has elected short-term lease treatment for those acquired lease contracts which, at the Acquisition date, had a remaining lease term of 12 months or less.
NATURE OF LEASES
Occidental’s operating lease agreements include leases for oil and gas exploration and development equipment, including offshore and onshore drilling rigs of $217 million, compressors of $162 million and other field equipment of $389 million, which are recorded gross on the Consolidated Balance Sheet and in the lease cost disclosures below. Contract expiration terms generally range from 2 to 9 years. Further, actual expenditures are netted against joint-interest recoveries on the statement of operations through the normal joint-interest billing process. Occidental’s leases also include pipelines, rail cars, storage facilities, easements and real estate of $659 million, which typically are not associated with joint-interest recoveries. Real estate leases have contract expiration terms ranging from 1 to 14 years.
Occidental’s finance lease agreements include leases for oil and gas exploration and development equipment, as well as real estate offices, compressors, and field equipment of approximately $398 million.
The following table presents lease balances and their location on the Consolidated Balance Sheet at December 31, 2019:
millions | Balance sheet location | 2019 | ||||
Assets: | ||||||
Operating | Operating lease assets | $ | ||||
Finance | Property, plant and equipment | |||||
Total lease assets | $ | |||||
Liabilities: | ||||||
Current | ||||||
Operating | Current operating lease liabilities | $ | ||||
Finance | Current maturities of long-term debt | |||||
Non-current | ||||||
Operating | Deferred credits and other liabilities - Operating lease liabilities | |||||
Finance | Long-term debt, net | |||||
Total lease liabilities | $ | |||||
86 | OXY 2019 FORM 10-K |
| FINANCIAL STATEMENTS FOOTNOTES | |
At December 31, 2019, Occidental’s leases expire based on the following schedule:
millions | Operating Leases(a) | Finance Leases(b) | Total | ||||||||
2020 | $ | $ | $ | ||||||||
2021 | |||||||||||
2022 | |||||||||||
2023 | |||||||||||
2024 | |||||||||||
Thereafter | |||||||||||
Total lease payments | |||||||||||
Less: Interest | ( | ) | ( | ) | ( | ) | |||||
Total lease liabilities | $ | $ | $ | ||||||||
(a) | The weighted-average remaining lease term is |
(b) |
At December 31, 2018, future undiscounted net minimum fixed lease payments for non-cancellable operating leases, prepared in accordance with accounting standards prior to the adoption of ASC 842, were as follows:
millions | Operating Leases | |||
2019 | $ | |||
2020 | ||||
2021 | ||||
2022 | ||||
2023 | ||||
Thereafter | ||||
Total minimum lease payments(a) | $ | |||
(a) | The amount represents the future undiscounted cash flows at December 31, 2018, excluding any amount associated with the Acquisition. |
The following tables present Occidental’s total lease cost and classifications, as well as cash paid for amounts included in the measurement of operating and finance lease liabilities:
millions | Year ended December 31, 2019 | |||
Lease cost classification(a) | ||||
Operating lease costs(b) | ||||
Property, plant and equipment, net | $ | |||
Operating expense and cost of sales | ||||
Selling, general and administrative expenses | ||||
Finance lease cost | ||||
Amortization of ROU assets | ||||
Interest on lease liabilities | ||||
Total lease cost | $ | |||
(a) | Amounts reflected are gross before joint-interest recoveries. |
(b) | Included short-term lease cost of $ |
millions | Year ended December 31, 2019 | |||
Operating cash flows | $ | |||
Investing cash flows | $ | |||
Financing cash flows (a) | $ | |||
(a) |
OXY 2019 FORM 10-K | 87 |
| FINANCIAL STATEMENTS FOOTNOTES | |
NOTE 9 - DERIVATIVES |
OBJECTIVE AND STRATEGY
Occidental uses a variety of derivative financial instruments and physical contracts to manage its exposure to commodity-price fluctuations, interest rate risks, transportation commitments, and to fix margins on the future sale of stored commodity volumes. Occidental also enters into derivative financial instruments for trading purposes.
Occidental may elect normal purchases and normal sales exclusions when physically delivered commodities are purchased or sold to a customer. Occidental occasionally applies cash flow hedge accounting treatment to derivative financial instruments to lock in margins on the forecasted sales of its natural gas storage volumes, and at times for other strategies, such as to lock rates on forecasted debt issuances. Derivatives are carried at fair value and on a net basis when a legal right of offset exists with the same counterparty. See Note 1 - Summary of Significant Accounting Policies for Occidental’s accounting policy on derivatives.
DERIVATIVES NOT DESIGNATED AS HEDGING INSTRUMENTS
As of December 31, 2019, Occidental’s derivatives not designated as hedges consist of three-way oil collars and call options, interest rate swaps, marketing derivatives and the Warrant.
Derivative instruments that are derivatives not designated as hedging instruments are required to be recorded on the balance sheet at fair value. Changes in fair value will impact Occidental’s earnings through mark-to-market adjustments until the physical commodity is delivered or the financial instrument is settled. The fair value does not reflect the realized or cash value of the instrument.
THREE-WAY OIL COLLARS AND CALL OPTIONS
In 2019, Occidental entered into three-way costless collar derivative instruments for 2020 along with additional call options in 2021 to manage its near-term exposure to cash-flow variability from commodity price risks. A three-way collar is a combination of three options: a sold call, a purchased put and a sold put. The sold call establishes the ceiling price that Occidental will receive for the contracted commodity volume for a defined period of time. The purchased put establishes the floor price that Occidental will receive for the contracted volumes unless the market price for the commodity falls below the sold put strike price, at which point the floor price equals the reference price plus the difference between the purchased put strike price and the sold put strike price for a defined period of time. Occidental entered into the 2021 call options to substantially improve the terms for the ceiling price that Occidental will receive for the contracted commodity volumes in 2020. Net gains and losses associated with collars and calls are recognized currently in net sales.
Occidental had the following collars and calls outstanding at December 31, 2019:
Collars and Calls, not designated as hedges | ||||||
2020 Settlement | ||||||
Three-way collars (oil MMBBL) | ||||||
Volume weighted average price per barrel (Brent oil pricing) | ||||||
Ceiling sold price (call) | $ | |||||
Floor purchased price (put) | $ | |||||
Floor sold price (put) | $ | |||||
2021 Settlement | ||||||
Call options sold (oil MMBBL) | ||||||
Volume weighted average price per barrel (Brent oil pricing) | ||||||
Ceiling sold price (call) | $ | |||||
INTEREST RATE SWAPS
Occidental acquired interest rate swap contracts in the Acquisition. The contracts lock in a fixed interest rate in exchange for a floating interest rate indexed to three-month London Inter-Bank Offered Rate (LIBOR) throughout the reference period. Occidental also acquired interest rate swap contracts held by WES, which were settled as of December 31, 2019. Net gains and losses associated with interest rate derivative instruments not designated as hedging instruments are recognized currently in gains (losses) on interest rate swaps and warrants, net.
88 | OXY 2019 FORM 10-K |
| FINANCIAL STATEMENTS FOOTNOTES | |
Occidental had the following outstanding interest rate swaps at December 31, 2019:
millions except percentages | Mandatory | Weighted-Average | ||||||||
Notional Principal Amount | Reference Period | Termination Date | Interest Rate | |||||||
$ | September 2016 - 2046 | September 2020 | % | |||||||
$ | September 2016 - 2046 | September 2022 | % | |||||||
$ | September 2017 - 2047 | September 2020 | % | |||||||
$ | September 2017 - 2047 | September 2021 | % | |||||||
$ | September 2017 - 2047 | September 2023 | % | |||||||
Depending on market conditions, liability management actions or other factors, Occidental may enter into offsetting interest rate swap positions or settle or amend certain or all of the currently outstanding interest rate swaps. Occidental settled interest rate swaps with a notional value of $125 million in October 2019. In January and February 2020, Occidental extended September 2020 mandatory termination dates to September 2021 and September 2022 for swaps with a notional value of $500 million and $150 million, respectively.
Derivative settlements and collateralization are classified as cash flows from operating activities unless the derivatives contain an other-than-insignificant financing element, in which case the settlements and collateralization are classified as cash flows from financing activities. Due to the liability position of the interest rate derivatives at the date of the Acquisition, the interest rate derivatives in Occidental’s portfolio contain an other-than-insignificant financing element, and therefore, any settlements, collateralization or cash payments related to interest rate derivatives are classified as cash flow from financing activities. Net cash receipts related to settlements, and collateralization of interest rate swap agreements were $120 million during the period from August 8, 2019 through December 31, 2019.
MARKETING DERIVATIVES
Occidental’s marketing derivative instruments not designated as hedges are physical and financial forward contracts which typically settle within three months . A substantial majority of Occidental’s physically settled derivative contracts are index-based and carry no mark-to-market valuation in earnings. These instruments settle at a weighted-average contract price of $60.60 per barrel and $2.17 per thousand cubic feet (Mcf) for oil and natural gas, respectively, at December 31, 2019. The weighted-average contract price was $58.81 per barrel and $3.18 per Mcf for oil and natural gas, respectively, at December 31, 2018. Net gains and losses associated with marketing derivative instruments not designated as hedging instruments are recognized currently in net sales.
The following table summarizes net long/(short) volumes associated with the outstanding marketing commodity derivatives not designated as hedging instruments as of December 31, 2019, and 2018:
2019 | 2018 | |||||
Oil Commodity Contracts | ||||||
Volume (MMBBL) | ||||||
Natural gas commodity contracts | ||||||
Volume (Bcf) | ( | ) | ( | ) | ||
THE WARRANT
The Warrant issued with the Preferred Stock in connection with the Acquisition is exercisable at the holder’s option, in whole or in part, until the first anniversary of the date on which no shares of Preferred Stock remain outstanding at which point the Warrant expires. The holder of the Warrant may require net cash settlement if certain shareholder and regulatory approvals to issue Occidental common stock are not obtained on a timely basis. The initial fair value of the Warrant, $188 million, was measured at the date of the Acquisition using the Black Scholes option model. The following inputs were used in the Black Scholes option model: the expected life is based on the estimated term of the Warrant, the volatility factor is based on historical volatilities of Occidental common stock, and the call option price for Occidental common stock at $62.50 . The fair value of the Warrant is remeasured each reporting period based on changes in the inputs above.
DERIVATIVES DESIGNATED AS HEDGING INSTRUMENTS
Net gains and losses attributable to derivative instruments subject to cash flow hedge accounting reside in accumulated other comprehensive loss and are reclassified to earnings as the transactions to which the derivatives relate are recognized in earnings.
OXY 2019 FORM 10-K | 89 |
| FINANCIAL STATEMENTS FOOTNOTES | |
CASH FLOW HEDGES
Occidental’s marketing operations store natural gas purchased from third parties at Occidental’s leased storage facilities. Occidental occasionally elects cash flow hedge accounting for derivative instruments which are used to fix margins on the future sales of the stored volumes. The amount of cash flow hedges related to stored gas, including the ineffective portion, was immaterial for the years ended December 31, 2019, and 2018.
In June 2019, in anticipation of issuing debt in the third quarter to partially finance the cash portion of the Acquisition consideration, Occidental entered into a series of U.S. treasury locks which were designated as cash flow hedges. In August 2019, the U.S. treasury locks were unwound with the issuance of the $13.0 billion new senior unsecured notes, and the resulting after-tax accumulated other comprehensive loss of $125 million will be amortized to interest expense over the life of the underlying senior notes.
FAIR VALUE OF DERIVATIVES
Occidental has categorized its assets and liabilities that are measured at fair value in a three-level fair value hierarchy, based on the inputs to the valuation techniques: Level 1 – using quoted prices in active markets for the assets or liabilities; Level 2 – using observable inputs other than quoted prices for the assets or liabilities; and Level 3 – using unobservable inputs. Transfers between levels, if any, are reported at the end of each reporting period. The following table presents the fair values of Occidental’s outstanding derivatives. Fair values are presented at gross amounts below, including when derivatives are subject to netting arrangements, and are presented on a net basis in the Consolidated Balance Sheets.
millions | Fair Value Measurements Using | Total Fair Value | ||||||||||||||||||
Balance Sheet Classification | Level 1 | Level 2 | Level 3 | Netting (a) | ||||||||||||||||
December 31, 2019 | ||||||||||||||||||||
Oil Collars and Calls | ||||||||||||||||||||
Other current assets | $ | $ | $ | $ | $ | |||||||||||||||
Deferred credits and other liabilities - other | ( | ) | ( | ) | ||||||||||||||||
Marketing Derivatives | ||||||||||||||||||||
Other current assets | ( | ) | ||||||||||||||||||
Long-term receivables and other assets, net | ( | ) | ||||||||||||||||||
Accrued liabilities | ( | ) | ( | ) | ( | ) | ||||||||||||||
Deferred credits and other liabilities - other | ( | ) | ( | ) | ( | ) | ||||||||||||||
Interest Rate Swaps | ||||||||||||||||||||
Other current assets | ||||||||||||||||||||
Long-term receivables and other assets, net | ||||||||||||||||||||
Accrued liabilities | ( | ) | ( | ) | ||||||||||||||||
Deferred credits and other liabilities - other | ( | ) | ( | ) | ||||||||||||||||
Warrant | ||||||||||||||||||||
Deferred credits and other liabilities - other | ( | ) | ( | ) | ||||||||||||||||
December 31, 2018 | ||||||||||||||||||||
Marketing Derivatives | ||||||||||||||||||||
Other current assets | $ | $ | $ | $ | ( | ) | $ | |||||||||||||
Long-term receivables and other assets, net | ( | ) | ||||||||||||||||||
Accrued liabilities | ( | ) | ( | ) | ( | ) | ||||||||||||||
Deferred credits and other liabilities - other | ( | ) | ( | ) | ( | ) | ||||||||||||||
(a) | These amounts do not include collateral. As of December 31, 2019, $ |
90 | OXY 2019 FORM 10-K |
| FINANCIAL STATEMENTS FOOTNOTES | |
GAINS AND LOSSES ON DERIVATIVES
The following table presents gains and (losses) related to Occidental’s derivative instruments on the Consolidated Statements of Operations:
millions | December 31, | |||||||||||
Income Statement Classification | 2019 | 2018 | 2017 | |||||||||
Oil Collars and Calls | ||||||||||||
Net sales | $ | ( | ) | $ | $ | |||||||
Marketing Derivatives | ||||||||||||
Net sales (a) | ( | ) | ||||||||||
Interest Rate Swaps (Excluding WES) | ||||||||||||
Gain on interest rate swaps and warrants, net | ||||||||||||
Interest Rate Swaps (WES) | ||||||||||||
Gain on interest rate swaps and warrants, net | ||||||||||||
Warrant | ||||||||||||
Gain on interest rate swaps and warrants, net | ||||||||||||
(a) |
CREDIT RISK
The majority of Occidental’s counterparty credit risk is related to the physical delivery of energy commodities to its customers and their inability to meet their settlement commitments. Occidental manages credit risk by selecting counterparties that it believes to be financially strong, by entering into netting arrangements with counterparties and by requiring collateral or other credit risk mitigants, as appropriate. Occidental actively evaluates the creditworthiness of its counterparties, assigns appropriate credit limits, and monitors credit exposures against those assigned limits. Occidental also enters into future contracts through regulated exchanges with select clearinghouses and brokers, which are subject to minimal credit risk as a significant portion of these transactions settle on a daily margin basis.
Certain of Occidental’s OTC derivative instruments contain credit-risk-contingent features, primarily tied to credit ratings for Occidental or its counterparties, which may affect the amount of collateral that each party would need to post. The aggregate fair value of derivative instruments with credit-risk-contingent features for which a net liability position existed at December 31, 2019 was $787 million (net of $169 million collateral), primarily related to acquired interest-rate swaps, and $68 million (net of $1 million of collateral) existed at December 31, 2018.
NOTE 10 - ENVIRONMENTAL LIABILITIES AND EXPENDITURES |
Occidental’s operations are subject to stringent federal, state, local and international laws and regulations related to improving or maintaining environmental quality. The laws that require or address environmental remediation, including CERCLA and similar federal, state, local and international laws, may apply retroactively and regardless of fault, the legality of the original activities or the current ownership or control of sites. OPC or certain of its subsidiaries participate in or actively monitor a range of remedial activities and government or private proceedings under these laws with respect to alleged past practices at operating, closed and third-party sites. Remedial activities may include one or more of the following: investigation involving sampling, modeling, risk assessment or monitoring; cleanup measures including removal, treatment or disposal; or operation and maintenance of remedial systems. The environmental proceedings seek funding or performance of remediation and, in some cases, compensation for alleged property damage, punitive damages, civil penalties, injunctive relief and government oversight costs.
ENVIRONMENTAL REMEDIATION
As of December 31, 2019, Occidental participated in or monitored remedial activities or proceedings at 177 sites, which included 36 sites assumed through the Acquisition. The following table presents Occidental’s current and non-current environmental remediation liabilities as of December 31, 2019 and 2018, the current portion of which is included in accrued liabilities ($162 million in 2019 and $120 million in 2018) and the remainder in deferred credits and other liabilities - environmental remediation liabilities ($1.04 billion in 2019 and $762 million in 2018). Occidental continues to evaluate the remediation obligations assumed through the Acquisition.
Occidental’s environmental remediation sites are grouped into four categories: NPL sites listed or proposed for listing by the EPA on the CERCLA NPL and three categories of non-NPL sites — third-party sites, Occidental-operated sites and closed or non-operated Occidental sites.
OXY 2019 FORM 10-K | 91 |
| FINANCIAL STATEMENTS FOOTNOTES | |
2019 | 2018 | |||||||||||||
millions, except number of sites | Number of Sites | Remediation Balance | Number of Sites | Remediation Balance | ||||||||||
NPL sites | $ | $ | ||||||||||||
Third-party sites | ||||||||||||||
Occidental-operated sites | ||||||||||||||
Closed or non-operated Occidental sites | ||||||||||||||
Total | $ | $ | ||||||||||||
As of December 31, 2019, Occidental’s environmental liabilities exceeded $10 million each at 20 of the 177 sites described above, and 101 of the sites had liabilities from $0 to $1 million each. As of December 31, 2019, three sites — the Diamond Alkali Superfund Site and a former chemical plant in Ohio (both of which are indemnified by Maxus Energy Corporation, as discussed further below), and a landfill in Western New York — accounted for 94 percent of its liabilities associated with NPL sites. Seventeen of the 36 NPL sites are indemnified by Maxus.
Environmental remediation liabilities vary over time depending on factors such as acquisitions or dispositions, identification of additional sites and remedy selection and implementation. Occidental recorded environmental remediation expenses of $112 million, $47 million and $39 million for the years ended December 31, 2019, 2018 and 2017, respectively. Environmental remediation expenses primarily relate to changes to existing conditions from past operations. Based on current estimates, Occidental expects to expend funds corresponding to approximately 40 percent of the year-end remediation balance over the next three to four years with the remainder over the subsequent 10 or more years. Occidental believes its range of reasonably possible additional losses beyond those amounts currently recorded for environmental remediation for all of its environmental sites could be up to $1.1 billion.
MAXUS ENVIRONMENTAL SITES
When Occidental acquired Diamond Shamrock Chemicals Company (DSCC) in 1986, Maxus, a subsidiary of YPF S.A. (YPF), agreed to indemnify Occidental for a number of environmental sites, including the Diamond Alkali Superfund Site (Site) along a portion of the Passaic River. On June 17, 2016, Maxus and several affiliated companies filed for Chapter 11 bankruptcy in Federal District Court in the State of Delaware. Prior to filing for bankruptcy, Maxus defended and indemnified Occidental in connection with clean-up and other costs associated with the sites subject to the indemnity, including the Site.
In March 2016, the EPA issued a Record of Decision (ROD) specifying remedial actions required for the lower 8.3 miles of the Lower Passaic River. The ROD does not address any potential remedial action for the upper nine miles of the Lower Passaic River or Newark Bay. During the third quarter of 2016, and following Maxus’s bankruptcy filing, Occidental and the EPA entered into an Administrative Order on Consent (AOC) to complete the design of the proposed clean-up plan outlined in the ROD at an estimated cost of $165 million. The EPA announced that it will pursue similar agreements with other potentially responsible parties.
Occidental has accrued a remediation liability relating to its estimated allocable share of the costs to perform the design and the remediation called for in the AOC and the ROD, as well as for certain other Maxus-indemnified sites. Occidental’s accrued estimated environmental remediation liability does not consider any recoveries for indemnified costs. Occidental’s ultimate share of the estimated costs may be higher or lower than its accrued remediation liability, and is subject to final design plans and the resolution with other potentially responsible parties. Occidental continues to evaluate the costs to be incurred to comply with the AOC, the ROD and to perform remediation at other Maxus-indemnified sites in light of the Maxus bankruptcy and the share of ultimate liability of other potentially responsible parties. In June 2018, Occidental filed a complaint under CERCLA in Federal District Court in the State of New Jersey against numerous potentially responsible parties for reimbursement of amounts incurred or to be incurred to comply with the AOC, the ROD or to perform other remediation activities at the Site.
92 | OXY 2019 FORM 10-K |
| FINANCIAL STATEMENTS FOOTNOTES | |
NOTE 11 - LAWSUITS, CLAIMS, COMMITMENTS AND CONTINGENCIES |
LEGAL MATTERS
Occidental or certain of its subsidiaries are involved, in the normal course of business, in lawsuits, claims and other legal proceedings that seek, among other things, compensation for alleged personal injury, breach of contract, property damage or other losses, punitive damages, civil penalties, or injunctive or declaratory relief. Occidental or certain of its subsidiaries also are involved in proceedings under Comprehensive Environmental Response, Compensation and Liability Act (CERCLA) and similar federal, state, local and foreign environmental laws. These environmental proceedings seek funding or performance of remediation and, in some cases, compensation for alleged property damage, punitive damages, civil penalties and injunctive relief. Usually Occidental or such subsidiaries are among many companies in these environmental proceedings and have to date been successful in sharing response costs with other financially sound companies. Further, some lawsuits, claims and legal proceedings involve acquired or disposed assets with respect to which a third party or Occidental retains liability or indemnifies the other party for conditions that existed prior to the transaction.
In accordance with applicable accounting guidance, Occidental accrues reserves for outstanding lawsuits, claims and proceedings when it is probable that a liability has been incurred and the liability can be reasonably estimated. Reserves for matters, other than for environmental remediation, that satisfy this criteria as of December 31, 2019, and December 31, 2018, were not material to Occidental’s Consolidated Balance Sheets.
On May 30, 2019, a complaint was filed in the Court of Chancery of the State of Delaware by purported Occidental stockholders High River Limited Partnership, Icahn Partners Master Fund LP and Icahn Partners LP (the “Icahn Complainants”), captioned High River Ltd. P’ship v. Occidental Petroleum Corp., C.A. No. 2019-0403-JRS, seeking inspection of Occidental’s books and records pursuant to Section 220 of the Delaware General Corporation Law. In the complaint, the Icahn Complainants noted that they had accumulated over $1.6 billion of Occidental Common Stock. On June 14, 2019, Occidental filed an answer to the complaint in the Court of Chancery of the State of Delaware. A trial was held on September 20, 2019, and the court dismissed the Icahn Complaint. The Icahn Complainants appealed and oral arguments occurred in February 2020.
In 2016, Occidental received payments from the Republic of Ecuador of approximately $1.0 billion pursuant to a November 2015 arbitration award for Ecuador’s 2006 expropriation of Occidental’s Participation Contract for Block 15. The awarded amount represented a recovery of 60 percent of the value of Block 15. In 2017, Andes Petroleum Ecuador Ltd. (Andes) filed a demand for arbitration, claiming it is entitled to a 40 percent share of the judgment amount obtained by Occidental. Occidental contends that Andes is not entitled to any of the amounts paid under the 2015 arbitration award because Occidental’s recovery was limited to Occidental’s own 60 percent economic interest in the block. The merits hearing is scheduled for May 2020. Occidental intends to vigorously defend against this claim in arbitration.
The ultimate outcome and impact of outstanding lawsuits, claims and proceedings on Occidental cannot be predicted. Management believes that the resolution of these matters will not, individually or in the aggregate, have a material adverse effect on Occidental’s Consolidated Balance Sheets. If unfavorable outcomes of these matters were to occur, future results of operations or cash flows for any particular quarterly or annual period could be materially adversely affected. Occidental’s estimates are based on information known about the legal matters and its experience in contesting, litigating and settling similar matters. Occidental reassesses the probability and estimability of contingent losses as new information becomes available.
TAX MATTERS
During the course of its operations, Occidental is subject to audit by tax authorities for varying periods in various federal, state, local and foreign tax jurisdictions. Taxable years through 2016 for U.S. federal income tax purposes have been audited by the U.S. Internal Revenue Service (IRS) pursuant to its Compliance Assurance Program and subsequent taxable years are currently under review. Taxable years through 2009 have been audited for state income tax purposes. While a single foreign tax jurisdiction is open for 2002, all other significant audit matters in foreign jurisdictions have been resolved through 2010. During the course of tax audits, disputes have arisen and other disputes may arise as to facts and matters of law. Occidental believes that the resolution of outstanding tax matters would not have a material adverse effect on its consolidated financial position or results of operations.
For Anadarko, its taxable years through 2016 for U.S. federal and state income tax purposes have been audited by the IRS and respective state taxing authorities. There are outstanding significant audit matters in one foreign jurisdiction. During the course of the tax audit, disputes have arisen and other disputes may arise as to facts and matters of law. Other than the matter discussed below, Occidental believes that the resolution of these outstanding tax matters would not have a material adverse effect on its consolidated financial position or results of operations.
Anadarko received an $881 million tentative refund in 2016 related to its $5.2 billion Tronox settlement payment in 2015. In September 2018, Anadarko received a statutory notice of deficiency from the IRS disallowing the net operating loss carryback and rejecting Anadarko’s refund claim. As a result, Anadarko filed a petition with the U.S. Tax Court to dispute the disallowances in November 2018. The case is currently in the IRS appeals process. If the matter is not resolved in the IRS appeals process, Occidental expects to continue pursuing resolution in the U.S. Tax Court.
While Occidental believes it is entitled to this refund, in accordance with ASC 740’s guidance on the accounting for uncertain tax positions, as of December 31, 2019, Occidental has recorded no tax benefit on the tentative cash tax refund of
OXY 2019 FORM 10-K | 93 |
| FINANCIAL STATEMENTS FOOTNOTES | |
$881 million. As a result, should Occidental not ultimately prevail on the issue, there would be no additional tax expense recorded for financial statement purposes other than future interest. However, in that event Occidental would be required to repay approximately $925 million ($898 million federal and $27 million in state taxes) plus accrued interest of approximately $189 million. As a result, a liability for this amount has been recorded in deferred credits and other liabilities - other at December 31, 2019.
INDEMNITIES TO THIRD PARTIES
Occidental, its subsidiaries, or both, have indemnified various parties against specified liabilities those parties might incur in the future in connection with purchases and other transactions that they have entered into with Occidental. These indemnities usually are contingent upon the other party incurring liabilities that reach specified thresholds. As of December 31, 2019, Occidental is not aware of circumstances that it believes would reasonably be expected to lead to indemnity claims that would result in payments materially in excess of reserves.
PURCHASE OBLIGATIONS AND COMMITMENTS
Occidental, its subsidiaries, or both, have entered into agreements providing for future payments to secure terminal and pipeline capacity, drilling rigs and services, electrical power, steam and certain chemical raw materials. Occidental has certain other commitments under contracts, guarantees and joint ventures, including purchase commitments for goods and services at market-related prices and certain other contingent liabilities. At December 31, 2019, total purchase obligations were $20.7 billion, which included approximately $3.3 billion in 2020, $5.7 billion in 2021 and 2022, $4.7 billion in 2023 and 2024, and $7.1 billion in 2025 and thereafter.
NOTE 12 - INCOME TAXES |
The following summarizes domestic and foreign components of income (loss) from continuing operations before domestic and foreign income taxes for the years ended December 31:
millions | 2019 | 2018 | 2017 | |||||||||
Domestic | $ | ( | ) | $ | $ | ( | ) | |||||
Foreign | ||||||||||||
Total | $ | $ | $ | |||||||||
The following summarizes components of income tax expense (benefit) on continuing operations for the years ended December 31:
millions | 2019 | 2018 | 2017 | |||||||||
Current | ||||||||||||
Federal | $ | $ | ( | ) | $ | ( | ) | |||||
State and Local | ||||||||||||
Foreign | ||||||||||||
Total current tax expense | $ | $ | $ | |||||||||
Deferred | ||||||||||||
Federal | ( | ) | ( | ) | ||||||||
State and Local | ||||||||||||
Foreign | ( | ) | ( | ) | ||||||||
Total deferred tax expense (benefit) | $ | ( | ) | $ | $ | ( | ) | |||||
Total income tax expense | $ | $ | $ | |||||||||
94 | OXY 2019 FORM 10-K |
| FINANCIAL STATEMENTS FOOTNOTES | |
The following reconciliation of the U.S federal statutory income tax rate to Occidental’s worldwide effective tax rate on income from continuing operations for the years ended December 31 is stated as a percentage of income (loss) from continuing operations before income taxes:
2019 | 2018 | 2017 | |||||||
U.S. federal statutory tax rate | % | % | % | ||||||
Enhanced oil recovery credit and other general business credits | ( | ) | ( | ) | ( | ) | |||
Change in federal income tax rate | ( | ) | |||||||
Tax (benefit) expense due to reversal of indefinite reinvestment assertion | ( | ) | |||||||
Tax impact from foreign operations | |||||||||
State income taxes, net of federal benefit | |||||||||
Uncertain tax positions | |||||||||
Transaction costs | |||||||||
Non-controlling interest | ( | ) | |||||||
Executive compensation limitation | |||||||||
Stock warrants | ( | ) | |||||||
WES loss of control | |||||||||
Other | ( | ) | ( | ) | ( | ) | |||
Worldwide effective tax rate | % | % | % | ||||||
In 2019, Occidental’s worldwide effective tax rate was 373 %, which was largely a result of Acquisition-related costs and charges associated with the loss of control of WES for which Occidental received no tax benefit.
The tax effects of temporary differences resulting in deferred income taxes at December 31, 2019, and 2018 were as follows:
millions | 2019 | 2018 | ||||||
Deferred tax liabilities | ||||||||
Property, plant and equipment differences | $ | ( | ) | $ | ( | ) | ||
Equity investments, partnerships and foreign subsidiaries | ( | ) | ( | ) | ||||
Gross long-term deferred tax liabilities | ( | ) | ( | ) | ||||
Deferred tax assets | ||||||||
Environmental reserves | ||||||||
Postretirement benefit accruals | ||||||||
Deferred compensation and benefits | ||||||||
Asset retirement obligations | ||||||||
Foreign tax credit carryforwards | ||||||||
General business credit carryforwards | ||||||||
Net operating loss carryforward | ||||||||
Interest expense carryforward | ||||||||
All other | ||||||||
Gross long-term deferred tax assets | ||||||||
Valuation allowance | ( | ) | ( | ) | ||||
Net long-term deferred tax assets | $ | $ | ||||||
Less: Foreign deferred tax asset in long-term receivables and other assets, net | $ | ( | ) | $ | ||||
Total deferred income taxes, net | $ | ( | ) | $ | ( | ) | ||
Total deferred tax assets, after valuation allowances, were $3.7 billion and $1.3 billion as of December 31, 2019, and 2018, respectively. Occidental expects to realize the recorded deferred tax assets, net of any allowances, through future operating income and reversal of temporary differences. The total deferred tax liabilities were $13.4 billion and $2.3 billion as
OXY 2019 FORM 10-K | 95 |
| FINANCIAL STATEMENTS FOOTNOTES | |
of December 31, 2019 and 2018, respectively. The increase in net deferred tax liability in 2019 over 2018 is primarily due to the acquisition of Anadarko offset by the generation of interest expense and operating loss carryforwards in 2019.
As of December 31, 2019, Occidental had foreign tax credit carryforwards of $4.4 billion, federal general business credits carryforwards of $404 million, tax-effected foreign net operating loss carryforwards of $209 million, tax-effected state operating loss carryforwards of $292 million and state tax credit carryforwards of $39 million. These carryforward balances have varying carryforward periods through 2039. Occidental has recorded a valuation allowance for all of the foreign tax credit carryforwards, $240 million of the tax-effected state net operating loss carryforwards $32 million of the state tax credit carryforwards and all of the tax-effected foreign net operating loss carryforwards.
A deferred tax liability has not been recognized for temporary differences related to unremitted earnings of certain consolidated international subsidiaries aggregating approximately $889 million at December 31, 2019, as it is Occidental’s intention to reinvest such earnings indefinitely. If the earnings of these international subsidiaries were not indefinitely reinvested, an additional deferred tax liability of approximately $206 million would be required.
A reconciliation of the beginning and ending amount of unrecognized tax benefits is as follows:
millions | 2019 | 2018 | 2017 | |||||||||
Balance at January 1 | $ | $ | $ | |||||||||
Increase related to Anadarko Acquisition | ||||||||||||
Increases related to current-year positions | ||||||||||||
Settlements | ( | ) | ||||||||||
Balance at December 31 | $ | $ | $ | |||||||||
The December 31, 2019 balance of unrecognized tax benefits of $2.2 billion included potential benefits of $2.0 billion of which, if recognized, $1.7 billion would affect the effective tax rate on income. Also included are benefits of $131 million related to tax positions for which the ultimate deductibility is highly certain, but the timing of such deductibility is uncertain. Occidental records estimated potential interest and penalties related to liabilities for unrecognized tax benefits in the provisions for domestic and foreign income taxes. The Company accrued approximately $199 million of interest related to liabilities for unrecognized tax benefits as of December 31, 2019. During 2019, Occidental recorded interest related to liabilities for unrecognized tax benefits of $30 million. There were no interest and penalties associated with liabilities for unrecognized tax benefits recorded for the years ended December 31, 2018 and 2017. Over the next 12 months, it is reasonably possible that the total amount of unrecognized tax benefits could decrease by $100 million to $110 million due to settlements with taxing authorities or lapse in statutes of limitation.
Occidental has recognized $86 million and $68 million in federal and state income tax receivables at December 31, 2019, and 2018, respectively, which was recorded in other current assets. In addition, Occidental has recognized $36 million and $68 million in federal alternative minimum tax non-current receivables at December 31, 2019, and 2018, respectively, which was recorded in long-term receivables and other assets, net.
Occidental is subject to audit by various tax authorities in varying periods. See Note 11 - Lawsuits, Claims, Commitments and Contingencies for a discussion of these matters.
NOTE 13 - STOCKHOLDERS’ EQUITY |
The following is a summary of common stock issuances:
Shares in thousands | Common Stock | ||
Balance, December 31, 2016 | |||
Issued | |||
Options exercised and other, net | |||
Balance, December 31, 2017 | |||
Issued | |||
Options exercised and other, net | |||
Balance, December 31, 2018 | |||
Issued in the ordinary course | |||
Issued as part of the Acquisition (a) | |||
Balance, December 31, 2019 | |||
(a) | Included approximately |
96 | OXY 2019 FORM 10-K |
| FINANCIAL STATEMENTS FOOTNOTES | |
TREASURY STOCK
The total number of shares authorized for Occidental’s share repurchase program is 185 million shares of which 44.2 million may yet be purchased under the repurchase program. However, the program does not obligate Occidental to acquire any specific number of shares and may be discontinued at any time. In 2019, 2.7 million shares were purchased at an average price of $66.94 under the program and in 2018, 16.9 million shares were purchased at an average price of $74.92 . No shares were purchased under the program in 2017. Additionally, Occidental purchased shares from the trustee of its defined contribution savings plan during each year. As of December 31, 2019, 2018 and 2017, treasury stock shares numbered 150.3 million, 145.7 million, and 128.4 million, respectively.
PREFERRED STOCK
Occidental has authorized 50 million shares of preferred stock with a par value of $1.00 per share. On August 8, 2019, in connection with the Acquisition, Occidental issued 100,000 shares of series A preferred stock (the Preferred Stock), having a face value of $100,000 per share and a liquidation preference of $105,000 per share plus unpaid accrued dividends. In connection with the preferred stock issuance, Occidental also issued the Warrant. The holder of the Warrant and the Preferred Stock may redeem the Preferred Stock as payment for the exercise price of the Warrant in lieu of cash payment upon exercise. The Preferred Stock is redeemable at Occidental’s option after the 10th anniversary of issuance. Dividends on the Preferred Stock will accrue on the face value at a rate per annum of 8 percent, but will be paid only when, as, and if declared by Occidental’s Board of Directors. At any time, when such dividends have not been paid in full, the unpaid amounts will accrue dividends, compounded quarterly, at a rate per annum of 9 percent. Following the payment in full of any accrued but unpaid dividends, the dividend rate will remain at 9 percent per annum. In January 2020, Occidental paid $200 million in Preferred Stock dividends. At December 31, 2019, Occidental had 100,000 shares of preferred stock issued and outstanding, and none were outstanding in 2018 and 2017.
EARNINGS PER SHARE
The following table presents the calculation of basic and diluted earnings per share for the years ended December 31:
millions except per share amounts | 2019 | 2018 | 2017 | |||||||||
Income (loss) from continuing operations | $ | ( | ) | $ | $ | |||||||
Loss from discontinued operations | ( | ) | ||||||||||
Net income (loss) | $ | ( | ) | $ | $ | |||||||
Less: Net income attributable to noncontrolling interest | ( | ) | ||||||||||
Less: Preferred stock dividends | ( | ) | ||||||||||
Net income (loss) attributable to common stock | $ | ( | ) | $ | $ | |||||||
Less: Net income allocated to participating securities | ( | ) | ( | ) | ||||||||
Net income (loss), net of participating securities | $ | ( | ) | $ | $ | |||||||
Weighted-average number of basic shares | ||||||||||||
Basic earnings (loss) per common share | $ | ( | ) | $ | $ | |||||||
Net income (loss), net of participating securities | $ | ( | ) | $ | $ | |||||||
Weighted-average number of basic shares | ||||||||||||
Dilutive securities | ||||||||||||
Total diluted weighted-average common shares | ||||||||||||
Diluted earnings (loss) per common share | $ | ( | ) | $ | $ | |||||||
ACCUMULATED OTHER COMPREHENSIVE LOSS
Accumulated other comprehensive loss consisted of the following after-tax amounts at December 31:
millions | 2019 | 2018 | ||||||
Foreign currency translation adjustments | $ | ( | ) | $ | ( | ) | ||
Unrealized gains (losses) on derivatives | ( | ) | ||||||
Pension and postretirement adjustments (a) | ( | ) | ( | ) | ||||
Total | $ | ( | ) | $ | ( | ) | ||
(a) |
OXY 2019 FORM 10-K | 97 |
| FINANCIAL STATEMENTS FOOTNOTES | |
NOTE 14 - STOCK-BASED INCENTIVE PLANS |
Occidental issues stock-based awards to employees in accordance with the terms of the shareholder approved 2015 Long-Term Incentive Plan (2015 LTIP). An aggregate of 80 million shares of Occidental common stock were authorized for issuance and approximately 6.6 million shares had been allocated to employee awards through December 31, 2019. As of December 31, 2019, approximately 52.5 million shares were available for grants of future awards. The plan requires each share covered by an award (other than options) to be counted as if three shares were issued in determining the number of shares that are available for future awards. Accordingly, the number of shares available for future awards may be less than 52.5 million depending on the type of award granted, and shares available for future awards may increase by the number of shares that are forfeited, canceled, or correspond to the portion of any stock-based awards settled in cash, including awards that were issued under a previous plan that remain outstanding. Current outstanding awards include RSUs, stock options, CROCEIs, and TSRIs.
During 2019, non-employee directors were granted awards for 41,752 shares of common stock. Compensation expense for these awards was measured using the closing quoted market price of Occidental’s common stock on the grant date and was fully recognized at that time.
For the year ended December 31, 2019, Occidental incurred expenses of $208 million related to stock-based incentive plans, of which $31 million was related to the Acquisition. For the years ended December 31, 2018, and 2017, expense related to stock-based incentive plans was $180 million, and $150 million, respectively. The income tax benefit associated with this expense was $43 million, $47 million, and $32 million in the years ended December 31, 2019, 2018, and 2017, respectively.
As of December 31, 2019, unrecognized compensation expense for all unvested stock-based incentive awards was $354.1 million. This expense is expected to be recognized over a weighted-average period of 1.9 years. Occidental accounts for forfeitures as they occur.
RSUs
Certain employees are awarded the right to receive RSUs, some of which have performance criteria, and are in the form of, or equivalent in value to, actual shares of Occidental common stock. Depending on their terms, RSUs may be settled in stock or may be cash settled liabilities. These awards vest from one to 4 years following the grant date, however, certain of the RSUs are forfeitable if performance objectives are not satisfied by the seventh anniversary of the grant date. For certain RSUs, dividend equivalents are paid during the vesting period.
CASH-SETTLED LIABILITY AWARDS
The weighted-average, grant-date fair values of cash-settled RSUs granted in 2019, 2018 and 2017 were $42.62 , $75.86 , and $66.62 per share, respectively. Cash-Settled RSUs resulted in payments of $4 million, $18 million, and $23 million, during the years ended December 31, 2019, 2018 and 2017, respectively.
STOCK-SETTLED EQUITY AWARDS
The weighted-average, grant-date fair values of the stock-settled RSUs granted in 2019, 2018, and 2017 were $58.73 , $69.87 , and $67.21 , respectively. The fair value of RSUs settled in shares during the years ended December 31, 2019, 2018 and 2017 was $148 million, $109 million, and $64 million, respectively.
A summary of changes in Occidental’s unvested cash- and stock-settled RSUs during the year ended December 31, 2019, is presented below:
Cash-Settled | Stock-Settled | |||||||||||||||
thousands, except fair values | RSUs | Weighted-Average Grant-Date Fair Value | RSUs | Weighted-Average Grant-Date Fair Value | ||||||||||||
Unvested at January 1 | $ | $ | ||||||||||||||
Granted (a) | $ | $ | ||||||||||||||
Vested | ( | ) | $ | ( | ) | $ | ||||||||||
Forfeitures | ( | ) | $ | ( | ) | $ | ||||||||||
Unvested at December 31 | $ | $ | ||||||||||||||
(a) |
TSRIs
Certain executives are awarded TSRIs that vest at the end of a three-year period following the grant date. Payout is based upon Occidental’s absolute total shareholder return and performance relative to its peers. TSRIs have payouts that range from 0 % to 200 % of the target award and settle in stock once certified. Dividend equivalents for TSRIs are accumulated and paid upon certification of the award. The fair value of TSRIs settled in shares during the years ended December 31, 2019, 2018 and 2017 was $4 million, $12 million, and $5 million, respectively.
98 | OXY 2019 FORM 10-K |
| FINANCIAL STATEMENTS FOOTNOTES | |
The fair values of TSRIs are initially determined on the grant date using a Monte Carlo simulation model based on Occidental’s assumptions, noted in the following table, and the volatility from corresponding peer group companies. The expected life is based on the vesting period (Term). The risk-free interest rate is the implied yield available on zero coupon T-notes (U.S. Treasury Strip) at the time of grant with a remaining term equal to the Term. The dividend yield is the expected annual dividend yield over the Term, expressed as a percentage of the stock price on the grant date. Estimates of fair value may not accurately predict the value ultimately realized by the employees who receive the awards, and the ultimate value may not be indicative of the reasonableness of the original estimates of fair value made by Occidental.
The grant-date assumptions used in the Monte Carlo simulation models for the estimated payout level of TSRIs were as follows:
TSRIs | ||||||||||||
2019 | 2018 | 2017 | ||||||||||
Assumptions used: | ||||||||||||
Risk-free interest rate | % | % | % | |||||||||
Volatility factor | % | % | % | |||||||||
Expected life (years) | ||||||||||||
Grant-date fair value of underlying Occidental common stock | $ | $ | $ | |||||||||
A summary of Occidental’s unvested TSRIs as of December 31, 2019 and changes during the year ended December 31, 2019 is presented below:
TSRIs | ||||||||
thousands, except fair values | Awards | Weighted-Average Grant-Date Fair Value of Occidental Stock | ||||||
Unvested at January 1 | $ | |||||||
Granted | $ | |||||||
Vested (a) | ( | ) | $ | |||||
Forfeitures | ( | ) | $ | |||||
Unvested at December 31 | $ | |||||||
(a) | Presented at the target payouts. The weighted-average payout at vesting was |
STOCK OPTIONS
Certain employees have been granted options that are settled in stock. Exercise prices of the options were equal to the quoted market value of Occidental’s stock on the grant date. No options were granted, vested or forfeited in 2019. The intrinsic value of options exercised during the years ended December 31, 2019, 2018, and 2017 was insignificant. As of December 31, 2019, there were 530,000 fully vested options outstanding with an exercise price of $79.98 per share and a remaining life of 2.1 years.
CROCEI, ROCEI and ROAI
Certain executives are awarded CROCEI, ROCEI or ROAI awards that vest at the end of a three-year period if performance targets based on cash return on capital employed, return on capital employed, or return on assets are certified as being met. These awards are settled in stock upon certification of the performance target, with payouts that range from 0 % to 200 % of the target award. Dividend equivalents are accumulated and paid upon certification of the award.
CROCEI, ROCEI, and ROAI | ||||||||
thousands, except fair values | Awards | Weighted-Average Grant-Date Fair Value of Occidental Stock | ||||||
Unvested at January 1 | $ | |||||||
Granted | $ | |||||||
Vested (a) | ( | ) | $ | |||||
Forfeited | ||||||||
Unvested at December 31 | $ | |||||||
(a) |
OXY 2019 FORM 10-K | 99 |
| FINANCIAL STATEMENTS FOOTNOTES | |
NOTE 15 - RETIREMENT AND POSTRETIREMENT BENEFIT PLANS |
Occidental has various benefit plans for its salaried, domestic union and nonunion hourly, and certain foreign national employees.
In conjunction with the Acquisition, Occidental acquired certain Anadarko contributory and non-contributory defined benefit pension plans, which include both qualified and supplemental plans, and plans that provide health care and life insurance benefits for certain retired employees. The Anadarko pension and postretirement obligations were remeasured as of the Acquisition date. The remeasurement resulted in an increase to the benefit obligation of $193 million. The disclosures below exclude the plans related to the Africa Assets classified as held for sale as of December 31, 2019.
During the third quarter of 2018, Occidental adopted a postretirement benefit plan design change, which replaced the previous self-insured benefit with a Medicare Advantage PPA plan for Medicare-eligible retirees. As a result of this change, the postretirement benefit obligation was remeasured as of August 31, 2018. The remeasurement resulted in a decrease to the benefit obligation of $178 million with a corresponding offset to accumulated other comprehensive income.
DEFINED CONTRIBUTION PLANS
All domestic employees and certain foreign national employees are eligible to participate in one or more of the defined contribution retirement or savings plans that provide for periodic contributions by Occidental based on plan-specific criteria, such as base pay, level and employee contributions. Certain salaried employees participate in a supplemental retirement plan that restores benefits lost due to governmental limitations on qualified retirement benefits. The accrued liabilities for the supplemental retirement plan were $279 million and $201 million as of December 31, 2019, and 2018, respectively, and Occidental expensed $211 million in 2019, $152 million in 2018 and $130 million in 2017 under the provisions of these defined contribution and supplemental retirement plans.
DEFINED BENEFIT PLANS
Participation in defined benefit plans is limited. Approximately 4,000 domestic and 600 foreign national employees, mainly union, nonunion hourly and certain employees that joined Occidental from acquired operations with grandfathered benefits, are currently accruing benefits under these plans.
Pension costs for Occidental’s defined benefit pension plans, determined by independent actuarial valuations, are generally funded by payments to trust funds, which are administered by independent trustees.
POSTRETIREMENT AND OTHER BENEFIT PLANS
Occidental provides medical and dental benefits and life insurance coverage for certain active, retired and disabled employees and their eligible dependents. Occidental generally funds the benefits as they are paid during the year. These benefit costs, including the postretirement costs, were approximately $220 million in 2019, $182 million in 2018 and $181 million in 2017.
OBLIGATIONS AND FUNDED STATUS
The following tables show the amounts recognized in Occidental’s consolidated balance sheets at December 31, 2019 and 2018, related to its pension and postretirement benefit plans:
Pension Benefits | Postretirement Benefits | |||||||||||||||
millions | 2019 | 2018 | 2019 | 2018 | ||||||||||||
Amounts recognized in the consolidated balance sheet: | ||||||||||||||||
Long-term receivables and other assets, net | $ | $ | $ | $ | ||||||||||||
Accrued liabilities | ( | ) | ( | ) | ( | ) | ( | ) | ||||||||
Deferred credits and other liabilities — pension and postretirement obligations | ( | ) | ( | ) | ( | ) | ( | ) | ||||||||
$ | ( | ) | $ | ( | ) | $ | ( | ) | $ | ( | ) | |||||
Accumulated other comprehensive loss included the following after-tax balances: | ||||||||||||||||
Net (gain) loss | $ | ( | ) | $ | $ | $ | ||||||||||
Prior service credit | ( | ) | ( | ) | ||||||||||||
$ | ( | ) | $ | $ | $ | |||||||||||
100 | OXY 2019 FORM 10-K |
| FINANCIAL STATEMENTS FOOTNOTES | |
The following tables show the funding status, obligations and plan asset fair values of Occidental related to its pension and postretirement benefit plans for the years ended December 31:
Pension Benefits | Postretirement Benefits | |||||||||||||||
millions | 2019 | 2018 | 2019 | 2018 | ||||||||||||
Changes in the benefit obligation: | ||||||||||||||||
Benefit obligation — beginning of year | $ | $ | $ | $ | ||||||||||||
Service cost — benefits earned during the period | ||||||||||||||||
Interest cost on projected benefit obligation | ||||||||||||||||
Actuarial (gain) loss | ( | ) | ( | ) | ( | ) | ||||||||||
Foreign currency exchange rate gain | ( | ) | ||||||||||||||
Curtailment (gain) loss | ( | ) | ||||||||||||||
Special termination benefits | ||||||||||||||||
Benefits paid | ( | ) | ( | ) | ( | ) | ( | ) | ||||||||
Participant contributions | ||||||||||||||||
Plan amendments | ( | ) | ||||||||||||||
Additions due to the Acquisition | ||||||||||||||||
Benefit obligation — end of year | $ | $ | $ | $ | ||||||||||||
Changes in plan assets: | ||||||||||||||||
Fair value of plan assets — beginning of year | $ | $ | $ | $ | ||||||||||||
Actual return on plan assets | ( | ) | ||||||||||||||
Participant contributions | ||||||||||||||||
Employer contributions | ||||||||||||||||
Benefits paid | ( | ) | ( | ) | ( | ) | ||||||||||
Additions due to the Acquisition | ||||||||||||||||
Fair value of plan assets — end of year | $ | $ | $ | $ | ||||||||||||
Unfunded status: | $ | ( | ) | $ | ( | ) | $ | ( | ) | $ | ( | ) | ||||
The following table sets forth details of the obligations and assets of Occidental’s defined benefit pension plans for the years December 31:
Accumulated Benefit Obligation in Excess of Plan Assets | Plan Assets in Excess of Accumulated Benefit Obligation | |||||||||||||||
millions | 2019 | 2018 | 2019 | 2018 | ||||||||||||
Projected benefit obligation | $ | $ | $ | $ | ||||||||||||
Accumulated benefit obligation | $ | $ | $ | $ | ||||||||||||
Fair value of plan assets | $ | $ | $ | $ | ||||||||||||
OXY 2019 FORM 10-K | 101 |
| FINANCIAL STATEMENTS FOOTNOTES | |
COMPONENTS OF NET PERIODIC BENEFIT COST
The following table sets forth the components of net periodic benefit costs for the years ended December 31:
Pension Benefits | Postretirement Benefits | |||||||||||||||||||||||
millions | 2019 | 2018 | 2017 | 2019 | 2018 | 2017 | ||||||||||||||||||
Net periodic benefit costs: | ||||||||||||||||||||||||
Service cost — benefits earned during the period | $ | $ | $ | $ | $ | $ | ||||||||||||||||||
Interest cost on projected benefit obligation | ||||||||||||||||||||||||
Expected return on plan assets | ( | ) | ( | ) | ( | ) | ||||||||||||||||||
Recognized actuarial loss | ||||||||||||||||||||||||
Recognized prior service credit | ( | ) | ||||||||||||||||||||||
Liability (gain) loss due to curtailment | ( | ) | ||||||||||||||||||||||
Special termination benefits | ||||||||||||||||||||||||
Other costs and adjustments | ( | ) | ( | ) | ||||||||||||||||||||
Net periodic benefit cost | $ | ( | ) | $ | $ | $ | $ | $ | ||||||||||||||||
The service cost component of net periodic benefit cost is included in selling, general and administrative, oil and gas operating expense, chemical and midstream costs, and exploration expense on Occidental’s Consolidated Statements of Operations. All other components of net periodic benefit cost are included in other operating and non-operating expense.
The estimated net loss and prior service cost for the defined benefit pension plans that will be amortized from Accumulated Other Comprehensive Income (AOCI) into net periodic benefit cost over the next fiscal year are $3 million and zero , respectively. The estimated net loss and prior service credit for the defined benefit postretirement plans that will be amortized from AOCI into net periodic benefit cost over the next fiscal year are $12 million and $(8 ) million, respectively.
ADDITIONAL INFORMATION
The following table sets forth the weighted-average assumptions used to determine Occidental’s benefit obligation and net periodic benefit cost for domestic plans for the years ended December 31:
Pension Benefits | Postretirement Benefits | |||||||||||
2019 | 2018 | 2019 | 2018 | |||||||||
Benefit Obligation Assumptions: | ||||||||||||
Discount rate | % | % | % | % | ||||||||
Net Periodic Benefit Cost Assumptions: | ||||||||||||
Discount rate for January 1 - August 31 expense | % | % | % | % | ||||||||
Discount rate for September 1 - December 31 expense | % | % | % | % | ||||||||
Assumed long-term rate of return on assets | % | % | ||||||||||
Rates of increase in compensation levels | % | |||||||||||
For domestic pension plans and postretirement benefit plans, Occidental based the discount rate on AA-AAA Universe yield curve in 2019 and 2018. The assumed long-term rate of return on assets is estimated with regard to current market factors but within the context of historical returns for the asset mix that exists at year end. Assumed rates of compensation increases for active participants in certain plans and vary by age group.
In 2019, Occidental adopted the Society of Actuaries 2019 Pri-2012 Private Retirement Plans Mortality Tables with Mortality Improvement Scale, which updated the mortality assumptions that private defined-benefit plans in the United States use in the actuarial valuations that determine a plan sponsor’s pension obligations. The new mortality assumption reflects additional data that the Social Security Administration has released since the previous mortality tables and improvement scales were released. This additional data shows a lower degree of mortality improvement than previously reflected. The changes in the mortality assumption results in a decrease of $15 million and $9 million in the pension and postretirement benefit obligation, respectively, at December 31, 2019.
For pension plans outside the United States, Occidental based its discount rate on rates indicative of government or investment grade corporate debt in the applicable country, taking into account hyperinflationary environments when necessary. The discount rates used for the foreign pension plans ranged from 1.0 % to 8.8 % at December 31, 2019 and from 1.0 % to 8.9 % at December 31, 2018. The average rate of increase in future compensation levels ranged from 1.0 % to 8.0 % in 2019, depending on local economic conditions.
The postretirement benefit obligation was determined by application of the terms of medical and dental benefits and life insurance coverage, including the effect of established maximums on covered costs, together with relevant actuarial
102 | OXY 2019 FORM 10-K |
| FINANCIAL STATEMENTS FOOTNOTES | |
assumptions and health care cost trend rates. Health care cost trend rates for Medicare advantaged prescription drug (MAPD) plans of 4.3 % to 21.5 % in 2019, between (7.7 )% and (6.2 )% in 2020, 9.6 % in 2021, then grading down to 4.5 % in 2028 and beyond. The negative trend rates for the MAPD plans reflect the repeal of the Health Insurer Fee effective in 2021. Health care cost trend rates used for non-MAPD plans are 6.7 % to 7.5 % in 2019, then grading down to 4.5 % in 2028 and beyond.
A 1% increase or a 1% decrease in these assumed health care cost trend rates would result in an increase of $131 million or a reduction of $103 million, respectively, in the postretirement benefit obligation and increase of $13 million or a reduction of $9 million in the annual service and interest costs as of December 31, 2019.
The actuarial assumptions used could change in the near term as a result of changes in expected future trends and other factors that, depending on the nature of the changes, could cause increases or decreases in the plan assets and liabilities.
FAIR VALUE OF PENSION PLAN ASSETS
Pension plan assets are monitored by Occidental’s Pension and Retirement Trust and Investment Committee or by the Investment Subcommittee of the Anadarko Petroleum Corporation Administrative & Investment Committee (collectively, the Investment Committees), in their roles as fiduciaries. The Investment Committees select and employ various external professional investment management firms to manage specific investments across the spectrum of asset classes. The Investment Committees employ a total return investment approach that uses a diversified blend of investments across several categories (equity securities, fixed-income securities, real estate, hedge funds, and private equity) to optimize the long-term return of plan assets at a prudent level of risk. Equity investments are diversified across U.S. and non-U.S. stocks, as well as differing styles and market capitalizations. Investment performance is measured and monitored on an ongoing basis through quarterly investment portfolio and manager guideline compliance reviews, annual liability measurements and periodic studies.
The fair values of Occidental’s pension plan assets by asset category were as follows:
millions | Level 1 | Level 2 | Level 3 | Total | ||||||||||||
December 31, 2019 | ||||||||||||||||
Asset Class: | ||||||||||||||||
U.S. government securities | $ | $ | $ | $ | ||||||||||||
Corporate bonds (a) | ||||||||||||||||
Mutual funds: | ||||||||||||||||
Bond funds | ||||||||||||||||
International funds | ||||||||||||||||
Common and preferred stocks (b) | ||||||||||||||||
Other | ||||||||||||||||
Investments measured at fair value | $ | $ | $ | $ | ||||||||||||
Investments measured at net asset value (c) | — | — | — | |||||||||||||
Total pension plan assets (d) | $ | $ | $ | $ | ||||||||||||
December 31, 2018 | ||||||||||||||||
Asset Class: | ||||||||||||||||
U.S. government securities | $ | $ | $ | $ | ||||||||||||
Corporate bonds (a) | ||||||||||||||||
Common/collective trusts (e) | ||||||||||||||||
Mutual funds: | ||||||||||||||||
Bond funds | ||||||||||||||||
Blend funds | ||||||||||||||||
Common and preferred stocks (b) | ||||||||||||||||
Other | ||||||||||||||||
Total pension plan assets (d) | $ | $ | $ | $ | ||||||||||||
(a) | This category represents investment grade bonds of U.S. and non-U.S. issuers from diverse industries. |
(b) | This category included investment funds that primarily invest in U.S. and non-U.S. common stocks and fixed-income securities. |
(c) | This category represents direct investments in common and preferred stocks from diverse U.S. and non-U.S. industries. |
(d) | Certain investments measured at fair value using the net asset value per share (or its equivalent) have not been categorized in the fair value hierarchy. Amounts presented in this table are intended to reconcile the fair value hierarchy to the pension plan assets. |
(e) | Amounts exclude net payables of approximately $ |
OXY 2019 FORM 10-K | 103 |
| FINANCIAL STATEMENTS FOOTNOTES | |
Occidental expects to contribute $179 million in cash to its defined benefit pension plans during 2020. Estimated future benefit payments, which reflect expected future service, as appropriate, are as follows for the years ended December 31:
millions | Pension Benefits | Postretirement Benefits | ||||||
2020 | $ | $ | ||||||
2021 | $ | $ | ||||||
2022 | $ | $ | ||||||
2023 | $ | $ | ||||||
2024 | $ | $ | ||||||
2025 - 2029 | $ | $ | ||||||
NOTE 16 - INVESTMENTS AND RELATED-PARTY TRANSACTIONS |
EQUITY INVESTMENTS
As of December 31, 2019, and 2018, investments in unconsolidated entities were $6.4 billion and $1.7 billion, respectively. As of December 31, 2019, Occidental’s significant equity investments primarily consisted of the following:
millions | % Interest | Carrying amount | |||||
WES | % | $ | |||||
OxyChem Ingleside Facility | % | ||||||
Dolphin Energy Limited | % | ||||||
Other | various | ||||||
Total | $ | ||||||
As of December 31, 2018, Occidental’s significant equity investments consisted of investments in Plains, OxyChem Ingleside Facility and Dolphin Energy Limited. In September 2019, Occidental sold its equity investment in Plains, which consisted of an 11 percent interest in the general partner that owned approximately 40 percent in Plains Pipeline. See Note 4 - Acquisitions, Dispositions, and Other Transactions for additional information.
As part of the Acquisition, Occidental acquired equity investments in certain oil and gas properties and gathering and processing assets and assumed an associated notes payable which Occidental has the legal right of setoff and intends to net settle with its ownership interest in the equity investments. The notes payable can be net settled starting in 2022. The carrying value of the investment and note payable was $2.8 billion and $2.8 billion at December 31, 2019, respectively. Accordingly, the equity investments and the related notes payable are presented net on the Consolidated Balance Sheets.
Dividends received from equity investments were $422 million, $329 million, and $297 million to Occidental in 2019, 2018 and 2017, respectively. As of December 31, 2019, cumulative undistributed earnings of equity-method investees since they were acquired was immaterial. As of December 31, 2019, Occidental’s investments in equity investees exceeded the underlying equity in net assets by approximately $3.6 billion, of which $1.5 billion represented goodwill and the remainder comprised intangibles amortized over their estimated useful lives.
The following table presents the summarized financial information of its equity-method investments combined for the years ended and as of December 31:
millions | 2019 | 2018 | 2017 | |||||||||
Summarized Results of Operations(a) | ||||||||||||
Revenues and other income | $ | $ | $ | |||||||||
Costs and expenses | ||||||||||||
Net income | $ | $ | $ | |||||||||
Summarized Balance Sheet(b) | ||||||||||||
Current assets | $ | $ | $ | |||||||||
Non-current assets | $ | $ | $ | |||||||||
Current liabilities | $ | $ | $ | |||||||||
Long-term debt | $ | $ | $ | |||||||||
Other non-current liabilities | $ | $ | $ | |||||||||
Stockholders’ equity | $ | $ | $ | |||||||||
(a) | The 2019 Summarized Results of Operations include results of Plains for the period beginning January 1, 2019 through the date Occidental’s interest was sold in September 2019. |
(b) |
RELATED-PARTY TRANSACTIONS
From time to time, Occidental purchases oil, NGL, power, steam and chemicals from and sells oil, NGL, natural gas, chemicals and power to certain of its equity investees and other related parties. During 2019, 2018 and 2017, Occidental entered into the following related-party transactions and had the following amounts due from or to its related parties for the years ended December 31:
millions | 2019 | 2018 | 2017 | |||||||||
Sales (a,c) | $ | $ | $ | |||||||||
Purchases (b,c) | $ | $ | $ | |||||||||
Services | $ | $ | $ | |||||||||
Advances and amounts due from related parties | $ | $ | $ | |||||||||
Amounts due to related parties (d) | $ | $ | $ | |||||||||
(a) | In 2019, 2018 and 2017, sales of Occidental-produced oil and NGL to Plains Pipeline affiliates accounted for |
(b) | In 2019 and 2018, purchases of ethylene from the Ingleside ethylene cracker accounted for |
(c) | Excluded sales to and purchases from WES as it was a consolidated subsidiary from the date of the Acquisition through December 31, 2019. |
(d) | Amounts due to related parties at December 31, 2019 primarily consists of a |
NOTE 17 - FAIR VALUE MEASUREMENTS |
FAIR VALUES – RECURRING
In January 2012, Occidental entered into a long-term contract to purchase CO2. This contract contains a price adjustment clause that is linked to changes in NYMEX oil prices. Occidental determined that the portion of this contract linked to NYMEX oil prices is not clearly and closely related to the host contract, and Occidental therefore bifurcated this embedded pricing feature from its host contract and accounts for it at fair value in the consolidated financial statements.
104 | OXY 2019 FORM 10-K |
| FINANCIAL STATEMENTS FOOTNOTES | |
The following tables provide fair value measurement information for assets and liabilities that are measured on a recurring basis:
millions | Fair Value Measurements Using | Total Fair Value | ||||||||||||||||||
Balance Sheet Classification | Level 1 | Level 2 | Level 3 | Netting | ||||||||||||||||
December 31, 2019 | ||||||||||||||||||||
Embedded Derivatives | ||||||||||||||||||||
Accrued liabilities | $ | $ | $ | $ | $ | |||||||||||||||
Deferred credits and other liabilities - other | $ | $ | $ | $ | $ | |||||||||||||||
December 31, 2018 | ||||||||||||||||||||
Embedded Derivatives | ||||||||||||||||||||
Accrued liabilities | $ | $ | $ | $ | $ | |||||||||||||||
Deferred credits and other liabilities - other | $ | $ | $ | $ | $ | |||||||||||||||
FAIR VALUES – NONRECURRING
During 2019, Occidental measured assets and liabilities at acquisition-date fair value on a nonrecurring basis related to the Acquisition. See Note 3 - The Acquisition for more detail.
In 2019, Occidental recorded a $1 billion charge as a result of recording Occidental’s equity investment in WES at fair value upon loss of control, see Note 1 - Summary of Significant Accounting Policies. Additionally, Occidental’s oil and gas segment recognized pre-tax impairment and related charges of $285 million related to domestic undeveloped leases that were set to expire in the near term, where Occidental had no plans to pursue exploration activities, and $39 million related to Occidental’s mutually agreed early termination of its Qatar ISSD contract.
During 2018, Occidental recognized pre-tax impairment and related charges of $416 million primarily related to Qatar ISND and ISSD proved properties and inventory. The fair value of the proved properties was measured based on the income approach, which incorporated a number of assumptions involving expectations of future cash flows. These assumptions included estimates of future product prices, which Occidental based on forward price curves, estimates of oil and gas reserves, estimates of future expected operating and capital costs and a risk-adjusted discount rate of 10 percent. These inputs are categorized as Level 3 in the fair value hierarchy.
During 2017, Occidental recognized pre-tax impairment charges of $397 million primarily related to held for sale non-core proved and unproved Permian acreage. Assumptions for proved and unproved properties classified as held for sale include estimated third-party prices to be received based on recent transactions of similar acreage.
FINANCIAL INSTRUMENTS FAIR VALUE
The carrying amounts of cash, cash equivalents, restricted cash and restricted cash equivalents and other on-balance sheet financial instruments, other than fixed-rate debt, approximate fair value. See Note 7 - Long-term Debt for the fair value of Long-term debt.
NOTE 18 - INDUSTRY SEGMENTS AND GEOGRAPHIC AREAS |
Occidental conducts its operations through three segments: (1) oil and gas; (2) chemical; and (3) marketing and midstream.
Income taxes, interest income, interest expense, environmental remediation expenses, Anadarko acquisition-related costs and unallocated corporate expenses are included under Corporate and Eliminations. Intersegment sales eliminate upon consolidation and are generally made at prices approximating those that the selling entity would be able to obtain in third-party transactions. Identifiable assets are those assets used in the operations of the segments. Corporate assets consist of cash and restricted cash, certain corporate receivables and PP&E.
OXY 2019 FORM 10-K | 105 |
| FINANCIAL STATEMENTS FOOTNOTES | |
millions | Oil and Gas | Chemical | Marketing and Midstream | Corporate and Eliminations | Total | ||||||||||||||
Year ended December 31, 2019 | |||||||||||||||||||
Net sales | $ | $ | $ | $ | ( | ) | $ | ||||||||||||
Income (loss) from continuing operations before income taxes | $ | (a) | $ | $ | (b) | $ | ( | ) | (c) | $ | |||||||||
Income tax expense | ( | ) | (d) | ( | ) | ||||||||||||||
Income (loss) from continuing operations | $ | $ | $ | $ | ( | ) | $ | ( | ) | ||||||||||
Investments in unconsolidated entities | $ | $ | $ | $ | $ | ||||||||||||||
Property, plant and equipment additions(e) | $ | $ | $ | $ | $ | ||||||||||||||
Depreciation, depletion and amortization | $ | $ | $ | $ | $ | ||||||||||||||
Total assets | $ | $ | $ | $ | $ | ||||||||||||||
Year ended December 31, 2018 | |||||||||||||||||||
Net sales | $ | $ | $ | $ | ( | ) | $ | ||||||||||||
Income (loss) from continuing operations before income taxes | $ | (a) | $ | $ | (b) | $ | ( | ) | (c) | $ | |||||||||
Income tax expense | ( | ) | (d) | ( | ) | ||||||||||||||
Income (loss) from continuing operations | $ | $ | $ | $ | ( | ) | $ | ||||||||||||
Investments in unconsolidated entities | $ | $ | $ | $ | $ | ||||||||||||||
Property, plant and equipment additions(e) | $ | $ | $ | $ | $ | ||||||||||||||
Depreciation, depletion and amortization | $ | $ | $ | $ | $ | ||||||||||||||
Total assets | $ | $ | $ | $ | $ | ||||||||||||||
Year ended December 31, 2017 | |||||||||||||||||||
Net sales | $ | $ | $ | $ | ( | ) | $ | ||||||||||||
Income (loss) from continuing operations before income taxes | $ | (a) | $ | $ | (b) | $ | ( | ) | (c) | $ | |||||||||
Income tax expense | ( | ) | (d) | ( | ) | ||||||||||||||
Income (loss) from continuing operations | $ | $ | $ | $ | ( | ) | $ | ||||||||||||
Investments in unconsolidated entities | $ | $ | $ | $ | $ | ||||||||||||||
Property, plant and equipment additions(e) | $ | $ | $ | $ | $ | ||||||||||||||
Depreciation, depletion and amortization | $ | $ | $ | $ | $ | ||||||||||||||
Total assets | $ | $ | $ | $ | $ | ||||||||||||||
(a) | The 2019 amount included a net gain on sale of $ |
(b) | The 2019 amount included a $ |
(c) | The 2019 amount included corporate transactions related to the Acquisition including charges of $ |
(d) | Included all foreign and domestic income taxes from continuing operations. |
(e) | Included capital expenditures and capitalized interest, but excluded acquisition and disposition of assets. |
106 | OXY 2019 FORM 10-K |
| FINANCIAL STATEMENTS FOOTNOTES | |
GEOGRAPHIC AREAS
Property, plant and equipment, net | ||||||||||||
millions | 2019 | 2018 | 2017 | |||||||||
United States | $ | $ | $ | |||||||||
International | ||||||||||||
United Arab Emirates | ||||||||||||
Oman | ||||||||||||
Colombia | ||||||||||||
Qatar | ||||||||||||
Other International | ||||||||||||
Total International | ||||||||||||
Total | $ | $ | $ | |||||||||
OXY 2019 FORM 10-K | 107 |
| Supplemental Quarterly Information (Unaudited) |
Quarterly Financial Data | Occidental Petroleum Corporation and Subsidiaries |
millions except per-share amounts | First Quarter | Second Quarter | Third Quarter | Fourth Quarter | ||||||||||||
2019 | ||||||||||||||||
Segment net sales | ||||||||||||||||
Oil and gas | $ | 2,351 | $ | 2,718 | $ | 3,821 | $ | 4,533 | ||||||||
Chemical | 1,059 | 998 | 1,071 | 974 | ||||||||||||
Marketing and Midstream(a) | 816 | 909 | 1,163 | 1,244 | ||||||||||||
Eliminations | (222 | ) | (205 | ) | (368 | ) | (469 | ) | ||||||||
Net sales | $ | 4,004 | $ | 4,420 | $ | 5,687 | $ | 6,282 | ||||||||
Gross profit | $ | 1,210 | $ | 1,449 | $ | 1,422 | $ | 1,287 | ||||||||
Segment earnings | ||||||||||||||||
Oil and gas | $ | 484 | $ | 726 | $ | 221 | $ | 921 | ||||||||
Chemical | 265 | 208 | 207 | 119 | ||||||||||||
Marketing and Midstream(a) | 279 | 331 | 400 | (769 | ) | |||||||||||
Total segment earnings | $ | 1,028 | $ | 1,265 | $ | 828 | $ | 271 | ||||||||
Unallocated corporate items | ||||||||||||||||
Interest expense, net | (83 | ) | (143 | ) | (360 | ) | (416 | ) | ||||||||
Income taxes | (225 | ) | (306 | ) | (116 | ) | (46 | ) | ||||||||
Other | (89 | ) | (181 | ) | (1,089 | ) | (845 | ) | ||||||||
Income (loss) from continuing operations | $ | 631 | $ | 635 | $ | (737 | ) | $ | (1,036 | ) | ||||||
Discontinued operates, net of taxes | — | — | (15 | ) | — | |||||||||||
Net Income (loss) | $ | 631 | $ | 635 | $ | (752 | ) | $ | (1,036 | ) | ||||||
Less: Net income attributable to noncontrolling interests | — | — | (42 | ) | (103 | ) | ||||||||||
Less: Preferred stock dividend | — | — | (118 | ) | (200 | ) | ||||||||||
Net income (loss) attributable to common stockholders | $ | 631 | $ | 635 | $ | (912 | ) | $ | (1,339 | ) | ||||||
Basic earnings (loss) per common share | $ | 0.84 | $ | 0.84 | $ | (1.08 | ) | $ | (1.50 | ) | ||||||
Diluted earnings (loss) per common share | $ | 0.84 | $ | 0.84 | $ | (1.08 | ) | $ | (1.50 | ) | ||||||
Dividends per common share | $ | 0.78 | $ | 0.78 | $ | 0.79 | $ | 0.79 | ||||||||
2018 | ||||||||||||||||
Segment net sales | ||||||||||||||||
Oil and gas | $ | 2,454 | $ | 2,531 | $ | 2,889 | $ | 2,567 | ||||||||
Chemical | 1,154 | 1,176 | 1,185 | 1,142 | ||||||||||||
Marketing and Midstream | 389 | 603 | 1,367 | 1,297 | ||||||||||||
Eliminations | (234 | ) | (227 | ) | (225 | ) | (244 | ) | ||||||||
Net sales | $ | 3,763 | $ | 4,083 | $ | 5,216 | $ | 4,762 | ||||||||
Gross profit | $ | 1,371 | $ | 1,556 | $ | 2,297 | $ | 1,616 | ||||||||
Segment earnings | ||||||||||||||||
Oil and gas | $ | 750 | $ | 780 | $ | 767 | $ | 145 | ||||||||
Chemical | 298 | 317 | 321 | 223 | ||||||||||||
Marketing and Midstream | 179 | 250 | 1,698 | 675 | ||||||||||||
Total segment earnings | $ | 1,227 | $ | 1,347 | $ | 2,786 | $ | 1,043 | ||||||||
Unallocated corporate items | ||||||||||||||||
Interest expense, net | (92 | ) | (91 | ) | (92 | ) | (81 | ) | ||||||||
Income taxes | (339 | ) | (302 | ) | (710 | ) | (126 | ) | ||||||||
Other | (88 | ) | (106 | ) | (115 | ) | (130 | ) | ||||||||
Net income attributable to common stockholders | $ | 708 | $ | 848 | $ | 1,869 | $ | 706 | ||||||||
Basic earnings per common share | $ | 0.92 | $ | 1.10 | $ | 2.44 | $ | 0.93 | ||||||||
Diluted earnings per common share | $ | 0.92 | $ | 1.10 | $ | 2.44 | $ | 0.93 | ||||||||
Dividends per common share | $ | 0.77 | $ | 0.77 | $ | 0.78 | $ | 0.78 | ||||||||
(a) | Marketing and Midstream segment net sales and earnings include the results of WES from the Acquisition date to the loss of control date. |
108 | OXY 2019 FORM 10-K |
| Supplemental Oil and Gas Information (Unaudited) |
Supplemental Oil and Gas Information
OIL AND GAS RESERVES
The following tables set forth Occidental’s net interests in quantities of proved developed and undeveloped reserves of oil (including condensate), NGL and natural gas and changes in such quantities. Proved oil, NGL and natural gas reserves were estimated using the unweighted arithmetic average of the first-day-of-the-month price for each month within the year, unless prices were defined by contractual arrangements. Oil, NGL and natural gas prices used for this purpose were based on posted benchmark prices and adjusted for price differentials including gravity, quality and transportation costs. The following table shows the pricing used in the reserve analysis for the periods presented:
2019 | 2018 | 2017 | ||||
Average WTI oil price (per barrel) | $55.69 | $65.56 | $51.34 | |||
Average Brent price (per barrel) | $63.03 | $72.20 | $54.93 | |||
Average Henry Hub natural gas price (per MMBtu) | $2.58 | $3.10 | $2.98 | |||
Reserves are stated net of applicable royalties. Estimated reserves include Occidental’s economic interests under production-sharing contracts (PSCs) and other similar economic arrangements. In addition, discussions of oil and gas production or volumes, in general, refer to sales volumes unless the context requires or it is indicated otherwise.
Prices for oil, natural gas and NGL fluctuate widely. Historically, the markets for oil, natural gas, NGL and refined products have been volatile and may continue to be volatile in the future. Prolonged or further declines in oil, natural gas and NGL prices would continue to reduce Occidental’s operating results and cash flows, and could impact its future rate of growth and further impact the recoverability of the carrying value of its assets.
Proved undeveloped reserves in the Permian Basin are supported by a five-year detailed field-level development plan, which includes the timing, location and capital commitment of the wells to be drilled. Only proved undeveloped reserves which are reasonably certain to be drilled within five years of booking and are supported by a final investment decision to drill them are included in the development plan. A portion of the proved undeveloped reserves associated with international operations are expected to be developed beyond the five years and are tied to approved long-term development plans.
109 | OXY 2019 FORM 10-K |
| Supplemental Oil and Gas Information (Unaudited) |
OIL RESERVES(a)
millions of barrels (MMbbl) | United States | Latin America | Middle East (b) | Total | ||||||||
PROVED DEVELOPED AND UNDEVELOPED RESERVES | ||||||||||||
Balance at December 31, 2016 | 960 | 71 | 326 | 1,357 | ||||||||
Revisions of previous estimates | 66 | 14 | 33 | 113 | ||||||||
Improved recovery | 97 | 8 | 17 | 122 | ||||||||
Extensions and discoveries | — | — | 5 | 5 | ||||||||
Purchases of proved reserves | 70 | — | — | 70 | ||||||||
Sales of proved reserves | (13 | ) | — | — | (13 | ) | ||||||
Production | (73 | ) | (11 | ) | (55 | ) | (139 | ) | ||||
Balance at December 31, 2017 | 1,107 | 82 | 326 | 1,515 | ||||||||
Revisions of previous estimates | 15 | (2 | ) | (7 | ) | 6 | ||||||
Improved recovery | 135 | 23 | 31 | 189 | ||||||||
Extensions and discoveries | — | 4 | 2 | 6 | ||||||||
Purchases of proved reserves | 32 | — | — | 32 | ||||||||
Sales of proved reserves | (12 | ) | — | — | (12 | ) | ||||||
Production | (91 | ) | (11 | ) | (51 | ) | (153 | ) | ||||
Balance at December 31, 2018 | 1,186 | 96 | 301 | 1,583 | ||||||||
Revisions of previous estimates (c) | (154 | ) | 3 | 15 | (136 | ) | ||||||
Improved recovery | 128 | 12 | 25 | 165 | ||||||||
Extensions and discoveries | 37 | 2 | 2 | 41 | ||||||||
Purchases of proved reserves (d) | 545 | — | — | 545 | ||||||||
Sales of proved reserves | (17 | ) | — | — | (17 | ) | ||||||
Production | (155 | ) | (12 | ) | (44 | ) | (211 | ) | ||||
Balance at December 31, 2019 | 1,570 | 101 | 299 | 1,970 | ||||||||
PROVED DEVELOPED RESERVES | ||||||||||||
December 31, 2016 | 670 | 69 | 298 | 1,037 | ||||||||
December 31, 2017 | 772 | 77 | 279 | 1,128 | ||||||||
December 31, 2018 | 843 | 77 | 240 | 1,160 | ||||||||
December 31, 2019 (e) | 1,206 | 76 | 226 | 1,508 | ||||||||
PROVED UNDEVELOPED RESERVES | ||||||||||||
December 31, 2016 | 290 | 2 | 28 | 320 | ||||||||
December 31, 2017 | 335 | 5 | 47 | 387 | ||||||||
December 31, 2018 | 343 | 19 | 61 | 423 | ||||||||
December 31, 2019 | 364 | 25 | 73 | 462 | ||||||||
(a) | Excluded reserve amounts related to the Africa Assets. |
(b) | A majority of the proved reserve amounts relate to PSCs and other similar economic arrangements. |
(c) | Revisions of previous estimates in 2019 primarily related to negative price revisions, changes to development plans and reservoir performance in the Permian Basin. |
(d) | Purchases of proved reserves in 2019 related to acquired reserves through the Acquisition. |
(e) | Approximately 11% of the proved developed reserves at December 31, 2019, are nonproducing, primarily associated with Oman, Permian EOR and DJ Basin. |
110 | OXY 2019 FORM 10-K |
| Supplemental Oil and Gas Information (Unaudited) |
NGL RESERVES(a)
millions of barrels (MMbbl) | United States | Latin America | Middle East | Total | ||||||||
PROVED DEVELOPED AND UNDEVELOPED RESERVES | ||||||||||||
Balance at December 31, 2016 | 219 | — | 201 | 420 | ||||||||
Revisions of previous estimates | 11 | — | (2 | ) | 9 | |||||||
Improved recovery | 23 | — | 10 | 33 | ||||||||
Extensions and discoveries | — | — | — | — | ||||||||
Purchases of proved reserves | 21 | — | — | 21 | ||||||||
Sales of proved reserves | (7 | ) | — | — | (7 | ) | ||||||
Production | (20 | ) | — | (11 | ) | (31 | ) | |||||
Balance at December 31, 2017 | 247 | — | 198 | 445 | ||||||||
Revisions of previous estimates | 7 | — | 15 | 22 | ||||||||
Improved recovery | 47 | — | — | 47 | ||||||||
Extensions and discoveries | — | — | — | — | ||||||||
Purchases of proved reserves | 11 | — | — | 11 | ||||||||
Sales of proved reserves | (3 | ) | — | — | (3 | ) | ||||||
Production | (25 | ) | — | (11 | ) | (36 | ) | |||||
Balance at December 31, 2018 | 284 | — | 202 | 486 | ||||||||
Revisions of previous estimates (b) | (21 | ) | — | 10 | (11 | ) | ||||||
Improved recovery | 58 | — | — | 58 | ||||||||
Extensions and discoveries | 11 | — | — | 11 | ||||||||
Purchases of proved reserves (c) | 267 | — | — | 267 | ||||||||
Sales of proved reserves | (7 | ) | — | — | (7 | ) | ||||||
Production | (52 | ) | — | (12 | ) | (64 | ) | |||||
Balance at December 31, 2019 | 540 | — | 200 | 740 | ||||||||
PROVED DEVELOPED RESERVES | ||||||||||||
December 31, 2016 | 149 | — | 164 | 313 | ||||||||
December 31, 2017 | 161 | — | 153 | 314 | ||||||||
December 31, 2018 | 196 | — | 145 | 341 | ||||||||
December 31, 2019 (d) | 406 | — | 141 | 547 | ||||||||
PROVED UNDEVELOPED RESERVES | ||||||||||||
December 31, 2016 | 70 | — | 37 | 107 | ||||||||
December 31, 2017 | 86 | — | 45 | 131 | ||||||||
December 31, 2018 | 88 | — | 57 | 145 | ||||||||
December 31, 2019 | 134 | — | 59 | 193 | ||||||||
(a) | Excluded reserve amounts related to the Africa Assets. |
(b) | Revisions of previous estimates in 2019 primarily related to negative price revisions, changes to development plans and reservoir performance in the Permian Basin and DJ Basin. |
(c) | Purchases of proved reserves in 2019 related to acquired reserves through the Acquisition. |
(d) | Approximately 6% of the proved developed reserves at December 31, 2019, are nonproducing, primarily associated with Permian EOR and DJ Basin. |
OXY 2019 FORM 10-K | 111 |
| Supplemental Oil and Gas Information (Unaudited) |
NATURAL GAS RESERVES(a)
billions of cubic feet (Bcf) | United States | Latin America | Middle East (b) | Total | ||||||||
PROVED DEVELOPED AND UNDEVELOPED RESERVES | ||||||||||||
Balance at December 31, 2016 | 1,045 | 6 | 2,723 | 3,774 | ||||||||
Revisions of previous estimates | 197 | 8 | (33 | ) | 172 | |||||||
Improved recovery | 167 | 1 | 106 | 274 | ||||||||
Extensions and discoveries | — | — | 3 | 3 | ||||||||
Purchases of proved reserves | 50 | — | — | 50 | ||||||||
Sales of proved reserves | (146 | ) | — | — | (146 | ) | ||||||
Production | (108 | ) | (3 | ) | (185 | ) | (296 | ) | ||||
Balance at December 31, 2017 | 1,205 | 12 | 2,614 | 3,831 | ||||||||
Revisions of previous estimates | (25 | ) | — | 191 | 166 | |||||||
Improved recovery | 329 | 1 | 17 | 347 | ||||||||
Extensions and discoveries | — | — | 4 | 4 | ||||||||
Purchases of proved reserves | 69 | — | — | 69 | ||||||||
Sales of proved reserves | (14 | ) | — | — | (14 | ) | ||||||
Production | (119 | ) | (2 | ) | (187 | ) | (308 | ) | ||||
Balance at December 31, 2018 | 1,445 | 11 | 2,639 | 4,095 | ||||||||
Revisions of previous estimates (c) | (409 | ) | (1 | ) | 90 | (320 | ) | |||||
Improved recovery | 393 | 2 | 30 | 425 | ||||||||
Extensions and discoveries | 59 | 2 | 3 | 64 | ||||||||
Purchases of proved reserves (d) | 2,996 | — | — | 2,996 | ||||||||
Sales of proved reserves | (30 | ) | — | — | (30 | ) | ||||||
Production | (326 | ) | (2 | ) | (202 | ) | (530 | ) | ||||
Balance at December 31, 2019 | 4,128 | 12 | 2,560 | 6,700 | ||||||||
PROVED DEVELOPED RESERVES | ||||||||||||
December 31, 2016 | 708 | 6 | 2,324 | 3,038 | ||||||||
December 31, 2017 | 782 | 11 | 2,131 | 2,924 | ||||||||
December 31, 2018 | 978 | 11 | 2,015 | 3,004 | ||||||||
December 31, 2019 (e) | 3,198 | 11 | 1,996 | 5,205 | ||||||||
PROVED UNDEVELOPED RESERVES | ||||||||||||
December 31, 2016 | 337 | — | 399 | 736 | ||||||||
December 31, 2017 | 423 | 1 | 483 | 907 | ||||||||
December 31, 2018 | 467 | — | 624 | 1,091 | ||||||||
December 31, 2019 | 930 | 1 | 564 | 1,495 | ||||||||
(a) | Excluded reserve amounts related to the Africa Assets. |
(b) | Approximately one-third of Middle East proved reserves relate to PSCs and other similar economic arrangements. |
(c) | Revisions of previous estimates in 2019 primarily related to negative price revisions, changes to development plans and reservoir performance in the Permian Basin. |
(d) | Purchases of proved reserves in 2019 related to acquired reserves through the Acquisition. |
(e) | Approximately 4% of the proved developed reserves at December 31, 2019, are nonproducing, primarily associated with Permian EOR and DJ Basin. |
112 | OXY 2019 FORM 10-K |
| Supplemental Oil and Gas Information (Unaudited) |
TOTAL RESERVES(a)
millions of BOE (MMBOE) (b) | United States | Latin America | Middle East | Total(c) | ||||||||
PROVED DEVELOPED AND UNDEVELOPED RESERVES | ||||||||||||
Balance at December 31, 2016 | 1,353 | 72 | 981 | 2,406 | ||||||||
Revisions of previous estimates | 109 | 16 | 26 | 151 | ||||||||
Improved recovery | 149 | 8 | 44 | 201 | ||||||||
Extensions and discoveries | — | — | 5 | 5 | ||||||||
Purchases of proved reserves | 99 | — | — | 99 | ||||||||
Sales of proved reserves | (44 | ) | — | — | (44 | ) | ||||||
Production | (111 | ) | (12 | ) | (97 | ) | (220 | ) | ||||
Balance at December 31, 2017 | 1,555 | 84 | 959 | 2,598 | ||||||||
Revisions of previous estimates | 18 | (2 | ) | 40 | 56 | |||||||
Improved recovery | 237 | 23 | 34 | 294 | ||||||||
Extensions and discoveries | — | 4 | 3 | 7 | ||||||||
Purchases of proved reserves | 54 | — | — | 54 | ||||||||
Sales of proved reserves | (17 | ) | — | — | (17 | ) | ||||||
Production | (136 | ) | (11 | ) | (93 | ) | (240 | ) | ||||
Balance at December 31, 2018 | 1,711 | 98 | 943 | 2,752 | ||||||||
Revisions of previous estimates (d) | (243 | ) | 3 | 40 | (200 | ) | ||||||
Improved recovery | 251 | 12 | 30 | 293 | ||||||||
Extensions and discoveries | 58 | 2 | 3 | 63 | ||||||||
Purchases of proved reserves (e) | 1,311 | — | — | 1,311 | ||||||||
Sales of proved reserves | (29 | ) | — | — | (29 | ) | ||||||
Production | (261 | ) | (12 | ) | (90 | ) | (363 | ) | ||||
Balance at December 31, 2019 | 2,798 | 103 | 926 | 3,827 | ||||||||
PROVED DEVELOPED RESERVES | ||||||||||||
December 31, 2016 | 937 | 70 | 849 | 1,856 | ||||||||
December 31, 2017 | 1,063 | 79 | 786 | 1,928 | ||||||||
December 31, 2018 | 1,202 | 79 | 721 | 2,002 | ||||||||
December 31, 2019(f) | 2,145 | 78 | 700 | 2,923 | ||||||||
PROVED UNDEVELOPED RESERVES | ||||||||||||
December 31, 2016 | 416 | 2 | 132 | 550 | ||||||||
December 31, 2017 | 492 | 5 | 173 | 670 | ||||||||
December 31, 2018 | 509 | 19 | 222 | 750 | ||||||||
December 31, 2019 | 653 | 25 | 226 | 904 | ||||||||
(a) | Excluded reserve amounts related to the Africa Assets. |
(b) | Natural gas volumes have been converted to barrels of oil equivalent (BOE) based on an energy content of six thousand cubic feet (Mcf) of gas to one barrel of oil. |
(c) | Included proved reserves related to PSCs and other similar economic arrangements of 0.5 billion BOE at December 31, 2019, 2018, 2017, and 2016. |
(d) | Revisions of previous estimates in 2019 primarily related to negative price revisions, changes to development plans and reservoir performance in the Permian Basin. |
(e) | Purchases of proved reserves in 2019 related to acquired reserves through the Acquisition. |
(f) | Approximately 8% of the proved developed reserves at December 31, 2019, are nonproducing, primarily associated with Oman, Permian EOR and DJ Basin. |
OXY 2019 FORM 10-K | 113 |
| Supplemental Oil and Gas Information (Unaudited) |
Reserves of Assets Held for Sale
The table below shows proved developed and undeveloped reserves related to Ghana and Algeria that were presented as held for sale at December 31, 2019:
Oil (MMbbl) | NGL(MMbbl) | Natural Gas (Bcf) | Total (MMBOE) | |||||||||
PROVED DEVELOPED RESERVES | 99 | 7 | 19 | 109 | ||||||||
PROVED UNDEVELOPED RESERVES | 14 | — | 11 | 16 | ||||||||
CAPITALIZED COSTS
Capitalized costs relating to oil and gas producing activities and related accumulated DD&A were as follows:
millions | United States | Latin America | Middle East | Total | ||||||||||||
December 31, 2019 | ||||||||||||||||
Proved properties | $ | 59,658 | $ | 3,667 | $ | 11,787 | $ | 75,112 | ||||||||
Unproved properties | 30,301 | 36 | 432 | 30,769 | ||||||||||||
Total capitalized costs (a,b) | 89,959 | 3,703 | 12,219 | 105,881 | ||||||||||||
Proved properties depreciation, depletion and amortization | (20,961 | ) | (2,643 | ) | (8,853 | ) | (32,457 | ) | ||||||||
Unproved properties valuation | (1,025 | ) | (27 | ) | (170 | ) | (1,222 | ) | ||||||||
Total Accumulated depreciation, depletion and amortization | (21,986 | ) | (2,670 | ) | (9,023 | ) | (33,679 | ) | ||||||||
Net capitalized costs | $ | 67,973 | $ | 1,033 | $ | 3,196 | $ | 72,202 | ||||||||
December 31, 2018 | ||||||||||||||||
Proved properties | $ | 35,717 | $ | 3,436 | $ | 17,302 | $ | 56,455 | ||||||||
Unproved properties | 1,900 | 43 | 401 | 2,344 | ||||||||||||
Total capitalized costs (a) | 37,617 | 3,479 | 17,703 | 58,799 | ||||||||||||
Proved properties depreciation, depletion and amortization | (17,188 | ) | (2,514 | ) | (14,286 | ) | (33,988 | ) | ||||||||
Unproved properties valuation | (1,200 | ) | (27 | ) | (85 | ) | (1,312 | ) | ||||||||
Total Accumulated depreciation, depletion and amortization | (18,388 | ) | (2,541 | ) | (14,371 | ) | (35,300 | ) | ||||||||
Net capitalized costs | $ | 19,229 | $ | 938 | $ | 3,332 | $ | 23,499 | ||||||||
December 31, 2017 | ||||||||||||||||
Proved properties | $ | 31,091 | $ | 3,194 | $ | 16,582 | $ | 50,867 | ||||||||
Unproved properties | 2,094 | 53 | 394 | 2,541 | ||||||||||||
Total capitalized costs (a) | 33,185 | 3,247 | 16,976 | 53,408 | ||||||||||||
Proved properties depreciation, depletion and amortization | (14,609 | ) | (2,412 | ) | (13,196 | ) | (30,217 | ) | ||||||||
Unproved properties valuation | (1,166 | ) | (27 | ) | — | (1,193 | ) | |||||||||
Total Accumulated depreciation, depletion and amortization | (15,775 | ) | (2,439 | ) | (13,196 | ) | (31,410 | ) | ||||||||
Net capitalized costs | $ | 17,410 | $ | 808 | $ | 3,780 | $ | 21,998 | ||||||||
(a) | Included acquisition costs, development costs, capitalized interest and asset retirement obligations. Excluded capitalized costs related to Africa Assets. |
(b) | $48.4 billion of capitalized costs are associated with the Acquisition. |
114 | OXY 2019 FORM 10-K |
| Supplemental Oil and Gas Information (Unaudited) |
COSTS INCURRED
Costs incurred in oil and gas property acquisition, exploration and development activities, whether capitalized or expensed, were as follows:
millions | United States | Latin America | Middle East | Total | ||||||||||||
FOR THE YEAR ENDED DECEMBER 31, 2019(a) | ||||||||||||||||
Property acquisition costs | ||||||||||||||||
Proved properties | $ | 19,567 | $ | 6 | $ | — | $ | 19,573 | ||||||||
Unproved properties | 29,042 | 1 | 11 | 29,054 | ||||||||||||
Exploration costs | 307 | 58 | 141 | 506 | ||||||||||||
Development costs | 4,449 | 196 | 563 | 5,208 | ||||||||||||
Costs incurred | $ | 53,365 | $ | 261 | $ | 715 | $ | 54,341 | ||||||||
FOR THE YEAR ENDED DECEMBER 31, 2018 | ||||||||||||||||
Property acquisition costs | ||||||||||||||||
Proved properties | $ | 428 | $ | — | $ | — | $ | 428 | ||||||||
Unproved properties | 46 | 4 | 2 | 52 | ||||||||||||
Exploration costs | 196 | 42 | 44 | 282 | ||||||||||||
Development costs | 3,387 | 203 | 698 | 4,288 | ||||||||||||
Costs incurred | $ | 4,057 | $ | 249 | $ | 744 | $ | 5,050 | ||||||||
FOR THE YEAR ENDED DECEMBER 31, 2017 | ||||||||||||||||
Property acquisition costs | ||||||||||||||||
Proved properties | $ | 880 | $ | — | $ | 1 | $ | 881 | ||||||||
Unproved properties | 32 | — | — | 32 | ||||||||||||
Exploration costs | 163 | 39 | 54 | 256 | ||||||||||||
Development costs | 1,981 | 157 | 582 | 2,720 | ||||||||||||
Costs incurred | $ | 3,056 | $ | 196 | $ | 637 | $ | 3,889 | ||||||||
(a) | Excluded costs incurred related to Africa Assets. |
OXY 2019 FORM 10-K | 115 |
| Supplemental Oil and Gas Information (Unaudited) |
RESULTS OF OPERATIONS
Occidental’s oil and gas producing activities for continuing operations, which exclude items such as asset dispositions, corporate overhead, interest and royalties, were as follows:
millions | United States | Latin America | Middle East | Total | ||||||||||||
FOR THE YEAR ENDED DECEMBER 31, 2019 | ||||||||||||||||
Revenues (a) | $ | 9,497 | $ | 703 | $ | 3,335 | $ | 13,535 | ||||||||
Lease operating costs | 2,271 | 163 | 904 | 3,338 | ||||||||||||
Transportation costs | 647 | 5 | 78 | 730 | ||||||||||||
Other operating expenses | 1,125 | 51 | 200 | 1,376 | ||||||||||||
Depreciation, depletion and amortization | 4,113 | 135 | 746 | 4,994 | ||||||||||||
Taxes other than on income | 651 | 8 | — | 659 | ||||||||||||
Exploration expenses | 99 | 45 | 102 | 246 | ||||||||||||
Oil and gas mark-to-market - Collars and CO2 | 15 | — | — | 15 | ||||||||||||
Pretax income before impairments and other charges | 576 | 296 | 1,305 | 2,177 | ||||||||||||
Asset impairments and other charges | 288 | — | 39 | 327 | ||||||||||||
Pretax income | 288 | 296 | 1,266 | 1,850 | ||||||||||||
Income tax expense (b) | 74 | 135 | 634 | 843 | ||||||||||||
Results of operations(c) | $ | 214 | $ | 161 | $ | 632 | $ | 1,007 | ||||||||
FOR THE YEAR ENDED DECEMBER 31, 2018 | ||||||||||||||||
Revenues (a) | $ | 5,747 | $ | 731 | $ | 3,963 | $ | 10,441 | ||||||||
Lease operating costs | 1,675 | 151 | 939 | 2,765 | ||||||||||||
Transportation costs | 11 | 3 | 98 | 112 | ||||||||||||
Other operating expenses | 676 | 49 | 186 | 911 | ||||||||||||
Depreciation, depletion and amortization | 2,321 | 102 | 831 | 3,254 | ||||||||||||
Taxes other than on income | 407 | 6 | — | 413 | ||||||||||||
Exploration expenses | 64 | 19 | 27 | 110 | ||||||||||||
Oil and gas mark-to-market - CO2 | (4 | ) | — | — | (4 | ) | ||||||||||
Pretax income before impairments and other charges | 597 | 401 | 1,882 | 2,880 | ||||||||||||
Asset impairments and other charges | 32 | — | 416 | 448 | ||||||||||||
Pretax income | 565 | 401 | 1,466 | 2,432 | ||||||||||||
Income tax expense (benefit) (b) | (131 | ) | 174 | 925 | 968 | |||||||||||
Results of operations | $ | 696 | $ | 227 | $ | 541 | $ | 1,464 | ||||||||
FOR THE YEAR ENDED DECEMBER 31, 2017 | ||||||||||||||||
Revenues (a) | $ | 4,047 | $ | 570 | $ | 3,253 | $ | 7,870 | ||||||||
Lease operating costs | 1,463 | 151 | 849 | 2,463 | ||||||||||||
Transportation costs | 11 | 4 | 101 | 116 | ||||||||||||
Other operating expenses | 621 | 51 | 166 | 838 | ||||||||||||
Depreciation, depletion and amortization | 2,549 | 124 | 596 | 3,269 | ||||||||||||
Taxes other than on income | 273 | 9 | — | 282 | ||||||||||||
Exploration expenses | 28 | 7 | 47 | 82 | ||||||||||||
Oil and gas mark-to-market - CO2 | (36 | ) | — | — | (36 | ) | ||||||||||
Pretax income (loss) before impairments and other charges | (862 | ) | 224 | 1,494 | 856 | |||||||||||
Asset impairments and other charges | 397 | 4 | — | 401 | ||||||||||||
Pretax income (loss) | (1,259 | ) | 220 | 1,494 | 455 | |||||||||||
Income tax expense (benefit) (b) | (695 | ) | 120 | 690 | 115 | |||||||||||
Results of operations | $ | (564 | ) | $ | 100 | $ | 804 | $ | 340 | |||||||
(a) | Revenues are net of royalty payments. |
(b) | U.S. federal income taxes reflect certain expenses related to oil and gas activities allocated for U.S. income tax purposes . These amounts are computed using the statutory rate in effect during the period. |
(c) | The 2019 results of operations excluded amounts related to Africa Assets. |
116 | OXY 2019 FORM 10-K |
| Supplemental Oil and Gas Information (Unaudited) |
RESULTS PER UNIT OF PRODUCTION FOR CONTINUING OPERATIONS
$/BOE (a) | United States | Latin America | Middle East | Total | ||||||||||||
FOR THE YEAR ENDED DECEMBER 31, 2019 | ||||||||||||||||
Revenues (b) | $ | 36.43 | $ | 56.70 | $ | 36.94 | $ | 37.25 | ||||||||
Lease operating costs | 8.71 | 13.18 | 10.01 | 9.19 | ||||||||||||
Transportation costs | 2.48 | 0.34 | 0.87 | 2.01 | ||||||||||||
Other operating expenses | 4.32 | 4.15 | 2.21 | 3.79 | ||||||||||||
Depreciation, depletion and amortization | 15.78 | 10.85 | 8.27 | 13.74 | ||||||||||||
Taxes other than on income | 2.50 | 0.63 | — | 1.81 | ||||||||||||
Exploration expenses | 0.38 | 3.66 | 1.13 | 0.68 | ||||||||||||
Oil and gas mark-to-market - Collars and CO2 | 0.06 | — | — | 0.04 | ||||||||||||
Pretax income before impairments and other charges | 2.20 | 23.89 | 14.45 | 5.99 | ||||||||||||
Asset impairments and other charges | 1.11 | — | 0.43 | 0.90 | ||||||||||||
Pretax income | 1.09 | 23.89 | 14.02 | 5.09 | ||||||||||||
Income tax expense(c) | 0.29 | 10.90 | 7.01 | 2.32 | ||||||||||||
Results of operations(d) | $ | 0.80 | $ | 12.99 | $ | 7.01 | $ | 2.77 | ||||||||
FOR THE YEAR ENDED DECEMBER 31, 2018 | ||||||||||||||||
Revenues (b) | $ | 42.30 | $ | 63.37 | $ | 42.78 | $ | 43.50 | ||||||||
Lease operating costs | 12.33 | 13.08 | 10.14 | 11.52 | ||||||||||||
Transportation costs | 0.08 | 0.24 | 1.06 | 0.47 | ||||||||||||
Other operating expenses | 4.98 | 4.24 | 2.01 | 3.79 | ||||||||||||
Depreciation, depletion and amortization | 17.08 | 8.88 | 8.96 | 13.56 | ||||||||||||
Taxes other than on income | 3.00 | 0.52 | — | 1.72 | ||||||||||||
Exploration expenses | 0.47 | 1.65 | 0.29 | 0.46 | ||||||||||||
Oil and gas mark-to-market - CO2 | (0.03 | ) | — | — | (0.01 | ) | ||||||||||
Pretax income before impairments and other charges | 4.39 | 34.76 | 20.32 | 11.99 | ||||||||||||
Asset impairments and other charges | 0.24 | — | 4.49 | 1.87 | ||||||||||||
Pretax income | 4.15 | 34.76 | 15.83 | 10.12 | ||||||||||||
Income tax expense (benefit) (c) | (0.96 | ) | 15.08 | 9.99 | 4.03 | |||||||||||
Results of operations | $ | 5.11 | $ | 19.68 | $ | 5.84 | $ | 6.09 | ||||||||
FOR THE YEAR ENDED DECEMBER 31, 2017 | ||||||||||||||||
Revenues (b) | $ | 36.50 | $ | 47.79 | $ | 33.51 | $ | 35.79 | ||||||||
Lease operating costs | 13.19 | 12.66 | 8.75 | 11.20 | ||||||||||||
Transportation costs | 0.10 | 0.33 | 1.04 | 0.53 | ||||||||||||
Other operating expenses | 5.60 | 4.28 | 1.71 | 3.81 | ||||||||||||
Depreciation, depletion and amortization | 22.99 | 10.37 | 6.14 | 14.87 | ||||||||||||
Taxes other than on income | 2.47 | 0.75 | — | 1.28 | ||||||||||||
Exploration expenses | 0.25 | 0.59 | 0.48 | 0.37 | ||||||||||||
Oil and gas mark-to-market - CO2 | (0.32 | ) | — | — | (0.16 | ) | ||||||||||
Pretax income before impairments and other charges | (7.78 | ) | 18.81 | 15.39 | 3.89 | |||||||||||
Asset impairments and other charges | 3.58 | 0.34 | — | 1.82 | ||||||||||||
Pretax income (loss) | (11.36 | ) | 18.47 | 15.39 | 2.07 | |||||||||||
Income tax expense (benefit) (c) | (6.27 | ) | 10.06 | 7.11 | 0.52 | |||||||||||
Results of operations | $ | (5.09 | ) | $ | 8.41 | $ | 8.28 | $ | 1.55 | |||||||
(a) | Natural gas volumes have been converted to barrels of oil equivalent (BOE) based on energy content of six thousand cubic feet (Mcf) of gas to one barrel of oil. |
(b) | Revenues are net of royalty payments. |
(c) | U.S. federal income taxes reflect certain expenses related to oil and gas activities allocated for U.S. income tax purposes . These amounts are computed using the statutory rate in effect during the period. |
(d) | The 2019 results of operations excluded amounts related to Africa Assets. |
OXY 2019 FORM 10-K | 117 |
| Supplemental Oil and Gas Information (Unaudited) |
STANDARDIZED MEASURE, INCLUDING YEAR-TO-YEAR CHANGES THEREIN, OF DISCOUNTED FUTURE NET CASH FLOWS
For purposes of the following disclosures, future cash flows were computed by applying to Occidental’s proved oil and gas reserves the unweighted arithmetic average of the first-day-of-the-month price for each month within the years ended December 31, 2019, 2018, and 2017, respectively, unless prices were defined by contractual arrangements, and exclude escalations based upon future conditions. The realized prices used to calculate future cash flows vary by producing area and market conditions. Future operating and capital costs were forecast using the current cost environment applied to expectations of future operating and development activities to develop and produce proved reserves at year end.
2019 | 2018 | 2017 | ||||
Average WTI oil price (per barrel) | $55.69 | $65.56 | $51.34 | |||
Average Brent price (per barrel) | $63.03 | $72.20 | $54.93 | |||
Average Henry Hub natural gas price (per MMBtu) | $2.58 | $3.10 | $2.98 | |||
Future income tax expenses were computed by applying, generally, year-end statutory tax rates (adjusted for permanent differences, tax credits, allowances and foreign income repatriation considerations) to the estimated net future pre-tax cash flows. The discount was computed by application of a 10% discount factor. The calculations assumed the continuation of existing economic, operating and contractual conditions at December 31, 2019, 2018, and 2017. Such assumptions, which are required by regulation, have not always proven accurate in the past. Other valid assumptions would give rise to substantially different results.
STANDARDIZED MEASURE OF DISCOUNTED FUTURE NET CASH FLOWS
millions | United States | Latin America | Middle East | Total | ||||||||||||
AT DECEMBER 31, 2019 | ||||||||||||||||
Future cash inflows | $ | 97,293 | $ | 5,803 | $ | 28,715 | $ | 131,811 | ||||||||
Future costs | ||||||||||||||||
Production costs and other operating | (47,685 | ) | (2,824 | ) | (9,786 | ) | (60,295 | ) | ||||||||
Development costs (a) | (13,137 | ) | (553 | ) | (2,543 | ) | (16,233 | ) | ||||||||
Future income tax expense | (4,097 | ) | (687 | ) | (2,559 | ) | (7,343 | ) | ||||||||
Future net cash flows | 32,374 | 1,739 | 13,827 | 47,940 | ||||||||||||
10% discount factor | (12,427 | ) | (701 | ) | (6,819 | ) | (19,947 | ) | ||||||||
Standardized measure of discounted future net cash flows (b) | $ | 19,947 | $ | 1,038 | $ | 7,008 | $ | 27,993 | ||||||||
AT DECEMBER 31, 2018 | ||||||||||||||||
Future cash inflows | $ | 75,313 | $ | 6,104 | $ | 31,158 | $ | 112,575 | ||||||||
Future costs | ||||||||||||||||
Production costs and other operating | (33,373 | ) | (2,673 | ) | (9,609 | ) | (45,655 | ) | ||||||||
Development costs (a) | (9,450 | ) | (377 | ) | (2,136 | ) | (11,963 | ) | ||||||||
Future income tax expense | (4,150 | ) | (959 | ) | (3,524 | ) | (8,633 | ) | ||||||||
Future net cash flows | 28,340 | 2,095 | 15,889 | 46,324 | ||||||||||||
10% discount factor | (14,288 | ) | (846 | ) | (7,729 | ) | (22,863 | ) | ||||||||
Standardized measure of discounted future net cash flows | $ | 14,052 | $ | 1,249 | $ | 8,160 | $ | 23,461 | ||||||||
AT DECEMBER 31, 2017 | ||||||||||||||||
Future cash inflows | $ | 59,289 | $ | 3,961 | $ | 25,662 | $ | 88,912 | ||||||||
Future costs | ||||||||||||||||
Production costs and other operating | (29,318 | ) | (1,915 | ) | (9,349 | ) | (40,582 | ) | ||||||||
Development costs (a) | (7,986 | ) | (238 | ) | (2,199 | ) | (10,423 | ) | ||||||||
Future income tax expense | (1,838 | ) | (543 | ) | (2,906 | ) | (5,287 | ) | ||||||||
Future net cash flows | 20,147 | 1,265 | 11,208 | 32,620 | ||||||||||||
10% discount factor | (10,951 | ) | (423 | ) | (5,026 | ) | (16,400 | ) | ||||||||
Standardized measure of discounted future net cash flows | $ | 9,196 | $ | 842 | $ | 6,182 | $ | 16,220 | ||||||||
(a) | Included asset retirement costs. |
(b) | Excluded discounted future net cash flows of $2.0 billion related to Occidental’s Africa Assets. |
118 | OXY 2019 FORM 10-K |
| Supplemental Oil and Gas Information (Unaudited) |
CHANGES IN THE STANDARDIZED MEASURE OF DISCOUNTED FUTURE NET CASH FLOWS FROM PROVED RESERVE QUANTITIES
millions | 2019 | 2018 | 2017 | |||||||||
Balance at January 1 | $ | 23,461 | $ | 16,220 | $ | 9,713 | ||||||
Sales and transfers of oil and gas produced, net of production costs and other operating expenses | (8,884 | ) | (7,828 | ) | (5,362 | ) | ||||||
Net change in prices received per barrel, net of production costs and other operating expenses | (6,823 | ) | 9,482 | 7,598 | ||||||||
Extensions, discoveries and improved recovery, net of future production and development costs | 2,607 | 3,378 | 1,534 | |||||||||
Change in estimated future development costs | (1,636 | ) | (3,463 | ) | (1,283 | ) | ||||||
Revisions of quantity estimates | (1,769 | ) | 664 | 966 | ||||||||
Previously estimated development costs incurred during the period | 3,297 | 1,943 | 1,643 | |||||||||
Accretion of discount | 2,276 | 1,551 | 922 | |||||||||
Net change in income taxes | 2,905 | (1,182 | ) | (528 | ) | |||||||
Purchases and sales of reserves in place, net | 9,945 | 347 | 688 | |||||||||
Changes in production rates and other | 2,614 | 2,349 | 329 | |||||||||
Net change | 4,532 | 7,241 | 6,507 | |||||||||
Balance at December 31 | $ | 27,993 | $ | 23,461 | $ | 16,220 | ||||||
AVERAGE SALES PRICE
The following table sets forth, for each year in the three-year period ended December 31, 2019, Occidental’s approximate average sales prices in continuing operations:
United States | Latin America | Middle East | Total | |||||||||||||
2019 | ||||||||||||||||
Oil ($/bbl) | $ | 54.31 | $ | 57.26 | $ | 61.96 | $ | 56.09 | ||||||||
NGL ($/bbl) | $ | 16.03 | $ | — | $ | 21.31 | $ | 17.06 | ||||||||
Gas ($/Mcf) | $ | 1.31 | $ | 7.01 | $ | 1.59 | $ | 1.45 | ||||||||
2018 | ||||||||||||||||
Oil ($/bbl) | $ | 56.30 | $ | 64.32 | $ | 67.69 | $ | 60.64 | ||||||||
NGL ($/bbl) | $ | 27.64 | $ | — | $ | 23.20 | $ | 26.25 | ||||||||
Gas ($/Mcf) | $ | 1.59 | $ | 6.43 | $ | 1.58 | $ | 1.62 | ||||||||
2017 | ||||||||||||||||
Oil ($/bbl) | $ | 47.91 | $ | 48.50 | $ | 50.38 | $ | 48.93 | ||||||||
NGL ($/bbl) | $ | 23.67 | $ | — | $ | 18.05 | $ | 21.63 | ||||||||
Gas ($/Mcf) | $ | 2.31 | $ | 5.08 | $ | 1.52 | $ | 1.84 | ||||||||
OXY 2019 FORM 10-K | 119 |
| Supplemental Oil and Gas Information (Unaudited) |
NET PRODUCTIVE AND DRY— EXPLORATORY AND DEVELOPMENT WELLS COMPLETED
The following table sets forth, for each year in the three-year period ended December 31, 2019, Occidental’s net productive and dry exploratory and development wells completed:
United States | Latin America | Middle East | Total | |||||||||
2019 | ||||||||||||
Oil | ||||||||||||
Exploratory | 22 | — | 7 | 29 | ||||||||
Development | 422 | 68 | 129 | 619 | ||||||||
Gas | ||||||||||||
Exploratory | — | 2 | 5 | 7 | ||||||||
Development | 2 | — | 2 | 4 | ||||||||
Dry | ||||||||||||
Exploratory | 1 | 3 | 6 | 10 | ||||||||
Development | — | 1 | — | 1 | ||||||||
2018 | ||||||||||||
Oil | ||||||||||||
Exploratory | 11 | 2 | 5 | 18 | ||||||||
Development | 267 | 54 | 138 | 459 | ||||||||
Gas | ||||||||||||
Development | 3 | — | 1 | 4 | ||||||||
Dry | ||||||||||||
Exploratory | — | 2 | 3 | 5 | ||||||||
2017 | ||||||||||||
Oil | ||||||||||||
Exploratory | 14 | 1 | 5 | 20 | ||||||||
Development | 201 | 51 | 105 | 357 | ||||||||
Gas | ||||||||||||
Development | 2 | — | 1 | 3 | ||||||||
Dry | ||||||||||||
Exploratory | — | — | 3 | 3 | ||||||||
PRODUCTIVE OIL AND GAS WELLS
The following table sets forth, as of December 31, 2019, Occidental’s productive oil and gas wells (both producing and capable of production):
Wells at December 31, 2019 (a) | United States | Latin America | Middle East | Total | ||||||||||||||||||||
Oil | ||||||||||||||||||||||||
Gross (b) | 20,976 | (1,196 | ) | 1,881 | — | 2,579 | — | 25,436 | (1,196 | ) | ||||||||||||||
Net (c) | 17,304 | (1,076 | ) | 954 | — | 1,205 | — | 19,463 | (1,076 | ) | ||||||||||||||
Gas | ||||||||||||||||||||||||
Gross (b) | 9,596 | (2,386 | ) | 35 | — | 113 | (2 | ) | 9,744 | (2,388 | ) | |||||||||||||
Net (c) | 8,056 | (2,138 | ) | 33 | — | 58 | (2 | ) | 8,147 | (2,140 | ) | |||||||||||||
(a) | The numbers in parentheses indicate the number of wells with multiple completions. |
(b) | The total number of wells in which interests are owned. |
(c) | The sum of fractional interests. |
120 | OXY 2019 FORM 10-K |
| Supplemental Oil and Gas Information (Unaudited) |
PARTICIPATION IN WELLS BEING DRILLED OR PENDING COMPLETION
The following table sets forth, as of December 31, 2019, Occidental’s participation in exploratory and development wells being drilled:
United States | Latin America | Middle East | Total | |||||||||
Exploratory and development wells being drilled | ||||||||||||
Gross | 73 | 2 | 23 | 98 | ||||||||
Net | 57 | 2 | 13 | 72 | ||||||||
Exploratory and development wells pending completion (a,b) | ||||||||||||
Gross | 359 | — | — | 359 | ||||||||
Net | 294 | — | — | 294 | ||||||||
(a) | Wells suspended or waiting on completion include exploration and development wells where drilling has occurred, but the wells are awaiting the completion of hydraulic fracturing or other completion activities or the resumption of drilling in the future. |
(b) | There were 138 MMBOE of PUDs primarily assigned to U.S. onshore development wells suspended or waiting on completion at December 31, 2019, Occidental expects to convert all of these PUDs reserves to developed status within five years of their initial disclosure. |
At December 31, 2019, Occidental was participating in 109 pressure-maintenance projects, mostly waterfloods, in the United States, 9 in Latin America, and 44 in the Middle East.
OIL AND GAS ACREAGE
The following table sets forth, as of December 31, 2019, Occidental’s holdings of developed and undeveloped oil and gas acreage:
thousands | United States | Latin America | Middle East | Total | ||||||||
Developed (a) | ||||||||||||
Gross (b) | 6,782 | 146 | 589 | 7,517 | ||||||||
Net (c) | 4,208 | 97 | 215 | 4,520 | ||||||||
Undeveloped (d) | ||||||||||||
Gross (b) | 1,992 | 1,853 | 5,536 | 9,381 | ||||||||
Net (c) | 1,341 | 996 | 4,717 | 7,054 | ||||||||
Fee Mineral Ownership (e) | ||||||||||||
Gross (b) | 12,515 | — | — | 12,515 | ||||||||
Net (c) | 8,810 | — | — | 8,810 | ||||||||
(a) | Acres spaced or assigned to productive wells. |
(b) | Total acres in which interests are held. |
(c) | Sum of the fractional interests owned based on working interests, or interests under PSCs and other economic arrangements. |
(d) | Acres on which wells have not been drilled or completed to a point that would permit the production of commercial quantities of oil and gas, regardless of whether the acreage contains proved reserves. |
(e) | Occidental’s fee mineral acreage is primarily undeveloped. |
Occidental’s investment in developed and undeveloped acreage comprises numerous concessions, blocks and leases. Work programs are designed to ensure that the exploration potential of any property is fully evaluated before the contractual expiration date. In some instances, Occidental may elect to relinquish acreage in advance of the contractual expiration date if the evaluation process is complete and there is not a business basis for extension. In cases where additional time may be required to fully evaluate acreage, Occidental has generally been successful in obtaining extensions. Scheduled lease and concession expirations for undeveloped acreage over the next three years are not expected to have a material adverse impact on Occidental.
OXY 2019 FORM 10-K | 121 |
| Supplemental Oil and Gas Information (Unaudited) |
OIL, NGL AND NATURAL GAS SALES VOLUMES PER DAY
The following tables set forth the sales volumes from ongoing operations of oil, NGL and natural gas per day for each of the three years in the period ended December 31, 2019. The differences between the sales and production volumes per day are negligible and are generally due to the timing of shipments at Occidental’s international locations where product is loaded onto tankers. Natural gas volumes have been converted to BOE based on energy content of six Mcf of gas to one barrel of oil.
Sales per Day from Ongoing Operations (MBOE/d) | 2019 | 2018 | 2017 | ||||||
United States | |||||||||
Permian Resources | 355 | 214 | 141 | ||||||
Permian EOR | 154 | 154 | 150 | ||||||
DJ Basin | 120 | — | — | ||||||
Gulf of Mexico | 58 | — | — | ||||||
Other Domestic | 27 | 4 | 5 | ||||||
Total | 714 | 372 | 296 | ||||||
Latin America | 34 | 32 | 33 | ||||||
Middle East | |||||||||
Al Hosn Gas | 82 | 73 | 71 | ||||||
Dolphin | 42 | 40 | 42 | ||||||
Oman | 89 | 86 | 95 | ||||||
Qatar | 35 | 55 | 58 | ||||||
Total | 248 | 254 | 266 | ||||||
Total Sales from Ongoing Operations (MBOE/d) | 996 | 658 | 595 | ||||||
Sold domestic operations | — | — | 8 | ||||||
Discontinued operations - Africa Assets | 33 | — | — | ||||||
Total Sales (MBOE/d) | 1,029 | 658 | 603 | ||||||
122 | OXY 2019 FORM 10-K |
| Supplemental Oil and Gas Information (Unaudited) |
Sales per Day by Products from Ongoing Operations (MBOE/d) | 2019 | 2018 | 2017 | ||||||
United States | |||||||||
Oil (Mbbl) | |||||||||
Permian Resources | 207 | 132 | 85 | ||||||
Permian EOR | 117 | 117 | 113 | ||||||
DJ Basin | 46 | — | — | ||||||
Gulf of Mexico | 48 | — | — | ||||||
Other Domestic | 7 | 1 | 2 | ||||||
Total | 425 | 250 | 200 | ||||||
NGL (Mbbl) | |||||||||
Permian Resources | 74 | 38 | 26 | ||||||
Permian EOR | 30 | 29 | 27 | ||||||
DJ Basin | 28 | — | — | ||||||
Gulf of Mexico | 4 | — | — | ||||||
Other Domestic | 4 | — | — | ||||||
Total | 140 | 67 | 53 | ||||||
Natural gas (MMcf) | |||||||||
Permian Resources | 442 | 261 | 184 | ||||||
Permian EOR | 44 | 50 | 57 | ||||||
DJ Basin | 275 | — | — | ||||||
Gulf of Mexico | 34 | — | — | ||||||
Other Domestic | 98 | 16 | 18 | ||||||
Total | 893 | 327 | 259 | ||||||
Latin America | |||||||||
Oil (Mbbl) | 33 | 31 | 32 | ||||||
Natural gas (MMcf) | 7 | 6 | 7 | ||||||
Middle East | |||||||||
Oil (Mbbl) | |||||||||
Al Hosn Gas | 14 | 13 | 13 | ||||||
Dolphin | 7 | 7 | 7 | ||||||
Oman | 66 | 63 | 72 | ||||||
Qatar | 35 | 55 | 58 | ||||||
Total | 122 | 138 | 150 | ||||||
NGL (Mbbl) | |||||||||
Al Hosn Gas | 26 | 23 | 23 | ||||||
Dolphin | 8 | 8 | 8 | ||||||
Total | 34 | 31 | 31 | ||||||
Natural gas (MMcf) | |||||||||
Al Hosn Gas | 251 | 220 | 211 | ||||||
Dolphin | 161 | 152 | 159 | ||||||
Oman | 138 | 139 | 138 | ||||||
Total | 550 | 511 | 508 | ||||||
Total Sales from Ongoing Operations (MBOE/d) | 996 | 658 | 595 | ||||||
OXY 2019 FORM 10-K | 123 |
Schedule II – Valuation and Qualifying Accounts | Occidental Petroleum Corporation and Subsidiaries |
Additions | |||||||||||||||||||||
millions | Balance at Beginning of Period | Charged to Costs and Expenses | Charged to Other Accounts | Deductions (a) | Balance at End of Period | ||||||||||||||||
2019 | |||||||||||||||||||||
Allowance for doubtful accounts | $ | $ | $ | ( | ) | $ | $ | (b) | |||||||||||||
Environmental, litigation and other reserves | $ | $ | $ | $ | ( | ) | $ | (c) | |||||||||||||
2018 | |||||||||||||||||||||
Allowance for doubtful accounts | $ | $ | $ | ( | ) | $ | $ | (b) | |||||||||||||
Environmental, litigation, tax and other reserves | $ | $ | $ | $ | ( | ) | $ | (c) | |||||||||||||
2017 | |||||||||||||||||||||
Allowance for doubtful accounts | $ | $ | $ | ( | ) | $ | $ | (b) | |||||||||||||
Environmental, litigation, tax and other reserves | $ | $ | $ | $ | ( | ) | $ | (c) | |||||||||||||
Note: The amounts presented represent continuing operations.
(a) | Primarily represents payments. |
(b) | Of these amounts, $ |
(c) | Of these amounts, $ |
124 | OXY 2019 FORM 10-K |
ITEM 9. | CHANGES IN AND DISAGREEMENTS WITH ACCOUNTANTS ON ACCOUNTING AND FINANCIAL DISCLOSURE |
Occidental had no changes in, and no disagreements with, Occidental’s accountants on accounting and financial disclosure.
ITEM 9A. CONTROLS AND PROCEDURES
MANAGEMENT’S ANNUAL ASSESSMENT OF AND REPORT ON INTERNAL CONTROL OVER FINANCIAL REPORTING |
The management of Occidental Petroleum Corporation and its subsidiaries (Occidental) is responsible for establishing and maintaining adequate internal control over financial reporting. Occidental’s system of internal control over financial reporting is designed to provide reasonable assurance regarding the reliability of financial reporting and the preparation of consolidated financial statements for external purposes in accordance with generally accepted accounting principles. Occidental’s internal control over financial reporting includes those policies and procedures that: (i) pertain to the maintenance of records that, in reasonable detail, accurately and fairly reflect the transactions and dispositions of Occidental’s assets; (ii) provide reasonable assurance that transactions are recorded as necessary to permit preparation of financial statements in accordance with generally accepted accounting principles, and that Occidental’s receipts and expenditures are being made only in accordance with authorizations of Occidental’s management and directors; and (iii) provide reasonable assurance regarding prevention or timely detection of unauthorized acquisition, use or disposition of Occidental’s assets that could have a material effect on the financial statements.
Because of its inherent limitations, internal control over financial reporting may not prevent or detect misstatements. Also, projections of any evaluation of effectiveness to future periods are subject to the risk that controls may become inadequate because of changes in conditions, or that the degree of compliance with the policies or procedures may deteriorate.
Management has assessed the effectiveness of Occidental’s internal control system as of December 31, 2019, based on the criteria for effective internal control over financial reporting described in Internal Control - Integrated Framework issued in 2013 by the Committee of Sponsoring Organizations of the Treadway Commission (COSO). Based on this assessment, management believes that, as of December 31, 2019, Occidental’s system of internal control over financial reporting is effective.
Occidental’s independent auditors, KPMG LLP, have issued an audit report on Occidental’s internal control over financial reporting.
DISCLOSURE CONTROLS AND PROCEDURES |
Occidental’s President and Chief Executive Officer and its Senior Vice President and Chief Financial Officer supervised and participated in Occidental’s evaluation of its disclosure controls and procedures (as defined in Rules 13a-15(e) and 15d-15(e) under the Exchange Act) as of the end of the period covered by this report. Based upon that evaluation, Occidental’s President and Chief Executive Officer and Senior Vice President and Chief Financial Officer concluded that Occidental’s disclosure controls and procedures were effective as of December 31, 2019.
Except as described below, there has been no change in Occidental’s internal control over financial reporting (as defined in Rules 13a-15(f) and 15d-15(f) under the Exchange Act) during the fourth quarter of 2019 that has materially affected, or is reasonably likely to materially affect, Occidental’s internal control over financial reporting. The Report of Independent Registered Public Accounting Firm on Internal Control over Financial Reporting is set forth in Item 8.
In the third quarter of 2019, Occidental started the process of integrating Anadarko into its operations and internal control processes, resulting in some of Anadarko’s historical internal controls being superseded by Occidental’s internal controls. Management will continue to integrate Anadarko’s historical internal controls over financial reporting with Occidental’s internal controls over financial reporting. This integration may lead to changes in Occidental’s or Anadarko’s historical internal controls over financial reporting in future fiscal periods. Occidental is also in the process of implementing a new Enterprise Resource Planning (ERP) system which was implemented in January 2020. Occidental intends to integrate Anadarko’s internal control processes into Occidental’s internal control processes in conjunction with implementation of the ERP system. Management expects the integration process to be completed during 2021.
ITEM 9B. | OTHER INFORMATION |
None.
OXY 2019 FORM 10-K | 125 |
Part III
ITEM 10. | DIRECTORS, EXECUTIVE OFFICERS AND CORPORATE GOVERNANCE |
Occidental has adopted a Code of Business Conduct (Code). The Code applies to the President and Chief Executive Officer; Senior Vice President and Chief Financial Officer; Vice President, Chief Accounting Officer and Controller; and persons performing similar functions (Key Personnel). The Code also applies to Occidental’s directors, its employees and the employees of entities it controls. The Code is posted at www.oxy.com. Occidental will satisfy any disclosure requirement under Item 5.05 of Form 8-K regarding an amendment to, or waiver from, any provision of the Code with respect to its Key Personnel or directors by disclosing the nature of that amendment or waiver on its website within four business days following the date of the amendment or waiver.
The list of Occidental’s executive officers and related information under “Information About Our Executive Officers” set forth in Part I of this report is incorporated by reference herein. The information required by this Item 10 is incorporated herein by reference from Occidental’s definitive Proxy Statement to be filed with the SEC pursuant to Regulation 14A within 120 days of December 31, 2019.
ITEM 11. | EXECUTIVE COMPENSATION |
The information under the caption “Compensation Discussion and Analysis - Compensation Committee Report” shall not be deemed to be “soliciting material,” or to be “filed” with the SEC, or subject to Regulation 14A or 14C under the Exchange Act or to the liabilities of Section 18 of the Exchange Act, nor shall it be deemed incorporated by reference into any filing under the Securities Act of 1933. The information required by this Item 11 is incorporated herein by reference from Occidental’s definitive Proxy Statement to be filed with the SEC pursuant to Regulation 14A within 120 days of December 31, 2019.
ITEM 12. | SECURITY OWNERSHIP OF CERTAIN BENEFICIAL OWNERS AND MANAGEMENT AND RELATED STOCKHOLDER MATTERS |
SECURITIES AUTHORIZED FOR ISSUANCE UNDER EQUITY COMPENSATION PLANS |
All of Occidental’s stock-based compensation plans for its employees and non-employee directors have been approved by the stockholders. The aggregate number of shares of Occidental common stock authorized for issuance under such plans is approximately 80 million, of which approximately 6.6 million had been reserved for issuance through December 31, 2019. The following is a summary of the securities available for issuance under such plans:
a) | Number of securities to be issued upon exercise of outstanding options, warrants and rights | b) | Weighted-average exercise price of outstanding options, warrants and rights | c) | Number of securities remaining available for future issuance under equity compensation plans (excluding securities reflected in column (a)) | ||
7,450,436 (1) | $79.98 (2) | 52,452,301 (3) | |||||
(1) | Included shares reserved to be issued pursuant to restricted stock units, stock options (Options), and performance-based awards. Shares for performance-based awards are included assuming maximum payout, but may be paid out at lesser amounts, or not at all, according to achievement of performance goals. |
(2) | Price applies only to the Options included in column (a). Exercise price is not applicable to the other awards included in column (a). |
(3) | A plan provision requires each share covered by an award (other than stock appreciation rights (SARs) and Options) to be counted as if three shares were issued in determining the number of shares that are available for future awards. Accordingly, the number of shares available for future awards may be less than the amount shown depending on the type of award granted. Additionally, under the plan, the amount shown may increase, depending on the award type, by the number of shares currently unvested or forfeitable, or three times that number as applicable, that are forfeited or canceled, or correspond to the portion of any stock-based awards settled in cash. |
The information required by this Item 12 is incorporated herein by reference from Occidental’s definitive Proxy Statement to be filed with the SEC pursuant to Regulation 14A within 120 days of December 31, 2019.
ITEM 13. | CERTAIN RELATIONSHIPS AND RELATED TRANSACTIONS AND DIRECTOR INDEPENDENCE |
The information required by this Item 13 is incorporated herein by reference from Occidental’s definitive Proxy Statement to be filed with the SEC pursuant to Regulation 14A within 120 days of December 31, 2019.
126 | OXY 2019 FORM 10-K |
ITEM 14. | PRINCIPAL ACCOUNTING FEES AND SERVICES |
The information required by this Item 14 is incorporated herein by reference from Occidental’s definitive Proxy Statement to be filed with the SEC pursuant to Regulation 14A within 120 days of December 31, 2019.
Part IV
ITEM 15. | EXHIBITS AND FINANCIAL STATEMENT SCHEDULES |
The agreements included as exhibits to this report are included to provide information about their terms and not to provide any other factual or disclosure information about Occidental or the other parties to the agreements. The agreements contain representations and warranties by each of the parties to the applicable agreement that were made solely for the benefit of the other agreement parties and:
• | should not be treated as categorical statements of fact, but rather as a way of allocating the risk among the parties if those statements prove to be inaccurate; |
• | have been qualified by disclosures that were made to the other party in connection with the negotiation of the applicable agreement, which disclosures are not necessarily reflected in the agreement; |
• | may apply standards of materiality in a way that is different from the way investors may view materiality; and |
• | were made only as of the date of the applicable agreement or such other date or dates as may be specified in the agreement and are subject to more recent developments. |
(a) (1) and (2). Financial Statements and Financial Statement Schedule
Reference is made to Item 8 of the Table of Contents of this report, where these documents are listed.
(a) (3). Exhibits
2.1 | |
2.2 | |
3.(i) | |
3.(i)(a) | |
3.(ii) | |
3.(ii)(a) | |
4.1 | |
Instruments defining the rights of holders of other long-term debt of Occidental and its subsidiaries are not being filed since the total amount of securities authorized under each of such instruments does not exceed 10% of the total assets of Occidental and its subsidiaries on a consolidated basis. Occidental agrees to furnish a copy of any such instrument to the Commission upon request. | |
All of the Exhibits numbered 10.1 to 10.38 are management contracts and compensatory plans required to be identified specifically as responsive to Item 601(b)(10)(iii)(A) of Regulation S-K pursuant to Item 15(b) of Form 10-K. | |
10.1 | |
10.2 | |
10.3 | |
10.4 | |
10.5 | |
10.6 | |
OXY 2019 FORM 10-K | 127 |
10.7 | |
10.8 | |
10.9 | Form of Indemnification Agreement between Occidental and each of its directors and certain executive officers (filed as Exhibit B to the Proxy Statement of Occidental for its May 21, 1987, Annual Meeting of Stockholders, File No. 1-9210). |
10.10 | Occidental Petroleum Corporation Split Dollar Life Insurance Program and Related Documents (filed as Exhibit 10.2 to the Quarterly Report on Form 10-Q of Occidental for the quarterly period ended September 30, 1994, File No. 1-9210). |
10.11 | |
10.12 | |
10.13 | |
10.14 | |
10.15 | |
10.16 | |
10.17 | |
10.18 | |
10.19 | |
10.20 | |
10.21 | |
10.22 | |
10.23 | |
10.24 | |
10.25 | |
10.26 | |
10.27 | |
10.28 | |
128 | OXY 2019 FORM 10-K |
10.29 | |
10.30 | |
10.31 | |
10.32 | |
10.33 | |
10.34 | |
10.35 | |
10.36 | |
10.37 | |
10.38 | |
10.39 | |
10.40 | |
10.41 | |
10.42 | |
21 | |
23.1 | |
23.2 | |
23.3 | |
31.1 | |
31.2 | |
32.1 | |
99.1 | |
99.2 | |
101.INS | Inline XBRL Instance Document. |
101.SCH | Inline XBRL Taxonomy Extension Schema Document. |
101.CAL | Inline XBRL Taxonomy Extension Calculation Linkbase Document. |
101.LAB | Inline XBRL Taxonomy Extension Label Linkbase Document. |
101.PRE | Inline XBRL Taxonomy Extension Presentation Linkbase Document. |
101.DEF | Inline XBRL Taxonomy Extension Definition Linkbase Document. |
104 | |
OXY 2019 FORM 10-K | 129 |
ITEM 16. | FORM 10-K SUMMARY |
Not applicable.
130 | OXY 2019 FORM 10-K |
SIGNATURES |
Pursuant to the requirements of Section 13 or 15(d) of the Securities Exchange Act of 1934, the registrant has duly caused this report to be signed on its behalf by the undersigned, thereunto duly authorized.
OCCIDENTAL PETROLEUM CORPORATION | ||
By: | /s/ Vicki Hollub | |
Vicki Hollub | ||
President and Chief Executive Officer | ||
Pursuant to the requirements of the Securities Exchange Act of 1934, this report has been signed below by the following persons on behalf of the registrant and in the capacities and on the dates indicated.
Title | Date | |||
/s/ Vicki Hollub | President, Chief Executive Officer | February 27, 2020 | ||
Vicki Hollub | and Director | |||
/s/ Cedric W. Burgher | Senior Vice President and | February 27, 2020 | ||
Cedric W. Burgher | Chief Financial Officer | |||
/s/ Christopher O. Champion | Vice President, Chief Accounting Officer | February 27, 2020 | ||
Christopher O. Champion | and Controller | |||
/s/ Spencer Abraham | Director | February 27, 2020 | ||
Spencer Abraham | ||||
/s/ Eugene L. Batchelder | Chairman of the Board of Directors | February 27, 2020 | ||
Eugene L. Batchelder | ||||
/s/ Margaret M. Foran | Director | February 27, 2020 | ||
Margaret M. Foran | ||||
/s/ Carlos M. Gutierrez | Director | February 27, 2020 | ||
Carlos M. Gutierrez | ||||
/s/ William R. Klesse | Director | February 27, 2020 | ||
William R. Klesse | ||||
/s/ Jack B. Moore | Director | February 27, 2020 | ||
Jack B. Moore | ||||
/s/ Avedick B. Poladian | Director | February 27, 2020 | ||
Avedick B. Poladian | ||||
/s/ Robert M. Shearer | Director | February 27, 2020 | ||
Robert M. Shearer | ||||
/s/ Elisse B. Walter | Director | February 27, 2020 | ||
Elisse B. Walter | ||||
OXY 2019 FORM 10-K | 131 |