0000795266FALSE2021FYus-gaap:AccountingStandardsUpdate201409Memberus-gaap:AccountingStandardsUpdate201602Memberus-gaap:AccountingStandardsUpdate201613MemberP2YP2YP3Yus-gaap:OtherAssetsus-gaap:AccountsPayableAndAccruedLiabilitiesCurrentAndNoncurrent0.20.20.40.70.6us-gaap:OtherAssetsus-gaap:OtherAssetsus-gaap:AccountsPayableAndAccruedLiabilitiesCurrentAndNoncurrentus-gaap:AccountsPayableAndAccruedLiabilitiesCurrentAndNoncurrent0.20.30.20.30.20.40.60.6P2Y0.70.30.30.900007952662020-12-012021-11-300000795266us-gaap:CommonStockMember2020-12-012021-11-300000795266us-gaap:RightsMember2020-12-012021-11-3000007952662021-05-31iso4217:USDxbrli:shares00007952662021-12-310000795266us-gaap:SubsequentEventMember2021-12-3100007952662019-12-012020-11-3000007952662018-12-012019-11-300000795266us-gaap:HomeBuildingMember2020-12-012021-11-300000795266us-gaap:HomeBuildingMember2019-12-012020-11-300000795266us-gaap:HomeBuildingMember2018-12-012019-11-300000795266us-gaap:FinancialServiceMember2020-12-012021-11-300000795266us-gaap:FinancialServiceMember2019-12-012020-11-300000795266us-gaap:FinancialServiceMember2018-12-012019-11-30iso4217:USDxbrli:shares0000795266us-gaap:HomeBuildingMember2021-11-300000795266us-gaap:HomeBuildingMember2020-11-300000795266us-gaap:FinancialServiceMember2021-11-300000795266us-gaap:FinancialServiceMember2020-11-3000007952662021-11-3000007952662020-11-300000795266us-gaap:CommonStockMember2018-11-300000795266us-gaap:TrustForBenefitOfEmployeesMember2018-11-300000795266us-gaap:TreasuryStockMember2018-11-300000795266us-gaap:AdditionalPaidInCapitalMember2018-11-300000795266us-gaap:RetainedEarningsMember2018-11-300000795266us-gaap:AccumulatedOtherComprehensiveIncomeMember2018-11-3000007952662018-11-3000007952662017-12-012018-11-300000795266srt:CumulativeEffectPeriodOfAdoptionAdjustmentMemberus-gaap:RetainedEarningsMember2018-11-300000795266srt:CumulativeEffectPeriodOfAdoptionAdjustmentMember2018-11-300000795266us-gaap:RetainedEarningsMember2018-12-012019-11-300000795266us-gaap:AccumulatedOtherComprehensiveIncomeMember2018-12-012019-11-300000795266us-gaap:CommonStockMember2018-12-012019-11-300000795266us-gaap:AdditionalPaidInCapitalMember2018-12-012019-11-300000795266us-gaap:TrustForBenefitOfEmployeesMember2018-12-012019-11-300000795266us-gaap:TreasuryStockMember2018-12-012019-11-300000795266us-gaap:CommonStockMember2019-11-300000795266us-gaap:TrustForBenefitOfEmployeesMember2019-11-300000795266us-gaap:TreasuryStockMember2019-11-300000795266us-gaap:AdditionalPaidInCapitalMember2019-11-300000795266us-gaap:RetainedEarningsMember2019-11-300000795266us-gaap:AccumulatedOtherComprehensiveIncomeMember2019-11-3000007952662019-11-300000795266srt:CumulativeEffectPeriodOfAdoptionAdjustmentMemberus-gaap:RetainedEarningsMember2019-11-300000795266srt:CumulativeEffectPeriodOfAdoptionAdjustmentMember2019-11-300000795266us-gaap:RetainedEarningsMember2019-12-012020-11-300000795266us-gaap:AccumulatedOtherComprehensiveIncomeMember2019-12-012020-11-300000795266us-gaap:CommonStockMember2019-12-012020-11-300000795266us-gaap:TreasuryStockMember2019-12-012020-11-300000795266us-gaap:AdditionalPaidInCapitalMember2019-12-012020-11-300000795266us-gaap:TrustForBenefitOfEmployeesMember2019-12-012020-11-300000795266us-gaap:CommonStockMember2020-11-300000795266us-gaap:TrustForBenefitOfEmployeesMember2020-11-300000795266us-gaap:TreasuryStockMember2020-11-300000795266us-gaap:AdditionalPaidInCapitalMember2020-11-300000795266us-gaap:RetainedEarningsMember2020-11-300000795266us-gaap:AccumulatedOtherComprehensiveIncomeMember2020-11-300000795266srt:CumulativeEffectPeriodOfAdoptionAdjustmentMemberus-gaap:RetainedEarningsMember2020-11-300000795266srt:CumulativeEffectPeriodOfAdoptionAdjustmentMember2020-11-300000795266us-gaap:RetainedEarningsMember2020-12-012021-11-300000795266us-gaap:AccumulatedOtherComprehensiveIncomeMember2020-12-012021-11-300000795266us-gaap:CommonStockMember2020-12-012021-11-300000795266us-gaap:TreasuryStockMember2020-12-012021-11-300000795266us-gaap:AdditionalPaidInCapitalMember2020-12-012021-11-300000795266us-gaap:TrustForBenefitOfEmployeesMember2020-12-012021-11-300000795266us-gaap:CommonStockMember2021-11-300000795266us-gaap:TrustForBenefitOfEmployeesMember2021-11-300000795266us-gaap:TreasuryStockMember2021-11-300000795266us-gaap:AdditionalPaidInCapitalMember2021-11-300000795266us-gaap:RetainedEarningsMember2021-11-300000795266us-gaap:AccumulatedOtherComprehensiveIncomeMember2021-11-300000795266us-gaap:EmployeeSeveranceMember2020-03-012020-05-310000795266srt:MinimumMemberkbh:ComputerEquipmentIncludingCapitalizedSoftwareMember2020-12-012021-11-300000795266srt:MaximumMemberkbh:ComputerEquipmentIncludingCapitalizedSoftwareMember2020-12-012021-11-300000795266kbh:ModelFurnishingsandSalesOfficeImprovementsMembersrt:MinimumMember2020-12-012021-11-300000795266kbh:ModelFurnishingsandSalesOfficeImprovementsMembersrt:MaximumMember2020-12-012021-11-300000795266us-gaap:FurnitureAndFixturesMembersrt:MinimumMember2020-12-012021-11-300000795266us-gaap:FurnitureAndFixturesMembersrt:MaximumMember2020-12-012021-11-300000795266us-gaap:HomeBuildingMemberus-gaap:SalesRevenueNetMemberus-gaap:ProductConcentrationRiskMember2020-12-012021-11-30xbrli:pure0000795266us-gaap:HomeBuildingMemberus-gaap:SalesRevenueNetMemberus-gaap:ProductConcentrationRiskMember2019-12-012020-11-300000795266srt:CumulativeEffectPeriodOfAdoptionAdjustmentMemberus-gaap:RetainedEarningsMember2018-12-0100007952662019-12-010000795266srt:CumulativeEffectPeriodOfAdoptionAdjustmentMemberus-gaap:RetainedEarningsMember2019-12-010000795266srt:CumulativeEffectPeriodOfAdoptionAdjustmentMemberus-gaap:RetainedEarningsMember2020-12-01kbh:segment0000795266kbh:FinancialServicesMember2020-12-012021-11-300000795266kbh:KBHSLLCMemberkbh:StearnsLendingLLCMember2021-11-300000795266us-gaap:HomeBuildingMemberkbh:WestCoastMember2020-12-012021-11-300000795266us-gaap:HomeBuildingMemberkbh:WestCoastMember2019-12-012020-11-300000795266us-gaap:HomeBuildingMemberkbh:WestCoastMember2018-12-012019-11-300000795266us-gaap:HomeBuildingMemberkbh:SouthwestMember2020-12-012021-11-300000795266us-gaap:HomeBuildingMemberkbh:SouthwestMember2019-12-012020-11-300000795266us-gaap:HomeBuildingMemberkbh:SouthwestMember2018-12-012019-11-300000795266us-gaap:HomeBuildingMemberkbh:CentralMember2020-12-012021-11-300000795266us-gaap:HomeBuildingMemberkbh:CentralMember2019-12-012020-11-300000795266us-gaap:HomeBuildingMemberkbh:CentralMember2018-12-012019-11-300000795266us-gaap:HomeBuildingMemberkbh:SoutheastMember2020-12-012021-11-300000795266us-gaap:HomeBuildingMemberkbh:SoutheastMember2019-12-012020-11-300000795266us-gaap:HomeBuildingMemberkbh:SoutheastMember2018-12-012019-11-300000795266us-gaap:HomeBuildingMemberus-gaap:CorporateAndOtherMember2020-12-012021-11-300000795266us-gaap:HomeBuildingMemberus-gaap:CorporateAndOtherMember2019-12-012020-11-300000795266us-gaap:HomeBuildingMemberus-gaap:CorporateAndOtherMember2018-12-012019-11-300000795266us-gaap:HomeBuildingMemberkbh:WestCoastMember2021-11-300000795266us-gaap:HomeBuildingMemberkbh:WestCoastMember2020-11-300000795266us-gaap:HomeBuildingMemberkbh:SouthwestMember2021-11-300000795266us-gaap:HomeBuildingMemberkbh:SouthwestMember2020-11-300000795266us-gaap:HomeBuildingMemberkbh:CentralMember2021-11-300000795266us-gaap:HomeBuildingMemberkbh:CentralMember2020-11-300000795266us-gaap:HomeBuildingMemberkbh:SoutheastMember2021-11-300000795266us-gaap:HomeBuildingMemberkbh:SoutheastMember2020-11-300000795266us-gaap:HomeBuildingMemberus-gaap:CorporateAndOtherMember2021-11-300000795266us-gaap:HomeBuildingMemberus-gaap:CorporateAndOtherMember2020-11-300000795266kbh:ConvertibleSeniorNotesDueTwoThousandNineteenAtOnePointThreeSevenFivePercentMember2019-02-010000795266us-gaap:LandMember2020-12-012021-11-300000795266us-gaap:LandMember2019-12-012020-11-300000795266us-gaap:LandMember2018-12-012019-11-30kbh:property0000795266srt:MinimumMember2020-12-012021-11-300000795266srt:MaximumMember2020-12-012021-11-300000795266srt:MinimumMember2019-12-012020-11-300000795266srt:MaximumMember2019-12-012020-11-300000795266srt:MinimumMember2018-12-012019-11-300000795266srt:MaximumMember2018-12-012019-11-30kbh:delivery0000795266us-gaap:EstimateOfFairValueFairValueDisclosureMember2021-11-300000795266us-gaap:EstimateOfFairValueFairValueDisclosureMember2020-11-300000795266us-gaap:EstimateOfFairValueFairValueDisclosureMember2019-11-300000795266kbh:LandOptionContractAbandonmentMember2020-12-012021-11-300000795266kbh:LandOptionContractAbandonmentMember2019-12-012020-11-300000795266kbh:LandOptionContractAbandonmentMember2018-12-012019-11-300000795266us-gaap:VariableInterestEntityNotPrimaryBeneficiaryMember2020-11-30kbh:joint_venture0000795266us-gaap:VariableInterestEntityNotPrimaryBeneficiaryMember2021-11-300000795266kbh:NonVIELandOptionContractsAndOtherSimilarContractsMember2021-11-300000795266kbh:NonVIELandOptionContractsAndOtherSimilarContractsMember2020-11-300000795266us-gaap:EquityMethodInvestmentNonconsolidatedInvesteeOrGroupOfInvesteesMember2020-12-012021-11-300000795266us-gaap:EquityMethodInvestmentNonconsolidatedInvesteeOrGroupOfInvesteesMember2019-12-012020-11-300000795266us-gaap:EquityMethodInvestmentNonconsolidatedInvesteeOrGroupOfInvesteesMember2018-12-012019-11-300000795266kbh:InvestmentsInUnconsolidatedJointVenturesWithDebtMember2020-12-012021-11-30kbh:home0000795266kbh:InvestmentsInUnconsolidatedJointVenturesWithDebtMember2019-12-012020-11-300000795266us-gaap:EquityMethodInvestmentNonconsolidatedInvesteeOrGroupOfInvesteesMember2021-11-300000795266us-gaap:EquityMethodInvestmentNonconsolidatedInvesteeOrGroupOfInvesteesMember2020-11-300000795266kbh:UsGaap_ComputerEquipmentIncludingCapitalizedSoftwareMemberMember2021-11-300000795266kbh:UsGaap_ComputerEquipmentIncludingCapitalizedSoftwareMemberMember2020-11-300000795266kbh:ModelFurnishingAndSalesOfficeImprovementsMember2021-11-300000795266kbh:ModelFurnishingAndSalesOfficeImprovementsMember2020-11-300000795266kbh:LeaseholdImprovementsOfficeFurnitureAndEquipmentMember2021-11-300000795266kbh:LeaseholdImprovementsOfficeFurnitureAndEquipmentMember2020-11-300000795266us-gaap:StateAndLocalJurisdictionMember2018-12-012019-11-3000007952662020-03-012020-05-3100007952662019-12-012020-02-2900007952662020-08-310000795266srt:MaximumMember2020-03-132020-12-3100007952662020-12-012021-02-280000795266kbh:TaxCreditCarryforwardExpiringIn2041Member2020-12-012021-11-300000795266us-gaap:StateAndLocalJurisdictionMember2019-12-012020-11-300000795266us-gaap:StateAndLocalJurisdictionMember2021-11-300000795266kbh:MortgagesAndLandContractsDueToLandSellersAndOtherLoansMember2021-11-300000795266kbh:MortgagesAndLandContractsDueToLandSellersAndOtherLoansMembersrt:MinimumMember2020-11-300000795266kbh:MortgagesAndLandContractsDueToLandSellersAndOtherLoansMembersrt:MaximumMember2020-11-300000795266kbh:MortgagesAndLandContractsDueToLandSellersAndOtherLoansMember2020-11-300000795266kbh:SeniorNotesDueTwoThousandTwentyOneAtSevenPointZeroZeroPercentMemberus-gaap:SeniorNotesMember2021-11-300000795266kbh:SeniorNotesDueTwoThousandTwentyOneAtSevenPointZeroZeroPercentMemberus-gaap:SeniorNotesMember2020-11-300000795266us-gaap:SeniorNotesMemberkbh:SeniorNotesDueTwoThousandTwentyTwoAtSevenPointFiveZeroPercentMember2021-11-300000795266us-gaap:SeniorNotesMemberkbh:SeniorNotesDueTwoThousandTwentyTwoAtSevenPointFiveZeroPercentMember2020-11-300000795266kbh:SeniorNotesDueTwoThousandTwentyThreeAtSevenPointSixTwoFivePercentMemberus-gaap:SeniorNotesMember2021-11-300000795266kbh:SeniorNotesDueTwoThousandTwentyThreeAtSevenPointSixTwoFivePercentMemberus-gaap:SeniorNotesMember2020-11-300000795266kbh:SeniorNotesDueTwoThousandTwentySevenAtSixPointEightSevenFivePercentMemberus-gaap:SeniorNotesMember2021-11-30utr:Rate0000795266kbh:SeniorNotesDueTwoThousandTwentySevenAtSixPointEightSevenFivePercentMemberus-gaap:SeniorNotesMember2020-11-300000795266kbh:SeniorNotesDueTwoThousandTwentyNineAtFourPointEightPercentMemberus-gaap:SeniorNotesMember2021-11-300000795266kbh:SeniorNotesDueTwoThousandTwentyNineAtFourPointEightPercentMemberus-gaap:SeniorNotesMember2020-11-300000795266kbh:SeniorNotesDueTwoThousandThirtyOneAtFourPointZeroZeroPercentMemberus-gaap:SeniorNotesMember2021-11-300000795266kbh:SeniorNotesDueTwoThousandThirtyOneAtFourPointZeroZeroPercentMemberus-gaap:SeniorNotesMember2020-11-300000795266us-gaap:RevolvingCreditFacilityMember2021-11-300000795266us-gaap:LetterOfCreditMember2021-11-300000795266us-gaap:RevolvingCreditFacilityMembersrt:MinimumMember2020-12-012021-11-300000795266us-gaap:RevolvingCreditFacilityMembersrt:MaximumMember2020-12-012021-11-300000795266kbh:LOCFacilitiesMember2021-08-110000795266kbh:LOCFacilitiesMember2021-08-120000795266kbh:LOCFacilitiesMember2021-11-300000795266kbh:LOCFacilitiesMember2020-11-300000795266us-gaap:SeniorNotesMemberkbh:SeniorNotesDueTwoThousandTwentyTwoAtSevenPointFiveZeroPercentMember2012-07-310000795266kbh:SeniorNotesDueTwoThousandTwentyThreeAtSevenPointSixTwoFivePercentMemberus-gaap:SeniorNotesMember2015-02-170000795266kbh:SeniorNotesDueTwoThousandTwentySevenAtSixPointEightSevenFivePercentMemberus-gaap:SeniorNotesMember2019-02-200000795266kbh:SeniorNotesDueTwoThousandTwentyNineAtFourPointEightPercentMemberus-gaap:SeniorNotesMember2019-11-040000795266kbh:SeniorNotesDueTwoThousandThirtyOneAtFourPointZeroZeroPercentMemberus-gaap:SeniorNotesMember2021-06-090000795266kbh:SeniorNotesDueTwoThousandThirtyOneAtFourPointZeroZeroPercentMemberus-gaap:SeniorNotesMember2019-11-040000795266kbh:SeniorNotesDueTwoThousandTwentyThreeAtSevenPointSixTwoFivePercentMemberus-gaap:SeniorNotesMember2019-02-200000795266us-gaap:SeniorNotesMember2021-11-300000795266kbh:SeniorNotesDueTwoThousandThirtyOneAtFourPointZeroZeroPercentMemberus-gaap:SeniorNotesMember2021-06-092021-06-090000795266kbh:SeniorNotesDueTwoThousandTwentyOneAtSevenPointZeroZeroPercentMemberus-gaap:SeniorNotesMember2021-06-0900007952662021-06-092021-06-090000795266kbh:SeniorNotesDueTwoThousandTwentyOneAtSevenPointZeroZeroPercentMemberus-gaap:SeniorNotesMember2021-09-150000795266kbh:SeniorNotesDueSeptemberTwoThousandTwentyOneAtSevenPointZeroZeroPercentMemberus-gaap:SeniorNotesMember2021-09-150000795266us-gaap:FairValueMeasurementsNonrecurringMemberus-gaap:FairValueInputsLevel3Member2021-11-300000795266us-gaap:FairValueMeasurementsNonrecurringMemberus-gaap:FairValueInputsLevel3Member2020-12-012021-11-300000795266us-gaap:FairValueMeasurementsNonrecurringMemberus-gaap:FairValueInputsLevel3Member2020-11-300000795266us-gaap:FairValueMeasurementsNonrecurringMemberus-gaap:FairValueInputsLevel3Member2019-12-012020-11-300000795266us-gaap:FairValueInputsLevel2Memberus-gaap:CarryingReportedAmountFairValueDisclosureMemberus-gaap:SeniorNotesMember2021-11-300000795266us-gaap:EstimateOfFairValueFairValueDisclosureMemberus-gaap:FairValueInputsLevel2Memberus-gaap:SeniorNotesMember2021-11-300000795266us-gaap:FairValueInputsLevel2Memberus-gaap:CarryingReportedAmountFairValueDisclosureMemberus-gaap:SeniorNotesMember2020-11-300000795266us-gaap:EstimateOfFairValueFairValueDisclosureMemberus-gaap:FairValueInputsLevel2Memberus-gaap:SeniorNotesMember2020-11-300000795266us-gaap:DamagesFromProductDefectsMember2020-12-012021-11-300000795266us-gaap:WarrantyObligationsMember2020-12-012021-11-300000795266kbh:SelfInsuranceMember2021-11-300000795266kbh:SelfInsuranceMember2020-11-300000795266kbh:SelfInsuranceMember2020-12-012021-11-300000795266kbh:SelfInsuranceMember2019-12-012020-11-300000795266kbh:SelfInsuranceMember2018-12-012019-11-300000795266kbh:Chapter558oftheFloridaStatutesMember2020-12-012021-11-30kbh:claim_filed0000795266kbh:NorthernCaliforniaTownhomeCommunityMember2016-11-300000795266kbh:NorthernCaliforniaTownhomeCommunityMembersrt:MinimumMember2021-11-300000795266kbh:NorthernCaliforniaTownhomeCommunityMembersrt:MaximumMember2021-11-300000795266kbh:LOCFacilitiesMember2020-12-012021-11-300000795266us-gaap:SubsequentEventMember2022-01-10kbh:executive0000795266kbh:July2021StockRepurchaseProgramMember2021-07-080000795266kbh:May2018StockRepurchaseProgramMember2021-07-070000795266kbh:July2021StockRepurchaseProgramMember2021-11-300000795266kbh:DirectorPlanSARsMember2014-07-170000795266kbh:DirectorPlanSARsMember2021-11-3000007952662021-06-012021-08-3100007952662020-09-012020-11-3000007952662021-03-012021-05-3100007952662021-09-012021-11-3000007952662020-06-012020-08-3100007952662019-06-012019-08-3100007952662019-09-012019-11-3000007952662018-12-012019-02-2800007952662019-03-012019-05-310000795266kbh:NotPartofaShareRepurchaseProgramMember2020-12-012021-11-300000795266kbh:NotPartofaShareRepurchaseProgramMember2019-12-012020-11-300000795266kbh:NotPartofaShareRepurchaseProgramMember2018-12-012019-11-300000795266us-gaap:AccumulatedDefinedBenefitPlansAdjustmentMember2019-11-300000795266us-gaap:AccumulatedDefinedBenefitPlansAdjustmentMember2019-12-012020-11-300000795266srt:CumulativeEffectPeriodOfAdoptionAdjustmentMemberus-gaap:AccumulatedDefinedBenefitPlansAdjustmentMember2019-11-300000795266us-gaap:AccumulatedDefinedBenefitPlansAdjustmentMember2020-11-300000795266us-gaap:AccumulatedDefinedBenefitPlansAdjustmentMember2020-12-012021-11-300000795266us-gaap:AccumulatedDefinedBenefitPlansAdjustmentMember2021-11-300000795266kbh:SavingPlanMember2020-12-012021-11-300000795266kbh:SavingPlanMember2019-12-012020-11-300000795266kbh:SavingPlanMember2018-12-012019-11-300000795266kbh:SavingPlanMember2021-11-300000795266kbh:SavingPlanMember2020-11-300000795266kbh:SavingPlanMember2019-11-300000795266kbh:EquityIncentiveTwoThousandFourteenPlanMember2016-04-070000795266kbh:EquityIncentiveTwoThousandFourteenPlanMember2014-04-030000795266kbh:EquityIncentiveTwoThousandFourteenPlanMember2021-11-300000795266kbh:EquityIncentiveTwoThousandTenPlanMember2020-12-012021-11-300000795266kbh:EquityIncentiveTwoThousandFourteenPlanMember2020-12-012021-11-300000795266us-gaap:StockOptionMember2020-12-012021-11-300000795266us-gaap:StockOptionMember2019-12-012020-11-300000795266us-gaap:StockOptionMember2018-12-012019-11-300000795266us-gaap:RestrictedStockMember2020-12-012021-11-300000795266us-gaap:RestrictedStockMember2019-12-012020-11-300000795266us-gaap:RestrictedStockMember2018-12-012019-11-300000795266us-gaap:PerformanceSharesMember2020-12-012021-11-300000795266us-gaap:PerformanceSharesMember2019-12-012020-11-300000795266us-gaap:PerformanceSharesMember2018-12-012019-11-300000795266kbh:NonEmployeeDirectorStockUnitsMember2020-12-012021-11-300000795266kbh:NonEmployeeDirectorStockUnitsMember2019-12-012020-11-300000795266kbh:NonEmployeeDirectorStockUnitsMember2018-12-012019-11-300000795266kbh:RangeOneMember2020-12-012021-11-300000795266kbh:RangeOneMember2021-11-300000795266kbh:RangeTwoMember2020-12-012021-11-300000795266kbh:RangeTwoMember2021-11-300000795266kbh:RangeThreeMember2020-12-012021-11-300000795266kbh:RangeThreeMember2021-11-300000795266kbh:RangeFourMember2020-12-012021-11-300000795266kbh:RangeFourMember2021-11-300000795266us-gaap:StockOptionMember2021-11-300000795266us-gaap:RestrictedStockMember2020-11-300000795266us-gaap:RestrictedStockMember2019-11-300000795266us-gaap:RestrictedStockMember2018-11-300000795266us-gaap:RestrictedStockMember2021-11-300000795266us-gaap:PerformanceSharesMembersrt:MinimumMember2020-12-012021-11-300000795266us-gaap:PerformanceSharesMembersrt:MaximumMember2020-12-012021-11-300000795266us-gaap:PerformanceSharesMember2021-10-072021-10-070000795266us-gaap:PerformanceSharesMember2020-10-082020-10-080000795266us-gaap:PerformanceSharesMember2019-10-032019-10-030000795266us-gaap:PerformanceSharesMember2020-11-300000795266us-gaap:PerformanceSharesMember2019-11-300000795266us-gaap:PerformanceSharesMember2018-11-300000795266us-gaap:PerformanceSharesMember2021-11-300000795266us-gaap:PerformanceSharesMemberkbh:PSU2017Member2020-12-012021-11-300000795266us-gaap:PerformanceSharesMemberkbh:PSU2016Member2019-12-012020-11-300000795266us-gaap:PerformanceSharesMemberkbh:PSU2015Member2018-12-012019-11-300000795266kbh:DirectorPlanSARsMember2020-12-012021-11-300000795266kbh:DirectorPlanSARsMember2021-11-300000795266kbh:DirectorPlanSARsMember2020-11-300000795266kbh:DirectorPlanSARsMember2019-11-300000795266kbh:NonEmployeeDirectorDeferredCommonStockMember2021-11-300000795266kbh:NonEmployeeDirectorDeferredCommonStockMember2020-11-300000795266kbh:NonEmployeeDirectorDeferredCommonStockMember2019-11-300000795266us-gaap:SupplementalEmployeeRetirementPlanDefinedBenefitMember2021-11-300000795266us-gaap:SupplementalEmployeeRetirementPlanDefinedBenefitMember2020-11-300000795266us-gaap:SupplementalEmployeeRetirementPlanDefinedBenefitMember2020-12-012021-11-300000795266us-gaap:SupplementalEmployeeRetirementPlanDefinedBenefitMember2018-12-012019-11-300000795266us-gaap:SupplementalEmployeeRetirementPlanDefinedBenefitMember2019-12-012020-11-300000795266us-gaap:OtherPensionPlansPostretirementOrSupplementalPlansDefinedBenefitMember2021-11-300000795266us-gaap:OtherPensionPlansPostretirementOrSupplementalPlansDefinedBenefitMember2020-11-300000795266us-gaap:OtherPensionPlansPostretirementOrSupplementalPlansDefinedBenefitMember2019-12-012020-11-300000795266us-gaap:OtherPensionPlansPostretirementOrSupplementalPlansDefinedBenefitMember2020-12-012021-11-300000795266us-gaap:OtherPensionPlansPostretirementOrSupplementalPlansDefinedBenefitMember2018-12-012019-11-300000795266kbh:HomebuildingMember2021-11-300000795266kbh:HomebuildingMember2020-11-300000795266kbh:HomebuildingMember2019-11-300000795266kbh:FinancialServicesMember2021-11-300000795266kbh:FinancialServicesMember2020-11-300000795266kbh:FinancialServicesMember2019-11-300000795266kbh:InspiradaBuildersLLCMember2020-12-012021-11-300000795266kbh:InspiradaBuildersLLCMember2019-12-012020-11-300000795266kbh:InspiradaBuildersLLCMember2018-12-012019-11-300000795266us-gaap:AccountingStandardsUpdate201409Member2021-11-300000795266us-gaap:AccountingStandardsUpdate201409Member2020-11-300000795266us-gaap:AccountingStandardsUpdate201409Member2019-11-30
UNITED STATES
SECURITIES AND EXCHANGE COMMISSION
Washington, D.C. 20549
FORM 10-K
☒ ANNUAL REPORT PURSUANT TO SECTION 13 OR 15(d) OF THE SECURITIES EXCHANGE ACT OF 1934
For the fiscal year ended November 30, 2021
or
☐ TRANSITION REPORT PURSUANT TO SECTION 13 OR 15(d) OF THE SECURITIES EXCHANGE ACT OF 1934
For the transition period from to .
Commission File No. 001-09195
KB HOME
(Exact name of registrant as specified in its charter)
| | | | | |
| Delaware | 95-3666267 |
(State or other jurisdiction of
incorporation or organization) | (I.R.S. Employer
Identification No.) |
10990 Wilshire Boulevard, Los Angeles, California 90024
(Address of principal executive offices) (Zip Code)
Registrant’s telephone number, including area code: (310) 231-4000
Securities Registered Pursuant to Section 12(b) of the Act:
| | | | | | | | | | | | | | |
| Title of each class | | Trading Symbol(s) | | Name of each exchange
on which registered |
| Common Stock (par value $1.00 per share) | | KBH | | New York Stock Exchange |
| Rights to Purchase Series A Participating Cumulative Preferred Stock | | | | New York Stock Exchange |
Securities Registered Pursuant to Section 12(g) of the Act: None
Indicate by check mark if the registrant is a well-known seasoned issuer, as defined in Rule 405 of the Securities Act. Yes ☒ No ☐
Indicate by check mark if the registrant is not required to file reports pursuant to Section 13 or Section 15(d) of the Act. Yes ☐ No ☒
Indicate by check mark whether the registrant (1) has filed all reports required to be filed by Section 13 or 15(d) of the Securities Exchange Act of 1934 during the preceding 12 months (or for such shorter period that the registrant was required to file such reports), and (2) has been subject to such filing requirements for the past 90 days. Yes ☒ No ☐
Indicate by check mark whether the registrant has submitted electronically every Interactive Data File required to be submitted pursuant to Rule 405 of Regulation S-T during the preceding 12 months (or for such shorter period that the registrant was required to submit such files). Yes ☒ No ☐
Indicate by check mark whether the registrant is a large accelerated filer, an accelerated filer, a non-accelerated filer, a smaller reporting company, or an emerging growth company. See the definitions of “large accelerated filer,” “accelerated filer,” “smaller reporting company,” and “emerging growth company” in Rule 12b-2 of the Exchange Act.
| | | | | | | | | | | |
| Large accelerated filer | ☒ | Accelerated filer | ☐ |
| Non-accelerated filer | ☐ | Smaller reporting company | ☐ |
| | Emerging growth company | ☐ |
If an emerging growth company, indicate by check mark if the registrant has elected not to use the extended transition period for complying with any new or revised financial accounting standards provided pursuant to Section 13(a) of the Exchange Act. ☐
Indicate by check mark whether the registrant has filed a report on and attestation to its management's assessment of the effectiveness of its internal control over financial reporting under Section 404(b) of the Sarbanes-Oxley Act (15 U.S.C. 7262(b)) by the registered public accounting firm that prepared or issued its audit report.☒
Indicate by check mark whether the registrant is a shell company (as defined in Rule 12b-2 of the Act). Yes ☐ No ☒
The aggregate market value of the voting common stock held by non-affiliates of the registrant on May 31, 2021 was $4,627,090,889, including 6,705,247 shares held by the registrant’s grantor stock ownership trust and excluding 1,303,141 shares held in treasury.
There were 88,220,848 shares of the registrant’s common stock, par value $1.00 per share, outstanding on December 31, 2021. The registrant’s grantor stock ownership trust held an additional 6,705,247 shares of the registrant’s common stock on that date.
Documents Incorporated by Reference
Portions of the registrant’s definitive Proxy Statement for the 2022 Annual Meeting of Stockholders (incorporated into Part III).
KB HOME
FORM 10-K
FOR THE YEAR ENDED NOVEMBER 30, 2021
TABLE OF CONTENTS
| | | | | | | | |
| | | Page
Number |
|
| Item 1. | | |
| Item 1A. | | |
| Item 1B. | | |
| Item 2. | | |
| Item 3. | | |
| Item 4. | | |
| |
|
|
| Item 5. | | |
| Item 6. | | |
| Item 7. | | |
| Item 7A. | | |
| Item 8. | | |
| Item 9. | | |
| Item 9A. | | |
| Item 9B. | | |
|
|
| Item 10. | | |
| Item 11. | | |
| Item 12. | | |
| Item 13. | | |
| Item 14. | | |
|
|
| Item 15. | | |
| Item 16. | | |
| |
PART I
Item 1.BUSINESS
General
KB Home is one of the largest and most recognized homebuilding companies in the U.S. We have been building homes for 65 years, with over 655,000 homes delivered since our founding in 1957. We build a variety of new homes designed primarily for first-time and first move-up, as well as second move-up and active adult homebuyers, including attached and detached single-family residential homes, townhomes and condominiums. We offer homes in development communities, at urban in-fill locations and as part of mixed-use projects. Our homebuilding operations represent the majority of our business, accounting for 99.7% of our total revenues in 2021. Our financial services operations, which accounted for the remaining .3% of our total revenues in 2021, offer various insurance products to our homebuyers in the markets where we build homes and provide title services in certain of those markets. Our financial services operations also provide mortgage banking services, including residential consumer mortgage loan (“mortgage loan”) originations, to our homebuyers indirectly through KBHS Home Loans, LLC (“KBHS”), which is an unconsolidated joint venture between us and a third party.
Unless the context indicates otherwise, the terms “we,” “our” and “us” used in this report refer to KB Home, a Delaware corporation, and its predecessors and subsidiaries. We also use the following terms in our business with the corresponding meanings: “home” is a single-family residence, whether it is a single-family home or other type of residential property; “homes delivered” are homes for which the sale has closed and title has passed to a customer; “community” is a single development in which new homes are constructed as part of an integrated plan; and “community count” is the number of communities we have open for sales with at least five homes/lots left to sell.
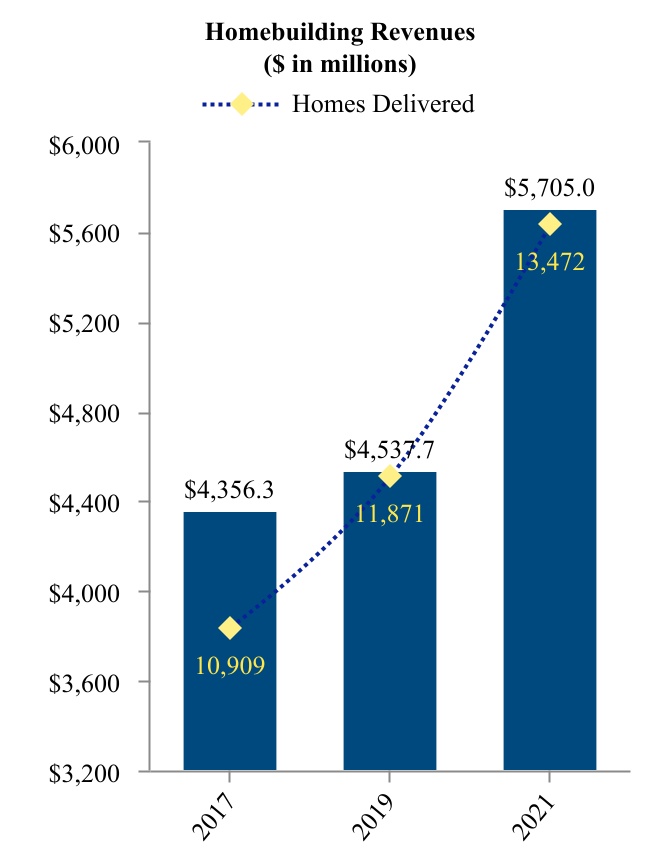
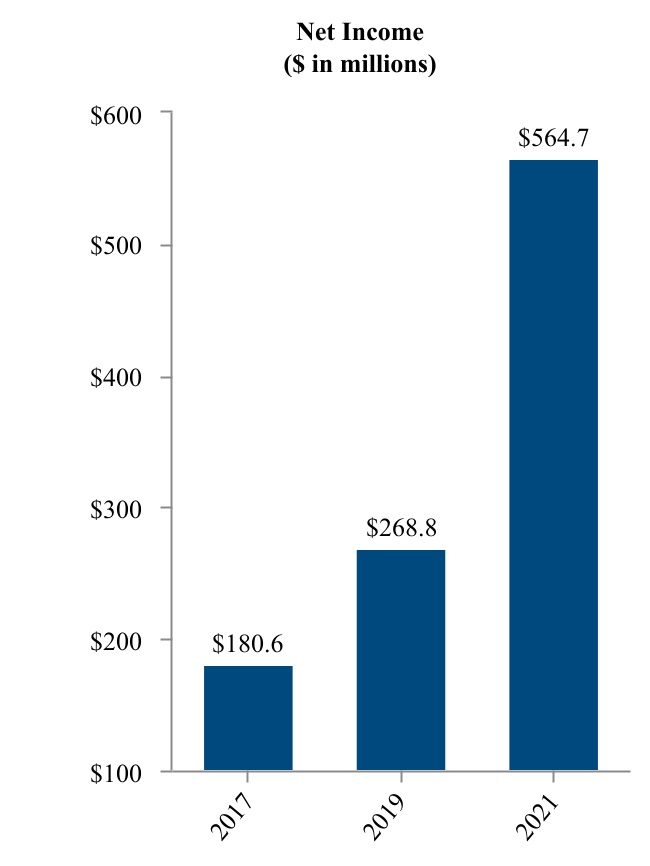
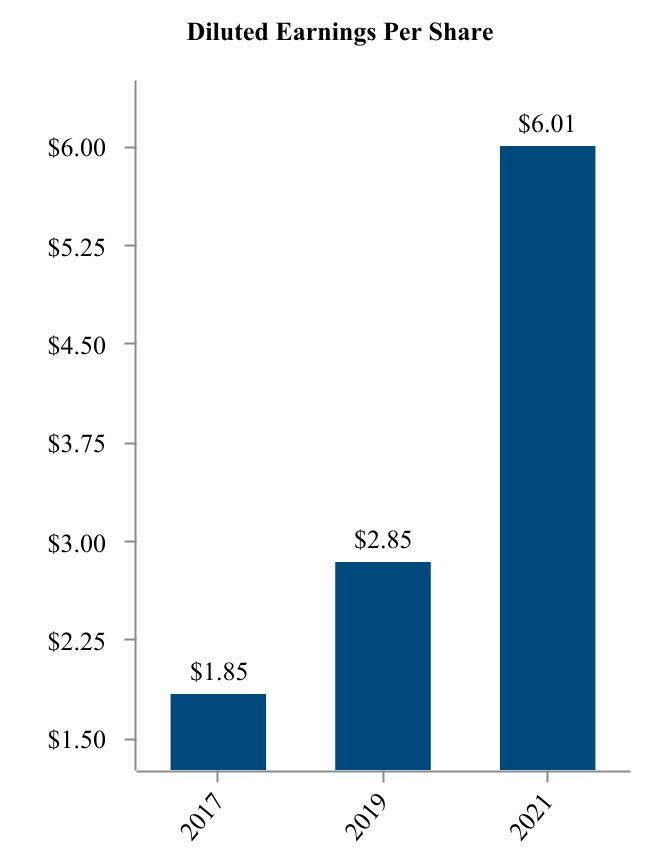
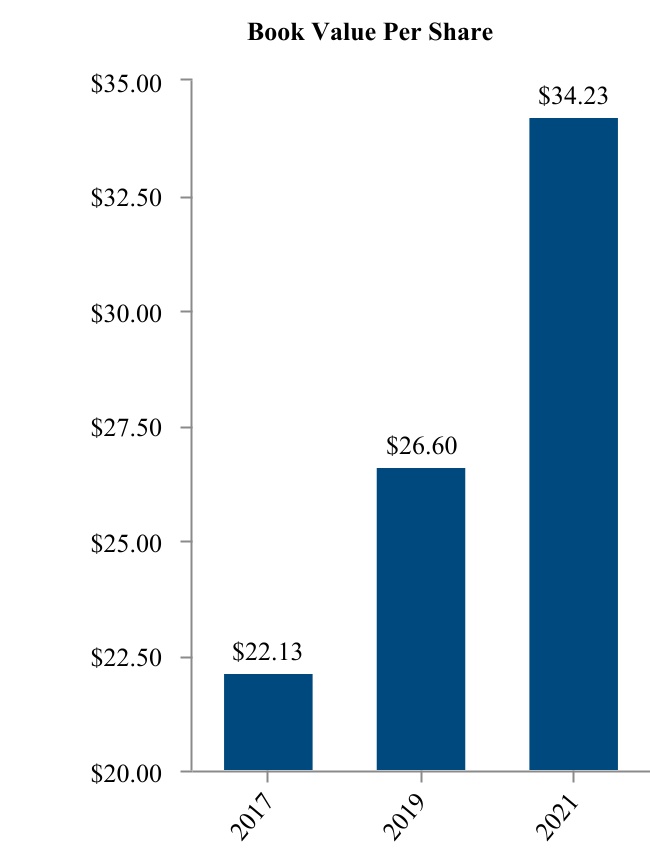
The following charts present homebuilding revenues, homes delivered, net income and diluted earnings per share for the years ended November 30, 2017, 2019 and 2021, and book value per share as of November 30, 2017, 2019 and 2021:
Markets
Reflecting the geographic reach of our homebuilding business, we have ongoing operations in the nine states and 47 major markets presented below. We also operate in various submarkets within these major markets. We may refer to these markets and submarkets collectively as our “served markets.” For reporting purposes, we organize our homebuilding operations into four segments — West Coast, Southwest, Central and Southeast.
| | | | | | | | | | | | | | |
| Segment | | States | | Major Market(s) |
| | | | |
| West Coast | | California | | Contra Costa County, Fresno, Hollister, Los Angeles, Madera, Modesto, Oakland, Orange County, Riverside, Roseville, Sacramento, Salinas, San Bernardino, San Diego, San Francisco, San Jose, Santa Rosa-Petaluma, Stockton, Vallejo, Ventura and Yuba City |
| | Idaho | | Boise |
| | Washington | | Olympia and Seattle |
| Southwest | | Arizona | | Phoenix and Tucson |
| | Nevada | | Las Vegas |
| Central | | Colorado | | Denver, Erie, Firestone and Loveland |
| | Texas | | Austin, Dallas, Fort Worth, Houston and San Antonio |
| Southeast | | Florida | | Fort Myers, Jacksonville, Lakeland, Melbourne, Orlando, Palm Coast, Sarasota and Tampa |
| | North Carolina | | Charlotte, Durham-Chapel Hill and Raleigh |
Business Strategy
Overview. Our core business strategy, which we refer to as KB Edge, is to expand our scale primarily within our current geographic footprint to achieve a top-five position in each of our served markets (based on homes delivered). KB Edge is a systematic, fact-based and process-driven approach to homebuilding that is grounded in gaining a detailed understanding of consumers’ location and product preferences and product price-to-value perceptions. In our business, we use the term “product” to mean and encompass a home’s floor plan design and interior/exterior style, amenities, functions and features.
KB Edge consists of the following key principles with respect to customers, land, products and operations:
•Customers. With our Built-to-Order® homebuying process, we provide each of our homebuyers with a highly personalized experience where they can make a wide range of structural and design choices for their future new home, as discussed further below under “Customer Obsession.” We believe this highly interactive, “customer-first” experience that puts our homebuyers firmly in control of designing the home they want based on how they live and what they value, at an affordable price, gives us a meaningful and distinct competitive advantage over other homebuilders and resale and rental homes.
•Land. We seek to manage our working capital and reduce our operating risks by primarily acquiring entitled land parcels within attractive submarkets identified by our market research. We typically focus on metropolitan areas with favorable long-term economic and population growth prospects that we believe have the potential to sustain a minimum of 800 homes delivered per year, and target land parcels that meet our investment return standards. Identified consumer preferences and home sales activity largely direct where our land acquisition teams search for available land. We focus on investments that provide a one- to two-year supply of land or lots per product line, per community, and individual assets that are generally between 50 to 200 lots in size. Though we evaluate new markets to enter, our primary focus is on our existing geographic footprint. We leverage the relationships we have with land owners, developers and brokers to find and acquire land parcels, and use our experience in working with municipalities to efficiently obtain development approvals.
•Products. We offer our customers a variety of homes with a standardized set of base functions and features generally priced to be affordable for those with household incomes within a range of the local area’s median level. With our Built-to-Order approach, our customers have the opportunity to select their lot location within a community, floor plan, elevation and structural options, and to personalize their homes beyond our base offerings with numerous interior design options and upgrades in our KB Home Design Studios. Our design studios, generally centrally located within our served markets, are a key component of our Built-to-Order process, with the mix of design options and upgrades we offer at each studio primarily based on the preferences identified by our market survey and purchase frequency data, as discussed further below under “Customer Obsession.” We utilize a centralized internal architectural group that designs homes to meet or exceed customers’ price-to-value expectations while being as efficient as possible to construct. To enhance the simplicity and efficiency of our products and processes, our architectural group has developed a core series of high-frequency, flexible floor plans and elevations that we can offer across many of our served markets. Our standardized plans allow us to more effectively shift with local demand and particular site attributes, such as the size and location of developable lots, enabling us to better understand in advance the cost to build our products and to compare and implement best land development and home construction practices across divisions and communities. We also incorporate energy-efficient features into our product designs to help lower our homebuyers’ total cost of homeownership and reduce our homes’ impact on the environment, as discussed below under “Environmental, Social and Governance.”
•Operations. In addition to differentiating us from other high-production homebuilders, our Built-to-Order process helps drive low cost production. We generally commence construction of a home only after we have a signed purchase contract with a homebuyer and have obtained preliminary credit approval or other evidence of the homebuyer’s financial ability to purchase the home, and seek to build a backlog of sold homes. In order to help moderate construction-related cost inflation, we typically enter into fixed-price contracts with our larger trade partners and building material suppliers for specified periods of time. By maintaining a substantial backlog, along with centralized scheduling and standardized reporting processes, we have established a disciplined and scalable operational platform that helps us sustain an even-flow production of pre-sold homes. This reduces our inventory risk, promotes construction efficiencies, enhances our relationships with independent contractors and other business partners, and provides us with greater visibility and predictability on future deliveries as we grow.
There may be market-driven circumstances where we believe it is necessary or appropriate to temporarily deviate from certain of the above principles. These deviations may include starting construction on a small number of homes in a community before corresponding purchase contracts are signed with homebuyers to more quickly meet customer delivery expectations and generate revenues; or acquiring land parcels in peripheral neighborhoods of a core metropolitan area that otherwise fit our growth strategy and meet our investment return standards. Throughout 2021, we experienced significant supply chain disruptions and construction services shortages that, in conjunction with high customer demand, impacted our operations in many markets by, among other things, impairing our even-flow home production process; causing appreciable delays in opening new communities and delivering homes; and prompting us to narrow the design options and upgrades offered in our design studios and provide substitutes for unexpectedly unavailable items, in some cases on an interim basis. Other circumstances could arise in the future that may lead us to make specific short-term shifts from our KB Edge principles.
Asset Efficiency. In implementing our KB Edge business strategy, a key tenet of our approach is to enhance asset efficiency. We do this by calibrating home sales rates and selling prices at each of our communities to improve profitability; focusing on controlling direct construction costs within our communities; increasing inventory turns to the extent practical; balancing pace, price and construction starts at each community; structuring land acquisitions to minimize upfront costs where possible, as discussed below under “Community Development and Land Inventory Management”; and deploying excess cash flow from operations to help fuel additional revenue growth or reduce debt, among other steps. Raising our asset efficiency also supports utilization of our valuable deferred tax assets, allowing us to realize substantial tax cash savings that can be productively deployed in our business or to enhance our capital structure.
Customer Obsession. Based on more than 60 years of experience, we believe the best homes start with the people who live in them. Our customer-centric approach comes from a deep-rooted operational philosophy and company culture motivated by a paramount objective: to be the most customer-obsessed homebuilder in the world. Driven by this ambitious guidepost, our team seeks to provide a compelling, simple and personalized homebuying process distinguished by phenomenal customer service. We want our customers to know they have a real partner when buying a home with us, and to feel that once their home is built, they can see themselves in their new home. Our team members, supported through our training and development programs, are encouraged to make decisions intended to produce the best results for our customers and our organization. Our customer obsession mindset is built around the following key principles:
•Find out what customers want and offer them choice to attain it. Design plays an important role in the homes we build for our customers. We ascertain homebuyer product design and location preferences through surveys we conduct of recent buyers of both new and resale homes across our served markets. We also obtain data from our own homebuyers’ selections and post-sale feedback. We use this information on what matters most to homebuyers when making purchase and trade-off decisions to develop and refine our products, as well as our land acquisition targets.
We also cultivate and leverage close supplier and business partner relationships to integrate into or offer with our products architectural elements (such as flex spaces that can serve multiple purposes, quiet zones or home offices), building materials, construction techniques, and structural and non-structural systems, components and devices that are aligned with the preferences identified in our surveys and other data sources, including with the design options and upgrades we offer. With our focus on affordability, we seek out innovative techniques, materials and items to help meet homebuyers’ priorities at attainable price points.
From our synthesis of the foregoing consumer research and related activities, we give our homebuyers a wide array of choice to craft the new home that fits their particular lifestyle and priorities, including their homesite, floor plan, elevation and structural options. Our homebuyers can visit our KB Home Design Studios, where they get both advice and the opportunity to select from a broad range of included features, design upgrades and options that will help personalize their home.
•Create collaborative customer relationships. In our view, we are not just selling a house. We are in the business of delivering an exceptional, personalized experience that enables our customers to achieve perhaps the most meaningful purchase they will ever make and an important landmark in their life’s journey — their own home. From this perspective, we strive to form close relationships with our homebuyers. We endeavor to learn key details about what they want, their top priorities today and where they see themselves in the future, so we can co-create a home for their day-to-day lives. We support each person or family, whether it is their first time or they have already been homeowners, with a dedicated community team of construction supervisors, sales representatives, design consultants and other personnel. This team is available to guide each homebuyer through each major step of the design, construction and closing of their KB home and aims to make the process as easy and straightforward as possible.
•Continue to listen to customers after the sale is done. To help learn and improve our customer experience, we schedule follow up visits with our customers 30 days after they move in, as well as three, six, 10 and 18 months later, to hear about their experience in their new home and to address any concerns they may have, including warranty claims. Information about our KB Home 10-year Limited Warranty program is provided in Note 17 – Commitments and Contingencies in the Notes to Consolidated Financial Statements in this report.
We believe our approach differentiates us in the homebuilding industry and, along with our company culture that sustains it, enhances customer satisfaction. We are proud of the high levels of satisfaction our homebuyers have reported to us and on outside surveys. In 2021, we achieved the top rank for customer satisfaction among homebuilders in third-party surveys, which we believe reflects the effective dedication we have to our homebuyers.
Promotional Marketing Strategy. To emphasize the distinct combination of innovative designs, personalization, affordability and partnership we offer to our homebuyers and the importance we place on customer satisfaction, we have
centered our external brand identity and messaging around Built on Relationships®. Built on Relationships also encapsulates the importance of customer, as discussed above, and other key relationships – with suppliers, trade contractors, land sellers and municipalities – to the success of our business. The key components we highlight as part of our brand identity include:
•Offering Innovative Designs. We believe we offer homebuyers product designs that distinctively blend consumer-preferred elements, such as open floor plans, flexible living spaces and extra storage, as discussed above under “Customer Obsession;” quality construction standards; and superior energy efficiency, compared to other new homes and resale homes with which we compete.
•A Personalized Home. We give our homebuyers considerable ability to personalize their new home from floor plans to design features to where they live in the community. At our KB Home Design Studios, our homebuyers are able to get both advice and the opportunity to select from a broad range of included features, design upgrades and options that will help personalize their home.
•Affordable Today and a Lower Cost of Homeownership Tomorrow. We offer our customers a variety of homes with a standardized set of base functions and features generally priced to be affordable for those with household incomes within a range of the local area’s median level. Our ENERGY STAR® certified homes can provide long-term significant savings on utility bills compared to typical resale homes and to competitive new homes that are not ENERGY STAR certified.
•A Partner Every Step of the Way. Our dedicated team of sales counselors, design studio consultants, construction superintendents and customer service representatives, as well as KBHS loan officers, work closely with our homebuyers throughout the homebuying process.
We typically sell our homes through commissioned sales associate employees from sales offices located in or adjacent to furnished model homes in each community. We also use electronic sales capabilities, which we have progressively enhanced since 2020, as the outbreak of the 2019 coronavirus disease (“COVID-19”) pandemic and the related responses by public health and governmental authorities to contain and combat its outbreak and spread (“COVID-19 control responses”) accelerated our use of technology to give our customers a variety of convenient ways to shop for and purchase a new KB home, including, among other things:
•Offering virtual home tours for prospective homebuyers;
•Providing access to interactive floor plans available at their desired community;
•Enabling live chats with sales counselors;
•Conducting virtual appointments and tours of the design studios with our studio professionals;
•Having KBHS pre-qualify our homebuyers for mortgages, and utilizing online tools and/or contactless methods to serve homebuyers where possible;
•Organizing virtual events with the broker community to introduce new communities;
•Presenting homebuyers with the ability to virtually see and walk through their home at various points during its construction and prior to closing; and
•Arranging virtual or drive-through closings, where permitted.
In addition, as part of our commitment to sustainability, which is discussed further below under “Environmental, Social and Governance,” and providing our customers a simple path to homeownership, we continue to work towards the goal of paperless homebuying. Over the past few years, we have eliminated a significant amount of paper from our home purchase contract by reducing the number of forms required to complete the process and digitizing as many of the remaining forms as possible. We plan to make additional investments in our digital sales and marketing tools in 2022.
We market our homes to prospective homebuyers and real estate brokers through a variety of media, and use data analytics to target our advertising and measure its effectiveness and efficiency in terms of generating leads and net orders. In recent years and in response to the growing number of millennial and Generation Z homebuyers, we have increased our emphasis on digital marketing, through search engine marketing, interactive Internet-based applications, email, social media outlets, our website and other evolving communication technologies. We also use print media, billboards, radio, magazine and newspaper advertising in our served markets, as necessary.
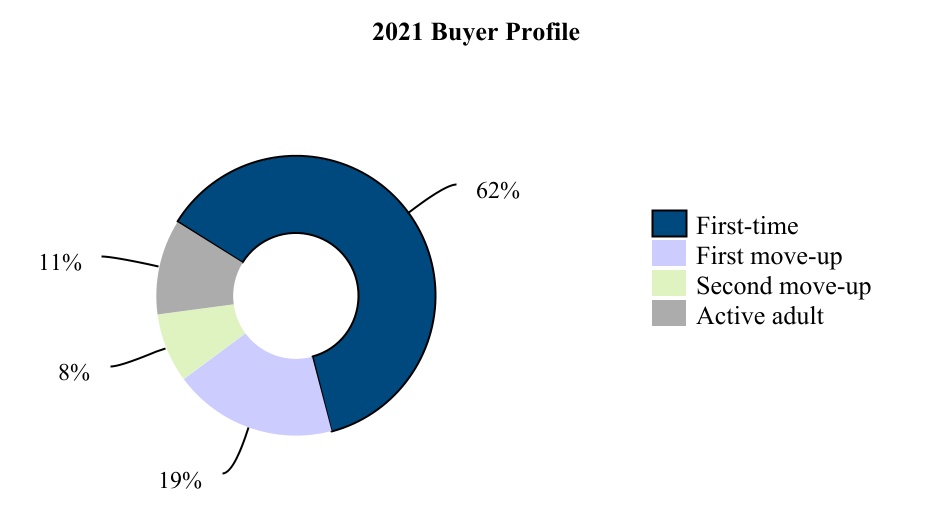
Homebuyer Profile. We focus on offering a variety of homes with a standardized set of base functions and features that are generally priced to be affordable for those with household incomes within a range of the local area’s median level in order to position our products to be attainable for the largest demand segments of the relevant submarket. Our product portfolio for customers ranges from smaller, higher density homes, with average selling prices typically suited for first-time homebuyers, to larger homes in premium locations with additional amenities and higher average selling prices that generally attract a first or second move-up homebuyer. We also offer a variety of single-story floorplans that typically appeal to an active adult homebuyer age 55 and over, as well as multi-story floorplans that attract a wide range of homebuyers. For more than a decade, first-time and first move-up homebuyers have accounted for an average of over 75% of our annual deliveries ; in 2021, these homebuyers accounted for 81% of our deliveries, as shown in the following chart:
Operational Structure. We operate our homebuilding business through divisions with experienced management teams who have in-depth local knowledge of their particular served markets, which helps us acquire land in preferred locations; develop communities with products that meet local demand; and understand local regulatory environments. Our division management teams exercise considerable autonomy in identifying land acquisition opportunities; developing land and communities; implementing product, marketing and sales strategies; and controlling costs. To help maintain consistent execution within the organization, our division management teams and other employees are continuously trained on KB Edge principles and are evaluated, in part, based on their achievement of relevant operational objectives.
Our corporate management and support personnel develop and oversee the implementation of company-wide strategic initiatives, our overall operational policies and internal control standards, and perform various centralized functions, including architecture; purchasing and national contracts; treasury and cash management; land acquisition approval; risk and litigation management; accounting and financial reporting; internal audit and compliance activities; information technology (“IT”) systems; marketing; and investor and media relations.
Community Development and Land Inventory Management
Developable land for the production of homes is a core resource for our business. Based on our current strategic plans, we seek to own or control land sufficient to meet our forecasted production goals for the next four to six years. In 2022, we intend to continue to invest in and develop land positions within attractive submarkets and selectively acquire or control additional land that meets our investment return standards. However, we may periodically sell certain land interests or monetize land previously held for future development.
Our community development process generally consists of four phases: land acquisition, land development into finished lots for a community (if necessary), home construction and delivery of completed homes to homebuyers. Historically, our community development process has typically ranged from 12 to 24 months in our West Coast homebuilding reporting segment, with a somewhat shorter duration in our other homebuilding reporting segments. The development process in our West Coast homebuilding reporting segment is typically longer than in our other segments due to the municipal and regulatory requirements that are generally more stringent in California. Our community development process varies based on, among other things, the extent and speed of required government approvals and utility service activations, the overall size of a particular community, the scope of necessary site preparation activities, the type of product(s) that will be offered, weather conditions, time of year, promotional marketing results, the availability of construction resources, consumer demand, local and general economic and housing market conditions, and other factors. In 2021, as noted above under “Business Strategy,” we experienced extended community development timelines due to nationwide supply chain disruptions that created shortages of
certain construction materials and other products; construction services availability constraints; and delays with respect to state and municipal construction permitting, inspections and utilities, and we believe these challenging conditions will generally persist into 2022 and potentially throughout the year, as discussed below under “Outlook.”
Although they vary significantly in size and complexity, our single-family residential home communities typically consist of 50 to 200 lots per product line, with lots ranging in size from 1,700 to 11,000 square feet. In our communities, we typically offer three to 15 home design choices. We also generally build one to three model homes at each community so that prospective homebuyers can preview the various products available. Depending on the community, we may offer premium lots containing more square footage, better views and/or location benefits. Some of our communities consist of multiple-story structures that encompass several attached condominium-style units.
Land Acquisition and Land Development. We continuously evaluate land acquisition opportunities against our investment return standards, while balancing competing needs for financial strength, liquidity and land inventory for future growth. When we acquire land, we generally focus on parcels with lots that are entitled for residential construction and are either physically developed to start home construction (referred to as “finished lots”) or partially finished. However, depending on market conditions and available opportunities, we may acquire undeveloped and/or unentitled land. We may also invest in land that requires us to repurpose and re-entitle the property for residential use, such as urban in-fill developments. We expect that the overall balance of undeveloped, unentitled, entitled, partially finished and finished lots in our inventory will vary over time, and in implementing our strategic growth initiatives, we may acquire a greater proportion of undeveloped or unentitled land in the future if and as the availability of reasonably priced land with finished or partially finished lots diminishes.
As part of the decision-making process for approving a land purchase, we review extensive information about a proposed project, including past use; assessment of environmentally-sensitive areas and areas that may be suitable for parks, trails, and open space preservation areas; assessment of site development required, including any work needed to comply with storm water regulations; distance to major employment and retail centers; and site design and product (home designs and specifications) plans that are consistent with our commitment to building 100% ENERGY STAR homes using 100% WaterSense® labeled fixtures, as discussed below under “Environmental, Social and Governance.”
We generally structure our land acquisition and land development activities to minimize, or defer the timing of, expenditures in order to reduce both the market risks associated with holding land and our working capital and financial commitments, including interest and other carrying costs. We typically use contracts that, in exchange for a small initial option payment or earnest money deposit, give us an option or similar right to acquire land at a future date, usually at a pre-determined price and pending our satisfaction with the feasibility of developing and selling homes on the land and/or an underlying land seller’s completion of certain obligations, such as securing entitlements, developing infrastructure or finishing lots. We refer to land subject to such option or similar contractual rights as being “controlled.” Our decision to exercise a particular land option or similar right is based on the results of our due diligence and continued market viability analysis after entering into such a contract.
The following table presents the number of inventory lots we owned, in various stages of development, or controlled under land option contracts or other similar contracts by homebuilding reporting segment as of November 30, 2021 and 2020:
| | | | | | | | | | | | | | | | | | | | | | | | | | | | | | | | | | | | | | | | | | | | | | | |
| Homes Under Construction | | Land Under Development | | Land Under Option (a) | | Total Land
Owned or Under Option |
| | 2021 | | 2020 | | 2021 | | 2020 | | 2021 | | 2020 | | 2021 | | 2020 |
| West Coast | 2,838 | | | 2,128 | | | 10,617 | | | 8,467 | | | 10,084 | | | 6,395 | | | 23,539 | | | 16,990 | |
| Southwest | 1,895 | | | 1,265 | | | 7,207 | | | 6,975 | | | 3,237 | | | 4,050 | | | 12,339 | | | 12,290 | |
| Central | 3,194 | | | 2,363 | | | 13,082 | | | 11,947 | | | 12,685 | | | 9,389 | | | 28,961 | | | 23,699 | |
| Southeast | 1,718 | | | 976 | | | 7,974 | | | 5,926 | | | 12,237 | | | 7,157 | | | 21,929 | | | 14,059 | |
Total | 9,645 | | | 6,732 | | | 38,880 | | | 33,315 | | | 38,243 | | | 26,991 | | | 86,768 | | | 67,038 | |
(a)Land under option as of November 30, 2021 and 2020 includes 12,434 and 10,254 lots, respectively, under land option contracts or other similar contracts where the associated deposits were refundable at our discretion.
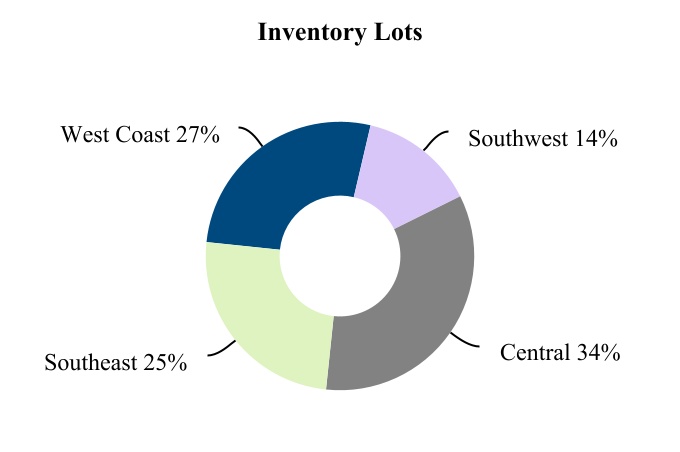
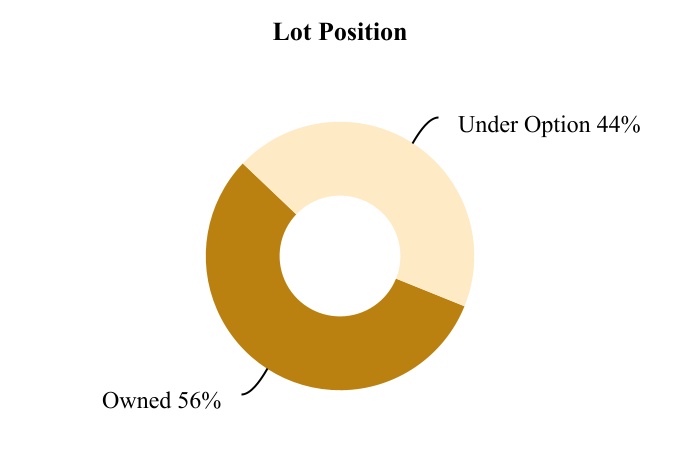
The following charts present the percentage of inventory lots we owned or controlled under land option contracts or other similar contracts by homebuilding reporting segment and the percentage of total lots we owned and had under option as of November 30, 2021:
Home Construction and Deliveries. Following the acquisition of land and, if necessary, the development of the land into finished lots, we typically begin constructing model homes and marketing homes for sale. To minimize the costs and risks of unsold homes in production, we generally commence construction of a home only after we have a signed purchase contract with a homebuyer and have obtained preliminary credit approval or other evidence of the homebuyer’s financial ability to purchase the home. Other than model homes, our inventories typically do not consist of a significant number of completed unsold homes. However, cancellations of home purchase contracts prior to the delivery of the underlying homes, the construction of attached products with some unsold units, or specific marketing or other strategic considerations will result in our having some unsold completed or partially completed homes in our inventory. Our cycle time from home sale to delivery is typically six to seven months.
We, or outside general contractors we may engage, contract with a variety of independent contractors, who are typically locally based, to perform all land development and home construction work through these independent contractors’ own employees or subcontractors. We do not self-perform any land development or home construction work. These independent contractors also supply some of the building materials required for such production activities. Our contracts with these independent contractors require that they comply with all laws applicable to their work, including wage and safety laws, meet performance standards, follow local building codes and permits, and abide by our Ethics Policy referenced under Item 10 – Directors, Executive Officers and Corporate Governance in this report.
Raw Materials. Outside of land, the principal raw materials used in our production process are concrete and forest products. Other primary materials used in home construction include drywall, and plumbing and electrical items. We source all of our building materials from third parties, and seek out products that provide independent sustainability assessments. In addition, our lumber suppliers generally certify that their wood was not sourced from endangered forests or is certified by recognized programs. We attempt to enhance the efficiency of our operations by using, where practical, standardized materials that are commercially available on competitive terms from a variety of outside sources. In addition, we have national and regional purchasing programs for certain building materials, appliances, fixtures and other items that allow us to benefit from large-quantity purchase discounts and, where available, participate in outside manufacturer or supplier rebate programs. When possible, we arrange for bulk purchases of these products at favorable prices from such manufacturers and suppliers.
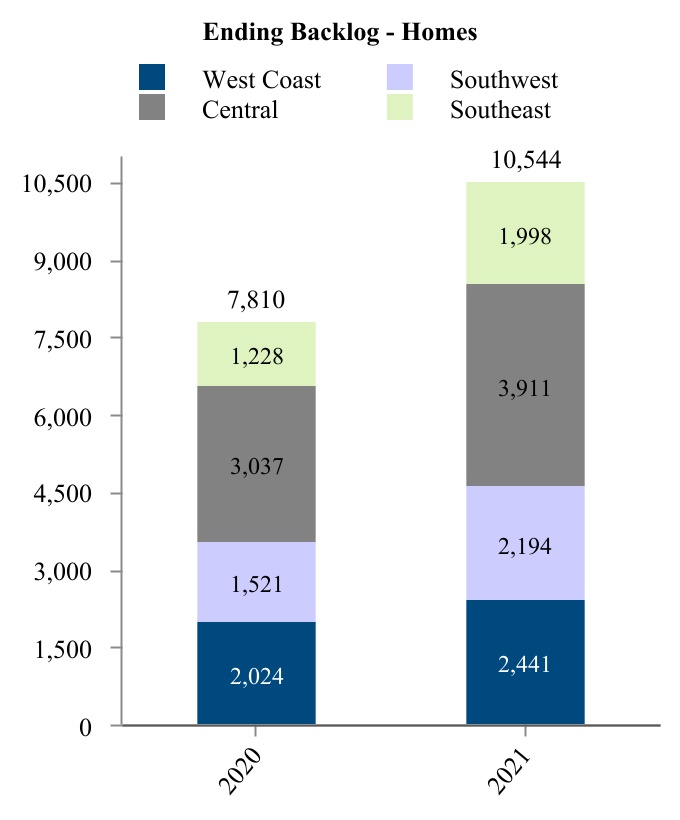
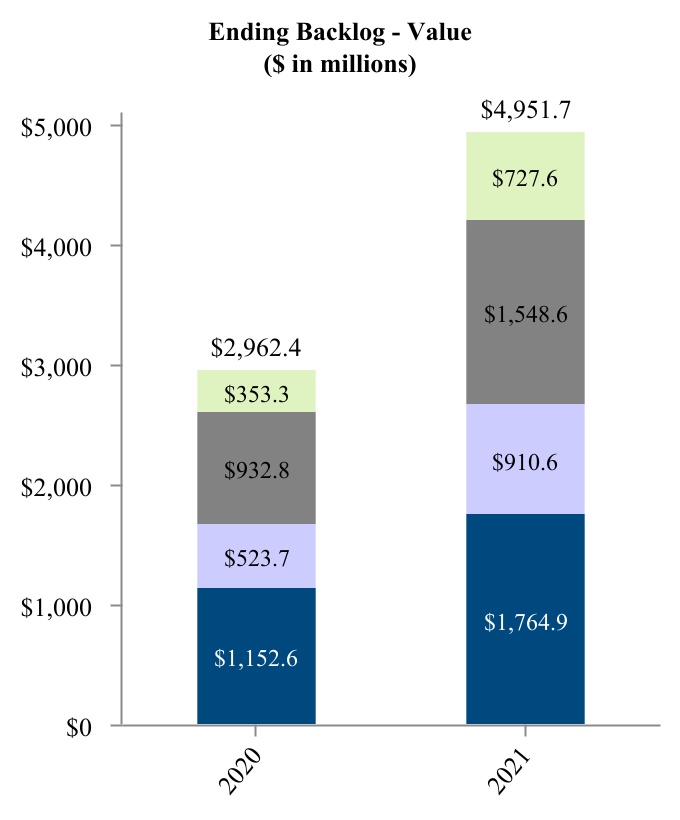
Backlog
Our “backlog” consists of homes that are under a purchase contract but have not yet been delivered to a homebuyer. Ending backlog represents the number of homes in backlog from the previous period plus the number of net orders (new orders for homes less cancellations) generated during the current period minus the number of homes delivered during the current period. Our backlog at any given time will be affected by cancellations, homes delivered and our community count. Backlog value represents potential future housing revenues from homes in backlog. Our cancellation rates and the factors affecting such rates are further discussed below under both Item 1A – Risk Factors and Item 7 – Management’s Discussion and Analysis of Financial Condition and Results of Operations in this report.
The following charts present our ending backlog (number of homes and value) by homebuilding reporting segment as of November 30, 2020 and 2021:
Competition, Seasonality, Delivery Mix and Other Factors
Competition. The homebuilding industry and housing market are highly competitive with respect to selling homes; contracting for construction services, such as carpentry, roofing, electrical and plumbing; and acquiring attractive developable land, though the intensity of competition can vary and fluctuate between and within individual markets and submarkets. We compete for homebuyers, construction resources and desirable land against numerous homebuilders, ranging from regional and national firms to small local enterprises. As to homebuyers, we primarily compete with other homebuilders on the basis of selling price, community location and amenities, availability of financing options, home designs, reputation, home construction cycle time, and the design options and upgrades that can be included in a home. In some cases, this competition occurs within larger residential development projects containing separate sections other homebuilders design, plan and develop. We also compete for homebuyers against housing alternatives to new homes, including resale homes, apartments, single-family rentals and other rental housing.
In markets experiencing extensive construction activity, including areas recovering from earthquakes, wildfires, hurricanes, flooding or other natural disasters, there can be craft and skilled trade shortages that limit independent contractors’ ability to supply construction services to us, which in turn tends to drive up our costs and/or extend our production schedules. Elevated construction activity, and reallocations of staff for public safety priorities after natural disasters or otherwise, has also contributed to measurable increases in the amount of time needed to obtain governmental approvals or utility service activations and, combined with tariffs imposed or increased by the U.S. and other governments, the cost of certain raw building materials, such as steel, Canadian lumber, drywall and concrete, or finished products. Since 2020, we have experienced intensifying building material cost pressures, particularly for lumber, and production capacity issues with some of our main product suppliers, reflecting sustained high levels of homebuilding and renovation activity combined with supply chain disruptions stemming from international and domestic COVID-19 control responses and economy-wide labor shortages in the U.S. In addition, since 2013, we have seen higher prices for desirable land amid heightened competition with homebuilders and other developers and investors (both domestic and international), particularly in the land-constrained areas where we operate. We expect these upward cost trends to continue in 2022, if and as housing market activity grows and there is greater competition for these resources across a disrupted global supply chain.
Seasonality. Our performance is affected by seasonal demand trends for housing. Traditionally, there has been more consumer demand for home purchases and we tend to generate more net orders in the spring and early summer months
(corresponding to most of our second quarter and part of our third quarter) than at other times of the year. This “selling season” demand results in our typically delivering more homes and generating higher revenues from late summer through the fall months (corresponding to part of our third quarter and all of our fourth quarter). However, as illustrated in the table below, the outbreak of COVID-19 and the related COVID-19 control responses beginning in mid-March 2020 disrupted our usual seasonal patterns in 2020, with our 2020 second quarter net order activity measurably constrained followed by a significant rebound in our 2020 third and fourth quarters, resulting in a higher percentage of net orders in those quarters, compared to corresponding quarters in previous years. The seasonal pattern of our homes delivered and housing revenues in 2021 was slightly more in line with typical historical trends. However, we can provide no assurance whether or to what extent typical seasonal performance trends will return in 2022, or at all.
| | | | | | | | | | | | | | | | | | | | | | | |
| |
| First Quarter | | Second Quarter | | Third Quarter | | Fourth Quarter |
| Net Orders | | | | | | | |
| 2021 | 26 | % | | 27 | % | | 25 | % | | 22 | % |
| 2020 | 26 | % | | 13 | % | | 32 | % | | 29 | % |
| 2019 | 21 | % | | 32 | % | | 26 | % | | 21 | % |
| | | | | | | |
| Homes Delivered | | | | | | | |
| 2021 | 21 | % | | 26 | % | | 26 | % | | 27 | % |
| 2020 | 26 | % | | 23 | % | | 24 | % | | 27 | % |
| 2019 | 18 | % | | 23 | % | | 26 | % | | 33 | % |
| | | | | | | |
| Housing Revenues | | | | | | | |
| 2021 | 20 | % | | 25 | % | | 26 | % | | 29 | % |
| 2020 | 26 | % | | 22 | % | | 23 | % | | 29 | % |
| 2019 | 18 | % | | 23 | % | | 25 | % | | 34 | % |
| | | | | | | |
Delivery Mix and Other Factors. In addition to the overall volume of homes we sell and deliver, our results in a given period are significantly affected by the geographic mix of markets and submarkets in which we operate; the number and characteristics of the communities we have open for sales in those markets and submarkets; and the products we sell from those communities during the period. While there are some similarities, there are differences within and between our served markets in terms of the number, size and nature of the communities we operate and the products we offer to consumers. These differences reflect, among other things, local homebuyer preferences; household demographics (e.g., large families or working professionals; income levels); geographic context (e.g., urban or suburban; availability of reasonably priced finished lots; development constraints; residential density); and the shifts that can occur in these factors over time. These factors in each of our served markets will affect the costs we incur and the time it takes to locate, acquire rights to and develop land, open communities for sales, and market and build homes; the size of our homes; our selling prices (including the contribution from homebuyers’ purchases of design options and upgrades); the pace at which we sell and deliver homes; the rate at which communities are sold out; and our housing gross profits and housing gross profit margins. Therefore, our results in any given period will fluctuate compared to other periods based on the proportion of homes delivered from areas with higher or lower selling prices and on the corresponding land and overhead costs incurred to generate those deliveries, as well as from our overall community count.
Human Capital Resources
At November 30, 2021 and 2020, we had approximately 2,244 and 1,752 full-time employees, respectively. None of our employees are represented by a collective bargaining agreement. For fiscal 2021, our turnover rate was 16%, made up of 15% voluntary turnover and 1% involuntary turnover.
Our Culture. In order to achieve our strategic goals, it is essential for us to attract, promote and retain qualified personnel, particularly the local division leaders who manage our businesses in our served markets and partner with all constituents. Therefore, we strive to create an engaging internal environment that offers our employees satisfying work, with meaningful opportunities for career growth and development, and rewarding short- and long-term compensation programs that are aligned with achieving our business goals. In addition, we offer our employees benefit programs, which include medical, dental and vision insurance, a savings/retirement plan, life and disability insurance, and tuition reimbursement, along with an array of voluntary benefits designed to meet individual needs. We engage nationally recognized outside compensation and benefits
consulting firms to objectively evaluate our programs and benchmark them against peers and other similarly sized organizations. We believe our position as an industry leader in sustainability also supports our ability to both attract and retain high-caliber talent.
Our top division and regional leaders average more than 11 years of tenure with us, and the local leaders responsible for land acquisition, entitlement, and development average over nine years with us. In addition, our named executive officers who are responsible for setting our overall strategy average 19 years of tenure with us and more than two decades in the homebuilding industry. Our leadership team’s long service history provides consistency in managing our business and helps reinforce and sustain our company culture through all levels of the organization.
Diversity. We are committed to supporting a work culture that treats all employees fairly and with respect, promotes inclusivity, provides equal opportunities for the professional growth of the diverse individuals who join us, and advancement based on merit. At November 30, 2021, based on information available to us, females made up approximately 40% of our workforce and 32% of our managerial employees, with ethnic and racial minorities making up approximately 35% of our workforce and 21% of our managerial employees. We intend to continue using a combination of targeted recruiting, talent development and internal promotion strategies to expand the diversity of our employee base across all roles and functions.
Learning and Development. To help advance our employees’ personal growth and drive consistent execution of our business strategy, including our customer obsession philosophy, we provide training opportunities that align with team members’ responsibilities over the arc of their careers with us. We support a dedicated Internet-based learning platform with a broad portfolio of written, audio-visual and interactive enterprise-wide and discipline-specific policy and training materials. This platform includes a library of more than 300 self-directed courses and virtual, instructor-led programs for employees at all levels of our organization. New employee orientations, functional role training, and our required annual ethics training and certification, are provided on this platform. During 2021, our team members completed more than 26,000 courses in total, an average of approximately 12 courses per employee. Managers and supervisors are provided training to help their direct reports progress in their professional development.
To recognize and promote outstanding employees, we conduct a comprehensive talent and succession planning review process on an annual basis, focused on identifying top-performing, high-potential, and diverse team members for advancement to key field and corporate leadership roles. This review process is overseen by the management development and compensation committee of our board of directors, which also guides updates and refinements to our human capital investment and development strategies.
Employee Safety. We strive to provide a safe working environment for our employees, as well as our trade partners, as discussed below under “Social Practices.” In addition to the benefits programs described above, we offer a wellness program designed to support our team members’ general health. To help our team members mitigate stressors arising from the outbreak of the COVID-19 pandemic and the related COVID-19 control responses, we expanded our wellness program offerings and made them available online so that every employee had access to them. Monthly interactive webinars address topics such as holistic health, including nutrition, and preventive care. We have continued to enhance our wellness program throughout 2021, and see it as a positive way to create and strengthen internal connections with and among our employees.
During 2020, we implemented various steps to address the safety and health of our workforce due to the COVID-19 pandemic. Some examples include the following: temporarily closed our offices and established new safety protocols and procedures; maintained regular communication regarding the impacts of the pandemic on our team members and operations; developed and refined a playbook to guide the safe return to offices, communities, and work sites; provided paid time off for those directly impacted by COVID-19 and instructed those who are infected to stay home; offered additional paid time off for employees to receive their COVID-19 vaccines and recover from resulting side effects; increased cleaning protocols across all locations; established physical distancing procedures, modifying workspaces, and providing personal protective equipment and cleaning supplies for employees who need to be onsite; and invested in our IT systems to support a working environment that encompasses a mix of remote and in-person arrangements. We continued, and in some instances, expanded these efforts throughout 2021 to help enhance our employees’ well-being and productivity.
Environmental, Social and Governance (“ESG”)
For nearly 15 years, we have made a dedicated effort to become a leading national company in sustainability, which encompasses our ESG practices. We believe our longstanding, industry-leading sustainability initiatives provide tangible benefits for our customers, our operations and the environment, and distinctly differentiate us from other builders of new homes and from resale homes. In addition to our internal executive team, we monitor evolving trends and gather input and guidance for our initiatives through a panel of external advisors that we call our National Advisory Board, which we established in 2009 solely for these purposes. These advisors, who have a broad and diverse set of personal and professional perspectives,
experiences and expertise, help us shape our sustainability priorities and reporting, as well as our approach to stakeholder engagement.
Environmental Practices. We are committed to building energy-efficient homes and have progressively expanded our sustainability program and use of technological advancements to make renewable solar energy, water efficiency, waste reduction and indoor environments that support personal wellness available to our buyers. As most of the energy consumed during a home’s multi-decade life occurs after we deliver the home to our customers, we have made energy efficiency central to our efforts to help reduce carbon and other greenhouse gas (“GHG”) emissions, and see enhancing the conservation of natural resources in a home’s day-to-day use as a key part of our business strategy.
ENERGY STAR Commitment. The cornerstone of our energy-efficiency initiatives is building 100% ENERGY STAR certified new homes, a standard to which we committed in 2008. ENERGY STAR is a voluntary U.S. Environmental Protection Agency (“EPA”) and Department of Energy program that seeks to help consumers, businesses and industry save money and protect the environment through the adoption of energy-efficient products and practices. We were the first national homebuilder to make every new home we build ENERGY STAR certified, and have built over 160,000 high-performance ENERGY STAR certified new homes since 2000, more than any other builder in the nation. By comparison, the EPA estimates only about 10% of all new homes in the U.S. were ENERGY STAR certified in the past three years. According to the EPA, ENERGY STAR certified new homes achieve a 20% energy efficiency improvement on average compared to new homes built to local code, and even more compared to resale homes. Each certified home is estimated by the EPA to reduce GHG emissions by approximately 3,287 pounds (1.5 metric tons) per year compared to a typical home. Based on our energy use analysis, our homes currently save our homeowners an estimated average of $1,300 annually on utility bills compared to typical resale homes. Our commitment to building ENERGY STAR certified homes has also enabled us to earn significant federal energy tax credits.
GHG Emission Reductions. We have a goal to reduce the estimated GHG emissions (metric tons per year) of our average home built in 2025 by 0.5 metric tons per year, or 8%, from the estimated 6 metric tons per year average for a KB home built in 2020. Our benchmark for measuring the achievement of this goal is the Home Energy Rating System (HERS®) Index, as each HERS Index score point reduction equates to a 1% improvement in energy efficiency relative to a standard new home and potentially reduces GHG emissions by an average of 0.1 metric tons (as calculated based on the states in which we operate). Therefore, we expect to attain our GHG emissions reduction goal if we reduce our national average HERS Index score by five points, from 50 in 2020 to a target of 45 for 2025. For comparison, a typical resale home today has a HERS Index score of 130.
Solar. We built our first solar home in 2005 and introduced our first all solar community in 2011. We have delivered more than 14,000 homes with solar-paneled power systems, producing an estimated total of 557 million kilowatt hours of electrical power. In recent years, we have added higher efficiency solar panels that generate more power using the same roof space. In 2020, we were the first national homebuilder to offer a complete roof-integrated solar-paneled system. In 2021, we built over 3,000 solar homes in California, representing nearly 80% of our homes built in the state that year. As of November 30, 2021, approximately 72% of our model homes and sales offices in California were powered by solar energy.
Indoor Environments. In recent years, we have expanded our sustainability portfolio to include enhancing our homes’ indoor environment with high-performance ventilation systems and low- or zero-VOC products. In 2020, we announced a partnership with Well Living Lab, a collaboration between Delos Living LLC, a wellness real estate and technology company, and the Mayo Clinic, an academic medical center. The Well Living Lab focuses exclusively on researching how indoor environments can improve human health and well-being. Under this partnership, in 2021, we built a concept home in Phoenix, Arizona to demonstrate how advancements in design and construction materials as well as wellness intelligence ecosystems and biometric smart devices can make a significant potential contribution to the overall health of the home’s residents. Separately, beginning in mid-2021, we included MERV-13 rated air filters, one of the highest rated residential air filters on the market, as standard at all of our new communities. These filters are designed to remove dust, pollen, mold and certain bacteria and viruses for better air quality compared to lower-rated air filters, and exceed current ENERGY STAR requirements.
Consumer Awareness. To assist customers in understanding the energy-efficiency benefits of our homes, we include a KB Home Energy Savings Comparison™, or ESC, with each home that provides an estimate of its monthly energy costs and monthly savings compared to a typical resale home. We also engage in campaigns and other educational efforts, sometimes together with other companies, organizations and groups, to increase consumer awareness of the importance and impact of sustainability in selecting a home and the products within a home. We intend to continue to research, evaluate and utilize new or improved products and construction and business practices consistent with our sustainability commitment, and believe our initiatives in this area can help put us in a better position, compared to resale homes and homebuilders with less-developed programs, to comply with evolving regulations directed at addressing climate change and similar environmental concerns, and to meet growing consumer demand for resource-efficient products, as discussed below under Item 1A – Risk Factors in this report.
Water Conservation. As a homebuilder operating in some of the most water-challenged regions of the country, we also prioritize water conservation. We provide water-saving features in our homes that reduce our homeowners’ bills and may help to mitigate strain on local communities’ water resources. As water availability is an important consideration for local governments in approving new-home developments, we believe our leadership in this area has positioned us to effectively address water-related development concerns and help preserve this critical resource.
We were the first national homebuilder to join the EPA’s WaterSense program, which is a voluntary partnership program that is both a label for water-efficient products and a resource for helping conserve water. According to the EPA, WaterSense labeled products use at least 20% percent less water compared to products that are not labeled. To date, we have built over 18,000 WaterSense and Water Smart homes, more than any other homebuilder, and installed over 900,000 WaterSense labeled fixtures, collectively helping to save an estimated 1.6 billion gallons of water per year. We were the first national homebuilder to implement the new WaterSense Labeled Homes Program, Version 2, which was released in February 2021 and requires homes to be at least 30% more water efficient than a typical new home.
Awards and Recognition. We have been recognized with major national awards for our leading sustainability practices, including:
•2021 ENERGY STAR Partner of the Year – Sustained Excellence Award – Our 11th consecutive award for demonstrating leadership in energy-efficient construction;
•2021 ENERGY STAR Certified Homes Market Leader Awards – A record 25 awards in all, one in each of our primary markets nationwide, recognizing excellence in energy-efficient home building;
•2021 WaterSense Sustained Excellence Award – The seventh consecutive year we have received this award for our achievements in constructing water-efficient homes;
•Newsweek 2021 and 2022 lists of America’s Most Responsible Companies – We were the only national homebuilder to receive this distinction each year for the past two years for demonstrating leading ESG practices, specifically, our industry-leading environmental initiatives, dedication to social responsibility and strong corporate governance standards.
Our annual sustainability reports, which we have published on our website since 2008, contain more information about our programs, goals, and achievements.
Social Practices. As discussed above under “Human Capital Resources,” we maintain a human capital strategy that supports a diverse and inclusive workforce with equal opportunity and programs for training and career advancement, strong benefits, incentives, and health, safety and wellness initiatives. We have published a Human Rights Statement that outlines our commitment to maintaining a work culture that treats all employees fairly and with respect, promotes inclusivity, provides equal opportunities for the professional growth of the diverse individuals who join us, and advancement based on merit. We earned a place on Forbes’ 2021 list of America’s Best Midsize Employers, the only national homebuilder to receive this distinction. In 2021, we were also the only national homebuilder named to The Wall Street Journal’s “Management Top 250” list, which identifies the most effectively managed U.S. companies, as developed by the Drucker Institute. Management Top 250 measures corporate effectiveness by examining performance in the areas of customer satisfaction, employee engagement and development, innovation, social responsibility and financial strength.
Safety is a priority for our employees, our homebuyers and our independent contractors. To get a sense of our independent contractors’ compliance with their safety obligations, we track nearly 50 checkpoints across key aspects of jobsite safety, including safety documentation, personal protective equipment, scaffolding and ladders, fall protection, trenching and excavation, hazard assessment protocol, first aid and emergency plan, electrical safety and material safety.
Our commitment to our communities is not solely about the homes we build. Our KB Cares philanthropic program helps to build strong social ties through efforts ranging from assisting people in challenging circumstances to educating the next generation. We have partnered with local nonprofits and community organizations to contribute to the long-term social fabric of the areas in which we build. For instance, we are one of the founding partners of the Building Talent Foundation, whose mission is to advance the education, training and career progression of young people and people from underrepresented groups as skilled technical workers and business owners in residential construction.
We have a Supplier Code of Conduct that builds upon the principles, guidelines and standards within our Ethics Policy, including operating in accordance with applicable laws; treating all workers fairly and with dignity and respect; and providing a clean, safe and healthy work environment. Our Supplier Code of Conduct also encourages our suppliers to operate in an
efficient and environmentally responsible manner, conserve natural resources and minimize waste and the use of environmentally harmful materials.
Corporate Governance Practices. Our board of directors maintains a robust governance framework and leading practices to oversee the management of our business and, among other things, oversees our sustainability initiatives as part of our overall business strategy. Our approach to corporate governance aligns with the principles of the Investor Stewardship Group, a coalition of some of the world’s largest investors and asset managers, as follows:
| | | | | | | | |
| Stewardship Principle | | What We Do |
| | |
•Boards are accountable to stockholders. | | •Our board is unclassified and directors stand for election annually under a majority voting standard in an uncontested election. •Stockholders approved measures with potential “anti-takeover” effects to protect valuable deferred tax assets.
|
| | |
•Stockholders should be entitled to voting rights in proportion to their economic interest. | | •We have one class of outstanding voting securities that allow each holder one vote for each share held. |
| | |
•Boards should be responsive to stockholders and be proactive in order to understand their perspectives. | | •Stockholders may communicate with us and our board. •We proactively engage with stockholders year-round. In 2021, many stockholder dialogues included discussions on our ESG programs’ progress. |
| | |
•Boards should have a strong, independent leadership structure. | | •Our board has a strong independent lead director with significant responsibilities and authority. •Independent directors lead all board committees. |
| | |
•Boards should adopt structures and practices that enhance their effectiveness. | | •Directors have extensive and relevant experience and skills. •92% of directors are independent; 42% are women or racial or ethnic minorities. •Stockholders elected three new candidates at our 2021 Annual Meeting, and a new director joined the board later in 2021, promoting its refreshment. |
| | |
•Boards should develop management incentive structures that are aligned with the long-term strategy of the company. | | •At our 2021 Annual Meeting, our proposal to approve named executive officer compensation received 85% support. •Management compensation is designed to advance our long-term strategic goals. |
More information concerning our corporate governance can be found in our Proxy Statement for the 2022 Annual Meeting of Stockholders (“2022 Proxy Statement”).
Government Regulations and Environmental Matters
Our operations are subject to myriad legal and regulatory requirements concerning land development (including governmental permits, taxes, assessments and fees), the homebuilding process, employment conditions and worksite health and safety. These requirements often provide broad discretion to government authorities, and they could be interpreted or revised in ways that delay or prohibit project development or home sales, and/or make these activities more costly. The costs to comply, or associated with any noncompliance, are, or can be, significant and variable from period to period.
Under applicable environmental laws (including those aimed at protecting against climate change impacts), we may be responsible for, among other things, removing or remediating hazardous or toxic substances even where we were not aware of their presence or on land we previously owned. In addition to incurring clean-up costs, the presence of harmful substances on or near our properties may prevent us from performing land development or selling homes. Also, we are subject to federal, state and local rules that can require us to undertake extensive measures to prevent or minimize discharges of stormwater and other materials from our communities, and to protect wetlands and other designated areas.
As part of our due diligence process for land acquisitions, we often use third-party environmental consultants to investigate potential environmental risks, and we require disclosures, representations and warranties from land sellers regarding environmental risks. We also take steps prior to our acquisition of the land to gain reasonable assurance as to the precise scope of any remediation work required and the costs associated with removal, site restoration and/or monitoring. To the extent contamination or other environmental issues have occurred in the past, we will attempt to recover restoration costs from third parties, such as the generators of hazardous waste, land sellers or others in the prior chain of title and/or their insurers. However, despite these efforts, there can be no assurance that we will avoid material liabilities relating to the existence or removal of toxic wastes, site restoration, monitoring or other environmental matters affecting properties currently or previously owned or controlled by us, and no estimate of any potential liabilities can be made.
Available Information
Our annual reports on Form 10-K, quarterly reports on Form 10-Q, current reports on Form 8-K, beneficial ownership reports on Forms 3, 4 and 5 and proxy statements, as well as all amendments to those reports are available free of charge through our investor relations website at investor.kbhome.com, as soon as reasonably practicable after such reports are electronically filed with, or furnished to, the Securities and Exchange Commission (“SEC”). They can also be found at the SEC’s website at www.sec.gov. We will also provide these reports in electronic or paper format free of charge upon request made to our investor relations department at investorrelations@kbhome.com or at our principal executive offices. We intend for our investor relations website to be the primary location where investors and the general public can obtain announcements regarding, and can learn more about, our financial and operational performance, business plans and prospects, our board of directors, our senior executive management team, and our corporate governance policies, including our articles of incorporation, by-laws, corporate governance principles, board committee charters, and ethics policy. We may from time to time choose to disclose or post important information about our business on or through our investor relations website, and/or through other electronic channels, including social media outlets, such as Facebook® (Facebook.com/KBHome) and Twitter® (Twitter.com/KBHome), and other evolving communication technologies. The content available on or through our primary website at www.kbhome.com, our investor relations website, including our sustainability reports, Human Rights Statement, Supplier Code of Conduct and other ESG-related policies, or social media outlets and other evolving communication technologies is not incorporated by reference in this report or in any other filing we make with the SEC, and our references to such content are intended to be inactive textual or oral references only.
Item 1A.RISK FACTORS
Although we have operated through a number of varying economic cycles, there are several risks that could affect our ability to conduct our business, which we discuss below. If any of these risks materialize, they could, among other things, (a) materially and adversely impact our results of operations and consolidated financial statements; and (b) cause our results to differ materially from the forward-looking and other statements we make in our SEC filings; in our news releases and other public reports and communications, including those we post on or make available through our websites or other electronic channels; or orally through our personnel and representatives. These risks, and other factors outside of our control, could also create or increase volatility in our common stock’s market price.
Consumer Demand Risks. The following could negatively affect consumer demand for our products, thereby unfavorably impacting our net orders, homes delivered, average selling prices, revenues and/or profitability:
•Soft or negative economic or housing market conditions. Adverse conditions in our served markets or nationally could be caused or worsened by factors outside of our control, including, for example, due to the imposition and/or continuation of federal, state and/or local orders for individuals to substantially restrict daily activities and for businesses to significantly curtail or cease normal operations to address COVID-19 or other disease outbreaks or civil unrest, or a federal government shutdown or failure to approve additional COVID-19-related relief or stimulus measures, and financial markets’ and businesses’ reactions thereto. Among other impacts, a severe economic contraction may also trigger a rise in home purchase cancellations.
•Reduced employment levels and job and wage growth. While employment levels have improved since the onset of the COVID-19 pandemic in the 2020 second quarter, these trends may weaken or reverse in 2022, particularly if there are sustained or renewed COVID-19 outbreaks. If they do, our core first-time and first move-up homebuyer segments could be particularly affected, impacting us more severely than homebuilders that target a different buyer demographic.
•Lower population growth, household formations or other unfavorable demographic changes. These may be driven by, among other things, birth rate changes, economic factors or U.S. immigration policies.
•Diminished consumer confidence, whether generally or as to purchasing a home. Consumers may be reluctant to purchase a home compared to housing alternatives (such as renting apartments or homes, or remaining in their existing home) due to location or lifestyle preferences, affordability perceptions (particularly in markets experiencing rapid home price appreciation), employment instability or otherwise. Consumers may also decide not to search for a new home when there are significant public health risks in doing so in their area, which we saw across our served markets in the 2020 second quarter with the outbreak of COVID-19.
•Rising home selling prices. Steady demand for housing since 2013 combined with declining home inventories, in part reflecting a low supply of new homes compared to historical levels, has helped drive above-average home price appreciation across most markets for the past several years, and especially since the 2020 third quarter. If home selling prices, including our homes’ selling prices, increase at a faster rate than consumer incomes, consumers, including and perhaps particularly those in our core first-time and first move-up homebuyer segments, may not be able to afford to purchase a home, including our homes.
•Tightened availability or affordability of mortgage loans and homeowner insurance coverage. Most of our buyers need a mortgage loan to purchase their home. Their ability to obtain a mortgage loan is largely subject to prevailing interest rates, lenders’ credit standards and appraisals, and the availability of government-supported programs, such as those from the Federal Housing Administration, the Veterans Administration, Federal National Mortgage Association (also known as Fannie Mae) and the Federal Home Loan Mortgage Corporation (also known as Freddie Mac). If mortgage loan interest rates increase, credit standards are tightened, appraisals for our homes are lowered or mortgage loan programs are curtailed, potential buyers of our homes may not be able to obtain necessary mortgage financing to be able to purchase a home from us.
Insurance companies are increasingly drawing back from issuing, or are measurably raising premiums for, homeowner insurance policies in areas that have experienced, or are thought to be at risk of experiencing, significant wildfires, hurricanes, flooding or other natural disasters. If potential homebuyers are unable to obtain affordable homeowner insurance coverage, they may decide not to pursue purchasing a home or may cancel a home purchase contract with us.
•Poor lender performance. We depend on third-party lenders, including our third-party partner in KBHS, to provide mortgage loans to our homebuyers, unlike homebuilders with a wholly-owned mortgage lender. These lenders may be unable or unwilling to complete, timely or at all, the loan originations they start for our homebuyers. Poorly performing lenders can significantly delay home closings, disrupting our production schedules and delivery forecasts, or cause home purchase contract cancellations. If KBHS performs poorly and our customers use another lender, the income from and value of our KBHS equity interest would decline.
On March 1, 2021, Guaranteed Rate, Inc. (“Guaranteed Rate”) acquired the parent company of Stearns Ventures, LLC (“Stearns”), our KBHS partner prior to that date. In October 2021, Stearns was renamed as GR Alliance Ventures, LLC (“GR Alliance”). While we are not aware of any significant changes with respect to GR Alliance (f/k/a Stearns) or its operations as a result of the transaction being completed, we can offer no assurance that KBHS’ operations will continue in their current form or that KBHS’ performance will not be negatively affected by post-acquisition integration activities and/or related management or other personnel changes, which, in turn, could result in one or more of the impacts described in the foregoing paragraph.
•Adverse tax law changes. If federal or state laws are changed to eliminate or reduce the income tax benefits associated with homeownership, such as personal tax deductions for mortgage loan interest costs and real estate taxes, the after-tax cost of homeownership could measurably increase and diminish consumer interest in buying a home, as could increases in personal income tax rates, which the current presidential administration may consider.
•Competition. We face significant competition for customers from other homebuilders, sellers of resale homes and other housing industry participants, including rental-housing operators. This competitive environment may, among other things, cause us to reduce our home selling prices or offer incentives to attract or retain buyers.
•Seasonality. As discussed above under Item 1 – Business in this report, we historically have experienced fluctuations in our quarterly operating results with measurably more homes delivered and revenues generated in our third and fourth fiscal quarters. However, as was the case in 2021 and 2020, this pattern may not continue in the future at all or to the same degree as in the past.
•Inflation. We and the homebuilding industry in general may be adversely affected during periods of high inflation, primarily because of higher land and construction costs, as we experienced throughout 2021, and with increased intensity. Inflation may also raise our financing costs. In addition, higher mortgage loan interest rates can affect the affordability of mortgage financing to prospective homebuyers. While we attempt to pass on increases in our costs
through increased sales prices, market forces may limit our ability to do so. If we are unable to raise sales prices enough to compensate for higher costs, or if mortgage loan interest rates increase significantly, our revenues, housing gross profit margin and net income could be adversely affected.
Supply Risks. The following could negatively affect our ability to increase our owned and controlled lot inventory, community count, operational scale and market share, and to grow our business, if at all:
•Lack of available land. Securing sufficient developable land that meets our investment return standards is critical for us to meet our strategic goals and profitably expand our business’ scale. Land availability depends on several factors, including geographical/topographical/governmental constraints, sellers’ business relationships and reputation within the residential real estate community, and competition from other parties, some of which can bid more for land. We expect to continue to face fierce competition for desirable land in our served markets in 2022, pressuring its availability and increasing its cost.
•Supply chain and construction services shortages. Our business relies upon a network of suppliers and trade partners to source materials and services to build homes. However, since the COVID-19 pandemic began, our industry and the U.S. economy have continued to experience labor shortages, supply chain constraints, and rising and volatile raw material prices and availability, particularly related to building materials and appliances, such as with paint, HVAC systems and water heaters, as well as delays with respect to state and municipal construction permitting, inspections and utilities. Such constraints, cost pressures and delays can increase our costs, reduce our revenues in particular reporting periods, lead to higher order cancellations or result in lower customer satisfaction. In an effort to manage our cycle times and deliver homes to our homebuyers, we, among other things, expanded our supplier base; worked with our national suppliers to get products and materials, or available temporary or permanent substitutes, delivered; paced lot releases to align with our production capacity; and balanced pace, price and construction starts to enhance margins. However, we experienced measurable delays in delivering homes in 2021 because of the above-described issues, and believe these challenging conditions will generally persist into 2022 and potentially throughout the year, as discussed below under “Outlook.” We may also face increased future home warranty and construction defect claims associated with replacing or servicing substitute products or materials used in some instances to address supply shortages in certain served markets or communities.
•Insufficient financial resources. Our business needs considerable cash to, among other things, acquire and develop land, build homes and provide customer service. We expect to meet our needs with existing cash, future operational cash flow, our unsecured revolving credit facility with various banks (“Credit Facility”) and unsecured letter of credit facility with certain financial institutions (“LOC Facility”), or outside sources, including loans that are specifically obtained for, or secured by, particular communities or other inventory assets, which we refer to as project financing. However, outside financing may be unavailable, costly and/or considerably dilute stockholders. For instance:
◦Tight capital or financial market conditions may hinder our ability to obtain external financing, or use or expand our Credit Facility and LOC Facility, on favorable terms or at all. Also, if a rating agency downgrades our credit rating or outlook, external financing may be difficult and costly for us to obtain.
◦Noncompliance with our Credit Facility and senior notes’ covenants may restrict our ability to borrow; accelerate repayment of our debt, which may not be feasible for us; or cause our lenders to impose significant fees or cease lending to us.
◦As described in Note 15 – Notes Payable in the Notes to Consolidated Financial Statements in this report, if a change of control or fundamental change occurs before our senior notes mature, we may need to offer to purchase certain of them. This may require us to refinance or restructure our debt, which we may be unable to do at all or on favorable terms.
◦Our debt and debt-to-capital levels could require us to dedicate substantial cash flow to debt service; inhibit our ability to respond to business changes or adjust our debt maturity schedule; curb execution on our current strategies; and/or make us more vulnerable in a downturn than our less-leveraged competitors. Our next senior note maturity is our $350.0 million in aggregate principal amount of 7.50% senior notes due September 15, 2022 (“7.50% Senior Notes due 2022”).
•Decreased land inventory value. Our land inventory’s value depends on market conditions, including our estimates of applicable future demand and revenue generation. If conditions deteriorate during the typically significant amount of time between our acquiring ownership/control of land and delivering homes on that land; if we cannot sell land held for sale at its estimated fair value; or if we make strategic changes, we may need to record inventory-related charges. We may also record charges if we decide to sell land at a loss or activate or sell land held for future development.
In addition, our business could be negatively affected if our net orders, homes delivered or backlog-to-homes delivered conversion rate fall; if often-volatile building materials prices or construction services costs increase, which has been the trend over the past few years and was particularly the case with lumber in 2021 and 2020; or if our community openings are delayed due to, among other things, prolonged development from supply chain disruptions, construction services shortages or otherwise, our strategic adjustments, or protracted government approvals or utility service activations from staff or resource cuts or reallocations for public safety priorities (e.g., earthquakes, wildfires, flooding, hurricanes or other natural disasters).
•Trade disputes and defective materials. The federal government has imposed, and may in the future impose, new or increased import tariffs, and other countries have implemented retaliatory measures, raising the cost and reducing the supply of several home construction items. In addition, shortages or rising prices of building materials may ensue from manufacturing defects, resulting in recalls of materials. If such disputes continue or recalls occur, our costs and supply chain disruptions could increase further.
•Poor contractor availability and performance. Independent contractors perform essentially all of our land development and home construction work. Though we schedule and oversee such activities at our community sites, we have no control over our independent contractors’ availability or work methods. If qualified contractors are not available (due to general shortages in a tight labor market, as was the case throughout 2021 and is anticipated into 2022, competition from other builders or otherwise), or do not timely perform, we may incur production delays and other inefficiencies, or higher costs for substitute services. Also, if our trade partners’ work or materials quality does not meet our standards, we could face more home warranty and construction defect claims, and they or their insurers may not be able to cover the associated repair costs.
•Potential expansion of employment-related obligations. Governmental agencies or others might assert that we should be subjected to California law and associated regulations that, in certain circumstances, impose responsibility upon direct contractors for certain wages and benefits that subcontractors of the direct contractor have failed to pay to their employees. It might also be alleged that California law and regulations impose other liabilities upon us with respect to the employees of our trade partners. Further efforts in California or elsewhere to impose such external labor-related obligations on us could create substantial exposure for us in situations beyond our control.
Strategy Risks. Our strategies, and any related initiatives or actions, and any changes thereto, may not be successful in achieving our goals or generate any growth, earnings or returns, particularly in a highly volatile business environment precipitated by a health or economic crisis, akin to the outbreak of COVID-19 or the extended supply chain disruptions and construction services shortages that marked 2021, or by social instability or distress. We may not achieve positive operational or financial results, or results equal to or better than we did in any prior period or in comparison to other homebuilders. We may also incur higher costs, or experience due to sourcing or supply chain disruptions extended times, to build our homes than other homebuilders due to our commitment to sustainability, as discussed above under “Environmental, Social and Governance.” Among other strategic risks, our business is presently concentrated in California, Florida, Nevada and Texas. Poor conditions in any of those markets could have a measurable negative impact on our results, and the impact could be larger for us than for other less-concentrated homebuilders. In addition, we may not be successful in generating positive results from our recent expansion into the Boise, Idaho market, our re-entry into the Charlotte, North Carolina market, or if we choose to enter into any other new markets, based on our relative inexperience with the local homebuilding and economic environment and the need to make a significant investment to achieve effective scale and profitable returns, which we may not be able to accomplish.
Adverse conditions in California would have particular significance to our business. We generate the highest proportion of our revenues from and make significant inventory investments in our California operations. However, we may be constrained or delayed in entitling land and selling and delivering homes in California, and incur higher development or construction costs, from water conservation or wildfire protection measures (including precautionary and event-induced electricity blackouts, temporary or extended local or regional evacuations, development moratoriums in high-risk areas, and community resiliency design requirements) that are intended to address severe drought and climatic conditions that have arisen in recent years. In addition, as large-scale wildfires and flooding due to such conditions in California, as well as hurricanes, heavy rains and other climate change-driven natural disasters in other of our served markets, become more frequent and intense, as discussed below under “Climate Risk,” we may experience greater disruption to our land development and homebuilding activities, delaying orders and home deliveries, among other impacts.
Also, California’s highly regulated and litigious business environment has made the state an increasingly challenging and uncertain place for us to operate. This includes implementing regulations under the state’s Global Warming Solutions Act of 2006 (AB32) intended to lower GHG emissions. For instance, we have and will continue to incur higher construction costs because of a state law requirement that effectively requires that all new homes permitted to build in 2020 and beyond have solar
power systems, and we may be unable to offset (through customer leases) or cover such costs through selling price increases due to competition and consumer affordability concerns. Also, while not yet a statewide mandate, certain local jurisdictions have passed ordinances effectively eliminating natural gas in new homes by 2023 or 2024 as part of a continuing trend in California to mandate electrification of all new homes. In addition, California and certain of its local governments are considering or have implemented restrictions on or disincentives with respect to the creation or size of new suburban and exurban residential communities generally in favor of higher-density, urban developments that can be attractive to some buyers, but in many cases are on smaller parcels with higher building costs and more complicated entitlement requirements and may be subject to affordable housing mandates, prevailing wage requirements, greater local opposition and/or additional site remediation work. Depending on their scope, these efforts could significantly increase our land acquisition and development costs and, along with increasing competition from other homebuilders and investors for available developable land, limit our California operations’ growth, while making new homes less affordable to potential buyers in the state. Partially offsetting these trends, California’s governor and certain legislators have taken positions to promote new housing construction, including the adoption of SB 8, which extends into 2030 the provisions of the Housing Crisis Act of 2019 (SB 330) intended to expedite the approval process for housing development in order to address the housing shortage in California.
Climate Risk. GHG emissions are driving global climate change that is expected to have various impacts on our operations, ranging from more frequent extreme weather events to extensive governmental policy developments and shifts in consumer preferences, which have the potential individually or collectively to significantly disrupt our business as well as negatively affect our suppliers, independent contractors and customers. Experiencing or addressing the various physical, regulatory and adaptation/transition risks from climate change may significantly reduce our revenues and profitability, or cause us to generate losses. For instance, incorporating greater resource efficiency into our home designs, whether to comply with upgraded building codes or recommended practices given a region’s particular exposure to climate conditions, or undertaken to satisfy demand from increasingly environmentally conscious customers or to meet our own sustainability goals, often raises our costs to construct homes. In evaluating whether to implement voluntary improvements, we also consider that choosing not to enhance our homes’ resource efficiency can make them less attractive to municipalities, and increase the vulnerability of residents in our communities to rising energy and water expenses and use restrictions. We weigh the impact of the costs associated with offering more resource-efficient products against our priorities of generating higher returns and delivering homes that are affordable to our core first-time and first move-up buyers. In balancing these objectives, we may determine we need to absorb most or all the additional operating costs that come with making our homes more efficient. While our years of experience in sustainable homebuilding, as discussed above under “Environmental Practices,” and ability to leverage economies of scale may give us an advantage over other homebuilders in managing these absorbed costs, they may be substantial for us.
Beyond the commercial pressures implicated by climate change concerns, our operations in any of our served markets may face its potential adverse physical effects. For example, California, our largest market, has historically experienced, and is projected to continue to experience, climate-related events at an increasing frequency including drought, water scarcity, heat waves, wildfires and resultant air quality impacts and power shutoffs associated with wildfire prevention. In addition, severe cold weather in Texas in early 2021 and large hurricanes later in the year contributed to the supply chain disruptions that have significantly affected our business, as discussed above under “Strategy Risks.” While we have safety protocols in place for our construction sites and take steps to safeguard our administrative functions, including our IT resources, as described below under “Information Technology and Information Security Risks,” we can provide no assurance that we or our suppliers or trade partners can successfully operate in areas experiencing a significant weather event or natural disaster, and we or they may be more impacted and take longer, and with higher costs, to resume operations in an affected location than other homebuilders or businesses, depending on the nature of the event or other circumstances.
As discussed above under “Strategy Risks,” and below under “Legal and Compliance Risks,” international, federal, state and local authorities and legislative bodies have issued, implemented or proposed regulations, penalties, standards or guidance intended to restrict, moderate or promote activities consistent with resource conservation, GHG emission reduction, environmental protection or other climate-related objectives. Compliance with those directed at or otherwise affecting our business or our suppliers’ (or their suppliers’) operations, products or services, could increase our costs, such as with California’s requirement that effectively all new homes built in 2020 and beyond have solar power systems; delay or complicate home construction, for example, due to a need to reformulate or redesign building materials or components, or source updated or upgraded items or equipment, or specially trained or certified independent contractors, in limited or restricted supply, which has been a challenge for us in certain cases in 2021, such as with paint, HVAC systems and water heaters that have been out of stock and delayed home construction or required us to install or use temporary or permanent substitutes due to the supply chain disruptions we have experienced; or diminish consumer interest in homes mandated to include or omit certain features, amenities or appliances, particularly if home prices increase as a result.
Adapting to or transitioning from the use of certain items or methods in home construction, or adjusting the products we offer to our buyers, whether due to climate-related governmental rules affecting home construction or our supply chain, market dynamics or consumer preferences, can negatively affect our costs and profitability, production operations in affected markets
and customer satisfaction during the transition period, which could be prolonged. For instance, in certain local markets in California where natural gas use is banned in new homes, we have faced some disruptions in reorienting our purchase order, independent contractor engagement, design studio and home construction processes to accommodate the restriction and, longer term, have implemented certain architectural design changes for all-electric homes. To the extent other jurisdictions adopt such bans, we will face similar issues.
Though practically available technology and resources allow us only to make certain estimates, and not definitive measurements, of the effectiveness and overall impact of our longstanding and broad-based environmental sustainability initiatives described above under “Environmental Practices,” we feel these initiatives and their evolution over time represent how we can best address climate change risks in the context of our business, industry and the wider, and rapidly changing, economic, social and political environment. However, climate change is an intrinsically complex global phenomenon with inherent residual risks across its physical, regulatory and adaptation/transition dimensions that cannot be mitigated given their wide-ranging, (sometimes unexpectedly) interdependent and largely unpredictable potential scope, nature, timing or duration. Therefore, we cannot provide any assurance that we have or can successfully prepare for, or are or will be able to reduce or manage, any of them to the extent they may arise. In addition, we may experience substantial negative impacts to our business if an unexpectedly severe weather event or natural disaster damages our operations or those of our suppliers or independent contractors in our primary markets, such as in California, Florida, Nevada and Texas, or from the unintended consequences of regulatory changes that directly or indirectly impose substantial restrictions on our activities or adaptation requirements.
Warranty Risks. Our homebuilding business is subject to warranty and construction defect claims. Though we have insurance coverage to partially reduce our exposure, it is limited and costly, in part due to a shrinking provider market, and we have high self-insured retentions that are expected to increase. We self-insure some of our risk through a wholly-owned insurance subsidiary.
Due to our dependence on the performance of independent suppliers and contractors to provide products and materials and carry out our homebuilding activities, and the associated risks described above under “Supply chain and construction services shortages” and “Poor contractor availability and performance,” as well as inherent uncertainties, including obtaining recoveries from responsible parties and/or their or our insurers, our recorded warranty and other liabilities may be inadequate to address future claims, which, among other things, could require us to record charges to increase such liabilities. We may also record charges to reflect our then-current claims experience, including the actual costs incurred. Home warranty and other construction defect issues may also generate negative publicity, including on social media and the Internet, that detracts from our reputation and efforts to sell homes.
Deferred Tax Asset Recovery and Tax Position Risks. Our realization of our deferred tax assets depends on our generating sufficient future taxable income, which may not occur. Also, our deferred tax assets’ value can increase or decrease with: (a) changes in the federal corporate income tax rate; (b) our undergoing a “change of ownership” under federal tax rules, which would significantly reduce and possibly eliminate their value; and (c) adjustments in statutory or taxing authority treatment of such assets. We have filed our tax returns based on certain positions we believe are appropriate, and we may owe additional taxes if taxing authorities disagree with those positions.
Human Capital Risks. Our directors, officers and employees are important resources. If we cannot attract, retain and develop talent at reasonable pay and benefits levels or, alternatively, if we need to implement personnel or compensation reductions, our performance, profitability and ability to achieve our strategic goals could be significantly impaired. In addition, in many of our served markets, we need to have personnel with certain professional licenses, including building contractor and real estate brokerage licenses. Our home selling and construction activities may be severely disrupted or delayed if we do not have sufficient licensed individuals in our workforce.
Information Technology and Information Security Risks. We use IT resources to carry out important operational activities and maintain our business records. Third parties maintain many of our IT resources, including disaster recovery and business continuity services intended to safeguard our access to and use of our IT resources during a general or local network outage, under agreements with evolving security and service level standards.
Our systems have faced a variety of phishing, denial-of-service and other attacks. We have administrative, physical and multi-layered technical controls and processes in place to address and mitigate cybersecurity risks and help protect our IT resources, including employee education and training, as well as third-party assessments. Our technical defense layers are designed to provide multiple, redundant measures to protect against exploitation of a vulnerability that may arise or if a security control fails. We rely on artificial intelligence, machine learning computer network monitoring and antivirus resources, firewall and intrusion detection systems, vendor cloud service defenses, Internet address and content filtering monitoring software that secures against known malicious websites and potential data exfiltration, and a variety of cyber intelligence threat monitoring sources that provide ongoing updates, all provided from third parties that we believe are capable of performing the protective service for which we have engaged them. We also depend on our service providers, GR Alliance and other mortgage lenders
with whom we share some personal identifying and confidential information to secure our information and the homebuyer information they collect from us. Our IT security costs, including cybersecurity insurance, are significant and will likely rise in tandem with the sophistication and frequency of system attacks.
However, our, GR Alliance’s and our service providers’ measures may be inadequate and possibly have operational or security vulnerabilities that could go undetected for some period of time. If our IT resources are compromised by an intentional attack, natural or man-made disaster, electricity blackout, IT failure or systems misconfiguration, service provider error, mismanaged user access protocols, personnel action, or otherwise, we may be severely limited in conducting our business and achieving our strategic goals for an extended period, experience internal control failures or lose access to operational assets or funds. A substantial disruption, or security breach suffered by GR Alliance/KBHS or a service provider, could damage our reputation and result in the loss of customers or revenues, in sensitive personal information being publicly disclosed or misused and/or legal proceedings against us. We may incur significant expenses to resolve such issues.
We have invested significant resources over the past few years to develop and implement a new custom enterprise resource planning (“ERP”) system designed to improve the efficiency of our internal operational and administrative activities. There are inherent risks in undertaking this type of broad-based IT project and we have experienced complications and delays during the implementation process. We expect these will continue as we progress and expand the scope of the system in 2022 and that we will incur appreciable additional costs in doing so. In addition, the testing and use of the new system during this rollout could increase our exposure to the security risks and consequences discussed in the foregoing paragraph.
Legal and Compliance Risks. As discussed above under Item 1 – Business in this report, our operations are subject to myriad legal and regulatory requirements, which can delay our operational activities, raise our costs and/or prohibit or restrict homebuilding in some areas. For example, certain of our Texas operations are subject to rules mandating enhanced flood management practices stemming from recent large hurricanes and rainstorms. These requirements often provide broad discretion to government authorities, and they could be interpreted or revised in ways unfavorable to us. The costs to comply, or associated with any noncompliance, are, or can be, significant and variable from period to period. With respect to environmental laws, in addition to the risks and potential operational costs discussed above, we have been, and we may in the future be, involved in federal, state and local air and water quality agency investigations or proceedings for potential noncompliance with their rules, including rules governing discharges of materials into the air and waterways; stormwater discharges from community sites; and wetlands and listed species habitat protection. We could incur penalties and/or be restricted from developing or building at certain community locations during or as a result of such agencies’ investigations or findings.
Additionally, we are involved in legal, arbitral or regulatory proceedings or investigations incidental to our business, the outcome or settlement of which could result in material claims, losses, monetary damage awards, penalties, or other direct or indirect payments recorded against our earnings, or injunctions, consent decrees or other voluntary or involuntary restrictions or adjustments to our business operations or practices. Any adverse results could be beyond our expectations, insurance coverages and/or accruals at particular points in time. Unfavorable outcomes, as well as unfavorable investor, analyst or news reports related to our industry, company, personnel or operations, may also generate negative publicity, including on social media and the Internet, damaging our reputation and resulting in the loss of customers or revenues.
To reduce the risks and expected significant costs of defending intra-corporate proceedings in multiple venues and to help ensure that such matters are considered within a well-established body of law, our By-laws provide that, subject to certain exceptions, Delaware state courts are the exclusive forum for specified internal corporate affairs actions. This may limit a stockholder’s ability to bring a claim in their favored forum. At the same time, if a court were to allow for an alternative forum, or we waive the provision’s application, for a particular matter, we may incur additional costs associated with resolving an otherwise relevant action in another jurisdiction(s).
The European Union and state governments, notably California and Nevada, have enacted or enhanced data privacy regulations, and other governments are considering establishing similar or stronger protections. These regulations impose certain obligations for securing, and potentially removing, specified personal information in our systems, and for apprising individuals of the information we have collected about them. We have incurred costs in an effort to comply with these data privacy risks and requirements, and our costs may increase significantly as risks become increasingly complex or if new or changing requirements are enacted, and based on how individuals exercise their rights. For example, in November 2020, California voters approved Proposition 24 (Consumer Personal Information Law and Agency Initiative), which will increase data privacy requirements for our business when its provisions take effect in 2023. Despite our efforts, any noncompliance could result in our incurring substantial penalties and reputational damage.
KBHS’ operations are heavily regulated. If GR Alliance, which oversees KBHS’ operations, or KBHS is found to have violated regulations, or mortgage investors demand KBHS repurchase mortgage loans it has sold to them, or cover their losses,
for claimed contract breaches, KBHS could face significant liabilities, which, if they exceed its reserves, could result in our recognizing losses on our KBHS equity interest.
Our financial results may be materially affected by the adoption of new or amended financial accounting standards, and regulatory or outside auditor guidance or interpretations. In addition, to the extent we expand our disclosures on our sustainability initiatives in line with certain private reporting frameworks and investor requests, our failure to report accurately or achieve progress on our metrics on a timely basis, or at all, could adversely affect our reputation, business, financial performance and growth.
Pandemic Risks. An epidemic, pandemic or similar serious public health issue, and the measures undertaken by governmental authorities to address it, could significantly disrupt or prevent us from operating our business in the ordinary course for an extended period, and thereby, and/or along with any associated economic and/or social instability or distress, have a material adverse impact on our consolidated financial statements. We experienced significant impacts to our business during 2020, beginning in mid-March, due to the outbreak of COVID-19 and the related COVID-19 control responses by international, federal, state and local public health and governmental authorities, including quarantines, “stay-at-home” orders and similar mandates.
In response to the initial COVID-19 control responses in our served markets, we temporarily closed our sales centers, model homes and design studios to the general public, shifted to an appointment-only personalized home sales process and prioritized our warranty service activities to respond to emergency repair requests, and otherwise on a by-exception basis, in each case as and where permitted and following recommended distancing and other health and safety protocols when meeting in person with a customer. We also leveraged our virtual sales tools to give customers the ability to shop for a new KB home from their mobile device or personal computer. In addition, we shifted our corporate and division office functions to work remotely. We limited our construction operations largely to authorized activities with increased safety measures and experienced a reduction in the availability, capacity and efficiency of municipal and private services necessary to the progress of developing land, building homes, completing mortgage loans and delivering homes to varying degrees depending on the scope of the restrictions local authorities established.
Although we gradually resumed nearly all of our operations with the relaxing of the early COVID-19 control responses beginning late in our 2020 second quarter and for the remainder of the fiscal year, the magnitude and duration of the business and economic impacts from the unprecedented public health effort to contain and combat the spread of COVID-19 have produced ongoing uncertainty about the overall operating environment going forward and made it more challenging for our management to estimate the future performance of our business and to develop strategies to generate growth. Moreover, we can provide no assurance as to whether the COVID-19 public health effort will be intensified to such an extent, particularly in response to any resurgence in infections, whether due to the spread of any variants of the virus or otherwise, combined with the seasonal flu, that we will not be able to conduct any business operations in certain of our served markets or at all for an indefinite period, including due to the reduced availability of contractors, employees and other talent, which may result from infections or medically necessary or recommended self-quarantining, which we have experienced in a few locations at various times during 2021. This could result in our recognizing charges in future periods, which may be material, for inventory impairments or land option contract abandonments, or both, related to our inventory assets.
Should the adverse impacts described above (or others that are currently unknown) occur, whether individually or collectively, we would expect to experience, among other things, decreases in our net orders, homes delivered, average selling prices, revenues and profitability, as we did during our 2020 second quarter, and such impacts could be material to our consolidated financial statements. In addition, should the COVID-19 public health effort intensify to such an extent that we cannot operate in most or all of our served markets, we could generate few or no orders and deliver few, if any homes during the applicable period, which could be prolonged. Along with an increase in cancellations of home purchase contracts, if there are prolonged government restrictions on our business and our customers, and/or an extended economic recession, we could be unable to produce revenues and cash flows sufficient to conduct our business; meet the terms of our covenants and other requirements under the Credit Facility, our senior notes and the related indenture, and/or mortgages and land contracts due to land sellers and other loans; service our outstanding debt; or pay any dividends to our stockholders. Such a circumstance could, among other things, exhaust our available liquidity (and ability to access liquidity sources) and/or trigger an acceleration to pay a significant portion or all of our then-outstanding debt obligations, which we may be unable to do.
Other Risks. The risk factors described above are not our only salient risks. Political events, war, terrorism, weather or other natural/environmental disasters, and other risks that are currently unknown or seen as immaterial, could also have a material adverse impact on our business, consolidated financial statements and/or common stock’s market price.
Item 1B.UNRESOLVED STAFF COMMENTS
None.
Item 2.PROPERTIES
None.
Item 3.LEGAL PROCEEDINGS
Our legal proceedings are discussed in Note 18 – Legal Matters in the Notes to Consolidated Financial Statements in this report.
Item 4.MINE SAFETY DISCLOSURES
Not applicable.
Information about our Executive Officers
The following table presents certain information regarding our executive officers as of December 31, 2021:
| | | | | | | | | | | | | | | | | | | | | | | | | | | | | | | | | | | | | | |
| Name | | Age | | Present Position | | Year
Assumed
Present
Position | | Years
at
KB
Home | | Other Positions and Other
Business Experience within the
Last Five Years | | From – To |
| | | | | | | | | | | | |
| Jeffrey T. Mezger | | 66 | | Chairman, President and Chief Executive Officer (a) | | 2016 | | 28 | | | | |
| Jeff J. Kaminski | | 60 | | Executive Vice President and Chief Financial Officer | | 2010 | | 11 | | | | |
| Matthew W. Mandino | | 57 | | Executive Vice President and Co-Chief Operating Officer | | 2018 | | 10 | | Regional President, Southwest | | 2016-2018 |
| | | | | | | | | | | | |
| | | | | | | | | | | | |
| Robert V. McGibney | | 47 | | Executive Vice President and Co-Chief Operating Officer | | 2021 | | 21 | | Regional President | | 2018-2021 |
| | | | | | | | | | Division President and Regional General Manager | | 2016-2018 |
| Albert Z. Praw | | 73 | | Executive Vice President, Real Estate and Business Development | | 2011 | | 25 | | | | |
| Brian J. Woram | | 61 | | Executive Vice President and General Counsel | | 2010 | | 11 | | | | |
(a)Mr. Mezger has served as a director since 2006.
There is no family relationship between any of our executive officers or between any of our executive officers and any of our directors.
PART II
Item 5.MARKET FOR REGISTRANT’S COMMON EQUITY, RELATED STOCKHOLDER MATTERS AND ISSUER PURCHASES OF EQUITY SECURITIES
Our common stock is traded on the New York Stock Exchange under the ticker symbol “KBH.” As of December 31, 2021, there were 569 holders of record of our common stock.
Information regarding the shares of our common stock that may be issued under our equity compensation plans is provided below under Item 12 – Security Ownership of Certain Beneficial Owners and Management and Related Stockholder Matters in this report.
The following table summarizes our purchases of our own equity securities during the three months ended November 30, 2021:
| | | | | | | | | | | | | | | | | | | | | | | | | | |
| Period | | Total Number of Shares Purchased | | Average Price Paid per Share | | Total Number of Shares Purchased as Part of Publicly Announced Plans or Programs | | Maximum Number of Shares That May Yet be Purchased Under the Plans or Programs |
| September 1-30 | | — | | | $ | — | | | — | | | 331,400 | |
| October 1-31 | | 85,050 | | | 41.00 | | | — | | | 331,400 | |
| November 1-30 | | — | | | — | | | — | | | 331,400 | |
| Total | | 85,050 | | | $ | 41.00 | | | — | | | |
As of November 30, 2020, we had 2,193,947 shares authorized for repurchase under a share repurchase program approved by our board of directors in 2018. On July 8, 2021, our board of directors authorized us to repurchase up to 5,000,000 shares of our outstanding common stock. This authorization reaffirmed and incorporated the then-current balance of 2,193,947 shares that remained under the prior authorization. In the 2021 third quarter, we purchased 4,668,600 shares of our common stock pursuant to this authorization at a total cost of $188.2 million. As of November 30, 2021, we had 331,400 shares authorized for repurchase.
The shares purchased during the three months ended November 30, 2021 were previously issued shares delivered to us by employees to satisfy withholding taxes on the vesting of restricted stock awards. These transactions are not considered repurchases under the board of directors’ authorization.
Stock Performance Graph
The following graph compares the five-year cumulative total return of KB Home common stock, the S&P 500 Index and the Dow Jones US Home Construction Index for the periods ended November 30:
Comparison of Five-Year Cumulative Total Return
Among KB Home, S&P 500 Index and
Dow Jones US Home Construction Index
| | | | | | | | | | | | | | | | | | | | | | | | | | | | | | | | | | | |
| 2016 | | 2017 | | 2018 | | 2019 | | 2020 | | 2021 |
| KB Home | $ | 100 | | | $ | 199 | | | $ | 134 | | | $ | 224 | | | $ | 231 | | | $ | 267 | |
| S&P 500 Index | 100 | | | 123 | | | 131 | | | 152 | | | 178 | | | 228 | |
| Dow Jones US Home Construction Index | 100 | | | 179 | | | 128 | | | 186 | | | 228 | | | 304 | |
The above graph is based on the KB Home common stock and index prices calculated as of the last trading day before December 1 of the year-end periods presented. The closing price of KB Home common stock on the New York Stock Exchange was $39.99 per share on November 30, 2021 and $35.20 per share on November 30, 2020. The performance of our common stock as presented above reflects past performance only and is not indicative of future performance. Total return assumes $100 invested at market close on November 30, 2016 in KB Home common stock, the S&P 500 Index and the Dow Jones US Home Construction Index, including reinvestment of dividends.
Item 6.[RESERVED]
Item 7.MANAGEMENT’S DISCUSSION AND ANALYSIS OF FINANCIAL CONDITION AND RESULTS OF OPERATIONS
Our discussion and analysis below is focused on our 2021 and 2020 financial results, including comparisons of our year-over-year performance between these years. Discussion and analysis of our 2019 fiscal year specifically, as well as the year-over-year comparison of our 2020 financial performance to 2019, are located under Part II, Item 7 – Management’s Discussion and Analysis of Financial Condition and Results of Operations in our Annual Report on Form 10-K for the fiscal year ended November 30, 2020, filed with the SEC on January 22, 2021, which is available on our investor relations website at investor.kbhome.com and the SEC’s website at www.sec.gov.
RESULTS OF OPERATIONS
Overview. Revenues are generated from our homebuilding and financial services operations. The following table presents a summary of our consolidated results of operations (dollars in thousands, except per share amounts):
| | | | | | | | | | | | | | | | | | | | | | | | | | | | | |
| | Years Ended November 30, | | Variance |
| | 2021 | | 2020 | | 2019 | | 2021 vs 2020 | | 2020 vs 2019 |
| Revenues: | | | | | | | | | |
| Homebuilding | $ | 5,705,029 | | | $ | 4,167,702 | | | $ | 4,537,658 | | | 37 | % | | (8) | % |
| Financial services | 19,901 | | | 15,472 | | | 15,089 | | | 29 | | | 3 | |
| Total | $ | 5,724,930 | | | $ | 4,183,174 | | | $ | 4,552,747 | | | 37 | % | | (8) | % |
| Pretax income: | | | | | | | | | |
| Homebuilding | $ | 656,911 | | | $ | 331,500 | | | $ | 325,189 | | | 98 | % | | 2 | % |
| Financial services | 38,435 | | | 32,543 | | | 22,986 | | | 18 | | | 42 | |
| Total | 695,346 | | | 364,043 | | | 348,175 | | | 91 | | | 5 | |
| Income tax expense | (130,600) | | | (67,800) | | | (79,400) | | | (93) | | | 15 | |
| Net income | $ | 564,746 | | | $ | 296,243 | | | $ | 268,775 | | | 91 | % | | 10 | % |
| Earnings per share: | | | | | | | | | |
| Basic | $ | 6.22 | | | $ | 3.26 | | | $ | 3.04 | | | 91 | % | | 7 | % |
| Diluted | $ | 6.01 | | | $ | 3.13 | | | $ | 2.85 | | | 92 | % | | 10 | % |
In 2021, housing market conditions were positive, with healthy demand, particularly from millennial and Generation Z demographic groups, a limited supply of new and resale inventory and relatively low mortgage loan interest rates driving strong results for our business. Considerable demand for our homes enabled us to lift selling prices in the vast majority of our communities and, in combination with our focus on balancing pace, price and construction starts at each community, helped us to enhance the performance of our inventory assets and improve returns, despite supply chain challenges and rising construction services and building materials costs. Reflecting these actions, the value of our net orders for 2021 grew 45% year over year to $7.68 billion due to a 21% increase in net orders and a 20% rise in their overall average selling price. The year-over-year increase in our net order volume was due to higher net orders per community, partly offset by a lower average community count for the year. Our lower average community count reflected the accelerated sell-out of communities that resulted from our exceptionally strong monthly net order pace, which rose 37% to 6.3 in 2021 from 4.6 in 2020, even as we paced lot releases to
align with our production capacity, as well as delays in new community openings during 2021, as further described below. Compared to 2020, our average community count for 2021 decreased 12%, and our ending community count declined 8%.
Since 2020, we have experienced intensifying building material cost pressures, particularly for lumber, and production capacity issues with some of our main product suppliers, reflecting sustained high levels of homebuilding and renovation activity combined with supply chain disruptions stemming from international and domestic COVID-19 control responses and economy-wide labor shortages in the U.S. Our housing gross profit margin on homes delivered in the latter part of 2021 were especially impacted by high lumber costs during the period in which these homes were started. In 2021, the continuing supply chain disruptions, combined with construction services availability constraints and delays with respect to state and municipal construction permitting, inspections and utilities, extended our construction cycle times by several weeks and delayed many expected deliveries and new community openings during our fiscal year. We believe these challenging conditions will generally persist into 2022 and potentially throughout the year. We have incorporated these trends into our performance expectations, as presented below under “Outlook.”
Homebuilding revenues for 2021 grew 37% from the previous year due to an increase in housing revenues that reflected 26% growth in the number of homes delivered to 13,472 and a 9% increase in the overall average selling price of those homes to $422,700. In 2021, homebuilding operating income rose 109% year over year to $661.3 million and, as a percentage of homebuilding revenues, improved 400 basis points to 11.6%. The increase in our homebuilding operating income margin was driven by significant improvements in both housing gross profit margin and selling, general and administrative expenses as a percentage of housing revenues. Our pretax income margin improved 340 basis points to 12.1%, and net income and diluted earnings per share increased 91% and 92%, respectively, each as compared to 2020. Our 2021 results included a $5.1 million loss on early extinguishment of debt associated with our purchase, pursuant to a tender offer that expired on June 8, 2021, of $269.8 million in aggregate principal amount of our 7.00% senior notes due 2021 (“7.00% Senior Notes due 2021”) prior to their maturity date. . Our 2020 results included severance charges of $6.7 million, as described below under “COVID-19 Pandemic Impact.”
Our return on equity (“ROE”) for 2021 improved 810 basis points to 19.9%, compared to 11.8% for 2020. ROE is calculated as net income for the year divided by average stockholders’ equity, where average stockholders’ equity is based on the ending stockholders’ equity balances of the trailing five quarters.
COVID-19 Pandemic Impact. The COVID-19 pandemic and related COVID-19 control responses considerably disrupted global and national economies, the U.S. housing market, and our business in the 2020 second quarter. During that period, we experienced a sizable reduction in net orders and backlog as well as supply chain disruptions and construction cycle time extensions in most of our served markets that resulted in home delivery delays. With the uncertainty surrounding the COVID-19 pandemic, and in prioritizing cash preservation and liquidity, we limited our land investments and curtailed our overhead expenditures, partly through workforce realignment and reductions. Due to these workforce-related actions, our selling, general and administrative expenses for the 2020 second quarter included severance charges of $6.7 million.
With the easing to varying degrees of restrictive public health orders in our served markets beginning in May 2020, our net orders began to rebound significantly following a low point in April 2020, as steadily increasing demand drove our 2020 third- and fourth-quarter net orders to then-15-year highs. The sharp rise in net orders over these periods substantially expanded the number of homes in our backlog as well as our backlog value. In 2021, demand for our homes remained strong, with the value of our net orders for the year up 45% year over year to $7.68 billion. Our ending backlog value at November 30, 2021 increased 67% to approximately $4.95 billion, our highest fourth-quarter level since 2005, supporting our expectation for significant year-over-year growth in our scale, profitability and returns in 2022, as described below under “Outlook.” With the ongoing strong demand, we continued to increase our land acquisition and development investments in 2021, as we did in the latter part of 2020, to measurably expand our lot pipeline and support future community count growth.
While we continue to experience construction services availability constraints, supply chain disruptions and rising and volatile raw material prices and availability, particularly with respect to lumber, other building materials and appliances, as well as delays related to state and municipal construction permitting, inspections and utilities, that could negatively impact our growth, margins and financial results in future periods, and there remains a risk that significant COVID-19 pandemic-related disruptions could emerge or re-emerge, we believe we are well-positioned to operate effectively through the present environment.
HOMEBUILDING
Financial Results. The following table presents a summary of certain financial and operational data for our homebuilding operations (dollars in thousands, except average selling price):
| | | | | | | | | | | | | | | | | |
| | Years Ended November 30, |
| | 2021 | | 2020 | | 2019 |
| Revenues: | | | | | |
| Housing | $ | 5,694,668 | | | $ | 4,150,793 | | | $ | 4,510,814 | |
| Land | 10,361 | | | 16,909 | | | 26,844 | |
| Total | 5,705,029 | | | 4,167,702 | | | 4,537,658 | |
| Costs and expenses: | | | | | |
| Construction and land costs | | | | | |
| Housing | (4,466,053) | | | (3,365,509) | | | (3,683,174) | |
| Land | (3,258) | | | (14,942) | | | (25,754) | |
| Total | (4,469,311) | | | (3,380,451) | | | (3,708,928) | |
| Selling, general and administrative expenses | (574,376) | | | (470,779) | | | (497,350) | |
| Total | (5,043,687) | | | (3,851,230) | | | (4,206,278) | |
| Operating income | 661,342 | | | 316,472 | | | 331,380 | |
| Interest income | 1,049 | | | 2,554 | | | 2,158 | |
| Equity in income (loss) of unconsolidated joint ventures | (405) | | | 12,474 | | | (1,549) | |
| Loss on early extinguishment of debt | (5,075) | | | — | | | (6,800) | |
| Homebuilding pretax income | $ | 656,911 | | | $ | 331,500 | | | $ | 325,189 | |
| Homes delivered | 13,472 | | | 10,672 | | | 11,871 | |
| Average selling price | $ | 422,700 | | | $ | 388,900 | | | $ | 380,000 | |
| Housing gross profit margin as a percentage of housing revenues | 21.6 | % | | 18.9 | % | | 18.3 | % |
| Housing gross profit margin excluding inventory-related charges as a percentage of housing revenues | 21.8 | % | | 19.6 | % | | 18.7 | % |
| Adjusted housing gross profit margin as a percentage of housing revenues | 24.4 | % | | 22.7 | % | | 22.2 | % |
| Selling, general and administrative expense as a percentage of housing revenues | 10.1 | % | | 11.3 | % | | 11.0 | % |
| Operating income as a percentage of homebuilding revenues | 11.6 | % | | 7.6 | % | | 7.3 | % |
Revenues. Year-over-year growth in homebuilding revenues to $5.71 billion in 2021 reflected an increase in housing revenues, partly offset by a decrease in land sale revenues. Housing revenues in 2020 were negatively impacted by the COVID-19 pandemic and related COVID-19 control responses.
Housing revenues in 2021 advanced 37% from the previous year, due to a 26% increase in the number of homes delivered and a 9% increase in the overall average selling price of those homes. The higher volume of homes delivered was largely due to our backlog of homes at the beginning of the year (“beginning backlog”) increasing 54% from 2020, as well as strong net order growth in 2021. In addition, the number of homes delivered in 2020 was tempered primarily by the negative impact of the COVID-19 pandemic and related COVID-19 control responses. The year-over-year increase in the overall average selling price of our homes delivered in 2021 reflected strong housing market conditions, which enabled us to raise prices in the vast majority of our communities, as well as product and geographic mix shifts of homes delivered.
Land sale revenues for 2021 decreased 39% from 2020. Generally, land sale revenues fluctuate with our decisions to maintain or decrease our land ownership position in certain markets based upon the volume of our holdings, our business strategy, the strength and number of developers and other land buyers in particular markets at given points in time, the availability of opportunities to sell land at acceptable prices and prevailing market conditions.
Operating Income. Our homebuilding operating income grew 109% in 2021, as compared to the previous year, due to an increase in housing gross profits, partly offset by an increase in selling, general and administrative expenses. In 2021 and 2020, homebuilding operating income included total inventory-related charges of $12.0 million and $28.7 million, respectively, as discussed in Note 7 – Inventory Impairments and Land Option Contract Abandonments in the Notes to Consolidated Financial Statements in this report. In 2020, our homebuilding operating income also included severance charges of $6.7 million associated with workforce reductions made during the 2020 second quarter, as discussed above under “COVID-19 Pandemic Impact.” As a percentage of homebuilding revenues, our homebuilding operating income for 2021 improved 400 basis points year over year to 11.6%. Excluding inventory-related charges for both periods and the above-mentioned severance charges in 2020, our homebuilding operating income margin improved 340 basis points to 11.8% in 2021 from 8.4% in 2020.
•Housing Gross Profits – In 2021, housing gross profits increased by $443.3 million, or 56%, to $1.23 billion from $785.3 million in 2020. The year-over-year increase in 2021 reflected the higher volume of homes delivered and an increase in the housing gross profit margin. Housing gross profits for 2021 and 2020 included the respective inventory-related charges described above.
Our housing gross profit margin for 2021 increased 270 basis points from the previous year, mainly as a result of a favorable pricing environment that more than offset higher construction services and building materials costs (approximately 110 basis points); lower amortization of previously capitalized interest as a percentage of housing revenues (approximately 50 basis points); a decrease in inventory-related charges (approximately 50 basis points); an increase in operating leverage due to higher housing revenues (approximately 40 basis points); and other miscellaneous factors (approximately 20 basis points). As a percentage of housing revenues, the amortization of previously capitalized interest associated with housing operations was 2.6% for 2021 and 3.1% for 2020. Excluding the amortization of previously capitalized interest associated with housing operations and the above-mentioned inventory-related charges for the applicable periods, our adjusted housing gross profit margin increased 170 basis points to 24.4% in 2021 from 22.7% in 2020. The calculation of adjusted housing gross profit margin, which we believe provides a clearer measure of the performance of our business, is described below under “Non-GAAP Financial Measures.”
•Selling, General and Administrative Expenses – The following table presents the components of our selling, general and administrative expenses (dollars in thousands):
| | | | | | | | | | | | | | | | | | | | | | | | | | | | | | | | | | | |
| Years Ended November 30, |
| 2021 | | % of Housing Revenues | | 2020 | | % of Housing Revenues | | 2019 | | % of Housing Revenues |
| Marketing expenses | $ | 117,481 | | | 2.1 | % | | $ | 116,590 | | | 2.8 | % | | $ | 129,733 | | | 2.9 | % |
| Commission expenses (a) | 217,608 | | | 3.8 | | | 164,507 | | | 3.9 | | | 174,338 | | | 3.8 | |
| General and administrative expenses | 239,287 | | | 4.2 | | | 189,682 | | | 4.6 | | | 193,279 | | | 4.3 | |
| Total | $ | 574,376 | | | 10.1 | % | | $ | 470,779 | | | 11.3 | % | | $ | 497,350 | | | 11.0 | % |
| | | | | | | | | | | |
(a)Commission expenses include sales commissions on homes delivered paid to internal sales counselors and/or external real estate brokers.
Selling, general and administrative expenses for 2021 increased 22% from the prior year, mainly due to an increase in commission expenses associated with our higher housing revenues, and an increase in general and administrative expenses. The year-over-year increase in general and administrative expenses primarily reflected higher costs associated with performance-based employee compensation plans, as well as expenses incurred to support current operations and expected growth, partly offset by a $4.3 million benefit from an Employee Retention Credit (“ERC”), which is discussed in Note 14 – Income Taxes in the Notes to Consolidated Financial Statements in this report, recognized in early 2021 and the severance charges of $6.7 million recorded in 2020. As a percentage of housing revenues, our selling, general and administrative expenses improved 120 basis points in 2021 as compared to 2020, largely reflecting increased operating leverage due to our higher housing revenues, partly offset by the above-mentioned higher expenses.
Interest Income/Expense. Interest income, which is generated from short-term investments, totaled $1.0 million in 2021 and $2.6 million in 2020. Generally, increases and decreases in interest income are attributable to changes in the interest-bearing average balances of short-term investments and fluctuations in interest rates.
We incur interest principally from our borrowings to finance land acquisitions, land development, home construction and other operating and capital needs. The amount of interest incurred generally fluctuates based on the average amount of debt outstanding for the period and/or the interest rate on that debt. In 2021, interest incurred totaled $120.5 million, down 3% from $124.1 million in 2020, mainly due to both our lower average interest rate and lower average debt level. All interest incurred during 2021 and 2020 was capitalized as the average amount of our inventory qualifying for interest capitalization was higher than our average debt level for each period. As a result, we had no interest expense for 2021 or 2020. Further information regarding our interest incurred and capitalized is provided in Note 6 – Inventories in the Notes to Consolidated Financial Statements in this report.
Equity in Income (Loss) of Unconsolidated Joint Ventures. Our equity in loss of unconsolidated joint ventures totaled $.4 million in 2021, compared to equity in income of unconsolidated joint ventures of $12.5 million in 2020. This year-over-year change mainly resulted from a decrease in the number of homes delivered from an unconsolidated joint venture in California. This unconsolidated joint venture, which delivered its last home in the 2021 second quarter, delivered 10 homes in 2021, compared to 99 homes delivered in 2020. Further information regarding our investments in unconsolidated joint ventures is provided in Note 9 – Investments in Unconsolidated Joint Ventures in the Notes to Consolidated Financial Statements in this report.
Loss on Early Extinguishment of Debt. Our $5.1 million loss on early extinguishment of debt in 2021 was associated with our purchase, pursuant to a tender offer that expired on June 8, 2021, of $269.8 million in aggregate principal amount of our 7.00% Senior Notes due 2021 prior to their maturity date. Further information regarding this transaction is provided in Note 15 – Notes Payable in the Notes to Consolidated Financial Statements in this report.
Net Orders, Backlog and Community Count. The following table presents information about our net orders, cancellation rate, ending backlog, and community count for the years ended November 30, 2021 and 2020 (dollars in thousands):
| | | | | | | | | | | | | | |
| | Years Ended November 30, |
| | 2021 | | 2020 |
| Net orders | | 16,206 | | | 13,404 | |
| Net order value (a) | | $ | 7,683,990 | | | $ | 5,299,489 | |
| Cancellation rate (b) | | 10 | % | | 20 | % |
| Ending backlog — homes | | 10,544 | | | 7,810 | |
| Ending backlog — value | | $ | 4,951,725 | | | $ | 2,962,403 | |
| Ending community count | | 217 | | | 236 | |
| Average community count | | 214 | | | 243 | |
(a)Net order value represents potential future housing revenues associated with net orders generated during the period, as well as homebuyer selections of lot and product premiums and design studio options and upgrades for homes in backlog during the same period.
(b)Cancellation rate represents the total number of contracts for new homes cancelled during a period divided by the total (gross) orders for new homes generated during the same period.
Net Orders. In 2021, net orders from our homebuilding operations grew 21% from 2020, reflecting a 37% increase in monthly net orders per community to 6.3, partly offset by a 12% decrease in our overall average community count, which is discussed below under “Community Count.” This higher monthly net order pace occurred even as we raised our home selling prices and paced lot releases, as described above under “Overview.” We believe our Built-to-Order homebuying process, which, as described above under Item 1 – Business in this report, provides personalization and choice, was a key contributor to our strong 2021 net order pace.
The value of our 2021 net orders rose 45% from 2020 as a result of the growth in net orders and a 20% increase in the overall average selling price of those orders. These factors drove net order value expansion in all four of our homebuilding reporting segments, ranging from 37% in our West Coast segment to 93% in our Southeast segment. The higher overall average selling price of net orders in 2021 largely reflected strong demand in most of our served markets as well as product and geographic mix shifts of net orders.
Backlog. The number of homes in our backlog at November 30, 2021 increased 35% from the previous year, mainly due to our substantially higher backlog at the beginning of the fiscal year as well as year-over-year growth in our 2021 net orders. The potential future housing revenues in our backlog at November 30, 2021 grew 67% year over year as a result of both the higher number of homes in our backlog and a 24% increase in the average selling price of those homes. The increases in the number of homes in backlog and backlog value reflected strong growth in each of our four homebuilding reporting segments, with increases in backlog value ranging from 53% in our West Coast segment to 106% in our Southeast segment. Substantially all of the homes in our backlog at November 30, 2021 are expected to be delivered during the year ending November 30, 2022.
Community Count. Our average community count for 2021 decreased 12% from the previous year, and our ending community count declined 8%. The year-over-year decreases in our average and ending community counts primarily reflected communities that sold out earlier than planned due to an increase in our demand-driven net order pace and delays in new community openings. We substantially increased our investments in land acquisition and land development in 2021 to support future community count growth.
HOMEBUILDING REPORTING SEGMENTS
Operational Data. The following tables present information about our homes delivered, net orders, cancellation rates as a percentage of gross orders, net order value, average community count, and ending backlog (number of homes and value) by homebuilding reporting segment (dollars in thousands):
| | | | | | | | | | | | | | | | | | | | | | | | | | | | | | | | | | | | | | |
| | Years Ended November 30, |
| | Homes Delivered | | Net Orders | | Cancellation Rates |
| Segment | | 2021 | | 2020 | | 2021 | | 2020 | | 2021 | | 2020 |
| West Coast | | 4,008 | | | 2,869 | | | 4,425 | | | 3,850 | | | 10 | % | | 17 | % |
| Southwest | | 2,574 | | | 2,385 | | | 3,247 | | | 2,668 | | | 7 | | | 19 | |
| Central | | 4,630 | | | 3,932 | | | 5,504 | | | 4,981 | | | 12 | | | 21 | |
| Southeast | | 2,260 | | | 1,486 | | | 3,030 | | | 1,905 | | | 11 | | | 25 | |
| Total | | 13,472 | | | 10,672 | | | 16,206 | | | 13,404 | | | 10 | % | | 20 | % |
| | | | | | | | | | | | | | | | | | | | | | | | | | | | | | | | | | | | | | |
| | |
| | | Net Order Value | | Average Community Count |
| Segment | | 2021 | | 2020 | | Variance | | 2021 | | 2020 | | Variance |
| West Coast | | $ | 3,164,684 | | | $ | 2,302,785 | | | 37 | % | | 60 | | | 74 | | | (19) | % |
| Southwest | | 1,342,562 | | | 914,770 | | | 47 | | | 36 | | | 36 | | | — | |
| Central | | 2,119,617 | | | 1,534,747 | | | 38 | | | 78 | | | 89 | | | (12) | |
| Southeast | | 1,057,127 | | | 547,187 | | | 93 | | | 40 | | | 44 | | | (9) | |
| Total | | $ | 7,683,990 | | | $ | 5,299,489 | | | 45 | % | | 214 | | | 243 | | | (12) | % |
| | | | | | | | | | | | |
| | | | | | | | | | | | |
| | November 30, |
| | | Backlog – Homes | | Backlog – Value |
| Segment | | 2021 | | 2020 | | Variance | | 2021 | | 2020 | | Variance |
| West Coast | | 2,441 | | | 2,024 | | | 21 | % | | $ | 1,764,911 | | | $ | 1,152,609 | | | 53 | % |
| Southwest | | 2,194 | | | 1,521 | | | 44 | | | 910,583 | | | 523,705 | | | 74 | |
| Central | | 3,911 | | | 3,037 | | | 29 | | | 1,548,574 | | | 932,814 | | | 66 | |
| Southeast | | 1,998 | | | 1,228 | | | 63 | | | 727,657 | | | 353,275 | | | 106 | |
| Total | | 10,544 | | | 7,810 | | | 35 | % | | $ | 4,951,725 | | | $ | 2,962,403 | | | 67 | % |
As discussed above under Item 1 – Business in this report, the composition of our homes delivered, net orders and backlog shifts with the mix of our active communities and the corresponding average selling prices of the homes ordered and/or delivered at these communities in any particular period, and it changes as new communities open and existing communities wind down or sell out. In addition, with our Built-to-Order model, the selling prices of individual homes within a community may vary due to differing lot sizes and locations, home square footage, and option and upgrade selections. These intrinsic
variations in our business limit the comparability of our homes delivered, net orders and backlog, as well as their corresponding values, between sequential and year-over-year periods, in addition to the effect of prevailing economic or housing market conditions in or across any particular periods.
Financial Results. Below is a discussion of the financial results of each of our homebuilding reporting segments. Further information regarding these segments, including their pretax income (loss), is included in Note 2 – Segment Information in the Notes to Consolidated Financial Statements in this report. The difference between each homebuilding reporting segment’s operating income (loss) and pretax income (loss) is generally due to the equity in income (loss) of unconsolidated joint ventures, which is also presented in Note 2 – Segment Information in the Notes to Consolidated Financial Statements in this report, and/or interest income and expense.
In addition to the results of our homebuilding reporting segments presented below, our consolidated homebuilding operating income includes the results of Corporate and other, a non-operating segment described in Note 2 – Segment Information in the Notes to Consolidated Financial Statements in this report. Corporate and other had operating losses of $148.9 million in 2021, $107.2 million in 2020 and $104.1 million in 2019. The increase in 2021 as compared to 2020 reflected higher selling, general and administrative expenses, mainly due to higher costs associated with performance-based employee compensation plans, as well as expenses to support current operations and expected growth.
With strong housing market conditions from the 2020 third quarter through the 2021 fourth quarter in most of our served markets, we delivered more homes at a higher overall average selling price and significantly expanded our homebuilding operating income as a percentage of revenues in each of our homebuilding segments for 2021, as compared to the previous year. The financial results for each of our homebuilding reporting segments for the year ended November 30, 2020 were negatively affected by the impacts from the onset of the COVID-19 pandemic, as discussed in Note 1 – Summary of Significant Accounting Policies in the Notes to Consolidated Financial Statements in this report
West Coast. The following table presents financial information related to our West Coast homebuilding reporting segment for the years indicated (dollars in thousands, except average selling price):
| | | | | | | | | | | | | | | | | | | | | | | | | | | | | |
| | Years Ended November 30, | | Variance |
| | 2021 | | 2020 | | 2019 | | 2021 vs 2020 | | 2020 vs 2019 |
| Revenues | $ | 2,552,382 | | | $ | 1,748,582 | | | $ | 1,912,146 | | | 46 | % | | (9) | % |
| Construction and land costs | (2,044,274) | | | (1,480,775) | | | (1,591,896) | | | (38) | | | 7 | |
| Selling, general and administrative expenses | (162,461) | | | (129,744) | | | (141,324) | | | (25) | | | 8 | |
| Operating income | $ | 345,647 | | | $ | 138,063 | | | $ | 178,926 | | | 150 | % | | (23) | % |
| | | | | | | | | |
| Homes delivered | 4,008 | | | 2,869 | | | 3,214 | | | 40 | % | | (11) | % |
| Average selling price | $ | 636,800 | | | $ | 609,400 | | | $ | 592,300 | | | 4 | % | | 3 | % |
| Operating income as a percentage of revenues | 13.5 | % | | 7.9 | % | | 9.4 | % | | 560 | bps | | (150) | bps |
This segment’s revenues in 2021 were generated solely from housing operations. In 2020, revenues for this segment were generated from housing operations and nominal land sales. Housing revenues for 2021 grew 46% from the previous year due to increases in the number of homes delivered in California and Washington, and the higher average selling price of those homes. The higher average selling price reflected strong housing market conditions and product and geographic mix shifts of homes delivered.
Operating income grew significantly from 2020, reflecting higher housing gross profits, partially offset by higher selling, general and administrative expenses. As a percentage of revenues, this segment’s 2021 operating income increased from the previous year, reflecting a 460 basis-point expansion in the housing gross profit margin to 19.9%, and a 100 basis-point improvement in selling, general and administrative expenses as a percentage of housing revenues to 6.4%. The housing gross profit margin expansion was primarily driven by a favorable pricing environment that more than offset higher construction services and building materials costs, lower relative amortization of previously capitalized interest, a reduction in inventory-related charges and an increase in operating leverage due to higher housing revenues. Inventory-related charges impacting the housing gross profit margin totaled $11.0 million in 2021, compared to $21.9 million in 2020. The improvement in selling, general and administrative expenses as a percentage of housing revenues mainly reflected increased operating leverage from higher housing revenues, partly offset by higher expenses incurred to support current operations and expected growth.
Southwest. The following table presents financial information related to our Southwest homebuilding reporting segment for the years indicated (dollars in thousands, except average selling price):
| | | | | | | | | | | | | | | | | | | | | | | | | | | | | |
| | Years Ended November 30, | | Variance |
| | 2021 | | 2020 | | 2019 | | 2021 vs 2020 | | 2020 vs 2019 |
| Revenues | $ | 965,139 | | | $ | 796,810 | | | $ | 764,816 | | | 21 | % | | 4 | % |
| Construction and land costs | (702,947) | | | (596,512) | | | (585,880) | | | (18) | | | (2) | |
| Selling, general and administrative expenses | (75,375) | | | (66,415) | | | (67,223) | | | (13) | | | 1 | |
| Operating income | $ | 186,817 | | | $ | 133,883 | | | $ | 111,713 | | | 40 | % | | 20 | % |
| | | | | | | | | |
| Homes delivered | 2,574 | | | 2,385 | | | 2,346 | | | 8 | % | | 2 | % |
| Average selling price | $ | 371,300 | | | $ | 327,300 | | | $ | 322,000 | | | 13 | % | | 2 | % |
| Operating income as a percentage of revenues | 19.4 | % | | 16.8 | % | | 14.6 | % | | 260 | bps | | 220 | bps |
In 2021 and 2020, this segment’s revenues were generated from both housing operations and land sales. Housing revenues for 2021 grew 22% year over year to $955.7 million, mainly due to an increase in the number of homes delivered from our Nevada operations and a rise in the average selling price of homes delivered in both our Arizona and Nevada operations. The higher average selling price reflected strong housing market conditions and product and geographic mix shifts of homes delivered. Land sale revenues totaled $9.4 million in 2021 and $16.1 million in 2020.
This segment’s operating income for 2021 increased from the previous year, mainly due to higher housing gross profits and increased land sale profits, partially offset by higher selling, general and administrative expenses. As a percentage of revenues, operating income improved from 2020 due to a 130 basis-point increase in the housing gross profit margin to 26.7%, a 60 basis-point improvement in selling, general and administrative expenses as a percentage of housing revenues to 7.9% and higher profits from land sales. The housing gross profit margin expansion was largely driven by a favorable pricing environment that more than offset higher construction services and building materials costs, and lower relative amortization of previously capitalized interest. Land sales generated profits of $7.1 million in 2021 and $2.0 million in 2020. The improvement in selling, general and administrative expenses as a percentage of housing revenues was mainly due to increased operating leverage from higher housing revenues.
Central. The following table presents financial information related to our Central homebuilding reporting segment for the years indicated (dollars in thousands, except average selling price):
| | | | | | | | | | | | | | | | | | | | | | | | | | | | | |
| | Years Ended November 30, | | Variance |
| | 2021 | | 2020 | | 2019 | | 2021 vs 2020 | | 2020 vs 2019 |
| Revenues | $ | 1,503,857 | | | $ | 1,192,869 | | | $ | 1,267,892 | | | 26 | % | | (6) | % |
| Construction and land costs | (1,172,926) | | | (941,381) | | | (1,015,415) | | | (25) | | | 7 | |
| Selling, general and administrative expenses | (130,773) | | | (122,712) | | | (126,176) | | | (7) | | | 3 | |
| Operating income | $ | 200,158 | | | $ | 128,776 | | | $ | 126,301 | | | 55 | % | | 2 | % |
| | | | | | | | | |
| Homes delivered | 4,630 | | | 3,932 | | | 4,291 | | | 18 | % | | (8) | % |
| Average selling price | $ | 324,800 | | | $ | 303,400 | | | $ | 293,500 | | | 7 | % | | 3 | % |
| Operating income as a percentage of revenues | 13.3 | % | | 10.8 | % | | 10.0 | % | | 250 | bps | | 80 | bps |
In 2021 and 2020, revenues for this segment were generated solely from housing operations. Housing revenues for 2021 grew 26% from the prior year, reflecting increases in the number of homes delivered in both states that comprise this segment, and the higher average selling price of those homes. The increase in the average selling price reflected strong housing market conditions and product and geographic mix shifts of homes delivered.
Operating income for 2021 increased from 2020, reflecting growth in housing gross profits, partially offset by higher selling, general and administrative expenses. In 2021, the improvement in operating income as a percentage of revenues
reflected a 90 basis-point expansion in the housing gross profit margin to 22.0% and a 160 basis-point improvement in selling, general and administrative expenses as a percentage of housing revenues to 8.7%. The housing gross profit margin rose from the previous year primarily due to lower inventory-related charges, improved operating leverage due to higher housing revenues, and lower relative amortization of previously capitalized interest. Inventory-related charges for 2021 were nominal, compared to $5.5 million in 2020. The year-over-year improvement in selling, general and administrative expenses as a percentage of housing revenues mainly reflected increased operating leverage from higher housing revenues, and the continued impact of targeted actions we took in 2020 to reduce overhead costs in the early stages of the COVID-19 pandemic.
Southeast. The following table presents financial information related to our Southeast homebuilding reporting segment for the years indicated (dollars in thousands, except average selling price):
| | | | | | | | | | | | | | | | | | | | | | | | | | | | | |
| | Years Ended November 30, | | Variance |
| | 2021 | | 2020 | | 2019 | | 2021 vs 2020 | | 2020 vs 2019 |
| Revenues | $ | 683,651 | | | $ | 429,441 | | | $ | 592,804 | | | 59 | % | | (28) | % |
| Construction and land costs | (541,471) | | | (355,242) | | | (508,351) | | | (52) | | | 30 | |
| Selling, general and administrative expenses | (64,516) | | | (51,248) | | | (65,902) | | | (26) | | | 22 | |
| Operating income | $ | 77,664 | | | $ | 22,951 | | | $ | 18,551 | | | 238 | % | | 24 | % |
| | | | | | | | | |
| Homes delivered | 2,260 | | | 1,486 | | | 2,020 | | | 52 | % | | (26) | % |
| Average selling price | $ | 302,100 | | | $ | 288,600 | | | $ | 293,200 | | | 5 | % | | (2) | % |
| Operating income as a percentage of revenues | 11.4 | % | | 5.3 | % | | 3.1 | % | | 610 | bps | | 220 | bps |
In 2021 and 2020, this segment’s revenues were generated from both housing operations and nominal land sales. Housing revenues for 2021 rose 59% year over year to $682.7 million due to increases in both the number of homes delivered and the average selling price of those homes. The higher average selling price in 2021 as compared to 2020 mainly reflected strong housing market conditions and product and geographic mix shifts of homes delivered.
Operating income increased from 2020, reflecting higher housing gross profits, partly offset by higher selling, general and administrative expenses. As a percentage of revenues, operating income rose from 2020 due to a 350 basis-point increase in the housing gross profit margin to 20.8% that mainly reflected a shift in geographic mix, improved operating leverage due to higher housing revenues, and lower relative amortization of previously capitalized interest. In addition, selling, general and administrative expenses as a percentage of housing revenues improved 260 basis points from 2020 to 9.4%, primarily due to increased operating leverage as a result of higher housing revenues, and the continued impact of targeted actions we took in 2020 to reduce overhead costs in the early stages of the COVID-19 pandemic.
FINANCIAL SERVICES REPORTING SEGMENT
The following table presents a summary of selected financial and operational data for our financial services reporting segment (dollars in thousands):
| | | | | | | | | | | | | | | | | |
| | Years Ended November 30, |
| | 2021 | | 2020 | | 2019 |
| Revenues | $ | 19,901 | | | $ | 15,472 | | | $ | 15,089 | |
| Expenses | (5,055) | | | (4,083) | | | (4,333) | |
| Equity in income of unconsolidated joint ventures | 23,589 | | | 21,154 | | | 12,230 | |
| Pretax income | $ | 38,435 | | | $ | 32,543 | | | $ | 22,986 | |
| | | | | |
| | | | | | | | | | | | | | | | | |
| | Years Ended November 30, |
| | 2021 | | 2020 | | 2019 |
| Total originations (a): | | | | | |
| Loans | 9,225 | | | 7,580 | | | 7,436 | |
| Principal | $ | 3,252,054 | | | $ | 2,457,522 | | | $ | 2,190,823 | |
| Percentage of homebuyers using KBHS | 76 | % | | 77 | % | | 70 | % |
| Average FICO score | 729 | | | 723 | | | 719 | |
| | | | | |
| Loans sold (a): | | | | | |
| Loans sold to Stearns/GR Alliance | 7,706 | | | 7,900 | | | 6,224 | |
| Principal | $ | 2,744,685 | | | $ | 2,536,689 | | | $ | 1,827,917 | |
| Loans sold to other third parties | 1,293 | | | 310 | | | 772 | |
| Principal | $ | 420,119 | | | $ | 102,363 | | | $ | 202,349 | |
| | | | | | | | | | | | | | | | | |
| |
| | | | | |
| Mortgage loan origination mix (a): | | | | | |
| Conventional/non-conventional loans | 61 | % | | 56 | % | | 58 | % |
| FHA loans | 26 | % | | 28 | % | | 26 | % |
| Other government loans | 13 | % | | 16 | % | | 16 | % |
| | | | | |
| Loan type (a): | | | | | |
| Fixed | 99 | % | | 99 | % | | 98 | % |
| ARM | 1 | % | | 1 | % | | 2 | % |
(a)Loan originations and sales occurred within KBHS.
Revenues. Our financial services reporting segment, which includes the operations of KB HOME Mortgage Company, generates revenues primarily from insurance commissions and title services. The year-over-year growth in our financial services revenues for 2021 reflected increases in both title services revenues and insurance commissions.
Pretax income. Our financial services pretax income for 2021 grew 18% from the previous year due to improved results from our insurance and title services businesses, and an increase in the equity in income of unconsolidated joint ventures. In 2021, our equity in income of our unconsolidated joint venture, KBHS, increased 12% year over year as a result of a substantial increase in the principal amount of loan originations and improved margins. The higher principal amount of loan originations in 2021 was primarily due to a 26% increase in the number of homes we delivered and a 9% increase in the average selling price of those homes.
On March 1, 2021, Guaranteed Rate acquired the parent company of Stearns, our KBHS partner prior to that date. In October 2021, Stearns was renamed as GR Alliance. As of the date of this report, we are not aware of any significant changes with respect to GR Alliance or its operations as a result of the transaction being completed.
INCOME TAXES
Income Tax Expense. Our income tax expense and effective income tax rate were as follows (dollars in thousands):
| | | | | | | | | | | | | | | | | |
| | Years Ended November 30, |
| | 2021 | | 2020 | | 2019 |
| Income tax expense | $ | 130,600 | | | $ | 67,800 | | | $ | 79,400 | |
| Effective income tax rate | 18.8 | % | | 18.6 | % | | 22.8 | % |
Our effective tax rate for 2021 increased slightly from the previous year, as the impacts of higher taxable income, a $5.6 million increase in non-deductible compensation expense and a $4.9 million decrease in excess tax benefits related to stock-based compensation were mostly offset by the favorable effect of a $30.8 million increase in federal tax credits we earned primarily from building energy-efficient homes.
The federal energy tax credits for the year ended November 30, 2021 resulted from legislation enacted in December 2020 and earlier periods. The legislation enacted in December 2020, among other things, extended the availability of a business tax
credit for building new energy-efficient homes through December 31, 2021. Prior to this legislation, the tax credit was set to expire on December 31, 2020.
In June 2020, California enacted tax legislation that approved the suspension of California net operating loss (“NOL”) deductions for tax years 2020, 2021 and 2022. Although the suspension of California NOL deductions did not have an impact on our income tax expense for the years ended November 30, 2021 and 2020, it contributed to the year-over-year increase in the amount of income taxes we paid in 2021.
Under current accounting standards, we expect volatility in our income tax expense in future periods, the magnitude of which will depend on, among other factors, the price of our common stock and the timing and volume of stock-based compensation award activity, such as employee exercises of stock options and the vesting of restricted stock awards and performance-based restricted stock units (each, a “PSU”).
For each of the years ended November 30, 2021 and 2020, the amount of income taxes we paid was substantially less than our income tax expense primarily due to the utilization of our deferred tax assets to reduce taxable income. We anticipate the amount of income taxes we pay will be less than our income tax expense for at least the next year.
Further information regarding our income taxes is provided in Note 14 – Income Taxes in the Notes to Consolidated Financial Statements in this report.
NON-GAAP FINANCIAL MEASURES
This report contains information about our adjusted housing gross profit margin, which is not calculated in accordance with generally accepted accounting principles (“GAAP”). We believe this non-GAAP financial measure is relevant and useful to investors in understanding our operations, and may be helpful in comparing us with other companies in the homebuilding industry to the extent they provide similar information. However, because it is not calculated in accordance with GAAP, this non-GAAP financial measure may not be completely comparable to other companies in the homebuilding industry and, thus, should not be considered in isolation or as an alternative to operating performance and/or financial measures prescribed by GAAP. Rather, this non-GAAP financial measure should be used to supplement the most directly comparable GAAP financial measure in order to provide a greater understanding of the factors and trends affecting our operations.
Adjusted Housing Gross Profit Margin. The following table reconciles our housing gross profit margin calculated in accordance with GAAP to the non-GAAP financial measure of our adjusted housing gross profit margin (dollars in thousands):
| | | | | | | | | | | | | | | | | |
| | Years Ended November 30, |
| | 2021 | | 2020 | | 2019 |
| Housing revenues | $ | 5,694,668 | | | $ | 4,150,793 | | | $ | 4,510,814 | |
| Housing construction and land costs | (4,466,053) | | | (3,365,509) | | | (3,683,174) | |
| Housing gross profits | 1,228,615 | | | 785,284 | | | 827,640 | |
Add: Inventory-related charges (a) | 11,953 | | | 28,669 | | | 17,291 | |
Housing gross profits excluding inventory-related charges | 1,240,568 | | | 813,953 | | | 844,931 | |
Add: Amortization of previously capitalized interest (b) | 149,354 | | | 129,330 | | | 156,114 | |
Adjusted housing gross profits | $ | 1,389,922 | | | $ | 943,283 | | | $ | 1,001,045 | |
Housing gross profit margin as a percentage of housing revenues | 21.6 | % | | 18.9 | % | | 18.3 | % |
Housing gross profit margin excluding inventory-related charges as a percentage of housing revenues | 21.8 | % | | 19.6 | % | | 18.7 | % |
Adjusted housing gross profit margin as a percentage of housing revenues | 24.4 | % | | 22.7 | % | | 22.2 | % |
(a)Represents inventory impairment and land option contract abandonment charges associated with housing operations.
(b)Represents the amortization of previously capitalized interest associated with housing operations.
Adjusted housing gross profit margin is a non-GAAP financial measure, which we calculate by dividing housing revenues less housing construction and land costs excluding (1) housing inventory impairment and land option contract abandonment charges (as applicable) recorded during a given period and (2) amortization of previously capitalized interest associated with
housing operations, by housing revenues. The most directly comparable GAAP financial measure is housing gross profit margin. We believe adjusted housing gross profit margin is a relevant and useful financial measure to investors in evaluating our performance as it measures the gross profits we generated specifically on the homes delivered during a given period. This non-GAAP financial measure isolates the impact that the housing inventory impairment and land option contract abandonment charges, and the amortization of previously capitalized interest associated with housing operations, have on housing gross profit margins, and allows investors to make comparisons with our competitors that adjust housing gross profit margins in a similar manner. We also believe investors will find adjusted housing gross profit margin relevant and useful because it represents a profitability measure that may be compared to a prior period without regard to variability of housing inventory impairment and land option contract abandonment charges, and amortization of previously capitalized interest associated with housing operations. This financial measure assists us in making strategic decisions regarding community location and product mix, product pricing and construction pace.
SUPPLEMENTAL GUARANTOR FINANCIAL INFORMATION
As of November 30, 2021, we had $1.69 billion in aggregate principal amount of outstanding senior notes and no borrowings outstanding under the Credit Facility. Our obligations to pay principal, premium, if any, and interest on the senior notes and borrowings, if any, under the Credit Facility are guaranteed on a joint and several basis by certain of our subsidiaries (“Guarantor Subsidiaries”), which are listed on Exhibit 22. Our other subsidiaries, including all of our subsidiaries associated with our financial services operations, do not guarantee any such indebtedness (collectively, “Non-Guarantor Subsidiaries”), although we may cause a Non-Guarantor Subsidiary to become a Guarantor Subsidiary if we believe it to be in our or the relevant subsidiary’s best interest. See Note 15 – Notes Payable in the Notes to Consolidated Financial Statements in this report for additional information regarding the terms of our senior notes and the Credit Facility.
The guarantees are full and unconditional and the Guarantor Subsidiaries are 100% owned by us. The guarantees are senior unsecured obligations of each of the Guarantor Subsidiaries and rank equally in right of payment with all unsecured and unsubordinated indebtedness and guarantees of such Guarantor Subsidiaries. The guarantees are effectively subordinated to any secured indebtedness of such Guarantor Subsidiaries to the extent of the value of the assets securing such indebtedness, and structurally subordinated to indebtedness and other liabilities of Non-Guarantor Subsidiaries.
Pursuant to the terms of the indenture governing the senior notes and the terms of the Credit Facility, if any of the Guarantor Subsidiaries ceases to be a “significant subsidiary” as defined by Rule 1-02 of Regulation S-X using a 5% rather than a 10% threshold (provided that the assets of our non-guarantor subsidiaries do not in the aggregate exceed 10% of an adjusted measure of our consolidated total assets), it will be automatically and unconditionally released and discharged from its guaranty of the senior notes and the Credit Facility so long as all guarantees by such Guarantor Subsidiary of any other of our or our subsidiaries’ indebtedness are terminated at or prior to the time of such release.
The following tables present summarized financial information for KB Home and the Guarantor Subsidiaries on a combined basis, excluding unconsolidated joint ventures and after the elimination of (a) intercompany transactions and balances between KB Home and the Guarantor Subsidiaries and (b) equity in earnings from and investments in the Non-Guarantor Subsidiaries. See Note 9 – Investments in Unconsolidated Joint Ventures in the Notes to Consolidated Financial Statements in this report for additional information regarding our unconsolidated joint ventures.
| | | | | | | | | | |
| | November 30, 2021 |
| Summarized Balance Sheet Data (in thousands) | |
| Assets | | | | |
| Cash | | $ | 250,118 | | | |
| Inventories | | 4,425,531 | | | |
| Amounts due from Non-Guarantor Subsidiaries | | 323,549 | | | |
| Total assets | | 5,581,883 | | | |
| | | | |
| Liabilities and Stockholders’ Equity | | | | |
| Notes payable | | 1,682,517 | | | |
| Amounts due to Non-Guarantor Subsidiaries | | 254,717 | | | |
| Total liabilities | | 2,755,817 | | | |
| Stockholders’ equity | | 2,826,066 | | | |
| | | | |
| | | | | | | | | | |
| | Year Ended November 30, 2021 | | |
| Summarized Statement of Operations Data (in thousands) | | | |
| Revenues | | $ | 5,451,685 | | | |
| Construction and land costs | | (4,250,958) | | | |
| Selling, general and administrative expenses | | (564,112) | | | |
| Interest income from non-guarantor subsidiary | | 20,176 | | | |
| Pretax income | | 652,763 | | | |
| Net income | | 530,963 | | | |
LIQUIDITY AND CAPITAL RESOURCES
Overview. We have funded our homebuilding and financial services activities over the last several years with:
• internally generated cash flows;
• public issuances of debt securities;
• borrowings under the Credit Facility;
• land option contracts and other similar contracts and seller notes;
• public issuances of our common stock; and
• letters of credit and performance bonds.
We manage our use of cash in the operation of our business to support the execution of our primary strategic goals. Over the past several years, we have primarily used cash for:
•land acquisitions and land development;
•home construction;
•operating expenses;
•principal and interest payments on notes payable; and
•repayments of borrowings under the Credit Facility.
Cash flows for each of our communities depend on their stage of development and can differ significantly from reported earnings. Early stages of development or expansion require significant cash outflows for land acquisition, zoning plat and other approvals, land development, and construction of model homes, roads, utilities, landscape and other items. Because these costs are a component of our inventory and are not recognized in our income statement until a home is delivered, we incur significant cash outflows prior to the recognition of earnings. In the later stages of a community as homes are delivered, cash inflows may significantly exceed earnings reported for financial statement purposes, as the cash outflows associated with the land and home construction were previously incurred.
We ended 2021 with total liquidity of $1.08 billion, including cash and cash equivalents and $791.4 million of available capacity under the Credit Facility. Based on our financial position as of November 30, 2021, and our positive business forecast for 2022 as discussed below under “Outlook,” we have no material concerns related to our liquidity. While the ongoing COVID-19 pandemic creates potential liquidity risks, as discussed further below, we believe that our existing cash and cash equivalents, our anticipated cash flows from operations and amounts available under our Credit Facility will be sufficient to fund our anticipated operating and land-related investment needs for at least the next 12 months.
Cash Requirements. Our material cash requirements include the following contractual and other obligations:
Notes Payable. We have outstanding fixed-rate notes payable with varying maturities. As of November 30, 2021, our notes payable had an aggregate principal amount of $1.70 billion, with $353.6 million payable within 12 months. Future interest payments associated with our notes payable totaled $443.6 million as of November 30, 2021, with $104.1 million payable within 12 months. Further information regarding our notes payable is provided in Note 15 – Notes Payable in the Notes to Consolidated Financial Statements in this report.
Leases. We have operating leases for certain property and equipment with an expected term at the commencement date of more than 12 months. As of November 30, 2021, the future minimum payments required under these leases totaled $32.6 million, with $10.6 million payable within 12 months. Further information regarding our leases is provided in Note 13 – Leases in the Notes to Consolidated Financial Statements in this report.
Inventory-Related Obligations. As of November 30, 2021, we had inventory-related obligations totaling $36.1 million, comprised of liabilities for inventory not owned associated with financing arrangements as discussed in Note 8 – Variable Interest Entities in the Notes to Consolidated Financial Statements in this report, as well as liabilities for fixed or determinable amounts associated with tax increment financing entity (“TIFE”) assessments. Approximately $27.0 million of these inventory-related obligations are payable within 12 months. However, TIFE assessment obligations are paid by us only to the extent we do not deliver homes on applicable lots before the related TIFE obligations mature.
Investments in Land and Land Development. Our investments in land and land development increased to $2.53 billion in 2021, compared to $1.69 billion in 2020. Approximately 50% of our total investments in both 2021 and 2020 related to land acquisitions. While we made strategic investments in land and land development in each of our homebuilding reporting segments during 2021 and 2020, approximately 53% and 55%, respectively, of these investments for each year were made in our West Coast homebuilding reporting segment. Our investments in land and land development in the future will depend significantly on market conditions and available opportunities that meet our investment return standards to support home delivery and revenue growth in 2022 and beyond.
The following table presents the number of lots we owned or controlled under land option contracts and other similar contracts and the carrying value of inventory by homebuilding reporting segment (dollars in thousands):
| | | | | | | | | | | | | | | | | | | | | | | | | | | | | | | | | | | | | | |
| | November 30, 2021 | | November 30, 2020 | | Variance |
| Segment | | Lots | | $ | | Lots | | $ | | Lots | | $ |
| West Coast | | 23,539 | | | $ | 2,300,096 | | | 16,990 | | | $ | 1,928,500 | | | 6,549 | | | $ | 371,596 | |
| Southwest | | 12,339 | | | 875,438 | | | 12,290 | | | 688,807 | | | 49 | | | 186,631 | |
| Central | | 28,961 | | | 995,811 | | | 23,699 | | | 867,170 | | | 5,262 | | | 128,641 | |
| Southeast | | 21,929 | | | 631,484 | | | 14,059 | | | 413,005 | | | 7,870 | | | 218,479 | |
Total | | 86,768 | | | $ | 4,802,829 | | | 67,038 | | | $ | 3,897,482 | | | 19,730 | | | $ | 905,347 | |
The number and carrying value of lots we owned or controlled under land option contracts and other similar contracts at November 30, 2021 increased from November 30, 2020, primarily due to our investments in land and land development in 2021 and an increase in the number of homes under construction. The number of lots in inventory as of November 30, 2021 included 12,434 lots under contract where the associated deposits were refundable at our discretion, compared to 10,254 of such lots at November 30, 2020, reflecting ordinary course fluctuations in the number of such contracts. Our lots controlled under land option contracts and other similar contracts as a percentage of total lots was 44% at November 30, 2021 and 40% at November 30, 2020. Generally, this percentage fluctuates with our decisions to control (or abandon) lots under land option contracts and other similar contracts or to purchase (or sell owned) lots based on available opportunities and our investment return standards.
Land Option Contracts and Other Similar Contracts. As discussed in Note 8 – Variable Interest Entities in the Notes to Consolidated Financial Statements in this report, our land option contracts and other similar contracts generally do not contain provisions requiring our specific performance. Our decision to exercise a particular land option contract or other similar contract depends on the results of our due diligence reviews and ongoing market and project feasibility analysis that we conduct after entering into such a contract. In some cases, our decision to exercise a land option contract or other similar contract may be conditioned on the land seller obtaining necessary entitlements, such as zoning rights and environmental and development approvals, and/or physically developing the underlying land by a pre-determined date. We typically have the ability not to exercise our rights to the underlying land for any reason and forfeit our deposits without further penalty or obligation to the sellers. If we were to acquire all of the land we had under land option contracts and other similar contracts at November 30, 2021, we estimate the remaining purchase price to be paid would be as follows: 2022 – $1.34 billion; 2023 – $318.7 million; 2024 – $51.6 million; 2025 – $78.2 million; 2026 – $1.7 million; and thereafter – $0.
Liquidity. The table below summarizes our total cash and cash equivalents, and total liquidity (in thousands):
| | | | | | | | | | | | | | |
| | November 30, |
| | 2021 | | 2020 |
| Total cash and cash equivalents | | $ | 290,764 | | | $ | 681,190 | |
| Credit Facility commitment | | 800,000 | | | 800,000 | |
| Borrowings outstanding under the Credit Facility | | — | | | — | |
| Letters of credit outstanding under the Credit Facility | | (8,618) | | | (12,429) | |
| Credit Facility availability | | 791,382 | | | 787,571 | |
| Total liquidity | | $ | 1,082,146 | | | $ | 1,468,761 | |
| | | | |
The majority of our cash equivalents at November 30, 2021 and 2020 were invested in interest-bearing bank deposit accounts.
Capital Resources. Our notes payable consisted of the following (in thousands):
| | | | | | | | | | | | | | | | | |
| November 30, | | |
| 2021 | | 2020 | | Variance |
| Mortgages and land contracts due to land sellers and other loans | $ | 5,327 | | | $ | 4,667 | | | $ | 660 | |
| Senior notes | 1,679,700 | | | 1,742,508 | | | (62,808) | |
| Total | $ | 1,685,027 | | | $ | 1,747,175 | | | $ | (62,148) | |
Our financial leverage, as measured by the ratio of debt to capital, was 35.8% at November 30, 2021, compared to 39.6% at November 30, 2020. The ratio of debt to capital is calculated by dividing notes payable by capital (notes payable plus stockholders’ equity).
On June 9, 2021, we completed the underwritten public offering of $390.0 million in aggregate principal amount of 4.00% senior notes due 2031 (“4.00% Senior Notes due 2031”) at 100% of their aggregate principal amount. Net proceeds from this offering totaled $385.2 million, after deducting the underwriting discount and our expenses relating to the offering. The 4.00% Senior Notes due 2031 will mature on June 15, 2031. On June 9, 2021, we used a portion of the net proceeds to purchase, pursuant to a tender offer that expired the previous day, $269.8 million in aggregate principal amount of our outstanding $450.0 million of 7.00% Senior Notes due 2021. We paid $274.9 million to purchase the notes and recorded a charge of $5.1 million for the early extinguishment of debt in the 2021 third quarter due to a premium paid under the tender offer and the unamortized original issue discount associated with these senior notes. On September 15, 2021, we redeemed the remaining $180.2 million in aggregate principal amount of 7.00% Senior Notes due 2021 at par value pursuant to the terms of the notes. Together, these 2021 transactions effectively extended the maturity of our senior notes by more than two years and reduced our weighted average borrowing rate by approximately 70 basis points.
LOC Facility. On August 12, 2021, we entered into an amendment to our unsecured letter of credit agreement with a financial institution (“LOC Facility”) that increased the limit of letters of credit we may issue from $50.0 million to $75.0 million and extended the expiration date from February 13, 2022 to February 13, 2025. We had $34.6 million and $29.7 million of letters of credit outstanding under the LOC Facility at November 30, 2021 and 2020, respectively.
Performance Bonds. As discussed in Note 17 – Commitments and Contingencies in the Notes to Consolidated Financial Statements in this report, we had $1.11 billion and $897.6 million of performance bonds outstanding at November 30, 2021 and 2020, respectively.
Unsecured Revolving Credit Facility. We have an $800.0 million Credit Facility that will mature on October 7, 2023. The amount of the Credit Facility available for cash borrowings and the issuance of letters of credit depends on the total cash borrowings and letters of credit outstanding under the Credit Facility and the maximum available amount under the terms of the Credit Facility. As of November 30, 2021, we had no cash borrowings and $8.6 million of letters of credit outstanding under the Credit Facility. The Credit Facility is further described in Note 15 – Notes Payable in the Notes to Consolidated Financial Statements in this report.
Under the terms of the Credit Facility, we are required, among other things, to maintain compliance with various covenants, including financial covenants regarding our consolidated tangible net worth, consolidated leverage ratio (“Leverage Ratio”), and either a consolidated interest coverage ratio (“Interest Coverage Ratio”) or minimum liquidity level, each as defined therein. Our compliance with these financial covenants is measured by calculations and metrics that are specifically defined or described by the terms of the Credit Facility and can differ in certain respects from comparable GAAP or other commonly used terms. The financial covenant requirements under the Credit Facility are set forth below:
•Consolidated Tangible Net Worth – We must maintain a consolidated tangible net worth at the end of any fiscal quarter greater than or equal to the sum of (a) $1.54 billion, plus (b) an amount equal to 50% of the aggregate of the cumulative consolidated net income for each fiscal quarter commencing after May 31, 2019 and ending as of the last day of such fiscal quarter (though there is no reduction if there is a consolidated net loss in any fiscal quarter), plus (c) an amount equal to 50% of the cumulative net proceeds we receive from the issuance of our capital stock after May 31, 2019.
•Leverage Ratio – We must also maintain a Leverage Ratio of less than or equal to .65 at the end of each fiscal quarter. The Leverage Ratio is calculated as the ratio of our consolidated total indebtedness to the sum of consolidated total indebtedness and consolidated tangible net worth, all as defined under the Credit Facility.
•Interest Coverage Ratio or Liquidity – We are also required to maintain either (a) an Interest Coverage Ratio of greater than or equal to 1.50 at the end of each fiscal quarter; or (b) a minimum level of liquidity, but not both. The Interest Coverage Ratio is the ratio of our consolidated adjusted EBITDA to consolidated interest incurred, each as defined under the Credit Facility, in each case for the previous 12 months. Our minimum liquidity is required to be greater than or equal to consolidated interest incurred, as defined under the Credit Facility, for the four most recently ended fiscal quarters in the aggregate.
In addition, under the Credit Facility, our investments in joint ventures and non-guarantor subsidiaries (which are shown, respectively, in Note 9 – Investments in Unconsolidated Joint Ventures in the Notes to Consolidated Financial Statements in this report and under “Supplemental Guarantor Financial Information” above) as of the end of each fiscal quarter cannot exceed the sum of (a) $104.8 million and (b) 20% of consolidated tangible net worth. Further, the Credit Facility does not permit our borrowing base indebtedness, which is the aggregate principal amount of our outstanding indebtedness for borrowed money and non-collateralized financial letters of credit, to be greater than our borrowing base (a measure relating to our inventory and unrestricted cash assets).
The covenants and other requirements under the Credit Facility represent the most restrictive provisions that we are subject to with respect to our notes payable. The following table summarizes the financial covenants and other requirements under the Credit Facility, and our actual levels or ratios (as applicable) with respect to those covenants and other requirements, in each case as of November 30, 2021:
| | | | | | | | | | | | | | | | | |
| Financial Covenants and Other Requirements | | Covenant Requirement | | Actual |
| Consolidated tangible net worth | | > | $ | 2.08 | billion | | $ | 2.98 | billion |
| Leverage Ratio | | < | .650 | | | .363 | |
| Interest Coverage Ratio (a) | | > | 1.500 | | | 7.452 | |
| Minimum liquidity (a) | | > | $ | 119.5 | million | | $ | 290.8 | million |
| Investments in joint ventures and non-guarantor subsidiaries | | < | $ | 701.7 | million | | $ | 229.5 | million |
| Borrowing base in excess of borrowing base indebtedness (as defined) | | | n/a | | $ | 2.12 | billion |
(a)Under the terms of the Credit Facility, we are required to maintain either a minimum Interest Coverage Ratio or a minimum level of liquidity, but not both. As of November 30, 2021, we met both the Interest Coverage Ratio and the minimum liquidity requirements.
The indenture governing our senior notes does not contain any financial covenants. Subject to specified exceptions, the indenture contains certain restrictive covenants that, among other things, limit our ability to incur secured indebtedness, or engage in sale-leaseback transactions involving property above a certain specified value. In addition, our senior notes contain certain limitations related to mergers, consolidations, and sales of assets.
As of the date of this report, we were in compliance with the applicable terms of all our covenants and other requirements under the Credit Facility, the senior notes, the indenture, and the mortgages and land contracts due to land sellers and other loans. Our ability to access the Credit Facility for cash borrowings and letters of credit and our ability to secure future debt financing depend, in part, on our ability to remain in such compliance. There are no agreements that restrict our payment of
dividends other than the Credit Facility, which would restrict our payment of certain dividends, such as cash dividends on our common stock, if a default under the Credit Facility exists at the time of any such payment, or if any such payment would result in such a default (other than dividends paid within 60 days after declaration, if there was no default at the time of declaration).
Depending on available terms, we finance certain land acquisitions with purchase-money financing from land sellers or with other forms of financing from third parties. At November 30, 2021, we had outstanding mortgages and land contracts due to land sellers and other loans payable in connection with such financing of $5.3 million, secured primarily by the underlying property, which had an aggregate carrying value of $20.8 million.
Unconsolidated Joint Ventures. As discussed in Note 9 – Investments in Unconsolidated Joint Ventures in the Notes to Consolidated Financial Statements in this report, we have investments in unconsolidated joint ventures in various markets where our homebuilding operations are located. None of our unconsolidated joint ventures had outstanding debt at November 30, 2021.
Credit Ratings. Our credit ratings are periodically reviewed by rating agencies. In February 2021, Moody’s Investors Service affirmed our corporate Ba3 credit rating, and upgraded the rating outlook to positive from stable. In May 2021, Moody’s Investors Service upgraded our corporate rating to Ba2 from Ba3, and changed the rating outlook to stable from positive.
Consolidated Cash Flows. The following table presents a summary of net cash provided by (used in) our operating, investing and financing activities (in thousands):
| | | | | | | | | | | | | | | | | |
| | Years Ended November 30, |
| | 2021 | | 2020 | | 2019 |
| Net cash provided by (used in): | | | | | |
| Operating activities | $ | (37,296) | | | $ | 310,678 | | | $ | 251,042 | |
| Investing activities | (38,084) | | | (26,563) | | | (40,944) | |
| Financing activities | (315,013) | | | (56,444) | | | (330,359) | |
| Net increase (decrease) in cash and cash equivalents | $ | (390,393) | | | $ | 227,671 | | | $ | (120,261) | |
Operating Activities. Operating activities used net cash of $37.3 million in 2021 and provided net cash of $310.7 million in 2020. Generally, our net operating cash flows fluctuate primarily based on changes in our inventories and our profitability. Net cash used in operating activities in 2021 mainly reflected a net increase in inventories of $897.8 million and a net increase in receivables of $32.0 million, partly offset by net income of $564.7 million and a net increase in accounts payable, accrued expenses and other liabilities of $181.6 million. Net cash provided by operating activities in 2020 primarily reflected net income of $296.2 million, a net decrease in receivables of $59.3 million, largely due to an income tax refund received, and a net increase in accounts payable, accrued expenses and other liabilities of $4.1 million, partly offset by a net increase in inventories of $183.2 million.
Investing Activities. Investing activities used net cash of $38.1 million in 2021 and $26.6 million in 2020. Our uses of cash in 2021 included $39.4 million for net purchases of property and equipment and $11.5 million for contributions to unconsolidated joint ventures. These uses of cash were partially offset by a $12.8 million return of investments in unconsolidated joint ventures. In 2020, the net cash used in investing activities included $28.8 million for net purchases of property and equipment and $10.4 million for contributions to unconsolidated joint ventures. These uses of cash were partly offset by a $12.7 million return of investments in unconsolidated joint ventures.
Financing Activities. In 2021, the year-over-year change in net cash used in financing activities was mainly due to financing transactions we completed during the year. In 2021, cash was used for the repayment of $450.0 million in aggregate principal amount of our 7.00% Senior Notes due 2021, stock repurchases totaling $188.2 million, dividend payments on our common stock of $54.1 million, tax payments associated with stock-based compensation awards of $12.3 million, payments of debt issuance costs of $4.8 million and payments on mortgages and land contracts due to land sellers and other loans of $2.3 million. The cash used was partially offset by cash provided from our public offering of $390.0 million in aggregate principal amount of 4.00% Senior Notes due 2031 and $11.7 million of issuances of common stock under employee stock plans. In 2020, net cash was used for dividend payments on our common stock of $38.1 million, payments on mortgages and land contracts due to land sellers and other loans of $24.9 million, and tax payments associated with stock-based compensation awards of $9.5 million. Partially offsetting these uses of cash was $16.1 million of cash provided by issuances of common stock under employee stock plans.
Dividends. Our board of directors declared four quarterly cash dividends of $.15 per share of common stock in 2021. In 2020, our board of directors declared quarterly cash dividends of $.09 per share of common stock in the first, second and third quarters. In the 2020 fourth quarter, our board of directors approved an increase in the quarterly cash dividend on our common stock to $.15 per share and declared a quarterly cash dividend at the new higher rate. Cash dividends declared and paid during the years ended November 30, 2021 and 2020 totaled $.60 and $.42 per share of common stock, respectively. The declaration and payment of future cash dividends on our common stock, whether at current levels or at all, are at the discretion of our board of directors, and depend upon, among other things, our expected future earnings, cash flows, capital requirements, access to external financing, debt structure and any adjustments thereto, operational and financial investment strategy and general financial condition, as well as general business conditions.
Shelf Registration Statement. On July 9, 2020, we filed an automatically effective universal shelf registration statement (“2020 Shelf Registration”) with the SEC. The 2020 Shelf Registration registers the offering of securities that we may issue from time to time in amounts to be determined. Our ability to issue securities is subject to market conditions. The 2020 Shelf Registration replaced our previously effective universal shelf registration statement filed with the SEC on July 14, 2017.
Share Repurchase Program. On July 8, 2021, our board of directors authorized us to repurchase up to 5,000,000 shares of our outstanding common stock. This authorization reaffirmed and incorporated the then-current balance of 2,193,947 shares that remained under a prior board-approved share repurchase program. In 2021, we repurchased 4,668,600 shares of our common stock on the open market pursuant to this authorization at a total cost of $188.2 million. Repurchases under the remaining authorization of 331,400 shares may occur periodically through open market purchases, privately negotiated transactions or otherwise, with the timing and amount at management’s discretion and dependent on market and business conditions and other factors. This share repurchase authorization will continue in effect until fully used or earlier terminated or suspended by our board of directors and does not obligate us to purchase any additional shares.
Unrelated to the common stock repurchase program, our board of directors authorized in 2014 the repurchase of no more than 680,000 shares of our outstanding common stock solely as necessary for director compensation elections with respect to settling outstanding stock appreciation rights awards (“Director Plan SARs”) granted under our Non-Employee Directors Compensation Plan (“Director Plan”). As of November 30, 2021, we have not repurchased any shares pursuant to the board of directors authorization.
While the ongoing COVID-19 pandemic has created uncertainty as to general economic conditions for 2022 and beyond, as of the date of this report, we believe we have adequate capital resources and sufficient access to external financing sources to satisfy our current and reasonably anticipated requirements for funds to conduct our operations and meet other needs in the ordinary course of our business. In 2022, we expect to use or redeploy our cash resources or cash borrowings under the Credit Facility to support our business within the context of prevailing market conditions. During this time, we may also engage in capital markets, bank loan, project debt or other financial transactions, including the repurchase of debt or equity securities or potential new issuances of debt or equity securities to support our business needs. The amounts involved in these transactions, if any, may be material. In addition, as necessary or desirable, we may adjust or amend the terms of and/or expand the capacity of the Credit Facility or the LOC Facility, or enter into additional letter of credit facilities, or other similar facility arrangements, in each case with the same or other financial institutions, or allow any such facilities to mature or expire. However, with the uncertainty surrounding the COVID-19 pandemic, which could materially and negatively affect our business and the housing market, our ability to engage in such transactions may be constrained by volatile or tight economic, capital, credit and/or financial market conditions, as well as moderated investor and/or lender interest or capacity and/or our liquidity, leverage and net worth, and we can provide no assurance as to successfully completing, the costs of, or the operational limitations arising from any one or series of such transactions. Further discussion of the potential impacts from the COVID-19 pandemic on our capital resources and liquidity is provided above under Item 1A – Risk Factors in this report.
CRITICAL ACCOUNTING POLICIES AND ESTIMATES
The accompanying consolidated financial statements were prepared in conformity with GAAP. The preparation of these financial statements requires the use of estimates, judgments and assumptions that affect the reported amounts of assets and liabilities at the date of the financial statements and reported amounts of revenues and expenses during the periods presented. Actual results could differ from those estimates and assumptions. See Note 1 – Summary of Significant Accounting Policies in the Notes to Consolidated Financial Statements in this report for a discussion of our significant accounting policies. The following are accounting policies that we believe are critical because of the significance of the activity to which they relate or because they require the use of significant estimates, judgments and/or other assumptions in their application.
Homebuilding Revenue Recognition. We recognize homebuilding revenue by applying the following steps in determining the timing and amount of revenue to recognize: (1) identify the contract(s) with a customer; (2) identify the performance
obligations in the contract; (3) determine the transaction price; (4) allocate the transaction price to the performance obligations in the contract, if applicable; and (5) recognize revenue when (or as) we satisfy a performance obligation.
Our home sale transactions are made pursuant to contracts under which we typically have a single performance obligation to deliver a completed home to the homebuyer when closing conditions are met. Revenues from home sales are recognized when we have satisfied the performance obligation within the sales contract, which is generally when title to and possession of the home and the risks and rewards of ownership are transferred to the homebuyer on the closing date. Little to no estimation is involved in recognizing such revenues.
Land sale transactions are made pursuant to contracts under which we typically have a performance obligation(s) to deliver specified land parcels to the buyer when closing conditions are met. We evaluate each land sale contract to determine our performance obligation(s) under the contract, including whether we have a distinct promise to perform post-closing land development work that is material within the context of the contract, and use objective criteria to determine our completion of the applicable performance obligation(s), whether at a point in time or over time. Revenues from land sales are recognized when we have satisfied the performance obligation(s) within the sales contract, which is generally when title to and possession of the land and the risks and rewards of ownership are transferred to the land buyer on the closing date. In instances where we have a distinct and material performance obligation(s) within the context of a land sale contract to perform land development work after the closing date, a portion of the transaction price under the contract is allocated to such performance obligation(s) and is recognized as revenue over time based upon our estimated progress toward the satisfaction of the performance obligation(s). We generally measure our progress based on our costs incurred relative to the total costs expected to satisfy the performance obligation(s). Certain land sale contracts may require management judgment in determining the appropriate revenue recognition, but the impact of such transactions is generally immaterial.
Inventories and Cost of Sales. Housing and land inventories are stated at cost, unless the carrying value is determined not to be recoverable, in which case the affected inventories are written down to fair value or fair value less associated costs to sell. Fair value is determined based on estimated future net cash flows discounted for inherent risks associated with the real estate assets, or other valuation techniques. Due to uncertainties in the estimation process and other factors beyond our control, it is possible that actual results could differ from those estimated. Other than model homes, our inventories typically do not consist of completed unsold homes. However, as discussed above under Item 1 – Business in this report, we may have unsold completed or partially completed homes in our inventory.
We rely on certain estimates to determine our construction and land costs and resulting housing gross profit margins associated with revenues recognized. Construction and land costs are comprised of direct and allocated costs, including estimated future costs for the limited warranty we provide on our homes, and certain amenities within a community. Land acquisition, land development and other common costs are generally allocated on a relative fair value basis to the homes or lots within the applicable community or land parcel. Land acquisition and land development costs include related interest and real estate taxes.
In determining a portion of the construction and land costs recognized for each period, we rely on project budgets that are based on a variety of assumptions, including future construction schedules and costs to be incurred. It is possible that actual results could differ from budgeted amounts for various reasons, including construction delays, construction resource shortages, increases in costs that have not yet been committed, changes in governmental requirements, unforeseen environmental hazards or other unanticipated issues encountered during construction and other factors beyond our control. While the actual results for a particular construction project are accurately reported over time, variances between the budgeted and actual costs of a project could result in the understatement or overstatement of construction and land costs and homebuilding gross profits in a particular reporting period. To reduce the potential for such distortion, we have set forth procedures that collectively comprise a critical accounting policy. These procedures, which we have applied on a consistent basis, include assessing, updating and revising project budgets on a monthly basis, obtaining commitments to the extent possible from independent contractors and vendors for future costs to be incurred, reviewing the adequacy of warranty accruals and historical warranty claims experience, and utilizing the most current information available to estimate construction and land costs to be charged to expense. Variances to the budgeted costs after an estimate has been charged to expense that are related to project costs are generally allocated on a relative fair value basis to the remaining homes to be delivered within the community or land parcel, while such variances related to direct construction costs are generally expensed as incurred. The variances between budgeted and actual costs have historically not been material to our consolidated financial statements. We believe that our policies provide for reasonably dependable estimates to be used in the calculation and reporting of construction and land costs.
Inventory Impairments and Land Option Contract Abandonments. Each community or land parcel in our owned inventory is assessed to determine if indicators of potential impairment exist. Impairment indicators are assessed separately for each community or land parcel on a quarterly basis and include, but are not limited to, the following: significant decreases in net orders, average selling prices, volume of homes delivered, gross profit margins on homes delivered or projected gross profit
margins on homes in backlog or future deliveries; significant increases in budgeted land development and home construction costs or cancellation rates; or projected losses on expected future land sales. If indicators of potential impairment exist for a community or land parcel, the identified asset is evaluated for recoverability.
We evaluated one, 11 and 21 communities or land parcels for recoverability as of November 30, 2021, 2020 and 2019, respectively. The carrying values of those communities or land parcels evaluated as of November 30, 2021, 2020 and 2019 were $29.9 million, $123.4 million and $207.7 million, respectively. The higher number and corresponding carrying value of communities or land parcels evaluated as of November 30, 2020 and 2019 reflected the then-current conditions and trends in the markets where the communities are located, as well as certain communities or land parcels previously held for future development that were reactivated as part of our efforts to improve our asset efficiency.
When an indicator of potential impairment is identified for a community or land parcel, we test the asset for recoverability by comparing the carrying value of the asset to the undiscounted future net cash flows expected to be generated by the asset. The undiscounted future net cash flows are impacted by then-current conditions and trends in the market in which the asset is located as well as factors known to us at the time the cash flows are calculated. These factors may include recent trends in our orders, backlog, cancellation rates and volume of homes delivered, as well as our expectations related to the following: product offerings; market supply and demand, including estimated average selling prices and related price appreciation; and land development, home construction and overhead costs to be incurred and related cost inflation.
The following table presents information regarding inventory impairment and land option contract abandonment charges included in construction and land costs in our consolidated statements of operations (dollars in thousands):
| | | | | | | | | | | | | | | | | |
| | Years Ended November 30, |
| | 2021 | | 2020 | | 2019 |
| Inventory impairments: | | | | | |
| | | | | |
| | | | | |
| Number of communities or land parcels written down to fair value | 2 | | | 10 | | | 8 | |
| Pre-impairment carrying value of communities or land parcels written down to fair value | $ | 27,923 | | | $ | 69,211 | | | $ | 41,160 | |
| Inventory impairment charges | (9,903) | | | (22,723) | | | (14,031) | |
| Post-impairment fair value | $ | 18,020 | | | $ | 46,488 | | | $ | 27,129 | |
| Land option contract abandonments charges | $ | 2,050 | | | $ | 5,946 | | | $ | 3,260 | |
The inventory impairment charges in 2021, 2020 and 2019 reflected our decisions to make changes in our operational strategies aimed at more quickly monetizing our investment in certain communities by accelerating the overall pace for selling, building and delivering homes therein, including communities on land previously held for future development.
As further described in Note 7 – Inventory Impairments and Land Option Contract Abandonments in the Notes to Consolidated Financial Statements in this report, given the inherent challenges and uncertainties in forecasting future results, our inventory assessments at the time they are made take into consideration whether a community or land parcel is active, meaning whether it is open for sales and/or undergoing development, or whether it is being held for future development or held for sale.
We record an inventory impairment charge on a community or land parcel that is active or held for future development when indicators of potential impairment exist and the carrying value of the real estate asset is greater than the undiscounted future net cash flows the asset is expected to generate. These real estate assets are written down to fair value, which is primarily determined based on the estimated future net cash flows discounted for inherent risk associated with each such asset, or other valuation techniques. Inputs used in our calculation of estimated discounted future net cash flows are specific to each affected real estate asset and are based on our expectations for each such asset as of the applicable measurement date, including, among others, expectations related to average selling prices and volume of homes delivered. The discount rates used in our estimated discounted cash flows ranged from 18% - 19% in 2021, 17% - 18% in 2020, and 17% during 2019. The discount rates we used were impacted by one or more of the following at the time the calculation was made: the risk-free rate of return; expected risk premium based on estimated land development, home construction and delivery timelines; market risk from potential future price erosion; cost uncertainty due to land development or home construction cost increases; and other risks specific to the asset or conditions in the market in which the asset is located.
We record an inventory impairment charge on land held for sale when the carrying value of the real estate asset is greater than its fair value. These real estate assets are written down to fair value, less associated costs to sell. The fair value of such
real estate assets is generally based on bona fide letters of intent from outside parties, executed sales contracts, broker quotes or similar information.
As of November 30, 2021, the aggregate carrying value of our inventory that had been impacted by inventory impairment charges was $87.7 million, representing 11 communities and various other land parcels. As of November 30, 2020, the aggregate carrying value of our inventory that had been impacted by inventory impairment charges was $113.1 million, representing 16 communities and various other land parcels.
Our inventory controlled under land option contracts and other similar contracts is assessed to determine whether it continues to meet our investment return standards. Assessments are made separately for each optioned land parcel on a quarterly basis and are affected by the following factors relative to the market in which the asset is located, among others: current and/or anticipated net orders, average selling prices and volume of homes delivered; estimated land development and home construction costs; and projected profitability on expected future housing or land sales. When a decision is made not to exercise certain land option contracts and other similar contracts due to market conditions and/or changes in our marketing strategy, we write off the related inventory costs, including non-refundable deposits and unrecoverable pre-acquisition costs.
The estimated remaining life of each community or land parcel in our inventory depends on various factors, such as the total number of lots remaining; the expected timeline to acquire and entitle land and develop lots to build homes; the anticipated future net order and cancellation rates; and the expected timeline to build and deliver homes sold. While it is difficult to determine a precise timeframe for any particular inventory asset, based on current market conditions and expected delivery timelines, we estimate our inventory assets’ remaining operating lives to range generally from one year to in excess of 10 years and expect to realize, on an overall basis, the majority of our inventory balance as of November 30, 2021 within five years. The following table presents as of November 30, 2021 and 2020, respectively, the estimated timeframe of delivery for the last home in an applicable community or land parcel and the corresponding percentage of total inventories such categories represent within our inventory balance (dollars in millions):
| | | | | | | | | | | | | | | | | | | | | | | | | | | | | | | | | | | | | | | | | | | | | | | | | | | | | |
| 0-2 years | | 3-5 years | | 6-10 years | | Greater than
10 years | | |
| $ | | % | | $ | | % | | $ | | % | | $ | | % | | Total |
| 2021 | $ | 2,646.3 | | | 55 | % | | $ | 1,961.3 | | | 41 | % | | $ | 176.5 | | | 4 | % | | $ | 18.7 | | | — | % | | $ | 4,802.8 | |
| 2020 | 1,893.9 | | | 49 | | | 1,843.8 | | | 47 | | | 140.7 | | | 4 | | | 19.1 | | | — | | | 3,897.5 | |
The inventory balances in the 0-2 years and 3-5 years categories were located throughout all of our homebuilding reporting segments, though mostly in our West Coast, Southwest and Central segments. These categories collectively represented 96% of our total inventories as of November 30, 2021 and November 30, 2020. The inventory balances in the 6-10 years and greater than 10 years categories were primarily located in our Central and Southeast segments, and together totaled $195.2 million at November 30, 2021, compared to $159.8 million at November 30, 2020. The year-over-year increase mainly reflected larger land positions in the Central and Southeast homebuilding reporting segments acquired during 2021, partly offset by our decisions to accelerate the overall timing for selling, building and delivering homes through community reactivations and generally favorable market conditions. The inventories in the 6-10 years and greater than 10 years categories as of November 30, 2021 were mostly comprised of active, multi-phase communities with large remaining land positions. As of November 30, 2020, such inventories also included certain land held for future development.
Due to the judgment and assumptions applied in our inventory impairment and land option contract abandonment assessment processes, and in our estimations of the remaining operating lives of our inventory assets and the realization of our inventory balances, particularly as to land held for future development, it is possible that actual results could differ substantially from those estimated.
Deterioration in the supply and demand factors in the overall housing market or in an individual market or submarket, or changes to our operational or selling strategy at certain communities may lead to additional inventory impairment charges, future charges associated with land sales or the abandonment of land option contracts or other similar contracts related to certain assets. Due to the nature or location of the projects, land held for future development that we activate as part of our strategic growth initiatives or to accelerate sales and/or our return on investment, or that we otherwise monetize to help improve our asset efficiency, may have a somewhat greater likelihood of being impaired than other of our active inventory.
We believe the carrying value of our inventory balance as of November 30, 2021 is recoverable. Our considerations in making this determination include the factors and trends incorporated into our impairment analyses, and as applicable, the prevailing regulatory environment, competition from other homebuilders, inventory levels and sales activity of resale homes, and the local economic conditions where an asset is located. In addition, we consider the financial and operational status and
expectations of our inventories as well as unique attributes of each community or land parcel that could be viewed as indicators for potential future impairments. However, if conditions in the overall housing market or in a specific market or submarket worsen in the future beyond our current expectations, including, among other things, from ongoing negative effects of the COVID-19 pandemic and related COVID-19 control responses, if future changes in our business strategy significantly affect any key assumptions used in our projections of future cash flows, or if there are material changes in any of the other items we consider in assessing recoverability, we may recognize charges in future periods for inventory impairments or land option contract abandonments, or both, related to our current inventory assets. Any such charges could be material to our consolidated financial statements.
Warranty Costs. We provide a limited warranty on all of our homes. The specific terms and conditions of our limited warranty program vary depending upon the markets in which we do business. We estimate the costs that may be incurred under each limited warranty and record a liability in the amount of such costs at the time the revenue associated with the sale of each home is recognized. In assessing our overall warranty liability at a reporting date, we evaluate the costs for warranty-related items on a combined basis for all of our previously delivered homes that are under our limited warranty program.
Our primary assumption in estimating the amounts we accrue for warranty costs is that historical claims experience is a strong indicator of future claims experience. Factors that affect our warranty liability include the number of homes delivered, historical and anticipated rates of warranty claims, and cost per claim. We periodically assess the adequacy of our accrued warranty liability, which is included in accrued expenses and other liabilities in our consolidated balance sheets, and adjust the amount as necessary based on our assessment. Our assessment includes the review of our actual warranty costs incurred to identify trends and changes in our warranty claims experience, and considers our home construction quality and customer service initiatives and outside events. Based on this assessment, we may from time to time adjust our warranty accrual rates, which would be applied on a prospective basis to homes delivered. Although adjustments to the accrual rates are generally infrequent, they may be necessary when actual warranty expenditures have increased or decreased on a sustained basis, as was the case in recent years when we reduced our warranty accrual rates to reflect favorable trends in our warranty expenditures. Based on our assessment, we may also make adjustments to our previously recorded accrued warranty liability. Such adjustments are recorded in the period in which the change in estimate occurs. During 2021, 2020 and 2019, we made adjustments to reduce our accrued warranty liability by $4.0 million, $3.6 million and $5.6 million, respectively. While we believe we may face increased future home warranty and construction defect claims associated with replacing or servicing substitute products or materials used in some instances to address supply shortages in certain served markets or communities, as discussed above under Item 1A - Risk Factors in this report, as of the date of this report, we have not made any adjustments to our accrued liabilities associated with this potential risk. We have not made any material changes in the methodology used to establish our accrued warranty liability during 2021, 2020 and 2019. Our accrued warranty liability is presented on a gross basis for all years without consideration of recoveries and amounts we have paid on behalf of and expect to recover from other parties, if any. Estimates of recoveries and amounts we have paid on behalf of and expect to recover from other parties, if any, are recorded as receivables when such recoveries are considered probable.
While we believe the warranty liability currently reflected in our consolidated balance sheets to be adequate, unanticipated changes or developments in the legal environment, local weather, land or environmental conditions, quality of materials or methods used in the construction of homes or customer service practices and/or our warranty claims experience could have a significant impact on our actual warranty costs in future periods and such amounts could differ significantly from our current estimates. A 10% change in the historical warranty rates used to estimate our accrued warranty liability would not result in a material change in our accrual.
Self-Insurance. We maintain, and require the majority of our independent contractors to maintain, general liability insurance (including construction defect and bodily injury coverage) and workers’ compensation insurance. These insurance policies protect us against a portion of our risk of loss from claims related to our homebuilding activities, subject to certain self-insured retentions, deductibles and other coverage limits. We self-insure a portion of our overall risk through the use of a captive insurance subsidiary. In Arizona, California, Colorado and Nevada, our contractors’ general liability insurance primarily takes the form of a wrap-up policy under a program where eligible independent contractors are enrolled as insureds on each community. Enrolled contractors contribute toward the cost of the insurance and agree to pay a contractual amount in the future if there is a claim related to their work.
We record liabilities based on the estimated costs required to cover reported claims, claims incurred but not yet reported, and claim adjustment expenses. These estimated costs are based on an actuarial analysis of our historical claims and expense data, as well as industry data. Our self-insurance liabilities are presented on a gross basis without consideration of insurance recoveries and amounts we have paid on behalf of and expect to recover from other parties, if any.
The amount of our self-insurance liability is based on an analysis performed by a third-party actuary that uses our historical claim and expense data, as well as industry data to estimate these overall costs. These estimates are subject to uncertainty due
to a variety of factors, the most significant being the long period of time between the delivery of a home to a homebuyer and when a structural warranty or construction defect claim may be made, and the ultimate resolution of any such construction defect claim. Though state regulations vary, construction defect claims are reported and resolved over a long period of time, which can extend for 10 years or more. As a result, the majority of the estimated self-insurance liability based on the actuarial analysis relates to claims incurred but not yet reported. Therefore, adjustments related to individual existing claims generally do not significantly impact the overall estimated liability. Adjustments to our liabilities related to homes delivered in prior years are recorded in the period in which a change in our estimate occurs. During 2021, we recorded adjustments to increase our previously recorded liabilities by $6.8 million. In 2020 and 2019, we recorded adjustments to reduce our previously recorded liabilities by $4.0 million and $2.5 million, respectively. The adjustments in 2021, 2020 and 2019 resulted from changes in estimates due to actual claims experience differing from previous actuarial projections and, in turn, impacting actuarial estimates for existing and potential future claims. We have not made any material changes in our methodology used to establish our self-insurance liabilities during 2021, 2020 or 2019.
The projection of losses related to these liabilities requires the use of actuarial assumptions. Key assumptions used in developing these estimates include claim frequencies, severities and resolution patterns, which can occur over an extended period of time. These estimates are subject to variability due to the length of time between the delivery of a home to a homebuyer and when a construction defect claim is made, and the ultimate resolution of such claim; uncertainties regarding such claims relative to our markets and the types of product we build; and legal or regulatory actions and/or interpretations, among other factors. Due to the degree of judgment involved and the potential for variability in these underlying assumptions, our actual future costs could differ from those estimated. In addition, changes in the frequency and severity of reported claims and the estimates to resolve claims can impact the trends and assumptions used in the actuarial analysis, which could be material to our consolidated financial statements. A 10% increase in the claim frequency and the average cost per claim used to estimate the self-insurance liability would result in increases of approximately $26.7 million in our liability and approximately $10.2 million in our receivable as of November 30, 2021, and additional expense of approximately $16.5 million for 2021. A 10% decrease in the claim frequency and the average cost per claim used to estimate the self-insurance liability would result in decreases of approximately $24.8 million in our liability and approximately $7.6 million in our receivable as of November 30, 2021, and a reduction to expense of approximately $17.2 million for 2021.
Estimates of insurance recoveries and amounts we have paid on behalf of other parties, if any, are recorded as receivables when such recoveries are considered probable. These estimated recoveries are principally based on actuarially determined amounts and depend on various factors, including, among other things, the above-described claim cost estimates, our insurance policy coverage limits for the applicable policy year(s), historical third-party recovery rates, insurance industry practices, the regulatory environment, and legal precedent, and are subject to a high degree of variability from year to year. Because of the inherent uncertainty and variability in these assumptions, our actual insurance recoveries could differ significantly from amounts currently estimated.
Legal Matters Accruals. We record contingent liabilities resulting from claims against us when a loss is assessed to be probable and the amount of the loss is reasonably estimable. Assessing the probability of losses and estimating probable losses requires analysis of multiple factors, including in some cases judgments about the potential actions of third-party claimants, regulatory agencies, mediators, arbitrators, responsible third parties and/or courts, as the case may be. Recorded contingent liabilities are based on the most recent information available and actual losses in any future period are inherently uncertain. If future adjustments to estimated probable future losses or actual losses exceed our recorded liability for such claims, we would record additional charges during the period in which the actual loss or change in estimate occurred. In addition to contingent liabilities recorded for probable losses, we disclose contingent liabilities when there is a reasonable possibility the ultimate loss will materially exceed the recorded liability. While we cannot predict the outcome of pending legal matters with certainty, we do not believe any currently identified claim or proceeding, either individually or in aggregate, will have a material impact on our results of operations, financial position or cash flows.
Stock-Based Compensation. We measure and recognize compensation expense associated with our grants of equity-based awards at an amount equal to the fair value of such share-based payments over their applicable vesting period. We have provided compensation benefits to certain of our employees in the form of stock options, restricted stock and PSUs, and to our non-employee directors in the form of unrestricted shares of common stock, deferred common stock awards and Director Plan SARs. Determining the fair value of share-based awards requires judgment to identify the appropriate valuation model and develop the assumptions to be used in the calculation, including the expected term of the stock options or Director Plan SARs, expected stock-price volatility and dividend yield. We estimate the fair value of stock options and Director Plan SARs granted using the Black-Scholes option-pricing model with assumptions based primarily on historical data. The expected volatility factor is based on a combination of the historical volatility of our common stock and the implied volatility of publicly traded options on our common stock. We believe this blended approach balances the forward-looking nature of implied volatility with the relative stability over time of historical volatility to arrive at a reasonable estimate of expected volatility. Additionally, judgment is required in estimating the percentage of share-based awards that are expected to vest, and in the case of PSUs, the
level of performance that will be achieved and the number of shares that will be earned. If actual results differ significantly from these estimates, stock-based compensation expense could be higher and have a material impact on our consolidated financial statements.
Income Taxes. As discussed in Note 14 – Income Taxes in the Notes to the Consolidated Financial Statements in this report, we evaluate our deferred tax assets quarterly to determine if adjustments to our valuation allowance are required based on the consideration of all available positive and negative evidence using a “more likely than not” standard with respect to whether deferred tax assets will be realized. This evaluation considers, among other factors, our historical operating results, our expectation of future profitability, the duration of the applicable statutory carryforward periods, and conditions in the housing market and the broader economy. The ultimate realization of our deferred tax assets depends primarily on our ability to generate future taxable income during the periods in which the related deferred tax assets become deductible. The value of our deferred tax assets in our consolidated balance sheets depends on applicable income tax rates. We base our estimate of deferred tax assets and liabilities on current tax laws and rates. In certain cases, we also base this estimate on business plan forecasts and other expectations about future outcomes. Changes in positive and negative evidence, including differences between our future operating results and estimates, could result in the establishment of an additional valuation allowance against our deferred tax assets. Accounting for deferred taxes is based upon estimates of future results. Judgment is required in determining the future tax consequences of events that have been recognized in our consolidated financial statements and/or tax returns. Differences between the anticipated and actual outcomes of these future results could have a material impact on our consolidated financial statements. Also, changes in existing federal and state tax laws and corporate income tax rates could affect future tax results and the realization of deferred tax assets over time.
We recognize accrued interest and penalties related to unrecognized tax benefits in our consolidated financial statements as a component of the provision for income taxes. Our liability for unrecognized tax benefits, combined with accrued interest and penalties, is reflected as a component of accrued expenses and other liabilities in our consolidated balance sheets. Judgment is required in evaluating uncertain tax positions. We evaluate our uncertain tax positions quarterly based on various factors, including changes in facts or circumstances, tax laws or the status of audits by tax authorities. Changes in the recognition or measurement of uncertain tax positions could have a material impact on our consolidated financial statements in the period in which we make the change.
INFLATION
The impact of inflation on us is reflected in increased costs for land, land development, construction, and overhead. Inflation may also raise our financing costs. We generally enter into contracts to acquire land a significant period of time before development and sales efforts commence. Accordingly, to the extent land acquisition costs are fixed, subsequent increases or decreases in our home selling prices will affect our profits. As the selling price of each of our homes is fixed at the time a buyer enters into a home purchase contract, and because we generally commence construction of a home only after we have a signed purchase contract with a homebuyer, any construction-related cost inflation can result in lower housing gross profit margins. In order to help moderate that effect, we typically enter into fixed-price contracts with our larger trade partners and building material suppliers for specified periods of time.
RECENT ACCOUNTING PRONOUNCEMENTS
Recent accounting pronouncements are discussed in Note 1 – Summary of Significant Accounting Policies in the Notes to Consolidated Financial Statements in this report.
OUTLOOK
We believe several long-term housing market fundamental factors will remain positive in 2022, including favorable demographics, a housing supply-demand imbalance resulting from a decade-plus underproduction of new homes in relation to population growth, a limited supply of resale homes available for sale and relatively low mortgage loan interest rates. We believe our highly customer-centric, personalized approach to homebuilding and operational capabilities will enable us to effectively adapt to evolving buyer preferences and needs and, together with an expected year-over-year increase in our community count, drive further growth in our results in 2022, subject to business conditions and other factors described in this report.
Our present 2022 outlook is as follows:
2022 First Quarter –
•We expect to generate housing revenues in the range of $1.43 billion to $1.53 billion, an increase from $1.14 billion in the corresponding period of 2021, and anticipate our average selling price to be approximately $472,000, compared to $397,100 in the year-earlier period.
•We expect our homebuilding operating income margin will be approximately 12.0%, assuming no inventory-related charges, up from 10.4% for the year-earlier quarter.
◦We expect our housing gross profit margin to be in the range of 22.0% to 22.6%, assuming no inventory-related charges, compared to 21.1% for the corresponding 2021 quarter.
◦We expect our selling, general and administrative expenses as a percentage of housing revenues to be approximately 10.4%, an improvement of 30 basis points from the 2021 first quarter.
•We expect the effective tax rate will be approximately 25%, excluding any favorable impacts from federal tax credits for building energy-efficient homes. The effective tax rate for the year-earlier quarter was approximately 21%.
•We expect our ending community count will be relatively flat sequentially and represent the likely low point for 2022, and expect our average community count to decline by a low single-digit percentage from the 2021 first quarter.
2022 Full Year –
•We expect our housing revenues to be in the range of $7.20 billion to $7.60 billion, an increase of 30% at the mid-point of the range, from $5.69 billion in 2021, and anticipate our average selling price to be in the range of $480,000 to $490,000, an increase of between 14% and 16% from 2021.
•We expect our homebuilding operating income margin to be in the range of 15.7% to 16.5%, assuming no inventory-related charges, compared to 11.8% for 2021.
◦We expect our housing gross profit margin to be in the range of 25.4% to 26.2%, assuming no inventory-related charges, compared to 21.8% for 2021, reflecting sequential expansion beginning in the second quarter.
◦We expect our selling, general and administrative expenses as a percentage of housing revenues to be in the range of 9.4% to 9.9%, compared to 10.1% in the prior year.
•We expect the effective tax rate will be approximately 25%, assuming no federal energy tax credit extension is enacted. The effective tax rate for 2021 was approximately 19%, which reflected the favorable effect of federal tax credits we earned primarily from building energy-efficient homes.
•We expect our ending community count will increase 20% to 25% from 2021.
•We expect our return on equity to be in excess of 26%, an improvement of more than 600 basis points compared to 19.9% for 2021.
We believe we are well-positioned for 2022 due to, among other things, our strong backlog, planned new community openings, investments in land and land development and current positive economic and demographic trends, to varying degrees, in many of our served markets.
However, our future performance and the strategies we implement (and adjust or refine as necessary or appropriate) will depend significantly on prevailing economic, homebuilding industry and capital, credit and financial market conditions and on a fairly stable and constructive political and regulatory environment (particularly in regards to housing and mortgage loan financing policies). In particular, we and other residential construction firms continue to experience services and supply constraints and rising and volatile raw material prices, particularly for lumber. Although we continue to work with our suppliers and trade partners to resolve these issues, we believe they will generally persist into 2022 and potentially throughout the year. Continued supply chain disruptions, construction services and building material shortages, and delays with respect to state and municipal construction permitting, inspections and utilities could further extend our construction cycle times, delay our new community openings and intensify construction-related cost pressures beyond our experience in 2021. In addition, consumer demand for our homes and our ability to grow our scale, revenues, net orders, backlog and returns in 2022 could be materially and negatively affected by persistent inflation in the U.S. economy, the severity of the ongoing COVID-19 pandemic and related COVID-19 control responses (including new or more restrictive “stay-at-home” orders and other new or revised
public health requirements recommended or imposed by federal, state and local authorities), and/or other factors that cause mortgage loan interest rates to increase or that temper mortgage loan availability, employment or income levels or consumer confidence in the U.S. or in our served markets. The potential effect of these factors on our business is highly uncertain, unpredictable and outside our control, and our past performance should not be considered indicative of our future results on any metric or set of metrics.
FORWARD-LOOKING STATEMENTS
Investors are cautioned that certain statements contained in this report, as well as some statements by us in periodic press releases and other public disclosures and some oral statements by us to securities analysts, stockholders and others during presentations, are “forward-looking statements” within the meaning of the Private Securities Litigation Reform Act of 1995 (the “Act”). Statements that are predictive in nature, that depend upon or refer to future events or conditions, or that include words such as “expect,” “anticipate,” “intend,” “plan,” “believe,” “estimate,” “hope,” and similar expressions constitute forward-looking statements. In addition, any statements that we may make or provide concerning future financial or operating performance (including without limitation future revenues, community count, homes delivered, net orders, selling prices, sales pace per new community, expenses, expense ratios, housing gross profits, housing gross profit margins, earnings or earnings per share, or growth or growth rates), future market conditions, future interest rates, and other economic conditions, ongoing business strategies or prospects, future dividends and changes in dividend levels, the value of our backlog (including amounts that we expect to realize upon delivery of homes included in our backlog and the timing of those deliveries), the value of our net orders, potential future asset acquisitions and the impact of completed acquisitions, future share issuances or repurchases, future debt issuances, repurchases or redemptions and other possible future actions are also forward-looking statements as defined by the Act. Forward-looking statements are based on our current expectations and projections about future events and are subject to risks, uncertainties, and assumptions about our operations, economic and market factors, and the homebuilding industry, among other things. These statements are not guarantees of future performance, and we have no specific policy or intention to update these statements. In addition, forward-looking and other statements in this report and in other public or oral disclosures that express or contain opinions, views or assumptions about market or economic conditions; the success, performance, effectiveness and/or relative positioning of our strategies, initiatives or operational activities; and other matters, may be based in whole or in part on general observations of our management, limited or anecdotal evidence and/or business or industry experience without in-depth or any particular empirical investigation, inquiry or analysis.
Actual events and results may differ materially from those expressed or forecasted in forward-looking statements due to a number of factors. The most important risk factors that could cause our actual performance and future events and actions to differ materially from such forward-looking statements include, but are not limited to, the following:
•general economic, employment and business conditions;
•population growth, household formations and demographic trends;
•conditions in the capital, credit and financial markets;
•our ability to access external financing sources and raise capital through the issuance of common stock, debt or other securities, and/or project financing, on favorable terms;
•the execution of any securities repurchases pursuant to our board of directors’ authorization;
•material and trade costs and availability, including building materials and appliances;
•consumer and producer price inflation;
•changes in interest rates;
•our debt level, including our ratio of debt to capital, and our ability to adjust our debt level and maturity schedule;
•our compliance with the terms of the Credit Facility;
•volatility in the market price of our common stock;
•home selling prices, including our homes’ selling prices, increasing at a faster rate than consumer incomes;
•weak or declining consumer confidence, either generally or specifically with respect to purchasing homes;
•competition from other sellers of new and resale homes;
•weather events, significant natural disasters and other climate and environmental factors;
•any failure of lawmakers to agree on a budget or appropriation legislation to fund the federal government’s operations, and financial markets’ and businesses’ reactions to any such failure;
•government actions, policies, programs and regulations directed at or affecting the housing market (including the tax benefits associated with purchasing and owning a home, and the standards, fees and size limits applicable to the purchase or insuring of mortgage loans by government-sponsored enterprises and government agencies), the homebuilding industry, or construction activities;
•changes in existing tax laws or enacted corporate income tax rates, including those resulting from regulatory guidance and interpretations issued with respect thereto;
•changes in U.S. trade policies, including the imposition of tariffs and duties on homebuilding materials and products, and related trade disputes with and retaliatory measures taken by other countries;
•the adoption of new or amended financial accounting standards and the guidance and/or interpretations with respect thereto;
•the availability and cost of land in desirable areas and our ability to timely develop acquired land parcels and open new communities;
•our warranty claims experience with respect to homes previously delivered and actual warranty costs incurred;
•costs and/or charges arising from regulatory compliance requirements or from legal, arbitral or regulatory proceedings, investigations, claims or settlements, including unfavorable outcomes in any such matters resulting in actual or potential monetary damage awards, penalties, fines or other direct or indirect payments, or injunctions, consent decrees or other voluntary or involuntary restrictions or adjustments to our business operations or practices that are beyond our current expectations and/or accruals;
•our ability to use/realize the net deferred tax assets we have generated;
•our ability to successfully implement our current and planned strategies and initiatives related to our product, geographic and market positioning, gaining share and scale in our served markets and in entering into new markets;
•our operational and investment concentration in markets in California;
•consumer interest in our new home communities and products, particularly from first-time homebuyers and higher-income consumers;
•our ability to generate orders and convert our backlog of orders to home deliveries and revenues, particularly in key markets in California;
•our ability to successfully implement our business strategies and achieve any associated financial and operational targets and objectives, including those discussed in this report or in other public filings, presentations or disclosures;
•income tax expense volatility associated with stock-based compensation;
•the ability of our homebuyers to obtain residential mortgage loans and mortgage banking services;
•the performance of mortgage lenders to our homebuyers;
•the performance of KBHS;
•information technology failures and data security breaches;
•an epidemic or pandemic (such as the outbreak and worldwide spread of COVID-19), and the control response measures that international, federal, state and local governments, agencies, law enforcement and/or health authorities implement to address it, which may (as with COVID-19) precipitate or exacerbate one or more of the above-mentioned and/or other risks, and significantly disrupt or prevent us from operating our business in the ordinary course for an extended period;
•widespread protests and civil unrest, whether due to political events, efforts to institute law enforcement and other social and political reforms, and the impacts of implementing or failing to implement any such reforms, or otherwise; and
•other events outside of our control.
Item 7A.QUANTITATIVE AND QUALITATIVE DISCLOSURES ABOUT MARKET RISK
We enter into debt obligations primarily to support general corporate purposes, including the operations of our subsidiaries. We are subject to interest rate risk on our senior notes. For fixed rate debt, changes in interest rates generally affect the fair value of the debt instrument, but not our earnings or cash flows. We generally have no obligation to prepay our debt before maturity, and, as a result, interest rate risk and changes in fair market value should not have a significant impact on our fixed rate debt until we are required or elect to refinance or repurchase such debt. Under our current policies, we do not use interest rate derivative instruments to manage our exposure to changes in interest rates.
The following tables present principal cash flows by scheduled maturity, weighted average effective interest rates and the estimated fair value of our long-term fixed rate debt obligations as of November 30, 2021 and 2020 (dollars in thousands):
| | | | | | | | | | | | | | | | | | | | | | | | | | | | | | | | | | | | | | | | | | | | | | | |
| As of November 30, 2021 and for the Years Ending November 30, | | Fair Value at
November 30,
2021 |
| 2022 | | 2023 | | 2024 | | 2025 | | 2026 | | Thereafter | | Total | |
| Long-term debt | | | | | | | | | | | | | | | |
| Fixed Rate | $ | 350,000 | | | $ | 350,000 | | | $ | — | | | $ | — | | | $ | — | | | $ | 990,000 | | | $ | 1,690,000 | | | $ | 1,796,500 | |
| Weighted Average Effective Interest Rate | 7.7 | % | | 7.5 | % | | — | % | | — | % | | — | % | | 5.3 | % | | 6.2 | % | | |
| | | | | | | | | | | | | | | | | | | | | | | | | | | | | | | | | | | | | | | | | | | | | | | |
| As of November 30, 2020 and for the Years Ending November 30, | | Fair Value at
November 30,
2020 |
| 2021 | | 2022 | | 2023 | | 2024 | | 2025 | | Thereafter | | Total | |
| Long-term debt | | | | | | | | | | | | | | | |
| Fixed Rate | $ | — | | | $ | 800,000 | | | $ | 350,000 | | | $ | — | | | $ | — | | | $ | 600,000 | | | $ | 1,750,000 | | | $ | 1,924,250 | |
| Weighted Average Effective Interest Rate | — | % | | 7.4 | % | | 7.5 | % | | — | % | | — | % | | 6.0 | % | | 7.0 | % | | |
Item 8.FINANCIAL STATEMENTS AND SUPPLEMENTARY DATA
KB HOME
INDEX TO CONSOLIDATED FINANCIAL STATEMENTS
Separate combined financial statements of our unconsolidated joint venture activities have been omitted because, if considered in the aggregate, they would not constitute a significant subsidiary as defined by Rule 3-09 of Regulation S-X.
KB HOME
CONSOLIDATED STATEMENTS OF OPERATIONS
(In Thousands, Except Per Share Amounts)
| | | | | | | | | | | | | | | | | |
| | Years Ended November 30, |
| | 2021 | | 2020 | | 2019 |
| Total revenues | $ | 5,724,930 | | | $ | 4,183,174 | | | $ | 4,552,747 | |
| Homebuilding: | | | | | |
| Revenues | $ | 5,705,029 | | | $ | 4,167,702 | | | $ | 4,537,658 | |
| Construction and land costs | (4,469,311) | | | (3,380,451) | | | (3,708,928) | |
| Selling, general and administrative expenses | (574,376) | | | (470,779) | | | (497,350) | |
| Operating income | 661,342 | | | 316,472 | | | 331,380 | |
| Interest income | 1,049 | | | 2,554 | | | 2,158 | |
| | | | | |
| Equity in income (loss) of unconsolidated joint ventures | (405) | | | 12,474 | | | (1,549) | |
| Loss on early extinguishment of debt | (5,075) | | | — | | | (6,800) | |
| Homebuilding pretax income | 656,911 | | | 331,500 | | | 325,189 | |
| Financial services: | | | | | |
| Revenues | 19,901 | | | 15,472 | | | 15,089 | |
| Expenses | (5,055) | | | (4,083) | | | (4,333) | |
| Equity in income of unconsolidated joint ventures | 23,589 | | | 21,154 | | | 12,230 | |
| Financial services pretax income | 38,435 | | | 32,543 | | | 22,986 | |
| Total pretax income | 695,346 | | | 364,043 | | | 348,175 | |
| Income tax expense | (130,600) | | | (67,800) | | | (79,400) | |
| Net income | $ | 564,746 | | | $ | 296,243 | | | $ | 268,775 | |
| Earnings per share: | | | | | |
| Basic | $ | 6.22 | | | $ | 3.26 | | | $ | 3.04 | |
| Diluted | $ | 6.01 | | | $ | 3.13 | | | $ | 2.85 | |
| Weighted average shares outstanding: | | | | | |
| Basic | 90,401 | | | 90,464 | | | 87,996 | |
| Diluted | 93,587 | | | 94,086 | | | 93,838 | |
See accompanying notes.
KB HOME
CONSOLIDATED STATEMENTS OF COMPREHENSIVE INCOME
(In Thousands)
| | | | | | | | | | | | | | | | | |
| | Years Ended November 30, |
| | 2021 | | 2020 | | 2019 |
| Net income | $ | 564,746 | | | $ | 296,243 | | | $ | 268,775 | |
| Other comprehensive income (loss): | | | | | |
Postretirement benefit plan adjustments: | | | | | |
Net actuarial gain (loss) arising during the period | 2,664 | | | (8,412) | | | (10,268) | |
Amortization of net actuarial loss | 1,575 | | | 963 | | | 218 | |
Amortization of prior service cost | 86 | | | 425 | | | 1,556 | |
| Settlement loss | — | | | — | | | 356 | |
| Other comprehensive income (loss) before tax | 4,325 | | | (7,024) | | | (8,138) | |
Income tax benefit (expense) related to items of other comprehensive income (loss) | (1,168) | | | 1,897 | | | 2,197 | |
| Other comprehensive income (loss), net of tax | 3,157 | | | (5,127) | | | (5,941) | |
| Comprehensive income | $ | 567,903 | | | $ | 291,116 | | | $ | 262,834 | |
See accompanying notes.
KB HOME
CONSOLIDATED BALANCE SHEETS
(In Thousands, Except Shares)
| | | | | | | | | | | |
| | November 30, |
| | 2021 | | 2020 |
| Assets | | | |
| Homebuilding: | | | |
| Cash and cash equivalents | $ | 290,764 | | | $ | 681,190 | |
| | | |
| Receivables | 304,191 | | | 272,659 | |
| Inventories | 4,802,829 | | | 3,897,482 | |
| Investments in unconsolidated joint ventures | 36,088 | | | 46,785 | |
| Property and equipment, net | 76,313 | | | 65,547 | |
| Deferred tax assets, net | 177,378 | | | 231,067 | |
| Other assets | 104,153 | | | 125,510 | |
| 5,791,716 | | | 5,320,240 | |
| Financial services | 44,202 | | | 36,202 | |
| Total assets | $ | 5,835,918 | | | $ | 5,356,442 | |
| | | |
| Liabilities and stockholders’ equity | | | |
| Homebuilding: | | | |
| Accounts payable | $ | 371,826 | | | $ | 273,368 | |
| Accrued expenses and other liabilities | 756,905 | | | 667,501 | |
| Notes payable | 1,685,027 | | | 1,747,175 | |
| 2,813,758 | | | 2,688,044 | |
| Financial services | 2,685 | | | 2,629 | |
| Stockholders’ equity: | | | |
Preferred stock — $1.00 par value; 10,000,000 shares authorized; none issued | — | | | — | |
Common stock —$1.00 par value; 290,000,000 shares authorized at November 30, 2021 and 2020; 100,711,153 and 99,868,625 shares issued at November 30, 2021 and 2020, respectively | 100,711 | | | 99,869 | |
| Paid-in capital | 848,620 | | | 824,306 | |
| Retained earnings | 2,379,364 | | | 1,868,896 | |
| Accumulated other comprehensive loss | (19,119) | | | (22,276) | |
Grantor stock ownership trust, at cost: 6,705,247 and 7,124,317 shares at November 30, 2021 and 2020, respectively | (72,718) | | | (77,265) | |
Treasury stock, at cost: 5,785,058 and 1,106,537 shares at November 30, 2021 and 2020, respectively | (217,383) | | | (27,761) | |
| Total stockholders’ equity | 3,019,475 | | | 2,665,769 | |
| Total liabilities and stockholders’ equity | $ | 5,835,918 | | | $ | 5,356,442 | |
See accompanying notes.
KB HOME
CONSOLIDATED STATEMENTS OF STOCKHOLDERS’ EQUITY
(In Thousands)
| | | | | | | | | | | | | | | | | | | | | | | | | | | | | | | | | | | | | | | | | | | | | | | | | | | | | | | | | | | |
| | Years Ended November 30, 2021, 2020 and 2019 |
| | Number of Shares | | Common
Stock | | Paid-in
Capital | | Retained
Earnings | | Accumulated
Other
Comprehensive
Loss | | Grantor
Stock
Ownership
Trust | | Treasury
Stock | | Total
Stockholders’
Equity |
Common
Stock | | Grantor
Stock
Ownership
Trust | | Treasury
Stock | |
| Balance at November 30, 2018 | 119,196 | | | (8,157) | | | (24,113) | | | $ | 119,196 | | | $ | 753,570 | | | $ | 1,897,168 | | | $ | (9,565) | | | $ | (88,472) | | | $ | (584,397) | | | $ | 2,087,500 | |
| Cumulative effect of adoption of ASC 606 | — | | | — | | | — | | | — | | | — | | | 11,610 | | | — | | | — | | | — | | | 11,610 | |
| Net income | — | | | — | | | — | | | — | | | — | | | 268,775 | | | — | | | — | | | — | | | 268,775 | |
| Other comprehensive loss, net of tax | — | | | — | | | — | | | — | | | — | | | — | | | (5,941) | | | — | | | — | | | (5,941) | |
| Dividends on common stock | — | | | — | | | — | | | — | | | — | | | (20,370) | | | — | | | — | | | — | | | (20,370) | |
Employee stock options/other | 2,341 | | | — | | | — | | | 2,341 | | | 28,183 | | | — | | | — | | | — | | | — | | | 30,524 | |
| | | | | | | | | | | | | | | | | | | |
| Stock awards | 56 | | | 526 | | | 27 | | | 56 | | | (6,111) | | | — | | | — | | | 5,714 | | | 341 | | | — | |
| Stock-based compensation | — | | | — | | | — | | | — | | | 18,312 | | | — | | | — | | | — | | | — | | | 18,312 | |
| | | | | | | | | | | | | | | | | | | |
| | | | | | | | | | | | | | | | | | | |
| | | | | | | | | | | | | | | | | | | |
Tax payments associated with stock-based compensation awards | — | | | — | | | (270) | | | — | | | — | | | — | | | — | | | — | | | (7,288) | | | (7,288) | |
| Balance at November 30, 2019 | 121,593 | | | (7,631) | | | (24,356) | | | 121,593 | | | 793,954 | | | 2,157,183 | | | (15,506) | | | (82,758) | | | (591,344) | | | 2,383,122 | |
| Cumulative effect of adoption of ASC 842 | — | | | — | | | — | | | — | | | — | | | 1,510 | | | — | | | — | | | — | | | 1,510 | |
| Reclassification of stranded tax effects | — | | | — | | | — | | | — | | | — | | | 1,643 | | | (1,643) | | | — | | | — | | | — | |
| Net income | — | | | — | | | — | | | — | | | — | | | 296,243 | | | — | | | — | | | — | | | 296,243 | |
| Other comprehensive loss, net of tax | — | | | — | | | — | | | — | | | — | | | — | | | (5,127) | | | — | | | — | | | (5,127) | |
| Dividends on common stock | — | | | — | | | — | | | — | | | — | | | (38,065) | | | — | | | — | | | — | | | (38,065) | |
Employee stock options/other | 1,696 | | | — | | | 17 | | | 1,696 | | | 13,941 | | | — | | | — | | | — | | | 421 | | | 16,058 | |
| | | | | | | | | | | | | | | | | | | |
| Stock awards | 68 | | | 507 | | | (15) | | | 68 | | | (5,120) | | | — | | | — | | | 5,493 | | | (441) | | | — | |
| Stock-based compensation | — | | | — | | | — | | | — | | | 21,531 | | | — | | | — | | | — | | | — | | | 21,531 | |
| | | | | | | | | | | | | | | | | | | |
| | | | | | | | | | | | | | | | | | | |
Tax payments associated with stock-based compensation awards | — | | | — | | | (241) | | | — | | | — | | | — | | | — | | | — | | | (9,503) | | | (9,503) | |
| Retirement of treasury stock | (23,488) | | | — | | | 23,488 | | | (23,488) | | | — | | | (549,618) | | | — | | | — | | | 573,106 | | | — | |
| Balance at November 30, 2020 | 99,869 | | | (7,124) | | | (1,107) | | | 99,869 | | | 824,306 | | | 1,868,896 | | | (22,276) | | | (77,265) | | | (27,761) | | | 2,665,769 | |
| Cumulative effect of adoption of ASU 2016-13 | — | | | — | | | — | | | — | | | — | | | (226) | | | — | | | — | | | — | | | (226) | |
| Net income | — | | | — | | | — | | | — | | | — | | | 564,746 | | | — | | | — | | | — | | | 564,746 | |
| Other comprehensive income, net of tax | — | | | — | | | — | | | — | | | — | | | — | | | 3,157 | | | — | | | — | | | 3,157 | |
| Dividends on common stock | — | | | — | | | — | | | — | | | — | | | (54,052) | | | — | | | — | | | — | | | (54,052) | |
Employee stock options/other | 798 | | | — | | | — | | | 798 | | | 10,891 | | | — | | | — | | | — | | | — | | | 11,689 | |
| Stock awards | 44 | | | 419 | | | 199 | | | 44 | | | (15,481) | | | — | | | — | | | 4,547 | | | 10,890 | | | — | |
| Stock-based compensation | — | | | — | | | — | | | — | | | 28,904 | | | — | | | — | | | — | | | — | | | 28,904 | |
| | | | | | | | | | | | | | | | | | | |
| Stock repurchases | — | | | — | | | (4,669) | | | — | | | — | | | — | | | — | | | — | | | (188,175) | | | (188,175) | |
Tax payments associated with stock-based compensation awards | — | | | — | | | (208) | | | — | | | — | | | — | | | — | | | — | | | (12,337) | | | (12,337) | |
| Balance at November 30, 2021 | 100,711 | | | (6,705) | | | (5,785) | | | $ | 100,711 | | | $ | 848,620 | | | $ | 2,379,364 | | | $ | (19,119) | | | $ | (72,718) | | | $ | (217,383) | | | $ | 3,019,475 | |
See accompanying notes.
KB HOME
CONSOLIDATED STATEMENTS OF CASH FLOWS
(In Thousands)
| | | | | | | | | | | | | | | | | |
| | Years Ended November 30, |
| | 2021 | | 2020 | | 2019 |
| Cash flows from operating activities: | | | | | |
Net income | $ | 564,746 | | | $ | 296,243 | | | $ | 268,775 | |
| Adjustments to reconcile net income to net cash provided by (used in) operating activities: | | | | | |
Equity in income of unconsolidated joint ventures | (23,184) | | | (33,628) | | | (10,681) | |
Distributions of earnings from unconsolidated joint ventures | 18,511 | | | 35,649 | | | 6,450 | |
Amortization of discounts, premiums and issuance costs | 2,852 | | | 2,498 | | | 4,426 | |
Depreciation and amortization | 28,640 | | | 28,396 | | | 27,158 | |
Deferred income taxes | 53,767 | | | 50,304 | | | 73,303 | |
Loss on early extinguishment of debt | 5,075 | | | — | | | 6,800 | |
| | | | | |
Stock-based compensation | 28,904 | | | 21,531 | | | 18,312 | |
Inventory impairments and land option contract abandonments | 11,953 | | | 28,669 | | | 17,291 | |
Changes in assets and liabilities: | | | | | |
Receivables | (32,014) | | | 59,257 | | | 44,428 | |
Inventories | (897,750) | | | (183,233) | | | (165,347) | |
Accounts payable, accrued expenses and other liabilities | 181,625 | | | 4,091 | | | (40,583) | |
Other, net | 19,579 | | | 901 | | | 710 | |
| Net cash provided by (used in) operating activities | (37,296) | | | 310,678 | | | 251,042 | |
| Cash flows from investing activities: | | | | | |
Contributions to unconsolidated joint ventures | (11,523) | | | (10,373) | | | (11,290) | |
Return of investments in unconsolidated joint ventures | 12,838 | | | 12,651 | | | 5,001 | |
Proceeds from sale of building | — | | | — | | | 5,804 | |
Purchases of property and equipment, net | (39,399) | | | (28,841) | | | (40,459) | |
| Net cash used in investing activities | (38,084) | | | (26,563) | | | (40,944) | |
| Cash flows from financing activities: | | | | | |
| | | | | |
Proceeds from issuance of debt | 390,000 | | | — | | | 705,250 | |
Repayment of senior notes | (455,075) | | | — | | | (986,231) | |
Payment of issuance costs | (4,813) | | | — | | | (11,128) | |
Borrowings under revolving credit facility | 340,000 | | | — | | | 610,000 | |
Repayments under revolving credit facility | (340,000) | | | — | | | (610,000) | |
Payments on mortgages and land contracts due to land sellers and other loans | (2,250) | | | (24,934) | | | (41,116) | |
| | | | | |
Issuance of common stock under employee stock plans | 11,689 | | | 16,058 | | | 30,524 | |
| | | | | |
Stock repurchases | (188,175) | | | — | | | — | |
Tax payments associated with stock-based compensation awards | (12,337) | | | (9,503) | | | (7,288) | |
Payments of cash dividends | (54,052) | | | (38,065) | | | (20,370) | |
| Net cash used in financing activities | (315,013) | | | (56,444) | | | (330,359) | |
| Net increase (decrease) in cash and cash equivalents | (390,393) | | | 227,671 | | | (120,261) | |
| Cash and cash equivalents at beginning of year | 682,529 | | | 454,858 | | | 575,119 | |
| Cash and cash equivalents at end of year | $ | 292,136 | | | $ | 682,529 | | | $ | 454,858 | |
See accompanying notes.
KB HOME
NOTES TO CONSOLIDATED FINANCIAL STATEMENTS
Note 1. Summary of Significant Accounting Policies
Operations. KB Home is a builder of attached and detached single-family residential homes, townhomes and condominiums. As of November 30, 2021, we conducted ongoing operations in Arizona, California, Colorado, Florida, Idaho, Nevada, North Carolina, Texas and Washington. We also offer various insurance products to our homebuyers in the same markets as our homebuilding reporting segments, and provide title services in the majority of our markets located within our Southwest, Central and Southeast homebuilding reporting segments. We offer mortgage banking services, including mortgage loan originations, to our homebuyers indirectly through KBHS, which is an unconsolidated joint venture between us and a third party.
Basis of Presentation. Our consolidated financial statements have been prepared in accordance with GAAP and include our accounts and those of the consolidated subsidiaries in which we have a controlling financial interest. All intercompany balances and transactions have been eliminated in consolidation. Investments in unconsolidated joint ventures in which we have less than a controlling financial interest are accounted for using the equity method.
Impact of COVID-19 Pandemic on Consolidated Financial Statements. The COVID-19 pandemic and related governmental control measures considerably disrupted global and national economies, the U.S. housing market, and our business during the 2020 second quarter. Amid extraordinary economic impacts; a sudden rise in unemployment; significant stock market and secondary market volatility; uncertainty about how to effectively contain COVID-19’s spread; weakened consumer confidence; and our swift closing of our sales centers, model homes and design studios to the public, we saw a drastic decrease in demand for new homes (including homes ordered in the 2020 first quarter) and our order pace slowed significantly. Along with a considerable increase in home purchase cancellations, we experienced a sizable reduction in our 2020 second quarter net orders. Further, our construction activities were restricted in many jurisdictions, and completely shut down in some of them, and together with the reduced availability or capacity of some municipal and private services necessary to build and deliver homes, and supply chain disruptions, our cycle times became extended. This caused home delivery delays during most of the 2020 second quarter, which tempered our revenues for the period. With the uncertainty surrounding the COVID-19 pandemic, and in prioritizing cash preservation and liquidity, we limited our land investments and curtailed our overhead expenditures, partly through workforce realignment and reductions. As a result, our selling, general and administrative expenses for the 2020 second quarter included severance charges of $6.7 million.
With the easing to varying degrees of restrictive public health orders in our served markets beginning in May 2020, our net orders began to rebound significantly following a low point in April 2020, as steadily increasing demand drove our 2020 third- and fourth-quarter net orders to then-15-year highs. Though this sharp rise in net orders over these periods substantially expanded the number of homes in our backlog as well as our backlog value, our deliveries and revenues for the 2020 third and fourth quarters were moderated primarily by the negative effects of the COVID-19 pandemic in our 2020 second quarter. In 2021, while the pandemic persisted, demand for our homes remained strong, and our ending backlog value at November 30, 2021 expanded to its highest fourth-quarter level since 2005. With the ongoing strong demand, we continued to increase our land acquisition and development investments in 2021, as we did in the latter part of 2020, to measurably expand our lot pipeline and support future community count growth.
While we continue to experience construction services availability constraints, supply chain disruptions and rising and volatile raw material prices and availability, particularly with respect to building materials and appliances, as well as delays related to state and municipal construction permitting, inspections and utilities, that could negatively impact our growth, margins and financial results in future periods, and there remains a risk that significant COVID-19 pandemic-related disruptions could emerge, we believe we are well-positioned to operate effectively through the present environment.
Use of Estimates. The preparation of financial statements in conformity with GAAP requires management to make estimates and judgments that affect the amounts reported in the consolidated financial statements and accompanying notes. Actual results could differ from those estimates.
Cash and Cash Equivalents. We consider all highly liquid short-term investments purchased with an original maturity of three months or less to be cash equivalents. Our cash equivalents totaled $15.4 million at November 30, 2021 and $508.5 million at November 30, 2020. At November 30, 2021 and 2020, the majority of our cash and cash equivalents was invested in interest-bearing bank deposit accounts.
Receivables. We record receivables net of an allowance for doubtful accounts. This allowance for potential losses is established or maintained for expected uncollectible receivables. The allowance is estimated based on our evaluation of the
receivables, taking into account historical collection experience, general economic conditions, specific credit risk of the counterparties and other relevant information.
Property and Equipment and Depreciation. Property and equipment are recorded at cost and are depreciated using the straight-line method over their estimated useful lives as follows: computer software and equipment – two to 15 years; model furnishings and sales office improvements – two to three years; office furniture and equipment – three to 10 years; and leasehold improvements – life of the lease. Repair and maintenance costs are expensed as incurred. Depreciation expense totaled $28.6 million in 2021, $28.4 million in 2020 and $27.2 million in 2019.
Homebuilding Operations. We recognize homebuilding revenue by applying the following steps in determining the timing and amount of revenue to recognize: (1) identify the contract(s) with a customer; (2) identify the performance obligations in the contract; (3) determine the transaction price; (4) allocate the transaction price to the performance obligations in the contract, if applicable; and (5) recognize revenue when (or as) we satisfy a performance obligation.
Our home sale transactions are made pursuant to contracts under which we typically have a single performance obligation to deliver a completed home to the homebuyer when closing conditions are met. Revenues from home sales are recognized when we have satisfied the performance obligation within the sales contract, which is generally when title to and possession of the home and the risks and rewards of ownership are transferred to the homebuyer on the closing date. Under our home sale contracts, we typically receive an initial cash deposit from the homebuyer at the time the sales contract is executed and receive the remaining consideration to which we are entitled, through a third-party escrow agent, at closing. Customer deposits related to sold but undelivered homes are included in accrued expenses and other liabilities.
Concurrent with the recognition of revenues in our consolidated statements of operations, sales incentives in the form of price concessions on the selling price of a home are recorded as a reduction of revenues. The costs of sales incentives in the form of free or discounted products or services provided to homebuyers, including option upgrades and closing cost allowances, are reflected as construction and land costs because such incentives are identified in our home sale contracts with homebuyers as an intrinsic part of our single performance obligation to deliver and transfer title to their home for the transaction price stated in the contracts. Sales incentives that we may provide in the form of closing cost allowances are immaterial to the related revenues. Cash proceeds from home sale closings held by third-party escrow agents for our benefit, typically for less than five days, are considered deposits in-transit and classified as cash.
Land sale transactions are made pursuant to contracts under which we typically have a performance obligation(s) to deliver specified land parcels to the buyer when closing conditions are met. We evaluate each land sale contract to determine our performance obligation(s) under the contract, including whether we have a distinct promise to perform post-closing land development work that is material within the context of the contract, and use objective criteria to determine our completion of the applicable performance obligation(s), whether at a point in time or over time. Revenues from land sales are recognized when we have satisfied the performance obligation(s) within the sales contract, which is generally when title to and possession of the land and the risks and rewards of ownership are transferred to the land buyer on the closing date. Under our land sale contracts, we typically receive an initial cash deposit from the buyer at the time the contract is executed and receive the remaining consideration to which we are entitled, through a third-party escrow agent, at closing. In the limited circumstances where we provide financing to the land buyer, we determine that collectability of the receivable is reasonably assured before we recognize revenue.
In instances where we have a distinct and material performance obligation(s) within the context of a land sale contract to perform land development work after the closing date, a portion of the transaction price under the contract is allocated to such performance obligation(s) and is recognized as revenue over time based upon our estimated progress toward the satisfaction of the performance obligation(s). We generally measure our progress based on our costs incurred relative to the total costs expected to satisfy the performance obligation(s). While the payment terms for such a performance obligation(s) vary, we generally receive the final payment when we have completed our land development work to the specifications detailed in the applicable land sale contract and it has been accepted by the land buyer.
Homebuilding revenues include forfeited deposits, which occur when home sale or land sale contracts that include a nonrefundable deposit are cancelled. Revenues from forfeited deposits are immaterial.
Within our homebuilding operations, substantially all of our contracts with customers and the related performance obligations have an original expected duration of one year or less.
Construction and land costs are comprised of direct and allocated costs, including estimated future costs for the limited warranty we provide on our homes, and certain amenities within a community. Land acquisition, land development and other common costs are generally allocated on a relative fair value basis to the homes or lots within the applicable community or land parcel. Land acquisition and land development costs include related interest and real estate taxes.
Disaggregation of Revenues. Our homebuilding operations accounted for 99.7% and 99.6% of our total revenues for the years ended November 30, 2021 and 2020, with most of those revenues generated from home sale contracts with customers. Due to the nature of our revenue-generating activities, we believe the disaggregation of revenues as reported in our consolidated statement of operations, and as disclosed by homebuilding reporting segment in Note 2 – Segment Information and for our financial services reporting segment in Note 3 – Financial Services, fairly depicts how the nature, amount, timing and uncertainty of cash flows are affected by economic factors.
Inventories. Housing and land inventories are stated at cost, unless the carrying value is determined not to be recoverable, in which case the affected inventories are written down to fair value or fair value less associated costs to sell. Real estate assets, such as our housing and land inventories, are tested for recoverability whenever events or changes in circumstances indicate that their carrying value may not be recoverable. Recoverability is measured by comparing the carrying value of an asset to the undiscounted future net cash flows expected to be generated by the asset. These impairment evaluations are significantly impacted by estimates for the amounts and timing of future revenues, costs and expenses, and other factors. If the carrying value of a real estate asset is determined not to be recoverable, the impairment charge to be recognized is measured by the amount by which the carrying value of the affected asset exceeds its estimated fair value. For land held for sale, if the fair value less associated costs to sell exceeds the asset’s carrying value, no impairment charge is recognized.
Capitalized Interest. Interest is capitalized to inventories while the related communities or land parcels are being actively developed and until homes are completed or the land is available for immediate sale. Capitalized interest is amortized to construction and land costs as the related inventories are delivered to homebuyers or land buyers (as applicable). In the case of land held for future development and land held for sale, applicable interest is expensed as incurred.
Fair Value Measurements. Fair value measurements are used for inventories on a nonrecurring basis when events and circumstances indicate that their carrying value is not recoverable. For these real estate assets, fair value is determined based on the estimated future net cash flows discounted for inherent risk associated with each such asset, or other valuation techniques.
Our financial instruments consist of cash and cash equivalents, senior notes, and mortgages and land contracts due to land sellers and other loans. Fair value measurements of financial instruments are determined by various market data and other valuation techniques as appropriate. When available, we use quoted market prices in active markets to determine fair value.
Financial Services Operations. Our financial services reporting segment, which includes the operations of KB HOME Mortgage Company, generates revenues primarily from insurance commissions and title services. Revenues from title services are recognized when policies are issued, which generally occurs at the time each applicable home sale is closed. We receive commissions from various third-party insurance carriers for arranging for the carriers to provide homeowner and other insurance policies for our homebuyers that elect to obtain such coverage. In addition, each time a homebuyer renews their insurance policy with the insurance carrier, we receive a renewal commission. Revenues from insurance commissions are recognized when the insurance carrier issues an initial insurance policy to our homebuyer, which generally occurs at the time each applicable home sale is closed. As our performance obligations for policy renewal commissions are satisfied upon issuance of the initial insurance policy, insurance commissions for renewals are considered variable consideration. Accordingly, we estimate the probable future renewal commissions when an initial policy is issued and record a corresponding contract asset and insurance commission revenues. We estimate the amount of variable consideration based on historical renewal trends and constrain the estimate such that it is probable that a significant reversal of cumulative recognized revenue will not occur. We also consider the likelihood and magnitude of a potential future reversal of revenue and update our assessment at the end of each reporting period. The contract assets for estimated future renewal commissions are included in other assets within our financial services reporting segment.
Warranty Costs. We provide a limited warranty on all of our homes. We estimate the costs that may be incurred under each limited warranty and record a liability in the amount of such costs at the time the revenue associated with the sale of each home is recognized. Our primary assumption in estimating the amounts we accrue for warranty costs is that historical claims experience is a strong indicator of future claims experience. Factors that affect our warranty liability include the number of homes delivered, historical and anticipated rates of warranty claims, and cost per claim. We periodically assess the adequacy of our accrued warranty liability and adjust the amount as necessary based on our assessment. Our warranty liability is presented on a gross basis for all years without consideration of recoveries and amounts we have paid on behalf of and expect to recover from other parties, if any. Estimates of recoveries and amounts we have paid on behalf of and expect to recover from other parties, if any, are recorded as receivables when such recoveries are considered probable.
Self-Insurance. We self-insure a portion of our overall risk through the use of a captive insurance subsidiary. We record liabilities based on the estimated costs required to cover reported claims, claims incurred but not yet reported, and claim adjustment expenses. These estimated costs are based on an actuarial analysis of our historical claims and expense data, as well as industry data. Our self-insurance liability is presented on a gross basis for all years without consideration of
insurance recoveries and amounts we have paid on behalf of and expect to recover from other parties, if any. Estimates of insurance recoveries and amounts we have paid on behalf of and expect to recover from other parties, if any, are recorded as receivables when such recoveries are considered probable.
Community Sales Office and Other Marketing- and Model Home-Related Costs. Community sales office and other marketing- and model home-related costs are either recorded as inventories, capitalized as property and equipment, or expensed to selling, general and administrative expenses as incurred. Costs related to the construction of a model home, inclusive of upgrades that will be sold as part of the home, are recorded as inventories and recognized as construction and land costs when the model home is delivered to a homebuyer. Costs to furnish and ready a model home or on-site community sales facility that will not be sold as part of the model home, such as costs for model furnishings, community sales office and model complex grounds, sales office construction and sales office furniture and equipment, are capitalized as property and equipment under “model furnishings and sales office improvements.” Model furnishings and sales office improvements are depreciated to selling, general and administrative expenses over their estimated useful lives. Other costs related to the marketing of a community, removing the on-site community sales facility and readying a completed (model) home for sale are expensed to selling, general and administrative expenses as incurred.
Advertising Costs. We expense advertising costs as incurred. We incurred advertising costs of $28.0 million in 2021, $29.3 million in 2020 and $43.6 million in 2019.
Legal Fees. Legal fees associated with litigation and similar proceedings that are not expected to provide a benefit in future periods are generally expensed as incurred. Legal fees associated with land acquisition and development and other activities that are expected to provide a benefit in future periods are capitalized to inventories in our consolidated balance sheets as incurred. We expensed legal fees of $11.5 million in 2021, $11.6 million in 2020 and $16.7 million in 2019.
Stock-Based Compensation. We measure and recognize compensation expense associated with our grant of equity-based awards at an amount equal to the fair value of share-based payments granted under compensation arrangements over the vesting period. We estimate the fair value of stock options and Director Plan SARs granted using the Black-Scholes option-pricing model with assumptions based primarily on historical data. We estimate the fair value of other equity-based awards using the closing price of our common stock on the grant date. For PSUs, we recognize compensation expense ratably over the vesting period when it is probable that stated performance targets will be achieved and record cumulative adjustments in the period in which estimates change. We account for forfeitures of equity-based awards as they occur.
Income Taxes. The provision for, or benefit from, income taxes is calculated using the asset and liability method, under which deferred tax assets and liabilities are recorded based on the difference between the financial statement and tax basis of assets and liabilities using enacted tax rates in effect for the year in which the differences are expected to reverse. Deferred tax assets are evaluated on a quarterly basis to determine if adjustments to the valuation allowance are required. This evaluation is based on the consideration of all available positive and negative evidence using a “more likely than not” standard with respect to whether deferred tax assets will be realized. The ultimate realization of our deferred tax assets depends primarily on our ability to generate future taxable income during the periods in which the related deferred tax assets become deductible. The value of deferred tax assets in our consolidated balance sheets depends on applicable income tax rates.
Accumulated Other Comprehensive Loss. The accumulated balances of other comprehensive loss in the consolidated balance sheets as of November 30, 2021 and 2020 were comprised solely of adjustments recorded directly to accumulated other comprehensive loss related to our benefit plan obligations. Such adjustments are made annually as of November 30, when our benefit plan obligations are remeasured.
Earnings Per Share. We compute earnings per share using the two-class method, which is an allocation of earnings between the holders of common stock and a company’s participating security holders. Our outstanding nonvested shares of restricted stock contain non-forfeitable rights to dividends and, therefore, are considered participating securities for purposes of computing earnings per share pursuant to the two-class method. We had no other participating securities at November 30, 2021, 2020 or 2019.
Adoption of New Accounting Pronouncements. In May 2014, the Financial Accounting Standards Board (“FASB”) issued Accounting Standards Update No. 2014-09, “Revenue from Contracts with Customers (Topic 606)” (“ASU 2014-09”), which supersedes the revenue guidance in Accounting Standards Codification Topic 605, “Revenue Recognition,” and most industry-specific revenue and cost guidance in the accounting standards codification, including some cost guidance related to construction-type and production-type contracts. ASU 2014-09 and its related amendments collectively resulted in ASC 606. The core principle of ASC 606 is that an entity should recognize revenue to depict the transfer of promised goods or services to customers in an amount that reflects the consideration to which the entity expects to be entitled in exchange for those goods or services. On December 1, 2018, we adopted ASC 606, using the modified retrospective method applied to contracts that were
not completed as of the adoption date. Upon the adoption of ASC 606, we recorded a cumulative effect adjustment to increase beginning retained earnings by $11.6 million, net of tax, as of December 1, 2018.
Within our homebuilding operations, ASC 606 impacted the classification and timing of recognition in our consolidated financial statements of certain community sales office and other marketing- and model home-related costs, which we previously capitalized to inventories and amortized through construction and land costs with each home delivered in a community. With our adoption of ASC 606, these costs are capitalized to property and equipment and depreciated to selling, general and administrative expenses, or expensed to selling, general and administrative expenses as incurred. Upon adopting ASC 606, we reclassified these community sales office and other marketing- and model home-related costs and related accumulated amortization from inventories to either property and equipment, net or retained earnings in our consolidated balance sheet. As a result of the change in the classification of certain community sales office and other marketing- and model home-related costs from inventories to property and equipment, net, these costs are presented as a cash outflow from investing activities in our consolidated statements of cash flows under ASC 606. Previously, such costs were classified as a cash outflow from operating activities. Forfeited deposits related to cancelled home sale and land sale contracts, which were previously reflected as other income within selling, general and administrative expenses, are included in homebuilding revenues under ASC 606.
Within our financial services operations, ASC 606 impacted the timing of recognition in our consolidated financial statements of insurance commissions for insurance policy renewals. We previously recognized such insurance commissions as revenue when policies were renewed. With our adoption of ASC 606, insurance commissions for future policy renewals are estimated and recognized as revenue when the insurance carrier issues an initial insurance policy to our homebuyer, which generally occurs at the time each applicable home sale is closed. Upon adopting ASC 606, we recognized contract assets for the estimated future renewal commissions related to existing insurance policies as of December 1, 2018.
In February 2016, the FASB issued Accounting Standards Update No. 2016-02, “Leases (Topic 842)” (“ASU 2016-02”), which requires leases with original lease terms of more than 12 months to be recorded on the balance sheet. On December 1, 2019, we adopted ASU 2016-02 and its related amendments (collectively, “ASC 842”) using the modified retrospective method. Results for reporting periods beginning December 1, 2019 and after are presented under ASC 842, while results for prior reporting periods have not been adjusted and continue to be presented under the accounting guidance in effect for those periods. We elected the package of practical expedients permitted under the transition guidance, which allowed us to carry forward our original assessment of (1) whether contracts are or contain leases, (2) lease classification and (3) initial direct costs. We also elected the practical expedient that allows lessees the option to account for lease and non-lease components together as a single component for all classes of underlying assets. The adoption of ASC 842 resulted in our recording lease right-of-use assets and lease liabilities of $31.2 million on our consolidated balance sheet as of December 1, 2019. Lease right-of-use assets are classified within other assets on our consolidated balance sheet, and lease liabilities are classified within accrued expenses and other liabilities. At the December 1, 2019 adoption date, we also recorded a cumulative effect adjustment to increase beginning retained earnings by $1.5 million, net of tax, to recognize a previously deferred gain on our sale and leaseback of an office building in 2019. The adoption of ASC 842 did not materially impact our consolidated statements of operations or consolidated cash flows. Further information regarding our leases is provided in Note 13 – Leases.
In February 2018, the FASB issued Accounting Standards Update No. 2018-02, “Income Statement — Reporting Comprehensive Income (Topic 220): Reclassification of Certain Tax Effects from Accumulated Other Comprehensive Income” (“ASU 2018-02”), which allows a reclassification from accumulated other comprehensive income (loss) to retained earnings for stranded tax effects resulting from the 2019 Tax Cuts and Jobs Act (“TCJA”), and requires certain disclosures about stranded tax effects. We adopted ASU 2018-02 effective December 1, 2019 and elected to reclassify the income tax effects of the TCJA from accumulated other comprehensive loss to retained earnings, which resulted in an increase of $1.6 million to both retained earnings and accumulated other comprehensive loss, with no impact on total stockholders’ equity. Amounts for prior reporting periods have not been adjusted and continue to be presented under the accounting guidance in effect for those periods.
In June 2016, the FASB issued Accounting Standards Update No. 2016-13, “Financial Instruments — Credit Losses (Topic 326): Measurement of Credit Losses on Financial Instruments” (“ASU 2016-13”), which changes the impairment model for most financial assets and certain other instruments from an incurred loss approach to a new expected credit loss methodology. On December 1, 2020, we adopted ASU 2016-13 using the modified retrospective method and recorded a cumulative effect adjustment to decrease beginning retained earnings by $.2 million, net of tax, to establish an allowance for credit losses for certain receivables on our consolidated balance sheet. The adoption of ASU 2016-13 did not materially impact our consolidated statements of operations or cash flows.
Recent Accounting Pronouncements Not Yet Adopted. In December 2019, the FASB issued Accounting Standards Update No. 2019-12, “Income Taxes (Topic 740): Simplifying the Accounting for Income Taxes” (“ASU 2019-12”), which simplifies the accounting for income taxes, eliminates certain exceptions within Accounting Standards Codification Topic 740, “Income
Taxes” (“ASC 740”), and clarifies certain aspects of ASC 740 to promote consistency among reporting entities. ASU 2019-12 is effective for us beginning December 1, 2021. Most amendments within ASU 2019-12 are required to be applied on a prospective basis, while certain amendments must be applied on a retrospective or modified retrospective basis. We do not expect the adoption of ASU 2019-12 to have a material impact on our consolidated financial statements.
In March 2020, the FASB issued Accounting Standards Update No. 2020-04, “Reference Rate Reform (Topic 848): Facilitation of the Effects of Reference Rate Reform on Financial Reporting” (“ASU 2020-04”), which provides optional expedients and exceptions for applying GAAP to contracts, hedging relationships and other transactions affected by the discontinuation of the London Interbank Offered Rate (“LIBOR”) or by another reference rate expected to be discontinued because of reference rate reform. The guidance was effective beginning March 12, 2020 and can be applied prospectively through December 31, 2022. In January 2021, the FASB issued Accounting Standards Update 2021-01, “Reference Rate Reform (Topic 848): Scope” (“ASU 2021-01”), which clarified the scope and application of the original guidance. We plan to adopt ASU 2020-04 and ASU 2021-01 when LIBOR is discontinued. We are currently evaluating the potential impact of adopting this guidance, but do not expect it to have a material impact on our consolidated financial statements.
Reclassifications. Certain amounts in our consolidated financial statements of prior years have been reclassified to conform to the current period presentation.
Note 2. Segment Information
An operating segment is defined as a component of an enterprise for which separate financial information is available and for which segment results are evaluated regularly by the chief operating decision maker in deciding how to allocate resources and in assessing performance. We have identified each of our homebuilding divisions as an operating segment. Our homebuilding operating segments have been aggregated into four homebuilding reporting segments based primarily on similarities in economic and geographic characteristics, product types, regulatory environments, methods used to sell and construct homes and land acquisition characteristics. We also have one financial services reporting segment. Management evaluates segment performance primarily based on segment pretax results.
As of November 30, 2021, our homebuilding reporting segments conducted ongoing operations in the following states:
| | | | | |
| West Coast: | California, Idaho and Washington |
| Southwest: | Arizona and Nevada |
| Central: | Colorado and Texas |
| Southeast: | Florida and North Carolina |
Our homebuilding reporting segments are engaged in the acquisition and development of land primarily for residential purposes and offer a wide variety of homes that are designed to appeal to first-time, first move-up and active adult homebuyers. Our homebuilding operations generate most of their revenues from the delivery of completed homes to homebuyers. They also earn revenues from the sale of land.
Our financial services reporting segment offers property and casualty insurance and, in certain instances, earthquake, flood and personal property insurance to our homebuyers in the same markets as our homebuilding reporting segments, and provides title services in the majority of our markets located within our Southwest, Central and Southeast homebuilding reporting segments. Our financial services segment earns revenues primarily from insurance commissions and from the provision of title services.
We offer mortgage banking services, including mortgage loan originations, to our homebuyers indirectly through KBHS, an unconsolidated joint venture we initially formed with Stearns, with each party having a 50.0% ownership interest and Stearns providing management oversight of KBHS’ operations. On March 1, 2021, Guaranteed Rate acquired the parent company of Stearns. In October 2021, Stearns was renamed as GR Alliance. We are not aware of any significant changes with respect to GR Alliance or its operations as a result of the transaction being completed. The financial services reporting segment is separately reported in our consolidated financial statements.
Corporate and other is a non-operating segment that develops and oversees the implementation of company-wide strategic initiatives and provides support to our reporting segments by centralizing certain administrative functions. Corporate management is responsible for, among other things, evaluating and selecting the geographic markets in which we operate, consistent with our overall business strategy; allocating capital resources to markets for land acquisition and development activities; making major personnel decisions related to employee compensation and benefits; and monitoring the financial and operational performance of our divisions. Corporate and other includes general and administrative expenses related to
operating our corporate headquarters. A portion of the expenses incurred by Corporate and other is allocated to our homebuilding reporting segments.
Our reporting segments follow the same accounting policies used for our consolidated financial statements as described in Note 1 – Summary of Significant Accounting Policies. The results of each reporting segment are not necessarily indicative of the results that would have occurred had the segment been an independent, stand-alone entity during the periods presented, nor are they indicative of the results to be expected in future periods.
The following tables present financial information relating to our homebuilding reporting segments (in thousands):
| | | | | | | | | | | | | | | | | |
| | Years Ended November 30, |
| | 2021 | | 2020 | | 2019 |
| Revenues: | | | | | |
| West Coast | $ | 2,552,382 | | | $ | 1,748,582 | | | $ | 1,912,146 | |
| Southwest | 965,139 | | | 796,810 | | | 764,816 | |
| Central | 1,503,857 | | | 1,192,869 | | | 1,267,892 | |
| Southeast | 683,651 | | | 429,441 | | | 592,804 | |
Total | $ | 5,705,029 | | | $ | 4,167,702 | | | $ | 4,537,658 | |
| | | | | | | | | | | | | | | | | |
| |
| | | | | |
| Pretax income (loss): | | | | | |
| West Coast | $ | 345,714 | | | $ | 151,039 | | | $ | 178,078 | |
| Southwest | 186,351 | | | 133,386 | | | 111,016 | |
| Central | 200,159 | | | 128,802 | | | 126,304 | |
| Southeast | 77,663 | | | 22,950 | | | 18,550 | |
| Corporate and other | (152,976) | | | (104,677) | | | (108,759) | |
| Total | $ | 656,911 | | | $ | 331,500 | | | $ | 325,189 | |
| | | | | |
| |
| | | | | |
| Equity in income (loss) of unconsolidated joint ventures: | | | | | |
| West Coast | $ | 62 | | | $ | 12,972 | | | $ | (851) | |
| Southwest | (466) | | | (497) | | | (697) | |
| Central | — | | | — | | | — | |
| Southeast | (1) | | | (1) | | | (1) | |
| Total | $ | (405) | | | $ | 12,474 | | | $ | (1,549) | |
| | | | | |
| |
| | | | | |
| Inventory impairment and land option contract abandonment charges: | | | | | |
| West Coast | $ | 11,046 | | | $ | 21,941 | | | $ | 15,567 | |
| Southwest | 536 | | | 570 | | | 408 | |
| Central | 131 | | | 5,520 | | | 848 | |
| Southeast | 240 | | | 638 | | | 468 | |
| Total | $ | 11,953 | | | $ | 28,669 | | | $ | 17,291 | |
| | | | | |
| | | | | | | | | | | |
| | November 30, |
| | 2021 | | 2020 |
| Inventories: | | | |
| West Coast | $ | 2,300,096 | | | $ | 1,928,500 | |
| Southwest | 875,438 | | | 688,807 | |
| Central | 995,811 | | | 867,170 | |
| Southeast | 631,484 | | | 413,005 | |
| Total | $ | 4,802,829 | | | $ | 3,897,482 | |
| | | |
| | | | | | | | | | | |
| | November 30, |
| | 2021 | | 2020 |
| Investments in unconsolidated joint ventures: | | | |
| West Coast | $ | 33,576 | | | $ | 42,762 | |
| Southwest | — | | | 1,516 | |
| Central | — | | | — | |
| Southeast | 2,512 | | | 2,507 | |
| Total | $ | 36,088 | | | $ | 46,785 | |
| | | |
| Assets: | | | |
| West Coast | $ | 2,520,374 | | | $ | 2,057,362 | |
| Southwest | 938,300 | | | 738,765 | |
| Central | 1,168,242 | | | 998,612 | |
| Southeast | 684,752 | | | 448,388 | |
| Corporate and other | 480,048 | | | 1,077,113 | |
| Total | $ | 5,791,716 | | | $ | 5,320,240 | |
Note 3. Financial Services
The following tables present financial information relating to our financial services reporting segment (in thousands):
| | | | | | | | | | | | | | | | | |
| | Years Ended November 30, |
| | 2021 | | 2020 | | 2019 |
| Revenues | | | | | |
| Insurance commissions | $ | 10,486 | | | $ | 8,589 | | | $ | 8,662 | |
| Title services | 9,415 | | | 6,883 | | | 6,421 | |
| Interest income | — | | | — | | | 6 | |
| Total | 19,901 | | | 15,472 | | | 15,089 | |
| Expenses | | | | | |
| General and administrative | (5,055) | | | (4,083) | | | (4,333) | |
| Operating income | 14,846 | | | 11,389 | | | 10,756 | |
| Equity in income of unconsolidated joint ventures | 23,589 | | | 21,154 | | | 12,230 | |
| Pretax income | $ | 38,435 | | | $ | 32,543 | | | $ | 22,986 | |
| | | | | | | | | | | |
| | November 30, |
| | 2021 | | 2020 |
| Assets | | | |
| Cash and cash equivalents | $ | 1,372 | | | $ | 1,339 | |
| Receivables | 2,166 | | | 1,988 | |
| Investments in unconsolidated joint ventures | 16,317 | | | 10,978 | |
| Other assets (a) | 24,347 | | | 21,897 | |
| Total assets | $ | 44,202 | | | $ | 36,202 | |
| Liabilities | | | |
| Accounts payable and accrued expenses | $ | 2,685 | | | $ | 2,629 | |
| Total liabilities | $ | 2,685 | | | $ | 2,629 | |
(a)Other assets at November 30, 2021 and 2020 included $24.1 million and $21.5 million, respectively, of contract assets for estimated future renewal commissions.
Note 4. Earnings Per Share
Basic and diluted earnings per share were calculated as follows (in thousands, except per share amounts):
| | | | | | | | | | | | | | | | | |
| | Years Ended November 30, |
| | 2021 | | 2020 | | 2019 |
| Numerator: | | | | | |
Net income | $ | 564,746 | | | $ | 296,243 | | | $ | 268,775 | |
Less: Distributed earnings allocated to nonvested restricted stock | (253) | | | (197) | | | (123) | |
Less: Undistributed earnings allocated to nonvested restricted stock | (2,366) | | | (1,329) | | | (1,505) | |
Numerator for basic earnings per share | 562,127 | | | 294,717 | | | 267,147 | |
Effect of dilutive securities: | | | | | |
Interest expense and amortization of debt issuance costs associated with convertible senior notes, net of taxes | — | | | — | | | 541 | |
Add: Undistributed earnings allocated to nonvested restricted stock | 2,366 | | | 1,329 | | | 1,505 | |
Less: Undistributed earnings reallocated to nonvested restricted stock | (2,286) | | | (1,278) | | | (1,412) | |
Numerator for diluted earnings per share | $ | 562,207 | | | $ | 294,768 | | | $ | 267,781 | |
| | | | | |
| Denominator: | | | | | |
Weighted average shares outstanding — basic | 90,401 | | | 90,464 | | | 87,996 | |
Effect of dilutive securities: | | | | | |
Share-based payments | 3,186 | | | 3,622 | | | 4,415 | |
Convertible senior notes | — | | | — | | | 1,427 | |
Weighted average shares outstanding — diluted | 93,587 | | | 94,086 | | | 93,838 | |
| Basic earnings per share | $ | 6.22 | | | $ | 3.26 | | | $ | 3.04 | |
| Diluted earnings per share | $ | 6.01 | | | $ | 3.13 | | | $ | 2.85 | |
In 2021 and 2020, no outstanding stock options were excluded from the diluted earnings per share calculation. In 2019, outstanding stock options to purchase a nominal amount of common stock were excluded from the diluted earnings per share calculation because the effect of their inclusion would be antidilutive. The diluted earnings per share calculation for the year ended November 30, 2019 included the dilutive effect of our 1.375% convertible senior notes due 2019 based on the number of days they were outstanding during the period. We repaid those notes at their February 1, 2019 maturity.
Contingently issuable shares associated with outstanding PSUs were not included in the basic earnings per share calculations for the periods presented, as the applicable vesting conditions had not been satisfied.
Note 5. Receivables
Receivables consisted of the following (in thousands):
| | | | | | | | | | | |
| | November 30, |
| | 2021 | | 2020 |
| Due from utility companies, improvement districts and municipalities (a) | $ | 151,284 | | | $ | 105,700 | |
| Recoveries related to self-insurance and other legal claims | 95,063 | | | 82,018 | |
| Refundable deposits and bonds | 13,681 | | | 10,897 | |
| | | |
| Income taxes receivable | — | | | 41,323 | |
| Other | 49,359 | | | 40,020 | |
| Subtotal | 309,387 | | | 279,958 | |
| Allowance for doubtful accounts | (5,196) | | | (7,299) | |
| Total | $ | 304,191 | | | $ | 272,659 | |
(a)These receivables typically relate to infrastructure improvements we make with respect to our communities. We are generally reimbursed for the cost of such improvements when they are accepted by the utility company, improvement district or municipality, or after certain events occur, depending on the terms of the applicable agreements. These events may include, but are not limited to, the connection of utilities or the issuance of bonds by the respective improvement districts or municipalities.
Note 6. Inventories
Inventories consisted of the following (in thousands):
| | | | | | | | | | | |
| | November 30, |
| | 2021 | | 2020 |
| Homes completed or under construction | $ | 2,103,038 | | | $ | 1,437,911 | |
| Land under development | 2,699,791 | | | 2,459,571 | |
| | | |
| Total | $ | 4,802,829 | | | $ | 3,897,482 | |
Homes completed or under construction is comprised of costs associated with homes completed or in various stages of construction and includes direct construction and related land acquisition and land development costs. Land under development primarily consists of land acquisition and land development costs. Land development costs include capitalized interest and real estate taxes. When home construction begins, the associated land acquisition and land development costs are included in homes under construction.
Land under development at November 30, 2021 and 2020 included land held for future development of $44.6 million and $74.0 million, respectively. Land held for future development principally relates to land where development activity has been suspended or has not yet begun but is expected to occur in the future. These assets are generally located in submarkets where conditions do not presently support further investment or development, or are subject to a building permit moratorium or regulatory restrictions, or are portions of larger land parcels that we plan to build out over several years and/or that have not yet been entitled. At November 30, 2021 and 2020, land under development also included land held for sale of $.6 million and $1.3 million, respectively.
Our interest costs were as follows (in thousands):
| | | | | | | | | | | | | | | | | |
| | Years Ended November 30, |
| | 2021 | | 2020 | | 2019 |
| Capitalized interest at beginning of year | $ | 190,113 | | | $ | 195,738 | | | $ | 209,129 | |
| Interest incurred | 120,514 | | | 124,147 | | | 143,412 | |
| | | | | |
| Interest amortized to construction and land costs (a) | (149,508) | | | (129,772) | | | (156,803) | |
| Capitalized interest at end of year | $ | 161,119 | | | $ | 190,113 | | | $ | 195,738 | |
(a)Interest amortized to construction and land costs for the years ended November 30, 2021, 2020 and 2019 included $.2 million, $.4 million and $.7 million, respectively, related to land sales during the periods.
Note 7. Inventory Impairments and Land Option Contract Abandonments
Each community or land parcel in our owned inventory is assessed to determine if indicators of potential impairment exist. Impairment indicators are assessed separately for each community or land parcel on a quarterly basis and include, but are not limited to, the following: significant decreases in net orders, average selling prices, volume of homes delivered, gross profit margins on homes delivered or projected gross profit margins on homes in backlog or future deliveries; significant increases in budgeted land development and home construction costs or cancellation rates; or projected losses on expected future land sales. If indicators of potential impairment exist for a community or land parcel, the identified asset is evaluated for recoverability. We evaluated one, 11 and 21 communities or land parcels for recoverability as of November 30, 2021, 2020 and 2019, respectively. The carrying values of those communities or land parcels evaluated as of November 30, 2021, 2020 and 2019 were $29.9 million, $123.4 million and $207.7 million, respectively. The higher number and corresponding carrying value of communities or land parcels evaluated as of November 30, 2020 and 2019 reflected the then-current conditions and trends in the markets where the communities are located, as well as certain communities or land parcels previously held for future development that were reactivated as part of our efforts to improve our asset efficiency. In addition, we evaluated land held for future development for recoverability as of November 30, 2021, 2020 and 2019. Inventory impairment charges are included in construction and land costs in our consolidated statements of operations.
When an indicator of potential impairment is identified for a community or land parcel, we test the asset for recoverability by comparing the carrying value of the asset to the undiscounted future net cash flows expected to be generated by the asset. The undiscounted future net cash flows are impacted by then-current conditions and trends in the market in which the asset is located as well as factors known to us at the time the cash flows are calculated. These factors may include recent trends in our orders, backlog, cancellation rates and volume of homes delivered, as well as our expectations related to the following: product offerings; market supply and demand, including estimated average selling prices and related price appreciation; and land development, home construction and overhead costs to be incurred and related cost inflation. With respect to the year ended November 30, 2021, these expectations considered the year-over-year increases in our overall average net orders per community, backlog levels, homes delivered and housing gross profit margin during the period as well as our experience that conditions in the markets where assessed assets were located were relatively stable or improved, with no significant deterioration identified or projected, as to revenue or cost drivers that would prevent or otherwise impact recoverability. Our inventory is assessed for potential impairment on a quarterly basis, and the assumptions used are reviewed and adjusted, as necessary, to reflect the market conditions and trends and our expectations at the time each assessment is performed.
With respect to the year ended November 30, 2020, our expectations considered that our net orders, ending backlog and cancellation rates for the 2020 third and fourth quarters improved from both the corresponding year-earlier quarters as well as the 2020 second quarter, when the early stages of the COVID-19 pandemic and related COVID-19 control responses in our served markets caused a significant contraction in economic activity and adversely affected our ability to conduct normal operations, as described in Note 1 – Summary of Significant Accounting Policies. Our impairment assessments also considered that while the number of homes delivered in the 2020 third and fourth quarters decreased from the corresponding year-earlier quarters, reflecting the negative COVID-19-related impacts earlier in the year, the average selling price of those homes increased and our housing gross profit margins improved significantly over the same periods. Moreover, the average selling price of our net orders generated during the 2020 third and fourth quarters increased from the corresponding year-earlier periods. Taken together, and notwithstanding the significant disruptions associated with the COVID-19 pandemic during the 2020 second quarter, our inventory assessments as of November 30, 2020 determined that market conditions for each of our assets in inventory where impairment indicators were identified were expected to be sufficiently stable, with a solid net order pace and a steady average selling price, to support such assets’ recoverability.
Given the inherent challenges and uncertainties in forecasting future results, our inventory assessments at the time they are made take into consideration whether a community or land parcel is active, meaning whether it is open for sales and/or undergoing development, or whether it is being held for future development or held for sale. Due to the short-term nature of active communities and land held for sale, as compared to land held for future development, our inventory assessments generally assume the continuation of then-current market conditions, subject to identifying information suggesting significant sustained changes in such conditions. Our assessments of active communities, at the time made, generally anticipate net orders, average selling prices, volume of homes delivered and costs for land development and home construction to continue at or near then-current levels through the particular asset’s estimated remaining life. Inventory assessments for our land held for future development consider then-current market conditions as well as subjective forecasts regarding the timing and costs of land development and home construction and related cost inflation; the product(s) to be offered; and the net orders, volume of homes delivered, and selling prices and related price appreciation of the offered product(s) when an associated community is anticipated to open for sales. We evaluate various factors to develop these forecasts, including the availability of and demand for homes and finished lots within the relevant marketplace; historical, current and expected future sales trends for the marketplace; and third-party data, if available. The estimates, expectations and assumptions used in each of our inventory assessments are specific to each community or land parcel based on what we believe are reasonable forecasts for their particular performance, and may vary among communities or land parcels and may vary over time.
We record an inventory impairment charge on a community or land parcel that is active or held for future development when indicators of potential impairment exist and the carrying value of the real estate asset is greater than the undiscounted future net cash flows the asset is expected to generate. These real estate assets are written down to fair value, which is primarily determined based on the estimated future net cash flows discounted for inherent risk associated with each such asset, or other valuation techniques. Inputs used in our calculation of estimated discounted future net cash flows are specific to each affected real estate asset and are based on our expectations for each such asset as of the applicable measurement date, including, among others, expectations related to average selling prices and volume of homes delivered. The discount rates we used were impacted by one or more of the following at the time the calculation was made: the risk-free rate of return; expected risk premium based on estimated land development, home construction and delivery timelines; market risk from potential future price erosion; cost uncertainty due to land development or home construction cost increases; and other risks specific to the asset or conditions in the market in which the asset is located.
We record an inventory impairment charge on land held for sale when the carrying value of a land parcel is greater than its fair value. These real estate assets are written down to fair value, less associated costs to sell. The estimated fair values of such assets are generally based on bona fide letters of intent from outside parties, executed sales contracts, broker quotes or similar information.
The following table summarizes ranges for significant quantitative unobservable inputs we utilized in our fair value measurements with respect to impaired communities, other than land held for sale, written down to fair value during the years presented:
| | | | | | | | | | | | | | | | | | | | | |
| | | Years Ended November 30, |
| Unobservable Input (a) | | | 2021 | | 2020 | | 2019 |
| Average selling price | | | $471,000 - $949,400 | | $301,600 - $1,127,100 | | $315,000 - $1,045,400 |
| Deliveries per month | | | 4 - 5 | | 1 - 4 | | 1 - 4 |
| Discount rate | | | 18% - 19% | | 17% - 18% | | 17% |
(a)The ranges of inputs used in each period primarily reflect differences between the housing markets where each impacted community is located, rather than fluctuations in prevailing market conditions.
Based on the results of our evaluations, we recognized inventory impairment charges of $9.9 million in 2021 related to two communities with a post-impairment fair value of $18.0 million. In 2020, we recognized inventory impairment charges of $22.7 million related to 10 communities with a post-impairment fair value of $46.5 million. In 2019, we recognized inventory impairment charges of $14.0 million related to eight communities with a post-impairment fair value of $27.1 million. The impairment charges in 2021, 2020 and 2019 reflected our decisions to make changes in our operational strategies aimed at more quickly monetizing our investment in certain communities by accelerating the overall pace for selling, building and delivering homes therein, including communities on land previously held for future development. If we change our strategy or if there are changes in market conditions for any given asset, it is possible that we may recognize additional inventory impairment charges.
As of November 30, 2021, the aggregate carrying value of our inventory that had been impacted by inventory impairment charges was $87.7 million, representing 11 communities and various other land parcels. As of November 30, 2020, the aggregate carrying value of our inventory that had been impacted by inventory impairment charges was $113.1 million, representing 16 communities and various other land parcels.
Our inventory controlled under land option contracts and other similar contracts is assessed to determine whether it continues to meet our investment return standards. Assessments are made separately for each optioned land parcel on a quarterly basis and are affected by the following factors relative to the market in which the asset is located, among others: current and/or anticipated net orders, average selling prices and volume of homes delivered; estimated land development and home construction costs; and projected profitability on expected future housing or land sales. When a decision is made not to exercise certain land option contracts and other similar contracts due to market conditions and/or changes in our marketing strategy, we write off the related inventory costs, including non-refundable deposits and unrecoverable pre-acquisition costs. Based on the results of our assessments, we recognized land option contract abandonment charges of $2.1 million in 2021, $5.9 million in 2020 and $3.3 million in 2019. Land option contract abandonment charges are included in construction and land costs in our consolidated statements of operations.
The estimated remaining life of each community or land parcel in our inventory depends on various factors, such as the total number of lots remaining; the expected timeline to acquire and entitle land and develop lots to build homes; the anticipated future net order and cancellation rates; and the expected timeline to build and deliver homes sold. While it is difficult to determine a precise timeframe for any particular inventory asset, based on current market conditions and expected delivery timelines, we estimate our inventory assets’ remaining operating lives to range generally from one year to in excess of 10 years, and expect to realize, on an overall basis, the majority of our inventory balance as of November 30, 2021 within five years.
Due to the judgment and assumptions applied in our inventory impairment and land option contract abandonment assessment processes, and in our estimations of the remaining operating lives of our inventory assets and the realization of our inventory balances, particularly as to land held for future development, it is possible that actual results could differ substantially from those estimated.
Note 8. Variable Interest Entities
Unconsolidated Joint Ventures. We participate in joint ventures from time to time that conduct land acquisition, land development and/or other homebuilding activities in various markets where our homebuilding operations are located. Our investments in these joint ventures may create a variable interest in a variable interest entity (“VIE”), depending on the contractual terms of the arrangement. We analyze our joint ventures under the variable interest model to determine whether they are VIEs and, if so, whether we are the primary beneficiary. Based on our analyses, we determined that one of our joint ventures at November 30, 2021 and 2020 was a VIE, but we were not the primary beneficiary of the VIE. Therefore, all of our joint ventures at November 30, 2021 and 2020 were unconsolidated and accounted for under the equity method because we did not have a controlling financial interest.
Land Option Contracts and Other Similar Contracts. In the ordinary course of our business, we enter into land option contracts and other similar contracts with third parties and unconsolidated entities to acquire rights to land for the construction of homes. The use of these contracts generally allows us to reduce the market risks associated with direct land ownership and development, and reduce our capital and financial commitments, including interest and other carrying costs. Under these contracts, which generally do not contain provisions requiring our specific performance, we typically make a specified option payment or earnest money deposit in consideration for the right to purchase land in the future, usually at a predetermined price.
We analyze each of our land option contracts and other similar contracts under the variable interest model to determine whether the land seller is a VIE and, if so, whether we are the primary beneficiary. Although we do not have legal title to the underlying land, we are required to consolidate a VIE if we are the primary beneficiary. In determining whether we are the primary beneficiary, we consider, among other things, whether we have the power to direct the activities of the VIE that most significantly impact the VIE’s economic performance. Such activities would include, among other things, determining or limiting the scope or purpose of the VIE, selling or transferring property owned or controlled by the VIE, or arranging financing for the VIE. As a result of our analyses, we determined that as of November 30, 2021 and 2020, we were not the primary beneficiary of any VIEs from which we have acquired rights to land under land option contracts and other similar contracts. We perform ongoing reassessments of whether we are the primary beneficiary of a VIE.
The following table presents a summary of our interests in land option contracts and other similar contracts (in thousands):
| | | | | | | | | | | | | | | | | | | | | | | |
| November 30, 2021 | | November 30, 2020 |
| Cash
Deposits | | Aggregate
Purchase Price | | Cash
Deposits | | Aggregate
Purchase Price |
| Unconsolidated VIEs | $ | 38,333 | | | $ | 1,093,669 | | | $ | 20,962 | | | $ | 910,495 | |
| Other land option contracts and other similar contracts | 36,176 | | | 766,182 | | | 33,672 | | | 507,934 | |
| Total | $ | 74,509 | | | $ | 1,859,851 | | | $ | 54,634 | | | $ | 1,418,429 | |
In addition to the cash deposits presented in the table above, our exposure to loss related to our land option contracts and other similar contracts with third parties and unconsolidated entities consisted of pre-acquisition costs of $38.1 million at November 30, 2021 and $31.1 million at November 30, 2020. These pre-acquisition costs and cash deposits were included in inventories in our consolidated balance sheets.
For land option contracts and other similar contracts where the land seller entity is not required to be consolidated under the variable interest model, we consider whether such contracts should be accounted for as financing arrangements. Land option contracts and other similar contracts that may be considered financing arrangements include those we enter into with third-party land financiers or developers in conjunction with such third parties acquiring a specific land parcel(s) on our behalf, at our direction, and those with other landowners where we or our designee make improvements to the optioned land parcel(s) during the applicable option period. For these land option contracts and other similar contracts, we record the remaining purchase price of the associated land parcel(s) in inventories in our consolidated balance sheets with a corresponding financing obligation if we determine that we are effectively compelled to exercise the option to purchase the land parcel(s). In making this determination with respect to a land option contract, we consider the non-refundable deposit(s) we have made and any non-reimbursable expenditures we have incurred for land improvement activities or other items up to the assessment date; additional costs associated with abandoning the contract; and our commitments, if any, to incur non-reimbursable costs associated with the contract. As a result of our evaluations of land option contracts and other similar contracts for financing arrangements, we recorded inventories in our consolidated balance sheets, with a corresponding increase to accrued expenses and other liabilities, of $26.5 million at November 30, 2021 and $19.4 million at November 30, 2020.
Note 9. Investments in Unconsolidated Joint Ventures
We have investments in unconsolidated joint ventures that conduct land acquisition, land development and/or other homebuilding activities in various markets where our homebuilding operations are located. We and our unconsolidated joint venture partners make initial and/or ongoing capital contributions to these unconsolidated joint ventures, typically on a pro rata basis, according to our respective equity interests. The obligations to make capital contributions are governed by each such unconsolidated joint venture’s respective operating agreement and related governing documents. Our partners in these unconsolidated joint ventures are unrelated homebuilders, and/or land developers and other real estate entities, or commercial enterprises. These investments are designed primarily to reduce market and development risks and to increase the number of lots we own or control. In some instances, participating in unconsolidated joint ventures has enabled us to acquire and develop land that we might not otherwise have had access to due to a project’s size, financing needs, duration of development or other circumstances. While we consider our participation in unconsolidated joint ventures as potentially beneficial to our homebuilding activities, we do not view such participation as essential.
For distributions we receive from these unconsolidated joint ventures, we have elected to use the cumulative earnings approach for our consolidated statements of cash flows. Under the cumulative earnings approach, distributions up to the amount of cumulative equity in earnings recognized are treated as returns on investment within operating cash flows and those in excess of that amount are treated as returns of investment within investing cash flows.
We typically have obtained rights to acquire portions of the land held by the unconsolidated joint ventures in which we currently participate. When an unconsolidated joint venture sells land to our homebuilding operations, we defer recognition of our share of such unconsolidated joint venture’s earnings (losses) until we recognize revenues on the corresponding home sale, which is generally when title to and possession of the home and the risks and rewards of ownership are transferred to the homebuyer on the closing date. At that time, we account for the earnings (losses) as a reduction (increase) to the cost of purchasing the land from the unconsolidated joint venture. We defer recognition of our share of such unconsolidated joint venture losses only to the extent profits are to be generated from the sale of the home to a homebuyer.
We share in the earnings (losses) of these unconsolidated joint ventures generally in accordance with our respective equity interests. In some instances, we recognize earnings (losses) related to our investment in an unconsolidated joint venture that
differ from our equity interest in the unconsolidated joint venture. This typically arises from our deferral of the unconsolidated joint venture’s earnings (losses) from land sales to us, or other items.
We had investments in six unconsolidated joint ventures as of November 30, 2021 and five unconsolidated joint ventures as of November 30, 2020 and 2019. The following table presents combined condensed information from the statements of operations of our unconsolidated joint ventures (in thousands):
| | | | | | | | | | | | | | | | | |
| | Years Ended November 30, |
| | 2021 | | 2020 | | 2019 |
| Revenues | $ | 14,818 | | | $ | 127,270 | | | $ | 23,676 | |
| Construction and land costs | (12,398) | | | (93,162) | | | (23,659) | |
| Other expenses, net | (2,640) | | | (8,850) | | | (2,644) | |
| Income (loss) | $ | (220) | | | $ | 25,258 | | | $ | (2,627) | |
For the years ended November 30, 2021 and 2020, combined revenues and construction and land costs primarily related to homes delivered from an unconsolidated joint venture in California. The lower combined revenues and construction and land costs for 2021 as compared to 2020 mainly reflected a decrease in the number of homes delivered from this unconsolidated joint venture to 10 in 2021 from 99 in 2020. The joint venture delivered its last home in the 2021 second quarter. For the year ended November 30, 2019, combined revenues and construction and land costs were generated primarily from land sales.
The following table presents combined condensed balance sheet information for our unconsolidated joint ventures (in thousands):
| | | | | | | | | | | |
| | November 30, |
| | 2021 | | 2020 |
| Assets | | | |
| Cash | $ | 15,731 | | | $ | 38,837 | |
| Receivables | 795 | | | 96 | |
| Inventories | 64,034 | | | 65,233 | |
| Other assets | 50 | | | 593 | |
| Total assets | $ | 80,610 | | | $ | 104,759 | |
| Liabilities and equity | | | |
| Accounts payable and other liabilities | $ | 12,285 | | | $ | 14,037 | |
| Equity | 68,325 | | | 90,722 | |
| Total liabilities and equity | $ | 80,610 | | | $ | 104,759 | |
Note 10. Property and Equipment, Net
Property and equipment, net consisted of the following (in thousands):
| | | | | | | | | | | | | | |
| | November 30, |
| | 2021 | | 2020 |
| Computer software and equipment | | $ | 39,938 | | | $ | 32,902 | |
| | | | |
| Model furnishings and sales office improvements | | 87,702 | | | 83,882 | |
| Leasehold improvements, office furniture and equipment | | 17,922 | | | 17,245 | |
Subtotal | | 145,562 | | | 134,029 | |
| Accumulated depreciation | | (69,249) | | | (68,482) | |
Total | | $ | 76,313 | | | $ | 65,547 | |
Note 11. Other Assets
Other assets consisted of the following (in thousands):
| | | | | | | | | | | |
| | November 30, |
| | 2021 | | 2020 |
| Cash surrender value and benefit receivable from corporate-owned life insurance contracts | $ | 68,748 | | | $ | 73,227 | |
| | | |
| Lease right-of-use assets | 27,508 | | | 35,967 | |
| Prepaid expenses | 6,344 | | | 13,916 | |
| Debt issuance costs associated with unsecured revolving credit facility, net | 1,553 | | | 2,400 | |
| Total | $ | 104,153 | | | $ | 125,510 | |
Note 12. Accrued Expenses and Other Liabilities
Accrued expenses and other liabilities consisted of the following (in thousands):
| | | | | | | | | | | |
| | November 30, |
| | 2021 | | 2020 |
| Self-insurance and other legal liabilities | $ | 239,129 | | | $ | 232,556 | |
| Employee compensation and related benefits | 192,549 | | | 165,342 | |
| Warranty liability | 96,153 | | | 91,646 | |
| Customer deposits | 71,032 | | | 26,243 | |
| Inventory-related obligations (a) | 36,146 | | | 31,094 | |
| Lease liabilities | 29,279 | | | 37,668 | |
| Accrued interest payable | 24,554 | | | 31,641 | |
| Real estate and business taxes | 17,563 | | | 14,249 | |
| Other | 50,500 | | | 37,062 | |
| Total | $ | 756,905 | | | $ | 667,501 | |
(a)Represents liabilities for financing arrangements discussed in Note 8 – Variable Interest Entities, as well as liabilities for fixed or determinable amounts associated with TIFE assessments. As homes are delivered, our obligation to pay the remaining TIFE assessments associated with each underlying lot is transferred to the homebuyer. As such, these assessment obligations will be paid by us only to the extent we do not deliver homes on applicable lots before the related TIFE obligations mature.
Note 13. Leases
We lease certain property and equipment for use in our operations. We recognize lease expense for these leases generally on a straight-line basis over the lease term and combine lease and non-lease components for all leases. Lease right-of-use assets and lease liabilities are recorded on our consolidated balance sheets for leases with an expected term at the commencement date of more than 12 months. Some of our leases include one or more renewal options, the exercise of which is generally at our discretion. Such options are excluded from the expected term of the lease unless we determine it is reasonably certain the option will be exercised. Lease liabilities are equal to the present value of the remaining lease payments while the amount of lease right-of-use assets is based on the lease liabilities, subject to adjustment, such as for lease incentives. Our leases do not provide a readily determinable implicit interest rate; therefore, we estimate our incremental borrowing rate to calculate the present value of remaining lease payments. In determining our incremental borrowing rate, we considered the lease term, market interest rates, current interest rates on our senior notes and the effects of collateralization. Our lease population at November 30, 2021 was comprised of operating leases where we are the lessee, primarily real estate leases for our corporate offices, division offices and design studios, as well as certain equipment leases. Our lease agreements do not contain any residual value guarantees or material restrictive covenants.
Lease expense is included in selling, general and administrative expenses in our consolidated statements of operations and includes costs for leases with terms of more than 12 months as well as short-term leases with terms of 12 months or less. For the years ended November 30, 2021 and 2020, our total lease expense was $17.3 million and $17.7 million, respectively, and
included short-term lease costs of $4.7 million and $6.0 million, respectively. Variable lease costs and external sublease income for the years ended November 30, 2021 and 2020 were immaterial.
The following table presents our lease right-of-use assets, lease liabilities and the weighted-average remaining lease term and weighted-average discount rate (incremental borrowing rate) used in calculating the lease liabilities (dollars in thousands):
| | | | | | | | | | | | | | |
| | November 30, |
| | 2021 | | 2020 |
| Lease right-of-use assets (a) | | $ | 27,693 | | | $ | 36,270 | |
| Lease liabilities (b) | | 29,481 | | | 38,000 | |
| Weighted-average remaining lease term | | 3.8 years | | 4.5 years |
| Weighted-average discount rate (incremental borrowing rate) | | 5.1 | % | | 5.1 | % |
(a)Represents lease right-of-use assets within our homebuilding operations and financial services operations of $27.5 million and $.2 million, respectively, at November 30, 2021, and $36.0 million and $.3 million, respectively, at November 30, 2020.
(b)Represents lease liabilities within our homebuilding operations and financial services operations of $29.3 million and $.2 million, respectively, at November 30, 2021, and $37.7 million and $.3 million, respectively, at November 30, 2020.
The following table presents additional information about our leases (in thousands):
| | | | | | | | | | | |
| | Years Ended November 30, |
| 2021 | | 2020 |
| Lease right-of-use assets obtained in exchange for new lease liabilities | $ | 1,526 | | | $ | 14,229 | |
| Cash payments on lease liabilities | 11,613 | | | 11,243 | |
As of November 30, 2021, the future minimum lease payments required under our leases are as follows (in thousands):
| | | | | | | | |
| Years Ending November 30, | | |
| 2022 | | $ | 10,560 | |
| 2023 | | 8,292 | |
| 2024 | | 6,149 | |
| 2025 | | 4,508 | |
| 2026 | | 1,182 | |
| Thereafter | | 1,930 | |
| Total lease payments | | 32,621 | |
| Less: Interest | | (3,140) | |
| Present value of lease liabilities | | $ | 29,481 | |
Note 14. Income Taxes
Income Tax Expense. The components of the income tax expense in our consolidated statements of operations are as follows (in thousands):
| | | | | | | | | | | | | | | | | |
| Federal | | State | | Total |
| 2021 | | | | | |
| Current | $ | (44,300) | | | $ | (33,700) | | | $ | (78,000) | |
| Deferred | (47,200) | | | (5,400) | | | (52,600) | |
| Income tax expense | $ | (91,500) | | | $ | (39,100) | | | $ | (130,600) | |
| | | | | |
| | | | | | | | | | | | | | | | | |
| Federal | | State | | Total |
| 2020 | | | | | |
| Current | $ | (12,100) | | | $ | (3,500) | | | $ | (15,600) | |
| Deferred | (36,200) | | | (16,000) | | | (52,200) | |
| Income tax expense | $ | (48,300) | | | $ | (19,500) | | | $ | (67,800) | |
| | | | | |
| 2019 | | | | | |
| Current | $ | (200) | | | $ | (3,700) | | | $ | (3,900) | |
| Deferred | (53,800) | | | (21,700) | | | (75,500) | |
| Income tax expense | $ | (54,000) | | | $ | (25,400) | | | $ | (79,400) | |
Our effective tax rates were 18.8% for 2021, 18.6% for 2020 and 22.8% for 2019.
In 2021, our income tax expense and effective tax rate reflected the favorable impacts of $49.5 million of federal tax credits we earned primarily from building energy-efficient homes and $7.1 million of excess tax benefits related to stock-based compensation, partly offset by $11.3 million of non-deductible executive compensation expense under Internal Revenue Code Section 162(m). In 2020, our income tax expense and effective tax rate reflected the favorable impacts of $18.7 million of federal tax credits we earned from building energy-efficient homes and $12.0 million of excess tax benefits related to stock-based compensation, partly offset by $5.7 million of non-deductible executive compensation expense. In 2019, our income tax expense and effective tax rate reflected the favorable impacts of $5.3 million of excess tax benefits related to stock-based compensation, a $4.4 million deferred tax asset valuation allowance reversal related to refundable alternative minimum tax (“AMT”) and $4.3 million of federal tax credits we earned from building energy-efficient homes, partly offset by $5.3 million of non-deductible executive compensation expense and a $1.9 million non-cash charge due to the re-measurement of deferred tax assets based on a reduction in certain state income tax rates.
The federal energy tax credits for the year ended November 30, 2021 resulted from legislation enacted in December 2020 and earlier periods. The legislation enacted in December 2020, among other things, extended the availability of a business tax credit for building new energy-efficient homes through December 31, 2021. The federal energy tax credits for the year ended November 30, 2020 resulted from legislation enacted in December 2019 that, among other things, extended the availability of the tax credit through December 31, 2020. The federal energy tax credits for the year ended November 30, 2019 resulted from legislation enacted on February 9, 2018 that, among other things, extended the availability of the tax credit through December 31, 2017.
On March 27, 2020, the Coronavirus Aid, Relief, and Economic Security Act (“CARES Act”) was enacted to provide economic and other relief as a result of the COVID-19 pandemic. Among other things, the CARES Act accelerated the timetable for AMT credit refunds. As a result, in the 2020 second quarter, we filed a superseding 2019 federal income tax return claiming an additional refund of $39.3 million of AMT credits and reclassified this amount from deferred tax assets to receivables. We received this AMT credit refund in the 2021 first quarter. In the 2020 fourth quarter, an amended 2019 federal income tax return was filed to expedite our additional refund and to recognize federal energy tax credits we earned from building energy-efficient homes in 2019. These credits were in addition to the $43.3 million of AMT tax credits that we reclassified from deferred tax assets to receivables in the 2020 first quarter when we filed a preliminary 2019 federal income tax return. We received the $43.3 million AMT credit refund in the 2020 third quarter. Our accounting policy regarding the balance sheet presentation of AMT credits is to maintain the balance in deferred tax assets until a tax return is filed claiming a refund of a portion of the credit, at which time such amount will be presented in receivables.
The CARES Act also provided an ERC, which is a refundable payroll tax credit that encouraged businesses to keep employees on the payroll during the COVID-19 pandemic. Eligible employers could qualify for up to $5,000 of credit for each employee based on certain wages paid after March 12, 2020 and before January 1, 2021. Based on our evaluation of this provision and the significant pandemic-related impacts on our operations in 2020, we recognized an ERC of $4.3 million as an offset to payroll tax expenses within selling general and administrative expenses in our consolidated statements of operations upon filing for the refund in the 2021 first quarter. We received the ERC refund in the 2021 fourth quarter.
In June 2020, California enacted tax legislation that approved the suspension of California NOL deductions for tax years 2020, 2021 and 2022. Although the suspension of California NOL deductions did not have an impact on our income tax expense for the year ended November 30, 2021 or 2020, it contributed to the year-over-year increase in the amount of taxes we paid in 2021.
Deferred Tax Assets, Net. Deferred income taxes result from temporary differences in the financial and tax basis of assets and liabilities. Significant components of our deferred tax liabilities and assets are as follows (in thousands):
| | | | | | | | | | | |
| | November 30, |
| | 2021 | | 2020 |
| Deferred tax liabilities: | | | |
| Capitalized expenses | $ | 36,660 | | | $ | 43,439 | |
| State taxes | 20,558 | | | 22,562 | |
| Depreciation and amortization | 3,926 | | | 2,714 | |
| Other | 1,555 | | | 2,884 | |
Total | 62,699 | | | 71,599 | |
| | | |
| Deferred tax assets: | | | |
| NOLs from 2006 through 2021 | 73,662 | | | 79,987 | |
| Employee benefits | 56,384 | | | 52,713 | |
| Warranty, legal and other accruals | 54,826 | | | 41,319 | |
| Inventory impairment and land option contract abandonment charges | 30,767 | | | 40,998 | |
| Capitalized expenses | 26,849 | | | 19,903 | |
| Partnerships and joint ventures | 8,265 | | | 8,733 | |
| | | |
| | | |
| Tax credits | 4,634 | | | 75,108 | |
| Other | 2,090 | | | 1,905 | |
Total | 257,477 | | | 320,666 | |
| Valuation allowance | (17,400) | | | (18,000) | |
Total | 240,077 | | | 302,666 | |
| Deferred tax assets, net | $ | 177,378 | | | $ | 231,067 | |
Reconciliation of Expected Income Tax Expense. The income tax expense computed at the statutory U.S. federal income tax rate and the income tax expense provided in our consolidated statements of operations differ as follows (dollars in thousands):
| | | | | | | | | | | | | | | | | | | | | | | | | | | | | | | | | | | |
| | Years Ended November 30, |
| | 2021 | | 2020 | | 2019 |
| $ | | % | | $ | | % | | $ | | % |
| Income tax expense computed at statutory rate | $ | (146,023) | | | (21.0) | % | | $ | (76,449) | | | (21.0) | % | | $ | (73,117) | | | (21.0) | % |
| Tax credits | 49,522 | | | 7.1 | | | 18,734 | | | 5.1 | | | 6,595 | | | 1.9 | |
| Depreciation and amortization | 5,872 | | | .8 | | | 9,910 | | | 2.7 | | | 4,276 | | | 1.2 | |
| Valuation allowance for deferred tax assets | 600 | | | .1 | | | 1,200 | | | .3 | | | 4,400 | | | 1.3 | |
| Non-deductible compensation | (9,241) | | | (1.3) | | | (4,812) | | | (1.3) | | | (4,653) | | | (1.3) | |
| | | | | | | | | | | |
| State taxes, net of federal income tax benefit | (31,378) | | | (4.5) | | | (16,395) | | | (4.4) | | | (20,927) | | | (6.0) | |
| NOL reconciliation | — | | | — | | | — | | | — | | | 3,111 | | | .9 | |
| | | | | | | | | | | |
| | | | | | | | | | | |
| | | | | | | | | | | |
| | | | | | | | | | | |
| Other, net | 48 | | | — | | | 12 | | | — | | | 915 | | | .2 | |
| Income tax expense | $ | (130,600) | | | (18.8) | % | | $ | (67,800) | | | (18.6) | % | | $ | (79,400) | | | (22.8) | % |
Deferred Tax Asset Valuation Allowance. We evaluate our deferred tax assets quarterly to determine if adjustments to our valuation allowance are required based on the consideration of all available positive and negative evidence using a “more likely than not” standard with respect to whether deferred tax assets will be realized. Our evaluation considers, among other factors, our historical operating results, our expectation of future profitability, the duration of the applicable statutory carryforward periods, and conditions in the housing market and the broader economy. In our evaluation, we give more significant weight to evidence that is objective in nature as compared to subjective evidence. Also, more significant weight is given to evidence that
directly relates to our then-current financial performance as compared to indirect or less current evidence. The ultimate realization of our deferred tax assets depends primarily on our ability to generate future taxable income during the periods in which the related deferred tax assets become deductible. The value of our deferred tax assets depends on applicable income tax rates.
Our deferred tax assets of $194.8 million at November 30, 2021 and $249.1 million at November 30, 2020 were partially offset in each year by valuation allowances of $17.4 million and $18.0 million, respectively. The deferred tax asset valuation allowances at November 30, 2021 and 2020 were primarily related to certain state NOLs that had not met the “more likely than not” realization standard at those dates. As a result of our utilization of certain state NOLs, we reduced the valuation allowance by $.6 million in 2021. As of November 30, 2021, we would need to generate approximately $670 million of pretax income in future periods before 2041 to realize our deferred tax assets. Based on the evaluation of our deferred tax assets as of November 30, 2021, we determined that most of our deferred tax assets would be realized. In 2020, as a result of an expiration and the remeasurement of certain state NOLs, we decreased both our deferred tax assets and the related deferred tax asset valuation allowance for these NOLs by $1.2 million. In 2019, the decrease in the valuation allowance primarily reflected our reversal of a $4.4 million deferred tax asset valuation allowance, partly due to the Internal Revenue Service’s announcement in January 2019 that refundable AMT credits will not be subject to sequestration for taxable years beginning after December 31, 2017.
We will continue to evaluate both the positive and negative evidence on a quarterly basis in determining the need for a valuation allowance with respect to our deferred tax assets. The accounting for deferred tax assets is based upon estimates of future results. Changes in positive and negative evidence, including differences between estimated and actual results, could result in changes in the valuation of our deferred tax assets that could have a material impact on our consolidated financial statements. Changes in existing federal and state tax laws and corporate income tax rates could also affect actual tax results and the realization of deferred tax assets over time.
The majority of the tax benefits associated with our NOLs can be carried forward for 20 years and applied to offset future taxable income. Depending on their applicable statutory period, the state NOL carryforwards of $73.7 million, if not utilized, will begin to expire between 2022 and 2041. State NOL carryforwards of $.2 million and $.4 million expired in 2021 and 2020, respectively. In addition, $4.6 million of our tax credits, if not utilized, will expire in 2041.
Unrecognized Tax Benefits. Gross unrecognized tax benefits are the differences between a tax position taken or expected to be taken in a tax return, and the benefit recognized for accounting purposes. A reconciliation of the beginning and ending balances of gross unrecognized tax benefits, excluding interest and penalties, is as follows (in thousands):
| | | | | | | | | | | | | | | | | |
| | Years Ended November 30, |
| | 2021 | | 2020 | | 2019 |
| Balance at beginning of year | $ | — | | | $ | — | | | $ | — | |
| | | | | |
| Increase as a result of tax position taken in prior years | 930 | | | — | | | — | |
| | | | | |
| Balance at end of year | $ | 930 | | | $ | — | | | $ | — | |
We had unrecognized tax benefits of $.9 million as of November 30, 2021. Our unrecognized tax benefits are included in accrued expenses and other liabilities in our consolidated financial statements. We recognize accrued interest and penalties related to unrecognized tax benefits in our consolidated financial statements as a component of the provision for income taxes. As of November 30, 2020 and 2019, we had no gross unrecognized tax benefits.
If these unrecognized tax benefits reverse in the future, they would have a beneficial impact on our effective tax rate at that time. During the next 12 months, it is possible that the amount of unrecognized tax benefits will change, but we are not able to provide a range of such change. The potential change will be related to increases due to new tax positions taken and the accrual of interest and penalties. As of November 30, 2021 and 2020, there were no tax positions for which the ultimate deductibility is highly certain but the timing of such deductibility is uncertain. Our total accrued interest and penalties related to unrecognized income tax benefits was zero at both November 30, 2021 and 2020. Because of the impact of deferred tax accounting, other than interest and penalties, the disallowance of the shorter deductibility period would not affect our annual effective tax rate, but would accelerate the payment of cash to a tax authority to an earlier period. The fiscal years ending 2018 and later remain open to federal examinations, while 2017 and later remain open to state examinations.
The benefits of our deferred tax assets, including our NOLs, built-in losses and tax credits would be reduced or potentially eliminated if we experienced an “ownership change” under Section 382. Based on our analysis performed as of November 30, 2021, we do not believe that we have experienced an ownership change as defined by Section 382, and, therefore, the NOLs, built-in losses and tax credits we have generated should not be subject to a Section 382 limitation as of this reporting date.
Note 15. Notes Payable
Notes payable consisted of the following (in thousands):
| | | | | | | | | | | |
| | November 30, |
| | 2021 | | 2020 |
Mortgages and land contracts due to land sellers and other loans (at interest rates of 4.5% at November 30, 2021 and 4.5% to 6.0% at November 30, 2020) | $ | 5,327 | | | $ | 4,667 | |
7.00% Senior notes due December 15, 2021 | — | | | 449,029 | |
7.50% Senior notes due September 15, 2022 | 349,471 | | | 348,846 | |
7.625% Senior notes due May 15, 2023 | 350,788 | | | 351,281 | |
6.875% Senior notes due June 15, 2027 | 297,161 | | | 296,757 | |
4.80% Senior notes due November 15, 2029 | 296,905 | | | 296,595 | |
4.00% Senior notes due June 15, 2031 | 385,375 | | | — | |
| Total | $ | 1,685,027 | | | $ | 1,747,175 | |
The carrying amounts of our senior notes listed above are net of debt issuance costs and premiums, which totaled $10.3 million at November 30, 2021 and $7.5 million at November 30, 2020.
Unsecured Revolving Credit Facility. We have an $800.0 million Credit Facility that will mature on October 7, 2023. The Credit Facility contains an uncommitted accordion feature under which its aggregate principal amount of available loans can be increased to a maximum of $1.00 billion under certain conditions, including obtaining additional bank commitments. The Credit Facility also contains a sublimit of $250.0 million for the issuance of letters of credit. Interest on amounts borrowed under the Credit Facility is payable at least quarterly in arrears at a rate based on either a Eurodollar or a base rate, plus a spread that depends on our Leverage Ratio, as defined under the Credit Facility. The Credit Facility also requires the payment of a commitment fee at a per annum rate ranging from .20% to .35% of the unused commitment, based on our Leverage Ratio. Under the terms of the Credit Facility, we are required, among other things, to maintain compliance with various covenants, including financial covenants relating to our consolidated tangible net worth, Leverage Ratio, and either an Interest Coverage Ratio or a minimum level of liquidity, each as defined therein. The amount of the Credit Facility available for cash borrowings and the issuance of letters of credit depends on the total cash borrowings and letters of credit outstanding under the Credit Facility and the maximum available amount under the terms of the Credit Facility. As of November 30, 2021, we had no cash borrowings and $8.6 million of letters of credit outstanding under the Credit Facility. Therefore, as of November 30, 2021, we had $791.4 million available for cash borrowings under the Credit Facility, with up to $241.4 million of that amount available for the issuance of letters of credit.
LOC Facility. On August 12, 2021, we entered into an amendment to our LOC Facility that increased the limit of letters of credit we may issue under it from $50.0 million to $75.0 million, and extended the expiration date from February 13, 2022 to February 13, 2025. Under the LOC Facility, we obtain letters of credit from time to time in the ordinary course of operating our business. As of November 30, 2021 and 2020, we had letters of credit outstanding under the LOC Facility of $34.6 million and $29.7 million, respectively.
Mortgages and Land Contracts Due to Land Sellers and Other Loans. As of November 30, 2021, inventories having a carrying value of $20.8 million were pledged to collateralize mortgages and land contracts due to land sellers and other loans.
Shelf Registration. On July 9, 2020, we filed the 2020 Shelf Registration with the SEC. The 2020 Shelf Registration registers the offering of securities that we may issue from time to time in amounts to be determined. Our ability to issue securities is subject to market conditions. The 2020 Shelf Registration replaced our previously effective universal shelf registration statement filed with the SEC on July 14, 2017.
Senior Notes. All of the senior notes outstanding at November 30, 2021 and 2020 represent senior unsecured obligations that are guaranteed by certain of our subsidiaries and rank equally in right of payment with all of our existing and future indebtedness. All of our senior notes were issued in underwritten public offerings. Interest on each of these senior notes is payable semi-annually.
The key terms of each of our senior notes outstanding as of November 30, 2021 were as follows (dollars in thousands):
| | | | | | | | | | | | | | | | | | | | | | | | | | | | | | | | |
| | | | | | | | Redeemable Prior to Maturity | | Effective Interest Rate |
| | | | | | | | |
| Notes Payable | | Principal | | Issuance Date | | Maturity Date | | |
| | | | | | | | | | |
7.50% Senior notes | | $ | 350,000 | | | July 31, 2012 | | September 15, 2022 | | Yes (a) | | 7.7 | % |
7.625% Senior notes | | 350,000 | | | February 17, 2015/February 20, 2019 | | May 15, 2023 | | Yes (b) | | 7.5 | |
6.875% Senior notes | | 300,000 | | | February 20, 2019 | | June 15, 2027 | | Yes (b) | | 7.1 | |
4.80% Senior notes | | 300,000 | | | November 4, 2019 | | November 15, 2029 | | Yes (b) | | 5.0 | |
4.00% Senior notes | | 390,000 | | | June 9, 2021 | | June 15, 2031 | | Yes (b) | | 4.2 | |
(a)At our option, these notes may be redeemed, in whole at any time or from time to time in part, at a redemption price equal to the greater of (i) 100% of the principal amount of the notes being redeemed and (ii) the sum of the present values of the remaining scheduled payments of principal and interest on the notes being redeemed (exclusive of interest accrued to the applicable redemption date), discounted to the redemption date at a defined rate, plus, in each case, accrued and unpaid interest on the notes being redeemed to the applicable redemption date.
(b)At our option, these notes may be redeemed, in whole at any time or from time to time in part, at a redemption price equal to the greater of (i) 100% of the principal amount of the notes being redeemed and (ii) the sum of the present values of the remaining scheduled payments of principal and interest on the notes being redeemed (exclusive of interest accrued to the applicable redemption date), discounted to the redemption date at a defined rate, plus, in each case, accrued and unpaid interest on the notes being redeemed to, but excluding, the applicable redemption date, except that six months prior to the stated maturity date for these notes and until their maturity, the redemption price will be equal to 100% of the principal amount of the notes being redeemed, plus, in each case, accrued and unpaid interest on the notes being redeemed to, but excluding, the applicable redemption date.
If a change in control occurs as defined in the instruments governing our senior notes, we would be required to offer to purchase all of our outstanding senior notes at 101% of their principal amount, together with all accrued and unpaid interest, if any.
On June 9, 2021, we completed the underwritten public offering of $390.0 million in aggregate principal amount of 4.00% Senior Notes due 2031 at 100% of their aggregate principal amount. Net proceeds from this offering totaled $385.2 million, after deducting the underwriting discount and our expenses relating to the offering. The 4.00% Senior Notes due 2031 represent senior unsecured obligations of ours and rank equally in right of payment with all of our existing unsecured and unsubordinated indebtedness. Interest on the 4.00% Senior Notes due 2031 is payable semi-annually in arrears on June 15 and December 15, commencing on December 15, 2021. These notes will mature on June 15, 2031.
On June 9, 2021, we used a portion of the net proceeds from the issuance of the 4.00% Senior Notes due 2031 to purchase, pursuant to a tender offer that expired the previous day, $269.8 million in aggregate principal amount of our outstanding $450.0 million of 7.00% Senior Notes due 2021. We paid $274.9 million to purchase the notes and recorded a charge of $5.1 million for the early extinguishment of debt in the 2021 third quarter due to a premium paid under the tender offer and the unamortized original issue discount associated with these senior notes.
On September 15, 2021, we redeemed the remaining $180.2 million in aggregate principal amount of the 7.00% Senior Notes due 2021 at par value pursuant to the terms of the notes.
The indenture governing our senior notes does not contain any financial covenants. Subject to specified exceptions, the indenture contains certain restrictive covenants that, among other things, limit our ability to incur secured indebtedness, or engage in sale-leaseback transactions involving property above a certain specified value. In addition, our senior notes contain certain limitations related to mergers, consolidations, and sales of assets.
As of the date of this report, we were in compliance with the applicable terms of all our covenants and other requirements under the Credit Facility, the senior notes, the indenture, and the mortgages and land contracts due to land sellers and other loans. Our ability to access the Credit Facility for cash borrowings and letters of credit and our ability to secure future debt financing depend, in part, on our ability to remain in such compliance. There are no agreements that restrict our payment of dividends other than the Credit Facility, which would restrict our payment of certain dividends, such as cash dividends on our common stock, if a default under the Credit Facility exists at the time of any such payment, or if any such payment would result in such a default (other than dividends paid within 60 days after declaration, if there was no default at the time of declaration).
Principal payments on senior notes, mortgages and land contracts due to land sellers and other loans are due during each year ending November 30 as follows: 2022 — $353.6 million; 2023 — $351.1 million; 2024 — $.6 million; 2025 — $0; 2026 — $0; and thereafter — $990.0 million.
Note 16. Fair Value Disclosures
Fair value measurements of assets and liabilities are categorized based on the following hierarchy:
Level 1Fair value determined based on quoted prices in active markets for identical assets or liabilities.
Level 2Fair value determined using significant observable inputs, such as quoted prices for similar assets or liabilities or quoted prices for identical or similar assets or liabilities in markets that are not active, inputs other than quoted prices that are observable for the asset or liability, or inputs that are derived principally from or corroborated by observable market data, by correlation or other means.
Level 3Fair value determined using significant unobservable inputs, such as pricing models, discounted cash flows, or similar techniques.
Fair value measurements are used for inventories on a nonrecurring basis when events and circumstances indicate that their carrying value is not recoverable. The following table presents the fair value hierarchy and our assets measured at fair value on a nonrecurring basis (in thousands):
| | | | | | | | | | | | | | | | | | | | | | | | | | | | | | | | | | | | | | | | | | | | |
| | | | November 30, 2021 | | November 30, 2020 |
| Description | | Fair Value Hierarchy | | Pre-Impairment Value | | Inventory Impairment Charges | | Fair Value (a) | | Pre-Impairment Value | | Inventory Impairment Charges | | Fair Value (a) |
| Inventories (a) | | Level 3 | | $ | 27,923 | | | $ | (9,903) | | | $ | 18,020 | | | $ | 69,211 | | | $ | (22,723) | | | $ | 46,488 | |
(a)Amounts represent the aggregate fair value for real estate assets impacted by inventory impairment charges during the applicable period, as of the date that the fair value measurements were made. The carrying value for these real estate assets may have subsequently increased or decreased from the fair value reflected due to activity that has occurred since the measurement date.
The fair values for inventories that were determined using Level 3 inputs were based on the estimated future net cash flows discounted for inherent risk associated with each underlying asset.
The following table presents the fair value hierarchy, carrying values and estimated fair values of our financial instruments, except those for which the carrying values approximate fair values (in thousands):
| | | | | | | | | | | | | | | | | | | | | | | | | | | | | | | | |
| | | | | November 30, |
| | | | | 2021 | | 2020 |
| Description | | Fair Value Hierarchy | | Carrying
Value (a) | | Estimated
Fair Value | | Carrying
Value (a) | | Estimated
Fair Value |
| Financial Liabilities: | | | | | | | | | | |
| Senior notes | | Level 2 | | $ | 1,679,700 | | | $ | 1,796,500 | | | $ | 1,742,508 | | | $ | 1,924,250 | |
| | | | | | | | | | |
(a)The carrying value for the senior notes, as presented, includes unamortized debt issuance costs. Debt issuance costs are not factored into the estimated fair values of these notes.
The fair values of our senior notes are generally estimated based on quoted market prices for these instruments. The carrying values reported for cash and cash equivalents, and mortgages and land contracts due to land sellers and other loans approximate fair values. The carrying value of corporate-owned life insurance is based on the cash surrender value of the policies and, accordingly, approximates fair value.
Note 17. Commitments and Contingencies
Commitments and contingencies include typical obligations of homebuilders for the completion of contracts and those incurred in the ordinary course of business.
Warranty. We provide a limited warranty on all of our homes. The specific terms and conditions of our limited warranty program vary depending upon the markets in which we do business. We generally provide a structural warranty of 10 years, a
warranty on electrical, heating, cooling, plumbing and certain other building systems each varying from two to five years based on geographic market and state law, and a warranty of one year for other components of the home. Our limited warranty program is ordinarily how we respond to and account for homeowners’ requests to local division offices seeking repairs of certain conditions or defects, including claims where we could have liability under applicable state statutes or tort law for a defective condition in or damages to a home. Our warranty liability covers our costs of repairs associated with homeowner claims made under our limited warranty program. These claims are generally made directly by a homeowner and involve their individual home.
We estimate the costs that may be incurred under each limited warranty and record a liability in the amount of such costs at the time the revenue associated with the sale of each home is recognized. Our primary assumption in estimating the amounts we accrue for warranty costs is that historical claims experience is a strong indicator of future claims experience. Factors that affect our warranty liability include the number of homes delivered, historical and anticipated rates of warranty claims, and cost per claim. We periodically assess the adequacy of our accrued warranty liability, which is included in accrued expenses and other liabilities in our consolidated balance sheets, and adjust the amount as necessary based on our assessment. Our assessment includes the review of our actual warranty costs incurred to identify trends and changes in our warranty claims experience, and considers our home construction quality and customer service initiatives and outside events. While we believe the warranty liability currently reflected in our consolidated balance sheets to be adequate, unanticipated changes or developments in the legal environment, local weather, land or environmental conditions, quality of materials or methods used in the construction of homes or customer service practices and/or our warranty claims experience could have a significant impact on our actual warranty costs in future periods and such amounts could differ significantly from our current estimates.
The changes in our warranty liability were as follows (in thousands):
| | | | | | | | | | | | | | | | | |
| | Years Ended November 30, |
| | 2021 | | 2020 | | 2019 |
| Balance at beginning of year | $ | 91,646 | | | $ | 88,839 | | | $ | 82,490 | |
| Warranties issued | 34,627 | | | 29,505 | | | 35,480 | |
| Payments | (26,120) | | | (23,098) | | | (23,531) | |
| Adjustments | (4,000) | | | (3,600) | | | (5,600) | |
| Balance at end of year | $ | 96,153 | | | $ | 91,646 | | | $ | 88,839 | |
Guarantees. In the normal course of our business, we issue certain representations, warranties and guarantees related to our home sales and land sales. Based on historical experience, we do not believe any potential liability with respect to these representations, warranties or guarantees would be material to our consolidated financial statements.
Self-Insurance. We maintain, and require the majority of our independent contractors to maintain, general liability insurance (including construction defect and bodily injury coverage) and workers’ compensation insurance. These insurance policies protect us against a portion of our risk of loss from claims related to our homebuilding activities, subject to certain self-insured retentions, deductibles and other coverage limits. We also maintain certain other insurance policies. Costs associated with our self-insurance programs are included in selling, general and administrative expenses. In Arizona, California, Colorado and Nevada, our contractors’ general liability insurance primarily takes the form of a wrap-up policy under a program where eligible independent contractors are enrolled as insureds on each community. Enrolled contractors contribute toward the cost of the insurance and agree to pay a contractual amount in the future if there is a claim related to their work. To the extent provided under the wrap-up program, we absorb the enrolled contractors’ general liability associated with the work performed on our homes within the applicable community as part of our overall general liability insurance and our self-insurance.
We self-insure a portion of our overall risk through the use of a captive insurance subsidiary, which provides coverage for our exposure to certain construction defect, bodily injury and property damage claims and related litigation or regulatory actions, up to certain limits. Our self-insurance liability generally covers the costs of settlements and/or repairs, if any, as well as our costs to defend and resolve the following types of claims:
•Construction defect: Construction defect claims, which represent the largest component of our self-insurance liability, typically originate through a legal or regulatory process rather than directly by a homeowner and involve the alleged occurrence of a condition affecting two or more homes within the same community, or they involve a common area or homeowners’ association property within a community. These claims typically involve higher costs to resolve than individual homeowner warranty claims, and the rate of claims is highly variable.
• Bodily injury: Bodily injury claims typically involve individuals (other than our employees) who claim they were injured while on our property or as a result of our operations.
• Property damage: Property damage claims generally involve claims by third parties for alleged damage to real or personal property as a result of our operations. Such claims may occasionally include those made against us by owners of property located near our communities.
Our self-insurance liability at each reporting date represents the estimated costs of reported claims, claims incurred but not yet reported, and claim adjustment expenses. The amount of our self-insurance liability is based on an analysis performed by a third-party actuary that uses our historical claim and expense data, as well as industry data to estimate these overall costs. Key assumptions used in developing these estimates include claim frequencies, severities and resolution patterns, which can occur over an extended period of time. These estimates are subject to variability due to the length of time between the delivery of a home to a homebuyer and when a construction defect claim is made, and the ultimate resolution of such claim; uncertainties regarding such claims relative to our markets and the types of product we build; and legal or regulatory actions and/or interpretations, among other factors. Due to the degree of judgment involved and the potential for variability in these underlying assumptions, our actual future costs could differ from those estimated. In addition, changes in the frequency and severity of reported claims and the estimates to resolve claims can impact the trends and assumptions used in the actuarial analysis, which could be material to our consolidated financial statements. Though state regulations vary, construction defect claims are reported and resolved over a long period of time, which can extend for 10 years or more. As a result, the majority of the estimated self-insurance liability based on the actuarial analysis relates to claims incurred but not yet reported. Therefore, adjustments related to individual existing claims generally do not significantly impact the overall estimated liability. Adjustments to our liabilities related to homes delivered in prior years are recorded in the period in which a change in our estimate occurs.
Our self-insurance liability is presented on a gross basis for all years without consideration of insurance recoveries and amounts we have paid on behalf of and expect to recover from other parties, if any. Estimated probable insurance and other recoveries of $57.8 million and $60.0 million are included in receivables in our consolidated balance sheets at November 30, 2021 and 2020, respectively. These self-insurance recoveries are principally based on actuarially determined amounts and depend on various factors, including, among other things, the above-described claim cost estimates, our insurance policy coverage limits for the applicable policy year(s), historical third-party recovery rates, insurance industry practices, the regulatory environment and legal precedent, and are subject to a high degree of variability from year to year. Because of the inherent uncertainty and variability in these assumptions, our actual insurance recoveries could differ significantly from amounts currently estimated.
The changes in our self-insurance liability were as follows (in thousands):
| | | | | | | | | | | | | | | | | |
| | Years Ended November 30, |
| | 2021 | | 2020 | | 2019 |
| Balance at beginning of year | $ | 194,180 | | | $ | 177,765 | | | $ | 176,841 | |
| Self-insurance provided | 19,665 | | | 15,399 | | | 19,185 | |
| Payments | (29,369) | | | (4,375) | | | (9,398) | |
| Adjustments (a) | 4,655 | | | 5,391 | | | (8,863) | |
| Balance at end of year | $ | 189,131 | | | $ | 194,180 | | | $ | 177,765 | |
(a)Includes net changes in estimated probable recoveries related to self-insurance, which are recorded in receivables, to present our self-insurance liability on a gross basis; an adjustment to increase our previously recorded liability by $6.8 million in 2021; and adjustments to reduce our previously recorded liability by $4.0 million in 2020 and $2.5 million in 2019.
For most of our claims, there is no interaction between our warranty liability and self-insurance liability. Typically, if a matter is identified at its outset as either a warranty or self-insurance claim, it remains as such through its resolution. However, there can be instances of interaction between the liabilities, such as where individual homeowners in a community separately request warranty repairs to their homes to address a similar condition or issue and subsequently join together to initiate, or potentially initiate, a legal process with respect to that condition or issue and/or the repair work we have undertaken. In these instances, the claims and related repair work generally are initially covered by our warranty liability, and the costs associated with resolving the legal matter (including any additional repair work) are covered by our self-insurance liability.
The payments we make in connection with claims and related repair work, whether covered within our warranty liability and/or our self-insurance liability, may be recovered from our insurers to the extent such payments exceed the self-insured
retentions or deductibles under our general liability insurance policies. Also, in certain instances, in the course of resolving a claim, we pay amounts in advance of and/or on behalf of an independent contractor(s) or their insurer(s) and believe we will be reimbursed for such payments. Estimates of all such amounts, if any, are recorded as receivables in our consolidated balance sheets when any such recovery is considered probable.
Florida Chapter 558 Actions. We and certain of our trade partners have received a growing number of claims from attorneys on behalf of individual owners of our homes and/or homeowners’ associations that allege, pursuant to Chapter 558 of the Florida Statutes, various construction defects, with most relating to stucco and water-intrusion issues. The claims primarily involve homes in our Jacksonville, Orlando, and Tampa operations. Under Chapter 558, homeowners must serve written notice of a construction defect(s) and provide the served construction and/or design contractor(s) with an opportunity to respond to the noticed issue(s) before they can file a lawsuit. Although we have resolved many of these claims without litigation, and a number of others have been resolved with applicable trade partners or their insurers covering the related costs, as of November 30, 2021, we had approximately 543 outstanding noticed claims, and some are scheduled for trial over the next few quarters and beyond. In addition, some of our trade partners’ insurers in some of these cases have informed us of their inability to continue to pay claims-related costs. At November 30, 2021, we had an accrual for our estimated probable loss for these matters and a receivable for estimated probable insurance recoveries. While it is reasonably possible that our loss could exceed the amount accrued and our recoveries could be less than the amount recorded, at this time, we are unable to estimate the total amount of the loss in excess of the accrued amount and/or associated with a shortfall in the recoveries that is reasonably possible. In addition, although we believe it is probable we will receive additional claims in future periods, we are unable to reasonably estimate the number of such claims or the amount or range of any potential losses associated with such claims as each of these is dependent on several factors, including the actions of third parties over which we have no control; the nature of any specific claims; and our evaluation of the particular facts surrounding each such claim.
Townhome Community Construction Defect Claims. In the 2016 fourth quarter, we received claims from a homeowners association alleging there were construction defects, primarily involving roofing and stucco issues, at a completed townhome community in Northern California totaling approximately $25.0 million. We, along with our outside consultants, have continued to investigate these allegations, and at November 30, 2021, we had an accrual for our estimated probable loss in this matter and a receivable for estimated probable insurance recoveries that reflected the status of our investigation to such date. At this stage of our investigation into these allegations, it is reasonably possible that our loss could exceed the amount accrued by an estimated range of $0 to $3.0 million. Our investigation will also involve identifying potentially responsible parties, including insurers, to pay for or perform any necessary repairs. We are in discussions with the homeowners association regarding the claims and their resolution.
Performance Bonds and Letters of Credit. We are often required to provide to various municipalities and other government agencies performance bonds and/or letters of credit to secure the completion of our projects and/or in support of obligations to build community improvements such as roads, sewers, water systems and other utilities, and to support similar development activities by certain of our unconsolidated joint ventures. At November 30, 2021, we had $1.11 billion of performance bonds and $43.2 million of letters of credit outstanding. At November 30, 2020, we had $897.6 million of performance bonds and $42.1 million of letters of credit outstanding. If any such performance bonds or letters of credit are called, we would be obligated to reimburse the issuer of the performance bond or letter of credit. We do not believe that a material amount of any currently outstanding performance bonds or letters of credit will be called. Performance bonds do not have stated expiration dates. Rather, we are released from the performance bonds as the underlying performance is completed. The expiration dates of some letters of credit issued in connection with community improvements coincide with the expected completion dates of the related projects or obligations. Most letters of credit, however, are issued with an initial term of one year and are typically extended on a year-to-year basis until the related performance obligations are completed.
Land Option Contracts and Other Similar Contracts. In the ordinary course of business, we enter into land option contracts and other similar contracts to acquire rights to land for the construction of homes. At November 30, 2021, we had total cash deposits of $74.5 million to purchase land having an aggregate purchase price of $1.86 billion. Our land option contracts and other similar contracts generally do not contain provisions requiring our specific performance.
Potential Contingent Gain. In pursuing e-commerce opportunities in the late-1990s, we sought strategic alliances to provide new products and services to our homebuyers and invested in certain technology businesses aimed at enhancing the homebuying experience. We accounted for these investments under the cost method. We wrote these investments off in 2001-2002, when we believed they were not recoverable based on the extended technology industry downturn and related severe stock market correction. One of these companies, in which we had invested approximately $1.8 million, has since developed a viable business and experienced significant revenue growth. We have a minority ownership interest in this investee company. In addition, in 2000 we granted nominal ownership interests in this and other investee companies to 16 then-current executives under an incentive compensation program. Prior to his appointment, our chairman, president and chief executive officer, who presently serves on this investee company’s board of directors, received such grants, including for this
investee company, as a participant in the program. Subsequent to the end of our 2021 fiscal year, this investee company entered into a letter of intent with a prospective buyer and, if a sales transaction is completed, we expect we could realize a gain that would be recognized in a future period when the sale closes.
Note 18. Legal Matters
We are involved in litigation and regulatory proceedings incidental to our business that are in various procedural stages. We believe the accruals we have recorded for probable and reasonably estimable losses with respect to these proceedings are adequate and that, as of November 30, 2021, it was not reasonably possible that an additional material loss had been incurred in an amount in excess of the estimated amounts already recognized or disclosed in our consolidated financial statements. We evaluate our accruals for litigation and regulatory proceedings at least quarterly and, as appropriate, adjust them to reflect (a) the facts and circumstances known to us at the time, including information regarding negotiations, settlements, rulings and other relevant events and developments; (b) the advice and analyses of counsel; and (c) the assumptions and judgment of management. Similar factors and considerations are used in establishing new accruals for proceedings as to which losses have become probable and reasonably estimable at the time an evaluation is made. Our accruals for litigation and regulatory proceedings are presented on a gross basis without consideration of recoveries and amounts we have paid on behalf of and expect to recover from other parties, if any. Estimates of recoveries and amounts we have paid on behalf of and expect to recover from other parties, if any, are recorded as receivables when such recoveries are considered probable. Based on our experience, we believe the amounts that may be claimed or alleged against us in these proceedings are not a meaningful indicator of our potential liability. The outcome of any of these proceedings, including the defense and other litigation-related costs and expenses we may incur, however, is inherently uncertain and could differ significantly from the estimate reflected in a related accrual, if made. Therefore, it is possible that the ultimate outcome of any proceeding, if in excess of a related accrual or if an accrual had not been made, could be material to our consolidated financial statements. Pursuant to SEC rules, we will disclose any proceeding in which a governmental authority is a party and that arises under any federal, state or local provisions enacted or adopted regulating the discharge of materials into the environment or primarily for the purpose of protecting the environment only where we believe that such proceeding will result in monetary sanctions on us, exclusive of interest and costs, above $1.0 million or is otherwise material to our consolidated financial statements.
Note 19. Stockholders’ Equity
Preferred Stock. To help protect the benefits of our NOLs and other deferred tax assets from an ownership change under Section 382, on January 22, 2009, we adopted a Rights Agreement (“Prior Rights Agreement”), and we declared a dividend distribution of one preferred share purchase right for each outstanding share of common stock that was payable to stockholders of record as of the close of business on March 5, 2009. On April 12, 2018, we entered into an Amended and Restated Rights Agreement with Computershare Inc., as rights agent (“2018 Rights Agreement”), which amended and restated the Prior Rights Agreement. The 2018 Rights Agreement extended the latest possible expiration date of the rights issued pursuant to the 2018 Rights Agreement to the close of business on April 30, 2021 and made certain other related changes. On April 8, 2021, we entered into an Amended Rights Agreement with Computershare Inc., as rights agent, (“2021 Rights Agreement”) following its approval by our stockholders at our 2021 Annual Meeting held on April 8, 2021. The 2021 Rights Agreement amends the 2018 Rights Agreement. As with the 2018 Rights Agreement, the 2021 Rights Agreement is intended to continue to help protect our NOLs and other deferred tax assets from an ownership change under Internal Revenue Code Section 382. The 2021 Rights Agreement extended the latest possible expiration date of the rights issued pursuant to the 2018 Rights Agreement to the close of business on April 30, 2024 and made certain other related changes. Otherwise, the 2021 Rights Agreement’s terms are substantively the same as those of the 2018 Rights Agreement.
Subject to the terms, provisions and conditions of the 2021 Rights Agreement, if these rights become exercisable, each right would initially represent the right to purchase from us 1/100th of a share of our Series A Participating Cumulative Preferred Stock for a purchase price of $85.00 (“Purchase Price”). If issued, each fractional share of preferred stock would generally give a stockholder approximately the same dividend, voting and liquidation rights as does one share of our common stock. However, prior to exercise, a right does not give its holder any rights as a stockholder, including without limitation any dividend, voting or liquidation rights. The rights will not be exercisable until the earlier of (a) 10 calendar days after a public announcement by us that a person or group has become an Acquiring Person (as defined under the Prior Rights Agreement) and (b) 10 business days after the commencement of a tender or exchange offer by a person or group if upon consummation of the offer the person or group would beneficially own 4.9% or more of our outstanding common stock.
Until these rights become exercisable (“Distribution Date”), common stock certificates and/or book-entry shares will evidence the rights and may contain a notation to that effect. Any transfer of shares of our common stock prior to the Distribution Date will constitute a transfer of the associated rights. After the Distribution Date, the rights may be transferred other than in connection with the transfer of the underlying shares of our common stock. If there is an Acquiring Person on the
Distribution Date or a person or group becomes an Acquiring Person after the Distribution Date, each holder of a right, other than rights that are or were beneficially owned by an Acquiring Person, which will be void, will thereafter have the right to receive upon exercise of a right and payment of the Purchase Price, that number of shares of our common stock having a market value of two times the Purchase Price. After the later of the Distribution Date and the time we publicly announce that an Acquiring Person has become such, our board of directors may exchange the rights, other than rights that are or were beneficially owned by an Acquiring Person, which will be void, in whole or in part, at an exchange ratio of one share of common stock per right, subject to adjustment.
At any time prior to the later of the Distribution Date and the time we publicly announce that an Acquiring Person becomes such, our board of directors may redeem all of the then-outstanding rights in whole, but not in part, at a price of $.001 per right, subject to adjustment (“Redemption Price”). The redemption will be effective immediately upon the board of directors’ action, unless the action provides that such redemption will be effective at a subsequent time or upon the occurrence or nonoccurrence of one or more specified events, in which case the redemption will be effective in accordance with the provisions of the action. Immediately upon the effectiveness of the redemption of the rights, the right to exercise the rights will terminate and the only right of the holders of rights will be to receive the Redemption Price, with interest thereon. The rights issued pursuant to the 2021 Rights Agreement will expire on the earliest of (a) the close of business on April 30, 2024 (b) the time at which the rights are redeemed, (c) the time at which the rights are exchanged, (d) the time at which our board of directors determines that a related provision in our Restated Certificate of Incorporation is no longer necessary, and (e) the close of business on the first day of a taxable year of ours to which our board of directors determines that no tax benefits may be carried forward.
Common Stock. On July 8, 2021, our board of directors authorized us to repurchase up to 5,000,000 shares of our outstanding common stock. This authorization reaffirmed and incorporated the then-current balance of 2,193,947 shares that remained under a prior board-approved share repurchase program. In 2021, we repurchased 4,668,600 shares of our common stock on the open market pursuant to this authorization at a total cost of $188.2 million. Repurchases under the remaining authorization of 331,400 shares may occur periodically through open market purchases, privately negotiated transactions or otherwise, with the timing and amount at management’s discretion and dependent on market and business conditions and other factors. This share repurchase authorization will continue in effect until fully used or earlier terminated or suspended by our board of directors and does not obligate us to purchase any additional shares.
Unrelated to the share repurchase program, our board of directors authorized in 2014 the repurchase of not more than 680,000 shares of our outstanding common stock, and also authorized potential future grants of up to 680,000 stock payment awards under the KB Home 2014 Equity Incentive Plan (“2014 Plan”), in each case solely as necessary for director elections in respect of outstanding Director Plan SARs. The 2014 Plan, which was amended in April 2016, is discussed in Note 21 – Employee Benefit and Stock Plans. As of November 30, 2021, we have not repurchased any shares and no stock payment awards have been granted under the 2014 Plan, as amended, pursuant to the respective board of directors’ authorizations.
Our board of directors declared four quarterly cash dividends of $.15 per share of common stock in 2021. In 2020, our board of directors declared quarterly cash dividends of $.09 per share of common stock in the first, second and third quarters. In the 2020 fourth quarter, our board of directors approved an increase in the quarterly cash dividend on our common stock to $.15 per share and declared a quarterly cash dividend at the new higher rate. Our board of directors declared quarterly cash dividends of $.025 per share of common stock in the 2019 first and second quarters. In the 2019 third quarter, our board of directors approved an increase in the quarterly cash dividend on our common stock to $.09 per share, and declared quarterly cash dividends at the new higher rate in the 2019 third and fourth quarters. All dividends declared during 2021, 2020 and 2019 were also paid during those years.
Treasury Stock. In addition to the shares purchased in 2021 pursuant to our share repurchase program, we acquired $12.3 million, $9.5 million and $7.3 million of our common stock in 2021, 2020 and 2019, respectively. All of the common stock acquired in 2020 and 2019 and a portion of the common stock acquired in 2021 consisted of previously issued shares delivered to us by employees to satisfy their withholding tax obligations on the vesting of PSUs and restricted stock awards or of forfeitures of previous restricted stock awards. Treasury stock is recorded at cost. Differences between the cost of treasury stock and the reissuance proceeds are recorded to paid-in capital. These transactions are not considered repurchases under the 5,000,000 share repurchase program described above. During 2020, we retired 23,487,966 shares of our treasury stock. Upon the retirement of the treasury stock, we deducted the par value from common stock and reflected the excess of cost over par value as a reduction to retained earnings.
Note 20. Accumulated Other Comprehensive Loss
The following table presents the changes in the balances of each component of accumulated other comprehensive loss (in thousands):
| | | | | | | | | | | |
Postretirement Benefit Plan Adjustments | | | Total Accumulated Other Comprehensive Loss |
| Balance at November 30, 2019 | | | $ | (15,506) | |
| Other comprehensive loss before reclassifications | | | (8,412) | |
| Amounts reclassified from accumulated other comprehensive loss | | | 1,388 | |
| Income tax benefit related to items of other comprehensive loss | | | 1,897 | |
| Other comprehensive loss, net of tax | | | (5,127) | |
| Reclassification of stranded tax effects to retained earnings | | | (1,643) | |
| Balance at November 30, 2020 | | | (22,276) | |
| Other comprehensive income before reclassifications | | | 2,664 | |
| Amounts reclassified from accumulated other comprehensive loss | | | 1,661 | |
| Income tax expense related to items of other comprehensive income | | | (1,168) | |
| Other comprehensive income, net of tax | | | 3,157 | |
| | | |
| Balance at November 30, 2021 | | | $ | (19,119) | |
The amounts reclassified from accumulated other comprehensive loss consisted of the following (in thousands):
| | | | | | | | | | | | | | | | | | | | |
| | Years Ended November 30, |
Details About Accumulated Other Comprehensive Loss Components | | 2021 | | 2020 | | 2019 |
| Postretirement benefit plan adjustments | | | | | | |
| Amortization of net actuarial loss | | $ | 1,575 | | | $ | 963 | | | $ | 218 | |
| Amortization of prior service cost | | 86 | | | 425 | | | 1,556 | |
| Settlement loss | | — | | | — | | | 356 | |
| Total reclassifications (a) | | $ | 1,661 | | | $ | 1,388 | | | $ | 2,130 | |
(a)The accumulated other comprehensive loss components are included in the computation of net periodic benefit costs as further discussed in Note 22 – Postretirement Benefits.
There is no estimated prior service cost expected to be amortized from accumulated other comprehensive loss into net periodic benefit cost during 2022.
Note 21. Employee Benefit and Stock Plans
Most of our employees are eligible to participate in the KB Home 401(k) Savings Plan (“401(k) Plan”) under which we partially match employee contributions. The aggregate cost of the 401(k) Plan to us was $7.2 million in 2021, $6.5 million in 2020 and $6.9 million in 2019. The assets of the 401(k) Plan are held by a third-party trustee. The 401(k) Plan participants may direct the investment of their funds among one or more of the several fund options offered by the 401(k) Plan. As of November 30, 2021, 2020 and 2019, approximately 4%, 4% and 5%, respectively, of the 401(k) Plan’s net assets at each period were invested in our common stock.
Amended KB Home 2014 Plan. At our Annual Meeting of Stockholders held on April 7, 2016, our stockholders approved the Amended KB Home 2014 Equity Incentive Plan (“Amended 2014 Plan”), authorizing, among other things, the issuance for grants of stock-based awards to our employees, non-employee directors and consultants of up to 7,500,000 additional shares above the original 4,800,000 shares our stockholders approved under the plan (or an aggregate issuance of 12,300,000 shares), plus any shares that were available for grant as of April 7, 2014 under our 2010 Equity Incentive Plan (“2010 Plan”), and any
shares subject to then-outstanding awards under the 2010 Plan that subsequently expire or are cancelled, forfeited, tendered or withheld to satisfy tax withholding obligations with respect to full value awards, or settled for cash. No new awards may be made under the 2010 Plan. Therefore, the Amended 2014 Plan is our only active equity compensation plan. Under the Amended 2014 Plan, grants of stock options and other similar awards reduce the Amended 2014 Plan’s share capacity on a 1-for-1 basis, and grants of restricted stock and other similar “full value” awards reduce the Amended 2014 Plan’s share capacity on a 1.78-for-1 basis. In addition, subject to the Amended 2014 Plan’s terms and conditions, a stock-based award may also be granted under the Amended 2014 Plan to replace an outstanding award granted under another plan of ours (subject to the terms of such other plan) with terms substantially identical to those of the award being replaced.
The Amended 2014 Plan provides that stock options and SARs may be awarded for periods of up to 10 years. The Amended 2014 Plan also enables us to grant cash bonuses and other stock-based awards.
Stock-Based Compensation. With the approval of the management development and compensation committee, consisting entirely of independent members of our board of directors, we have provided compensation benefits to certain of our employees in the form of stock options, restricted stock and PSUs. Certain stock-based compensation benefits are also provided to our non-employee directors pursuant to the Director Plan. Compensation expense related to equity-based awards is included in selling, general and administrative expenses in our consolidated statements of operations.
The following table presents our stock-based compensation expense (in thousands):
| | | | | | | | | | | | | | | | | |
| Years Ended November 30, |
| 2021 | | 2020 | | 2019 |
| Stock options | $ | — | | | $ | — | | | $ | 189 | |
| Restricted stock | 7,139 | | | 6,993 | | | 6,080 | |
| PSUs | 19,512 | | | 13,069 | | | 10,742 | |
| Director awards | 2,253 | | | 1,469 | | | 1,301 | |
| Total | $ | 28,904 | | | $ | 21,531 | | | $ | 18,312 | |
Stock Options. Stock option transactions are summarized as follows:
| | | | | | | | | | | | | | | | | | | | | | | | | | | | | | | | | | | |
| | Years Ended November 30, |
| | 2021 | | 2020 | | 2019 |
| | Options | | Weighted
Average
Exercise
Price | | Options | | Weighted
Average
Exercise
Price | | Options | | Weighted
Average
Exercise
Price |
| Options outstanding at beginning of year | 2,462,714 | | | $ | 15.32 | | | 4,163,481 | | | $ | 13.00 | | | 7,237,544 | | | $ | 16.02 | |
| Granted | — | | | — | | | — | | | — | | | — | | | — | |
| Exercised | (788,321) | | | 14.83 | | | (1,694,767) | | | 9.52 | | | (2,300,004) | | | 13.27 | |
| Cancelled | — | | | — | | | (6,000) | | | 45.16 | | | (774,059) | | | 40.43 | |
| Options outstanding at end of year | 1,674,393 | | | $ | 15.56 | | | 2,462,714 | | | $ | 15.32 | | | 4,163,481 | | | $ | 13.00 | |
| Options exercisable at end of year | 1,674,393 | | | $ | 15.56 | | | 2,462,714 | | | $ | 15.32 | | | 4,163,481 | | | $ | 13.00 | |
| Options available for grant at end of year | 4,096,427 | | | | | 4,888,526 | | | | | 5,567,467 | | | |
There were no stock options granted in 2021, 2020 or 2019. We have not granted any stock option awards since 2016. The total intrinsic value of stock options exercised was $22.1 million for the year ended November 30, 2021, $48.2 million for the year ended November 30, 2020 and $37.1 million for the year ended November 30, 2019. The aggregate intrinsic value of stock options outstanding was $40.9 million, $48.9 million and $89.9 million at November 30, 2021, 2020 and 2019, respectively. The intrinsic value of stock options exercisable was $40.9 million at November 30, 2021, $48.9 million at November 30, 2020, and $89.9 million at November 30, 2019. The intrinsic value of a stock option is the amount by which the market value of the underlying stock exceeds the price of the option.
Stock options outstanding and stock options exercisable at November 30, 2021 are summarized as follows:
| | | | | | | | | | | | | | | | | | | | | | | | | | | | | | | | | | | | | | |
| | | Options Outstanding | | Options Exercisable |
| Range of Exercise Price | | Options | | Weighted
Average
Exercise
Price | | Weighted
Average
Remaining
Contractual
Life | | Options | | Weighted
Average
Exercise
Price | | Weighted
Average
Remaining
Contractual
Life |
$6.32 to $14.62 | | 201,517 | | | $ | 14.62 | | | 2.9 | | 201,517 | | | $ | 14.62 | | | |
$14.63 to $14.92 | | 663,000 | | | 14.92 | | | 3.9 | | 663,000 | | | 14.92 | | | |
$14.93 to $16.21 | | 611,876 | | | 16.21 | | | 4.8 | | 611,876 | | | 16.21 | | | |
$16.22 to $29.51 | | 198,000 | | | 16.63 | | | 1.9 | | 198,000 | | | 16.63 | | | |
$6.32 to $29.51 | | 1,674,393 | | | $ | 15.56 | | | 3.9 | | 1,674,393 | | | $ | 15.56 | | | 3.9 |
At November 30, 2021, there was no unrecognized stock-based compensation expense related to stock option awards as all of these awards were fully vested.
Restricted Stock. From time to time, we grant restricted stock to various employees as a compensation benefit. During the restriction periods, these employees are entitled to vote and to receive cash dividends on such shares. The restrictions imposed with respect to the shares granted lapse in installments within, or in full at the end of, three years after their grant date if certain conditions are met.
Restricted stock transactions are summarized as follows:
| | | | | | | | | | | | | | | | | | | | | | | | | | | | | | | | | | | |
| | Years Ended November 30, |
| | 2021 | | 2020 | | 2019 |
| | Shares | | Weighted
Average
per Share
Grant Date
Fair Value | | Shares | | Weighted
Average
per Share
Grant Date
Fair Value | | Shares | | Weighted
Average
per Share
Grant Date
Fair Value |
| Outstanding at beginning of year | 423,215 | | | $ | 19.56 | | | 500,066 | | | $ | 20.66 | | | 555,457 | | | $ | 23.19 | |
| Granted | 286,709 | | | 40.55 | | | 265,187 | | | 35.57 | | | 282,523 | | | 31.67 | |
| Vested | (265,131) | | | 42.04 | | | (304,095) | | | 34.25 | | | (319,687) | | | 34.66 | |
| Cancelled | (13,602) | | | 34.43 | | | (37,943) | | | 28.18 | | | (18,227) | | | 22.81 | |
| Outstanding at end of year | 431,191 | | | $ | 19.22 | | | 423,215 | | | $ | 19.56 | | | 500,066 | | | $ | 20.66 | |
As of November 30, 2021, we had $15.0 million of total unrecognized compensation cost related to restricted stock awards that will be recognized over a weighted average period of approximately three years.
Performance-Based Restricted Stock Units. On October 7, 2021, we granted PSUs to certain employees. Each PSU grant corresponds to a target amount of our common stock (“Award Shares”). Each PSU entitles the recipient to receive a grant of between 0% and 200% of the recipient’s Award Shares, and will vest based on our achieving, over a three-year period commencing on December 1, 2021 and ending on November 30, 2024, specified levels of (a) cumulative adjusted earnings per share; (b) average adjusted return on invested capital; and (c) revenue growth performance relative to a peer group of high-production public homebuilding companies. The grant date fair value of each such PSU was $39.31. On October 8, 2020, we granted PSUs to certain employees with similar terms as the 2021 PSU grants, except that the applicable performance period commenced on December 1, 2020 and ends on November 30, 2023. The grant date fair value of each such PSU was $40.06. On October 3, 2019, we granted PSUs to certain employees with similar terms as the 2021 PSU grants, except that the applicable performance period commenced on December 1, 2019 and ends on November 30, 2022. The grant date fair value of each such PSU was $33.10.
PSU transactions are summarized as follows:
| | | | | | | | | | | | | | | | | | | | | | | | | | | | | | | | | | | |
| | Years Ended November 30, |
| | 2021 | | 2020 | | 2019 |
| | Shares | | Weighted
Average
per Share
Grant Date
Fair Value | | Shares | | Weighted
Average
per Share
Grant Date
Fair Value | | Shares | | Weighted
Average
per Share
Grant Date
Fair Value |
Outstanding at beginning of year | 1,346,870 | | | $ | 23.25 | | | 1,262,664 | | | $ | 22.13 | | | 1,090,967 | | | $ | 18.70 | |
| Granted | 465,064 | | | 39.67 | | | 397,452 | | | 40.05 | | | 468,957 | | | 30.45 | |
| Vested | (419,070) | | | 40.70 | | | (313,246) | | | 40.04 | | | (297,260) | | | 22.67 | |
| Cancelled | — | | | — | | | — | | | — | | | — | | | — | |
Outstanding at end of year | 1,392,864 | | | $ | 23.48 | | | 1,346,870 | | | $ | 23.25 | | | 1,262,664 | | | $ | 22.13 | |
| | | | | | | | | | | |
The number of shares of our common stock actually granted to a recipient, if any, when a PSU vests will depend on the degree of achievement of the applicable performance measures during the applicable three-year period. The shares of our common stock that were granted under the terms of PSUs that vested in 2021 included an aggregate of 119,733 additional shares above the target amount awarded to the eligible recipients based on our achievement of certain levels of the three above-described metrics over the three-year period from December 1, 2017 through November 30, 2020. The shares of our common stock that were granted under the terms of PSUs that vested in 2020 included an aggregate of 108,511 additional shares above the target amount awarded to the eligible recipients based on our achievement of certain levels of the three above-described metrics over the three-year period from December 1, 2016 through November 30, 2019. The shares of our common stock that were granted under the terms of PSUs that vested in 2019 included an aggregate of 119,260 additional shares above the target amount awarded to the eligible recipients based on our achievement of certain levels of the three above-described metrics over the three-year period from December 1, 2015 through November 30, 2018. The PSUs do not have dividend or voting rights during the performance period. Compensation cost for PSUs is initially estimated based on target performance achievement and adjusted as appropriate throughout the performance period. Accordingly, future compensation costs associated with outstanding PSUs may increase or decrease based on the probability and extent of achievement with respect to the applicable performance measures. At November 30, 2021, we had $41.0 million of total unrecognized compensation cost related to unvested PSUs, which is expected to be recognized over a weighted-average period of approximately three years.
Director Awards. We have granted Director Plan SARs and deferred common stock awards to our non-employee directors pursuant to the terms of the Director Plan and elections made by each director. All of these awards were fully vested as of November 30, 2016. Director Plan SARs, which have not been granted since April 2014 as they ceased being a component of non-employee director compensation after that date, are stock settled, have terms of up to 15 years and may be exercised when a respective director leaves the board or earlier if applicable stock ownership requirements have been met. Deferred common stock awards will be paid out at the earlier of a change in control or the date a respective director leaves the board. All Director Plan SARs were granted at an exercise price equal to the closing price of our common stock on the date of grant. At November 30, 2021, 2020 and 2019, the aggregate outstanding Director Plan SARs were 70,849, 155,569 and 224,674, respectively, and the aggregate outstanding deferred common stock awards granted under the Director Plan were 469,171, 548,952 and 519,160, respectively. In addition, we have granted common stock on an unrestricted basis to our non-employee directors on the grant date pursuant to the Director Plan and elections made by each director.
Grantor Stock Ownership Trust. We have a grantor stock ownership trust (“Trust”), administered by a third-party trustee, that holds and distributes the shares of common stock acquired to support certain employee compensation and employee benefit obligations under our existing stock option plan, the 401(k) Plan and other employee benefit plans. The existence of the Trust does not impact the amount of benefits or compensation that is paid under these plans.
For financial reporting purposes, the Trust is consolidated with us, and therefore any dividend transactions between us and the Trust are eliminated. Acquired shares held by the Trust remain valued at the market price on the date of purchase and are shown as a reduction to stockholders’ equity in the consolidated balance sheets. The difference between the Trust share value and the market value on the date shares are released from the Trust is included in paid-in capital. Common stock held in the Trust is not considered outstanding in the computations of earnings per share. The Trust held 6,705,247 and 7,124,317 shares of common stock at November 30, 2021 and 2020, respectively. The trustee votes shares held by the Trust in accordance with voting directions from eligible employees, as specified in a trust agreement with the trustee.
Note 22. Postretirement Benefits
We have a supplemental non-qualified, unfunded retirement plan, the KB Home Retirement Plan (“Retirement Plan”), effective as of July 11, 2002, pursuant to which we have offered to pay supplemental pension benefits to certain designated individuals (consisting of current and former employees) in connection with their retirement. The Retirement Plan was closed to new participants in 2004. We also have an unfunded death benefit plan, the KB Home Death Benefit Only Plan (“DBO Plan”), implemented on November 1, 2001, for certain designated individuals (consisting of current and former employees). The DBO Plan was closed to new participants in 2006.
In connection with these plans and two other minor benefit programs, we have purchased cost recovery life insurance contracts on the lives of the designated individuals. The insurance contracts associated with the Retirement Plan and DBO Plan are held by a trust. The trust is the owner and beneficiary of such insurance contracts. The amount of the insurance coverage under the contracts is designed to provide sufficient funds to cover all costs of the plans if assumptions made as to employment term, mortality experience, policy earnings and other factors, as applicable, are realized. The cash surrender value of the Retirement Plan life insurance contracts was $40.5 million at November 30, 2021 and $43.5 million at November 30, 2020. We recognized an investment loss on the cash surrender value of the Retirement Plan life insurance contracts of $1.1 million in 2021, and investment gains of $.7 million in 2020 and $2.1 million in 2019. In 2021, 2020 and 2019, we paid $1.9 million, $1.9 million and $1.8 million, respectively, in benefits under the Retirement Plan to eligible former employees. The cash surrender value of the DBO Plan life insurance contracts was $18.5 million at November 30, 2021 and $18.8 million at November 30, 2020. We recognized an investment loss on the cash surrender value of the DBO Plan life insurance contracts of $.3 million in 2021, and investment gains of $.3 million in 2020 and $.9 million in 2019. In 2019, we paid $1.7 million in benefits under the DBO Plan. We did not pay out any benefits under the DBO Plan in 2021 or 2020.
The net periodic benefit cost of our Retirement Plan and DBO Plan is included in selling, general and administrative expenses in our consolidated statements of operations and consisted of the following (in thousands):
| | | | | | | | | | | | | | | | | | | | |
| | Years Ended November 30, |
| | 2021 | | 2020 | | 2019 |
| Interest cost | | $ | 1,593 | | | $ | 1,950 | | | $ | 2,478 | |
| Amortization of prior service cost | | 85 | | | 425 | | | 1,556 | |
| Service cost | | 1,152 | | | 1,077 | | | 958 | |
| Amortization of net actuarial loss | | 1,443 | | | 912 | | | 218 | |
| Settlement loss | | — | | | — | | | 356 | |
| Total | | $ | 4,273 | | | $ | 4,364 | | | $ | 5,566 | |
The liabilities related to these plans were $76.3 million at November 30, 2021 and $77.7 million at November 30, 2020, and are included in accrued expenses and other liabilities in the consolidated balance sheets. For the years ended November 30, 2021 and 2020, the discount rates we used for the plans were 2.3% and 1.8%, respectively.
Benefit payments under our Retirement Plan and DBO Plan are expected to be paid during each year ending November 30 as follows: 2022 — $2.6 million; 2023 — $2.9 million; 2024 — $3.2 million; 2025 — $3.6 million; 2026 — $4.4 million; and for the five years ended November 30, 2031 — $23.0 million in the aggregate.
Note 23. Supplemental Disclosure to Consolidated Statements of Cash Flows
The following are supplemental disclosures to the consolidated statements of cash flows (in thousands):
| | | | | | | | | | | | | | | | | |
| | Years Ended November 30, |
| | 2021 | | 2020 | | 2019 |
| Summary of cash and cash equivalents at the end of the year: | | | | | |
Homebuilding | $ | 290,764 | | | $ | 681,190 | | | $ | 453,814 | |
Financial services | 1,372 | | | 1,339 | | | 1,044 | |
Total | $ | 292,136 | | | $ | 682,529 | | | $ | 454,858 | |
| | | | | |
| | | | | | | | | | | | | | | | | |
| | Years Ended November 30, |
| | 2021 | | 2020 | | 2019 |
| Supplemental disclosure of cash flow information: | | | | | |
| Interest paid, net of amounts capitalized | $ | 7,087 | | | $ | 866 | | | $ | (1,327) | |
| Income taxes paid | 68,274 | | | 17,253 | | | 4,479 | |
| Income taxes refunded | 39,450 | | | 44,336 | | | 221 | |
| Supplemental disclosure of non-cash activities: | | | | | |
| Increase in inventories due to distributions of land and land development from an unconsolidated joint venture | 9,766 | | | 9,350 | | | 9,662 | |
| Increase (decrease) in consolidated inventories not owned | 7,071 | | | 7,254 | | | (9,634) | |
| Inventories acquired through seller financing | 2,910 | | | 21,712 | | | 8,967 | |
| Reclassification of federal tax refund from deferred tax assets to receivables | — | | | 82,617 | | | — | |
| Increase in operating lease right-of-use assets and lease liabilities due to adoption of ASC 842 | — | | | 31,199 | | | — | |
| Decrease in inventories due to adoption of ASC 606 | — | | | — | | | (35,288) | |
| Increase in property and equipment, net due to adoption of ASC 606 | — | | | — | | | 31,194 | |
REPORT OF INDEPENDENT REGISTERED PUBLIC ACCOUNTING FIRM
To the Stockholders and Board of Directors of KB Home:
Opinion on the Financial Statements
We have audited the accompanying consolidated balance sheets of KB Home (the Company) as of November 30, 2021 and 2020, the related consolidated statements of operations, comprehensive income, stockholders’ equity, and cash flows for each of the three years in the period ended November 30, 2021, and the related notes (collectively referred to as the “consolidated financial statements”). In our opinion, the consolidated financial statements present fairly, in all material respects, the financial position of the Company at November 30, 2021 and 2020, and the results of its operations and its cash flows for each of the three years in the period ended November 30, 2021, in conformity with U.S. generally accepted accounting principles.
We also have audited, in accordance with the standards of the Public Company Accounting Oversight Board (United States) (PCAOB), the Company’s internal control over financial reporting as of November 30, 2021, based on criteria established in Internal Control — Integrated Framework issued by the Committee of Sponsoring Organizations of the Treadway Commission (2013 framework) and our report dated January 21, 2022 expressed an unqualified opinion thereon.
Basis for Opinion
These financial statements are the responsibility of the Company’s management. Our responsibility is to express an opinion on the Company’s financial statements based on our audits. We are a public accounting firm registered with the PCAOB and are required to be independent with respect to the Company in accordance with U.S. federal securities laws and the applicable rules and regulations of the Securities and Exchange Commission and the PCAOB.
We conducted our audits in accordance with the standards of the PCAOB. Those standards require that we plan and perform the audit to obtain reasonable assurance about whether the financial statements are free of material misstatement, whether due to error or fraud. Our audits included performing procedures to assess the risks of material misstatement of the financial statements, whether due to error or fraud, and performing procedures that respond to those risks. Such procedures included examining, on a test basis, evidence regarding the amounts and disclosures in the financial statements. Our audits also included evaluating the accounting principles used and significant estimates made by management, as well as evaluating the overall presentation of the financial statements. We believe that our audits provide a reasonable basis for our opinion.
Critical Audit Matter
The critical audit matter communicated below is a matter arising from the current period audit of the financial statements that was communicated or required to be communicated to the audit committee and that: (1) relates to accounts or disclosures that are material to the financial statements and (2) involved our especially challenging, subjective or complex judgments. The communication of the critical audit matter does not alter in any way our opinion on the consolidated financial statements, taken as a whole, and we are not, by communicating the critical audit matter below, providing a separate opinion on the critical audit matter or on the accounts or disclosures to which it relates.
| | | | | |
| |
| |
| |
| |
| |
| |
| |
| |
| |
| |
| Self-insurance Liabilities and Recoveries |
| |
Description of the Matter | At November 30, 2021, the Company’s self-insurance liability was $189.1 million, and receivables for estimated probable insurance and other recoveries related to self-insurance claims totaled $57.8 million. As disclosed in Note 17 to the consolidated financial statements, the Company’s self-insurance liability for construction defects is based on an analysis prepared by a third-party actuary that uses historical claim and expense data as well as industry data to estimate the cost of all unpaid losses, including estimates related to claims incurred but not yet reported. Key assumptions used in developing these estimates include claim frequencies, severities and resolution patterns, which can occur over an extended period of time. Self-insurance recoveries are principally based on actuarially determined amounts and consider the claim cost estimates described above, applicable insurance policy coverage limits, historical recovery rates, and other factors. |
| |
| Auditing the Company’s self-insurance liability and related recoveries is complex and highly judgmental due to the complexity of the actuarial methods used to estimate the losses and related recoveries and degree of subjective judgment required to assess the underlying assumptions, which required us to involve our actuarial specialists. These estimates are subject to variability due to the length of time between the delivery of a home to a homebuyer and when a construction defect claim is made and ultimately resolved; uncertainties regarding such claims relative to the markets and types of products built; and legal or regulatory actions and interpretations, among other factors. |
| |
How We Addressed the Matter in Our Audit | We obtained an understanding, evaluated the design, and tested the operating effectiveness of controls over the Company’s self-insurance liability and recoveries estimation process including controls over the data and assumptions used in the analysis. |
| |
| To test the Company’s self-insurance liability and related recoveries, our audit procedures included, among others, testing the completeness and accuracy of the underlying claims and recovery data utilized by the Company’s third-party actuary, testing the existence and terms of third-party insurance policies, and involving our actuarial specialist to assist in our evaluation of the methodologies and assumptions applied by management’s third-party actuary. Additionally, we compared the Company’s recorded self-insurance liability and related recoveries to estimated ranges which our actuarial specialist developed based on independently selected assumptions. |
/s/ Ernst & Young LLP
We have served as the Company’s auditor since 1991.
Los Angeles, California
January 21, 2022
Item 9.CHANGES IN AND DISAGREEMENTS WITH ACCOUNTANTS ON ACCOUNTING AND FINANCIAL DISCLOSURE
None.
Item 9A.CONTROLS AND PROCEDURES
Disclosure Controls and Procedures
We have established disclosure controls and procedures to ensure that information we are required to disclose in the reports we file or submit under the Securities Exchange Act of 1934, as amended (“Exchange Act”), is recorded, processed, summarized and reported within the time periods specified in the SEC’s rules and forms, and accumulated and communicated to management, including our Chief Executive Officer (“Principal Executive Officer”) and Chief Financial Officer (“Principal Financial Officer”), as appropriate, to allow timely decisions regarding required disclosure. Under the supervision and with the participation of senior management, including our Principal Executive Officer and Principal Financial Officer, we evaluated our disclosure controls and procedures, as such term is defined under Rule 13a-15(e) promulgated under the Exchange Act. Based on this evaluation, our Principal Executive Officer and Principal Financial Officer concluded that our disclosure controls and procedures were effective as of November 30, 2021.
Internal Control Over Financial Reporting
(a)Management’s Annual Report on Internal Control Over Financial Reporting
Our management is responsible for establishing and maintaining adequate internal control over financial reporting, as such term is defined in Rule 13a-15(f) under the Exchange Act. Internal control over financial reporting is a process designed to provide reasonable assurance regarding the reliability of financial reporting and the preparation of financial statements for external reporting purposes in accordance with GAAP. Our management recognizes that there are inherent limitations in the effectiveness of any internal control and that effective internal control over financial reporting may not prevent or detect misstatements. In addition, because of changes in conditions, the effectiveness of internal control over financial reporting may vary over time. Under the supervision and with the participation of senior management, including our Principal Executive Officer and Principal Financial Officer, we evaluated the effectiveness of our internal control over financial reporting based on the Internal Control — Integrated Framework (2013) established by the Committee of Sponsoring Organizations of the Treadway Commission. Based on the evaluation under that framework and applicable SEC rules, our management concluded that our internal control over financial reporting was effective as of November 30, 2021.
Ernst & Young LLP, the independent registered public accounting firm that audited our consolidated financial statements included in this annual report, has issued its report on the effectiveness of our internal control over financial reporting as of November 30, 2021, which is presented below.
(b) Report of Independent Registered Public Accounting Firm
To the Stockholders and Board of Directors of KB Home:
Opinion on Internal Control over Financial Reporting
We have audited KB Home’s internal control over financial reporting as of November 30, 2021, based on criteria established in Internal Control — Integrated Framework issued by the Committee of Sponsoring Organizations of the Treadway Commission (2013 framework) (the COSO criteria). In our opinion, KB Home (the Company) maintained, in all material respects, effective internal control over financial reporting as of November 30, 2021, based on the COSO criteria.
We also have audited, in accordance with the standards of the Public Company Accounting Oversight Board (United States) (PCAOB), the 2021 consolidated financial statements of the Company and our report dated January 21, 2022 expressed an unqualified opinion thereon.
Basis for Opinion
The Company’s management is responsible for maintaining effective internal control over financial reporting, and for its assessment of the effectiveness of internal control over financial reporting included in the accompanying Management’s Annual Report on Internal Control Over Financial Reporting. Our responsibility is to express an opinion on the Company’s internal control over financial reporting based on our audit. We are a public accounting firm registered with the PCAOB and are
required to be independent with respect to the Company in accordance with U.S. federal securities laws and the applicable rules and regulations of the Securities and Exchange Commission and the PCAOB.
We conducted our audit in accordance with the standards of the PCAOB. Those standards require that we plan and perform the audit to obtain reasonable assurance about whether effective internal control over financial reporting was maintained in all material respects.
Our audit included obtaining an understanding of internal control over financial reporting, assessing the risk that a material weakness exists, testing and evaluating the design and operating effectiveness of internal control based on the assessed risk, and performing such other procedures as we considered necessary in the circumstances. We believe that our audit provides a reasonable basis for our opinion.
Definition and Limitations of Internal Control Over Financial Reporting
A company’s internal control over financial reporting is a process designed to provide reasonable assurance regarding the reliability of financial reporting and the preparation of financial statements for external purposes in accordance with generally accepted accounting principles. A company’s internal control over financial reporting includes those policies and procedures that (1) pertain to the maintenance of records that, in reasonable detail, accurately and fairly reflect the transactions and dispositions of the assets of the company; (2) provide reasonable assurance that transactions are recorded as necessary to permit preparation of financial statements in accordance with generally accepted accounting principles, and that receipts and expenditures of the company are being made only in accordance with authorizations of management and directors of the company; and (3) provide reasonable assurance regarding prevention or timely detection of unauthorized acquisition, use, or disposition of the company’s assets that could have a material effect on the financial statements.
Because of its inherent limitations, internal control over financial reporting may not prevent or detect misstatements. Also, projections of any evaluation of effectiveness to future periods are subject to the risk that controls may become inadequate because of changes in conditions, or that the degree of compliance with the policies or procedures may deteriorate.
/s/ Ernst & Young LLP
Los Angeles, California
January 21, 2022
(c)Changes in Internal Control Over Financial Reporting
As discussed above under Item 1A. Risk Factors in this report, we have invested significant resources over the past few years to develop and implement a new custom ERP system designed to improve the efficiency of our internal operational and administrative activities. While the new ERP system has become an increasing component of our business as more of our operating divisions transition to it, the related internal control over financial reporting has been designed to provide reasonable assurance regarding the reliability of financial reporting and the preparation of financial statements for external purposes. Accordingly, we continue to rely upon a combination of our existing and new ERP systems for financial statement reporting purposes. Other than the new ERP system implementation, there have been no changes in our internal control over financial reporting during the quarter ended November 30, 2021 that have materially affected, or are reasonably likely to materially affect, our internal control over financial reporting.
Item 9B.OTHER INFORMATION
None.
PART III
Item 10.DIRECTORS, EXECUTIVE OFFICERS AND CORPORATE GOVERNANCE
The information for this item for executive officers is provided above in the Executive Officers of the Registrant section in this report. Except as stated below, the other information for this item will be provided to the extent applicable in the “Corporate Governance and Board Matters,” “Election of Directors,” “Ownership of KB Home Securities” and “Annual Meeting, Voting and Other Information” sections in our 2022 Proxy Statement and is incorporated herein by this reference.
Ethics Policy
We have adopted an ethics policy for our directors, officers (including our principal executive officer, principal financial officer and principal accounting officer) and employees. The ethics policy is available on our investor relations website at investor.kbhome.com. Stockholders may request a free copy of the ethics policy from:
KB Home
Attention: Investor Relations
10990 Wilshire Boulevard
Los Angeles, California 90024
(310) 231-4000
investorrelations@kbhome.com
Within the time period required by the SEC and the New York Stock Exchange, we will post on our investor relations website any amendment to our ethics policy and any waiver applicable to our principal executive officer, principal financial officer or principal accounting officer, or persons performing similar functions, and our other executive officers or directors.
Corporate Governance Principles
We have adopted corporate governance principles, which are available on our investor relations website. Stockholders may request a free copy of the corporate governance principles from the address, phone number and e-mail address stated above under “Ethics Policy.”
Item 11.EXECUTIVE COMPENSATION
The information for this item will be provided in the “Corporate Governance and Board Matters” and “Compensation Discussion and Analysis” sections in our 2022 Proxy Statement and is incorporated herein by this reference.
Item 12.SECURITY OWNERSHIP OF CERTAIN BENEFICIAL OWNERS AND MANAGEMENT AND RELATED STOCKHOLDER MATTERS
Except as provided below, the information for this item will be provided in the “Ownership of KB Home Securities” section in our 2022 Proxy Statement and is incorporated herein by this reference.
The following table presents information as of November 30, 2021 with respect to shares of our common stock that may be issued under our existing equity compensation plans:
| | | | | | | | | | | | | | | | | | | | | | | |
| Equity Compensation Plan Information | |
| Plan category | | Number of
common shares to
be issued upon
exercise of
outstanding options,
warrants and
rights
(a) | | Weighted-average
exercise price of
outstanding options,
warrants and rights
(b) | | Number of common
shares remaining
available for future
issuance under equity
compensation plans
(excluding common
shares reflected in
column(a))
(c) | |
| Equity compensation plans approved by stockholders | | 1,674,393 | | | $ | 15.56 | | | 4,096,427 | | |
| Equity compensation plans not approved by stockholders | | — | | | — | | | — | | (1) | |
| Total | | 1,674,393 | | | $ | 15.56 | | | 4,096,427 | | |
(1)Represents a prior non-employee directors compensation plan under which our non-employee directors received Director Plan SARs, which were initially granted as cash-settled instruments. As discussed in Note 19 – Stockholders’ Equity in the Notes to Consolidated Financial Statements in this report, all non-employee directors serving on our board of directors have elected to receive shares of our common stock in settlement of their Director Plan SARs under the terms of the plan. We consider this non-employee director compensation plan as having no available capacity to issue shares of our common stock.
Item 13.CERTAIN RELATIONSHIPS AND RELATED TRANSACTIONS, AND DIRECTOR INDEPENDENCE
The information for this item will be provided in the “Corporate Governance and Board Matters” section in our 2022 Proxy Statement and is incorporated herein by this reference.
Item 14.PRINCIPAL ACCOUNTING FEES AND SERVICES
The information for this item will be provided in the “Independent Auditor Fees and Services” section in our 2022 Proxy Statement and is incorporated herein by this reference.
PART IV
Item 15.EXHIBITS, FINANCIAL STATEMENT SCHEDULES
(a) 1. Financial Statements
Reference is made to the index set forth on page 53 of this Annual Report on Form 10-K.
2. Financial Statement Schedules
Financial statement schedules have been omitted because they are not applicable or the required information is provided in the consolidated financial statements or notes thereto.
3. Exhibits
| | | | | | | | |
Exhibit Number | | Description |
| | |
| 3.1 | | |
| |
| 3.2 | | |
| |
| 4.1 | | |
| |
| 4.2 | | |
| |
| 4.3 | | |
| | |
| 4.4 | | |
| | |
| 4.5 | | |
| | |
| 4.6 | | |
| | |
| 4.7 | | |
| | |
| 4.8 | | |
| | |
| 4.9 | | |
| | |
| 4.10 | | |
| | | | | | | | |
Exhibit Number | | Description |
| | |
| | |
| 4.11 | | |
| | |
| 4.12 | | |
| | |
| 4.13 | | |
| | |
| 4.14 | | |
| | |
| 4.15 | | |
| | |
| 4.16 | | |
| | |
| 4.17 | | |
| | |
| 4.18 | | |
| | |
| 4.19 | | |
| | |
| 4.20 | | |
| |
| 4.21 | | |
| | |
| 10.1 | | KB Home Directors’ Legacy Program, as amended January 1, 1999, filed as an exhibit to our 1998 Annual Report on Form 10-K (File No. 001-09195), is incorporated by reference herein. |
| |
| 10.2 | | Trust Agreement between Kaufman and Broad Home Corporation and Wachovia Bank, N.A. as Trustee, dated as of August 27, 1999, filed as an exhibit to our 1999 Annual Report on Form 10-K (File No. 001-09195), is incorporated by reference herein. |
| | |
| 10.3* | | |
| |
| 10.4* | | |
| |
| 10.5* | | |
| |
| 10.6* | | |
| |
| 10.7* | | |
| |
| | | | | | | | |
Exhibit Number | | Description |
| | |
| 10.8* | | |
| |
| 10.9* | | |
| |
| 10.10* | | |
| |
| 10.11* | | |
| |
| 10.12* | | |
| |
| 10.13 | | |
| |
| 10.14 | | |
| |
| 10.15* | | |
| |
| 10.16* | | |
| |
| 10.17* | | |
| |
| 10.18* | | |
| |
| 10.19* | | |
| | |
| 10.20* | | |
| | |
| 10.21* | | |
| | |
| 10.22* | | |
| | |
| 10.23* | | |
| | |
| 10.24* | | |
| | |
| 10.25* | | |
| | |
| 10.26* | | |
| | |
| | | | | | | | |
Exhibit Number | | Description |
| | |
| 10.27 | | |
| | |
| 10.28 | | |
| | |
| 10.29* | | |
| | |
| 10.30 | | |
| | |
| 10.31 | | |
| | |
| 10.32† | | |
| | |
| 21† | | |
| |
| 22† | | |
| | |
| 23† | | |
| |
| 31.1† | | |
| |
| 31.2† | | |
| | |
| 32.1† | | |
| | |
| 32.2† | | |
| | |
| 101.INS | | XBRL Instance Document - the instance document does not appear in the Interactive Data File because its XBRL tags are embedded within the Inline XBRL document. |
| | |
| 101.SCH | | Inline XBRL Taxonomy Extension Schema Document. |
| | |
| 101.CAL | | Inline XBRL Taxonomy Extension Calculation Linkbase Document. |
| | |
| 101.DEF | | Inline XBRL Taxonomy Extension Definition Linkbase Document. |
| | |
| 101.LAB | | Inline XBRL Taxonomy Extension Label Linkbase Document. |
| | |
| 101.PRE | | Inline XBRL Taxonomy Extension Presentation Linkbase Document. |
| | |
| 104† | | Cover Page Interactive Data File (embedded within the Inline XBRL document and included in Exhibit 101). |
* Management contract or compensatory plan or arrangement in which executive officers are eligible to participate.
† Document filed with this Form 10-K.
Item 16. FORM 10-K SUMMARY
None.
SIGNATURES
Pursuant to the requirements of Section 13 or 15(d) of the Securities Exchange Act of 1934, the registrant has duly caused this report to be signed on its behalf by the undersigned, thereunto duly authorized.
| | | | | | | | | | | |
| | KB Home |
| | | |
| | By: | /S/ JEFF J. KAMINSKI |
| | | Jeff J. Kaminski |
| | | Executive Vice President and Chief Financial Officer |
| Date: | January 21, 2022 | |
Pursuant to the requirements of the Securities Exchange Act of 1934, this report has been signed below by the following persons on behalf of the registrant and in the capacities and on the dates indicated:
| | | | | | | | | | | | | | |
| Signature | | Title | | Date |
/S/ JEFFREY T. MEZGER | | Chairman, President and
Chief Executive Officer
(Principal Executive Officer) | | January 21, 2022 |
| Jeffrey T. Mezger | | | |
| | |
/S/ JEFF J. KAMINSKI | | Executive Vice President and
Chief Financial Officer
(Principal Financial Officer) | | January 21, 2022 |
| Jeff J. Kaminski | | | |
| | |
/S/ WILLIAM R. HOLLINGER | | Senior Vice President and
Chief Accounting Officer
(Principal Accounting Officer) | | January 21, 2022 |
| William R. Hollinger | | | |
| | | | |
/S/ ARTHUR R. COLLINS | | Director | | January 21, 2022 |
| Arthur R. Collins | | | |
| | | |
/S/ DORENE C. DOMINGUEZ | | Director | | January 21, 2022 |
| Dorene C. Dominguez | | | |
| | | | |
/S/ KEVIN P. ELTIFE | | Director | | January 21, 2022 |
| Kevin P. Eltife | | | |
| | | |
/S/ TIMOTHY W. FINCHEM | | Director | | January 21, 2022 |
| Timothy W. Finchem | | | |
| | | |
/S/ STUART A. GABRIEL | | Director | | January 21, 2022 |
| Stuart A. Gabriel | | | |
| | | |
/S/ THOMAS W. GILLIGAN | | Director | | January 21, 2022 |
| Thomas W. Gilligan | | | |
| | |
/S/ ROBERT L. JOHNSON | | Director | | January 21, 2022 |
| Robert L. Johnson | | | |
| | | |
/S/ JODEEN A. KOZLAK | | Director | | January 21, 2022 |
| Jodeen A. Kozlak | | | |
| | | | |
/S/ MELISSA LORA | | Director | | January 21, 2022 |
| Melissa Lora | | | |
| | | | |
/S/ BRIAN R. NICCOL | | Director | | January 21, 2022 |
| Brian R. Niccol | | | |
| | |
/S/ JAMES C. WEAVER | | Director | | January 21, 2022 |
| James C. Weaver | | | |